TREASURY DEPARTMENT UNITED STATES INTERNAL REVENUE STATISTICS OF INCOME FROM RETURNS OF NET INCOME FOR 1921 INCLUDING STATISTICS FROM FEDERAL ESTATE TAX RETURNS COMPILED UNDER THE DIRECTION OF THE COMMISSIONER OF INTERNAL REVENUE WASHINGTON GOVERNMENT PRINTING OFFICE 1923

Welcome message from author
This document is posted to help you gain knowledge. Please leave a comment to let me know what you think about it! Share it to your friends and learn new things together.
Transcript

TREASURY DEPARTMENT
UNITED STATES INTERNAL REVENUE
STATISTICS OF INCOMEFROM
RETURNS OF NET INCOME FOR 1921
INCLUDING STATISTICS FROM
FEDERAL ESTATE TAX RETURNS
COMPILED UNDER THE DIRECTION OF THE
COMMISSIONER OF INTERNAL REVENUE
WASHINGTON
GOVERNMENT PRINTING OFFICE
1923

ADDITIONAL COPIESOF THIS PUBLICATION MAY BE PROCURED FROM
THE SUPERINTENDENT OF DOCUMENTSGOVERNMENT PRINTING OFFICE
WASHINGTON, D. C.AT
20 CENTS PER COPY
PURCHASER AGREES NOT TO RESELL OR DISTRIBUTE THISCOPY FOR PROFIT.—PUB. RES. 57, APPROVED MAY 11, 1922

CONTENTS.
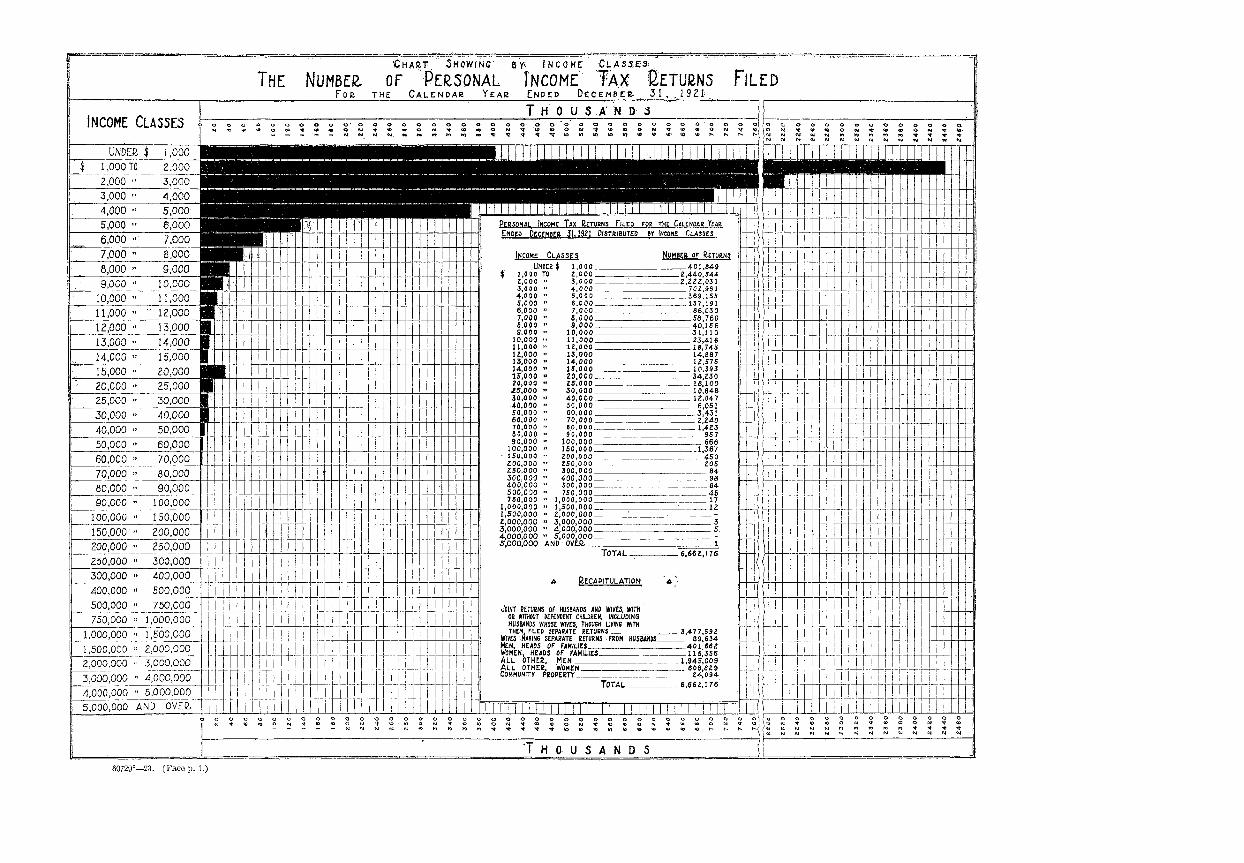
CHART: Page.Showing by income classes the number of personal income-tax returns
filed for the calendar year ended December 31, 1921 FrontispieceOFFICIAL TRANSMITTAL 1RETURNS FILED 1
Aggregate net income and total tax (individuals and corporations) for eachof the years 1917-1921 1
PERSONAL INCOME-TAX RETURNS. 2Distribution by States and Territories and by population 2
Text table—Personal returns, by States and Territories, and percapita distribution, calendar year 1921 2-3
Simple and cumulative distribution, by income classes 4Text table—-Simple and cumulative distribution of personal
returns, by income classes, calendar year 1921 4-5Classification by sex and family relationship 5
Text table—Distribution of personal returns, by sex and familyrelationship, calendar year 1921 5
Income exempt from normal tax 6Text table—Net income exempt from and amount subject to nor-
mal tax, personal returns, calendar year 1921 6Service, business, and property as sources of income 6
Text table—Distribution by sources, personal income, calendaryear 1921 6
Sources of income and deductions by income classes 7Text tables-
Distribution by sources of income and deductions, by incomeclasses, calendar year 1921 7
Distribution of personal income, by sources and incomeclasses, calendar year 1921. 8
Distribution of personal income, by sources and by incomeclasses, showing the proportion from each source expressedin percentages, calendar year 1921 9
Income from business 9Text table—Income reported from business pursuits, personal re-
turns, calendar year 1921 9PARTNERSHIPS AND PERSONAL SERVICE CORPORATIONS 10CORPORATION INCOME-TAX RETURNS 10
Corporations distributed by industrial groups 10Text table—Distribution of corporations by industrial groups and
into those reporting net income and those reporting no netincome, calendar year 1921 10-11
Income and deductions 12Text tables-
Distribution of corporation income, by industrial groups andby nature of deductions, calendar year 1921 12-13
Percentage distribution of corporation income by nature of de-ductions and by industrial groups, calendar year 1921 13
Income on Federal obligations not wholly exempt from tax 14Income wholly exempt from tax 14Corporation returns distributed by size of net income 14
Text table—Corporation returns distributed by size of net income,calendar year 1921 14
Corporations reporting invested capital 15Text table—Corporations reporting invested capital distributed
by industrial groups, calendar year 1921 15-16INCOME RETURNS BY STATES 16
Combined personal and corporation income and tax 16Text table—Personal and corporation income and tax by States and
Territories, calendar year 1921 17in

IV CONTENTS,
INCOME FROM FOREIGN INVESTMENTS AND RETURNS OF ALIENS 17Text t ab les -
Income from sources within the United States and its possessions 18Income from sources in foreign countries 18
SUMMARY OF INCOME AND TAX REPORTED BY YEARS 18Text t ab les -
Number of personal returns, calendar years 1914-1921, by incomeclasses 18
Returns of net income by years—personal and corporation 19Income-tax yield by years, personal, partnership, and corporation . . . 19Personal returns, net income reported for calendar years 1916-1921,
by income classes 20-21Personal returns, tax yield for calendar years 1916-1921, by income
classes 21-22Personal returns, average tax and average rate of tax per individual,
calendar years 1916-1921, by income classes 22-23Personal returns, income by sources for calendar years 1916-1921 23-24
PERSONAL RETURNS BY COUNTIES AND CITIES 25FEDERAL ESTATE TAX RETURNS 25-26
Text tables—A-E:A. Returns of resident decedents distributed by size of net estate,
showing form of property and nature of deduction 27-30B. Returns of non-resident decedents, distributed by size of net estate. 31C. Returns of resident decedents, distributed by collection districts 32-33D. Returns of non-resident decedents, distributed by collection
districts 34-35E. Simple and cumulative distribution by size of net estate, resident
and non-resident decedents 36
BASIC TABLES.PERSONAL RETURNS:
United States tables—1-7:1. Distribution by States 38-392. Distribution by income classes 40—413. Simple and cumulative distribution by income classes 42-434. Sex and family relationship—Distribution by States 44-475. Sex and family relationship—-Distribution by income classes 48-516. Distribution by sources and by States 52-537. Distribution by sources and by income classes 54-55
States and Territories tables—13,14.13. Distribution by income classes 122-15514. Returns by years 156-163
Counties and cities tables—15, 16.15. Distribution by counties 164-17716. Distribution by cities 178-185
CORPORATION RETURNS:United States tables — 8, 9, 11:
8. Distribution by States 56-579. Distribution by industries. . 58-65
11. Distribution by size of net income by industrial groups 100-106States and Territories tables—10, 12.
10. Distribution by industrial grcups 66-9912. Returns by years 107-121

STATISTICS OF INCOME, CALENDAR YEAR 1921.
TREASURY DEPARTMENT,OFFICE OF COMMISSIONER OF INTERNAL REVENUE,
Washington, I). C., October 4, 1923.
SIR: I have the honor to transmit the following statistical reportof economic data compiled from the returns of individuals, corpora-tions, and partnerships reporting net income for the calendar yearended December 31, 1921. There are also included herein tablesprepared from the Federal estate-tax returns filed during the year.
RETURNS FILED.
The number of individuals who filed income-tax returns for thecalendar year ended December 31, 1921, was 6,662,176. The aggre-gate net income reported by these returns was $19,577,212,528, andthe tax (normal tax and surtax) amounted to $719,387,106. Ascompared with 1920, the above figures show a falling off of 597,768in the number of returns filed, and a reduction in the total net in-come reported amounting to $4,158,416,655, as well as a decrease of$355,666,580 in the total tax.
The number of corporation income-tax returns for the calendaryear 1921, other than those of personal service corporations, was356,397. Of these, 171,239 reported net income amounting to$4,336,047,813; income tax $366,443,621; war-profits and excess-profits tax $335,131,811; total tax $701,575,432.
For the calendar year 1920 the number of corporation returns was345,595, of which 203,233 reported net income totaling $7,902,654,813and tax aggregating $1,625,234,643.
The aggregate net income and total tax (individuals and corpora-tions) for each of the years 1917-1921, inclusive, are as follows:
Year.
19171918191919201921
Net income.
$24,382,743,41824,286,150,60429,270,909,90631,638,283,99623,913,260,341
Increase ordecrease.
-$96*592,*8i4'4,984,759,3022,367,374,090
-7.725,023,655
Income andprofits tax.
$2,833,938,7234,286,486,2573,444,971,6822,700,288,3291,420,962,538
Increase ordecrease.
SI, 452,547,534-841,514,575-744,683,353
-1,279,325,791
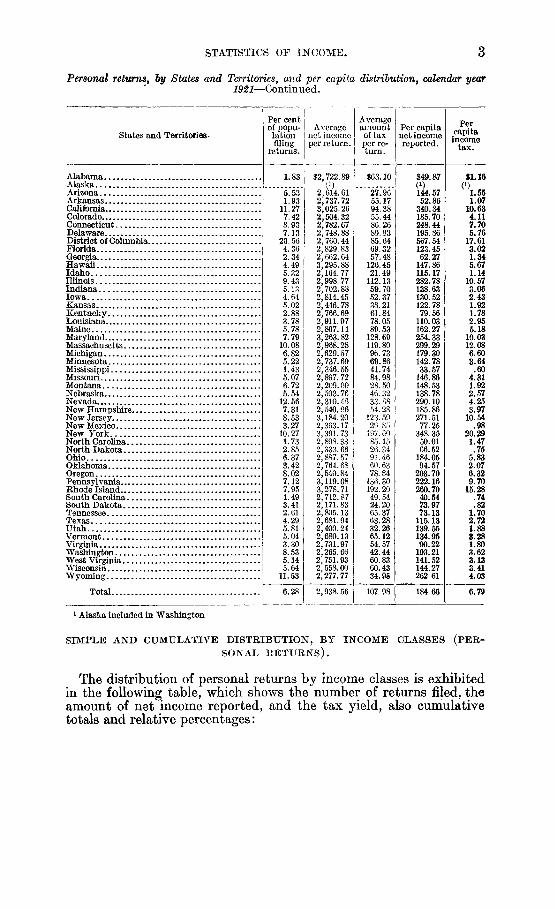
PERSONAL INCOME-TAX RETURNS.
In the following table is visualized the distribution of the personalreturns by States and Territories, as well as the per capita incomeand tax, according to the population reported by the FourteenthCensus of the United States, 1920. As relating to the entire popu-

2 STATISTICS OF INCOME.
lation of the United States subject to Federal income tax, the pro-portion filing returns was 6.28 per cent. The per capita net incomereported was $184.65 and the per capita income tax was $6.79.
On the basis of returns filed, the average net income reported for1921 was $2,938.56, the average amount of tax $107.98, and theaverage tax rate 3.67 per cent.
Personal returns, by States and Territories, and per capita distribution, calendar year 1921.
States and Terri-tories.
AlabamaAlaskaArizonaArkansasCaliforniaColoradoConnecticutDelawareDistrict of ColumbiaFloridaGeorgiaHawaiiIdahoIllinoisIndianaIowaKansasKentuckyLouisianaMaineMarylandMassachusettsMichiganMinnesotaMississippiMissouriMontanaNebraskaNevadaNew HampshireNew JerseyNew MexicoNew YorkNorth CarolinaNorth DakotaOhioOklahomaOregonPennsylvaniaRhode Island.South CarolinaSouth DakotaTennesseeTexasUtahVermontVirginiaWashingtonWest VirginiaWisconsinWyoming
Total
Populationcensus 1920.
2,348,17454,899
334,1621,752,2043,426,861
939,6291,380,631
223,003437, 571968,470
2,895,832255,912431, 866
6,485,2802,930,3902,404,0211,769,2572,416,6301,798, 509
768,0141,449,6613,852,3563,668,4122,387,1251,790,6183,404,055
548, 8891,296,372
77,407443,083
3,155,900360,350
10,385,2272,559,123
646,8725,759,3942,028,283
783,3898,720,017
604,3971,683,724
636,5472,337,8854,663,228
449,396352,428
2,309,1871,356,6211,463,7012,632,067
194,402
106,021,431
Returns.
Number.
43,0090)18,47733,830
386,08269,676123,26915,88989,96642,24967,71911,48122,976611,558150,300111,48388,78569,49667,96044,397112,963388,442250,147124,50125,614172,51936,90771,8539,71932,410269,09611,780
1,066,63744,16118,440367,09669,38162,804621,10348,05725,16021,68160,949
200,18826,12817,74676,257
115,68875,277
148,45722,413
6,662,176
Percent oftotal.
0.65
.28
.515.791.051.85.24
1.35.63
1.02.17.34
9.182.261.671.331.061.02.67
1.695.833.751.86.38
2.59.55
1.08.15.49
4.04.18
16.01.66.28
5.511.04.94
9.32.72.38.33.91
3.00.39.27
1.141.741.132.23.34
Net income.
Amount.
100.00
$117,108,806
48,310,19792,616,903
1,168,021,448174,490,980343,017,18043,676,893
248,345,804119,557,316180,311,46637,840,01449,737,718
1,833,920,436406,242,138313,762,935217,237,297192,273,937197,897,146124,628,679368,691,062
1,153,008,156657,779,854340,833,69960,104,438499,911,00481,527,662179,905,51322,455,50882,352,496856,856,05827,838,165
3,617,757,104127,992,95143,032,753
1,060,027,926191,816,067159,574,639
1,937,291,858157,568,41168,255,82547,087,498170,969,895536,897,42762, 713,46147,561,557208,331,701262,109,642207,157,054379,754,22251,051,629
19,577,212,528
Percent oftotal.
0.60
.25
.475.97.89
1.75.22
1.27.61.92.19.25
9.372.081.601.11.98
1.01.64
1.885.893.361.74.31
2.55.42.92.11.42
4.38.14
18.48.65.22
5.41.98.82
9.91.80.35.24.87
2.74.32.24
1.071.341.061.94.26
100.00
Tax.
Amount.
$2,713,826
516,6371,866,164
36,438,4323,882,862
10,633,0451,284,3657,704,5642,929,4093,892,6451,451,776
493,65868,574,3518,973,6535,837,9603,392,4294,297,4705,304,5223,974,861
14,537,30346,534,64424,197,8408,697,1171,069,136
14,660,3511,051,8633,328,145
329,2961,759,290
33,258,294351,629
210,768,3793,760,499
485,78333,574,0944,206,5074,951,580
84,660,2209,236,3281,246,523
524,6533,984,051
12,667,894842,904
1,155,7674,161,1164,909,8574,579,1138,971,044
783,257
719,387,106
Percent oftotal.
0.38
.07
.265.06.54
1.48.18
1.08.41.54.20.07
9.531.25.81.47.60.74.55
2.036.473.361,21.15
2.04.15.46.05.24
4.62,05
29.30.52.07
4.67.58.68
11.761.28.17.07.55
1.76.12.16.58.68.64
1.25.11
100.00
J Alaska included in Washington.
STATISTICS OF INCOME.
Personal returns, by States and Territories, and per capita distribution, calendar year1921—Continued.
States and Territories-
Alabama
Arizona . .ArkansasCaliforniaColoradoConnecticut .Delaware . . .
FloridaGeorgiaHawaiiIdaho . .IllinoisIndiana .IowaKansas..Kentucky. . . . . . .LouisianaMaineMarylandMassachusettsMichiganMinnesotaMississippi . . . . . . . . .MissouriMontana . .NebraskaNevada . .New HampshireNew JerseyNew MexicoNew YorkNorth Carolina . . . . . . . . .North DakotaOhio . . . .OklahomaOregon . . . . . .PennsylvaniaRhode Island . .South Carolina.South DakotaTennesseeTexas. . .Utah .VermontVirginia..WashingtonWest Virginia.Wisconsin .Wyoming
Total
Per centof popu-lationfiling
returns.
1.83
5.531.93
11.277.428.937.13
20 564.362.344 495.329.435.134.645.022.883.785.787.79
10.086.825 221.435.076.725.54
12.567.318.533.27
10 271.732.856.373.428.027.127.951.493.412.614.295.815.043.308.535.145.64
11.53
6.28
Averagenet incomeper return.
$2,722.89
2,614.612,737.723,025.282,504.322,782.672,748.882 760 442,829.832,662.643,295.882,164.772,998.772,702.882,814.452,446 782, 766.692,911.972,807.143,263.822,968.282,629.572,737.602,346.552,897.722,209.002,503.762,310.482,540.963,184.202,363.173,391.732, 80S.332,333.662,887. 572,764.682,540.843,119.083,278.712,712.872,171.832,805.132,681.942,400.242,680.132,731.972,265.662,751.932,558.002,277.77
2,938.56
Averageamountof taxper re-turn.
$63.10
27.9655.1794.3855.4486.2680.8385 6469.3257.48
126 4521.49
112.1359.7052.3738 2161.8478.0589.53
128.69119.8096.7369.8641.7484.9828.5046. 3233 8854.28
123.59
197"6085.1526.3491.4660.6378.84
136.30192.2049.5424.2065.3763.2832.2665.1254.5742.4460.8360.4334. %
107 98
Per capitanet incomereported.
$49.87
144.5752.86
340.84185.70248.44195.86567 54123.4562.27
147.86115.17282.78138.63130.52122.7879.56
110.03162.27254.33299.29179.30142.7833.57
146.86148.53138.78290.10185.86271.5177.25
348 3550.0166.52
184.0594.57
203.70222.16260.7040.5473.9773.13
115.13139. 55134.9590.22
193.21141.52144.27262.61
184.65
Percapitaincome
tax.
$1.16
°1 551.07
10.634.117.705.76
17.613.021.345.671.14
10.573.062 431.921.782.955.18
10.0312.086.603.64
.604.311.922.574.253.97
10.54.98
20 291.47
.755.832.076.329.70
15.28.74.82
1.702.721.883.281.803.623.133.414.03
6.79
1 Alaska included in Washington
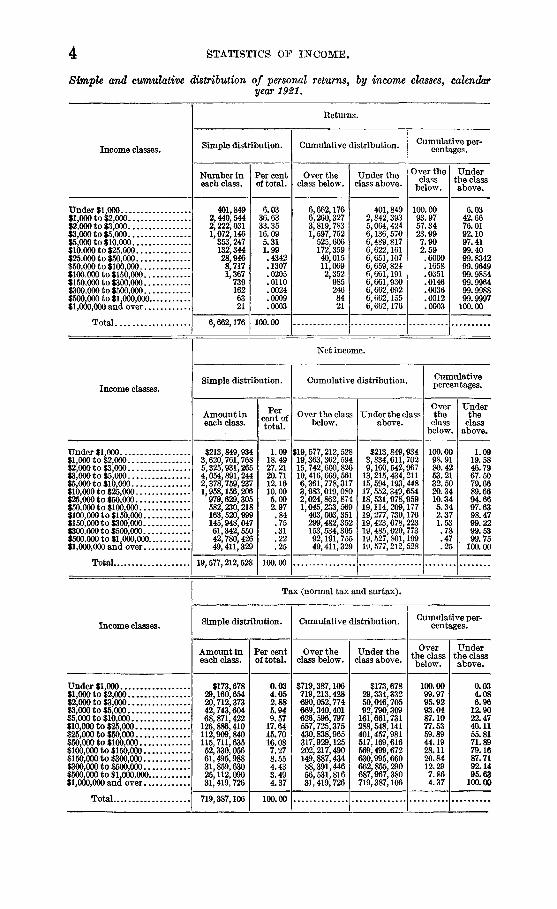
SIMPLE AND CUMULATIVE DISTRIBUTION, BY INCOME CLASSES (PER-SONAL RETURNS).
The distribution of personal returns by income classes is exhibitedin the following table, which shows the number of returns filed, theamount of net income reported, and the tax yield, also cumulativetotals and relative percentages:
STATISTICS OF INCOME.
Simple and cumulative distribution of personal returns, by income classes, calendaryear 1921.
Income classes.
Eeturns.
Simple distribution.
Number ineach class.
Per centof total.
Cumulative distribution.
Over theclass below.
Under theclass above.
Cumulative per-centages.
Over theclass
below.
Underthe classabove.
Under $1,000$1,000 to $2,000$2,000 to $3,000$3,000 to $5,000$5,000 to $10,000$10,000 to $25.000$25,000 to $50,000$50,000 to $100,000....$100,000 to $150,000..$150,000 to $300,000..$300,000 to $500,000..$500,000 to $1,000,000.$1,000,000 and over...
Total ,
401,8492,440,5442,222,0311,072,146
353,247132,34428,9468,7171,367
7391626321
6.0336.6333.3516.095.311.99.4342.1307.0205.0110.0024.0009.0003
6,662,1766,260,3273,819,7831,597,752525,606172,35940,01511,0692,3529852468421
401,8492,842,3935,064,4246,136,5706,489,8176,622,1616,651,1076,659,8246,661,1916,661,9306,662,0926,662,1556,662,176
100.0093.9757.3423.997.902.59.6000.1658.0351.0146.0036. 0012.0003
6.0342.6676.0192.1097.4199.4099.834299.964999.985499.996499.998899.9997100.00
6,662,176 100.00
Income classes.
Net income.
Simple distribution.
Amount ineach class.
Percent oftotal.
Cumulative distribution.
Over the classbelow.
Under the classabove.
Cumulative
Overtheclass
below.
Underthe
classabove.
Under $1,000$1,000 to $2,000$2,000 to $3,000$3,000 to $5,000$5,000 to $10,000$10,000 to $25,000....$25,000 to $50,000....$50,000 to $100,000...$100,000 to $150,000..$150,000 to $300,000..$300,000 to $500,000..$500,000 to $1,000,000.$1,000,000and over..
Total
$213,849,9343,620,761,7685,325,931,2654,054,891,2442,378,759,2371,958,156,206979,629,305582,230,218163,520,999145,948,04761,342,55042,780,42649,411,329
1.0918.4927.2120.7112.1610.005.002.97.84.75.31.22.25
$19,577,19,363,15,742,10,416,6,361,3,983,2,024,1,045,463,299,153,92,49,
212,528362,594600,826669,561778,317019,080862,874233, 569003,351482,352534,305191,755411,329
$213,849,9343,834,611,7029,160,542,96713,215,434,21115,594,193,44817,552,349,65418,531,978,95919,114, 209,17719,277, 730,17619,423,678,22319,485,020,77319,527, 801,19919, 577,212,528
100.0098.9180.4253.2132.5020.3410.345.342.371.53.78.47.25
1.0919.5846.7967.5079.6689.6694.6697.6398.4799.2299.5399.75
100.00
19,577,212,528 100.00
Income classes.
Tax (normal tax and surtax).
Simple distribution.
Amount ineach class.
Per centof total.
Cumulative distribution.
Over theclass below.
Under theclass above.
Cumulative per-
Overthe classbelow.
Underthe classabove.
Under $1,000$1,000 to $2,000$2,000 to $3,000$3,000 to $5,000$5,000 to $10,000$10,000 to $25,000....$25,000 to $50,000....$50,000 to $100,000...$100,000 to $150,000..$150,000 to $300,000..$300,000 to $500,000..$500,000 to $1,000,000.$1,000,000and over..
Total
$173,67829,160,65420,712,37342,743,60468,871,422
126,886,410112,909,840115,711,63552,330,05661,495,98831,859,63025,112,09031,419,726
0.034.052.885.949.57
17.6415.7016.087.278.554.433.494.37
$719,387,106719,213,428690,052,774669,340,401626,596,797557,725,375430,838,965317,929,125202,217,490149,887,43488,391,44656,531,81631,419,726
$173,67829,334,33250,046,70592,790,309161,661,731288,548,141401,457,981517,169,616569,499,672630,995,660662,855,290687,967,380719,387,106
100.0099.9795.9293.0487.1077.5359.8944.1928.1120.8412.297.864.37
0.034.086.9612.9022.4740.1155.8171.8979.1687.7192.1495.63100.00
719,387,106 100.00
STATISTICS OF INCOME, 5
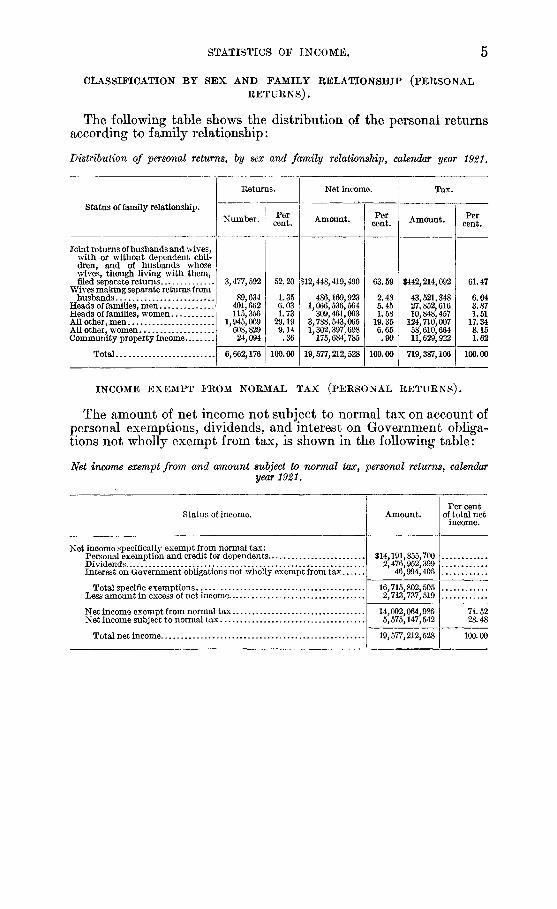
CLASSIFICATION BY SEX AND FAMILY RELATIONSHIP (PERSONALRETURNS).
The following table shows the distribution of the personal returnsaccording to family relationship:
Distribution of personal returns, by sex and family relationship, calendar year 1921.
Status of family relationship.
Joint returns of husbands and wives,with or without dependent chil-dren, and of husbands whosewives, though living with them,filed separate returns
Wives making separate returns fromhusbands
Heads of families, menHeads of families, womenAll other, menAll other, womenCommunity property income
Total
Returns.
Number.
3,477,592
89,634401,662115,356
1,945,009608,82924,094
6,662,176
Percent.
52.20
1.356.031.73
29.199.14.36
100.00
Net income.
Amount.
112,448,419,490
486,169,9231,066,536,564
309,461,0033,788,543,0651,302,397,698
175,684,785
19,577,212,528
Percent.
63.59
2.485.451.58
19.356.65.90
100.00
Tax.
Amount.
$442,214,092
43,521,34827,852,61610,848,457
124,710,00758,610,66411,629,922
719,387,106
Percent.
61.47
6.043.871.51
17.348.151.62
100.00
I N C O M E E X E M P T FROM NORMAL TAX ( P E R S O N A L R E T U R N S ) .
The amount of net income not subject to normal tax on account ofpersonal exemptions, dividends, and interest on Government obliga-tions not wholly exempt from tax, is shown in the following table:
Net income exempt from and amount subject to normal tax, personal returns, calendaryear 1921.
Status of income. Amount.Per cent
of total netincome.
Net income specifically exempt from normal tax:Personal exemption and credit for dependentsDividendsInterest on Government obligations not wholly exempt from tax
$14,191,855,7007 6 2 92,476,952,399'6,994,406
Total specific exemptionsLess amount in excess of net income..Net income exempt from normal tax.Net income subject to normal tax
16,715,802,5052,713,737,519
14,002,064,9865,575,147,542
Total net income.. 19,577,212,528
71.5228.48
100.00

6 STATISTICS OF INCOME.
SERVICE, BUSINESS, AND PROPERTY AS SOURCES OF INCOME (PER-SONAL R E T U R N S ) .
In the table immediately following is shown the distribution of thenet income reported according to its origin; that is, whether frompersonal service or from property.
Distribution by sources^ personal incomef calendar year 1921.
Source of income.
Personal service:Salaries, wages, commissions, bonuses, directors' fees, etcBusiness, trade, commerce, partnerships, farming, and profits from
incidental sales of real estate, stocks, bonds, and other property, andincome received from fiduciaries „
Total...
Property:Rents and royalties.Interest on bonds notes etcDividends
Total
Total income .General deductions
Amount.
$13,813,169,165
4,170,363,591
17,983,532,756
1,177,957,8821,690,338,8952,476,952,399
5,345,249,176
23,328,781,9323,751,569,404
19,577,212,528
Per centof totalincome.
59.2J
17.88
77.09
5.057.25
10.61
22.91
100.0016.08
83.92
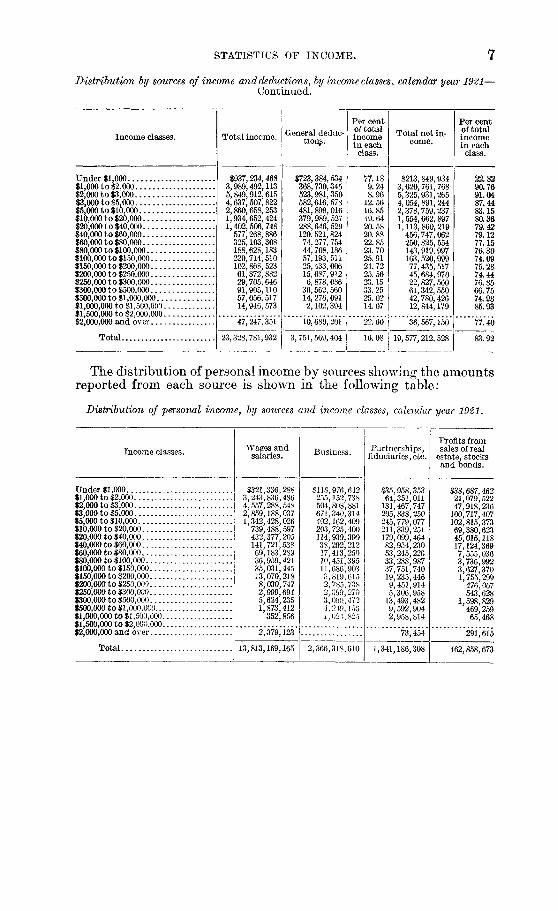
SOURCES OF INCOME AND DEDUCTIONS BY INCOME CLASSES(PERSONAL RETURNS).
The distribution of income from service and business and fromproperty, as well as the total deductions in each income class, areshown in the following table. This table also shows the proportionof the total income reported from each source, as well as the per centof general deductions and net income to total income for each incomeclass.
Distribution by sources of income and deductions, by income classes, calendar year 1921.
Income classes.Income from
personal serviceand business.
Per centof totalincomein eachclass.
Income fromproperty.
Per centof totalincomein eachclass.
Under $1,000$1,000 to $2,000$2,000 to $3,000$3,000 to $5,000$5,000 to $10,000$10,000 to $20,000$20,000 to $40,000$40,000 to $60,000$60,000 to $80,000$80,000 to $100,000$100,000 to$150,000....$150,000 to $200,000$200,000 to $250,000$250,000 to $300,000....$300,000 to $500,000....$500,000 to $1,000,000...$1,000,000 to $1,500,000.$1,500,000 to $2,000,000.$2,000,000 and over
Total.
$514.3,584;5,241.3,837,2,093.1,223,
771.280.147,
958,745419,757483,412084,008184,885933,871432,177092,349396,801436,795097,458880,578744,466249,550807,018184,731401,963
54.9489.8589.6082.7473.1763.2655.0048.5245.3444.7639.9136.8233.8037.8725.9028.3729.45
$422,275,723405,072,356608,429,203800,423,814767,473,368710,718,553631,074,571297,176,537177,706,507104,191,388132,617,05264,987,94540,628,41618,456,09668,098,09240,871,78610,544,610
2,744,192 5.81 44,503,159
17,983,532,756 77.08 5,345,249,176
45.0610.1510.4017.2626.8336.7445.0051.4854.6665.2460.0963.1866.2062.1374.1071.6370.55
94.19
22.92
STATISTICS OF INCOME. 7
Distribution by sources of income and deductions, by i?icome classes, calendar year 1921—Continued.
Income classes.
Under $1,000$1,000 to $2,000$2,000 to $3,000$3,000 to $5,000$5,000 to $10,000$10,000 to $20,000$20,000 to $40,000$40,000 to $60,000$60,000 to $80,000$80,000 to $100,000$100,000 to $150,000....$150,000 to $200,000$200,000 to $250,000....$250,000 to $300,000$300,000 to $500,000....$5001000 to $1,000,000...$1,000,000 to $1,500,000.$1,500,000 to $2,000,000.$2,000,000 and over . . . .
Total.
Total income.
$937, 234,4683,989,492,1135,849,912,6154,637,507,8222,860,658,2531,934,652,4241,402,506,748
577,268,886325,103,308188,628,183220,714,510102,868, 52361,372, 88229,705,64691,905,11057,056, 51714,946,573
47,247,351
23,328,781,932
General deduc-tion^.
$723,384,534368,730,345523,981,350582,616,578481,899,016379,989,527288,646, 529120,521, 82474,277, 75444,708,18657,193,51125,433, 00615,687,9126, 878,086
30,562,56014, 276,0912,102,394
10,680, 201
3,751,569,404
Per centof totalincomein eachclass.
77.189.248.96
12.5616.8519.6420.5820.8822.8523.7025. 9124.7225. 5623.1533. 2525.0214.07
Total net in-come.
$213, 849,9343,620,761,7685,325,931,2654,054,891, 2442,378,759,2371,554,662, 8971,113,860,219
456,747,062250,825,554143,919, 997163,520,99977,435, 51745,684, 97022,827, 56061,342, 55042,780,42612,844,179
22. 60 I 36,567,150
16.08 19, 577,212, 528
Per centof totalincomein eachclass.
22.8290.7691.0487.4483.1580.3679.4279.1277.1576.3074.0975.2874.4476.8566.7574.9885.93
77.40
83.92
The distribution of personal income by sources showing the amountsreported from each source is shown in the following table:
Distribution of personal income, by sources and income classes, calendar year 1921.
Income classes.
Under $1,000$1,000 to $2,000$2,000 to $3,000$3,000 to $5,000$5,000 to $10,000$10,000 to $20,000$20,000 to 140,000$40,000 to $60,000$60,000 to $80,000 ,$80,000 to $100,000$100,000 to $150,000$150,000 to $200,000....$200,000 to 1250,000$250,000 to $300,000$300,000 to $500.000$500,000 to $1,000,000....$1,000,000 to $1,500,000..$1,500,000 to $2,000,000.$2,000,000 and over
Wages andsalaries.
$321;3,243.4,557;2,859.1,342:739:432;141;69,36.35:13;8,2',5'.
336,288836,486288,548188,037428,026488,597377,205721,538183,289959,421031,445070,218030,747999,694624,235873,412352,856
2,379,123
Total I 13,813,169,165
Business.
$118,976,642255,152,738504,808,881671,340,314402,162,409203,725,400114,939,39038,292,21217,413,25010,451,39511,686,9033,819,6152,78.5,7382,399,2703,090,472•1219,158I)024,825
2,366,318,610
Partnerships,fiduciaries, etc.
$35,958,35364,351,011131,467,747205,838,250245,779,077211,339,251179,099,46482,954,23053,245,22633,288,98737,751,74019,235,4469,451,9145,306,95813,493,4829,592,9042,958,814
73,454
1,341,186,308
Profits fromsales of real
estate, stocksand bonds.
$38,687,46221,079,52247,918,236100,717,407102,815,37369,380,62345,016,11817,124,3697,555,0363,736,9923,627,3701,755,299476,067543,628
1,598,829469,25965,468
291,615
462,858,673

8 STATISTICS OF INCOME.
Distribution of personal income, by sources and income classes, calendar year 1921—*Continued.
Income classes.
Under $1,000 ,$1,000 to $2,000$2,000 to $3,000$3,000 to $5,000$5,000 to $10,000$10,000 to $20,000$20,000 to $40,000$40,000 to $60,000$60,000 to $80,000$80,000 to $100,000$100,000 to $150,000$150,000 to $200,000$200,000 to $250.000$250,000 to $300,000$300,000 to $500.000$500,000 to $1,000.000....$1,000,000 to $1,500,000..$1,500,000 to $2,000,000.,$2,000,000 and over
Total.
Rents androyalties.
$116,652,120151,391,796240,115,413248,866,148171,850,952107,953,73870,605,21425,446,55813,260, 5277,496,6768,257,0464,936,1662,013,963
464,1462,268,2174,356,613
1,233
2,021,356
1,177,957,882
Dividends.
$168,395,62166,325,05897,084,540
230,009,270349,231,315407,565,766409,556,238208,162,957129,500, 74778,235,249
100,568,99749,960,27231,898,61215,219,64355,429,20431,353,9869,956,287
38,498,637
2,476,952,399
Interest andinvestment
income.
$137,227,982187,355,502271,229,250321,548,396246,391,101195,199,049150,913,11963,567,02234,945,23318,459,46323,791,00910,091, 5076,715, 8412,772,307
10,400,6715,161,187
587,090
3,983,166
1,690,338,895
Total income.
$937,234,4683,989,492,1135,849,912,6154,637,507,8222,860,658,2531,934,652,4241,402,506,748577,268,886325,103,308188,628,183220,714,510102,868,52361,372,88229,705,64691,905,11057,056,51714,946,573
47,247,351
23,328,781,932
The distribution of personal income by sources, expressed in per-centages, is given in the succeeding table:
Distribution of personal income, by sources and by income classes, showing the proportionfrom each source expressed in percentages, calendar year 1921.
Income classes.Wagesand
salaries.
Under $1,000$1,000 to $2,000$2,000 to $3,000$3,000 to $5,000$5,000 to $10,000$10,000 to $20,000$20,000 to $40,000$40,000 to $60,000$60,000 to $80,000$80,000 to $100,000$100,000 to $150,000$150,000 to $200,000$200,000 to $250,000$250,000 to $300,000$300,000 to $500,000$500,000 to $1.000,000$1,000,000 to $1,500,000$1,500,000 to $2,000,000$2,000,000 and over
Total
34.2881.3277.8861.6546.9333.2230.8324.5521.2819.5915.8712.7113.0910.106.123.282.36
5.04
59.21
Busi-ness.
12.696.398.63
14.4714.0610.538.206.645.365.545.293.714.548.083.367.456.86
10.14
Part-ner-
ships,fiduci-aries,etc.
3.841.612.254.448.59
10.9212.7714.3716.3817.6517.1118.7015.4017.8714.6816.8219.79
Profitsfrom
sales ofreal
estate,stocks
andbonds.
.16
5.75
4.13.53.82
2.173.593 593.* 212.972.321.981.641.71.78
1.831.74.82.44
.62
Rents,and
royal-ties.
12.453.794.115.376.015.585.034.414.083.973.744.803.281.562.477.63.01
4.28
5.05
Divi-dends.
17.971.661.674.96
12.2121.0729.2036.0539.8341.4845.5748.5751.9751.2360.3154.9666.61
81.47
10.62
Inter-estand
invest-mentin-
come.
14.644.704.646.948.61
10.0910.7611.0110.759.79
10.789.80
10.949.33
11.329.043.93
8.43
7.25
Totalin-
comer
100.00100.00100.00100.00100.00100.00100.00100.00100.00100.00100.00100.00100.00100.00100.00100.00100.00
100.00
100.00
STATISTICS OF INCOME.
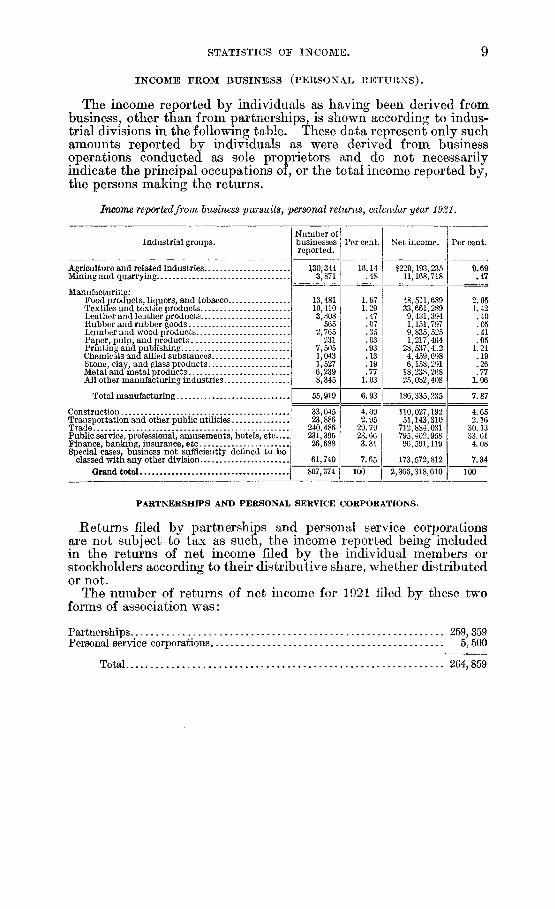
INCOME FROM BUSINESS (PERSONAL RETURNS).
The income reported by individuals as having been derived frombusiness, other than from partnerships, is shown according to indus-trial divisions in the following table. These data represent only suchamounts reported by individuals as were derived from businessoperations conducted as sole proprietors and do not necessarilyindicate the principal occupations of, or the total income reported by,the persons making the returns.
Income reported from business pursuits, personal returns, calendar year 1921.
Industrial groups.
Agriculture and related industriesMining and quarryingManufacturing:
Food products, liquors, and tobaccoTextiles and textile productsLeather and leather productsRubber and rubber goodsLumber and wood productsPaper, pulp, and productsPrinting and publishingChemicals and allied substancesStone, clay, and glass productsMetal and metal productsAll other manufacturing industries
Total manufacturing
ConstructionTransportation and other public utilitiesTradePublic service, professional, amusements, hotels, e t c . ,Finance, banking, insurance, etc ,Special cases, business not sufficiently defined to be
classed with any other divisionGrand total ,
Number ofbusinessesreported.
130,3443,871
Per cent.
16.14.48
13,48110,4103,808565
2,765231
7,5051,0431,5276,2398,345
55,919
33,04523,886240,486231,39526,688
61,740
807,374
1.671.29.47.07.35.03.93.13.19.77
1.03
6.93
Net income.
$229,193,23511,168,718
48,511,68933,661,2899,481,3941,151,7979,835,5251,217,464
28,537,4124,459,6986,158,291
18,238,26825,082,408
186,335,235
4.092,95
29.7928.663.31
7.65
100
110,027,19251,143,3:10
712,884,031795,402,95896,591,119
173,572,812
2,366,318,610
Per cent.
.47
2.051.42.40.05.41.05
1.21.19.26.77
1.06
7.87
4.652.16
30.1333.614.08
7.34
100
PARTNERSHIPS AND PERSONAL SERVICE CORPORATIONS.
Returns filed by partnerships and personal service corporationsare not subject to tax as such, the income reported being includedin the returns of net income filed by the individual members orstockholders according to their distributive share, whether distributedor not.
The number of returns of net income for 1921 filed by these twoforms of association was:
Partnerships 259, 359Personal service corporations 5, 500
Total 264, 859

10 STATISTICS OF INCOME.
CORPORATION INCOME TAX RETURNS.
The table immediately following shows the returns of corporationsdistributed by industrial groups and segregated according to thosereporting net" income and those reporting no net income. In the"Transportation and Other Public Utilities" group, both grossincome and general deductions should be greatly in excess of theamounts shown. This is due to railroad and other utility corpora-tions, to a large extent, reporting on the face of the return merelythe amount of net income or deficit.
To have inspected the numerous supporting schedules of thesereturns for the purpose of compiling tne gross income and generaldeductions was inexpedient, due to the cost and the additional timethat it would have required.
TABLE A.—Distribution of corporations by industrial groups and into those reportingnet income and those reporting no net income, calendar year 1921.
Industrial groups.
Agriculture and relatedindustries
Mining and quarryingManufacturing:
Food products, liquorsand tobacco
Textiles and textileproducts
Leather and leatherproducts
Rubber and rubbergoods
Lumber and woodproducts
Paper, pulp, and prod-ucts
Printing and publish-ing.
Chemicals and alliedsubstances
Stone, clay, and glassproducts
Metal and metal prod-ucts
All other manufactur-ing industries
Total manufacturing.
ConstructionTransportation and other
public utilitiesTradePublic service—profes-
sional, amusements, ho-tels, etc
Finance, banking, insur-ance, etc
C ombinations—p r e d o m i -nant industry not ascer-tainable
Inactive concerns.
Total
Totalnumberof cor-
porationsreporting.
8,72417,660
13,777
10,872
2,184
641
6,733
1,676
8,432
5,924
3,681
15,536
10,292
79, 748
10, 361
19,10588,179
19,103
82,858
2,87927,780
356,397
Corporations reporting net income.
Number.
3,1464,365
7,207
5,312
981
196
2,984
730
5,386
2,502
1,998
5,468
4,266
37, 030
6,041
11,83142,809
10,694
54,122
1,201
171,239
Percent
report-ing
net in-come.
36.0624.72
52.31
48. S6
44.92
30.58
44.32
43.56
63.88
42.23
54.28
35.20
41.45
46.43
58.31
61.9348.55
55.98
65.32
41.72
48.05
Gross income.
$371,039,4061,728,765,475
5, 519,503,463
3,885,118,040
822,817,015
112,146,551
1,071,669,578
565,401,379
1,414,017,240
2,117,210,866
733,427,446
6,044,372,496
2,136,393,002
24,422,077,076
1,281, 614,507
i 7,187,369,10717,570,065,920
1,312,596,853
5,797,975,438
379,619,547
60,051,123,329
Totaldeductions.
$330,321,2141,543,631,552
5,200,327,190
3,557,761,957
765,752,379
107,044,878
1,001,158,527
520,519,542
1,289,860,650
1,958,993,577
663,670,947
5,607,005,636
1,972,196,185
22,644,291,468
1,214,279,139
1 6,365,497,65316,998,120,623
1,207,724,299
5,058,678,633
352,530,935
55,715,075,516
Net income.
$40,718,192185,133,923
319,176,273
327,356,083
57,064,636
5,101,673
70,511,051
44,881,837
124,156,590
158,217,289
69,756,499
437,366,860
164,196,817
1,777,785,608
67,335,368
821,871,454571,945,297
104,872,554
739,296,805
27,088,612
4,336,047,813
i Gross income and total deductions incomplete (see text above).

STATISTICS OF INCOME. 11
TABLE A.—Distribution of corporations by industrial groups and into those reportingnet income and those reporting no net income, calendar year 1921—Continued.
Industrial groups.
Agriculture and related industriesMining and quarryingManufacturing:
Food products, liquors and tobacco..Textiles and textile productsLeather and leather productsRubber and rubber goodsLumber and wood productsPaper, pulp, and productsPrinting and publishingChemicals and allied substancesStone, clay, and glass productsMetal and metal productsAll other manufacturing industries..
Total manufacturing
ConstructionTransportation and other public utilities.TradePublic service—professional, amuse-
ments , hotels, etc...Finance, banking, insurance, etcCombinations—predominant industry
not ascertainableInactive concerns
Total
Income tax.
$3,433,52915,804,592
26,801,43327, 642, 7314,858, 825
448, 0096,061,2133,938, 8569,921,830
14,310,7896,015, 890
36,561,16914,474,387
151,035,132
4,872,33176,870,13146,279,219
8,016,77357,056,408
3,075,506
366,443, 621
Corporations reporting net income.
Warprofits and
excessprofits
tax.
$2,568,43316,164,624
38,874, 87139,573,3396,956,022
367,4595,185, 8603,645, 206
17,261, 53615,287, 0736,015,738
53,746, 55113,821,462
200,735,117
8,722, 55524,151,63450,463,296
11,252,32519,215,184
1,858,643
335,131, 811
Total tax.
$6,001,96231,969,216
65,676,30467,216,07011,814,847
815,46811,247,0737,584,062
27,183, 36629,597, 86212,031,62890,307, 72028,295, 849
351,770,249
13,594, 886101,021,76596,742, 515
19,269,09876,271,592
4,934,149
701,575, 432
Percent-age dis-
tributionof total
tax.
0.864.56
9.369.591.69.12
1.601.083.874.221.71
12,874.03
50.14
1.9414.4013.78
2.7510.87
.70
100. 00
Per centof totaltax tonet in-come.
14.7417.26
20.5820.5320.7015.9815.9516.9021.8918.7017.2520.6517.23
19.79
20.1912.2916.91
18.3710.32
18.21
16.18
Industrial groups.
Agriculture and related industries..Mining and quarryingManufacturing*
Food products, liquors, andtobacco
Textiles and textile products . . .Leather and leather products..Rubber and rubber goodsLumber and wood productsPaper, pulp, and productsPrinting and publishingChemicals and allied substances.Stone, clay, and glass products .Metal and metal productsAll other manufacturing indus-
tries
Total manufacturing
ConstructionTransportation and other public
utilitiesTradePublic service—professional, amuse-
ments, hotels, etcFinance, banking, insurance, etc...Combinations—predominant indus-
try not ascertainableInactive concerns . . . .
Total. . . .
Corporations reporting no net income.
Number.
5,57813,295
6,5705,5601,203
4453,749
9463,0463,4221,683
10,068
6,026
42,718
4,320
7,27445,370
8,40928,736
1,67827,780
185,158
Per centreport-ing nonet in-come.
63.9475.28
47.6951.1455.0869.4255.6856.4436.1257.7745.7264.80
58.55
53.57
41.69
38.0751.45
44.0234.68
58.28100. 00
51.95
Gross income.
$304,559,0492,160,110,985
2,750,043,4011,800,976,566
595,180,564525,699,814775,312,435438,100,079307,991,840
1,761,669,436220,329,251
3,760,766,301
1,083,777,026
14,019,846,713
491,693,680
i 1,813,387,0569,774,283,657
442,490,7331,753,120,702
438,605,60452,024
31,198,150,203
Totaldeductions.
$393,121,9472,574,599,936
3,059,205,3881,990,415,896
701,089,919627,261,549895,532,322487,278,671334,671,825
1,894,550,501246,589,044
4,426,768,198
1,255,314,777
15,918,678,090
543,201,031
12,136,755,84910,401,112,000
488,429,7682,116,286,615
504,115,31668,785
35,076,369,337
Deficit.
$88,562,898414,488,951
309,161,987189,439,330105,909,355101,561,735120,219,88749,178,59226,679,985
132,881,06526,259,793
666,001,897
171,537,751
1,898,831,377
51,507,351
323,368,793626,828,343
45,939,035363,165,913
65,509,71216,761
3,878,219,134
iGross income and total deductions incomplete (see text, p. 10).
12 STATISTICS OF INCOME.
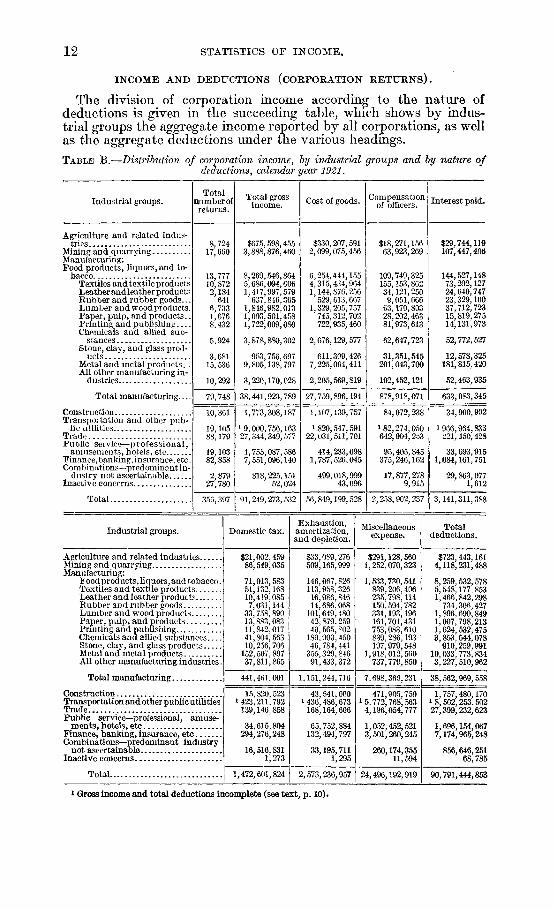
INCOME AND DEDUCTIONS (CORPORATION RETURNS).
The division of corporation income according to the nature ofdeductions is given in the succeeding table, which shows by indus-trial groups the aggregate income reported by all corporations, as wellas the aggregate deductions under the various headings.TABLE B.—Distribution of corporation income, by industrial groups and by nature of
deductions, calendar year 1921.
Industrial groups.Total
number ofreturns.
Total grossincome. Cost of goods. Compensation
of officers. Interest paid.
Agriculture and related indus-tries
Mining and quarryingManufacturing:Food products, liquors, and to-
baccoTextiles and textile productsLeather and leather productsRubber and rubber goods...Lumber and wood products.Paper, pulp, arid products..Printing and publishingChemicals and allied sub-
stancesStone, clay, and glass prod-
uctsMetal and metal products..All other manufacturing in-
dustries
Total manufacturing
ConstructionTransportation and other pub-
lic utilitiesTradePublic service—professional,
amusements, hotels, etcFinanee,banking, insurance, etc.Combinations—predominant in-
dustry not ascertainableInactive concerns
Total
8,72417,660
13,77710,8722,184641
6,7331,6768,432
5,924
3,68115,536
10,292
$675,598,4553,888,876,460
8,269,5,686,1,417,637,
1,846,1,003,1,722,
546,864094,006997,579846,365982,013501,458009,080
3,878,880,302
953,756,6979,805,138,797
3,220,170,028
$330,207,5912,099,075,456
6,254,444,1554,315,434', 9641 144,876,256529,613,667
1,329,205,757745,312,702722,935,460
2,676,129,577
611,309,4267,225,064,411
2,205,569,819
$18,271,15663,923,269
109,749,325155,153,86234,12i; 2509,051,66663,170,80328,202,46381,973,613
62,647,723
31,351,545201,043,700
102,452,121
$29,744,119107,447,406
144,527,14873,292,12724,640,74723,329,10037,712,72315,819,27514,131,973
52,772,527
12,578,325181,815,420
52,463,935
79,748 38,441,923,789 27,759,896,194 878,918,071 633,083,345
10,361
19,10588,179
19,10382,858
2,87927,780
1,773,308,1871 9,000,756,16327,344,349,577
1,755,087,5867,551,096,140
818,225,15152,024
1,107,139,7571 820,547,591
22,031,511,701
414,233,0981,787,526,045
499,018,99943,096
84,072,238 34,900,902
182,274,050642,904,253
95,405,845375,246,162
17,877,2789,915
356,397 91,249,273,532 56,849,199,528 2,258,902,237
1 966,964,833221,450,428
33,693,9151,084,161,751
29,863,0771,612
3,141,311,3S8
Industrial groups.
Agriculture and related industriesMining and quarryingManufacturing:
Food products,liquors, and tobacco.Textiles and textile productsLeather and leather productsRubber an d rubber goodsLumber and wood productsPaper, pulp, and productsPrinting and publishingChemicals and allied substancesStone, clay, and glass productsMetal and metal productsAll other manufacturing industries.
Total manufacturing
ConstructionTransportation and other public utilitiesTrade 7.Public service—professional, amuse-
ments, hotels, etcFinance, banking, insurance, etcCombinations—predominant industry
not ascertainabloInactive concerns
Total
Domestic tax.
$21,002,45986,549,035
71,013,58351,132,16810,419,0857,031,144
33,758,89013,883,08311,842,01741,804,56310,256,706
152,507,89737,811,865
441,461,001
15,820,5231 423,211,792
139,146,858
34,615,804294,276,248
16,516,8311,273
Exhaustion,amortization,and depletion.
$33,089,276509,165,999
146,067,826113,958,32616,986,84614,686,068101,649,48042,879,25940,565,802180,903,45046,784,441355,329,84691,433,372
1,151,244,716
Miscellaneousexpense.
$291,128,5601,252,070,323
1,533,839,235,150,331,161,753,839,197,
1,918,737.
730,541206,406798,114594,782193,196701,431083,610286,193979,548012,560779,850
7,698,366,231
43,641,000^436,486,673168,164,606
65,752,884132,494,797
33,195,7111,295
1,472,601,824 2,573,236,957
471,905,7501 5,772,768,5634,196,054,777
1,052,452,5213,501,260,245
260,174,35511,594
24,496,192,919
Totaldeductions .
$723,443,1614,118,231,488
8,259,5,548,1,466,734.
1,896!1,007;1,624,3,853,910,
10,033,3,227,
532,578177,853842,298306,427690,849798,213532,475544.078259;991773,834510,962
38,562,969,558
1,757,480,1701 8,502,253,50227,309,232,623
1,696,154,0677,174,965,248
856,646,25168,785
90,791,444,853
1 Gross income and total deductions incomplete (see text, p . 10).

STATISTICS OF INCOME. 13
TABLE B.—Distribution of corporation income, by industrial groups and by nature ofdeductions, calendar year 1921—Continued.
Industrial groups.
Agriculture and related industries.Mining and quarryingManufacturing:
Food products, liquors, andtobacco
Textiles and textile products..Leather and leather products..Rubber and rubber goodsLumber and wood productsPaper, pulp, and productsPrinting and publishingChemicals and allied substancesStone, clay, and glass products.Metal and [metal productsAll other manufacturing in-
dustries
Net income or deficit be-fore deducting tax.
Net income. Deficit.
$10,014,286137,916,753
97,476,60525,336,22143,496,706
Total manufacturingConstructionTransportation and other public
utilitiesTradePublic service—professional amuse-
ments, hotels, etcFinance, banking, insurance, etc...Combinations—predominant in-
dustry not ascertainableInactive concerr s
Total.
314,240,574
15,828,017
498,502,661
58,933,519376,130, 892
1,263,635,663
$47,844, 706229,355,028
48,844,71996,460,06249,708,836
4,296,755
228,635,037
7,340,931
435,286,343
54,883,046
38,421,10016,761
805,806,984
Income tax,war profits,and excessprofits tax.
$6,001,96231,969,216
65,676,30467,216,07011,814,847
815,46811,247,0737,584,06227,183,36629,597,86212,031,62890,307,720
28,295,849
351, 770,249
13,594,886
101,021,76596,742,515
19,269,09876,271,592
4,934,149
701,575,432
Net income or deficit afterdeducting tax.
Net income. Deficit.
$70,700,683
70,293,239
"31* 465," 078
172,459,000
2,233,131
397,480,896
39,664,421299,859,300
$53,846,668261,324,244
55,662,018
60,659,56697,275,53060,955,90911,880,817
4,261,638
"3i8,"942,"757
35,636,783645,275,018
151,625,561
43,355,24916, 761
911,696, 748 1,155, 443,501
In the table immediately following, the division of the corporation in-come, according to the nature of deductions, is expressed in percentages.TABLE C.—Percentage distribution of corporation income by nature of deductions and by
industrial groups, calendar year 1921.
Industrial groups.
Agriculture and related industries.Mining and quarryingManufacturing:
Food products, liquors, andtobacco
Textiles and textile products.Leather and leather products „Rubber and rubber goodsLumber and wood products..Paper, pulp, and productsPrinting and publishingChemicals and allied sub-
stancesStone, clay, and glass prod-
uctsMetal and metal productsAll other manufacturing in-
dustriesTotal manufacturing
ConstructionTransportation and other public
utilitiesTradePublic service—professional,
amusements, hotels, etcFinance, banking, insurance, etc .Combinations—predominant in-
dustry not ascertainableInactive concerns
Total
o
100.00
100.00100.00100.00100.00100.00100.00100.00
100. 00
100.00100.00
100.00
100.00
100.00
100.00
100.00100.00
100.00100. 00
100. 00
48.87
75.6375.9180.7483.0471.9774.2741.
68.99
64. C
68.50
72.20
62.43
0)80.57
23.6023.67
60.82.83
62.31
2.701.
1.332.732.411.423.422.814.76
1.61
3.302.05
3.18
2.29
4.74
C1)2.35
5.444.97
2.1919.
2.48
4.40 3.112.76 2.23
1.751.291.743.66 1.102.04 1. 831.58 1.38.82
1.36 1.
1.33 1.091.85 1. 56
1.63 1.17
1. 66 1.15
.891.97
0).811.92 1.97
14.35 3. 91
3. 65 2. 023.10
3.44 1.61
.69
2.45
gjj
lit
4.9013.09
1.772.001.192.305.504.272.36
4.e
4.903.62
2.99
2.46
3.751.76
4.062.49
2.82
43.09 107.0732.20 105.90
18.5414.76 97.5816. 63 103.4423.6117. 93 102.16.12 100. 4343.73
21.64
20.75
26.62
59.9746.36
26.84
115.13
94.34
19.34
95.4519. 56 102.33
22.92 100. 23
1.02 100.31
99.11
.. 0)15.35 100. 20
'6.6515.02
31.79 104.22. 29 132.22
If*
- 7 . 0 7- 5 . 9 0
.122.42
-15." 13- 2 . 6 9
- . 4 35.66
4.55- 2 . 3 3
- . 2 3
- . 3 1
0)- . 2 0
3.354.98
- 4 .-32.22
.50
.791.18.83.13.61.76
1.58
.76
1.26.92
.77
C1).35
1.101.01
.77
uspi- 7 . 9 6- 6 . 7 2
- . 6 71.24
- 4 . 2 7-15 . 26- 3 . 3 0- 1 . 1 9
4.08
- . 1 0
3.29- 3 . 2 5
- 1 . 1 1
- 1 . 2 3
Tl2
0)- . 5 5
2.253.97
- 5 . 2 9-32.22
- . 2 7
1 Not given, due to incomplete data.60729°—23 2
2 Minus sign (—) indicates deductions exceed gross income.
14 STATISTICS OF INCOME.
INCOME OF FEDERAL OBLIGATIONS NOT WHOLLY EXEMPT FROM TAX
(CORPORATION RETURNS).
Interest on obligations of the United States and war finance cor-poration bonds, not wholly exempt from tax, and included in grossincome, amounted to $203,095,789.
INCOME WHOLLY EXEMPT FROM TAX (CORPORATION RETURNS).
In addition to the income of corporations, as shown in the pre-ceding tables, there was likewise reported the following incomewholly exempt from tax:Dividends on stock of domestic corporations and from foreign corpora-
tions, taxable by the United States on their net incomes, and divi-dends on stock of personal service corporations out of earnings uponwhich a Federal income tax has been imposed $509,117, 760
Interest on obligations of the United States and its possessions, States,Territories, and political subdivisions thereof, and interest on farmloan bonds issued under the Federal farm loan act 188, 788, 627
Total 697,906,387
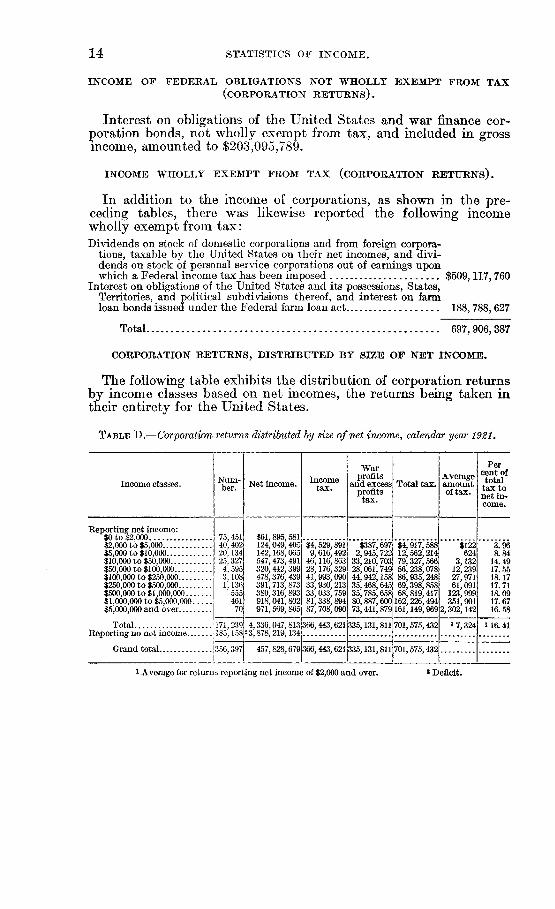
CORPORATION RETURNS, DISTRIBUTED BY SIZE OF NET INCOME.
The following table exhibits the distribution of corporation returnsby income classes based on net incomes, the returns being taken intheir entirety for the United States.
TABLE D.—Corporation returns distributed by size of net income, calendar year 1921.
Income classes.
Reporting net income:$0 to $2,000$2,000 t o $5,000$5,000 t o $10,000$10,000 t o $50,000$50,000 t o $100,000$100,000 t o $250,000$250,000 t o $500,000$500,000 t o $1,000,000$1,000,000 to $5,000,000$5,000,000 a n d over
Total.Reporting no net income
Grand total
Num-ber.
75,45140,40220,13425,3274,5953,1,136
555461
70
171,239185,158
356,397
Net income.
$61,895,581L24,049,405142,168,065547,473,491320,442,399478,376,439391,713, 873380,316,893918,041,802971,569, 865
Incometax.
$4,529,8919,616,492
46,116,86328,176,32941,993,09033,930, 21333,033, 75981,338, 89487, 708,090
4,336,047,813 366,443,621 335,131,811 701,575,43223,878,219,134
Warprofits
and excessprofitstax.
$387,6972,945,722
33,210,70328,061,74944,942,15835,468,64535,785,65880,887,60073,441,879 161
457,828,679 366,443,621 335,131,811 701,575,432
Total tax.
917,588562,214327,566238,078935,248398,858819,417226,494
Averageamountof tax.
$122624
3,13212,23927,97161,091
123,999351,901
149; 969 2,302,142
17,324
Percent oftotal
tax tonet in-come.
3.968.84
14.4917.5518.1717.7118.0917.6716.58
116.41
1 Average for returns reporting net income of $2,000 and over. 2 Deficit.
STATISTICS OF INCOME.
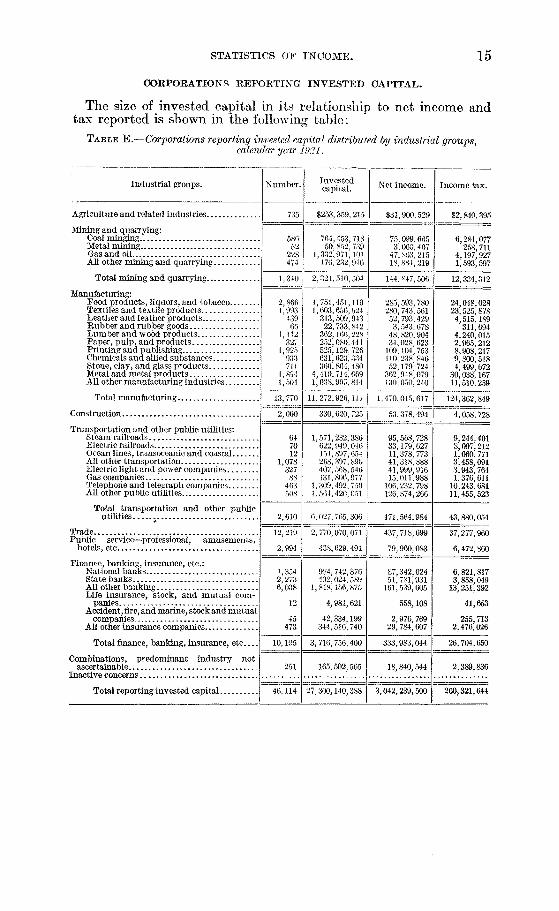
CORPORATIONS REPORTING INVESTED CAPITAL.
15
The size of invested capital in its relationship to net income andtax reported is shown in the following table:
TABLE E.—Corporations reporting invested capital distributed by industrial groups,calendar year 1921.
Industrial groups.
Agriculture and related industries
Mining and quarrying:Coal mingingMetal miningGas and oilAll other mining and quarrying
Total mining and quarrying
Manufacturing:Food products, liquors, and tobaccoTextiles and textile productsLeather and leather productsRubber and rubber goodsLumber and wood productsPaper, pulp, and productsPrinting and publishingChemicals and allied substancesStone, clay, and glass productsMetal and metal productsAll other manufacturing industries
Total manufacturing
Construction
Transportation and other public utilities:Steam railroadsElectric railroadsOcean lines, transoceanic and coastalAll other transportationElectric light and power companiesGas companiesTelephone and telegraph companiesAll other public utilities
Total transportation and other publicutilities
TradePublic service—professional, amusements,
hotels, etc
Finance, banking, insurance, etc.:National banksState banks .All other bankingLife insurance, stock, and mutual com-
paniesAccident, fire, and marine, stock and mutual
companiesAll other insurance companies
Total finance, banking, insurance, etc
Combinations, predominant industry notascertainable
Inactive concerns
Total reporting invested capital
Number.
735
58652
228474
1,340
2,8661 993
43966
1,112327
1,925933711
1,8941,504
13 770
2,000
647012
1,078327
88463508
2,610
12,219
2,994
1,3542, 2736,038
12
45473
10,195
251
46,114
Investedcapital.
$253,359,215
764,453,71850,852,739
1,332,971,101176,232,946
2,324,510,504
1,751,451,1101,603,656,524
313,509,94322,733,842
362.166,228252,080,441525,129,726631,623,334360,864,480
4,410,714,6691,038,995,814
11,272,926,111
330,620, 725
1,571,232,386622,949,046151,897,654268, 397,896407,568,546131,806,977
1,309,492,7501,564,420,051
6 027 765 306
Net income.
131,900,529
75,099,6653,060,407
47, S03, 21518', 884,219
144,847,506
285,593,780280, 743,56152,793,4293,543,678
48,820,90434,028,623
109,104,753110,238,84652,179, 724
362,948,079130,050,240
1,470,045,617
53,378,494
95,568,72833,179,62711,378,77341,318,88841,999,91615.011,988
106,232,798126,874,266
471 £fi4 QR4.
2,770,070,071
438,629,491
984,742,376492,024,589
1,848,156,875
4,981,621
42,334,199344,516,740
3,716, 756,400
165,502,565
27,300,140,388
437,718,699
79,960,083
87,342,02451,781,931
161,539,605
558,108
2,976,76929,784,607
333,983,044
18,840,544
3,042,239,500
Income tax.
$2,840,395
6,284,077258,711
4,197,9271,593,597
12,334,312
24,048,02823,525,8784,515,189
311,6944,240,0152,965,2128,908,2179,800,5184, 499, 672
30,038,16711,510,259
124,362,849
4,058,728
9,244,4013,097,2121,060,7713,458,0913,943,7641,376,611
10,243,68111,455,523
43,880,054
37,277,960
6,472,860
6,821,8173,858,049
13,251,392
41,653
255,7132,476,026
26, 704,650
2,389,836
260,321,644

STATISTICS OF INCOME.
TABLE E.—Corporations reporting invested capital distributed by industrial groups,calendar year 1921—Continued.
Industrial groups.War profitsand excessprofits tax.
Total tax.
Per centof net
incometo in-vestedcapital.
Per centof totaltax to
netincome.
Agriculture and related industries...
Mining and quarrying:Coal miningMetal miningG as and oilAll other mining and quarrying.
Total mining and quarrying...
Manufacturing:Food products, liquors, and tobacco..Textiles and textile productsLeather and leather productsRubber and rubber goodsLumber and wood productsPaper, pulp, and productsPrinting and publishingChemicals and allied substancesStone, clay, and glass productsMetal and* metal productsAll other manufacturing industries...
Total manufacturing.
ConstructionTransportation and other public utilities:
Steam railroadsElectric railroadsOcean lines, transoceanic and coastal..All other transportationElectric light and power companies...Gas companiesTelephone and telegraph companies...All other public utilities
Total transportation and other public utilities...
TradePublic service—professional, amusements, hotels, etc..Finance, banking, insurance, etc.:
National banksState banksAll other bankingLife insurance, stock, and mutual companiesAccident, fire, and marine, stock and mutual
companiesAll other insurance companies
Total finance, banking, insurance, etc.
Combinations, predominant industry not ascertainable.Inactive concerns :
$2,563,972 $5,404,367
8,294,777320,929
5,289,5832,202,272
14,578,854579,640
9,487,5103,795,869
16,107,561 28,441,873
38,710,20839,561,2796,956,022
367,4595,178,7203,645,206
17,252,19015,153,7266,014,255
53,655,67713,812,646
62,758,23663,087,15711,471,211
679,1539,418,7356,610,418
26,160,40724,954,24410,513,92783,693,84425,322,905
200,307,388 324,670,237
8,672,588 12,731,316
1,475,2401,478,085
559,6484,962,1942,017,0121,139,6252,192,564
10,057,292
10,719,6414,575,2971,620,4198,420,2855,960,7762,516,236
12,436,24521,512,815
23,881,660 67,761,714
49,935,49111,195,601
87,213,45117,668,461
3,705,9762,801,353
10,038,72642,734
95,7412,382,824
10,527,7936,659,402
23,290,11884,387
351,4544,858,850
19,067,354 45,772,004
1,857,353 4,247,189
Total reporting invested capital. 333,588,968 593,910,612
12.59
9.826.023.59
10.72
6.23
16.3117.5116.8415.5913.4813.5020.7817.4514.468.23
12.52
13.04
16.14
5.337.49
15.3910.3011.398.118.11
7.8
15.8018.23
8.8710.528.74
11.20
7. as8.65
8.99
11.38
11.14
16.94
19.4118.9419.8520.10
19.64
21.9722.4721.7319.1719.2919.4323.9822.6420.1523.0619.47
22.09
23.85
11.2213.7914.2420.3814.1916.7711.7116.96
14.37
19.9222.10
12.0512.8614.4215.12
11.8116.31
13.71
22.54
19.52
INCOME RETURNS BY STATES.COMBINED PERSONAL AND CORPORATION INCOME AND TAX.
The following table exhibits by States and Territories the com-bined personal and corporation incomes and income taxes for thecalendar year 1921. The amounts do not represent, however, whatmay be called the geographical distribution of income. The figuresare compiled from the returns filed in each State. An individualfiles his income-tax return in the district in which his legal residenceor principal place of business is located, and a corporation files itsincome-tax return in the district in which its principal place of business
STATISTICS OF INCOME. 17
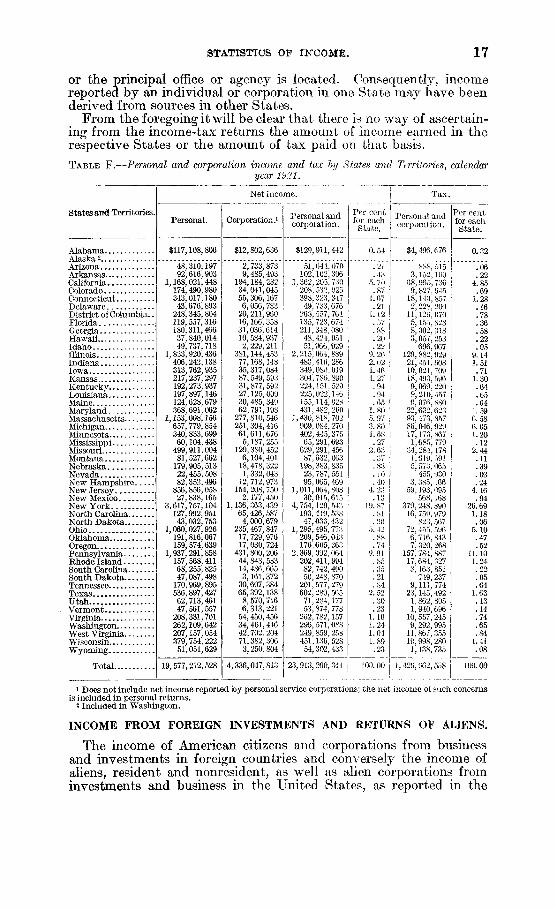
or the principal office or agency is located. Consequently, incomereported by an individual or corporation in one State may have beenderived from sources in other States.
From the foregoing it will be clear that there is no way of ascertain-ing from the income-tax returns the amount of income earned in therespective States or the amount of tax paid on that basis.TABLE F.—Personal and corporation income and tax by States and Territories, calendar
year 1921.
States and Territories.
AlabamaAlaska2ArizonaArkansasCaliforniaColoradoConnecticutDelawareDistrict of Columbia.FloridaGeorgiaHawaiiIdahoIllinoisIndianaIowaKansasKentuckyLouisianaMaineMarylandMassachusettsMichiganMinnesotaMississippiMissouriMontanaNebraskaNevadaNew Hampshire. . . .New JerseyNew MexicoNew YorkNorth CarolinaNorth DakotaOhioOklahomaOregonPennsylvaniaRhode IslandSouth CarolinaSouth DakotaTennesseeTexasUtahVermontVirginiaWashingtonWest VirginiaWisconsinWyoming
Total..
Net income.
Personal.
$117,108,806
48,310,19792,616,903
1,168,021,448174,490,980343,017,18043,676,893248,345,804119,557,316180,311,46637,840,01449,737,718
1,833,920,436406,242,138313,762,935217,237,297192,273,937197,897,146124,628,679368,691,062
1,153,008,156657,779,854340,833,69960,104,438499,911,00481,527,662179,905,51322,455,50882,352,496856,856,05827,838,165
3,617,757,104127,992,95143,032,753
1,060,027,926191,816,067159,574,639
1,937,291,858157,568,41168,255,82547,087,498170,969,895536,897,42762,713,46147,561,557208,331,701262,109,642207,157,054379,754,22251,051,629
19,577,212,528
Corporation.1
$12,802,636
2,9,
194,34,55,6,20,16,31,10,2,
381,77,35,87,31,27.30'62,
277,251,61,5,
129,6,18,1,
12,154,2,
1,136,65,4,
235,17,17,
431,44,14,3,
30,65,8,6,54,34,42,71,3,
733,873485,493184,282041,045306,167056,783211,960166,358036,614584,937229,211144,453168,148317,084549, 593877,592125, 000485,349791,198810,546304,416611,676187,255380,452104,401478,322332,043712,973208, 750177,450363,439426,5S7000,679467,847729,976030,724800,206843,583486,665161,372607,384392,138570,716313,221450,456461,446702,204382,306250,804
4,336,047,813
Personal andcorporation.
$129,911,442
51,102,
1, 362,208,398,49,
268.135;211,48,51,
2, 215,483,349,304!224'225,155,431,
1,430,909,40265!
629:87!
198',23.95;
1,011,30,
4,754,193,47,
1,295,209,176',
2,369,202,82,50,
201,602,71,53,
262,296;249,451,54,
044,070102,396205, 730532 025323, 317733,676557,764723,674348,080424,951966;929064,889410,286080,019786, 890151,529022,146114,028482,260818, 702084,270445,375291,693291,456632.063383,835787, 551065,469064,808015,615120,54:'.419,538033, 432495, 773546,043605, 363092.064411,994742,490248, 870577,279289,565284,177874, 778782,157571, OSS859,258136,528302,433
Per centfor each
State.
0.54
23,913,260,341
.21
.435.70
.871.67
.211.12
.57
.88
.20
.229.262.021.461.27
.94
.94
.651.805. 973.801.68
2.63
. JO
. 404. 2,'',
.1319.87
.81
.205. 42
.88
.749. 91
.85
.35
.21
.842.52
.30
.231.101.241.041.89
.23
Tax.
Personal andcorporation.
Per centfor eachState.
$4,496,676
100.00
888,5153,152,109
68,965,7369,827,045
18,143, 8572, 228, 200
11,126,0705,155, 8288,302,3183,057,253
696,967129,882,92921,451,50310,021,70918,493,5969,069.2209, 210; 4579,076, 880
22,632,62393,473,85786,046,92917,173,8671,685,779
34, 284,178
5,573,065455, 930
3,385,16659,193, 095
568, 168379,248, S90
16, 759, 979823, 567
72,455, 5966,716, S437,320, 268
157,784, 88717,684, 3273,163, 851
749,2379,111,774
23,145, 4921,862,8051,940,696
10,557, 2459,292,995
11,867,35519,998,2801,138,735
1,420,962,538
0.32
.06
.224.85
.691.28
.16
.78
.36
.58
.22
.059.141.51
.711.30
.64
.65
.641. 59(i. 586.051.20
.122.44
.11
.39
.03
.244.16
.0426.691.18
.065.10
.47.52
11.101.24
.22
.05
.641.63
.13
.14
.74
.65
.841.41.08
100.00
1 Does not include net income reported by personal service corporations; the net income of such concernsis included in personal returns.
2 Included in Washington.
INCOME FROM FOREIGN INVESTMENTS AND RETURNS OF ALIENS.
The income of American citizens and corporations from businessand investments in foreign countries and conversely the income ofaliens, resident and nonresident, as well as alien corporations frominvestments and business in the United States, as reported in the

18 STATISTICS OF INCOMS.
returns of net income for the calendar year ended December 31, 1921,is shown below. The data relative to individuals represent onlythe information contained in returns reporting net income of $5,000and over.
Income from sources within the United States
Nonresident aliens..Resident aliensForeign corp oration
United States
Total
) orations.
lding investments in the
Numberof
returns.
3,4972,979
235
6,711
Total netincome.
$43,623,27724,604,011
28,688,213
96,915,501
Federalincome tax.
$7,881,0851,630,660
2,908,667
12,420,412
Income from sources in foreign countries.
American citizens and domestic corporations.
American citizens residing abroadAll other American citizens or residents reporting net
income of $5,000 and overDomestic corporations in business or holding investments
in foreign countries
Total
Reporting foreignincome.
Numberof
returns.
1,747
28,599
537
30, S83
Amount.
$7,484,551
36,551,204
65,873,267
109,909,022
Tax paid foreigncountries.
Numberof
returns.
920
537
2,421
Amount.
$1,406,291
1,751,846
4,668,654
7,826,791
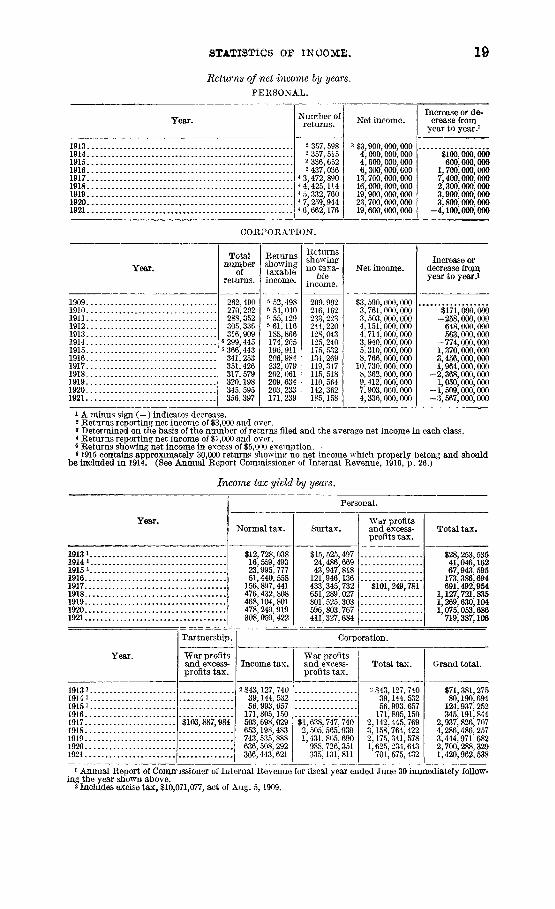
SUMMARY OF INCOME AND TAX REPORTED BY YEARS.
A general review of the number of returns, the net income, andthe tax reported for each of the years since the inception of thepresent epoch of income taxation is given in the following tables:
Number of personal returns,
Income classes.
Under $1,000$1,000 to $2,000 . .$2 000 to $3 000$3,000 to $4,000$4,000 to $5,000$5,000 to $10,000$10,000 to $15,000$15,000 to $20,000$20,000 to $25,000$25,000 to $30,000$30,000 to $40,000$40,000 to $50,000$50,000 to $100,000$100,000 to $150,000$150,000 to $200,000$200,000 to $250.000$250,000 to $300,000$300,000 to $400,000$400,000 to $500,000$500,000 to $1,000,000$1,000,000 and over
TotalMarried women making
separate returns fromhusbands
Total number ofreturns filed
1914
82,75466,525
127,44834,14115,7908,6725,4836,0083,1855,1611,189
40623313014769
11460
357, 515
357,515
1915
69,04558,949
120,40234,10216,4759,7076,1967,0054,1006,8471,793
724386216254122209120
336,652
336,652
calendar years 1914-1921,
1916
85,12272' 027
150, 55345,30922,61812,9538.055
10'. 0685; 611
10,4522.900L284
726427469245376206
429,401
1 7,635
437,036
1917
1,640, 758838,707374,958185,805270,66665, 80029,89616,80610, 57112,7337,087
12,4393,3021,302
703342380179315141
3,472,890
3,472,890
1918
1,516,9381,496,878
610,095322,241319,35669,99230,22716,35010,20611,8876,4499,9962,358
86640124726012217867
4,425,114
4,425,114
by income classes.
1919
1,924,8721,569,741
742,334438,154438,851
97, 85242,02822,60513,76915,4108,298
13,3202,9831,092
52225028514018965
5,332,760
5,332,760
1920
2,671,9502,569,316
894, 559442,557455,442103,57044, 53123,72914,47115,8088,269
12,0932,191
59030716616970
12333
7,259,944
7,259,944
1921
401,8492,440,5442,222,031
702,991369,155353,24780,01434,23018,10010, 84812,0476,0518,7171,367
4502058498646321
6,662,176
6,662,176
1 In 1916 the net income on returns filed separately by husband and wife is combined and the total ap-pears as one return. In all other years the returns of married women filed separately are included in theirindividual income classes independently of husband's income.
NOTE.—The returns for 1913 are omitted, as they pertain only to the last 10 months of that year.
STATISTICS INCOME. 19
Returns of net income by years.PERSONAL.
Year.
19131914 . . . . . . . .1915191619171918191919201921 .
Number ofreturns.
2 357,5982 357, 5152336,6522 437,036
4 3,472, 89014,425,1141 5,332,760^7,259,944i 6,662,176
Net income.
3 $3,900,000,0004,000,000,0004,600,000,0006,300,000, GOO
13,700,000,00016,000,000,00019,900,000,00023,700,000,00019,600,000,000
Increase or de-crease from
year to year.1
$100,000,000600,000,000
1,700,000,0007,400,000,0002,300,000,0003,900,000,0003,800,000,000
-4,100,000,000
C O R P O R A T I O N .
Year.
1909 . .19101911 . . .19121913 . .191419151916191719181919. . . .19201921 . . .
Totalnumber
ofreturns.
262,490270,202288,352305,336316,909
6 299,445e 366, 443
341, 253351, 426317, 579320,198345,595356,397
Returnsshowingtaxableincome.
& 52, 4985 54,040& 55,129& 61,116188,866174, 205190,911206,984232, 079202, 061209,634203, 233171, 239
Returnsshowingno taxa-
bleincome.
209,992216,162233,223244, 220128,043125,240175, 532134,269119,347115, 518110, 564142,362185,158
Net income.
$3,590,000,0003,761,000,0003,503,000,0004,151,000,0004, 714,000,0003,940,000,0005,310, 000,0008,766,000,000
10,730, 000, 0008,362,000,0009,412,000,0007,903,000,0004,336,000,000
Increase ordecrease fromyear to year.*
sl7i, 665,666-258; 000, 000
648, 000,000563,000,000
-774,000, 0001,370,000,0003,456,000,0001,964,000,000
-2,368,000,0001,050,000,000
—1,509,000,000-3,567,000,000
1 A minus sign (—) indicates decrease.2 Returns reporting net income of $3,000 and over.3 Determined on the basis of the number of returns filed and the average net income in each class.4 Returns reporting net income of $1,000 and over.6 Returns showing net income in excess of $5,000 exemption.6 1915 contains approximately 30,000 returns showing no net income which properly belong and should
be included in 1914. (See Annual Report Commissioner of Internal Revenue, 1916, p. 26.)
Income tax yield by years.
Year.
191311914 i1915 i1916 .19171918191919201921
Year.
191311914 119151.191619171918191919201921
Personal.
Normal tax.
$12,728,03816,559,49323,995,77751,440,558
156,897,441476,432,808468,104,801478,249,919308,059,422
Partnership.
War profitsand excess-profits tax.
$103,887,984
Surtax.
$15,525,49724,486,66943,947,818
121,946,136433,345,732651,289,027801,525,303596,803,767411,327,684
War profitsand excess-profits tax.
$101,249,781
Total tax.
$28,253,53541,046,16267,943,595
173,386,694691,492,954
1,127,721,8351,269,630,1041,075,053,686
719,387,106
Corporation.
Income tax.
2 $43,127, 74039,144, 53256,993', 657
171, 805,150503, 698,029653,198, 483743, 535, 888636, 508, 292366,443, 621
"War profitsand excess-profits tax.
$1,638,747,7402,505, 565,9391,431, 805', 690
988, 726,351335,131, 811
Total tax.
2 $43,127, 74039,144,53256,993,657
171,805,1502,142,445,7693,158, 764,4222,175, 341, 5781,625, 234,643
701,575,432
Grand total.
$71,381,27580,190,694
124,937,252345,191,844
2,937,826,7074,286,486, 2573,444,971,6822,700,288,3291,420,962,538
1 Annual Report of Commissioner of Internal Revenue for fiscal year ended June 30 immediately follow-ing the year shown above.
2 Includes excise tax, $10,071,077, act of Aug. 5, 1909.

20 STATISTICS OF INCOME.
Personal returns, net income reported for calendar years 1916-1921, by income classes.
Income classes.
Net income.
1916 1917 1918
Under $1,000$1,000 to $2,000$2,000 to $3,000$3,000 to $5,000$5,000 to $10,000$10,000 to $25,000$25,000 to $50,000$50,000 to $100,000....$100,000 to$150,000...$150,000 to $300,000...$300,000 to $500,000...$500,000 to $1,000,000.$1,000,000 and over...
Total.
$624,1,037,1,235,
822,722,357,505,271,256,464,
6b9,015247,977015,786661,658795,474355,318859,406938,017771,325263,644
i $2,461,137,0002,064,977,3282,115,884,6011.827,508,0881,687,165,6191,042,320,083
846,894,335400,492,040474,651,960209,904,969214,631,270306,835,914
$2,232,354,5773,626,824,8333,535,219,0072,145,690,0161,736,548,050
978,042,710679,720,737284,106,740305,024,817144,545,428119,075,548137,486,892
6,298,577,620 13,652,383,207 15,924,639,355
Income classes.
Net income.
1919 1920 1921
Under $1,000$1,000 to $2,000$2,000 to $3,000$3,000 to $5,000$5,000 to $10,000$10,000 to $25,000$25,000 t o $50,000$50,000 to $100,000....$100,000 to $150,000...$150,000 to $300,000...$300,000 to $500,000...$500,000 to $1,000,000.$1,000,000 and over...
Total.
$2,829,113,1513,807,286,3654,513,264,0302,954,137,2532,412,275,7571,277,364,635
896,497,209358,392,923371,148,536159,070,948128,290,396152,650,245
$4,050,066,6186,184,543,3685,039,607,2393,068,330,9632,547,904,7861,307,785,113
810,386,333265,511,505215,138,67389,313,55279,962,89477,078,139
$213,849,9343,620,761,7685,325,931,2654,054,891,2442,378,759,2371,958,156,206
979,629,305582,230,218163,520,999145,948,04761,342,55042,780,42649,411,329
19,859,491,448 23,735,629,183 19,577,212,528
Income classes.
Increase or decrease.2
1917-16
Amount. Percent.
1918-17
Amount. Percent.
Under $1,000$1,000 to $2,000$2,000 to $3,000$3,000 to $5,000$5,000 to $10,000$10,000 to $25,000$25,000 to $50,000$50,000 to $100,000....$100,000 to $150,000...$150,000 to $300,000...$300,000 to $500,000...$500,000 to $1,000,000.$1,000,000 and over . . .
Total.
$2,461,2,064,1,491,
790,452,219,124,43,
- 3 1 .-62;-42,
-157,
137,000977,328195,586260, 111149,833658,425098,861136,722207,446033,048140,055427,730
2397637271712
- 6- 2 3- 1 6- 3 4
-$228,782,4231,561,847,5051,419,354,406
318,181,92849,382,431
-64,277,373-167,173,598-116,385,300-169,627,143-65,359,541-95,555,722
-169,349,022
7667173
- 6- 2 0- 2 9- 3 6- 3 1- 4 5- 5 5
7,353,805,587 117 2,272,256,148
1 Determined on basis of the number of returns filed and the average net income.* A minus sign (—) indicates decrease.
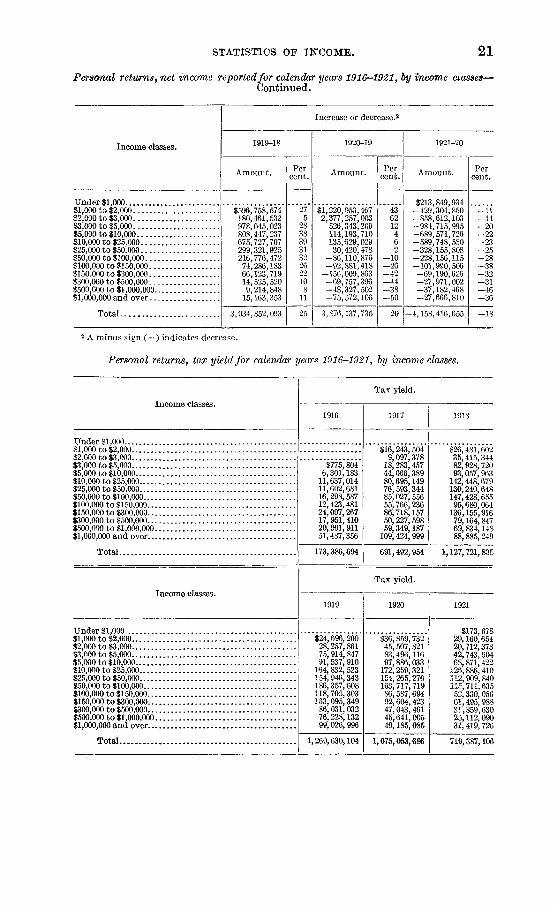
STATISTICS OF INCOME. 21
Personal returns, net income reported for calendar years 1916-1921, by income classes—
Continued.
Income classes.
U n d e r $1,000$1,000 to $2,000$2,000 t o $3,000$3,000 t o $5,000$5,000 to $10,000$10,000 t o $25,000$25,000 to $50,000$50,000 t o $100,000$100,000 t o $150,000.. .$150,000 t o $300,000.. .$300,000 t o $500,000.. .$500,000 to $1,000,000..$1,000,000and o v e r . . .
Total.
Increase or decrease.3
1919-18
Amount.
$596,180,978,80S,675,299,216,
7 166!U,9.
15!
758,574461,532045,023447,237727,707321,925776,472286,183123,719525,520214,848163,353
3,934,852,093
Per
cent.
1920-19
Amount.
$1,220,953,4672,377,257,003
526,343,209114,193,710135,629,02930,420,478
-86,110,876-92,881,418
-156,009,863-69,757,396-48,327,502-75,572,106
3,876,137,735
Percent.
1921-20
Amount.
$213,849,934-429,304,850-858,612,103-984,715,995-689,571,726—589,748,580-328,155,808-228,156,115-101,990,506-69,190,626—27,971,002-37,182,468-27,666,810
20 1-4,158,416,655
Per
cent.
-11-14-20-22-23-25-28-38-32-31-46
2 A minus sign (—) indicates decrease.
Personal returns, tax yield for calendar years 1916-1921, by income classes.
Income classes.
Unde r $1,000$1,000 t o $2,000$2,000 t o $3,000$3,000 t o $5,000$5,000 t o $10,000$10,000 t o $25,000$25,000 t o $50,000$50,000 to $100,000....$100,000 t o $150,000...$150,000 t o $300,000...$300,000 t o $500,000...$500,000 to $1,000,000.$1,000,000 a n d ove r . . .
Total.
Tax yield.
1916
$775,8046,301,18311,637,01411,602,68116,298,58712,423, 48124,007,26717,951,41020,901, 91151,487,356
173,386,694
1917
$16,243,5049,097,378
18,283,45744,066,38980,695,14976,593,34485,027,55655,766,23686,718,15750,227,59859,349,187
109,424,999
691,492,954
$26,481,60235,415,34482,928, 72093,057,963
142,448,679130,240,648147,428,65595,680,064
136,155,91679,164,84769,834,14888,885,249
1,127,721,835
Income classes.
U n d e r $1,000$1,000 t o $2,000$2,000 t o $3,000$3,000 t o $5,000$5,000 t o $10 ,000 . . . . . .$10,000 to $25,000$25,000 t o $50,000$50,000 t o $100,000....$100,000 to $150,000...$150,000 t o $300,000...$300,000 t o $500,000...$500,000 t o $1,000,000.$1,000,000 a n d ove r . . .
Total.
Tax yield.
1919
$24,696,20028,257,86175,914, 84791,537,910
164,832, 523154,946,343186,357,608118,705,303133,095,349
86,031,03276,228,13299,026,996
1,269,630,104
1920
$36,859,73245,507,82183,496,11697,886,033172,259,321154,265,276163,717,71986,587,69492,604,42347,043,46145,641,00549,185,085
1,075,053,686
1921
$173,67829,160,65420,712,37342,743,60468,871,422
126,886,410"112,909,840115,711,63552,330,05661,495, 98831,859,63025,112,09031,419, 726
719,387,106

22 STATISTICS OF INCOME.
Personal returns, tax yield for calendar years 1916-1921, by income classes—Continued.
Income c.
Under $1,000$1,000 to $2,000...$2,000 to $3,000$3,000 to $5,000$5,000 to $10,000$10,000 to $25,000$25,000 to $50,000$50,000 to $100,000$100,000 to $150,000$150,000 to $300,000$300,000 to $500,000$500,000 to $1,000,000$1,000,000 and over
Total.
Increase or decrease.1
1917-16
Amount.
$16,243,5049,097,378
17,507,65337,765,20669,058,13564,990,66368,728,96943,342,75562,710,89032,276,18838,447,27657,937,643
618,106,260
Percent.
2,257599593560422349261180184113
299
1918-17
Amount.
$10,238,09826,317,96664,645,26348,991,57461,753,53053,647,30462,401,09939,913,82849,437,75928,937,24910,484,961
-20,539,750
436,228,881
Percent.
6028935411177707372575818
-19
Income classes.
Under $1.000$1,000 to $2,000$2,000 to $3,000$3,000 to $5,000$5,000 to $10,000$10,000 to $25,000$25,000 to $50,000$50,000 to $100,000$100,000 to $150,000...$150,000 to $300,000...$300,000 to $500,000...$500,000 to $1,000,000.$1,000,000and over . . .
Total.
Increase or decrease.1
1919-18
Amount.
—$1,785,402-7,157,483-7,013,873—1,520,05322,383,84424,705,69538,928,95323,025,23926,939,4336,866,1856,393,98410,141,747
141,908,269
Percent.
- 7- 2 0- 8- 2161926242099
11
13
1920-19
Amount.
$12,163,53217,249,9607,581,2696,348,1237,426,798-681,067
-32,117,609-70,490,926-38,987,571-30,587,127-49,841,911
-194,576,418
Percent.
49611075
- 1- 1 2- 2 7- 4 3- 4 5- 4 0- 5 0
- 1 5
1921-20
Amount.
$173,678-7,699,078-24,795,448-40,752,512—29,014,611-45,372,911-41,355,436-48,006,084-34,257,638-31,108,435-15,183,831-20,528,915-17,765,359
-355,666,580
Percent.
- 2 1- 5 4- 4 9- 3 0- 2 6- 2 7- 2 9- 4 0- 3 4- 3 2- 4 5
-33
i A minus sign (—) indicates decrease.
Personal returns, average tax and average rate of tax per individual, calendar years 1916—
1921, by income classes.
Income classes.
Under $1 000$1,000 to $2,000$2,000 to $3,000$3,000 to $5,000$5,000 to $10,000$10,000 to $25,000$25,000 to $50,000$50,000 to $100,000$100,000 to $150,000$150,000 to $300,000$300,000 to $500,000$500,000 to $1,000,000$1,000,000 and over
General average...
1916
Average taxper individual.
$4.9441.85
143. 88488. 86
1,559.374,283. 969,851.16
25,142. 0355,590.19
249,938. 62
396.60
Averagerate of
tax (percent).
0.12.61.94
1.412.253.484.756.608.14
11.09
2.75
1917
Average taxper individual.
$9.9010.8532.60
162. 80717. 27
2,520.266,835. 56
16,888. 6236,948.5189,852. 59
188,410.12776,063. 82
199.11
Averagerate of
tax (percent).
0.66.44.86
2.414.787.34
10.0413.9218.2723.9327.6335.65
5.06
1918
Average taxper individual.
$17.4623.6688.95
291.391,222.014,563.12
14,748.7640,576. 7989,871.89
207,237.82392,326.67
1,326,645.51
254.85
Averagerate of
tax (percent).
1.19.98
2.354.348.20
13.3221.6933.6844.6454.7758.6564.65
7.08
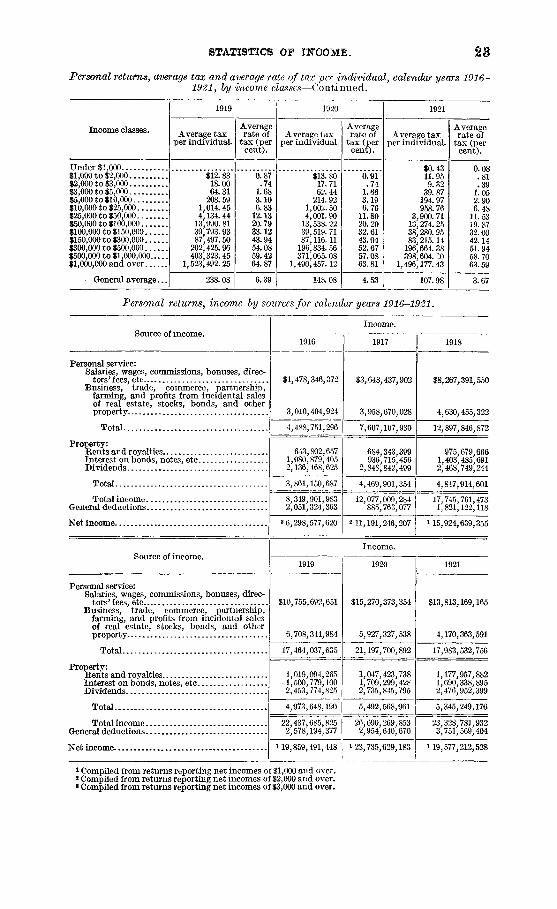
STATISTICS OF INOOME.
Personal returns, average tax and average rate of tax per individual, calendar years 1916-1921, by income classes—Continued.
Income classes.
Under $1,000$1,000 to $2,000$2,000 to $3,000$3,000 to $5,000$5,000 to $10,000$10,000 to $25,000$25,000 to $50,000$50,000 to $100,000$100,000 to $150,000$150,000 to $300,000$300,000 to $500,000$500,000 to $1,000,000$1,000,000 and over
General average...
1919
Average taxper individual.
$12. 8318.0064.31
208. 591,014.454,134.44
13,990. 8139,793.9387,497.50
202,425.96403,323.45
1,523,492.25
238. 08
Averagerate of
tax (percent).
0.87.74
1.683.106.83
12.1320.7933.1243.9454.0859.4264.87
6.39
1920
Average taxper individual.
Hi 8*617.7162. 44
214. 921,002.504,001.90
13,538.2239,519. 7187,116.11
196,834. 56371,065.08
1,490,457.12
148.08
Averagerate of
tax (percent).
0.91.74
1.663.196.76
11.8020.2032.6143.0452.6757.0863.81
4.53
1921
Average taxper individual.
$0.4311.959.32
39,, 87194. 97958. 76
3,900.7113,274. 2538,280.9583,215.14
196,664.38398,604. CO
1,496,177.43
107.98
Averagerate of
tax (percent).
0.08.81.39
1.052.906.48
11.5319.8732.0042.1451.9458.7063.59
3.67
Personal returns, income by sources for calendar years 1916-1921.
Source of income.
Personal service:Salaries, wages, commissions, bonuses, direc-
tors' fees, etcBusiness, trade, commerce, partnership,
farming, and profits from incidental salesof real estate, stocks, bonds, and otherproperty
Total
Property:Rents and royaltiesInterest on bonds, notes, etcDividends
Total
Total incomeGeneral deductions
Net income
Source of income.
Personal service:Salaries, wages, commissions, bonuses, direc-
tors'fees, etcBusiness, trade, commerce, partnership,
farming, and profits from incidental salesof real estate, stocks, bonds, and otherproperty
Total
Property:Rents and royaltiesInterest on bonds, notes, etcDividends
Total
Total incomeGeneral deductions . .
Net income
1916
$1,478,346,372
3,010,404,924
4,488,751,296
643,802,6571,080,879,4052,136,468,625
3,861,150,687
8,349,901,9832,051,324,363
3 6,298,577,620
Income.
1917
$3,648,437,902
3,958,670,028
7,607,107,930
684,343,399936,715,456
2,848,842,499
4,469,901,354
12,077,009,284885,763,077
2 11,191,246,207
1918
$8,267,391,550
4,630,455,322
12,897,846,872
975,679,6661,403,485,6912,468,749,244
4,847,914,601
17,745,761,4731,821,122,118
115,924,639,355
Income.
1919
$10,755,692,651
6,708,344,984
17,464,037,635
1,019,094,265-1,500,779,1002,453,774,825
4,973,648,190
22,437,685,8252,578,194,377
119,859,491,448
1920
$15,270,373,354
5,927,327,538
21,197,700,892
1,047,423,7381,709,299,4282,735,845,795
5,492,568,961
26,690,269,8532,954,640,670
123,735,629,183
1921
$13,813,169,165
4,170,363,591
17,983,532,756
1,177,957,8821,690,338,8952,476,952,399
5,345,249,176
23,328,781,9323,751,569,404
119,577,212,528
1 Compiled from returns reporting net incomes of $1,000 and over.2 Compiled from returns reporting net incomes of $2,000 and over.* Compiled from returns reporting net incomes of $3,000 and over.
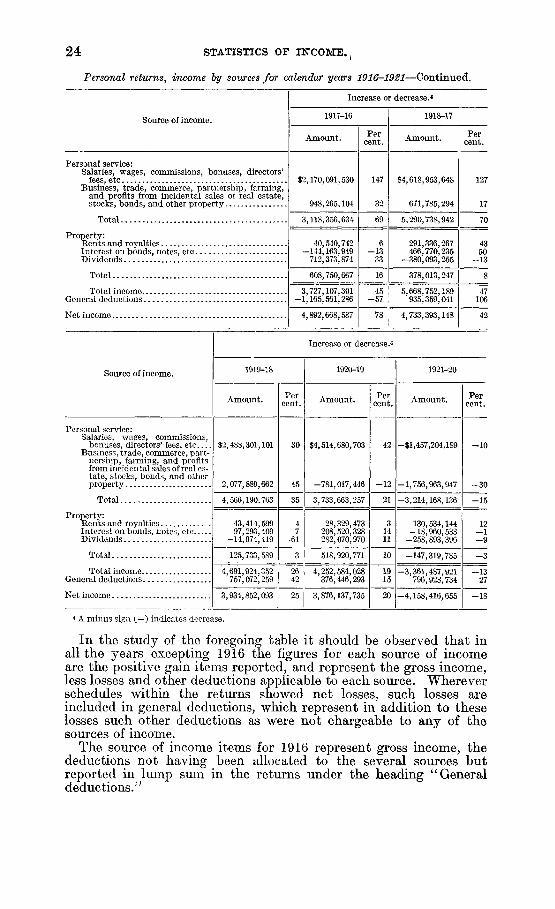
24 STATISTICS OF INCOME.,
Personal returns, income by sources for calendar years 1916-1921—Continued.
Source of income.
Personal service:Salaries, wages, commissions, bonuses,
fees, etc . .directors*
Business, trade, commerce, partnership, farming,and profits from incidental sales of real estate,stocks, bonds, and other property
Total
Property:Rents and royaltiesInterest on bonds, notes, etcDividends
Total
Total incomeGeneral deductions
Net income
Source of income.
Personal service:Salaries, wages, commissions,
bonuses, directors' fees, etcBusiness, trade, commerce, part-
nership, farming, and profitsfrom incidental sales of real es-tate, stocks, bonds, and otherproperty
Total
Property:Rents and royaltiesInterest on bonds, notes, etcDividends
Total
Total incomeGeneral deductions
Net income
$2
2
4
4
3
1919-18
Amount
,488
,077,
,566,
43,97,
- 1 4
125,
.fWI,757,
,934,
301,
889,
190,
414,293,974,
733,
q94072^
852,
101
662
763
599409419
589
T>?259
093
Increase or decrease.*
1917-16
Amount.
¥
z
,170,091,530
948,265,104
,118,356,634
40,540,742-144,163,949
712,373,874
608,750,667
3- 1
4
Percent.
30
45
35
47
- 6 1
3
2642
25
,727,107,301,165,561,286
,892,668,587
Percent.
147
32
69
6- 1 3
33
16
45- 5 7
78
1918-17
Amount.
$4,618,953,648
671,785,294
5,290,738,942
291,336,267466,770,235
-380,093,255
378,013,247
5,668,752,189935,359,041
4,733,393,148
Increase or decrease.4
1920-19
Amount.
$4,514,680,703
-781,017,446
3,733,663,257
28,329,473208,520,328282,070,970
518,920,771
4 252,584,028376,446,293
3,876,137,735
Percent.
42
- 1 2
21
31411
10
1915
20
Percent.
127
17
70
4350
- 1 3
8
47106
42
1921-20
Amount.
—$1,457,204,189
-1,756,963,947
-3,214,168,136
130,534,144-18,960,533
-258,893,396
-147,319,785
—3 361 487 921796,928,734
-4,158,416,655
Percent.
- 1 0
- 3 0
—15
12—1
- 3
—1327
- 1 8
4 A minus sign (—) indicates decrease.
In the study of the foregoing table it should be observed that inall the years excepting 1916 the figures for each source of incomeare the positive gain items reported, and represent the gross income,less losses and other deductions applicable to each source. Whereverschedules within the returns showed net losses, such losses areincluded in general deductions, which represent in addition to theselosses such other deductions as were not chargeable to any of thesources of income.
The source of income items for 1916 represent gross income, thedeductions not having been allocated to the several sources butreported in lump sum in the returns under the heading " Generaldeductions.''

STATISTICS OF INCOME. 2 5
PERSONAL RETURNS BY COUNTIES AND CITIES.
The number of personal returns filed for the calendar year 1921 ineach county of the United States, as well as in each city having apopulation of 5,000 or over, are shown elsewhere in this publication.The compilation does not represent an exact count of the returns foreach of the counties or cities but is a very close approximation of thenumber filed and is arrived at as follows: Index cards are prepared inthe offices of the collectors of internal revenue for the returns of netincome filed in each collection district. These cards are arranged bycounties and cities and the number is ascertained by measurementon the basis of a certain number of cards to the inch.
FEDERAL ESTATE TAX RETURNS.
There are printed on the following pages a series of statistical tablesprepared from an inspection of estate tax returns filed from Janu-ary 16, 1922, to December 31,1922, inclusive. These tables are basedon estate tax returns actually filed with the bureau during thisperiod as distinguished from the number of taxable estates origi-nating within the period (the returns not being due until one yearafter the date of death), and the tables are in continuance of the estatetax tables previously published, which covered returns filed fromSeptember 9, 1916, the effective date of the original estate tax act,to January 15, 1922, the date as of which the first statistical analy-sis of estate tax returns was made.
The Federal estate tax as imposed by the several revenue acts is atax levied on the transfer of the net estate of a decedent as definedby the statute, and the tax is graduated according to the size of thenet estate. In these tables the size of the net estate is divided intoblocks corresponding to the successive taxable blocks as fixed bythe revenue acts. The tax, while popularly referred to as a Federalinheritance tax, is an estate tax and not an inheritance tax, thedistinction being that the tax is levied on an estate in its entirety,whereas in the case of inheritance taxes the tax is generally leviedon the share received by the individual legatee or beneficiary and ismeasured by that amount. The net estate" as reflected in these tablesis the gross estate less the sum of the authorized deductions, includingin the case of resident decedents a specific exemption of $50,000which does not apply in the case of nonresident decedents. Thegross estate represents the estate of the decedent within the usualmeaning of that term, together with certain items of property spe-cifically included b}̂ statute as in the case of transfers made in con-templation of death or intended to take effect at or after death. Forfurther explanation, reference should be made to Regulations 63relating to estate tax.
The two statistical analyses made of returns filed for the periodfrom. September 9, 1916, to December 31, 1922, show the followingtotals:
Previous statistics as published.Present compilation
Total
Eeturnsfiled. Tax.
45,12613,506
58,632
$356,516,251118,776,541
475,292,792
26 STATISTICS OF INCOME.
The tables are based on the data given in the returns as filed butnot as audited. The tax shown does not correspond with actual col-lections made during this period for the reason that payment maybe made at a later date than when the returns are filed and for thefurther reason that field investigation and office audit may discloseadditional tax which is not reflected in these tables.
Table A covers only returns filed for estates of resident decedents,and gives a detailed statistical analysis showing the distribution ofthe gross estate into the several forms of wealth owned by the de-cedents or into the several classifications specifically included as tax-able, as in the case of taxable transfers, and the distribution of thedeductions according to the several classifications entered on thereturns and established by the revenue acts. The table furthershows this distribution according to the size of the net estate intotaxable blocks, and the relative percentages of the several classifi-cations. This analysis, which has not been attempted before, pre-sents an authentic and representative statement showing the dis-tribution of estates into the several forms of wealth owned by thedecedents in the case of all estates amounting to more than $50,000for which returns were filed during this period. These returns arerendered more valuable for this purpose inasmuch as they representestates having their situs in every collection district within the UnitedStates and this composite picture of the distribution of nationalwealth in estates of this importance affords a unique opportunity toobtain an accurate survey which is not only of great value to theadministrative officers of the bureau but should prove of generalinterest as an important contribution to the statistics of wealth.
Table B is a statistical analysis of returns filed for the estates ofnonresident decedents which shows the distribution by the size ofthe net estate. A detailed analysis as in the case of Table A was notattempted as to these returns; the experience of the bureau, however,in their audit shows that the property of nonresident decedents con-sists largely of cash and securities.
Tables C and D show by collection districts the total number ofreturns, the aggregate gross estate, the total amount of deductions,the total net estate subject to tax, and the total tax. If a summaryfor any particular State is desired it can be obtained by combiningthe data for the collection districts within the State as in the case ofthe two California districts.
Table E shows the simple and cumulative distribution by size ofthe net estate and is of interest and importance as indicating thesource from which the principal part of the tax is actually collectedand also as indicating for administrative purposes the relative impor-tance of the net estates falling within the several blocks.
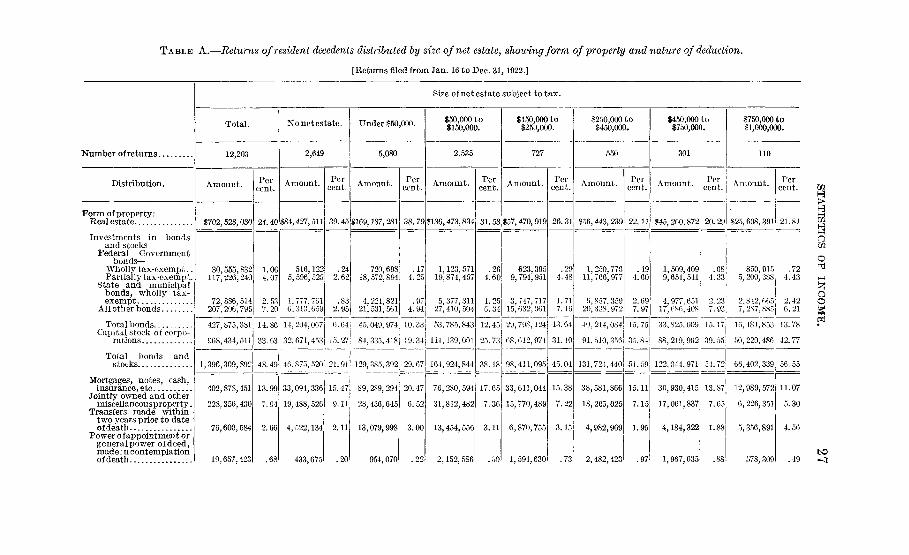
TABLE A.—Returns of resident decedents distributed by size of net estate, showing form of property and nature of deduction.
Number of returns
Distribution.
Form of property:Real estate
Investments in bondsand s tocks-
Federal Governmentbonds—
Wholly tax-exempt..Partially tax-exempt.
State and municipalbonds, wholly tax-exempt
All other bonds
Total bondsCapital stock of corpo-
rations
Total bonds andstocks..
Mortgages, notes, cash,insurance, etc
Jointly owned and othermiscellaneousproperty.
Transfers made withintwo years prior to dateof death..
Power of appointment orgeneralpower ofdeed,madei n contemplationofdeath
Returns filed from Jan. 16 to Dec. 31, 1922.]
Size of net estate subject to tax.
Total.
12,203
Amount.
$702,528,030
30,555,832117,226,240
72,886,514207,206,795
427,875,381
968,434,511
1,396,309,892
402,878,451
228,356,430
76,600,584
19,657,423
Percent.
24.40
1.064.07
2.537.20
14.86
33.63
48. 49
13.99
7.94
2.66
.68
No net estate.
2,649
Amount.
$84,427,511
516,1225,596,525
1,777,7610,313,659
14, 204,067
32,671,453
46,875,520
33,094,336
19,488,526
4, 522,134
433,675
Percent.
39.45
.242.62
.832.95
6.64
15.27
21.91
15.47
9.11
2.11
.20
Under $50,000.
5,080
Amount.
$169,187, 281
720,69818,572,894
4,224,82121,531,561
45,049, 974
84,335,418
129,385,392
89,2S9, 294
28,436,645
13,079,998
954,070
Percent.
38.79
.174.25
.974.94
10.33
19. 34
29.67
20.47
6.52
3.00
.22
$50,000 to$150,000.
2,535
Amount.
1136,473,834
1,123,57119,874,457
5,377,31127,410,504
53,785,843
111,139,001
164,924,844
76,280,594
31,812,482
13,454,556
2,152,586
Percent.
31 58
.264.60
1.256.34
12.45
25.73
38.18
17.65
7.36
3.11
.50
$150,000 to$250,000.
727
Amount.
$57 470,919
623,3959,794,951
3,747,71715,632,061
29, 798,124
08,612,971
98,411,095
33,611,044
15,770,489
6,870,755
1, 594,630
Percent.
26.31
.294.48
1.717.15
13. 64
31.40
45.04
15.38
7.22
3.15
.73
$250,000 to$450,000.
550
Amount.
$56,443, 239
1,250,77011,706,977
6,857,35920, 338, 972
Percent.
22.11
.494.60
2.697.97
40,214,084| 15.75
91,510,356 35.84
131,724,440
38,581,866
18,265,025
4,982,969
2,482,423
51.59
15.11
7.15
1.95
.97
$450,000 to$750,000.
301
Amount.
$45,260,872
1,509,4099,651,541
4,977,65117,(380,408
33,825,009
88, 219,962
122,044,971
30,930,415
17,061,837
4,184,322
1,967,635
Percent.
20.29
.684.33
2.237.93
15.17
39. 55
54.72
13.87
7.65
1.88
.88
$750,000 to$1,000,000.
110
Amount.
$25,608,391
850,9155, 200,388
2,812,0057,287,885
10,181,853
50,220,486
66,402,339
12,989,572
6,226,351
5,356,891
578,309
Percent.
21.81
.724.43
2.426.21
13. 78
42.77
56. 55
11.07
5.30
4.56
.49
w.
Io
QO
to
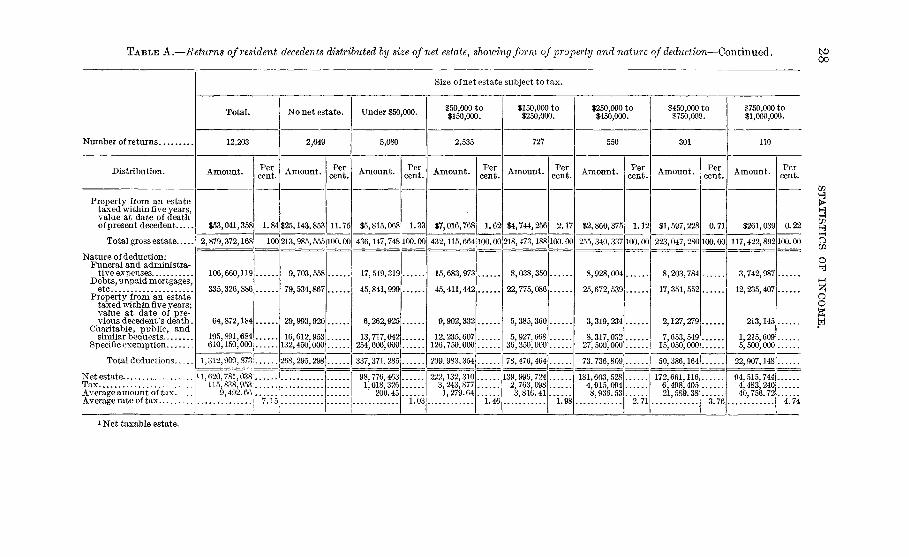
TABLE A.—Returns of resident decedents distributed by size of net estate, showing form of property and nature of deduction—Continued.00
Number of returns
Distribution.
Property from an estatetaxed within five years,value at date of deathof present decedent
Total gross estate
Nature of deduction:Funeral and administra-
tive expensesDebts, unpaid mortgages,
etcProperty from an estate
taxed within five years;value at date of pre-vious decedent s death.
Charitable, public, andsimilar bequests
Specific exemption
Total deductions..
Net estateTaxAverage amount of taxAverage rate of tax
Size of net estate subject to tax.
Total.
12,203
Amount.
$53,041,358
2,879,372,168
106,660,119
335,326,886
64,872,184
195,891,684
Percent.
1.84
100
610,150,000i
1,312,900,873
U, 620,781,038115,838,953
9,492.667.15
No net estate.
2,649
Amount.
$25,143,853
213,985,555
9,703,558
79,534,867
29,993,920
16 612 953132,450,000
Percent.
11.75
100.00
268,295,2981
Under $50,000.
5,080
Amount.
$5,815,068
Percent.
1.33
436,147,748 100.00
17,549,319
45,841,999
6,262,925
13,717,042254,000,000
337,371,285
98,776,4631,018,326
200.451.03
$50,000 to$150,000.
2,535
Amount.
$7,016,768
Percent.
1.62
432,115,6641100.00
15,683,973
45,411,442
9,902,332
12,235,607126,750,000
209,983,3,54
222,132,3103,243,8771,279.64
1.46
$150,000 to$250,000.
727
Amount.
$4,744,256
Percent.
2.17
218,473,188 100.00
8,038,350
22,775,086
5,385,360
5,927,66836,350,000
78,476,464
139,996,7242,763,0983,816.41
1.98
$250,000 to$450,000.
550
Amount.
$2,860,375
255,340,337
8,928,004
25,672 539
3,319,234
8,317,03227,500,000
73,736,809
181,603,5284,915,0948,936.53
Percent.
1.12
100.00
2.7l
$450,000 to$750,000.
301
Amount.
$1,597,228
223,047,280
8,203,784
17,351,552
2,127,279
7,653,54915,050,000
50,386,164
172,661,1166,498,40521,589.38
Percent.
0.71
100.00
3.76
$750,000 to$1,000,000.
110
Amount.
$261,039
117,422,892
3,742,987
12,235,407
213,145
1,215,6095,500,000
22 907 148
94,515,7444,483,24040 758.72
Percent.
0.22
100.00
4.74
oUl
oo
1 Net taxable estate.

•
to Number of returnsCO
Distribution.
1 Form of property:Real estate
W Investments in bonds and stocks—Federal Government bonds—
Wholly tax-exemptPartially tax-exempt
State and municipal bonds, wholly tax-exempt..All other bonds
Total bondsCapital stock of corporations
Total bonds and stocks
Mortgages, notes, cash, insurance, etcJomtly'owned and other miscellaneous property...Transfers made within two years prior to date of
death .Power of appointment or general power of deed,
Property from an estate taxed within five years,value at date of death of present decedent
Total gross estate
Nature of deduction:Funeral and administrative expenses
Property from an estate taxed within five years;value at date of previous decedent's death
Charitable public and similar bequestsSpecific exemption T
Total deductions »
Net" estate . . . . . . . . . . . .TaxAverage amount of taxAverage rate of tax
Size of net estate subject to tax.
$1,000,000 to$1,500,000.
I l l
Amount.
$27,196,057
1,510,0516,606,2865,564,692
14,572,527
28,253,55675,828,314
104,081,870
15,974,26614,437,916
5,407,034
700,686
2,328,050
170,125,879
6,927,64613,829,568
4,435,4926,892,0795,550,000
37,634,785
132,491,0948,046,81672,493.84
Percent.
15.99
.893.883.278.57
16.6144.57
61.18
9.398.48
3.18
.41
1.37
100.00
"6.07
$1,500,000 to$2,000,000.
45
Amount.
$15,179,191
1 807 5624,649,2963,214,5196; 479,314
16 150 69138,736,687
54,887,378
6 251 1279,165,471
4,648,635
443,585
120,509
90,695,896
2,540,9645,359,791
120,5092,972,4002,250,000
13,243,664
77,452,2325,802,204
128,937. 86
Percent.
16.74
1.995.123.557.15
17.8142.73
60.54
6.8910.10
5.12
.48
.13
100.00
7.49
$2,000,000 to$3,000,000.
41
Amount.
$16,519,366
2 818 0125,193,668
10,067,27113,603,967
31 682 91852,689,773
84,372,691
13 407 83711,516,524
2,218,456
1,287,933
3,135,045
132,547,852
5,092,02819,498,240
3,092,7212 241,6882,050,000
31,974,677
100,573,1759,210,046
224,635.26
Percent.
12.46
2 133.927.59
10.26
23 9039.75
63.65
10.198.69
1.67
.97
2.37
100.00
- - - - - - - -
9.16
$3,000,000 to$4,000,000.
17
Amount.
$6,894,730
1 661,7952,140,9684,102,8556,025,081
13 930 69934,318,533
48,249,232
4,032 1786,464,571
73,285
65,713,996
2,258,8773,452,619
3,660,760850,000
10,222,256
55,491,7405,836,778
343,339.88
Percent.
10.49
2.533.266.249.17
21.2052.23
73.43
6.149. S3
.11
100.00
10.52
$4,000,000 to$5,000,000.
10
Amount.
$7,361,293
2,473,4434,556,053
991,4242,257,967
10,278,88730,652,652
40,931,539
2,270,4401,702,362
1,401,120
19,167
53,685,921
1,596,6947,051,492
19,267499,500500,000
9,666,953
44,018,9685,334,530
533,453.00
Percent.
13.71
4.608.491.854.21
19.1557.11
76.26
4.223.17
2.61
.03
100.00
'"ii'io
$5,000,000 to$6,000,000.
7
Amount.
$2,478,791
2,274,5311,422,350
37,4231,563,349
5,297 65321,528,605
26,826,258
7,372,8097,942,271
843,970
25,441
45,489,540
1 600 2793,966,901
2,475,828350,000
8,393,008
37,096,5324,990,808
712,972.57
Percent.
5.44
5.003.13
.083.44
11.6547.34
58.99
16.2117.46
1.85
.05
100.00
13.45
oU2
oo
toCO
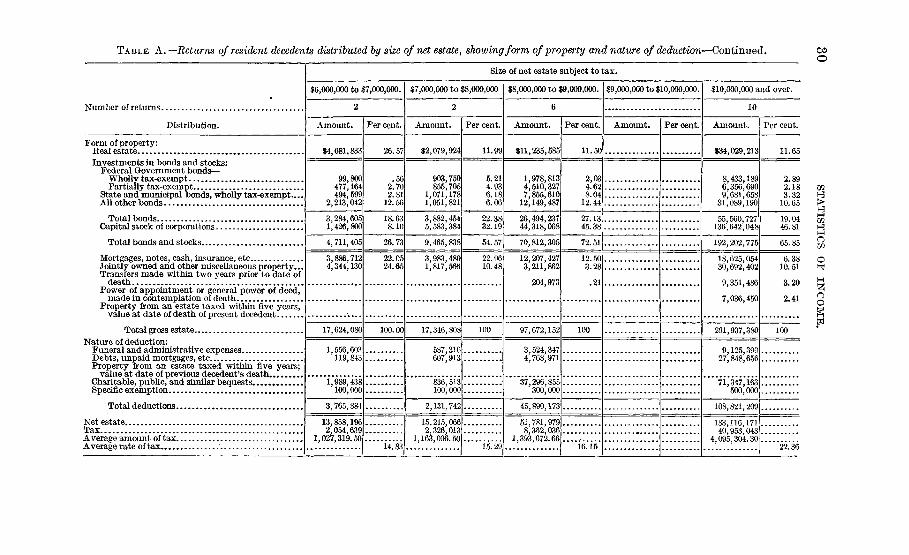
TABLE A.—Returns of resident decedents distributed by size
Number of returns
Distribution.
Form of property:Real estate.Investments in bonds and stocks:
Federal Government bonds—Wholly tax-exemptPartially tax-exempt.. . . .
State and municipal bonds, wholly tax-exempt....All other bonds . . . . .
Total bondsCapital stock of corporations
Total bonds and stocks
Mortgages, notes, cash, insurance, etcJointly owned and other miscellaneous property...Transfers made within two years prior to date of
deathPower of appointment or general power of deed,
made in contemplation of deathProperty from an estate taxed within five years,
value at date of death of present decedent.
Total gross estateNature of deduction:
Funeral and administrative expensesDebts, unpaid mortgages, etc.Property from an estate taxed within five years;
Charitable, public, and similar bequestsSpecific exemption
Total deductions
Net estateTax . . . .Average amount of taxAverage rate of tax
of net estate, showing form of property and nature of deduction—Continued.
Size of net estate subject to tax.
$6,000,000 to $7,000,000.
2
Amount.
$4,681,833
99,800477,164494,599
2,213,042
3,284,6051,426,800
4,711,405
3,886,7124,344,130
17,624,080
1,556,603119,843
1,989,438100,000
3,765,884
13,858,1962.054,639
1,027,319.50
Per cent.
26.57
.562.702.81
12.56
18.638.10
26.73
22.0524.65
100.00
14.83
$7,000,000 to $8,000,000
2
Amount.
$2,079,924
903,750855,705
1,071,1781,051,821
3,882,4545,583,384
9,465,838
3,983,4801,817,566
17,346,808
587,316607,913
836,513100,000
2,131,742
15,215,0662,326,013
1,163,006.50
Per cent.
11.99
5.214.936.186.06
22.3832.19
54.57
22.9610.48
100
15.29
$8,000,000 to $9,000,000.
6
Amount.
$11,235,585
1,978,8134,510,3277,855,610
12,149,487
26,494,23744,318,068
70,812,305
12,207,4273,211,862
204,973
97,672,152
3,524,3474,768,971
37,296,855300,000
45,890,173
51,781,9798,362,036
1,393,672.66
Per cent.
11.50
2,034.628.04
12.44
27.1345.38
72.51
12.503.28
.21
100
16.15
$9,000,000 to $10,000,000.
Amount. Per cent.
$10,000,000 and over.
10
Amount.
$34,029,213
8,433,1896,356,6909,681,658
31,089,190
55,560,727136,642,048
192,202,775
18,625,05430,692,402
9,351,486
7,036,450
291,937,380
9,125,39027,848,656
71,347,163500,000
108,821,209
183,116,17140,953,043
4,095 304.30
Per cent.
11.65
2.892.183.32
10.65
19.0446.81
65.85
6.3810.51
3.20
2.41
100
22.36
o
M
HMoUl
QO

No net estateUnder $50,000$50,000 to $150,000$150,000 to $250,000$250,000 to $450,000$450,000 to $750,000$750,000 to $1,000,000$1,000,000 to $1,500,000..$1,500,000 to $2,000,000..$2,000,000 to $3,000,000. .$3,000,000 to $4,000,000..$4,000,000 to $5,000,000. .$5,000,000 to $6,000,000..$6,000,000 to $7,000,000. .$7,000,000 to $8,000,000..$8,000,000 to $9,000,000..$9,000,000 to $10,000,000.$10,000,000 and over
Total.
T A B L E B.—Returns of nonresident decedents, distributed by size of net estate.
[Returns filed from Jan. 16 to Dec. 31, 1922.]
Size of net estate.Num-ber of
returns.
801,095
701716963241
1,303
Grossestate.
$117,1636,720,8256, 465,2693,358,9875,474,1585,173,6995,493,1294,239,4875,327,641
11,978,4953,688,118
58,036,971
Deduc-tions.
$158,689649,401615,978351,722267,857369,590315, 748370,632
1,793,808751,631367,322
6,012,378
Netestate.
$6,071,4245,849,2913,007,2655,206,3014,804,1095,177,3813,868, 8553,533,83311,226,8643,320,796
152,066,119
Tax.
$66,82789,15171,461140,761186,666243,189241,386307,560
1,237,760352,827
2,937,588
Averagetax.
$61.021,273.594,203.598,797. 56
20,740.6740,531. 5080,462. 00
153,780.00309,440.00352,827.00
2,254.48
Aver-age
rate.
P.ct.
1.101.522.382.703.894.706.248.70
11.0210.62
5.64
QCG
3oo
1 Net taxable estate.
CO
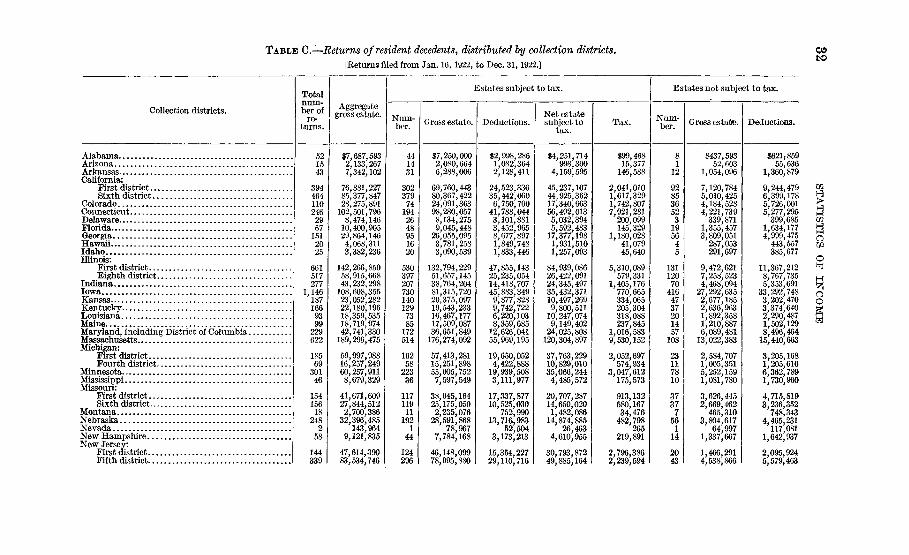
TABLE C—Returns of resident decedents, distributed by collection districts.
[Returns filed from Jan. 16, 1922, to Dec. 31, 1922.]
COto
Collection districts.
Totalnum-ber of
re-turns.
gross estate.
Estates subject to tax.
Num-ber. Gross estate. Deductions.
Net estatesubject to
tax.Tax.
Estates not subject to tax.
Num-ber. Gross estate. Deductions.
AlabamaArizonaArkansasCalifornia:
First districtSixth district
ColoradoConnecticutDelawareFloridaGeorgiaHawaiiIdahoIllinois:
First districtEighth district
IndianaIowaKansasKentuckyLouisianaMaineMaryland, including District of Columbia.MassachusettsMichigan:
First districtFourth district
MinnesotaMississippiMissouri:
First districtSixth district
MontanaNebraskaNevadaNew HampshireNew Jersey:
First districtFifth district
521543
39446411024629671512025
661517277
1,1461871669399
229622
18569
30146
15415618
248258
144339
$7,687,5932,133,2677,342,102
76,881,22785,377,84728,275,891102,501,7968,474,14610,400,90529,864,1464,068,3113,382,236
142,266,85058,915,66843,232,298108,608,35523,052,28222,180,19618,359,53518,719,97442,741,330189,296,475
59,997,98816,257,24960,257,9118,679,329
41,671,60927,844,5122,700,386
32,396,485143,964
9,121,835
47,614,39083,534,746
441431
302379741942648951620
5303972077301401297385172514
16258
22336
11711911
1921
44124296
$7,250,0002,080,6646,288,006
69,760,44380,367,42224,091,36398,280,0578,134,2759,045,448
26,055,0953,781,2583,090,539
132,794,22951,657,14538,764,20481,315,72020,375,09719,543,23316,467,17717,509,08736,651,849
176,274,092
57,413,28115,251,89855,005,7527,597,549
38,045,16425,175,0502,235,07628,591,868
78,9677,784,168
46,148,09978,995,880
$2,998,2861,082,3642,128,411
24,523,33635,442,0606,750,700
41,788,0443,101,8813,452,9658,677,8971,849,7481,833,446
47,855,14325,235,05414,418,70745,883,3499,877,8289,742,7226,220,1038,359,68512,626,04155,969,195
19,650,0524,422,88819,939,5083,111,977
17,337,87710,525,030
752,99013,716,983
52,5043,173,213
15,354,22729,110,716
$4,251,714998,300
4,159,595
45,237,10744,925,36217,340,66356,492,0135,032,3945,592,483
17,377,1981,931,5101,257,093
84,939,08626,422,09124,345,49735,432,37110,497,2699,800,51110,247,0749,149,40224,025,808120,304,897
37,763,22910,829,01035,066,2444,485,572
20,707,28714,650,0201,482,08614,874,885
26,4634,610,955
30,793,87249,885,164
$99,46815,377146,588
2,041,0101,617,3291,742,8077,921,281200,099145,329
1,180,02841,07945,640
5,310,089579,331
1,405,176770,665334,065205,304318,088237,845
1,016,5839,530,152
2,052,697574,934
3,047,612175,573
913,132580,16734,476482,798
265219,891
2,796,3862,239,594
$437,59352,603
1,054,096
928536523195645
131120704164737201457108
23117810
3737756114
7,120,7845,010,4254,184,5284,221,739339,871
1,355,4573,809,051
287,053291,697
9,472,6217,258,5234,468,09427,292,6352,677,1852,636,9631,892,3581,210,8876,089,48113,022,383
2,584,7071,005,3515,252,1591,081,780
3,626,4452,669,462465,310
3,804,61764,997
1,337,667
1,466,2914,538,866
$621,-85955,636
1,360,879
9,244,4796,399,1785,726,0015,277,295399,685
1,634,1774 999,475443,557385,677
11,367,2128,767,7355,353,691
33,292,7483,202,4703,374,6402,290,4871,502,1298,496,46415,440,663
3,205,1681,205,6166,362,7891,730,960
4,715,8193,236,352748,343
4,465,231117,081
1,642,937
2,095,9245,579,463
Q
3oo

New MexicoNew York:
First districtSecond districtFourteenth districtTwenty-first districtTwenty-eighth district
North CarolinaNorth DakotaOhio:
First districtTenth districtEleventh districtEighteenth district
OklahomaOregonPennsylvania:
First districtTwelfth districtTwenty-third district
Rhode IslandSouth CarolinaSouth DakotaTennesseeTexas:
First districtSecond district
UtahVermontVirginiaWashington, including AlaskaWest VirginiaWisconsinWyoming
Total
37267032714017510148
1399575
2135751
5711103531189811778
155121264311218111318622
207,902
128,612,546353,904,39487,833,06823,551,38932,441,29124,894,9596,787,893
31,985,56812,731,90617,479,76346,208,06710,803,0146,260,960
150,889,62519,972,886
225,191,15564,878,42913,681,63911,066,60413,794,661
27,058,29819,899,3766,302,301
12,278,73521,567,56531,895,18214,578,02935,928,6612,703,468
12,203 2,879,372,168
3195822691141518436
12167631594036
4857529595677454
1219417361061487814914
9,554
159,812
123,918,683345,196,29982,248,01721,566,15530,487,93223,070,1766,061,284
29.333,68411,124,18016,500,37542,489,8737,533,3024,329,342
142,579,25817,110,440
217,288,32463,855,26011,702,6478,246,99712,412,041
23,603,08517,580,8745,370,37411,457,42021,026,8f)329,948,19612,376,12733,285,3901,625,048
2,665,386,613
121,304
33,592,594146,000,24929,397,0779,874,70812,658,75611,893,0422,251,517
11,346,2714,951,1625,610,72913,820,4863,236,0162,557,660
52,614,8606,910,26597,084,40413,151,1825,436,6504,520,7434,945,555
9,045,0937,347,2522,968,4585,210,6608,138,64713,104,9276,337,15512,649,746
863,477
1,044,605,575
38,508
90,326,089199,196,05052,850,94011,691,44717,829,17611,177,1343,809,767
17,987,4136,173,01810,889,64628,669,3874,297,2861,771,682
89,964,39810,200,175120,203,92050,704,0786,265,9973,726,2547,466,486
14,557,99210,233,6222,401,9166,246,76012,888,21616,843,2696,038,97220,635,644
761,571
1,620,781,038 |
13,15,2,
1,
4,
15,6,
115,
385
060,133853,440993,567311,010595,636683,389129,137
741,326193,904537,740418,068122,59326,085
988,113413,253165,991796,084181,970107,457221,281
516,994351,308150,350220,609371,295580,444148,122921,49716,914
838,953
1
53885826241712
182812541715
86356813314324
34279763335378
2,649
48,090
4,693,8638,708,0955,585,0511,985,2341,953,3591,824,783726,609
2,651,8841,607,726979,388
3,718,1943,269,7121,931,618
8,310,3672,862,4467,902,8311,023,1691,978,9922,819,6071,382,620
3,455,2132,318,502931,927821,315540,702
1,946,9862,201,9022,643,2711,078,420
213,985,555
51,800
5,396,34410,864,6116,920,7152,469,7382,376,1512,300,7401,028,033
3,155,6951,856,8781,163,0514,429,5444,077,9852,406,040
11,754,3,562,9,468,1,294,2,583,3,306,1,855,
4,239,2,813,1,280,1,568,679,
2,623,2,727,3,983,1,314,
384863494848461698162
586067083079520842840417
15
3ao
268,295,298
CO05

TABLE D.—Returns of nonresident decedents, distributed by collection districts.
[Returns filed from Jan. 16,1922, to Dec. 31,1922.]
CO
Collection district.
Alabama..ArizonaArkansasCalifornia:
First districtSixth district.. . . ..
ColoradoConnecticut..DelawareFloridaGeorgiaHawaiiTdahoIllinois:
First districtEighth district
IndianaIowaKansasKentucky . .LouisianaMaineMaryland including District of ColumbiaMassachusettsMichigan:
First districtFourth district
MinnesotaMississippiMissouri:
First districtSixth district
MontanaNebraskaNevadaNew HampshireNew Jersey:
First district
Totalnum-ber of
returns.
1
391113
2
4
121
2
261
77933
8
2
1
1
Aggregategross estate.
$64,495
2,035,713281,687185,43012,720
866,019
470,968
1,356,6945,040
9,204
1,028,568639,244205,135
8,985,6161,216,074
302,192
126,374
1,585
66,290
Estate subject to tax.
Num-ber.
1
371112
2
3
111
2
261
72032
7
2
1
1
Gross estate.
$64,495
2,020,120281,687185,43012,720
866,019
445,575
1,356,6945,040
9,204
1,028,568639,244205,135
8,934,2601,216,074
298,825
126,374
1,585
66,290
Deductions.
$1,907
53,06347,46218,543
137
716
100,254
899
151,122174,059
6,818507,086301,964
135,627
3,572
747
Net estatesubject to tax.
$62,588
1,967,057234,225166,88712,583
866,019
444,859
1,256,4405,040
8,305
877,446465,185198,317
8,427,174914,110
163,198
122,802
1,585
65,543
Tax.
$752
47,1522,7143,007
126
40,424
10,928
28,80450
105
40,2996,3753,950
168,20824,595
2,067
1,952
16
1,622
Estates not subject to tax.
Num-ber.
2
1
1
1
591
1
Gross estate.
$15,593
25,393
51,356
3,367
Deductions.
$15,593
26,269
92,006
3,367
3oo

Fifth district.New MexicoNew York:
First district.Second districtFourteenth district .. . .Twenty-first districtTwenty-eighth district
North Carolina..North DakotaOhio:
First districtTenth district. . .Eleventh districtEighthteenth district . .
OklahomaOregon . .Pennsylvania:
First districtTwelfth districtTwentv-third district
Rhode IslandSouth CarolinaSouth DakotaTennesseeTexas:
First districtSecond district
UtahVermontVirginiaWashington including AlaskaWest VirginiaW i s c o n s i nW y o m i n g . . . .
T o t a l
61
4315
318
3
11
412
14
3
1
3411
13
31
1,303
531,06954,810
86,64728,033,673
640,48431,01321,173
58,859
77,400169
486,9164,1427,811
519,438
3,071,496
55,100
127,7023,289,603
8801,750
143,534
2,930,0374,217
58,036,971
61
4304
317
3
11
412
13
3
1
3411
12
31
1,223
531,06954,810
86,64728,012,803
640,48431,01320,589
58,859
77,400169
486,9164,1427,811
519,438
3,071,496
55,100
127,7023,289,603
8801,750
143,534
2,930,0374,217
57,919,808
12, 5495,654
7,0823,680,833
64,0191,524
536
5,500
5,69119
5,318110
27,811
4,623
2,878
1,162437,440
87952
9,888
76,H5
5,853,689
518, 52049,156
79,56524,331, 970
576,46529,48920,053
53,359
71,709150
481, 5984,0327,811
491,627
3,066,873
52,222
126,5402,852,163
11,698
133,646
2, 853, 8924,217
52,066,119
11,843492
9611,496,140
21,042295312
534
9343
11,5304085
10,504
438,042
544
1,584277,770
117
1,671
280,05642
2,937,588
11
1
1
1
80
20,870
584
117,163
20,870
584
158,689
Ul
1QC/2
I I
ao
DO

36 STATISTICS OF INCOME.
TABLE E.—Simple and cumulative distribution by size of net estate—Resident and non-resident decedents.
[Returns filed from Jan. 16,1922, to Dec. 31,1922.]
Size of net estate.
Returns.
Simpledistribution.
Numberin eachclass.
Per centof total.
Cumulativedistribution.
Numberunderhigherclass.
Per centunderhigherclass.
Net estate.
Simpledistribution.
Amount ineach class.
Per centof total.
No net estateUnder $50,000$50,000 to $150,000$150,000 to $250,000$250,000 to $450,000$450,000 to $750,000$750,000 to $1,000,000....$1,000,000 to $ 1,500,000..$1,500,000 to $2,000,000..$2,000,000 to $3,000,000..$3,000,000 to $4,000,000..$4,000,000 to $5,000,000..$5,000,000 to $6,000,000..$6,000,000 to $7,000,000..$7,000,000 to $8,000,000..$8,000,000 to $9,000,000..$9,000,000 to $10,000,000.$10,000,000 and over
2,7296,1752,605
74456631011611447451810722
20.2045.7219.285.514.192.30
.39
.33
.13
.07
.05
.01
.01
.04
2,7298,90411,50912,25312,81913,12913,24513,35913,40613,45113,46913,47913,48613,48813,49013,496
20.2065.9285.2090.7194.9097.2098.0698.9099.2999.6299.7599.8299.8799.88
99.93
$104,847,887227,981,601143,003,989186,809, 829177,465,22599,693,125136,359,94980,986,065111,800,03958,812,53644,018,96837,096,53213,858,19615,215,06651,781,979
6.2613.628.55
11.1710.615.968.154.846.683.522.632.22.83
* .913.10
10 .07 13,506 100.00 183,116,171 10.95
Total. 13,506 100.00 1,672,847,157 100.00
Size of net estate.
Net estate.
Cumulativedistribution.
Amount underhigher class.
Per centunderhigherclass.
Tax.
SimpleDistribution.
Amount ineach class.
Per centof total.
Cumulativedistribution.
Amountunderhigherclass.
Per centunderhigherclass.
No net estateUnder $50,000$50,000 to $150,000$150,000 to $250,000$250,000 to $450,000 ,$450,000 to $750,000$750,000to $1,000,000....$1,000,000 to $1,500,000..$1,500,000 to $2,000,000..$2,0005OOOto $3,000,000..$3,000,000to $4,000,000..$4,000,000to $5,000,000..$5,000,000to $6,000,000..$6,000,000to $7,000,000..$7,000,000 to $8,000,000..$8,000,000 to $9,000,000..$9,000,000 to $10,000,000.,$10,000,000 and over
$104,332,475,662,840,939,
1,076,1,157,1,268,1,327,1,371,1,408,1,422,1,437,1,489,
847,887829,488833,477643,306108,531801,656161,605147,670947,709760,245779,213875,745733,941949,007730,986
6.2619.8828.4339.6050.2156.1764.3269.1675.8479.3681.9984.2185.0485.9589.05
$1,085,1533,333,0282,834,5595,055,8556,685,0714,726,4298,288,2026,109,76410,447,8066,189, 6055,334,5304,990,8082,054, 6392,326,0138,362,036
0.912.812.394.265.633.986.985.148.805.214.494.201.731.967.04
$1,085,1534,418,1817,252,74012,308,59518,993,66623,720,09532,008,29738,118,06148,565,86754,755,47260,090,00265,080,81067,135,44969,461,46277,823,498
0.913.726.1110.3716.0019.9826.9632.1040.9046.1150.6054.8056.5358.4965.53
1,672,847,157 100.00 40,953,043 34.47 118,776,541 100.00
Total.. 118,776,541 100.00
On the pages immediately following are continued the basic tablesof income distribution in the United States and in each State andTerritory.
Respectfully,D. H. BLAIR,
Commissioner of Internal Revenue.Approve d:
A. W. MELLON,Secretary of the Treasury,
BASIC TABLES
37

PERSONAL RETURNS.
TABLE 1.—Personal returns—Distribution of income, by States,for the United States; showing for each State the number of returns, net income, tax, andrelative percentages.
[Income returned for the calendar year ended Dec. 31,1921.]
COOO
States and Terri-tories.
AlabamaAlaska2
ArizonaArkansasCaliforniaColoradoConnecticutDelawareDistrict of Colum-
biaFloridaGeorgiaHawaiiIdahoIllinoisIndianaIowaKansasKentuckyLouisianaMaineMarylandMassachusettsMichiganMinnesotaMississippiMissouriMontanaNebraskaNevadaNew Hampshire-.New JerseyNew Mexico
Returns.
Number.
43,009
18,47733,830
386,08269,676
123,26915,889
89,96642,24967,71911,48122,976
611,558150,300111,48388,78569,496G7,96044,397
112,963388,442250,147124,50125,614
172,51936,90771,8539,719
32,410269,09611,780
Percent oftotal.
0.65
.28
.515.791.051.85.24
1.34.63
1.02.17.34
9.182.261.671.331.061.02.67
1.705.833.751.86.38
2.59.55
1.08.15.49
4.04.18
Net income.
Amount.
$117,108,806
48,310,19792,616,903
1,168,021,448174,490,980343,017,18043,676,893
248,345,804119,557,316180,311,46637,840,01449,737,718
1,833,920,436406,242,138313,762,935217,237,297192,273,937197,897,146124,628,679368,691,062
1,153,008,156657,779,854340,833,69960,104,438
499,911,00481,527,662
179,905,51322,455,50882,352,496
856,856,05827,838,165
Percent oftotal.
0.60
.25
.475.97.89
1.75.22
1.27.61.92.19.25
9 372.081.601.11.98
1.01.64
1.885.893.361.74.31
2.55.42.92.11.42
4.38.14
Exemptions from normal tax.
Personalexemption.
$100,811,000
45,146,70080,913,600
796,672,500154,698,100251,231,60034,484,100
171,359,58695,525,600
161,262,80027,320,40053,142,400
1,216,774,500335,667,800248,627,800204,981,700154,538,100149,021,40096,521,100
229,573,014807,231,100518,710,700265,446,70058,961,700
367,946,30081,318,600
165,469,80019,998,40067,934,300
577,752,20027,078,400
Dividends.
$6,816,588
1,804,5555,264,313
120,484,03915,60S, 88970,201,11014,407,813
19,987,23112,146,85912,710,5527,82S, 3551,592,728
194,930,75429,957,68220,552,03010,963,55320,937,79517,019,11515,844,74641,644,587
210,303,44985,215,00439,961,9644,298,282
57,688,7283,595,212
11,633,9331,236,217
11,372,338106,428,445
1,590,969
Interest onGovern-
ment obli-gations.1
$163,451
41,034131,251
2,224,046265,757740,003163,112
517,554357,865157,60776,07719,744
3,219,683615,845349,722251,731558,874421,911192,671765,530
2,579,0751,110,974
480,789133,939
1,114,85337,526
172,49521,689
176,9681,834,229
17,302
Exemptionsfrom normal
tax inexcess of
net income.
$19,349,011
7,944,05317,680,029
131,318,98535,792,77557,210,35113,217,717
10,946,86221,464,80335,750,1236,493,411
14,065,447161,601,89261,717,42837,464,66050,031,03632,487,05330,902,02218,836,45948,291,995
181,247,575113,809,67644,990,92117,435,86564,109,97219,504,05842,165,8924,128,516
15,443,65497,661,1486,510,112
Net incomesubject to
normal tax.
$28,666,778
9,261,96123,987,768
379,959,84839,711,00978,054,8187,839,585
67,428,29532,991,79541,930,6309,108,5939,048,293
580,597,391101,718,23981,69S, 04351,071,34948,726,22162,336,74230,906,621
144,999,926314,142,107166,552,85279,935,16714,146,382
137,271,09516,080,38244,795,1775,327,718
18,312,544268,502,332
5,661,606
Normaltax.
$1,492,075
419,8391,246,107
20,158,2142,067,9244,434,130
487,603
4,161,6411,749,2792,207,956
496,078406,714
31,505,3705,141,8793,949,5802,472,7212,499,0223,203,8641,632,0107,008,838
18,011,8019,027,9984,269,610
697,1657,333,702
720, 8012,210,492
231,915948, 809
14,822,502255,637
Surtax.
$1,221,751
96,798620,057
16,280,2181,794,9386,198,915
796,762
3,542,9231,180,1301,684,689
955,69886,944
37,068,9813,831,7741,888,380
919,7081,798,4482,100,6582,342,8517,528,465
28,522,84315,169,8424,427,507
371,9717,326,649
33i;0621,117,653
97,381810,481
18,435,79295,992
Total tax.
Amount.
$2,713,826
516,6371,866,164
36,438,4323,862,862
10,633,0451,284,365
7,704,5642,929,4093,892,6451,451,776
493,65868,574,3518,973,6535,837.9603,392,4294,297,4705,304,5223,974,861
14,537,30346,534,64424,197,8408,697,1171,069,136
14,660,3511,051,8633,328,145
329,2961,759,290
33,258,294351.629
Percent oftotal.
0.38
.07
.265.0G.54
1.48.18
1.08.41.54.20.07
9.531.25.81.47.GO.74.55
2.036.473.361.21.15
2.04.15.46.05.24
4.62OK
o
oo

New YorkNorth Carolina...North DakotaOhioOklahomaOregonPennsylvaniaRhode IslandSouth Carolina...South DakotaTennesseeTexasUtahVermontVirginiaWashingtonWest VirginiaWisconsinWyoming
Total
1,066,63744.16118,440
367,09669,38162,804
621,10348,05725,16021,68160,949
200,18826,12817,74676 257
115,68875,277
148,45722,413
6,662,176
16.01.66.28
5.511.04
.949.32
.72
.38
.33
.913.00
.39
.271.141.741.132.23
.34
100.00
3,617,757,104127,992,95143,032,753
1,060,027,926191,816,067159,574,639
1,937,291,858157,568,41168,255,82547,087,498
170,969,895536,897,42762,713,46147,561,557
208,331,701262,109,642207,157,054379,754,22251,051,629
19,577,212,528
18.48.65.22
5.41.98.82
9.91.80.35.24.87
2.74.32.24
1.071.341.061.94.26
100.00
2,284,478,200103,595,40042,200,100
805,657,500166,914,000134,240,000
1,206,543,80098,537,30059,724,20049.245,000
138,734,800448,068,60060,979,80037,439,000
170,899,900223,140,800178,181,400308,100,50049,053,400
14,191,855,700
633,025,34318,205,2481,837,299
141,562,0498,985,5339,208,287
273.063,73041' 557,0956,545,0192,420,462
15,704,18133,482,9064,319,1276,880,777
21,994,79720,581,80524,618,43437,134,7091,797,763
2,476,952,399
14,199,713486,97127,212
2,364,112290,339264,595
6,543,116494,94676,12533,896
290,868857,52035,47394,326
454,907486,063467,695570,927'42,295
46,994,406
467,094,18124,004,752
9̂ 779,738146,708,26834,732,50327,780,461
164,738,09526,945,36113,404,17913,958,04929,486,643
101,258,05215,130,5177,851,669
33,922', 12753,615,59942,998,32869,219,21711,536,279
2,713,737,519
1,153,148,02929,710,0848,747,880
257,152,53350,358,69843,642,218
555,879,30743,924, 43115,314,6609,346,189
45,726,689155,746,45312,509,57810,999,12348,904,22471,516,57346,887,853
103,167,30311,694,450
5,575,147,542
71,519,8271,560,529
392,08514,138,7752,661,6322,240,815
31,238,2042,591,109
770,698422,552
2,398,5707,835,450
605,402558,470
2,508,2503,299,0942,394, 7565,104,470
547,452
308,059,422
139,248,5522,199,970
93,69819,435,3191,544,8752,710,765
53,422,0166,645,219
475,825102,101
1,585,4814,832, 438
237,502597, 297
1,652,8661,610,7632,184,3573,866,574
235, 805
411,327,684
210,76K,3/U3,760,499
485,78333,574,0944,206,5074.951,580
84,660,2209,236,3281,246,523
524,6533,984,051
12,667,894842, 904
1,155, 7674,161,1164,909,8574,579,1138,971,044
783,257
719,387,106
.52
.074.67
.58
.6811.761.28
.17
.07
.551.76
.12
.16
.58
.68
.641.25
.11
100.00
1 Interest on Government obligations not wholly exempt from tax.2 Alaska included in Washington.
wHI—Iom
ao
CoCD
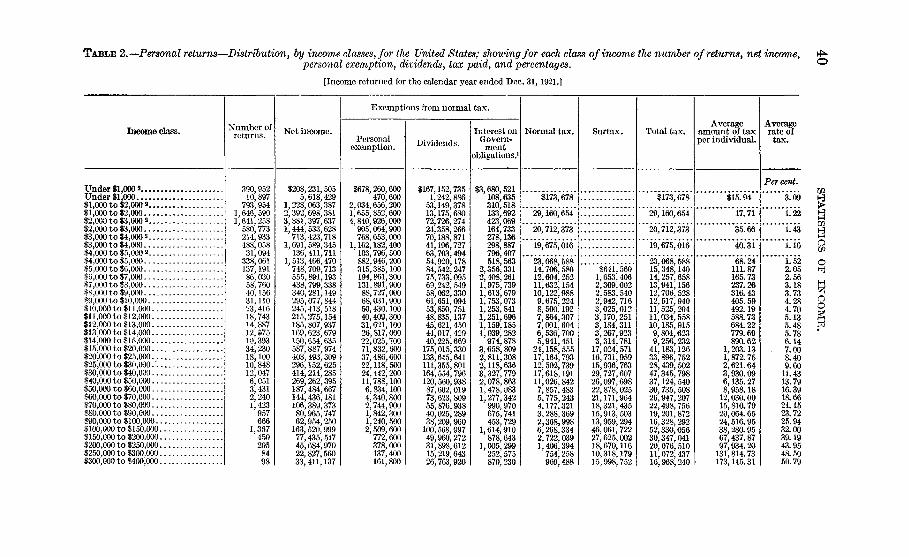
TABLE 2.—Personal returns—Distribution, by income classes, for the United States; shoiving for each class of income the number of returns, net income,personal exemption, dividends, tax paid, and percentages.
[Income returned for the calendar year ended Dec. 31,1921.]
Income class. Number ofreturns.
Net income.
Exemptions from normal tax.
Personalexemption. Dividends.
Interest onGovern-ment
obligations.1
Normal tax. Surtax. Total tax.Average
amount of taxper individual.
Averagerate oftax.
Under $1,000 2Under $1,000$1,000 to $2,000 2 . . .$1,000 to $2,000$2,000 to $3,000 2 . . .$2,000 to $3,000... .$3,000 to $4,000 2 . . .$3,000 to $4,000... .$4,000 to $5,0002...$4,000 to $5,000....$5,000 to $6,000$6,000 to $7,000... .$7,000 to $3,000$8,000 to $9,000$9,000 to $10,000...$10,000 to $11,000..$11,000 to $12,000..$12,000 to $13,000..$13',000 to $14,000..$14,000 to $15)000..$15,000 to $20.000..$20,000 to $25,000..$25,000 to $30,000.'.$30,000 to $40,000..$40,000 to $50,000..$50,000 to $60,000..$60,000to $70,000..$70,000 to $80,000..$80,000 to $90,000..$90,000 to $100,000.$100;000 to $150,000$150,000 to $200,000$200,000 to $250,000$250,000 to $300,000$300,000 to $400,000
390,95210,897
793,954646, 590641, 258580,773214,933488,05831,094
338,061137,19186,03058,76040,15631,110'23,41618,74314,88712, §7510,39334,23018,10010,84812,0476,0513,4312,2401,423
957666
1,367450205
$208,231,5055,618,429
1,228,063,3872,392,698,3813,881,397,6371,444,533,628
713,423,7181,691,589,345
136,411,7111,513,466,470
748,709,713555,891,193438,799,338340,281,149295,077,844245,413,518215,275,154185,807,937169,623,679150,654,635587,887,974403,493,309296,152,625414,214,285269,262,395187,484,667144,436,181106,389,37380,965,74762,954,250
163,520,99977,435,51745,684,97022,827,56033,411,137
$678,260,600470,600
2,034,656,2001,655,852,6004,840,926,000
905,064,900768,653,000
1,162,182,400103,796,500882,946,200315,385,100194,861,300131,891,90088,727,00068,031,90050,430,10040,409,30031,621,10026,817,00022,025,70071,832,60037,486,60022,118,50024,442,20011,788,1006,834,1004,340,8002,744,9001,842,3001,240,5002,509,600
772,600378,000137,400161,800
$167,152,7351,242,886
53,149,37813,175,68072,726,27424,358,26670,188,87141,196,72763,703,49454,920,17884,542,24775,733,09569,242, 54958,062,33061,651,09453,850,75148,835,13745,621,45044,017,42940,225,669
175,015,330133,645,641111,355,801164,554,796120,560,93887,602,01973,623,80955,876,93840,025,28938,209,960
100,568,99749,960,27231,898,61215,219,64326,763,920
$3,680,521108,635310,518133,692423,069164,733278,136298,887796,407518,563
2,356,3312,408,2611,975,7391,613,6791,753,0731,253,8411,251,6961,159,1851,039,282
974,8783,658,8092,811,3082,118,6363,327,7792,078,8631,478,0831,277,342
990,970675,741453,729
1,614,910878,643
1,005,299252,575870,230
$173,678
29,160,654
*20,"7i2*373'
19,675,016
23,068,58814,706,58012,604,25211,632,15410,122,9889,675,2248,500,1927,864,3077,001,6046,536,7005,941,451
24,158,55517,164,79312,502,73917,618,19111,026,8427,857, 4835,775,2434,177,3213,288,3692,368,9986,268,3342,722,0391,406,394
754,258
$173,078
"29,"i60,*654"
20,712,373
19,675,016
$641,5601,653,4062,309,0022,583,5402,942,7163,025,0123,170,2513,184,3113,267,9233,314,781
17,024,57116,731,95915,936,76329,727,60726,097,69822,878,02521,171,96418,321,43515,913,50313,959,29446,061,72227,625,00218,670,11610,318,17915,998,752
23,068,58815,348,14014,257,65813,941,15612,706,52812,617,94011,525,20411,034,55810,185,9159,804,6239,256,232
41,183,12633,896,75228,439, 50247,345,79837,124,54030,735,50826,947,20722,498,75619,201,87216,328,29252,330,05630,347,04120,076,51011,072,43716,968,240
Per cent.
$15.94
17.71
35.66
"4O."3i'
68.24111. 87165.73237.26316.43405.59492.19588.73684.22779.69890.62
1,203.131,872.752,621.643,930.096,135.278,958.18
12,030.0015,810.7920,064.6524,516.9538,280.9567,437.8797,934.20
131,814.73173,145.31
3.09
"i.*22
1.43
1.16
1.522.052.563.183.734.284.705.135.485.786.147.008.409.60
11.4313.7916.3918.6621.1523.7225.9432.0039.1943.9548.5050.79
M
o
jao
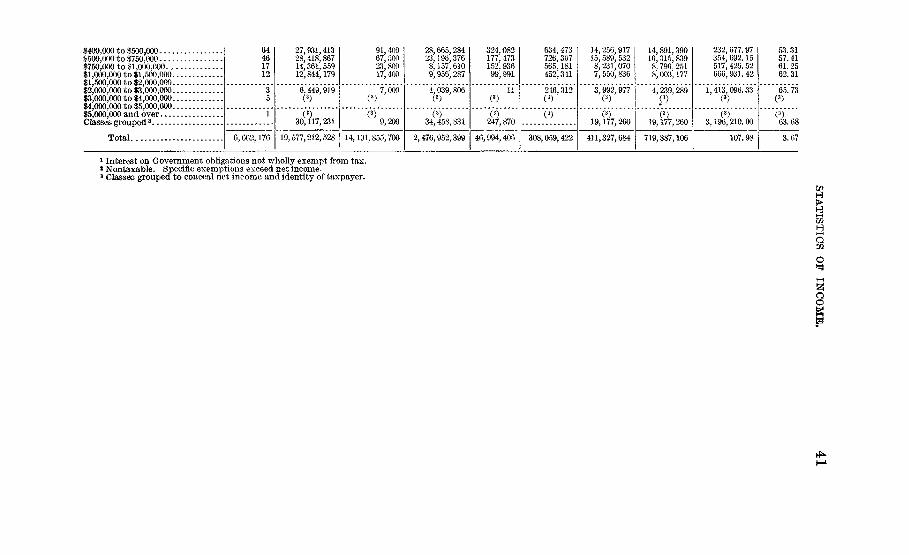
$400,000 t o §500,000&500,000 t o $750,000$750,000 t o $1,000,000$1,000,000 t o $1,500,000$1 500 000 t o $2 000 000$2,000,000 t o $3,000,000$3,000,000 t o $4,000,000$4,000 000 t o $5,000,000$5,000,000 a n d overClasses crouDPd.'
Total
64461712
35
1
6,662,176
27,931,41328,418,86714,361,55912,844,179
6,449,919(8)
(3)30,117,231
19,577,212,528
91,40067,50023,80017,400
7,000(3)
(3)9,200
14,191,855,700
28,665,28423,196,3768,157,6109,956,287
4,039,806(3)
(3)34,458,831
2,476,952,399
324,082177,473152,93699,991
Ii(3)(3)
247, 870
46,994,406
634,473726,307565,181452,341
246,312( * ) •
( 8 )
308,059,422
14,256,91715,589, 5328,231,0707, 550,836
3,992,977(3)
(3)19,177,260
411,327,684
14, 891,39016,315.8398, 796' 2518,003', 177
4,239,289(3)
(3)19,177,260
719,387,106
232,677.97354, 692.15517,426. 52666,931.42
1,413,096.33(3)
(3)3,196,210.00
107.98
53.3157.4161.2562.31
65.73(3)
(3)63.68
3.67
1 Interest on Government obligations not wholly exempt from tax.* Nontaxable. Specific exemptions exceed net income.3 Classes grouped to conceal net income and identity of taxpayer.
>HI—iin
Q
o
joo

TABLE 3.—Personal returns—Simple and cumulative distribution by income classes.[Income returned for the calendar year ended Dec. 31,1921.] to
Income class.
Returns.
Simple distribution.Number ineach class.
Per centof total.
Cumulative distribution. Cumulative percentages.Over the
class belowUnder theclass above.
Over theclass below
Under theclass above.
Net income.
Simple distribution.Amount in each
class.Under $1,000$1,000 to $2,000$2,000 to $3,000$3,000 to $4,000$4,000 to $5,000$5,000 to $6,000$6,000 to $7,000$7,000 to $8,000$8,000 to $9,000$9,000 to $10,000$10,000 to $11,000$11,000 to $12,000$12,000 to $13,000$13,000 to $14,000$14,000 to $15,000$15,000 to $20,000$20,000 to $25,000$25,000 to $30,000$30,000 to $i0,000$40,000 to $50,000$50,000 to $60,000$60,000 to $70,000$70,000 to $80,000$80,000 to $90,000$90,000 to $100,000$100,000 to $150,000$150,000 to $200,000$200,000 to $250,000$250,000 to $300,000$300,000 to $400,000$400,000 to $500,000$500,000 to $750,000$750,000 to $1,000,000-...$1,000,000 to $1,500,000..$1,500,000 to $2,000,000..$2,000,000 to $3,000,000..$3,000,000 to $4,000,000..$4,000,000 to $5,000,000..$5,000,000 and overClasses grouped1
Total
401,8492,440,5442,222,031
702,991369,155137,19186,03058,76040,15631,11023,41618,74314,88712,57510,39334,23018,10010,84812,0476,0513,4312,2401,423
957666
1,367450205
6.0336.6333.3610.555.542.061.29.88.60.47.35.28.22.19.16.52.27.16.18.092.053.034.0213.0143.0100.0204.0068.0031.0013.0015.0010.0007.0003.00018
6,662,1766,260,3273,819,7831,597,752
894, 761525,606388,415302,385243,625203,469172,359148,943130,200115,313102,73892,34558,11540,01529,16717,12011,0697,6385,3983,9753,0182,352
985535330246148843821
401, 8492,842, 3935,084,4245,767,4156,136, 5706, 273,7616,359,7916,418, 5516, 458, 7076, 489,8176, 513,2336,531,9766,546,8636,559,4386,569,8316,604,0616,622,1616,633,0096,645, 0566,651,1076,654, 5386,656,7786,658,2016,659,1586,659,8246,661,1916,661,6416, 661,8466,661,9306,662,0286,662, 0926,662,1386,662,1556,662,167
100.0093.9757.3423.9813.437.895.834.543.663.062.592.241.961.741.551.39.87.60.44.26.168.115.081.0597.0454.0354.0150.0082.0051.0038.0023.0013.0006.00030
6.0342.6676.02 .86.5792.1194.1795.4696.3496.9497.4197.7698.0498.2698.4598.6199.1399.4099.5699.7499.83299.88599.91999,940399.954699.964699.985099.991899.994999.996299.997799.998799.999499.999799.99988
$213,849,9343,620,761, 7685,325,931,2652,405,013,0631,649,878,181
748,709,713555,891,193438,799,338340,281,149295,077,844245,413,518215,275,154185,807,937169,623,679150,654,635587,887,974403,493, 309296,152,625414,214,285269,262, 395187,484,667144,436,181106,389,37380,965, 74762,954,250
163,520, 99977,435,51745,684,97022,827, 56033,411,13727,931,41328,418,86714,361,55912,844,179
C1).00004 6,662,170 .00012 99.99992 6,449,919
C1)
C1).00008 6,662,176 .00008 100.00
C1)30,117,231
6,662,176 100.00 19,577,212,528.15
100.001 Classes grouped to conceal net income and identity of taxpayer.
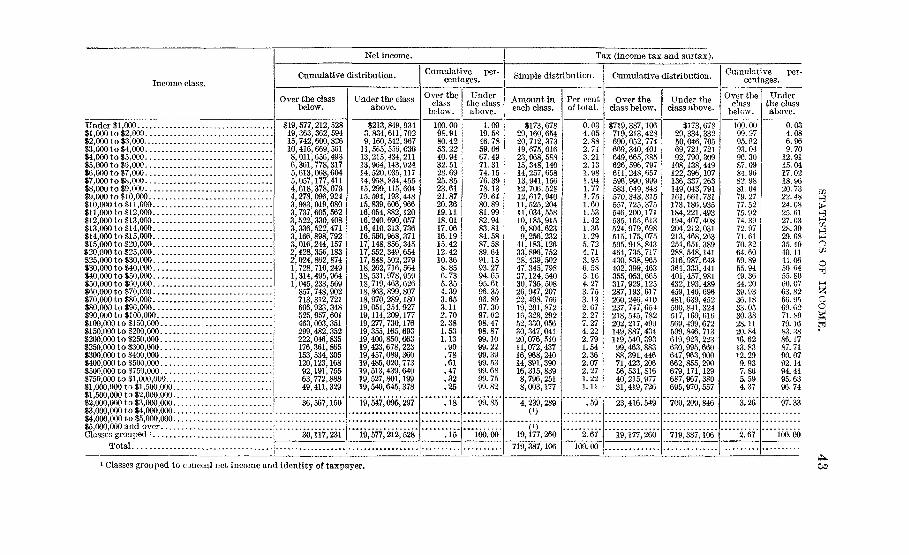
Income class.
Net income.
Cumulative distribution.
Over the classbelow.
Under the classabove.
Cumulative per-
Over theclass
below.
Underthe classabove.
Tax (income tax and surtax).
Simple distribution. Cumulative distribution.
Amount ineach class.
Per centof total.
Over theclass below.
Under theclass above.
Cumulativecents per-
Over theclass
below.
Underthe classabove.
Under $1,000$1,000 to $2,000$2,000 to $3,000$3,000 to $4,000$4,000 to $5,000$5,000 to $5,000$6,000 to $7,000$7,000 to $8,000$8,000 to $9,000$9,000 to $10,000$10,000 to $11,000$11,000 to $12,000$12,000 to $13,000$13,000 to $14,000$14,000 to $15,000$15,000 to $20,000$20,000 to $25,000$25,000 to $30,000$30,000 to 140,000$40,000 to $50,000$50,000 to $60,000$60,000 to $70,000$70,000 to $80,000$80,000 to $90,000$90,000 to $100,000$100,000 to $150,000$150,000 t o $200,000....$200,000 t o $250,000$250,000 t o $300,000....$300,000 to $400,000....$400,000 t o $500,000$500,000 to $750,000....$750,000 to $1,000,000...$1,000,000 to $1,500,000.$1,500,000 to $2,000,000.$2,000,000 to $3,000,000.$3,000,000 to $4,000,000.$4,000,000 to $5,000,000.$5,000,000 and overClasses grouped l
Total
$19,577,19,363'15,742:10416^8, Oil,6,361,5,613,5,057,4,618,4,278,3,983,3,737,3,522,3,336,3,166,3,016,2,428,2,024,1,728,1,314,1,045,
857,713,606,525,463,299,222,176,153,120,92,63,49,
212,528, 362,594600,826669,561656,498778,317068,604177,411378,073096,924019,080605,562330,408522,471
244,157356,183862,874710,249495,964233,569748,902312,721923,348957,601003.351482.352046,835361,865534,305123,168191,755772,888411,329
$213,849,9343,834,611,7029,160,542; 96711,565,556,03013,215,434,21113,964,143,92414,520,035,11714,958,834,45515,299,115,60415,594,193,44815,839,606,96616,054,882,12016,240,690,05716,410,313,73616,560,968,37117,148,856,34517,552,349,65417,848,502,27918,262,716,56418, 531,978,95918,719, 463,62618,863, 899,80718,970,289,18019,051,254, 92719,114,209,17719,277,730,17619,355,165,69319,400,850,66319,423,678,22319,457,089,36019,485,020,77319,513,439,64019,527,801,19919,540,645,378
100.0098.9180.4253.2240.9432.5128.6925.8523.6121.8720.3619.1118.0117.0616.1915.4212.4210.368.856.735.354.393.653.112.702.381.531.13.90.78.61.47.32.25
1.0919.5846.7859.0667.4971.3174.1576.3978.1379.6480.8981.9982.9483.8184.5887.5889.6491.1593.2794.6595.6196.3596.8997.3097.6298.4798.8799.1099.2299.3999.5399.6899.7599.82
$173,67829,160,65420,712,37319,675,01623,068,58815,348,14014,257,65813,941,15612,706, 52812,617,94011,525,20411,034,55810,185,9159,804,6239,256,23241,183,12633,896,75228,439,50247,345,79837,124,54030,735, 50826,947,20722,498, 75619, 201,87216,328,29252, 330,05630,347,04120,076,51011,072,43716,968, 24014,891,39016,315,8398,796,2518,003,177
0.034.052.882.743.212.131.981.941.771.751.601.531.421.361.295.724.713.956.585.164.273.753.132.672.277.274.222.791.542.362.072.271.221.11
$719,387,106719,213,428690,052,774669,340, 401649,665,385626,596, 797611,248,657596,990,999583,049,843570,343, 315557,725,375546,200,171535,165,613524,979,698515,175,075505,918,843464,735, 717430,838,965402,399,463355,053,665317,929,125287,193,617260,246,410237,747,654218,545, 782202,217,490149,887,434119,540,39399,463, 88388,391,44671,423,20656,531, 81640,215,97731,419,726
$173,67829,334,33250,046,70569,721, 72192,790, 309108,138,449122,396,107136,337,263149,043,791161,661,731173,186,935184,221,493194,407,408204,212,031213,468,263254,651,389288, 548,141316,987,643364,333,441401,457,981432,193,489459,140, 696481,639, 452500, 841,324517,169,616569,499,672599,846,713619,923,223630,995,660647,963,900662,855,290679,171,129687,967,380695,970,557
36,567,150 19,547,095,297 .18 99.85 4,239,289(')
.59 23,416,549 700,209,846
30,117,231 19,577,212,528 .15 100.00 19,177,260 2.67 19,177,: 719,387,106719,387,106 100.00
100.0099.9795.9293. 0490.3087.0984.9682.9881.0479.2777.5275.9274.3972.9771.6170.3264.6059.8955.9449.3644.2039.9336.1833.0530.3828.1120.8416.6213.8312.299.937.865.594.37
3.26
2.67
0.034.086.969.7012.9115.0417.0218.9620.7322.4824.0825.6127.0328.3929.6835.4040.1144.0650.6455. 8060.0763.8266. 9569.6271.8979.1683.3886.1787.7190.0792.1494.4195.6396.74
97.33
100. 00
U2
o
c6
1 Classes grouped to conceal net income and identity of taxpayer. 00

TABLE 4.—Personal returns—Sex and family relationship-distribution by States, for the United States.
[Income returned for the calendar year ended December 31,1921.]
States and t erritories.
Joint returns of husbandsand wives, with or with-out dependent children,including husbands whosewives, though living withthem, filed separate re-returns.
Number ofreturns. Amount.
Men—Heads of families.
Number ofreturns. Amount.
Women—Heads offamilies.
Number ofreturns. Amount.
All other—Men.
Number ofreturns. Amount.
AlabamaAlaska iArizonaArkansasCaliforniaColoradoConnecticutDelawareDistrict of Columbia.FloridaGeorgiaHawaiiIdahoIllinoisIndianaIowaKansasKentuckyLouisianaMaineMarylandMassachusettsMichiganMinnesotaMississippiMissouriMontanaNebraskaNevadaNew HampshireNew JerseyNew MexicoNew York
24,102 $79,801,456 2,772 $6,582,621 $1,814,473 12,158 $22,382,957
M
a
o
QO
11,77420,404194,29538,78554,6438,36339,16823,98239,4176,24412,730
324,80684,88860,67453,18436,91031,29923,52553,448187,552122,41862,10414,66991,09319,25943,9004,55516,293147,7206,274
562,042
32,005,17664,765,097726,731,477117,370,236198,963,14228,351,468144,442,18680,923,003124,777,73223,863,72330,548,218
1,190,696,081278,731,099209,844,267152,949,440126,023,77687,294,53381,457,835223,619,025705,012,572424,527,512221,593,20640,200,304325,192,15451,547,286127,530,93412,183,03651,368,648
573,893,56716,279,402
2,295,669,713
7392,350
21,1314,1758,973
9634,0892,3354,800
6731,357
26,2229,1178,3524,6684,6984,4812,6075,382
25,66912,9979,0031,38711,5402,0412,875517
1,75014,618
81261,173
1,882,8445,534,259
60,304,0989,447,58921,494,4142,374,09311,192,1595,816,66911,333,3691,671,3262,706,89977,755,24322,798,82619,839,00310,572,83312,038,30911,599,9985,866,16017,512,59065,658,25630,422,72321,504,8443,263,13229,689,6094,389,8687,682,0131,183,8113,931,30343,732,1011,741,797
193,501,922
107639
7,5051,5972,863401
2,347877
1,521191236
8,0692,0031,7221,2141,3751,676885
1,8195,7692,8022,529445
3,13840966679511
4,144146
25,151
269,0401,525,929
20,923,2943,415,5917,075,5651,044,4046,136,0632,399,9353,245,179715,035482,386
21,793,1014,167,3573,663,4202,621,5273,466,0823,912,6082,093,4525,728,25915,824,2017,068,4455,521,4791,020,5317,318,171766,514
1,432,609197,399
1,192,59813,669,069
350,99976,579,700
4,1938,308
124,25617,71937,8604,00724,00210,92816,0932,7846,909
199,46643,32230,37322,75518,78917,73112,73934,568110,45490,87141,1437,30250,56113,06417,7104,00210,32570,0313,421
284.753
8,100,43515,770,884
249,495,94329,772,83067,428,3227,270,11245,511,19321,285,15729,346,6406,478,17010,658,188
402,900,85078,714,05158,668,26238,465,91635,436,50036,480,24024,612,53380,027,407
218,570,397148,066,27869,757,88112,404,37296,228,86321,009,47131,041,6936,919,035
17,575,651141,048,948
5,861,871

North Carolina.North Dakota..OhioOklahoma ,Oregon ,Pennsylvania.,Rhode Island.,South CarolinaSouth Dakota.TennesseeTexasUtahVermontVirginiaWashington...West Virginia.WisconsinWyoming
Total...
1 Included in Washington.
25,64410,901197,96843,53933,313317,95721,31814,49712,51835,203110,00814,2528,62641,05243,58941,69273,44011,555
3 477 ̂
87,077,60130,138,558705,940,629137,631,063105,389,675
1,221,524,16690,354,26246,052,07232,221,107119,790,284288,666,84742,094,17129,544,224137,356,653111,440,418139,749,581243,985,31431,302,561
12,448,419,490
2,319504
23,5174,3053,24046,6814,1861,3564,9623,32210,4911,3591,1535,2989,7905,1388,6891,086
401,662
6,856,8341,238,037
60,870,52510,588,9477,540,934
124,105,7369,710,8243,959,5157,863,3019,450,55424,725,1222,977,7302,651,61613,474,64921,331,87111,337,29020,216,2092,612,189
1,066,536,564
560110
6,554676
1,0418,8151,368269158565
3,721278396
1,0593,938971
1,086129
115,356
1,479,688298,392
15,955,3311,795,3872,106,49328,175,5343,419,621845,054287,427
1,449,0889,503,756606,787779,322
2,828,0807,325,1622,025,4552,851,257294,751
309,461,003
5,629102,45616,63721,412188,09714,8086,9742,12415,68248,7518,5705,66822,16841,98423,34447,6128,706
1,915,009
9,371,189,962,32,052,35,770,384,074,32,661,12,893,3,869,27,934,94,319,13,561,9,917,40,985,68,594,43,638,78,362,15,100,
935838800006469879901998402595389125189254421115
3,788,543,065H
WH
o
oo
Cn
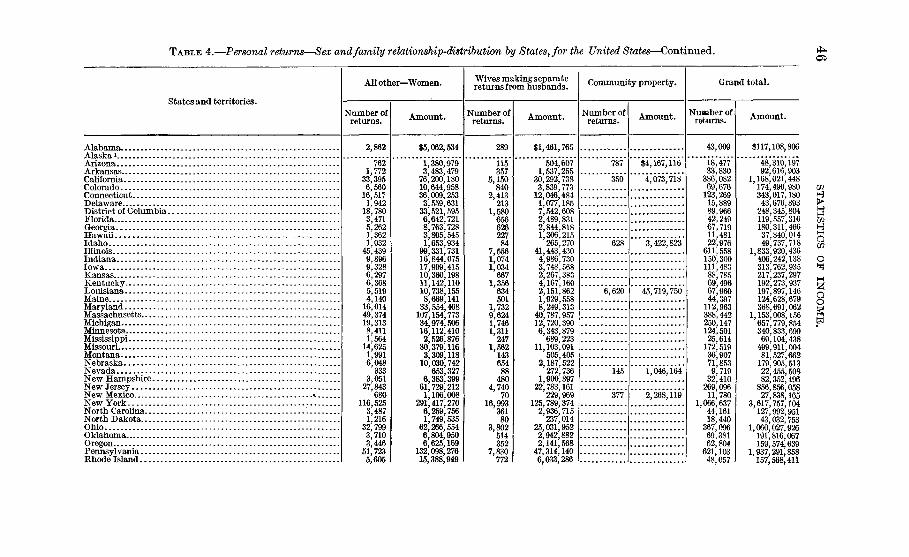
TABLE 4.—Personal returns—Sex and family relationship-distribution by States, for the United States—Continued.
States and territories.
All other—Women.
Number ofreturns. Amount.
Wives making separatereturns from husbands.
Number ofreturns. Amount.
Community property.
Number ofreturns. Amount.
Grand total.
Number ofreturns. Amount.
AlabamaAlaska*ArizonaArkansasCaliforniaColoradoConnecticutDelawareDistrict of Columbia.FloridaGeorgiaHawaiiIdahoIllinoisIndianaIowaKansasKentuckyLouisianaMaineMarylandMassachusettsMichiganMinnesotaMississippiMissouriMontanaNebraskaNevadaNew HampshireNew JerseyNew MexicoNew YorkNorth CarolinaNorth DakotaOhioOklahomaOregonPennsylvaniaEhode Island
2,862 $5,062,534 289 $1,461,765 43,009 $117,108,806
7621,772
33,3956,560
16,5171,942
18,7803,4715,2621,3621,032
45,4399,8969,3286,2976,3685,5194,14016,01449,37419,3138,4111,56414,6251,9916,048333
3,05127,843
680116,5253,4871,216
32,7993,7103,44651,7235,605
1,380,9793,483,47976,200,18010,644,95836,009,2533,559,63133,521,5956,642,7218,763,7283,805,5451,653,93499,331,73116,844,07517,999,41510,360,19811,142,11010,738,1558,669,14133,554,468107,154,77334,974,50616,112,4102,526,87630,379,1163,309,11810,030,742
653,3276,383,39961,729,2121,106,008
291,417,2706,259,7561,749,535
62,266,5546,804,9506,625,169
132,098,27615,388,949
115357
5,150840
2,413213
1,58065662622784
7,5561,0741,034667
1,356634501
1,7329,6241,7461,311247
1,56214365488
4804,740
7016,993
36180
3,802514352
7,830772
504,6071,537,25530,292,7383,839,77312,046,4841,077,1857,542,6082,489,8312,844,8181,306,215265,270
41,443,4304,986,7303,748,5682,267,3834,167,1602,151,8621,929,5588,249,31340,787,95712,720,3906,343,879689,223
11,103,091505,405
2,187,522272,736
1,900,89722,783,161
229,969125,789,3742,936,715237,014
25,031,9522,942,8822,141,568
47,314,1406,033,286
787 $4,167,116
350 4,073,718
628 3,422,823
6,620 45,719,750
145 1,046,164
377 2,268,119
18,47733,830386,08269,676123,26915,88989,96642,24967,71911,48122,976611,558150,300111,48388,78569,49667,96044,397112,963388,442250,147124,50125,614172,51936,90771,8539,71932,410269,09611,780
1,066,63744,16118,440
69,38162,804621,10348,057
48,310,19792,616,903
1,168,021,448174,490,980343,017,18043,676,893248,345,804119,557,316180,311,46637,840,01449,737,718
1,833,920,436406,242,138313,762,935217,237,297192,273,937197,897,146124,628,679368,691,062
1,153,008,156657,779,854340,833,69960,104,438499,911,00481,527,662179,905,51322,455,50882,352,496856,856,05827,838,165
3,617,757,104127,992,95143,032,753
1,060,027,926191,816,067159,574,639
1,937,291,858157,568,411
o
aog
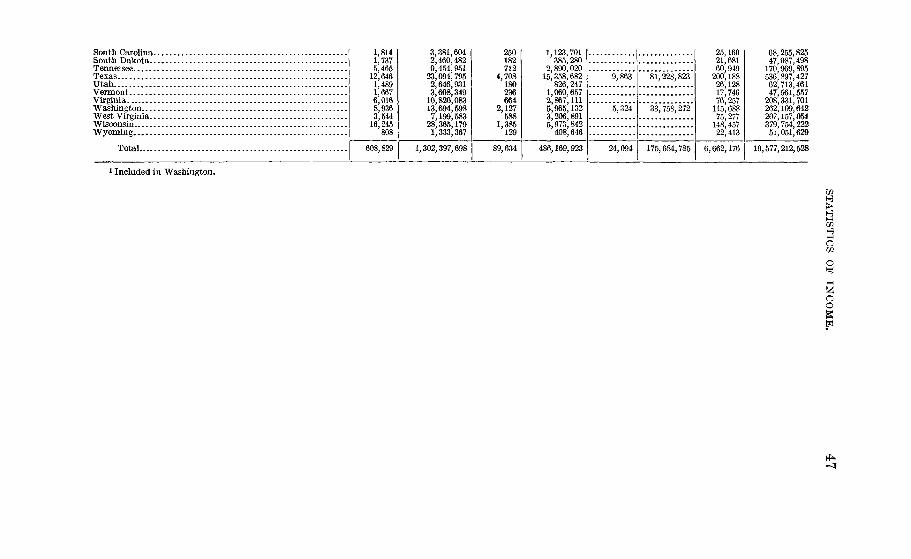
South CarolinaSouth Dakota.Tennessee ,TexasUtahVermontVirginiaWashington...West Virginia.WisconsinWyoming
Total....
1,8141,7375,465
12,6461,4891,6676,0168,9363,544
16,245
608,829
3,381,6042,460,4829,454,95123,094,7952,646,9313,608,34910,820,08313,694,5987,199,583
28,365,1791,333,367
250182712
4,708180236664
2,127588
1,385129
1,302,397,698 !9,634
1,123,385,
2,890,15,358,
826,1,060,2,867,5,965,3,206,5,973,
408,
486,169,923
5,324
81,228,823
33,758,272
24,094 175,684,785
25,16021,68160,949
200,18826,12817,74676,257
115,68875,277
148,45722,413
6,662,176
68,255,82547,087,498
170,969,895536,897,42762,713,46147,561,557
208,331,701262,109,642207,157,054379,754,22251,051,629
19,577,212,528
1 Included in Washington.
Hh—i
wQ
ao
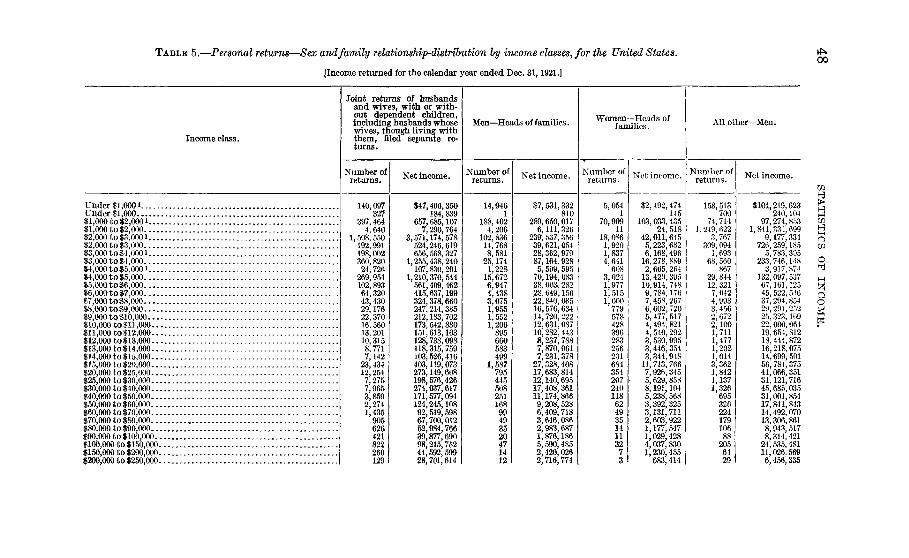
TABLE 5.—Personal returns—Sex and family relationship-distribution by income classes, for the United States.
[Income returned for the calendar year ended Dec. 31,1921.]00
Income class.
Joint returns of husbandsand wives, with or with-out dependent children,including husbands whosewives, though living withthem, filed separate re-turns.
Number ofreturns.
140,097327
397,4644,640
1,508,550192,991198,002360,82024,726
269,954102,89364,32043,43029,17622,37016.56013,20110,3158,7717,142
23,43412,2547,2757,9653,8592,2741,435
905626421822260129
Net income.
$47,406,350184, 839
657,685,1077,290,764
3,571,174, 578524,246,619656,568,327
1,255,438,240107, 830,291
1,210,370, 544561,409,462415,637,199324,378,660247,214,385212,183, 702173,542,880151,613,103128,738,098118,315,759103,526,416403,119,073273,149,608198,576,426274,037,617171,577,094124,245,10892,519,59867,700,01252,984,76639,877,69098,215,75244,592,59928,701,614
Men—Heads of families.
Number ofreturns.
14,9461
188,4024,206
102,83614,7688,581
25,1741,228
15,6726,9474,4383,0751,9551,5521,206
895660583499
1,587795445508251168
99493520471412
Net income.
$7,531,332810
289,650,0176,111,326
239", 537, 35639,621,05428,362,97987,164,9285,509,595
70,194, 08338,003,28228,649,15622,840,08516,576,63414,720,22212,631,08710,282,4438,237, 7887,870,0617,231,378
27,328, 40817,683,81412,140,69517,408,36111,174, 8669,208,5286,409, 7183,646, 0862,983,6871,876,1865,590,4852,420,0262,716,774
Women—Heads offamilies.
Number ofreturns.
5,0541
70,90911
18,0861,9201,8374,641
6083,0241,9771,5151,000
779578428396283256231684354207240118
624935141132
73
Net income.
$2,492,474145
103,033,43524, 518
42,011,6455,223,6826,168,496
16,278, 8892,665,264
13,420,39510,914, 7489,784,1767,458, 2676,602,7205,477,5174,494,8214, 540,2923,530,9953,446,3543,344,948
11,713,7667,926,345
• 5,629,8588,191,1045,238, 5683,392,3253,131,7112,603,9221,177, 5471,029,4284,037, 8301,230,455
683,414
All other—Men.
Number ofreturns.
158,513700
74, 7141,249,622
3,767309, 094
1,69368, 560
86729, 84412,3217,0424,9933,4562,6722,1001,7111,4771,2021,0143,3621,8421,1371,326
695326224179106
88205
6429
Net income-
Co
$101,219,623 S240,104 \2
97,274,853 CO1,841,331,699 £
9,177,334 Q726,259,185 w.
5, 783,305233,746,118 O
3,917,874 ^132,097,537 M67,161,125 t?45, 522, 516 A37,294,854 o29, 291, 252 fc*25,323,1C9 g22,000,064 F3
19,654,81218, 444,87216,218,07514,699,50156,784,37541,066,35131,121,71645,685,03531,001,85417,841,84314,492,07013,306,8618,943,5178,314,421
24,535, 48111,026,5696,456,335
Under $l,000».....Under $1,000$1,000 to $2,0001...$1,000 to $2,000....$2,000 to$3,0001...$2,000 to $3,000$3,000 to $4,0001...$3,000 to $4,000$4,000 to $5,0001...$4,000 to $5,000$5,000 to $6,000....$6,000 to $7,000....$7,000 to $8,000....$8,000 to $9,000....$9,000 to $10,000...$10,000 to$11,000..$11,000 to$12,000..$12,000 to$13,000..$13,000 to $14,000..$14,000 to $15,000..$15,000 to $20,000..$20,000 to $25,000..$25,000 to$30,000..$30,000 to $40,000..$40,000 to $50,000..$50,000 to $60,000..$60,000 to $70,000..$70,000 to $80,000..$80,000 to $90,000..$90,000 to $100,000.$100,000 to $150,000$150,000 to $200,000,$200,000 to $250,000
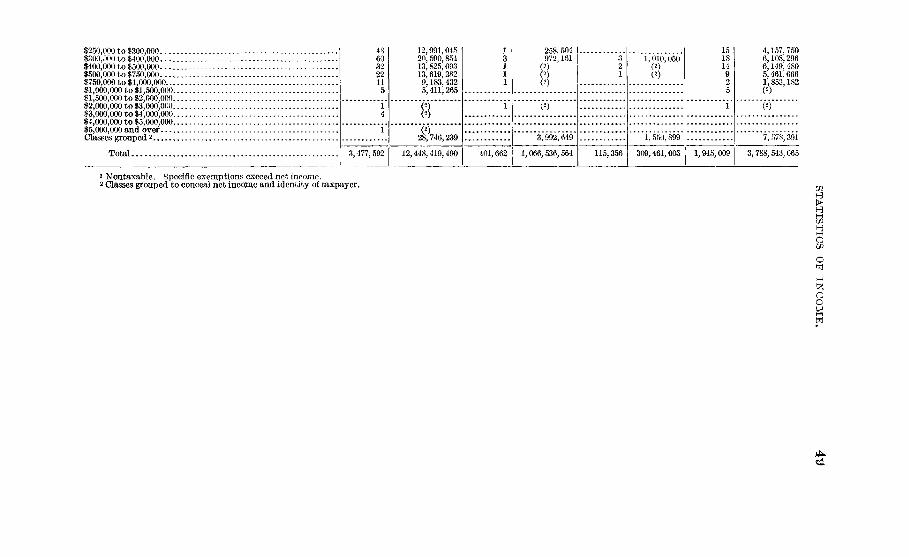
$250,000 to $300,000$300,000 to $400,000$400,000 to $500,000$500,000 to $750,000$750,000 to $1,000,000....$1,000,000 to $1,500,000..$1,500,000 to $2,000,000..$2,000,000 to $3,000,000..$3,000,000 to $4,000,000..$4,000,000 to $5,000,000..$5,000,000 and overClasses grouped2
Total. 3,477, 592
12,991,04520,590,85413,825,09313,619,2829,183,4325,411,265
18,746,239
12,448,4197 490 401,662
258,504972,161
3,992,649
1,066,536,564 115,356
1,010,050
8
1,550,899
309,461,003
4,157, 7506,108,2966,149, 4805,461,6661,853,182(2)
7, 578,391
1,945,009 3,738,543,065
1 Nontaxable. Specific exemptions exceed net income.2 Classes grouped to conceal net income and identity of taxpayer.
a
oo

TABLE 5.—Personal returns—Sex and family relationship-distribution by income classes, for the United States—Continued. OrO
Income class.All other—Women.
Number ofreturns. Net income.
Wives making separatereturns from husbands.
Number ofreturns. Net income.
Community propertyincome.
Number ofreturns. Net income.
Grand total.
Number ofreturns. Net income.
Under $l,000iUnder $1,000$1,000 to $2,000 i$1,000 to $2,000$2,000 to $3,000 i$2,000 to $3,000$3,000 to $4,000 i$3,000 to $4,000$4,000 to $5,000 i$4,000 to $5,000$5,000 to $6,000$6,000 to $7,000$7,000 to $8,000$8,000 to $9,000$9,000 to $10,000$10,000 to $11,000....$11,000 to $12,000....$12,000 to $13,000....$13,000 to $14,000....$14,000 to $i5,000....$15,000 to $20,000....$20,000 to $25,000....$25,000 to $30,000....$30,000 to $40,000....$40,000 to $50,000....$50,000 to $60,000....$60,000 to $70,000....$70,000 to $80,000....$80,000 to $90,000....$90,000 to $100,000...$100,000 to $150,000..$150,000 to $200,000..$200,000 to $250,000..$250,000 to $300,000..$300,000 to $400,000..$400,000 to $500,000..$500,000 to $750,000..$750,000 to $1,000,000.
61,961427
57,815373,979
5 16749,6173 165
16,4371 879
10,5615 6833,8202,6772,1111,7151,3951,149
902793682
2,2991,356
7989105392882111157565
1354918108
1232
$45,488,380173,090
73,784,073517,113,00812,545,974
117,766,32510 751,53256,050,6578,521,431
47,137,86830,986,06024,662,50020,056,14017,887,36816,269,47714,630,18613,190,97211,260,40410,702,1919,885,944
39,669,60730,197,55221,771,83231,286,57424,083,44915,688,54313,569,5448,651,8876,330,5096,116,348
16,199,5158,358,9794,017,6862,737,7292,599,4075,274,1881.876,257
10,0349,4364,573
13,9952,7919,6751,5587,5021,7055 7024 1682,8382,1591,6961 4871,105
926829715567
2,0581,132
7618494632611861138757
11149141063
101
$4,050,0175,017,2496 524 467
20,596,7306,793,440
24,014,4145,455,673
25,818,4297,600,959
25,473,84722,730,80218,349,63316,112,58314,364,62614,108,24711,593,55410,641,83910,339,5169,639,9148,216,894
35,462,20225,347,39620,735,68429,126,95520,545,21514,244,20712,013,6488,443,3987,362,0765,350,513
13,159,3558,517,7603,109,1472,682,5322,130,3691,366,0976,258,559
3475
7713761
2,70897
4,92481
3,3043,2022,0571,426
983736622465421255258806367225249126523627144
15
$43,3292,192
111,435230,336157,310
7,402,349333,406
17,092,054366,297
14,772,19617,504,23413,285,98310,658,7498,344,1646,995,5706,520,9265,351,6935,256,2643,431,3253,749,554
13,810,5438,122,2436,176,4148,478,6395,641,3492,864,1132,299 8922,037,2071,183,645
389,6641,782,5811,289,129
390,95210,897
793,9541,646,5901,641,258
580,773214,933488,05831,094
338,061137,19186,03058,76040,15631,11023,41618,74314,88712,57510,39334,23018,10010 84812,0476,0513,4312,2401,423
957666
1,3674502058498644617
$208,231,5055,618,429
l,228,0&3,3872,392,698,3813,881,397,6371,444,533,628
713,423,7181,691,589,345
136,411,7111,513,466,470
748,709,713555,891,193438,799,338340,281,149295,077,844245,413,518215,275,154185,807,937169,623,679150,654,635587,887,974403,493,309296,152,625414,214,285269,262,395187,484,667144,436,181106,389,37380,965,74762,954,250
163,520,99977,435,51745,684,97022,827,56033,411,13727,931,41328,418,86714,361,559
mHi—iQUl
QO

$1,000,000 to $1,500,000 ,$1,500,000 to $2,000,000$2 000 000 to $3 000,00013 000 000 to $4 000 000$4 000 000 to $5,000,000.$5 000 000 and overClasses grouped2
Total
1
608,829
(2)
5,104,512
1,302,397,698
2
89,634
(2)
2,871,977
486,169,923 24,094 175,684,785
12
351
6,662,176
12,844,179
836,567,150
19,577,212,528
1 Nontaxable. Specific exemptions exceed net income.2 Classes grouped to conceal net income and identity of taxpayer.
o
oo
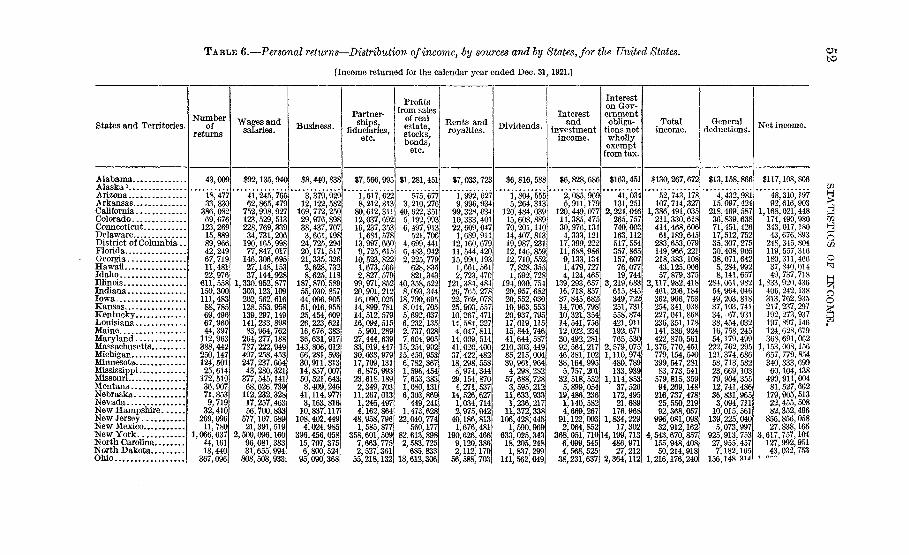
TABLE 6.—Personal returns—Distribution of income, by sources and by States, for the United States.
[Income returned for the calendar year ended Dec. 31,1921.]to
States and Territories.Number
ofreturns
Wages andsalaries. Business.
Partner-ships,
fiduciaries,etc.
Profitsfrom sales
of realestate,stocks,bonds,
etc.
Rents androyalties. Dividends.
Interestand
investmentincome.
Intereston Gov-ernmentobliga-
tions notwhollyexemptfrom tax.
Totalincome.
Generaldeductions. Net income.
AlabamaAlaska1
ArizonaArkansasCaliforniaColoradoConnecticutDelawareDistrict of Columbia..FloridaGeorgiaHawaiiIdahoIllinoisIndianaIowaKansasKentuckyLouisianaMaineMarylandMassachusettsMichiganMinnesotaMississippiMissouriMontanaNebraskaNevadaNew HampshireNew JerseyNew MexicoNew YorkNorth CarolinaNorth DakotaOhio
43,009 $92,135,94C $8,440,838 $7,566,995 $1,281,451 $7,033,723 $6,816,588 $6,828,686 $163,451 $130,267,672 $13,158,866 $117,108, $06
18,47733,830
386,08269,676
123,26915,88989,96642,24967, 71911,48122,976
611, 558150,300111, 48388,78569,49667,96044,397
112,963388,442250,147124,50125,614
172, 51936,90771,8539,719
32,410269,096
11, 780,066,637
44,16118,440
367,096
41,245,76562,865,479752,998,927123,529,513228,769,33934,731,206190,165,99877,847,017146,306,69527,148,15337,144,928
1,330,952,877303,123,109202,562,616128, 553,958139,297,149141,233, 89883,964,762
264,277,188787,222,949497,258,453247,237,66443,280,321
377, 545,14168,626,739112,232,32817,257,46356,700,833
577,107,58921,391,519
2,500,096,16096,081,38331,655,994
3,379,92912,122, 582
169,772,25029,976,89838,437,7073,661,19824,725,29420,171,51721,335,3262,628,7328,625,118
187,870,58955,030,85744,006,90551,016,95525,454,60926,223,62116,676,38336,631,917143,806,01266,281,59330,911,81314,857,00750,521,6438,409,246
41,114,9773,163,81610,837,117
108,402,4494,024,985
396,456,05815,707,3756,800,52495,090,368
1,617,6228,212,31380,612,31112,037,69216,237,3531,681,578
13,997,6609,725,61510,523,8221,673,5662,827, 57999,971,85220,901, 21216,090,02514,899, 78114,512,57916,094,5155,901,289
27,444,63983,019,44730,033,97917,709,1316,875,99323,618.1892,349,70311,267,0131,246,4974,162,864
48,958,7961,585,877
358,601,5097,663,7752,527,36155,218,132
575,67'3,210,27640,622,3515,192,9936,497,913521,706
4,699,4416,483,9422,225,779628,835821,343
40,358,5228,093,34418,790,6958,044,7055,692,0376,232,1352,737,0287,604,90515,254,90215,450,9536,782,3671,596,4547,653,3831,080,1316,303,869449,241
1,473,62822,040,774
560,17782,613,8982,583,725685,833
18,612,306
1,992,6279,996,934
99,328,03410,333,40122,609,047
1,689,91112,160,67911, 544,42015,990,193
1,661, 5612,723,470
121,384,48426, 765, 27822,769,07825,903, 55710,267,47114,584,2274,047,811
14,009, 51441,020,40037,422,48218,298,5586,974,344
29,154,8704,271,537
14,526,6271,034,7142,975,042
40,186,8131,676,481
190,628,4669,120,3862,112,17056,588,703
1,804,5555,264,313
120,484,03915,608, 88970,201,11014,407,81319,987,23112,146,85912, 710, 5527,828,3551,592,728
194,930,75429,957,68220,552,03010,963,55320,937,79517,019,11515,844,74641,644,587210,303,44985,215,00439,961,9644,298,28257,688,7283,595,21211,633,9331,236,21711,372,338106,428,4451,590,969
633,025,34318,205,2481, 837,299
141,562,049,
2,085,911,179
120,449,07714,385,47530,976,1344,333,12117,399,22211,688,9869,133,1341,479,7274,124,465
139,293,65716,718, 85737,845,68214,706,79810,321,35414,541,75612,022,23430,492,28192,564,21746,381,10238,164,9955,757,201
32, 518, 5525,899,05419,486,2361,140,5824,669,26791,122,0032,064,852
368,051,71014,6,099, 5454,568, 52538,231,637
41,034131,251
2,224,046265, 757740,003163,112517,554357,865157,60776,07719,744
3,219,683615,845349,722251, 731558,874421,911192,671765,530
2, 579,0751,110,974480,789133,939
1,114,85337,526172,49521,689176,968
1,834,22917, 302
L199,713486,97127,212
2,364,112
52,107,
1,386,211;414,6i;283;149,218,43,57,
2,117,461,362,254,227,236,141,422,
1,375,779,399,83,579,94;
216,25,92,
996,32,
4,543,155,50,
1,216,
743,178714,327491,035330,618468,606189,645653,079966,221383,108125,006879,375982,418206,184966,753341,038041,868351,178386,924870,561770,451154,540547,281773,541815,359269,148737,478550,219368,057081,098912,162670,857
214,918176,240
4,432,98115,097,424
218,469,58736,839,63871,451,42617,512,75235,307,27530,408,90538,071,6425,284,9928,141,657
284,061,98254,964,04649,203,81837,103,74134, 67,93138, 454, 03216,758,24554,179,499222,762, 295121,374,68658,713, 58223,669,10379,904,35512, 741,48636,831,9653,094,71110,015,561139,225,0405,073,997
925,913, 75327,955,4577,182,165
156,148.314
48,310,19792,616,903
1,168,021,448174,490,980343,017, ISO43,676, 893248,345, 804119,557,316180,311,46637,840,01449,737,718
1,833,920,436406,242,138313, 762,935217,237,297192,273,937197, 897,146124,628,679368,691,062
1,153,008,156' 657, 779, 854340,833,69960,104,438
499,911,00481,527,662179,905,51322,455,50882,352,496
856,856,05827,838,165
3,617,757,104127,992,95143,032,753
ain
3oo

OklahomaOregonPennsylvania. .Rhode Is land. .South Carolina.South Dakota. .TennesseeTexasUtahVermontVirginiaWashingtonWest Virginia..WisconsinWyoming
69,38162, 801621,10348,05725,16021,68160,949200,18826,12817,74676,257115,68875,277148, 45722, 413
138,112,
1,335,100,51,30,127,356,51.31;160,198,154.271;
40.
956, 805197,246700,667991,862308,866419,426728,845012,255257,028286,009993,371425,654357,274611,733864,138
27,562,26522,482,289200,486,84012,899,2968,031,65212,607,75321,176,21083,416,2036,558,8797,214,29919,961,92778,124,83222,007,77954,438,8436, 775,335
14,852,476]11,627,367;
139,317,7188,800,9844,088,1803,596,545
13,985,27748,310,872
2,531, 8963,199,173
11,159,59915,539,3818,982,197
15,321,7922,504, 587
8,684,8672,656,075
37,914,6282,426,0291,528,9022,072,4162,750,890
20,140,581580,838752,238
4, 534,4605,909,0378,214,653
10,046,6771,189,663
21,769,335!10, 593,45479,006, 8947,058,2624,832,6603,146,898
12,216,61170,641,9522,345,6321,267,475
13,612,93531,483,60711,951,26512,508,8932,736,996
8,985, 5339,208,287
273,063,73041,557,0956,545,0192,420,462
15,704,18133,482,906
4,319,1276,880,777
21,994,79720, 581, 80524,618,43437,134,709
1,797,763
Total 6,662,176 13, 813,169,165 2,366,318,610 1,341,186, 308 462, 858,673 1,177,957,882 2,476,952,399 1,643,344,489 46,994,406123, 328, 781,932 3, 751,569,404 19,577,212,528
11,406,51913,283,445
171,355,86115,019,7665,903,1454,896,5399,374,523
49,953,4473,416,5404,153,284
12,320, 55529,145,156
7,835,17440,138, 004
3,685,259
290,339264,595
6,543,116494,94676,12533,896
290, 868857, 52035, 47394,326
454,907486,063467,695570, 92742, 295
232,182,
2,243,18S,82,59,
203,662,
71,54.
245!379;238,441,59
508,139312,758389,454248,240314, 549193,935227,405815,736045,413847, 581032,551695,535434,471771, 578596,036
40,692,07222,738,119
306,097,59631,679,82914,058,72412,106,43732,257, 510
125,918,3098,331,9527,286,024
36,700,850117, 585,89331,277,41762,017,356
8,544,407
191,816,067159,574,639
1,937,291, 858157, 568,41168,255,82547,087,498
170,969, 895536, 897,427
62, 713,46147, 561, 557
208,331,701262,109,642207,157,054379,754,222
51,051,629
i Alaska included in Washington.
OUl
oog
CO
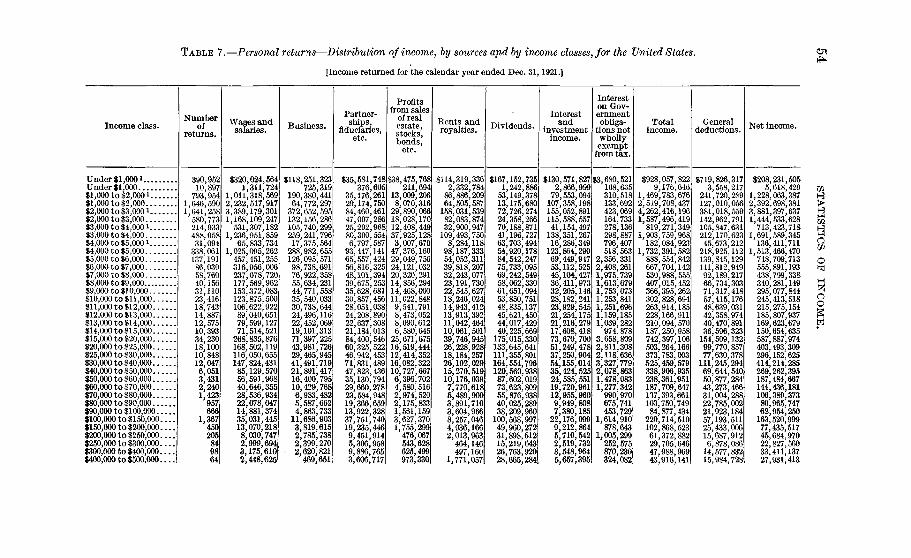
TABLE 7.—Personal returns—Distribution of income, by sources and by income classes, for the United States.
[Income returned for the calendar year ended Dec. 31,1921.]
Ox
Income class.Number
ofreturns.
Wages andsalaries. Business.
Partner-ships,
fiduciaries,etc.
Profitsfrom sales
of realestate,stocks,bonds,
etc.
Rents androyalties. Dividends.
Interestand
investmentincome.
Intereston Gov-ernmentobliga-
tions notwhollyexempt
from tax.
Totalincome.
Generaldeductions. Net income.
Under $1,0001Under $1,000$1,000 to $2,0001.. . .$1,000 to $2,000$2,000 to $3,0001.. . .$2,000 to $3,000$3,000 to $4,0001... .$3,000 to $4,000$4,000 to $5,0001$4,000 to $5,000$5,000 to $6,000$6,000 to $7,000$7,000 to $8,000$8,000 to $9,000$9,000 to $10,000$10,000 to $11,000...$11,000 to $12,000...$12,000 to $13,000...$13,000 to $14,000...$14,000 to $15,000...$15,000 to $20,000...$20,000 to $25,000...$25,000 to $30,000...$30,000 to $40,000...$40,000 to $50,000...$50,000 to $60,000...,$60,000 to $70,000...,$70,000 to $80,000...,$80,000 to $90,000....$90,000 to $100,000...$100,000 to $150,000..$150,000 to $200,000..$200,000 to $250,000..$250,000 to $300,000..$300,000 to $400,000..$400,000 to $500,000..
390,95210,897793,954
1,646,5901,641,258580,773214,933488,05831,094338,061137,19186,03058,76040,15631,11023,41618,74314,88712,57510,39334,23018,10010,84812,0476,0513,4312,2401,423957666
1,367450205849864
$320,024,5641,311,724
1,011,318,5692,232,517,9173,389,179,3011,168,109,247
531,307,1821,236,951,859
65,833,7341,025,095,262
457,451,255316,956,006237,078,720177,569,962153,372,083123,875,500106,622,92289,040,65179,599,12771,514,521
268,835,876168,502,119116,050,655147,824,43185,129,57056,591,96840,646,35528,536,93422,078,04714,881,37435,031,44513,070,2188,030,7472,999,6943,175,6102,448,625
$118,251,323725,319
190,380,44164,772,297
372,652,595132,156,286105,740,299259,241,79617,375,564
288,982,655126,095,57198,738,69176,922,35855,634,23144,771,55835,540,03330,738,64424,496,11622,452,06919,101,31371,397,22543,981,72629,465,94541,491,71921,891,41716,400,79510,429,7686,983,4825,587,6624,863,733
11,686,9033,819,6152,785,7382,399,2702,620,821
469,651,
$35,581376',
35,176,29,174,84,460,47,007,25,292,80,300,6,797,
93,447,65,557,56,816,48,101,39,675,35,628,30,857,28,051,24,208,22,637,21,184,84,400,60,325,46,942,71,831,47,823,35,130,29,660,23,584,19,366,13,922,37,751,19,235,9,451,5,306,
748 $38.605261750461286968554587141424325394253681456038890308013546522453489436794278948659328740446914
7653,606; 717
,475,768211,694
13,009,2068,070,31629,890,06618,028,17012,408,44937,925,1283,007,67047,376,16029,049,75624,121,03220,320,29114,856,29414,468,00011,022,8489,541,7918,473,0528,090,6126,580,64525,671,67516,519,44412,414,35216,082,32210,727,6676,396,7024,580,5162,974,5202,175,8331,581,1593,627,3701,755,299476,067543,628625,499973,330
$114,319,3362,332,78486,886,20964,505,587158,031,53982,083,87432,900,947109,493,7508,284,118
98,187,33354,052,31139,818,20732,243,07723,191,73022,545,62718,246,02414,943,41213,913,39211,042,46410,061,50139,746,94526,228,92818,184,25726,192,02915,270,51910,176,0397,770,6185,489,9093,891,7103,604,9668,257,0464,936,1662,013,963464,146497,160
1,771,057
$167,152,7351,242,88653,149,37813,175,68072,726,27424,358,26670,188,87141,196,72763,703,49454,920,17884,542,24775,733,09569,242,54958,062,33061,651,09453,850,75148,835,13745,621,45044,017,42940,225,669175,015,330133,645,641111,355,801164,554,796120,560,93887,602,01973,623,80955,876', 93840,025,28938,209,960100,568,99749,980,27231,898,61215,219,64326,763,92028,665,284
$130,571,827 $3,2,866,99979,553,094107,358,198155,052,891115,588,55741,154,497138,351,26716,286,349
123,864,29069,449,94753,112,52545,104,42736,411,97332,205,14628,182,24123,929,54521,254,17521,216,27917,608,41873,670,70051,249,47837,250,90454,155,01435,424,52524,585,55119,720,96112,955,9609,949,8087,380,18522,176,0999,212,8645,710,5422,519,7323,548,9645,657,395
680,521108,635310,518133,692423,069164,733278,136298,887796,407518,563356,331408,261975,739613,679753,073253,841251,696159,185039,282974,878658,809811,308118,636327,779078,863478,083277,342990,970675,741453,729614,910878,643005,299252,575870,230324,082
$928,057,S229,176,646
1,469,783,6762,519,708,4374,262,416,1961,587,496,419819,271,349
1,903,759,968182,084,923
1,732,391,582888,554,842667,704,142530,988,555407,015,452366,395,262302,828,694263,914,185228,166,911210,094,570187,250,958742,397,106503,264,166373,783,003525,459,579338,906,935238,361,951187,709,647137,393,661103,750,74984,877,434.
220,714,510102,868,52361,372,88229,705,64647,988,96943,916,141
$719,826,3173,558,217
241,720,289127,010,056381,018,559142,962,791105,847,631212,170,62345,673,212218,925,112139,845,129111,812,94992,189,21766,734,30371,317,41857,415,17648,639,03142,358,97440,470,89136,596,323154,509,13299,770,85777,630,378111,245,29469,644,54050,877,28443,273,46631,004,28822,785,00221,923,18457,193,51125,433,00615,687,9126,878,08614,577,83215,984,728
$208,231,5055,618,429
1,228,063,3872,392,698,3813,881,397,6371,444,533,628713,423,718
1,691,589,345136,411,711
1,513,466,470748,709,713555,891,193438,799,338340,281,149295,077,844245,413,518215,275,154185,807,937169,623,679150,654,635587,887,974403,493,309296,152,625414,214,285269,262,395187,484,667144,436,181106,389,37380,965,74762,954,250163,520,99977,435,51745,684,97022,827,56033,411,13727,931,413
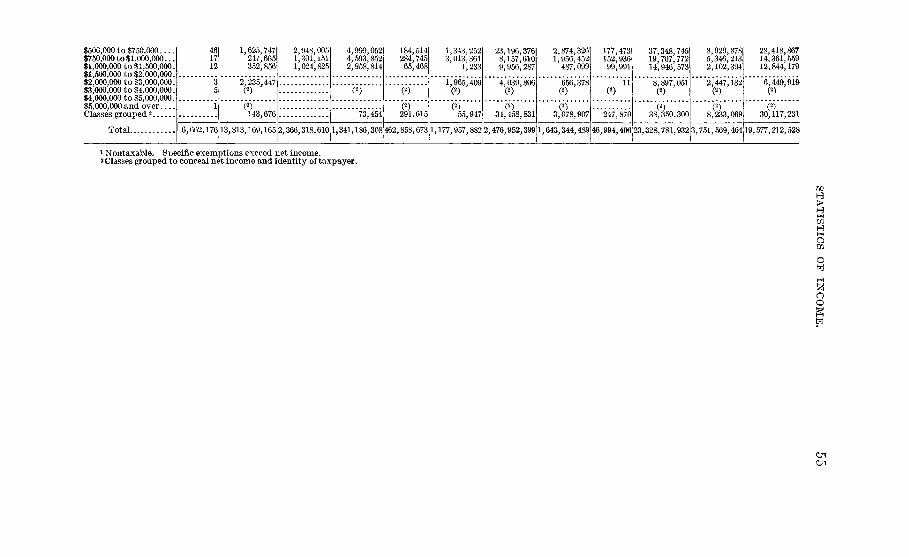
$50G,000 to $750,000 j$750,000 to $1,000,000...$1,000,000 to $1,500,000.$1,500,000 to $2,000,000.$2,000,000 to 13,000,000.$3,000,000 to $4,000,000.$4,000,000 to $5,000,000.$5,000,000 and overClasses grouped '2
Total..
1,625,747247,665352,856
2,235,447(2)
()143,676
2,948,0051,301,1511,024,825
4,999,0524,593,8522,958,814
184,514284,74565,468
73,454 291,615
1,343,2523,013,361
1,233
1,965,409(2)
5555,947
23,196,3768,157,6109,956,287
4,039,806(2)
()34,458,831
6,662,176 13,813,169,165 2,366,318,610 1,341,186,308 462,858,673 1,177,957,882 2,476,952,399 1,643,344,489 46,994,406 23,328,781,932 3,751,569,404J19,577,212,528
2,874,3261,956,452487,099
656,378(2)
()3,078,907
177,473152,93699,991
11
37,348,74519,707,77214,946,573
8,897,051(2)
247,870 38,350,300
8,929,8785,346,2132,102,394
2,447,132(2)
28,418,86714,361,55912,844,179
6,449,919(2)
8,233,069 30,117,231
1 Nontaxable. SDecific exemptions exceed net income.2 Classes grouped to conceal net income and identity of taxpayer.
wH>jjjwHO
3aoK

CORPORATION RETURNS.
TABLE 8.—Corporation returns—Distribution by States for the United States.
[Income returned for the calendar year ended Dec. 31,1921.]
Or
States andTerritories.
AlabamaAlaskaArizonaArkansasCaliforniaColoradoConnecticutDelawareDist. Columbia.FloridaGeorgiaHawaiiIdahoIllinoisIndianaIowaKansasKentuckyLouisianaMaineMarylandMassachusetts..MichiganMinnesotaMississippiMissouriMontanaNebraskaNevadaNew Hampshire
Totalnum-ber ofcor-
pora-tions.
3,079121
1,5722,383
15,1816,5594,899
9181,2583,4724,547
5871,706
22,3969,3978,6434,7494,7574,4702,9944 S-~
14,83711,4269,1771,548
13,7353,7825,0921,2441,021
Corporations reporting net income.
Num-ber re-port-ing
net in-come.
1,42545
3761,2757,3972,3402,369
383716
1,6462,067
315601
11,3844,9914,4942,8522,6172,0531,5952,0737,1995,2094,710
8197,3381,1832,447
274591
Percentof
totalnum-ber ineachState.
46.2837.1923.9253.5048.7335.6848.3641.7256.9247.4145.4653.6635.2350.8353.1152.0060.0555.0145.9353.2748.8248.5245.5951.3252.9153.4331.2848.0622.0357.88
Grossincome.
$198,170,6472,606,513
39,267,010152,850,457
2,728,823,850486,204,976739,116,25081,777,825
220,704,491211,881,821412,283,72790,392,43949,405,234
6,744,818,6671,005,748,132
656,579,966791,541,272444,349,329479,873,646352,668,492722,857,528
3,463,117,2342,345,423,6141,305,870,652
95,826,3132,276,260,673
88,670,129387,099,43320,657,513
141,379,061
Deductions.
$185,368,0112,376,755
36,533,137143,364,964
2,534,639,568452,163,931683,810,08375,721,042
200,492,531195,715,463381,247,11379,807,50247,176,023
6,363,674,214928,579,984621,262,882703,991,679112,471,737452,748,646322,183,143660,066,330
3,185,306,6882,094,119,1981,244,258,976
90,639,0582,146,880,221
82,565,728368,621,11119,325,470
128,666,088
Netincome.
$12,802,636229,758
2,733,8739,485,493
194,184,28234,041,04555,306,1676,056,783
20,211,96016,166,35831,036,61410,584,9372,229,211
381,144,45377,168,14835,317,08487,549,59331,877,59227,125,00030,485,34962,791,198
277,810,546251,304,41661,611,6765,187,255
129,380,4526,104,401
18,478,3221,332,043
12,712,973
Incometax.
$989,36415,274
205,329695,014
16,231,0272,716,2624,669,300
487,1341,701,1071,245,8972,618,990
922,666122,845
33,106,4476,264,2112,729,1117,505,0592,498,2522,213,8672,552,3455,638,109
24,464,73219,037,6235,019,706
369,65910,817,654
457,6601,473,860
84,7931,023,270
Warprofits
andexcessprofitstax.
$793,4867,112
166,549590,931
16,296,2773,248,5212,841,512
456,7011,720,399
980,5221,790,683
682,81180,464
28,202,1316,213,6391,454,6387,596,1082,273,4981,692,0682,549,6742,457,211
22,474,48142,811,4663,457,044
246,9848,806,173
110,068771,06041,841
602,606
Totaltax.
$1,782,85022,386
371,8781,285,945
32,527,3045,964,7837,510,812
943,8353,421,5062,226,4194.409,6731,605,477
203,30961,308,57812,477,8504,183,749
15,101,1674,771,7503,905,9355,102,0198,095,320
46,939,21361,849,0898,476,750
616,64319,623,827
567,7282,244,920
126,6341,625,876
Percentof
totaltax.
0.25.01.05.18
4.63.85
1.07.13.49.32.63.23.03
8.741.78.60
2.15.68.56.73
1.156.698.821.21.09
2.
.'32
.02
.23
Corporations reporting no net income.
Num-ber
report-ingnonetin-
come.
1,65476
1,1961,1087,7844,2192,530
535542
1,8262,480
2721,105
11,0124,4064,1491,8972,1402,4171,3992,1737,6386,2174,467
7296,3972,5992,645
970430
Percentof
totalnum-
ber in.each
State.
53.7262.8176.0846.5051.2764.3251.64.58.2843.0852.5954.5446.3464.7749.1746.8948.0039.9544.54.0746.7351.1851.4854.4148.6847.0946. 5768.7251.9477.9742.12
Grossincome. Deductions.
$187,696,7902,634,205
56,178,901118,329,398816,108,871318,578,783608,015,53391,783,43280,010,719
126,633,887314,385,44167,553,63663,281,973
3,758,752,152534,323,814421,721,046375,340,061219,658,706334,891,801177,443,735296,177,658
1,621,932,6931,219,593,453
779,803,32978,358,022
1,029,103,36890,998,781
274,343,83218,351,35683,215,490
$210,880,2723,033,609
67,974,775130,466,029924,658,590453,123,239675,599,235105,310,13691,823,143
142,700,737353,659,41476,247,67873,591,353
4,116,064,205601,321,503459,671,636397,587,581253,965,378375,023,151211,930,901333,938,370
1,872,422,6401,400,088,545
848,513,22687,742,228
1,119,302,987105,396,619298,498,49822,646,28088,091,047
Deficit.
$23,183,482S99,404
11,795,87412,136,631
108,549,719134,544,45667,583,70213,526,70411,812,42416,066,85039,273,9738,694,042
10,309,380357,312,05366,997,68937,950,59022,247,52034,306,67240,131,35034,487,16637,760,712
250,489,947180,495,09268,709,8979,384,206
90,199,61914,397,83824,154,6664,294,9244,875,557
Io
o
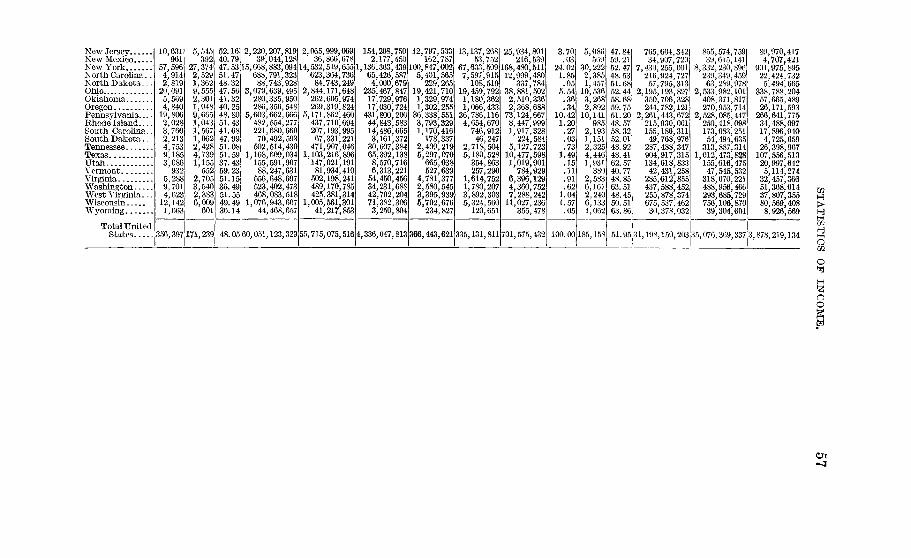
New JerseyNew MexicoNew YorkNorth Carolina..North Dakota. . .OhioOklahomaOregonPennsylvaniaRhode IslandSouth Carolina..South Dakota. . .TennesseeTexasUtahVermontVirginiaWashingtonWest Virginia...WisconsinWyoming
Total UnitedStates
10,631961
57,5964,9142,81920,0915,5694,84019,8062,0283,7602,2134,7539,1853,086932
5,2889,7014,623
12,1421,663
5,545392
27,3742,5291,3629,5552,3011,9489,6651,0431,5671,0622,4284,7391,155
5522,7053,5402,3836,009
601
356,397171,239
52.16 2,40.7947.53 15,51.4748.3247.5641.3240.2548.51.4341.6847.9951.0851.5937.4359.2351.1536.4951.5549.4936.14
220,207,81939,044,128
668,883,09414,688,791,32388,743,928
079,639,495280,335,950286,350,548
1,603,662,666482,554,277221,680,66070,492,593
502,514,430,168,609,034155,591,90788,247,631
556,648,697523,402,473468,083,518
,076,943,60744,468,657
48.05 60,051,123,329
065,999,06936,866,678
532,519,6551623,364,73684,743,249844,171,648262,605,974269,319,824171,862,460437,710,694207,193,99567,331,221471,907,046,103,216,896147,021,19181,934,410502,198,241489,170,785425,381.314,005,561,30141,217,853
154,208,2,177,
,136,363,65,426.4,000,
235,467,17,729.17,030!431,800:44,843:14,486;3,16i:30,607!65,392'8,570;6,313:54,450;34,231;42,702'71,3823,250:
750450439 100,587 "
12,,797,533162,787847,002,401,565229,265,421,710,329,974,302,255.338,551793,329170,416178,337409,219,297,070665,038527,639,781,377,580,545,395,939,702,676234,827
55,715,075,516 4,336,047,813 366,443,621 335,131,811 701,575,432
13,137,268 25,53,752
67,633,509 168.7,597,915
108,51919,459,7921,180,3621,066,43336,786,1164,654,670746,91246,247
2,718,5045,180,528354,863257,290
1,614,7521,780,2073,892,3035,324,560120,651
934,801216,539480,511999,480337,784881,502510,336368,688124,667447,999917,328224,584127,723,477,598019,901784,929396,129,360,752,288,242027,236355,478
3.70.03
24.021.85
.055.54
.36
.3410.42
. 1.20.27.03.73
1.49.15.11.91.62
1.041.57
.05
100.00
5,086509
30,2222,3851,457
10,5363,2682,892
10,141985
2,1931,1512,3254,4461,931
3802,5836,1612,2406,1331,062
185,158
47.8459.2152.4748.5351.6852.4458.59.7551.2048.5758.3252. OH48.9248.4162.5740.7'48.85j63.5148.4550.5163.86
765,604,34234,907,720
7,430,255,001216,924,72757,795,313
2,195,193,897350,706,328244,782,121
2,261,443,672215,930,001155,186,31149,768,976287,488,347904,917,315134,618,83342,431,258285,612,855437,588,452255,878,374675,537,46230,378,032
855.39;
8,332,239.63,
2,533.408;270,
2,528.250;173,54.
313!1,012.
155!47.
318:488;293.756;39;
574,759615,141230,896349,459289,978982,101371,817953,714085,447418,098083,251494,635887.314473,828616,475545,532070,221956,466685,729106,870304,601
89,970,4174,707,421
901,975,89522,424,7325,494,665
338,788,20457,665,48926,171,593266,641,77534,488,09717,896,9404,725,65926,398,967107,556,51320,997,6425,114,27432,457,36651,368.01437,807,35580,569,408
51.95 31,198,150,203 35,076,369,337 3,878,219,134 Mi l l ' O
oo

TABLE 9.—Corporation returns—Distribution of incomes by industries for the United States.
| Income returned for the calendar year ended Dec. 31,1921.]
Or00
SerialNo.
12315
0789
10
11
1213141516
17181920
Industries.
AGRICULTURE AND RELATED INDUSTRIES.
I. Farming:Cotton f a r m i n g . . .Grain farmingFruit farmingStock farmingAll other farming
Total, farming
II. Related industries:1 ogging...FishingIce harvestingAll other related industries
Total, related industriesAgriculture, n. p. d.,1 or combinations of I and II
Grand total, agriculture and related industries
MINING AND QUARRYING.I. Mining:
Coal miningMetal mining-
Iron . . . .CopperLead and zinc..Gold, silver, and precious metalsAll other mining
Nonmetal mining-Oil . . . . . . .GasSalt, mines and other sourcesAll other nonmetal mining
Totalnumberof corpo-rations.
1123
944711
5,739
7,428
364196151551
1,26234
8,724
3,656
108149127450688
2,60818457
2,060
Corporations reporting net income.
Number.
32
368131
2,180
2,684
13868
121121
44814
3,146
1,079
37122073
130
77311933
555
Net income.
$27,50548,262
20,989,777723,220
12,477,411
34,266,175
2,816,401279,428
1,599 9021,678,213
6,373,94478,073
40,718,192
82,654,787
255,519141,924
1,451,5703,449,0324,543,351
57,950,0741,433,7094,813,7916,871,395
Income tax.
$2,3343,399
1,898,76857,499
916,341
2,878,341
255,04320,299
126 238147,599
549,1796,009
3,433, 529
6,922,882
14,01711,462
138,253313,692394,741
5,081,043121,175416,827553,227
War profits,and excess-profits tax.
$1,88312,038
1,523,9829,609
673,751
2,221,263
109,527841
156,04280,653
347,063107
2,568,433
8,296,562
1,871451
11,649181,476129,133
5,225,63164,123
598,152464,495
Total tax.
$4,21715,437
3,422,75067,108
1,590,092
5,099,604
364,57021,140
282,280228,252
896,2426,116
6,001,962
15,219,444
15,88811,913
149,902495,168523,874
10,306,674185,298
1,014,9791,017,722
Corporations reportingno net income.
Number.
821
576580
3,559
4,744
22612830
430
81420
5,578
2,577
71137107377558
1,8356524
1,505
Deficit.
$248,512335,461
3,877,44812,248,17446,624,653
63,334,248
6,666,78714,567,002
105,6953,657,033
24,996,517232,133
88,562,898
72,521,815
9,742,79751,973,3463,497,993
12,058,17632,483,913
139,884,645531,649368,587
53,016,585
Ul
>

21
26
All other mining concerns, n. p. d.,l combinationsand tributary industries.
Total, mining
II. Quarrying:StoneClay? sand, gravelPrecious and semipreciousAll other quarrying, n. p. d.1
Total, quarrying ,Mining and quarrying combinations, but main business
not given
Grand total, mining and quarrying
MANUFACTURING.
I. Food products, liquors, and tobacco:Bread and bakery products and retail saleMilling, flour, meal, feedCereal preparations, etc ,Dairy products and condensed milk ,Butter substitutes.Chocolate, confectionery, ice cream, etc ,Coffee and spices ,Fish canning and preservingFruit and vegetable canning and preserving, etcMeat packing, etcPoultry and eggs, packedSugar making ana refining, cane and beet ,Ice manufacturing, etc ,Soft drinks, etcBreweries and distilleries, etcTobaccoAll other food products
Total, food products, liquors, p-nd tobacco
II. Textiles and textile products:Textile fabrics—
Cotton goods, etcWoolen and worsted goods, etcSilk goods, etcFelt goods and products, except hatsLinen and flax, etcAll other textile fabricsFur goods and fur products n. p. d.1, etc
Total textile fabrics
6,021
16,108
49372010258
1,481
71
17,660
1,2331,732164
2,47025
1,3761272269055066
2011,2921,281576564
1,093
13,777
8624106834117
1,418
3853,816
799
3,630
2653453
100
713
22
4,365
76167969
1,6474
6167950328315437
1,055565221267510
7,207
470249307226
770
1962,020
7,991,321
171,556,473
5,955,1255,428,312
56,2041,529,659
12,969,300
608,150
185,133,923
37,459,99321,411,1426,980,43125,154,729
11,52626,544,2475,861,608486,614
8,905,72824,754,868
14,5156,363,40322,129,3027,675,4578,891,52084,179,79332,351,397
319,176,273
77,300,20433,837,89621,222,2561,971,399236,708
91,980,740
4,396,090230,945,293
688,042
14,655,361
522,806443,2715,043
124,578
1,095,698
53,533
15,804,592
3,027,7761,832,445541,531
1,986,068529
2,178,251433,63437,363687,575
2,292,302747
544,4011,799,13460S, 989679,920
7,342,7642,808,004
26,801,433
6,818,8132,847,2081,832,655183,88919,707
7,654,127
329,43019,685,829
140,357
15,113,900
372,128477,1772,931
152,372
1,004,608
46,116
16,164,624
5,723,7291,297,7901,462,8153,589,480
3,870,9471,389,815
29,0571,264,4361,397,139
760,3222,697,285778, 506939,208
10,093,6713,580,671
38,874,871
7,357,9855,182,3302.328,205
80,39812,828
12,505,030
815,18828,281,964
828,399
29,769,261
894,934920,4487,974
276,950
2,100,306
99,649
31,969,216
8,751,5053,130,2352,004,3465,575,54S
5296,049,1981,823,449
66,4201,952,0113,689,441
7471,304,7234,496,4191,387,4951,619,12817,436,4356,388,675
65,676,304
14,176,7988,029,5384,160,860264,28732,535
20,159,157
1,144,61847,967,793
5,222
12,478
2283757
158
768
49
13,295
4721,053
9582321760481765771912
164237716355297583
6,570
3921613761911648
1891,796
31,205,306
407,284,812
2,315,2403,094,524
30,868908,276
6,348,908
855,231
414,488,951
3,779,88121,415,6911,940,5235,455,5681,398,17420,360,7941,554,59615,670,89715,484,39973,188,479
9,51589,059,0081,847,0927,663,19216,376,0065,620,34228,337,830
309,161,987
35,054,16313,265,66614,887,904
264,407326,591
25,113,724
2,623,53491,535,989
So
oo
1 N. p. d.—Main business not precisely denned. CO
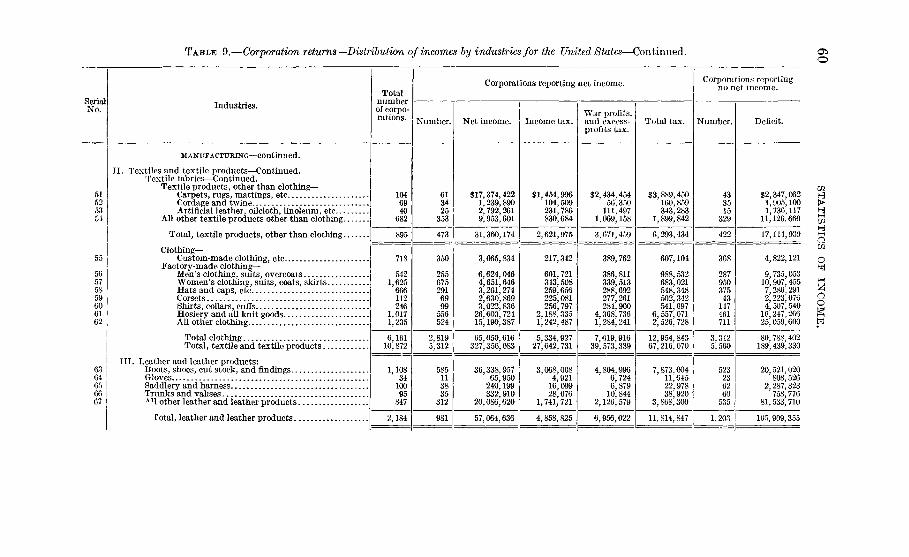
TABLE 9.—Corporation returns—Distribution of incomes by industries for the United States—Continued.
SerialNo. Industries.
Totalnumberof corpo-rations.
Corporations reporting net income.
Number. Net income. Income tax.War profits,and excess-profits tax.
Total tax.
Corporations reportingno net income.
Number. Deficit.
M A NUFACTURING—continued.
II. Textiles and textile products—Continued.Textile fabrics—Continued.
Textile products, other than clothing—Carpets, rugs, mattings, etc ,Cordage and twineArtificial leather, oilcloth, linoleum, etc...
All other textile products other than clothing
Total, textile products, other than clothing
Clothing-Custom-made clothing, etc
Factory-made clothing-Men's clothing, suits, overcoatsWomen's clothing, suits, coats, skirtsHats and caps, etcCorsetsShirts, collars, cuffsHosiery and all knit goodsAll other clothing
Total clothingTotal, textile and textile products
III. Leather and leather products:Boots, shoes, cut stock, and findingsGlovesSaddlery and harnessTrunks and valisesA H other leather and leather products
Total, leather and leather products
1046940
682
895
718
5421,625
666112246
1,0171,235
6,16110,872
1,10834
10095
847
2,184
613425
353
$17,374,4221,239,8902,792,2619,953,601
$1,454,996104,509231,786830,684
$2,434,45456,350
111,4971,069,158
$3,889,450160,859343,283
1,899,842
433515
329
473 I 31,360,174 2,621,975 3,671,459 6,293,434 422
350
255675291
556524
2,8195,312
58511
35312
981
3,065,834
6,624,0464,651,6463,261,2742,630,8693,022,836
26,603,72415,190,387
217,342
601,721343,508259,656225,081256,797
2,188,3351,242,487
389,762
386,811339,513288,692277,261281,900
4,368,7361,284,241
607,104
988,532683,021548,348502,342541,697
6,557,0712,526,728
368
28795037543
147461711
65,050,616327,356,083
5,334,92727,642,731
7,619,91639,573,339
12,954,84367,216,070
3,3425,560
36,338,95765,950240,199332,910
20,086,620
3,068,0084,92116,09928,076
1,741,721
4,804,9966,7246,87910,844
2,126,579
7,873,00411,64522,97838,920
3,868,300
523236260535
57,064,636 4,858,825 6,956,022 11,814,847 1,203
$2,347,0621,905,1001,736,11711,126,660
17,114,939
4,822,121
9,735,05310,907,4557,286,2912,223,0764,507,54016,247,26625,059,600
80,788,402189,439,330
20,521,020808,526
2,287,323758,776
81,533,710
105,909,355
in
>
3H
o
M
oo
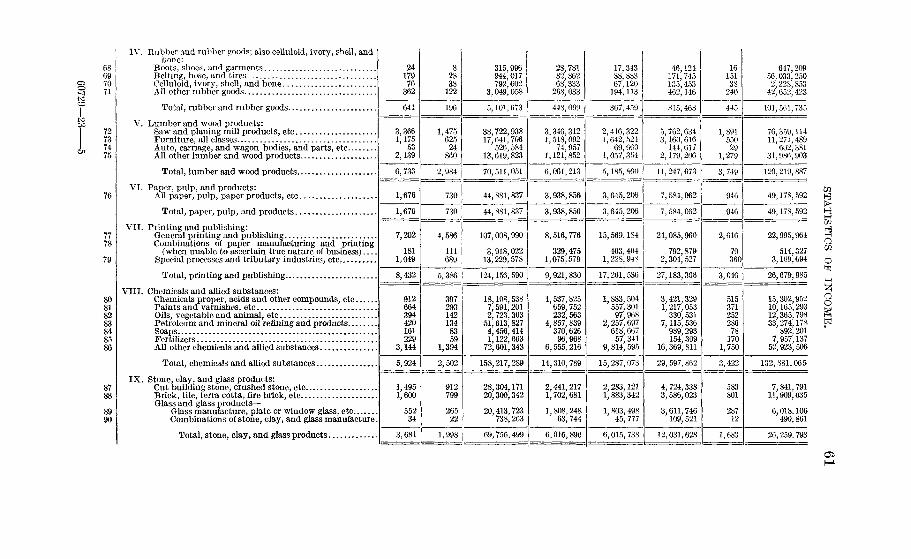
76
79
87
IV. Rubber and rubber goods; also celluloid, ivory, shell, andbone:
Boots, shoes, and garmentsBelting, hose, and tiresCelluloid, ivory, shell, and boneAll other rubber goods
Total, rubber and rubber goods
V. Lumber and wood products:Saw and planing mill products, etcFurniture, all classesAuto, carriage, and wagon bodies, and parts, etcAll other lumber and wood products
Total, lumber and wood products
VI. Paper, pulp, and products:
All paper, pulp, paper products, etc
Total, paper, pulp, and products
VII. Printing and publishing:General printing and publishingCombinations of paper manufacturing and printing
(when unable to ascertain true nature of business)Special processes and tributary industries, etc,
Total, printing and publishing
VIII. Chemicals and allied substances:Chemicals proper, acids and other compounds, etcPaints and varnishes, etcOils, vegetable and animal, etcPetroleum and mineral oil refining and productsSoapsFertilizersAll other chemicals and allied substances
Total, chemicals and allied substances
IX. Stone, clay, and glass products:Cut building stone, crushed stone, etcBrick, tile, terra cotta, fire brick, etcGlass and glass products—
Glass manufacture, plate or window glass, etcCombinations of stone, clay, and glass manufacture.
Total, stone, clay, and glass products
2417976362
641
3,3661,175
532,139
6,733
1,676
1,676
7,202
1811,049
8,432
912664394420161229
3,144
5,924
1,4951,600
55234
3,681
82838122
196
1,47562524860
2,9S4
730
730
4,586
111689
5,386
3972931421348359
1,394
2,502
912799
26522
1,998
315,996944,017792,602
3,049,058
5,101,673
38,722,93817,641, 706
526,58413,619,823
70,511,051
44,881,837
44,881,837
107,008,990
3,918,02213,229,578
124,156,590
18,108,5387,591,2012,723,30351,613,8274,456,4141,122,66372,601,343
158,217,289
28,304,17120,300,342
20,413,723738,263
69,756,499
28,78182,86268,333268,033
448, 009
3,346,3121,518,092
74,9571,121,852
6,061,213
3,938,856
3,938,856
8,516,776
329,4751,075,579
9,921,830
1,537,825659,752232,563
4,857, 839370,62696,968
6,555,216
14,310,789
2,441,2171,702,681
1,808,24863, 744
6,015,890
17,34388, 88367,120194,113
367,459
2,416,3221,642,524
69,6601,057,354
5,185,860
3,645,206
3,645,206
15,569,184
463,4041,228,94S
17,261,536
1,883,504557,30197,968
2,257,697618,66757,341
9,814, 595
15,287,073
2,283,1211,883,342
1,803,49845,777
6,015, 738
46,124171,745135,453462,146
815,468
5,762,6343.160,616144,617
2,179,206
11,247,073
7,584,062
7,584,062
24,085,960
792,8792,304,527
27,183,366
3,421,3291,217,053330,531
7,115, 536989,293154,309
16,369,811
29, 597,862
4,724,3383,586,023
3,611,746109,521
12,031,628
1615138240
445
1,89155029
1,279
3, 749
946
946
2,616
70360
3,046
51537125228678170
1,750
3,422
583801
28712
1,683
647,20956,033,2502,228.85342,652, 423
101, 561,735
76,359,11411,271,489
602,38131,986,903
120,219,887
49,178,592
49,178,592
22,995,964
514,3273,169,694
26,679,985
15,302,95210,165,29312,365,79833,274,178
892,2017,957,13752,923,506
132,881,065
7,841,79111,909,035
6,018,106' 490,861
26,259,793
Oin
o
oo

TABLE 9.—Corporation returns—Distribution of incomes by industries for the United States—Continued.fcO
SerialNo.
91
92
93
94
95
9697
98
99
100
101102103
104
105
Industries.
MANUFACTURING—continued.
X. Metal manufacture:Metal products of iron and steel, or iron and steel and
other metals-Smelting from the ore, crude or refined metal pro-
duction, etcGeneral or stock products or forms made in foun-
dries or rolling mills, etcAgricultural machinery, steam appliances, con-
struction machinery, etcMetal-working and paper-making machinery, heavy
ordnance, rolling stock, safes, vaults, etcGeneral electric machinery, stationary and marine
engines, refrigerating machinery, etcMotor vehicles, and spare partsBoot and shoe machinery, typewriters and calcu-
lating machines, gas and electrical fixtures, etc.. .Metal furniture, ornamental iron work, sewing ma-
chines, etcFirearms, hardware, cutlery, hand and machine
tools, gauges, etcAll other metal products
Metal products, not iron or steel-Base metals, smelting and refining, etcAeroplanes complete, or partsPrecious metals, smelting, refining, etc
Total, metal manufactureXI. All other manufacturing concerns:
All other manufacturing, n. p. d.,1 etc
Grand total, manufacturing
CONSTRUCTION.
Excavation and construction under or upon the ground (notbuildings), etc
Totalnumberof corpo-rations.
100
2,574
1,479
782
5721,000
725
203
7845,823
74940
705
Number.
15,536
10,292
79,748
1,046
19
881
554
364
189251
296
122
2171,977
26715
316
Corporations reporting net income.
Net income.
$489,787
39,284,930
27,314,460
64,872,922
34,289,413148,230,008
22,324,357
2,650, '166
10,617,64763,830,286
16,739,785837,654
5,885,145
437,366,860
164,196,817
37,030
664
1,777,785,608
9,403,241
Income tax.
$43,973
3,252,013
2,377,408 |
5,794,285 i
3,292,41310,977,441 i
2,112,927
216,901
War profits. !and excess- Total tax.profits tax.
5,518,159
1,515,39060,738
510,765
36,561,169
14,474,387
151,035,132
700,413
$7,949
2,388,871
1,766,120
5,972,037
796,60533,426,298
921,084
275,479
1,539,8415,526,350
723,14766,223
336, 547
53,746,551
13,821,462
200,735,117
$51,922
5,640,884
4,143,528
11,766,322
4,089,01844,403,739
3,034,011
492,380
2,428, 59711,044,509
2,238,537126,961847,312
90,307,720
28,295,849
351,770,249
1,493,694 i 2,194,107
Corporations reportingno net income.
Number.
81
1,693
925
418
383749
429
81
5673,846
482 j25 i
389
10,068
6,026
42,718
382
Deficit.
$17,205,099
121,572,283
84,307,188
28,791,001
20,348,361164,353,S78
17,775,831
2,663,143
19,764,763156,798,339
22,909,602921,381
8,591,028
666,001,897
171,537,751
1,898,831,377
4,127,090
til
o
3QO
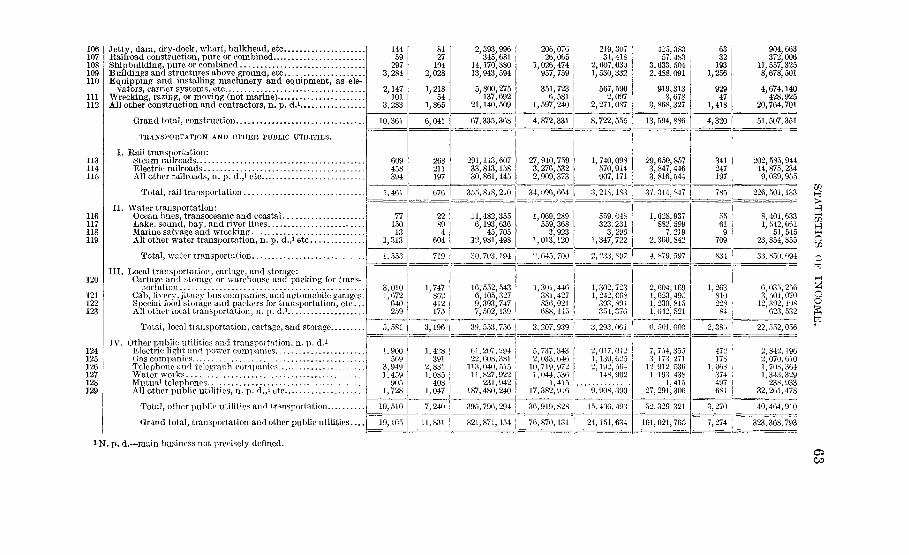
106 Jetty, dam, dry-dock, wharf, bulkhead, etc107 Railroad construction, pure or combined108 Shipbuilding, pure or combined109 Buildings and structures above ground, etc110 Equipping and installing machinery and equipment, as ele-
vators, carrier systems, etc111 Wrecking, razing, or moving (not marine)112 All other construction and contractors, n. p. d.1
Grand total, construction
TRANSPORTATION AND OTHER PUBLIC UTILITIES.
I. Rail transportation:113 Steam railroads114 Electric railroads115 All other railroads, n. p. d.,1 etc
Total, rail transportation
II. Water transportation:116 Ocean lines, transoceanic and coastal117 Lake, sound, bay, and river lines118 Marine salvage and wrecking119 All other water transportation, n. p. d.,1 etc
Total, water transportation.
III. Local transportation, cartage, and storage:120 Cartage and storage or warehouse and packing for trans-
portation121 Cab, livery, jitney bus companies, and automobile garages.122 Special food storage and packers for transportation, e tc . . .123 All other local transportation, n. p. d.1 „
Totai, local transportation, cartage, and storage
IV. Other public utilities and transportation, n. p. d.1124 Electric light and power companies125 Gas companies.126 Telephone and telegraph companies127 Water works128 Mutual telephones129 All other public utilities, n. p. d.,1 etc
Total, other public utilities and transportation
Grand total, transportation and other public utilities
1 N. p. d.~main business not precisely defined.
14459297
3,284
2,147101
3,283
10,361
609458394
1,461
7715013
1,313
1,553
3,0101,672640259
5, 5S1
1,900569
3,9491,459905
1,728
10, 510
19,105
8127104
2,028
1,21854
1,865
6,041
268211197
676
22894
604
719
1,747862412175
3,196
1,428391
2, 8811,085408
1,047
7, 240
11,831
2,393,996345,681
14,170,38013,943,594
5,800,275137,692
21,140,509
67,335,368
291,113,60733,843,15830,861, 445
355,818,210
11,482,3556,193,636
45, 70512,981,498
30,703,191
16,552,5436,105,3279,393,7477,502,139
39,553,756
61,207,29422, 008, 381113,040,51511,827,922
231 942187,480,240
395,796,294
821,871,454
206,07626,065
1,026,474957,759
351,7236,581
1,597,240
4,872,331
27, 910,7593,276,5322,909,373
34,096,664
1,069,289559,3683,923
1,013,120
2,645,700
1,301, 446381, 427836,921688,145
3,207,939
5,737,3432,033,64610,719,9721,044, 536
1 41517,382,916
36,919, 828
76, 870,131
219,30731.418
2,607,0301,530,332
567,5902,097
2,271,087
8,722,555
1,740,098570,914907,171
3, 218,183
559,648323.2313, 296
1,347,722
2,233,897
1,302,7231,242,06S393, 894354,376
3,293,001
2,017,0121,139, 6252,192, 504148.902
9,908,390
15,406,493
24,151,634
425,38357, 483
3,633, 5042,488,091
919,3138,678
3,868,327
13, 594, 886
29,650,8573,847,4463,816,544
37,314,847
1,628,937882, 5997,219
2,360,842
4, 879, 597
2,604,1691,623, 4951,230, 8151, 042, 521
6,501,000
7, 754,3553,173,27112,912,5361,193,438
1 41527, 291,306
52,326,321
101,021,765
6332193
1,256
92947
1,418
4,320
341247197
785
55619
709
834
1,26381022884
2,385
47217S
1, 068374497681
3,270
7,274
904,663372,006
11,557,3258,678,501
4,674,140428,925
20,764,701
51,507,351
202,585,94414,875,2349,039,955
226,501,133
8,401,6331,542,661
51, 54523,854, 855
33, 850, 694
6,035,2563,501,07012,392,198
623,532
22,552,056
2, 842,1962,070,6101,708,3641,343,32923S 933
32,261, 478
40,464,910
323,368,793
I I
H
OoK
Co

TABLE 9.—Corporation returns—Distribution of incomes oy industries for the United States—Continued.
SerialNo.
CO CO
f
133
134
135136137138
139140141
142
143
144145146
Industries.
TRADE.
Wholesalers and jobbers, including exporters, importers, etcDepartment stores, either wholesale or retail, or both _Retail stores, all other etcCommission trade, including commercial travelers and special
agents, etcAll other trade, n. p . d.,1 etc
Grand total, trade
SERVICE.I. Domestic service:
Restaurants, lunch rooms, etcHotels, board and lodging houses.Laundries, cleaning and dyeingAll other domestic service, n. p. d.,1 etc
Total, domestic service
II . Amusements:Theaters, or theatrical organizations, etcMoving picturesAll other amusements
Total, amusements
III . Professional and other services:Business services, advertising, appraisers, auditors, ac-
tuaries, etcEducational service, including art, colleges, schools, libra-
ries, etc., teachers, etcCurative services physicians, surgeons, etcLegal services, lawyers, patent attorneys, e t c . . .Engineering, mechanical design, invention, scientific re-
search, etc
Totalnumberof corpo-rations.
15,9651,219
40 202
2 39328,340
88 179
1 5461 Q402 501
218
6,205
4341 5272,257
4,218
1,799
9001,0531,084
887
Number.
6,930782
20 591
1 03513,471
42 809
8061 2361,672
138
3, S52
224843
1,166
2,233
989
518582789
186
Corporations reporting
Net income.
$120,038, S1470,074,540
191,880,427
18 090,832165,854,684
571,945,297
10,029,84228,874,63512,437,967
989,542
52,331,986
5,621,7318,141,953
13,305,762
27,069,446
7,486,837
3,281,4172,837,8885,287,678
818,802
Income tax.
Sr.), 909,9550,819,905
14 722 049
1 501 32913,325,381
46,279,219
675,3192 423 333
898,56873,234
4,070,454
464,536612 166
1,058,743
2,135,445
542,921
246,068192,134404,125
55,078
net income.
"War profits,arid excess-profits tax.
$10,169, S446,415,921
17 4 i i 150
1 213 28515,253,090
50,463,296
1,922,1322 740,0891,122,513
91,532
5, 870, 266
669,635897,119
1,639,307
3,206,061
904,941
334,231200,706308,660
61,420
Total tax.
$20,079,79913,235,82632 133 799
2 714 61428,578,477
96,742,515
2,597,4515 163 4222,021,081
164,766
9,946,720
1,134,1711,509,2852,698,050
5,341,506
1,447,862
580,299392,840712,785
116,498
Corporations reportingno net income.
Number.
9,035437
19 071
1 35814,869
45,370
740704829
80
2,353
210684
1,091
1,985
810
382471295
701
Deficit.
$234,270,82610,227,425
145,087,590
13,886,563223,355,939
626,828,343
5,315,0307,920,1972,671,115
888,025
16,794,367
2,250,1024,793,0365,812,484
12,855,622
4,901,141
2,168,2151,434,226
474,647
3,170,821
Ia
oo
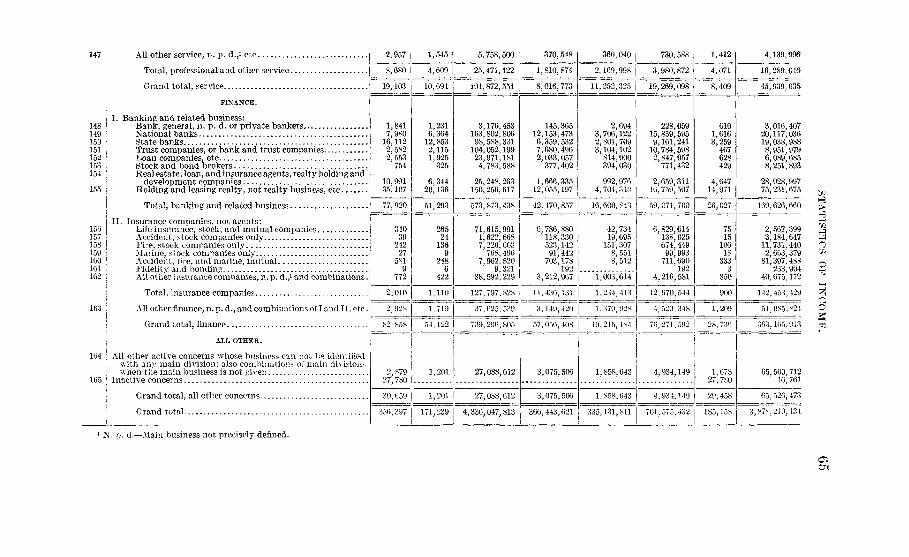
147
148149150151152153154
155
150157158159160161162
163 ;
164
165
All other service, n. p. d.,1 etc
Total, professional and other service.
Grand total, service
2,957 1
Banking and related business:Bank, general, n. p. d. or private bankersNational banksState banksTrust companies, or bank and trust companiesLoan companies, etcStock and bond brokersReal estate, loan, and insurance agents, realty holding and
development companies '.Holding and leasing realty, not realty business, etc
Total, banking and related business.
I I . Insurance companies, not agents:Life insurance, stock, and mutua l companiesAccident, stock companies onlyFire, stock companies onlyMarine, st ock companies onlyAccident, fire, and marine, mutualFidelity and bonding
All other insurance companies, n. p . d.,1 and. combinations.
Total, insurance companies
All other finance, n. p . d., and combinations of I and IT, etc.
Grand total, financeALL OTHER.
All other active concerns whose business can not be identifiedwith any main division; also combinations of main divisionswhen the main business is not given
Inactive concerns
Grand total, all other concerns..
G rand total
1,8417,980
16,1122,5822,553
754
10,99135,107
77,920
34039
24227
5819
772
S2,858
2,87927,780
30,659
1,545
8,680 4,609
19,103 | 10,694
1,2316,364
12,8532,1151,925
325
6,34420,136
51, 293
26524
1369
2486
422
5,758,500
25,471,122
370,548
1,810,874
104,872,554 8,016,773
360,040 f 730,588 | 1,412
2,169,998 | 3,980,872 | 4,071
11,252,325 | 19,269,098 | 8,409
3,176,453163,802,80698,588,331
104,052,19923,971,1814,783,588
25,248,263150,250,617
573,873, 438
71,615,9911,622,6687, 226,603
768,4967,962,520
9,32138,592,229
2,010 1,110 I 127,797,828
54,122
1,201
1, 201
37,625,539
739,296, 805
27,088,612
27,088,612
356,397 | 171,239 | 4,336,047,813
145,36512,153,4736,359,5327,680,4962,033,057
377,402
1,666,33512,055,197
2,6943,706,1222,801,7093,104,102
814,900394,030
992,9764,704,310
42,470,857 I 16,600,843
6,786,880118,330523,14291,442
703,178192
3,212,967
42,73419,695
151,3078,5518,512
1,003,614
11,430,131 j 1,234,413 12,670,544 |
228,05915,859,5959,161,241
10,784,5982,847,957
771,432
2,659,31116,759,507
59,071,700
6,829,614138,025674,44999,993
711,690192 I
4,216,581
6101,6163,259
467628429
4,64714,971
26,627
3,149,420 | 1,379,928) 4,529,348 | 1,209
3,075,506
3,075,506
366,443,621
1,858,643
1,858,643
335,131,811
4,934,149
4,934,149
701,575,432
1,67827,780
29,458
4,139,99$
16,289,046
45,939,035
3,016,40720,117,03619,038,9888,951,9796,089,6858,251,893
28,928,99775,231,675
169,626,660
7515106183333
350
2,3,11,2,81,
40,
567,399184,647731,440663,379397,488233,904675,172
51,085,824
65,509,71210, 761
05,520,473
185,158 j 3,878,219,134
1 N. p. d.—Main business not precisely defined.
TJ1
142,453,429 -4
; g.57,056,408 j 10,215,184 I 70,271,592 I 28.730 j 363,105,913 &
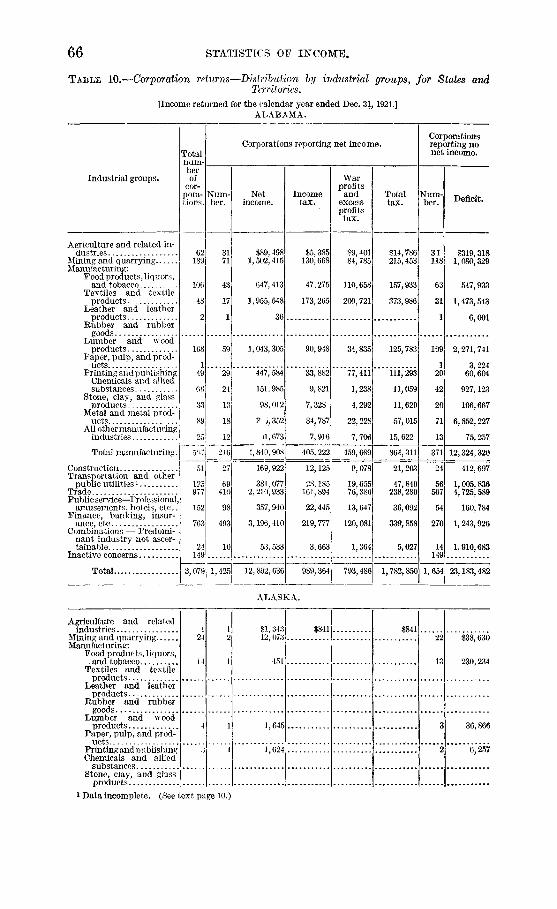
66 STATISTICS OF INCOME.
TABLE 10.—Corporation returns—Distribution by industrial groups, for States andTerritories.
[Income returned for the calendar year ended Dec. 31,1921.]ALABAMA.
Industrial groups.
Agriculture and related in-dustries
Mining and a uarryingManufacturing:
Food products, liquors,and tobacco
Textiles and textileproducts
Leather and leatherproducts
Rubber and rubbergoods
Lumber and woodproducts
Paper, pulp, and prod-ucts.
Printing and publishingChemicals and alliedsubstances
Stone, clay, and glassproducts
Metal and metal prod-ucts
All other manufacturingindustries
Total manufacturing.
ConstructionTransportation and other
public utilities iTradePublic service—Professional,
amusements, hotels, etc..Finance, banking, insur-
ance etc.Combinations — Predomi-
nant industry not ascer-tainable.
Inactive concerns
Total
Totalnum-berof
cor-pora-tions.
62189
106
48
2
168
149
GG
33
89
25
51
125977
152
763
24149
3,079
Corporations reporting net income.
Num-ber.
3171
43
17
1
59
29
24
13
18
12
216
27
69410
98
493
10
1, 425
Netincome.
$89, 4981,502,415
647,413
1,955,548
36
1,043,305
447, 584
151,985
98, 012
? i,352
<1,673
4, 840, 90S
169,922
381,0772,210,933
357, 940
3,196,410
53,533
12,802,636
Incometax.
$5,385130,668
47,275
173,265
90,948
33,882
9,821
7,328
34,787
7,916
405, 222
12,125
28,185161,894
22,445
219,777
3,663
989,364
Warprofits
andexcessprofitstax.
$9,40184,785
110,658
200,721
34, 835
77,411
1,238
4,292
22,228
7,706
459,089
9,078
19,65576,386
13,647
120,081
1,364
793,486
Totaltax.
114,786215,453
157,933
373,986
125,783
111,293
11,059
11,620
57, 015
15,622
864,311
21,203
47,840238,280
36,092
339,858
5,027
1,782,850
Corporationsreporting nonet income.
Num-ber.
31118
63
31
1
109
]
20
42
20
71
13371
24
56567
54
270
14149
1,654
Deficit.
$319,3181,080,329
547,933
1,473,543
6,001
2,271,741
3,22460,604
927,123
106,667
6,852,227
75,257
12,324,320
412,697
1,005, 8364,725,589
160, 784
1,243,926
1,910,683
23,183,482
ALASKA.
Agriculture and relatedindustries
Mining and quarryingManufacturing:
Food products, liquors,.and tobacco
Textiles and textileproducts
Leather and leatherproducts..
Rubber and rubbergoods....
Lumber and woodproducts
Paper, pulp, and prod-ucts
Printing and publishingChemicals and allied
substancesStone, clay, and glass
products
124
14
4
12
1
1
1
$1,34312,073
451
1,645
1,624
$841 $84122
13
3
2
$38,630
230,234
36,866
6,257
1 Data incomplete. (See text page 10.)

STATISTICS OF INCOME. 67
TABLE 10.—Corporation returns—Distribution by industrial groups, for States andTerritories—Continued.
ALASKA—-Continued.
Industrial groups.
Manufacturing—Contd.Metal and metal prod-
uctsAll other manufacturing
industriesTotal manufacturing-
ConstructionTransportation and other
public utilitiesl
TradePublic service—Professional
amusements, hotels, etc..Finance, banking, insur-
ance, etcCombinations — Predomi-
nant industry not ascer-tainable
Inactive concernsTotal
Totalnum-berof
cor-pora-tions.
21
1
9
23
6
25
11
121
Corporations reporting net income.
Num-ber.
3
614
3
16
45
Netincome.
$3, 720
48,460106,758
8,298
49,106
229 758
Incometax.
Warprofits
andexcessprofits
tax.
1 .$3,889 $2,5468 013 2 425
349
2,182
15 274
44
1,087
7,112
Totaltax.
$6,43511,448
393
3,269
22,3S6
Corporationsreporting nonet income.
Num-ber.
18
1
39
3
9
11
76
Deficit.
$273,357
447
30,22145,070
3,113
8,566
399,404
ARIZONA.
Agriculture and related in-dustries ..
Mining and quarryingManufacturing:
Food products, liquors,and tobacco
Textiles and textileproducts
Leather and leatherproducts
Rubber and rubbergoods '.
Lumber and wood prod-ucts ..
Paper, pulp, and prod-ucts
Printing and publishingChemicals and allied
substancesStone, clay, and glass
productsMetal and metal prod-
ucts.All other manufacturing
industries .Total manufacturing.
Construction.Transportation and other
public utilities *TradeP u b l i c service-—Profes-
sional, amusements, ho-tels, etc.
Finance, banking, insur-ance, etc...
Combinations—Predomi-nant industry not ascer-tainable.
Inactive concernsTotal
103288
32
2
1
11
122
2
9
6
2
88
15
67280
64
251
16400
1,572
1415
16
2
c
7
2
4
2
1
39
HI
2892
37
134
7
$62,033170,653
268,012
210,110
34,515
35,916
1,909
9.096
113,232
22,495
965,285
37,301
343,851471,574
124,214
705,560
123,402
376 2 733 X73
U, 02414,356
23,740
10,390
2,713
2,828
502
9,254
1,610
$3,392274
15,601
43,225
3,131
2,805
17,080
4,398
57,037| 86,240
2 076| 2 845
28,36231,374
7,717
49,501
10,819
205,329
23,46721,340
5,726
23,265
166,549
$7,41614,630
39,341
59,615
5,844
5,633
502
26,334
6,008
143,277
4,921
51,82952, 714
13,443
72,829
10,819
371,878
89273
16
1
6
115
4
1
49
5
39188
27
117
9400
1, L96
$1,936,9115,352,946
292,367
1,970
453,395
2,83596,030
23,889
32,656
1,190
904,332
32,642
236,9072,084,854
83,279
1,134,446
29,53720
11,795,874
1 Data incomplete. (See text page 10.)

68 STATISTICS OF INCOME.
TABLE 10.—Corporation returns—Distribution by industrial groups, for States andTerritories—Continued.
ARKANSAS.
Industrial groups.
Agriculture and related in-dustries .
Mining and quarryingManufacturing:
Food products, liquors,and tobacco
Textiles and textileproducts
Leather and leatherproducts.
Rubber and rubbergoods
Lumber and wood prod-ucts
Paper, pulp, and prod-ucts
Printing and publishingChemicals and allied
substancesStone, clay, and glass
productsMetal and metal prod-
ucts.All other manufacturing
industries
Total manufacturing.ConstructionTransportation and other
public utilities iTrade .Public service—Profes-
sional, amusements, ho-tels, e tc . .
Finance, banking, insur-surance, etc . .
Combinations—Predomi-nant industry not ascer-tainable
Inactive concernsTotal
Totalnum-berof
cor-pora-tions.
133127
86
7
2
1
149
138
29
13
21
11
358
24
120789
80
651
2180
2,383
Corporations reporting net income.
Num-ber.
6238
46
4
1
48
26
10
7
8
3153
12
81360
58
505
6
1,275
Netincome.
$397,148363,915
482,657
43,616
5,062
1,379,521
214,396
88,806
51,234
40,070
45,885
2,351,247
46,983
1,003,6221,893,938
500,454
2,908,436
19,750
9,485,493
Incometax.
$25,02521,608
34,292
3,774
306
123,287
16,592
7,638
3,788
2,399
3,919
195,995
2,293
84,853129,135
39,187
195,667
1,251
695,014
Warprofits
andexcessprofits
tax.
$58,90080,785
54,197
2,223
80,303
17,414
4,048
2,195
260
2,821
163,461
946
103,23688,656
43,361
51,586
590,931
Totaltax.
$83,925102,393
88,489
5,997
306
203,590
34,006
11,686
5,983
2,659
6,740
359,456
3,239
188,089217,791
82,548
247,253
1,251
1,285,945
Corporationsreporting nonet income.
Num-ber.
7189
40
3
2
101
112
19
6
13
8
Deficit.
$571,103975,198
368,451
29,697
35,698
2,017,531
12,35238,049
552,904
119,702
130,704
137,337
205 3,442, 425
12
39429
22
146
1580
1,108
114,658
1,592,3404,756,527
34,285
525,922
124,173
12,136,631
CALIFORNIA.
Agriculture and related in-dustries 1,209 479 $5,642,659
Mining and quarrying 1,368 340 26,110,686Manufacturing:
Food products, liquors,and tobacco 583 280 11,320,006
Textiles and textileproducts 151 85 1,530,356
Leather and leatherproducts 43 26 3,575,979
Rubber and rubbergoods 22 10 168,660
Lumber and wood prod-ucts 175 101 4,296,917
Paper, pulp, and prod-ucts 36 25 2,816,132
Printing and publishing 286 209 6,020,940Chemicals and allied
substances 203 94 13,110,734Stone, clay, and glass
products 113 70 4,335,212Metal and metal prod-
ucts 458 212 2,760,600
* Data incomplete. (See text page 10.)
$444,6772,380,237
941,305
120,637
355,566
14,749
389,336
271,713455,054
1,238,084
371,710
211,896
$465,7981,714,229
1,580,628
67,548
114,839
6,624
207,428
121,6181,144,967
430,242
502,983
328,902
$910,4754,094,466
2,521,'
188,185
470,405
21,373
596,764
393,3311,600,021
1,068,326
874,693
540,798
730 $12,920,8071,028 13,019,730
303
66
17
12
74
11
77
109
43
246
14,005,252
1,189,856
645,120
269,149
2,650,873
99,623369,784
2,060,629
531,574
5,865,795

STATISTICS OF INCOME. 69
TABLE 10.—Corporation returns—Distributioii by industrial groups, for States andTerritories—Continued.CALIFORNIA—Continued.
Industrial groups
Manufacturing—Contd.All other manufacturing
industries
Total manufacturing.
ConstructionTransportation and other
public utilitiesl
TradePublic service — Profes-
sional, amusements, ho-tels, etc
Finance, banking, insur-ance, etc
Combinations — Predomi-nant industry not ascer-tainable
Inactive concerns .
Total ..
Totalnum-berof
cor-pora-tions.
313
2,383
307
7832,836
911
3,959
1421,283
15,181
Corporations reporting net income.
Num-ber.
122
1,234
182
4371,705
576
2,390
54
7,397
Netincome.
$1,822,732
51,748,268
6,121,585
24,001,41036,121,299
7,735,215
35,282,841
1,410,319
194 184,282
Incometax.
S142,796
4,512,846
350,388
2,180,5972,978,643
605,213
2,656,136
122,290
Warprofits
andexcessprofits
tax.
$237,552
4,743,331
2,253,427
1,341,4533,612,580
939,729
1,139,152
86,578
16,231,027 16. 296. 277
Totaltax.
$380,348
9,256,177
2,603,815
3,522,0506,591,223
1,544,942
3,795,288
208,868
32 527,304
Corporationsreporting nonet income.
Num-ber.
191
Deficit.
$2,613,533
1,149| 30,301,188
125
3461,131
335
1,569
881,283
7,784
2,282,084
8,626,19320,274,173
2,239,868
17,365,875
1,519,801
108,549,719
COLORADO.
Agriculture and related in-dustries .
Mining and quarryingManufacturing:
Foodproducts, liquors,and tobacco
Textiles and textileproducts
Leather and leatherproducts
Rubber and rubbergoods
Lumber and woodproducts
Paper, pulp, and prod-ucts ..
Printing and publishingChemicals and allied
substancesStone, clay, and glass
productsMetal and metal prod-
uctsAll other manufactur-
ing industries
Total manufacturing.
ConstructionTransportation and other
public utilities1
TradePublic service — Profes-
sional, amusements, ho-tels, etc . . .
Finance, banking, insur-ance, etc
Combinations — Predomi-nant industry not ascer-tainable
Inactive concerns
Total
2591,031
189
34
11
7
26
3
84
52
48
96
81631
70
2111,357
332
1,445
471,176
6,559
59172
87
17
5
1
15
1
58
16
24
29
2828 L
43
105664
196
800
20
2,340
$291,30410,092,360
1,968,579
36,406
11,539
1
117,746
3,3341,046,827
3,506,081
1,906,111
88,138
153,326
8, 838,088
191,717
3,275,3114,750,523
1,241,069
5,257,128
103,545
34,041,045
$23,613759,297
161,018
1,727
246
9,233
133
76,886
347,093
165,825
4,966
11,357778,484
11,405
315,130352,480
90,763
376,941
8,149
2,716,262
$9,9392,070,685
220,070
495
3,102
200,767
24,362
202,703
3,714
2,087
$33,5522,829,982
381,088
2,222
246
12,335
133
277,653
371,455
368,528
8,680
13,444657,300 1,435,784
11,690
16,884269,511
134,765
77,747
3,248,521
23,095
332,014621,991
225,528
454,688
8,149
5,964,783
200859
102
17
6
6
11
226
36
24
67
53
350
27
106693
136
645
271,176
4,219
$2,269,4547,258,080
15,862,493
326,987
70,458
36,837
336,356
11,664108,170
166,039
159,597
930,370
369,989
18,378,960
70,353
94,258,5695,814,941
419,896
2,537,308
3,536.744151
L34,544,456
1 Data incomplete. (See text page 10.)
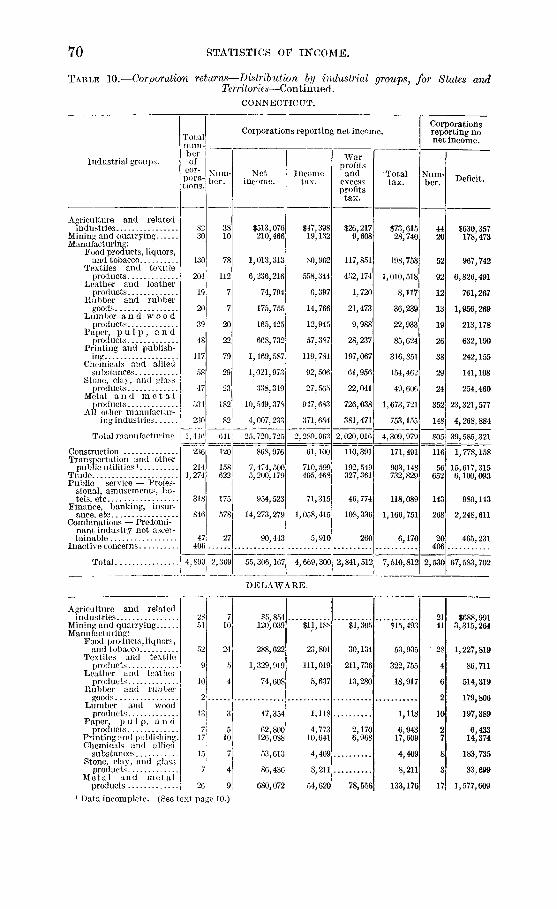
70 STATISTICS OF INCOME.
TABLE 10.—Corporation returns—Distribution by industrial groups, for States andTerritories—Continued.
CONNECTICUT.
Industrial groups.
Agriculture and relatedindustries
Mining and quarryingManufacturing:
Food products, liquors,and tobacco
Textiles and textileproducts
Leather and leatherproducts
Rubber and rubbergoods
Lumber a n d w o o dproducts
Paper, p u l p , a n dproducts
Printing and publish-ing
Chemicals and alliedsubstances
Stone, clay, and glassproducts
Metal a n d m e t a lproducts
Ail other manufactur-ing industries
Total manufacturing .
ConstructionTransportation and other
public utilities l
TradePublic service — Profes-
sional, amusements, ho-tels, etc
Finance, banking, insur-ance, etc
Combinations — Predomi-nant industry not ascer-tainable
Inactive concerns
Total .
Totalnum-berof
cor-pora-tions.
Corporations reporting net income.
ber.
130
204
19;
20
39 j
48
117
58
47
534
230
l,44f>
236
2141,274
318
846
471406 .
78
112
7
7
20
22
79
29
23
182
82
Netincome.
$513,076210,466
1,013,313
6,236,216
74,794
175,755
165,425
668,732
1,469,587
1,021,973
338,319
10,549,378
4,007,233
Incometax.
641
120
158622
175
578
27
25,720, 725
4,899 2,369
868,976
7,474,5005,200,179
954,523
14,273,279
0,443
55,306,167
$47,39819,132
80,902
558,344
6,397
14,766
12,'
57,387
119,784
92,506
27,565
947,683
371,684
2,289,963
~~6l7lOO
710,599405,468
71,315
1,058,415
5,910
4,669,300
Warprofits
andexcessprofitstax.
$26,2179,608
117,851
452,174
1,720
21,473
28,237
197,067
61,956
22,041
726,038
381,471
Totaltax.
$73,61528,740
198,758
1,010,518
8,117
36,239
22,933
85,624
316,851
154,462
49,606
1,673,721
753,155
2,020,016| 4,309,979
110,391
192,549327,361
46,774
108,336
260
2,841,512
171,491
903,148732,829
118,089
1,166,751
6,170
7,510,812
Corporationsreporting nonet income.
Num-ber.
20
52
92
12
13
19
26
38
29
24
352
148
116
56652
143
20406
2,530
Deficit.
$630,357178,473
967,742
6,826,491
761,267
1,956,269
213,178
632,190
242,155
141,108
254,460
23,321,577
4,268,884
39,585,321
1,778,158
15,617,3156,100,093
980,143
2,248,611
465,231
67,583,702
DELAWARE.
Agriculture and relatedindustries
Mining and quarryingManufacturing:
Food products, liquors,and tobacco
Textiles and textileproducts
Leather and leatherproducts
Rubber and rubbergoods
Lumber and woodproducts
Paper, p u l p , a n dproducts
Printing arid publishing.Chemicals and allied
substancesStone, clay, and glass
productsMetal and metal
products 26
10
$5,854120,039
288,622
1,329,919
74,608
17,354
62,800126,r""
53,613
86,436
680,072
$11,1SS
23,801
111,019
5,637
1,118
4,77310,641
4,409
8,211
54,620
$4,305
30,134
211,736
13,280
2,1706,968
78,556
$15,493
53,935
322,755
18,917
1,118
6,94317,609
4,409
8,211
133,176
$688,9913,315,264
1,227,819
86,711
514,319
179,806
197,389
6,43314,374
183,735
33,699
1,577,6091 Data incomplete. (See text page 10.)

STATISTICS OF INCOME. 71
TABLE 10.—Corporation returns—Distribution by industrial groups, for £Territories—Continued.
States and
DELAWARE—Continued.
Industrial groups.
Totalnum-berof
cor-pora-tions.
Manufacturing—Contd.All other manufactur-
ing industries
Total manufacturing.
ConstructionTransportation and other
public utilities l
TradePublic service — Profes-
sional, amusements, ho-tels, etc
Finance, banking, insur-ance, etc
Combinations — Predomi-nan t industry not as-certainable
Inactive concerns
Total .
Num-ber.
20
178
26
25177
59
243
12119
Corporations reporting net income.
27.
141
Netincome.
Incometax.
$328,396} $30,897
Warprofits
andexcessprofits
tax.
$8,220
3,047,908 255,126; 351,064
180,852
22,302474,090
95,888
2,063,060
14,515; 14,110
54," 905977
33,955
6,307
161,378
46,790l 3,6
3,433
27,576
1,308'
Totaltax.
$39,117
Corporationsreporting nonet income.
Num-ber, i Deficit.
10 $629,1
606,190 97 4,650,922
28,
SS,
188,
621
11920,975
75
918 383 6,056,783 487,134 456,701 943,8351 535! 13,526,704
15
1488
32
102
38,645
845,736808,984
482,031
2,675,081
DISTRICT OF COLUMBIA.
Agriculture and related in-dustries . . .
Mining and quarryingManufacturing:
Food products, liquors,and tobacco
Textiles and textileproducts
Leather and leatherproducts
Rubber and rubbergoods
Lumber and wood prod-ucts
Paper, pulp, and prod-ucts .
Printing and publishing.Chemicals and allied
substances -Stone, clay, and glass
productsMetal and metal prod-
uctsAll other manufactur-
ing industries
Total manufacturing.
ConstructionTransportation and other
public util i t ies1
TradePublic service—Profes-
sional, amusements, ho-tels, etc
Finance, banking, insur-ance, etc
Combinations—Pred o m i -nant industry not ascer-tain able
Inactive concerns
Total
1028
37
10
2
5
357
20
7
26
23
190
60
70350
172
271
899
1,258
33
22
7
1
4
234
9
6
13
6
104
41
41215
124
181
4
716
1
1
2
4
9
3
20
$4-142
, 2 2 5
18
27,
160,, 1 2 2 ,
93
181,
64,
15,
, 9 1 0 ,
414
,915. ,593
, 4 3 3
637
?1P
, 2 1 1 ,
364031
126
030
895
781
178950
104
9S1
768
883
696
482
42038<>
630
9^6
960
$43 ,
105,
1,
14,87,
7,
14,
3,
2,36,
29,
535,383,
204
284,
19,
1,701,
398507
680
840
812
1W765
040
84?
847
802
750
184
285?6?
308
9?7
486
107
$2,1121,294
120,790
183
3,062
15,199195,950
16 757
38,517
2,530
1,265
394,253
58,134
338,857498,672
258 819
143,990
24,268
1,720.399
$64,
226,
1,
4,
29283,
23
53,
6
631,
87,
874,881,
463
428
43
3, 121,
801
470
023
874
3^1715
797
3W
377
067
003
318
142934
197
917
7v4
506
725
15
3
1
1
123
11
1
13
17
86
19
29135
48
90
499
542
1,
7,1
1,
11,
$37,226482,629
130,578
65,713
1,188
7,066
116 427127,538
29 697
259
614 543
186,230
279 239
129,138
433,6SS018,935
315 536
081,316
34 717
812,424
1 Data incomplete. (See text page 10.)

72 STATISTICS OF INCOME.
TABLE 10.—Corporation returns—Distribution by industrial groups, for /States andTerritories—Continued.
FLORIDA.
Industrial groups.
Agriculture and related in-dustries
Mining and quarryingManufacturing:
Food products, liquors,and tobacco
Textiles and textileproducts
Leather and leatherproducts ..
Rubber and rubbergoods
Lumber and wood prod-ucts
Paper, pulp, and prod-ucts...
Printing and publishing.Chemicals and allied
substancesStone, clay, and glass
productsMetal and metal prod-
uctsAll other manufactur-
ing industries
Total manufacturing.
ConstructionTransportation and other
public utilitiesl
TradePublic service—Profes-
sional, amusements, ho-tels, etc .
Finance, banking, insur-ance, etc
Combinations—Pre domi-nant industry not ascer-tainable
Inactive concerns
Total. ..
Totalnum-berof
cor-pora-tions.
23629
130
8
1
130
72
66
23
34
34
498
57
159823
207
1,067
43353
3,472
Corporations reporting net income.
Num-ber.
769
74
2
55
45
17
14
16
17
240
33
93446
123
610
16
1,646
Netincome.
$420,58298,556
567,584
3,410
1,104,921
378,297
274,678
48,816
87,310
94,346
2,559,362
217,609
4, 757,7073,651,957
688,351
3,627,113
145,121
16,166,358
Incometax.
$32,4548,634
43,664
76
96,650
29,657
24,166
3,049
5,816
7,043
210,121
16,961
410,105281,029
44,986
229,185
12,422
1,245,897
Warprofits
andexcessprofitstax.
$16,2113,172
33,243
52,367
27,379
22,653
779
6,357
313
143,091
6,342
416,598242,065
40,313
111,161
1,569
980,522
Totaltax.
$48,66511,806
76,907
76
149,017
57,036
46,819
3,828
12,173
7,356
353,212
23,303
826,703523,094
85,299
340,346
13,991
2,226,419
Corporationsreporting nonet income.
Num-ber.
16020
56
6
1
75
27
49
9
18
17
258
24
66377
84
457
27353
1,826
Deficit.
$1,704,529143,818
1,023,111
75,838
1,582
3,045,201
69,116
458,320
61,140
136,612
320,665
5,191,585
502,072
1,329,7463,729,622
330,241
2,776,700
358,537
16,066,850
GEORGIA.
Agriculture and related in-dustries
Mining and quarryingManufacturing:
Food products, liquors,and tobacco
Textiles and textileproducts
Leather and leatherproducts
Rubber and rubbergoods
Lumber and woodproducts
P a p e r , p u l p , andproducts
Printing and p ublishing.Chemicals and alliedsubstancesStone, clay, and glass
productsMeta l and m e t a l
products1 Data incomplete. (See text page 10.)
17841
189
170
10
6
145
1577
134
63
62
5815
105
74
4
1
66
543
30
28
19
$4,27148,916
611,474
1,095,628
26,017
111,774
17,37352,306
15,846
52,715
13,659
12026
84
96
6
5
79
1034
104
35
43
$716,032261,298
931,845
7,258,924
82,347
156,313
3,055,070
409,368270,703
2,976,825
284,926
2,055,460
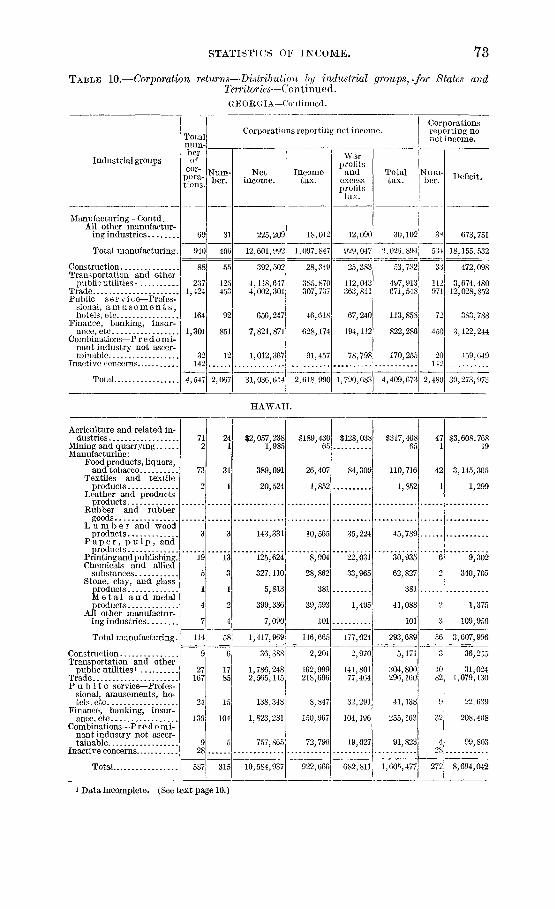
STATISTICS OF INCOME. 73
TABLE 10.—Corporation returns—Distribution by industrial groups,*for Slates andTerritories—Continued.G E O R GI A—C ontinued.
Industrial groups
Manufacturing—Contd.All other manufactur-
ing industries
Total manufacturing.
Construction.Transportation and other
public utilities *TradePublic service—Profes-
sional, a m u s e m e n t s ,hotels, etc
Finance, banking, insur-ance, etc. . .
Combinations—P redomi-nant industry not ascer-tainable.
Tnactive concerns
Total
Totalnum-berof
cor-pora-tions.
69
940
88
2371,424
164
1,301
32142
4,547
Corporations reporting net income.
Num-ber.
31
406
55
125453
92
851
12
2,067
Netincome.
225,209
Incometax.
18,012
12,601,992 1,097,847
392 502i 2£ 349
4,118,6474,002,301
656,247
7,821,871
1,012,367
31,036,614
385,870307,737
46,618
628,174
91,457
2,618,990
Warprofits
andexcessprofits
tax.
12,090
929,047
25,383
112,043363,811
67,240
194,112
78,798
1,790,683
Totaltax.
30,102
Corporationsreporting nonet income.
Num-ber.
38
:>, 020, 894 534
53 732 3:1
497,913671,548
113,858
822,286
170,255
4,409,673
112971
72
450
20142
2,480
Deficit.
673,751
18,155,532
472,098
3,674,48012,028,852
383,788
3,122,244
459,649
39,273,973
HAWAII.
Agriculture and related in-dustries .
Mining and quarryingManufacturing:
Food products, liquors,and tobacco
Textiles and textileproducts
Leather and productsproducts
Rubber and rubbergoods..
L u m b e r and woodproducts.
P a p e r , p u l p , andproducts
Printing and publishing.Chemicals and allied
substances...Stone, clay, and glass
products.M e t a l a n d metalproducts.
All other manufactur-ing industries
Total manufacturing.
Construction.Transportation and other
public utilities1 .TradeP u b l i c service—Profes-
sional, amusements, ho-tels, etc . .
Finance, banking, insur-ance etc
Combinations—P redomi-nant industry not ascer-tainable
Inactive concerns
Total
712
73
2
3
19
5
1
4
7
114
9
27167
24
136
928
587
241
31
1
3
13
3
1
2
4
58
6
1785
15
104
5
315
$2,057,2381,985
389,091
20,524
143,331
125,624
327,110
5,813
399,386
7,090
1,417,969
36,888
1,786,2482,565,115
138,348
1,823,281
757,865
10,584,937
$189,43065
26,407
1,852
10,565
8,904
28,862
381
39,593
101
116,665
2,201
162,999218,696
8,847
150,967
72,796
922,666
$128,038
84,309
35,224
22,031
33,965
1,495
177,024
2,970
141,80177,464
32,291
104,196
19,027
682,811
$317,46865
110,716
1,852
45,789
30,935
62,827
381
41,088
101
293,689
5,171
304,800296,160
41,138
255,163
91,823
1,605,477
471
42
1
6
3
56
3
10
9
428
272
$3,608,76819
3,145,365
1,299
9,302
340,705
\s 375
109,950
3,607,996
36,255
31,0241,079,130
22.639
208,408
99,803
8,694,042
i Data incomplete. (See text page 10.)

74 STATISTICS OF INCOME.
TABLE 10.—Corporation returns—Distribution by industrial groups, for States andTerritories—Continued..
IDAHO,
Industrial groups.
Agriculture and related in-dustries
Mining and quarryingManufacturing:
Food products, liquors,and tobacco
Textiles and textileproducts
Leather and leatherproducts
Rubber and rubbergoods
Lumber and woodproducts
Paper, pulp, and prod-ucts
Printing and publishingChemicals and allied
substancesStone, clay, and glass
productsMetal and metal prod-
uctsAll other manufactur-
ing industries
Total manufacturing.
ConstructionTransportation and other
public utilitiesl
Trade ..Public service — Profes-
sional, amusements, ho-tels, etc
Finance, banking, insur-ance, etc
Combinations — Predomi-nant industry not ascer-tainable.
Inactive concerns
Total
Totalnum-berof
cor-pora-tions.
118305
58
1
3
2
40
1
27
5
9
5
4155
12
108467
91
377
1261
1,706
Corporations reporting net income.
Num-ber.
2527
26
1
2
12
115
4
3
2
2
68
6
47182
49
192
5
601
Netincome.
863,030147,030
56,109
1,602
2,914
85,622
2,89444,866
268,813
6,308
41,494
2,311
512,933
7,728
208,158534,094
121,169
625,890
9,179
2, 229,211
Incometax.
$3.6/87,875
2,007
44
81
6,939
892,698
20,593
147
3,846
2
36,446
147
14,35627,005
5,362
27,656
320
122,845
Warprofits
andexcessprofitstax.
$61
400
56,720
57,120
7,7274,016
790
10,750
80,464
Totaltax.
$3,6787,936
2,007
44
81
6,939
893,098
77,313
147
3,846
2
93,566
147
22,08331,021
6,152
38,406
320
203,309
Corporationsreporting nonet income.
Num-ber.
93278
32
1
2
28
12
1
6
3
2
87
6
61285
42
185
761
1,105
Deficit.
$2,885,9481,058,451
160,630
114
946
2,355,392
21,906
20,781
26,649
708
702
2,587 828
120,184
448,9981,883,485
83,323
1,189,465
51,698
10,309,380
ILLINOIS.
Agriculture and related in-dustries 220 103 $406,128
Mining and quarrying 611 186 12,645,118Manufacturing:
Food products, liquors,and tobacco 888 480 37,857,382
Textiles and textileproducts 734 333 10,706,769
Leather and leatherproducts 126 47 2,201,830
Rubber and rubbergoods 31 8 140,044
Lumber and woodproducts 405 230 4,697,901
Paper, pulp, and prod-ucts 124 54 1,637,604
Printing and publishing 914 611 15,496,546Chemicals and allied
substances 495 228 21,458,296Stone, clay, and glass
products 264 145 5,303,775Metal and metal prod-
ucts 1,693 612 37,479,3421 Data incomplete. (See text page 10.)
f
$28,8391,037,878
3,333,364
907,770
178,356
10,993
396,536
127,4121,251,090
1,947,330
452,596
3,369,755
$8,4701,872,670
3,565,007
1,030,622
325,291
16,500
397,935
253,4772,159,958
1,677,686
511,638
2,061,772
$37,3092,910,548
6,898,371
1,938,392
503,647
27,493
794,471
380,8893,411,048
3,625,016
964,234
5,431,527
117425
408
401
79
23
175
70303
267
119
1,081
$3,935,1749,685,109
74,872,343
12,028,445
2,514,341
421,422
7,555,813
1,733,4812,535,284
4,387,921
1,448,643
73,495,516

STATISTICS OF USTCOMK. 75
TABLE 10.—Corporation returns—Distribution by industrial groups, for States
Territories—Continued.and
ILLINOIS—Continued.
Industrial groups.
Manufacturing—Contd.All other manufactur-
ing industries
Total manufacturing.
ConstructionTransportation and other
public utilities2
TradePublic service — Profes-
sional, amusements, ho-tels, etc
Finance, banking, insur-ance, etc
Combinations — Predomi-nant industry not ascer-tainable
Inactive concerns
Total
Totalnum-berof
cor-pora-tions.
1,329
7,003
1,1416, 272
1,734
3,200
1611,301
Corporations reporting net income.
Num-ber.
3,367
452
713,069
1,003
2,422
65
Net
$20,380,669
157,360,158
78,804,44154,214,631
10,188,878
56,181,436
4,626,714
Incometax.
$1,755,474 Si, 813,115
13,730,676 13,813,001
491,649
7,541,1104,459,874
796,037
4,626,253
394,131
Warproiits
andexcessprofits
tax .
1,112,953
1,970,9665,053,782
881,951
2,907,098
581, 240
22,396 11,384 381,144,453 33,106,447J28,202,131 61,308,578J11,012 357,312,053
Totaltax.
$3,568,589
27,543,677
1,604,602
9,512,0769,513,656
1,677,988
7,533,351
975,371
Corporationsreporting nonet income.
Num-ber.
10 $20,620,507
424,203
731
778
1,301
Deficit.
3.636 201,613,716
301 2,720,395
32,345,97373,659,361
4,421,063
20,847,360
8,083,560342
INDIANA.
Agriculture and related in-dustries
Mining and quarryingManufacturing:
Food products, liquors,and tobacco
Textiles and textileproducts
Leather and leatherproducts
Rubber and rubbergoods
Lumber and woodproducts
Paper, pulp, and prod-ucts
Printing and publishingChemicals and allied
substancesStone, clay, and glass
productsMetal and metal prod-
uctsAll other manufactur-
ing industries
110333
416
94
23
23
309
46113
213
47
8
5
161
208
136
151
61
168 106
523! 165
350| 140
Total manufacturing.
ConstructionTransportation and other
public utilities1
TradePublic service — Profes-
sional, amusements, ho-hotels, etc
Finance, banking, insur-ance, etc
Combinations — Predomi-nant industry not aseer-tainable
Inactive concerns
Total.
2,284
257
5732,302
512
2,259
9,397
$118,1992,332,929
5,521,302
1,574,719
41,089
238,699
3,686,204
390, 2942,328,793
1,711,160
2,884,996
20,449,018
2,995,522
l,072| 41,821, 796j
$6,661176, 736
463,936
115,863
2,511
17,719
305,284
32,551181,352
147,714
237,032
1, 808,156
259,934
3,572,052
174
3941,1.
1,686,510] 124,757
6,513,646'8,594,028|
557,214643,133
299|
1,726
4,991
1,507,148
14,230,486
363,406
$1,659333,046
554,110
210,900
5,563
53,066
393,618
20,805
278,806|
159,507
275,482
2,156,957
261,6634,370,477
S8,320509,782
1,018,046
326,763
8,074
70,785
698,902
53,356460,158
307,221
512,514
3,965,113
521,597
64220
203
47
15
18
148
19
57
75
62
358
210
$384,4984,662,608
3,349,003
770, 821
625,007
778,272
3,097,022
887,265381,525
1,351,842
1,001,840
24,953,171
4,701,597
199,601; 324,358
7,942,529| 1, 212J 41,897,365
83
427.874!539', 040!
985,0881,182,173
105,460 84,426' 189,886
1,046,038
32,160
244,696; 1,290,734
12,820 44,980
77,168,148 6,264,211] 6,213,639! 12,477,850
625, 353
1, 796,9911,152 10,458,990
179
21
533
729
4,406
633,375
5,762,172
776,337
66,997,689
J Data incomplete. (See text page 10.)
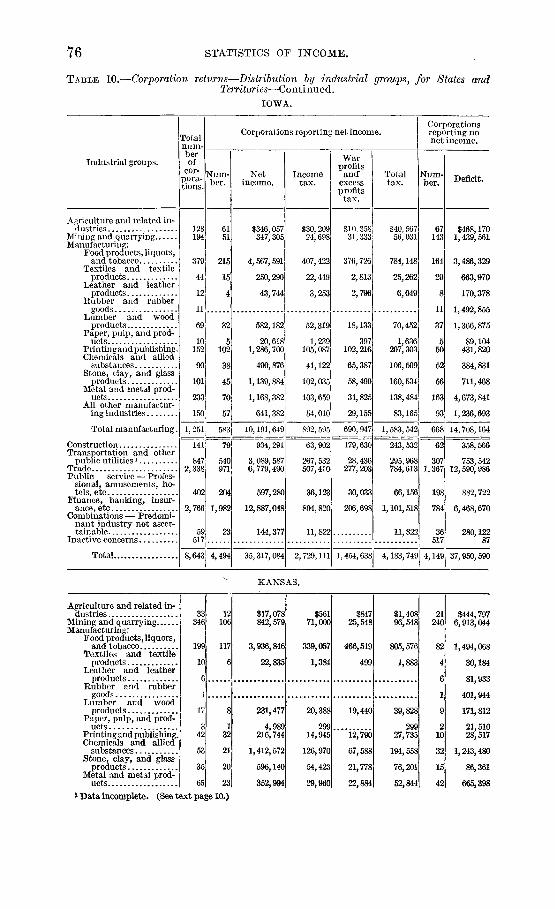
76 STATISTICS OF INCOME.
TABLE 10.—Corporation returns—Distribution by industrial groups, for States and
Territories—Continued.IOWA.
Industrial groups.
Agriculture and related in-dustries
Mining and quarryingManufacturing:
Food products, liquors,and tobacco
Textiles and textileproducts
Leather and leatherproducts
Rubber and rubbergoods
Lumber and woodproducts
Paper, pulp, and prod-ucts
Printing and publishing.Chemicals and allied
substancesStone, clay, and glass
productsMetal and metal prod-
uctsAll other manufactur-
ing industries
Total manufacturing.
ConstructionTransportation and other
public utilities1
TradePublic service — Profes-
sional, amusements, ho-tels, etc. .
Finance, banking, insur-ance , etc
Combinations — Predomi-nant industry not ascer-tainable.
Inactive concerns
Total
Totalnum-berof
cor-pora-tions.
128194
379
44
12
11
69
10152
90
101
233
150
Corporations reporting net income.
Num-ber.
6151
215
15
32
5102
38
45
70
57
l,25l! 583
Netincome.
$346,057347,305
4,567,591
250,290
43,744
582,182
20,6181,286,700
490,876
1,139,884
1,168,382
641,382
10,191,649
141 7Q! 934 291
8472,338
402
2,766
59517
8,643
540971
204
1,982
23
4,494
3,089,5876,779,490
597,280
12,887,048
144,377
35,317,084
Incometax.
S30,20924,698
407,422
22,449
3,253
52,319
1,239105,087
41,122
102,035
103,659
54,010
892,595
63,902
267,532507,410
36,123
894,820
11,822
2,729,111
Warprofitsand"
excessprofitstax.
$10,35831,333
376,726
2,813
2,796
18,133
397102,216
65,387
58,499
34,825
29,155
690,947
179,630
28,436277,203
30,033
206,698
1,454,638
Totaltax.
$40,56756,031
784,148
25,262
6,049
70,452
1,636207,303
106,509
160,534
138,484
83,165
1,583,542
243,532
295,968784,613
66,156
1,101,518
11,822
4,183,749
Corporationsreporting nonet income.
Num-ber.
67143
164
29
8
11
37
550
52
56
163
93
668
62
3071,367
198
784
36517
4,149
Deficit.
$468,1701,439,561
3,486,329
663,970
170,378
1,492,855
1,366,875
89,104431,820
384,831
711,468
4,673,841
1,236,693
14,708,164
358,566
753,54212,590,986
882,722
6,468,670
280,12287
37,950,590
KANSAS.
Agriculture and related in-dustries
Mining and quarryingManufacturing:
Food products,liquors,and tobacco
Textiles and textileproducts
Leather and leatherproducts
Rubber and rubbergoods
Lumber and woodproducts
Paper, pulp, and prod-ucts
Printing and publishing.Chemicals and allied
substances ,Stone, clay, and glass
productsMetal and metal prod-
ucts1 Data incomplete. (See text page 10.)
33346
199
10
6
1
17
342
53
35
65
12106
117
6
8
132
21
20
23
$17,078842,579
3,936,846
22,835
231,477
4,989216,744
1,412,572
596,140
352,994
$56171,000
339,057
1,384
20,388
29914,945
126,970
54,423
29,960
25,548
466,519
499
19,440
12,790
67,588
21,778
22,884
$1,40896,548
805,576
1,8
29927,735
194,558
76,201
52,844
240
82
4
6
1
9
210
32
15
42
$444,7976,913,044
1,494,068
30,184
81,933
401,944
171,812
21,51028,517
1,243,480
86,361

STATISTICS OF INCOME. 77
TABLE 10.—Corporation returns—Distribution by industrial groups, for States andTerritories—C ontinue d.
KANSAS—Continued.
Industrial groups.
Manufacturing—Contd.All other manufactur-
ing industries
Total manufacturing.
ConstructionTransportation and other
public utilities 1
TradePublic service — profes-
sional, a m u s e n e n t s ,hotels, etc .
Finance, banking, insur-ance etc
Combinations — predomi-nant industry not ascer-tainable
Inactive concerns
Total
Totalnum-berof
cor-pora-tions.
47
478
46
4061,541
146
1,545
25183
4,749
Corporations reporting net income.
Num.,ber."
12
240
26
278844
85
1,252
9
2,852
Netincome.
$254,050
7,028,647
149,233
68,434,4094,154,641
367,610
6,537,039
18,357
87,549,593
Incometax.
$22,265
609,691
10,365
6,084,853277,286
33,992
416,513
798
7,505,059
Warprofits
andexcessprofitstax.
$17,836
629,334
16,770
6,534,042191,558
26,177
171,832
7,596,108
Totaltax.
$40,101
1,239,025
27,135
12,618,895468,844
60,169
588,345
798
15,101,167
Corporationsreporting nonet income.
Num-ber.
35
238
20
128697
61
293
16183
1,897
Deficit.
$720,498
4,945,705
205,581
841,3185,147,082
174,632
2,285,574
1,289,787
22,247,.52O
KENTUCKY.
Agriculture and related in-dustries
Mining and quarryingManufacturing:
Food products, liquors,and tobacco
Textiles and textileproducts
Leather and leatherproducts
Rubber and rubbergoods
Lumber and woodproducts
Paper, pulp, and prod-
Printing and publishing.Chemicals and allied
substancesStone, clay, and glass
productsMetal and metal prod-
uctsAll other manufactur-
ing industriesTotal manufacturing.
ConstructionTransportation and other
public utilities *TradePublic service — profes-
sional, amusemen t s ,hotels, etc
Finance, banking, insur-ance, etc
Combinations — predomi-nant industry not ascer-tainable
Inactive concernsTotal
28580
300
58
19
4
119
4105
82
51
129
89960
89
3321,124
255
991
63335
4,757
10181
181
34
8
2
59
76
41
38
42
41522
58
200635
156
826
29
2,617
$7,6512,628,735
3,020,653
605,491
176,887
3,475
1,695,588
648,514
3,699,124
697,962
1,239,296
680,305
12,467,295279,307
2,616,6614,422,723
1,970,488
7,278,380
206,352
31,877,592
$54199,198
223,821
51,591
15,729
117
145,362
48,257
321,529
58,812
106,294
57,204
1,028,71619,136
227,258324,439
156,206
525,304
17,941
2,498,252
$332,363
203,534
46,205
13,355
152,416
63,643
484,064
52,698
95,157
53,8171,164, 889
10,311
117,400210,021
253,050
178,028
7,436
2,273,498
$54531,561
427,355
97,796
29,084
117
297,778
111,900
805,593
111,510
201,451
111,0212,193,605
29,447
344,658534,460
409,256
703,332
25,377
4,771,750
18399
119
24
11
2
60
429
41
13
87
48438
31
132489
99
165
34335
2,140
$167,08012,271,278
1,737,246
268,703
402,585
177,287
1,534,152
8,056115,196
1,466,258
114,124
4,492,955
2,596,28512,912,8473,166,181
835,0873,664,716
185,689
521,595
582,16039
34,306,672
1 Data incomplete. (See text page 10.)
60729°— 23 6

78 STATISTICS OF INCOME.
TABLE 10.—Corporation returns—Distribution by industrial groups, for States andTerritories—Continued.
LOUISIANA.
Industrial groups.
Agriculture and related in-dustries
Mining and quarryingManufacturing:
Food products, liquors,and tobacco
Textiles and textileproducts
Leather and leatherproducts
Rubber and rubbergoods
Lumber and woodproducts
Paper, pulp, and prod-ucts
Printing andpub lishingChemicals and allied
substancesStone, clay, and glass
productsMetal and metal prod-
uctsAll other manufactur-
ing industries
Total manufacturing.
ConstructionTransportation and other
public utilities J
Trade . .Public service—profes-
sional, amusements, ho-tels, etc.. .
Finance, banking, insur-ance, etc.. . .
Combinations — predomi-nant industry not ascer-tainable
Inactive concerns
Total
Totalnum-berof
cor-pora-tions.
276205
255
37
6
2
229
873
86
20
70
44
830
97
2081,267
169
945
43430
4,470
Corporations reporting net income.
Num-ber.
8574
123
20
2
1
94
145
20
13
32
19
370
55
118623
115
596
17
2,053
Netincome.
$384,861609,261
1,991,746
751,348
28,769
49
4,334,771
434573,095
140,618
85,648
259,631
153,080
8,319,189
379,451
3,302,8576,752,349
983,418
6,323,450
70,164
27,125,000
Incometax.
$26,81049,696
153,893
69,066
2,171
393,489
41,561
10,328
6,425
20,442
13,176
710,551
26,210
263,001558,239
71,970
502,680
4,710
2,213,867
Warprofits
andexcessprofitstax.
$23,15834,599
294,430
56,314
2,959
178,847
92,857
9,696
9,078
11,712
4,590
660,483
41,538
80,607425,645
123,878
300,658
1,502
1,692,068
Totaltax.
$49,96884,295
448,323
125,380
5,130
572,336
134,418
20,024
15,503
32,154
17,766
1,371,034
67,748
343,608983,884
195,848
803,338
6,212
3,905,935
Corporationsreporting nonet income.
Num-ber.
191131
132
17
4
1
135
728
66
7
38
25
460
42
90644
54
349
26430
2,417
Deficit.
$4,294,3824,594,463
8,395,029
244,386
62,439
64
5,723,507
185,01350,504
1,907,188
38,676
450,030
487,388
17,544,224
459,805
2,290,4537,707,531
453,614
2,443,670
342,845363
40,131,350
MAINE.
Agriculture and related in-dustries .
Mining and quarryingManufacturing:
Food products, liquors,and tobacco
Textiles and textileproducts
Leather and leatherproducts
Rubber and rubbergoods
Lumber and wood prod-ucts
Paper, pulp, and prod-ucts
Printing and publishingChemicals and allied
substancesStone, clay, and glass
productsMetal and metal prod-
ucts* Data incomplete. (See text page 10,N
9273
106
64
43
136
1559
35
14
64
3814
32
40
24
44
842
16
9
29
$345,008312,333
375,536
5,195,719
2,925,864
311,464
5,416,132399,907
185,609
35,246
413?992
$27, 80129,264
29,302
420,148
250,478
23,457
478,38129,765
12,451
2,340
33,101
$19,7543,722
37,481
876,391
466,455
19,114
562,43149,236
48,112
576
31,670
$47,55532,986
66,783
1,296,539
716,933
42,571
1,040,81279,001
60,563
2,916
64,771
$8,815,173976,056
8,699,744
877,036
496,295
3,500,532
372,662102,772
3,158,180
39,059
446,042
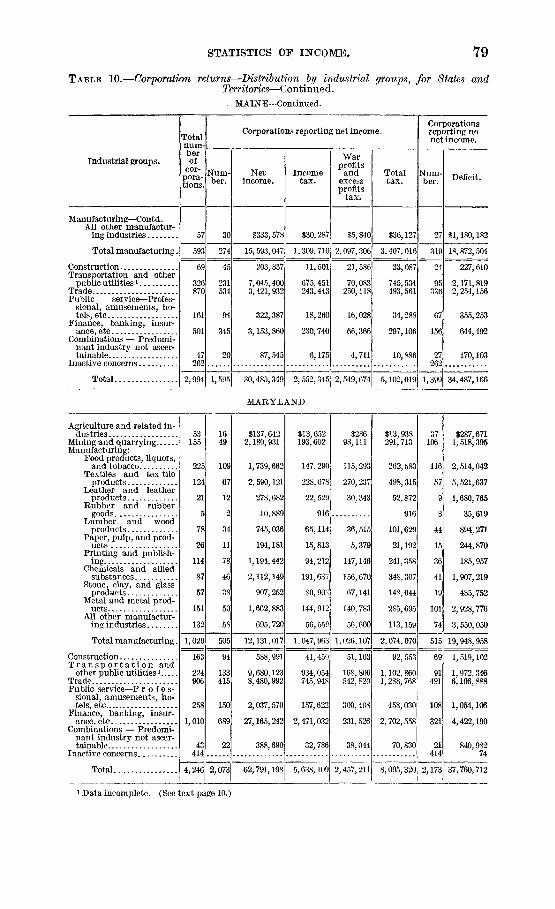
STATISTICS OF INCOME. 79
TABLE 10.—Corporation returns—Distribution by industrial groups, for States andTerritories—Continued.
MAINE—Continued.
Industrial groups.
Manufacturing—Contd.All other manufactur-
ing industries
Total manufacturing.
Construction.Transportation and other
public utilities 1TradePublic service—Profes-
sional, amusements, ho-tels, etc
Finance, banking, insur-ance, etc...
Combinations — Predomi-nant industry not ascer-tainable
Inactive concerns
Total
Totalnum-berof
cor-pora-tions.
57
593
69
326870
161
501
47262
2,994
Corporations reporting net income.
Num-ber.
30
274
45
231534
94
345
20
1,595
Netincome.
$333,578
15,593,047
203,837
7,045,4003,421,932
322,387
3,153,860
87,545
30,485,349
Incometax.
$30,287
1,309,710
11,501
675,451243,443
18,260
230,740
6,175
Warprofits
andexcessprofits
tax.
$5,840
2,097,306
21,586
70,083250,118
16,028
66,366
4,711
2,552,345 2,549,674
Totaltax.
$36,127
3,407,016
33,087
745,534493,561
34,288
297,106
10,886
5,102,019
Corporationsreporting nonet income.
Num-ber.
27
319
24
95336
67
156
27262
1,399
Deficit.
$1,180,182
18,872,504
227,610
2,171,8192,254,156
355,253
644,492
170,103
34,487,166
M A R Y L A N D .
Agriculture and related in-dustries
Mining and quarryingManufacturing:
Food products, liquors,and tobacco
Textiles and tex tileproducts
Leather and leatherproducts
Rubber and rubbergoods
Lumber and woodproducts
Paper, pulp, and prod-ucts
Printing and publish-ing
Chemicals and alliedsubstances
Stone, clay, and glassproducts
Metal and metal prod-ucts
All other manufactur-ing industries
Total manufacturing
ConstructionT r a n s p o r t a t i o n and
other public utilities:
TradePublic service—P ro fe s -
sional, amusements, ho-tels, etc
Finance, banking, insur-ance, etc
Combinations — Predomi-nant industry not ascer-tainable
Inactive concerns
Total.
53155
225
124
21
5
78
26
114
87
57
151
132
1,020
224906
258
1,010
43414
4,246
109
67
12
2
34
11
78
46
38
50
58
505
133415
150
689
22
2,073
$137,6422,180,931
1,739,662
2,590,121
278,682
10,:
745,036
194,181
1,194,442
2,112,149
907,252
1,662,883
695,720
12,131,017
588,991
9,680,1238,480,992
2,037,570
27,165,242
388,690
62,791,1
$13,652193,602
147,290
228,07S
22,529
916
65,114
15,813
94,212
191,637
80,903
144, 912
56,559
1,047,963
41,450
934,054745,948
157,622
2,471,032
32,786
5,638,109
$28698,111
115,293
270,237
30,343
36,515
5,379
147,146
156,670
67,141
140,783
56,600
1,026,107
51,103
168,80(3542,820
300,408
231,526
38,044
2,457,211
$13,938291,713
262,583
498,315
52,872
916
101,629
21,192
241,358
348,307
148,044
285,695
113,159
2,074,070
92,553
1,102,8601,288,768
458,030
2,702,558
70,830
8,095,320
37106
116
57
9
44
15
36
41
19
101
74
515
91491
108
321
21414
2,173
$287,6711,518,395
514,042
,521,637
680,765
35,619
894,271
244,870
185,957
907,219
485,752
928,776
,550,050
19,948,958
1,519,102
972,346196,888
1,054,106
4,422,190
840,98274
37,760,712
i Data incomplete. (See text page 10.)

80 STATISTICS OF INCOME.
TABLE 10.—Corporation returns—Distribution by industrial groups, for States andTerritories.—Continued.
MASSACHUSETTS. .
Industrial groups.
Totalnum-berof
cor-pora-tions.
Num-ber.
Corporations reporting net income.
Netincome.
Incometax.
Warprofits
andexcessprofitstax.
Totaltax.
Num-ber.
Corporationsreporting nonet income.
Deficit.
Agriculture and related in-dustries.
Mining and quarryingManufacturing:
Food products, liquors,and tobacco
Textiles and textileproducts
Leather and leatherproducts
Kubber and rubbergoods
Lumber and woodproducts
Paper, pulp, and prod-ucts
Printing and publishingChemicals and allied
substancesStone, clay, and glass
productsMetal and metal prod-
uctsAll other manufactur-
ing industries
Total manufacturing
ConstructionTransportation and other
public utilities l
TradePublic service—P r o f e s -
sional, amusements, ho-tels, etc
Finance, banking, insur-ance, etc
Combinations — Predomi-nant industry not ascer-tainable
Inactive concerns
265234
385
883
636
74
191
185427
314
120
954
716
12461
174
491
289
31
95
59272
143
57
351
309
$16,244,5189,315,948
9,684,174
54,218,097
10,533,432
1,253,585
1,966,098
6,949,6,272,803
10,283,897
402,283
33,559,274
7,725,820
$1,494,675 $1,057,233850,172
791,708
4,836,956
856,676
105,327
171,208
626,206522,661
838,128
29,125
2,950,643
799,888
634,385
1,552,898
4,460,018
1,468,567
128,314
121,500
408,204709,857
1,888,134
29,862
3,627,904
653,771
$2,551,9081,484,557
2,344,606
9,296,974
2,325,243
233,641
292,708
1,034,4101,232,518
2,726,262
58,987
6,578,547
1,453,659
141173
211
392
347
43
96
126155
171
63
603
407
$2,885,1888,714,240
5,460,318
34,115,425
39,940,570
11,232,479
2,188,860
8,623,2051,898,991
6,415,495
3,740,810
29,431,814
10,831,764
4,885 2,271 142,849,454 12,528,526 15,049,029 27,577,555 2,614153,879,731
554
6064,151
936
2,178
115913
3912,094
520
1,414
39
2,041,456
27,938,55?31,974,831
6,934,071
39,477,577
1,034,133
150,670
2,754,5392,565,235
557,869
3,473,492
89,554
154,043
297,6553,660,378
772,079
748,306
101,373
304,713
3,052,1946,225,613
1,329,948
4,221,798
190,927
269
2152,057
416
764
76913
3,313,736
8,048,83825,221,630
3,053,963
44,704,569
668,052
Total. 14,837 7,199 277,810,546 24,464,732 22,474,481 46,939,213 7,638 250,489,947
MICHIGAN.
Agriculture and relatedindustries
Mining and quarryingManufacturing:
Food products, liquors,and tobacco
Textiles and textileproducts
Leather and leatherproducts
Rubber and rubbergoods
Lumber and woodproducts
Paper, pulp, and prod-ucts
Printing and publishingChemicals and allied
substancesStone, clay, and glass
productsMetal and metal prod-
ucts ,
28°154
440
120
4 2
H318
71293
147
110
1,089
10849
201
51
10
2
114
23
185
65
57
316
$1,585,9221,297,761
8,777,261
1,405,358
236,126
16,902
4,825,598
2,062,7666,265,428
8,807,394
2,178,256
139,002,184
$130,448115, T '
713,789
119,765
20,993
1,357
420,167
174,921432,216
769,600
177,965
$100,174108,880
1,228,986
152,404
22,954
505,297
204,5711,649,283
797,047
320,543
10,168,073 32,498,794
$230,622224,763
,942,775
272,169
43,947
1,357
925,464
379,492,081,499
,566,647
498,508
,666,867
174105
239
69
32
11
204
48108
82
53
773
$1,234,4473,034,950
7,948,660
2,159,362
4,365,931
95,538
8,947,023
3,932,650908,721
1,341,768
474,667
92,772,001
i Data incomplete. (See text page 10.)

STATISTICS OF INCOME. 81
TABLE 10.—Corporation returns—Distribution by industrial groups, for States andTerritories—Continued.
MICHIGAN—Continued.
Industrial groups.
Manufacturing—Contd.All manufacturing in-
dustries ,
Totalnum-berof
cor-pora-tions.
413
Total manufacturing.
ConstructionTransportation and other
public utilitiesl
TradePublic service—P rofes -
sional, amusements, ho-tels, etc
Finance, banking, insur-ance, etc
Combinations — Predomi-nant industry not ascer-tainable
Inactive concerns
Total..
Num-ber.
3,056
383
4562,833
576
2,731
66889
11,426
Corporations reporting net income.
161
1,185
211
2761,277
292
1,786
25
5,209
Net
$9,429,229
183,006,502
2,286,456
11,662,42917,989,190
2,507,743
30,780,649
187,764
251,304,416
Incometax.
Warprofits
andexcessprofitstax.
$752,199 $1,617,422
13,751,045 38,997,301
156,258
1,102,2791,493,672
191,767
2,084,148
12,123
422,304
198,7431,500,326
210,907
1,239,352
33,479
19,037,623 42,811,466
Totaltax.
$2,369,621
52,748,346
578,562
1,301,0222,993,998
402,674
3,323,500
45,602
61,849,089
Corporationsreporting nonet income.
Num-ber.
252
1,871
~T72
1801,556
284
945
Deficit.
$4,143,657
127,089,978
1,549,601
16,463,40919,256, 872
1,829,878
9,825, 849
210,05850
6,217180,495,092
MINNESOTA.
Agriculture and related in-dustries
Mining and quarryingManufacturing:
Food products, liquors,and tobacco
Textiles and textileproducts
Leather and leatherproducts
Rubber and rubbergoods
Lumber and woodproducts
Paper, pulp, and prod-ucts
Printing and publish-ing
Chemicals and alliedsubstances
Stone, clay, and glassproducts
Metal and metal prod-ucts
All other manufactur-ing industries
Total manufacturing
ConstructionTransportation and other
public utilities1
TradePublic service — Profes-
sional, amusements, ho-tels, etc
Finance, banking, insur-ance, etc
Combinations — Predomi-nant industry not ascer-tainable
Inactive concerns ,
Total..
159265
569
90
18
5
120
15
217
84
98
232
192
1,640
201
3982,312
341
3,074
95692
9,177
355
43
6
1
56
7
140
40
54
79
81
2631,169
202
1,924
41
4,710
$398,7011,254,244
8,330,991
664,037
89,469
88
1,744,321
482,810
2,381,800
1,543,600
891,273
906,576
1,262,332
18,297,297
1,118,391
15,521,21711,953,307
1,078,559
11,603,321
386,639
61,611,676
$31,550108,968
655,682
51,520
8,137
152,179
41,966
198,783
134,419
69,989
73,898
106,258
1,492, 831
80,662
1,372,137986,147
78,647
836,155
32,609
5,019,706
$8,360102,210
1,381,464
93,642
40,353
25,190
144,350
165,652
118,175
78,270
89,142
2,136, 238
127,472
319,006598,825
34,243
116,605
14,085
3,457,044
$39,910211,178
2,037,146
145,162
8,137
192,532
67,156
343,133
300,071
188,164
152,168
195,400
3,629,069
208,134
1,691,1431,584,972
112,890
952,760
46,694
8,476,750
105185
214
47
12
4
64
8
77
44
44
153
111
778
86
1351,143
139
1,150
54692
4,467
$1,495,7041,916,031
4,354,863
1,885,604
1,102,148
243,946
3,988,716
334,651
471,724
637,246
259,730
6,272,053
3,756,780
23,307,461
852,708
12,291,21920,196,036
579,012
7,519,46D
552,155111
68,709,897
i Data incomplete. (See text page 10.)

82 STATISTICS OF INCOME,
TABLE 10.—Corporation returns—Distribution by industrial groups, for States and
Territories—Continued.MISSISSIPPI.
Industrial groups.
Agriculture and related in-dustries
Mining and quarryingManufacturing:
Food products, liquors,and tobacco
Textiles and textileproducts
Leather and leather
Rubber and rubbergoods
Lumber and woodproducts
Paper, pulp, and prod-ucts.
Printingandpublishing.Chemicals and allied
substancesStone, clay, and glass
productsMetal and metal prod-
uctsAll other manufacturing
industries
Total manufacturing.
ConstructionTransportation and other
utilities1
TradeP u b l i c service—Profes-
sional, amusements, ho-tels, etc
Finance, banking, insur-ance, etc
Combinations—Predomin-ant industry not ascer-tainable
Inactive concerns
Total
Totalnum-berof
cor-pora-tions.
748
75
13
1
112
21
35
10
13
7
2S7
12
88556
60
428
1124
1,548
Corporations reporting net income.
Num-ber.
474
42
5
32
17
12
3
2
5
118
8
62250
37
286
7
819
Netincome.
$119,8075,055
319,954
67,890
1,159,210
41,924
102,322
16,658
18,563
191,152
1,917,673
24,457
785,6701,080,352
89,993
1,141,646
22,602
5,187,255
Incometax.
$4,696183
22,200
5,789
102,050
1,385
8,907
960
1,482
16,774
159,547
1,190
68,14365,000
4,097
65,333
1,470
369,659
Warprofits
andexcessprofits
tax.
$2,76984
35,656
72,887
192
411
1,202
802
29,917
141,067
1,248
66,27520,055
2,534
12,612
340
246,984
Totaltax.
$7,465267
57,856
5,789
174,937
1,577
9,318
2,162
2,284
46,691
300,614
2,438
134,41885,055
6,631
77,945
1,810
616,643
Corporationsreporting nonet income.
Num-ber.
274
33
8
1
80
4
23
7
11
2
169
4
26306
23
142
424
729
Deficit.
$292,08719,481
279,319
768,809
2,094
3,088,938
14,624
655,009
36,091
67,368
56,747
4,968,999
75,542
163,3362,854,893
46,185
949,091
14,592
9,384,206
MISSOURI.
Agriculture and related in-dustries 166 50 $479,755
Mining and quarrying 552 136 2,786,420Manufacturing:
Food products, liquors,and tobacco 495 249 20,997,526
Textiles and textileproducts 250 118 2,032,123
Leather and leatherproducts 80 39 5,418,534
Rubber and rubbergoods 20 4 7,095
Lumber and woodproducts 193 87 3,251,224
Paper, pulp, and prod-ucts 45 26 716,824
Printingandpublishing. 328 217 3,654, iChemicals and allied
substances 233 119 5,694,582Stone , clay, and glass
products 123 63 1,474,501Metal and metal prod-
ucts 433 161 6,198,0401 Data incomplete. (See text page 10.)
$41,174233,099
1,815,753
180,788
507,251
1,222
278,803
58,725271,r~~
416,137
132,284
541,396
$32,595142,127
1,662,119
117,481
267,148
113,682
68,949647,214
1,355,823
29,917
402,068
$73,769375,266
3,477,872
298,269
774,399
1,222
392,485
127,674919,200
1,771,960
162,201
943,464
116416
246
132
41
16
106
19111
114
60
272
$969,0749,730,900
8,093,858
2,136,959
2,861,824
550,565
2,424,647
364,4571,307,754
3,6
641,414
9,876,753

STATISTICS OF INCOME. 83
TABLE 10.—Corporation returns—Distribution by industrial groups, for States andTerritories—Co ntinue d.
MISSOURI—Continued.
Industrial groups.
Manufacturing—Contd.All other manufactur-
ing industries
Total manufacturing.
Construction..Transportation and other
public utilitiesl
TradePublic s e r v i c e—Profes-
sional, amusements, ho-tels, etc
Finance, banking, insur-ance, etc
Combinations—P redomi-nant industry not ascer-tainable
Inactive concerns
Total
Totalnum-berof
cor-pora-tions.
379
2,579
376
5473,537
733
4,358
93794
13,735
Corporations reporting net income.
Num-ber.
146
1,229
208
3541,839
407
3,071
44
7,338
Netincome.
$3,190,523
52,635,041
1,234,558
16,861,36427,814,113
3,209,858
23,658,966
700,377
129,380,452
Incometax.
$277,081
4,481,426
79,349
1,602,7452,285,170
245,597
1,794,441
54,653
10,817,654
Warprofitsand
excessprofits
tax.
$182,820
4,847,221
146,129
356,9492,454,599
246,470
481,305
98,778
8,806,173
Totaltax.
$459,901
9,328,647
225,478
1,959,6944,739,769
492,067
2,275,746
153,431
19,623,827
Corporationsreporting nonet income.
Num-ber.
233
1,350
168
1931,698
326
1,287
49794
6,397
Deficit.
$4,319,344
36,250,461
919,079
2,423,97127,170,369
1,045,172
8,458,871
3,231,722
90,199,619
MONTANA.
Agriculture and related in-dustries... .
Mining and quarryingManufacturing:
Food products, liquors,and tobacco
Textiles and textileproducts
Leather and l ea therproducts
Rubber and rubbergoods
Lumber and woodproducts
Pape r , p u l p , andproducts...
Printing and publish-ing
Chemicals and" alliedsubstances
Stone, clay, and glassproducts
Meta l and m e t a lproducts
All other manufactur-ing industries
Total manufacturing.
C onstructi onTransportation and other
public utilities iTradePublic s e r v i c e—profes-
sional, amusements, ho-tels, etc....
Finance, banking, insur-ance, etc...
Combinations — Predomi-nant industry not ascer-tainable..
Inactive concerns
Total....
289412
79
3
2
18
54
11
14
15
13
209
37
134958
173
878
32660
3,782
5565
35
1
6
27
3
7
5
5
89
23
70371
77
416
17
1,183
$98,446483,403
81,507
787
40,296
95,248
39,051
11,594
9,159
14,095
291,737
103,492
1,964,2881,193,733
375,377
1,522,810
71,115
6,104,401
$4,24939,563
3,417
3,092
5,801
2,693
672
406
845
16,926
6,364
189,17470,123
28,660
97,176
5,425
457,660
$18231,539
2,564
650
3,566
611
85
7,476
9,254
5,36614,919
21,254
19,584
494
110,068
$4,43171,102
5,981
3,742
9,367
3,304
757
406
845
24,402
15,618
194, 54085,042
49,914
116,760
5,919
567,728
234347
44
3
1
12
27
8
7
10
8
120
14
64587
96
462
15660
2,599
$3,139,3472,586,482
1,023,669
13,270
5,996
131,774
176,775
39,654
26,657
63,498
20,410
1,501,703
64,326
407,1574,308,046
541,932
1,788,047
60,090708
14,397,838
1 Data incomplete. (See text page 10).

84 STATISTICS OF INCOME.
TABLE 10.—Corporation returns—Distribution by industrial groups, for States andTerritories—Continued.
NEBRASKA.
Industrial groups.
Agriculture and related in-dustries
Mining and quarryingManufacturing:
Food products, liquors,and tobacco
Textiles and textileproducts
Leather and l ea the rproducts
Rubber and r u b b e rgoods
L u m b e r and woodproducts
P a p e r , p u l p , andproducts
Printing and publishingChemicals and allied
substancesStone, clay, and glass
productsMeta l and m e t a l
productsAll other manufactur-
ing industries
Total manufacturing.
ConstructionTransportation and other
public utilitiesl
TradePublic s e r v i c e—Profes-
sional, amusements, ho-tels, etc
Finance, banking, insur-ance, etc...
Combinations — Predomi-nant industry not ascer-tainable
Inactive concerns
Total
Totalnum-berof
cor-pora-tions.
9670
158
16
6
8
14
487
37
33
64
52
479
72
3391,628
199
1,704
39466
5,092
Corporations reporting net income.
Num-ber.
3516
67
8
1
2
9
53
14
15
21
22
212
49
244631
il5
1,131
14
2,447
Netincome.
$221,456141,816
2,478,892
12,203
6,602
20,866
142,469
1,108,112
658,597
80,228
204,328
207,860
4,920,157
603,861
1,836,7224,093,037
496,144
5,859,524
305,605
18,478,322
Incometax.
$9,80212,182
217,990
467
470
1,687
12,439
94,661
58,914
5,247
17,957
18,368
428, 200
45,987
160,261306,854
33,130
448,752
28,692
1,473,860
Warprofits
andexcessprofitstax.
$5,45310,885
192,349
17
282
5,335
95,093
42,414
1,732
11,944
15,146
364,312
74,780
10,581169,807
21,613
103,185
10,444
771,060
Totaltax.
$15,25523,067
410,339
484
752
1,687
17,774
189,754
101,328
6,979
29,901
33,514
Corporationsreporting nonet income.
Num-ber.
6154
91
8
5
6
5
434
23
18
43
30
792,512| 267
120,767
170,842476,661
54,743
551,937
39,136
2,244,920
23
95997
84
573
25466
2,645
Deficit.
$1,016,417365,587
1,997,336
2,281,894
184, 757
232,902
80,580
27,497202,245
239,519
81,645
883,178
396,847
6,608,400
72,007
544,20810,362,644
353,926
4,558,490
272,987
24,154,666
NEVADA.
Agriculture and related in-dustries
Mining and quarryingManufacturing:
Food products, liquors,and tobacco
Textiles and textileproducts...
Leather and leatherproducts
Rubber and rubbergoods
Lumber and woodproducts...
Paper, pulp, and prod-ucts
Printing and publishingChemicals and allied
substancesStone, clay, and glass
productsMetal and metal prod-
ucts
69409
20
4
114
4
1
4
1238
5
15
1
1
2
$58,20995,535
32,415
20,83520,390
58
22,052
7,600
$3,8577,666
2,557
1,4851,255
1,610
527
$2,5031,413
110
2,701441
3,955
108
$6,3609,079
2,667
4,1861,696
5,565
635
57371
15
4
9
3
2
$1,683,2531,499,952
119,046
269,906
14,768
936
1,703
i Data incomplete. (See text page 10.)

STATISTICS OF INCOME. 85
TABLE 10.—Corporation returns—Distribution by industrial groups, for States andTerritories—Continued.
NEVADA—Continued.
Industrial groups.
Manufacturing—C ontd.All other manufactur-
ing industries
Total manufacturing.
Construction. . .Transportation and other
public utilities l
Trade . . .Public service—Profession-
al, amusements, hotels,etc
Finance, banking, insur-ance etc
Combinations—P redomi-nant industry not ascer-tainable.
Inactive concerns
Total
Totalnum-berof
cor-pora-tions.
3
51
6
32142
31
120
16368
1,244
Corporations reporting net income.
Num-ber.
15
3
1793
20
72
4
274
Netincome.
$103,350
8,620
149,961389,347
49,041
470,828
7,152
1,332,013
Incometax.
$7,434
380
11,77422,781
2,339
28,490
72
84,793
Warprofits
andexcessprofitstax.
$7,315
68618,745
707
10,472
41,841
Totaltax.
$14,749
380
12,46041,526
3,046
38,962
72
126,634
Corporationsreporting nonet income.
Num-ber.
3
36
3
1549
11
48
12368
970
Deficit.
$3,678
410,037
3,430
20, 708300,467
6,833
191,320
178,924
4,294,924
N E W H A M P S H I R E .
Agriculture and related in-dustries
Mining and quarryingManufacturing:
Food products, liquors,and tobacco
Textiles and textileproducts
Leather and leatherproducts
Rubber and rubbergoods
Lumber and woodproducts
Paper, pulp, and prod-ucts
Printing and publishingChemicals and allied
substancesStone, clay, and glass
productsMetal and metal prod-
ucts.All other manufactur-
ing industries
Total manufacturing.
Construction.Transportation and other
public utilities2
TradePublic service—Profession-
al,amusements, hotels, etc.Finance, banking, insur-
ance, etc....Combinations—P redomi-
nant industry not ascer-tainable.. .
Inactive concerns
Total
176
19
57
34
51
17
18
9
6
45
31287
14
98229
61
250
2039
1,021
81
11
29
14
23
1313
7
1
19
10
140
10
71125
39
188
9
591
$14,2203,485
100,722
5,455,486
492,180
201,095
480,306144,760
20,057
3,981
211,746
426,315
7,536,648
82,146
2,357,056791,159
251,723
1,605,253
71,283
12,712,973
$389149
7,878
431,687
41,988
16,040
44,65911,586
1,365
198
15,801
41,783
612,985
$5,605
286,332
41,958
9,164
11,5489,818
3,162
29,885
74,173
471,645
5,13l| 21.773
217,19955,933
18,027
108,107
5,350
1,023,270
15,66752,974
12,845
17,721
9,981
602,606
$389149
$13,483
718,019
83,946
25,204
56,20721,404
4,527
198
45,686
115,956
1,084,630
26,904
232,866108,907
30,872
125,828
15,331
1,625,876
95
8
28
20
28
45
2
5
26
21
147
4
27104
22
62
1139
$69,65010,263
64,580
1,134,092
573,905
657,984
135,170
55,584
26,363
75,375
275,208
156,7573,155,018
25,951
201,556855,088
98,044
240,039
219,948
430 4,875,557
i Data incomplete. (See text page 10.)

86 STATISTICS OF INCOME.
TABLE 10.—Corporation returns—Distribution by industrial groups, for States andTerritories—C ontinued.
Industrial groups.
Agriculture and related in-dustries
Mining and quarryingManufacturing:
Food products, liquors,and tobacco
Textiles and textileproducts
Leather and leatherproducts
Rubber and rubbergoods
Lumber and woodproducts
Paper, pulp, and prod-ucts
Printing and publishingChemicals and allied
substancesStone, clay, and glass
productsMetal and metal prod-
uctsAll other manufactur-
ing industries
Total manufacturing.
ConstructionTransportation and other
public utilitiesx
TradePublic service—Profes-
s i o n a 1, amusements,hotels, etc
Finance, banking, insur-ance, etc
Combinations — Predomi-nant industry not ascer-tainable
Inactive concerns
Total
Totalnum-berof
cor-pora-tions.
142106
316
724
95
71
121
68208
248
163
731
465
3,210
573
4862,030
649
2,660
91684
10,631
NEW JERSEY.
Corporations reporting net income.
Num-ber.
7042
154
345
37
21
66
31140
110
91
291
192
1,478
378
2761,148
377
1,734
42
5,545
Netincome.
$735,835352,599
11,049,925
21,693,285
1,117,255
573,365
1,275,330
1,106,3042,613,546
7,303,235
2,116,779
9,583,727
12,841,234
Incometax.
$56,43526,082
817,324
1,774,785
90,853
50,951
106,061
92,450196,307
645,281
185,964
753,101
1,099,493
71,273,985 5,812,570
4,194,309
18,219,98523,916,321
3,837,014
31,458,880
219,822
154,208,750
329,362
1,760,4801,996,389
307,866
2,493,225
15,124
12,797,533
Warprofits
andexcessprofits
tax.
$83,27129,691
1,923,915
2,879,166
131,071
31,478
132,314
122,544469,289
604,692
86,131
951,537
1,359,768
8,691,905
359,665
292,9612,451,434
252,647
960,182
15,512
13,137,268
Totaltax.
$139,70655,773
2,741,239
4,653,951
221,924
82,429
238,375
214,994665,596
1,249,973
272,095
1,704,638
2,459,261
14,504,475
689,027
2,053,4414,447,823
560,513
3,453,407
30,636
25,934,801
Corporationsreporting nonet income.
Num-ber.
7264
162
379
58
50
55
37
68
138
72
440
2731,732
195
210882
272
926
49684
5,086
Deficit.
$789,647594,744
21,781,351
9,541,132
4,042,161
4,343,626
764,470
2,302,845449,276
2,452,683
918,055
16,430,589
5,772,869
68,799,057
1,382,292
1,746,6357,966,995
1,726,211
5,580,731
1,384,105
89,970,417
NEW MEXICO.
Agriculture and related in-dustries
Mining and quarryingManufacturing:
Food products, liquors,and tobacco
Textiles and textileproducts
Leather and leatherproducts
Rubber and rubbergoods
Lumber and woodproducts
Paper, pulp, and prod-ucts
Printing and publishingChemicals and allied
substancesStone, clay, and glass
productsMetal and metal prod-
ucts
97115
23
3
2
7
21
1
3
2
1815
12
1
4
9
1
1
$118,549420,703
18,493
3,766
11,903
15,771
4,106
1,380
$9,73740,791
872
177
391
486
211
$649
292
$10,38640,791
872
177
391
778
211
79100
11
3
1
3
12
1
2
1
$1,680,535631,677
71,885
42,131
17,248
45,333
76,520
99,890
15,684
911 Data incomplete. (See text page 10.)

STATISTICS OF INCOME. 87TABLE 10.—Corporation returns—Distribution by industrial groups, for States and
Territories—Continued.NEW MEXICO—Continued.
Industrial groups.
Manufacturing— Contd.All other manufactur-
ing industries
Total manufacturing.
ConstructionTransportation and other
public utilities l
TradePublic service—P r o f e s -
s i o n a 1, amusements,hotels, etc..
Finance, banking, insur-ance, etc
Combinations — Predomi-nant industry not ascer-tainable
Inactive concerns
Total
Totalnum-berof
cor-pora-tions.
62
9
42244
55
238
1188
961
Num-ber.
28
3
26129
35
137
1
392
Corporations reportin
Netincome.
$55,419
2,327
91,957681 166
53 739
752,014
1 576
2,177,450
Incometax.
$2,137
5,42748 044
2 347
54,304
162,787
g net income.
Warprofits
andexcessprofits
tax.
$292
95226 953
572
24,334
53,752
Totaltax.
$2,429
6,37974 997
2 919
78,638
216,539
Corporationsreporting nonet income.
Num-ber.
34
6
16115
20
101
1088
569
Deficit.
$368,782
16,742
68,3751,171 365
65 560
587,638
116 747
4,707,421
NEW YORK.
Agriculture and relatedindustries
Mining and quarryingManufacturing:
Food products, liquors,and tobacco
Textiles and textileproducts
Leather and leatherproducts
Rubber and rubbergoods
Lumber and woodproducts
Paper, pulp, and prod-ucts
Printing and publish-ing
Chemicals and alliedsubstances
Stone, clay, and glassproducts
Metal and metal prod-ucts
All other manufactur-ing industries
Total manufacturing.
ConstructionTransportation and other
public utilitiesl
TradePublic service—Profession-
al, amusements, hotels,etc
Finance, banking, insur-ance, etc
Combinations—Predom-inant industry not ascer-tainable
Inactive concerns
Total..
390
4,077
438
105
616
469
1,854
1,216
395
2,478
2,355
15,471
2,782
2,82613,407
3,530
13,397
5114,393
172194
748
1,881
206
319
196
1,040
526
222
990
945
7,109
1,623
1,5586,362
1,849
8,290
217
$2,198,73826,739; 790
87,926,603
79,230,343
14,512,073
493,946
4,881,952
10,173,758
31,861,292
35,487,977
9,046,310
80,384,223
49,466,357
403,464,834
16,483,432
320,277,425139,219,361
29,532,565
191,113,238
7,334,056
$188,7272,414,074
7,722,779
6,700,089
1,207,294
42,390
397,625
888,212
2,667,821
3,515,030
780,214
7,450,074
4,469,067
1,262,491
30,740,025
$184,0221,874,050
956,546
964,081
071,483
30,750
475,562
791,730
470,890
727,062
814,189
018,084
236,382
35,840,595 35,556,759
1,525,013
529,25411^743,734|13,582,138
2,295,805
14,946,656
3,814,987
5,242,706
1,414,895 324,580
57,596 27,374 1,136,363,439 100,847,002 67,633,509 168,480,511 30,222 901,975,895
$372,7494,288,124
16,679,325
15,664,170
3,278,777
73,140
873,187
1,679,942
6,138,711
7,242,092
1,594,403
10,468,158
7,705,449
218695
720
2,196
232
69
297
273
814
690
173
1,
1,410
71,397,354! 8,362
2,787,504
36,269,27925,325,872
6,110,792
20,189,362
1,739,475
1,159
1,2687,045
1,681
5,107 108;
2944,3
$4,312,654129,498,619
51,859,764
54,530,056
22,513,016
5,802,075
12,856,162
17,593,676
8,650,869
49,603,168
2,129,943
95,908,631
60,131,909
381,579,269
16,256,556
64,200,111163,611,299
12,250,634
1,677,522
21,587,2152,016
1 Data incomplete. (See text page 10.)
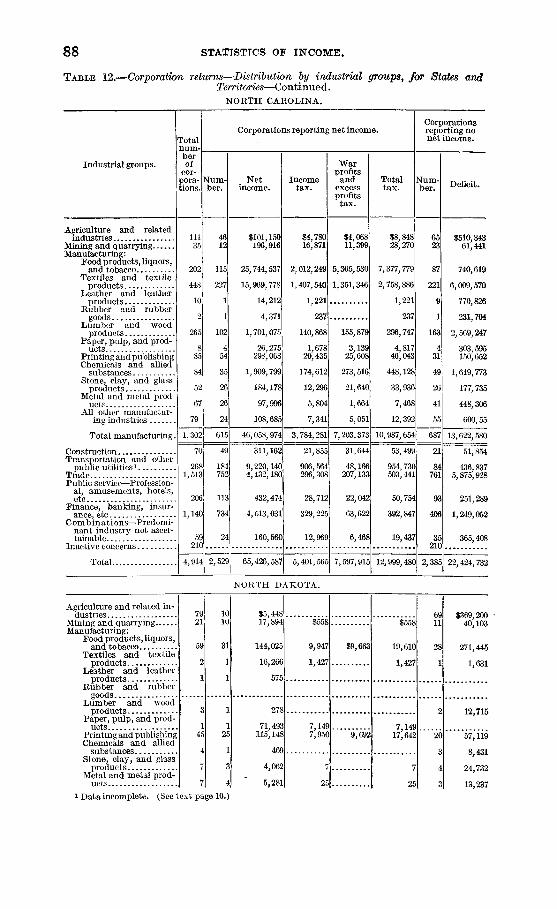
88 STATISTICS OF INCOME.
TABLE 12.—Corporation returns—Distribution by industrial groups, for States andTerritories—Continued.
NORTH CAROLINA.
Industrial groups.
Agriculture and relatedindustries
Mining and quarryingManufacturing:
Food products, liquors,and tobacco
Textiles and textileproducts
Leather and leatherproducts
Rubber and rubbergoods
Lumber and woodproducts
Paper, pulp, and prod-ucts. .
Printing and publishingChemicals and allied
substancesStone, clay, and glass
productsMetal and metal prod
uctsAll other manufactur-
ing industries
Total manufacturing.
ConstructionTransportation and other
public utilities1
TradePublic service—Profession-
al, amusements, hotels,etc
Finance, banking, insur-ance etc
Combinations—Predomi-nant industry not ascer-tainable
Total .
Totalnum-berof
cor-pora-tions.
I l l35
202
448
10
265
885
84
52
67
79
1,302
70
2681,513
206
1,140
59210
4,914
Corporations reporting net income.
STum-ber.
4612
115
227
1
1
102
454
35
26
26
24
615
49
184752
113
734
24
2,529
Netincome.
$101,150196,916
25,744,537
15,969,778
14,212
4,371
1,701,075
26,275298,068
1,909,799
184,178
97,996
108,685
46,058,974
311,162
9,220,1404,432,180
432,474
4,513,031
160,560
65,426,587
Incometax.
$4,78016,871
2,012,249
1,407,540
1,221
237
140,868
1,67820,435
174,612
12,296
5,804
7,341
3,784,281
21,855
906,564296,308
28,712
329,225
12,969
5,401,565
Warprofits
andexcessprofitstax.
$4,06811,399
5,365,530
1,351,346
155,879
3,13925,608
273,516
21,640
1,664
5,051
7,203,373
31,644
48,166207,133
22,042
63,622
6,468
7,597,915
Totaltax.
$8,84828,270
7,377,779
2,758,886
1,221
237
296,747
4,81746,043
448,128
33,936
7,468
12,392
10,987,654
53,499
954,730503,441
50,754
392,847
19,437
12,999,480
Corporationsreporting nonet income.
Num-ber.
6523
87
221
9
1
163
431
49
26
41
55
687
21
84761
93
406
35210
2,385
Deficit.
$510,34361,441
740,619
6,009,570
770,826
231,704
2,569,247
303,595150,652
1,619,773
177,735
448,306
600,55
13,622,580
51,854
436,8375,875,928
251,289
1,249,052
365,408
22,424,732
N O R T H DAKOTA.
Agriculture and related in-dustries
Mining and quarryingManufacturing:
Food products,liquors,and tobacco
Textiles and textileproducts
Leather and leatherproducts
Rubber and rubber
Lumber and woodproducts
Paper, pulp, and prod-
Printing and publishingChemicals and allied
substancesStone, clay, and glass
productsMetal and metal prod-
ucts
7921
59
2
1
3
145
4
7
1010
31
1
1
1
125
1
3
4
$5,44817,894
144,025
16,266
575
278
71,493115,148
469
4,062
5,281
$558
9,947
1,427
7,1497,950
25
$9,663
9*692
$558
19,610
1,427
7,14917,642
7
25
6911
28
1
to '<
CO rf».
OO
O
•
tO
$369,20040,103
271,445
1,631
12,715
57,119
8,431
24,732
13,237
i Data incomplete. (See text page 10.)

STATISTICS OF INCOME. 89
TABLE 10.—Corporation returns—Distribution by industrial groups, for States and
Territories—Co n tinue d.NORTH DAKOTA—Continued.
Industrial groups.
Manufactur ing—C ontd.All other manufactur-
ing industries
Total manufacturing.
ConstructionTransportation and other
public utilities1
TradePublic service—Profession-
al, amusements, hotels,etc
Finance, banking, insur-ance, etc
Combinations—P r e d o m-inant industry not ascer-tainable
Inactive concerns
Total
Totalnum-berof
cor-pora-tions.
6
135
24
1421,072
89
1,142
2095
2,819
Corporations reporting net income.
Num-ber.
1
69
10
84529
47
589
14
1,362
Netincome.
$456,654
814,251
43,086
399,0661,310,181
54,055
1,339,334
17,364
4,000,679
Incometax.
$51,368
77,873
2,421
31,48559,275
1,621
55,604
428
229,265
Warprofits
andexcessprofits
tax.
$19,355
3,520
14,29531,136
416
39,797
108,519
Totaltax.
$51,368
97,228
5,941
45,78090,411
2,037
95,401
428
337,784
Corporationsreporting nonet income.
Num-ber.
5
66
14
58543
42
553
695
1,457
Deficit.
$99,682
488,992
113,005
150,4152,417,860
97,908
1,785,594
31,588
5,494,665
OHIO.
Agriculture and related in-dustries
Mining and quarryingManufacturing:
Food products,liquors,and tobacco
Textiles and textileproducts
Leather and leatherproducts
Rubber and rubbergoods
Lumber and woodproducts
Paper, pulp, and prod-ucts
Printing and publish-ing
Chemicals and alliedsubstances
Stone, clay, and glassproducts
Metal and metal prod-ucts
All other manufactur-ing industries
Total manufacturing.
ConstructionTransportation and other
public utilities1
TradePublic service—Profession-
al, amusements, hotels,etc
Finance, banking, insur-ance, etc
Combinations—P redom-inant industry not ascer-tainable
Inactive concernsTotal 20,091 9,555
2001,047
798
342
114
112
298
111
533
405
401
1,827
781
5,722
802
9034,947
1,093
4,139
1251,113
70314
392
146
59
33
159
47
365
184
237
564
321
2,507
442
5652,216
564
2,828
49
$377,13918,212,629
9,973,122
3,940,636
8,626,924
1,353,837
2,582,364
2,703,053
9,086,385
12,177,513
8,748,33'
33,393,340
14,927,988107,513,499
7,002,162
30,006,70830,415,725
5,446,978
36,112,241
380,766
235,467,847
$23, 7731,495,215
808,211
317,448
723,
129,792
251,840
222,707
715,273
1,060,784
732,486
2,830,665
1,315,525
518,601
2,519,3322,430, (547
409,460
2,890,381
25,872
$33,5031,449,510
165,50(i
477,348
233,921
56,491
121,139
335,269
397,410
114,722
965,234
785,742
358,883
9,108,42612,011,665
449,583
,475,090!, 848,451
534,300
647,936
9,754
19,421,71019,459,792
$57,2762,944,725
1,973,717
794,796
1,957,616
186,283
372,979
557,976
2,112,683
2,175,506
1,697,720
6,616,407
2,674,408
21,120,091
968,184
3,994,4225,279,098
943,760
3,538,320
35,626
130733
406
196
55
79
139
64
168
221
164
460
3,215
~~360
3382,731
529
1,311
761,113
38,881,502 10,536 338,788,204
$1,323,23614,296,370
,628,130
,427,888
173,910
159,336
356,878
604,868
435,675
769,433
806,525
1,263125,149,707
918,810
66,:
3,;
1,6
1,4
12,:
2,8
17,9
252,431,160
35,
890,602
113,429343,421
3,167,895
17,135,405
8,079,3867,300
i Data incomplete. (See text page 10.)

90 STATISTICS OF INCOME.
TABLE 10.—Corporation returns—Distribution by industrial groups, for States and
Territories—Continued.OKLAHOMA.
Industrial groups.
Totalnum-berof
cor-pora-tions.
Num-ber.
Corporations reporting net income.
Netincome.
Incometax.
Warprofits
andexcessprofitstax.
Totaltax.
Num-ber.
Corporationsreporting nonet income.
Deficit.
Agriculture and related in-dustries
Mining and quarryingManufacturing:
Food products, liquors,and tobacco
Textiles and textileproducts
Leather and leatherproducts
Rubber and rubbergoods '.
Lumber and woodproducts
Paper, pulp, and prod-ucts
Printing and publishingChemicals and allied
substancesStone, clay, and glass
productsMetal and metal prod-
uctsAll other manufactur-
ing industries
Total manufacturing.
ConstructionTransportation and other
public utilities 1TradePublic service—Profession-
al, amusements, hotels,etc
Finance, banking, insur-ance, etc
Combinations—P redomi-nant industry not ascer-tainable
Inactive concerns
701,030
120
10
5
4
13
1
78
106
30
62
44
33248
$92,0361,713,839
753,753
193,911
6,658
4,710
26,637
11,249324,408
555,093
224,002
288,384
154,513
$3,743128,716
56,710
18,253
121
248
1,662
92525,291
47,683
14,962
24,000
12,281
$5,297143,259
92,015
1,949
1,223
23,845
47,958
51,816
14,141
2,019
$9,040271,975
148,725
20,202
121
248
2,885
92549,136
95,641
66,778
38,141
14,300
782
45
3
2
2
7
$421,17834,457,039
660,071
9,073
302,032
134,922
206,121
8,934,784
162,175
642,116
400,429
230 2,543,318 202,136 234,966 437,102 11,460,111
1911,250
227
1,246
28916
67
119597
141
856
10
474,816
4,992,5923,612,724
614,201
3,671,163
15,287
31,9
439,153261,690
40,955
221,084
509
67,624
386,182202,486
47,419
93,129
99,612
825,335464,176
88,374
314,213
35
72653
390
509 18946
185,126
574,2177,099,042
204,922
2,647,073
616,781
Total 5,569 2,301 17,729,976 1,329,974 1,180,362 2,510,336 3,268 57,665;
OREGON.
Agriculture and related in-dustries 335 89 $904,740
Mining and quarrying 132 17 85, f""Manufacturing:
Food products, liquors,and tobacco 224 110 1,255,706
Textiles and textileproducts 40 23 283,223
Leather and leatherproducts 16 4 16,217
Rubber and rubbergoods 3 1 2,117
Lumber and woodproducts 215 64 1,771,583
Paper, pulp, and prod-ucts 8 4 579,234
Printing and publish- 94 57 975,712ing Chemicals and al-lied substances 26 10 80,838
Stone, clay, and glassproducts 28 19 265,287
Metal and metal prod-ucts 100 33 1,555,406
1 Data incomplete. (See text page 10.)
$80,9286,248
117,602
23,948
939
15
155,349
47,61870,130
6,615
21,160
129,242
$20,9501,947
35,918
10,985
78,120
54,551196,722
4,338
25,321
250,023
$101,8788,195
153,520
34,933
939
15
233,469
102,169266,852
10,953
46,481
379,265
246115
114
17
12
2
151
437
16
9
67
$3,040,092320,245
3,680,445
249,596
127,554
37,302
4,737,655
43,163145,851
23,466
38,588
653,346
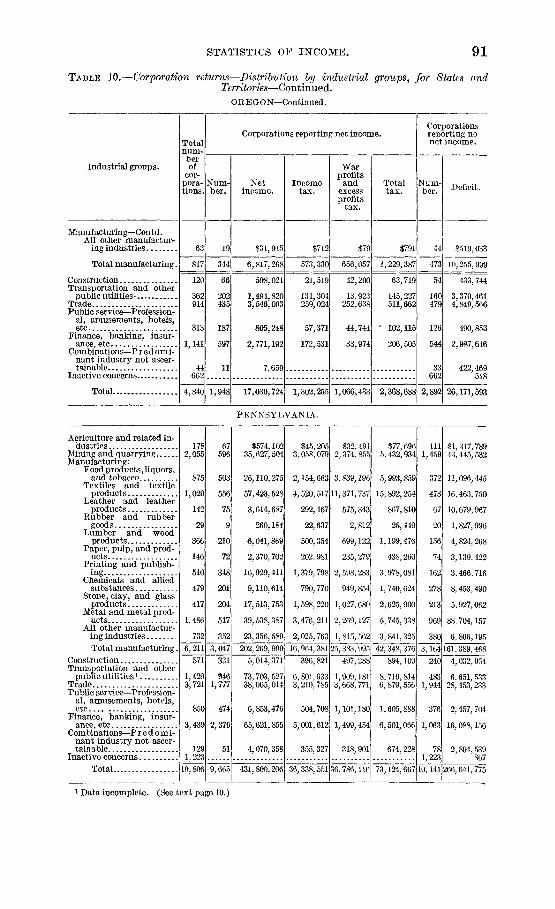
STATISTICS OF INCOME. 91
TABLE 10.—Corporation returns—Distribution by industrial groups, for States andTerritories—Continued.
O R E G O N—Continued.
Industrial groups.
Manufacturing—Contd.All other manufactur-
ing industries
Total manufacturing.
ConstructionTransportation and other
public utilities1
TradePublic service—Profession-
al, amusements, hotels,etc
Finance, banking, insur-ance etc
Combinations—Predomi-nant industry not ascer-
Inactive concerns
Total
Totalnum-berof
cor-pora-tions.
63
817
120
362914
313
1,141
44662
4,840
Corporations reporting net income.
Num-ber.
19
344
66
202435
187
597
11
1,948
Netincome.
$31,945
6,817,268
598,021
1,494,8203,546,093
805,248
2,771,192
7 659
17,030,724
Incometax.
$712
573,330
21,519
131,304259,024
57,371
172,531
1,302,255
Warprofits
andexcessprofits
tax.
$79
656,057
42 200
13,923252,638
44,744
33,974
1,066,433
Totaltax.
$791
1,229,387
63 719
145,227511,662
' 102,115
206,505
2,368,688
Corporationsreporting nonet income.
Num-ber.
44
473
54
160479
126
544
33662
2,892
Deficit.
$519,033
10,255,999
433 744
3,370 4614,849,566
490,853
2,987,646
422 469518
26,171,593
PENNSYLVANIA.
Agriculture and related in-dustries
Mining and quarryingManufacturing:
Food products, liquors,and tobacco
Textiles and textileproducts
Leather and leatherproducts
Rubber and rubbergoods
Lumber and woodproducts
Paper, pulp, and prod-ucts
Printing and publish-ing
Chemicals and alliedsubstances
Stone, clay, and glassproducts
Metal and metal prod-ucts
All other manufactur-ing industriesTotal manufacturing.
ConstructionTransportation and other
public utilities1
TradePublic service—Profession-
al, amusements, hotels,etc
Finance, banking, insur-ance, etc
Combinations—P r e d o m i-nant industry not ascer-tainable
Inactive concernsTotal 19,806 9,665
1782,055
875
1,029
142
29
146
510
479
417
1,486
732
6,211571
1,4293,721
850
3,439
1291,223
67596
503
556
75
210
72
348
201
204
517
352
$574,10235,627,504
26,110,275
57,423,528
3,614,687
260,184
6,041,;
2,370,702
16,929,411
9,110,614
17,513,753
39,538,387
23,356,
$45,2053,058,079
2,154,663
4,520,517 11,
292,467
22,637
500,354
202,981
1,379,798
790,770
1,598,220
3,476,211
2,025,7633,047 202,269,999; 16,964,381 25,383,995331
1,777
474
2,376
51
5,014,371' 396,821
73,703,52738,065,014
6,853,476
65,621,855
4,070,358
I431,800,206
6, 801,6333,210,785
$32,4912,374,855
839,196
371,737
575,343
2,812
699,122
235,279
598,283
949,854
027,680
269,127
815,562
497,288
, 909,181!, 668, 771
504,708 1,101,180
5,001,612 1,499,454
355,327
36,338,551
318,901
36,786,116
$77,6965,432,934
5,993,859
15,892,254
867,810
25,449
1,199,476
438,260
3,978,081
1, 740,624
2,625,900
5,745,338
3,841, 325
1111,459
372
473
67
20
156
74
162
278
213
909
$1, 317, 78943,445,532
11,096,445
16,463,750
10,679,967
1,827,996
4,824,268
3,139,422
3,466, 716
8,453,490
5,927,062
88,704,157
42,348, 376894,109
8, 710,8146, 879,556
1,605,888
6,501,066
674,228
73,124,667
240
4831,944
376
1,063
781,223
6,806,1953803,164 161,389,468
4,032,954
6,651,53328,453,233
2,457,704
16,088,156
2,804,539867
10,141 266,641,775
1 .Data incomplete. (See text page 10.)

92 STATISTICS OF INCOME.
TABLE 10.—Corporation returns—Distribution by industrial groups, for States andTerritories—Continued.
RHODE ISLAND.
Industrial groups.
Agriculture and related in-dustries .
Mining and quarryingManufacturing:
Food products, liquors,and tobacco
Textiles and textileproducts
Leather and leatherproducts
Rubber and rubbergoods
Lumber and woodproducts
Paper, pulp, and prod-ucts
Printing and publishingChemicals and allied
substancesStone, clay, and glass
productsMetal and metal prod-
ucts. .All other manufactur-
ing industriesTotal manufacturing.
Construction. . .Transportation and other
public utilities1
TradePublic service—Profession-
al, amusements, hotels,etc
Finance, banking, insur-ance, etc
Combinations—P redomi-nant industry not ascer-tainable
Inactive concernsTotal
Totalnum-berof
cor-pora-tions.
1612
52
237
8
9
16
1135
38
7
252
90
755
75
81418
91
406
19155
2,028
Corporations reporting net income.
Num-ber.
114
23
138
3
4
13
726
17
4
85
43
363
50
52230
56
271
6
1,043
Netincome.
$29,18239,382
358,150
25, ISO, 668
145,126
114,361
175,077
171, 780983,811
562,005
43,771
1,359,197
1,829,405
30,923, 351
359,235
3,755,8245,044,101
350,592
4,329,146
12,770
44,843,583
Incometax.
U, 3892,988
27,887
2,134,023
13,455
10,668
14,337
13,99280,449
46,836
3,120
114,471
167, 427
2,626, 665
Warprofits
andexcessprofitstax.
$6962,447
48,568
3,506,742
19,771
2,608
11,214
20,295145,301
72,293
7,962
83,131
66,670
3,984,555
25, 350 23. 507
359,430429,054
24,914
322,772
767
3,793,329
101,621451,618
27,562
62,664
4,654,670
Totaltax.
$2,0855,435
76,455
5,640,765
33,226
13,276
25,551
34,287225,750
119,129
11,082
197,602
234,097
6,611,220
48,857
461,051880,672
52,476
385,436
767
8,447,999
Corporationsreporting nonet income.
Num-ber.
58
29
99
5
5
3
49
21
3
167
47
392
25
29188
35
135
13155
985
Deficit.
$51> 97273,641
714,314
4,661,260
37,988
1,869,834
84,492
129,14364,726
291,324
33, 768
4, 911,356
1,362,468
14,160,673
130,795
748,9241,937,123
210,416
17,152,499
22,054
34,488,097
SOUTH CAROLINA.
Agriculture and related in-dustries
Mining and quarryingManufacturing:
Food products, liquors,and tobacco
Textiles and textileproducts
Leather and leatherproducts
Rubber and rubbergoods
Lumber and woodproducts
Paper, pulp, and prod-ucts
Printing and publishingChemicals and allied
substancesStone, clay, and glass
productsMetal and metal prod-
ucts1 Data incomplete. (See text page 10.)
11419
108
143
4
. . 77
250
71
22
17
506
51
75
1
23
128
23
10
2
$160,71735,271
349,139
8,831,401
7,881
213,241
31,923134,480
143,142
32,469
3,151
$11,5362,978
25,928
812,396
512
18,159
3,192
8,289
11,143
1,703
$3,189
18,353
607,790
759
9,060
3,078
592
$14,7252,978
. 44,281
1,420,186
1,271
18,159
3,19217,349
14,221
2,295
57
$419,86873,903
489,350
3,432,890
13,494
980,023
19,26396,804
1,589,145
80,727
493,259

STATISTICS OF INCOME. 93
TABLE 10.—Corporation returns—Distribution by industrial groups, for States andTerritories—Conti nued.
SOUTH CAROLINA—Continued.
Industrial groups.
Manufacturing—Contd.All other manufactur-
ing industries
Total manufacturing.
ConstructionTransportation and other
public utilities1
TradePublic service — profes-
sional, amusemen t s ,hotels, etc
Finance, banking, insur-ance etc
Combinations — predomi-nant industry not ascer-tainable
Inactive concerns
Total
Totalnum-berof
cor-pora-tions.
15
509
44
2361,299
131
1,025
29354
3,760
Corporations reporting net income.
Num-ber.
5
219
25
141457
57
603
9
1,567
Netincome.
$25,230
9,772,057
98,582
564,0751,468,022
154,849
2,204,926
28,166
14,486,665
Incometax.
$81,919
883,241
5,779
41,96186,487
9,482
127,492
1,460
1,170,416
Warprofits
andexcessprofits
tax.
$639,632
3,675
22,11438,009
4,586
34,600
1,107
746,912
Totaltax.
$1,919
1,522,873
9,454
64,075124,496
14,068
162,092
2,567
Corporationsreporting nonet income.
Num-ber.
10
290
19
95842
74
422
20354
1,917,3281 2,193
Deficit.
$31,115
7,226,070
291,023
303,4447,484,858
204,112
1,740,974
152,688
17,896,940
SOUTH DAKOTA.
Agriculture and related in-dustries
Mining and quarryingManufacturing:
Food products, liquors,and tobacco
Textiles and textileproducts
Leather and leatherproducts
Rubber and rubbergoods
Lumber and woodproducts
Paper, pulp, and prod-ucts
Printing and publishingChemicals and allied
substancesStone, clay, and glass
productsMetal and metal prod-
uctsAll other maufactur-
ing industries
Total manufacturing.
ConstructionTransportation and other
public utilities l
TradePublic service — profes-
sional, amusements ,hotels, etc
Finance, banking, insur-ance etc
Combinations — predomi-nant industry not ascer-tainable
Inactive concerns
Total
4956
87
3
8
140
3
15
13
9
179
31
208895
108
529
16142
2,213
1322
53
3
24
1
7
2
4
97
13
145371
61
336
4
1,062
$37,47330,857
157,426
3,978
22,159
47,675
1,377
11,071
19,926
686
264,298
75,211
367,5201,049,522
90,143
1,228,531
17,817
3,161,372
$662840
8,595
137
1,714
1,824
318
1,337
13,925
4,682
26,98855,035
4,402
70,363
1,440
178,337
$5,591
475
228
998
7,292
7,329
2,23516,332
5,354
7,247
458
46,247
$662840
14,186
137
1,714
2,299
546
2,335
21,217
12,011
29,22371,367
9,756
77,610
1,898
224,584
3634
34
1
116
2
8
10
5
82
18
63524
47
193
12142
1,151
$307,889145,965
215,347
1,457
129,545
2,828135,004
4,038
42,697
63,757
53,587
648,260
67,942
84,6032,716,370
90,277
650,355
13,998
4,725,659
1 Data incomplete. (See text page 10.)
60729°—23 7

94 STATISTICS OF INCOME.
TABLE 10.—Corporation returns—Distribution by industrial groups, for States andTerritories—Continued.
TENNESSEE.
Industrial groups.
Agriculture and related in-dustries .
Mining, quarryingManufacturing:
Food products, liquors,and tobacco
T e x t i l e s and textileproducts
Lea the r and leatherproducts
Rubber and rubbergoods
L u m b e r and woodproducts
P a p e r , p u l p , andproducts
Printing and publishingChemicals and allied
substancesStone, clay, and glass
productsMeta l a n d m e t a l
productsAll other manufactur-
ing industries
Total manufacturing.
ConstructionTransportation and other
public utilities l
TradePublic service — Profes-
sional, amusements, ho-tels etc
Finance, banking, insur-ance etc
Combinations — Predomi-nant industry not ascer-tainable
Inactive concerns
Total
Totalnum-berof
cor-pora-tions.
100249
270
106
9
2
201
10
83
106
56
112
831,038
Corporations reporting net income.
Num-ber.
4885
142
53
3
71
4
52
39
30
44
37475
861 53
2661,329
251
1,079
49306
4,753
173634
161
777
22
2,428
Netincome.
$232,7582,069,494
5,553,320
1,582,770
1,351
1,294,342
241,606
871,106
775,868
1,091,167
863,186
155,25112,429,967
437,170
1,725,2135,833,402
1,262,918
6,497,513
118,949
30,607,384
Incometax.
$16,38015?,049
456,608
138, 891
108, 886
22,25170,469
66,754
96,956
72,537
10,265
1,043,617
29,215
154, 498454,309
94,438
455,360
9,353
2,409, 219
Warprofits
andexcessprofits
tax.
$323446,374
866,722
122,803
42,735
12,356126,926
54, 253
98,540
69,625
2,050
l,396;010
66, 880
32,167460,698
153,322
159,906
2,824
2,718,504
Totaltax.
$16,7fl3598,423
1,323,330
261,694
151,621
34,607197,395
121,007
195,496
142,162
12,315
2,439, 627
96,095
186,665915,007
247,760
615,266
12,177
5,127,723
Corporationsreporting nonet income.
Num-ber .
52164
128
53
6
2
130
631
67
26
68
46
563
33
93695
90
302
27306
2,325
Deficit.
$574,6283,020,287
1,334,604.
1,663,483
70,578
7,927
2,687,213
504,503189,734
934,63a
184,723
1,158,102
1,651,339
10,386,836
161,899
2,088,9477,311,940
232,053
995,697
1,624,9801,700
26,398,967
TEXAS.
Agiiculture and related in-dustries 470 233 $1,123,056
Mining and quarrying 797 170 1,659,784Manufacturing:
Food products, liquors,and tobacco 325 191 4,252,578
T e x t i l e s andtextileproducts 53 23 614,877
L e a t h e r and leatherproducts 14 4 3,270
R u b b e r and rubbergoods 7
L u m b e r a n d woodproducts 120 46 1,848,607
Paper , pu lp , andproducts 9 5 116,363
Printing and publishing 186 118 977,706Chemicals and allied
substances 208 66 6,533,062Stone, clay, and glass
products 68 37 855,698Metal and metal
products 121 44 441,443*Data incomplete. (See text page 10.)
$81,200134,462
347,653
41,012
171,432
9,28469,734
607,164
69,680
35,399
$61,129130,125
516,896
71,260
72,633
7,311119,070
75,143
116,051
21,947
$142,329264,587
864,549
112,272
244,065
16,595
188,804
682,307
185,731
57,346
237627
134
30
10
7
74
4
68
14:
31
77
$2,152,54752,677,816
3,020,285-
804,254
661,846.
39,842
2,411,653
125,159567,890
4,410,316
297,634
1,552,523
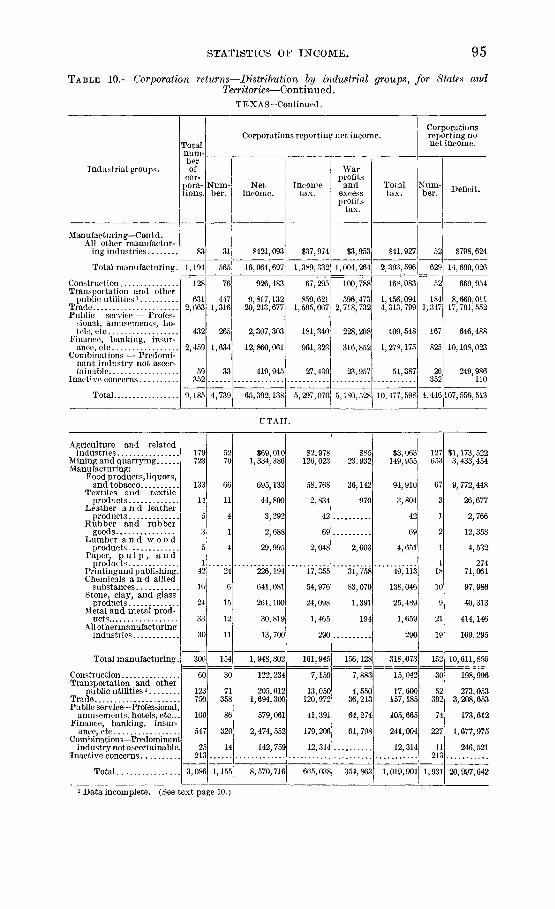
STATISTICS OF INCOME. 95
TABLE 10.—Corporation returns—Distribution by industrial groups, for States andTerritories—Continued.
TEXAS—Continued.
Industrial groups.
Manufacturing—Cont d.All other manufactur-
ing industries
Total manufacturing.
ConstructionTransportation and other
public utilities]
TradePublic service — Profes-
sional, amusements, ho-tels, etc
Finance, banking, insur-ance, etc
Combinations — Predomi-nant industry not ascer-tainable. . . .
Inactive concerns
Total
Totalnum-berof
cor-pora-tions.
83
1,194
128
6312,663
432
2,459
59352
9,185
Corporations reporting net income.
Num-ber.
31
565
76
4471,316
265
1,634
33
4,739
Netincome.
$421,093
16,064,697
926,483
9,817,13220,213,677
2,307,303
12,860,061
419,945
65,392,138
Incometax.
$37,974
1,389,332
67,295
859,6211,595,067
181,340
961,323
27,430
5,297,070
Warprofits
andexcessprofits
tax.
$3,953
1,004,264
100,788
596,4732,718,732
228,208
316,852
23,957
5,180,528
Totaltax.
$41,927
2,393,596
168,083
1,456,0944,313, 799
409,548
1,278,175
51,387
10,477,598
Corporationsreporting nonet income.
Num-ber.
52
629
52
1841,347
167
825
26352
4,446
Deficit.
$798,624
14,690,026
669,954
8,660,01117,701,552
646,488
10,108,023
249,986110
107,556,513
UTAH.
Agriculture and relatedindustries
Mining and quarryingManufacturing:
Food products, liquors,and tobacco
Textiles and textileproducts
Leather a n d leatherproducts
Rubber and rubbergoods
Lumber a n d w o o dproducts
Paper, p u l p , a n dproducts
Printing and publishing.Chemicals a n d allied
substancesStone, clay, and glass
productsMetal and metal prod-
uctsAll othermanufacturing
industries
Total manufacturing.
ConstructionTransportation and other
public utilities l
TradePublic service—Professional,
amusements, hotels, etc...Finance, banking, insur-
ance, etcCombinations—Predominant
industry not ascertainable.Inactive concerns
Total.
179723
133
14
306
123750
160
54
3,086
30
71358
86
320
14
1,155
$69,0101,334,:
695,133
44,800
3,292
2,688
29,995
226,194
641,081
261,100
30,819
13, 700
1,948,802
122,234
205,6121,694,300
579,061
2,474,552
142,759
8,570, 716
$2,978126,023
58,768
2,834
42
69
2,048
17,355
54,976
24,098
1,465
290
161,945
$8523,932
36,142
970
2,603
31, 758
83,070
1,391
194
156,128
7,159
13,050120,972|
41,391
179,206|
12,314
7,883
4,55036,213
64,274
61, 798
665,038 354,863
$3,063149,955
94,910
3, <
42
69
4,651
49,113
138,046
25,489
1,659
290
318,073
15,042
17,600157,185
105,665
241,004
12,314
1,019,901
653$1,173,522
3,433,454
9,772,448
26,677
2,766
12,358
4,532
27471,061
97,986
40,313
414,146
169,295
152 10,611,856
30! 198,996
52392
74
227
11213
1,931
273,0533,208,653
173,612
1,677,975
246,521
20,997,642
1 Data incomplete. (See text page 10.)

96 STATISTICS OF INCOME.
TABLE 10.—Corporation returns—Distribution by industrial groups, for States andTerritories—Continue d.
VERMONT.
Industrial groups.
Agriculture and relatedindustries..
Mining and quarryingManufacturing:
Food products, liquors,and tobacco
Textiles a n d textileproducts
Leather a n d leatherproducts
Rubber a n d rubbergoods
Lumber a n d woodproducts
Paper, p u l p a n dproducts
Printing and publishingChemicals a n d allied
substancesStone, clay, and glass
productsMetal and metal prod-
uctsAll other manufactur-
ing industries
Total manufacturing.
Construction. . . . .Transportation and other
public utilities1
TradePublic service—Professional,
amusements, hotels, etc...Finance, banking, insur-
ance, etcCombinations—P redomi-
nant industry not ascer-tainable
Inactive concerns.. . . .
Total
Totalnum-berof
cor-pora-tions.
2123
61
29
5
48
1621
15
52
42
28
317
3
105219
41
161
113L
932
Corporations reporting net income.
Num-ber.
1114
39
16
2
22
517
9
28
15
8
161
78137
28
119
4
552
Netincome.
$15,100240,569
290,756
511,613
20,074
419,125
81,840116,403
288,861
1,026,207
154,509
395,108
3, 304,496
235,588832,350
57,645
1,599,527
27,946
6,313,221
Incometax.
$9420,475
19,837
46,286
1,550
34,651
7,0087,946
25,058
96,972
14,497
37,305
291,110
16,28057,644
2,424
137,737
1,875
527,639
Warprofits
andexcessprofitstax.
$14,625
42,804
23,281
573
39,867
1,2108,649
35,893
4,046
1,275
34,059
191,657
1745,748
3,594
1,649
257,290
Totaltax.
$9435,100
62,641
69,567
2,123
74,518
8,21816,595
60,951
101,018
15,772
71,364
482, 767
16,297103,392
2,424
141,331
3,524
784,929
Corporationsreporting nonet income.
Num-ber.
109
22
13
3
26
11
4
6
24
27
20156
3
27
82
13
42
731
380
Deficit.
$132,30940,849
278,008
662,400
6,214
353,363
825,00419,055
34,145
116,621
1,444,975
501, 580
4,241,365
13,269
160,106353, 731
25,699
134,572
12,374
5,114,274
VIRGINIA.
Agriculture and relatedindustries
Mining and quarryingManufacturing:
Food products, liquors,and tobacco
Textiles and textileproducts
Leather and leatherproducts
Rubber and rubbergoods
Lumber and woodproducts
Paper, pulp, and prod-ucts
Printing and publishingChemicals and allied
substancesStone, clay, and glass
productsMetal and metal prod-
uctsi Data incomplete. (See text page 10.)
122207
267
69
18
1
151
2485
98
51
97
2866
145
28
7
1
59
1660
42
22
25
$45,5203,454,949
$623,7594,408,252
1,273,006
949,091
435,199
914,434114,052
1,637,248
285,435
1,290,780

STATISTICS OF COME. 97
TABLE 10.—Corporation returns—Distribution by industrial groups, for States and
Territories—Continued.VIRGINIA—Continued.
Industrial groups.
Manufacturing—Contd.All other manufacturing
industries
Total manufacturing.
ConstructionTransportation and other
public utilitiesl
TradePublic service—Profesional
amusements, hotels, etc..Finance, banking, insur-
ance, etcCombinations — Predomi-
nant industry not ascer-tainable
Inactive concerns . .
Total
Totalnum-berof
cor-pora-tions.
63
Corporations reporting net income.
Num-ber.
16
924| 421
116
2631,566
230
1,515
57288
5,288
69
172799
129
996
25
2,705
Netincome.
$123,450
9,977,033
1,918,449
22,304,5166,341,454
795,8,54
9,295,191
317,490
Income
tax.
$8,646
852, 819
171,359
2,167,325
485,507
65,066
699,773
28,792
i54,450,456 4, 781,377
Warprofits
andexcessprofitstax.
$15,840
815, 975
80, 549
56, 443279,757
48,006
173,729
2,236
1,614, 752
Totaltax.
$24,486
1,668, 794
251,908
2,223,768765,264
113,072
873,502
31,028
6,396,129
Corporationsreporting nonet income.
Num-ber.
47
503
47
91767
101
519
32288
2,583
Deficit.
$539,851
10,132, 971
565,323
6,497,3777,339,507
394,283
2,125,853
370,01130
32,457,366
WASHINGTON.
Agriculture and relatedindustries
Mining and quarryingManufacturing:
Food products, liquors,and tobacco
Textiles and textileproducts
Leather and leatherproducts
Rubber and rubbergoods
Lumber and woodproducts
Paper, p u l p , a n dproducts
Printing and publishingChemicals a n d allied
substancesStone, clay, a n d glass
productsMetal and m e t a l
productsAll other manufacturing
industries
Total manufacturing.
ConstructionTransportation and other
public utilities*TradePublic service — Profes-
sional, amusements, ho-tels, etc
Finance, banking, insur-ance, etc
Combinations — Predomi-nant industry not ascer-tainable
Inactive concerns
Total..
560526
9
10
483
12143
61
61
211
137
1,534
167
5602,028
573
2,204
761,473
20146
136
31
4
1
150
495
24
32
55
47
78
313952
259
1,076
9,701 3,540
$2,247,1441,289,326
1,
141,641
22,699
40
3,820,793
919,9451,584,379
36,921
524,541
421,432
175,927
9,317,970
751,503
5,310,3496,712,611
1,735,598
6,396,642
470,545
$193,069120,756
132,263
9,019
1,492
329,901
70,665136,004
34,903
35,477
11,826
762,636
~~36/726
374,700490,725
130,856
429,782
41,295
34,231,688; 2,580,545
$82,490
48,384
172,868
4,480
241,760
163,43593,260
37,403
3,134
4,265
723,466
263,339
57,569358,260
127,568
103,908
15,223
1,780,207
$275,559169,140
305,131
13,499
4,353
571,661
234,100229,264
1,1
72,306
38,611
16,091
1,486,102
300,065
432,269848,985
258,424
533,690
56,518
4,360,752
359480
203
37
5
333
848
37
29
156
90
955
2471,076
314
1,128
411,472
6,161
$4,587,5803,125,100
8,352,094
270,759
30,490
297,125
7,804,890
237,604143,336
366,591
120,885
2,563,444
627,727
20,814,945
721,757
2,998,54810,844,764
913,758
7,056,585
302,7872,190
51,368,014
1 Data incomplete. (See text page 10.)

98 STATISTICS OF INCOME.
TABLE 10.—Corporation returns—Distribution by industrial groups, for States andTerritories—Continued.
WEST VIRGINIA.
Industrial groups.
Agriculture and related in-dustries
Mining and quarryingManufacturing:
Food products, liquors,and tobacco
Textiles and textileproducts
Leather and l ea the r ,products
Rubber a n d r u b b e r
L u m b e r and woodproducts
Pape r , p u l p , andDroducts
Printing and publishingChemicals and allied
substancesStone, clay, and glass
productsM e t a l and m e t a l
productsAll other manufactur-
ing industriesTotal manufacturing.
ConstructionTransportation and other
public utilitiesl
TradePublic s e r v i c e — Profes-
sional, amusements, ho-tels etc - -
Finance, banking, insur-ance, etc .
Combinations — Predomi-nant industry not ascer-tainable
Total . .
Totalnum-berof
cor-pora-tions.
911,134
133
27
6
4
115
960
40
129
72
34
629
94
227965
146
976
49312
4,623
Corporations reporting net income.
dum-ber.
16404
82
15
3
50
6
47
16
68
23
13323
64
139617
85
717
18
2,383
Netincome.
$46,76713,980,646
2,121,496
430,296
72,430
851,401
105,648356,741
2,703,593
2,960,847
381,814
550,237
10,534,503
439,946
3,822,0426,564,578
437,836
6,785,635
90,251
42,702,204
Incometax.
$2,3331,112,163
176,411
40,398
6,346
64,440
8,66226,730
221,488
246,427
30,912
51,682
873, 496
31,587
344,420511,714
28,839
485,544
5,843
3,395,939
Warprofits
andexcessprofits
tax.
$1,3511,658,845
215,791
8,591
4,770
74,272
7,02730,804
422,876
407,838
33,201
28,906
1,234,076
34,747
112,438520,379
29,288
295,624
5,555
3,892,303
Totaltax.
$3,6842,771,008
392,202
48,989
11,116
138,712
15,68957,534
644,364
654,265
64,113
80,588
2,107,572
66,334
456,8581,032,093
58,127
781,168
11,398
7,288,242
Corporationsreporting nonet income.
Num-ber.
75730
51
12
3
4
65
313
24
61
49
21
306
30
88348
61
259
31312
2,240
Deficit.
$492,68016,366,927
456,882
61,883
1,104,786
73,236
2,096,325
117,747
28,683
377,083
1,741,678
8,574,381
861,99215,494,676319,824
277,9583,411,435
158,540
877,358
407,957
37,807,355
WISCONSIN.
Agriculture and related in-dustries 269 103 $834,940
Mining and quarrying 190 51 511,296Manufacturing:
Food products, liquors,and tobacco 1,209 686 6,457,836
T e x t i l e s and textileproducts 205 100 5,006,940
Leather and l e a t h e rproducts 108 50 1,715,
Rubber and r u b b e rgoods 18 6 244,438
L u m b e r a n d woodproducts 310 133 3,549,283
P a p e r , p u l p , andproducts...... 91 41 3,067,910
Printing and publishing 241 165 1,950,584Chemicals and allied
substances 101 43 2,114,747Stone, clay, and glass
products 95 56 477,402Metal and metal
products 667 214 10,175,916
* Data incomplete. (See text page 10.)
$66,13341,684
489,083
405,323
149,572
21,666
295,916
292,630145,704
184,104
33,935
858,131
$60,30230,540
986,778
825,191
99,343
17,343
380,266
125,806284,527
220,553
51,732
844,958
$126,43572,224
1,475,861
1,230,514
248,915
39,009
676,182
418,436430,231
404,657
85,667
1,703,089
166139
523
105
58
12
177
5076
58
39
453
$1,335,897648,112
9,601,760
2,394,693
3,040,328
2,276,693
9,404,296
3,061,357
281,008
2,344,805
238,135
22,311,959
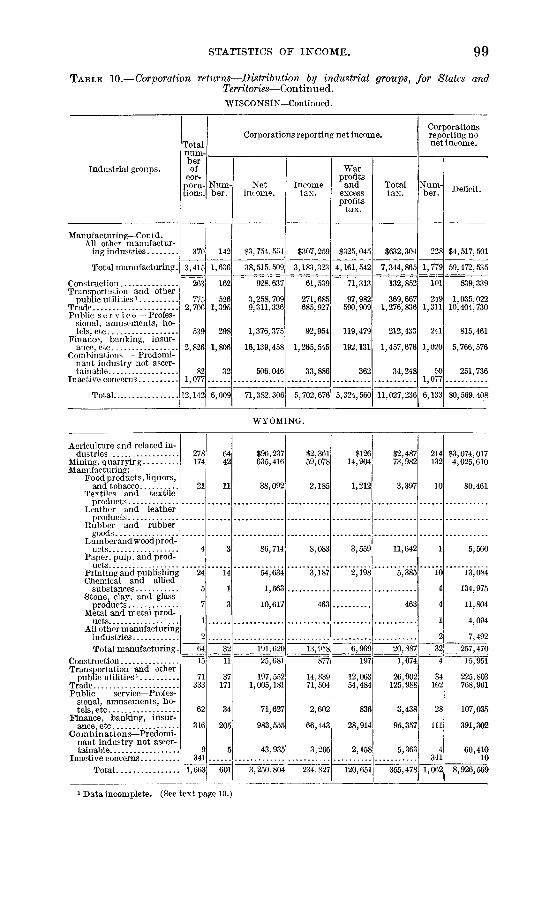
STATISTICS OF INCOME. 99
TABLE 10.—Corporation returns—Distribution by industrial groups, for States and
Territories—Continued.WISCONSIN—Continued.
Industrial groups.
Manufacturing—Contd.All other manufactur-
ing industries
Total manufacturing.
ConstructionTransportation and other
public utilitiesl
TradePublic s e r v i c e — Profes-
sional, amusements, ho-tels, etc
Finance, banking, insur-ance, etc
Combinations — Predomi-nant industry not ascer-tainable - . -
InacMve concerns
Total
Totalnum-berof
cor-pora-tions.
370
3,415
263
7752,706
539
2,826
821 077
12,142
Corporations reporting net income.
Num-ber.
142
1,636
162
5261,395
298
1,806
32
6,009
Netincome.
$3,754,554
38,515,509
928,637
3,258,7099,311,336
1,376,375
16,139,458
506,046
71,382,306
Incometax.
$307,259
3,183,323
61,539
271,685685,927
92,954
1,265,545
33,886
5,702,676
Warprofits
andexcessprofits
tax.
$325,045
4,161,542
71,313
97,982590,909
119,479
192,131
362
5,324,560
Totaltax.
$632,304
7,344,865
132,852
369,6671,276,836
212,433
1,457,676
34,248
11,027,236
Corporationsreporting nonet income.
Num-ber.
228
1,779
101
2491,311
241
1,020
501 077
6,133
Deficit.
$4,517,501
59,472,535
839,339
1,035,02210,404,730
815,461
5,766,576
251,736
80,569,408
WYOMING.
Agriculture and related in-dustries
Mining, quarryingManufacturing:
Food products, liquors,and tobacco
Textiles and textileproducts
Leather and leatherproducts . . . . .
Rubber and rubbergoods
Lumber and wood prod-ucts
Paper, pulp, and prod-ucts
Printing and publishingChemical and allied
substancesStone, clay, and glass
productsMetal and metal prod-
uctsAll other manufacturing
industries
Total manufacturing.ConstructionTransportation and other
public utilities*TradePublic service—Profes-
sional, amusements, ho-tels etc
Finance, banking, insur-ance etc
Combinations—Predomi-nant industry not ascer-tainable
Inactive concernsTotal
278174
21
4
24
5
7
1
2
64
15
71333
62
316
9341
1,663
6442
11
3
14
1
3
32
11
37171
34
205
5
601
$96,237635,416
38,092
86., 714
54,634
1,563
10,617
191,620
25,681
197,5521,005,181
71,627
983,555
43,935
$2,36159,078
2,185
8,083
3,187
463
13,918
877
14,83971,504
2,602
66,443
3,205
3,250,804 234.827
$12614,904
1,212
3,559
2,198
6,969
197
12,06354,484
836
28,914
2,158
120,651
$2,48773,982
3,397
11,642
5,385
463
20,887
1,074
26,902125,988
3,438
95,357
5,363
355,478
214132
10
1
io4
4
1
232
4
34162
28
111
4341
1,062
$3,074,0174,025,610
80,461
5,560
13,084
134,975
11,804
4,094
7,492
257,470
15,951
225,803768,961
107,035
391,302
60,41010
8,926,569
1 Data incomplete. (See text page 10.)
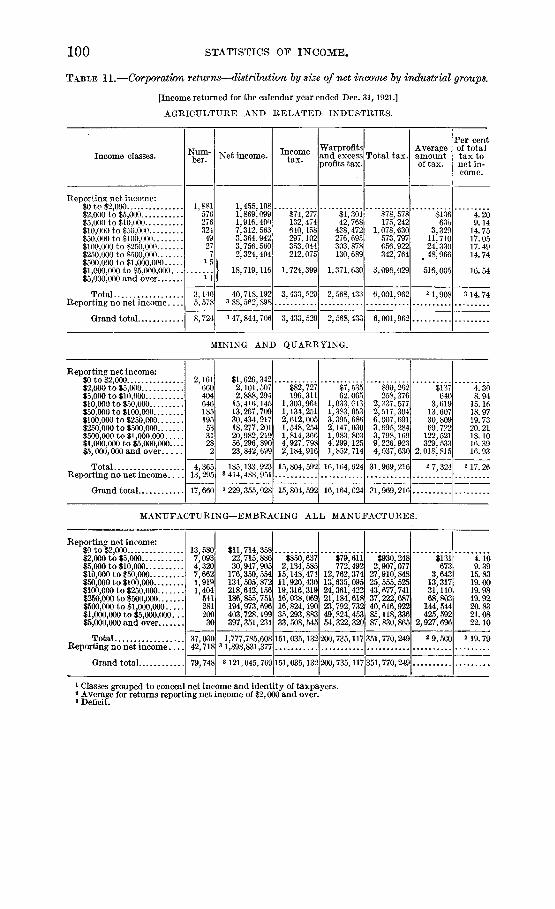
100 STATISTICS OF INCOME.
TABLE 11.—Corporation returns—distribution by size of net income by industrial groups.
[Income returned for the calendar year ended Dec. 31,1921.]
AGRICULTURE AND RELATED INDUSTRIES.
Income classes.
Reporting net income:$0 to $2 000$2,000 to $5,000$5,000 to $10,000$10,000 to $50,000$50,000 to $100,000$100,000 to $250,000$250,000 to $500,000$500,000 to $1,000,000$1,000,000 to $5,000,000$5,000,000 and over
TotalReporting no net income....
Grand total
Num-ber.
1,8815762763244927^715
1 1
3,1465,578
8,724
Net income.
1,455,1081,869,0991,916,4007,312,5633,364,9423,756,5602,324,404
I 18,719,116
40,718,1923 8S, 562, 898
3 47,844,706
Incometax.
$74,277132,474640,158297,102353,044212,075
1,724,399
3,433,520
3,433,529
Warprofitsand excessprofits tax.
$4,3oi42,768
438,472276,695303, 878130,689
1,371,630
2,568,433
2,568,433
Total tax.
$78,578175,242
1,078,630573,797656.922342,764
3,096,029
6,001,962
6,001,962
Averageamountof tax.
$136635
3,32911,71024,330
m 48,966
516,005
2 1,908
Per centof totaltax tonet in-come.
4.209.14
14.7517.0517.4914.74
16. .54
2 14.74
MINING AND QUARRYING.
Reporting net income:$0 to $2,000$2,000 to $5,000$5,000 to $10,000$10,000 to $50,000$50,000 to $100,000$100,000 to $250,000$250,000 to $500,000$500,000 to $1,000,000$1,000,000 to $5,000,000....$5,000,000 and over
TotalReporting no net income.. . .
Grand total
2,1616604046461851955331282
4,36513,295
17,660
$1,626,3422.101', 5072,888,294
15,416,14513,267,70930,434,91718,277, 20120,982,21956,296, 89023,842, 699
185,133, 9233 414,488,951
3 229,355,028
$82,727196,311
1,303,9641,134,2512,612,0051,548,2541,814,3664,927,7982,184,916
15,804,592
15,804,592
$7,53562,065
1,033,0131,383,0533.395,6862; 147,0301,983,8034,299,1251,852,714
16,164,624
16,164,624
$90,262258,376
2,337,5772,517,3046,007,6913,695', 2843,798,1699,226,9234,037,630
31,969,216
31,969,216
$137640
3,61913,60730,80969,722
122,521329, 533
2,018,815
2 7,324
4.308.94
15.1618.9719. 7320.2118.1016.3916.93
2 17. 26
MANUFACTURING—EMBRACING ALL MANUFACTURES.
Reporting net income:$0 to $2,000$2,000 to $5,000$5,000 to $10,000$10,000 to $50,000$50,000 to $100,000$100,000 to $250,000....$250,000 to $500,000....$500,000 to $1,000,000$1,000,000 to $5,000,000...$5,000,000 and over
TotalReporting no net income
Grand total
13,5807,0934,3207,6621,9191,404
54128120030
37,03042,718
79,748
$11,714,35822,715,88630,947,905176,350,554134,505,872218,642,156186,855, 751194,973,696403,728.199397,351,231
$850,6372,134,58515,148,47111,920,43019,316,31916,038,06916,824,19035,293, 88333, 508, 545
1,777,785,608 151,035,132 200,735,117 351,770,2493 1,898,831,377
3 121,045,769 151,035,132 200,735,117 351,770,249
$79,611772,492
12,762,37413,635,09524,361,42221,184,61823,792,73249,824,45354,322,320
$930,2482,907,07727,910,84825,555,52543,677,74137,222,68740,616,92285,118,33687,830,865
$131673
3,64313,31731,11068, 803144,544425,592,927,696
2 9,5C0
4.109.39
15.8319.0019. 9819.9220.8321.0822.10
2 19. 79
1 Classes grouped to conceal net income and identity of taxpayers.2 Average for returns reporting net income of $2,000 and over.3 Deficit.

STATISTICS OF INCOME. 101
TABLE 11.—Corporation returns—distribution by size of net income by industrialgroups—Continued.
MANUFACTURING—FOOD PRODUCTS, LIQUORS, AND TOBACCO.
Income classes.
Reporting net income:$0 to $2,000$2,000 to $5,000$5,000 to $10,000$10,000 to $50,000$50,000 to $100,000$100,000 to $250,000$250,000 to $500,000$500,000 to $1,000,000$1,000,000 to $5,000,000...$5,000,000 and over
TotalReporting no net income
Grand total
Num-ber.
2,9431,342
8151,418
3312037145327
7,2076 570
13,777
Net income.
$2,456,0034,326,1365,847,514
32,765,38523,261,79930,929,35024,914,14432,862,30369,364,92892,448,711
319,176,2733 309,161,987
10,014,286
Incometax.
$164,043403,830
2,788,9731,994,6322,651,9572,046, 8432,709,6955,696,9758,254,485
26,801,433
26,801,433
Warprofitsand excessprofits tax.
$18,110161,800
2,952,7572,936,7854,167,5303,384,2204,951,214
11,062,7989,239,657
38,874,871
38,874,871
Total tax.
$182,153565,630
5,741,7304,931,4176,819,4875,431,0637,750,909
16,759,77317,494.142
65,676,304
65,676,304
Averageamoimitof tax.
$136694
4,04914,89933,59476,494
172,242523.743
2,499,1632 9,113
Per centof totaltax tonet in-come.
4.219.67
17. 5221.2022.0521.8023.5924.1618.92
2 20.58
MANUFACTURING—TEXTILES AND TEXTILE PRODUCTS.
MANUFACTURING—LEATHER AND LEATHER PRODUCTS.
1 Classes grouped to conceal net income and identity of taxpayers.2 Average for returns reporting net income of $2,000 and over.*Deficit.
Reporting net income:$0 to $2,000$2,000 to $5,000$5,000 to $10,000$10,000 to $50,000$50,000 to $100,000$100,000 to $250,000$250,000 to $500,000$500,000 to $1,000,000....$1,000,000 to $5,000,000...$5,000,000 and over
Total . . ..Reporting no net income
Grand total
1,7641,020
5631,050
35330013676482
5,3125,560
10,872
$1,631,3333,218,2634,019,954
25,114,17924,617,13046,440,52347,561,68051,244,41397,007,99326,500, 615
327,356,0833189,439,330
137,916,753
$119,117277,234
2,165,7252,246,8414,111,7953,989,6394,526,0788,320,1371,886,165
27,642,731
27,642,731
$10,337103,665
1,547,7012,163,0694,814,8545,814,0585,522,333
12,552,4477,044,875
39,573,339
39,573,339
$129,454380,899
3,713,4264,409,9108,926,6499,803,697
10,048,41120,872,5848,931,040
67,216,070
67,216,070
$127677
3,53712,49229,75572,086
132,216434,845
4,465,520
212,654
4.029.48
14.7817.9119.2220.6119.6121.5233.70
2 20. 53
Reporting net income:$0 to $2,000$2,000 to $5,000$5,000 to $10,000$10,000 to $50,000$50,000 to $100,000$100,000 to $250, COO$250,000 to $500,000$500,000 to $1,000,000$1,000,000 to $5,000,000...$5,000,000 and over
TotalReporting no net income
Grand total
3021821062187658141717i l
9811,203
2,184
$262,444587,291752,384
5,001,2775,108,5349,047,0304,745,251
11,659,103} 19,901,322
57,064,6363 105,909,355
3 48,844,719
$23,44150,848
425,491442,678787,862396,097966,779
1,765,629
4,858,825
4,858,825
$2,05317,263
349,891536,966
1,136,252755,477
1,806,2302,351,890
6,956,022
6,956,022
$25,49468, 111
775,382979,644
1,924,1141,151,5742,773,0094,117,519
11,814,847
11,814,847
$140643
3,55712,89033,17482,255
163,118514,690
2 12,044
4.349.05
15.5019.1721.2724.2723.7820.69
2 20.70

102 STATISTICS OF INCOME.
TABLE 11.—Corporation returns—distribution by size of net income by industrialgroups—Continued.
MANUFACTURING—RUBBER AND RUBBER GOODS.
Income classes.
Reporting net income:$0 to $2,000$2,000 to $5,000$5,000 to $10,000$10,000 to $50,000$50,000 to $100,000$100 000 to $250 000$250,000 to $500,000$500 000 to $1,000,000$1 000 000 to $5 000 000$5000000 and over.. . .
TotalReporting no net income
Grand total
Num-ber.
6441174625
3
196445
641
Net income.
$54,115139,577125,221
1,108,6622,548,526
1,125,572
5,101,6733101,561,735
3 96,460,062
Incometax.
$6,9659,056
99,257224,483
108,248
448,009
448,009
Warprofitsand excessprofits tax.
$434953
67,770218,165
80,137
367,459
367,459
Total tax.
$7,39910,009
167,027442,648
188,385
815,468
815,468
Averageamountof tax.
$180589
3,63117,706
62,795
2 4,161
Per centof totaltax tonet in-come.
5.307.99
15.0717.37
16.74
2J5.98
MANUFACTURING—LUMBER AND WOOD PRODUCTS.
Reporting net income:$0 to $2,000$2,000 to $5,000$5,000 to $10,000$10,000 to $50,000$50,000 to $100,000$100,000 to $250,000$250,000 to $500,000$500,000 to $1,000,000$1,000,000 to $5,000,000...$5 000 000 and over
TotalReporting no net income
Grand total
8156033758611861112418i l
2,9843,749
6,733
$760,9741,973,0992,728,451
20,045,81612,481,23317,192,8508,018,344
| 7,310,284
70,511,0513120,219,887
3 49,708,836
$74,624191,089
1,747,6171,110,1911,567,340
727,545
642,807
6,061,213
6,061,213
$4,75053,018
1,205,0011,056,6431,337,475
598,785
930,188
5,185,860
5,185,860
$79,374244,107
2,952,6182,166,8342,904,8151,326,330
1,572,995
11,247,073
11,247,073
$132651
3,42911,65026,17055,264
174,777
2 3,769
4,028.95
14.7317.3616.9016.54
21.52
2 15.95
MANUFACTURING—PAPER, PULP, AND PRODUCTS.
Heporting net income:$0 to $2,000$2,000 to $5,000..;$5,000 to $10,000
: $10,000 to $50,000$50,000 to $100,000$100,000 to $250,000$250,000 to $500,000-$500,000 to $1,000,000$1,000,000 to $5,000,000...$5 000 000 and over
TotalReporting no net income
Grand total
14813583
221545617115
730946
1,676
$139,156429,396591,335
5,076,8573,977,1658,874,7476,095,7057,510,456
12,187,020
44,881,8373 49,178,592
3 4,296,755
$15,10437,833
439,534342,380817,705557,607639,152
1,089,541
3,938,856
3,938,856
$13110,617
301,286376,825704,944413,268989,918848,217
3,645,206
3,645,206
$15,23548,450
740,820719, 205
1,522,649970,875
1,629,0701,937,758
7,584,062
7,584,062
$113584
3,35213,31927,19057,110
148,097387,552
2 10,389
3.558.19
14.5918.0817.1615.9321.6915.90
216.90
1 Classes grouped to conceal net income and identity of taxpayers.2 Average for returns reporting net income of $2,000 and over,s Deficit.

STATISTICS OF INCOME. 103
TABLE 11.—Corporation returns—distribution by size of net income by industrialgroups—Continued.
MANUFACTURING—PRINTING AND PUBLISHING.
Income classes.
Reporting net income:$0 to $2,000$2,000 to $5,000$5,000 to $10,000$10,000 to $50,000$50,000 to $100,000f 100,000 to $250,000$250,000 to $500,000$500,000 to $1,000,000$1,000,000 to $5,000,000 . . .$5,000,000 and over
Total .. ..Reporting no net income
Grand total
Num-ber.
2,2441,194
6519281711114624
U 6i 1
5,3863 046
8,432
Net income.
$1,968,4613,763,0664,647,378
20,062,39612,066,71617,220,31115,060,68215,903,332
| 33,464,248
124,156,5903 26,679,985
97,476, 605
Incometax.
$135,954321,351
1,673,9381,037,5151,438,0161,282,3551,334,814
2,697,887
9,921,830
9,921,830
Warprofitsand excessprofits tax.
$13,209159,697
1,916,5691,640,3352,569, 9952,126,4322,538,009
6,297,290
17,261,536
17,261,536
Total tax.
$149,163481,048
3,590,5072,677,8504,008,0113,408,7873,872,823
8, 995,177
27,183,366
27,183,366
Averageamountof tax.
$125739
3,86915,66036,10874,104
161,368
529,128
2 5,047
Per centof totaltax tonet in-come.
3.9610.3517.9022.1923.2722.6324.35
26.87
2 21.89
MANUFACTURING—CHEMICALS AND ALLIED SUBSTANCES.
Reporting net income:$0 to $2 000$2,000 to $5,000...$5,000 to $10,000..$10,000 to $50,000$50,000 to $100,000$100,000 to $250,000$250,000 to $500,000$500,000 to $1,000,000$1,000,000 to $5,000,000. . .$5,000,000 and over
TotalReporting no net income.
Grand total.
1,0293962475011261084223255
2,5023,422
5, 924
$712,4901,286,2491,769,661
11,635,0648,988,797
17,231,60214,394,16516,008,38948,130,02038,060,852
158,217,2893 132,881,065
25, 336, 224
$49,774120,201
1,015,187777,897
1,520,2901,189,5921,355,6324,649,7603,632,456
14,310,789
14,310,789
$4,76839,626
827,645987,591
1,964,6992,157,4032, 297,6895,880,1141,127,538
15,287,073
15,287,073
$54,542159,827
1,842,8321,765,4883,484,9893,346, 9953,653,321
10,529,8744,759,994
29,597,862
$138647
3,67814,01232,26879,690
158,840421,195951,999
2 11,830
29,597,862
4.249.03
15.8419.6420.2223.2522.8221.8812.51
2 18.71
MANUFACTURING—STONE, CLAY, AND GLASS PRODUCTS.
1 Classes grouped to conceal net income and identity of taxpaxers.2 Average for returns reporting net income of $2,000 and over.3 Deficit.
Reporting net income:$0 to $2,000$2,000 to $5,000$5,000 to $10,000$10,000 to $50,000$50,000 to $100,000$100,000 to $250,000$250,000 to $500,000$500,000 to $1,000,000$1,000,000 to $5,000,000...$5,000,000 and over
TotalReporting no net income
Grand total
66139726942311293251017i 1
1,9981,683
3,681
$650,5921,279,2511, 885,2129,693,5667,662,077
14,310,4698, 247,5057,336,847
| 18,690,980
69, 756,4993 26,259,793
43,496,706
$50,970130,312842,436678, 900
1,213,751726,551654,441
1,718,529
6,015,890
6,015,890
$4,08234,619
741,407827, 210
1,939,181741,702562,387
1,165,150
6,015,738
6,015,738
$55,052164,931
1, 583,8431,506,1103,152,932J, 468, 2531, 216,828
2,883,679
12,031,628
12,031,628
$139613
3,74413,44733,90258,730
121,683
360,460
2 6,022
4.308.74
16.3419.6622.0317.8016.58
15.43
2 17. 25
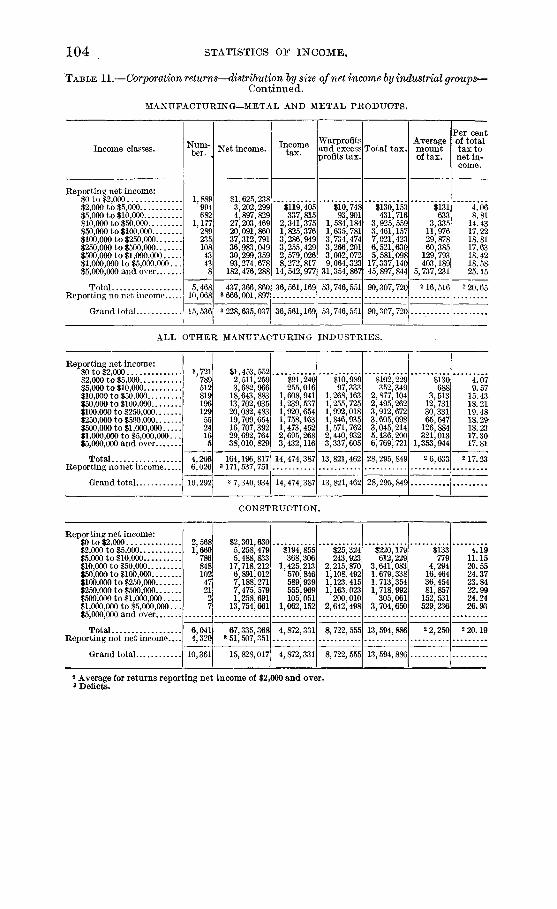
104 STATISTICS OF INCOME.
TABLE 11.—Corporation returns—distribution by size of net income by industrial groups—Continued.
MANUFACTURING—METAL AND METAL PRODUCTS.
Income classes.
Reporting net income:$0 to $2,000$2,000 to $5,000$5,000 to $10,000$10,000 to $50,000$50,000 to $100,000$100,000 to $250,000$250,000 to $500,000$500,000 to $1,000,000$1,000,000 to $5,000,000...$5,000,000 and over
TotalReporting no net income
Grand total
Num-ber. ,
1,889994682
1,17728923510843438
5,46810,068
15,536
Net income.
$1,625,2383,202,2994,897,829
27,203,46920,091,86037,312,79136,983,04930,299,35993,274,678
182,476,288
437,366,8603 666,001,897
3 228,635,037
Incometax.
$119,405337,815
2,341,3751,825,3763,286,9493,255,4292,579,0268,272,817
14,542,977
36,561,169
36,561,169
Warprofitsand excessprofits tax.
$10,74893,901
1,584,1841,635,7813,734,4743,266,2013,002,0729,064,323
31,354,867
53,746,551
53,746,551
Total tax.
$130,153431,716
3,925,5593,461,1577,021,4236,521,6305,581,098
17,337,14045,897,844
90,307,720
90,307,720
Averagemountof tax.
$131633
3,33511,97629,87860,385
129,793403,189
5,737,231
216,516
Per centof totaltax tonet in-come.
4.068.81
14.4317.2218.8117.6318.4218.5825.15
2 20.65
ALL OTHER MANUFACTURING INDUSTRIES.
Reporting net income:$0 to $2 000 . .$2,000 to $5,000$5,000 to $10,000$10,000 to $50,000$50,000 to $100,000$100,000 to $250,000$250,000 to $500,000$500,000 to $1,000,000$1,000,000 to $5,000,000...$5,000,000 and over
TotalReporting no net income
Grand total
1,7217895128191961295524165
4,2666,026
10,292
$1,453,5522,511,2593,682,966
18,643,88313,702,03520,082,48319,709,65416,707,39229,692, 76438,010, 829
164,196,8173 171,537,751
3 7,340,934
$91,240255,016
1,608,9411,239,5371,920,6541,758,1631,473,4522,695,2683,432,116
14,474,387
14,474,387
$10,98997,333
1,268,1631,255,7251,992,0181,846,9351,571,7622,440,9323,337,605
13,821,462
13,821,462
$102,229352,349
2,877,1042,495,2623,912,6723,605,0983,045,2145,136,2006,769,721
28,295, 849
28,295,849
$130688
3,51312,73130,33165,547
126,884321,013
1,353,944
2 6,633
4.079.57
15.4318.2119.4818.2918.2317.3017.81
2 17.23
CONSTRUCTION.
Reporting net income:$0 to $2.000$2,000 to $5,000$5,000 to $10,000$10,000 to $50,000$50,000 to $100,000$100,000 to $250,000$250,000 to $500,000$500,000 to $1,000,000$1,000,000 to $5,000,000...$5,000 000 and over
TotalReporting not net income
Grand total
2,5681,660
786848102472127
6,0414,320
10,361
$2,301,6305,258,4795,488,833
17,718,2126,891,0127,188,2717,475,5791,258,691
13,754,661
67,335,3683 51,507,351
15,828,017
$194,855368,306
1,425,213570,846589,939555,969105,051
1,062,152
4,872,331
4,872,331
$25,324243,923
2,215,8701,108,4921,123,4151,163,023
200,0102,642,498
8,722,555
8,722,555
$220,179612,229
3,641,0831,679,3381,713,3541,718,992
305,0613,704,650
13,594, 886
13,594,886
$133779
4,29416,46436,45481,857
152,531529,236
2 2,250
4.1911.1520.5524.3723.8422.9924.2426.93
2 20.19
2 Average for returns reporting net income of $2,000 and over,s Deficts.
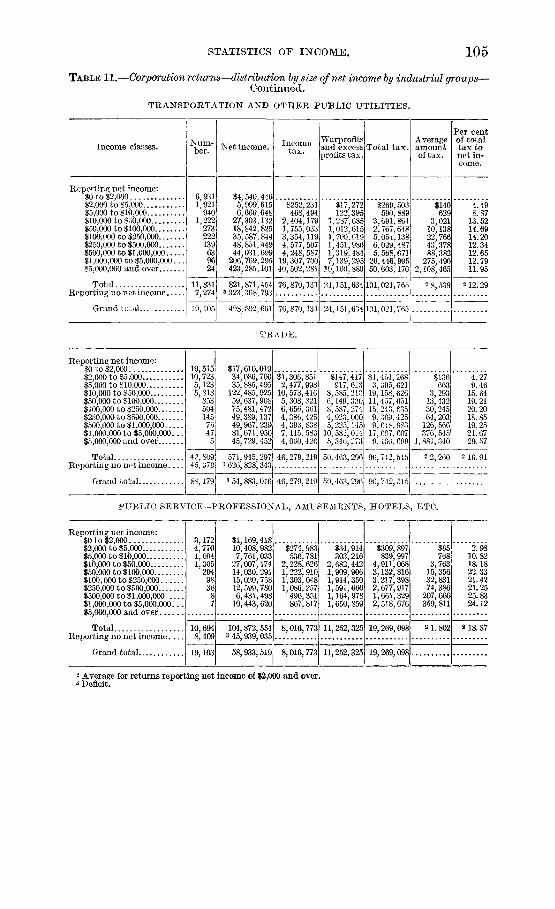
STATISTICS OF INCOME. 105
TABLE 11.—Corporation returns—distribution by size of net income by industrial groups—Continued.
TRANSPORTATION AND OTHER PUBLIC UTILITIES.
Income classes.
Reporting; net income:$0 to $2,000$2,000 to $5,000$5,000 to $10,000$10,000 to $50,000$50,000 to $100,000$100,000 to $250,000$250,000 to $500,000$500,000 to $1,000,000$1,000,000 to $5,000,000...$5,000,000 and over
TotalReporting no net income
Grand total
Num-ber.
6,9311,921
9401,222
273222139639624
11,8317,274
19,105
Net income.
$4,540,4465,999,6156,660,048
27,303,13218,842,82535,587,84448,851,44944,031,699
206,769,295423,285,101
821,871,4543 323,368, 793
498,502,661
Income
tax.
$252,231468,494
2,404,1791,755,0333,354,1194,577, 5074,248,587
19,307,70040,502,281
76,870,131
76,870,131
Warprofitsand excessprofits tax.
$17,272122,395
1,287,6851,012,6151,700,0191,451,9801,319,4847,139,295
10,100,889
21,151,634
24,151,634
Total tax.
$269,503590, 889
3,691,8642,767,6485,054,1386,029,4875,568,071
26,446,99550,603,170
101,021,765
Averageamountof tax.
$140629
3,02110,13822,76643,37888,382
275,4902,108,465
2 8,539
101,021,765
Per centof totaltax tonet in-come.
4.498.87
13.5214.6914.2012.3412.6512.7911.95
212.29
TRADE.
Reporting net income:$0 to $2,000$2,000 to $5,000$5,000 to $10,000$10,000 to $50,000$50,000 to $100,000$100,000 to $250,000$250,000 to $500,000$500,000 to $1,000,000$1,000,000 to $5,000,000...$5,000,000 and over
TotalReporting no net income
Grand total
19,51510,7235,1235,818
85350414576475
42, 80945, 370
88,179
$17,610,01934,086,70035,885,495
122,485,92559,637,90875,481,47249,389,13749,967, 23981,671,95045,729,452
571,945,297s 626,828,343
3 54,883,046
$1,306,8512, 477,998
10,573,4165,308,3216,656, 3614,386,4254,393, 8387,115,5834,060,426
46,279,219
46,279,219
$147,417917, 6.3
8,585,2106,149,3308,587,2744,923,0005,225, 145
10,582,0-45,340, 273
50,463, 296
50,463,296
$1,454,2683,395,621
19,158, 62611,457,65115, 243, 6359, 309,4259,618,983
17, 697, 6079,400, 099
90,742,515
90,742,515
$136663
3, 29313,43230,24564,203
126,566376,545
1,881,340
2 2,260
4.279.46
15.6419.2120. 2018.8519.2521.6720.57
2 16. 91
P U B L I C SERVICE—PROFESSIONAL, AMUSEMENTS, H O T E L S , ETC..
Reporting net income:$0 to $2,000$2,000 to $5,000$5,000 to $10,000$10,000 to $50,000$50,000 to $100,000$100,000 to $250,000$250,000 to $500,000$500,000 to $1,000,000$1,000,000 to $5,000,000...$5 000 000 and over
TotalReporting no net income
Grand total
3,1724,7701,0941,305
204983687
10,6948,409
19,103
$1,169,41810,408,9827,761,033
27,007,17414,030, 29115,020, 75812,599, 7806,431,498
10,443, 620
104,872, 5543 45,939, 035
58,933,519
$274,983536,781
2,228, 6261,222, 9101,303,0481,086,257
496,351867, 817
8,016,773
8,016,773
$34,914303,216
2,682, 4421,909, 9061,914, 3501,591, 6601,164,9781,650, 859
11,252,325
11,252,325
$309, 897839,997
4,911,0683,132, 8163,217,3982,677,9171,661,3292,518, 676
19, 269, 098
19,269,098
$65768
3,76315,35632,83174,386
207,666359, 811
21, 802
2.9810.8218.1822.3321.4221.2525.8324.12
2 18.37
2 Average for returns reporting net income of $2,000 and over.3 Deficit.
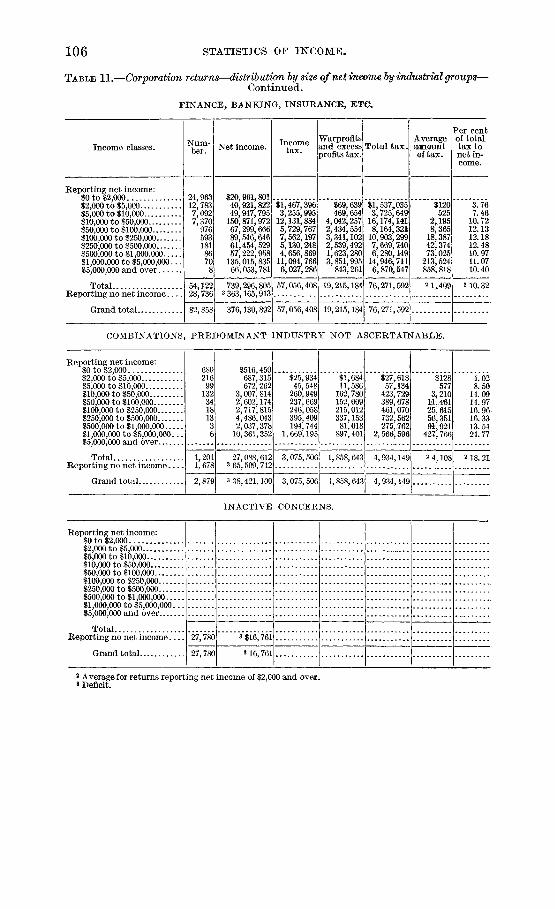
106 STATISTICS OF INCOME.
TABLE 11.—Corporation returns—distribution by size of net income hy industrial groups—Continued.
FINANCE, BANKING, INSURANCE,, ETC.
Income classes.
Reporting net income:«O to S2 000$2,000 to $5,000$5,000 to $10,000$10,000 to $50,000$50,000 to $100,000$100,000 to $250,000$250,000 to $500,000$500,000 to $1,000,000$1,000,000 to $5,000,000...$5,000,000 and over
Total .Reporting no net income
Grand total
Num-ber.
24,96312,7837,0927,370
97659318186708
54,12228,736
82,858
Net income.
$20,961,80140,921,82249,947,795
150,871,97267,299,66689,546,64661,454,52957,222,958
135,015,83566,053,781
739,296,8053 363,165,913
376,130,892
Incometax.
$1,467,3963,255,995
12,131,8845,729,7677,562,1975,130,2484,656,869
11,094,7666,027,286
57,056,408
57,056,408
Warprofitsand excessprofits tax.
$69,639469,654
4,042,2572,434,5543,341,1022,539,4921,623,2803,851,995
843,261
19,215,184
19,215,184
Total tax.
$1,537,0353,725,649
16,174,1418,164,321
10,903,2997,669,74€6,280,149
14,946.7116,870,547
76,271,592
76,271,592
Averageamountof tax.
$120525
2,1958,365
18,38742,37473,025
213,524858,818
2 l,.4O9
Per centof totaltax tonet in-come.
3.767.46
10.7212.1312.1812.4810.9711.0710. 40
2 10.32
COMBINATIONS, PREDOMINANT INDUSTRY NOT ASCERTAINABLE.
Reporting net income:$0 to $2,000$2,000 to $5,000$5,000 to $10,000$10,000 to $50,000$50,000 to $100,000$100,000 to $250,000$250,000 to $500,000$500,000 to $1,000,000$1,000,000 to $5,000,000...$5,000,000 and over. . .
TotalReporting no net income
Grand total
68021699
13234181336
1,2011,678
2,879
$516,459687,315672,262
3,007,8142,602,1742,717,8154,486,0432,037,378
10,361,352
27,088,6123 65,509,712
3 38,421,100
$25,93445, 548
260,949237, 669246,058395,409194,744
1, 669,195
3,075,506
3,075,506
$lr68411,586
162,780152,009215,012337,15381,018
897,401
$27,61857,134*
423,729389,678461,070732,562275,762
2,566,596
1,858,6431 4.934.149
1, 858,643 4,934,149
$128577
3,21011,46125, 61556,35191-, 921
427,766
24,108
4.028.50
14.0914. 9716.9616.3313.5424.77
2 18.21
INACTIVE CONCERNS.
Reporting net income:$0 to $2,000$2,000 to $5,000$5,000 to $10,000$10,000 to $50,000$50,000 to $100,000$100,000 to $250,000... .$250,000 to $500,000$500,000 to $1,000,000$1,000,000 to $5,000,000...$5,000,000 and over
TotalReporting no net income
Grand total
27,780
27,780
3 $16,761
3 16,761
2 Average for returns reporting net income of $2,000 and over.8 Deficit.

CORPORATION RETURNS.
TABLE 12.—Corporation returns by years—State tables.
UNITED STATES.
Year.
Totalnum-ber ofcorpo-rations.
Corporations reporting net income.
Num-ber re-portingnet in-come.
Percent oftotalnum-ber ineachState.
Gross income. Deductions. Net income. Income tax.War profitsand excessprofits tax.
Total tax.
Corporations reporting no net income.
Num-ber re-portingno netincome.
Percent oftotalnum-ber ineachState.
Gross income. Deductions. Deficit.
>
a
191619171918191919201921
341,253351, 426317, 579320,198345,595356, 397
206,984232,079202, 061209,634203,233171,239
60.65 $32,531,096,969 $2366.04 79,540,004,89163.63 79,706.659,14865.47 88,261^006,05258.81 93,824,224,70448.05 60,051,123,329
1,765,187,985 $8,68,809,644,68010,71,345,147,89978,849,587,59485,921,569,89155,715,075,516
!, 765,908,984 $171), 730,360,2118,361,511,2499,411,418,4587,902,654,8134,336,047, 813
i,150503', 698,029 $1.653,198,483743,535,888636,508,292366,443, 621
740 2,, 638,747,2,505,565,1,431,805,988,726,351335,131,811
$171,805,150!, 142,445,769
939 3,158,764, 422!, 175,341, 5781,625,234,643701,575,432
690 2,
134,269119,347115,518110, 564142,362185,158
39.3533.9636.3734.41.51.
$2,796,534,046 $3,453,438,4575,153,234,312
53111924;
6,757,622,1645,782,841,8747,447,394, 525
95 31'
, 657,742,792 12,653,289,033:, 381,337,545 26,410,761, """", 198,150. 203[35,076,' 369 J
289 2,337 3,
$656,904,411629,607,562689,772,361995,546,241
:, 029,423,744,878,219,134
A L A B A M A .j
oog
1916.1917.1918.1919.1920.1921.
3,3613,4703,2282,9833,1983,079
1,9362,3132,3372,0921,9671,425
57.6066.6672.4070.1361.5146.28
$152,706,812379,729, 758484,579,239408,416,618479,492,545198,170,647
$106,814,035319,299,240440,338,549371,403,622440,489,143185,368,011
$45, 892,77760,430,51844,240, 69037,012,99639.003, 40212', 802,636
$912,4022,683,2923,359,7992,834,3792,986,985989,364
$12,491,05511, 520'8904, 522, 7805,196,896793,486
$912, 40215,174,34714,880, 6897,357,1598,183, 8811,782,850
1,1,
1,1,
425157891891.231654
42.4033.3427.29.38.53.
60874972
$26,634,37339,495,97334,579,79844,926,281142,702,408187,696,790
$33,182,22944,027,82937,693,04249,663,021152,820,777210,880,272
$6,547,8564,531,8563,113,2444,736,740
10,118,36923,183,482
ALASKA.
19161917191819191920.1921
2062121276369121
909367363245
43.6943.8752. 7657.1446.3837.19
$2,833,0216,432,220
10,5.53,6725,208,7139,872,8672,606,513
$2,088,1185,434,6769,859,4164,709,1999,348,6832,376,755
$744,903997,554694, 256499, 514524,184229, 758
14,63645,56249.11741^39843,30315,274
$204,298153.70126' 46125,0857,112
$14,249,202.67,68,22,
636860818859388386
11611960273776
56.3156.1347.2442.8653.6262.81
$2,596,1131,003,150955,943300,276
1,014,3542,634,205
$2,928,0581,202,6951,098.690400;931
1,114,6293,033,609
$331,945199,545142.747IOO;655100,275399,404
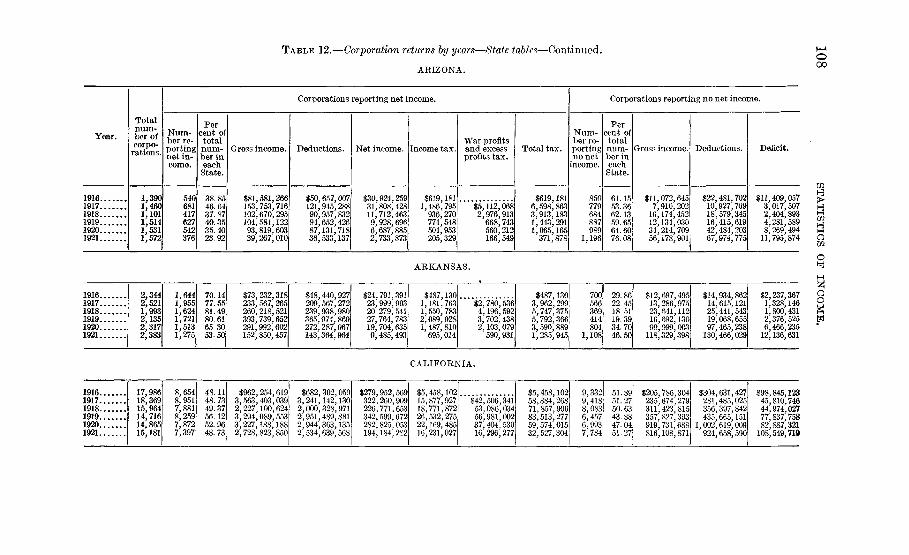
TABLE 12.—Corporation returns by years—State tables—Continued.
ARIZONA.
Year.
191619171918191919201921
Totalnum-ber ofcorpo-
rations.
1,3901,4601,1011,5141,5311,572
Corporations reporting net income.
Num-ber re-portingnet in-come.
540681417627542376
Percent oftotalnum-ber ineach
State.
38.8546.6437.8740.3535.4023.92
Gross income.
$81,581,266153,753,716102,670,295104,581,12293,819,60339,267,010
Deductions.
$50,657,007121,945,28890,957,83294,652,42687,131,71836,533,137
Net income.
$30,924,25931,808,42811,712,4639,928,6966,687,8852,733,873
Income tax.
$619,1811,486,795
936,270774, 548504,953205,329
War profitsand excessprofits tax.
$5,112,0682,976,913
668,743560,212166,549
Total tax.
$619,1816,598,8633,913,1831,443,2911,065,165
371,878
Corporations reporting no net income.
Num-ber re-portingnonet
income.
850779684887989
1,196
Percent oftotalnum-ber ineach
State.
61.1553.3662.1359.6564.6076.08
Gross income.
$11,072,6457,910,202
16,174,45212,134,03034,214,70956,178,901
Deductions.
$22,481,70210,927,70918,579,34516,415,61942,484,20367,974,775
Deficit.
$11,409,0573,017,5072,404,8934,281,5898,269,494
11,795,874
ARKANSAS.
191619171918191919201921
2,3442,5211,9932,1352,3172,383
1,6441,9551,6241,7211,5131,275
70.1477.5581.4980.6165.3053.50
$73,232,318233,567, 265260,218 521393,739,652291,992 602152,850,457
$48,440,927209,567,272239 938 980365,974, 869272,287,967143,364,964
$24,23,2027,19,
791,999,970764,704485,
391993541783
493
$487,1,181,1 550.2,1,
089,4S7,695,
130763783928810014
$2,780,5364 196 5923,702,4382,103,079
590,931
35531
$487,,962,,747,792,,590,,285,
130299T75366880945
700566369414804
1,108
29.8622.4518. 5119.3934.7046.50
$12,697,13,286,23 64116,692,90 999
118,329,
4959751T>130003398
$14,934,86214,615,12125,441,54319,068,65597,465,238
130,466,029
$2,237,3671,328,1461,800,4312,376,5256,466,235
12,136,631
C A L I F O R N I A .
191619171918191919201921
17,98618,36915,96414,71614, 86515,181
88 j
7,8,7,
65495188125987?
7,397
48.1148.7349.37561252.9648.73
$962.254.3,2,3,3,2,
563,403,227,100,294,089,227,188,728,823,
619039624553188850
$682.302
2,2,92,
241,142,000,328,951,489,944,363,534,639,
050130971881135568
$279,952,569322,260226,771,342,599,282, 825,194,184,
9006536720532S2
15,18,26,99,16,
458,877,
10?0?7
771,872532,275169, 485231, 027
$42, 50653,086,56,981,37,40416, 296,
S41034002530277
$5,458,10258 384 26871,857,90683,513,27759 574 01532,527,304
o.q'8,6,67,
33?418083457003784
51.8951.2750.6343.8847.0451.27
$205,786235 674311,423357, 827;919 731
304
815393
816,108,871
$304,631,281 485,356,397,435,665,
1 002 619924,658,
4?70?584215100Q590
$98,845,12345 810 74644,974,02777,837,75882 887 321
108,549,719
O00
I)oui
oog

COLORADO.
os 1916o 19173 1918co 1919,° 1920.L 1 9 2 1
7,4797,6187,1706,7046,8126,559
2,9863,5393,2733,1072,9762,340
39.9346.4645. 6546.3543. 6935.68
$238,993,673, 894,654, 000,807,999,870,395,486,204,
105965372998990976
$181,949,887577,133,647579,790,512728, 712, 201804,361,156452,163,931
$57,043, 21896,761, 31874,209, 86079,287, 79766,034, 83434,041, 045
$1,115, 8544,743,9805, 504,9666,237,0315,135, 5652,716,262
$9,912,11722, 528,85811,353,4707,666,3013,248,521
$1,115, 85414,656,09728, 033, 82417,590, 50112, 801,8665,964,783
4,4,3,3,
493079897597
3,8364,219
60. 0853. 5454.3553.6556.3164.32
$42, 771, 52248,956, 85179,061,007
165, 788,176173, 583, 367318,578,783
$55,812,04461,463,37290,100,277182, 616,423191, 604, 925453,123,239
$13,040, 52212,506,52111,039,27016,828,24718,021,558
134,544,456
CONNECTICUT.
191619171918191919201921
444,
852976799
4,40544,665899
3,3,33,2,2,
096263249012966369
63.8165.5767.7068.3863.5848.36
$834,382,1091, 578, 754,4961,511, 534,7871, 553, 856,9331,461,129,326
739,116, 250
$645,170,7101,396, 898,9511, 349, 211,4011, 378,099,1381,361,135,831683, 810, 083
$189,211, 399181, 855, 545162,323, 386175,757, 79599,993, 49555,306,167
$3,713,3847,999,28112,028,38313,944,1828,099,3964,669,300
$36,743,41253,443,79625,093,62110,265', 3332, 841, 512
$3446539
713742472037
18,364
7
384693179803729
510, 812
1,7561,7131, 5501,3931,6992, 530
363432313651
.19
.43
.30
.62
.42
.64
$52,446,99104,108, 81,467,955, 823217,982,006498,359,480608,015, 533
$65,489,719114,122, 812478, 738,742261,089, 505557, 586,834675, 599,235
$13,042,72810,013,99710,782,91943,107,49959,227,35467,583,702
oDELAWARE.
191619171918. . .191919201921
9601,071688816809918
554616384466401383
57.7157.5255.8157.1149.5741.72
$221,569,789810,771,861437,050,491334, 790,234329,059,96181,777, 825
$85, 298, 891682,294,433390,320, 419298,110,694303, 832,53675,721,042
$136,270,898 $2,894,425128,477, 42846,730. 07236, 679, 54025,227, 4256,056, 783
5,891, 8783,421, 9193, 051, 7052,265, 736
487,134
$23,262,73716,515, 8465, 537,1521,397,267456,701
$2, 894,42529,154,61519,937, 7658, 588, 8573,663, 003
943, 835
406455304350408535
424244.42.50.
2948198943
58.28
$2, 238,31612, 234, 9506,435, 757
17, 887, 47935,035,78591, 783, 432
$3,537,00420,332,8598,374,759
20, 500,85841,152,812105,310,136
$1,298,6888,097,9091,939,0022,613,3796,117,02713,526,704
3oog
DISTRICT OF COLUMBIA.
191619171918191919201921
1,1301,263719995
1,1831,258
653821552659659716
57.7965.0076.7766.2357.1656.92
$242,882,222265,653,938177, 578,447212,922, 598225,380, 949220,704,491
$201,421,241231, 260,378162,477,947183,175,905201, 014,376200, 492, 531
$41,460, 98134,393, 56015,100, 50029,746, 69324,366, 57320,211, 960
$778,2741,759,6291,260, 7162, 380,3411,988,1771,701,107
$2,357,5283, 532,1384,031,1641,688,4921,720,399
$778,2744,117,1574,792, 8546,411, 5053,676, " "3,421, 506
477442167336494542
42.35.23.
210023
33. 7742.43.
8408
$16,179,42011, 230, 5689,794, 57019,550, 94656,250, 76980,010, 719
$18,191,80012,944,62411,126,85422,484,79359,886,68191,823,143
$2,012,3801,714,0561, 332,2842,933,8473,635,91211,812,424
OCD
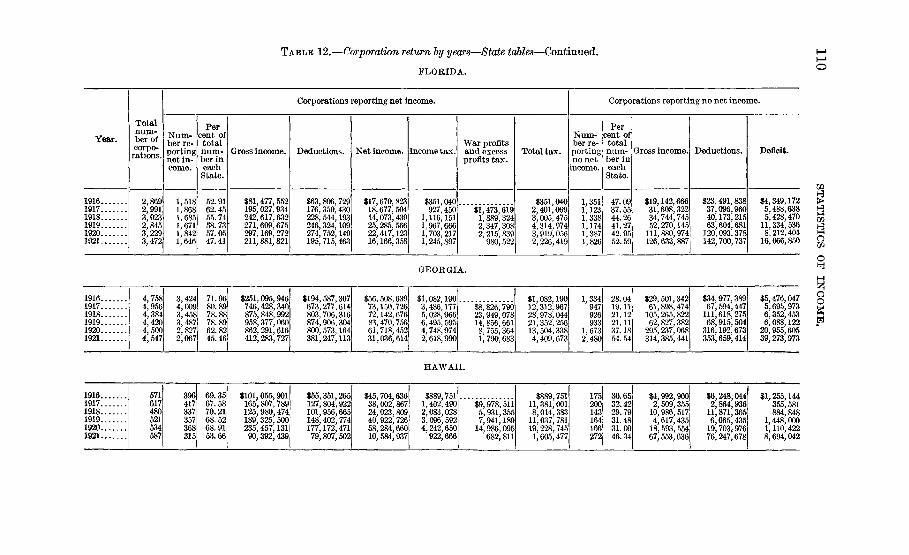
TABLE 12.—Corporation return by years—State tables—Continued.
FLORIDA.
Year.
191619171918191919201921
Totalnum-ber ofcorpo-rations.
2,8692,9913,0232,8453,2293,472
Corporations reporting net income.
Num-ber re-portingnet in-come.
1,5181,8681,6851,6711,8421,646
Percent oftotalnum-ber ineachState.
52.9162.4555.7458.7357.0547.41
Gross income.
$81,477,552195,027,934242,617,632
' 271,609,675297,169,272211,881,821
Deductions.
$63,806,729176,350,430228,544,193246,324,109274,752,149195,715,463
Net income.
$17,670,82318,677,50414,073,43925,285,56622,417,12316,166,358
Income tax.
$351,040927,450
1,116,1511,967,6661,703,2171,245,897
War profitsand excessprofits tax.
$1,473,6191,889,3242,347,3082,215,839
980,522
Total tax.
$351,0402,401,0693,005,4754,314,9743,919,0562,226,419
Corporations reporting no net income.
Num-ber re-portingno net
income.
1,3511,1231,3381,1741,3871,826
Percent oftotalnum-ber ineachState.
47.0937.5544.2641.2742.9552.59
Gross income.
$19,142,66631,608,32234,744,74552,270,145
111, 880,974126,633,887
Deductions.
$23,491,83837,096,96040,173,21563,604,681
120,093,378142,700,737
Deficit.
$4,349,1725,488,6385,428,470
11,334,5368,212,404
16,066,850
GEORGIA.
191619171918191919201921
4,7584,9564,3844,4204,5004,547
3,4244,0093,4583,4872,8272,067
71.9680.8978.8878.8962.8245.46
$251,095,946746,428,340875,848,992958,377,060862,291,616412,283,727
$194,587,307673,277,614803,706,316874,906,304800,573,164381,247,113
$56,508,63973,150,72672,142,67683,470,75661,718,45231,036,614
$1,082,1903,486,1775,028,9666,495,5954,748,9742,618,990
$8,826,79023,949,07814,856,6618,755,3641,790,683
SI, 082,19012,312,96728,978,04421,352,25613,504,3384,409,673
1,334947926933
1,6732,480
28.0419.1121.1221.1137.1854.54
$29,501,34261,898,474105,265,82262,827,382295,237,068314,385,441
$34,977,38967,594,447111, 618,27568,915,504316,192,673353,659,414
$5,476,0475,695,9736,352,4536,088,12220,955,60539,273,973
3oo
HAWAII.
1916.1917.1918.19191920.1921
571617480521534587
396417337357368315
69.3567.5870.2168.5268.9153.66
$101,055,901165,807,789125,980,474189,325, 500235,457,13190,392; 439
$55,351'127,804,'101,956,1148,402,774177,172,47179,807,502
$45,704,63638,002,86724,023,80940,922,72658,284,66010,584,937
$889,7511,402,4902,083,0283,096,5924,242,650922,666
$9,978,5115,931,3557,941,18914,986,095
682,811
$889,75111,381,0018,014,383
11,037,78119,228,7451,605,477
175200143164166272
30.6532.4229.7931.4831.0946.34
$4,992,9002,509,35510,986,5174,617,43518,593,55467,553,636
$6,248,0442,864,93611,871,3656,065,43519,703,97676,247,678
$1,255,144355,581884,848
1,448,0001,110,4228,694,042

IDAHO.
191619171918191919201921
1,7801,8891,1841,6901,7711,706
9691,084
657951893601
54.4457.3855.4956.2750.4235.23
$37,741,867136,418,19091,825,305139,493,420128,387,43449,405,234
$26,924,633121,466,77184, 520,111128,094, 293118,603,52947,176,023
$10,817,23414,951,4197,305,19411,399,1279,783, 9052,229,211
$212,526733, 739607, 507866, 210740,061122,845
$1,763, 7131,226,387884, 225637, 86180,464
$212,5262,497,4521,833, 8941,750, 4351,377, 922203,309
8118051527 S739|878!
1,105!
45.5642.6244.5143. 7349.5864.77
$9,002,77213,401, 09010,352, 79819,512, 34855,969, 54363,281,973
$10,936,89915,355,24211,956,45322,041,72461,654,62773,591,353
$1,934,1271, 954,1521,603,6552,529,3765,685,084
10,309,380
ILLINOIS.
191619171918191919201921
21,93122, 38920,40620, 21421,12722,396
13,45114, 39912,92013, 79213,41311,384
61.33 $3,168,454,04164. 311 7,676,120,612
8,460,298,9709,437,663,0589,334,087,2166, 744,818,667
63.3168.2363. 4950.83
$2,406,308,6296,542,362,5267,700,973,3888,604, 505, 3888,656, 906, 9426,363,674,214
$762,145,4121,133,783,726
759,325,582833,157,670677,180, 274381,144,453
$15, 014, 84553, 593,28162,851,975;
66,614,01155, 817, 886j33,106, 447
$165,425,5380,26117, 7100,7122,131
215,810,2611122, 707, 71093,230,7112 8 , 2 0 2 / "
$15,014, 845219,018, 819278,662, 236189,321, 721149,048, 59861,308,578
8,480!7,9907,486!6, 422'7, 71411,012,
38.6735. 6936.6931.7736. 5149.17
$189,184,120408,337, 235408, 944, 552
4,179,415, 8742,967,631,3913, 758,752,152
$217,780,179451,077,084443,295,049
4,265,445,0763,112,951,4774,116,064,205
$28, 596,05942, 739,84934,350,49786,029,202145,320,086357,312,053 1-3
oCO
I N D I A N A .
191619171918191919201921
8,5469,0198,5898,7889,2759,397
5,8816,8496,0906,2275,8854,991
68.8275. 9470.9070.8663.4553.11
$459,263,5461,453, 704, 7671,357, 050, 3351,578, 739, 5961,728,056,0781,005, 748,132
$357,512,1781,315, 381,9001,242,903, 8591,436, 367, 7381,599,891,865928,579,984
$101,751,368138,322,867114,146,476142, 371, 858128,164, 21377,168,148
$2,001,337.6,381,3388, 569, 053
10, 732, 3489, 809,9246,264, 2111
$21, 797, 83131,922,48822,683, 35417,653,4666,213,639
$2,001,33728,179,16940,491, 54133,415, 70227, 463,39012,477, 850
$47, 847, 292106, 863,962119,313,764156,121, 599463,026, 255534, 323,814
$55, 833,280116,849,798130,520,012168,946,885497,993,861601,321,503
$7,985,9889,985, 836
11,206,24812,825, 28634,967,60666,997, 689
3oog
IOWA.
191619171918191919201921
9 0649,2888,2577,7988,8998,643
5 8556,4235,8255,3735,4974,494
64 6069.1570. 5568.9061.7752.00
$265,972,786837, 831,971839, 521,038
1,102,603,896956,667,062656,579,966
$208,362,402759,982,658778, 528, 539
1,030,794, 547896, 721,344621,262,882
$57,610,38477,849, 31360,992,49971,809, 34959,945, 71835,317,084
$1,113,9033, 760,3624,759,6935,259, 7854,422,4312,729,111
$8, 756, 96611,340,8998, 863,0994,992,1361,454,638
$1,113,90312,517,32816,100, 59214,122, 8849,414, 5674,183, 749
3,2092,8652,4322,4253,4024,149
35. 4030.8529.4531.1038. 2348.00
$42, 266,43386,497, 47695,619,609130, 764, 441409,450, 293421, 721,046
$58,321,69690, 555, 842101,682,452142,103,366435, 895,156459,671,636
$16,055,2634,058, 3666,062, 84311,338, 92526,444, 86337,950,590

TABLE 12.—Corporation return by years—State tables—Continued.
KANSAS.
Year.
19161917.1918191919201921
Totalnum-ber ofcorpo-
rations.
4,4674,6044,4744,5314,6584,749
Corporations reporting net income.
Num-ber re-portingnet in-come.
3,2993,6803,3533,4363,2022,852
Percent of
totalnum-ber ineacli
State.
73.8579.9374.9475.8368.7460.05
Gross income.
$352, 747, 535803,041,896722,919,437953,144,030
1,111,082,200791,541,272
Deductions.
$248,676,965681,645,684641,124, 893836, 892,309
1, 006, 481,468703,991,679
Net income.
$104,070, 570121,396, 212
81, 794, 544116,251, 721104,600, 73287,549, 593
Income tax.
$2,073,9115,954,9217,617,0149,771,4928,962,1887,505,059
"War profitsand excess
profits tax.
$13,656,95412,002. 46911,216, 4227,675,5827,596,108
Total tax.
$2,073,91119,611,87519,619,48320,987,91416,637, 77015,101,167
Corporations reporting no net income.
Num-ber re-portingnonet
income.
1,168924
1,1211,0951,4561,897
Percent oftotalnum-ber ineach
State.
26.1520.0725.0624.1731. 2639.95
Gross income.
$18, 727,10759,606,59656, 745,78380,387,217
354, 340, 288375,340,061
Deductions.
$21, 275, 29464, 876, 83362,390,17087,716,944
373, 460, 386397,587,581
Deficit.
$2, 548,1874,270,2375,644,3877,329,727
19,120,09822,247,520
KENTUCKY.
inH
o
o
19161917191819191920.1921,
5,4055,5804,3074,5714,8044,757
3,4393,8533,1433,0753,0792,617
63.6369.0572.9767.2764.0955.01
$278,007,892652,268,827707, 866,437639, 458,091832, 738, 581444,349,329
$211,488,773569,373,083638,044,885568, 869,330757,869,502412,471,737
$66; 519,119895,744821, 552588, 761869,079877,592
$1,303,4543, 845,3515, 740,2795,459,9325,702,0902,498,252
$13, 545,37218,238, 6579,811,172
11,203,1492,273,498
$1,303,45417,390, 72323,978, 93615,271,10416,965,2394,771,750
11111,
966727164496725
2,140
36.3730.9527.0332.7335.9144.99
$22,524,65844,825,29137,744,85170,249,155
152,151,464219,658,706
$28,086,17848,995,22541,447,39476,695,661
165,017,410253,965,378
$5,561,5204,169,9343,702,5436,446,506
12,865,94634,306,672
oo
LOUISIANA.
191619171918191919201921
343,
705096661
4,0014,4,
365470
2,3,2,2,%
380113557690441
2,053
64.76.69.67.55.45.
240084239293
$211,202,896734,600,111731,556, 847950, 986, 340820, 556,035479,873,646
$158,569,779646,421,493674,389,226862,029,140753,264,396452,748,646
$52,633,1188,178,61857,167,62188,957,20067,291,63927,125,000
$1,047,7754,178,4194,607,5426,885,4735,170,9352,213,867
$13,379,22013,693,33915,900,47710,256,6721,692,068
$1 047557
775639
18,300,8812215
3,
785427905,
950607935
111
,325983
,104,311,924
2,417
3524
7600
30.16324454
770807
$23,877,12048, 028,48438,143,41599,716,348302,041,114334,891,,'
$29,807,10954,682,21543,538,399107,905,977328,924,798375,023,151
$5,929,9896,653, 7315,394,9848,189,62926,883,68440,131,350

MAINE.
1916..191719181919.19201921
3,0843,3112,4692,8412,8302,994
1,9,1,1,11,
94U390496908737595
63.2C72.1860.5967.1601.3853.27
$167,998,563402,801,390284,018, 735489,053,461540,634,952352,668,492
$129,685,789346,976,800258,767,107440,295,200496,799,284322,183,143
$38,312,77455,824,59025,251,62848,758, 26143,835,66830,485,349
$744,7732,756,9692,063,4453,833,0863,529,9592,552,345
$5,325,5575,934,2846,991,6715,278, 8152,549,674
$744,7738,082,5267,997,729
10,824,7578,808, 7745,102,019
$26,270,02622,297,89731,452,60336,377,598
100,927,621177,443,735
$30,206,45925,773,51137,942,62343,525,673
109,309,788211,930,901
$3,936,4333,475,6146,490,0207,148,0758,382,167
34,487,166
MARYLAND.
1916.. .19171918191919201921.
4,0394,2503,4983,8854,6624,246
2,5842,8972,5292,6473,0122,073
63.9868.1672.2968.1364.6148.82
$443,382,1031949, 855,3931929,339,590!904,191,353941,296,390722,857,528
$356,098,100839,963,810844,577,898810,223,989864,394,371660,066,330
$87,284,003109,891,58384,761,69293, 967,36476,902,01962,791,198
$1,658,0365,326,2496,825,2107,470,1286,414,0145,638,109
$13,373,54423,291,20714,779,3537,465,4732,457,211
i $1,658,03618,699,79330,116,41722, 249,48113,879,48718,095,320
1,455!1,353!
969i1,238!
1,650!2,173
36.0231.8427.7131.8735.3951.18
$25,604,14059,272,09966,213,09779,402, 434253,929,061296,177,658
$30,268,15367,167,55071,088,61488, 053,285276,694,572333,938,370
$4,664,0137,895,4514,875,5178,650,85122,765,51137,760,712
3oMASSACHUSETTS.
191619171918191919201921
13,27313,79912,62213, 28614,15014,837
8,3509,8498,5018,8948,1427,199
62.9171.3767.3566.9457. 5448.52
$1,772,712,3085,023,176,4795,871, 704, 0855,826,613,8194,874,334,6653,463,117, 234'
$1,305,208,6464,191, 441,1555,258, 807,8525,172,057,1054,471,807,1543,185,306,688
$467,503,662831,735, 324614, 896, 233654,556, 714402,527,511277, 810, 546
$8,927,59440,442,86544,594,53051,101, 03032,660,52924,464,732
$96, 781,840229,493, 756117,830, 26655,186,54422,474,481
$8,927,594137,224,705274, 088,286168,931,29687,847,07346,939,213
4,92313,9504,1214,3926, 0087,638
37.0928.6332.6533.0642.4651.48
$153,413,973325,363,706377, 740,551495,981,643
2,164,242,3121,621,932,693
$181, 500,346351,903,741445, 383,973557, 847,895
2,363,383,1301,872,422,640
$28,086,37326, 540,03567,643,42261,866,252
199,140,818250,489,947
QO
g
MICHIGAN.
191619171918191919201921
9,0219,62610,87211,426
7,1625,9516,6376,7045,209
64.7771.6765.9768.9561.6645.59
180,450,979.253,055,263,832,177,645.254,345,423,
$805,196,7822, 671,503,3842,716, 534,8203,314,403,1993,243,208,8512,094,119,198
$375,253,744307,749, 892338, 729,021517, 774,681402,047, 385251,304,416
$7,362,94514,575, 90624, 842,97738,506,22232,182, 83719,037,623
$46,392,602118,332, 316121,060,45570,437,94842,811,466
$760143
362,945968,508175,293
159,566,67710261,
620, 785849,089
3,2,3,2,4,6,
461831070989168217
35.2328.3334.0331.0538.3454.41
$84,176, 870182,288, 812181, 480,106159, 533, 186757,220, 766
1,219,593,453
$97.969,398213^ 693,864199,972, 642176, 489,390806,756,132
1,400,088,545
$13,792,52831,405,05218,492,53616,956,20449,535,366
180,495,092
CO

TABLE 12.—Corporation returns by years—State tables—Continued.
MINNESOTA.
Year.
191619171918191919201921
Totalnum-ber of
9,2769,4868,5768,5889,3159,177
Corporations reporting net income.
Num-ber re-portingnet in-come.
5,9167,2355,7875,9465,8214,710
Percent of
totalnum-ber ineach
State.
63.7876.2767.4869.2462.4951.32
Gross income.
$746,083,8122,216,876,1971,878,316,7082,053,409,0312,233,521,5061,305,870,652
Deductions.
$540,398,4831,943,428,5301,740,215,4481,862,975,6722,085,047,5351,244,258,976
Net income.
$205,685,329273,447,667138,101,260190,433,359148,473,97161,611,676
Income tax.
$4,053,24313,014,90212,384,01515,633,73110,725,6535,019,706
War profitsand excessprofits tax.
$35,883,36823,161,60819,691,57212,612,8363,457,044
Total tax.
$4,053,24348,898,27035,545,62335,325,30323,338,4898,476,750
Corporations reporting no net income.
Num-ber re-portingnonet
income.
3,3602,2512,7892,6423,4944,467
Percent oftotalnum-ber ineachState.
36.2223.7332.5230.7637. 5148.68
Gross income.
$52,271,961150,251,711102,080,35199,093,959
472,701,059779,803,329
Deductions.
$64,481,856169,113,049112,249,197110,578,948497,477,966848,513,226
Deficit.
$12,209,89518,861,33810,168,84611,484,98924,776,90768,709,897
MISSISSIPPI.
191619171918191919201921
1 6531,8111,1321,4361,5731,548
1 1481,431
8721,1771,015
819
69.4579.0277.0381.9664,5352.91
$48 355,712183,632,659133,113,464214,347,116207,688,94695,826,313
$36,972 856169,918, 500121,869,413195,644,549190,314, 89190,639,058
$11,382,85614,814,15911,244,05118,702,56717,374,0555,187,255
$222,380743,089887,277
1,396,1541,350,204
369,659
$1,184,3682,293,0642,369,0061,930,725
246,984
$222 3801,927,4573,180,3413,765,1603,280,929
616,643
505380260259558729
30 5520.9822.9718.0435.4747.09
$11 018 62416,105,50918,596,34416,710,42986,484,73378,358,022
$12 733 62317,502,86820,290,77817,987,98494,071,00687,742,228
$1 714 9991,397,3591,694,4341,277,5557,586,2739,384,206
Oin
O
MISSOURI.
191619171918191919201921
14,26214,84013,33212,76413,42813,735
8,9019,3048,2948,7408,4317,338
62.4162.7062.2168.4762.7953.43
$971,129,3313,058,064,5233,087,626,9833,446,312,0723,365,585,3132,276,260,673
$748,498,7292,754,845,2492,828,707,5813,159,804,8423,139,282,8132,146,880,221
$222,630,602302,119,274258,919,402286,507,230226,302,500129,380,452
$4,347,71714,461,26218,986,86822,095,19017,770,43210,817,654
$42,990,74984,412,91148,833,07030,379,4428,806,173
$4,347,71757,452,011103,399,77970,928,26048,149,87419,623,827
5,3615,5365,0384,0244,9976,397
37.5937.3037.7931.5337.2146.57
$117,530,228186,291,251209,591,434219,719,520814,725,610
1,029,103,368
$136,530,200204,848,660230,125,289245,881,772866,275,232
1,119,302,987
$18,999,97218,557,40920,533,85526,162,25251,549,62290,199,619

MONTANA.
1916.1917,1918.1919.1920.1921.
3,6133,7743,8043,3373,5713,782
2,0192,4302,3591,7701,5861,183
55.8864.3962,0153.0444.4131.28
$107,727,076235,705,796312,680,643189,172,306160,983,04988,670,129
$74,146,767204,403,129283, 859,392174,304,332149,451,32682.565, 728
$33,580,30931,302,66728,821,25114,867,97411, 531,7236,104,401
$663,3321,535, 4902,525,0851,123,195866,056457,660
$2,355,8262,938, 745633,625377,915110,068
$6633,891,5,463,1,756,1,243567,
332316830820971728
1,1,1,1,1,2,
594344445567985599
44.1235.6137.9946.9655.5968.72
$10,635,36922,230,44850,398,75253,643,01973,215,43890,998,781
$14,131,91026,184,99554,083,21459,639,442SQ, 454,114
105,396,619
$3,496,5414,954,5473,684,4625,996,423
13,238,67614,397,838
NEBRASKA.
19161917,1918191919201921
4,5614,6844,4644,5104,8735,092
3,3293,8853,3803,5153,1132,447
72.9982.9475.7277.9463. 8848.06
$144,812,843551,995,588616,667,889813,246,571602,409,992387,099,433
$109,069,989505,806,303582,794,905768,086,408570,718,997368,621,111
$35,742,85446,189,28533,872,98445,160,16331,690,99518,478,322
$701,4902,242,1302,635,8393,356,1642,495,9111,473,860
$4,486,4265,623,7115,092,7412,718,130771,060
$7016,7288,259,
490556550
8,448,9055,2142,244,
041920
1
1
1,2,
232799084995760645
27.0117.0624.2822.0636.1251.94
$10,143,25630,670,21262,971,37357,433,369274,138,657274,343,832
$12,330,10933,480,07167,016, 78362,297,550296,109,793298,498,498
$2,186,8532,809,8594,045,4104,864,18121,971,13624,154,666 M
oNEVADA.
191619171918191919201921
9391,051440958
1,1931,244
318399206285338274
33 8737.9746.8229. 7528.3322. 03
$14 092 88337,300,64726,650,80741,423,84729,808,76620,657,513
$10,314,57133,495,62324,362, 58038,087,59727,776,68619,325,470
$3,778,3123,805,0242,288,2273,336,2502,032,0801,332,043
$75,148192,815206,667245,196150,37184,793
$238,652232,308163,51682,09541,841
$75,148431,467438,975408, 712232, 466126,634
621652234673855970
66.1362.0353.1870.2571.6777.97
$7 579 7625,894,1136,311,2548,611,48816,782,07318,351,356
$9,671,8208,570,5688,188,00410,936,42521,663,70222,646,280
$2,092,0582,676,4551,876,7502,324,9374,881,6294,294,924
NEW HAMPSHIRE.
9oo8
191619171918191919201921
1,1,11,
1,
052177?!7f>003994021
748890997727682591
71.1075.6278.2072.4868.6157.88
$85,002,478151,484,964402,598,697211, 782,100214,581,450141,379,061
$70,140,754135,165,918360,375,151186, 276,650197,519,600128,666,088
$14,16,42,25,17,
861,724319,046223,546505,450061, 850712,973
$285,939575,915
3,098,8571,938,1151,332,4731,023,270
$2,423,39714,537,3174,039,0891,975, 486602,606
$285,9393,181,31217,636,1745,977,2043,307,9591,625,876
304287278276312430
28.9024.3821.8027.5231.3942.12
$10,504,79113,146,0539 138,9019,189,11845,528,82183,215,490
$11141010,48,88,
888,712451,022733 344106,324705,436091,047
$1,1,1
3,4,
383,304,•W4917,176,875,
9219694-13?06615557

TABLE 12.—Corporation returns by years—State tables—Continued.
NEW JERSEY.
Year.
191619171918191919201921
Totalnum-ber ofcorpo-rations.
9,77710,1128,8079,3929,896
10,631
Corporations reporting net income.
Num-ber re-portingnet in-come.
5,7506,2225,5036,0355,8755,545
Percent oftotalnum-ber ineachState.
58. 8161.5362.4864.2659.3752.16
Gross income.
$1,015,845,7362,123,440,7532,270,839,7402,945,523,4693,418,065,4352, 220,207,819
Deductions.
$770,138,8251,867,148,6092,079,821,0152,690,953,4543,227,279,8402,065,999,069
Net income.
$245,706,911256,292,144191,018,725254,570,015190, 785,595154,208,750
Income tax.
$4,819,51412,064,68516,469,20619,584,42014,875,30712,797,533
War profitsand excessprofits tax.
$35,216,00443,201,25445,748,06818,425,81313,137,268
Total tax.
$4,819,51447,280,68959,670,46065,332,48833,301,12025,934,801
Corporations reporting no net income.
Num-ber re-portingno net
income.
4,0273,8903,3043,3574,0215,086
Percent of
totalnum-ber ineach
State.
41.1938.4737.5235.7440.6347.84
Gross income.
$85,875,061260,604,130287,836,252507,688,469531,960,098765,604,342
Deductions.
$100,473,717278,178,033329,234,541593,778,908618,167,551855,574,759
Deficit.
$14,598,65617,573,90341,398,28986,090,43986,207,45389,970,417
wH
lO
NEW MEXICO.
19161917 . . .1918191919201921
9791 103
965940797961
474542558494411392
48.4249.1457.8252.5551.5740.79
$38,929,15477,131,58177,236,22257,550,26449,452,65039,044,128
$23,790,95962,538,69370,607,47853,276,63245,466,66836,866,678
$15,138,19514,592,8886,628,7444,273,6323,985,9822,177.450
$303,499677,816598,115317,342306,396162,787
$2,526,876679,354259,796188,99253,752
$303,4993,204,6921,277,469
577,138495,388216,539
505561407446386569
51.5850.8642.1847.4548.4359.21
$3,782,1258,998,2149,791,69017,737,09518,251,61534,907,720
$4,886,26111,334,54412,046,96519,693,26821,699,09139,615,141
$1,104,1362,336,3302,255,2751,956,1733,447,4764,707,421
•QOgi
NEW YORK.
191619171918191919201921
44,63246,14447,53548.49455.49557,596
27,77729, 88027, 76030, 47030,34927,374
62.2464.7558.4062.8354.6947.53
$8,300,137,67115,974,590,51215,945,819,32718,656,719,06522,086,479,69415,668,883,094
$6,025,476,249 $2,13, 773,437,05613,792,501,55716,264,233,00120,127,849,97114,532,519,655
!, 274,661,4222,201,115,7462,153,317,7702,392,486,0641,958,629,7231,136,363,439
$44,464,771105,625,319171,758,980196,187,661167,141,669100,847,002
$288,845,332635,547,519305,280,094188,051,01567,633,509
$44,464,771394,470,651807,306,499501,467,755353,192,684168,480,511
16,85516,26419, 77518,02425,14630,222
37.7635.2541.6037.1745.3152.47
$662,271,2481,163,881,3591,751,135,4961,919,255,5895,354,318,2147,430,255,001
$801,492,4791,303,348,1731,920,890,2662,112,305,3545,825,586,1128,332,230,896
$139,221,231139,466,814169,754,770193,049,765471,267,898901,975,895

N O R T H C A R O L I N A .
191619171918191919201921
5,0215,1554,2124,3964,8124,914
3,4383,9863,3623,5013,1432,529
68.4777.3279.8279.6465.3151.47
$284,767,644698,770,100879,192,164
1,038,581,5961,062,447,593
688,791,323
$223,884,841607,161,979772,163,987923,900,230960,169, 824623,364,736
$60,882,80391,608,121
107,028,177114,681,366102,277,76965,426,5.°"
$1,200,1854,124, 7256,661,4198, 707,0817,985,0415,401,565
$16,228,37344,016,68021,102,83515,985, 2117,597,915
$1,200,18520,353,09850,678,09929,809,91623,970,25212,999,480
1,5831,169850895
1,6692,385
31.5322.6820.1820.3634.6948.53
$14,830,01024,218,41928,462,10141,551,748190.420,975216,924,727
SI 8,766,84727,609,56531,005,50245,214,471205,035,251239,349,459
$3.936,8373,391,1462,543,4013,662,723
14,614,27622,424,732
N O R T H D A K O T A .
1916191719181919192C1921
2,7693,1242,7522,6392,8982,819
2,2202,5592,2172,1351,7471,362
80.1781.9180.5580.9060.2848.32
$35,477,730149,014,213171,981,215156,461,674137,313,047
88,743,928
$24,813,309139,218,605162,080,654147,309,645130.445,44384,743,249
$10,664,4219,795,6089,900,5619,152,0296,867,6044,000,679
$207,064434,318681,512505,850383, 888229, 265
$1,710,368804,465498,789347,667108, 519
$207,0642,144,6861,485,9771,004,639731,555337,784
1,1,
549565535504151457
19.8318.0919.4519.1039.7251.68
$4,139,53013,319,17617,841,97416,911,97169,597,25657,795,313
$5,165,88914,402,57418,725,59918,326,47274,439,04463,289,978
$1,026,3591,083,398
883,6251,414,5014,841,7885,494,665
jooB
O H I O .
191619171918191919201921
17,66017,61515, 81517, 08818, 82220,091
12,25113,54611,39412,19412,3029,555
69.3776.9072.0571.3665.3647.56
$2,093,727,3996,247,325,2486,225,443,0576,158,568,2886,288,735,9913,079,639,495
$1,463,582,4215,310,828,4735,582,256,9245,539,310,0925.728,179,0742, 844,171,648
$630,144,978936,483, 205643,186,133619,258,196560,556,917235,467,847
$12,364,79942,578,49447,484,99948,737,52044,865,55019,421,710
$175,539, 209219,859,55699,422; 77581,397,00119,459,792
$12,364,799218,117,703;267,344,555,148,160,295!126,262, 551!38,881,502;
5,4094,0694,4214,8946,52010,536
30.6323.1027.9528.6434.6452.44
$132,267,179294,239, 846302,314,756503,983,805
1,468,065,4582,195,193,897
$155,301,837331,020,581331,122,460545,371,887
1,593,049,4482,533,982,101
$23,034,65836,780,73528,807,70441,388,082
124,983,990338,788,204
O K L A H O M A .
191619171918191919201921
7,1507,3646,3215,9045,5645,569
3,4313,8723,2613,2953,0042,301
47.9952.5851.5955.8153.9941.32
$240,799,628602,833,776488,641,109593,992,416839,249,463280,335,950
$128,460,7611525,855,544:451,014,7971552,370,029782,368,569262,605,974
$112,338,867!76,978,23237,626,31241,622,38756,880,89417,729,976
$2,196,340|3,679,908; $10,796,8172,917,199 - -" """3,018,7674,569, 8461,329,9741
7,407,3335,595,2544,984,4231,180,362
$2,196,34014,476,72510,324,5328,614,0219,554,2692,510,336
3,7193,4923,0602,6092,5603,268
52.0147.4248.4144.1946.0158.68
$16,071,03854,361,998154,108,455122,333,300289,631,316350,706,328
$22,198,01461,696,417166,082,509143,670,579316,245,924408,371,817
$6,126,9767,334,41911,974,05421,337,27926,614,60857,665,489

TABLE 12.—Corporation returns by years—State tables—Continued.
OREGON.00
Year.
191619171918191919201921
Totalnum-ber ofcorpo-rations.
5,0225,3524,3984,2524,5884,840
Corporations reporting net income.
Num-ber re-
portingnet in-come.
2,1082,6422,4212,2602,2361,948
Percent oftotalnum-ber ineachState.
41.9849.3655.0553.1548.7440.25
Gross income.
$88,606,622392,174,272609,778,017552,358,559472,286,247286,350,548
Deductions.
$69,874,112357,788,383575,083,694504,220,151432,764,431269,319,824
Net income.
$18,732,51034,385,88934,694,32348,138,40839,521,81617,030,724
Income tax.
$357,6441,633,6552,501,8483,148,2732,941,6461,302,255
War profitsand excessprofits tax.
$4,698,1159,776,075
11,827,8095,561,8841,066,433
Total tax.
$357,6446,331,770
12,277,92314,976,0828,503,5302,368,688
Corporations reporting no net«incojne.
Num-ber re-portingno net
income.
2,9142,7101,9771,9922,3522,892
Percent oftotalnum-ber ineachState.
58.0250.6444.9546.8551.2659.75
Gross income.
$47,184,56351,815,92253,616,292
126,701.583261,327,802244,782,121
Deductions.
$60,662,32960,219,31361,690,804
137,129,966284,525,639270,953,714
Deficit.
$13,477,7668,403,3918,074,512
10,428,38323,197,83726,171,593
( iain
PENNSYLVANIA.
191619171918,19191920.1921.
20,46020,83418,47316,94418,82719,806
12,89913,54411,99611,10012,0129,665
63.0465.0064.9465.5163.8048.80
$3,914,308,2888,860,256,5518,245,325,7577,511,000,2209,501,290,8505.603,662,666
$2,791,861,222 $17,383,784,9127,282,063,0186,608,271,5008,529,708,9665,171,862,460
,122,447,0661,476,497,279963,262,739902,728,720971,581,884431,800,206
$22,276,54564,582,45776,232,92172,770,21176,272,21636,338,551
$323,313,222309,029,821126,208,200132,498,63036,786,116
$22,276,545387,895,679385,262,742198,978,411208,770,84673,124,667
7,5617,2906,4775,8446,81510,141
36.9635.0035.0634.4936.2051.20
$223,858,463399,296,467462,099,295606,669,257
1,459,076,7082,261,443,672
$279,582,508453,344,135506,080,495658,884,288
1,565,729,5702,528,085,447
$55,724,04554,047,66843,981,20052,215,031106,652,862266,641,775
QO
BHODE ISLAND.
1916,19171918,1919,1920.1921.
2,1332,2711,6171,7481,8372,028
1,3531,3401,0231,1771,1461,043
63.4359.0063.2767.3362.3851.43
$238,936,962581,878,202658,081,073827,427,430645,783,316482,554,277
$167,062,686505,224,365579,681,618715,286,439589, 838,866437,710,694
$71,874,27676,653,83778,399,455112,140,99155,944,45044,843,583
$1,395,7663,502,0065,271,0188,411,3244,558,4893,793,32$
$13,734,70430,611,74522,621,5307,065,4004,654,670
$1,395,76617,236,71035,882,76331,032,85411,623,8898,447,999
780931594571691985
36.5741.0036.7332.6737.6248.57
$11,059,75233,628,58233,405,47650,802,282299,582,337215,930,001
$12,893,99036,431,40243,702,27456,377,503327,271,364250,418,098
$1,834,2382,802,82010,296,7985,575,31127,689,02734,488,097
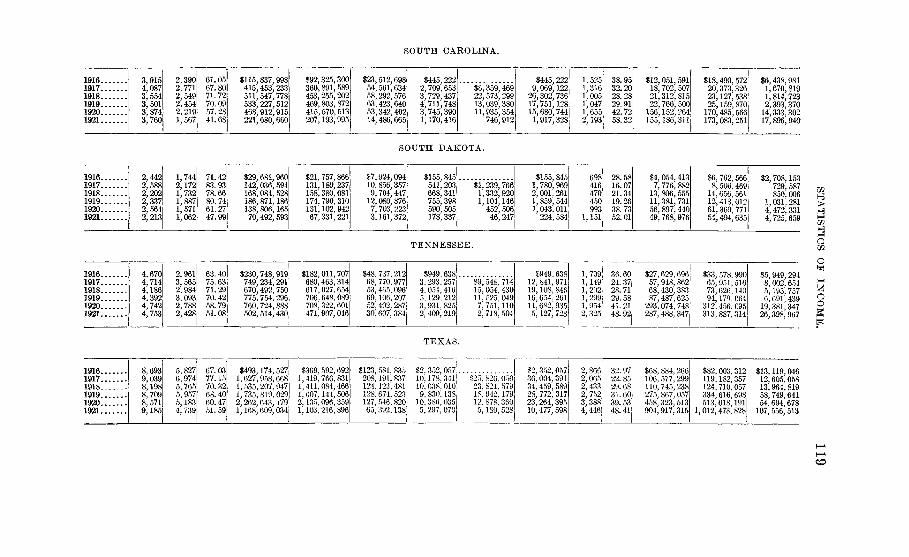
SOUTH CAROLINA.
19161917191819191920. . . .1921
3,9154,0873,5543,5013,8743,760
2,3902,7712,5492,4542,2191,567
61.0567.8071.7270.0957.2841.68
$115,837,998415,453,233511,547,778533,227,512468,912,915221,680, r —
$92,325,300360,891,589453,255,202469,803,872415,570,513207,193,f
$23,512,69854,561,63458,292,57663,423,64053,342,40214,486,665
$445,2222,709,6533,729,4374,711,7483,745,3901,170,416
$8,359,46922,573,29913,039,38011,935,354
746,912
$445,2229,069,12226,302,73617,751,12815,680,7441,917,328
1,1,1,1,1,2
525316005047655193
38.9532.2028.2829.9142.7258.32
$12,051,59118,702,50721,312,81522,766,500
156,152,264155,186,311
$18,490,57220,373,32623,127,53825,159,870
170,485,566173,083,251
$6,438,9811,670,8191,814,7232,393,370
14,333,30217,896,940
SOUTH D A K O T A .
191619171918191919201921
2,4422,5882,2022,3372,5642,213
1,7442,1721,7321,8871,5711,062
71.4283.9378.6680.7461.2747.99
$29,681,960142,036,594168,084, 528186,871,186138, 806,16570,492,593
$21, 757, 866131,180,237158,380,081174,790. 310131,102; 94267,331,221
$7,924,09410,856,3579,704,44712,080,8767, 703,2233,161,372
$155, 845541, 203668,341755,398590, 505178,337
$1,239, 7661,332,9201,104,146452,50646,247
$155, 8451, 780,9692,001,2611,859,5441, 043, Oil224,584
698416470450993
1,151
28.5816.0721.3419.2638.7352.01
$4,054,4137,776,88213,806, 55511,381,73156, 897,44049,768,976
$6,762,5668, 506,46914,656, 56112,413,01261,369,77154,494,635
$2,708,153729, 587850,006
1,031, 2814,472,3314,725,659
mH
5i i
in
aoin
T E N N E S S E E .
1916 . .19171918 .191919201921
4,6704,7144,1864,3924,7424,753
2,9613,5652,9843,0932,7882,428
63.4075.6371.2970.4258.7951.08
$230,748,919749,234,291670,492,750775,754,296760,724', 888502, 514,430
$182, Oil, 707680,463,314617,027,654706,648,089708,322,601471,907,046
$48,737,21268, 770,97753,465,09669,106,20752,402,28730,607,384
$949,638.3,293, 257|4, 054, 4165', 129, 2123, 931, 8252,409, 219
$9, 548, 71415,054,43011, 525, 0497, 751,1102, 718, 504
$949,63812,841,97119,108,84616,654, 26111,682,9355,127, 723
1,7091,1491,2021,2991, 9542,325
36.6024. 3728.7129.5841.2148.92
$27,629,69657,948, 86268,430,38387,487,62c
293,074, 748287,488,347
$33, 578,99065, 951,51673,626,14094,179,064312,456, 095313, 887,314
$5,949,2948,002,6545,195,7576,691.43919,38i; 34726,398, 967
3oo
TEXAS.
1916.1917191819191920.1921.
8,6939,0398,1988,7098,5719,185
5,8276,9745,7655,9575,1834,739
67.0377.1570.3268.4060.4751.59
$493,174,5271,627,958,6681, 535,207,9471, 735, 819,0292,262,643,1791,168,609,034
$369,592,6921,419,766,8311,411,084,4661, 607,144, 5062,135, 096,3591,103,216,896
$123, 581, 835208,191, 837124,123,481128, 674, 523127, 546. 82065,392,138
$2,352,057:.10,178,34l|10, 038, 010.9, 830,138|
10, 386, 0355, 297, 070
$25, 826,05023,821, 57918, 942,17912, 878,3605,180, 528
36,34,28,23,10,
352,004,459772,264,477,
057391589317395598
2,8662,0652,4332,7523,3884, 446
32.9722.8529.6831.6039.5348.41
$68,884,266106, 577,299110,745,238275, 867,05r458, 323, 513904,917,315
$82,003,312119,182,357124,710,057334,616,698513,018,191
1,012,473,828
$13,119,04612,605,05813,964,81958, 749,64154,694,678107,556,513
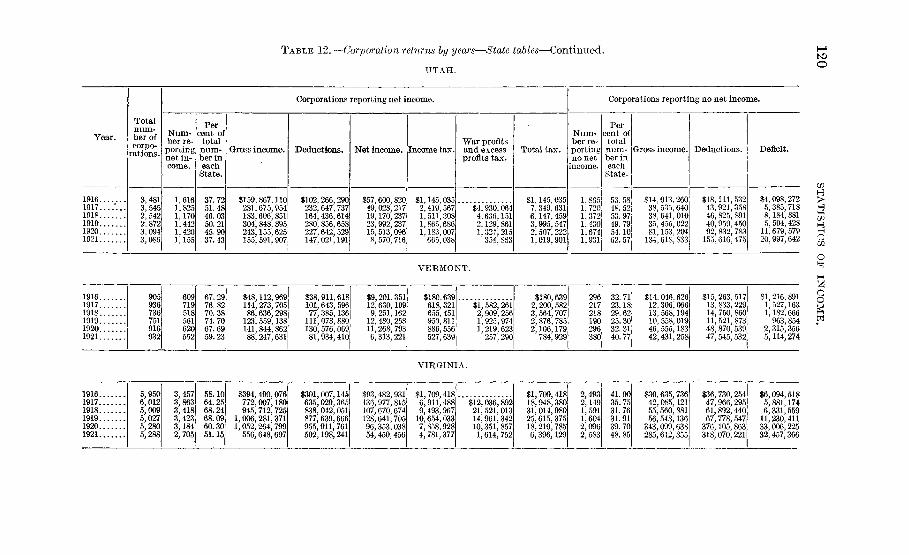
TABLE 12.—Corporation returns by years—State tables—Continued.
UTAH.too
Year.
19161917.../ . . .191819191920 .1921
Totalnum-ber ofcorpo-
rations.
3,4813,5452,5422,8723.0943,086
Corporations reporting net income.
Num-ber re-portingnet in-come.
1,6161, 8251,1701,4421,4201,155
Percent oftotalnum-ber ineachState.
37.7251.4846.0350.2145.9037.43
Gross income.
$159,867,110281,675,954183,606, 851304, 848, 895243,155,625155,591,907
Deductions.
$102,266,290232, 647,737164,436,614280, 856,658227,642,529147,021,191
Net income.
$57,600, 82049,028,21719,170,23723,992, 23715, 513,0968, 570, 716
Income tax.
$1,145,0352,419, 5671,511,3081,865,6861,183,007
665,038
War profitsand excessprofits tax.
$4,930,0644,636,1512,129, 8611,321,215
354,863
Total tax.
$1,145,0357,349, 6316,147, 4593,995, 5472,507, 2221,019,901
Corporations reporting no net income.
Num-ber re-portingnonet
income.
1,8651,7201,3721,4301,6741,931
Percent of
totalnum-ber ineach
State.
53. 5848.5253.9749.7954.1062.57
Gross income.
$14,013,26038, 535,64038,641, 01035, 455,02281,153,204
134,618,833
Deductions.
$18, 111, 53243,921,35846, 825, 89140, 959,45092, 832,783
155,616,475
Deficit.
$4,098,2725,385,7188,184, 8815,504,428
11,679,57920,997,642
in
OV E R M O N T .
191619171918191919201921
905936736751916932
609719518561620552
67.2976.8270.3874.7067.6959.23
$48,112,969114, 273, 70586,636,298123, 559,138141,844, 86288, 247,631
$38,911,618101,643, 59677,385,136111,078,880130, 576,06981,934,410
$9,201,12,630,9,251,12,480,11,268,6,313,
$180,639618,321655, 451950,811886,556527,639
$1, 582, 2612,909, 2561,925,9741,219,623257, r
$180,6392, 200, 5823,564, 7072,876, 7852,106,179
784,929
296217218190296380
32.7123.1829.6225.3032.3140.77
$14,046,12,306,06613, 568,19410, 558,01946,555,18342,431,—
$15,263, 51713,833,22914,750, 86011,521, 87348,870,53947,545,532
$1,216, 8911,527,1631,182,666
963, 8542,315,3565,114,274
oo
VIRGINIA.
191619171918191919201921
5,9506,0125,0095,0275,2805,288
3,4573,8633,4183,4233,1842,705
58.1064.2568.2468.0960.3051.15
$394,490,076772,007,180945, 712,725
1,006,281,3711,052,264,799556,648,697
$301,007,145635,029,365838,042,051877, 639,666955,911,761502,198,241
$93,482,931136,977, 815107, 670,674128,641, 70596,353,03854,450,456
$1, 709,4186,911,4889,493,96710,654,0337,858,9284,781,377
$12,036,89221, 521, 01314,961,34210,351,8571,614, 752
$1,709,41818,948,38031,014,98025,615,37518,210,7856,396,129
2,4932,1491,5911,6042,0962,583
41.9035.7531.7631.9139.7048.85
$30,635,73642,085,12155,560,88156, 548,136343,099,638285,612, 855
$36,730,25447,966,29561,892,44067,778, 547376,105,863318,070,221
$6,094,5185, 881,1746,331,55911,230,41133,006,22532,457,366
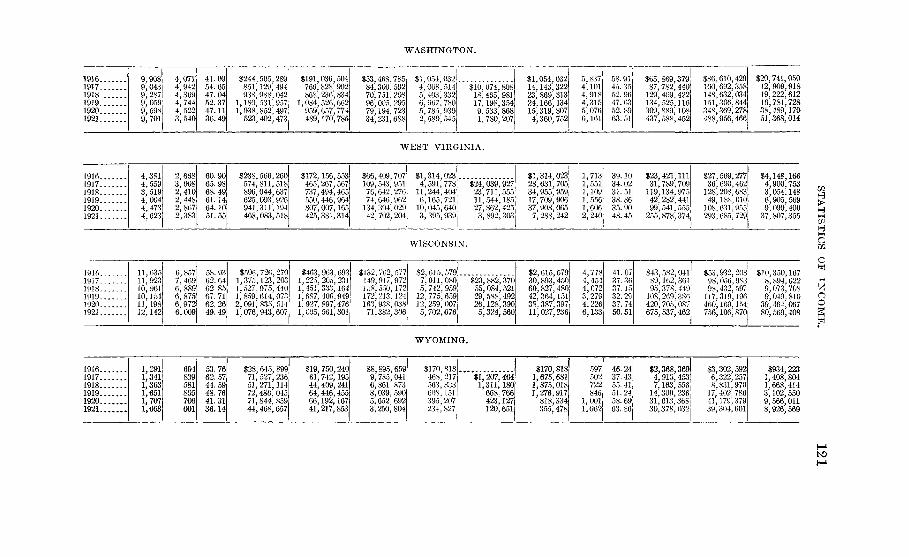
WASHINGTON.
1916.19171918191919201921
99,9,9,q9,
908043287059598701
A
4,4,4,4,3,
0719423697445??540
41.0954.6547.0452.3747.1136.49
$244851,938,
1,180,1,038,
523,
505129,988,531,85^402,
9sq'494042957;497:
473|
$191,766,868,
1,084,959,
036828.236,526,657
504902834662774
489,170,785
$5384,70,96,7934,
468 785300,592751.208005', 295194 723231,688
SI4,5,6;59*i
0>j068,403,967,785,
514332780Q3Q
580,545
$1018,1791
074, 808465, 981198,354533 868780,207
$114,23/24,15,4,
054 032143,322869,313166,134319, 807360,752
5 8374,1014,9184,3155,0766,161
58.9145. 3552. 9647. 6352.8963. 51
$6587,129,134,309,437,
869 379782,409,525880588,
440422116108452
$86,610,100,692,148,632,151,306.348,369^488,956,
429358034844?78466
$20,12,19,16,38,51,
741,909,222
m,489j368,
050918612728170014
WEST VIRGINIA.
191619171918191919201921
4 3814,5593,5194,0044 4734,623
2 6683,0082,4102,4482,8672,383
60.9065. 9868. 496164.51
141055
$238,566,574,811,896,044,625,093,941,311,
96051863799p,1Q4
468,083,518
$172,465,737,550,807,
156,553267,567494,465446, 964007.165
425,381,314
$66,109,76,74,134,42,
409,543,M?.646304;702,
7079512769620?q204
$1,4,116io;
314,591,24416504 S
3, 395,
n?3778404721640939
$24, 039,23,711.11.273
544;862,
927,^\1854?5<
892,303
$1,314 O23'28,631,70534,955,959,17,709, 90637,908,0657,288,242
11,1112,
713551109556606240
39.1034.0231.5138.8635.9048.45
$23,31,119,42,99,
255,
421.Ill789,709134,975282, 441541,555878,374
$27 569,27736,690,462128,208,68349,188;010108,631,955293,685,729
$4,148 1664,900,7533,054,1486,905,5699,090,400
37,807,355
WISCONSIN.
H>
uHO
1916.1917.1918.1919..1920..1921.
11,63511,92310, 96110,15411,19812,142
6,7,6,6,6r6,
857469889875972009
58626267.62.49.
936485712649
$596, 726,271,375,123,203!1,527,975,4401
$463, 963,6931,225,205,2311,451,333,164
1,859, 614, 073 1,687; 400', 9492,091, 835, 514 1,927, 897,4761,076, 943,607 1,005,561,301:
$132,149,158.172.'163,71,
762,577917, 972550.172213;124938, 038382,306
$2,615,5797,011,0805, 742, 959J
12'. 775, 659!12; 259, 00715,702,676,
$23,882,37055.084,52129, 588, 49226,128,3905,324, 560
$2,615,57930,893,45060,827,480!42,364,151138.387,397 jl i ; 027,236
4,7784, 4544,0723,2794,2266,133
4!373732.37.50.
073615297451
$43,582,04189,162,361!95,378,449
108,269.386'420,705; 087,675,537,462
$53,932,20,898,056,98398,432,5971
117,319,196460,169,154756,106,870
$10,350,1678,894,6229,073,7089,049,810
39,464,06780,569,408
3oog
WYOMING.
1916.19171918.191919201921
1,2911,3411,3031,6511,7071,663
694839581805706601
53.7662.5744.5948.7641.3136.14
$28. 645, 89971,' 527,23651, 271,11472, 486, 04571, 844, 85944,468,657
$19,750,24061,742,19544, 409,24164,446,45566,192,16741,217,853
$8,895,6599,785, 0416,861. 8738,039, 5905,652.6923,250,804
$170,818468, 217563, 838608,151395.2071234,827
$1, 207, 4641,311,180668766423; 127120,651
$170,8181,675,6811,875,0181,276,917818,334355,478
$2,368,3694,913,4537,163, 556
14,300,23631,613,368130,378,032
$3,302,5926,322,2578,831,970
17, 402.78641,179; 37939,304,601
$934,2231,408,8041,668,4143,102,5509,566,0118,926,569
fcO
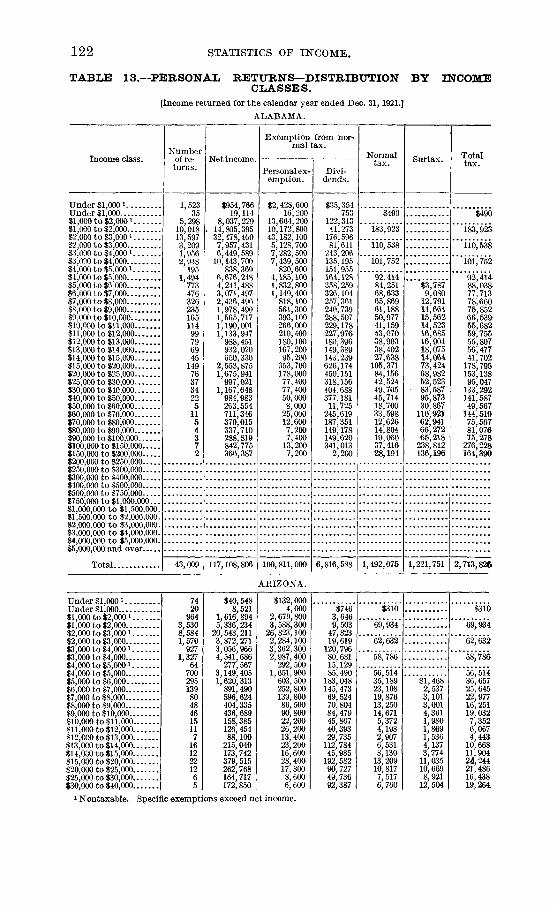
122 STATISTICS OF INCOME.
TABLE 13.—PERSONAL RETURNS—DISTRIBUTION BY INCOMECLASSES.
[Income returned for the calendar year ended Dec. 31, 1921.]
ALABAMA.
Income class.
Under $1,000!Under $1,000$1,000 to $2,0001$1,000 to $2,000$2,000 to $3,000 i$2,000 to $3,000$3,000 to $4,000!$3,000 to $4,000$4,000 to $5,0001$4,000 to $5,000$5,000 to $6,000$6,000 to $7,000$7,000 to $8,000$8,000 to $9,000$9,000 to $10,000$10,000 to $11,000$11,000 to $12,000$12,000 to $13,000$13,000 to $14,000$14,000 to $15,000$15,000 to $20,000$20,000 to $25,000$25,000 to $30,000$30,000 to $40,000$40,000 to $50,000$50,000 to $60,000$60,000 to $70,000$70,000 to $80,000$80,000 to $90,000$90,000 to $100,000 .$100,000 to $150,000$150,000 to $200,000$200 000 to $250 000..$250 000 to $300 000$300 000 to $400 000...$400 000 to $500 000..$500,000 to $750,000$750 000 to $1,000 000$1,000,000 to $1,500,000.$1,500,000 to $2,000,000.$2,000,000 to $3,000,000.$3,000,000 to $4,000,000.$4,000,000 to $5,000,000.$5 000 000 and over
Total
Numberof re-turns.
1,52335
5,29810,01813,5973,2091,9562,948
1951,494
77347632623516511499796945
149763734225
1154372
43,009
Net income.
$954,76619,114
8,037,229. 14,805,395
32,478,4607,957,4316,449,589
10,143,700838,369
6,676,2484,241,4883,071,4972,436,4901,978,4901,565,7171,190,0011,133,947
988,451932,020650,330
2,553,8751,675,941
997,0211,167,648
984,983263,554711,346370,015337,710288,819842,775366,387
Exemption from nor-mal tax.
Personal ex-emption.
$2,428,60016,200
13,664,20010,172,80043,182,1005,128,7007,282,5007,439,500
820,6004,185,1001,832,8001,149,400
818,100561,300393,100266,000210,400180,100167,20095,200
353,700178,00077,40077,40050,0008,000
25,00012,6007,2007,400
13,2007,200
117,108,806 100,811,000
Divi-dends.
$35,354753
122,31341,273
176,59681,611
243,206135,195151,955164,128358,259326,104257,361240,739288,507229,178227,976180,396149,389143,239626,174450,151318,156404,688377,18111,725
245,619187,351149,178149,620341,013
2,200
6,816,588
Normaltax.
$490
183,923
110,538
101,752
92,41484,25168,63365,86961,18850,97741,15943,07038,90338,40227,638
105,37184,15642,52449,70545,71418,70033,59812,62614,80410,06037,41628,194
1,492,075
Surtax.
$3,7879,080
12,79114,66415,56214,52316,68516,90418,07514,06473,42468,98252,523
• 83,58795,87330,867
110,92162,94166,27265,218
238,812136,196
1,221,751
Totaltax.
$490
183,923
ii6,538
101,752
92,41488,03&77,71378,66075,85266,53955,68259,75555,80756,47741,702
178,795153,13895,047
133,292141,58749,567
144,51975,56781,07675,278.
276,228164,390
2,713,82ft
ARIZONA.
Under $1,0001....Under $1,000$1,000 to $2,000i..$1,000 to $2,000....$2,000 to $3,000 i..S2,000 to $3,000....$3,000to$4,000i..$3,000 to $4,000....$4,000 to $5,0001..$4,000 to $5,000....$5,000 to $6,000...$6,000 to $7,000....$7,000 to $8,000....$8,000 to $9,000....$9,000 to $10,000...$10,000 to $11,000..$11,000 to $12,000..$12,CC0 to $13,000..$13,000 to $14,000..$14,000 to $15,000..$15,000 to $20,000..$20,000 to $25,000..$25,000 to $30,000..$30,000 to $40,000..
7420964
3,5308,5841,570927
1,32764700295139804846151171612221265
$40,5488,521
1,616, 8945,336,23420,543,2113,872,2713,056,9664,541,686277,567
3,149,4051,620,313891,490596,624404,335436,689158,385126, 45488,100215,040173,742379,515262,768164,717172,850
$132,0004,000
2,679,8003,588,30026,823,1002,284,1003,362,3002,987,400
292, 5001,651,900603,500252,800139, 80086,50090,80022,20026,20013, 40023,20016,60028, 40017, 800
6,600
$7463,6469,50347,82319,619120,79680,68115,12985, 490183,048145, 47369,52470,80484, 47945,86740,39329.735112,78445,985192,58290,72749.73692,387
$310
62,632
58,786
56,51435,18923,10819,87613,25014,6715,3724,1982,9076,5318,13013,20910,8177,5176,760
$1,4682,5373,1013,0014,3611,9801,8691,5364,1373,774
11,03510, 6698,921
12,504
$310
69,934
62,632
*58,*786
56,51436,65725, 64522,97716,25119, 0327,3526,0674,443
10,66811.90424,24421, 48616,43819,264
i Nontaxable. Specific exemptions exceed net income.

TABLE
STATISTICS OF INCOME.
13.—PERSONAL RETURNS—DISTRIBUTIONCLA S SE S—Continued.
ARIZONA—Continued.
123
BY INCOME
Income class.
$40,000 to $50,000$50,000 to $60,000$60,000 to $70,000$70,000 to $80,000.. . .$80,000 to $90,000$90 000 to $100,000$100,000 to $150,000$150 000 to $200,000...$200,000 to $250,000$250 000 to $300,000..$300,000 to $400,000$400,000 to $500,000$500,000 to $750,000$750,000 to $1,000,000...$1,000,000 to $1,500,000.$1,500,000 to $2,000,000.$2,000,000 to $3,000,000.$3,000,000 to $4,000,000.$4,000,000 to $5,000,000.$5,000,000 and overClasses grouped 2
Total
Numberof re-turns.
2
1
18,477
Net income.
(2)
(2)
$175,872
48,310,197
Exemption from nor-mal tax.
Personal ex-emption.
(2)
(2)
$4,900
45,146,700
Divi-dends.
(2)
(2)
$167,598
1,804,555
Normaltax.
(2)
(2)
$128
419,839
Surtax.
(2)
(2)
$25,905
96,798
Totaltax.
(2)
(2)
$26,033
516,637
ARKANSAS.
Under $1,000!Under $1,000$1,000 to $2,0001$1,000 to $2,000$2,000 to $3,000 i$2,000 to $3,000$3,000 to $4,000 i$3,000 to $4,000$4,000 to $5,0001$4,000 to $5,000$5,000 to $6,000$6,000 to $7,000$7,000 to $8,000$8,000 to $9,000$9,000 to $10,000$10,000 to $11,000$11,000 to $12,000$12,000 to $13,000$13,000 to $14,000$14,000 to $15,000$15,000 to $20,000$20,000 to $25,000$25,000 to $30,000$30,000 to $40,000$40,000 to $50,000$50,000 to $60,000$60,000 to $70,000$70,000 to $80,000$80,000 to $90., 000$90 000 to $100 000
$100,000 to $150,000$150 000 to $200 000$200*000 to $250 000..$250 000 to $300 000$300'000 to $400 000..$400 000 to $500 000$500'000 to $750 000 .$750'000 to $1 000,000$1,000,000 to $1,500,000.$1,500,000 to $2,000,000.$2,000,000 to $3,000,000.$3,000,000 to $4,000,000.$4,000,000 to $5,000,000.$5 000 000 and over. . .Classes grouped2 . .
Total
1,96560
4,2286,409
10,9452,4061,2682,451
1251,666
67937729417612711075686937
12560383921
4133
1
33,830
$890,49936,855
6,564,7699,445,382
26,063,5605,984,2694,212,6018,431,246
539,6177,445,6073,697,4612, 439,3942,203,0321,492, 4081,206,4901,147,469
864,101851,268931, 824535,418
2,150,3821,351, 8411,028, 5121,335,651
911,658216,620
215,529247,145
(2)
176,295
92,616,903
$3,999, 400
11,295,7006,431,400
34, 435, 9003,748,1004,617, 8006,005,000
476,1004,527,8001,609, 800
884, 600695, 600376,000309,500267,000181,700151, 800153,90081,300
283, 400131, 80093,00088,90044,5009,600
( 2U4,400
(2)
3,400
80,913,600
$145,5002,502
380,08538,234
245,99454,971
253,261120,650101,335224,373320,910263,151276,963233,896149,975167,968208, 99592, 478
207,690112,884400,322249,572192, 754471,535172,53546,078(2)49,23880,461
(2)
3
5,264,313
$1,379
118,701
87,411
92,362
108,29373,30656,05659,25347,50841,30440,56535,02838,25739,21421,93098,72171,14153,28461,32751,39912,731(2)12,29011,494
(2)
13,153
1,246,107
$3,0707,333
11,63611,32712,02214,29512,77414,67918,32911,77661,35956,83954,97895,40285,86425,891(2)35,53447,235
(2)
$1,379
118,701
87,411
92,362
108,29376,37663,38970,88958,83553,32654,86047,80252,93657, 54333,706
160,080127,980108,262156,729
• 137,26338,622
47,82458,729
(2)
i39,714 52.867
620,057 j 1,866,164
1 Nontaxable. Specific exemptions exceed net income.2 Classes grouped to conceal net income and identity of taxpayers.
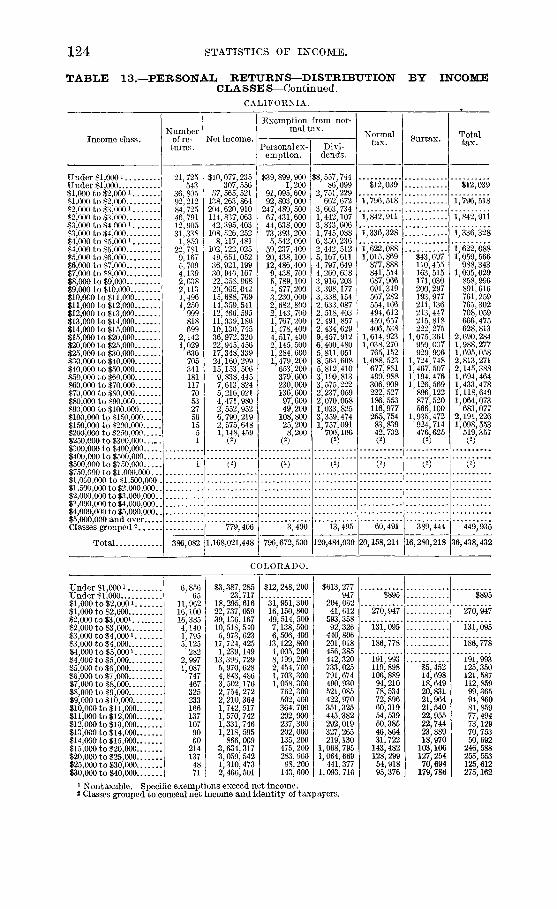
124 STATISTICS OF INCOME.
TABLE 13.—PERSONAL RETURNS—DISTRIBUTION BY INCOMECLASSES—Continued.
Income class.
Under $1,000 iUnder $1,000$1,000 to $2,0001$1,000 to $2.000$2,000 to $3',000 i$2,000 to $3,000$3,000 to $4,0001$3,000 to $4,000...$4,000 to $5,0001$4,000 to $5,000$5,000 to $6,000$6,000 to $7,000$7,000 to $8,000$8,000 to $9,000$9,000 to $10,000$10,000 to $11,000$11,000 to $12,000$12,000 to $13,000$13,000 to $14,000$14,000 to $15,000$15,000 to $20,000$20,000 to $25,000$25,000 to $30,000$30,000 to $40,000$40,000 to $50,000$50,000 to $60,000$60,000 to $70,000$70,000 to $80,000$80,000 to $90,000$90,000 to $100,000$100,000 to $150,000$150,000 to $200,000$200,000 to $250,000$250,000 to $300,000$300 000 to $400 000$400,000 to $500,000$500,000 to $750,000$750 000 to $1 000 000$1,000,000 to $1,500,000 .$1 500 000 to $2 000 000$2,000,000 to $3,000,000..$3,000,000 to $4,000,000..$4,000 000 to $5 000 000$5 000 000 and overClasses grouped2
Total
Numberof re-turns.
21,725543
36,80592,21284,72546,79112,90531,338
1,85022,7S19,1675,7094,1392,6382,1131,4961,250
999818699
2,1421,029
636705341181117705327561551
1
386,082
CALIFORNIA.
Net income.
$10,077,235307,556
57,565,521138,263,864204,620,910114,837,06342,395,403
108,526,2528,117,481
102,122,02549,651,05236,921,19930,940,16722,358,96820,065,04215,688,76914,359,54112,466,59511,039,18610,130,74536,972,32022,945,45617,348,33924,160,29915,153,5069,838,4457,613,8245,216,0214,471,9802,552,9526,790,2192,575,6481,148,459
(2)
(2)
779,406
1,168,021,448
Exemption from nor-mal tax.
Personal ex-emption.
$39,899,9001,200
91,095,60092,803,000
247,480,50067,431,60044,638,00073,393,2005,542,000
59,237,40020,438,10012,486,4009,438, 7005,789,1004,577,2003,230,0002,682,8002,143, 7001,767,2001,478,4004,517,4002,145,5001,284,6001,479,200
653,200379,600230,000136,60097,60049,200
108,80025,2008,200
(2)
(2)
3,400
796,672,500
Divi-dends.
58,557,74486,099
2,751,229662,672
3,663, 7341,442,1073,833,6061,745,0886,350,2362,442,5125,167,6114,797,6494,260,6383,916,2033,398,1773,338,1542,633,0872,518, 4032, 491,8572,434,6299,457,9126,400,4805,811,0518,564,6085,812,4103,199,8133,575,2222,237,0592,070,0581,033,8253,359,4741,757,091
700.106(25
(2)
13,495
120,484,039
Normaltax.
$12,039
1,796,518
1,842,911
1,336,328
1,622,0881,015,869
877,888841,514687,966691,319567,282554,166494,612450,657406,538
1,614,9231,038,270
765,1521,088,523
677,881499,988306,909222,527186,553116,977255,75483,83942,732(a5
(2)
60,491
20,158,214
Surtax.
$43,697110,455163,515171,030200,297193,977211,136213,447215,818222,275
1,075,361950,007929,906
1,724,7481,467,5071,194,4761,126,569
896,122877,520566,100
1,935,472924,714476,625(*5
(2)
389,444
16,280,218
-
Totaltax.
$12,039
1,796,518
1,842,911
1,336,328
1,622,0881,059,566
988,3431,005,029
858,996891,616761,259765,302708,059666,475628,813
2,690,2841,988,2771,695,0582,813,2712,145,3881,694,4641,433,4781,118,6491,064,073
683,0772,191,2261,008.553
519; 357(2)
(2)
449,935
36,438,432
COLORADO.
Under $1,000!Under $1,000$1,000 to $2,0001..$1,000 to $2,000....$2,000 to $3,000!..$2,000 to $3,000....$3,000 to $4,000i. .$3,000 to $4,000....$4,000 to $5,000i..$4,000 to$5,000.. . .$5,000 to $6,000....$6,000 to $7,000....$7,000 to $8,000....$8,000 to $9,000....$9,000 to $10,000...$10,000 to $11,000..$11,000 to $12,000..$12,000 to $13,000..$13,000 to $14,000..$14,000 to $15,000..$15,000 to $20,000..$20,000 to $25,000..$25,000 to $30,000..$30,000 to $40,000..
6,85665
11,96216,10016,3854,1401,7955,125
2822,9971,087
7474673252331661371079060
2141374871
$3,387,28523, 717
18,295,61622,737,05939,136,16710,518,5405,973,623
17,724, 4251,239,149
13,396,7295,970, 6284,843, 4863,502,1762,754, 2722,210,3641,742, 5171,570, 7421,331,7461,218, 595
866, 0693, 634,3173,059, 5421,310,4732, 466,501
$12,248,200
31,951,30016,150,80049,514,5007,138, 5006,506, 400
13,122, 8001,005, 2008,199, 2002, 454, 7001, 703,3001,058,300
762,300502, 400364,700292,900237,300202, 000135,200475, 200283, 900
98, 200143, 600
$613,277947
204,06241,612
593,35892,326
440,806201, 018456,385442,320733,025791,674490,930521,085422,970351,325445,382292,019327,265219,130
1,068,7951,064,669
441,3771,093,716
270,947
131,095
186,778
191, 993119, 898106,88994,21078,53472,89660,31954,53950,38546,86431,722
143,482128,29954,91895,376
$5, 45214, 69818,64920,83121,96421,54022,95522,74423,88918,970
103,106127,25470,694
179,786
$895
"276," 947
"ill," 095
186,778
191,993125,350121, 587112, 85999,36594,86081, 85977, 49473,12970,75350,692
246,588255,553125,612275,162
1 Nontaxable. Specific exemptions exceed net income.2 Classes grouped to conceal net income and identity of taxpayers.

STATISTICS OF INCOME. 125
TABLE 13.—PERSONAL RETURNS—DISTRIBUTION BY INCOMEC LA S SE S—Continued.
COLORADO—Continued.
$40,000 to $50,000$50,000 to $60,000$60,000 to $70,000$70,000 to $80,000$80,000 to $90,000$90,000 to $100,000$100,000 to $150,000$150,000 to $200,000$200,000 to $250,000$250,000 to $300,000$300 000 to $400 000$400 000 to $500,000.. .$500 000 to $750 000$750 000 to $1,000,000$1 000 000 to $1 500 000$1,500,000 to $2,000,000..$2 000 000 to $3 000 000$3 000 000 to $4 000 000$4,000,000 to $5 '000,000.$5 000 000 and overClasses grouped 2
Total
Numbernf roturns.
3314123428211
69,676
$1,449,421760,647771,906226,351337, 775188,987982,762342,319(2)(2)
517,074174,490,980
Exemption from nor-mal tax.
Personal ex-emption.
$64,80024,60017,4007,2009,2004,400
14,8002,000
(2)(2)
2,800154,698,100
Divi-dends.
$894,608366,985569, 848194,03962,645
126,7311,115,597
384,901(2)(2)
544,06215,608,889
Normaltax.
$43,11729,19719, 4261,762
20,6176,761
18,0327,947
(4(2)
1,0262,067,924
$138,48592,248
112,92239, 40166, 40541,847
283,115122,719
(2)(2)
225,2641,794,938
Totaltax.
$181,602121,445132,34841,16387,02248,608
301,147130,666(2)(2) -
226,2903,862,862
Under $l,000iUnder $1,000$1,000 to $2,000 i$1,000 to $2,000$2 000 to $3 000 l
$2,000 to $3,000$3,000 to $4,000 i$3,000 to $4,000$4 000 to $5 000 l . . .$4,000 to $5,000$5,000 to $6,000$6,000 to $7,000..$7,000 to $8,000$8,000 to $9,000$9,000 to $10,000$10,000 to $11,000$11,000 to $12,000$12,000 to $13,000$13,000 to $14,000$14,000 to $15,000$15,0u0 to $20,000$20,000 to $25,000$25,000 to $30,000$30,000 to $40,000$40,000 to $50,000$50,000 to $60,000$60,000 to $70,000$70,000 to $80,000$80,000 to $90,000$90,000 to $100,000$100,000 to $150,000$150,000 to $200,000$200,000 to $250,000$250,000 to $300,000$300,000 to $400,000$400,000 to $500,000$500,000 to $750,000$750,000 to $1,000,000...$1,000,000 to $1,500,000..$1,500,000 to $2,000,000..$2,000,000 to $3,000,000..$3,000 000 to $4 000,000$4,000,000 to $5,000,000..$5,000,000 and over
Total
8,879381
18,24736,57125,7757,7463,5326,766
9844,8492,3011,5121,000
727540461364280247193722375230248130
' 714925221119732
123,269
CONNECTICUT
$4,631,461187,520
27,484,99051,174, 23461,460,32019,344,18911,773,52223,336,4194,326,775
21,736,90712,504, 2189,805,8687,459,7936,166,5035,106,3174,845,0574,185,0463,497,7683,332,1962,797,906
12,446,4128,351,9156,264,5078,557,1305,789,8593,925,4203,137,8761,845,5581,866,3841,032,6742,261,4721,182,542
675,719522,703
343,017,180
$15,696,400400
44,707,30036,621,00077,655, 50012,112,30012,189,40016,466,1003, 261, 200
12,651,8005,004,6003,273,1002,131,4001,511,8001, 111, 400
930,600751,000558,800475,600392,400
1,459,200748,200439,400475,700225,200133,40085,90047,00040,00019,80034,10012,6003,8005,200
251,231,600
$4,861,32654,561
1,668,485331, 975
2,725, 504715, 753
1,971, 252958,971
1,991,3051,384,5862,741,6712,411,9022,001,4972,116,0761,669,2631,985,7271,558,7191,477,7271, 596,2291, 202,6935,668,4304,433,1513,365,0805,097,0234,121,9952,686,0992,215,0261,140,0441,731,917
738,0091,825,405
513,845620,166619,698
70,201,110
$5,332
568,970
259,100
239,435
310,893212, 257187,598163,369146,919137,530127,617124,57793,24698,86386, 292
391,939264,252188,872252, 204138,731114,18487,96947,69051,64621,89750,64751,5635,1575,381
4,434,130
$10,17829,70939,48646,87150,87860,16461,78159,92965, 23460,923
365,302344,561336,262618,339562,320485,504456,959313,187368,681227, 257634,654420,795277,961301,980
6,198,915
$5,332
568,970
259,100
239,435
310,893222,435217,307202,855193,790188,408187,781186,358153,175164,097147,215757,241608,813525,134870,543701,051599,688544,928360,877420,327249,154685,301472,358283,118307,361
10,633,045
1 Nontaxable. Specific exemptions exceed net income.3 Classes grouped to conceal net income and identity of taxpayers.
00729°— 23 9
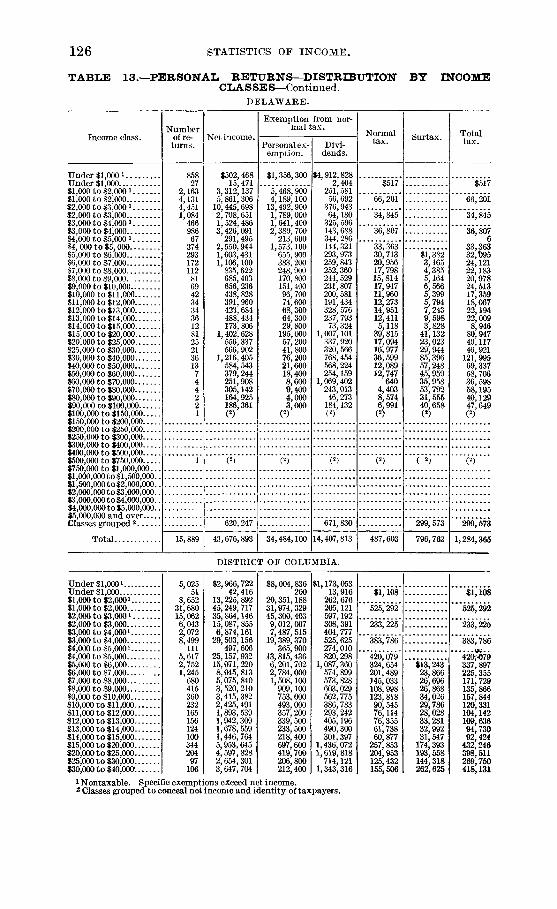
126 STATISTICS OF INCOME.
TABLE 13.—PERSONAL RETURNS—DISTRIBUTIONCL A S SE S—Continued.
DELAWARE.
BY INCOME
Income class.
Under $1,000 iUnder $1,000$1,000 to $2,000 i$1,000 to $2,000$2,000 t o $3,000i$2,000 to $3,000$3,000 t o $4,000 i$3,000 to $4,000$4,000 to $5,000 i$4, 000 to $5,000$5,000 to $6,000$6,000 to $7,000$7,000 to $8,000$8,000 to $9,000$9,000 to $10,000$10,000 to $11,000$11,000 to $12,000$12,000 t o $13,000$13,000 to $14,000$14,000 to $15,000$15,000 t o $20,000$20,000 to $25,000$25,000 to $30,000$30,000 to $40,000$40,000 to $50,000$50,000 to $60,000$60,000 to $70,000$70,000 t o $80,000$80,000 to $90,000$90,000 to $100,000 .$100,000 to $150,000$150,000 to $200,000..$200 000 to $250 000$250 000 to $300 000$300 000 to $400 000$400,000 to $500,000...$500,000 to $750,000$750 000 to $1 000 000$1,000,000 to $1,500,000..$1,500 000to $2 000,000$2 000 000to$3 000 000$3,000,000 to $4,000,000$4,000,000 to $5,000,000$5,000,000 and overClasses grouped2
Total
Numberof re-turns.
85827
2,1634,1314,4511,084
46698667
374293172112816942343436128125213613744221
1
15,889
Net income.
$502,46815,471
3,312,1375,861,306
10,445,6982,708,6511,524,4863,426,091
291,4952,550,9441,603,4311,106,100
835,622685,403656, 236438, 828391,960423, 684488,434173, 806
1,402,628556,337566,902
1,216,405584,543379,244251,908305,142164,925186,361(2)
(2)
620,247
43,676,893
Exemption from nor-mal tax.
Personal ex-emption.
$1,356,300
5,468,9004,189,100
13,492,9001,789,0001,641,4002,380,700
213,6001,573,100
655,900383, 200248,900170, 800151,40096,70074,60068,30064,30029,800
195,00057,20041,80076,20021,60018,4008,6009,4004,0003,000
(2)
34,484,100
Divi-dends.
$4,912,8282,404
251,58156,692
376,94364,180
325,596143,688344, 286144,321293,973259,843252,360244, 529231, 807200, 581191,434328,576237,79373,324
1,007,101337,920320,566768,454568,224254,159
1,069,402243,01346,273
184,132(2)
(2)
671,830
14,407,813
Normaltax.
$517
66,201
34,845
36,807
33,36330,71320,95617,79815,81417,94711,96012,27314,95112,4115,118
39,81517,09416,97736,59912,08912,747
6404,4038,5746,991
(25
(2)
487,603
Surtax.
$1,3823,1654,3855,1646,5665,3995,7947,2439,5983,828
41,13223,02329,94485,39657,24845,95935,95853,79231,55540,658(25
( 2)
299,573
796,762
Totaltax.
$517
66,201
34,845
36,8076
33,36332,t)9524,12122,18320,97824,51317,35918,06722,19422,0098,946
80,94740,11746, 921
121,99569,33758,70636,59858,19540,12947,649(2)
(2)
299,573
1,284,365
DISTRICT OF COLUMBIA.
Under $l,000iUnder $1,000$1,000 to $2,000i...$1,000 t o $2,000....$2,000 t o $3,0001..$2,000 to $3,000....$3,000 to $4,000i...$3,000 to $4,000....$4,000 t o $5,0001...$4,000 to $5,000....$5,000 t o $6,000....$6,000 to $7,000....$7,000 to $8,000....$8,000 to $9,000....$9,000 to $10,000...$10,000 to $11,000..$11,000 to $12,000..$12,000 to $13,000..$13,000 to $14,000..$14,000 to $15,000..$15,000 to $20,000..$20,000 t o $25,000..$25,000 t o $30,000..$30,000 t o $40,000*..
5,02551
8,65231,68015,0626,0432,0728,499
1115,6172,7521,245
68041536023216515612410034420497
106
$2,966,72242,416
13,225, 89245,249, 71735,864,14615,087, 8556,874,161
29,503,156497, 606
25,157, 93215,071, 2208,045, 8135,075,8403,520, 2103,415,3822,425,4911,893, 5391,942,3091,678,5591,446,7645,953, 6454,597, 8282,654,3013,647, 704
$8,004,836200
20,351,18831,974,32945,300,4039,012,0077,487, 515
19,389,370365, 900
13,815,4366,201,7022,784,0001,508,100
909,100753,000493,000357, 200339,500233, 500218,400697, 600419,700206,800212,400
$1,173,05313,916
262,676205,121597,192308,391404,777525, 625274,010820, 298
1,087,360574, 899573, 828603,029562,775386,783293, 242405,196490,300301,397
1,436,0721,619,818
714,1211,343,316
$1,108
'525*292'
233,225
383,786
420,079324, 654201,489145,033108,998123, 81890,54576,11476,35561,73860,877
257,853204,953125,432155,506
$13,24323,86626,69626,86834,02629,78628,02833,28132,99231,547
174,393193,558144,318262,625
$1,108
525,292
233,225
383,786
420^79337, 897225, 355171, 729135, 866157,844120,331104,142109,63694,73092,424
432,246398,511269,750418,131
1 Nontaxable. Specific exemptions exceed net income.z Classes grouped to conceal net income and identity of taxpayers.
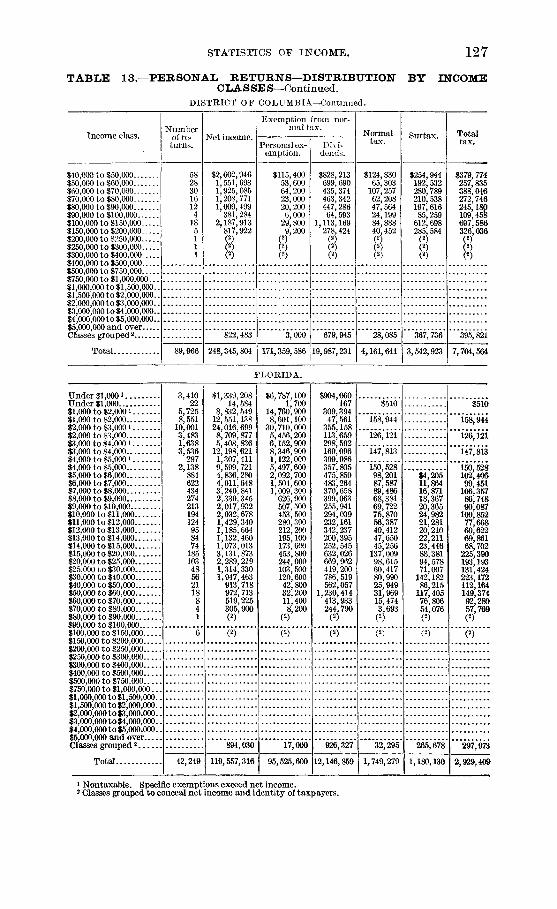
STATISTICS OF INCOME. 127
TABLE 13.—PERSONAL RETURNS—DISTRIBUTIONC LA S SE S—Continued.
BY INCOME
$40,000 to $50,000$50,000 to $60,000$60,000 to $70,000$70,000 to $80,000$80,000 to $90,000$90,000 to $100,000..$100,000 to $150,000$150,000 to $200,000$200,000 to $250,000$250,000 to $300,000$300,000 to $400,000$400,000 to $500,000$500,000 to $750,000$750,000 to $1,000,000...$1,000,000 to $1,500,000..$1,500,000 to $2,000,000..$2,000,000 to $3,000,000..$3,000,000 to $4,000,000..$4,000,000 to $5,000,000..$5,000,000 and overClasses grouped2
Total
DISTRICT OF
Numberturns.
58283016124
185111
89,966
$2,602,9461,551,6931.925,0851,208,7711,009,499
381,2842,187,913
817,922(2)(2)(2)
822,483
248,345,804
COLUMBIA—Continued.
Exemption from nor-mal tax.
Personal ex-emption.
$115,40053,60064,20023,00020,2006,000
29,8009,200
(2)(2)(2)
3,666
171,359,586
Divi-dends.
$828,213699,690435,374463,342447,28664,593
1,113,169278,424
(2)(2)(2)
679,945
19,987,231
Normaltax.
$124,83065, 303
107,25762,20847,56424,19984,88840,452(2)(2)(2)
28,085
4,161,641
Surtax
$254,944192,532280,789210,538197,61685,259
612,698285,584
(25(2)(2)
367,736
3,542,923
Totaltax.
$379,774257,835388,046272,746245,180109,458697,586326,036(2)(2)(2)
395,821
7,704,564
FLORIDA.
Under $1,0001Under $1,000$1,000 to $2,0001$1,000 to $2,000$2,000 to $3,000 i$2,000 to $3,000$3,000 to $4,000 i$3,000 to $4,000$4,000 to $5,0001$4,000 to $5,000$5,000 to $6,000$6,000 to $7,000$7,000 to $8,000$8,000 to $9,000$9,000 to $10,000$10,000 to $11,000$11,000 to $12,000$12,000 to $13,000$13,000 to $14,000$14,000 to $15.000$15,000 to $20,000$20,000 to $25,000.......$25,000 to $30,000$30,000 to $40,000$40,000 to $50,000$50,000 to $60,000$60,000 to $70,000$70,000 to $80,000$80,000 to $90,000$90,000 to $100,000 . .$100,000 to $150,000$150,000 to $200,000 .$200,000 to $250,000$250,000 to $300,000$300,000 to $400,000$400,000 to $500,000$500,000 to $750,000 . . .$750,000 to $1,000,000...$1,000,000 to $1,500,000..$1,500,000 to $2,000,000$2,000,000 to $3,000,000..$3,000,000 to $4,000,000$4,000,000 to $5,000,000..$5,000,000 and overClasses grouped2
Total
3,41022
5,7258,551
10,0013,4831,6383,536
2972,138
884622434274213194124958474
18510348562118841
6
42,249
$1,339,20814,584
8,832,54912,551,13824,016,6998,709,8775,408,836
12,198,6211,307,4119,599,7214,836,2804,011,6483,240, 8412,330,3452,017,9322,032,6781,429,3401,185,6641,132,4601,073,0133,131,8732,289,2191,314.3301.947,463' 913,718972,713519,225305,900
(2)
894,030
119,557,316
$6,787,1001,700
14,760,9008,601,100
30,710,0005,456,2006,152,9008,346,9001,122,0005,497,6002,092,7001,504,6001,009,300
626,900507,500453, 500280,300212,200195,100173,600453,800244,000103, 500120,60042,80032,20011,4008,200
(2)
17,000
95,525,600
$904,060167
309,39447,561
355,158113,659298,592169,096399,986357,805475,850483,264370,658399,063255,941294,039232,161342,237200,395252,545632,026669,962419,200786,519562,057
1,230,414413,933244 790
(2)
926,327
12,146,859
$510
158,944
126,121
147,813
150,52898,20187,58789,48668,38169,72275,87056,38740,41247,65045,256
137,00998,61560,41780,99025,94931,96915,4743,693
(2)
32,295
1,749,279
$4,20511,86416,87118,36720,36524,98221,28120,21022,21123,44688,38194,57871,007
142,18286,215
117,40576,80654,076
(2)
265,678
1,180,130
$510
158,944
126,121
147,813
150,528102,40699,451
106,35786,74890,087
100,85277,66860,62269,86168,702
225,390193,193131,424223,172112,164149,37492,28057,769
(2)
297,973
2,929,409
1 Nontaxable. Specific exemptions exceed net income.2 Classes grouped to conceal net income and identity of taxpayers.

128 STATISTICS OF INCOME.
TABLE 13.—PERSONAL RETURNS—DISTRIBUTIONCLASSES—Continued.
GEORGIA.
BY INCOME
Income class.
Under $1,0001Under $1,000$1,000 to $2,000!$1,000 to $2,000$2,000 to $3,000!$2,000 to $3,000$3,000 to $4,000!..$3,000 to $4,000$4,000 to $5,0001$4,000 to $5,000$5,000 to $6,000$6,000 to $7,000$7,000 to $8,000$8,000 to $9,000$9,000 to $10,000$10,000 to $11,000$11,000 to $12,000$12,000 to $13,000$13,000 to $14,000$14,000 to $15,000$15,000 to $20,000$20,000 to $25,000$25,000 to $30,000$30,000 to $40,000$40,000 to $50,000$50,000 to $60,000$60,000 to $70,000$70,000 to $80,000$80,000 to $90,000$90,000 to $100,000 ,$100,000 to $150,000$150,000 to $200,000$200 000 to $250 000$250^000 to $300,000$300 000 to $400,000 . .$400,000 to $500,000$500,000 to $750,000 . . .#750 000 to $1 000 000$1,000,000 to $1,500,000.$1 500,000 to $2,000 000$2,000,000 to $3,000,000.$3 000,000 to $4,000,000.$4 000 000 to $5 000,000$5,000,000 and overClasses grouped 2 . . . . . .
Total
Numberof re-turns.
5,26183
10,73911,83920,1764,5782,7984,995
2172,9841,088
7054823212521951541059667
228122687033301442481
67,719
Net income.
$2,462,50750,362
16,175,80117,622,87548,023,69211,468,2209,316,840
17,390,761943,880
13,325,6975,941,1414,546,8673,592,5452,717,7152,393,8992,046,0391,769,6061,313,4011,297,983
972,2443,925,1452,716,6181,863,1482,439,1011,477,2791,631,601
899,147311,656172,358380,609(2)(2)
1,122,729
180,311,466
Exemption from nor-mal tax.
Personal ex-emption.
$10,208,7005,900
26,877, 20012,023,00063,243,9007,205,500
10,427,40012,422,200
853,2008,370,1002,689,0001,700,2001,135,300
763,700601,600447,900362,200237,600217,600154,100537,100279,800154,600151,20065,00059,80030,6008,0002,000
10,000(2)(2)
18,400
161,262,800
Divi-dends.
$174,0852,762
84,45142,499
297,452121,383234,635232,899263,068300,219577,787593,995678,713623,480444,539472,332418,955406, 111277,096409,386
1,009,641710,446
1,024,357595,820526,217982,512204,60521,432
179,11085,814(25(2)
714,751
12,710,552
Normaltax.
$1,674
222,326
164,360
188,706
187,620113,12498,26690,66575,57176,56066,54160,31449,02450,43938,241
160,680118,91067,798
120,72465,02962,34650,67721,954
61822.144(2
(2)
33,645
2,207,956
Surtax.
$5,09613,34218,71520,63924,86525,27326,13423,09525,38721,471
113,553111,332100,656177,830144,150198,344131,37556,12034,62085,015(2)(2)
327,677
1,684,689
Totaltax.
$1,674
222,326
164,360
188,706
187,620118,220111,608109,38096,210
101,42591,81486,44872,11975,82659,712
274,233230,242168,454298,554209,179260,690182,05278,07435,238
107,159
361,322
3,892,645
HAWAII.
Under $1,0001Under $1,000$1,000 to $2,0001$1,000 to $2,000$2,000 to $3,0001$2,000 to $3,000$3,000 to $4,0001$3,000 to $4,000$4,000 to $5,0001$4,000 to $5,000$5,000 to $6,000$6,000 to $7,000$7,000 to $8,000.$8,000 to $9,000$9,000 to $10,000$10,000 to $11,000$11,000 to $12,000$12,000 to $13,000$13,000 to $14,000$14,000 to $15,000$15,000 to $20,000$20,000 to $25,000$25,000 to $30,000$30,000 to $40,000
55618
1,6832,3562,2141,092
5201,162
80715318179996546454035272760382228
$262,18111,942
2,546,1693,471,6985,403,3932,750,2681,749,4274,041,463
336,3603,184,7111,720,2881,158,275
736,655552,740434,207473,065458,007436,417362,564401,739
1,022,384838,316601,115983,173
$1,163,900
4,999,9002,383,0007,609,5001,634,1001,971,0002,784,700
290,3001,979,400
766,100436,300253,600161,600100,80088,80099,40076,40059,60058,000
117,20084,40052,40041,400
$152,7451,984
81,17516,834118,37240,103146,54860,251194,628102,354310,638197,997139,632142,204121,089190,514108,121224,13279,792159,069605,394472,056443,296623,948
$608
*42*870'
"43," 385
47,854
44,59628,78222,83716,28213,10611,77011,32814,36010,25313,80212,07023,37023,89818,42924,434
$1,3533,5243,8414,2334,4495,8746,7207,4717,0728,70525,18634,31030,43570,706
42,870
*43," 385
47,854
44,59630,13526,36120,12317,33916,21917,20221,08017,72420,87420,77548,55658,20848,86495,140
1 Nontaxable. Specific exemptions exceed net income.2 Classes grouped to conceal net income and identity of taxpayers.

STATISTICS OF INCOME. 129
TABIiE 13.—PERSONAL RETURNS—DISTRIBUTION BY INCOMECX. A S SE S—Continued.
H A W Al l—Cont in ucd.
$40,000 to $50,000$50,000 to $60,000$60,000 to $70,000$70,000 to $80,000$80,000 to $90,000$90,000 to $100,000$100,000 to $150,000$150,000 to $200,000$200,000 to $250,000 . . .$250 000 to $300 000$300,000 to $400,000 . .$400 000 t o $500 000$500,000 to $750,000$750,000 to $1,000,000...$1,000,000 t o $1,500,000$1,500 000 t o $2 000 000$2,000,000 t o $3,000,000$3,000 000 t o $4 000 000$4,000,000 to $5,000,000.$5,000,000 a n d overClasses grouped 2
Total
Number
turns.
2197331
111
11,481
$943,405483,929452,108220,687247,551(2)
1,285,777(2)
270,000
37,840,014
Exemption from nor-mal tax.
Personal ex-emption.
$42.20017,60016,4007,4005,600
(2)16,000
(2)
3,400
27,320,400
Divi-dends.
$697,071411,536322,186
81,132244,317
(251,043,131
(25
296,106
7,828,355
Normaltax.
$16,1586,6329,492
10,1981.417
(2528,147
(25
496,078
$92,72758,03666,41137,33947,390(2)
355,215(2)
84,701
955,698
Totaltax.
$108,88564,66875,90347,53748,807(2)
383,362(2)
84,701
1,451,776
IDAHO.
Under $1,0001Under $1,000$1,000 to $2,0001....$1,000 to $2; ooo$2,000 t o $3 ,0001 . . . .$2,000 t o $3,000$3,000 t o $4 ,0001 . . . .$3,000 t o $4,000$4,000 t o $5 ,0001. . . .$4,000 t o $5,000$5,000 t o $6,000$6,000 t o $7,000$7,000 to $8,000$8,000 to $9,000$9,000 to $10,000. . . .$10,000 t o $11,000. . .$11,000 t o $12,000.. .$12,000 t o $13,000.. .$13,000 t o $14,000.. .$14,000 t o $15,000.. .$15,000 t o $20,000.. .$20,000 t o $25,000.. .$25,000 t o $30,000.. .$30,000 t o $40,000.. .$40,000 t o $50,000.. .$50,000 t o $60,000.. .$60,000 t o $70,000.. .$70,000 t o $80 000.
--
$80 000 t o $90 000$90 000 t o $100 000$100 000 to $150,000. . .$150 000 t o $200 000$200' 00010 $250,000- .$250 000 t o $300,000. . . .$300 000 t o $400 000.$400 000 t o $500,000. . .$500 000 t o $750 000$750' 000 t o $1,000, (XX$1,000,000 t o $1,500,$1,500,000 t o $2,000, ($2,000,000 t o $3,000, ($3,000,000 t o $4,000, ($4,000,000 t o $5,000, ($5 000 000 and over
300300300300300
Classes srourjed 2
Total
2,28813
4,0125,1106,3351,697
8051,369
917572151214426141211218
22639221
22,976
$1,235,3662,222
0,317,6137,512,256
15,078,8764,223,9812,705,5084,709,309
391,5483,394,0371,159,279
767,058330,456219,952131,226124,975127,21624,877
(2)115,724370,286140,34881,074
295,68391,964
(2)(2)
186,884
49,737,718
$4,356,200
11,370,1005,177,900
20,180,7002,566,0002,959,5003,219,400
319,0002,000,800
470,200246,10090,70042,20022,20019,00019,4003,000
(2)10,80032,4006,8003,200
16,8002,800
(2)(2)
7,200
53,142,400
$43,235
46,3596,315
142,84527,437
242,141100,015134,249124,733136,089102,65947,60038,60243,08234,78332,0254,432
(2)41,86992,09027,18032,32959,615
(2)(2)
$103
94,913
65,415
56,018
50,68122,75318,7069,5807,4303,5563,9944,7201,065
3,78817,4347,4863,215
17,9516,814
(2)(2)
33,044
1,592,728
11,092
406,714
$8452,0301,7441,6411,2771,5181,903
423(2)2,544
10,3786,1744,304
20,0639,212
(2)(2)
22,888
86,944
$103
94,913
65,415
56,018
50,68123,59820,73611,3249,0714,8335,5126,6231,488
(2)6,332
27,81213,6607,519
38,01416,026(2)(2)
33,980
493,658
1 Nontaxable. Specific exemptions exceed net income.* Classes grouped to conceal net income and identity of taxpayers.
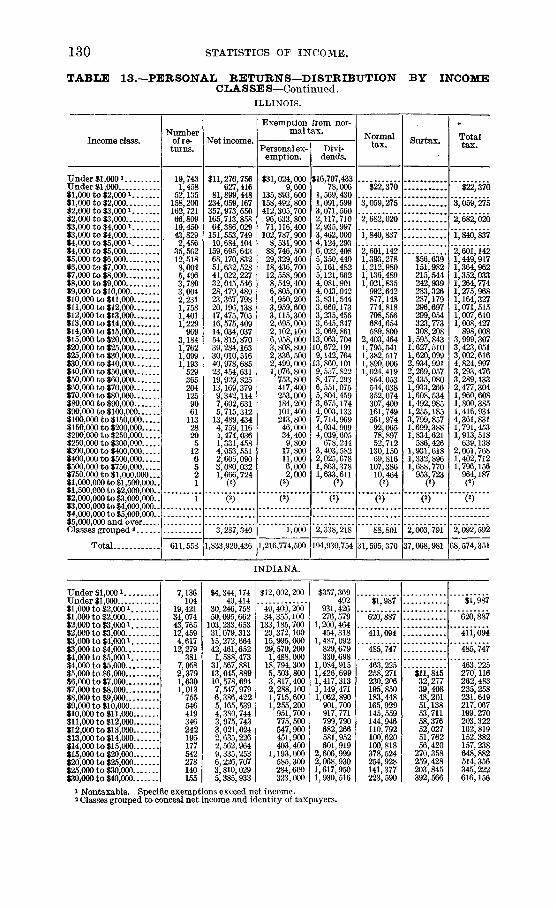
130 STATISTICS OF INCOME.
TABLE 13.—PERSONAL RETURNS—DISTRIBUTION BY INCOMECLASSES—Continued.
ILLINOIS.
Income class.
Under $1,0001Under $1,000$1,000 to $2,0001$1,000 to $2,000$2,000 to $3,0001$2,000 to $3,000$3,000 to $4,0001$3,000 to $4,000$4,000 to $5,0001$4,000 to $5,000$5,000 to $6,000$6,000 to $7,000$7,000 to $8,000$8,000 to $9,000$9,000 to $10,000$10,000 to $11,000....$11,000 to $12,000....$12,000 to $13,000....$13,000 to $14,000....$14,000 to $15,000....$15,000 to $20,000....$20,000 to $25,000....$25,000 to $30,000....$30,000 to $40,000....$40,000 to $50,000....$50,000 to $60,000....$60,000 to $70,000....$70,000 to $80,000....$80,000 to $90,000....$90,000 to $100,000...$100,000 to $150,000..$150,000 to $200,000..$200,000 to $250,000..$250,000 to $300,000..$300,000 to $400,000..$400,000 to $500,000..$500,000 to $750,000..$750,000 to $1,000,000$1,000,000 to $l,500,0C$1,500,000 to $2 000,0C$2,000,000 to $3,000,OC$3,000,000 to $4,000,0C$4,000,000 to $5,000,0C$5,000,000 and over..
6.'.o0..00
Classes grouped ̂
Total
Numberof re-turns.
19,7431,458
52,135158,200162,72166,80919,45043,8292,456
35,56212,5188,0045,4963,7803,0042,2311,7581,4011,229
9693,1841,7621,0991,193
5293652041259061
11328205
126521
1
611,558
Net income.
$11,276,756627,416
81,899,448234,059,167357,973,650165,713,85864,386,029
151,553,74910,684,104
159,695,64368,170,83251,632,52841,022,22732,045,54628,479,48923,367,79820,196,13817,475,70516,575,40914,034,03754,815,87039,284,16330,010,51640,978,68523,454,63119,929,82513,169,3799,342,1147,602,6315,715,312
13,489,4344,759,1164,474,0361,331,4584,053,5512,606,0903,080,0321,666,724
(2)
(2)
3,287,340
1,833,920,436
Exemption from nor-mal tax.
Personal ex-emption.
$31,024,0009,600
135,893,600158,492,800412,305,70096,633,80071,116,400
102,787,9008,531,900
88,746,50029,329,40018,436,70012,558,9008,549,4006,805,0004,950,2003,959,6003,115,3002,695,0002,102,1006,958,0003,808,8002,336,5002,499,0001,076,800
753,800417,400253,000184,200101,400213,80046,00034,4009,800
17,80011,0006,0002,000
(2)
(2)
1,000
1,216,774,500
Divi-dends.
$16,707,43378,006
1,569,4301,091,5993,071,5602,117,7102,935,9973,462,0004,124,2936,022,4085,350,4405,161,4825,121,6624,081,9014,043,0423,831,5443,669,1733,235,4563,645,8473,069,861
13,063,70410,672,1919,142,764
13,860,1019,557,8228,477,2936,551,0755,804,4593,675,1744,003,1337,714,9694,034,9094,039,605
678,2443,403,5822,025,6781,863,3781,633.611
(*)
(2)
2,338,218
194,930,754
Normaltax.
$22,370
3,059,275
2,682,020
1,840,837
2,601,1421,393,2781,212,9801,136,4891,021,835
992,642877,148774,818708,556684,654589,800
2,403,4641,795,5411,382,5171,890,0061,024,419
854,053544,038352,074307,400161,749561,97492,06578,89752,712
130,15069,816
107,38610,464
(*)
(2)
88,801
31,505,370
Surtax.
$56,639151,982215,544242,939283,326287,179296,697299,054323,773308,208
1,595,8431,627,5101,620,0992,934,9912,269,0572,435,0801,933,2661,608,5341,492,9851,255,1853,799,8571,699,3881,834,621
586,4261,931,6181,332,8961,688,770
953.723(*)
(2)
2,003,791
37,068,981
Totaltax.
$22,370
3,059,275
2,682,020
1,840,837
2,601,1421,449,9171,364,9621,352,0331,264,7741,275,9681,164,3271,071,5151,007,6101,008,427
898,0083,999,3073,423,0513,002,6164,824,9973,293,4763,289,1332,477,3041,960,6081,800,3851,416,9344,361,8311,791,4531,913,518
639,1382,061,7681,402,7121,796,156
964,187(2)
(2)
2,092,592
68,574,351
INDIANA.
Under $1,0001Under $1,000$1,000 to $2,000i J$1,000 to $2,000$2,000 to $3,0001$2,000 to $3,000$3,000 to $4,0001$3,000 to $4,000$4,000 to $5,0001$4,000 to $5,000$5,000 to $6,000$6,000 to $7,000$7,000 to $8,000$8,000 to $9,000$9,000 to $10,000$10,000 to $11,000$11,000 to $12,000$12,000 to $13,000$13,000 to $14,000$14,000 to $15,000$15,000 to $20,000$20,000 to $25,000$25,000 to $30,000$30,000 to $40,000 !
7,136104
19,42134,07443,76512,4594,617
12,279381
7,0582,3791,6301,013
755546419346242195177542278140155
$4,344,17440,414
30,246,75850,095,662
103,233,65331,079,31315,272,66442,461,6521,588,473
31,567,88113,045,88910,578,6947,547,9796,386,4225,165,5394,380,7443,975,7433,021,0242,635,2262,562,9649,335,2536,226,7073,810,0295,385,933
$12,002,200
49,400,20034,355,100
133,185,70020,372,10015,995,00029,570,2001,488,000
18,794,3005,503,8003,817,4002,288,1001,715,6001,255,200
951,700775,500547,900451,900403,400
1,193,000585,300284,600323,000
$357,369492
931,426276, 579
1,200,464454,318
1,487,092829,679330,698
1,084,9151,426,6991,417,3131,149,4711,062,890
901,700917,771799,790682,266581,952601,919
2,606,9992,068,9301,617,9501,930,516
$1,987
"620," 887'
411,094
485,747
463,225258,271230,206195,850183, 448165,929145,559144,946110,792100,620100,818378,524254,928141,377223,590
$11,84532,27739,40848,20151,13853,71158,37652,02751,76256,420
270,358259,428203,845392,566
$1,987
"620," 887
411,094
485,747
463,225270,116262,483235,258231,649217,067199,270203,322162,819152,382157,238648,882514,356345,222616,156
1 Nontaxable. Specific exemptions exceed net income.2 Classes grouped to conceal net income and identity of taxpayers.
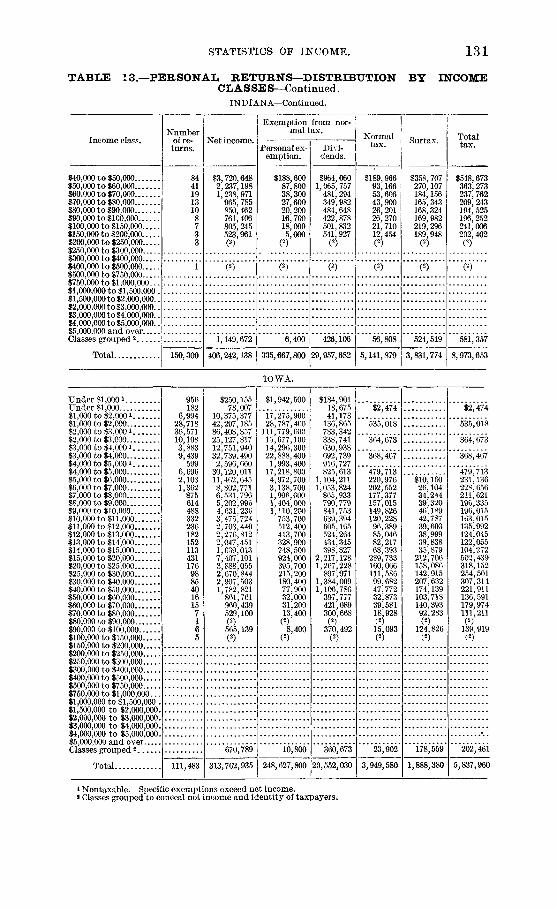
STATISTICS OF INCOME. 131
TABLE 13.—PERSONAL RETURNS—DISTRIBUTION BY INCOMECL A S SE S—Continued.
INDIANA—Continued.
Income class.
$40,000 to $50,000$50,000 to $60,000... . . . .$60,000 to $70,000$70,000 to $80,000$80,000 to $90,000$90,000 to $100,000$100,000 to $150,000$150,000 to $200,000$200,000 to $250,0001250,000 to $300,000$300,000 to $400,000$400,000 to $500,000$500,000 t o $750 000$750,000 to $1,000,000$1,000,000 to $1,500,000.$1,500,000 to $2 000 000$2,000,000 to $3,000,000$3,000,000 to $4,000,000..$4 000,000 to $5 000 000$5,000,000 and overClasses grouped 2
Total
Numberof re-turns.
84411913108733
1
150,300
Net income.
$3,720,6482,237,1981,238, 971
965, 785850,462761,406805, 245523,961
(2)
1,149,672
406,242,138
Exemption from nor-mal tax.
Personal ex-emption.
$188,60087,80038,30027,60020,20016,70018,0005,000
(2)
6,400
335,667,800
Divi-dends.
$964,0601,065, 757
481, 294349, 982484,648422, 878501, 832541 927
(2)
426,106
29,957,682
Normaltax.
$189,96693,16653,60643,90026, 20126, 27021,71012 454
(2)
56,808
5,141,879
Surtax.
$358, 707270,107184,156165,343168, 324169,982219,296189 948
(2)
524,549
3,831,774
Totaltax.
$548,673363,273237,762209,243194, 525196, 252241,006202,402
(2)
581,357
8,973,653
IOWA.
Under $1,0001Under $1,000$1,000 to $2,0001$1,000 to $2,000$2,000 to $3,0001$2,000 to $3,000$3,000 to $4,0001$3,000 to $4,000$4,000 to $5,0001$4,000 to $5,000$5,000 to $6,000...$6,000 to $7,000$7,000 to $8,000$8,000 to $9,000$9,000 to $10,000$10,000 to $11,000... . . . .$11,000 to $12,000$12,000 to $13,000$13,000 to $14,000$14,000 to $15,000$15,000 to $20,000$20,000 to $25,000$25,000 to $30,000$30,000 to $40,000$40,000 to $50,000$50,000 to $60,000$60,000 to $70,000$70,000 to $80,000$80,000 to $90,000$90,000 to $100,000$100,000 to $150,000$150,000 to $200 000
$200,000 to $250 000 .$250 000 to $300 000$300,000 to $400,000$400 000 to $500 000$500,000 to $750,000$750 000 to $1 000 000$1,000,000 to $1,500,000*.$1,500,000 to $2,000,000.$2,000,000 to $3,000,000.$3,000,000 to $4,000,000$4,000,000 to $5,000,000.$5 000 000 and overClasses grouped 2
Total
956182
6,99428,71836,57110,1083,8839,439
5996,6962,1031,362
87561448833223618215211343117698854016157165
111,483
$250,15578,007
10,375,37742,297,18586,408,85725,127,81712,751,94032,739,4902,596,660
30,120,01111,462,6458,802,7716,531,7965,202,9964,631,2363,475,7242,703,4402,276,8122,047,4511,639,0137,407,1013,888,0552,670,8442,907,5031,782,821
861,761960,439529,100(2)565,139(2)
670,789
313,762,935
$1,942,500
17,275,90028,787,400
111,779,60015,677,10014,296,30022,888,4001,993,400
17,218,8004,972,7003,138,7001,996,6001,404,0001,110,200
753,700512,400413,700328,900248,500924,000395,700215,200180,40077,90032,00031,20013,400
(2)8,400
(2)
10,800
248,627,800
$184,90118,67541,173
136,865783,342338,741630,938692,739916,727825,613
1,104,2111,053,824
865,933790,779841,753639,394605,1G5524,264434,345398,827
2,217,1281,267,228
897,9711,384,0091,106,786
397,777421,089300,668(2)
370,492
(2)
360,673
20,552,030
$2,474
535,018
364,673
368,467
479,713220,976202,552177,377157,015149,826120,22896,38985,04682,21768,393
289,733160,066111,58699,68247,77232,87339,58118,928(2)15,093(2)
23,902
3,949,580
$10,16026,10434,24439,32046,18942,78739,60338,99939,83835,879
212,706158,086142,915207,632174,139103,718140,39392.283
124,826(2)
178,559
1,888,380
$2,474
535,018
364,673
368,467
479,713231,136228,656211,621196,335196,015163,015135,992124,045122,055104,272502,439318,152254,501307,314221,911136,591179,974111,211(2)
139,919(2)
202,461
5,837,960
1 Nontaxable. Specific exemptions exceed net income.« Classes grouped to conceal net income and identity of taxpayers.
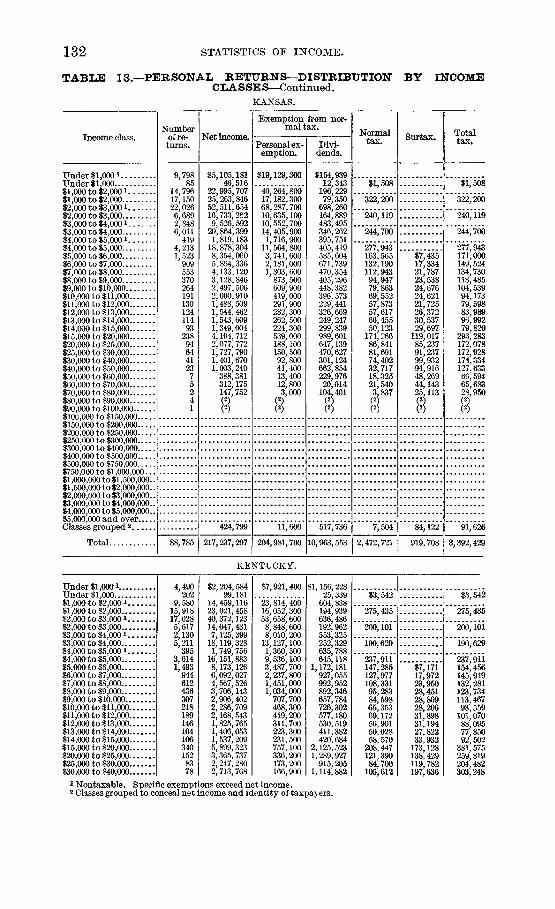
132 STATISTICS OF INCOME.
TABUS 13.—PERSONAL RETURNS—DISTRIBUTIONCLASSE S—Continued.
KANSAS.
BY INCOME
Income class.
Under $l,000iUnder $1,000$1,000 to $2,0001$1,000 to $2,000$2,000 to $3,0001$2,000 to $3,000$3,000 to $4,0001$3,000 to $4,000$4,000 to $5,000 i$4,000 to $5,000$5,000 to $6,000$6,000 to $7,000$7,000 to $8,000$8,000 to $9,000$9,000 to $10,000$10,000 to $11,000$11,000 to $12,000$12,000 to $13,000$13,000 to $14,000$14,000 to $15,000$15,000 to $20,000$20,000 to $25,000$25,000 to $30,000$30,000 to $40,000$40,000 to $50,000$50,000 to $60,000$60,000 to $70,000$70,000 to $80,000$80,000 to $90,000$90,000 to $100,000$100 000 to $150,000.. -$150 000 to $200 000$200 000 to $250,000 .$250,000 to $300,000$300 000 to $400 000$400 000 to $500 000$500,000to$750,000 . . .$750 000 to $1 000 000$1 000 000 to $1 500 000$1,500 000 to $2,000,000..$2 000 000 to $3 000 000$3,000,000 to $4,000,000..$4,000,000 to $5,000,000..$5 000 000 and overClasses grouped 2
Total
Numberof re-turns.
9,79885
14,79617,15022,0266,6892,8486,011
4194,2131,523
90955337026419113012411493
2389464412375241
88,785
Net income.
$5,105,18146,516
22,995,70725,263,84652,511,65416,733,2629,526,592
20,864,3991,819,183
18,878,3048,354,0605,854,3364,133,1203,128,8462,497,5062,000,9101,488,5091,544,4621,543,6091,349,0044,104,7122,077,7721,727,7901,401,6701,003,240
388,381312,175147,752(2)(2)
424,799
217,237,297
Exemption from nor-mal tax.
Personal ex-emption.
$19,129,300
40,264,80017,182,30068,287,70010,635,10010,552,70014,405,9001,716,900
11,564,8003,741,6002,181,0001,303,600
873,500609,900419,000291,900282,300262,500224,300539,000188,100150,50092,80041,40013,40012,8003,000
(2)(2)
11,600
204,981,700
DM-dends.
$154,93912,343
196,22979,350
698,260164,889483,495346,262395,751405,419585,604671,739470,354405,296448,382396,573229,441326,669249,247299,839989,601647,139470,627301,124662,854229,97620,014
104.401
(2)
517,736
10,963,553
Normaltax.
$1,508
322,200
240,119
244,700
277,943163,565132,190112,94394,94779,86369,55257,87357,61766,45550,123
174,26686,84181,69174,40232,71718,32521,5403,837(2
(2)
7,504
2,472,721
Surtax.
$7,43517,33421,78723,53824,67624,62121,72526,37230,53729,697
119,01785,23791,23799,93294,91648,26944,14325.113(25(2)
84,122
919,708
Totaltax.
$1,508
322,200
240,119
244,700
277,943171,000149,524134,730118,485104,53994,17379,59883,98996,99279,820
293,283172,078172,928174,334127,63366' 59465,68328,950(2)(2)
91,626
3,392,429
K E N T U C K Y .
Under $1,0001Under $1,000$1,000 to $2,0001..$1,000 to $2,000....$2,000 to $3,0001..$2,000 to $3,000....$3,000 to $4,0001..$3,000 to $4,000....$4,000 to $5,0001..$4,000 to $5,000....$5,000 to $6,000....$6,000 to $7,000....$7,000 to $8,000....$8,000 to $9,000....$9,000 to $10,000...$10,000 to $11,000..$11,000 to $12,000. .$12,000 to $13,000..$13,000 to $14,000..$14,000 to $15,000..$15,000 to $20,000..$20,000 to $25,000..$25,000 to $30,000..$30,000 to $40,000..
4,490202
9,58015,91817,0285,6172,1305,211
3953,6141,493
9446124363072181891461041063401528378
$2,204,58499,181
14,459,11623,021,45840,372,12314,047,4317,125,399
18,119,3281,749,756
16,151,8838,173,1266,092,0274,567,5263,706,1432,906,4022,286,7092,168,5431,825,7651,406,0531,537,2095,899,3233,365,7372,247,2802,713,768
$7,921,400
23,814,40016,052,30053,658,6008,848,6008,010, 200
13,127,1001,360,5009,536,1003,487,7002,237, 8001,451,0001,034,000
707,700468,300419,200311,700223,300231,500757,100336,200173,200166,900
$1,156,22825,339
604,838194,939636,486192,962553,325252,329635,788645,118
1,172,181927,055992,952892,346657,784726,302577,180530,519411,382420,684
2,125,5231,289,927
915,2051,114,882
$3,542
"275," 43*5
"266,* ioi'
190,629
237,911147,285127,977108,33195,28384,59865,35369,17256,90150,02858,570208,447121,39084,700105,612
$7,17117,97223,95028,45128,86928,20631,89831,19427,82233,932173,128138,429119,782197,636
$3,542
"275," 435
200,101
"i90,"629
237,911154,456145,949132,281123,734113,46793,559101,07088,09577,85092,502
381,575259,819204,482303,248
* Nontaxable. Specific exemptions exceed net income.2 Classes grouped to conceal net income and identity of taxpayers.

STATISTICS OF INCOME. 133
TABLE 13.—PERSONAL RETURNS—DISTRIBUTIONCLASSE S—Continued.KENTUCKY—Continued.
BY INCOME
$40,000 to $50,000$50,000 to $60,000$60,000 to $70,000$70,000 to $80,000$80,000 to $90,000$90,000 to $100,000$100,000 to $150,000$150,000 to $200,000$200,000 to $250,000$250,000 to $300,000...$300,000 to $400,000$400,000 to $500,000 .$500,000 to $750,000$750,000 to $1,000,000.$1,000,000 to $1,500,000..$1,500,000 to $2,000 000$2,000,000 to $3,000,000$3,000 000 to $4 000 000$4,000,000 to $5,000,000$5,000,000 and over
Total
Numberturns.
49181773342
69,496
$2,169,195962,334
1,076,503505,181253,125272,890466,097322,742
192,273,937
Exemption from nor-mal tax.
Personal ex-emption.
$89,80044,00030,70014,4007,0004,6008,4004,400
154,538,100
Divi-dends.
$975,699471,805609,959378,238205,739239,708215,847189,526
20,937,795
Normaltax.
$83,80333,88637,96210,3263,1146,672
19,64812,346
2,499,022
$209,155114,656154,61783,71349,69958,002
128,410111,756
1,798,448
Totaltax.
$292,958148,542192,57994,03952,81364,674
148,058124,102
4,297,470
LOUISIANA.
Under $1,0001Under $1,000$1,000 to $2,000 i$1,000 to $2,000$2,000 to $3,000 i$2,000 to $3,000$3,000 to $4,000 i$3,000 to $4,000$4,000 to $5,000 i$4,000 to $5,000$5,000 to $6,000$6,000 to$7,000....$7,000 to $8,000$8,000 to $9,000$9,000 to $10,000$10,000 to $11,000$11,000 to $12,000$12,000 to $13,000$13,000 to $14,000$14,000 to $15,000$15,000 to $20,000$20,000 to $25,000$25,000 to $30,000$30,000 to $40,000$40,000 to $50,000$50,000 to $60,000$60,000 to $70,000$70,000 to $80,000$80,000 to $90,000$90,000 to $100,000$100,000 to $150,000$150,000 to $200,000$200,000 to $250,000$250,000 to $300,000$300,000 to $400,000 . .$400,000 to $500,000....$500,000 to $750,000 .$750,000 to $1,000,000.$1,000,000 to $1,500,000$1,500,000 to $2,000,000..$2,000,000 to $3,000,000..$3,000,000 to $4,000,000$4,000,000 to $5,000,000..$5,000,000 and overClasses grouped2
Total
3,9093
8,01713,91315,6026,1062,8777,589
4304,3221,751
82951832824524317817110386
311143948847151212537111
67,960
$1,603,643658
12,112,56620,373,44137,193,06415,331,9259,598,757
26,249,5691,881,841
19,403,0619,532,2925,354,8353,863,6152,784,4652,322,4512,550,3402,046,3512,132,5101,384,9431,251,2755,377,6643,178,3422,560,6732,990,5682,121,961
832,626762,052897,686429,705288,746828,446(2)(2)(2)
657,075
197,897,146
$7,768,500200
20,555,70014,192,50049,444,0008,693,300
10,767,10016,463,0001,725,300
10.342,3003,740,0001,491,800
858,500519,300363,400360,700246,200248,600141,000112,800418,000200,800116,800118,80059,40019,80013,20014,8007,2003,000
11,000
. 8(2)
4,400
149,021,400
$1,144,109
244,74074,487
496,255213,272585,810594,787399,764645,208
1,009,129606,565556,950507,124508,873497,101582,117635,139417, 799281,200
1.470,6881,213,573'710,882572,231967,529248,195433, 707308,272229,099312,651101,951
(2)
449,908
17,019,115
$19
246,648
257,627
367,340
336,812202,368148,310123,31196,54386,863
107,81278,83883,21956,06156,128
237 723130,345124,900169,81286,49548,92627,39553,27014,449
19146,741(25
8
15,718
3,203,864
$7,92015,95420,19821,14023,16531,53830,03136,47626,57127,773
155,587130,866136,914210, 712209,168103,223109,801154,74086,03165,183
230,641
(2)(2)
267,026
2,100,658
$19
246,648
257,627
367,340
336,812210,288164,264143,509117,683110,028139,350108,869119,69582,63283,901
393,310261,211261,814380,524295,663152,149137,196208,010100,48065,374
2777382(2)
8
282,744
5,304,522
1 Nontaxable. Specific exemptions exceed net income.2 Classes grouped to conceal net income and identity of taxpayers.

134 STATISTICS OF INCOME.
TABLE 13.—PERSONAL RETURNS—DISTRIBUTIONCLASSE S—Continued.
MAINE.
BY INCOME
Income class.
Under $1,0001Under $1,000$1,000 to $2,0001$1,000 to $2,000$2,000 to $3,0001$2,000 to $3,000$3,000 to $4,000 i$3,000 to $4,000$4,000 to $5,000 i$4,000 to $5,000$5,000 to $6,000$6,000 to $7,000$7,000 to $8,000$8,000 to $9,000$9,000 to $10,000$10,000 to $11,000$11,000 to $12,000$12,000 to $13,000$13,000 to $14,000$14,000 to $15,000$15,000 to $20,000$20,000 to $25,000$25,000 to $30,000$30,000 to $40,000$40,000 to $50,000$50,000 to $60,000$60,000 to $70,000$70,000 to $80,000$80,000 to $90,000$90,000 to $100,000$100,000 to $150,000$150,000 to $200,000$200,000 to $250,000... .$250,000 to $300,000$300,000 to $400,000$400,000 to $500,000$500,000 to $750,000$750 000 to $1 000 000$1 000 000 to $1 500 000$1,500,000 to $2,000,000$2 000 000 to $3 000 000$3 000 000 to $4 000 000$4,000,000 to $5,000,000$5 000 000 and overClasses grouped 2
Total
Numberof re-turns.
1,60292
6,18711,54612,3533,0321,0173,189
1231,972
844569408247214154104908868
19298626233181242281
1
21
44,397
Net income.
8976,19531,331
9,324,33215,985,53529,229,8237,663,0013,356,859
10,949,680539,214
8,886,0004,629,1373,676, 8323,043,9952,092,3892,033, 0641,612,9471,191,3091,123,2011,183,555
982,4913,296, 2772,181,3611,696,3342,132,1331,499,669
989, 863776, 628307,864161,616192, 424961,901(2)
(2)
846,675(2)
1,075,044
124,628,679
Exemption from nor-mal tax.
Personal ex-emption.
$2,152,200400
15,465,10011,629,60038,045,5005,056,7003,583,5007,657,800
362,6005,308,3001,997,4001,288,600
903,400556,300468,900327,000214,600190,700186,500151,700382,900193,700126,900122,60058,20030,60023,2006,4003,0003,000
19,200(2)
(2)
4,200(2)
2,400
96,521,100
Divi-dends.
$531,1812,739
575,158107,488684,755130,171480,775278,002263,467299,898611,673621,816583,372491,066491,058455,873440,317303,304485,495337,193
1,194, 821963,936599,297860,606733,883729,078439,350123, 504102,315172,844411,615
(2)
432,516(25
906,180
15,844,746
Normaltax.
$1,112
172,681
98,774
121,129
131,03984,93376,62974,29856,23457,82349,23435,16937,90636,77932,890
116,73779,01267,86684,78253,23823,47022,55714,0564,9333,834
43,068(2)
(2)
30,954(2)
20,873
1,632,010
Surtax.
$4,11610,90215,99615,80020,34019,85317,29019,24723,09321,51094,95190,35791,541
153,062148,903121,823114,13954,77830,25043,435
272,265(25
(2)430,426
(25
528,774
2,342,851
Totaltax.
$1,112
172,681
98,774
121, i29
131,03989,04987,53190,29472,03478,16369,08752,45957,15359,87254,400
211,688169,369159,407237, 844202,141145,293136,69668,83435,18347,269
315,333(2)
(2)
461,380(2)
549,647
3,974,861
MARYLAND.
Under $1,000!Under $1,000$1,000 to $2,0001$1,000 to $2,000$2,000 to $3,0001$2,000 t o $3,000$3,000 to $4,0001$3,000 to $4,000$4,000 to $5,0001$4,000 to $5,000$5,000 to $6,000$6,000 to $7,000$7,000 to $8,000$8,000 to $9,000$9,000 to $10,000$10,000 to$11,000. . .„ . . .$11,000 to $12,000$12,000 t o $13,000$13,000 t o $14,000$14,000 to $15,000$15,000 to $20,000$20,000 to $25,000$25,000 to $30,000$30,000 to $40,000
6,603577
10,20329,71918,6449,7254,046
10,330284
9,3014,0372,5401,3491 234
687505409325287214749401212250
$3,657,035340,915
15,343,28242,020,48744,241,39024,270,16813,433,05635,904,485
1,233,16241,540,89621,994,33716,303,14010,091,05510,355,4596,517,8985,286,9574,698,3714,063,9523,865,6393,097,773
12,878,8258,926,7115,764,2068,721,116
$11,486,56467,300
23,997,21229,980,77156,868,39714,006,79314,496,78523,288,030
1,055,80023,552,5649,680,9986,023,4002,997,2002,909,2001,466,8001,100,700
856,000673,700632,200461, 200
1,580,700810,900437,800524,800
$1,449,99396,516
406,507135,404941,909562,975993,660703,093318,847
1,100,4631,290,4701,442,3891,433,2851,623,8711,302,9081,082,7251,047,076
964,126823,841764,501
3,364,8112,705,1031,687,4453,161,109
$7,305
"480," I65'
394,648
477,298
673,393456,936372,745276,993296,498215,981189,630181,689158,820157,142124,963564,374394,390267,441390,106
$18,30446,56353,32476,42964,96864,99469,18269,86075,59768,259
372,124368,917308,119617,779
$7,305
"480,* 165
394,648
477,298
673,393475, 240419,308330,317372,927280,949254,624250,871228,680232,739193,222936,498763,307575,560
1,007,8851 Nontaxable. Specific exemptions exceeds net income.2 Classes grouped to conceal net income and identity of taxpayers.

STATISTICS OF INCOME. 135
TABLE 13.—PERSONAL RETURNS—DISTRIBUTION BY INCOMECL A S SE S—Continued.
MAR YLAND—Con tinued.
Income class.
$40,000 to $50,000$50,000 to $60,000$60,000 to $70,000$70,000 to $80,000$80,000 to $90,000$90,000 to $100,000$100,000 to $150,000$150,000 to $200,000$200,000 to $250,000$250,000 to $300,000$300,000 to $400,000$400,000 to $500,000 . .$500,000 to $750,000$750,000 to $1,000,000.$1,000,000 to $1,500,000..$1,500,000 to $2,000,000..$2,00b,000 to $3,000,000$3,000,000 to $4,000,000..$4,000,000 to $5,000,000..$5,000,000 and overClasses grouped2
Total . . . .
Numberof re-turns.
12648502514133011512
1
112,963
Net income.
$5,622,4382,624,1783,223,4391,860,4421,196,4351,225,2643,515,9871,821,3091,079,989
679,717
(2)
1,291,549
368,691,062
Exemption from nor-mal tax.
Personal ex-emption.
$249,40093,20088,20047,20026,40026,80061,60012,0006,400
3,000
( 2 )
3,000
229,573,014
Divi-dends.
$2,149,8971,024,8231,706,547
815,976657,933523,207
1,293,8911,421,3631,071,786
393,092
( 2 )
1,183,045
41,644,587
Normal
$252,117114,422125,17279,66442,55661,432
178,79438,1784 649
24,388
( 2 )
7,009
7,008,838
Surtax.
$544,670320,675468,867318/897238,077270,825973,613640,542435,543
325,242
(2)
717,095
7,528,465
Total
$796,787435,097594,039398,561280,633332,257
1,152,407678,720440,192
349,630
(2)
724,104
14,537,303
MASSACHUSETTS.
Under $1,0001Under $1,000$1,000 to $2,000i$1,000 to $2,000$2,000 to $3,000i$2,000 to $3,000$3,000 to $4,0001.$3,000 to $4,000$4,000 to $5,0001$4,000 to $5,000$5,000 to $6,000$6,000 to $7,000$7,000 to $8,000$8,000 to $9,000..$9,000 to $10,000$10,000 to $11,000$11,000 to $12,000$12,000 to $13,000$13,000 to $14,000$14,000 to $15,000$15,000 to $20,000$20,000 to $25,000$25,000 to $30,000$30,000 to $40,000$40,000 to $50,000$50,000 to $60,000$60,000 to $70,000$70,000 to $80,000$80,000 to $90,000$90,000 to $100,000$100,000 to $150,000$150,000 to $200,000$200,000 to $250,000$250,000 to $300,000$300,000 to $400,000$400,000 to $500,000$500,000 to $750,000$750,000 to$1,000,000...$1,000,000 to $1,500,000..$1,500,000 to $2,000,000..$2,000,0001 o $3,000,000..$3,000,000 to $4,000,000..$4,000,000 to $5,000,000..$5,000,000 and overClasses grouped 2
Total
24,335600
47,437107,01989,02732,61511,95625,6643,024
16,0546,9964,7343,4272,3001,8321,4361,072
952827681
2,2471,212
7888544702681651297555
126271677251
388,442
$12,042,241264,721
71,845,036152,894,057211,838,53881,856,76739,997,86889,241,13713,333,92871,496,42938,344,92030,701,21825,574,68819,506,48217,390,68715,047,53912,311,24311,881,06511,157,2669,877,301
38,772,82627,015,62121,470,21129,487,00020,851,48114,594,45810,617,1699,612,6586,332,9015,170,375
15,364,8054,645,3513,611,4931,869,7992,282,014
856,161(2)(3)
3,850,702
1,153,008,156
$39,267,00011,300
117,185,100107,673,700274,129,10053,311,90040,082,90061,843,1007,882,500
41,280,80015,292,60010,305,6007,193,0004,864,6003,881,9002,978,7002,236,3001,948,3001,705,3001,335,5004,560,6002,421,1001,534,3001,704,300
891,900505,700344,600256,600131,600100,500237,60058,60033,00013,60012,6004,000
(2)(2)
11,300
807,231,100
$14,936,435123,181
10,729,1141,259,8268,255,9971,662,6379,192,8612,829,2458,430,6964,221,1626,847,2196,230,8245,759,6434,636,4094,547,0703,986,2233, 786,8893,725,1503,596,0783,400,841
14,117,35010,922,5469,304,437
13,631,64512,043,9487,338,2015,960,5464,868,8393,570,1653,061,2158,897,2542,353,6401,951,040
930,989668,555512,878
(2)(2)
2,012,701
210,303,449
$5,328
1,757,997
1,085,186
981,247
1,041,166701,712640,626615,560539,141529,082487,694397, 552398,665389,855352,121
1,427,4571,029,856
806,6101,106,551
705,158537,929382,570391,557234,156193,116540,300209,282123,28591,053
126,48826,534
153,967
18,011,801
$34,06293,256
134,269148,097173,367185,411181,501203,406217,987218,143
1,127,8131,119,2151,153,3832,128,0462,020,2351,782,5801,555,2421,650,2411,223,7841,139,3524,394,8861,670,1671,504,802
824,4491,077,239
436,401
2,125,509
28,522,843
$5,328
1,757,997
1,085,186
981,247
1,041,166738,774733,882749,829687,238702,449673,105579,053602,071607,842570,264
2,555,2702,149,0711,959,9933,234,5972,725,3932,320,5091,937,8122,041,7981,457,9401,332,4684,935,1861,879,4491,628,087
915,5021,203,727
462,935
2,279,476
46,534,644
1 Nontaxabl(\ Specific exemptions exceed net income.2 Classes grouped to conceal net income and identity of taxpayers.
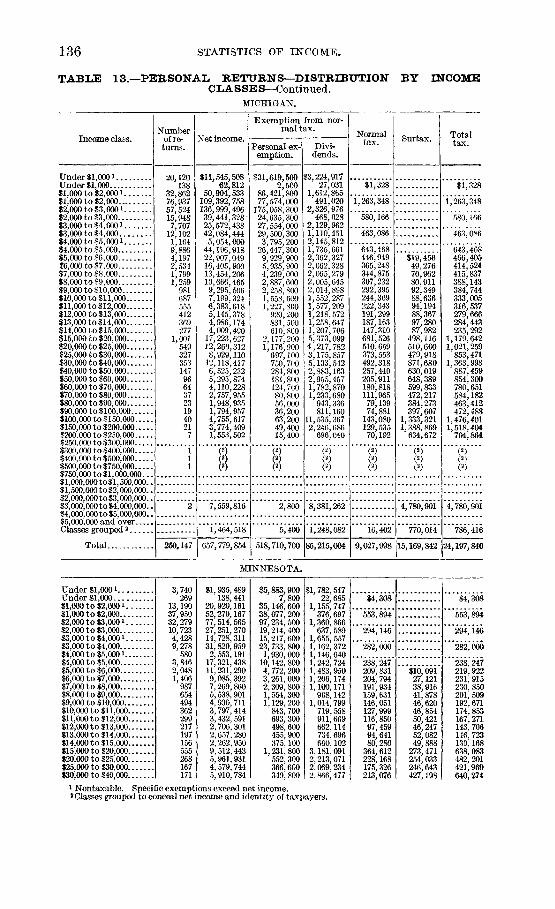
136 STATISTICS OF INCOME.
TABLE 13.—PERSONAL RETURNS—DISTRIBUTION BY INCOMECLASSE S—Continued.
MICHIGAN.
Income class.
Under Sl,000iUnder $1,000$1,000 to $2,0001$1,000 to $2,000$2,000 to $3,0001$2,000 to $3,000$3,000 to $4,0001$3,000 to $4,000$4,000 to $5,0001$4,000 to $5,000$5,000 to $6,000$6,000 to $7,000$7,000 to $8,000$8,000 to $9,000$9,000 to $10,000$10,000 to $11,000$11,000 to $12,000$12,000 to $13,000$13,000 to $14,000$14,000 to $15,000$15,000 to $20,000$20,000 to $25,000$25,000 to $30,000$30,000 to $40,000$40,000 to $50,000$50,000 to $60,000$60,000 to $70,000$70,000 to $80,000$80,000 to $90,000$90,000 to $100,000$100,000 to $150,000$150,000 to $200,000$200,000 to $250,000$250,000 to $300,000$300,000 to $400,000$400,000 to $500,000$500,000 to $750,000$750,000 to$1,000,000...$1,000,000 to $1,500,000..$1,500,000 to $2,000,000..$2,000,000 to$3,000,000..$3,000,000 to $4,000,000..$4,000,000 to $5,000,000..$5,000,000 and overClasses grouped2.
Total
Numberof re-turns.
20,120138
32 86276* 93757,52415,9487,707
12,1021,1649,8864,1972,5341,7991,259
981687555412369277
1,00154932735314796643723194021
111
2
250,147
Net income.
$11,545,50862,812
50,904,533109,392,758136,999,49639,441,328"25,572,43842,084,444
5,054,00044,196,91822,907,04916,405,90013,454,20610,666,4659,295,5067,199,3246,383,6185,145,3784,986,1744,009,490
17,223,62712,260,3128,929,110
12,118,4176,525,2325,295,8744,110,2282,757,9551,948,9351,794,9574,755,6173,774,4091,553,502
(2)(2)(2)
7,559,816
1,464,518
657,779,854
Exemption from nor-mal tax.
Personal ex-emption.
$31,619,5002,500
86,421,80077,574,000
175,058,30024,635,30027,554,00029,500,3003,795,200
26,447,3009,929,9005,935,9004,239,0002,887,6002,258,8001,558,6001,227,800
920,200531,500610,800
2,177,2001,176,900
697,100750,700284,800181,800124,70080,80056,00036,20063,20049,40015,400
(2)(2)(2)
2,800
5,400
518,710,700
Divi-dends.
$3,224,91727,031
1,612,865491,020
2,326,976468,028
2,129,9621,110,4512,145,8121,735,6612,362,3272,062,3282,065,2792,005,6452,014,8981,552,2871,577,2091,218,5721,258,6471,207,7065,373,0994,217,7823,175,8575,133,5422,883,1632,955,4571,782,8701,233,680
943,336811,160
11,535,3672,246,686
696,040
C2)(2)(2)
8,381,262
1,248,082
85,215,004
Normaltax.
$1,328
1,263,348
580,166
463,086
643,468446,949365,248344,875307,232292,395244,369222,343191,299187,163147,310681,526510,659373,553492,318257,440205,911180,818111,96579,13974,881
143,080129,53570,192
(2)(2)(2)
16,402
9,027,998
Surtax.
$19,45649,27670,96280,91192,34988,63694,19488,36797,28087,982
498,116510,600479,918871,680630,019648,389599,833472,217384,273397,607
1,333,3211,388,869
634,672
(2)(2)(2)
4,780,901
770,014
15,169,842
Totaltax.
$1,328
1,263,348
580,166
463,086
643,468466,405414,524415,837388,143384,744333,005316,537279,666284,443235,292
1,179,6421,021,259
853,4711,363,998
887,459854,300780,651584,182463,412472,488
1,476,4011,518,404
704,864
(2)(2)(2)
4,780,901
786,416
24,197,840
MINNESOTA.
Under $1,0001Under $1,000$1,000 to $2,0001..$1,000 t o $2,000....$2,000 t o $3,0001..$2,000 t o $3,000....$3,000 t o $4,0001..$3,000 t o $4,000....$4,000 to $5,0001..$4,000 t o $5,000....$5,000to $6,000....$6,000to $7,000....$7,000 to $8,000....$8,000 t o $9,000....$9,000 to $10,000...$10,000 to $11,000..$11,000 t o $12,000..$12,000 t o $13,000..$13,000 t o $14,000..$14,000 to $15,000..$15,000 t o $20,000..$20,000 to $25,000..$25,000 to $30,000..$30,000 to $40,000..
3,740269
13,19037,95032,27910,7234,4289,278580
3,8462,0481,406987654494362299217197156555268167171
$1,935,489138,441
20,920,16152,270,16777, 514, 56527,251,27014,728,31131,820,9592, 553,19117,321,43811,231,2909,085,3927,269,8605,538,9014,690, 7113, 797,4143,432,5912,706, 3012,657,2802,262,9509,512,4435,961,9314, 579, 7445, 910, 784
$5,883,9007,800
35,146, 60038,077,20097,234,50019,214, 40015,217, 60023,733, 8001,930, 000
10,142, 8004,772, 2003,261, 0002,309,8001,554,3001,129, 200
843, 700693,300498,600455,900375,100
1,231,800552,300366,600349, 800
$1,782,54722,685
1,155, 747376,697
1,360,866637, 589
1,655, 5571,162,3721,146, 6401, 242, 7241, 483, 9501,206,1741,100,171
968,1421,014,799
719,558911, 669662,114734,696660,102
3,181,0912,213,0712,069,2342.866,477
$4,308
553,894
294,146
282,000
238, 247209,831204, 794191, 934159,631146,051127,999116, 85097,45994,64180, 280
364,612228,168175,326213,076
$10,09127,12138,91641,87846,62046,85450,42146,24752,08249,888
273, 471254, 033246,643427,198
$4,308
553,894
294,146
282,000
238,247219,922231, 915230, 850201, 509192, 671174, 853167, 271143,706146, 723130,168638, 083482, 201421,969640,274
1 Nontaxable. Specific exemptions exceed net income.8 Classes grouped to conceal net income and identity of taxpayers.

STATISTICS OF INCOME.
TABLE 13.—PERSONAL RETURNS—DISTRIBUTIONCL A S SE S—Continued.MINNESOTA—Continued.
137
BY INCOME
Income class.
$40,000 to $50,000$50,000 to $60,000$60,000 to $70,000$70,000 to $80,000$80,000 to $90,000$90,000 to $100,000$100,000 to $150,000$150,000 to $200,000$200,000 to $250,000$250,000 to $300,000$300,000 to $400,000$400,000 t o $500,000$500 000 to $750,000 . .$750,000 to $1,000,000...$1 000 000 to $1 500,000$1,500,000 t o $2,000,000.$2 000 000 to $3,000,000$3,000,000 to $4,000,000.$1 000,000 to $5,000,000.$5,000,000 and overClasses grouped 2
Total
Numberof re-turns.
8444432611119531
124, 501
Net income.
$3,751,1522,434,9962,771,4211,959,344
929,4811,055,2251,070,397
843,323C2)(2)
926,776
340,833,699
Exemption from nor-mal tax.
Personal ex-emption.
$143,20095,00092,60039,30027,40025,80019,40014,200
(2)(2)
7,600
265,446,700
Divi-dends.
|2,017,0641,332,5281,403,1381,585,722
755,782691,495546,439302,176
(25(2)
992,948
39,961,964
Normaltax.
$130,82077,302
107,11742,79215,33530,18038,17041,382(2)(2)
3,265
4,269,610
Surtax.
$364,003301,686409,188338,508182, 782237,639296,322299,810
(2)(2)
386,106
4,427,507
Totaltax.
$494,823378,988516,305381,300198,117267,819334,492341,192(2)(2)
389,371
8,697,117
MISSISSIPPI.
Under $1,000!Under $1,000$1,000 to $2,0001$1,000 t o $2,000$2,000 to $3,0001$2,000 to $3,000$3,000 t o $4,000 i$3,000 to $4,000$4,000 to $5,0001$4,000 to $5,000$5,000 to $6,000$6,000 to $7,000$7,000 to $8,000$8,000 to $9,000$9,000 to $10,000$10,000 to $11,000$11,000 to $12,000$12,000 t o $13,000$13,000 t o $14,000$14,000 t o $15,000$15,000 to $20,000$20,000 to $25,000$25,000 t o $30,000$30,000 t o $40,000$40,000 t o $50,000$50,000 to $60,000$60,000 t o $70,000$70,000 to $80,000$80,000 t o $90,000$90 000 to $100 000$100,000 to $150,000$150,000 to $200,000$200,000 to $250,000$250,000 to $300,000$300 000 t o $400,000$400,000 to $500,000. ..$500,000 to $750,000$750,000 to $1 000,000$l,000,000to$l,500,000..$1 500 000 to $2 000,000$2 000,000to $3,000,000..$3,000,000to$4,000,000..$4,000,000 to $5,000,000..$5,000,000 and overClasses grouped 2
Total ,
4,02516
3,7264,8605,9511,882
9981,630
1011,118
38921816989826355353922643218183522
11
25,614
$1,157,9556,277
5,688,5287,163, 703
14,238, 9404,677,4293,322, 7905,678,733
441, 9724,978,1562,123,6181,404,7441,262, 003
760, 914777, 761661, 228632, 973439, 601527, 054318, 790
1,072,670708, 736489,333619, 911131,070273,018125,329154,192
(2)(2)
267,010
60,104,43 3
$8,827, 3002,000
9,619,0004,915,600
18,457, 5002,897,1003,700, 2003,921,600
407, 3003,077,400
947, 800522, 000420,500220,900192,100149,000126,30073,60092,60051,400
152, 50075,40039,60040,4007,600
14,2003,8004,000
(2)(2)
3,000
58,961,700
$682,53911,76175,19212, 789
202, 29652, 785
1.50, 92889, 513
111, 131151, 420202, 728165, 800113,131162, 308128,482135,410101, 96876,644
101,48056, 376
259,181178, 994337, 223191, 88078, 81619,656
124,468141, 566
(2)(2)
181,817
4,298,282
$146
91,229
69,208
66,984
70,10940,87331, 23834, 81320,69524,93921,92624,62419,67221,66613, 55245,17732, 23612,72627,2383,025
18,29699
475
(2)(2)
6,219
697,165
$1,8004,1146,6035,9517,7328,1599,3517,631
10,3637,029
29,79029,15726,68544,64212,23633,34817,78827,459
82,133
371,971
$146
91,229
69,208
66,984
70,10942,67335,35241,41626,64632,67130, 08533,97527,30332,02920,58174,96761, 39339,41171, 88015,26151,64417, 88727,934
ft
88,352
1,069,136
1 Nontaxable. Specific exemptions exceed net income.2 Classes grouped to conceal net income and identity of taxpayers.

138 STATISTICS OF INCOME.
TABLE 13.—PERSONAL RETURNS—DISTRIBUTIONCLASSE S—Continued.
MISSOURI.
BY INCOME
Income class.
Under $1,000!Under $1,000$1,000 to $2,0001$1,000 to $2,000$2,000 to $3,0001$2,000 to $3,000$3,000 to $4,0001$3,000 to $4,000$4,000 to $5,0001$4,000 to $5,000$5,000 to $6,000$6,000 to $7,000$7,000 to $8,000$8,000 to $9,000$9,000 to $10,000$10,000 to $11,000$11,000 to $12,000$12,000 to $13,000$13,000 to $14,000$14,000 to $15,000$15,000 to $20,000$20,000 to $25,000$25,000 to $30,000$30,000 to $40,000$40,000 to $50,000$50,000 to $60,000$60,000 to $70,000$70,000 to $80,000$80,000 to $90,000$90,000 to $100,000....$100,000 to $150,000...$150,000 to $200,000...$200,000 to $250,000...$250,000 to $300,000...$300,000 t o $400,000...$400,000 to $500,000...$500,000 to $750,000$750,000 to $1,000,000$1,000,000 to $1,500,00!$1,500,000 to $2,000,00<$2,000,000 to $3,000,00C$3,000,000 to $4,000,00C$4,000,000 to $5,000,00C$5,000,000 and over . .
0.) .)>
Classes grouped2
Total
Numberof re-turns.
7,62743
22,65344,28843,25915,6404,472
12,434587
7,9713,1772,2641,5381,079
847670554416291280957491306316154724132219
1672221
172,519
Net income.
$4,426,10427,909
35,423,02165,089,353
102,233,52539,289,92314,742,53542,731,7042,637,440
35,600,42417,437,13314,621,07911,489,7119,155,6308,033,0227,017,7886,360,3615,188,1973,930,6764,058,561
16,519,66610,911,6628,328,898
10,885,2556,906,4963,917,2182,648,9602,391,3331,782,495
867,4131,892,9731,171,725
436,271562,932(2)(2)
1,193,611
499,911,004
Exemption from nor-mal tax.
Personal ex-emption.
$13,101,200
56,157,70044,743,100
129,215,80025,701,00016,035,40030,317,5001,861,200
20,967,8007,189,0005,152,6003,447,9002,398,5001,889,4001,450,3001,194,800
858,700623,000599,000
2,055,2001,044,000
644,700610,900285,900154,50079,00057,40041,20016,40027,60013,0005,6003,000
(2)(2)
4,000
367,946,300
Divi-dends.
$1,932,29511,837
906,103290,429
1,458,123474,021
1,277,823904,135
1,481,0561,211,9062,079,6102,035,2591,804,4381,940,8461,590,1931, 841,6521,583,0191,464,2741,059,9431,297,9515,197,8183, 871,7053,466,7505,275,1763,270,1882,135,9481,386,5091,258,3411,202,587
543,0251,952,682
317,661236,895409,365
(2
(2)
519,165
57,688,728
Normaltax.
$644
804,296
527,126
465,225
535,673338,666321,379298,172257,874255,157221,163221,225179,138147,120148,572643,483426,188323,269390,079248,492140,65187,89787,09448,48927,05632,27666,57316,47020,929(2)(2)
53,326
7,333,702
Surtax.
$15,71243,32460,34969,76579,95686,30493,43588,91777,05989,392
479,770450,294445,998778,230672,372476,351389,464411,255352,158196,232528,508414,737176,783252,779
(2
(2)
597,505
7,326,649
Totaltax.
$644
804,296
527,126
465,225
535,673354,378364,703358,521327,639335,113307,467314,660268,055224,179237,964
1,123,253876,482769,267
1,168,309920,364617,002477,361498,349400,647223,288560,784481,310193,253273,708
650,831
14,660,351
MONTANA.
Under $1,000!Under $1,000$1,000 to $2,000!..$1,000 to $2,000....$2,000 to $3,0001..$2,000 to $3,000....$3,000 to $4,0001..$3,000 to $4,000...$4,000 to $5,0001..$4,000 to $5,000....$5,000 to $6,000....$6,000 to $7,000....$7,000 to $8,000....$8,000 to $9,000....$9,000 to $10,000...$10,000 to $11,000..$11,000 to $12,000..$12,000 to $13,000..$13,000 to $14,000..$14,000 to $15,000..$15,000 to $20,000. .$20,000 to $25,000..$25,000 to $30,000..$30,000 to $40,000..
3,
5,
73217
2539,2769,3,1,2,
672 .285239303132QQA
35818410377,534228301918
241410
$1,858,8268,711
8.336,60013,876,32823,082,2537,893,5694,108,5907,934,943
578,8244,408,2391,949,5711,187,111
770,299651,893501,162441,351321,333375,655257,027259,604805,489542,004373,818363,038
14,621,7009,378,900
30,337,1004,645,3004,603,3005,501,800
455,5002,769,000
866,500453,900247,300191,100123,40093,80066,70073,40044,20036,800
108,90056,60028,60021,400
$172,447247
89,88824,465
218,16646,463
146,824153,780149,153143,836182,432141,684127,535117,792117,844122,32160,72268,29857,82180,990
210,710268,352182,85999,717
$343
*179*136'
*i27,"86i'
92,147
59,42537,52325,97618,75117,83315,94612,63412,19414,33811,3928,989
32,07816,77011,33418,286
$1,6343,5034,0454,9234,9205,4724,6956,4695,0095,677
22,46022,86919,51027,872
$343
127,861
"*92*i47
59,42539,15729,47922,79622,75620,86618,10616,88920,80716,40114,66654,53839,63930,84446,158
1 Nontaxable. Specific exemptions exceed net income.* Classes grouped to conceal net income and identity of taxpayers.

STATISTICS OF INCOME. 139
TABUE 13.—PERSONAL RETURNS—DISTRIBUTION BY INCOMEC1ASSE S—-Continued.
MONTANA—Continued.
Income class
$40,000 to $50,000$50,000 to $60,000$60,000 to $70,000$70,000 to $80,000$80,000 to $90,000$90 000 to $100 000$100,000 to $150,000.. . .$150,000 to $200,000$200,000 to $250,000$250,000 to $300,000$300,000 to $400,000$400,000 to $500,000.. .$500,000 to $750,000$750 000 to $1,000 000$1,000,000 to $1,500,000.$1 500 000 to $2 000 000$2,000,000 to $3,000,000.,$3,000,000 to $4,000,000..$4 000 000 to $5 000,000.$5,000,000 and over.. . .Classes grouped 2
Total
Numberof re-turns.
1111
11
36,907
Net income.
i
£641,424
81,527,662
Exemption from nor-mal tax.
Personal ex-emption.
•
:
$12,200
81,318,600
Divi-dends.
(2)
Normaltax.
Ii
$610,866
3,595,212
$7,851
720,801
Surtax.
(2)
$192,004
331,062
Totaltax.
i
$199,855
1,051,863
N E B R A S K A .
Under $l,000iUnder $1,000$1,000 to $2,0001$1,000 to $2,000$2,000 to $3,0001$2,000 to $3,000$3,000 to $4,0001$3,000 to $4,000$4,000 to $5,0001$4,000 to $5,000$5,000 to $6,000$6,000 to $7,000$7,000 to $8,000$8,000 to $9,000$9,000 to $10,000$10,000 to $11,000$11,000 to $12,000$12,000 to $13,000$13,000 to $14,000$14,000 to $15,000$15,000 to $20,000$20,000 to $25,000$25,000 to $30,000$30,000 to $40,000$40,000 to $50,000$50,000 to $60,000$60,000 to $70,000$70,000 to $80,000$80,000 to $90,000$90,000 to $100,000$100,000 to $150,000$150,000 to $200,000$200,000 to $250,000.. . .
$250,000 to $300,000$300,000 to $400,000$400,000 to $500,000$500000 to $750 000$750'000 to $1 000,000 .$1,000,000 to $1,500,000$1,500,000 to $2,000,000$2,000,000 to $3,000,000$3,000,000 to $4,000,000$4,000,000 to $5,000,000$5,000,000 and over. . . .Classes grouped2
Total
7,946122
10,63415,26417,1435,8351,9064,841
3463,4411,431
801535313230198142998561
2091145751239533231
71,853
$4,042,66760,160
16,747,08822,107, 23140,825,72414,716,5356,384,161
16,825, 8721,533,897
15,407,1567,771,1875,156,4974,003,7742,652,6662,174,5512,079,2451,626,8881, 235,1901,147,798
881,4353,595,9022,565,8901,558,1631,772,7701,034,143
486,518327,381223,766247,530184,730(2)(2)
528,998
179,905,513
$16,671,400
30,493,90015,377,00053,551,9009,199, 2006,737,800
12,306,4001,232, 5009,354,3003,702, 9001,969,9001,246,900
731,100539, 200455,600319, 200227,400189,300143,400464,500232,600120,600109,80045,40015,20010,0006,4004,2003,000
(2)(2)
8,800
165,469,800
$634,255
564,19091,091
820, 238108,263471,044160,279504,909401, 230631,265633,612592,467334,840324,031382,890372,839201,089239,877155, 589814,057709,733465,381768,575405,310320,466157,066171,73615,828
153,728
(25(2)
28,055
11,633,933
$2,404
266,629
216,556
173,599
225,501142,226112,100105,38282,52973,35173,34760,40949,69544,75638,385
153,529114,61469,08873,76145,72913,47012,1483,256
17,4761,882(25(2)
38,670
2,210,492
i
$6,19615,07621,09520,04421,49325,70324,30021,11822,56219,162
104,636107,72983,954
128,92799,97658,65248,81338,28247,39039,914(2)(2)
$2,404
266,629
216,556
173,599
225,501148,422127,176126,477102,57394,84499,05084,70970,81367,31857,547
258,165222,343153,042202,688145,70572,12260,96141,53864,86641,796(2)(2)
1
162,631
1,117,653
201,301
3,328,145
1 Nontaxable. Specific exemptions exceed net income.2 Classes grouped to conceal net income and identity of taxpayers.

140 STATISTICS OF INCOME.
TABLE 13.—PERSONAL RETURNS—DISTRIBUTIONCLASSE S—Continued.
NEVADA.
BY INCOME
Income class.
Under $1,0001
Under $1,000$1,000 to $2,0001$1,000 to $2,000$2,000 to $3,0001$2,000 to $3,000$3,000 to $4,000 i$3,000 to $4,000$4,000 to $5,0001$4,000 to $5,000$5,000 to $6,000$6,000 to $7,000$7,000 to $8,000$8,000 to $9,000$9,000 to $10,000$10,000 to $11,000$11,000 to $12,000$12,000 to $13,000$13,000 to $14,000$14,000 to $15,000$15,000 to $20,000$20,000 to $25,000$25,000 to $30,000$30,000 to $40,000$40,000 to $50,000$50,000 to $60,000$60,000 to $70,000$70 000 to $80 000$80,000 to $90,000 . .$90 000 to $100 000$100,000 to $150,000$150 000 to $200 000$200 000 to $250 000$250 000to $300 000$300,000 to $400,000$400 000 to $500,000$500 000 to $750 000$750,000 to $1,000,000..$1,000,000 to $1,500,000$1,500,000to$2,000,000..$2,000,000 to $3,000,000.$3 000,000to$4,000,000$4 000 000to$5 000 000$5,000,000 and overClasses grouped 2 . . . .
Total
Numberof re-turns.
7663
1,1012,7992,1851,164
24168025
3521927547211615665
813412
1
9,719
Net income.
$385,6822,288
1,731,5094,191,4615,234,6632,830,473
790,5992,337,791
109,0461,581,6771,036,841
492, 849352,951178,046153, 200158,00868,76574,15567,072
130,780(2)85,408
140,414(2)109,440
(2)
212,39022,455,508
Exemption from nor-maltax.
Personal ex-emption.
$1,476,300
3,002,2002,841,4006,707,4001,650,600
888,1001,589,300
79,000894,000416,600177,300103,20043,40031,40030,60013,600
, 14,5006,800
11,600
4,9005,800
(2)2,400
(2)
8,00019,998,400
Divi-dends.
$18,782
25,4678,449
22,44128,34012,57628,41045,53130,739
173,08376,98167,06415,39647,77047,25116,52821,42443,462
21.372
(2538,49270,627(2)
132,484
(3)
243,5481,236,217
Normaltax.
$91
53,666
46,243
28,815
26,63519,59610,3628,9675,7154,4124,8952,2361,6541,124
6,566(2)3,8064.352(25
CO
2,780231,915
Surtax.
$7701,6061,8891,3661,5561,9791,0101,2461,304
3.473(254,210
10,322(2)13,354
(2)
53,29697,381
Totaltax.
$91
53,666
46,243
28,815
26,63520,36611,96810,8567,0815,9686,8743,2462,9002,428
10,039
8,01614,674(2)13,354
(2)
56,076329,296
NEW HAMPSHIRE.
Under $1,0001....Under $1,000$1,000 to $2,000!..$1,000 to $2,000....$2,000 to $3,0001..$2,000 to $3,000....$3,000 to $4,0001..$3,000 to $4,000....$4,000 to $5,0001-.$4,000 to $5,000....$5,000 to $6,000....$6,000 to $7,000....$7,000 to $8,000....$8,000to $9,000....$9,000 to $10,000...$10,000 to $11,000..$11,000 to $12,000..$12,000 to $13,000..$13,000 to $14,000..$14,000 to'$15,000..$15,000 to $20,000..$20,000 to $25,000..$25,000 to $30,000..$30,000 to $40,000..
2,74071
5,3578,6127,3341,886
7612,125
1861,369
581322229145107
8371595736
125552626
$1,871,10329,955
8,400,31712,350,71217,276,3064,661,4532,549,4807,401,590
825,5356,127,2543,171,1872,085,0071,715,4621,228,4501,017,958
868,340817,785734,354769,091521,953
2,145,1181,214,403
695,579867,416
$4,055,000
14,268,5008,676,900
22,150,5002,843,7002,649,2004,997,500
520,3003,608,0001,292,700
695,700482,800306,600225,800166,900136,500117,100109,30073,200
251,500111, 20054,80051,800
$392,5914,895
418,99387,333
819,994145,402486,296229,535563,657302,392587,253502,829439,863364,984324,021330,518245,676264,275318,920252,338
1,042,562628,223341,167455,958
$973
*i46,'973'
**68,'663"
90,694
89,37255,11439,46737,62830,47727,07323,05826,60923,14221,81914,29766,56640,31225,34529,015
$2,6966,2689,0489,30510,16110,67312,17112,41314,98611,46961,94849,75436,40459,908
146,973
68,003
90,694
89,37257,81045,73546,67639,78237,23433,73138,78035,55536,80525,766128,51490,06661,74988,923
1 Nontaxable. Specific exemptions exceed net income.3 Glasses grouped to conceal net income and identity of taxpayers.
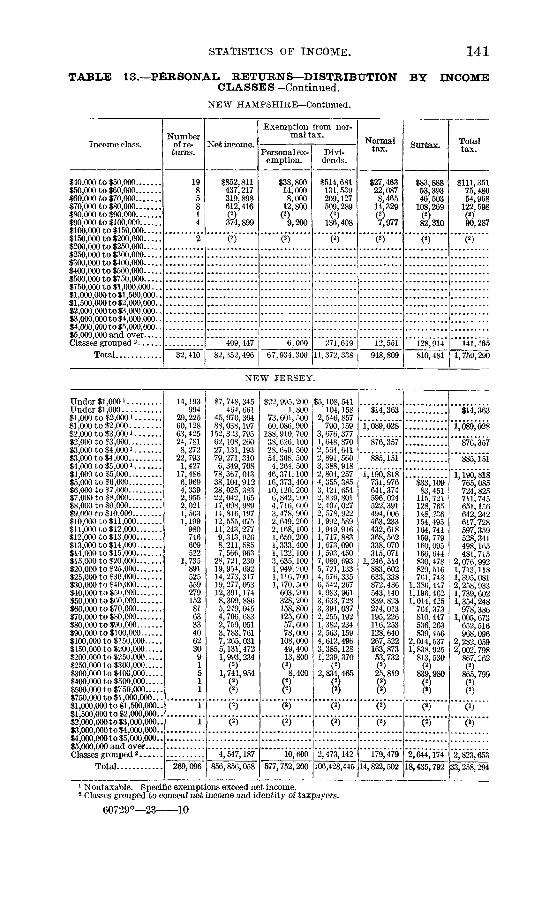
STATISTICS OF INCOME. 141
TABLE 13.—PERSONAL RETURNS—DISTRIBUTION BY INCOMEC LA S SE S—Continued.
N E W HAMPSHIRE—Cont inued.
Income ela^s.
$40,000 to $50.000$50,000 to $60,000$60,000 to $70,000$70,000 to $80,000$80,000 to $90,000$90,000 to $100,000$100,000 to $150,000$150,000 to $200,000$200,000 to $250,000$250,000to$300,000... .$300,000 to $400,000$400 000 to $500,000...$500,000 to $750,000$750,000 to $1,000,000...$1,000,000 to $1,500,000..$1,500,000 to $2,000,000..$2,000,000 to $3,000,000..$3,000,000 to $4,000,000..$4,000,000 to $5,000,000..$5,000,000 and overClasses grouped a . . . .
Total
Numberof re-turns.
1985814
2
32,410
Net income.
$852,811437,217319,898612,416(2)374,899
(2)
409,447
82,352,496
Exemption from nor-mal tax.
Personal ex-emption.
$38,80014,0008,000
12,800(2)
9,200
(2)
6,000
67,934,300
Divi-dends.
$514,681131,539209,127509,289
186,408
(2)
271,619
11,372,338
Normaltax.
$27,46322,0878,465
14.329{U(2)
12,551
948,809
Surtax.
$83,88853,39346,503
108.269
82,310
(2)
128,914
810,481
Totaltax.
$111,35175,48054,968
122 598(2)'90,287
(2)
141,465
1,759,290
N E W J E R S E Y .
Under $1,000*Under $1,000$1,000 to $2,0001$1,000 to $2,000$2,000 to $3,0001$2,000 to $3,000$3,000 to $4,000!$3,000 to $4,000$4,000 to $5,0001$4,000 to $5,000$5,000 to $6,000$6,000 to $7,000$7,000 to $8,000$8,000 to $9,000$9,000 to $10,000$10,000 to $11,000$11,000 to $12,000$12,000 to $13,000..$13,000 to $14,000$14,000 to $15,000$15,000 to $20,000$20,000 to $25,000$25,000 to $30,000$30,000 to $40,000$40,000 to $50,000$50,000 to $60,000$60,000 to $70,000$70,000 to $80,000$80,000 to $90,000$90,000 to $100,000$100,000 to $150,000$150,000 to $200,000$200,000 to $250,000$250,000 to $300,000$300,000 to $400,000$400,000 to $500,000$500,000 to $750,000$750,000 to $1,000,000...$1,000,000 to $1,500,000..$1,500,000 to $2,000,000..$2,000,000 to $3,000,000..$3,000,0001 o $4,000,000..$4,000 000to $5,000,000..$5,000,000 and overClasses erouDed 2 - - - .
Total
14,193994
29,22560,12863,42524,7818,272
22,7931,427
17,4866,9694,3392,9552,0211,5631,199
980746609522
1,73589152555927915281633340623091511
1
1
269,096
$7,748,345464, 661
45,970,30488,038,197
152,323, 79562,108,26027,131,19379,271,3106,349,708
78,367,04338,104,91228, 025,38322,042,16517,098,98914,816,19712,555,07511,243,2779,313,9268,211,5857,566,963
28,721,23019,954, 69214,273,31719,277,05312,391,1748,309, 8865,249,0454,706,6832,759,0513,783,7617,265,0315,131,4721,993,234
(2)1,741,954
(2)
(2)
4,547,187
856,856,058
$22,995,2001,800
73,601, 50060,086,900
188,910, 70038,626,10028,649, 50054,368, 5004,264, 500
46,371,10016,373,40010,120,2006, 842, 2004,716,0003,478, 9002,649,2002,168,1001,659,2001,333,4001,122,1003,635,1001,949,2001,116,7001,170,500
603,200328,200158,800125,60057,60078,000
108,00049,40013,800
(2)8,400
(2)(2)
(2)
(2)
10, 600
577,752,200
$5,108,541104,158
2,546,857790,159
3, 676,3771,648,8702,564,6412, 891, 5603,388,9182, 801,2574,355,3853,121,6542, 839,801
'?., 407,0272,578,9221,992,5891,949,9161,717,8831,673,0901,593,4507, 080, 6935,721,1334,576,3356,542,2674,983,9613,633,7283, 391,0872,255,1921,382,2342, 563,1594,612,4963,385,1281,239.370
2,834 465
(2)
(2)
2,473,142
106,428,445
$14,363
1,089,028
876,357
885, 151
1,190,818731,976641,374596,024522,391494,006463,233432,618368,562338,070315,071
1,246,514883,602633,338872,486543,140339,823214, 013195,226116,253128, 640267,522163,87353,732(2525,819(2
(2)
(2)
(2)
179,479
14,822,502
$33,10983,451
115,721128,765148,236154,495164,741159,779160,095166, 644830, 478829, 516761,743
1,386,4471,196,4621,014,425
764,373810,447536, 263839, 456
2,014,5371,838,925
813.530(25839,980
$
(2)
(2)
2,644,174
18,435,792
$14,363
1,089,028
876,357
885,151
1,190,818765,085724,825711,745651,156642,242617,728597,359528,341498,165481,715
2,076,9921,713,1181,395,0812,258,9331,739,6021,354,248
978,3861,005,673
652,516968,096
2,282,0592,002,798
867,262
865,799(2)(2)
(2)
(2)
2,823,653
33,258,294
1 Nontaxable. Specific exemptions exceed net income.2 Classes grouped to conceal net income and identity of taxpayers.
60729°—23 10

142 STATISTICS OF INCOME.
TABLE 13.—PERSONAL RETURNS—DISTRIBUTION BY INCOMECLA S SE S—Con tinued.
NEW MEXICO.
Income class.
Under $1,0001Under $1,000$1,000 to $2,0001$1,000 to $2,000$2,000 to $3,0001$2,000 to $3,000$3,000 to $4,000 i$3,000 to $4,000$4,000 to $5,000 i$4,000 to $5',000$5,000 to $6,000$6,000 to $7,000$7,000 to $8,000$8,000 to $9,000$9,000 to $10,000$10,000 to $11,000$11,000 to $12,000$12,000 to $13,000$13,000 to $14,000$14,000 to $15,000$15,000 to $20,000$20,000 to $25,000$25,000 to $30,000$30,000 to $40,000$40,000 to $50,000$50,000 to $60,000$60,000 to $70,000$70,000 to $80,000$80,000 to $90,000$90,000 to $100,000$100,000 to $150,000$150,000 to $200,000$200,000 to $250,000$250,000 to $300,000$300,000 to $400,000$400,000 to $500,000$500,000 to $750,000$750,000 to $1,000,000...$1,000,000 to $1,500,000..$1,500,000 to $2,000,000..$2,000,000 to $3,000,000..$3,000,000 to $4,000,000..$4,000,000 to $5,000,000..$5,000,000 and overClasses grouped2
Total
Numberof re-turns.
8875
1,5802,6733,3671,079
41884074
454165684229181211
4.3
14126613
1
Net income.
$383,7473,321
2,464,8713,983,5438,018,3672,681,1861,387,1272,878,804
323,8562,027,220
901,041435,102316,365245,255171,135125,792126,01999,73753,91243,999
241,484266,612167,014203,281(2)165,248
(2)
Exemption from nor-mal tax.
Personal ex-emption.
$1,799,8002,000
4,445,2002,731,400
10,722,7001,635, 6001,526,6001,973,800
256,0001,162, 200
390,900134,50079,00054,60028,00021,50021,90016,1006,6005,400
22,00019,2009,0006,800
(2)3,600
(2)
i
11,780
124,127
27, 838,165
4,000
27,078,400
Divi-dends.
$63,506
20,4787,242
65,04238,48054,35772,103
116,47364,012
116,72039,75147,92338,71328,50135,07819,0449,9527,427
12,340111,961170,434104,348120, 818
(3)98,181
(2)
128,085
1,590,969
Normaltax.
$58
50,117
40,652
33,508
32,07417,18611,7959,1037,8056,4563,6225,2934,0262,5871,6315,9786,5123,5755.143
(257,954
(2)
562
255,637
Surtax.
$8i41,2161,7122,0671,7141.5541,6291,7071,056
9907,024
10,9919,237
14.345
20,333
(2)
19,603
95,992
Totaltax.
S58
50,117
40,652
33,508
32,07418,00013,01110,8159,8728,1705,1766,9225,7333,6432,621
13,00217,50312,81219,488(2)28,287
(2)
20,165
351,629
N E W YORK.
Under $1,0001 64,182 $37,990,948Under $1,000 1,844 1,074,757$l,000to $2,0001 132,240 205,301,241$1,000 to $2,000 248,742 360,513,093$2,000 to $3,0001 249,535 593,124,295$2,000 to $3,000 93,519 230,952,363$3,000 to $4,0001 31,916 105,847,623$3,000 to $4,000 74,740 259,357,409$4,000 to $5,0001 3,713 16,470,464$4,000 to $5,000 54,219 242,397,134$5,000 to $6,000 25,670 140,327,912$6,000 to $7,000 17,235 111,379,847$7,000 to $8,000 12,033 89,925,660$8,000 to $9,000 8,495 72,087,490$9,000 to $10,000 6,708 63,683,579$10,000 to $11,000 5,055 52,978,773$11,000 to $12,000 4,170 47,916,476$12,000 to $13,000 3,291 41,079,521$13,000 to $14,000 2,837 38,273,302$14,000 to $15,000 2,387 34,612,469$15,000 to $20,000 8,135 140,195,351$20,000 to $25,000 4,574 102,060,969$25,000 to $30,000 2,876 78,648,851$30,000 to $40.000 3,219 110,671,249
1 Nontaxable. Specific exemptions exceed net income.2 Classes grouped to conceal net income and identity of taxpayers.
$102,579,600233,600
330,850,100249,732,300752,096,500160,549,400112,357,100177,654,30011,669,600
145,248,20057,779,10038,617,30026,538,30018,353,00014,373,50010,723,7008,900,3006,896,7005,948,8005,009,300
16,825,3009,294,4005,788,0006,437,100
$59,199,461246,924
10,551,5132,229,085
13,198,8913,431,829
12,922,6615,987,950
10,720,1546,427,123
14,213,73514,068,64913,086,0777,980,399
14,958,04010,927,7999,783,337
10,060,8658,966,2848,256,166
40,470,34630,481,27728,178,01840,857,669
$32,134
4,354,731
2,715,980
3,051,413
3,637,4642,896,8572,635,8832,524,4112,278,2442,217,7971,937,2791,863,7981,643,4361,583,8641,459,1756,170,7004,684,8553,559,9215,144,741
$121,124331,576473,442550,062636,088652,770706,914705,121700,733762,103
4,068,9444,237,2314,241,9987,953,189
$32,134
4,354,731
2,715,980
3,051,413
3,637,4643,017,9812,967,4592,997,8532,828,3062,853,8852,590,0492,570,7122,348,5572,284,5972,221,278
10,239,6448,922,0867,801,919
13,097,930
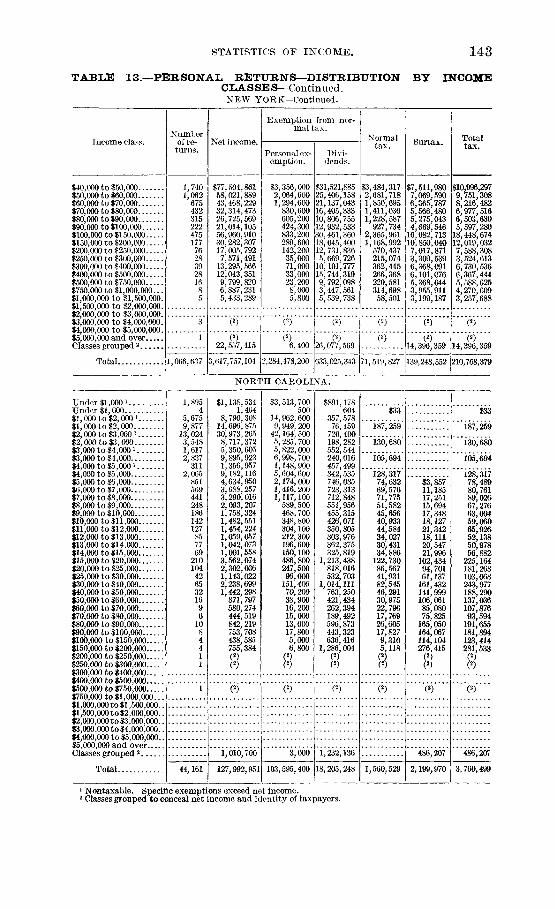
STATISTICS OF INCOME. 143
TAB:LE 13.—PERSONAL RETURNS—DISTRIBUTIONCLA S SE S—Continued.NEW YORK—Continued.
BY INCOME
Income class.
$40,000 to $50,000$50,000 to $60,000$60,000 to $70,000$70,000 to $80,000$80,000 to $90,000$90,000 to $100,000$100,000 to $150,000$150,000 to $200,000$200,000 to $250,000$250,000 to $300,000$300,000 to $400,000$400,000 to $500,000$500,000 to $750,000$750,000 to $1,000,000...$1,000,000 to $1,500,000.$1,500,000 to $2,000,000.$2,000,000 to $3,000,000.$3,000,000 to $4,000,000.$4,000,000 to $5,000,000.$5,000,000 and overClasses grouped2
Total
Numberof re-
turns.
1,7401,062
675432315222475177762839281685
3
1
1,066,637
Net income.
$77,504,86158,021,88943,468,22932,314,47326,725,56921,014,10556,960,91030,282,30717,005,7927,571,491
13,295,56612,043,3519,799,8206,887,2315,433,289
(2)
22,557,415
3,617,757,104
Exemption from nor-mal tax.
Personal ex-emption.
$3,356,0002,064,6001,294,600
830,600605,200424,300833,200289,600142,20035,00071,00033,00023,2008,0005,800
(2)
6,400
2,284,478,200
Divi-dends.
•131,521,88525,406,15821,137,04316,405,33310,806,75512,932,53330,461,36018, 045,40012,731,8365,669,726
10,101,77715,744,3199,792,0983,447,5615,539,738
(2)
26,077,569
633,025,343
Normaltax.
$3,484,3172,681,7181,850,6951,411,0361,228,587
927,7342,365,9611,168,992
570,437215,074362,445266,368220,581314,69858,501
(2)
.....(!L.71,519,827
Surtax.
$7,511,9807,069,5906,365,7875,566,4805,275,0434,669,546
16,082,71310,850,0407,017,8713,309,5396,368,0916,101,0765,368,0443,955,9113,199,187
(2)
(2)14,396,359
139,248,552
Totaltax.
$10,996,2979,751,3088,216,4826,977,5166,503,6305,597,280
18,448,67412,019,0327,588,3083,524,6136,730,5366,367,4445,588,6254,270,6093,257,688
(2)
14,396,359
210,768,379
NORTH CAROLINA.
Under $1.0001Under $1,000$1,000 to $2,0001$1,000 to $2,000$2,000 to $3,000!$2,000 to $3,000$3,000 to $4,0001$3,000 to $4,000$4,000 to $5,000i$4,000 to $5,000$5,000 to $6,000$6,000 to $7,000$7,000 to $8,000$8,000 to $9,000$9,000 to $10,000$10,000 to $11.000$11,000 to $12,000$12,000 to $13,000$13,000 to $14,000$14,000 to $15,000$15,000 to $20,000$20,000 to $25,000$25,000 to $30,000$30,000 to $40,000$40,000 to $50,000$50,000 to $60,000$60,000 to $70,000$70,000 to $80,000$80,000 to $90,000$90,000 to $100,000$100,000 to $150,000$150,000 to $200,000$200,000 to $250,000$250,000 to $300,000$300 000 to $400 000
$400 000 to $500,000 .$500,000 to $750,000$750,000 to $1,000,000..$1,000,000 to $1 500 000$1 500 000to$2 000 000$2 000 000 to $3 OOO'OOO$3,000,000 to $4 OOO'OOO$4 000 000 to $5 000 000$5 000 000 and overClasses grouped2
Total
1,8954
5,6759,877
13,0243,5481,6172,837
3112,065
851569441248186142127857769
2101044265321696
1084411
1
44,161
$1,138,5341,464
8,790,30814,696,87530,973,2658,717,3725,350,6059,895,9231,356,9579,182,1164,634,9503,688,2573,290,0162,093,2071,758,3241,482,5511,454,2241,059,0571,042,0731,001,5583,562,0742,302,0361,143,0222,238,6991,442,298
871,797580,274444,519842,219753,708438,585755,384(2)(2)
(2)
$3,513,700500
14,962,6009,949,200
42,164,5005,285,7005,822,0006,998, 7001,148,9005,604,6002,174, 0001,416,2001,117,100
589,500468,700348,800304,100212,300196,600150,100486,800247,50096,000
151,40070,20038,90016,20015,00013,00017,8005,0006,800
(2)(2)
(2)
1,010,700
127,992,951
3,000
103,595,400
$891,178604
357,57876,459
720,400198,282552,544240,016457,499342,535746,085723,313712,848551,956455,315426,071350,805303,976362,375325,819
1,213,438818,016532,703
1,014,111763,250421,434262,394189,492596,873443,323636,416
1,286,004(2)(2)
(2)
1,232,136
18,205,248
$33
187,259
130,680
105,694
i28,3l774,63269,57671,77551,58245,65640,93344,58434,02730,43134,886
122,73086,56741,93182,54546,29130,97522,79617,76926,60517,8279,3105,118(25(2)
(2)
1,560,529
$3,85711,18517,25115,69417,34818,12721,34218, 11120,54721,996
102,43494,70161,137
161,432141,999106,06185,08075,825
165,050164', 067114,104276,415
(2)(*)
(2)
486,207
2,199,970
$33
187,259
130,680
105,694
128,31778,48980,76189,02667,27663,00459,06065,92652,13850,97856,882
225,164181,268103,068243,977188,290137,036107,87693,594
191,655181,894123,414281,533(2)(2)
( 2 )
486,207
3,760,499
1 Nontaxable, Specific exemptions exceed net income.2 Classes grouped to conceal net income and identity of taxpayers.
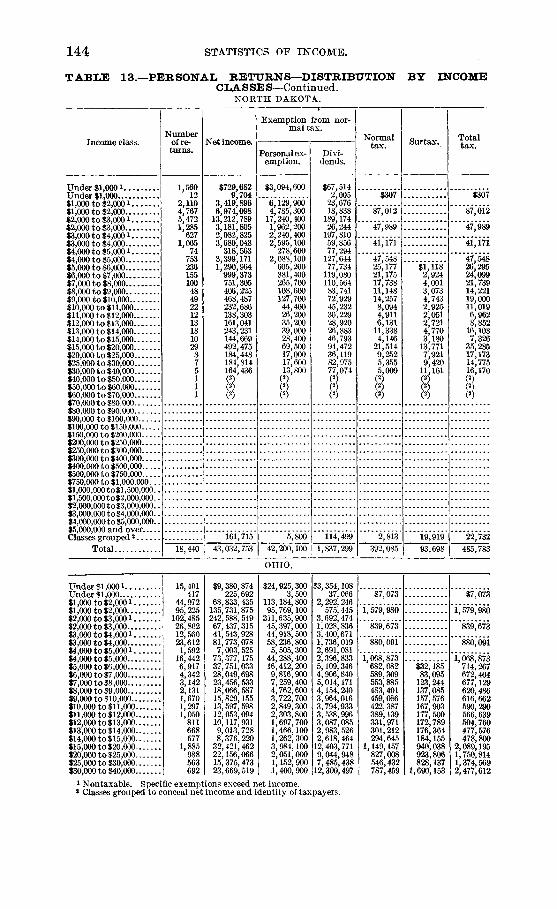
144 STATISTICS OF INCOME.
TABUS 13.—PERSONAL RETURNS—DISTRIBUTION BY INCOMECLASSES—Continued.
NORTH DAKOTA.
Income class.
Under $1,0001Under $1,000$1,000 to $2,0001$1,000 to $2,000$2,000 to $3,0001$2,000 t o $3,000$3,000 t o $4,0001$3,000 to $4,000$4,000 to $5,0001$4,000 to $5,000$5,000 t o $6,000$6,000 to $7,000$7,000 to $8,000$8,000 to $9,000..,$9,000 to $10,000$10,000 to $11,000$11,000 to $12,000$12,000 to $13,000$13,000 t o $14,000$14,000 t o $15,000$15,000 t o $20,000$20,000 t o $25,000$25,000 t o $30,000$30,000 t o $40,000$40,000 to $50,000$50,000 to $60,000$60,000 t o $70,000$70 000 t o $80 000 .
$80 000 to $90 000$90,000 to $100,000.$100 000 to $150 000$150 000 t o $200 000$200 000 to $250,000 .$250 000 to $300 000$300,000 to $400,000...$400 000 to $500 000$500 000 to $750 000$750,000 to $1 000,000.$1 000 000 to$1 500 000$1 500 000to$2 000 000$2 000 000to$3 000,000 .$3 000 000to$4 000 000$4 000 000to$5 000 000$5 000 000 and overClasses grouped 2
Total
Numberof re-turns.
1,56012
2,1104,7675,4721,285
6271.065
7532361551004849221213181029875111
18,440
Net income.
$729,6829,704
3,419,8966,974,098
13,212,7893,181,8052,082,8253,680,048
318,5633,399,1711,290,964
999,373751,305406,225468,487232,686138,303161,041243,231144,669492,475184,448184,814164,436(2)(2)(2)
161,715
43,032,753
Exemption from nor-mal tax.
Personal ex-emption.
$3,094,600
6,129,9004,785,300
17,240,4001,962,2002,240,4002,595,100
278,6002,088,100
605,200381,400265,700108,600127,70044,40026,20035,20039,00028,40069,50017,00017,60013,800
(2)(2)(2)
5,800
42,200,100
Divi-dends.
$67,5142,005
23,67618,838
189,17426,244
197,81059,85677,294
127,64477,734
119,080110,56483,74172,92945,23230,22928,92026,88346,79394,47236,11982,975
?r
114,499
1,837,299
Normaltax.
$307
87,012
47,989
41,171
47,54825,17721,17517,73811,14814,2578,0944,9116,131
11,3384,146
21,5149,2525,355$r8
2,813
392,085
Surtax.
$1,1182,9244,0013,0734,7432,9252,0512,7214,7703,180
13,7717,9219,420
11,161(2)(2)(2)
19,919
93,698
Totaltax.
$307
87,012
47,989
41,171
47,54826,29524,09921,73914,22119,00011,0196,9628,852
16,1087,326
35,28517,17314,77516,170(2)(2)(2)
22,732
485,783
OHIO.
Under $1,0001Under $1,000$1,000 to $2,000i..$1,000 to $2,000....$2,000 to $3,0001..$2,000 to $3,000....$3,000 to $4,0001..$3,000 to $4,000....$4,000 to $5,0001..$4,000 to $5,000....$5,000 to $6,000....$6,000 to $7,000....$7,000 to $8,000....$8,000 to $9,000....$9,000 to $10,000...$10,000 to $11,000..$11,000 to $12,000..$12,000 to $13,000..$13,000 to $14,000..$14,000 to $15,000..$15,000 to $20,000..$20,000 to $25,000..$25,000 to $30,000..$30,000 to $40,000..
15,401417
44,97295,225
102,48526,80212,56023,6121,592
16,4426,9174,3423,1422,1311,6701,2971,050
811668577
1,885988563692
$9,380,874225,692
68,833,435135,731,875242,588,54967,437,31541,543,92881,773,0787,003,525
73,377,17537,751,03328,049,69823,456,53318,066,58715,829,15513,597,59812,053,09410,117,9319,013,7288,376,220
32,421,46222,156,06615,375,47323,669,519
$24,925,3003,500
113,184,80095,769,100
311,635,90045,397,00044,918,50058,236,8005,505,300
44,288,40016,412, 2009,816,9007,259,4004,762,6003,722,7002,849,3002,303,8001,697,7001,466,1001,262,3003,984,1002,051,0001,152, 9001,400, 900
$3,354,10837,066
2,292, 246575,445
3,692,4741,028,8363,400,6711,736,0192,691,0812,396,8335,109,3464,906,8405,014,1714,154,2403,964,0163,794,9333,538,9963,087,0852,983,5262,618,464
12,403,7719,044,9487,485,438
12,300,497
$7,073
i,*579,'98O"
839,673
"880," 09i'
1,068,873682,082589,309553,885483,401459,086422,387389,139331,971301,212294,645
1,149,157827,008546,432787,459
$32,18583,095
123,244137,085157,576167,903177,500172,789176,364184,155940,038923,806828,137
1,690,153
$7,073
1,579,980
839,673
880,091
1,068,873. 714,267
672,404677,129620,486616,662590,290566,639504,760477,576478,800
2,089,1951,750,8141,374,5692,477,612
1 Nontaxable. Specific exemptions exceed net income.3 Classes grouped to conceal net income and identity of taxpayers.
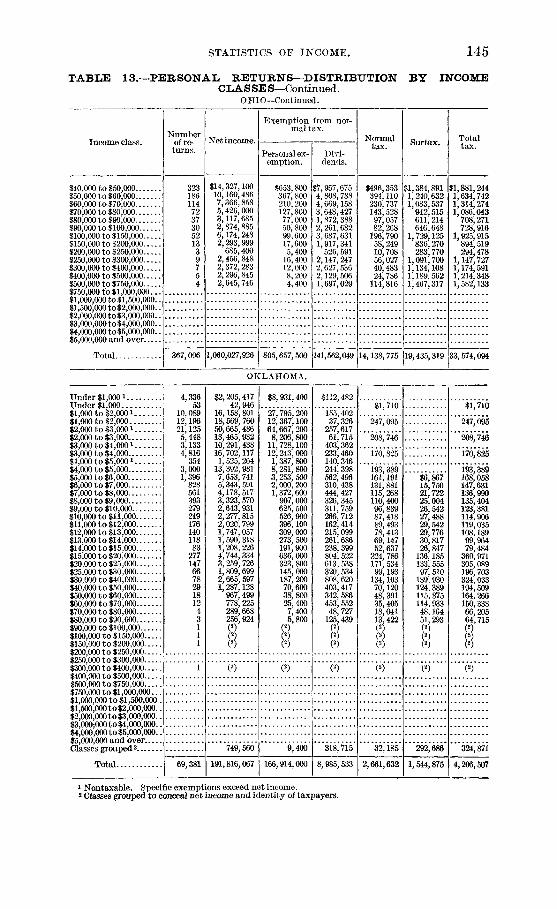
STATISTICS OF INCOME. 145
TABLE 13.—PERSONAL, RETURNS—DISTRIBUTION BY INCOMECLA S SE S—Continued.
O H I O—Continued.
$40,000 to $50,000$50,000 to $60,000$60,000 to $70,000$70,000 to $80,000$80,000 to $90,000$90,000 to $100,000$100,000 to $150,000$150,000 to $200,000$200,000 to $250,000$250,000 to $300,000$300,000 to $400,0001400,000 to $500,000$500,000 to $750,000$750,000 to $1,000,000$1,000 000 to $1 500,000 .$1,500,000 to $2,000,000..$2,000,000 to $3,000,000..$3,000,000 to $4,000,000..$4,000,000 to $5,000,000 .$5,000,000 and over
Total
Numberturns.
323186114723730521339754
367,096
Net income
$14,327,10010,160,4867,366,8585,426,0003,117,6852,874,8856,174, 2482,293,999
685,4002,456,8482,372,2832,296,8452,645,746
1,060,027,926
Exemption from nor-mal tax.
Personal ex-emption.
$653,800367,800210, 200127,80077,00050, 80099,60017,6005,400
16,40012,0008,2004,400
805,657,500
Divi-dends.
$7,957,6754,808,7884,669,1583,648,4271,872,3882,261,6823,687,6311,917,341
526,5912,147,2472,627,5362,129,5061,697,029
141,562,049
Normaltax.
$496,353394,110230,737143,52897,05782,268
196,79058,24910,70856,02740,48324,786
114,816
14,138,775
$1,384,8911,240,6321,083,537
942,515611, 214646,648
1,729,125836,270283,770
1,091,7001,134,1081,189,5621,467,317
19,435,319
Totaltax.
$1,881,2441,634,7421,314,2741,086,043
708,271728,916
1,925,915894,519294,478
1,147,7271,174,5911,214,3481,582,133
33,574,094
OKLAHOMA.
Under $1,0001Under $1,000$1,000 to $2,0001$1,000 to $2,000$2,000 to $3,0001$2,000 to $3,000$3,000 to $4,000 !$3,000 to $4,000$4,000 to $5,000 !$4,000 to $5,000$5,000 t o $6,000$6,000 to $7,000$7,000 to $8,000$8,000 to $9,000$9,000 to $10,000.$10,000 to $11,000$11,000 to $12,000$12,000 t o $13,000$13,000 t o $14,000$14,000 t o $15,000$15,000 t o $20,000$20,000 t o $25,000$25,000 to $30,000$30,000 to $40,000$40,000 to $50,000$50,000 to $60,000$60,000 to $70,000$70,000 to $80,000$80,000 to $90,000$90,000 to $100,000$100,000 to $150,000$150,000 t o $200,000$200 000 t o $950 000
$250*000 t o $300,000. .$300,000 t o $400,000$400 000 t o $500 000$500 000 to $750 000$750 000 to $1 000 000$1,000,000 to $1,500,000.$1 500 000to$2 000 000$2 000 000 to $3 000,000$3'000'000 to $4,000,000.$4 000 000 to $5 000 000$5000000and over ..Classes grouped2
Total
4,33653
10,08912,19621,1255,4483,1334,816
3543,0001,396
82856139327921917614011883
277147667829181243111
1
69,381
$2,205,41742,946
16,158, 80118,569, 76050,665,48613,465,93210,291,43816,702,1171,525,264
13,392,9817,653,7415,343, 5914,178, 5173,323, 5702,643,9312,277,8152,020,7991,747,0571,590, 3181,208,2264,744, 3343,259, 7261,809,6992,665,5971,287,128
967,499778, 225289,668256,924
(2)
(2)
749,560
191,816,067
$8,931,400
27,795, 20012,367,10064,667,2008,206,800
11,728,10012,243,0001,387, 8008,281, 8003,253, 5002,000, 2001,372,600
907, 000625, 500526, 900396,100309,000273, 500191,900636,000323, 800145,000187, 20070,60038,80025,4007,4005,800
(2)(2)(2)
(2)
9,400
166,914,000
$112,482
155,40237,326
257,61761,715
403,362233,460140, 346244,398562,496310,438444,427326, 345311, 759266, 712162, 414215,099261,686238, 399804, 522613, 538320, 534808, 620403, 417342, 586453, 552
48, 727125.439("5(2)(2)
(2)
318,715
8,985, 533
$1 710
247,095
208, 746
170,825
193161131,115110,968789786952
22417199
1347048351813(2
(2
(2
389191881268400839418493413147637786534193103120391405041422
(2)
32,185
2,661,632
$6,86715,75021,72225,00426,54227,48829,54229,77630, 81726,847
136,185133, 55597, 510
189. 930124; 389115, 875114,93348,16451,293(2)(2)(2)
(2)
292,686
1,544,875
$1,710
247,095
208,746
170,825
193,389168,058147,631136,990135,404123,381114,906119,035108,18999,96479,484
360,971305,089196,703324,033194,509164,266150,33866,20564,715(2)
(2)
324,871
4,206,507
1 Nontaxable. Specific exemptions exceed net income.2 Classes grouped to conceal net income and identity of taxpayers.

146 STATISTICS OF INCOME.
TABLE 13.—PERSONAL RETURNS—DISTRIBUTIONCLASSES—Continued.
OREGON.
BY INCOME
Income class.
Under $1,0001Under $1,000$1,000 to $2,0001$1,000 to $2,000$2,000 to $3,0001$2,000 to $3,000$3,000 to $4,0001$3,000 to $4,000$4,000 to $5,0001$4,000 to $5,000$5,000 to $6,000$6,000 to $7,000$7,000 to $8,000$8,000 to $9,000$9,000 to $10,000$10,000 to $11,000$11,000 to $12,000$12,000 to $13,000$13,000 to $14,000$14,000 to $15,000$15,000 to $20,000$20,000 to 125,000$25,000 to $30,000$30,000 to $40,000$40,000 to $50,000$50,000 to $60,000$60,000 to $70,000$70,000 to $80,000$80,000 to $90,000$90,000 to $100,000$100,000 to $150,000$150,000 to $200,000$200,000 to $250,000$250 000 to $300 000$300,000 to $400,000$400,000 to $500 000$500 000 to $750 000$750,000 to $1,000,000$1,000,000 to $1,500,000..$1 500 000 to $2 000 000$2,000,000 to $3 000 000$3,000 000 to $4 000 000$4 000 000 to $5 000 000$5,000,000 and overClasses grouped2
Total
Numberof re-turns.
5,5954G
8,25516,21315,8665,1451,7014,148
1392,1261,000
636413279238146137967881
22390444627164322222
1
2
62,S04
Net income.
$3,147,88821,883
13,003,52423,843,24537,882,11912,777,7235,607,367
14,430,133592,675
9,416,2325,484,4694,116,3313,065,7932,363,5442,256,0551,529,3771,574,4841,199,2521,052,8321,174,8973,819,9052,015,7281,200,5851,581,8521,205,022' 881,444253,268217,352174,789189,410241,470392,156462,912
(2)
(2)
2,398,923
159,574,639
Exemption from nor-mal tax.
Personal ex-emption.
$9,471,3001,000
21,762,40016,366,80048,011,5007,928,5006,168,100
10,090,400492,000
5,634,6002,406,1001,502,400
963,400664,000565,000328,300317,500219,400177,500172,100488,800196,00098,300
102,40049,80029,4006,2005,8003,0002,0003,0002,0003,400
(2)
(2)
7,600
134,240,000
Divi-dends.
$1,017,472725
181,43739,790
459,57763,863
260,585148,669175,633217,404344,377356,108317,051239,340222,482170,082308,489155,097226,676234,120877,739446,661349,198462,826653,902264,800184,899152,206152,551133,018134,90255,000
181,466
(2)
(2)
20,142
9,208,287
Normaltax.
$842
301,833
192,133
166,849
141,752112,84197,99383,52377,58181,00361,31958,49952,50941,34248,682
162,37893,63055,95973,40638,35643,4194,6763,216
6393,9747,640
26,43721,565
(2)
(2)
186,819
2,240,815
Surtax.
$4,88512,40215,83818,79422,51118,83623,23120,66920,60925,919
109,47183,69264,634
113,796117,077108,62236,41836,18435,59242,08268,584
150,627192,767
(2)
(2)
1,367,525
2,710,765
Totaltax.
$842
301,833
192,133
166,849
141,752117,726110,39599,36196,375
103,51480,15581,73073,17861,95174,601
271,849177,322120,593187,202155,433152.04141,09439,40036,23146,05676,224
177,064214,332
(2)
(2)
1,554,344
4,951,580
PENNSYLVANIA.
Under $l,000i | 18,863Under$l,000 1 1410$1,000 to $2,000 i ! 68; 356$1,000 to $2,000 155,113$2,000 to $3,000 i 168,107$2,000 to $3,000 ! 54,165$3,000 to $4,000 i 20,098$3,000 to $4,000 47,646$4,000 to $5,000 i i 3,017$4,000 to $5,000 1 34,494$5,000 to $6,000 12,695$6,000 to $7,000..$7,000 to $8,000..$8,000 to $9,000....$9,000 to $10,000...$10,000 to $11,000..$11,000 to $12,000..$12,000 to $13,000..$13,000 to $14,000..$14,000 to $15,000..$15,000 to $20,000..$20,000 to $25,000..$25,000 to $30,000..$30,000 to $40,000..
7,5455,3613,7322,993,2,2781,7391,4531,2501,0813,4181,7691,1081,342
$11,086,693750,346
105,274,948227,275,503400,215, 298134,425,91467,267,485
165,356,36213,214,813
154,601,93769,258,38348,738,19040,087,67331,617,45728,363,10423,906,29819,965,88518,155, 27516,864,90115,661,17258,666,25739,315,94730,312,23846,192,730
$31,696,70062,800
172,648,300155,326,200431,350,70078,418,90074,048, 700
112,589,10010,480,00089,457, 20029,482,90017,195,50012,164, 7008,314,6006,557, 4004,901, 2003,797, 5003,088,3002,648, 2002,313,9007,203, 6003,690, 3002,259,0002,758,100
$12,938,434151,679
4,997,2721,943,2338,112,1094,409,2257,847,8856,409,6145,575,1548,670,7109,112,2957,340,1286,578,7086,165,5795,914,9145, 483,8984, 534,1394, 408,5224,621,7994,481,710
17,397,19513,503,35912,212,52818,783,080
$23,060
2,814,261
'2,*680,'247'
1,870,193
2,263,3011,280,6331,059,9111,012,870
895,742899, 519793,740712,874674,753626,328608,821
2,372,4031,622,5191,224,7251,907,946
144,625211,590240,152283,108295,218293,732311,150330, 413345,763
1,690,8601,620,4671,631,0993,317,044
$23,060
2,814,261
2,080,247
1,870,193
2,263,3011,339,4851,204,5361,224,4601,135,8941,182,6271,088,9581,006,606
985,903956,741954,584
4,063,2633,242,9862,855,8245,224,990
1 Nontaxable. Specific exemptions exceed net income.2 Classes grouped to conceal net income and identity of taxpayers.
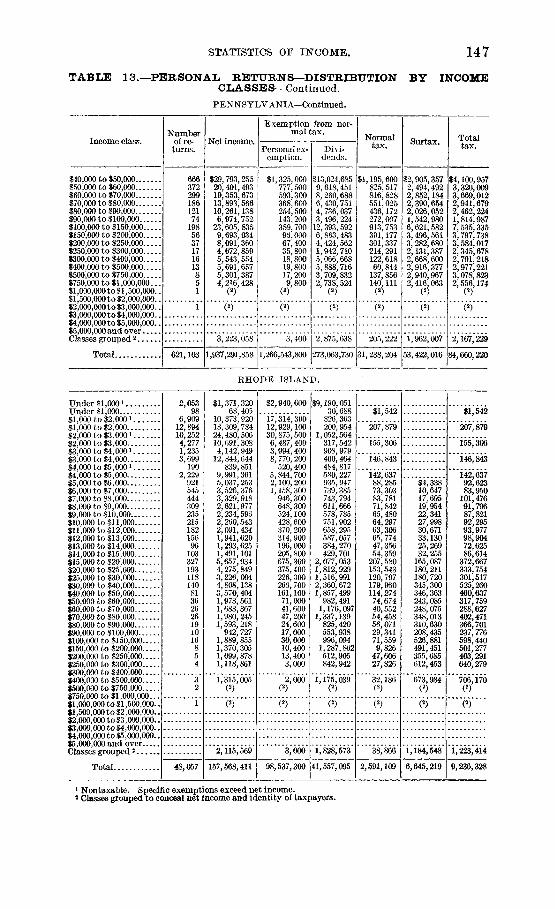
STATISTICS OF INCOME. 147
TABLE 13.—PERSONAL RETURNS—DISTRIBUTION BY INCOMECLASSES—Continued.
PENNSYLVANIA—Cont inued.
$40,000 to $50,000$50,000 to $60,000$60,000 to $70,000$70,000 to $80,000$80,000 to $90,000$90,000 to $100,000$100,000 to $150,000$150,000 to $200,000$200,000 to $250,000$250,000 to $300,000$300,000 to $400,000$400,000 to $500,000$500,000 to $750,000$750,000 to $1,000,000...$l,000,000to$l,500,000..$1,500,000 to $2,000,000..$2,000,000 to $3,000,000..$3,000,000 to $4,000,000..$4,000,000 to $5 000,000 .$5 000 000 and overClasses grouped2
Total
Numberturns.
66637229918612174
1985637171613851
1
621,103
$29,793,25520,401,49319,353,67313,893,56610,261,1386,974,752
23,605,8359,693,0348,091,3604,672,8595,543,5545,691,6575,301,3874,216,428
(2)
(2)
3,223,058
1,937,291,858
Exemption from nor-mal tax.
Personal ex-emption.
$1,325,000777., 500593,300368,600254,500143,200359,70096,00067,40035,80018,80019,80017,2009,800
(2)
(2)
3,400
1,266,543,800
Divi-dends.
$13,024,6859,618,4518,260,6886, 430,7514,736,0373, 496,224
12,393,5926, 863,4834,424,5621,942,7105,066,6685,888,7163,709,8322, 738,524
(2)
(2)
2,875,638
273,063,730
Normaltax.
$1,195,600825,517816,828551,025436,172272,007913,753301,177301,337214,291122,61860,844
137,856140, 111
(25(2)
205,222
31,238,204
$2,905,3572,494,4922,852,1842,390,6542,026,0521,542,9806,621,5823,496,5613,282,6802,131,3872,668,6002,916,3772,940,9672,416,063
(2)
(2)
1,962,007
53,422,016
Totaltax.
$4,100,9573,320,0093,669,0122,941,6792,462,2241,814,9877,535,3353,797,7383,584,0172,345,6782,791,2182,977,2213,078,8232,556,174
(2)
(2)
2,167,229
84,660,220
R H O D E ISLAND.
Under $1,000!Under $1,000$1,000 to $2,000!$1,000 to $2,000$2,000 to $3,000!$2,000 to $3,000$3,000 to $4,000i$3,000 to $4,000$4,000 to $5,0001$4,000 to $5,000$5,000 to $6,000$6,000 to $7,000$7,000 to $8,000$8,000 to $9,000$9,000 to $10,000$10,000 to $11,000$11,000 to $12,000$12,000 to $13,000$13,000 to $14,000$14,000 to $15,000$15,000 to $20,000$20,000 to $25,000$25,000 to $30,000$30,000 to $40,000$40,000 to $50,000$50,000 to $60,000$60,000 to $70,000$70,000 to $80,000$80,000 to $90,000$90,000 to $100,000$100,000 to $150,000....$150,000 to $200,000....$200,000 to $250,000....$250,000 to $300,000....$300,000 to $400,000....$400,000 to $500,000....$500,000 to $750,000....$750,000 to $1,000,000..$1,000,000 to $1,500,000.$1,500,000 to $2,000,000.$2,000,000 to $3,000,000.$3,000,000 to $4,000,000.$4,000,000 to $5,000,000.$5,000,000 and overClasses grouped2
Total.
2,05398
6,90912,89410,2524,2771,2353,699
1902,229
92154544430923521518215696
10332719311814081362626191016854
48,057
$1,371,32068,405
10,373,92018,309,78424,480,50610,691,3084,142,949
12,844,644839,851
9,991,3615,037,2533,526,3763,329,9182,621,9772,234,5982,260,5432,091,4341,941,6201,293,6251,491,1015,657,9344,275,8493,226,0044,808,1383,570,4041,978,5611,683,3671,980,2451,593,218
942,7271,889,8551,370,3051,099,8781,118,861
1,315,005(2)
2,115,569
157,568,411
$2,940,600
17,314,30012,929,10030,875,5006,487,4003,994,4008,770,200
520,4005,844,7002,100, 2001,158,300
946,300648,300524,100428,600370,200314,900196,000205,800675,300375,400226,300266,700161,10071,00041,60047,20024,60017,00030,00010,40013,4003,000
2,0002)
3,000
98,537,300
$9,190,05130,688
826,363200,954
1,052,564317,542908,979400,464484,817580,227935,947739,385743,794611,666578,785751,902658,295587,057384,270429,701
2,077,0531,812,9291,516,9912,360,6721,857,499
982,4911,176,097
1,337,139825,420553,938996,094
1,287,862512,905842,942
1,175,039(2)
1,828,573
41,557,095
$1,542
207,879
155,306
146,843
142,63788,28573,30383,78171,84265,48064,29763,30665,77447,35654,359
207,580153,543120,797179,960114,274
74,67440,55254,45856,07129,34171,5599,826
47,60627,826
32,186(2)
2,591,109
$4,33810,64717,69519,95422', 34127,99830,67133,13025,26932,255
165,087180,211180,720345,300346,363243,085248,075348,013310,630208,435526,881491,451355,685612,453
673,9(2)
1,184,548
6,645,219
$1,542
*207*879
155,306
"146," 843
142,63792,62383,950
101,47691,79687,82192,29593,97798,90472,62586,614
372,667333,754301,517525,260460,637317,759288,627402,471366,701237,776598,440501,277403,291640,279
706,170(2)
1,223,414
9,236,328
1 Nontaxable. Specific exemptions exceed net income.3 Classes grouped to conceal net income and identity of taxpayers.

148 STATISTICS OF INCOME.
TABLE 13.—PERSONAL RETURNS—DISTRIBUTIONCL A S SE S—Continued.
SOUTH CAROLINA.
BY INCOME
Income class.
Under $1,0001Under $1,000$1,000 to $2,0001$1,000 to $2,000$2,000 to $3,0001$2,000 to $3,000$3,000 to $4,0001$3,000 to $4,000$4,000 to $5,0001$4,000 to $5,000$5,000 to $6,000$6,000 to $7,000$7,000 to $8,000$8,000 to $9,000$9,000 to $10,000$10,000 to $11,000$11,000 t o $12,000$12,000 t o $13,000$13,000 t o $14,000$14,000 t o $15,000$15,000 t o $20.000$20,000 t o $25,000$25,000 t o $30,000$30,000 t o $40,000$40,000 t o $50,000$50,000 to $60,000$60,000 t o $70,000$70,000 t o $80,000$80,000 t o $90,000$90,000 to $100,000
$100,000 to $150,000$150 000 t o $200,000...$200,000 t o $250,000$250,000 t o $300,000...$300,000 t o $400,000...$400 000 t o $500 000$500,000 t o $750,000$750 000 t o $1,000,000.$1,000,000 t o $1,500,000..$1,500,000 t o $2,000,000.$2,000 000to$3,000,000 .$3,000,000 to $4,000,000..$4,000,000 to $5,000,000..$5,000,000 and over. . .Classes grouped2
Total
Numberof re-turns.
1,44317
2,0845,7657,8982,0081,3701,664
2091,123
464299187134866149392920
101352322149222
1
25,160
Net income.
$516,62611,480
3,320,0848,544,512
18,943,0564,924,0124,520,6415,753,723
922,4195,031,7682,542, 8291,931,6061,394,1801,133, 612
815, 646641, 850564,134484,311391,188289, 212
1,713,667778, 000625,387773,158626,427502,822121,725144,897(2)
(2)
292,853
68,255,825
Exemption from nor-mal tax.
Personal ex-emption.
$3,101,300
5,510,7005,811,400
25,779,4002,849,6005,141,7003.892,900
808, 8003,065,6001,090,700
719,300461,300316, 200227,000150,300104,900103,10064,40048,200
226,40074,40056,90045,80032,20024,5004,4005,600
(2)
(2)
7,200
59,724,200
Divi-dends.
$265,699
120,85739,260
367,14490,468
280, 565189,144250, 840235,982386,002384,381345,321205,353140,177196,903232,020130,626205,151
51,527631,378454,826262,153361,301232,120228,948
11,73397,037(2)
(2)
148,103
6,545,019
Normaltax.
$456
108; 422
79,662
66,910
69,28145,44038,01529,40631,14124,12817,68614,99014,8709,241
12,08062,46529,23121,98128,33826,68218,3757,8423,486
(2)
(2)
10,570
770,698
Surtax.
$2,2635,7217,2908,5238,1167,9818,2988,2217,6276,348
48,52832,12233,43458,07760,89462,93116,72024,108(2)
(2)
68,623
475,825
Totaltax.
$456
108,422
79,662
66,910
69,28147,70343,73636,69639,66432,24425,66723,28823,09116, 86818,428
110,99361,35355,41586,41587, 57681,30624, 56227,594(2)
(2)
79,193
1,246,523
SOUTH DAKOTA.
Under $1,0001.. . ,Under $1,000 ,$1,000 to $2,000!..$1,000 t o $2,000...,$2,000 t o $3,0001..$2,000 to $3,000...,$3,000 to $4,0001..$3,000 to $4,000...$4,000 to $5,0001..$4,000 to $5,000...$5,000 to $6,000...,$6,000 to $7,000....$7,000 to $8,000....$8,000 to $9,000....$9,000 to $10,000...$10,000 to $11,000.,$11,000 to $12,000.,$12,000 to $13,000..$13,000 to $14,000..$14,000 to $15,000..$15,000 to $20,000.,$20,000 to $25,000..$25,000 to $30,000.,$30,000 to $40,000.,
2,79138
3,1135,5554,9911,456
7581,230
1328452591459068473228301811291147
$1,169,13020,263
4,813,1657,894,222
11,904,4353,583,0332,505,2984,225,884
587,0533,759,6781,415,784
937,649669,289489,136447,802334,844322,449375,291242,502158,836490,532250,485109,182230,397
$6,376,3003,100
8,919,3005,533,100
15,648,4002,237,8002,727,9003,025,300
512,2002,402,500
677,800359,100192, OCX)131,600104,700
75,10065,50073,30035,80021,40065,40020,80011,00016,400
$91,5691,25694,62019,288232,30240,664160,54047,656173,99983,609158,145124,276118,36884,26760,12486,30593,12257,35273,73046,903216,01471,30934,821116,611
$632
*93*808*
52,337
"46," 263*
1 Nontaxable. Specific exemptions exceed net income.2 Classes grouped to conceal net income and identity of taxpayers.
51,18624,17120,22917,39414,24515,76110,58410,16315,2558,1455,87113,4009,7985,2226,482
$1,2172,7933,4533,6544,4954,0404,7776,4614,7423,48213,92110,7205,74215,733
93,808
52,337
*46*263
51,18625,38823,02220,84717,899-20,25614,62414,94021,71612,8879,35327,32120,51810,96422,215

STATISTICS OF INCOME. 149
TABLE 13.—PERSONAL RETURNS—DISTRIBUTION BY INCOMECL A S SE S—Continued.
SOUTH DAKOTA—Continued.
Income class.
$40,000 to $50,000$50,000 to $60,000$60,000 to $70,000$70,000 to $80,000$80,000 to $90 000 . . .$90,000 to $100,000$100,000 to $150,000$150,000 to $200,000$200,000 to $250,000$250,000 to $300,000$300,000 to $400,000$400,000to$500,000... .$500,000 to $750,000$750,000 to $1,000,000 . .$1,000,000 to $1,500,000..$1,500,000to$2,000,000..$2,000 000 to $3 000 000$3,000,000 to $4,000,000..$4,000,000 to $5 000 000$5,000,000 and overClasses grouped2 .
Total
Numberof re-
turns.
12
21,681
Net income.
(2)(2)
$151,159
47,087,498
Exemption from nor-mal tax.
Personal ex-emption.
(2)(2)
$9,200
49,245,000
Divi-dends.
(2)(2)
$133,612
2,420,462
Normaltax.
$1,606
422,552
Surtax.
8
$16,871
102,101
Totaltax.
(2)C2)
$18,477
524,653
T E N N E S S E E .
Under $1,0001Under $1,000$1,000 to $2,000i$1,000 to $2,000$2,000 to $3,0001$2,000 to $3,000$3,000 to $4,000 i$3,000 to $4, 000$4,000 to $5,0001$4,000 to $5,000$5,000 to $6,000$6,000 to $7,000$7,000 to $8,000$8,000 to $9,000$9,000 to $10,000$10,000 to $11,000$11,000 to $12,000$12,000 to $13,000$13,000 to $14,000$14,000 to $15,000$15,000 to $20,000$20,000 to $25,000$25,000 to $30,000$30,000 to $40,000$40,000 to $50,000$50,000 to $60,000$60,000 to $70,000$70,000 to $80,000$80,000 to $90,000$90,000 to $100,000$100,000 to $150,000$150 000 to $200 000$200,000 to $250,000 .$250 000 to $300 000$300 000 to $400 000$400 000 to $500 000$500'000 to $750*000$750 000 t o $1 000 000$1,000,000 to $1,500,000$1 500 000 to $2 000 000$2 000 000 to $3 000 000$3 000 000 to $4 000 000$4'000'000 to $5*000 000$,*> 000 000 and over
Total
4,57598
7,15313,84715,3784,5332,7714,509
4972,8371,198
83654239430322520214811281
28616883
104311574237
60,949
$1,891,15639,082
11,068,86619,910,02236,884,36111,378,3559,251,810
15,658,7992,139,421
12,689,3616,550,5875,405,6974,060,5973,328,1532,868,8832,355,0732,323,0201,841,9801,505,2391,174,4684,899,4723,715,6212,281,7903,571,5971,337,573
807,644461,207298,054167,221288,766815,920
170,969,895
$8,469,800"700
18,296,40014,045,40048,237,6007,441,700
10,053,20011,377,5001,909,8007,862,8002,829,2002,006,6001,264,300
916,000690,400514,500452,000333,200247,800190,600631,200390,900194,800219,80068,60033,00015,60010,8003,2009,600
17,800
138,734,800
$810,2905,923
404,49368,367
756,86082,660
1,078,893262,405625,480378,064741,489719,533586,309571,617545,311541,073529,201442,600366,630302,515
1,158,7551,354,195
773,1121,057,386
481,615264,280292,57645,57478,26581,905
296,805
15,704,181
$1,510
233,813
154,410
164,549
179,579123,450117,719103,13594,88189,46575,77283,77965,94156,24046,436
205,748142,44398,223
170,62863,30235,38215,44715,2336,541
15,25539,689
2,398,570
$5,64416,12821,49924,92028,43528,91634,15031,34129,12425,985
141,181152,337125,657255 244124,98997,04569,18451,13432,47765,243
224,848
1,585,481
$1,510
233,813
154,410
164,549
179,579129,094133,847124,634119,801117,900104,688117,92997,28285,36472, 421
346,929294, 780223,880425,872188,291132,42784,63166,36739,01880,498
264,537
3,984,051
1 Nontaxable. Specific exemptions exceed net income.2 Classes grouped to conceal net income and identity of taxpayers.

150 STATISTICS OF INCOME.
TABLE 13.—PERSONAL RETURNS—DISTRIBUTION BY INCOMECLASSE S—Continued.
TEXAS.
Income class.Number
of re-turns.
Net income.
Exemption from nor-mal tax.
Personal ex- Divi-emption. dends.
Normaltax. Surtax. Total
tax.
Under $1,0001Under $1,000$1,000 to $2,0001$1,000 to $2,000$2,000 to $3,0001$2,000 to $3,000$3,000 to $4,0001$3,000 to $4,000$4,000 to $5,0001$4,000 to $5,000$5,000 to $6,000$6,000 to $7,000$7,000 to $8,000$8,000 to $9,000$9,000 to $10,000$10,000 to $11,000$11,000 to $12,000$12,000 to $13,000$13,000 to $14,000$14,000 to $15,000$15,000 to $20,000$20,000 to $25,000$25,000 to $30,000$30,000 to $40,000$40,000 to $50,000$50,000 to $60,000$60,000 to $70,000$70,000 to $80,000$80,000 to $90,000$90,000 to $100,000 ,$100,000 to $150,000$150,000 to $200,000$200,000 to $250,000$250,000 to $300,000$300,000 to $400,000$400,000 to $500,000$500,000 to $750,000$750,000 to $1,000,000...$1,000,000 to $1,500,000$1,500,000 to $2,000,000$2,000,000 to $3,000,000$3,000,000 to $4,000,000$4,000,000 to $5,000,000$5,000,000 and over'....Classes grouped 2
Total
17,94597
24,58636,33250,99718, 7437,38520,202
84411,6603,9842,0371,2357545434403203181991845402721411981103630151531262
$8,301,79349,899
38,799,44154,597,163122.135,07747' 476,27124,559,45170,129,0123,708,94052,117,60721,614,78813,137,4519,210,9346,391,3065,156,1594,611,3753,682,3773,966,7372,632,6022,673,3429,274,7506,049,9043,829,6856,773,3494,905,9181,969,1311,931,5691,136,0481,262,302' 273,0751,419,1331,100,148452,167
$37,231,900200
67,165,60036,804,400157,415,40028,662,20026,867,60044,270,0003,153,30026,941,2007,948,1003,660,3002,129,9001,130,400757,900628,300435,400456, 800303,900245,800738,900359,500185,500279,300137, 20050,40034,60020,00021,0003,00013,6006,8004,400
$1,691,2776,272
1,290,445152,463
1,508,347564,307
1,303,6801,549,0371,038,1171,675,5822,189,6251,673,7971,341,0101,090,4711,047,672792,415718,401853,977558,845534,580
2,314,5721,630,0431,205,3462,092,4341,464,537494,478538,659219,309134,614111,774601,039340,640194,359
$1,793
710,706
*735,*7i7"
$1,793
'716*766
735,717
981,701 98i,70i
941,390487,954361,559296,432232,917201,787189,473160, 503172,814110,417127,665425,617297,056189,248338,997251,607108,639109,17068,80385,73612,18465,12770,37319,953
$17,07838,69648,18648,34751,17456,96154,09867,94549,96359,197266,495248,766203,333479,346477,751240,824273,251198,512246,93458,082396, 068228,472186,320
941,390505,032400,255344,618281,264252,961246,434214,601240,759160,380186,862692,112545,822392, 581818, 343729,358349,463382,421267, 315332,67070,266461,195298, 845206,273
1,568, 523 5,800 560,782 ;o, 118 836,639 916,757
200,188 536,897,427 448,068,600 33,482,906 7,835,456 4,832,438 12,667,894
UTAH.
Under $1,0001.. . .Under $1,000$1,000 to $2,0001..$1,000 to $2,000....$2,000 to $3,0001..$2,000 to $3,000....$3,000 to $4,0001..$3,000 to $4,000....$4,000 to $5,0001..$4,000 to$5000. . . .$5,000 to $6,000....$6,000 to$7,000....$7,000 to $8,000....$8,000 to $9,000....$9,000 to $10,000...$10,000 to $11,000..$11,000 to $12,000..$12,000 to $13,000..$13,000 to $14,000..$14,000 to $15,000..$15,000 to $20,000..$20,000 to $25,000..$25,000 to $30,000..$30,000 to $40,000..
1,
4,6,7,1,
1,
8442413940125678399345411585038923014810065564434392868321213
$934,38115,249
6,436,6659,299,32717,171,6824,355,7943,315,9285,032,754509,431
3,833,7272,127,4361,478,7701,106,077844,027614,921587,409506,782424,817527,233404,267
1,156,276716,525337,684440,651
$3,052,5002,600
11,469,9006,472,20024,026,5002,623,3003,700,0003,629,500414,400
2,410,5001,022,900561,800367,800247,200157,900138,400114,40085,00088,30067,200161,40087,50022,00029,600
$23,791432
126,61321,403
280,15551,119
262,01575, 061
142,73098, 289
286,827309,193191,558168,323106,536148,927153,602125,634217,455162,048430,548380,92184,475
209,657
111, 933
67,349
54,134
53,04934,61727,97225,43021,89419,37518,34615,33013,18716,37912,02340,38623,03416,48414,378
$1,8704,3065,8856,3166,3747,2537,5047,304
10,3738,870
32,59729,90418,88731,116
$558
111, 933
67,349
54,134
53,04936,48732,27831,31528,21025,74925,59922,83420,49126,75220,89372,98352,93835,37145,494
1 Nontaxable. Specific exemptions exceed net income.* Classes grouped to conceal net income and identity of taxpayer.

STATISTICS OF INCOME. 151
TABLE 13.-—PERSONAL RETURNS—DISTRIBUTION BY INCOMECLASSE S—Continued.
UTAH—Continued.
Income class.
$40,000 to $50,000$50,000 to $60,000$60,000 to $70,000$70,000 to $80,000$80,000 to $90,000$90,000 to $100,000$100,000 to $150,000$150,000 to $200,000$200 000 to $250,000.. . .$250,000 to $300,000$300 000 to $400,000.. . .$400,000 to $500,000$500 000 to $750,000$750,000 to $1,000,000...$1 000 000 to $1,500,000..$1,500,000 to $2,000,000..$2 000 000 to $3,000,000..$3,000,000 to$4,000,000..$4 000 000 to $5,000,000..$5 000 000 and over...
Total
Numberof re-turns.
632
26,128
Net income.
$255,877155,107124,664
62,713,461
Exemption from nor-mal tax.
Personal ex-emption.
$15,2007,6004,200
60,979, 800
Divi-dends.
$105,18376,43180,201
4,319,127
Normaltax.
$9,4787,0493,017
605,402
Surtax.
$23,59117,76917,583
237,502
Totaltax.
$33,06924,81820,600
842,904
VERMONT.
Under $1,000*Under $1,000$1,000 to $2,000 i$1,000 to $2,000$2,000 to $3,000 i$2,000 to $3,000$3,000 to $4,000 i$3,000 to $4,000$4,000 to $5,000 i$4,000 to $5,000$5,000 to $6,000$6,000 to $7,000$7,000 to $8,000$8,000 to $9,000$9,000 to $10,000$10,000 to $11,000$11,000 to $12,000$12,000 to $13,000$13,000 to $14,000$14,000 to $15,000$15,000 to $20,000$20,000 to $25,000$25,000 to $30,000$30,000 to $40,000$40,000 to $50,000$50,000 to $60,000$60,000 to $70,000$70,000 to $80,000$80,000 to $90,000$90,000 to $100,000$100,000 to $150,000$150,000 to $200,000$200 000 to $250,000$250,000 to $300,000$300,000 to $400,000$400,000 to $500,000$500,000 to $750,000$750,000 to $1,000,000...$1,000,000 to $1,500,000.$1,500,000 to $2,000,000.$2,000,000 to $3,000,000.$3,000,000 to $4,000,000.$4,000,000 to $5,000,000.$5,000,000 and overClasses grouped2
Total
1,07630
2,3544,8614,2691,183
5801,228
146791339217140988152453029236047191614831221
1
17,746
$580,3028,094
3,513,3106,709, 455
10,138,6522,951,6441,962,0384,237,326
661,7353,498,7591,863, 7411,406,7641,053,606
831, 809769, 000547,442514,944373,983391,957332,682
1,057,3771,034,251
509,659545,865612,688431,913191,397(2)164,805197,549(2)
(2)
468,810
47,561,557
$1,626,800
5,954,4004,887,800
13,015,1001,867,6001,836,1002,968,200
437,0002,112,300
801, 700496,000326,100219, 200179,400119,20097,40065,50051,00046,800
127,10086,50032,40029,80027,40013,4005,800
(2)4,0003,000
(a)
(2)
2,000
37,439,000
$328,3072,664
228,29230,646
362,70744,594
454, 962115,438407,626136,656308, 008267,913194,339188,631229, 773159,625116,21982,580
163,593118,835341,420464,415216, 768307,852409,179286,891126.007(25124,602166,178(2i
(2)
496,057
6,880,777
$210
72,868
41,686
46,376
50,14131,48328,47726,10722,51219,90416,88417,66013,58011,42610,96439,15939,11620,05811,53913,96012,1615,492
& *
(?57 6 1
(2)
682
558,470
$1,6934,2545,6606,3297,6697,0207,5056,3967,7037,317
31,91752,17526,83938,80758,12352,00627.784
(2531,50145.844(2i(2)
170,755
597,297
$210
72,868
41,686
46,376
50,14133,17632,73131,76728,84127,57323,90425,16519,97619,12918,28171,07691,29146,89750,34672,08364,16733,276(2)34,76548,605(2)
(2)
171,437
1,155,767
1 Nontaxable. Specific exemptions exceed net income.2 Classes grouped to conceal net income and identity of taxpayers.
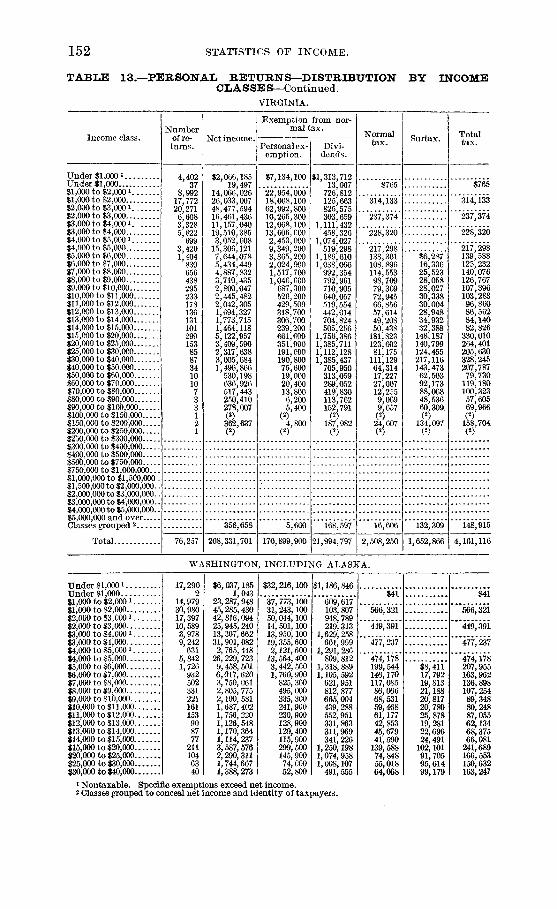
152 STATISTICS OF INCOME.
TABLE 13.—PERSONAL RETURNS—DISTRIBUTIONCLASSE S—Continued.
VIRGINIA.
BY INCOME
Income class.
Under $1,0001Under $1,000$1,000 to $2,000!$1,000 to $2,000$2,000 to $3,0001$2,000 to $3,000$3,000 to $4,0001. . . .$3,000 to $4,000$4,000 to $5,0001$4,000 to $5,000$5,000 to $6,000$6,000 to $7,000$7,000 to $8,000$8,000 to $9,000$9,000 to $10,000$10,000 to $11,000$11,000 to $12,000$12,000 to $13,000$13,000 to $14,000$14,000 to $15,000$15,000 to $20,000$20,000 to $25,000$25,000 to $30,000$30,000 to $40,000$40,000 to $50,000$50,000 to $60,000$60,000 to $70,000$70,000 to $80,000$80,000 to $90,000$90,000 to $100,000$100,000 to $150,000$150,000 to $200,000$200,000 to $250,000$250,000 to $300,000...
$300,000 to $400,000$300,000 to $500,000$500,000 to $750,000...$750,000 to $1,000,000$1,000,000 to $1,500,000 .$1,500,000 to $2,000,000..$2 000 000 to $3 000 000$3,000,000 to $4,000,000..$4,000,000 to $5,000,000..$5 000 000 and over. .Classes grouped 2
Total
Numberof re-turns.
4,40237
8,99217,77220,2716,6083,3285,622
6993,4201,404
8396564382952331781361311012991538587341010733121
76,257
Net income.
$2,066,18519,497
14,066,02626,033,00748,477,59416,461,43611,157,04019,510,3853,052,608
15,306,1217,644,0785,434,4494,887,8323,710,4352,800,0472,445,4822,042,3051,694,3271,773,7151,464,1185,122,9573,409,5902,317,6383,005,6841,496,866
530,198636,926517,443250,410278,007(2)362,637(2)
356,658
208,331,701
Exemption from nor-mal tax.
Personal ex-emption.
$7,134,100
22,954,00018,068,10062,992,80010,265,30012,068,10013,606,6002,453,0009,349,2003,365,2002,024,9001,517,7001,046,600
687,300526,200429,500318,700306,700239,200661,600351,900191,600190,80075,60019,00020,40013,8006,2005,400
(2)4,800
(2)
5,600
170,899,900
Divi-dends.
$1,313,71213,007
726,812125,663825,575303,659
1,111,432458,326
1,074,027519,298
1,186,6101,038,066
992,354792,961710,905040,057519,554442,014704,824505,256
1,756,3861,385,7111,112,1281,385,437
705,950313,059289,052419,830113,762152.791(25187,9821
(2)
168,597
21,994,797
Normaltax.
$765
314,133
237,374
228,320
217,298133,301108,896114,55398,70979,36972,94566,85657,61449,20850,438
181,823123,60281,175
111,12964,31417,22727,00712,2559,0699.657(25
24,607(25
16,606
2,508,250
Surtax.
$6,28716,33625,52328,05828,02730,33830,00428,94834,93232,388
148,187140,799124,455217,116143,47362,50392,17388,06848,53660,309.(2)
134,097(2)
132,309
1,652,866
Totaltax.
$765
314,133
237,374
228,320
217,298139,588125,232140,076126,767107,396103,28396,86086,56284,14082,826
330,010264,401205,630328,245207,78779,730
119,180100,32357,60569,966
(2)158,704(2)
148,915
4,161,116
WASHINGTON, INCLUDING ALASKA.
Under $1,0001Under $1,000$1,000 to $2,000 i$1,000 to $2,000$2,000 to $3,0001$2,000 to $3,000$3,000 to $4,000113,000 to $4,000$4,000 to $5,000 i$4,000 to $5,000$5,000 to $6,000$6,000 to $7,000$7,000 to $8,000$8,000 to $9,000$9,000 to $10,000$10,000 to $11,000$11,000 to $12,000$12,000 to $13,000$13,000 to $14,000$14,000 to $15,000$15,000 to $20,000$20,000 to $25,000$25,000 to $30,000$30,000 to $40,000
17,2902
14,97930,98017,39710,5893,9789,242
6315,8421,726
932502331221161153908777
2111046340
$6,037,1851,043
23,287,94845,285, 43042,816,09425,945, 24013,307,66231,901, 0822, 765, 448
26, 229, 7239,458, 5016,017,6203, 750, 0612,805, 7752,100, 5811,687, 4021, 756, 2201,126,5481,170, 3641,114, 2373,587, 5762,290, 3111, 744, 6671,388,273
$32,216,100 $1,186,846
37,773,10031,243,10050,044,10014,501,10013,950,100.19,355,6002,121, 60013,564, 4003,442, 5C01,760,900825, 300495, 000335, 300241, 900230,900128,900129,400115,900299,500145,90074,00052,800
609,617103,807
219,3131,629,258661, 999
1,291, 286809, 812
1,318, 8891,105, 592623,951812, 877665,004439, 288552,951331, 863311,969341,226
1,250,1981,074,9581,008,107491,555
$41
566,321
449,391
477,237
474,178199,544146,170117,08586,06668,53159,46861,17742,85345,67941,590139,58874,84855,01864,068
$8,41117,79219,81321,18820,81720,78025,87819,28122,69624,491102,10191,70595,61499,179
$41
*566*32i
449,391
'*477," 237
474,178207,955163,962136,898107,25489,34880,24887,05562,13468,37566,081241,689166,553150,632163,247
1 Nontaxable. Specific exemptions exceed net income.2 Classes grouped to conceal net income and identity of taxpayers.
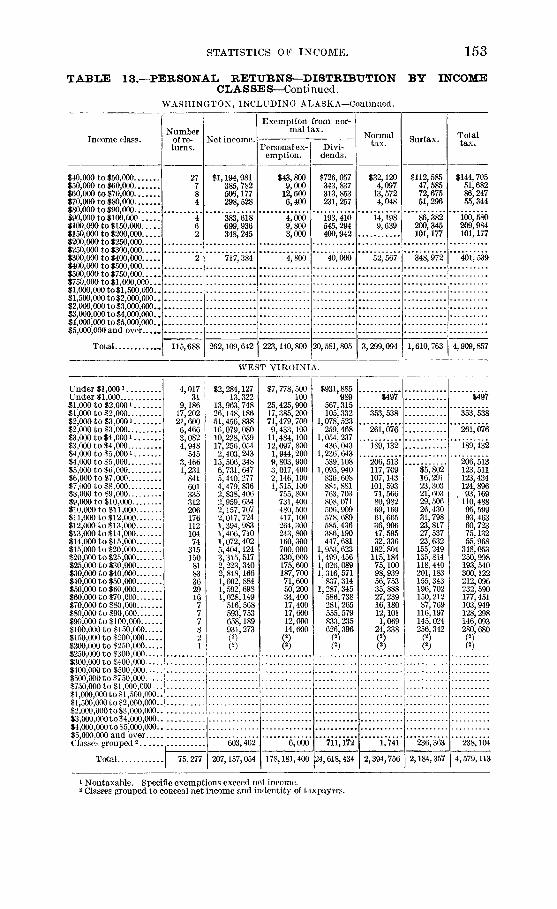
STATISTICS OF INCOME. 153
TABLE 13.—PERSONAL. RETURNS—DISTRIBUTION BY INCOMEC LA S SE S—Continued.
WASHINGTON, INCLUDING ALASKA—Continued.
Income class.
$40,000 to $50,000$50,000 to $60,000$60,000 to $70,000$70,000 to $80,000$80,000 to $90,000$90,000 to $100,000$100,000 to $150,000$150,000 to $200,000$200,000 to $250,000$250,000 to $300,000$300,000 to $400,000$400,000 to $500,000$500 000 to $750 000$750,000 to $1,000,000 . .$1,000 000 to$l 500 000$1,500,000 to $2,000 000..$2,000,000 to $3,000,000...$3,000,000 to $4,000,000..$4,000,000 to $5,000,000..$5,000,000 and over
Total m
Numberof re-turns.
27784
462
2
115,688
Net income.
$1,194,981385, 782506,177298,528
383,618699,936348, 245
717,384
262,109,642
Exemption from nor-mal tax.
Personal ex-emption.
$43,8009,000
12,6006,400
4,0009,8003,000
4,800
223,140,800
Divi-dends.
$726,057343, 837313, 853231, 257
193, 410545, 294400,942
40,000
20,581,805
Normaltax.
$32,1204,097
13,5724,048
14,1989,639
52, 567
3,299,094
Surtax.
$112,58547,58572,67551,296
86,382200, 345101,177
348, 972
1,610,763
Totaltax.
$144,70551,68286,24755,344
100,580209,984101,177
401, 539
4,909,857
W E S T VIRGINIA.
Under $l,OOOiUnder $1,000$1,000 to $2,0001$1,000 to $2,000$2,000 to $3,0001$2,000 t o $3,000$3,000 to $4,000i$3,000 to $4,000$4,000 to $5,0001$4,000 to $5,000$5,000 to $6,000$6,000 to $7,000$7,000 to $8,000$8,000 to $9,000$9,000 to $10,000$10,000 to $11,000$11,000 to $12,000$12,000 to $13,000$13,000 to $14,000$14,000 to $15,000$15,000 to $20,000$20,000 to $25,000$25,000 to $30,000$30,000 to $40,000$40,000 to $50,000$50,000 to $60,000$60,000 to $70,000$70,000 to $80,000$80,000 to $90,000$90,000 to $100,000$100,000 to $150,000$150,000 to $200,000$200,000 to $250,000$250,000 to $300,000$300,000 to $400,000...$400,000 to $500,000
4,01731
9,18617,20221,6006,4663,0824,948
5453,4661,231
84160133531220617611210474
3151508183362916777821
$500 000 to $750 000 . 1 .$750 000 to $1 000,000. .$1 000 000to$l 500 000 .$l',500',000 to $2',000,000..$9 000 000 to S3 000 000 .$3 000 000to $4 000,000..$4 000 000to $5 000 000$s'ooo'ooo and 'overClasses grouped2
Total 75,277
$2,284,12713,322
13,963,74826,148,18651,456,83816,079,08010,228,65917,256,0542,403,243
15,506, 3486,731, 6475,440,2774,479, 8362, 838, 4062,959,6342,157, 7072,017, 7241,394, 9831,406,7101,072,4025,404,1243,315,5172,223,3402,848,1661,602, 8841,592,6981,028,149
516,568593, 753658,189931,273
603,462
207,157,054
$7,778,500100
25,425,90017,385,20071,479,7009,433,100
11,484,10012,097,8001,944,2009,803, 9003,017, 4002,146,1001,515, 100
755, 800731, 400480, 500417,100264, 300243,800160,300700,000330,000175,600187,70071,60050,20034,40017,40017,60012,00014,600
$931,885989
567,315105,332
1,078,523259, 468
1,054,237436, 043
1,236,643539,108
1,095,940836, 608884, 881763, 703808,071506,909578, 689585,436386,190447, 681
1,953,6231,499,4561,026,0891,316,571
837,3141,287,345
586,738281,265555,579833,235626,396
1
6,000
178,181,400
711,172
24,618,434
$497
353,538
261,076
189,132
206,513117,709107,143101,59371,56680,98269,16961,66536,90647,59532,336
192,804115,18475,10098,93956,75335,88827,23916,18012,1011,069
24.338(25
$5,80216,29123,30321,60329,50626,43031,79823,31727,53723,632
155, 249135, 814118,440201,183155,343196,702150,21287, 769
116,197145, 024256,342
j
1,741
2,394,756
236,363
2,184,357
$497
353,538
261,076
189,132
206,513123,511123,434124,896
„ 93,169110,48895,59993,46360,72375,13255,968
348,053250,998193,540300,122212,096232,590177,451103,949128,298146,093280,680
238,104
4, 579,113
1 Nontaxable. Specific exemptions exceed net income.2 Classes grouped to conceal net income and indentity of taxpayers.

154 STATISTICS OF INCOME.
TABLE 13.—PERSONAL RETURNS—DISTRIBUTION BY INCOMECL A S SE S—Continued.
WISCONSIN.
Income class.
Under $1,0001Under $1,000$1,000 to $2,0001$1,000 to $2,000$2,000 to $3,0001$2,000 to $3,000$3,000 to $4,0001$3,000 to $4,000$4,000 to $5,0001$4,000 to $5,000$5,000 to $6,000$6,000 to $7,000$7,000 to $8,000$8,000 to $9,000$9,000 to $10,000$10,000 to $11,000$11,000 to $12,000$12,000 to $13,000$13,000 to $14,000$14,000 to $15,000$15,000 to $20,000$20,000 to $25,000$25,000 to $30,000$30,000 to $40,000$40,000 to $50,000$50,000 to $60,000$60,000 to $70,000$70,000 to $80,000$80,000 to $90,000$90,000 to $100,000..$100,000 to $150,000$150,000 to $200,000$200,000 to $250,000$250,000 to $300,000$300,000 to $400,000$400,000 to $500,000$500,000 to $750,000$750,000 to $1,000,000...$1,000,000 to $1,500,000..$1,500,000 to $2,000,000..$2,000,000 to $3,000,000..$3,000,000 to $4,000,000..$4,000,000 to $5,000,000..$5,000,000 and overClasses grouped2
Total
Numberof re-turns.
16,810315
24,77439,66821,85311,3513,048
11,032708
8,3153,2811,9391 272
74660140934125921917553529716315165452720155
143
1
148,457
Net income.
$10,764,827178,039
37,351,65555,299,48551,576,75028,547,44110,189,90038,358,6613,041,519
37,506,69017,710,42212,543,4589,503,2336,327,3555,694,6224,289,8863,917,5263,234,2662,955,8042,534,3639,188,7716,617,4614,446,9315,176,8292,896,8982,467,3891,729,7161,491,8551,263,315
477,1231,668,895
(2)
C2)
803,137
379,754,222
Exemption from nor-mal tax.
Personal ex-emption.
$28,208,10022,800
66,907,20039,802,90067,565,50017,501,00010,796, 70027,434,5002, 770,400
22,377,2007,935,0004,587,3002,970,0001,720,1001,427, 700
936,900771,500565,300479,400396,100
1,192,700648,100350,500323,700135,80089,60048,10036,20028,00010,60056,600(2)
(2)
5,000
308,100,500
Divi-dends.
$1,350,79435,736
647,172336,472
1,507,882583,050
1,426,848882,357892,492
1,459,8501,735,3591,567,9951,318,7921,204,2641,197,1611,004,578
966,726754,964813,579740,398
2,819,7302,153,7621,680,7832,218,0851,326,7011,622,150
979,2781,141,028
865,900204,084980,530(25
(2)
716,209
37,134,709
Normaltax.
$4,715
612,866
414,126
401,236
544,008331,533272,656243,617178,081168,241134,740132,045115,480103,84589,435
349,273262,793171,425190,517106,05163,42758,98631,18434,19920,19153,999
(2)
15,801
5,104,470
Surtax.
$13,15737,60850,01347,95956,46753,00657,38555,85057,92355,632
264,772273,788243,052370,637280,840302,661251,910256,385245,849106,836468,986(4
(2)
315,858
3,866,574
Totaltax.
$4,715
612,866
414,126
401,236
544,008344,690310,264293,630226,040224,708187,746189,430171,330161,768145,067614,045536,581414,477561,154386,891366,088310,896287, 569280,048127,027522,985(2)
(2)
331,659
8,971,044
1 N on taxable. Specific exemptions exceed net income.a Classes grouped to conceal net income and identity of taxpayers.

STATISTICS OF INCOME. 155
TABLE 13.—PERSONAL RETURNS—DISTRIBUTION BY INCOMECLASSES—Continued.
WYOMING.
Income class.
Under $1,0001Under $1,000$1,000 to $2,0001$1,000 to $2,000$2,000 to $3,0001$2,000 to $3,000$3,000 to $4,0001$3,000 to $4,000$4,000 to $5,0001$4,000 to $5,000$5,000 to $6,000$6,000 to $7,000$7,000 to $8,000$8,000 to $9,000$9,000 to $10,000$10,000 to $11,000$11,000 to $12,000$12,000 to $13,000$13,000 to $14,000$14,000 to $15,000$15,000 to $20,000$20,000 to $25,000$25,000 to $30,000$30,000 to $40,000$40,000 to $50,000$50,000 to $60,000$60,000 to $70,000$70,000 to $80,000$80,000 to $90,000$90,000 to $100,000$100,000 to $150,000$150,000 to $200,000. . . .$200,000 to $250,000$250,000 to $300,000$300,000 to $400,000$400,000 to $500,000$500,000 to $750,000$750,000 to $1,000,000. -.$1,000,000 to $1,500,000.$1,500,000 to $2,000,000..$2,000,000 to $3,000,000..$3,000,000 to $4,000,000..$4,000,000 to $5,000,000..$5,000,000 and overClasses grouped 2
Total
Numberof re-turns.
2,10625
3,1595,6295,3562,642
8051,295
82613227124805142252718151238187643
1
12
22,413
Net income.
$1,068,80113,290
5,122,6728,557,890
12,865,2736,344,0072,683,7214,463,183
356,7342,732,9851,253,329
801,649595,240433,780398,342262,900310,218222,670203,405174,054633,638405,547193,270201,773175,543155,849
(2)
(2)249,445
172,421
51,051,629
Exemption from nor-mal tax.
Personal ex-emption.
$3,926,0005,200
8,779,9005,709,300
16,999,6003,656,5003,051,5003,147,700
309,2001,783,000
594,200302,800198,200109,40082,20059,00057,00040,40040,00028,40085.00037;80019,2008,4007,3009,200
(2)
3,000
49,053,400
Divi-dends.
$179,650170
67,80415,34794,66613,972
122,76739,762
102,39345,53474,73874,11189,02869.51277,48577,73141,72034,92370,02555,671
164,46275,31237,38790,46911,74738,677
(2)
(2)1,032
Normaltax.
$532
114,101
106,893
51,051
35,95624,41918,42414,41513,24513,5818,650
12,9429,2136,0775,769
26,48419,4599,9097,611
11,8378,159
(2)
19,233
31,668
1,797,763
9,492
547,452
Surtax.
$1,2062,3753,1043,2993,9723,5824,5613,7894,0103,844
1.7,53017,03110,57014,06916,77617,962
(2)
Totaltax
$532
114,101
106,893
51,051
35,95625,62520,79917,51916,54417,55312,23217,50313,00210,0879,613
44,01436,49020,47921,6802S,61326,121
(2)
(2)91,964
;; ;
35,394
235,805
44,886
783,257
1 Nontaxable. Specific exemptions exceed net income.* Classes grouped to conceal net income and identity of taxpayers.
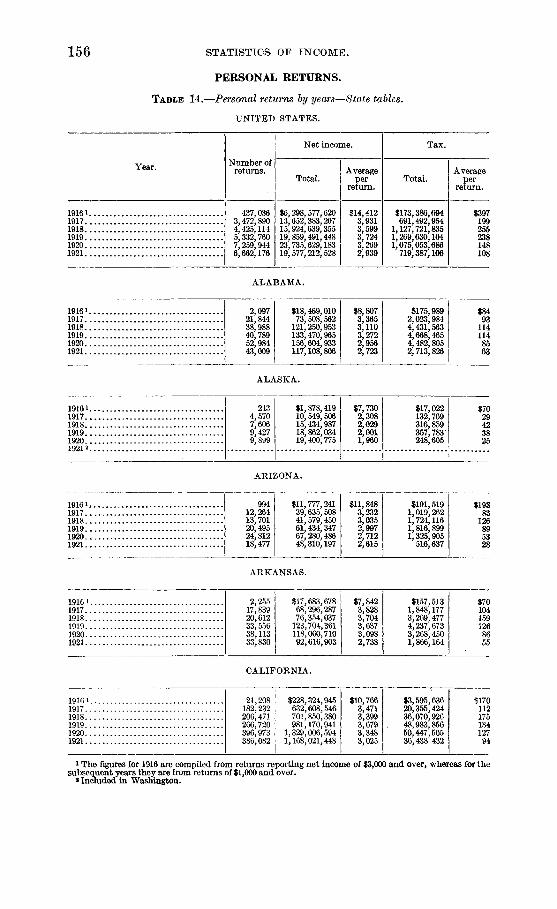
156 STATISTICS OF INCOME.
PERSONAL RETURNS.
TABLE 14.—Personal returns by years—State tables.
UNITED STATES.
Year.
1916119171918.191919201921
Number ofreturns.
437,0363,472,8904,425,1145,332,7607,259,9446,662,176
Net income.
Total.
$6,298,577,62013,652,383,20715,924,639,35519,859,491,44823,735,629,18319,577,212,528
Averageper
return.
$14,4123,9313,5993,7243,2692,939
Tax.
Total.
$173,386,694691,492,954
1,127,721,8351,269,630,1041,075,053,686
719,387,106
Averageper
return.
$397199255238148108
191619171918191919201921
ALABAMA.
2,09721,84438,98840,78952,98443,009
$18,469,01073,508,562
121,250,953133,470,965156,604,933117,108,806
$8,8073,3653,1103,2722,9562,723
$175,9892,023,9844,431,5634,668,4654,482,8052,713,826
$8493
1141148563
ALASKA.
19161.1917..1918..1919..1920. .19212.
2434,5707,6069,427
$1,878,41910,549,50615,434,98718,862,03419,400,775
$7,7302,3082,0292,0011,960
$17,022132,769316,859357,783'248,605
$7029423825
ARIZONA.
191611917.1918.1919.1920.1921.
99412,26413,70120,49524,81218,477
$11,777,24139,635,50841,579,45061,434,34767,280,48648,310,197
$11,8483,2323,0352,9972,7122,615
$191,5191,019,2621,724,1161,816,8991,325,905
516,637
$19383
126895328
ARKANSAS.
191G19171918191919201921
2,25517,83920,61233,55638,11333,830
$17,683,67868,296,28776,354,037
123,704,361118,060,71092,616,903
$7,8423,8283,7043,6873,0982,738
$157,5131,848,1773,269,4774,237,6733,268,4501,866,164
$70104159126
8655
CALIFORNIA.
1916 *1917 . . . .1918191919201921
21,208182,232206,471266,720396,973386,082
$228,324,945632,608,546701,850,380981,170,941
1,329,006,5941,168,021,448
$10,7663,4713,3993,6793,3483,025
$3,595,63620,355,42436,070,92648,983,85650,447,50536,438 432
$17011217518412794
* The figures for 1916 are compiled from returns reporting net income of $3,000 and over, whereas for thesubsequent years they are from returns of $1,000 and over.
* Included in "Washington.

STATISTICS OF INCOME. 157
TABLE 14.:—Personal returns by years—State tables—Continued.COLORADO.
Net income.
Year. I Number of! returns.
1916 i 4,4351917 40,6271918 54,1601919 57,5261920 74,1981921 •_. 69,676
Total.I Average| per' return.
S53,854,130137,853,875159,487,951191,001,999219,277,184174,490,980
il2,1433,3932,9453,3202,9552,504
Tax.
^0
K7,6,3,
tal.
055,758184,948844,925196,593766,900862,862
Averageper
return.
$2381281081259155
CONNECTICUT.
191611917.1918.1919.1920.1921.
9,71364,47286,489110,409148,195123,209
$133,858,341249,186,724295,617,840347,929.074451,737,702343,017,180
$13,7813,8653,4183,1513,0482,783
$2,824,84610,595,73717,690,34316,833,82915,774,59810,633,045
$29116420515210686
DELAWARE.
19161.1917..1918..1919..1920..1921..
1,3468,03210,23916,05918,93715,889
$57,798,41056,459,17648,358,03162,901,24955,633,32143,676,893
$42,9417,0294,7233,9172,9382,749
$3,9,7,7,2,1,
695,350,158,495,122,284,
605461522453025365
$2,1,74616469946711281
DISTRICT OF COLUMBIA.
19161191719181919 . . .19201921
6,80833,73750,77688,616109,73089,966
$67,334,621113,499,332154,963,835234,959,904299,802,574248,345,804
$9,8913,3643,0522,6512,7322,760
$1,068,6444,499,8208,832,2008,869,8339,468,6327,704,564
$1571331741008686
F L O R I D A .
19161917.1918.19191920.1921
1,77915,33619,10231,10742,21042,249
$17,401,20254,378, 49663,681,401
107,362,976141,105,124119, 557,316
$322,6361,584, 9172,367,4634,363, 0895,242,7052,929,409
$18110312414012469
GEORGIA.
1916 i1917.1918.1919.1920.1921.
3, 44438,25239, 07358, 93073,32567, 719
$32,992,965137,775,612148,366,439219, 471,959228,619, 716180,311,466
$9, 5803,6013,7973,7243,1182,663
$378, 0623,250,3427,077,1849,134, 0927,697, 6933,892,645
$1108518115510557
HAWAII.
19161 !1917 i1918 !
1919 |1920 !1921 |
1,1443,1314,2428,13613, 71511, 481
$20,362,02221, 888, 75520,054,94033,164,36655, 572, 89637, 840, 014
$17,7996,9914,7284,0764,0523,296
$366, 8021,174, 8311,857,3522,145,1944,075, 5391,451,776
$321375438264297126
i The figures for 1916 are compiled from returns reporting net income of $3,000 and over, whereas for thesubsequent years they are from returns of $1,000 and over.
60729°—23 11

158 STATISTICS OF INCOME.
TABLE 14.—Personal returns by years—State tables—Continued.IDAHO.
Year.
19161 . .19171918 .19191920 .1921
Number ofreturns.
75616,41419, 24921,44825,75522,976
Net income.
Total.
$7,927,06446,465, 51455,954,29665,472, 54067,391,63949,737, 718
Averageper
return.
$10,4862,8312,9073,0532,6172,165
Tax.
Total.
$140,496839,646
1,493, 5181,475,0231,086,614
493,658
Averageper
return.
$1865178694221
ILLINOIS.
191611917.1918.1919.1920.1921.
37, 525319,497366, 918422,229542,467611,558
$484,290,8331,119,960,6001,256,309, 4851.662,796,4411,836,9.56,9421,833,920,436
$12,9063,5053,4243,9383,3862,999
$10,947,25049,103,26184,560,64299,398,23685,409,20368,574,351
$292154230235157112
INDIANA.
191611917.1918.1919.1920.1921.
191611917. .1918.1919.1920.1921.
7,00485,021
104,581130,383189,587150,300
$74,637,683261,265,426325,549,440417,323,251556,061,991406,242,138
$10,6563,0733,1133,2012,9332,703
$1,165,9615,978,782
11,456,89813,541,24515,780,1248,973,653
$16670
110104
8360
IOWA.
8,497114,970118,933133, 796183,398111,483
$65,604,874337,283,861450,267,585527,163,054631,560,789313,762,935
$7,7212,9343,7863,9403,4442,814
$518,8455,445,816
15,928,15815,807, 70718,776,9905,837,960
$6147
13411810252
KANSAS.
191611917.1918.1919.1920.1921.
4,29063,06564,79476,45199,25588,785
$39,638,465202,159,002218,524,054264,971,649306,413,429217,237, 297
$9,2403,2063,3733,4663,0872,447
KENTUCKY.
191611917.1918.1919..1920.1921.,
3,88734,69247,09859,33278,25869,496
$38,506,976124,826,244166,350,127215,977,422243,879,230192,273,937
$9,9073,5983,5323,6403,1162,767
LOUISIANA.
191611917.1918.1919.1920.1921.
4,51732,31733,43252,87169,34067,960
134,137,201,
274,349,261,753,
237,109,197, 897,
633180983808145146
$11,3514,1574,1063,8153,4202,912
$555,9435,428,4957,880, 2449,138,3158,351,3933,392,429
$13086
122120
8438
$384,4972,943,1967,918,9607,5^5,3847,292,0984,297,47t)
$778,6934,936,8259,353,51812,888,6559,626,5915,304,522
851681289362
$17215328024413978
i The figures for 1916 are compiled from returns reporting net income of $3,000 and over, whereas for thesubsequent years they are from returns of $1,000 and over.
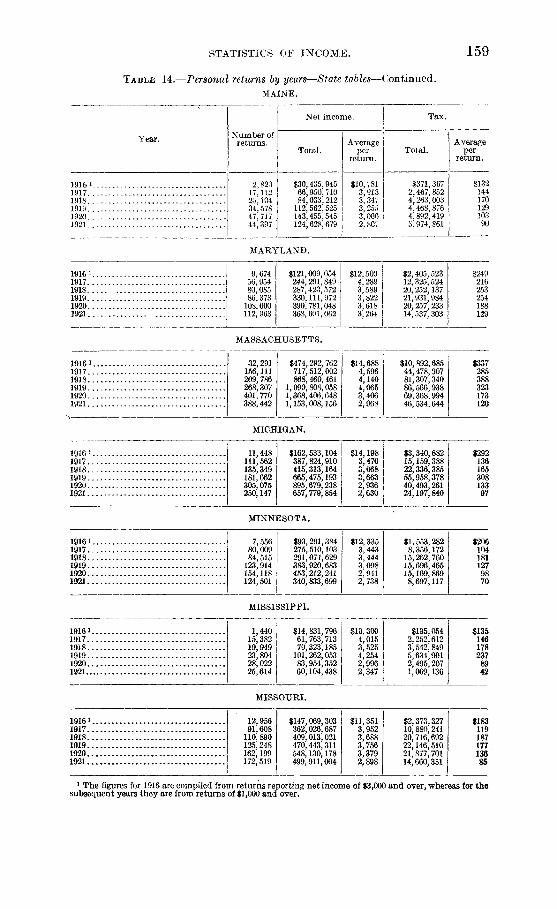
STATISTICS OF INCOME. 159
TABLE 14.—Personal returns by years—State tables—Continued.MAINE.
Year.Number of
returns.
19161917.1918.1919.1920.1921.
2,82317,11225,10434,57847,71744,397
Net income.
Total.
$30,435,94566,950, 71084,033,212
112,562,525143,455,545124,628,679
Averageper
return.
$10,7813,9133,3473,2553,0002.807
Tax.
Total.
$371,3672,467,8524,263,0034,468,8764,892,4193.974,861
Averageper
return.
$13214417012910390
MARYLAND.
1916 i1917.1918.1919.1920.1921.
$121,009,054244,291,849287,423,572330,111,972390,781,048368,691,062
$12,5094,2893,5893,8223,6183,264
$2,405,52312,325,52420,252,13721,931, 98420,257,23314,537,303
$249216253254188129
MASSACHUSETTS.
1916 i1917.1918.1919.1920.1921.
32,291156,111209, 786268,307401, 770388,442
$474717868
1,0901,3681,153,
292,762512,002460,461808,058406,648008,156
$14,6884,5964,1404,0653,4062,968
$10,892,68544,478,90781,307,34086,566,93869,368,99446,534,644
$337285388323173120
MICHIGAN.
1916119171918191919201921
11 448111,562135,349181,662305,075250,147
$162,533,104387,824,910415,313,164665,475,193895,679,238657,779,854
$14 1983,4763,0683,6632,9362,630
$3,340,68215,159,38822,336,38555,958,37840,493,26124,197,840
$29213616530813397
MINNESOTA.
191619171918191919201921
7,55680,00984,515123,914154,118124,501
MISSISSIPPI.
$93,201,384275,510,103291,074,629383,920,683453,212,241340,833,699
$12,3353,4433,4443,0982,9412,738
191611917.1918.1919.1920.1921..
1,44015,38219,94923,80428,02225,614
$14,831,79661, 763,71370,323,185
L01,262,05383,954,35260,104,438
$10,3004,0153,5254,2542,9962,347
$1,553,2828,356,172
15,262,76015,696,46515,169,8698,697,117
$195,0542,252,6123,542,8495,634,9012,495,2071.069,136
$2061041811279870
$1351461782378942
MISSOURI.
191611917.1918.1919.1920.1921.
12,95691,608
110, 890125,248162,199172,519
$147,069,303362,026,687409,013,021470,443,311548,130,178499,911,004
$11,3513,9523,6883,7563,3792,898
$2,373,32710,880,24120,716,69222,146,51021,877,70114,660,351
$18311918717713685
1 The figures for 1916 are compiled from returns reporting net income of $3,000 and over, whereas for thesubsequent years they are from returns of $1,000 and over.

160 STATISTICS OF INCOME.
TABLE 14.—Personal returns by years—State tables—Continued.MONTANA.
Year.
1916119171918191919201921 . .
Number ofreturns.
1,80128,64634,46442,59345,55736,907
Net income.
Total.
$19,467,01981,207,99290,091,830
108,380,657109,348.19481,527,662
Averageper
return.
$10,8092,8352,6142,5452,4002,209
Tax.
Total.
$304,4431,548,5823,012,9022,413,4632,033,1901,051,863
Averageper
return.
$1695487574529
NEBRASKA.
191611917.1918.1919.1920.1921.
4,28682,47296,04987,34497,72971,853
$36,559,607251,988,895306,053,565287,457,592306,362,706179,905,513
$8,5303,0553,1863,2913,1352,504
$347,7785,285,2389,373,5828,639,0038,363,3053,328,145
$816498998646
NEVADA.
19161.1917..1918..1919..1920..1921..
3646,6237,0978,740
10,3819,719
$2,799,77516,423,31617,826,66920,887,13225,337,93422,455,508
$7,6922,4802,5122,3902,4412,310
$18,505241,944412,342435,002390,077329,296
$513758503834
NEW HAMPSHIRE.
191611917191819191920 - -1921
1,73510,80917,31725,60135,98332,410
$19,557,54242,843,29656,889,28478,565,318
100,431,53982,352,496
$11,2723,9643,2853,0692,7912,541
$258,1731,517,1832,827,7242,811,8302,720,7931,759,290
$1491401631107654
NEW JERSEY.
191611917..1918.,1919..1920.1921.
19,701134,960185,706231,757296,989269,096
$254,068,880521,042,424653,112,589828,428,672977,853,627856,856,058
$12,8963,8613,5173,5753,2933,184
$5,545,23125,710,04243,109,64847,321,42243,275,47733,258,294
$281191232204145124
NEW MEXICO.
19161.1917..1918..1919..1920..1921...
81311,61613,08410,75713,65611,780
$7,486,73231,644,72136,591,41631,587,99036,923,12027,838,165
$9,2092,7242,7972,9372,7042,363
$83,935713,829989,825774,470612,573351,629
$1036176724530
NEW YORK.
1916 i | 93,1551917 i 489,0891918 | 559,7531919 i 683,0851920 i 1,047,6341921 ' 1, 066,637
$1,922,864,2,774,035,2,719,713,3,436,343,4,030,623,3,617,757,
651148784179696104
$20,6415,6724,8595,0313,8473,392
$77,970,521251,785,795354,263,417399,792,351286,607,280210,768,379
$837515633585274198
i The figures for 1916 are compiled from returns reporting net income of $3,000 and over, whereas for thesubsequent years they are from returns of $1,000 and over.

STATISTICS OF INCOME. 161
TABLE 14.—Personal returns by years—Slate tables—Continued.N O R T H C A R O L I N A .
1916 ^1917.1918.1919.1920.1921.
N O R T H D A K O T A .
19161.1917..1918..1919..1920..1921. .
O H I O .
1917.1918.1919.1920.1921.
21,774190,273306,918308,309447,998367,096
$318,822,511740,406,422993,314,432
1,075,115,9261,407,388,0031,060,027,926
$14,6423,8913,2363,4873,1422,888
dumber ofreturns.
2,20722,97721,73837,18547,34244,161
Net income.
Total.
$24,825,82684,220,13189,748.811
161,613; 467163,799,837127,992,951
Averageper
return.
Sll , 2493,6654,1294,3463,4602,898
Tax.
Total .
$560,9702,747,6735,575,001
10,010,3489,620,6753,760,499
Averageper
return.
$25412025626920385
1,17620,94129,12027,37524,20918,440
$9,219,05561,233,72389,586,41580,190,94666,188,43443,032,753
$7,8392,9243,0762,9292,7342,334
$66,344936,862
2,219,9541,360,5091,105,801
485,783
$564576504626
$7,722,30631,928,93755,170,25256,505,31556,285,16833,574,094
$35516818018312691
OKLAHOMA.
191611917.1918.1919.1920.1921.
2,53948,75846,81861,50081,78569,381
$66,811,462170,751,358163,678,297242,184,301295,790,791191,816,067
$26,3143,5023,4963,938316172,765
O R E G O N .
$4,347,7975,682,4937,649,280
12,207,12913,548,2114,206,507
$1,71211716319816661
191611917.1918.1919.1920.1921.
2,80025,07134,59249,66367,64062,804
$24,968,57284,746,023
111,601,050166,240,606193,652,281159,574,639
$8,9173,3803,2263,3472,8632,541
$337,0513,298,6306,049,9878,232,4376,649,0114,951,580
$120132175166S879
PENNSYLVANIA.
191611917.1918.1919.1920.1921.
40,289328.171518,729539.172672,746621,103
$643,243,9911,360,802,2931,770,848,1331,838,002,3952,212,178,0291,937,291,858
$15,9664,1473,4143,4093,2883,119
$17,612,73979,454,848
137,781,370128,195,161118,750,98984,660,220
RHODE ISLAND.
$437242266238177138
1916 *. . . . . . .19171918191919201921
3,74523,92732,92139,93653,12848,057
$65,257,163112,129,569129,630,322146,109,811180,303,990157,568,411
$17,4254,6863,9383,6593,3943,279
$1,915,1048,805,953
13,512,76611,234,13211,685,1639,236,328
$511368410281220192
1 The figures for 1916 are compiled from returns reporting net income of $3,000 and over, whereas for thesubsequent years they are from returns of $1,000 and over.
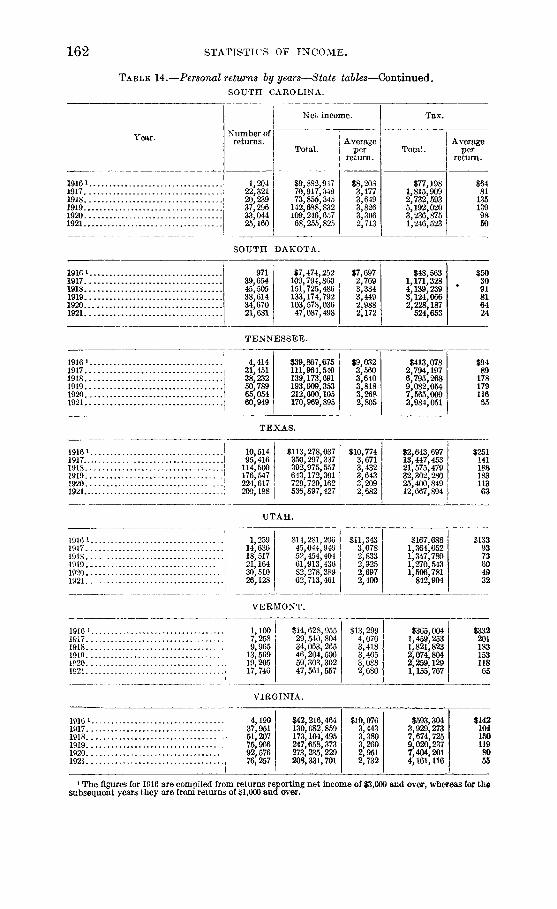
162 STATISTICS OF INCOME.
TABLE 14.—Personal returns by years—State tables—Continued.SOUTH CAROLINA.
Year.
19161191719181919 .1920 . . .1921
Number ofreturns.
1,20422,32120,23937,29633,04425,160
Net income.
Total.
$9,882,94770,917,34973,855,345
142,688,832109,246,65768,255,825
Averageper
return.
$8,2083,1773,6493,8263,3062,713
Tax.
Total.
$77,1981,815,9092,732,5935,192,0203,236,8751,246,523
Averageper
return.
$6481
1351399850
191611917.1918..1919.1920..1921.
SOUTH
97139,65445,50538,61434,67021,681
DAKOTA.
$7,474,252109,794,860151,725,486133,174,792103,578,03647,087,498
$7,6972,7693,3343,4492,9882,172
$48,5631,171,3284,139,2393,124,0662,228,187
524,653
$503091816424
T E N N E S S E E .
191611917.1918.1919.1920.1921.
4,41431,45138,23250,78965,05460,949
I
$39,867,675111,964,540139,173,691193,909,353212,600,105170,969,895
$9,0323,5603,6403,8183,2682,805
$413,0782,794,1976,795,2689,082,0547,565,0093,984,051
TEXAS.
19181 ! 10,5141917 ! 95,4161918 ! 114,5001919 ! 176,6471920 ' 224,6171921. i 200,188
$113,278,037350,297,337392,975,557643,172,301720,720,162536,897,427
$10,7743,6713,4323,6433,2092,682
$2,643,69713,447,45321,575,47932,302,28025,400,84912,667,894
UTAH.
19161...1917. . . .191819191920. . . .1921. . .
VERMONT.
1916 1 :1917 11918 i1919 j1920 !1921 j
VIRGINIA.
$9489
17817911665
$25114118818311363
1,25914,63618,51721,16430,51026,128
$14,281,20645,044,94652,454,40461,913,43682,278,38962,713,461
$11,3433,0782,8332,9252,6972,400
$167,6881,364,6521,347,7801,270,5431,506,781
842,904
$1339373604932
1,1007,2589,965
13,56919,20517,746
$14,628,95529,540,80434,063,26546,204,50659,303,30247,561,557
S13,2994,0703,4183,4053,0882,680
$365,0041,459,2531,821,8232,074,8042,259,1291,155,767
$33220118315311865
I19161917.1918.19191920.1921.
4,19037,95151,20775,96692,57676,257
$42,216,464130,682,859173,104,495247,658,373273,235, 229208,331,701
$10,0763,4433,3803,2602,9512,732
$593,3043,929,2737,674,7259,020,2377,404,2014,161,116
$1421041501198055
1 The figures for 1916 are compiled from returns reporting net income of $3,000 and over, whereas for thesubsequent years they are from returns of $1,000 and over.

STATISTICS OF INCOME. 163
TABLE 14.—Personal returns by years—State tables—Continued.WASHINGTON.
Year.
Net income. Tax.
19161.1917..1918..1919..1920..1921 a.
WEST VIRGINIA.
191611917.1918.1919.1920.1921.
WISCONSIN.
19161.1917..1918..1919..1920..1921..
WYOMING.
Number ofreturns.
5,36056,32295,422
114,322148,0(37115,593
Total.
$49,697,247169,727,615266,096,746325,920,733375,979,893261,400,721
Averageper
return.
$9,2723,0142,7892,8512,3592,261
Total.
$776,4704,377,7549.743,163
11,615,7859,094,7644,878,295
Averageper
return.
$14578
102102
• "•I42
2,57528,28148,87645,16896,32675,277
$30,170,809106,061,550156,557,747147,949,092287,729,460207,157,054
$11,7173,7503,2033 2762,9872,752
$416,3863,303,2855,709,2955,319,1978,517,2684,579,113
$1621171171188861
8,26170,55494,704
105,793150,452148,457
$87,614,595228,190,253290,199,685337,851,344436,436,810379,754,222
$10,6063,2343,0643,1942,9012,558
SI, 253,2575,716,256
11,382,12710,901,09713,232,5318,971,044
$15281
1201038860
191611917.1918.1919.1920.1921.
!
6737,6637,821
18,34924,59422,413
$6,523,78728,855,60326,413,93752,463,95963,244,52951,051,629
$9,694 j3,766 i3,377 |2,859 !2,5722,278 ;
$67,510838,196
1,272,6921,444,0631,161,320
783,257
$100109163794735
i The figures for 1916 are compiled from returns reporting net income of $3,000 and over, whereas for thesubsequent years they are from returns of $1,000 and over.
Includes Alaska.
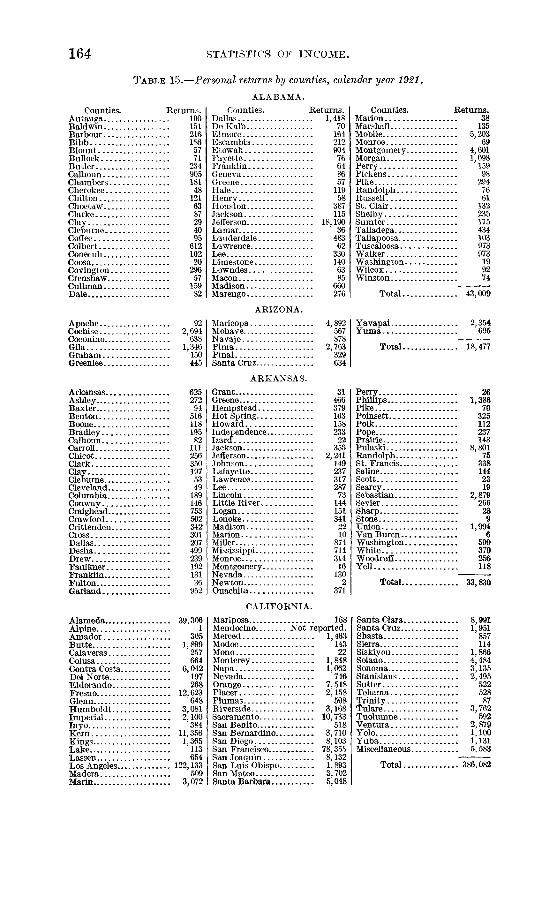
164 STATISTICS OF INCOME.
TABLE 15.—Personal returns by counties, calendar year 1921.
Counties. Returns.Autauga 100Baldwin 151Barbour 216Bibb 186Blount 57Bullock 71Butler 234Calhoun 905Chambers 181Cherokee 48Chilton 121Choctaw.. 63Clarke 87Clay 29Cleburne 40Coffee 95Colbert 612Conecuh 102Coosa 20Covington 296Crenshaw 57Cullman.. 159Dale 82
Apaehe 92Cochise 2,694Coconino 638Gila 1,346Graham 150Greenlee 445
Arkansas. . .AshleyBaxterBentonBopneBradleyCalhounCarrollChicotClarkClayCleburne...Cleveland..Columbia..Con wayCraighead..Crawford...Crittenden.CrossDallasDeshaDrewFaulkner . .Franklin. . .FultonGar land . . .
62527294
51611819582111256350197534918914675350234230120749923919213136952
Alameda 39,306Alpine 1Amador 305Butte 1,899Calaveras 257Colusa 664Contra Costa 6,042DelNorte 197Eldorando 268Fresno 12,623Glenn 648Humboldt 3,081Imperial 2,100Inyo 384Kern 11,356Kings 1,365Lake 113Lassen 654Los Angeles 122,133Madera 509Marin 3,072
ALABAMA.
Counties. Returns.Dallas 1,418DeKa lb 70Elmore 164Escambia 212Etowah 904Fayette 76Franklin 64Geneva 86Greene 57Hale 119Henry 58Houston 387Jackson 115Jefferson 18,190Lamar 36Lauderdale 483Lawrence 62Lee 330Limestone 140Lowndes 63Macon 85Madison 660Marengo 276
Counties.MarionMarshallMobileMonroe
Returns.38
1355,203
69
ARIZONA.
Maricopa...MohayeNavajoPimaPinalSanta Cruz..
ARKANSAS.
GrantGreeneHempsteadHot SpringHowardIndependence.IzardJacksonJeffersonJohnsonLafayetteLawrenceLeeLincolnLittle River . . .LoganLonokeMadisonMarionMillerMississippiMonroeMontgomery..NevadaNewtonOuachita
CALIFORNIA.
4,892567878
2,763329634
3146637916315823322356
2,211149237317287731441513412210874711314161302
371
Mariposa 168Mendocino Not reported.Merced 1,463Modoc 143Mono 22Monterey 1,848Napa 1,062Nevada 746Orange 7,548Placer 2,158Plumas 508Riverside 3,168Sacramento 10,733San Benito 518San Bernardino 3,710San Diego 8,103San Francisco 78,355SanJoaquin 8,132San Luis Obispo 1,893SanMateo 3,702Santa Barbara 5,048
Montgomery 4,601Morgan 1,098Perry 159Pickens 98Pike 294Randolph 76Russell 61St.Clair 132Shelby 235Sumter 175Talladega 434Tallapoosa 103Tuscaloosa 973Walker 973Washington 19Wilcox 92Winston 74
Total 43,009
Yavapai 2,354Yuma 695
Total 18,477
Perry 26Phillips 1,386Pike 70Poinsett 325Polk 112Pope 237Prairie 143Pulaski 8,801Randolph 75St. Francis 338Saline 144Scott 23Searcy 19Sebastian 2,879Sevier 266Sharp 23Stone 9Union 1,994Van Buren 6Washington 599White 379Woodruff 256Yell 118
Total 33,830
Santa Clara 8,991Santa Cruz 1,951Shasta 857Sierra 114Siskiyou 1,866Solano 4,484Sonoma 3,135Stanislaus 2,495Sutter 522Tehama 528Trinity 87Tulare 3,762Tuolumne 592Ventura 2,879Yolo 1,100Yuba 1,131Miscellaneous 5,583
Total 386,082

STATISTICS OF INCOME. 165
TABLE 15.—Personal returns by counties, calendar year 1921—Continued.
COLORADO.Counties. Returns.
Adams 621Alamosa 437Arapahoe 361Archuleta 60Baca 78Bent 262Boulder 1,665Chalice 652Cheyenne 108Clear Creek 116Concjos 97Costilla 48Crowley Net reported.Custer ~ 77Delta 453Denver 33,550Dolores 25Douglas 191Eagle 248Elbert 135El Paso 3,6.S3Fremont.. 1, 072
Counties.GarfieldGilpinGrandGunnisonHinsda lo . . . .HuerfanoJacksonJeffersonKiowaKit Carson...Lake . . . .La PlataLarimer.Las Animas.LincolnLoganMesa,.
Returns.3366S
163620
6.. 1,045
4879376299484667
1,433
MineralM off atMontezuma..
3,184422823
1,284
Mont rose.Morgan
24155134467645
Counties. Returns.Otero . . . . 1,698Ouray . . . 203Park 104Phillips 197Pitkin 131Prowers 551Pueblo 4,263Rio Blanco 77Rio Grande 393Routt 513Saguache 181San Juan 79San Miguel 433Sedgwick . 125Summit 104Teller 459Washingt on 193Weld 2,454Yuma 403
T o t a l . . . 69,676
FairfieldHar t ford . . . .LitchiieldMiddlesex.. .New Haven.
CONNECTICUT.
. 27,111
. 35,291
. 4,567
. 3,805
. 39,129
New London 7,883Tolland 1,769Windham 3,714
123,269Total.
D E L A W A R E .KentNew Castle.Sussex
81813,8911,180
Total 15,8
FLORIDA.
AlacmiaBakerBayBradfordBrevardBrowardCalhounCharlotteCitrusClayColumbiaDade 4De SotoDixieDuval 11Escambia 2FlaglerFranklinGadsdenGladesHamilton
ApplingAtkinson
61934
18667
490135
4773
114114
;on.
99i, 610
39170
527427347295123
Baker..Baldwin..Banks. . . .Barrow...Bartow...Ben Hill.Berrien.
12415
10830519418
Bibb 5,069Bleckley 45Brantley 14Brooks.. . . 135Bryan 20Bulloch 124Burke 147Butts 65Calhoun 41Camden 47Campbell 77
HardeeHernandoHighlandsHillsboroughHolmesJacksonJeffersonLafayetteLakeLeeLeonLevyLibertyMadisonManateeMarionMonroeNassauOkaloosaOkeechobecOrange
GEORGIA.
Candier 19Carroll 200Catoosa 38Charlton 29Chatham 8,014Chattahoochee 329Chattooga 51Cherokee 106Clarke 1,057
151133934376001964967
.,240 !
Osceola 179Palm Beach 1,080Pasco 135Pinellas l 628Polk 1,959Putnam 560Saint Johns 827Saint Lueie 439Santa Rosa 104Sarasota 122Seminole 710Sumter 40Suwanee 183Taylor 189Union 23Volusia 1,16CWakulla 4Walton 113Washington 76
Clay.ClaytonClinchCobbCoffeeColqui t t . . .Columbia..Cook.CowetaCrawford. .CrispDade
1510623
6131062591716
3588
208
Total 42,249
Dawson 3Decatur 253Dekalb 1,292Dodge 91Dooly 54Dougherty 780Douglas 37Early 62Echols 12Effingham 59Elbert 203Emanuei 43Evans 32Fannin 27Fayet te . . 26Floyd 787Forsyth 5Franklin 90Fulton 28,380Gilmer 9Glascock 4

166 STATISTICS OF INCOME.
TABLE 15.—Personal returns by counties, calendar year 1921—Continued.
GEORGIA—Continued.Counties.
GlynnGordonGradyGreeneGwinnettHabershamHallHancockHaralsonHarrisHartHeardHenryHoustonIrwinJacksonJasper
Returns.5739157
10020L10629863594078
189
20926
103Jasper 90Jeff Davis 22Jefferson 103Jenkins 62Johnson 19Jones 24Lamar 98Lanier 9Laurens 201Lee 19Liberty 31Lincoln 18Long 4Lowndes 548Lumpkin 9McDuffle 55Mclntosh 26
Counties.MaconMadisonMarionMeriwetherMillerMiltonMitchellMonroeMontgomery...MorganMurrayMuskogeeNewtonOconeeOglethorpePauldingPickensPiercePike.Polk.
R
PulaskiP u t n a m . . .Qui tman . .RabunRandolph. .Richmond.Rockdale. .SchleyScreven..Seminole.Spalding..Stephens.Stewart. . .
HAWAII .
•eturns.1447228
141112
1289819
13813
2,590178253321444684
32071634
31124
4,36772235721
39011158
Counties. Returns.Sumter 463Talbot 53Taliaferro 33Tattnall 31Taylor 49Telfair 74Terrell 114Thomas 439Tift 151Toombs 93Towns 1Treutlen 17Troup 656Turner 50Twiggs 10Union Not reported.Upson 97Walker 106Walton 195Ware 822Warren 74Washington 166Wayne 94Webster 11Wheeler 9White 12Whitfield 207Wilcox 39Wilkes 134Wilkinson 65Worth . . 61
Total 67,719
Hawaii...Honolulu.Kalawao..KauaiMaui
1,263, 8,459
Not reported.558
, 1,201
Total 11,481
IDAHO.
Ada 3,597Adams 39Bannock 3,457Bear Lake 400Benewah 440Bingham 440Blaine 150Boise 105Bonner 560Bonneville 1,013Boundary 210Butte 50Camas 33Canyon 1,902Caribou 51Cassia 395
Adams 3,000Alexander 1,162Bond 320Boone 476Brown 159Bureau 1,791Calboun 93Carroll 1,209Cass 1,275Champaign 3,700Christian 1,900Clark 375Clay 318Clinton 608Coles 1,987Cook 420,631Crawford 750Cumberland 143DeKa lb 1,699Dewitt 1,312Douglas 1.043
ClarkClear water.CusterElmoreFranklin. . .Fremont . . .GemGoodingIdahoJeffersonJerome.
61120105465110260250220240120160
Kootenai 1,142Latah 680Lemhi 160Lewis 210Lincoln 190
Madison 150Minidoka 210Nez Perce 1,112Oneida 65Owyhee 85Payette 290Power 88Shoshone 2,040Teton 26Twin Falls 1,160Valley 95Washington 320
ILLINOIS.
i Dupagei Edgar
Edwards . . .Effingham.FayetteFord..
6,37287878
433300675
Franklin 3,871Fulton 1,463Gallatin 151Greene 923Grandy 656Hamilton 100Hancock 853Hardin 77Henderson 212Henry 2,262Iroquois 1,180Jackson 1,643Jasper 152Jefferson 489Jersey 300
Total 22,976
Jo Daviess 795Johnson 155Kane 10,675Kankakee 2,160Kendall 241Knox 3,404Lake 6,100La Salle 5,941Lawrence 737Lee 1,205Livingston 1,725Logan 1,453McDonough 1,003McHenry 2,269McLean 4,950Macon 5,320Macoupin 3,880Madison 7,013Marion 2,453Marshall 520Mason 715

STATISTICS OF INCOME. 167
TABLE 15.—Personal returns by counties, calendar year 1921—Continued.
Counties.MassacMenard 487Mercer 641Monroe 357Montgomery 1,413Morgan 1,413Moultrie 401Ogle 896Peoria 10,296Perry 1,093Piatt 713Pike 578Pope 68Pulaski 505
ILLIN OIS—Contin ued.Returns, j Counties. Beturns.
219 Putnam 188Randolph 1,011Richland 225Rock Island.... 6,868St.Clair 9,664Saline 1,793Sangamon 8,979Schuyler 283Scott 399Shelby 599Stark 290Stephenson 2,256
Adams 436Allen 10,597Bartholomew 571Benton 368Blackford 315Boone 497Brown 19Carroll 244Cass 2,091Clark 1,075Clay 877Clinton 1,057Crawford 85Daviess 871Dearborn 524Decatur 401Dekalb 987Delaware 2;439Dubois 314Elkhart 4,193Fayette 970Floyd 1,731Fountain 423Franklin 178Fulton 315Gibson 947Grant 1,462Greene 1,757Hamilton 489Hancock 406Harrison 125Hendricks 322
i Tazewell 2,082| Union 273
INDIANA.
Henry 698Howard 1,873Huntington 1,413Jackson 598Jasper. 237Jay 474Jefferson 289Jennings 171Johnson 422Knox 1,844Kosciusko 533Lagrange 188Lake 15,594Laporte 2,710Lawrence 962Madison 2,194Marion 34,317Marshall 674Martin 73Miami 1,319Monroe 850Montgomery 893Morgan 338Newton 324Noble 607Ohio 20
I Orange 2581 Owen 165
Parke 303Perrv 195Pike 354Porter 985
IOWA.AdairAdamsAllamakee..Appanoose..Audubon. . .Benton.
301180450874341840
Blackhawk 3,739Boone 1,635Bremer 636Buchanan 538Buena Vista 740Butler 561Calhoun 685Carroll 1,065Cass 861Cedar 640Cerro Gordo 1,853Cherokee 900Chickasaw 311Clarke 131Clay 550Clayton 919Clinton „ 3,156Crawford 1,027Dallas 954Davis 186Decatur 211Delaware 550DesMoines 2,424Dickinson 280Dubuque 4,076Emmet 599Fayette 1,417Floyd 693
393482465320486890396955858687277450840325843915522887306608603
2,079Linn 4,464Louisa 312Lucas 410Lyon 520Madison 245Mahaska 1,036Marion 659Marshall 1,379Mills 564Mitchell 425Monona 500
! Monroe 896
Frankl in . . .Fremont . . .GreeneGrundyGuthrieHamilton..Hancock...HardinHarrison...Henry .HowardHumboldt.IdaIowaJacksonJasperJefferson...Johnson. . .JonesKeokuk... .Kossuth. . .Lee
Counties. Returns.Vermilion 5,850Wabash 515Warren 1,069Washington 290Wayne 178White 290Whiteside 2,411Will 5 808Williamson 3,975Winnebago 6,407Woodford 1,042
Total 611,558
Posey 299Pulaski 141Putnam 403Randolph 521Ripley 276Rush 379St. Joseph 11,451Scott 53Shelby 644Spencer 132Starke 226Steuben 265Sullivan 1,067Switzerland 41Tippecanoe 2,649Tipton 436Union 193Vanderburg 7,162Vermilion 1,756Vigo 7,906Wabash 878Warren 170Warrick 367Washington 117Wayne 2,744Wells 448White 288Whitley 327
Total 150,300
Montgomery 777Muscatine 1,360O'Brien 840Osceola 290Page 830Palo Alto 294Plymouth 1,020Pocahontas 547Polk 12,526Pottawattamie 4,596Poweskiek 620Ringgold 156Sac 800Scott 6,138Shelby 516Sioux 980Story l 005Tama 640Taylor 246Union 826VanBuren 210Wapello 2,042Warren 340Washington 1,007Wayne 191Webster 2,385Winnebago 315Winneshiek 677Woodbury 7,547Worth 289Wright 1,153
Total 111,483

168 STATISTICS OF INCOME.
TABLE 15.—Personal returns by counties, calendar year 19£1—Continued.
Counties. Returns.Allen 700Anderson 220Atchison 1,320Barber.. 260Barton 1,120Bourbon 950Brown 760Butler 2,700Chase 170Chautauqua 340Cherokee 7S0Chevenne . . . . . 205Clark 170Clay 590Cloud 740Coffey 300Comanche 160Cowley.. 2,780Crawford 3,212Decatur. . . 340Dickinson. 1,810Doniphan 330Douglas 1,020Edwards 465Elk 180Ellis 545Ellsworth 470Finney 250Ford . . . . 1,020Franklin..GearyGoveGraham..GrantGrayGreeley...
47080520019553
12545
KANSAS.Counties. Returns.
Greenwood 445Hamilton 90Harper 445Harvey 1,450HaskeU 20Hodgeman 80Jackson 305Jefferson 375Jewell 227Johnson 500Kearney 30Kingman 177Kiowa 197Labette 2,030Lane 90Leavenworth 1,605Lincoln 205Linn 205Logan. . 160Lyon 1,495McPherson 1,200Marion 960Marshall 1,020Meade 160Miami 825Mitchell 500Montgomery 3,212Morris 320Morton 80Nemaha 370Neosho 1,290Ness 207Norton 310Osage 385Osborne 365Ottawa 207
K E N T U C K Y .
Adair 20Allen 95Anderson 115Ballard 48Barren 177B a t h . . . 70Bell 979Boone 96Bourbon 934Boyd 1,625Boyle 706Bracken 119Breathitt 178Breckin ridge 138Bullitt lp>6Butler 20CaldweU 276Calloway 81Campbell 4,546Carlisle 26Carroll 126Carter 105Casey 5Christian 658Clark 761Clay 17Clinton 5Crittenden 51Cumberland 14Daviess 876Edmonson 31Elliott 3Estill 770Fayette 3,510Fleming 68Floyd 250Franklin 557Fulton 427Gallatin 35Garrard 124Grant 101
Graves..Grayson.Green.Greenup.Hancock.Hard in . . .Harlan.Harrison.Hart..Henderson..HenryHiekman. . .HopkinsJacksonJeffersonJessamine...JohnsonKentonKnottKnoxLarueLaurelLawrence.LeeLeslieLetcherLewisLincoln.Livingston. -LoganLyonMcCracken.McCreary...McLeanMadison. . . .MagoffinMarion.
3018211
50133
4201,27732333529132378809
25,718184271
6,5691618235701151554
4485911921
Counties. Returns.Pawnee 360Phillips 365Pottawatomie 460Pratt 770Rawlins 410Reno 2;180Republic 500Rice 545Riley 1,010Rooks 410Rush 285Russell 280Saline 2,330Scott 90Sedgwick 10,095Seward 320Shawnee 7,787SheridanShermanSmith . . .Stafford.Stanton..Stevens.
140335320455
930
Sumner 1,38031011526012032030905170
Wyandotte 8,347
Thomas.TregoWabaunsee.WallaceWashingtonWichitaWilsonWoodson
Total. 18,785
Marshall.Martin.. .Mason. . .Meade. . .
31543
1,80813339
42157
1605928
44219
Menifee 4Mercer 179Metcalfe 1Monroe 16Montgomery 298Morgan 32Muhlenberg 842Nelson 221Nicholas 106Ohio 220Oldham 169Owen 38Owsley 5Pendleton 100Perry 1,103Pike 762Powell 24Pulaski 372Rockcastle 86Robertson 4Rowan 50Russell 4Scott 268Shelby 344Simpson 100Spencer 33Taylor 61Todd. 130Trigg 40Trimble 20Union 316Warren 941Wasliin gt on 87Wayne 70Webster 303Whitley 897Wolfe.: 54Woodford 228
Total 69,496
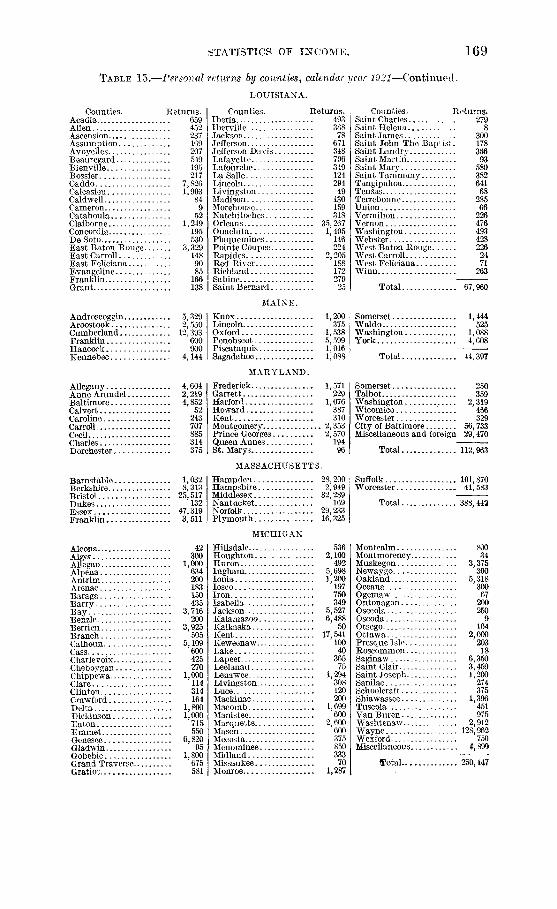
STATISTICS OF INCOME. 169
TABLE 15.—Personal returns by counties, calendar year 1921—Continued,LOUISIANA.
Counties.AcadiaAllenAscensionAssumption..AvoyellesBeauregard...BienvilleBossierCaddoCalcasieuCaldwellCameronCatahoula.
Returns.659452237169207549195217
... 7,826
.. . 1,903' 8 4
952
Claiborne 1,2^Concordia 195DeSoto 530East Baton Rouge 3,329East Carroll 7 148East Feliciana 90Evangeline 85Franklin 166Grant 138
Androscoggin 5,329Aroostook 2,550Cumberland 12,393Franklin 600Hancock 900Kennebec 4,144
Allegany 4,604Anne Arundel 2,219Baltimore 4,852Calvert 52Caroline 243Carroll 707Cecil 885Charles 314Dorchester 375
Barnstable 1,032Berkshire 8,313Bristol 25,517Dukes 132Essex 47,319Franklin 3,511
Alcona 42Alger.. 300Alfegan 1,000Alpena 634Antrim 200Arenac 183Baraga 150Barry 435Bay 3,716Benzle 200Berrien 3,925Branch 505Calhoun 5,109Cass 600Charlevoix 425Cheboygan 270Chippewa 1,000Clare 114Clinton 314Crawford 164D e l t a . . . . . 1,800Dickinson 1,000Eaton 715Emmet 550Genesee 6,820Gladwin 95Gobebic 1,800Grand Traverse 675Gratiot 581
Counties. Returns.IberiaIbervilleJacksonJefferson.Jefferson DavisLafayetteLafourcheLa SalleLincoln..LivingstonMadisonMorehouseNatchitoches
493388
78671348706349124294
49130159318
Orleans 35,267Ouachita 1,405Plaquemines 146Pointe Coupee 224Rapides 2,205Red River 188Richland 172Sabine 279Saint Bernard 25
MAINE.
Knox. 1,200Lincoln 375Oxford 1,538Penobscot 5,599Piscataquis 1,016Sagadahoc 1,088
MARYLAND.
Frederick ,. 1,571Garrett 229Harford 1,076Howard 387Kent 310Montgomery. 2,353Prince Georges 2,570Queen Annes 194St. Marys. . . 96
MASSACHUSETTS.
Hampden 28,200Hampshire 2,949Middlesex 82,289Nantucket 169Norfolk 29,233Plymouth 16,325
MICHIGANHillsdale 536Hough ton . . . . 2,100Huron 492Ingham 5,698Ion ia . . 1,200Iosco 197Iron 750Isabella 349Jackson 5,527Kalamazoo 6,488Kalkaska 50Kent 17,541Keweenaw 100Lake 40Lapeer 365Leelanau 75Lenawee 1,294Livingston 308Luce 120Mackinac 200Macomb 1,699Manistee 600Marquette 2,600Mason 600Mecosta 375Menominee 850Midland 333Missaukee 70Monroe 1,287
Counties. Returns.Saint Charles 279Saint Helena 8Saint James 300Saint John The Baptist- 178Saint Landry 366Saint Martin 93Saint Mary 580Saint Tammany 382Tangipahoa 641Tensas 68Terrebonne 285Union 66Vermilion 226Vernon 476Washington 493Webster 428West Baton Rouge 226West Carroll 24West Feliciana 71Winn 263
Total 67,960
Somerset 1,444Waldo 525Washington 1,088York 4,608
Total 44,397
Somerset 250Talbot 359Washington 2,319Wicomico 466Worcester 329City of Baltimore 56,733Miscellaneous and foreign 29,470
Total 112,963
Suffolk 101,870Worcester 41,583
Total 388,442
Montcalm 800Montmorency 34Muskegon 3,375Newaygo 300Oakland 5,318Oceana 300Ogemaw 67Ontonagon 200Osceola 250Oscoda 9Otsego 104Ottawa 2,000Presquelsle 203Roscommon 18Saginaw 6,350Saint Clair 3,459Saint Joseph 1,200Sanilac 274Schoolcraf t 375Shiawassee 1,396Tuscola 451Van Buren 975Washtenaw 2,912Wayne 128,962Wexford 750Miscellaneous 4,899
T o t a l . . . . . 250,147

170 STATISTICS OF INCOME.
TABLE 15.—Personal returns by counties, calendar year 1921—Continued.
Counties.AitkinAnokaBeckerBeltramiBentonBig Stone.
Returns.152256329546125235
Blue Ear th 1,324Brown 568Carlton 658Carver 320Cass 209Chippewa 392
4 Chisago 222Clay 867Clearwater 66Cook 15Cottonwood 178CrowWing 940Dakota 949Dodge 184Douglas : . . 359Faribault 923Fillmore 427Freeborn 931Goodhue 988Grant 163Hennepin 45,807Houston 162Hubbard 80Isanti I l l
Adams 750Alcorn 268Amite 57Attala 86Benton 10Bolivar 828Calhoun 18Carroll 54Chickasaw 173Choctaw 38Claiborne 89Clarke 142Clay 160Coahoma 1,213Copiah 248Covington 78DeSoto 124Forrest 927Franklin 61George 19Greene 80Grenada 219Hancock 151Harrison 950Hinds 2,408Holmes 452Humphreys 197Issaquena 26
6721302905524603104007038
703Buchanan 6,470- •- . . . 468
150264
1087638020
32060
AdairAndrew..Atchison..Audrain..BarryBarton...BatesBenton...Bollinger.Boone.
Butler.CaldwellCallawayCamdenCape Girardeau.CarrollCarterCassCedarCharitonChristian
MINNESOTA.Counties. Returns.
Itasca 1,03327953
5961244311506693981244S835363
204491268182450
Mower 1,026
Jackson..KanabecKandiy ohiKittsonKoochichingLac Qui ParleLakeLesueurLincolnLyonMcLeodMahnomenMarshallMartinMeekerMilleLacsMorrison..
Murray.NicolletNoblesNormanOlmsted....Otter Tail . .Pennington.P i n e . . . . . . . .Pipestone...PolkPope
113180408172
1,608767344216543988199
MISSISSIPPI.
Itawamba Not reported.Jackson..JasperJeffersonJefferson Davis .JonesKemperLafayetteLamar.
258507718
8383576
144Lauderdale 2,311Lawrence..LeakeLeeLefloreLincolnLowndesMadisonMarionMarshallMonroeMontgomery.,NeshobaNewtonNoxubeeOktibbeha. . .PanolaPearl River . .Perry
MISSOURI.
50
ClarkClayClintonColeCooperCrawford.. .DadeDallasDaviessDekalbDentDouglasDunklinFrank l in . . .Gasconade..GentryGreeneGrundyHarrisonHenryHickoryHolt
4213
30091631247528816714530514361
13114210220619956
103610370730325578015
1401507020
283602107330
1,260530180490
6250
Counties.RamsayRed LakeRedwoodRenvilleRiceRockRoseauSt. LouisScottSherburneSibleyStearnsSteeleStevensSwift .ToddTraverseWabashaWadenaWasecaWashingtonWatonwanWilkinWinona ..WrightYellow Medicine
Total
Returns.. . . . 26,114
67. . . 313
351911301
9215,962
30083
1581,644
52158429420117588205
. . . . 440674429696
1,677639275
124.501
Pike 1,202Pontotoc 47Prentiss 98Quitman 136Rankin 42Scott 63Sharkey 152Simpson 94Smith 5Stone 42Sunflower 473Tallahatchie 335Tate 91Tippah 56Tishomingo 39Tunica 180Union 147Walthall 72Warren 2,206Washington 1,469Wayne 71Webster 40Wilkinson 61Winston 89Yalobusha 359Yazoo 409
Total 25,614
Howard * 337Howell 190Iron 62Jackson 39,915Jasper , 2,685JeffersonJohnsonKnoxLacledeLafayetteLawrenceLewisLincolnLinnLivingstonMcDonaldMaconMadison .MariesMarionMercerMiller
82340010395
890250190
. . . 170994380
805468021
1,56655
205

STATISTICS OF INCOME. 171
TABLE 15.—Personal returns by counties, calendar year 1921—Continued.MISSOURI—Continued.
Counties.MississippiMoniteauMonroeMontgomery..MorganNew Madrid..NewtonNodawayOregon
Returns.24517519620960
220210440144601
327105
OzarkPemiscotPerryPettis 1,480Phelps 220Pike 365Platte 240
Beaverhead 571Big Horn 203Blaine 172Broadwater 96Carbon 1,090Carter 39Cascade 4,303Chouteau 198Custer 950Daniels 82Dawson 630Deerlodge 738Fallon 75Fergus 1,269Flathead 1,197Gallatin 903Garfield 36Glacier 174Golden Valley 52
Adams 1,140Antelope 268Arthur 8Banner 6Blaine 10Boone 340BoxBut te 486Boyd 115Brown 147Buffalo 995Burt 479Butler 737Cass 815Cedar. 529Chase 203Cherry 224Cheyenne 364Clay 348Colfax 427Cuming 657Custer 433Dakota 215Dawes 643Dawson 523Deuel 112Dixon 478Dodge 1,810Douglas 27,596Dundy 109Fillmore 328Franklin 322Frontier 154
Counties.
Churchill...ClarkDouglasElkoEsmeralda..EurekaHumboldt..
238713192974211127387
Polk.PulaskiPutnamRailsRandolphRayReynoldsRipleySt. CharlesSt. ClairSte. Gene vie veSt. FrancoisSt. LouisSalineSchuylerScotlandScott
MONTANA.
Returns.
GraniteHillJeffersonJudith BasinLewis and Clark.LibertyLincolnMcConeMadison
MineralMissoulaMusselshellParkPhillipsPonderaPowder River.PowellPrairie
NEBRASKA.Furnas. .GageGardenGarfieldGosperGrantGreeleyHallHamiltonHarlanHayesHitchcockHoltHookerHowardJeffersonJohnsonKearneyKeithKeyapahaKimballKnoxLancasterLincolnLoganLoupMcPhersonMadisonMerrickMorrill.NanceNemaha
NEVADA.Lander...Lincoln...LyonMineral...NyeOrmsby..Pershing..
100639077
1,6184603240
63370
145845
7,374960
7974
823
264744165188
2,50621
41521
177134156
3,2041,2641,084
19116542
665
4171,289
92424788
1511,786
40720919
15322527
25494522531018328
155593
7,5421,102
3587
1,612353297151386
203120406122
1,03980
304
Counties.ShannonShelbyStoddardStoneSullivanTaneyTexasVernonWarrenWashington..WayneWebsterW o r t h . . . . . . . .Wright.
Returns.17
148163
3307040
49010072
10910080
noCity of St. Louis 82,709
Total 172,519
RavalliRichland..Roosevelt..Rosebud...SandersSheridan.
273171403366182131
SilverBow 7,028«"-•" — <•— 127
Ill1091662921737345
Yellowstone 2,927
Total 36,907
Stillwater.Sweet GrassTetonTooleTreasureValleyWheatland.Wibaux
NuckollsOtoePawneePerkinsPhelpsPiercePlattePolkRed willowRichardsonRockSalineSarpySaundersScotts BluffSewardSheridanShermanSiouxStantonThayerThomasThurstonValleyWashingtonWayneWebsterWheelerYork
47079614391439256829293811743
833851605248122632484893321923141341228113
520
Total 71,853
Storey 246Washoe 3,917White Pine 440
Total 9,719

172 STATISTICS OF INCOME.
TABLE 15.—Personal returns by counties, calendar year 1921—Continued.
Counties. Returns.Belknap 1,182Carroll 463Cheshire 1,888Coos 2,214
Atlantic 5,420Bergen 20,104Burlington 4,870Camden 15,664CapeMay 1,255Cumberland 2,680Essex 70,307Gloucester 3,234
Bernalillo 2,581Catron 57Chaves 465Colfax 2,021Curry 633DeBaca 37DonaAna 268Eddy 267Grant 640Guadalupe 91Harding 36
Albany 14,625Allegany 1,243Bronx 33,750Broome 10,875Cattaraugus 4,982Cayuga 3,412Chautauqua 6,737Chemung 4,914Chenango 1,688Clinton 1,269Columbia 1,950Cortland 1,708Delaware 1,351Dutchess 5,275Erie 60,939Essex 1,080Franklin 1,912Fulton 2,250Genesee 1,794Greene 825Hamilton 40Herkimer 3,750
Alamance..Alexander.Alleghany.AnsonAsheA veryBeaufort...BertieBladenBrunswick.,
5755010
1752530
4306060
_ . . 60Buncombe 3,116Burke 190Cabarrus 450Caldwell 160Camden 15Carteret 155Caswell 15Catawba 440Chatham 80Cherokee 75Chowan 160Clay 5Cleveland 270Columbus 185Craven 605Cumberland 720Currituck 25Dare 15Davidson 425Davie 65Duplin 175Durham 1,695Edgecombe 1,760Forsyth 3,266
NEW HAMPSHIRE.Counties. Returns.
Grafton 2,931Hillsborough 11,706Merrimack 4,014Rockingham 4,092
NEW JERSEY.Hudson 56,018Hunterdon 1,349Mercer 12,870Middlesex 11,013Monmouth 6,270Morris 6,803Ocean 1,150Passaic 18,364
NEW MEXICO.Hidalgo 121Lea 28Lincoln 227Luna 303McKinley 829Mora 66Otero 154Quay 397RioArriba 182Roosevelt 57Sandoval 37
NEW YORK.Jefferson 4,789 |Kings 195,086Lewis 675Livingston 1,693Madison 2,251Monroe 34,655Montgomery 4,125Nassau 16,361New York 412,490Niagara 9,707Oneida 12,601Onondaga 26,338Ontario 3,008Orange 9,150Orleans 1,125Oswego 3,281Otsego 2,736Putnam 605Queens 42,894Rensselaer 7,650Richmond 6,818Rockland 3,000
NORTH CAROLINA.Franklin 100Gaston 865Gates 20Graham 10Granville 245Greene 35Guilford 3,686Halifax 670Harnett 155Haywood 295Henderson 250Hertford 50Hoke 40Hyde 20Iredell 515Jackson 50Johnston 300Jones 10Lee 190Lenoir 530Lincoln 145McDowell 175Macon 35Madison 50Martin 135Mecklenburg 5,023Mitchell 45Montgomery 85Moore 310Nash 110New Hanover 2,935Northampton 85Onslow 30Orange 180
Counties. Returns.Strafford 2,691Sullivan 1,229
Total 32,410
Salem 1,810Somerset 2,463Sussex 893Union 23,610Warren 2,919
Total 269,096
San J u a n . . .San Miguel.Santa Fe . . . .SierraSocorro. , . . .TaosTorranceUnionValencia
7272953056
2G864
109167288
Total 11,780
St . Lawrence 2,964Saratoga 3,445Schenectady 9,525Schoharie 600Schuyler 412Seneca 749Steuben 4,445Suffo lk . . . 6,655Sullivan 1,100Tioga 975TompMns 2,675Ulster 3,375Warren 1,800Washington 1,950W a y n e 1,875Westchester 31,950Wyoming 1,023Yates 1,023Miscellaneous 22,689
Total 1,066,637
PamlicoPasquo tank . .PenderPe rqu imans .PersonPittPolkRandolphRichmond.. .RpbesonRockingham.,
204553070
12560060
165615455670
Rowan 1,420Rutherford 220Sampson 90Scotland 175Stanly 240Stokes 55Surry 290Swain 100Transylvania 95Tyrrell 15Union 335Vance ,. 450Wake 2,510Warren 190Washington 60Watauga... 25Wayne 660Wilkes 160Wilson 825Yadkin 20Yancey 40
Total 44,161

STATISTICS OF INCOME. 173
TABLE 15.—Personal returns by counties, calendar year 1921—Continued.
NORTH DAKOTA.Counties. Returns.
Adams 70Barnes 567Benson 230Billings 55Bottineau 210Bowman 75Burke 177Burleigh 880Cass 3,299Cavalier 380Dickey 297Divide 175Dunn 75Eddy 230Emmons 110Foster 210Golden Valley 155Grand Forks 1,648Grant 90
Adams 89Allen 3,675Ashland 637Ashtabula 4,218Athens 1,803Auglaize 718Belmont 3,369Brown 183Butler 4,991Carroll 283Champaign 710Clark 4,537Clermont 544Clinton 598Columbiana 5,473Coshocton 649Crawford 2,236Cuyahoga 61,446Darke. . 707Defiance 441Delaware 602Erie 2,811Fairfield 1,431Fayette 632Franklin 26,463Fulton 385Gallia 145Geauga 170Greene 994Guernsey 2,036
Adair 95Alfalfa 330Atoka 98Beaver 81Beckham 339Blaine 273Bryan 345Caddo 516Canadian 1,266Carter 2,103Cherokee 72Choctaw 469Cimarron 27Cleveland 309Coal 223Comanche 750Cotton 351Craig 243Creek 3,424Custer 444Delaware 27Dewey 54Ellis.'. 99Garfield 1,950Garvin 464Grady 900Grant 372
Counties.GriggsHettinger..KidderLa Moure..LoganMcHenry..Mclntosh..McKenzie..McLean. . .MercerMortonMountrail..NelsonOliverPembina..Pierce
Ransom..Renville.
Returns. |2057575
20040
17016555
39075
690170205
10230 j90
690 I365 |50 i
OHIO.
HamiltonHancockHardinHarrisonHenryHighlandHockingHolmesHuronJacksonJeffersonKnoxLake . . .LawrenceLickingLoganLorainLucasMadisonMahoningMarionMedinaMeigsMercerMiamiMonroeMontgomery..MorganMorrowMuskingum..
OKLAHOMA.GreerHarmonHarperHaskellHughesJacksonJeffersonJohnstonKayKingfisherKiowaLatimerLe FloreLincolnLoganLoveMcClainMcCurtainMclntoshMajorMarshallMayesMurrayMuskogeeNobleNowataOkfuskee
50,8891,369711711464651551504
2,277401
6,035612
3,267861
1,8301,03911,05623,088
34130,5952,212993690419
1,921268
15,691109114
2,692
205108389225848816274
1,714301372263558270713811802251801509083
1263,663
413375254
Counties. Returns.Richland 585Rolette 115Sargent... 150Sheridan 115Sioux 25Slope 165Stark 455Steete 115Stutsman 980Towner 185Traill 290Walsh 480Ward 1,172Wells 250Williams 475
Total 18,440
Noble 164Ottawa 922Paulding 275Perry 1,212Pickaway 380Pike 74Portage 2,264Preble 434Putnam 438Richland 2,894Ross 1 485Sandusky 1,415Scioto 2,542Seneca 1,662Shelby 593Stark 14,989Summit 24,736Trumbull 4,442Tuscarawas 2,792Union 230VanWert 745Vinton 101Warren 684Washington 1,371Wayne 2,124Williams 622Wood 1,750Wyandot 419
Total 367 <
Oklahoma 11,879Okmulgee 2,993Osage 2,621Ottawa 708Pawnee 753Payne 1,289Pittsburg 1,757Pontotoc 514Pottawatomie , 1,196Pushmataha 83Roger Mills 18Rogers 288Seminole 135Sequoyah 108Stephens 932Texas 222Tillman 390Tulsa 13,348Wagoner 164Washington 1,988WTashita 288Woods 369Woodward 278
Total 69,381
60729°—23- -12

174 STATISTICS OF INCOME.
TABLE 15.—Personal returns by counties, calendar year 1921—Continued.
Counties. Returns.Baker 1,044Benton 619Clackamas 1,757Clatsop 1,833Columbia 590Coos 1,163Crook 103Curry 108Descnutes 599Douglas 945Gilliam 257Grant 137Harney 110
Adams 499Allegheny 149,796Armstrong 3,271Beaver 7,632Bedford 473Berks 10,832Blair 8,579Bradford 1,975Bucks 2,800Butler 3,424Cambria 13,714Cameron 136Carbon 3,637Center 1,598Chester 4,425Clarion 996Clearfield 3,838Clinton 1,680Columbia 1,387Crawford 2,589Cumberland 2,338Dauphin 13,004Delaware 14,111Elk 2,119
OREGON.Counties. Returns.
Hood River 432Jackson 1,064Jefferson 89Josephine 310Klamath 782Lake 181Lane 1,564Lincoln 90Linn 723Malheur 297Marion 1,888Morrow 280Multnomah 38,419
PENNSYLVANIA.
Erie 12,203Fayette 9,161Forest 9Franklin 1,618Fulton 15Greene 540Huntingdon 822Indiana 2,710Jefferson 2,592Juniata 171Lacka wanna 16,298Lancaster 8,934Lawrence 6,883Lebanon 2,428Lehigh 6,663Luzerne 17,411Ly coming 5,696McKean. 3,833Mercer 5,223Mifflin 713Monroe 640Montgomery 16,357Montour...' 186Northampton 10,785
RHODE ISLAND.
Counties. Returns.Polk 458Sherman 400Tillamook 390Umatilla 2,091Union 1,220Wallowa 289Wasco 882Washington 1,004Wheeler 66Yamnill 620
Total 62,804
Northumberland 5,539Perry 365Philadelphia 166,444Pike I l lPotter 433Schuylkill 10,690Snyder 113Somerset 3,431Sullivan 280Susquehanna 1,223Tioga 713Union 312Venango 5,041Warren 2,230Washington 9,802Wayne 572Westmoreland 15,327Wyoming 234York 6,238Miscellaneous 5,261
Total 621,103
1,0312,4333,308
39,3471,938
Total 48,057
BristolKentNewportProvidence..Washington.
SOUTH CAROLINA.Abbeville.AikenAllendale.Anderson.,Bamberg..Barnwell..Beaufort..Berkeley...Calhoun.
392325709761401042017087
Charleston 5,264Cherokee 242Chester 396Chesterfield 196Clarendon 132Colleton 102Darlington 605
Armstrong Not reported. |Aurora 130 •Beadle 1,242Bennett 5 |Bon Homme 234 ;Brookings 398Brovn 2,481Brule 201Buffalo 12Butte 200Campbell 89Charles Mix 413Clark 213Clay 288Codington 1,017Corson 161Custer 93Davison 1,181
DillonDorchester...Edgefield....FairfieldFlorenceGeorgetown..Greenville...Greenwood..HamptonHorryJasperKershawLancasterLaurensLeeLexington...
20118091
1281,289
3472,719
42689
13131
26113037180
208
McCormick..MarionMarlboroNewberry . . .Oconee.."Orangeburg..Pickens..
53242410304212508154
Richland 3,652Saluda. 51Spartanburg 1,812Sumter 656Union 258WiUiamsburg 178York 686
SOUTH DAKOTA.
DayDeuelDeweyDouglasEdmundsFall River.. .FaulkGrantGregoryHaakonHamlinHandHansonHardingHughesHutchinson..HydeJackson
28712511877
15433015225123943
11513212129
4602727611
Total 25,160
Jerauld 108Jones 88Kingsbury 257Lake 361Lawrence 1,078Lincoln 247Lyman 51MTcCook 143McPherson 116Marshall 160Meade 141Mellette Not reported.Miner 171Minnehaha 3,222Moody 183Pennington 480Perkins 112Potter 115
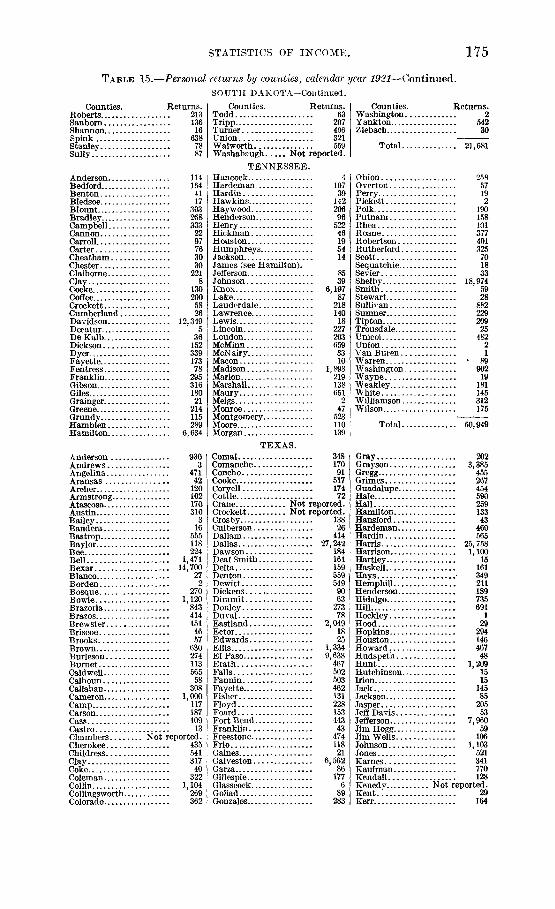
STATISTICS OF INCOME. 175
TABLE 15.—Personal returns by counties, calendar year 1921—Continued.SOUTH DAKOTA—Continued.
Counties.Roberts..Sanborn.Shannon..SpinkStanley...Sully
Returns.21313616
6387887
•. 1 1 4164411730326833322977630302218
1302005826
Davidson 12,349Decatur 5DeKalb 36Dickson 152Dyer 339Fayette 173Fentress 78Franklin 295Gibson... 316Giles 180Grainger. 21Greene 214Grundy 115Hamblen 289Hamilton 6,634
AndersonBedfordBentonBledsoeBlountBradleyCampbellCannonCarrollCarterCheathamChesterClaiborneClayCockeCoffeeCrockettCumberland
Anderson . .Andrews . . .Angelina.. .Aransas . . .ArcherArmstrong..AtascosaAustinBaileyBanderaBastropBaylorBeeBell.
9303
47142
120102170310
316
555. . . . . . . 118
2241,471
Bexar 14,700Blanco 27Borden 2Bosque 270Bowie 1,120Brazoria 843Brazos 414Brewster 151Briscoe 16Brooks 57Brown 630Burleson 274Burnet 113Caldwell 565Calhoun 58Callahan 308Cameron 1,000Camp 117Carson 187Cass 109Castro 13Chambers Not reported.Cherokee 435Childress 541Clay 317Coke 40Coleman 322Collin 1,104Collingsworth 269Colorado . . . . . . . . . . . 362
Counties.ToddTrippTurnerUnionWalworth.
Returns.63
207406321559
Washabaugh Not reported.TENNESSEE.
HancockHardemanHardinHawkinsHaywoodHendersonHenryHickmanHoustonHumphreys.JacksonJames (see Hamilton).JeffersonJohnsonKnoxLakeLauderdaleLawrenceLewisLincolnLoudonMcMinnMcNairyMaconMadisonMarionMarshallMaury
4107391422069652246195414
8539
6,19787218140182272036593310
1,
MonroeMontgomery..MooreMorgan
TEXAS.
219138651
247
523110139
ComalComanche.ConchoCookeCoryell....Cottle..
34817091
51717472
Crane Not reported.Crockett Not reported.Crosby 138Culberson 26Dallam 414Dallas 27,242Dawson 184Deaf Smith 161Delta 159Denton 559Dewitt 549Dickens 90Dimmit 63Donley 273Duval 78Eastland 2,049Ector 18Edwards 25Ellis 1,334ElPaso 9,638Erath 467Falls 502Fannin 503Fayette 462Fisher 131Floyd 228Foard 153Fort Bend 443Franklin 43Freestone 474Frio 118Gaines 21Galveston 6,562Garza 86Gillespie 177Glasscock 6Goliad 89Gonzales 283
Counties.Washington..YanktonZiebach
Returns.2
542
Total 21,681
ObionOvertonPerryPickettPolk...PutnamRheaRoaneRobertson..Rutherford.ScottSequatchie..Sevier...
25857192
190158101377401325701833
Shelby 18,974Smith 59Stewart 28Sullivan 882Sumner 229Tipton 209Trousdale 25Unicoi.. 482Union 2Van Buren 1Warren • 89Washington 902WTayne 19Weakley 181W h i t e . . . . 145Williamson 312Wilson 175
Total 60,949
G r a y . . . . . 202Grayson 3,385Gregg 455Grimes 267Guadalupe 454Hale 590Hall 259Hamilton 133Hansford 43Hardeman.. 460Hardin . . 565Harris 25,758Harrison 1,100Hartley 15Haskell 161H a y s . . . 349Hemphill 211Henderson 189Hidalgo 735Hill 691Hockley 1Hood 29Hopkins . . . . . 294Houston 146Howard 467Hudspeth 48Hunt 1,209Hutchinson 15Irion 15Jack 145Jackson 85Jasper 205Jeff Davis 53Jefferson 7,960JimHogg 59Jim Wells 106Johnson 1,103Jones 521Karnes 341Kaufman 770Kendall 128Kenedy Not reported.Kent 29Kerr . . . . 164
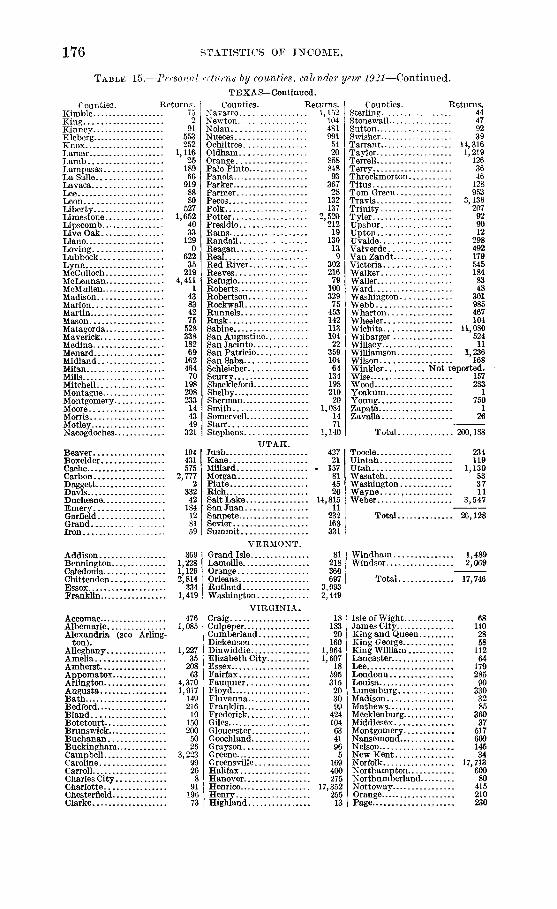
176 STATISTICS OF INCOME.
TABLE 15.—Personal returns by counties, calendar yevr 1921—Continued.
Counties. Returns.Kimble 75King 2Kinney 91Kleberg 553Knox 252Lamar 1,116Lamb 25Lampasas 189LaSalle 66Lavaca 919Lee 88Leon 80Liberty 527Limestone 1,652Lipscomb 40LiveOak 33Llano 129Loving 0Lubbock 622Lynn 35McCulloch 219McLennan 4,411McMullen 1Madison 43Marion 83Martin 42Mason 75Matagorda 528Maverick 338Medina 182Menard 69Midland 162Milan 464Mills 70Mitchell 198Montague 208Montgomery 233Moore 14Morris 43Motley 49Nacogdoches 321
Beaver 194Boxelder 431Cache 575Carbon 2,777Daggett..DavisDuchesne.,EmeryGarfield...GrandIron
AddisonBennington..CaledoniaChittenden..EssexFranklin
AccomacAlbemarleAlexandria (see Arling-
ton).AlleghanyAmeliaAmherstAppomatoxArlingtonAugustaBathBedfordBlandBotetourtBrunswickBuchananBuckinghamCampbellCarolineCarrollCharles CityCharlotteChesterfieldClarke.
233242
184128159
3691,2281,1262,814
3341,419
4761,085
1,22735
20863
4,3701,017
14921610
1502005026
3,22399268
9119673
TEXAS—Continued.Counties. Returns.
Navarro 1,152N t 1 0 4NewtonNolanNuecesOchiltrceOldhamOrangePalo PintoPanolaParkerParmerPecosPolk
1044819915420
85884893
36728
132l 1 3 7
Potter 2,520Presidio 212Rams 19Randall 130Reagan 13Real 9Red River 302Reeves 216Refugio 79Roberts 100Robertson 329Rockwall 75Runnels 453Rusk 142Sabine 113San Augustine. 104San Jacinto 22SanPatricio 359SanSaba 104Schleicher 64Scurry 134Shackleford 198Shelby 210Sherman 20Smith 1,084Somervell 14Starr 71Stephens 1,140
UTAH.Juab 427Kane 21 IMillard . 157Morgan 81Piute 45Rich 20Salt Lake 14,815San Juan 11Sanpete 232Sevier 168Summit 331
VERMONT.Grand Isle 81Lamoille 218Orange 360Orleans 697Rutland 3,093Washington 2,449
VIRGINIA.Craig 18Culpeper 183Cumberland 20Dickenson 160Dinwiddie 1,964Elizabeth City 1,607Essex 18Fairfax 595Fauquier 315Floyd 20Fluvanna 30Franklin 99Frederick 424Giles 104Gloucester 63Goochland 41Grayson 96Greene 5Greensville 169Halifax 400Hanover 275Henrico 17,352Henry 255Highland 13
Counties.SterlingStonewallSuttonS wisher..
Returns.44479239
Tarrant 14,316Taylor 1,219Terrell 126Terry. 36Thr ockmorton 46Titus 128Tom Green 953Travis 3,136Trinity 207Tyler 92Upshur.. 90Upton 12Uvalde 298Valverde 492Van Zandt 179Victoria 545Walker 184Waller 83Ward 48Washington 301W e b b . . . . . . . . . . . . . 985Wharton 467Wheeler 104Wichita 11,080Wilbarger.. . 524Willacy 11Williamson 1,236Wilson 168Winkler . . . Not reportedWise..WoodYoakum.Young...Zapata...Zavalla..
157283
1750
1
To ta l . . . . . 200,1
Tooele..Uintah.
234119
Utah 1,130Wasatch. . . . .Washington.Wayne.
5337
, 11Weber 3,547
T o t a l . . . . . . . . . . . . . . 26,128
Windham 1,489Windsor 2,069
Total 17,746
Isle of Wight 68James City 110King and Queen. 28King George 58King William... . 112Lancaster... 64Lee 179Loudoun. . . . 285Louisa 90Lunenburg 330Madison 32Mathews 85Mecklenburg 360Middlesex. . . . . 37Montgomery 517Nansemond... 609Nelson 145New Kent 34Norfolk 17,713Northampton 600Northumberland 80Nottoway 415Orange 210P a g e . . . . . . . . . . . . 230
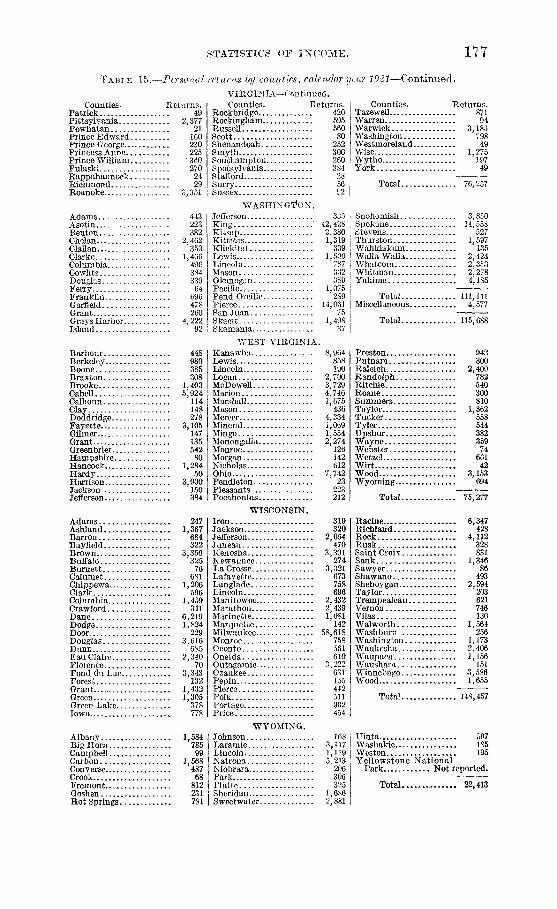
STATISTICS OF INCOME. 177
TABLE 15.—Personal returns by counties, calendar year 1921—Continued.
Counties.Patrick...PittsylvaniaPowhatanPrince EdwardPrince GeorgePrincess AnnePrince WilliamPulaskiRappahannoekRichmond.Roanoke
Returns. I49
. 2,377211602302253602702429
3,351
Adams 443Asotin 223Benton. . . 382Chelan 2,402ClaJlan 353Clarke 1,406Columbia 496Cowlitz 384Douglas 339Ferry 64Franklin 696Garfield 478Grant 260Grays Harbor 4,222 IIsland 92 1
Barbour 448Berkeley 980Boone 385Braxton 308Brooke. . . 1,403Cabell 5,924Calhoun 114Clay 148Doddridge. 278Fayette. . . 3,105Gilmer.. 147Grant 135Greenbrier 542Hampshire 80Hancock 1,284Hardy 50Harrison 3,900Jackson 150Jefferson 384
Adams 247Ashland . . . . . 1,367Barron 684Bayfield.. . . 322Brown 3,356Buffalo 325Burnett 76Calumet 681Chippewa 1,206Clark 596Columbia 1,459Crawford 341Dane 6,219Dodge 1,824Door 229Douglas 3,616Dunn 685Eau Claire 2,340Florence 70Fond du Lac 3,343Forest 132Grant 1,432Green 1,305Green Lake. 378Iowa 778
VIRGINIA—Continued.Counties. Returns.
42059556080
252300260384285602
335428380319339500787332
Roekbridge..RockinghamRussellScottShenandoahSmythSouthampton...SpotsylvaniaStaffordSurrySussex
WASHINGTON.JeffersonKing 42.Kitsap 2,Kittitas 1.KlickitatLewis 1.LincolnMasonOkanogan 389Pacific 1,075Pend Oreille... 289Pierce 14,061San Juan 75Skagit 1,498Skamania 37
WEST VIRGINIA.Kanawlia 8.964Lewis '858Lincoln 190Logan 2,700McDowell 3,729Marion 4,746Marshall.. 1,675Mason 436Mercer 4,334Mineral 1,069Mingo 1,554Monongalia 2,274Monroe 126Morgan 142Nicholas 612Ohio 7,742Pendleton 23Pleasants 223Pocahontas 212
WISCONSIN.IronJacksonJeffersonJuneauKenoshaKewauneeLa CrosseLafayetteLangladeLincolnManitowocMarathonMarinetteMarquetteMilwaukeeMonroeOcontoOneidaOutagamieOzaukeePepinPiercePolkPortagePrice
Counties. Returns.Tazewell 871Warren 94Warwick 3,183Washington 798Westmoreland 49Wise 1,275Wythe 197York. 49
Total. 76,257
Snohomish 3,850Spokane 14,558Stevens 527Thurston 1,597Wahkiakum 135Walla Walla 2,424Whatcom 2,353Whitman 2,278Yakima 4,185
Total 111,111Miscellaneous 4,577
Total 115,688
Preston 94?,Pu tnam 300Raleigh 2,400Randolph 782Ritchie 540Roane 300Summers 810Taylor 1,362TuckerTylerUpshurWayneWebsterWetzelWirtWoodWyoming
558544382359
74661
423,153
694
319320
2,054470
3,391274
3,321673758696
2,4322,4391,081142
58,618758561610
3,222631155442511902454
Total 75,277
Racine 6,347Richland 428Rock 4,112Rusk 328Saint Croix 831Sauk 1,346Sawyer 86Shawano 493Sheboygan 2,594Taylor 203Trempealeau 621Vernon 746Vilas 130Walworth 1,564Washburn 256Washington 1,173Waukesha.Waupaca. . .Waushara. .Winnebago.
2,4061,156
1513,586
Wood 1,655
Total 148,457
WYOMING.Albany 1,584Big Horn 785Campbell 99Carbon 1,568Converse 487Crook 68Fremont 812Goshen 231Hot Springs 781
Johnson..Laramie..Lincoln...Natrona. .Niobrara..Park..PlatteSheridanSweetwater.
1683,1171,1195.213
206306325
1,6862,881
Uinta 597Washakie 185Weston 195Yellowstone National
Park Not reported.
Total 22,413
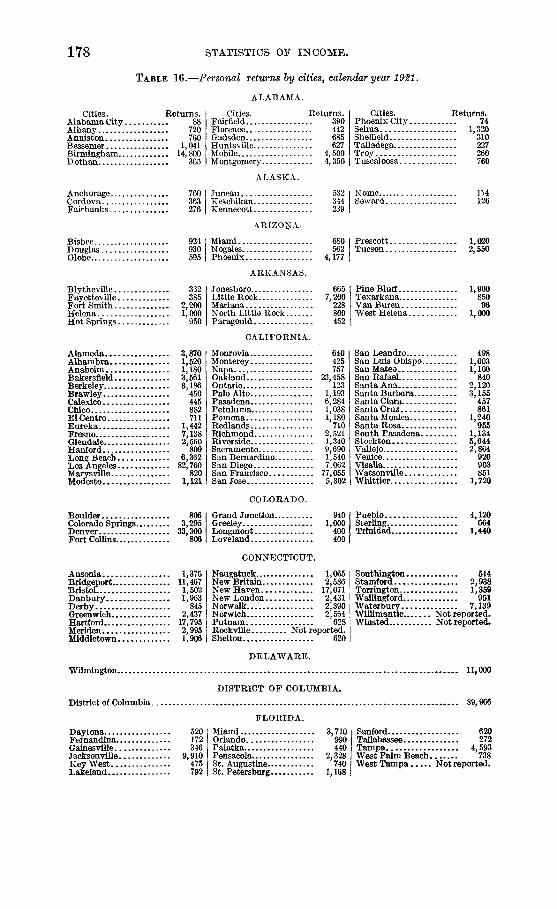
178 STATISTICS OF INCOME.
TABLE 16.—Personal returns by cities, calendar year 1921.
Cities. Returns.Alabama City 88Albany 720Anniston 760Bessemer . 1,041Birmingham 14,800Dothan 365
Anchorage.Cordova.. .Fairbanks..
Bisbee...Douglas.Globe....
760363276
924930595
Blytheville 332Fayettevil le. . . . 385Fort Smith 2,200Helena 1,000Hot Springs 950
Alameda 3,870Alhambra 1,520Anaheim 1,180Bakersfield 3,561Berkeley 8,186Brawley 450Calexico 445Chico 882ElCentro 711Eureka 1,442Fresno 7,138Glendale 2,560Hanford 809Long Beach 6,362Los Angeles 82,760Marysville 820Modesto 1,121
ALABAMA.
Cities.FairfieldFlorenceGadsdenHuntsvilleMobile
Returns.390442685627
4,500Montgomery 4,350
ALASKA.
Cities. Returns.PhoenixCity 74Selma 1,320Sheffield.TalladegaTroyTuscaloosa
Juneau 532Ketchikan 344Kennecott 239
Nome...Seward.
310227260760
114126
ARIZONA.
Miami.. .Nogales..Phoenix.
ARKANSAS.
JonesboroLittle RockMarianaNorth Little Rock.Paragould
CALIFORNIA.
MonroviaMontereyNapaOaklandOntarioPalo AltoPasadenaPetulumaPomonaRedlandsRichmondRiversideSacramentoSan Bernardino..San DiegoSan FranciscoSan Jose ,
5624,177
6657,200
228800452
640425757
23,458123
1,1936,2841,0381,180
7102,5211,3409,6901,5407,062
77,0555,302
Prescott 1,020Tucson 2,550
PineBluff 1,900Texarkana 850VanBuren 96West Helena 1,000
San Leandro. 498San Luis Obispo 1,003SanMateo 1,100San Rafael 840Santa Ana 2,120Santa Barbara 3,155Santa Clara 457SantaCruz 861Santa Monica 1,240Santa Rosa 955South Pasadena 1,134Stockton 5,644Vallejo 2,864Venice 920Visalia 903Watsonville 851Whittier 1,720
Boulder 806Colorado Springs. 3,295Denver 33,300Fort Collins 806
COLORADO.
Grand Junction 940Greeley 1,000Longmont 400Loveland 400
Pueblo 4,120Sterling 664Trinidad 1,440
Ansonia 1,375Bridgeport 11,467Bristol 1,502Danbury 1,963Derby 845Greenwich 2,437Hartford 17,795Meriden 2,995Middletown. 1,906
CONNECTICUT.
Naugatuck 1,065New Britain 2,586NewHaven 17,071New London 2,431Norwalk 2,390Norwich 2,564Putnam 628Rockville Not reported.Shelton 620
Southington 514Stamford 2,938Torrington 1,359Wallingford. 951Waterbury 7,139Willimantic Not reported.Winsted Not reported.
DELAWARE.
Wilmington 11,000
DISTRICT OF COLUMBIA.
District of Columbia. 59,966
FLORIDA.
DaytonaFernandina..Gainesville. 346Jacksonville 9,910- ~ • 475
792
520 ; Miami.. .172 | Orlando.
Key West.Lakeland
Palatka..PensacolaSt. Augustine..St. Petersburg.
3,710990440
2,328740
1,168
Sanford 620Tallahassee.. 272Tampa 4,593West Palm Beach 738West Tampa Not reported.

STATISTICS OF INCOME. 179
TABLE 16.—Personal returns by cities, calendar ijear 1921—Continued.
GEORGIA.
Cities. Returns.Albany 647Americus 429Athens 962Atlanta 26,830Augusta 4,215Brunswick 539Columbus 2,251Cordele 206Dalton 197
Boise 2,650Burley 340CaldweU 365
Alton 2,037Aurora 4,605Beardstown 900Belleville 2,310Belvdere 369Benton 753Berwyn 2,067Bloomington 3,175Bluelsland 1,752Cairo 850Canton 563Carbondale 559Carlinville 523Centralia 1,525Champaign 1,950Charleston.... 457Chicago 380,941Chicago Heights 1,269Cicero 6,555Clinton 759Collinsville 803Danville 3,707DeKalb 510Decatur 4,680Dixon 712Duquoin 617EastMoline 393East St. Louis 5,545Edwardsville 543Eldorado 605Elgin 4,126
Cities.DecaturDublinEast Point.Elberton...Fitzgerald.GainesvilleGriffinLagrange
Returns.883191204203194262
433Macon 4,767
IDAHO.
Coeur d'Alene.Idaho FallsLewiston
ILLINOIS.
740997740
Evanston. 7,801Forest Park 1,536Freeport 2,006Galesburg 2,840GraniteCity 1,133Harrisburg 850Harvey 846Herrin 1,190Highland Park 1,161Hillsboro 465Hoopeston 370Jacksonville 1,017Johnston City 600Joliet 5,456Kankakee 1,617Kewanee 1,001La Grange 2,073LaSalle 1,502LawrencevilleLincolnLitchfieldMacomb.. .MarionMattoonMaywoodMelrose Park.MetropolisMolineMonmouthMount Carxnel .Mount Vernon
337853303427
1 2651,4052 417
547137
2, 587734487259
Anderson 1,584Bedford 759Bicknell 568Bloomington 800Bluffton 379Brazil 637Clinton 1,236Columbus 520Connersville 944Crawfordsville 677East Chicago 2,216Elkhart 2,760Elwood 357Evansville 6,208FortWayne 9,009Frankfort 900Gary 5,055Goshen 488
Albia 393Ames 410Atlantic 503Boone 1,186Burlington 2,114Cedar Falls 373Cedar Rapids 3,775Centerville 554Chariton 300CharlesCity 389Cherokee 600Clinton 1,909
INDIANA.
Greensburg .. 316Hammond 3,633Hartford 241Huntington 1,292Indianapolis 29,237Jeffersonville 921Kendall ville 315Kokomo 1,811La Porte 1,152La Fayette 2,319Lebanon 346Linton 495Logansport 1,997Madison 238Marion 1,190Michigan City 1,388Mishawaka 2;288Mount Vernon 194
IOWA.
Council Bluffs 3,856Creston 712Davenport 5,642DesMoines 11,764Dubuque 3,796Fairfield 418Fort Dodge 1,987Fort Madison 962Grinnell 380Iowa City 726Keokuk 980Marshalltown 1,118
Cities.Marietta. . .Moultrie.. .NewnanRome..
Returns.401228277701
Savannah 7,707Thomasville 402Valdosta 526Waycross 782
Nampa 972Pocatello 2,756Twin Falls 765
Murphysboro 819Normal 303North Chicago 190Oak Park Not reported.Ottawa 1,280Pana 428Paris 568Pekin 1,061Peoria 9,434Peru 585Pontiac 525Quincy 2,550Rock Island 3,245Rockford 5,903Savanna 854Spring Valley 292Springfield 6,080Staunton 550Sterling 878Streator 1,077Taylorville 775Urbana 735Waukegan 2,082West Frankfort 1,016Wrest Hammond 231Wilmette 2,160Winnetka 1,462Woodstock 465Zion 330
Muncie 2,290New Albany 1,709Newcastle 489Peru 1,220Portland 282Princeton 597Richmond 2,339Rushville 279Seymour 474Shelbyville 531South Bend 7,375Terre Haute 6,361Valparaiso 628Vincennes 1,051Wabash 653Warsaw 308Washington 779Whitting 1,684
Mason City 1,517Muscatine 963Newton 390Oelwein 815Oskaloosa 807Ottumwa 1,748Perry 491RedOak 516Shenandoah 296SiouxCity 7,091Waterloo 3,178Webster City 478

180 STATISTICS OF INCOME.
TABLE 16.—Personal returns by cities, calendar year 1921—Continued.T7" k "K.T PI A C1
Cities. Returns.Arkansas City 1,900Atchison 1,215Chanute 1,125Coffeyville 1,270Dodge City 630ElDorado 1,720Emporia 1,305Fort Scott 945Hutchinson 1,890
Ashland 1,365Belleyue. _Bowling Green.CovingtonDanvilleDaytonFort Thomas. . .Frankfort
620885
5,020660639500550
Alexandria 1,668Baton Rouge 3,413Bogalusa 449Crowley 93Gretna 205
Auburn 1,538Augusta 1,013Bangor 2,775Bath 825Belfast 300Biddleford 1,350Brewer 525
KANSAS.Cities. Returns.
Independence 1,260Iola 380Junction City 620Kansas City 7,380Lawrence 850Leaven worth 1,360Manhattan 855Newton 1,345Ottawa 450
KENTUCKY
Henderson 490Hopkinsville 600Lexington 3,100Louisville 22,470Madisonville 386Mayfield 290Maysville 385Middlesborough 536
LOUISIANA.
Houma 198Lafayette 623Lake Charles 1,188Minden 272Monroe 1,353
MAINE.Brunswick 600Calais 225Gardiner 489Lewiston 2,620OldTown 300Portland 8,738Rockland 561
Cities. Returns.Parsons 1,800Pittsburgh 2,160Pratt 585Rosedale 540Salina 2,025Topeka 7,200Wellington 585Wichita 9,400Winfield 574
Newport 2,220O wensboro 848Paducah 1,805Paris 850Richmond 294Winchester 735
Morgan.New Iberia..
186
New Orleans 34,721Shreveport 6,672
Rumford Falls 618Saco 600South Portland 975Waterville 1,725Westbrook 750
Annapolis 1,167Baltimore 56,733Cambridge 303
Abington..AdamsAgawam...Amesbury.Amherst.,
733526150926395
Andover 1,207Arlington 3,019Athol 846Attleboro 2,404Belmont 1,841Beverly 2,599Boston 96,477Braintree 1,621Bridgewater 526Brockton 8,998Brookline 10,962Cambridge 11,854Canton 300Chelmford 243Chelsea...: 3,214Chicopee 2,526Clinton 977Concord 902Danvers 1,202Dartmouth 287Dedham 1,402Dracut 150Easthampton 676Easton 154Everett 3,119Fairhaven 601FaURiver 7,103Fitchburg 3,430Framingham 1,880Franklin 676Gardner 1,244Gloucester 1,642
MARYLANDCumberland 1,338Frederick 920Frostburg 448
MASSACHUSETTS.
Grafton 241Great Barrington 263Greenfield 2,074HaverhiU 5,581Hingham 730Holyoke 5,677Hudson 761Ipswich 486Lawrence 7,280Leominster 1,576Lexington 903Lowell 9,908Ludlow 1,025Lynn 12,635Maiden 4,648Mansfield 1,495Marblehead 123Marlborough 1,336Maynard 545Medford 4,931Melrose 3,306Methuen 1,469Middleborough 929Milford 5,177Millbury 470Milton 1,469Montague 243Natick 902Needham 854New Bedford 9,387Newburyport 1,438Newton 8,507North Adams 1,770North Andover 826North Attleborough 1,766Northampton 310Northbridge 169
Hagerstown 1 821Salisbury 442
Norwood 569Orange 334Palmer 411Peabody 2,684Pittsfleld 4,680Plymouth 1,155Quincy 4,637Reading 1,129Revere 2,477Rockland 1,129Salem 4,958Saugus 346Somerville 11,942Southbridge 1,160Spencer 385Springfield 15,575Stonenam 70Stoughton 692Swampscott 1,449Taunton 2,321Uxbridge 352Wakefield 1,200Walpole 516Waltham 3,606Ware 525Watertown 410Webster 1,409Wellesley 1,462West Springfield 1,055Westborough 72Westfield 1,204Weymouth 2,002Whitman 907Winchester 1,955Winthrop 3,006Woburn 1,907Worcester 21,075

STATISTICS OF IXCOME. 181
TABLE 16.—Personal returns by cities, calendar year 1921—Continued.
Cities. Returns.Adrian 746Albion 412Alma 334Alpena 628Ann Arbor 1,884Battle Creek 4,102BayCi ty 3,494Benton Harbor 1,200Bessemer. . . . 300Cadillac 700Charlotte 275Cheboygan 206Coldwater 334Detroit I l l , 195Dowagiac. 375Escanaba 1,200Flint 6,358Grand Haven 600Grand Rapids 16,000Hamtramck 903
MICHIGAN.
Cities. Returns.Hancock 450Hastings 275Highland Park 6,123Hillsdale 390Holland 1,000Ionia 750Iron Mountain 600Ironwood 1,000Ishpeming 750Jackson 5,064Kalamazoo 5,500Lansing 5,181Laurium 200Ludington 500Manistee 500Manistique 350Marquette 1,200Menominee 675Midland 294Monroe 1,099
Cities. Returns.Mount Clemens 1,020Munising 275Muskegon 3,000•%/r i , _ T T . : _/u J _ c\c\r'
gMuskegon HeightsNegauneeNilesOwossoPetoskeyPontiac
225350975805450
2,159Port Huron 2,385
6681,3745,573800900450375600
1,177726
River Rouge..Royal OakSaginawSOosephSault Ste MarieSturgisThree RiversTraverse CityWyandotteYpsilanti
Albert LeaAustinBemidji . .BrainerdChisholmCloquetCrookstonDuluthEveleth
BiloxiClarksdaleColumbusCorinth . .Green villeGreenwood
BrookfieldCape GirardeauCarthageChillicotheClintonColumbiaDe Soto . . .FultonHannibalIndependence
789852
729361428563
11,787573
324723439260868704
565. . . 709
360200190556
. . 307173
1,450. . . . 1,080
MINNESOTA.
FaribaultFergus FallsHibbingLittle FallsMankatoMinneapolisMoorheadNew UlmOwatonna
540460
1,024
MISSISSIPPI.
Gulf portHattiesburg.JacksonLaurelMcCombMeridian
MISSOURI.
Jefferson City..JoplinKansas Ci ty . . .KirksvilleMaplewoodMarshallMexicoMoberlyNevadaPopular Bluff..
2501,155
45,012481313428
487918
1,830748794
1,875
7001,680
37,180376994400375
1,462400437
RedWing 633Rochester 1,421St. Cloud 991St. Paul 25,716South St. Paul 468Still water 486Virginia.. 1,103Willmar 505Winona 1,565
Natchez 742Pascagoula 114Tupelo 266Vicksburg 1,760YazooCity 336
St. Charles 495St. Joseph 6,220St. Louis 80,704Sedalia 1,400Springfield 1,190Trenton 500University 640Webb City 240Webster Groves 1,781
MONTANA.
Anaconda 719Billings 2,170Bozeman 555But te . . . 5,425
Beatrice 653Columbus 586Fairbury 735Fremont 1,087Grand Island 1,565
Great Falls.HavreHelenaKalispeli
NEBRASKA.
HastingsKearneyLincolnNebraska City.Norfolk
2,945706
1,856434
995536
6,142440
1,033
Lewistown 867Livingston 994Miles City 909Missoula 2,435
North Piatte 925Omaha 25,854Scottsbluff 445York 376
Reno..
NEVADA.
2,064
Berlin 1,152Claremont 702Concord 2,592Deny 405Dover. 1,129
NEW HAMPSHIRE.Franklin.KeeneLaconia...Lebanon.
4681,152540540
Manchester 7,020
Nashua 2,592Portsmouth 1,800Rochester 556Somersworth 468
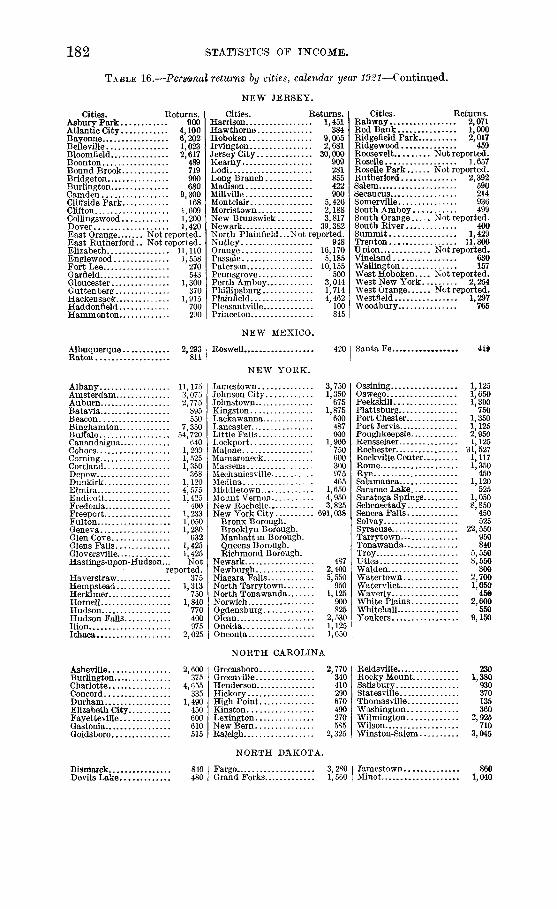
182 STATISTICS OF INCOME.
TABLE 16.—Personal returns by cities, calendar year 19:21—Continued.
Cities. Returns.AsburyPark 900Atlantic City 4,100Bayonne 6,202Belleville 1,023Bloomfield 2,617Boonton 489Bound Brook 719Bridgeton 900Burlington 680Camden 9,300Cliffside Park 168Clifton 1,609Collingswood 1,200Dover 1,420East Orange Not reported.East Rutherford.. Not reported.Elizabeth 11,110Englewood 1,558FortLee 270Garfield 543Gloucester 1,300Guttenberg 370Hackensack 1,915Haddonfield 700Hammonton 290
NEW JERSEY.
Cities. Returns.Harrison 1,451Hawthorne 384Hoboken 9,065Irvington 2,681Jersey City 30,000Kearny 909Lodi 281Long Branch 855Madison 422Millville 900Montclair 5,426Morristown 2,188New Brunswick 3,817Newark 39,382North Plainneld...Not reported.Nutley 948Orange 16,170Passaic 5,185Paterson 10,155Pennsgrove 500Perth Amboy 3,044Phillipsburg 1,714Plainfield 4,462Pleasantville 100Princeton 845
Cities. Returns.Rahway 2,071RedBank 1,000Ridgefield Park. 2,017Ridgewood 459Roosevelt Not reported.Roselle 1,657Roselle Park Not reported.Rutherford. . . . 2,392Salem 590Secaucus 214Somerville 936South Amboy 499South Orange Not reported.South River 400Summit 1,429Trenton. . 11,300Union Notreported.Vineland 630Wallington 157West Hoboken Notreported.WestNewYork 2,254West Orange Not reported.Westfield 1,297Woodbury 765
NEW MEXICO.
Albuquerque 2,293Raton 811
Albany 11,175Amsterdam 3,075Auburn 2,775Batavia 895Beacon 550Binghamton 7,350Buffalo 54,720Canandaigua 640Cohoes 1,200Corning 1,525Cortland 1,350Depew 368Dunkirk 1,120Elmira 4,575Endicott 1,425Fredonia 400Freeport 1,233Fulton 1,050Geneva 1,280Glen Cove 632Glens Falls 1,425Gloversville 1,425Hastings-upon-Hudson... Not
reported.Haverstraw 375Hempstead 1,313Herkamer 750Hornell 1,840Hudson 770Hudson Falls 400Ilion 975Ithaca 2,025
Roswell.,
NEW YORK.
420
Asheville 2,600Burlington 375Charlotte 4,655Concord 335Durham 1,490Elizabeth City 450Fayetteville 600Gastonia 610Goldsboro 515
Bismarck 840Devils Lake 480
Jamestown 3,750Johnson City 1,350Johnstown 675Kingston 1,875Lacka wanna 600Lancaster 487Little Falls 900Lockport 1,900Malone 750Mamaroneck 600Massena 300Mechanicsville 975Medina 465Middletown 1,650Mount Vernon 4,950NewRochelle 3,825New York City 691,038
Bronx Borough.Brooklyn Borough.Manhattan Borough.Queens Borough.Richmond Borough.
Newark 487Newburgh 2,400Niagara Falls 5,550North Tarrytown 950North Tonawanda 1,125Norwich 900Ogdensburg 825Olean 2,530Oneida 1,125Oneonta 1,650
NORTH CAROLINA
Greensboro 2,770Greenville 340Henderson 410Hickory 290High Point 670Kinston 490Lexington 270NewBern 585Raleigh 2,325
NORTH DAKOTA.
Fargo 3,280Grand Forks 1,560
Santa Fe 419
Ossining 1,125Oswego 1,650PeeksMll 1,300Plattsburg 750Port Chester 1,350PortJervis 1,125Poughkeepsie 2,950Rensselaer 1,125Rochester 31,527Rockville Center 1,117Rome 1,350Rye 450Salamanca 1,120Saranac Lake 525Saratoga Springs 1,050Schenectady. 8,850Seneca Falls 450Solvay 525Syracuse 22,550Tarrytown... 950Tonawanda 840Troy 5,550Utica 8,550Walden 300Watertown 2,700Watervliet 1,050Waverly 450White Plains 2,600Whitehall 550Yonkers 9,150
Reidsville 230Rocky Mount 1,380Salisbury 930Statesville 370Thomasville 135Washington 360Wilmington 2,925Wilson 710Winston-Salem 3,045
Jamestown 860Minot 1,040
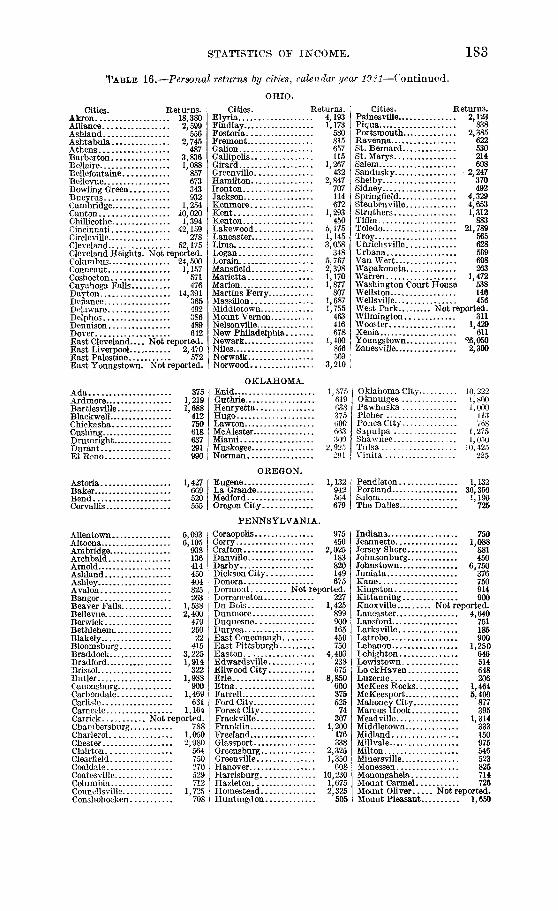
STATISTICS OF INCOME. 183
TABLE 16.—Personal returns by cities, calendar year 1921—Continued.
Cities. Returns.Akron 18,380Alliance 2,599Ashland 556Ashtabula.. . 2,745Athens 487Barberton 3,836Bellaire 1,088Bellefontaine 857Bellevue 673Bowling Green 343Bucyrus 932Cambridge 1,254Canton 10,020Chillicothe 1,394Cincinnati 42,159CircleviUe 278Cleveland 52,175Cleveland Heights. Not reported.Columbus 24,500Conneaut 1,157Coshocton 571Cuyahoga Falls 476Dayton 14,391Defiance 365Delaware 492Delphos 386Dennison 489Dover 642East Cleveland Not reported.East Liverpool 2,470East Palestine 572East Youngstown. Not reported.
A d a . . . . 375Ardmore 1,219BartJesville 1,688Blackwell 412Chickasha 750Gushing 618Drumright 637Durant 291El Reno 990
Astoria 1,427Baker 669Bend. . 520Corvallis 555
Allentown 5,093Altoona 6,105Ambridge 938Archbald 136Arnold 414Ashland. 450Ashley 404Avalon 825Bangor 263Beaver Falls 1,538Bellevue 2,400Berwick 479Bethlehem 250Blakely 22Bloomsburg 415Braddock 3,225Bradford 1,914Bristol 322Butler 1,988Canonsburg 900Carbondale 1,469Carlisle- 631Carnegie 1,164Carrick Not reported.Chambersburg 788Charieroi 1,050Chester 2,980Clairton 564Clearfield 750Coaldale 270Coatesville 529Columbia 712Connellsville 1,725Conshohocken 708
OHIO.Cities. Returns.
Elyria 4,193Findlay 1,173Fostoria 580Fremont 815Galion 657Gallipolis 115Girard 1,267Greenville 432Hamilton 2,847Ironton 707Jackson 114Kenmore 672Kent 1,293Kenton 450Lakewood 5,175Lancaster 1,145Lima 3,058Logan. 348Lorain 5,767Mansfield 2,398Marietta 1,170Marion 1,877Martins Ferry. 807Massillon 1,687Middletown 1,755Mount Vernon 463Nelsonville 416New Philadelphia 678Newark 1,400Niles 856Norwalk 569Norwood 3,210
OKLAHOMA.Enid 1,575Guthrie 619Henryetta 638Hugo 375Lawton <J00McAlester 663Miami 300Muskogee 2,925Norman 291
Cities, Returns.Painesville 2,123Piqua.. 838Portsmouth 2,385Ravenna 622St.Bernard 530St.Marys 214Salem 608Sandusky 2,247Shelby 370Sidney 492Springfield 4,329Steubenville 4,653Struthers 1,312Tiffin 883Toledo 21,789Troy 565Uhrichsville 628Urbana 509VanWert 608Wapakoneta 263Warren 1,472Washington Court House 538WeUston 148Wellsville 456West Park Not reported.Wilmington 311Wooster 1,429Xenia 611Youngstowa °.6,050ZanesviUe 2,300
Oklahoma CityOkmulgeePawhuskaPicherPonca CitySapulpaShawneeTulsa 10J425Vinita 225
10,22.2M001,000
113768
1,2751,050
OREGON.Eugene 1,132La Grande 942Medford 564Oregon City 679
PENNSYLVANIA.
i Coraopolis 975! Corry 450
Crafton 2,025Danville 183Darby 820Dickson City 149Donora- 675Dormant Not reported.Dorraneeton 227DuBois 1,425Dunmore 899Duquesne 900Duryea .- 165East Conemaugh 450East Pittsburgh 750Easton 4,403Edwardsville 238EllwoodCity 675Erie 8,850Etna 600Farrell 375Ford City 525Forest City 74Frackville 307Franklin 1,200Freeland 176Glassport 338Greensburg 2,325Greenville 1,350Hanover 608Harrisburg 10,230Hazleton 1,675Homestead 2,325Huntingdon 505
Pendleton 1,132Portland 36,356Salem 1,190The Dalles 725
Indiana. 750Jeannette 1,088Jersey Shore 881Johnsonburg. 450Johnstown 6,750Juniata 376Kane 750Kingston 914Kittanning 900Knoxville Not reported.Lancaster 4,640Lansford 751Larksville 185Latrobe 900Lebanon 1,250Lehighton 646Lewistown 514Lo ckHaven 648Luzerne 206McKees Rocks 1,464McKeesport 5,400MahoneyCity 877Marcus Hook 395Meadville 1,314Middletown 333Midland 150Millvale 975Milton 546Minersville 523Monessen 825Monongahela 714Mount Carmel 726Mount Oliver Not reported.Mount Pleasant... . 1,650
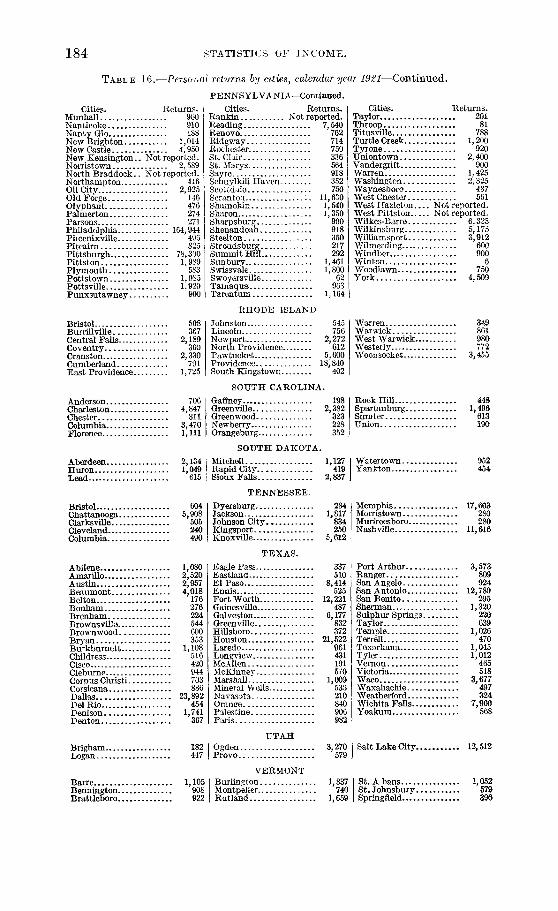
184 STATISTICS OF INCOME.
TABLE 16.—Personal returns by cities, calendar year 1921—Continued.
Returns.900910188
1,014
Cities.MunhallNanticokeNanty GloNew Brighton.. .Newcastle . . <950New Kensington.. Not reported.Norristown 2,589North Braddock.. Not reported.Northampton 416OilCity 2,925OldForge 146Olyphant 476Palmerton 274Parsons 271Philadelphia 164,944Phoenixville 496Pitcairn 825Pittsburgh 78,300Pittston 1,9S9Plymouth 5S3Pottstown I,0S5Pottsville 1.920Punxsutawney 900
Bristol 508Burrillville 367Central FaUs 2,189Coventry 360Cranston 2,330Cumberland 791East Providence 1,725
Anderson 706Charleston 4,847Chester 311Columbia 3,470Florence 1,111
Aberdeen 2,134Huron 1,049Lead 615
Bristol 604Chattanooga 5,908Clarksville 505Cleveland 240Columbia 490
Abilene 1,080Amarillo 2,520Austin 2,957Beaumont 4,018BeltonBonhamB r e n b a m —Brownsville.Brown wood.Bryan
PENNSYLVANIA—Continued.Cities. Returns.
Rankin N ot reported.Reading 7,540Renovo 762Ridgway 714Rochester. 750St. Clair 336St. Marys. 564Sayre 918Schuylkill Haven 352Scott'dalo. . . . 750Scranton 11,630ShamoMn 1,540Sharon 1,350Sharpsburg 900Shenandoah 918Steelton 350Stroudsburg.* 217Summit Hil l . . . 292Sunbury . . . . . . 1,461Swissvale 1,800Swoyersville 62Tamaqua 963Tarentum 1,164
RHODE ISLAND
Johnston.. 545Lincoln.- 756Newport 2,272North Providence 612Pawtucket 5,600Providence.. . . 18,840South Kingstown 402
176276224544600353
Burkburnett 1,108Childress 516Cisco 420Cleburne 944Corpus Christi 703Corsicana 886Dallas 23,892DelRio 454Denison 1,741Denton 367
Brigham..Logan
182447
Barre 1,105Bennington 908Brattleboro 922
SOUTH CAROLINA.
GaffneyGreenville.Greenwood.Newberry.Orangeburg...
1982,382323228352
Cities. Returns.Taylor 201Throop 81Titusville 788TurtleCreek 1,200Tyrone. . . . 920Uniontown 2,400Vandergrift 900Warren.. 1,425Washington 2,325Waynesboro 487WestChester 561West Hazleton Not reported.West Pittston Not reported.Wilkes-Barre 6,325Wilkmsburg 5,175Williamsport 3,912Wilmerding 600Windber 900Winton £>Woodlawn 750York 4,509
Warren 349Warwick 861West Warwick 980Westerly 772Woonsocket 3,455
RockHiU 448Spartanburg 1,496Sumter 613Union. . . 190
SOUTH DAKOTA.Mitchel l . . . . . . . 1,127 Watertown.Rapid City. 419Sioux FaUs 2,837
Yankton.952
TENNESSEE.DyersburgJacksonJohnson City.KingsportKnoxville.....
TEXAS.Eagle PassEastland...El PasoEnnisFort Worth. . . .GainesvilleGalvestonGreenville.HillsboroHoustonLaredoLongviewMe Al l en . . . . . . .McKinneyMarshallMineral Wells..Navasota . . . . . .OrangePalestineParis.
2841,817
834250
5,612
337510
8,414525
12,221487
6,177832372
21,522961431191570
1,009533210840906
Memphis 17,603Morristown 280Murfreesboro 280Nashville 11,616
Port Arthur 3,573Ranger 809SanAngelo 924San Antonio 12,780San Benito 295Sherman 1,320Sulphur Springs 220Taylor 639Temple 1,026Terrell 470Texarkana 1,045Tyler 1,012Vernon 465Victoria 518Waco 3,677Waxahachie 497Weatherford 324Wichita Falls 7,900Yoakum 568
UTAHI Ogden 3,270 I Salt Lake City..
Provo.
VERMONT
579 |12,512
Burlington 1,837Montpelier.., 740Rutland 1,659
St.Abans 1,052St.Johnsbury 579Springfield 390

STATISTICS OF INY:OME. 185
TABLE 16.—Personal returns by cities, calendar year 19:21—Continued.
Cities. Returns.Alexandria 2,630Bristol 520Charlottesville 920Clifton Forge 720Covington 385Danville 1,920Frederieksburg 380
Aberdeen 1,889Anacortes 290Bellingham 1,890Bremerton 1,458Centralia 455Everett 2,361
Bluefield 2,350Charleston 6,228Clarksburg 3,015Elkins 558Fairmont 2,736Grafton 1,196
Antigo 684Appleton 2,113Ashland 1,113Baraboo 619Beaver Dam 621Beloit 1,812Chippewa Falls 675Cudany Not reported.DePere 275EauClaire 2,076Fond du Lac 2,569GreenBay 3,251Janesville 2,120Kaukauna 357
VIRGINIA.Cities.
Hampton.Harrisonburg...Lynchburg . . .Newport NewsNorfolkPetersburg.Portsmouth
Returns... 1,360
360.. 2,880.. 2,705.. 12,320.. 1,920.. 3.340
WASHINGTON.HoquiamOlympiaPort Angeles.PuyallupSeattle.Spokane
1,227935156537
38,47513.320
WEST VIRGINIA.Huntington,KeyserMartinsburg....MorgantownMoundsvilleParkersburg
WISCONSIN.
KenoshaLa CrosseMadison —ManitowocMarinetteMarshfleldMenosha - —MenomonieMerrillMilwaukeeNeenahOshkoshPortageRacine
5, 758620890
1,866688
2,996
,970,262,452
50
WYOMING.
570600341384,912876
!,418588
1,543
Cities. Returns.Puiaski 210Richmond 16,000Roanoke 2,750South Norfolk Not reported.Staunton 640Suffolk 555Winchester 385
Tacoma 11,565Vancouver 920Walla Walla 1,956Wenatchee . . . . 1,360Yakima 2,705
Princeton. . . . . 779Weston 678Wheeling 7,376Williamson 848
Rhinelander 524Sheboygan 1,833South Milwaukee 769Stevens Point 722Stoughton 341Superior 3,531Two Rivers. 531Watertown 970Waukesha 1,213Wausau 1,704Wauwatosa 1,416WestAllis 1,533Wisconsin Rapids 648
Casper 4,234 i L a r a m i e . . . . . .Cheyenne 2,738 I Rock Springs.
1,349 j Sheridan..t.433 '
1,208
Related Documents