Statistics for Social and Behavioral Sciences Part IV: Causality Association and Causality Session 22 Prof. Amine Ouazad

Statistics for Social and Behavioral Sciences Part IV: Causality Association and Causality Session 22 Prof. Amine Ouazad.
Dec 22, 2015
Welcome message from author
This document is posted to help you gain knowledge. Please leave a comment to let me know what you think about it! Share it to your friends and learn new things together.
Transcript

Statistics for Socialand Behavioral Sciences
Part IV: CausalityAssociation and Causality
Session 22Prof. Amine Ouazad

Statistics Course Outline
PART I. INTRODUCTION AND RESEARCH DESIGN
PART II. DESCRIBING DATA
PART III. DRAWING CONCLUSIONS FROM DATA: INFERENTIAL
STATISTICS
PART IV. : CORRELATION AND CAUSATION: TWO GROUPS,
REGRESSION ANALYSIS
Week 1
Weeks 2-4
Weeks 5-9
Weeks 10-14
Multivariate regression now!
Estimating a parameter using sample statistics. Confidence Interval at 90%, 95%, 99% Testing a hypothesis using the CI method and the t method.
Sample statistics: Mean, Median, SD, Variance, Percentiles, IQR, Empirical RuleBivariate sample statistics: Correlation, Slope
Four Steps of “Thinking Like a Statistician”Study Design: Simple Random Sampling, Cluster Sampling, Stratified Sampling
Biases: Nonresponse bias, Response bias, Sampling bias
Coming up
• “Comparison of Two Groups”Last week.
• “Univariate Regression Analysis”Last Saturday. (Section 9.5)
• “Association and Causality: Multivariate Regression”Today, Monday, Tuesday. Chapters 10 and 11.
• “Randomized Experiments and ANOVA”.Wednesday. Chapter 12.
• “Robustness Checks and Wrap Up”.Last Thursday.

Outline
1. Correlation and Causation
2. Multiple CausesPartly Spurious AssociationSpurious AssociationChain Relationship
3. Interaction
Next time: Multivariate regression
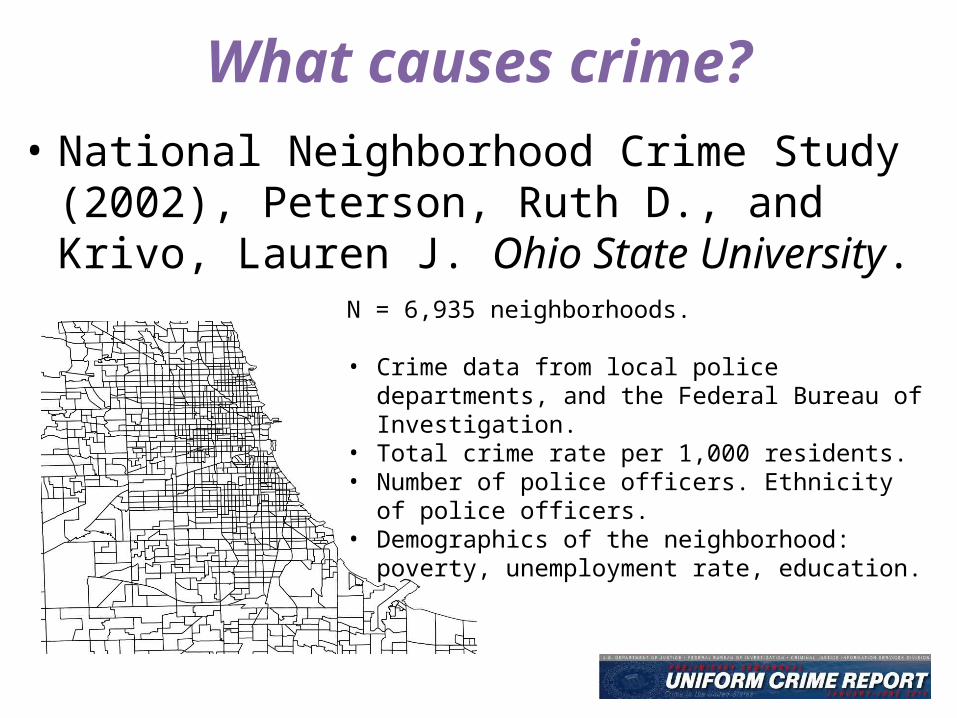
What causes crime?• National Neighborhood Crime Study (2002),
Peterson, Ruth D., and Krivo, Lauren J. Ohio State University.
N = 6,935 neighborhoods.
• Crime data from local police departments, and the Federal Bureau of Investigation.
• Total crime rate per 1,000 residents.• Number of police officers. Ethnicity of police officers.• Demographics of the neighborhood: poverty,
unemployment rate, education.

Regression of Crime Rate on the Unemployment Rate
• y : total crime per 1,000 residents.• x : unemployment rate from 0 to 100.

Causation Matters
• Changing, manipulating X will affect Y.• Example:
– if Poverty -> Crime, then addressing poverty (e.g. war on poverty, food stamps, welfare programs) will lower crime.
– if CO2 emissions Global average temperature, then reducing in CO2 emissions (eg through policies such as the Kyoto protocol) will lower global temperature.
– If shoe size -> literacy, changing shoe size will affect literacy ! Nonsense.
– If Hepatitis B vaccination -> autism, then reducing vaccination rates will lower the incidence of autism.
X Y
If the true relationship between X and Y is described by ….
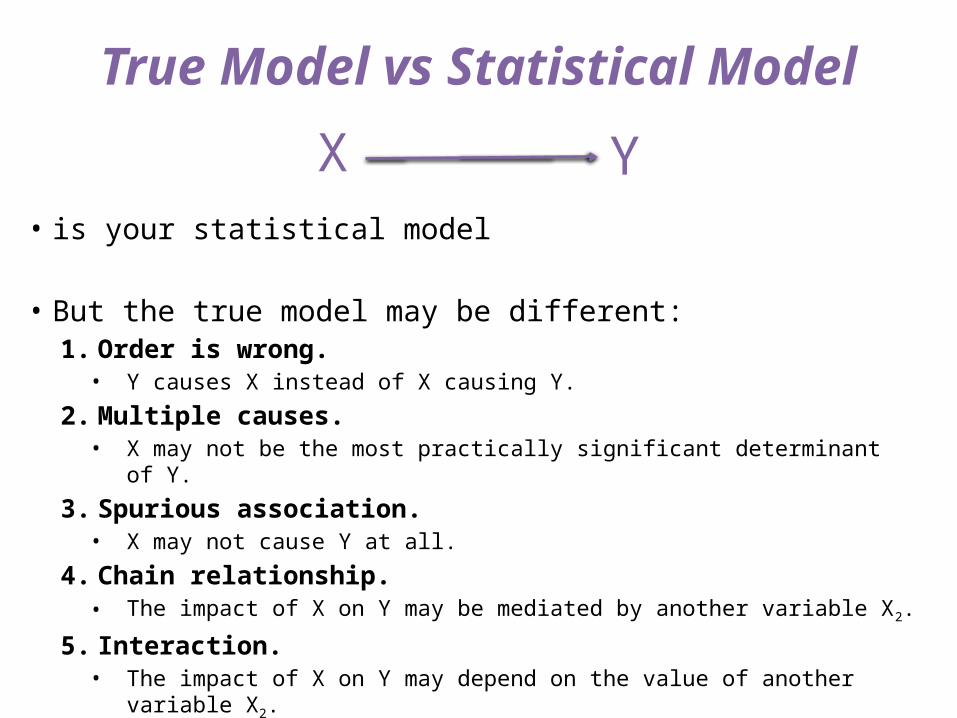
True Model vs Statistical Model
• is your statistical model
• But the true model may be different:1. Order is wrong.
• Y causes X instead of X causing Y.
2. Multiple causes.• X may not be the most practically significant determinant of Y.
3. Spurious association.• X may not cause Y at all.
4. Chain relationship.• The impact of X on Y may be mediated by another variable X2.
5. Interaction.• The impact of X on Y may depend on the value of another variable X2.
X Y
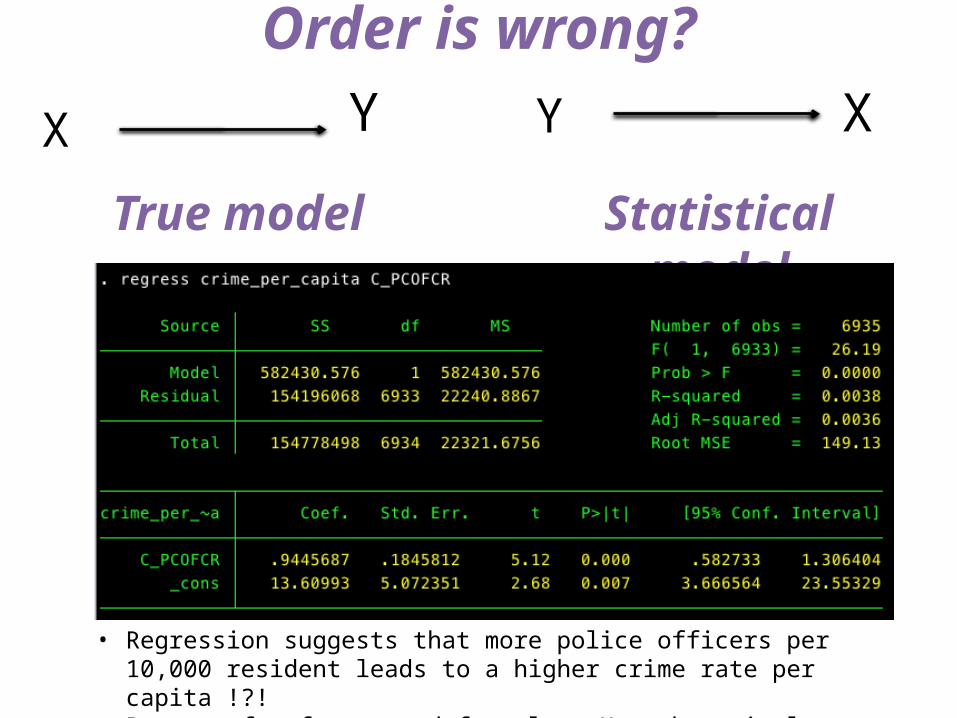
Order is wrong?
X Y Y X
True model Statistical model
• Regression suggests that more police officers per 10,000 resident leads to a higher crime rate per capita !?!
• Beware of software and formulas. Use them wisely.

Outline
1. Correlation and Causation
2. Multiple CausesPartly Spurious AssociationSpurious AssociationChain Relationship
3. Interaction
Next time: Multivariate regression

Multiple Causes• Acknowledge that crime (Y) may be caused by
a series of factors:
X1
X2
X3
XK
…Y
True
Mod
el
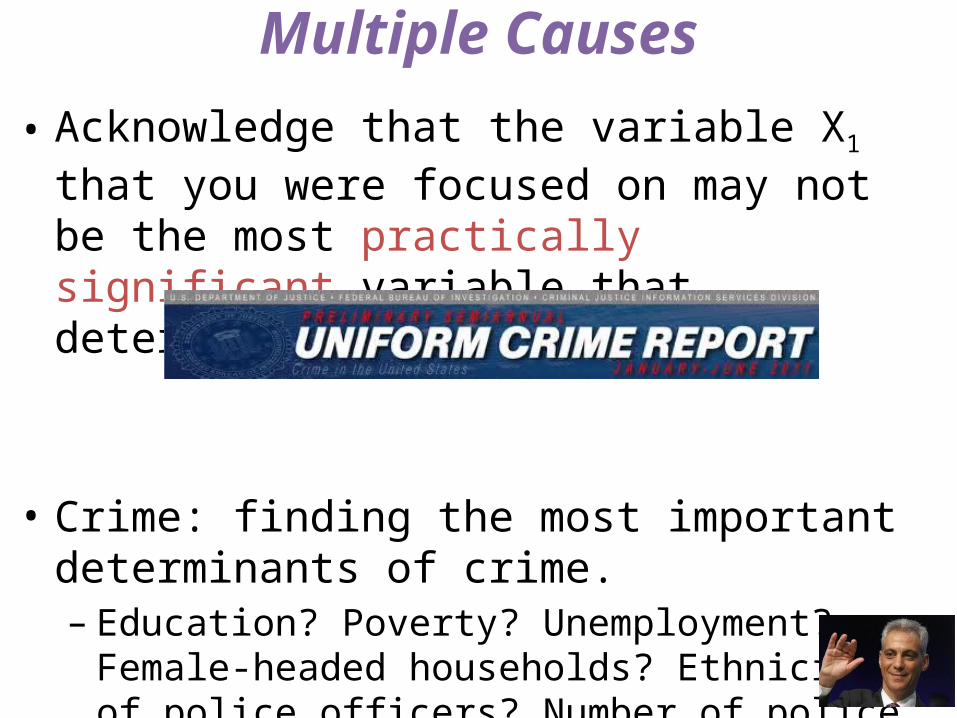
Multiple Causes• Acknowledge that the variable X1 that you were
focused on may not be the most practically significant variable that determines Y.
• Crime: finding the most important determinants of crime.– Education? Poverty? Unemployment? Female-headed
households? Ethnicity of police officers? Number of police officers per 10,000 residents? Incarceration rate?

From Univariate to Multivariate
• Univariate regression: True model: y = a + b x1 + e
Statistical model: y = a + b x1 + e
with E(y|x1) = a + b x1.
And SD(y|x1) = SD(e) .
• Multivariate regression:True model: y = a + b1 x1+ b2 x2 + b3 x3 + e
Statistical model: y = a + b1 x1 + b2 x2 + b3 x3 + e
with E(y|x1,x2,x3) = a + b x1 + b2 x2 + b3 x3 .
And SD(y|x1,x2,x3) = SD(e) .
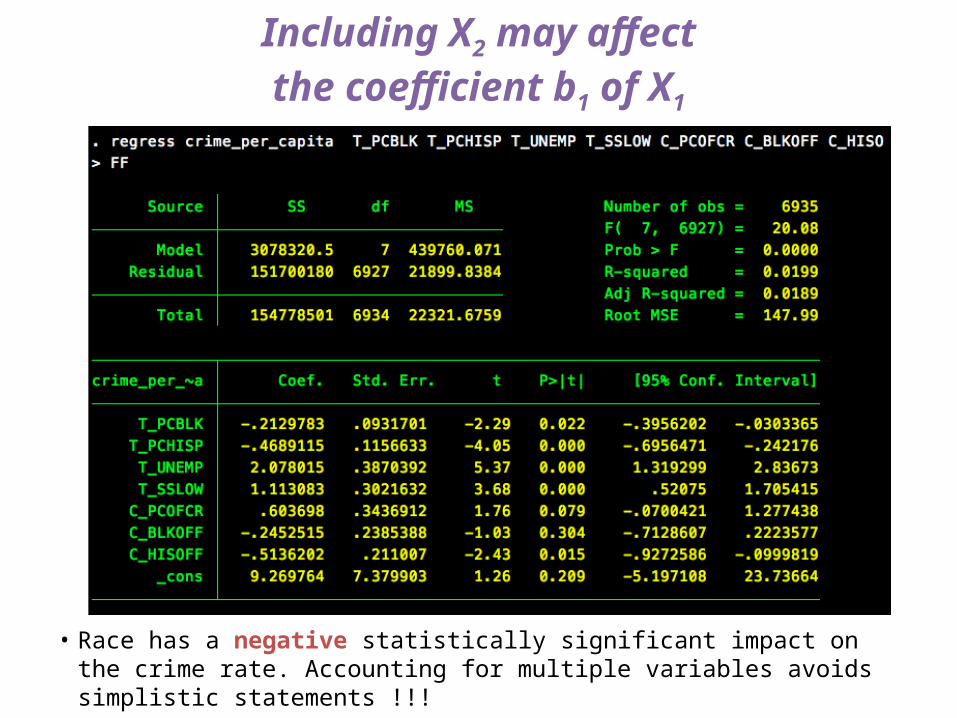
Including X2 may affectthe coefficient b1 of X1
• Race has a negative statistically significant impact on the crime rate. Accounting for multiple variables avoids simplistic statements !!!

Partly Spurious Associationbetween X1 and Y
• The statistical model does not include X2.
• When including X2 in the regression, the effect of X1 is lower in magnitude.
• X2 has both a direct and indirect effect on X1.
X1
X2
Y X1 Y
True model Statistical model

Spurious Association
• A statistically significant slope coefficient b does not mean that X1 causes Y.
• Another factor X2 may be causing both X1 and Y.
• When including X2 in the regression, the effect
X1
X2
Y X1 Y
True model Statistical model

Shoe size and Literacy
• Sample of N children from age 5 to age 16.• Literacy measured in the Early Childhood Longitudinal Study.• Including age in the regression will likely render the coefficient
of shoe size non significant.
Shoe size
Age
Literacy
True model Statistical model
Shoe size
Literacy

Correct approach
• Make the true model and the statistical model coincide.• Regress Y on both X1 and X2.• Include all determinants of crime in the regression.
X1
X2
Y X1 Y
True model Statistical model
X2

• Researchers had found that school funding is positively correlated (statistically significant and positive r and b) with student test scores….
• But when including measures of teacher quality, the relationship between the amount of money a school spends has no statistically significant impact on student test scores.
What makes a good school?
Teacher quality
Funding
Student test score
Funding
True model Statistical model
Student test score
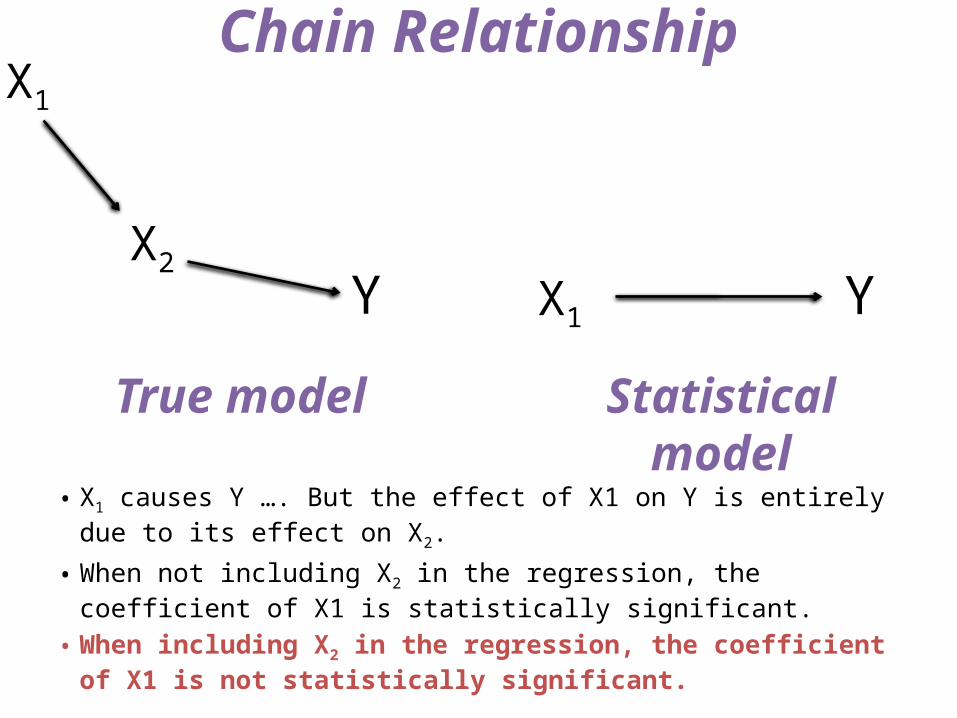
Chain Relationship
• X1 causes Y …. But the effect of X1 on Y is entirely due to its effect on X2.
• When not including X2 in the regression, the coefficient of X1 is statistically significant.
• When including X2 in the regression, the coefficient of X1 is not statistically significant.
X1
X2Y X1 Y
True model Statistical model

Outline
1. Correlation and Causation
2. Multiple CausesPartly Spurious AssociationSpurious AssociationChain Relationship
3. Interaction
Next time: Multivariate regression

Interaction
• X2 affects how X1 causes Y.• For instance, unemployment causes crime, but the impact
is much lower in neighborhoods that have a higher income.• When not accounting for X2, the coefficient of X1 measures
the average impact of X1 on Y.
X1
X2
Y X1 Y
True model Statistical model
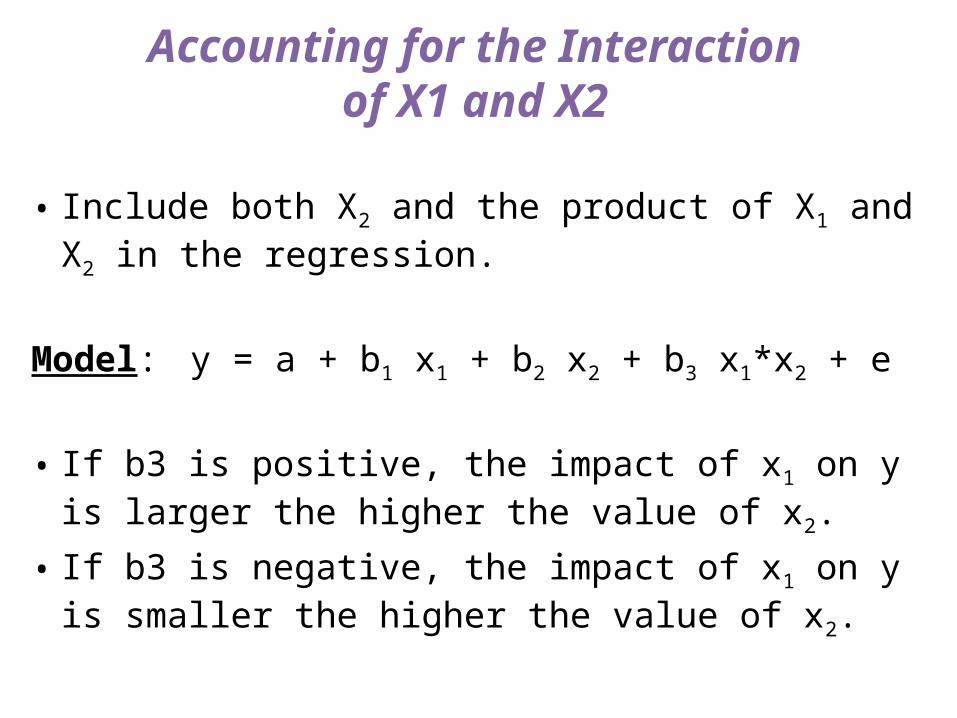
Accounting for the Interactionof X1 and X2
• Include both X2 and the product of X1 and X2 in the regression.
Model: y = a + b1 x1 + b2 x2 + b3 x1*x2 + e
• If b3 is positive, the impact of x1 on y is larger the higher the value of x2.
• If b3 is negative, the impact of x1 on y is smaller the higher the value of x2.

• Here, b3 is negative !• T_HINC75: percentage in neighborhood with high income.
Accounting for the Interactionof unemployment and income
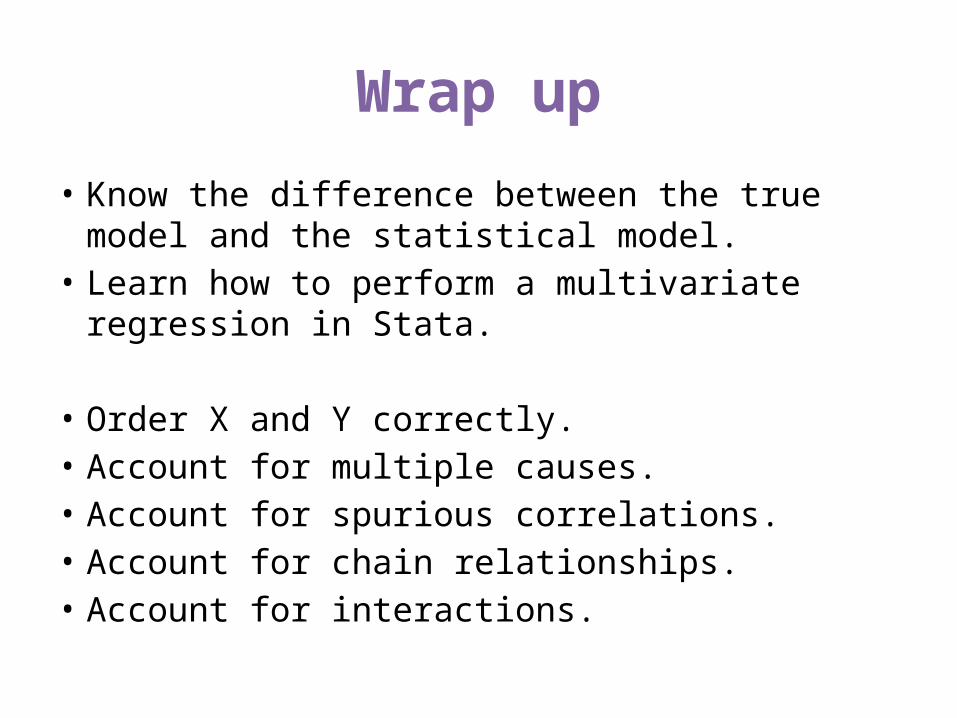
Wrap up
• Know the difference between the true model and the statistical model.
• Learn how to perform a multivariate regression in Stata.
• Order X and Y correctly.• Account for multiple causes.• Account for spurious correlations.• Account for chain relationships.• Account for interactions.

Coming up:
• Schedule for next week:• Chapter on “Association and Causality”, and “Multivariate Regression”.• Last online quiz sent last night, due Sunday 9am.• Make sure you come to sessions and recitations.
Sunday Monday Tuesday Wednesday Thursday
Recitation Evening session 7.30pmWest Administration 002
Usual class12.45pmUsual room
Evening session7.30pmWest Administration 001
Usual class12.45pmUsual room
Related Documents