LEVEL 4 STATISTICS AND PROBABILITY

Welcome message from author
This document is posted to help you gain knowledge. Please leave a comment to let me know what you think about it! Share it to your friends and learn new things together.
Transcript
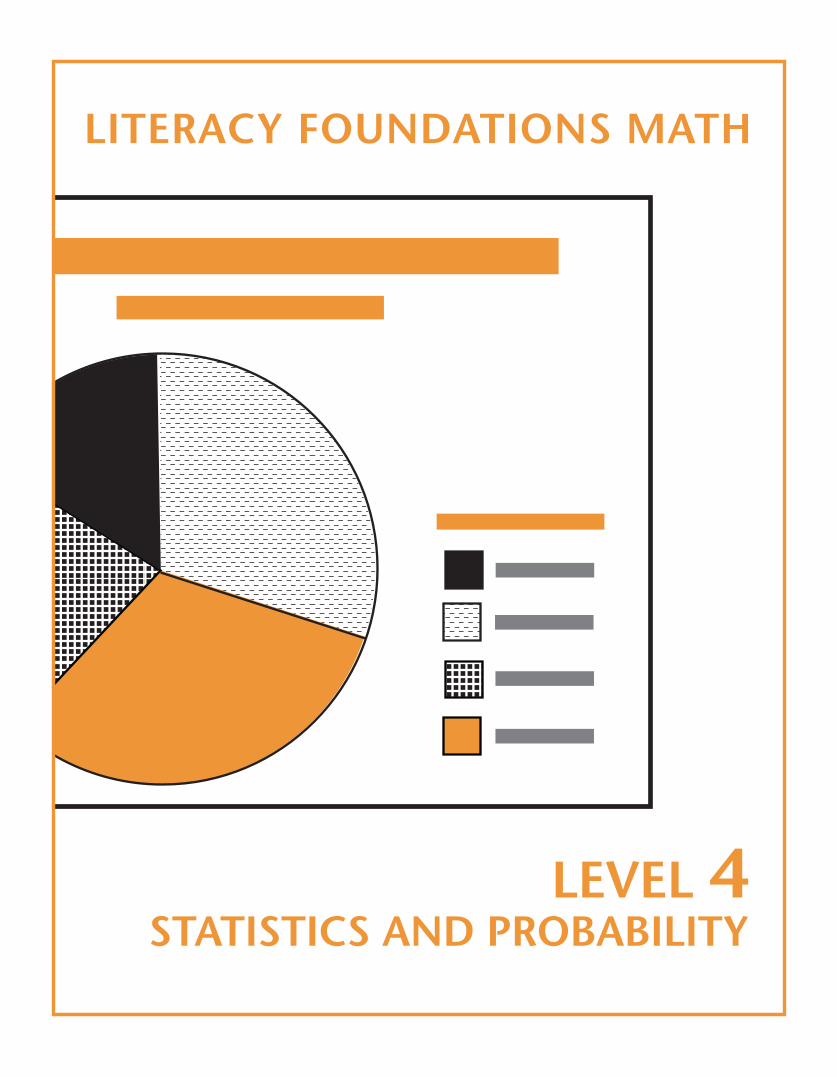
LEVEL 4STATISTICS AND PROBABILITY
ii | LiTERACY FOUNDATiONS MATH: LEVEL 4
To the StudentThis resource covers topics from the British Columbia Ministry of Education’s Literacy Foundations Math Level 4. You may find this resource useful if you’re a Literacy Foundations Math student, or a K–12 student in grades 7 – 9.
We have provided learning material, exercises, and answers for the exercises, which are located at the back of each set of related lessons. We hope you find it helpful.
Literacy Foundations Math Prescribed Learning OutcomesThe Literacy Foundations Math Prescribed Learning Outcomes (PLOs) are grouped into four areas: Number (A), Patterns and Relations (B), Shape and Space (C), and Statistics and Probability (D). For a complete list of the PLOs in Level 5, search for Literacy Foundations Math curriculum on the BC Ministry of Education’s website.
PLOs Represented in This ResourceThe PLOs represented in this Level 4 resource are as follows:
NumberA6, A7, A9, A11 – A18
Patterns and RelationsAll topics, B1 – B3
Shape and SpaceC1 – C5, C7*C3 topics are represented with the exception of angle construction
Statistics and ProbabilityD2
PLOs Not Represented in This ResourceThe PLOs for which no material is included in this resource are as follows:
NumberThere is no material for A1 – A5, read and write numbers, place value, and patterns for multiplying by 10, etc.; A8, compare decimal numbers; nor A10, patterns for multiplying and dividing by 1/10, etc.
Shape and SpaceThere is no material for C3, construct angles.
Statistics and ProbabilityThere is no material for D1, graph data to solve problems.
Acknowledgements and CopyrightProject Manager: Christina TeskeyWriter: Angela VollProduction Technician: Beverly CarstensenCover Design: Christine Ramkeesoon
This work is licensed under a Creative Commons Attribution 4.0 International License https://creativecommons.org/licenses/by/4.0/
For questions regarding this licensing, please contact [email protected] New, October 2015
LiTERACY FOUNDATiONS MATH: LEVEL 4 | iii
Table of Contents
Lesson 1: Circle Graphs . . . . . . . . . . . . . . . . . . . . . . . . . . . . . . . . . . . . . .1
Reading Circle Graphs . . . . . . . . . . . . . . . . . . . . . . . . . . . . . . . . . . . .1
Why Do We Use Circle Graphs? . . . . . . . . . . . . . . . . . . . . . . . . . . . . .2
Interpreting Circle Graphs . . . . . . . . . . . . . . . . . . . . . . . . . . . . . . . .12
Creating Circle Graphs . . . . . . . . . . . . . . . . . . . . . . . . . . . . . . . . . . .18
Answer Key . . . . . . . . . . . . . . . . . . . . . . . . . . . . . . . . . . . . . . . . . . . . . . .25
Circle Template for Exercise 1.4 . . . . . . . . . . . . . . . . . . . . . . . . . . . . . . .29

iV | LiTERACY FOUNDATiONS MATH: LEVEL 4
LiTERACY FOUNDATiONS MATH: LEVEL 4 | 1
LESSON 1 CiRCLE GRAPHS STATiSTiCS AND PRObAbiLiTY
Lesson 1
Circle Graphs
Learning Outcomesby the end of this lesson you will be better able to:
• identify characteristics of circle graphs. • read and interpret circle graphs. • create your own circle graphs. • solve problems that involve interpreting and creating circle graphs.
Reading Circle GraphsData—we collect it, interpret it, and summarize the results. You’ve probably seen data presented in several ways. For example, you may have made bar graphs, or t-tables in other math lessons, in other courses, or even just to help you organize information in your day.
This lesson will focus on how to read, understand, and interpret circle graphs. By the end of this lesson, you will be able to answer questions based on the information presented in this kind of graph.
As you come across circle graphs in newspapers, websites, television shows and other media, this lesson will help you to the understand the information being presented to you in a more meaningful way.
2 | LiTERACY FOUNDATiONS MATH: LEVEL 4
STATiSTiCS AND PRObAbiLiTY LESSON 1 CiRCLE GRAPHS
Why Do We Use Circle Graphs?
1. Circle Graphs Are Easy to Read and Understand
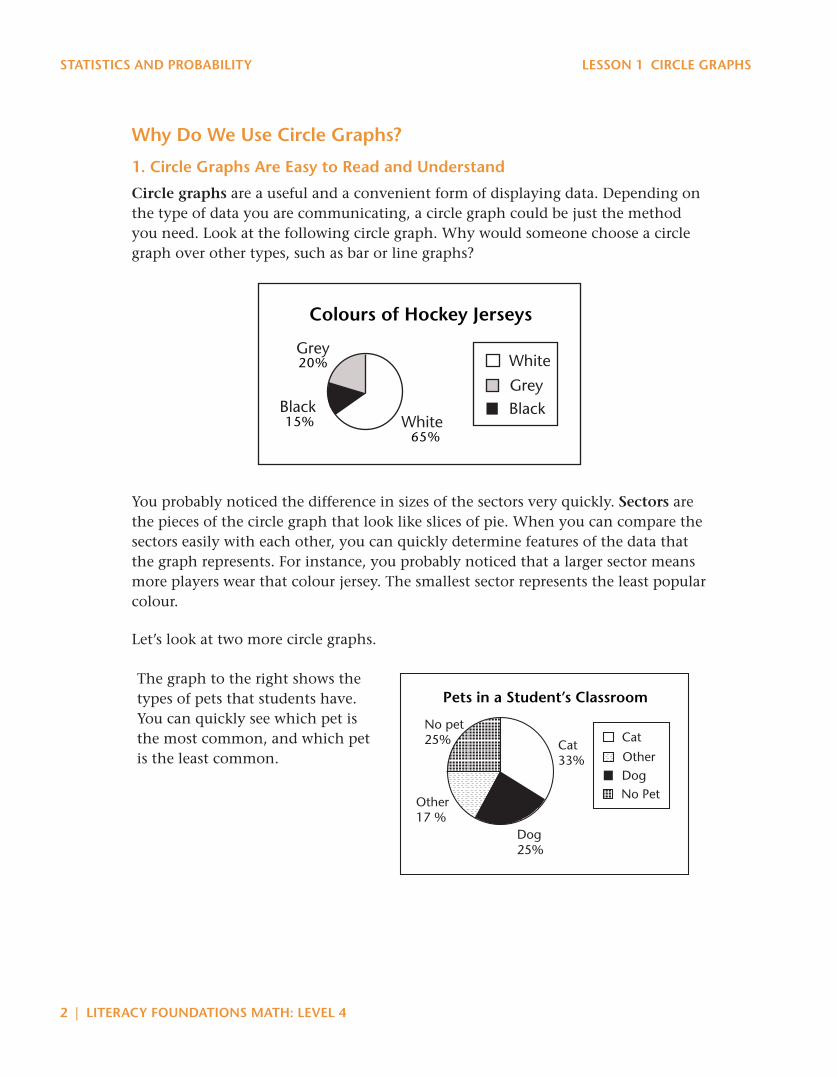
Circle graphs are a useful and a convenient form of displaying data. Depending on the type of data you are communicating, a circle graph could be just the method you need. Look at the following circle graph. Why would someone choose a circle graph over other types, such as bar or line graphs?
65%15%
20%
Colours of Hockey Jerseys
White
Black
Grey
WhiteBlackGrey
You probably noticed the difference in sizes of the sectors very quickly. Sectors are the pieces of the circle graph that look like slices of pie. When you can compare the sectors easily with each other, you can quickly determine features of the data that the graph represents. For instance, you probably noticed that a larger sector means more players wear that colour jersey. The smallest sector represents the least popular colour.
Let’s look at two more circle graphs.
The graph to the right shows the types of pets that students have. You can quickly see which pet is the most common, and which pet is the least common.
Cat
Dog25%
Other17 %
DogOther
No Pet
Cat33%
No pet25%
Pets in a Student’s Classroom
LiTERACY FOUNDATiONS MATH: LEVEL 4 | 3
LESSON 1 CiRCLE GRAPHS STATiSTiCS AND PRObAbiLiTY
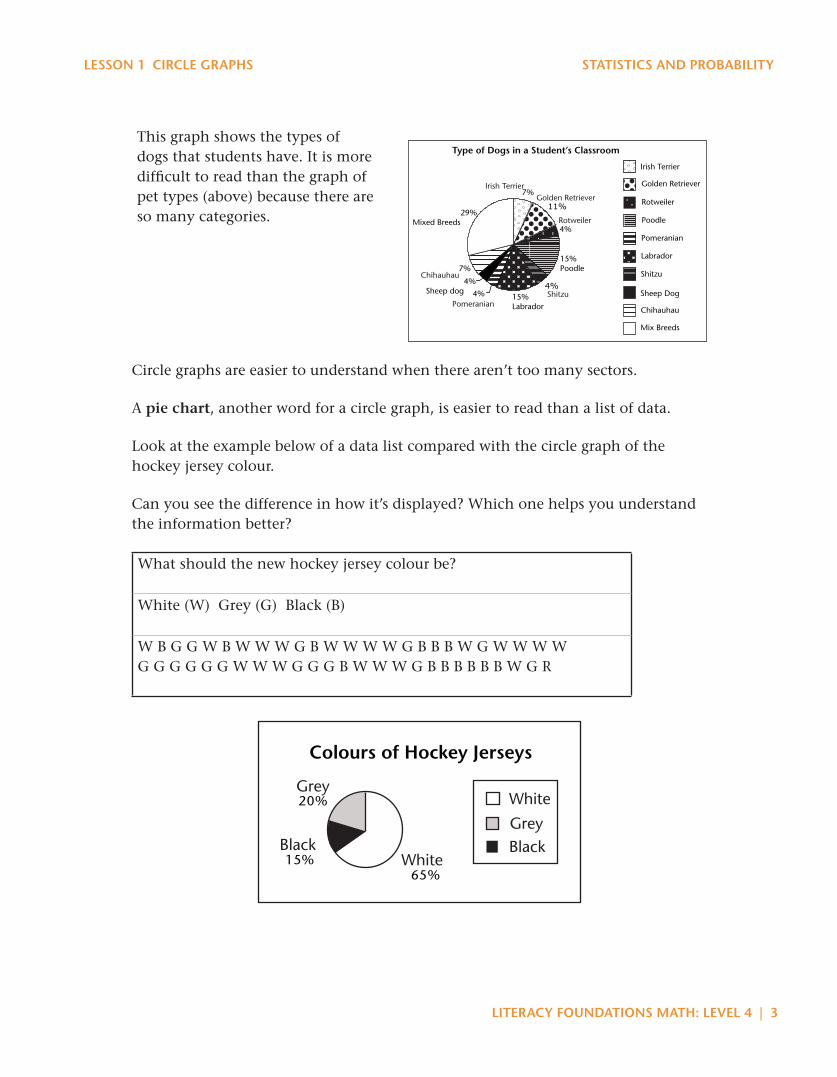
This graph shows the types of dogs that students have. It is more difficult to read than the graph of pet types (above) because there are so many categories.
Type of Dogs in a Student’s Classroom
7%
11%
4%
15%Poodle
4%15%Labrador
4%
4%Sheep dog
7%
29%Mixed Breeds
Irish Terrier
Golden Retriever
Rotweiler
Poodle
Pomeranian
Labrador
Shitzu
Sheep Dog
Chihauhau
Mix Breeds
Golden Retriever
Pomeranian
Chihauhau
Irish Terrier
Rotweiler
Shitzu
Circle graphs are easier to understand when there aren’t too many sectors.
A pie chart, another word for a circle graph, is easier to read than a list of data.
Look at the example below of a data list compared with the circle graph of the hockey jersey colour.
Can you see the difference in how it’s displayed? Which one helps you understand the information better?
What should the new hockey jersey colour be?
White (W) Grey (G) Black (B)
W B G G W B W W W G B W W W W G B B B W G W W W W G G G G G G W W W G G G B W W W G B B B B B B W G R
65%15%
20%
Colours of Hockey Jerseys
White
Black
Grey
WhiteBlackGrey
4 | LiTERACY FOUNDATiONS MATH: LEVEL 4
STATiSTiCS AND PRObAbiLiTY LESSON 1 CiRCLE GRAPHS
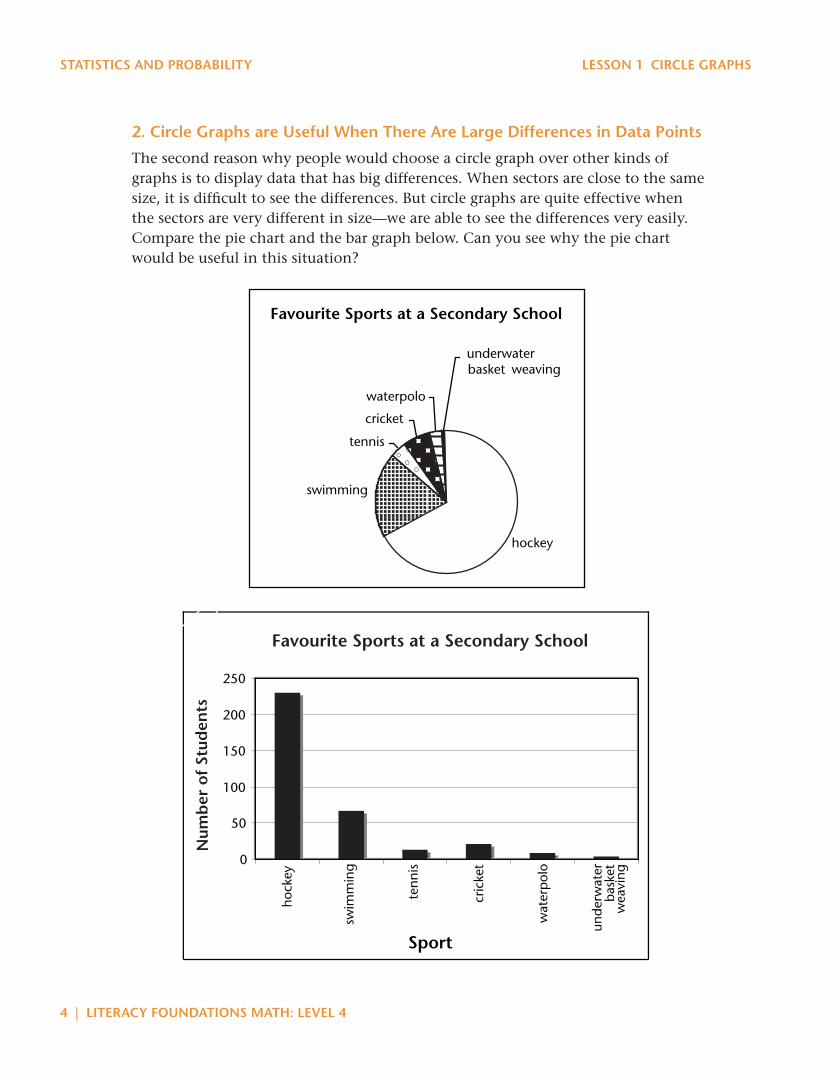
2. Circle Graphs are Useful When There Are Large Differences in Data Points
The second reason why people would choose a circle graph over other kinds of graphs is to display data that has big differences. When sectors are close to the same size, it is difficult to see the differences. But circle graphs are quite effective when the sectors are very different in size—we are able to see the differences very easily. Compare the pie chart and the bar graph below. Can you see why the pie chart would be useful in this situation?
Favourite Sports at a Secondary School
hockey
swimming
tennis
cricket
waterpolo
underwater basket weaving
hock
ey
swim
min
g
tenn
is
cric
ket
wat
erp
olo
unde
rwat
er
bask
et
wea
ving
0
50
100
150
200
250
Sport
Num
ber
of
Stud
ents
Favourite Sports at a Secondary School
LiTERACY FOUNDATiONS MATH: LEVEL 4 | 5
LESSON 1 CiRCLE GRAPHS STATiSTiCS AND PRObAbiLiTY
Before we go any further, let’s review a few important details. Reminding ourselves about concepts we have already learned will help us continue working with circle graphs.
What Characteristics Do Circle Graphs Have?
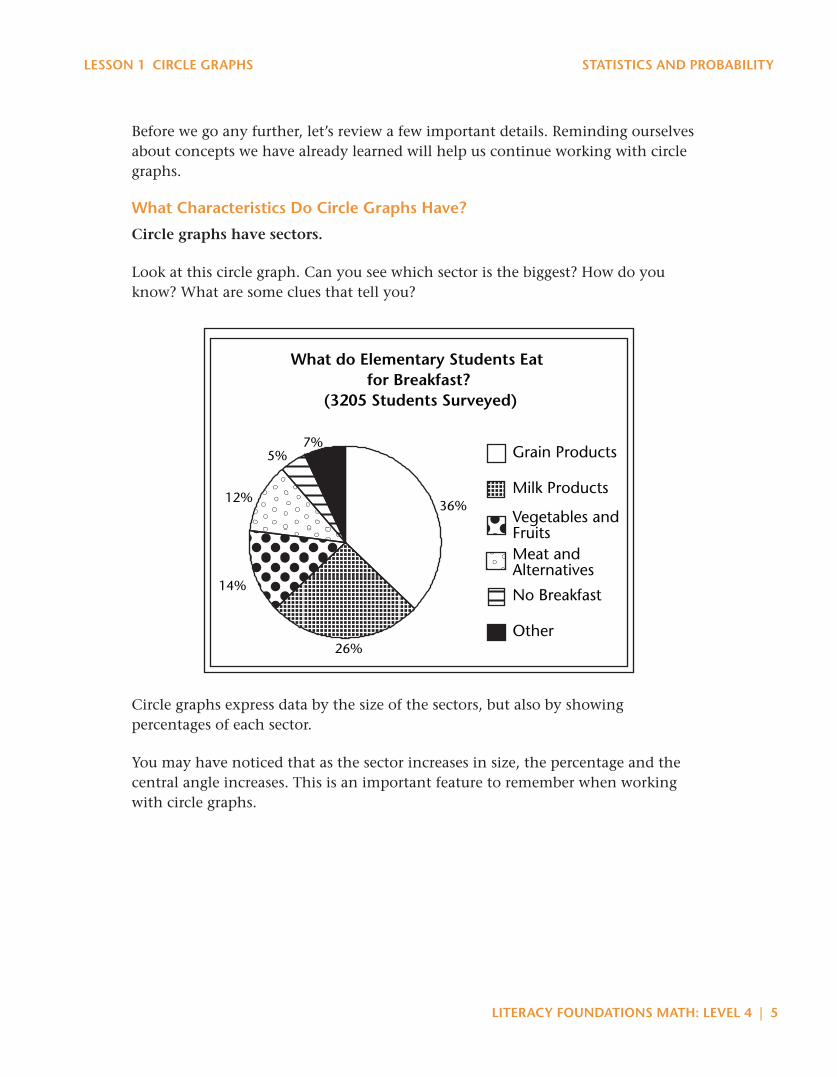
Circle graphs have sectors.
Look at this circle graph. Can you see which sector is the biggest? How do you know? What are some clues that tell you?
What do Elementary Students Eat for Breakfast?
36%
26%
14%
12%
5%7%
Grain Products
Milk Products
Vegetables andFruitsMeat andAlternatives
No Breakfast
Other
Source: Statistics Canada, Census at School, 2006/2007.
(3205 Students Surveyed)
Circle graphs express data by the size of the sectors, but also by showing percentages of each sector.
You may have noticed that as the sector increases in size, the percentage and the central angle increases. This is an important feature to remember when working with circle graphs.
6 | LiTERACY FOUNDATiONS MATH: LEVEL 4
STATiSTiCS AND PRObAbiLiTY LESSON 1 CiRCLE GRAPHS
Circle graphs have percentages.
Percentages compare a portion to a whole, or 100%. Add up all the percentages in the graphs above. What do you notice?
Did you know that in all circle graphs the percentages add up to 100%? You have learned a lot about percentages and fractions in other lessons. Can you see how what you know about percentages and fractions can help you out now?
Circle graphs have central angles.
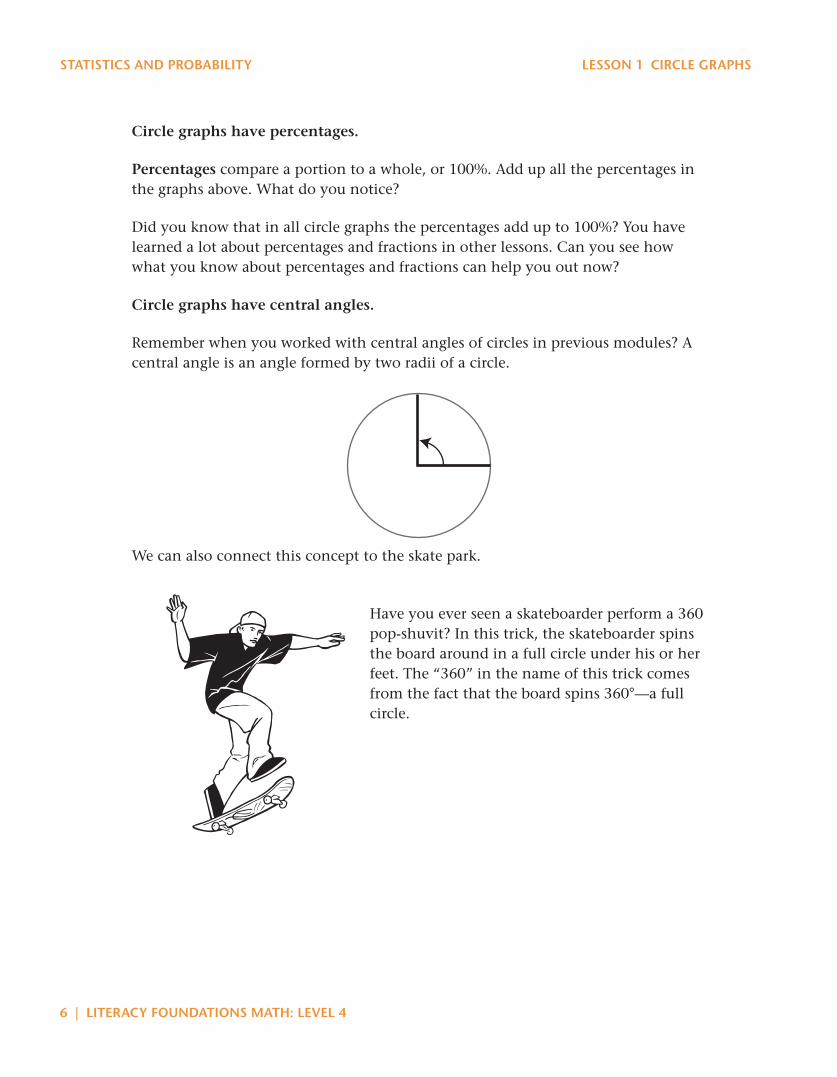
Remember when you worked with central angles of circles in previous modules? A central angle is an angle formed by two radii of a circle.
We can also connect this concept to the skate park.
Have you ever seen a skateboarder perform a 360 pop-shuvit? In this trick, the skateboarder spins the board around in a full circle under his or her feet. The “360” in the name of this trick comes from the fact that the board spins 360°—a full circle.
LiTERACY FOUNDATiONS MATH: LEVEL 4 | 7
LESSON 1 CiRCLE GRAPHS STATiSTiCS AND PRObAbiLiTY
Think about this when you are working with circles—the central angle of a circle is always 360°. However the sectors are broken up, all the angles will always add up to 360°.
In a circle graph:
• all of the angles add up to 360°
• all of the percentages add up to 100%
Circle graphs have features similar to other graphs.
Although there are characteristics of circle graphs that are unique, there are also parts of circle graphs that are similar to other graphs: basic features that we can look at to give us information to help us read and understand the data. Circle graphs have:
• a title that tells us what the graph is about
• a legend that helps us connect the labels and sectors
8 | LiTERACY FOUNDATiONS MATH: LEVEL 4
STATiSTiCS AND PRObAbiLiTY LESSON 1 CiRCLE GRAPHS
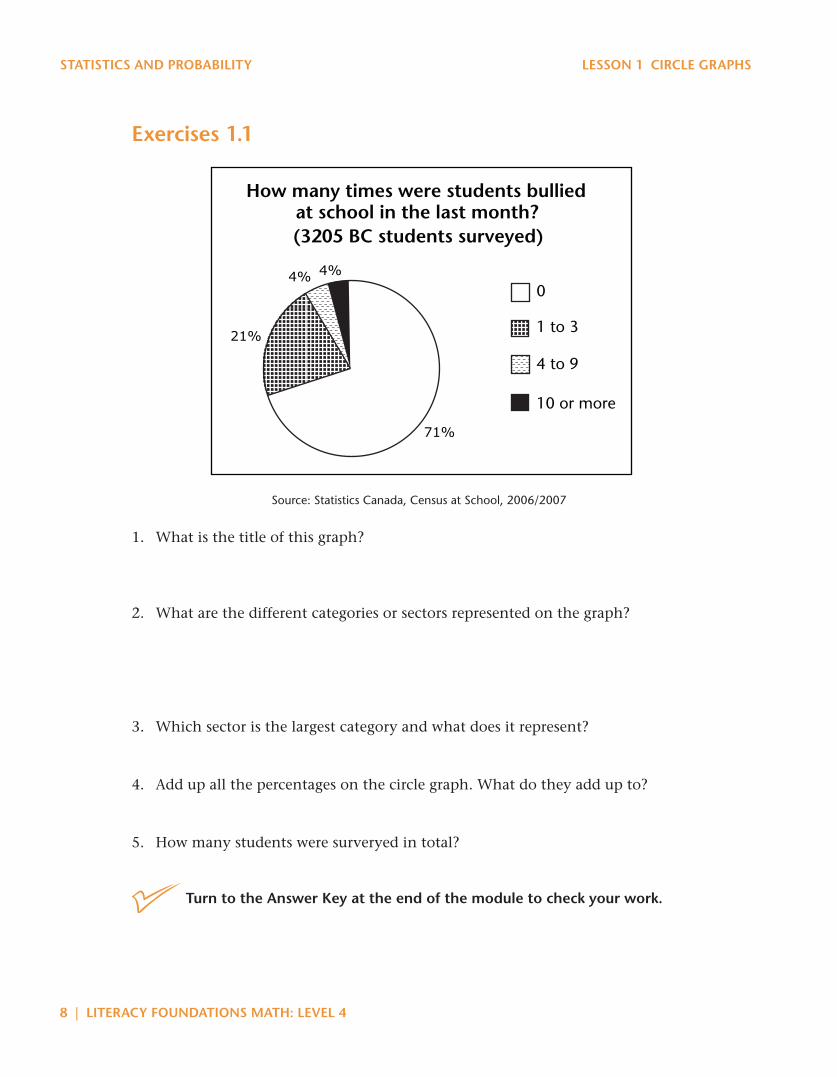
Exercises 1.1
How many times were students bullied at school in the last month? (3205 BC students surveyed)
71%
21%
4% 4%0
1 to 3
4 to 9
10 or more
Source: Statistics Canada, Census at School, 2006/2007
1. What is the title of this graph?
2. What are the different categories or sectors represented on the graph?
3. Which sector is the largest category and what does it represent?
4. Add up all the percentages on the circle graph. What do they add up to?
5. How many students were surveryed in total?
Turn to the Answer Key at the end of the module to check your work.
LiTERACY FOUNDATiONS MATH: LEVEL 4 | 9
LESSON 1 CiRCLE GRAPHS STATiSTiCS AND PRObAbiLiTY
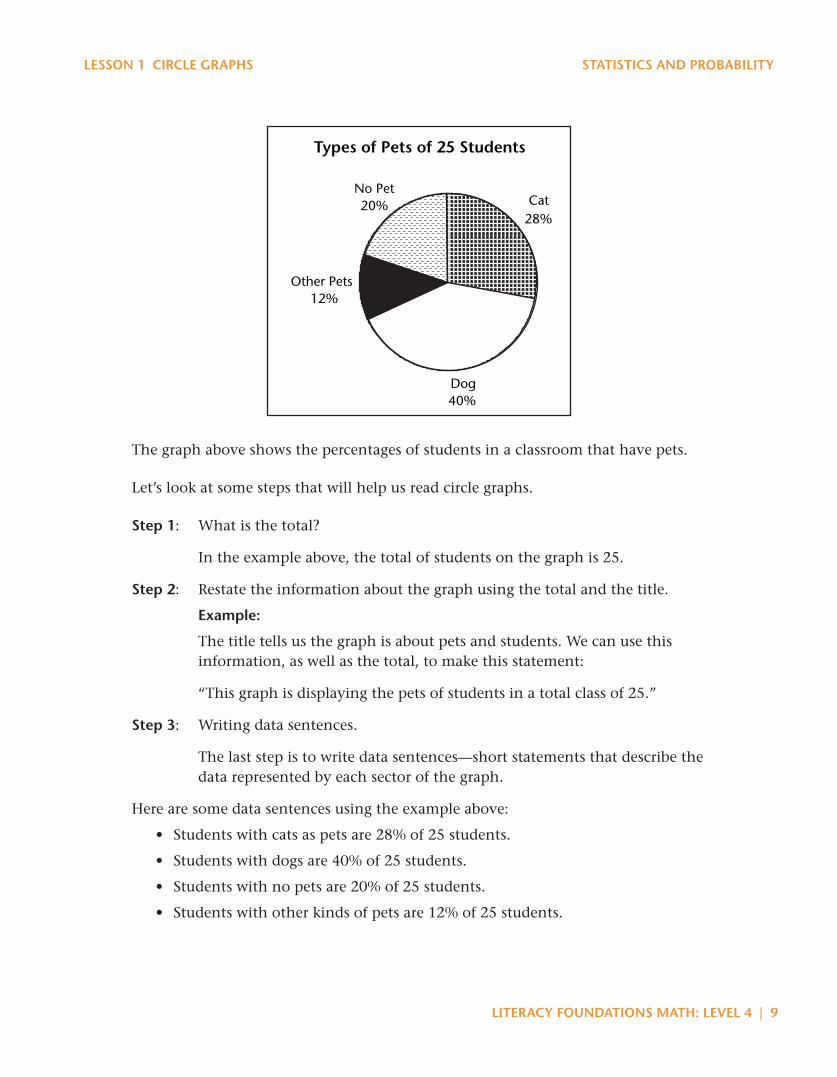
Types of Pets of 25 Students
Cat28%
Dog40%
Other Pets12%
No Pet20%
The graph above shows the percentages of students in a classroom that have pets.
Let’s look at some steps that will help us read circle graphs.
Step 1: What is the total?
In the example above, the total of students on the graph is 25.
Step 2: Restate the information about the graph using the total and the title.
Example:
The title tells us the graph is about pets and students. We can use this information, as well as the total, to make this statement:
“This graph is displaying the pets of students in a total class of 25.”
Step 3: Writing data sentences.
The last step is to write data sentences—short statements that describe the data represented by each sector of the graph.
Here are some data sentences using the example above:
• Students with cats as pets are 28% of 25 students.
• Students with dogs are 40% of 25 students.
• Students with no pets are 20% of 25 students.
• Students with other kinds of pets are 12% of 25 students.

10 | LiTERACY FOUNDATiONS MATH: LEVEL 4
STATiSTiCS AND PRObAbiLiTY LESSON 1 CiRCLE GRAPHS
Exercises 1.21. Look at the circle graph below and then follow the steps to help you read and
understand the data presented.
What do Elementary Students Eat for Breakfast?
36%
26%
14%
12%
5%7%
Grain Products
Milk Products
Vegetables andFruitsMeat andAlternatives
No Breakfast
Other
Source: Statistics Canada, Census at School, 2006/2007.
(3205 Students Surveyed)
Step 1: What is the total?
Step 2: Restate the information using information from the title.
Step 3: Write the data sentences for each sector.
LiTERACY FOUNDATiONS MATH: LEVEL 4 | 11
LESSON 1 CiRCLE GRAPHS STATiSTiCS AND PRObAbiLiTY
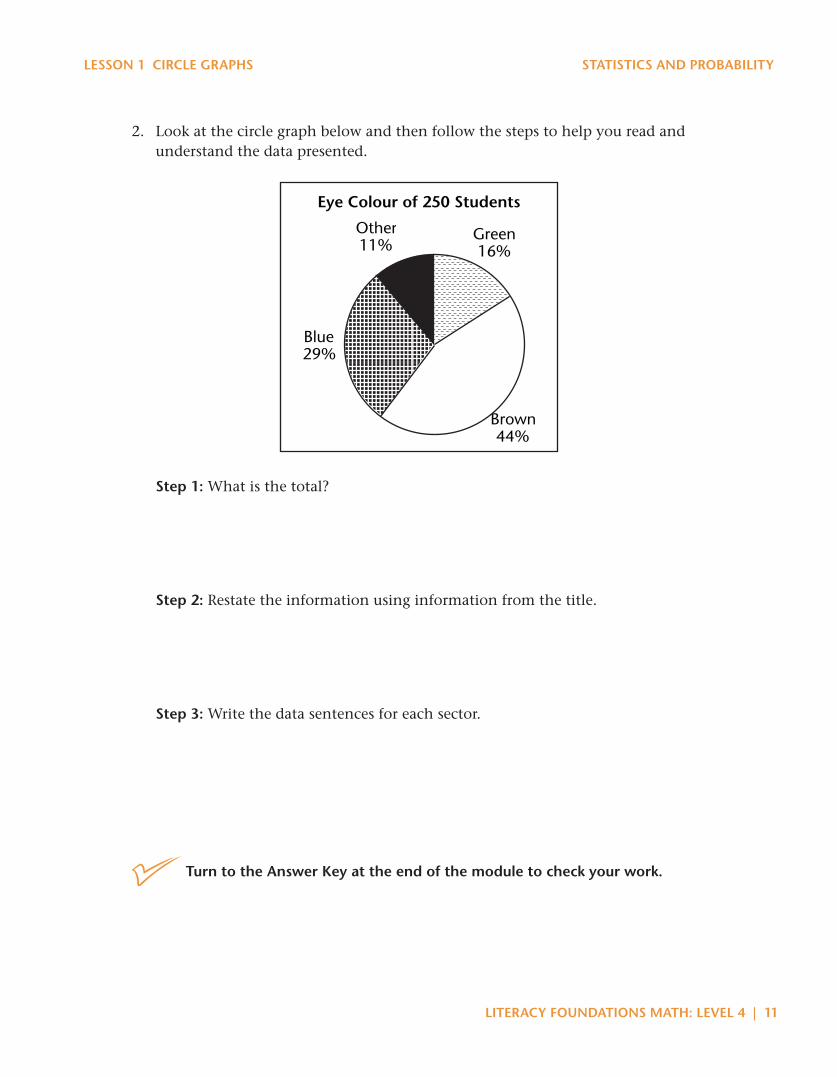
2. Look at the circle graph below and then follow the steps to help you read and understand the data presented.
Eye Colour of 250 Students
Green16%
Brown44%
Blue29%
Other11%
Step 1: What is the total?
Step 2: Restate the information using information from the title.
Step 3: Write the data sentences for each sector.
Turn to the Answer Key at the end of the module to check your work.
12 | LiTERACY FOUNDATiONS MATH: LEVEL 4
STATiSTiCS AND PRObAbiLiTY LESSON 1 CiRCLE GRAPHS
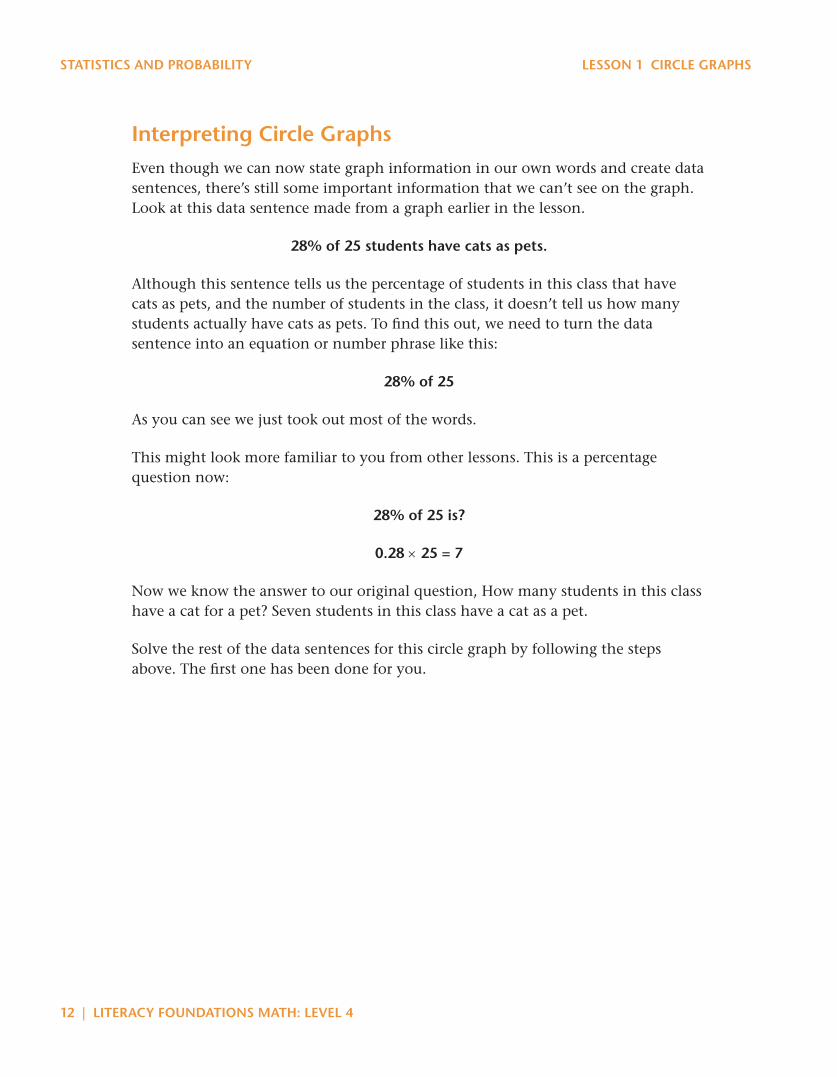
interpreting Circle GraphsEven though we can now state graph information in our own words and create data sentences, there’s still some important information that we can’t see on the graph. Look at this data sentence made from a graph earlier in the lesson.
28% of 25 students have cats as pets.
Although this sentence tells us the percentage of students in this class that have cats as pets, and the number of students in the class, it doesn’t tell us how many students actually have cats as pets. To find this out, we need to turn the data sentence into an equation or number phrase like this:
28% of 25
As you can see we just took out most of the words.
This might look more familiar to you from other lessons. This is a percentage question now:
28% of 25 is?
0.28 × 25 = 7
Now we know the answer to our original question, How many students in this class have a cat for a pet? Seven students in this class have a cat as a pet.
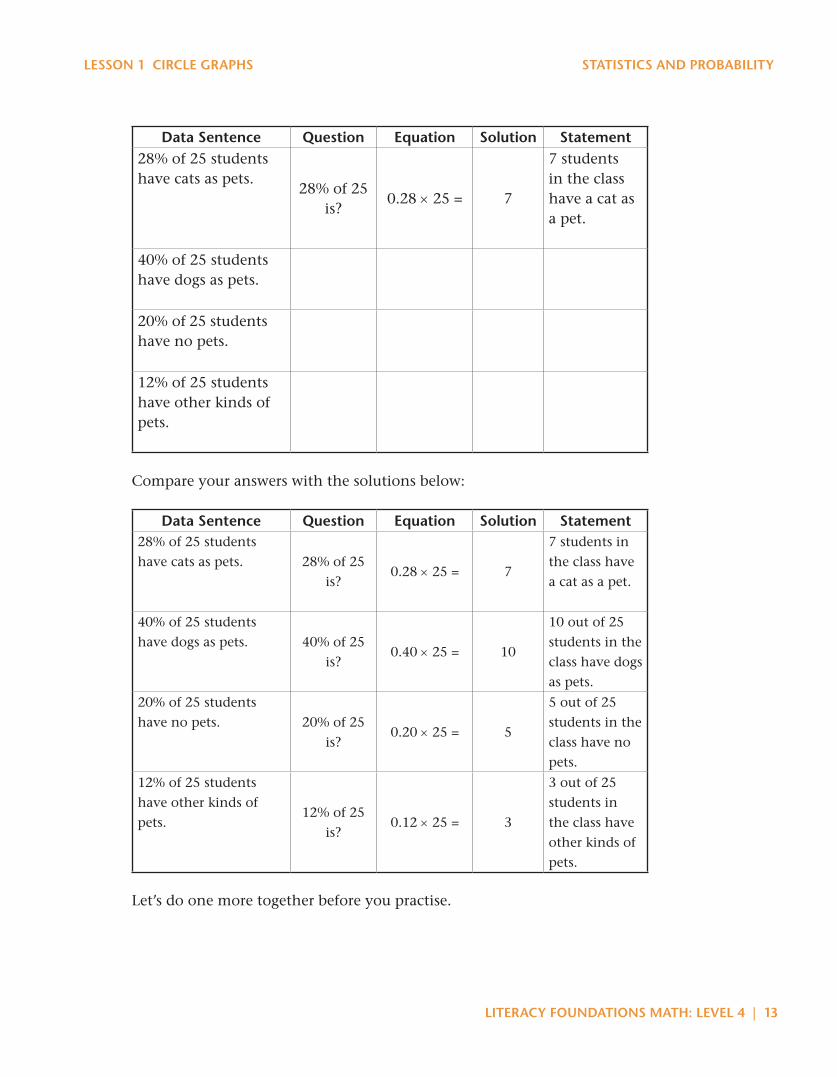
Solve the rest of the data sentences for this circle graph by following the steps above. The first one has been done for you.
LiTERACY FOUNDATiONS MATH: LEVEL 4 | 13
LESSON 1 CiRCLE GRAPHS STATiSTiCS AND PRObAbiLiTY
Data Sentence Question Equation Solution Statement28% of 25 students have cats as pets.
28% of 25 is?
0.28 × 25 = 7
7 students in the class have a cat as a pet.
40% of 25 students have dogs as pets.
20% of 25 students have no pets.
12% of 25 students have other kinds of pets.
Compare your answers with the solutions below:
Data Sentence Question Equation Solution Statement28% of 25 students
have cats as pets. 28% of 25
is?0.28 × 25 = 7
7 students in
the class have
a cat as a pet.
40% of 25 students
have dogs as pets. 40% of 25
is?0.40 × 25 = 10
10 out of 25
students in the
class have dogs
as pets.
20% of 25 students
have no pets. 20% of 25
is?0.20 × 25 = 5
5 out of 25
students in the
class have no
pets.
12% of 25 students
have other kinds of
pets. 12% of 25
is?0.12 × 25 = 3
3 out of 25
students in
the class have
other kinds of
pets.
Let’s do one more together before you practise.
14 | LiTERACY FOUNDATiONS MATH: LEVEL 4
STATiSTiCS AND PRObAbiLiTY LESSON 1 CiRCLE GRAPHS
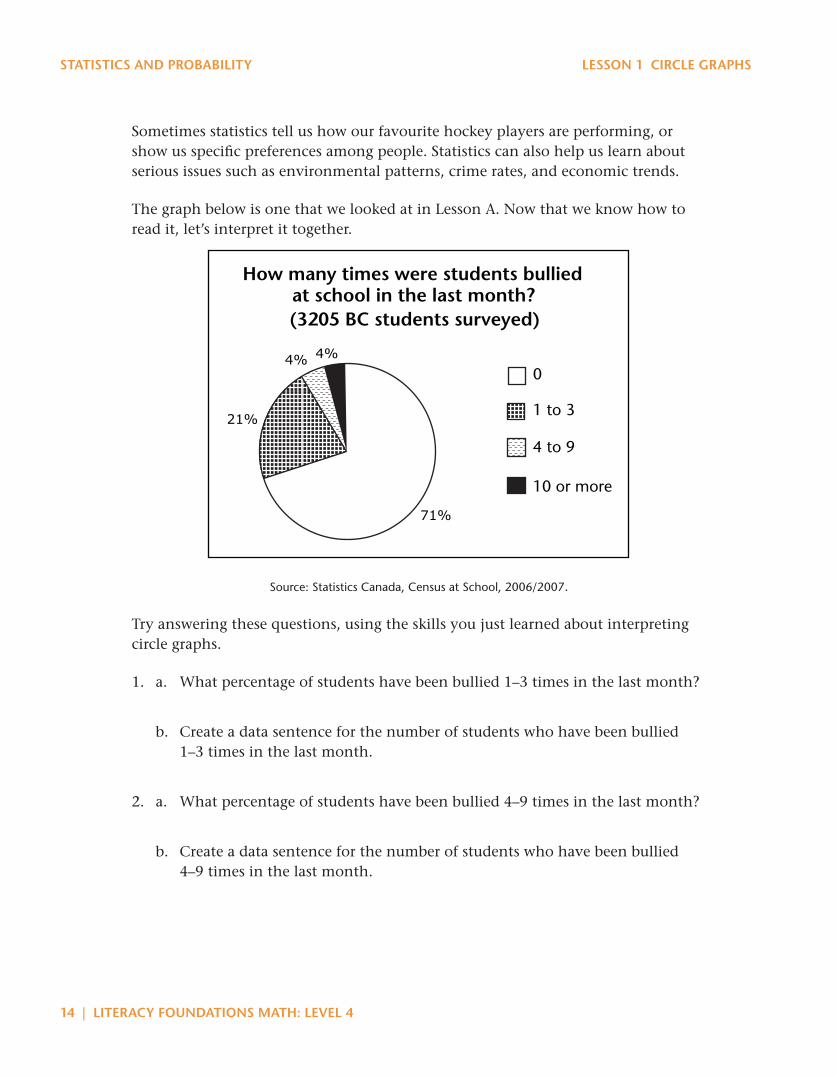
Sometimes statistics tell us how our favourite hockey players are performing, or show us specific preferences among people. Statistics can also help us learn about serious issues such as environmental patterns, crime rates, and economic trends.
The graph below is one that we looked at in Lesson A. Now that we know how to read it, let’s interpret it together.
How many times were students bullied at school in the last month? (3205 BC students surveyed)
71%
21%
4% 4%0
1 to 3
4 to 9
10 or more
Source: Statistics Canada, Census at School, 2006/2007.
Try answering these questions, using the skills you just learned about interpreting circle graphs.
1. a. What percentage of students have been bullied 1–3 times in the last month?
b. Create a data sentence for the number of students who have been bullied 1–3 times in the last month.
2. a. What percentage of students have been bullied 4–9 times in the last month?
b. Create a data sentence for the number of students who have been bullied 4–9 times in the last month.
LiTERACY FOUNDATiONS MATH: LEVEL 4 | 15
LESSON 1 CiRCLE GRAPHS STATiSTiCS AND PRObAbiLiTY
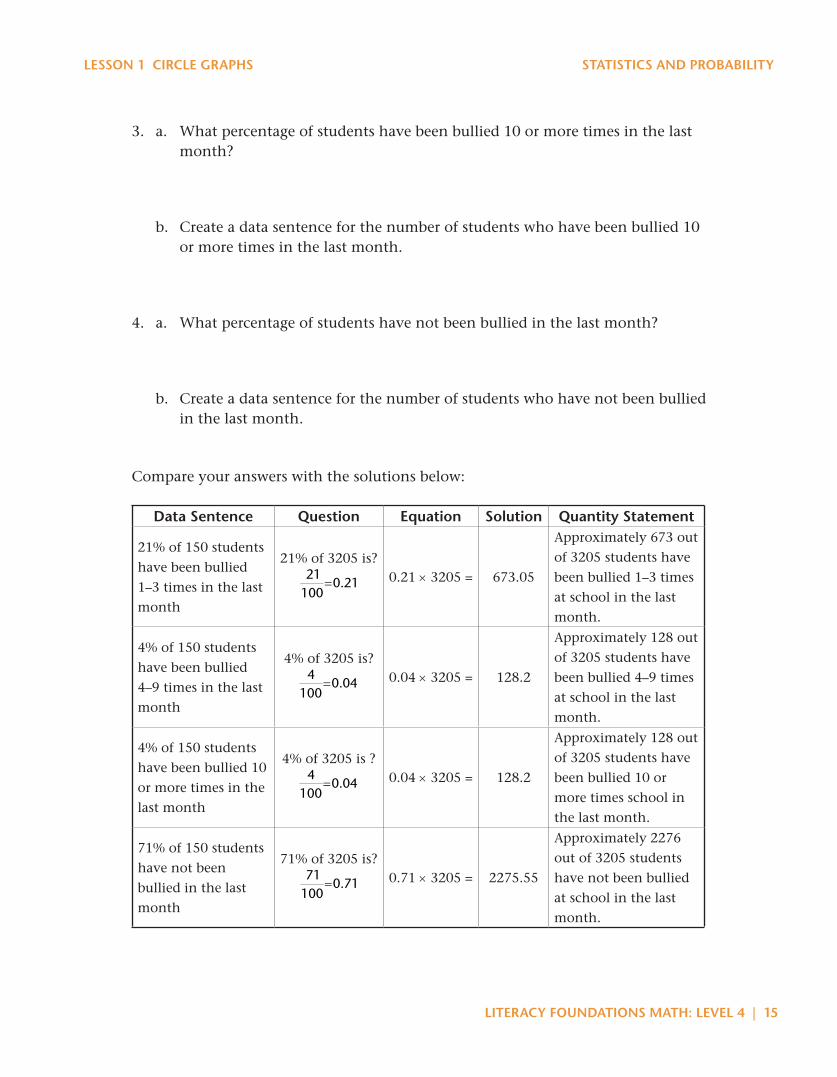
3. a. What percentage of students have been bullied 10 or more times in the last month?
b. Create a data sentence for the number of students who have been bullied 10 or more times in the last month.
4. a. What percentage of students have not been bullied in the last month?
b. Create a data sentence for the number of students who have not been bullied in the last month.
Compare your answers with the solutions below:
Data Sentence Question Equation Solution Quantity Statement
21% of 150 students
have been bullied
1–3 times in the last
month
21% of 3205 is?
21
100=0.21 0.21 × 3205 = 673.05
Approximately 673 out
of 3205 students have
been bullied 1–3 times
at school in the last
month.
4% of 150 students
have been bullied
4–9 times in the last
month
4% of 3205 is?
4
100=0.04 0.04 × 3205 = 128.2
Approximately 128 out
of 3205 students have
been bullied 4–9 times
at school in the last
month.
4% of 150 students
have been bullied 10
or more times in the
last month
4% of 3205 is ?
4
100=0.04 0.04 × 3205 = 128.2
Approximately 128 out
of 3205 students have
been bullied 10 or
more times school in
the last month.
71% of 150 students
have not been
bullied in the last
month
71% of 3205 is?
71
100=0.71 0.71 × 3205 = 2275.55
Approximately 2276
out of 3205 students
have not been bullied
at school in the last
month.
16 | LiTERACY FOUNDATiONS MATH: LEVEL 4
STATiSTiCS AND PRObAbiLiTY LESSON 1 CiRCLE GRAPHS
Interpreting the data is more than just reading numbers. Serious issues deserve careful examination. After looking closely at this graph, think about the following questions to help you reflect on the data.
• WhatdoyouthinkthegraphtellsusaboutbullyinginBCschools?
• Areyousurprisedbythenumberofstudentswhoarebulliedinschool?
• Dothesestatisticsreflectyourexperiencesinschool?
• Couldyouseehowusingthisdatamighthelptopreventorreducebullyinginschools?
LiTERACY FOUNDATiONS MATH: LEVEL 4 | 17
LESSON 1 CiRCLE GRAPHS STATiSTiCS AND PRObAbiLiTY
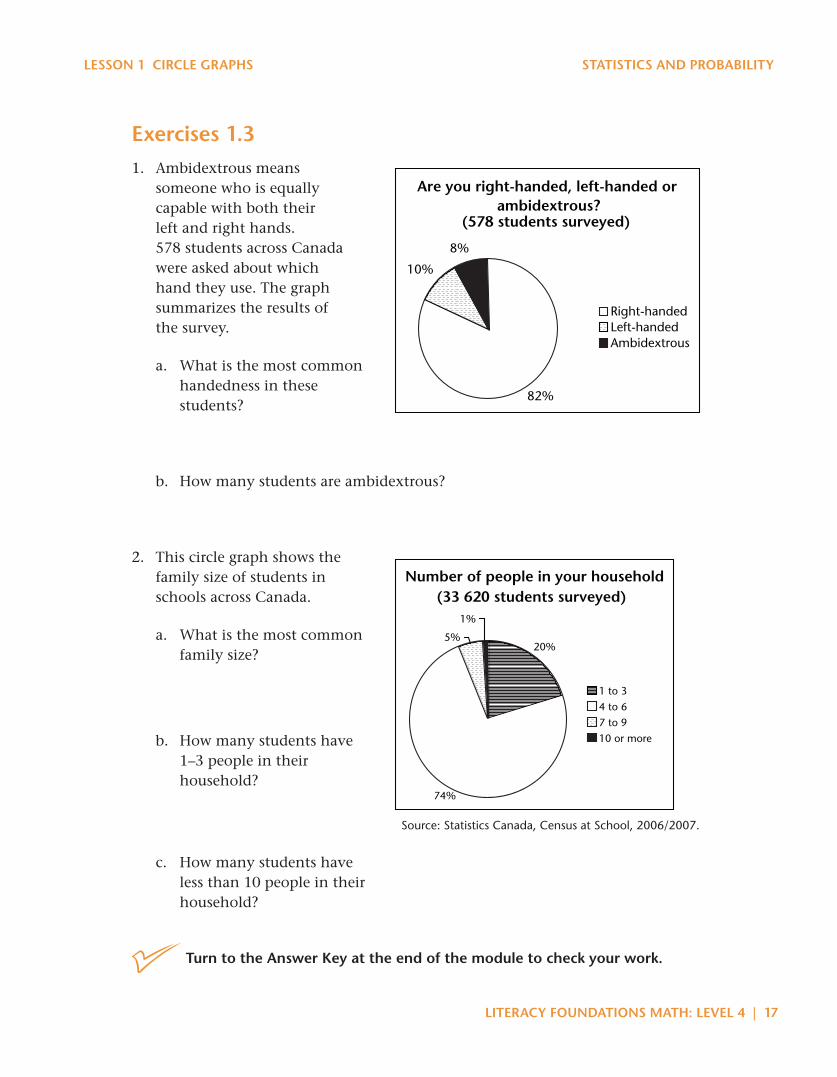
Exercises 1.31. Ambidextrous means
someone who is equally capable with both their left and right hands. 578 students across Canada were asked about which hand they use. The graph summarizes the results of the survey.
a. What is the most common handedness in these students?
b. How many students are ambidextrous?
2. This circle graph shows the family size of students in schools across Canada.
a. What is the most common family size?
b. How many students have 1–3 people in their household?
Source: Statistics Canada, Census at School, 2006/2007.
c. How many students have less than 10 people in their household?
Turn to the Answer Key at the end of the module to check your work.
Are you right-handed, left-handed or ambidextrous?
(578 students surveyed)
82%
10%
8%
Right-handedLeft-handedAmbidextrous
Number of people in your household (33 620 students surveyed)
20%
74%
5%
1%
1 to 34 to 67 to 910 or more
18 | LiTERACY FOUNDATiONS MATH: LEVEL 4
STATiSTiCS AND PRObAbiLiTY LESSON 1 CiRCLE GRAPHS
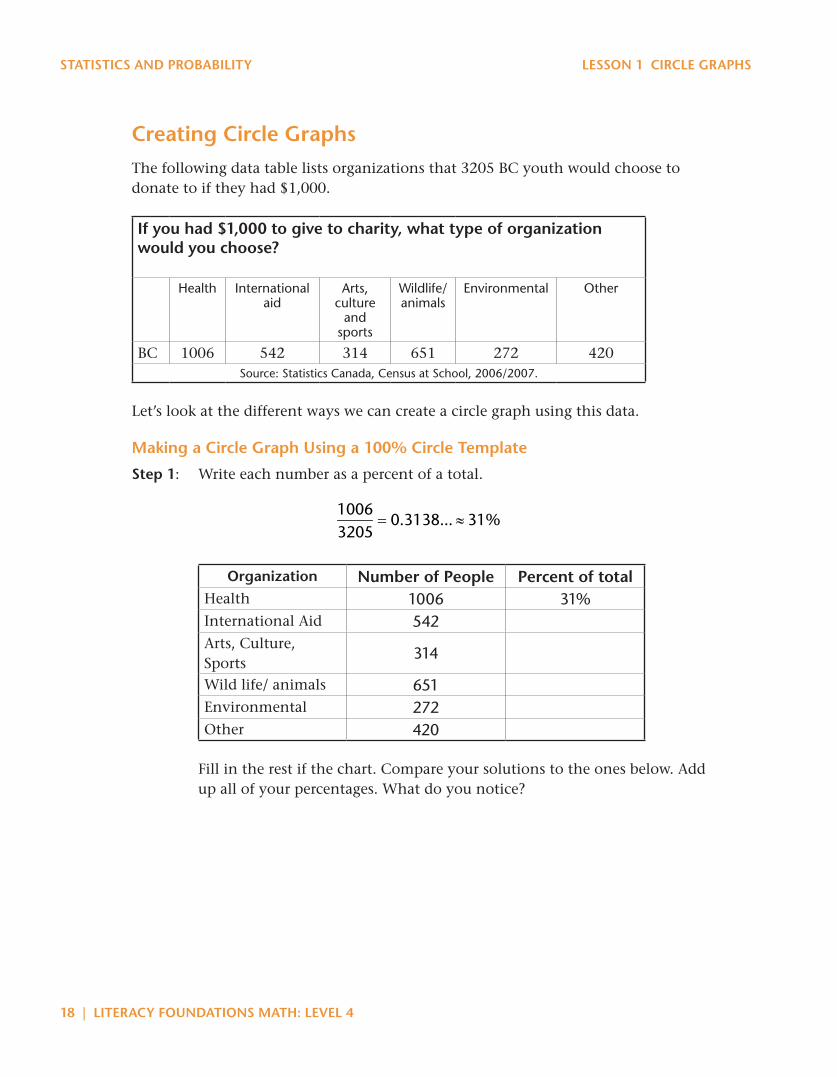
Creating Circle GraphsThe following data table lists organizations that 3205 BC youth would choose to donate to if they had $1,000.
if you had $1,000 to give to charity, what type of organization would you choose?
Health International aid
Arts, culture
and sports
Wildlife/ animals
Environmental Other
BC 1006 542 314 651 272 420Source: Statistics Canada, Census at School, 2006/2007 .
Let’s look at the different ways we can create a circle graph using this data.
Making a Circle Graph Using a 100% Circle Template
Step 1: Write each number as a percent of a total.
10063205
= 0.3138... ≈ 31%
Organization Number of People Percent of totalHealth 1006 31%International Aid 542Arts, Culture, Sports
314
Wild life/ animals 651Environmental 272Other 420
Fill in the rest if the chart. Compare your solutions to the ones below. Add up all of your percentages. What do you notice?
LiTERACY FOUNDATiONS MATH: LEVEL 4 | 19
LESSON 1 CiRCLE GRAPHS STATiSTiCS AND PRObAbiLiTY
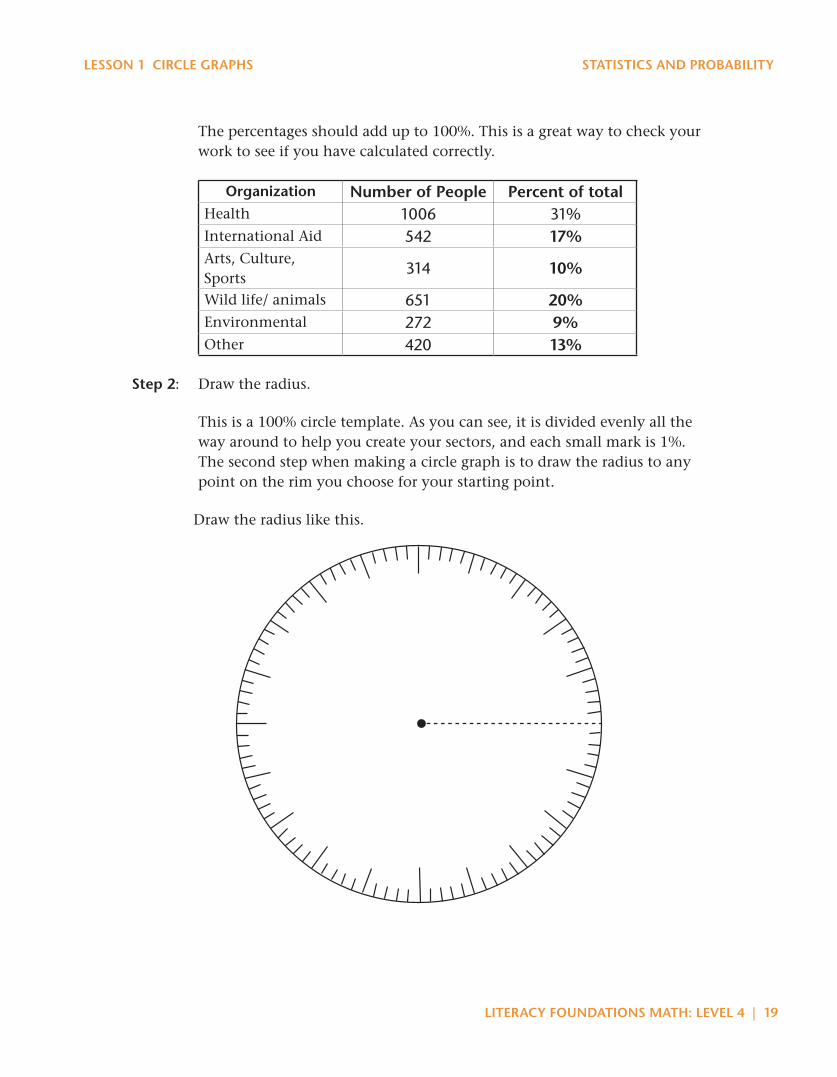
The percentages should add up to 100%. This is a great way to check your work to see if you have calculated correctly.
Organization Number of People Percent of totalHealth 1006 31%International Aid 542 17%Arts, Culture, Sports
314 10%
Wild life/ animals 651 20%Environmental 272 9%Other 420 13%
Step 2: Draw the radius.
This is a 100% circle template. As you can see, it is divided evenly all the way around to help you create your sectors, and each small mark is 1%. The second step when making a circle graph is to draw the radius to any point on the rim you choose for your starting point.
Draw the radius like this.
•
20 | LiTERACY FOUNDATiONS MATH: LEVEL 4
STATiSTiCS AND PRObAbiLiTY LESSON 1 CiRCLE GRAPHS
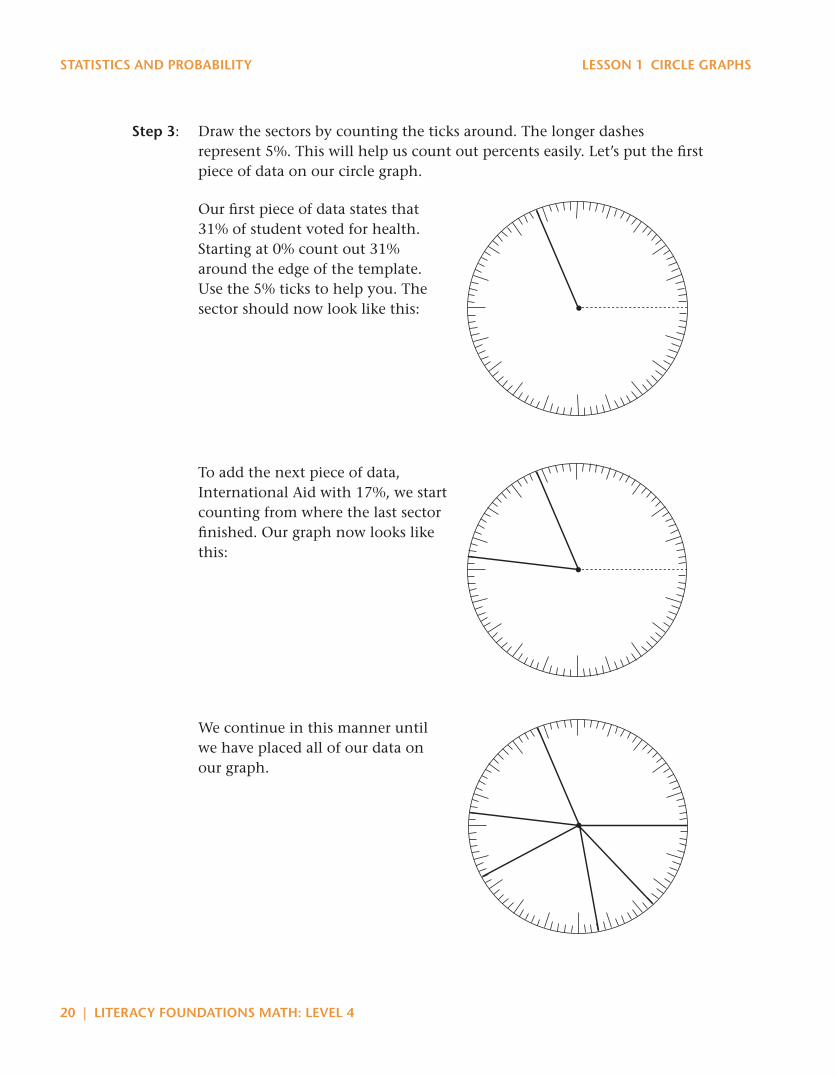
Step 3: Draw the sectors by counting the ticks around. The longer dashes represent 5%. This will help us count out percents easily. Let’s put the first piece of data on our circle graph.
Our first piece of data states that 31% of student voted for health. Starting at 0% count out 31% around the edge of the template. Use the 5% ticks to help you. The sector should now look like this:
To add the next piece of data, International Aid with 17%, we start counting from where the last sector finished. Our graph now looks like this:
We continue in this manner until we have placed all of our data on our graph.
•
•
•
LiTERACY FOUNDATiONS MATH: LEVEL 4 | 21
LESSON 1 CiRCLE GRAPHS STATiSTiCS AND PRObAbiLiTY
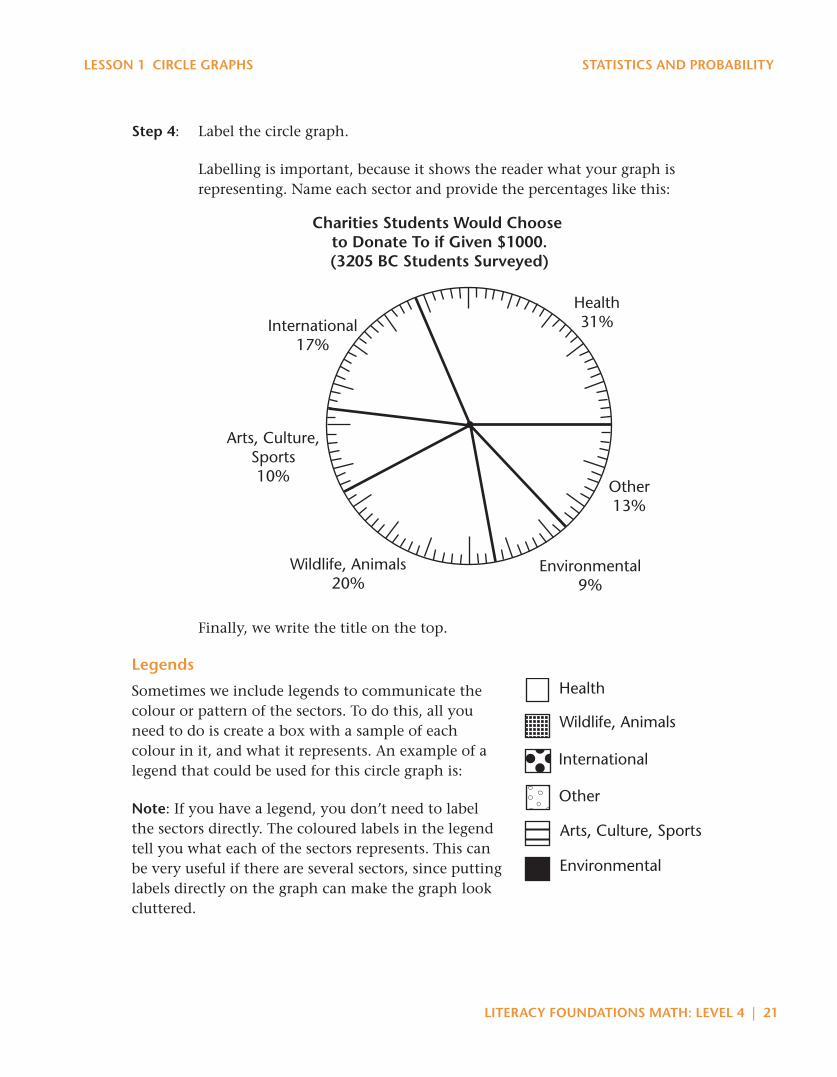
Step 4: Label the circle graph.
Labelling is important, because it shows the reader what your graph is representing. Name each sector and provide the percentages like this:
Health31%
Other13%
Environmental9%
Wildlife, Animals20%
Arts, Culture,Sports10%
International17%
•
Charities Students Would Choose to Donate To if Given $1000.(3205 BC Students Surveyed)
Finally, we write the title on the top.
Legends
Sometimes we include legends to communicate the colour or pattern of the sectors. To do this, all you need to do is create a box with a sample of each colour in it, and what it represents. An example of a legend that could be used for this circle graph is:
Note: If you have a legend, you don’t need to label the sectors directly. The coloured labels in the legend tell you what each of the sectors represents. This can be very useful if there are several sectors, since putting labels directly on the graph can make the graph look cluttered.
Health
Other
Environmental
Wildlife, Animals
Arts, Culture, Sports
International
22 | LiTERACY FOUNDATiONS MATH: LEVEL 4
STATiSTiCS AND PRObAbiLiTY LESSON 1 CiRCLE GRAPHS
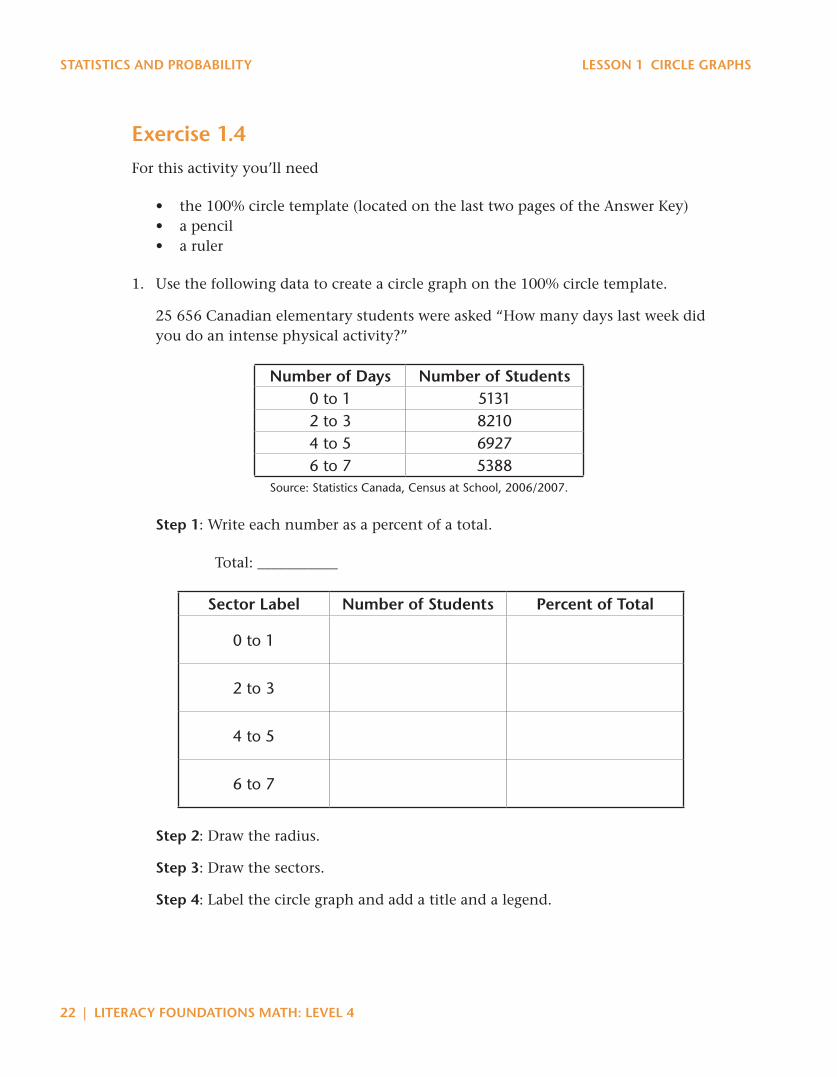
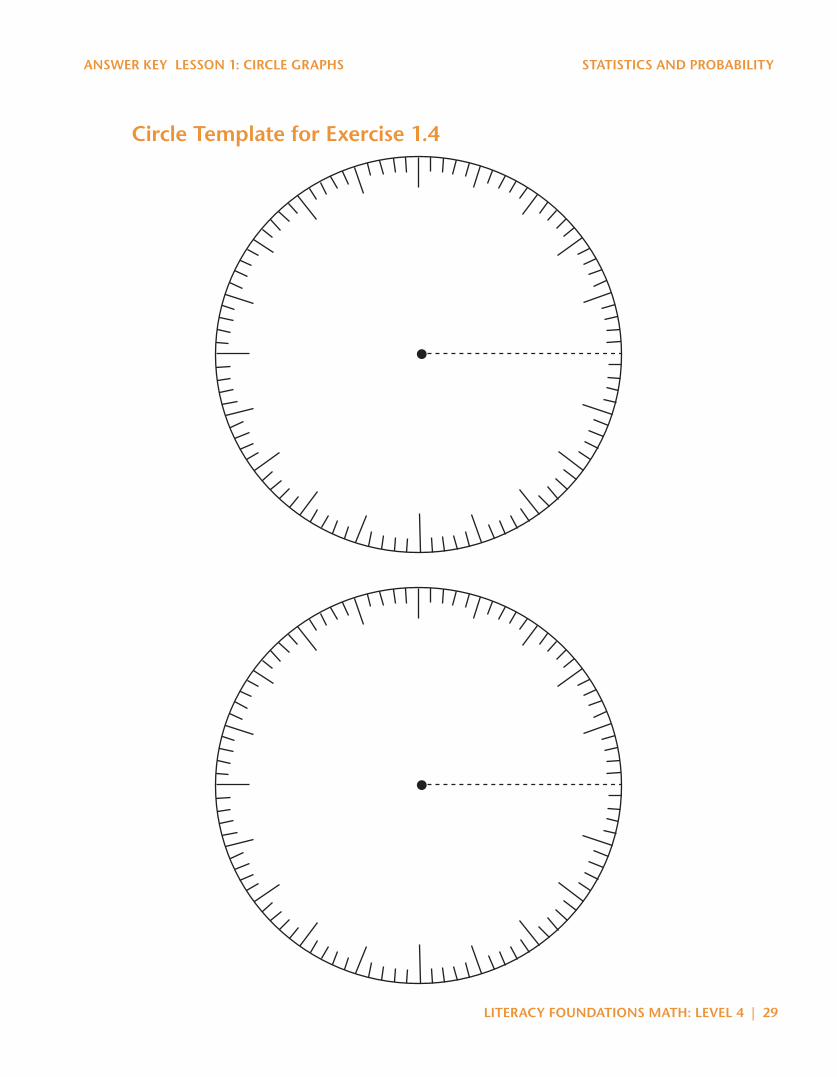
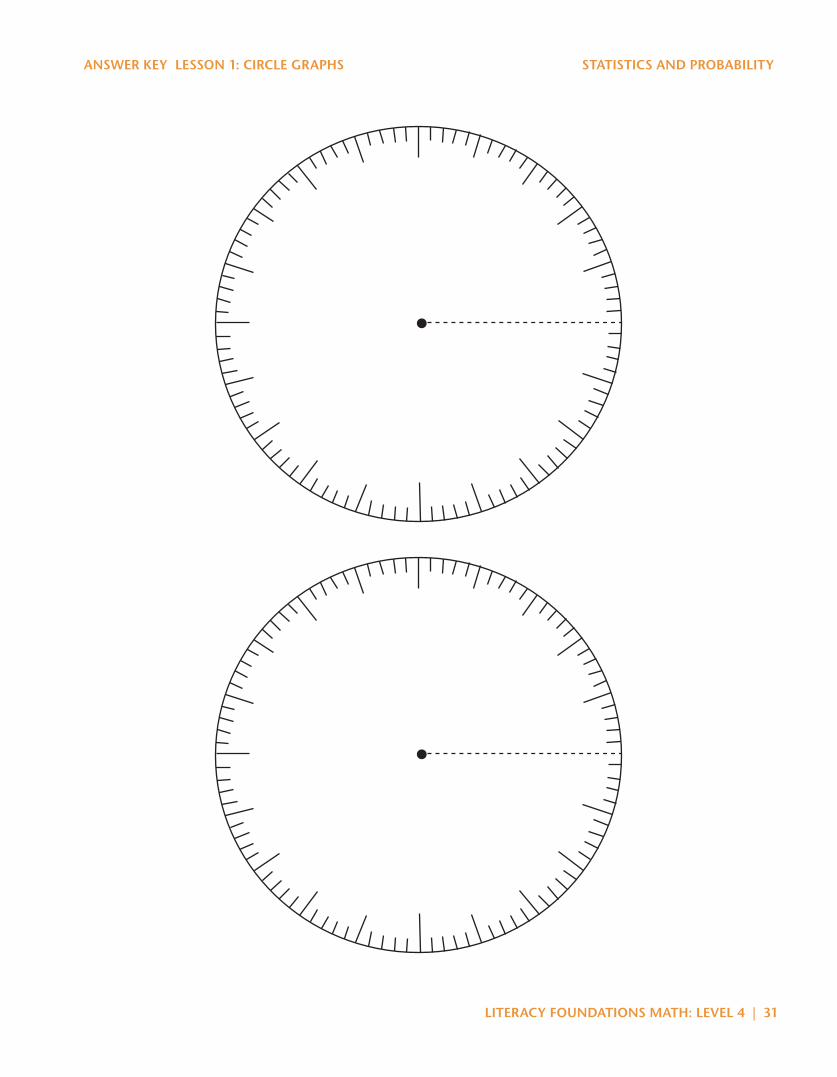
Exercise 1.4For this activity you’ll need
• the100%circletemplate(locatedonthelasttwopagesoftheAnswerKey) • apencil
• a ruler
1. Use the following data to create a circle graph on the 100% circle template.
25 656 Canadian elementary students were asked “How many days last week did you do an intense physical activity?”
Number of Days Number of Students0 to 1 51312 to 3 82104 to 5 69276 to 7 5388
Source: Statistics Canada, Census at School, 2006/2007 .
Step 1: Write each number as a percent of a total.
Total: ___________
Sector Label Number of Students Percent of Total
0 to 1
2 to 3
4 to 5
6 to 7
Step 2: Draw the radius.
Step 3: Draw the sectors.
Step 4: Label the circle graph and add a title and a legend.
LiTERACY FOUNDATiONS MATH: LEVEL 4 | 23
LESSON 1 CiRCLE GRAPHS STATiSTiCS AND PRObAbiLiTY
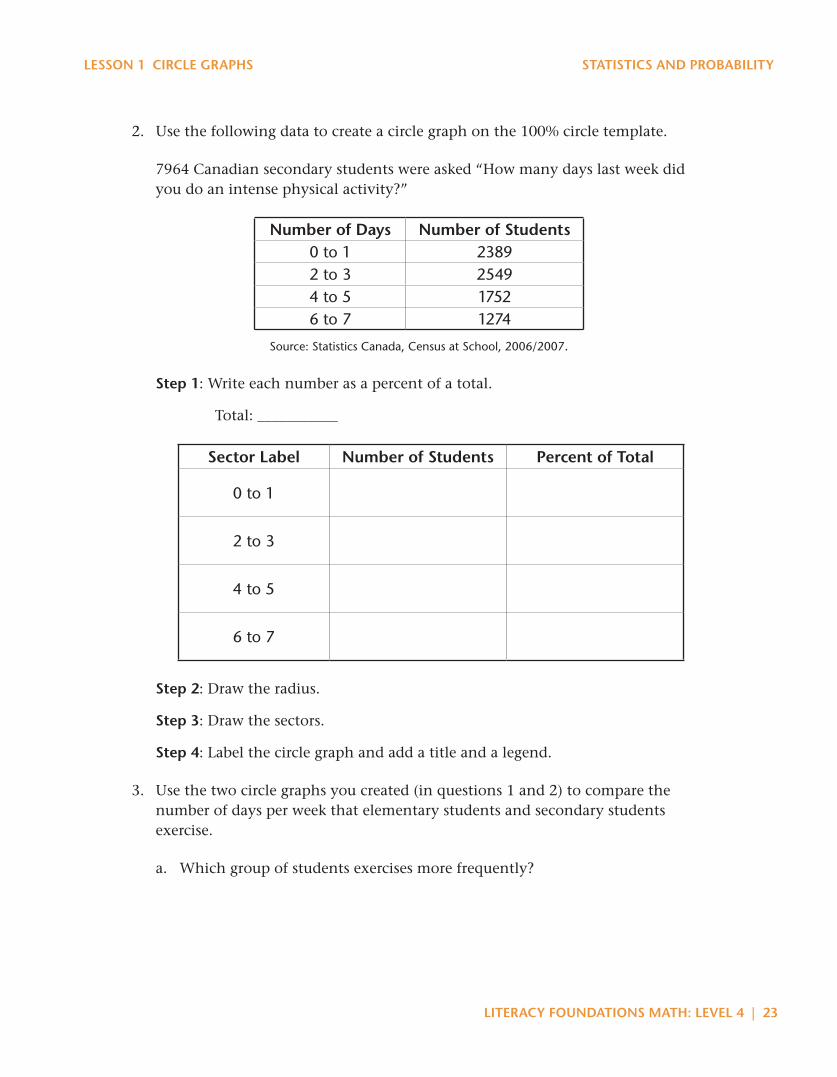
2. Use the following data to create a circle graph on the 100% circle template.
7964 Canadian secondary students were asked “How many days last week did you do an intense physical activity?”
Number of Days Number of Students0 to 1 23892 to 3 25494 to 5 17526 to 7 1274
Source: Statistics Canada, Census at School, 2006/2007.
Step 1: Write each number as a percent of a total.
Total: ___________
Sector Label Number of Students Percent of Total
0 to 1
2 to 3
4 to 5
6 to 7
Step 2: Draw the radius.
Step 3: Draw the sectors.
Step 4: Label the circle graph and add a title and a legend.
3. Use the two circle graphs you created (in questions 1 and 2) to compare the number of days per week that elementary students and secondary students exercise.
a. Which group of students exercises more frequently?
24 | LiTERACY FOUNDATiONS MATH: LEVEL 4
STATiSTiCS AND PRObAbiLiTY LESSON 1 CiRCLE GRAPHS
b. What are some possible reasons for your answer in a?
4. Read the survey question carefully. What factors might have contributed to how students responded to the survey?
Turn to the Answer Key at the end of the module to check your work.
LiTERACY FOUNDATiONS MATH: LEVEL 4 | 25
ANSWER KEY LESSON 1: CiRCLE GRAPHS STATiSTiCS AND PRObAbiLiTY
Answer Key
Lesson 1: Circle GraphsExercise 1.1
1. How many times have were students bullied at school in the last month? (3205 BC students surveyed)
2. number of times 0
number of times 1 to 3
number of times 4 to 9
number of times 10 more
3. number of times 0
4. 100%
5. 3205
Exercise 1.2
1. Step 1: 3205 students
Step 2: The graph displays what 3205 students usually eat for breakfast.
Step 3: Students who ate grain products are 36% of 3205 students.
Students who ate milk products are 26% of 3205 students.
Students who ate fruits or vegetables are 14% of 3205 students.
Students who ate meat products are 12% of 3205 students.
Students who did not have breakfast are 5% of 3205 students.
Students who had other breakfast are 7% of 3205 students.
2. Step 1: 250 students
Step 2: This graph describes the eye colour of 250 students.
Step 3: Students with brown eyes are 44% of 250 students.
Students with blue eyes are 29% of 250 students.
Students with green eyes are 16% of 250 students.
Students with another eye colour are 11% of 250 students
26 | LiTERACY FOUNDATiONS MATH: LEVEL 4
STATiSTiCS AND PRObAbiLiTY ANSWER KEY LESSON 1: CiRCLE GRAPHS
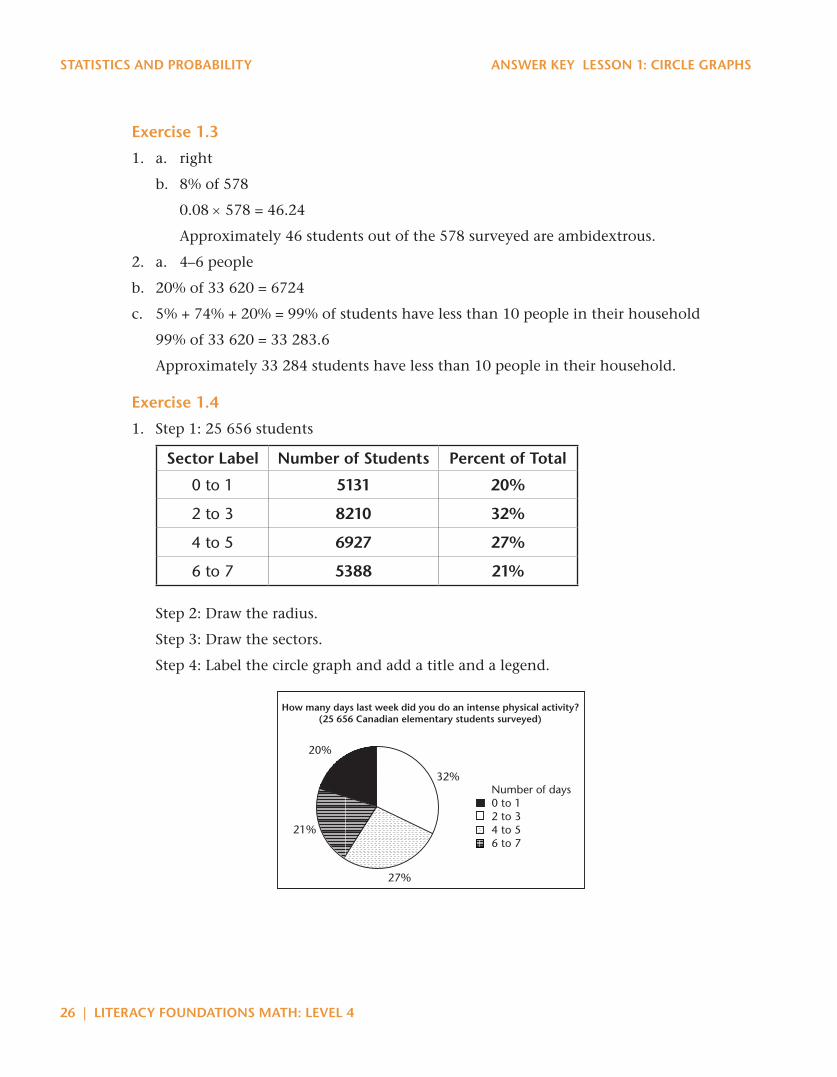
Exercise 1.3
1. a. right
b. 8% of 578
0.08 × 578 = 46.24
Approximately 46 students out of the 578 surveyed are ambidextrous.
2. a. 4–6 people
b. 20% of 33 620 = 6724
c. 5% + 74% + 20% = 99% of students have less than 10 people in their household
99% of 33 620 = 33 283.6
Approximately 33 284 students have less than 10 people in their household.
Exercise 1.4
1. Step 1: 25 656 students
Sector Label Number of Students Percent of Total
0 to 1 5131 20%
2 to 3 8210 32%
4 to 5 6927 27%
6 to 7 5388 21%
Step 2: Draw the radius.
Step 3: Draw the sectors.
Step 4: Label the circle graph and add a title and a legend.
20%
32%
27%
21%
How many days last week did you do an intense physical activity?(25 656 Canadian elementary students surveyed)
Number of days 0 to 12 to 34 to 56 to 7
LiTERACY FOUNDATiONS MATH: LEVEL 4 | 27
ANSWER KEY LESSON 1: CiRCLE GRAPHS STATiSTiCS AND PRObAbiLiTY
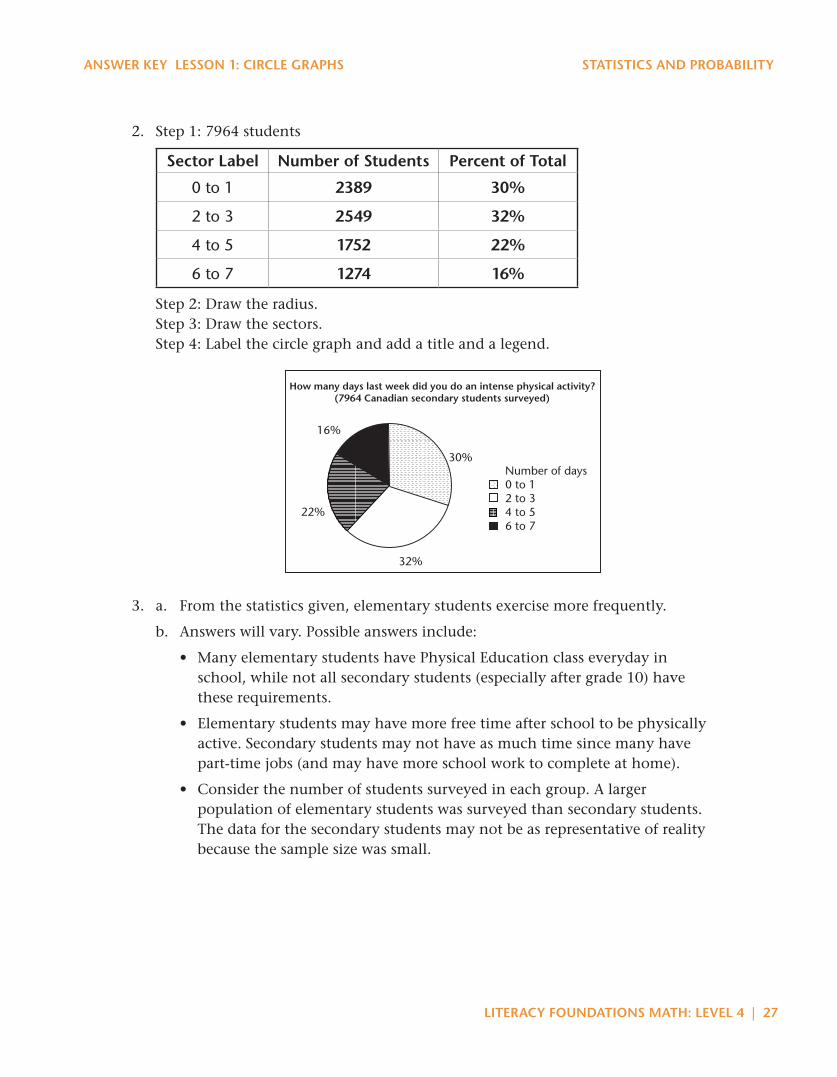
2. Step 1: 7964 students
Sector Label Number of Students Percent of Total
0 to 1 2389 30%
2 to 3 2549 32%
4 to 5 1752 22%
6 to 7 1274 16%
Step 2: Draw the radius. Step 3: Draw the sectors. Step 4: Label the circle graph and add a title and a legend.
16%
30%
32%
22%
How many days last week did you do an intense physical activity?(7964 Canadian secondary students surveyed)
Number of days 0 to 12 to 34 to 56 to 7
3. a. From the statistics given, elementary students exercise more frequently.
b. Answers will vary. Possible answers include:
• Many elementary students have Physical Education class everyday in school, while not all secondary students (especially after grade 10) have these requirements.
• Elementary students may have more free time after school to be physically active. Secondary students may not have as much time since many have part-time jobs (and may have more school work to complete at home).
• Consider the number of students surveyed in each group. A larger population of elementary students was surveyed than secondary students. The data for the secondary students may not be as representative of reality because the sample size was small.

28 | LiTERACY FOUNDATiONS MATH: LEVEL 4
STATiSTiCS AND PRObAbiLiTY ANSWER KEY LESSON 1: CiRCLE GRAPHS
4. The question asks how many times you did a physical activity last week. The responses that were given by students represent physical activity during a specific week, not an overall average. Many factors may have influenced the responses: time of year (weather, what sports are in season), whether or not elementary students were surveyed during the same week as secondary students, etc.
LiTERACY FOUNDATiONS MATH: LEVEL 4 | 29
ANSWER KEY LESSON 1: CiRCLE GRAPHS STATiSTiCS AND PRObAbiLiTY
Circle Template for Exercise 1.4
•
•

30 | LiTERACY FOUNDATiONS MATH: LEVEL 4
LiTERACY FOUNDATiONS MATH: LEVEL 4 | 31
ANSWER KEY LESSON 1: CiRCLE GRAPHS STATiSTiCS AND PRObAbiLiTY
•
•
Related Documents