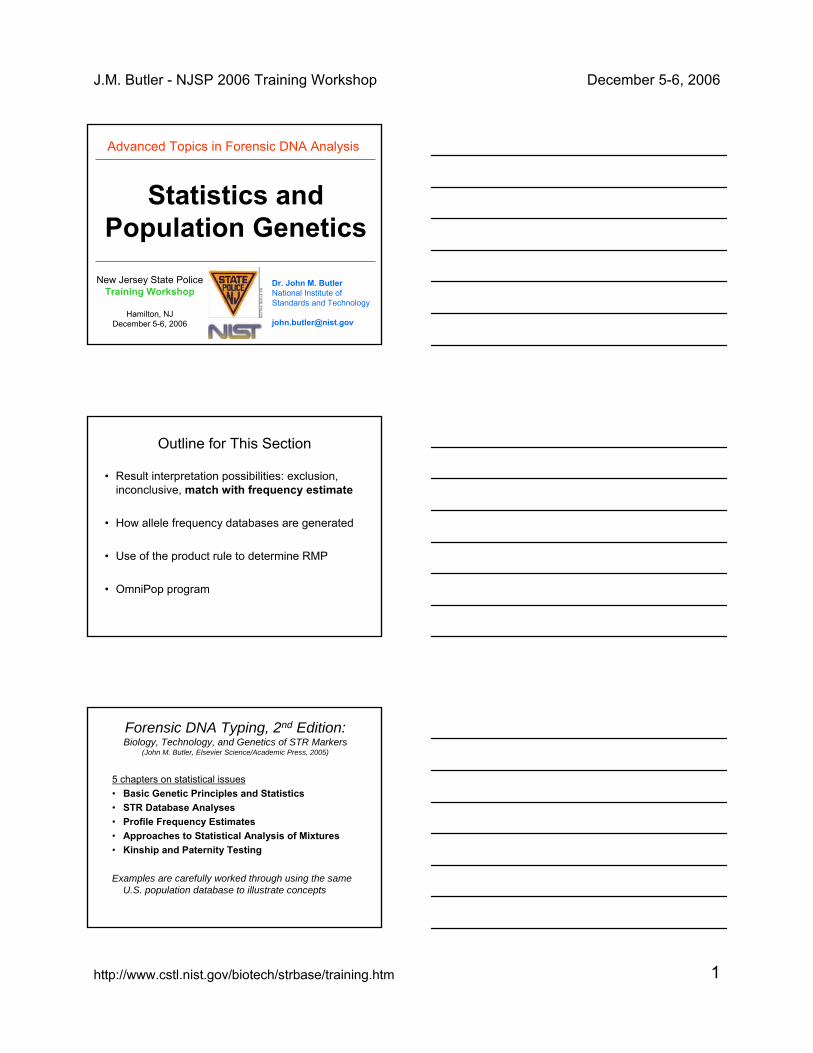
J.M. Butler - NJSP 2006 Training Workshop December 5-6, 2006 http://www.cstl.nist.gov/biotech/strbase/training.htm 1 Advanced Topics in Forensic DNA Analysis New Jersey State Police Training Workshop Hamilton, NJ December 5-6, 2006 Statistics and Population Genetics Dr. John M. Butler National Institute of Standards and Technology [email protected] Outline for This Section • Result interpretation possibilities: exclusion, inconclusive, match with frequency estimate • How allele frequency databases are generated • Use of the product rule to determine RMP • OmniPop program Forensic DNA Typing, 2 nd Edition: Biology, Technology, and Genetics of STR Markers (John M. Butler, Elsevier Science/Academic Press, 2005) 5 chapters on statistical issues • Basic Genetic Principles and Statistics • STR Database Analyses • Profile Frequency Estimates • Approaches to Statistical Analysis of Mixtures • Kinship and Paternity Testing Examples are carefully worked through using the same U.S. population database to illustrate concepts

Welcome message from author
This document is posted to help you gain knowledge. Please leave a comment to let me know what you think about it! Share it to your friends and learn new things together.
Transcript
J.M. Butler - NJSP 2006 Training Workshop December 5-6, 2006
http://www.cstl.nist.gov/biotech/strbase/training.htm 1
Advanced Topics in Forensic DNA Analysis
New Jersey State Police Training Workshop
Hamilton, NJDecember 5-6, 2006
Statistics and Population Genetics
Dr. John M. ButlerNational Institute of Standards and Technology
Outline for This Section
• Result interpretation possibilities: exclusion, inconclusive, match with frequency estimate
• How allele frequency databases are generated
• Use of the product rule to determine RMP
• OmniPop program
Forensic DNA Typing, 2nd Edition: Biology, Technology, and Genetics of STR Markers
(John M. Butler, Elsevier Science/Academic Press, 2005)
5 chapters on statistical issues• Basic Genetic Principles and Statistics • STR Database Analyses • Profile Frequency Estimates • Approaches to Statistical Analysis of Mixtures • Kinship and Paternity Testing
Examples are carefully worked through using the same U.S. population database to illustrate concepts
J.M. Butler - NJSP 2006 Training Workshop December 5-6, 2006
http://www.cstl.nist.gov/biotech/strbase/training.htm 2
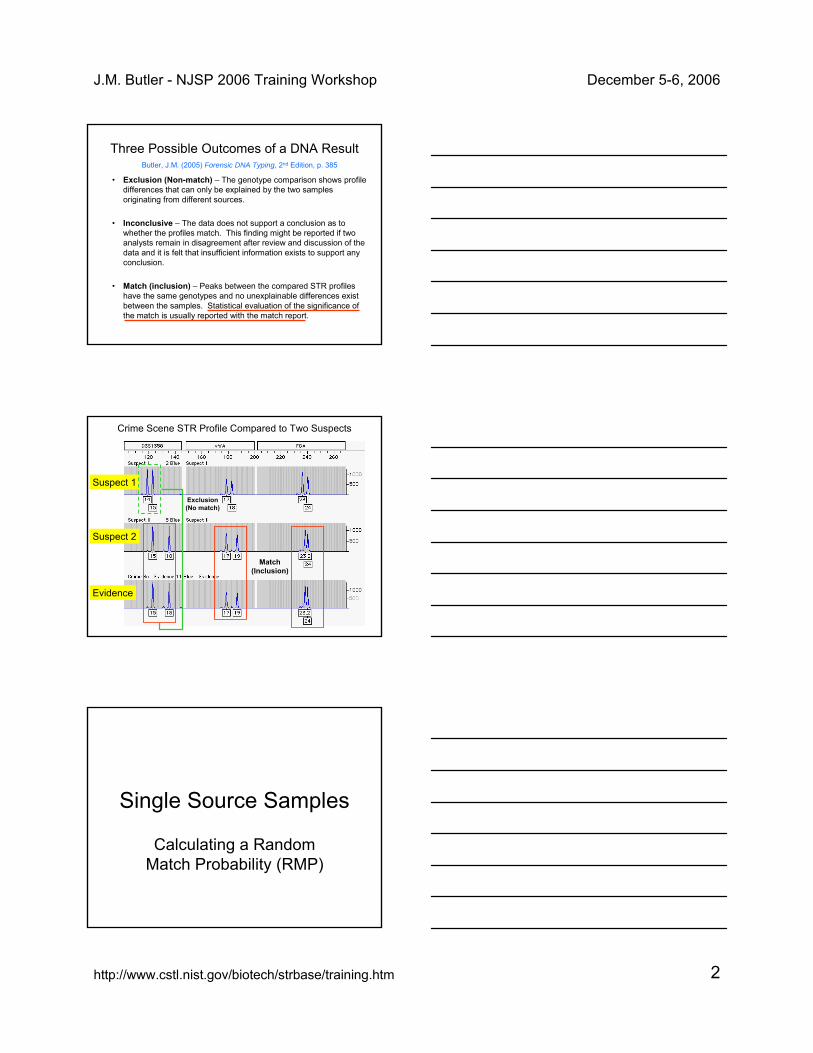
Three Possible Outcomes of a DNA Result
• Exclusion (Non-match) – The genotype comparison shows profile differences that can only be explained by the two samples originating from different sources.
• Inconclusive – The data does not support a conclusion as to whether the profiles match. This finding might be reported if two analysts remain in disagreement after review and discussion of the data and it is felt that insufficient information exists to support any conclusion.
• Match (inclusion) – Peaks between the compared STR profiles have the same genotypes and no unexplainable differences exist between the samples. Statistical evaluation of the significance of the match is usually reported with the match report.
Butler, J.M. (2005) Forensic DNA Typing, 2nd Edition, p. 385
Suspect 1
Suspect 2
Evidence
Match (Inclusion)
Exclusion (No match)
Crime Scene STR Profile Compared to Two Suspects
Single Source Samples
Calculating a Random Match Probability (RMP)

J.M. Butler - NJSP 2006 Training Workshop December 5-6, 2006
http://www.cstl.nist.gov/biotech/strbase/training.htm 3
Why Compute a Match Statistic?
• It would not be scientifically justifiable to speak of a match as proof of identity in the absence of underlying data that permit some reasonable estimate of how rare the matching characteristics actually are (NRC II, p. 192).
• Significance or weight of the evidence…
Population Genetics
• Population genetics seeks to understand genetic variation among individuals within and between population groups
• How can we estimate the frequency of a particular DNA profile?
• Random match probability - The probability that the DNA in a random sample from the population has the same profile as the DNA in the evidence sample. (Officers of the Court CD)
How Statistical Calculations are Made
• Generate data with set(s) of samples from desired population group(s) – Generally only 100-150 samples are needed to obtain
reliable allele frequency estimates
• Determine allele frequencies at each locus– Count number of each allele seen
• Allele frequency information is used to estimate the rarity of a particular DNA profile– Homozygotes (p2), Heterozygotes (2pq)– Product rule used (multiply locus frequency estimates)
For more information, see Chapters 20 and 21 in Forensic DNA Typing, 2nd Edition

J.M. Butler - NJSP 2006 Training Workshop December 5-6, 2006
http://www.cstl.nist.gov/biotech/strbase/training.htm 4
AA
A
A
a
a Aa
aA
aa
Freq (A) = p
Freq (a) = q (p + q)2 = p2 + 2pq + q2
Punnett square
p2 qp
pq q2
p
q
p q
Fath
er g
amet
es (s
perm
)
Mother gametes (egg)
p + q = 1
Resulting genotype combinations and frequencies
AA
Aa
p2
2pq
aaq2
Butler, J.M. (2005) Forensic DNA Typing, 2nd Edition, Figure 19.3, ©Elsevier Science/Academic Press
Assumptions behind the Product Rule
• Independence between alleles (Hardy-Weinberg equilibrium) – permits correlation of allele frequency with genotype
frequency
• Independence between loci (linkage equilibrium) – permits multiplication of genotype frequencies across
all tested loci
• Typically only match probabilities for unrelated individuals are reported
Assumptions with Hardy-Weinberg Equilibrium
Butler, J.M. (2005) Forensic DNA Typing, 2nd Edition, Table 20.6, ©Elsevier Science/Academic Press
None of these assumptions are really true…

J.M. Butler - NJSP 2006 Training Workshop December 5-6, 2006
http://www.cstl.nist.gov/biotech/strbase/training.htm 5
Decide on Number of Samples and Ethnic/Racial Grouping
Ethnic/ Racial Group 1
Ethnic/ Racial Group 2
Hardy-Weinberg equilibrium for allele independenceLinkage equilibrium for locus independence
Gather Samples
Analyze Samples at Desired Genetic Loci
Summarize DNA types
Determine Allele Frequencies for Each Locus
Perform Statistical Tests on Data
Usually >100 samples per group
Use Database(s) to Estimate an Observed DNA Profile Frequency
Often anonymous samples from a blood bank (self-declared ethnicities)
The number of times each allele is observed is counted and divided by the total number of alleles measured
Steps in Generating a Population Database
From Butler, J.M. (2005) Forensic DNA Typing, 2nd Edition, Figure 20.1, ©Elsevier Science/Academic Press
Examination of genetic distance between populations
PopStats calculation
U.S. Population Study with Identifiler STR Kit
Identifiler™
J. Forensic Sci. 48(4):908-911
0.00000
0.10000
0.20000
0.30000
0.40000
0.50000
5 6 7 8 9 9.3 10 11
Allele
Freq
uenc
y
302 Caucasians 258 African Americans 140 HispanicsTH01302 Caucasians 258 African Americans 140 Hispanics
5 0.00166 0.003886 0.23179 0.12403 0.214297 0.19040 0.42054 0.278578 0.08444 0.19380 0.096439 0.11424 0.15116 0.15000
9.3 0.36755 0.10465 0.2464310 0.00828 0.00194 0.0142911 0.00166
TH01 Allele Frequencies
http://www.cstl.nist.gov/biotech/strbase/NISTpop.htm
Individual Genotypes Are Summarized and Converted into Allele Frequencies
Butler, J.M. (2005) Forensic DNA Typing, 2nd Edition, Table 20.2, ©Elsevier Science/Academic Press
The 11,14 genotype was seen 12 times in 302 samples (604 examined chromosomes)

J.M. Butler - NJSP 2006 Training Workshop December 5-6, 2006
http://www.cstl.nist.gov/biotech/strbase/training.htm 6
Computer Programs for Performing Statistical Tests on Genetic Data
• PowerStats http://www.promega.com/geneticidtools/default.htm
• GDA http://lewis.eeb.uconn.edu/lewishome/software.html
• GENEPOP http://wbiomed.curtin.edu.au/genepop/index.html
• DNA-VIEW http://www.dna-view.com/ (costs money)
• DNATYPE Contact Ranajit Chakraborty about availability
• ARLEQUIN http://lgb.unige.ch/arlequin/
• PowerMarker http://www.powermarker.net
• PopStats part of the FBI’s CODIS system (not publicly available)
• TFPGA http://bioweb.usu.edu/mpmbio/tfpga.asp
See Table 20.5 Butler, J.M. (2005) Forensic DNA Typing, 2nd Edition
Figure 20.2, J.M. Butler (2005) Forensic DNA Typing, 2nd Edition © 2005 Elsevier Academic Press
Testing for Independence within a Locus
• Hardy-Weinberg equilibrium (HWE) predicts stability of allele and genotype frequencies from one generation to the next
• Small p values (p < 0.05) cast doubt on the validity of the null hypothesis

J.M. Butler - NJSP 2006 Training Workshop December 5-6, 2006
http://www.cstl.nist.gov/biotech/strbase/training.htm 7
DNA StatisticsFor heterozygous loci
P = 2pqP = probability; p and q are frequencies of allele in a given population
Example: For the locus D3S1358 and individual is 16,17 with frequencies of 0.2533 and 0.2152respectively
P = 2(0.2533)(0.2152) = 0.1090 or 1 in 9.17
For independent loci, the genotype frequencies can be combined through multiplication…Profile Probability = (P1)(P2)…(Pn)
= 1 in a very large number…
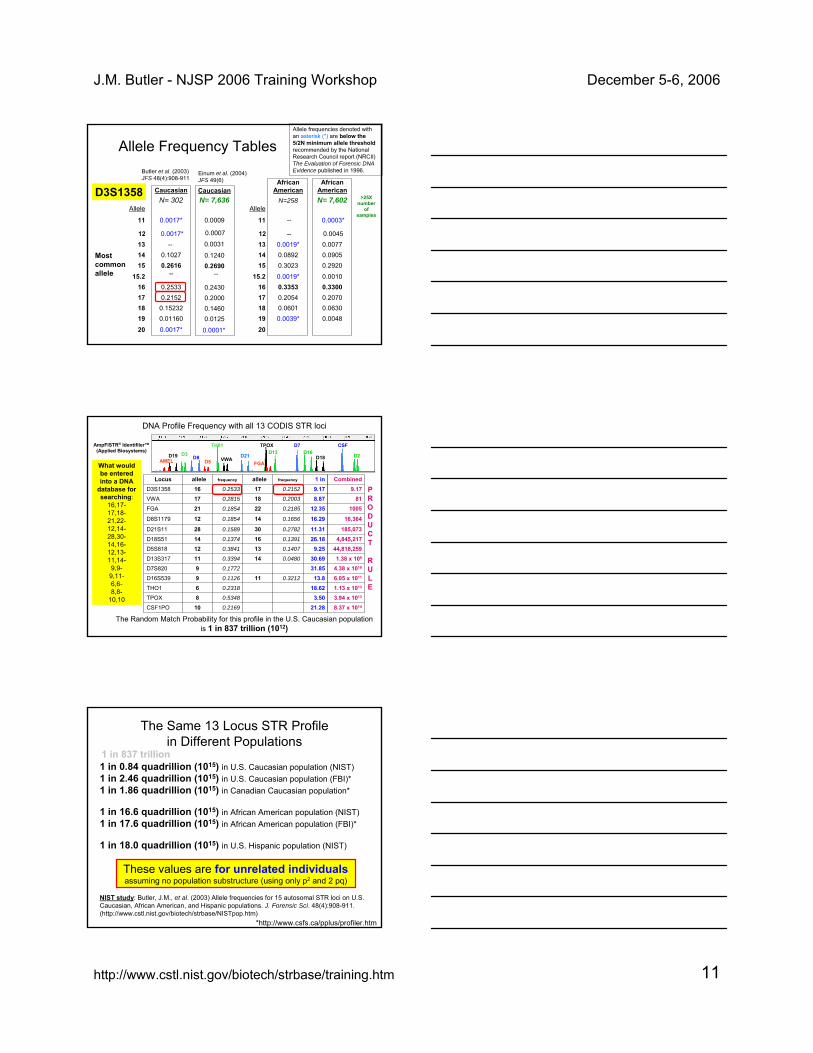
DNA Profile Frequency with all 13 CODIS STR loci
21.283.50
18.6213.8
31.8530.699.25
26.1811.31
16.29
12.358.879.171 in
0.2169 10CSF1PO
0.5348 8TPOX
0.2318 6THO1
0.3212 11 0.1126 9D16S539
0.17729D7S820
0.0480 140.3394 11D13S317
0.1407 130.384112D5S818
0.1391 160.1374 14D18S51
0.2782 30 0.1589 28 D21S11
0.1656 140.1854 12D8S1179
0.2185220.185421FGA
0.2003 180.2815 17 VWA
0.2152 17 0.2533 16D3S1358
frequencyallele 2 frequencyallele 1 Locus
The Random Match Probability for this profile in the U.S. Caucasian populationis 1 in 837 trillion (1012)
AmpFlSTR® Identifiler™(Applied Biosystems)
AMELD3
TH01 TPOX
D2D19FGA
D21 D18
CSFD16
D7D13
D5 VWAD8
PRODUCT
RULE
8.37 x 10¹⁴
3.94 x 10¹³
1.13 x 10¹³
6.05 x 10¹¹
4.38 x 10¹⁰
1.38 x 10⁹
44,818,2594,845,217
185,073
16,364
100581
9.17Combined
2pq 2pq2pq2pq2pq2pq2pq2pq
p2
2pqp2
p2
p2
Comparison of Results from Different Population Groups
Butler, J.M. (2005) Forensic DNA Typing, 2nd Edition, Table 21.1, ©Elsevier Science/Academic Press
U.S. Caucasians (N = 302)
U.S. Hispanics (N = 140)

J.M. Butler - NJSP 2006 Training Workshop December 5-6, 2006
http://www.cstl.nist.gov/biotech/strbase/training.htm 8
NRC II Recommendations for Estimating Random-Match Probabilities
• Recommendation 4.1– Use the product rule to calculate profile frequency– If perpetrator’s race is unknown, report calculations
on racial groups for all possible suspects– For heterozygotes: use 2pipj or 2pipj(1-θ) (eq. 4.4b)
– For homozygotes: use p2 + p(1-p)θ instead of p2
– With US population, use θ=0.01– With small, isolated populations, use θ=0.03
Why a Theta (θ) Correction?
• Used as a measure of the effects of population subdivision; due to co-ancestry (inbreeding) of alleles– Is essentially an attempt to correct for the degree of relatedness
of alleles that have a common ancestry
• Basis in fixation indices (F-statistics) described by SewallWright in 1951 – FST, FIT, FIS
• Calculations typically performed as described by Weir and Cockerham (1984) Estimating F-statistics for the analysis of population structure. Evolution 38: 1358-1370
If the subpopulations are distinct and in HW proportions, then θ = FST
With US population groups (African Americans, Caucasians, etc.), use θ = 0.01With small, isolated populations (Native Americans), use θ = 0.03
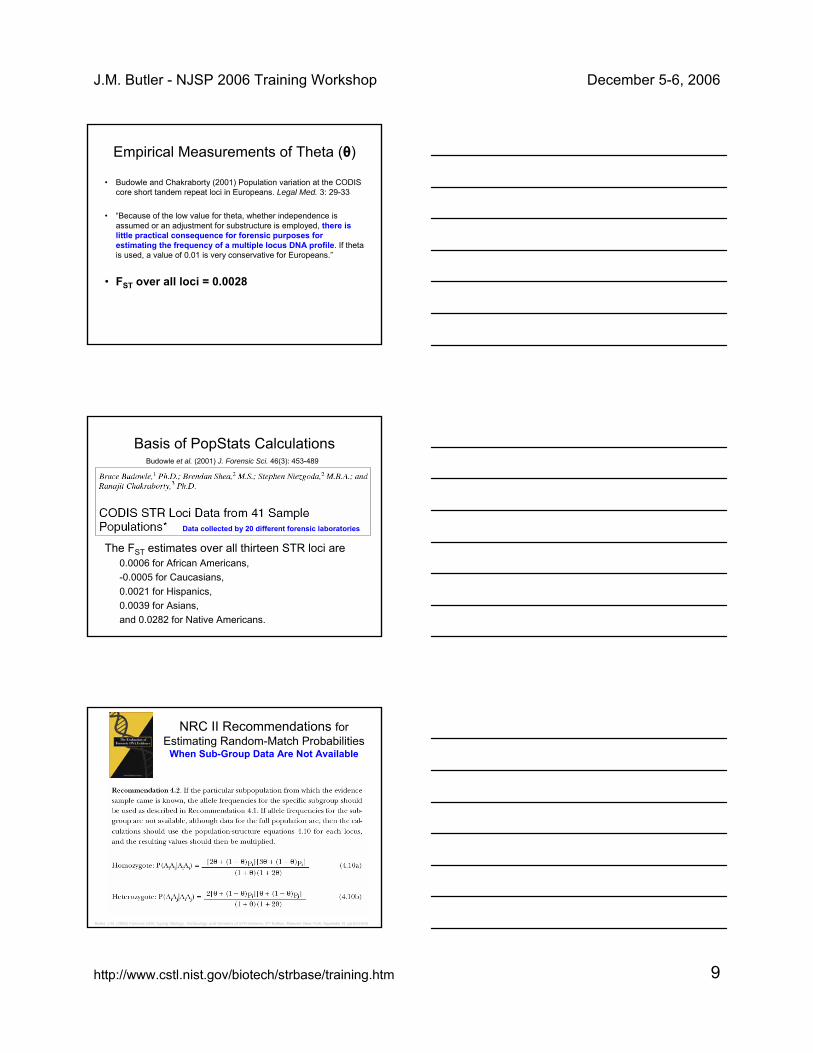
Empirical Measurements of Theta (θ) • Budowle et al. (2001) CODIS STR Loci Data from 41
Sample Populations. J. Forensic Sci. 46(3): 453-489
θ < 0.01 θ < 0.03
J.M. Butler - NJSP 2006 Training Workshop December 5-6, 2006
http://www.cstl.nist.gov/biotech/strbase/training.htm 9
Empirical Measurements of Theta (θ)
• Budowle and Chakraborty (2001) Population variation at the CODIS core short tandem repeat loci in Europeans. Legal Med. 3: 29-33
• “Because of the low value for theta, whether independence is assumed or an adjustment for substructure is employed, there is little practical consequence for forensic purposes for estimating the frequency of a multiple locus DNA profile. If theta is used, a value of 0.01 is very conservative for Europeans.”
• FST over all loci = 0.0028
Basis of PopStats Calculations
The FST estimates over all thirteen STR loci are0.0006 for African Americans, -0.0005 for Caucasians, 0.0021 for Hispanics, 0.0039 for Asians, and 0.0282 for Native Americans.
Budowle et al. (2001) J. Forensic Sci. 46(3): 453-489
Data collected by 20 different forensic laboratories
NRC II Recommendations for Estimating Random-Match Probabilities
When Sub-Group Data Are Not Available
Butler, J.M. (2005) Forensic DNA Typing: Biology, Technology, and Genetics of STR Markers, 2nd Edition, Elsevier: New York; Appendix VI, pp.623-625

J.M. Butler - NJSP 2006 Training Workshop December 5-6, 2006
http://www.cstl.nist.gov/biotech/strbase/training.htm 10
Comparison of Results Obtained with Various NRC II Formula
Butler, J.M. (2005) Forensic DNA Typing, 2nd Edition, Table 21.4, ©Elsevier Science/Academic Press
1 in 18.9 1 in 18.2 1 in 16.1
1 in 29.4 1 in 29.7 1 in 25.0
eq. (4.4b); NRCII, p.102
Butler, J.M. (2005) Forensic DNA Typing, 2nd Edition, Table 21.5, ©Elsevier Science/Academic Press
Example Calculations with Population Substructure Adjustments
NRC II Recommendations for Estimating Random-Match Probabilities
• Recommendation 4.3. If the person who contributed the evidence sample is from a group or tribe for which no adequate database exists, data from severalother groups or tribes thought to be closely related to it should be used. The profile frequency should be calculated as described in Recommendation 4.1 for each group or tribe.
– For heterozygotes: use 2pipj
– For homozygotes: use p2 + p(1-p)θ instead of p2
J.M. Butler - NJSP 2006 Training Workshop December 5-6, 2006
http://www.cstl.nist.gov/biotech/strbase/training.htm 11
Allele Frequency Tables
CaucasianN= 302
0.0017*
--0.10270.2616
--
0.25330.2152
0.152320.01160
AfricanAmerican
N=258
--
0.0019*0.08920.3023
0.0019*0.33530.20540.06010.0039*
20 0.0017* 0.0001*
D3S1358
Butler et al. (2003) JFS 48(4):908-911
Allele frequencies denoted with an asterisk (*) are below the5/2N minimum allele thresholdrecommended by the National Research Council report (NRCII) The Evaluation of Forensic DNA Evidence published in 1996.
Most common allele
Caucasian
0.0009
0.12400.2690
--
0.24300.20000.14600.0125
Einum et al. (2004) JFS 49(6)
Allele
11
131415
15.216171819
12 0.0017* --0.0007
0.0031
AfricanAmericanN= 7,602
0.0003*
0.00770.09050.2920
0.00100.33000.20700.06300.0048
0.0045
20
Allele
11
131415
15.216171819
12
N= 7,636 >25X number
of samples
DNA Profile Frequency with all 13 CODIS STR loci
21.283.50
18.6213.8
31.8530.699.25
26.1811.31
16.29
12.358.879.171 in
0.2169 10CSF1PO
0.5348 8TPOX
0.2318 6THO1
0.3212 11 0.1126 9D16S539
0.17729D7S820
0.0480 140.3394 11D13S317
0.1407 130.384112D5S818
0.1391 160.1374 14D18S51
0.2782 30 0.1589 28 D21S11
0.1656 140.1854 12D8S1179
0.2185220.185421FGA
0.2003 180.2815 17 VWA
0.2152 17 0.2533 16D3S1358
frequencyallele frequencyallele Locus
The Random Match Probability for this profile in the U.S. Caucasian populationis 1 in 837 trillion (1012)
AmpFlSTR® Identifiler™(Applied Biosystems)
AMELD3
TH01 TPOX
D2D19FGA
D21 D18
CSFD16
D7D13
D5 VWAD8What would be entered into a DNA
database for searching:
16,17-17,18-21,22-12,14-28,30-14,16-12,13-11,14-
9,9-9,11-6,6-8,8-
10,10
PRODUCT
RULE
8.37 x 10¹⁴
3.94 x 10¹³
1.13 x 10¹³
6.05 x 10¹¹
4.38 x 10¹⁰
1.38 x 10⁹
44,818,2594,845,217
185,073
16,364
100581
9.17Combined
The Same 13 Locus STR Profile in Different Populations
1 in 0.84 quadrillion (1015) in U.S. Caucasian population (NIST)1 in 2.46 quadrillion (1015) in U.S. Caucasian population (FBI)*1 in 1.86 quadrillion (1015) in Canadian Caucasian population*
1 in 16.6 quadrillion (1015) in African American population (NIST)1 in 17.6 quadrillion (1015) in African American population (FBI)*
1 in 18.0 quadrillion (1015) in U.S. Hispanic population (NIST)
*http://www.csfs.ca/pplus/profiler.htm
1 in 837 trillion
These values are for unrelated individualsassuming no population substructure (using only p2 and 2 pq)
NIST study: Butler, J.M., et al. (2003) Allele frequencies for 15 autosomal STR loci on U.S. Caucasian, African American, and Hispanic populations. J. Forensic Sci. 48(4):908-911.(http://www.cstl.nist.gov/biotech/strbase/NISTpop.htm)
J.M. Butler - NJSP 2006 Training Workshop December 5-6, 2006
http://www.cstl.nist.gov/biotech/strbase/training.htm 12
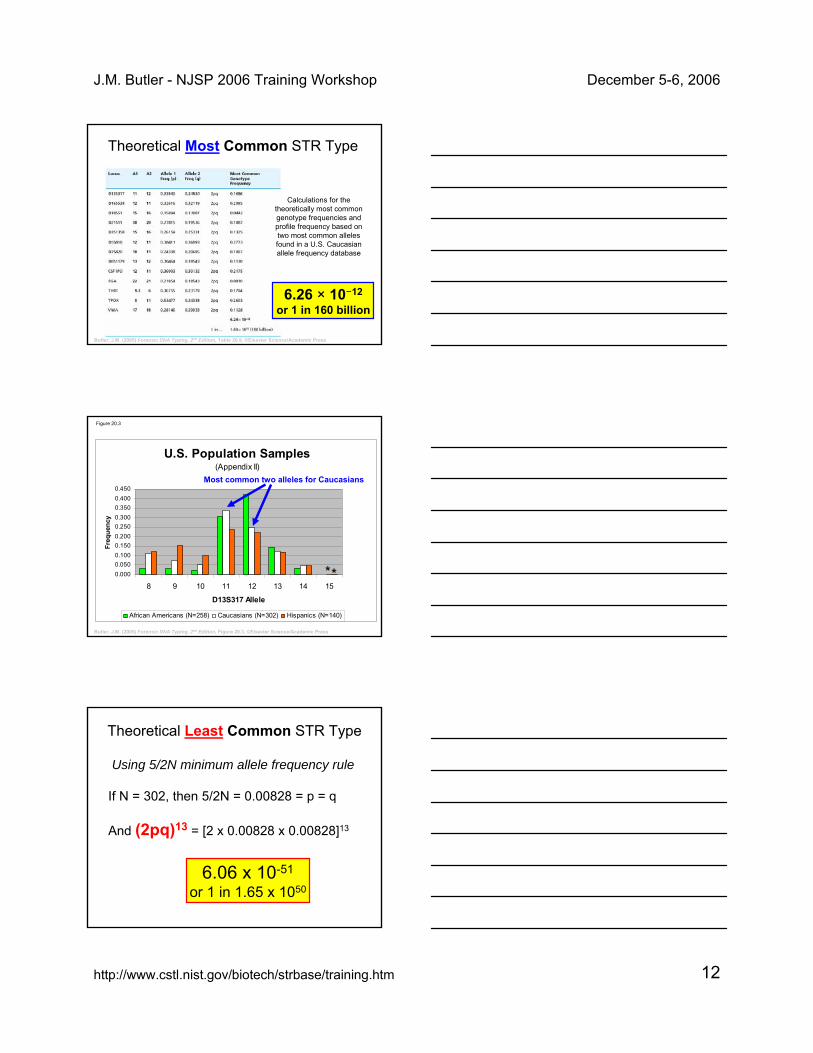
Theoretical Most Common STR Type
Butler, J.M. (2005) Forensic DNA Typing, 2nd Edition, Table 20.9, ©Elsevier Science/Academic Press
Calculations for the theoretically most common genotype frequencies and profile frequency based on two most common alleles found in a U.S. Caucasian allele frequency database
6.26 × 10⁻¹²
or 1 in 160 billion
Figure 20.3
U.S. Population Samples(Appendix II)
0.0000.0500.1000.1500.2000.2500.3000.3500.4000.450
8 9 10 11 12 13 14 15
D13S317 Allele
Freq
uenc
y
African Americans (N=258) Caucasians (N=302) Hispanics (N=140)
**
Butler, J.M. (2005) Forensic DNA Typing, 2nd Edition, Figure 20.3, ©Elsevier Science/Academic Press
Most common two alleles for Caucasians
Theoretical Least Common STR Type
Using 5/2N minimum allele frequency rule
If N = 302, then 5/2N = 0.00828 = p = q
And (2pq)13 = [2 x 0.00828 x 0.00828]13
6.06 x 10-51
or 1 in 1.65 x 1050
J.M. Butler - NJSP 2006 Training Workshop December 5-6, 2006
http://www.cstl.nist.gov/biotech/strbase/training.htm 13
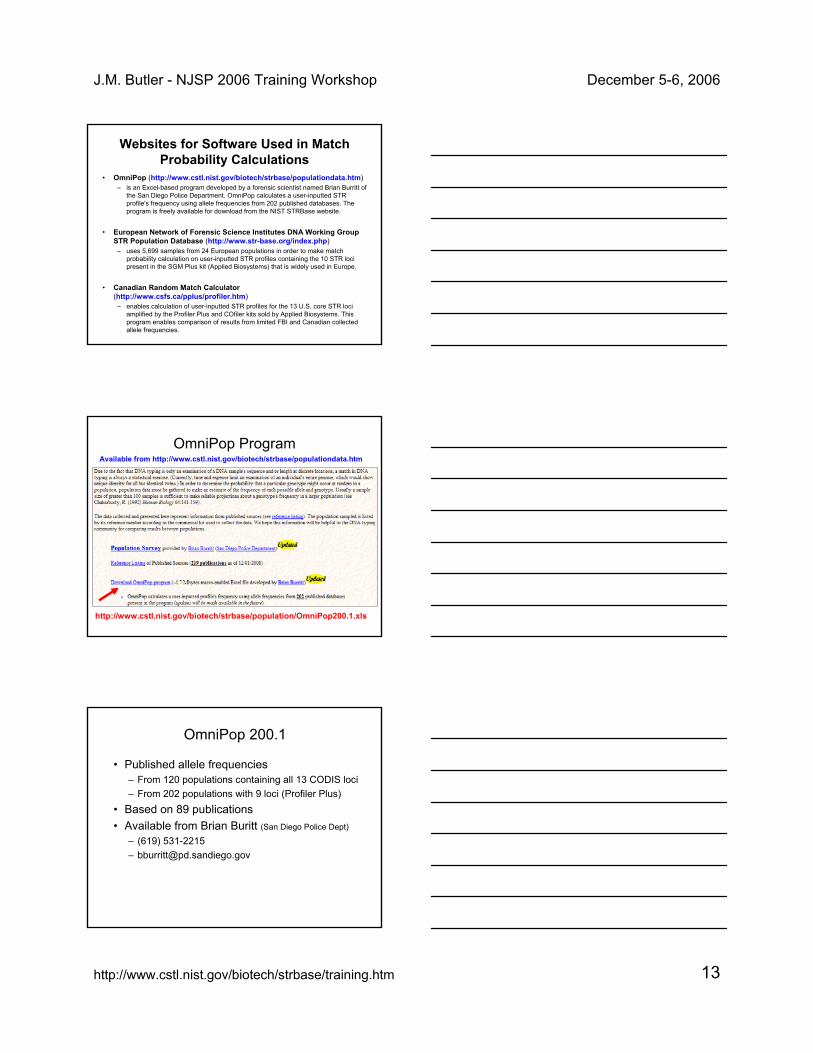
Websites for Software Used in Match Probability Calculations
• OmniPop (http://www.cstl.nist.gov/biotech/strbase/populationdata.htm) – is an Excel-based program developed by a forensic scientist named Brian Burritt of
the San Diego Police Department. OmniPop calculates a user-inputted STR profile's frequency using allele frequencies from 202 published databases. The program is freely available for download from the NIST STRBase website.
• European Network of Forensic Science Institutes DNA Working Group STR Population Database (http://www.str-base.org/index.php)
– uses 5,699 samples from 24 European populations in order to make match probability calculation on user-inputted STR profiles containing the 10 STR loci present in the SGM Plus kit (Applied Biosystems) that is widely used in Europe.
• Canadian Random Match Calculator(http://www.csfs.ca/pplus/profiler.htm)
– enables calculation of user-inputted STR profiles for the 13 U.S. core STR loci amplified by the Profiler Plus and COfiler kits sold by Applied Biosystems. This program enables comparison of results from limited FBI and Canadian collected allele frequencies.
OmniPop Program
http://www.cstl.nist.gov/biotech/strbase/population/OmniPop200.1.xls
Available from http://www.cstl.nist.gov/biotech/strbase/populationdata.htm
OmniPop 200.1
• Published allele frequencies – From 120 populations containing all 13 CODIS loci– From 202 populations with 9 loci (Profiler Plus)
• Based on 89 publications• Available from Brian Buritt (San Diego Police Dept)
– (619) 531-2215 – [email protected]

J.M. Butler - NJSP 2006 Training Workshop December 5-6, 2006
http://www.cstl.nist.gov/biotech/strbase/training.htm 14
OmniPop – Excel programTakes user-inputted STR types and calculates distribution of profile frequencies
OmniPop Plots Profile Frequency Distributions
120 populations
OmniPop Lists Frequency Calculations for All 120 Populations
7.89E+14Scottish (11)7.68E+14Azores (82)7.59E+14Swiss Caucasian (3)7.43E+14Caucasian (64)6.76E+14Belgian (99)3.43E+14Portuguese (6)1.42E+14Serbian (157)
2.65E+21Apache (2)7.09E+20Navajo (2)6.54E+20Canadian Aboriginal (56)3.77E+20PC/BT-Asian (4)2.02E+20Yupik (Alaska) (60)1.71E+20Inupiat (Alaska) (60)9.65E+18Athabaskan (Alaska) (60)
OmniPop References2-CODIS STR Loci Data from 41 Sample Populations, J Forensic Sci, 2001, 46(3), 453-489.60 - Population studies on three Native Alaska population groups using STR loci, FSI, 2002, p51-5764 - Allele Frequencies for 15 Autosomal STR Loci in U.S. Caucasian, African American, and Hispanic Populations, JFS, 2003, p908-911157 - Allele frequencies of the 15 AmpFlSTR Identifiler loci in the population of Vojvodina Province, Serbia and Montenegro, IJLM, 2004, 184-186
Most Common Profile Frequencies Least Common Profile Frequencies

J.M. Butler - NJSP 2006 Training Workshop December 5-6, 2006
http://www.cstl.nist.gov/biotech/strbase/training.htm 15
STR Cumulative Profile Frequency with Multiple Population Databases
Butler, J.M. (2005) Forensic DNA Typing, 2nd Edition, D.N.A. Box 21.1, ©Elsevier Science/Academic Press
1014 to 1021
6.26 × 10⁻¹²
or 1 in 160 billion
6.06 x 10-51
or 1 in 1.65 x 1050
Observed RMP Range
Theoretical RMP Range
DNA Advisory Board Statistics Article
http://www.fbi.gov/hq/lab/fsc/backissu/july2000/dnastat.htm
Discusses•Source attribution or identity•Cases where relatives may be involved•Interpretation of mixtures•Significance of a match derived through a DNA database search
Impact of Relatedness on Match Probabilities

J.M. Butler - NJSP 2006 Training Workshop December 5-6, 2006
http://www.cstl.nist.gov/biotech/strbase/training.htm 16
NRC II Recommendations for Estimating Random-Match Probabilities
When Relatives May Be Involved
Butler, J.M. (2005) Forensic DNA Typing: Biology, Technology, and Genetics of STR Markers, 2nd Edition, Elsevier: New York; Appendix VI, pp.623-625
Example Calculations with Corrections for Relatives
Effects of Family Relatedness on Match Probabilities
Butler, J.M. (2005) Forensic DNA Typing, 2nd Edition, Table 21.7, ©Elsevier Science/Academic Press
Form
ula
from
Wei
r, B
.S. (
2003
) For
ensi
cs. I
n B
aldi
ng, D
.J.,
Bis
hop,
M. a
nd C
anni
ngs,
C. (
eds)
Han
dboo
k of
S
tatis
tical
Gen
etic
s, 2
nd E
ditio
n, p
p. 8
30–8
52. H
obok
en, N
J: J
ohn
Wile
y &
Son
s., p
. 839
p = 0.23179
p = 0.33940q = 0.04801
J.M. Butler - NJSP 2006 Training Workshop December 5-6, 2006
http://www.cstl.nist.gov/biotech/strbase/training.htm 17
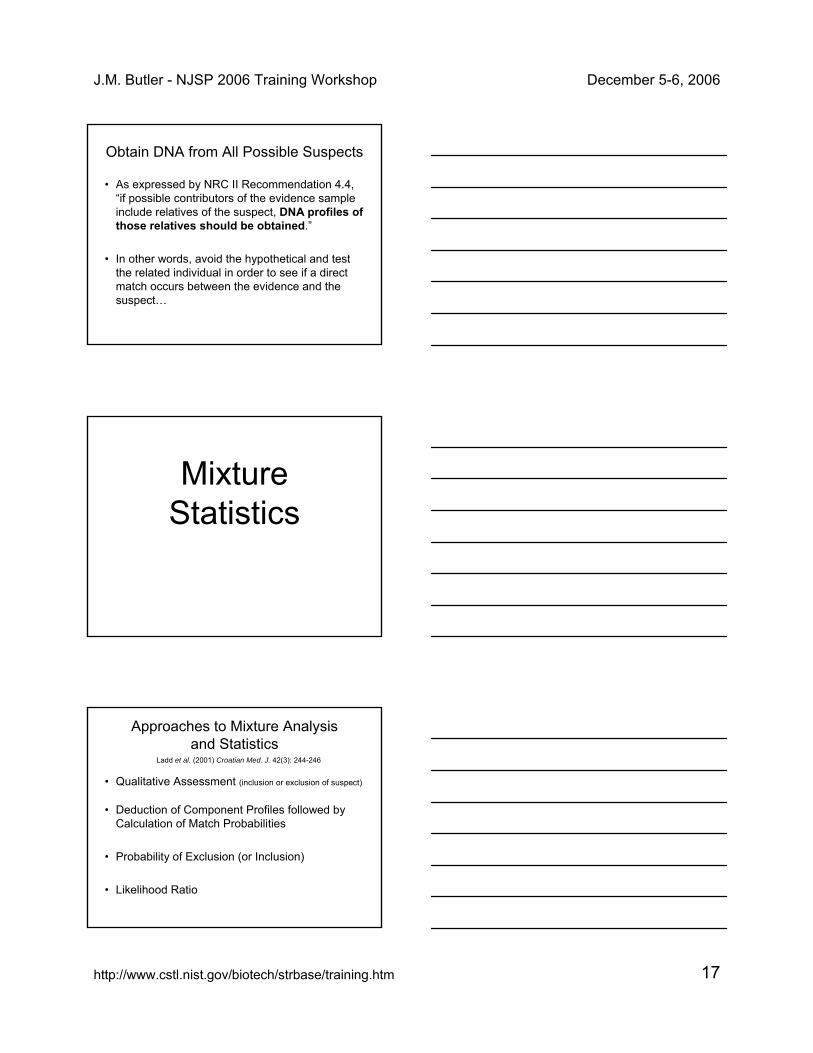
Obtain DNA from All Possible Suspects
• As expressed by NRC II Recommendation 4.4, “if possible contributors of the evidence sample include relatives of the suspect, DNA profiles of those relatives should be obtained.”
• In other words, avoid the hypothetical and test the related individual in order to see if a direct match occurs between the evidence and the suspect…
Mixture Statistics
Approaches to Mixture Analysis and Statistics
• Qualitative Assessment (inclusion or exclusion of suspect)
• Deduction of Component Profiles followed by Calculation of Match Probabilities
• Probability of Exclusion (or Inclusion)
• Likelihood Ratio
Ladd et al. (2001) Croatian Med. J. 42(3): 244-246

J.M. Butler - NJSP 2006 Training Workshop December 5-6, 2006
http://www.cstl.nist.gov/biotech/strbase/training.htm 18
ISFG Recommendations on Mixture InterpretationJuly 13, 2006 issue of Forensic Science International
Discuss probability of exclusion and likelihood ratio methods
Statistical Calculations for Lineage Markers
Y-Chromosome and Mitochondrial DNA
Counting Method Typically Used for Lineage Markers
• Number of times that a particular DNA type occurs in a population database (frequency point estimate)
• Sampling corrections can be made with 95% confidence interval around the frequency point estimate
Related Documents