Statistics and Inferences Review •Get out two sheets of paper •Name, date, period on the top right corner of you paper.

Welcome message from author
This document is posted to help you gain knowledge. Please leave a comment to let me know what you think about it! Share it to your friends and learn new things together.
Transcript
Statistics and Inferences
Review
•Get out two sheets of paper
•Name, date, period on the top
right corner of you paper.

1. Put the data set in order and find
the median and the mean of the
data set.
30, 15, 27, 16, 42

2. Find 5 number summary of the
data set (same data set)
30, 15, 27, 16, 42
Min
(Smallest)
Lower Quartile (Q1)
Median (Q2)
Upper Quartile (Q3)
Maximum (Largest)

3. Make a box and Whisker Plot
with your 5 number summary.
• Remember, your number line needs to go
from the minimum to the maximum, using
a steady interval.

4. Does this data set have an
outlier?
5. What is the best measure to use
for this set of data? Why?
Let’s Check
Put your pencil to the side
Get our your marker or red pen.
Go over your answers.
If it was incorrect, mark it wrong and make corrections in pen or marker.

1. Put the data set in order and find
the median and the mean of the
data set.30, 15, 27, 16, 42
15, 16, 27, 30, 42
Median = 27
Mean = 36
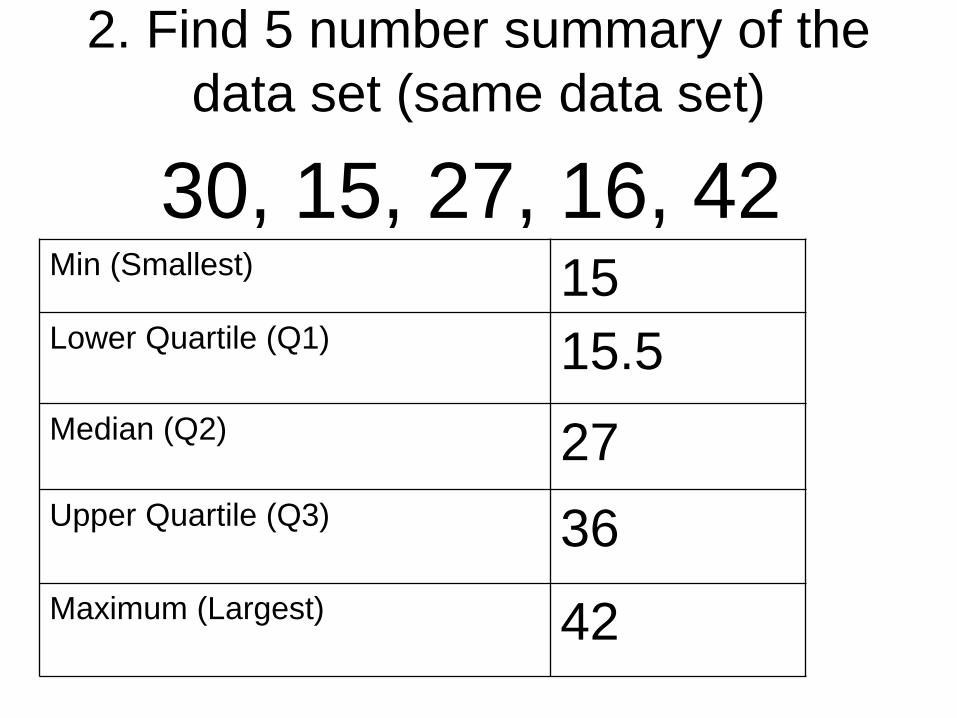
2. Find 5 number summary of the
data set (same data set)
30, 15, 27, 16, 42Min (Smallest) 15Lower Quartile (Q1) 15.5
Median (Q2) 27
Upper Quartile (Q3) 36
Maximum (Largest) 42

3. Make a box and Whisker Plot
with your 5 number summary.
• Remember, your number line needs to go
from the minimum to the maximum, using
a steady interval.
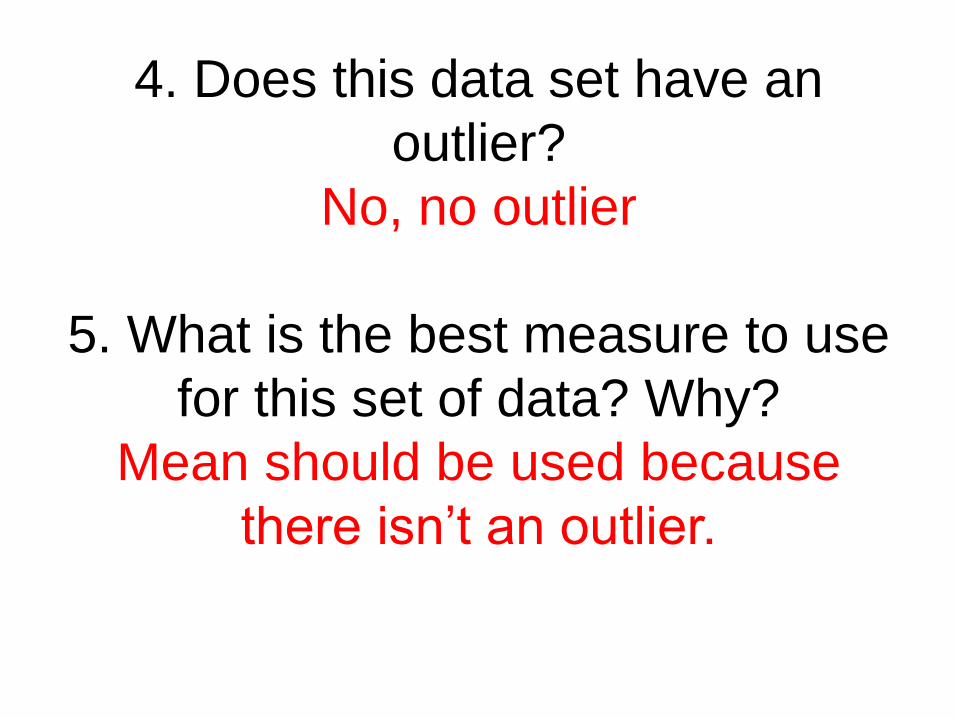
4. Does this data set have an
outlier?
No, no outlier
5. What is the best measure to use
for this set of data? Why?
Mean should be used because
there isn’t an outlier.

Put your marker away, and let’s
practice some more!

6. What is central tendency or
measure of center?

7. What is mean?
How do you find it?

8.What is the
median? How do you
find it?

9. What do you find the median of a
data set if there are more than one
number in the middle of the data
set?2 5 6 12 15 18

10. What is the mode?

11. Which measure of
central tendency is
affected by outliers?
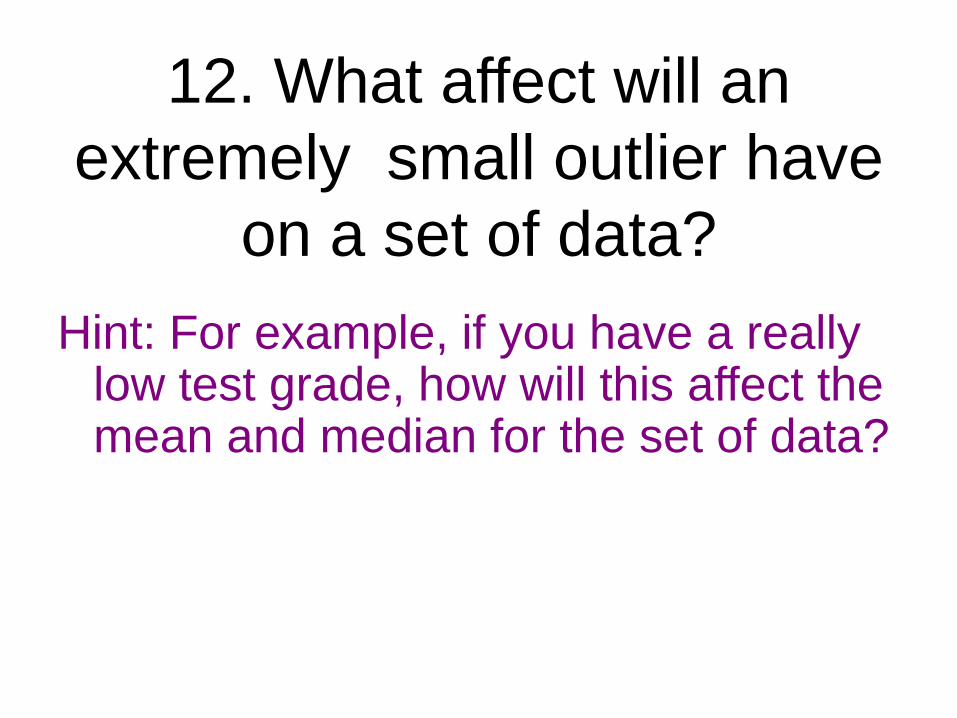
12. What affect will an
extremely small outlier have
on a set of data?
Hint: For example, if you have a really low test grade, how will this affect the mean and median for the set of data?

13. How will really large outliers
affect the mean and median of a
set of data?

Let’s Check
Put your pencil to the side
Get our your marker or red pen.
Go over your answers.
If it was incorrect, mark it wrong and make corrections in pen or marker.

6. What is central tendency or
measure of center?
• It refers to the middle or center of the data.
7.What is mean?
How do you find it?
• It is called the average.
• You add up all the numbers to find a sum.
• You divide the sum by the total numbers in
the data set.

8. What is the median? How do you
find it?
• It is the middle of the data.
• You put the numbers in order and
eliminate one on each side of the data
until you find the middle.

9. What do you find the median of a
data set if there are more than one
number in the middle of the data
set?2 5 6 12 15 18
Find the mean of those two numbers by adding them up and dividing by two.
6 + 12 = 1818/2 = 9The median would be 9
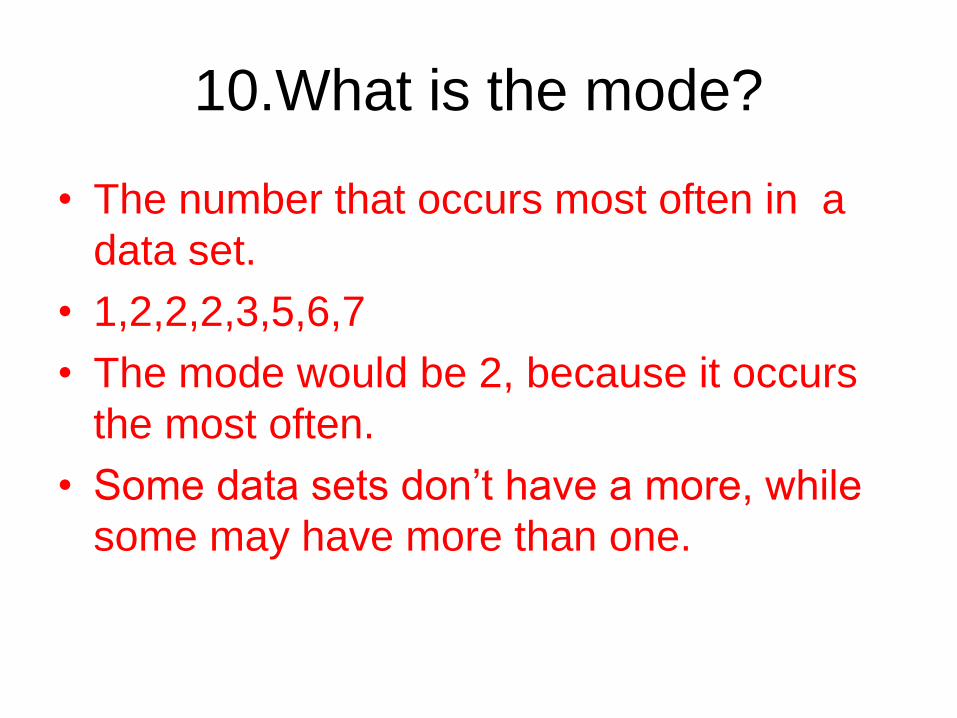
10.What is the mode?
• The number that occurs most often in a
data set.
• 1,2,2,2,3,5,6,7
• The mode would be 2, because it occurs
the most often.
• Some data sets don’t have a more, while
some may have more than one.

11. Which measure of central
tendency is affected by outliers?
Hint: If you made a really low grade, what is
going to affected the most? (Mean or
Median)
The mean is affected by outliers. The mean
of the test scores will go down.
The median is not affected by outliers?

12. What affect will an extremely small
outlier have on a set of data?
Hint: For example, if you have a really low test grade, how
will this affect the mean and median for the set of data?
The small outlier will bring down the
mean (average).
The median will not really be affected.

13. How will really large outliers affect
the mean and median of a set of data?
• The large outlier will cause the mean
(average) to increase.
• It will not really affect the median.

Put your marker away, and let’s
practice some more!

14. Which measure of central tendency
should we use for this data set? Why?

15. Which measure of central tendency
should be used to describe this data set?

16. This line plot has an outlier. Which
measure of central tendency best
describes the data?

17. Which measure of central tendency
should be used to describe this data set?

18. Find the mean of the data
set
You can find the sum of each line of
numbers
For example:
2 Occurs 5 times, so 2X5
= 10
(24 total pieces
of data)
10

19. Create a line plot with the data.
• 2, 3, 3, 6, 6, 6, 6, 8, 9, 10, 10,
14

20. Find the median of the line plot
you just created.
• ** Use the line plot to find the median.
• Eliminate one on each side until you reach the middle.
Remember to start at the top of each row.

21. Which measure of center
should we use for this line plot?

Let’s Check
Put your pencil to the side
Get our your marker or red pen.
Go over your answers.
If it was incorrect, mark it wrong and make corrections in pen or marker.
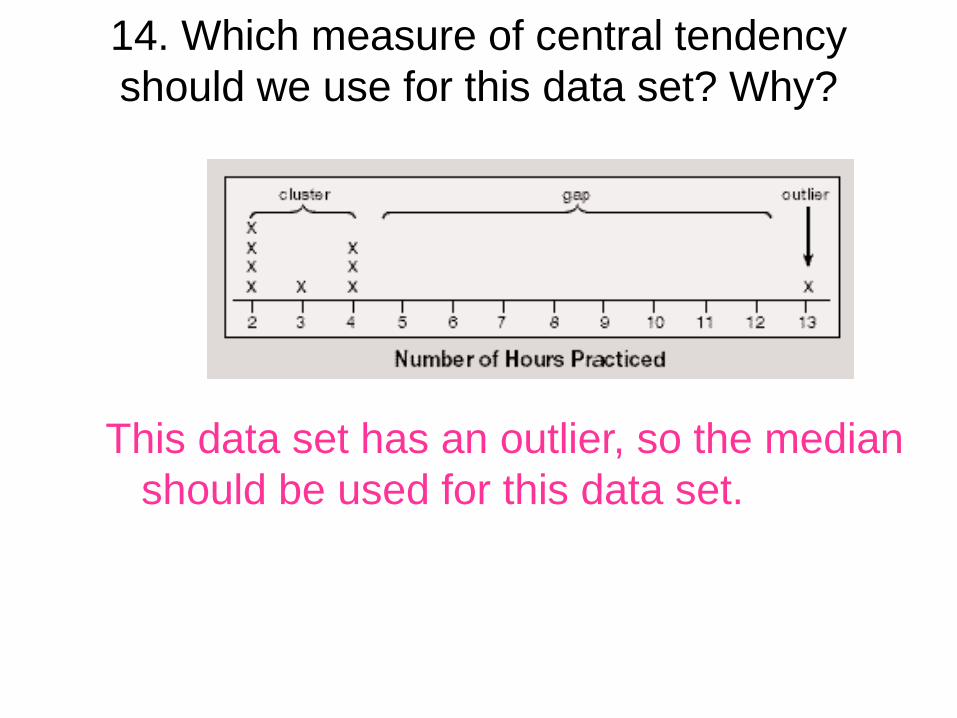
14. Which measure of central tendency
should we use for this data set? Why?
This data set has an outlier, so the median
should be used for this data set.

15. Which measure of central tendency
should be used to describe this data set?
The mean because it data set does not have an outlier.

16. This line plot has an outlier. Which
measure of central tendency best
describes the data?The median because there is an outlier in the
data set.

17. Which measure of central tendency
should be used to describe this data set?
The median should be used because the data
set has an outlier.

18. Find the mean of the data
set
3 + 10 + 18+16+15+12 + 10
You can find the sum of each line of
numbers
For example:
2 Occurs 5 times, so 2X5
= 10
= 84
---------- = 3.5
24(24 total pieces of data –
count the number of Xs)

19. Create a line plot with the data.
• 2, 3, 3, 6, 6, 6, 6, 8, 9, 10, 10,
14

20. Find the median of the line plot
you just created.
The median is in
between 6 and 6, so
it’s 6

21. Which measure of center
should we use for this line plot?
• The data is spread out. We should use
mean, because there aren’t any outliers.

Put your marker away, and let’s
practice some more!
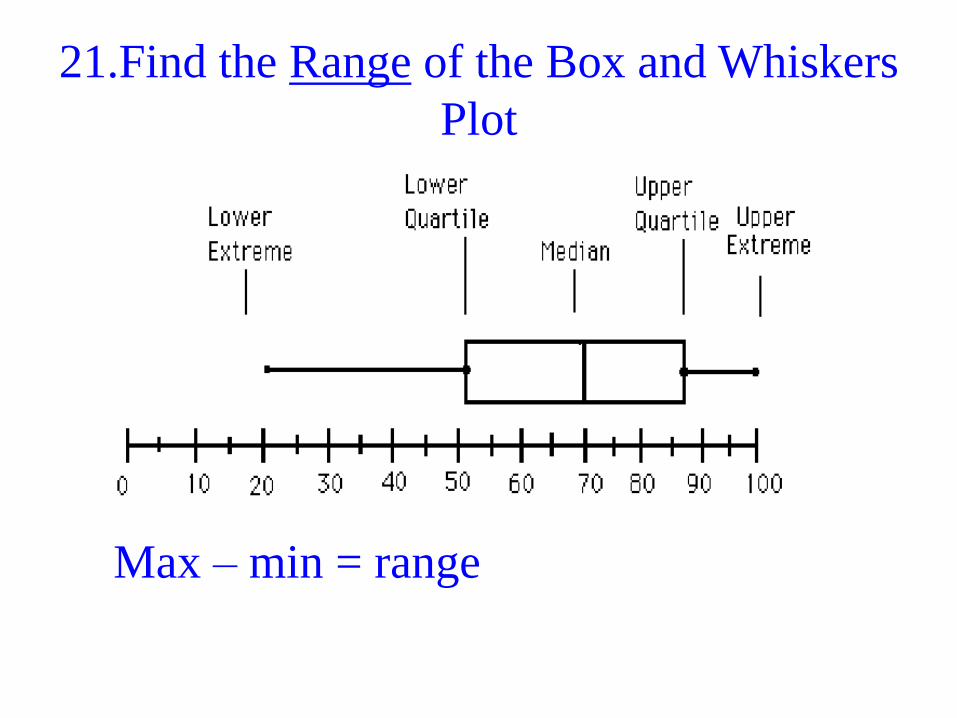
21.Find the Range of the Box and Whiskers
Plot
Max – min = range

22. Find the Interquartile Range of the B&W Plot
UQ – LQ = IQR

Use the box-and-whisker plots below to answer each question.
23.
Course 2
7-5 Box-and-Whisker Plots
Which set of heights of players has a greater median?
64 66 68 70 72 74 76 78 80 82 84 86 t Heights of Basketball and Baseball Players (in.)
Basketball Players
Baseball Players

Use the box-and-whisker plots below to answer each question.
24.
Course 2
7-5 Box-and-Whisker Plots
Which shoe store has a greater median?
20 24 26 28 30 32 34 36 38 40 42 44 t Number of Shoes Sold in One Week at Each Store
Maroon’s Shoe Store
Sage’s Shoe Store

25.What is the range of the box known
as?

Use the box-and-whisker plots below to answer each question.
26.
Course 2
7-5 Box-and-Whisker Plots
Which shoe store has a greater interquartile range?
20 24 26 28 30 32 34 36 38 40 42 44 t Number of Shoes Sold in One Week at Each Store
Maroon’s Shoe Store
Sage’s Shoe Store

27.
Course 2
7-5 Box-and-Whisker Plots
Which team is more consistent? Why?
64 66 68 70 72 74 76 78 80 82 84 86 t Heights of Basketball and Baseball Players (in.)
Basketball Players
Baseball Players

28. Fill in the sentence..
• The smaller the Interquartile Range, the
more ______________ the data.

29. Fill in the sentence..
• The higher the Interquartile Range, the
more ______________ the data.

Let’s Check
Put your pencil to the side
Get our your marker or red pen.
Go over your answers.
If it was incorrect, mark it wrong and make corrections in pen or marker.
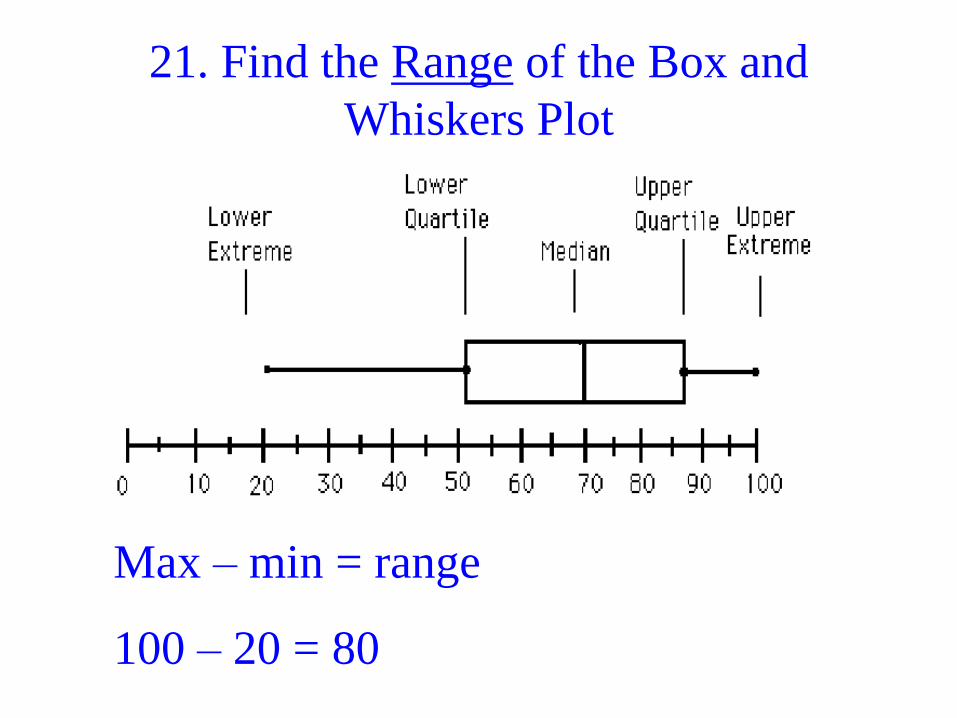
21. Find the Range of the Box and
Whiskers Plot
Max – min = range
100 – 20 = 80
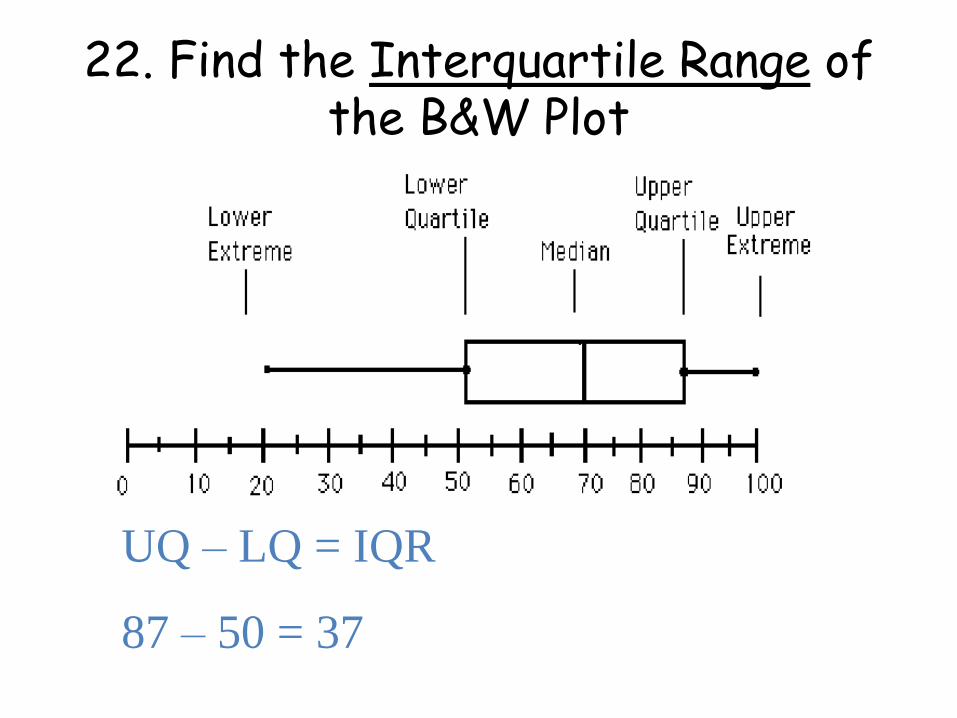
22. Find the Interquartile Range of the B&W Plot
UQ – LQ = IQR
87 – 50 = 37

Use the box-and-whisker plots below to answer each question.
23.
Course 2
7-5 Box-and-Whisker Plots
Which set of heights of players has a greater median?
The Basketball Players
64 66 68 70 72 74 76 78 80 82 84 86 t Heights of Basketball and Baseball Players (in.)
Basketball Players
Baseball Players

Use the box-and-whisker plots below to answer each question.
24.
Course 2
7-5 Box-and-Whisker Plots
Which shoe store has a greater median?
Sage’s Shoe Store
20 24 26 28 30 32 34 36 38 40 42 44 t Number of Shoes Sold in One Week at Each Store
Maroon’s Shoe Store
Sage’s Shoe Store

25.What is the range of the box known
as?
• Interquartile range

Use the box-and-whisker plots below to answer each question.
26.
Course 2
7-5 Box-and-Whisker Plots
Which shoe store has a greater interquartilerange?
Maroon’s shoe store has a longer box, so it has a greater interquartile range.
20 24 26 28 30 32 34 36 38 40 42 44 t Number of Shoes Sold in One Week at Each Store
Maroon’s Shoe Store
Sage’s Shoe Store

27.
Course 2
7-5 Box-and-Whisker Plots
Which team is more consistent? Why?
The Baseball players because they have a smaller range and interquartile range .
64 66 68 70 72 74 76 78 80 82 84 86 t Heights of Basketball and Baseball Players (in.)
Basketball Players
Baseball Players

28. Fill in the sentence..
• The smaller the Interquartile Range, the
more Consistent the data.
29. Fill in the sentence..
• The higher the Interquartile Range, the
more inconsistent the data.

Put your marker away, and let’s
practice some more!

The following slides are a review about
how to find the MAD
(mean absolute deviation).
Just read them and refresh your
memory..
You don’t have to take notes.

Mean Absolute DeviationAnother way to evaluate consistency in
data

Random Survey
• Find the mean of the
data set
The mean is 56

Mean Absolute Deviation
How far away are each piece
of data from the mean?
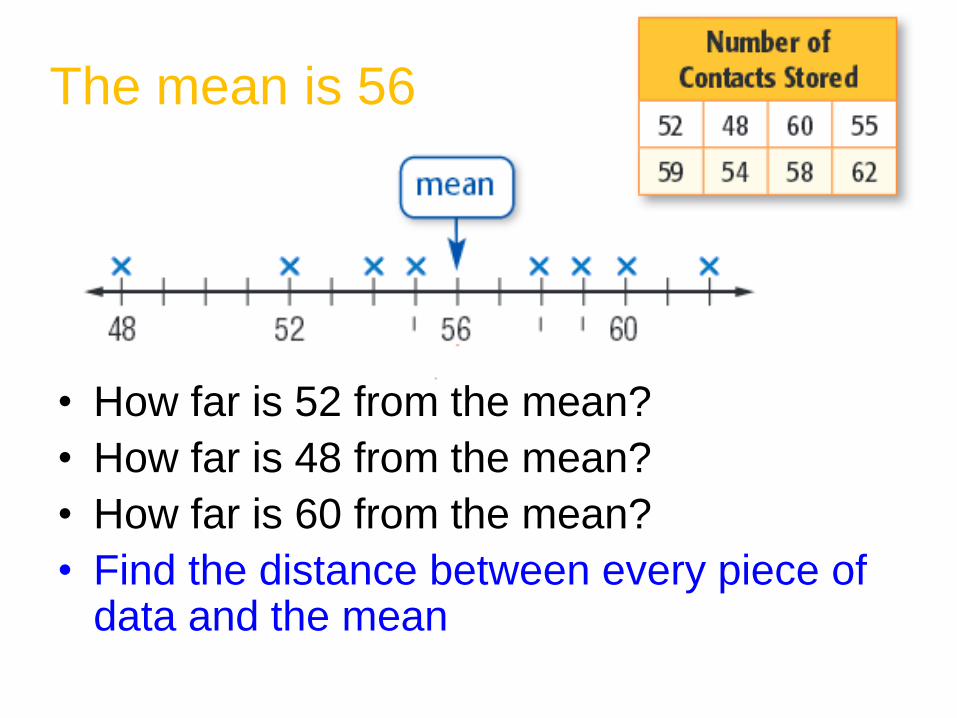
The mean is 56
• How far is 52 from the mean?
• How far is 48 from the mean?
• How far is 60 from the mean?
• Find the distance between every piece of data and the mean

Find out how far away each data
set is from the mean.
56
-
56
-
-56
56
-
-56
56
-
- 56 - 56

Now find the average or mean of these
numbers:
4 + 8 + 4 + 1 + 3 + 2 +2 +6
8
4 8 4 1 3 2 2
6

Mean Absolute Deviation
Now find the average or mean of these
numbers:
4 + 8 + 4 + 1 + 3 + 2 +2 +6
8
• = 3.75
• The average distance between each data
value and the mean is 3.75 phone
contacts.
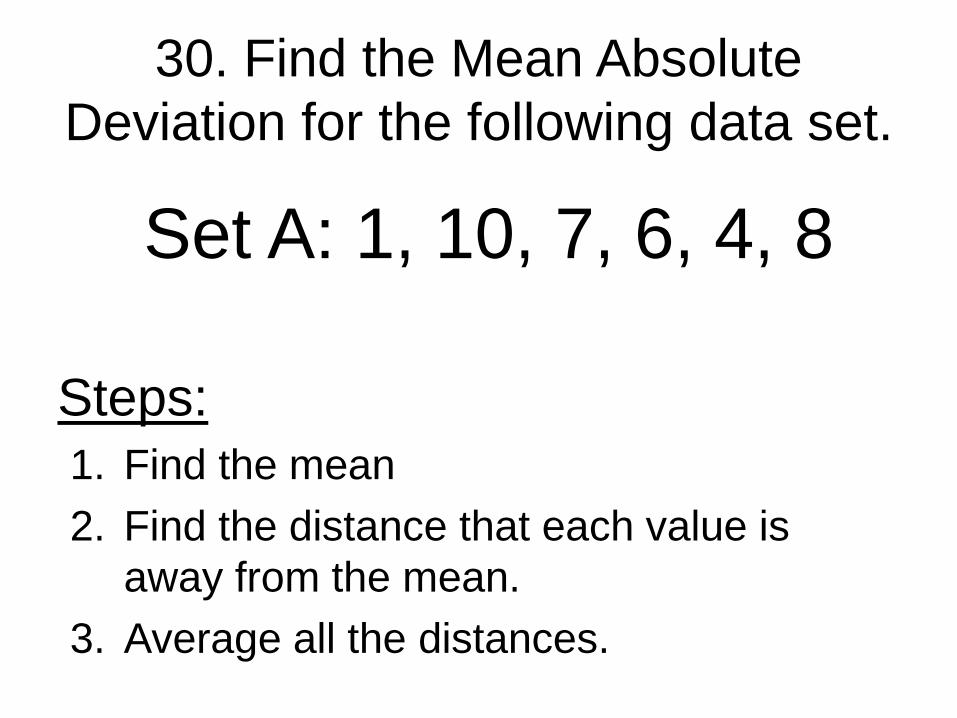
30. Find the Mean Absolute
Deviation for the following data set.
Set A: 1, 10, 7, 6, 4, 8
Steps:
1. Find the mean
2. Find the distance that each value is
away from the mean.
3. Average all the distances.

31. Find the Mean Absolute
Deviation for the following data set.
Set B: 10, 9, 3, 8, 10
Steps:
1. Find the mean
2. Find the distance that each value is
away from the mean.
3. Average all the distances.

32. Which data set is more
consistent, data set A or data set B
(#30 and 31)

Let’s Check
Put your pencil to the side
Get our your marker or red pen.
Go over your answers.
If it was incorrect, mark it wrong and make corrections in pen or marker.

30. Find the Mean Absolute
Deviation for the following data set.
Set A: 1, 10, 7, 6, 4, 8
Mean = 6
5+4+1+0+2+2 = 2.33 = MAD
6
5 4 1 0 2
2
Differences
between each data
set and the mean

31. Find the Mean Absolute
Deviation for the following data set.
Set B: 10, 9, 3, 8, 10
Mean = 8
2+1+5+0+2 = 2 = MAD
5
Differences
between each data
set and the mean
2 1 5 0 2

32. Which data set is more
consistent, data set A or data set B
(#30 and 31)
MAD for Set A = 2.33
MAD for Set B = 2
Data Set B because the MAD is lower.
The lower the MAD, the more consistent the data.

Put your marker away, and let’s
practice some more!
•The next few slides
are review and you
don’t need to take
notes.

Sample is a small group of the
total population
•For a random sample,
members of the population
are chosen at random. This
gives every member of the
population an equal chance
of being chosen.

CONVENIENCE SAMPLE
•A convenience sample is
based on members of the
population that are
conveniently available, such as
30 elk in a wildlife preservation
area.

•A biased sample does not
fairly represent the
population.
• A study of 50 elk belonging to a
breeder could be biased because the
breeder’s elk might be less likely to
have Mad Elk Disease than elk in the
wild.
Which would be better to
have, a random sample or
a convenience sample?

Which would be better to have, a random sample or a convenience sample?
A random sample is more likely to be representative of
a population than a convenience sample is.

The next few slides are questions
that you will answer on your
paper.

Sampling method
Maria surveys only the band students she knows personally.
Results
84% want blue uniforms
Jon writes each band student’s name on a card. He questions those students whose name he draws.
61% want blue uniforms
33. Write down the person’s name and determine what
type of sample they took.
Justify your answer.

Sampling method
Ferdinand surveys every other swimmer on the team.
Results
72% want practice early
Anna-Maria questions the swimmers who are in her Biology class.
50% want practice early
34. Write down the person’s name and determine what type
of sample they took.
Justify your answer.
35. If I wanted to find out what people’s
favorite clothing stores was and I stood
outside American Eagle at the mall, what
kind of sample would I be taking?
Would this be a biased sample?

Using a fair, 6 sided di36. What’s the probability of rolling a 5?
37. What’s the probability of rolling a zero?

Using two fair dice
38. What’s the probability that I will roll a
sum of 6?
39.What’s the probability of rolling a sum of
9?
• You can create a sample space to find all the possible combinations.

40.Kenny is playing basketball. He scores 11
out of 34 baskets. What is the probability
that he will make the next shot?
• (Write the fraction, decimal, and percent)
41. The probability of drawing a green
marble is 6/20. What is the probability of
not drawing a green marble?

Let’s Check
Put your pencil to the side
Get our your marker or red pen.
Go over your answers.
If it was incorrect, mark it wrong and make corrections in pen or marker.

Sampling method
Maria surveys only the band students she knows personally.
Results
84% want blue uniforms
Jon writes each band student’s name on a card. He questions those students whose name he draws.
61% want blue uniforms
33. Write down the person’s name and determine what
type of sample they took.
Justify your answer.
Maria’s sample is a convenience sample – she sampled only people she knew
Jon’s sample is a random sample, because everyone has the chance of being chosen for the survey.

34. Write down the person’s name and determine what type
of sample they took.
Justify your answer.Sampling method
Ferdinand surveys every other swimmer on the team.
Results
72% want practice early
Anna-Maria questions the swimmers who are in her Biology class.
50% want practice early
Ferdinand’s sample is a random sample, giving results that better represent the entire swimming team, so it is the better method.

35. If I wanted to find out what people’s
favorite clothing stores was and I stood
outside American Eagle at the mall, what
kind of sample would I be taking?
Would this be a biased sample?
• Convenience sample
• Biased sample

Using a fair, 6 sided di36. What’s the probability of rolling a 5?
1/6 .166 16.6%
37. What’s the probability of rolling a zero?
0/6 0%

38. What is the probability that you
roll the sum of 6?1 2 3 4 5 6
1 1,
1
2,
1
3,
1
4,
1
5,
1
6,
1
2 1,
2
2,
2
3,
2
4,
2
5,
2
6,
2
3 1,
3
2,
3
3,
3
4,
3
5,
3
6,
3
4 1,
4
2,
4
3,
4
4,
4
5,
4
6,
4
5 1,
5
2,
5
3,
5
4,
5
5,
5
6,
5
6 1,
6
2,
6
3,
6
4,
6
5,
6
6,
6
# outcomes that equal 6
Total # outcomes
5
36 =13.9%

39. What is the probability that you
roll the sum of 9?1 2 3 4 5 6
1 1,
1
2,
1
3,
1
4,
1
5,
1
6,
1
2 1,
2
2,
2
3,
2
4,
2
5,
2
6,
2
3 1,
3
2,
3
3,
3
4,
3
5,
3
6,
3
4 1,
4
2,
4
3,
4
4,
4
5,
4
6,
4
5 1,
5
2,
5
3,
5
4,
5
5,
5
6,
5
6 1,
6
2,
6
3,
6
4,
6
5,
6
6,
6
# outcomes that equal 9
Total # outcomes
4
36 =1
9
11.11%

40.Kenny is playing basketball. He scores 11
out of 34 baskets. What is the probability
that he will make the next shot?
11/34 = .3235 = 32% chance he makes the
shot
• (Write the fraction, decimal, and percent)

41. The probability of drawing a green
marble is 6/20. What is the probability of
not drawing a green marble?
14/20 = .7 = 70%

Related Documents