© 1992-2006 by Smarter Solutions, Inc., All rights reserved. Statistical Testing in Excel

Welcome message from author
This document is posted to help you gain knowledge. Please leave a comment to let me know what you think about it! Share it to your friends and learn new things together.
Transcript
© 1992-2006 by Smarter Solutions, Inc., All rights reserved.
Statistical Testing in Excel
© 1992-2006 by Smarter Solutions, Inc., All rights reserved.
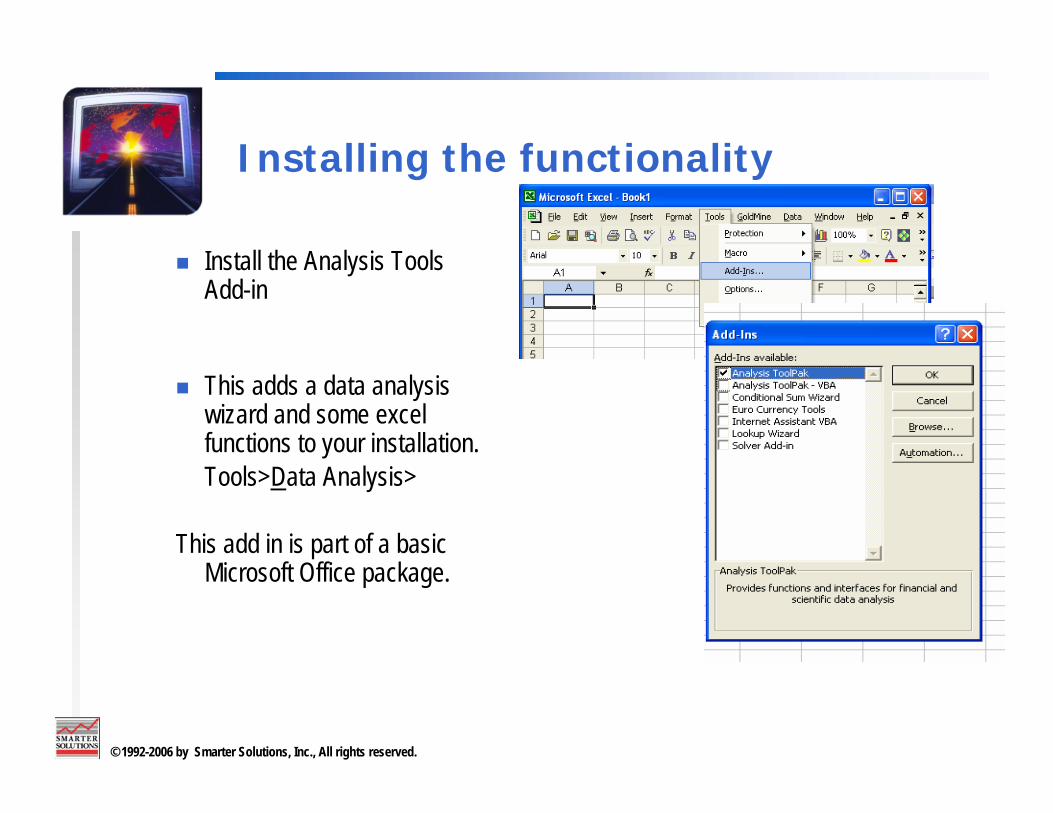
Installing the functionality
Install the Analysis Tools Add-in
This adds a data analysis wizard and some excel functions to your installation.Tools>Data Analysis>
This add in is part of a basic Microsoft Office package.

© 1992-2006 by Smarter Solutions, Inc., All rights reserved.
T-tests
Excel includes three t-tests in the Analysis tool pack
PairedTwo sample – Equal varianceTwo sample – unequal variance
The variance assumption is tested with the f-test function discussed later
© 1992-2006 by Smarter Solutions, Inc., All rights reserved.
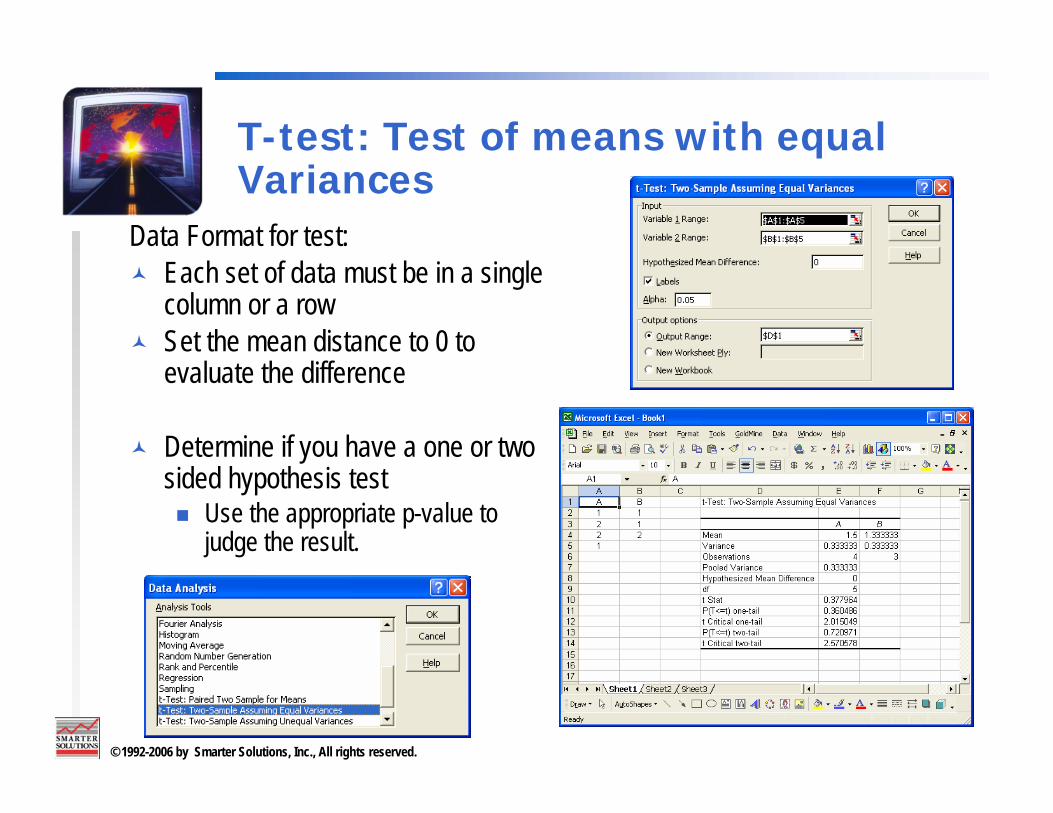
T-test: Test of means with equal Variances
Data Format for test:Each set of data must be in a single column or a rowSet the mean distance to 0 to evaluate the difference
Determine if you have a one or two sided hypothesis test
Use the appropriate p-value to judge the result.
© 1992-2006 by Smarter Solutions, Inc., All rights reserved.
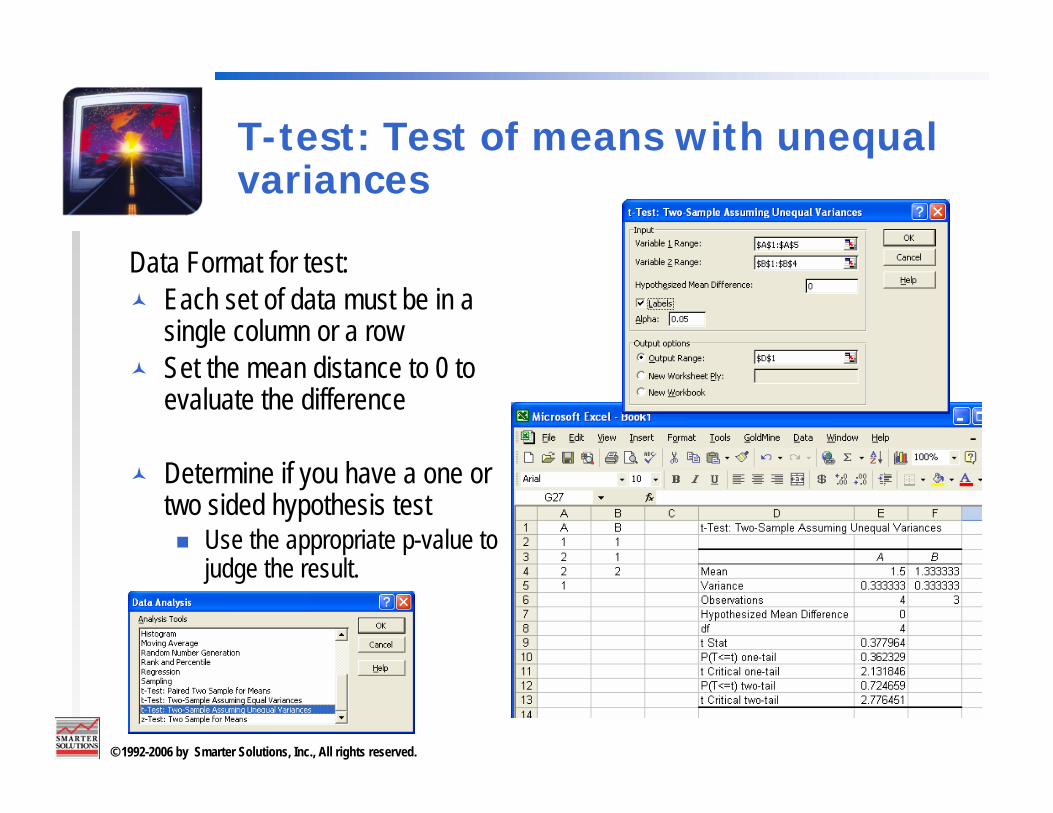
T-test: Test of means with unequal variances
Data Format for test:Each set of data must be in a single column or a rowSet the mean distance to 0 to evaluate the difference
Determine if you have a one or two sided hypothesis test
Use the appropriate p-value to judge the result.

© 1992-2006 by Smarter Solutions, Inc., All rights reserved.
Paired t-test of two means
Data Format for test:Each set of data must be in a single column or a rowSet the mean distance to 0 to evaluate the difference
Determine if you have a one or two sided hypothesis test
Use the appropriate p-value to judge the result.

© 1992-2006 by Smarter Solutions, Inc., All rights reserved.
T-test with a function
The t-test is also available with a single function
=ttest(array1,array2,tails,type)
Array1 and array2 are each a row (or column) of data
If tails = 1, TTEST uses the one-tailed distribution. If tails = 2, TTEST uses the two-tailed distribution.
If type = 1, the paired t-test is usedIf type = 2, the two sample, equal variance test is usedIf type = 3, the two sample, unequal variance test is used
The function returns the p-value of the
specified test.

© 1992-2006 by Smarter Solutions, Inc., All rights reserved.
F-test: Test for Equal Variance
Data Format for test:Each set of data must be in a single column or a rowSet the mean distance to 0 to evaluate the difference
Use the appropriate p-value to judge the result.
© 1992-2006 by Smarter Solutions, Inc., All rights reserved.
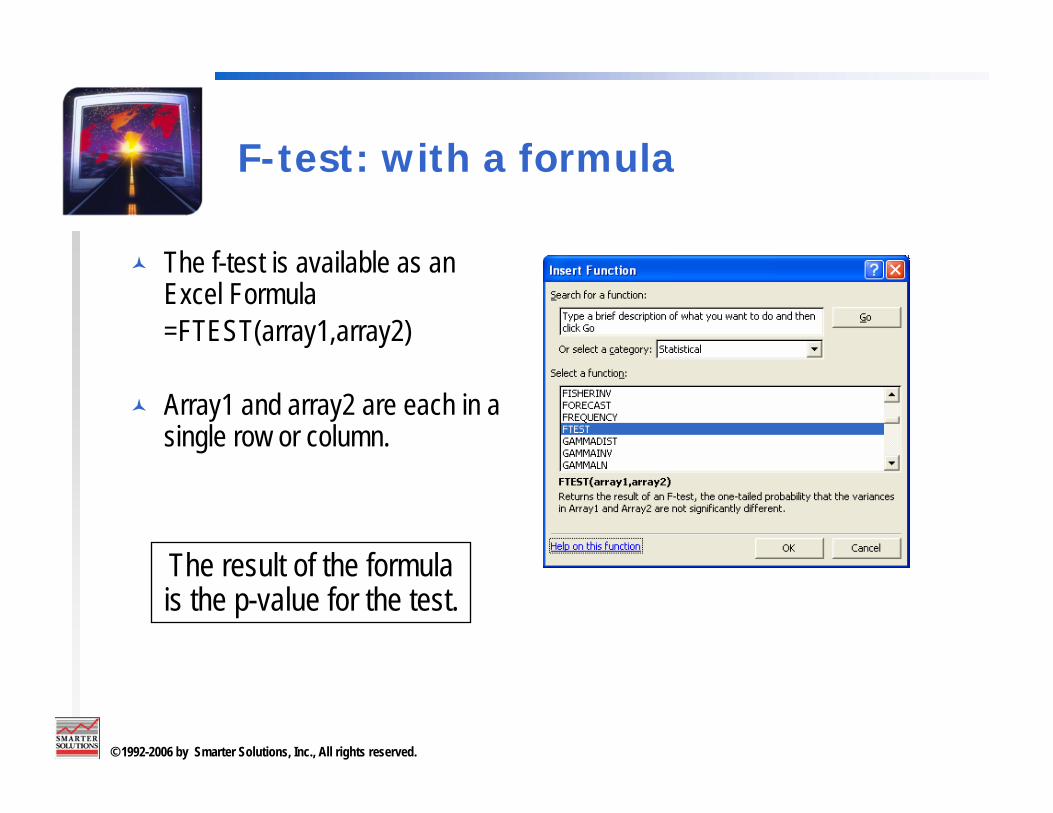
F-test: with a formula
The f-test is available as an Excel Formula=FTEST(array1,array2)
Array1 and array2 are each in a single row or column.
The result of the formula is the p-value for the test.

© 1992-2006 by Smarter Solutions, Inc., All rights reserved.
Regression:
Data formatThe Y data is in a single column of dataThe x data must be in a column of data. One or multiple x columns are allowed.If multiple x terms are used, all columns of x data must be adjacent.
This procedure provides multiple diagnostic charts as options.
Line fit chartResidual plotsProbabiloity plot
© 1992-2006 by Smarter Solutions, Inc., All rights reserved.
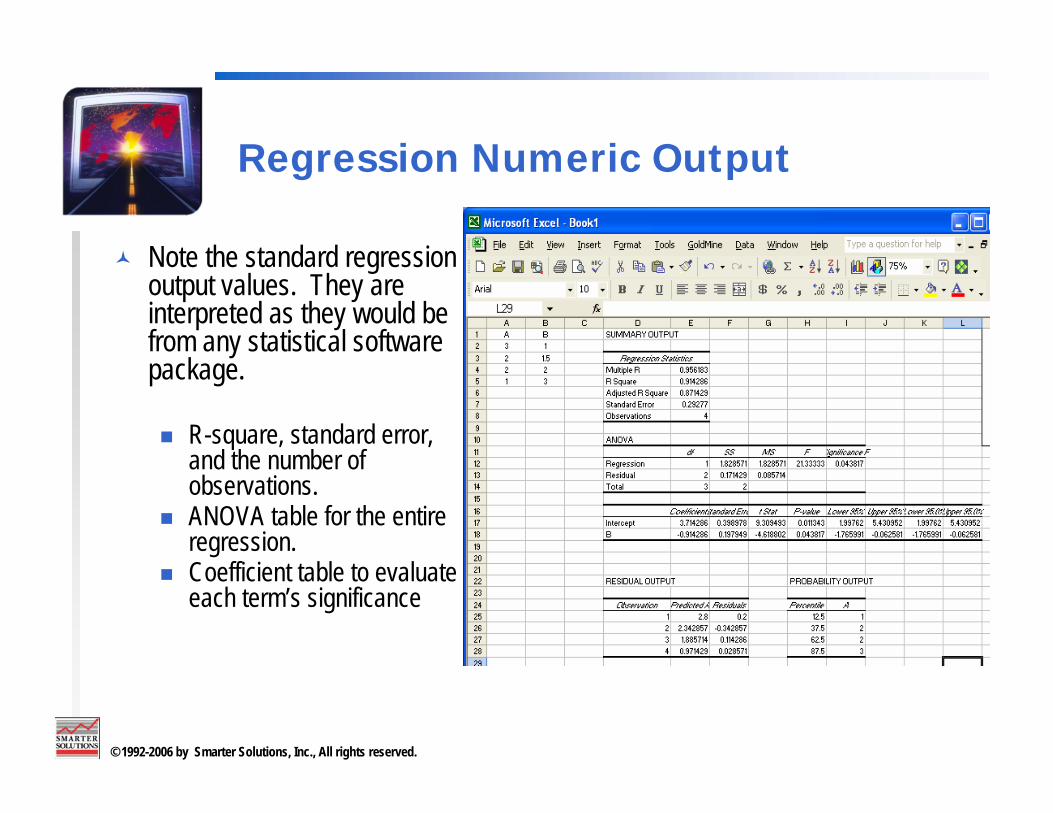
Regression Numeric Output
Note the standard regression output values. They are interpreted as they would be from any statistical software package.
R-square, standard error, and the number of observations.ANOVA table for the entire regression.Coefficient table to evaluate each term’s significance

© 1992-2006 by Smarter Solutions, Inc., All rights reserved.
Regression graphical outputs
B Residual Plot
-0.4
-0.3
-0.2
-0.1
0
0.1
0.2
0.3
0 1 2 3 4
B
Resi
dual
s
B Line Fit Plot
0
0.5
1
1.5
2
2.5
3
3.5
0 1 2 3 4
B
A
APredicted A
Normal Probability Plot
0
0.5
1
1.5
2
2.5
3
3.5
0 20 40 60 80 100
Sample Percentile
A
Three general plots are available. The normal probability plot has the axis flipped from the minitab format.All others are as expected, but you may want to change the backgrounds or modify the charts to have trend or regression lines.
© 1992-2006 by Smarter Solutions, Inc., All rights reserved.
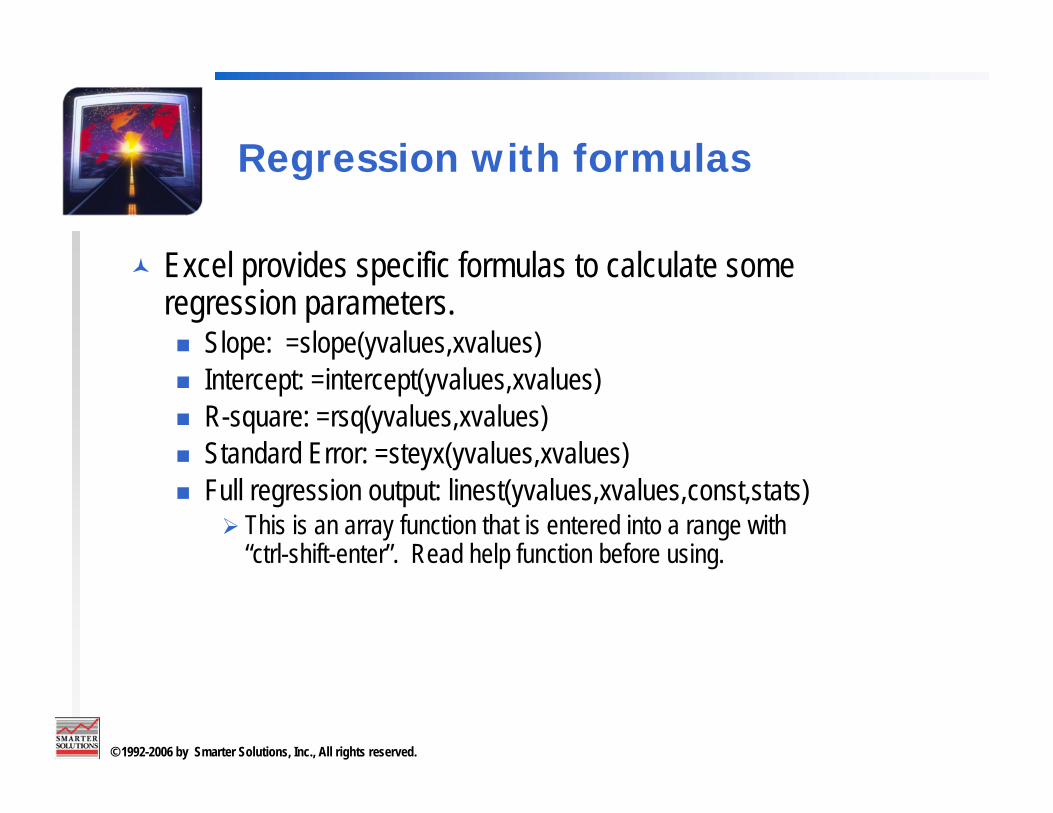
Regression with formulas
Excel provides specific formulas to calculate some regression parameters.
Slope: =slope(yvalues,xvalues)Intercept: =intercept(yvalues,xvalues)R-square: =rsq(yvalues,xvalues)Standard Error: =steyx(yvalues,xvalues)Full regression output: linest(yvalues,xvalues,const,stats)
This is an array function that is entered into a range with “ctrl-shift-enter”. Read help function before using.
© 1992-2006 by Smarter Solutions, Inc., All rights reserved.
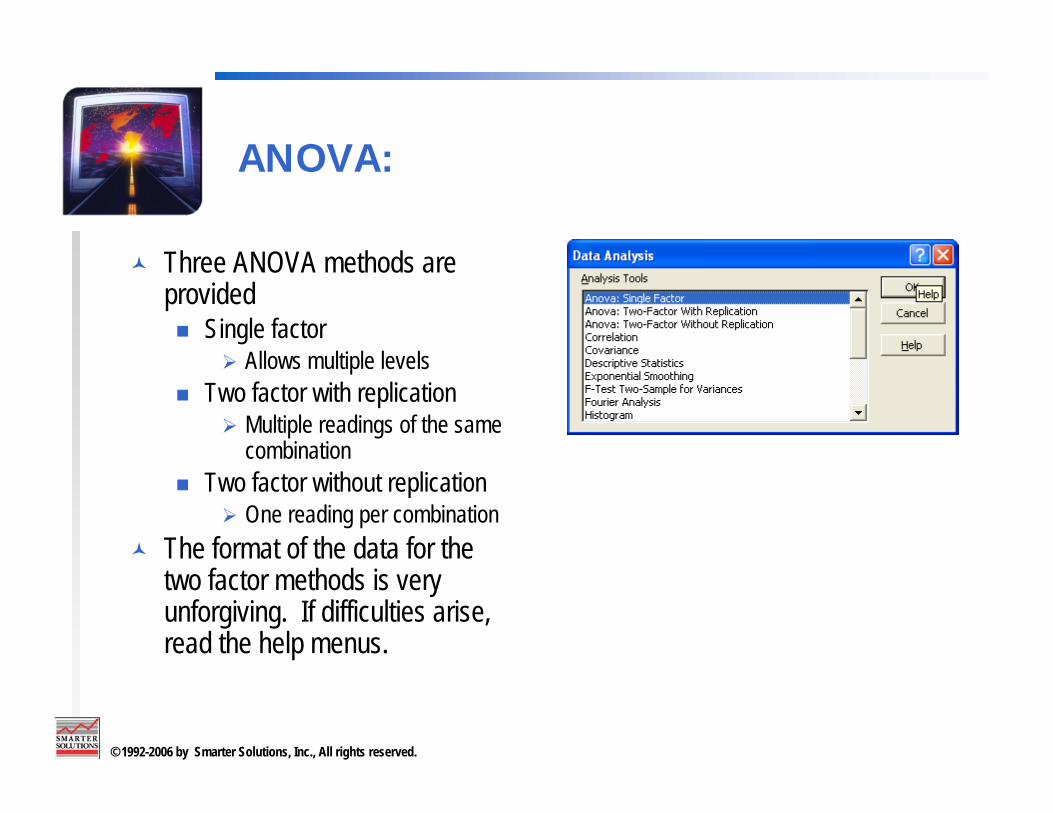
ANOVA:
Three ANOVA methods are provided
Single factor Allows multiple levels
Two factor with replicationMultiple readings of the same combination
Two factor without replicationOne reading per combination
The format of the data for the two factor methods is very unforgiving. If difficulties arise, read the help menus.

© 1992-2006 by Smarter Solutions, Inc., All rights reserved.
One way ANOVA
This is to compare multiple groups of data from the same factor.
Each group must be in adjacent columns or rows.All groups must have the same number of values.
The p-value is used to
evaluate the significance
© 1992-2006 by Smarter Solutions, Inc., All rights reserved.
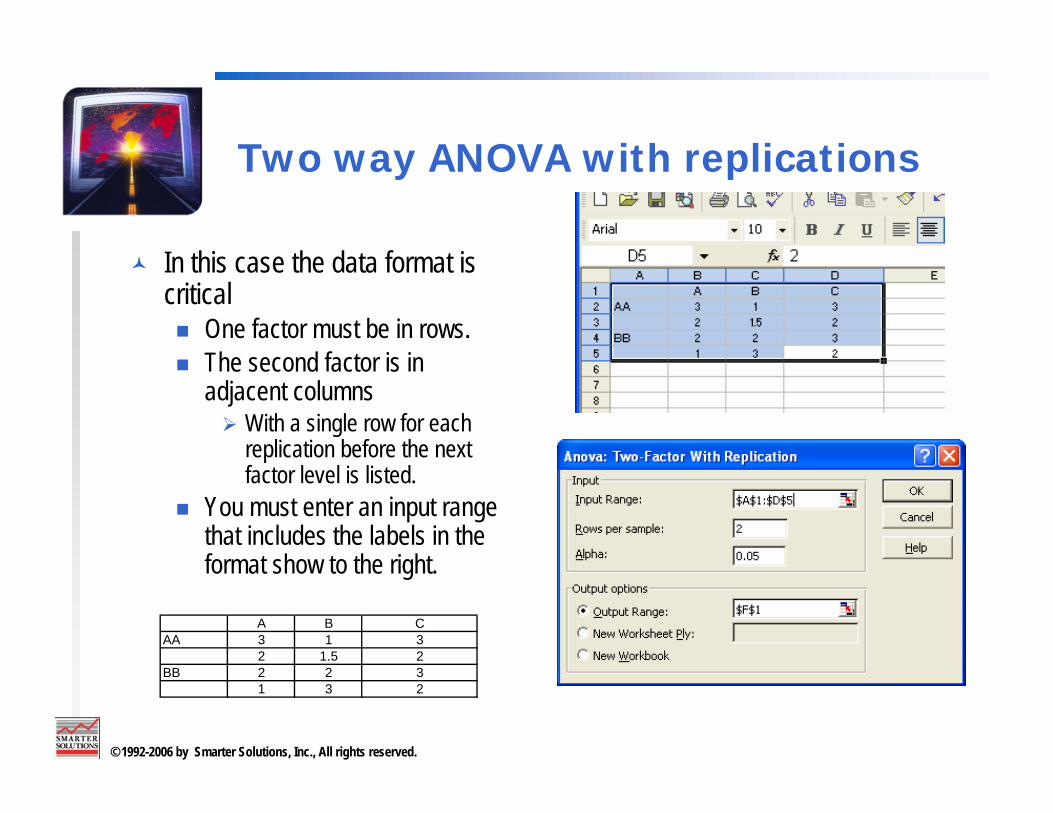
Two way ANOVA with replications
In this case the data format is critical
One factor must be in rows.The second factor is in adjacent columns
With a single row for each replication before the next factor level is listed.
You must enter an input range that includes the labels in the format show to the right.
A B CAA 3 1 3
2 1.5 2BB 2 2 3
1 3 2

© 1992-2006 by Smarter Solutions, Inc., All rights reserved.
Two-way ANOVA with replications –output.
The output of the ANOVA includes information of every combination of each factor being evaluated.The ANOVA table is included which includes an interaction and within group error estimates.
Note that all F tests are a comparison of the within group variance estimate.
Anova: Two-Factor With Replication
SUMMARY A B C TotalAA
Count 2 2 2 6Sum 5 2.5 5 12.5Average 2.5 1.25 2.5 2.083333Variance 0.5 0.125 0.5 0.641667
BBCount 2 2 2 6Sum 3 5 5 13Average 1.5 2.5 2.5 2.166667Variance 0.5 0.5 0.5 0.566667
TotalCount 4 4 4Sum 8 7.5 10Average 2 1.875 2.5Variance 0.666667 0.729167 0.333333
ANOVASource of Variation SS df MS F P-value F critSample 0.020833 1 0.020833 0.047619 0.834492 5.987374Columns 0.875 2 0.4375 1 0.421875 5.143249Interaction 2.541667 2 1.270833 2.904762 0.131146 5.143249Within 2.625 6 0.4375
Total 6.0625 11
© 1992-2006 by Smarter Solutions, Inc., All rights reserved.
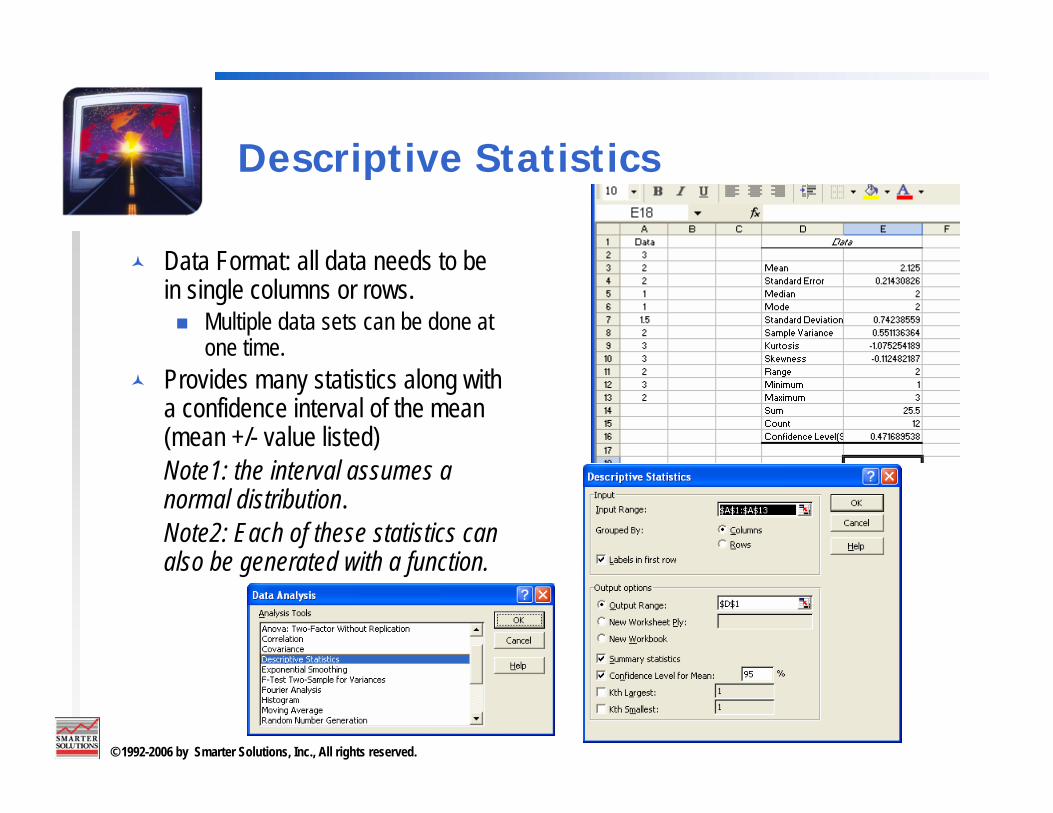
Descriptive Statistics
Data Format: all data needs to be in single columns or rows.
Multiple data sets can be done at one time.
Provides many statistics along with a confidence interval of the mean (mean +/- value listed)Note1: the interval assumes a normal distribution.Note2: Each of these statistics can also be generated with a function.
Related Documents