Statistical Statistical Strategies Used in Strategies Used in Project Empowerment Project Empowerment Research Research Jessica M. Ketchum Jessica M. Ketchum Assistant Professor Assistant Professor Virginia Commonwealth Virginia Commonwealth University University

Statistical Strategies Used in Project Empowerment Research Jessica M. Ketchum Assistant Professor Virginia Commonwealth University.
Dec 14, 2015
Welcome message from author
This document is posted to help you gain knowledge. Please leave a comment to let me know what you think about it! Share it to your friends and learn new things together.
Transcript

Statistical Strategies Statistical Strategies Used in Project Used in Project
Empowerment ResearchEmpowerment Research
Jessica M. KetchumJessica M. Ketchum
Assistant ProfessorAssistant Professor
Virginia Commonwealth Virginia Commonwealth UniversityUniversity
Statistics and ResearchStatistics and Research
Statistics is one of the many tools you will Statistics is one of the many tools you will need to conduct quality research.need to conduct quality research.
It is essential that you acquire some basic It is essential that you acquire some basic training in statistics to better conduct you training in statistics to better conduct you research.research.– AnalysisAnalysis– CommunicationCommunication– InterpretationInterpretation– LimitationsLimitations
The Scientific MethodThe Scientific Method
The scientific method is the process The scientific method is the process by which scientific information is by which scientific information is collected, analyzed, and reported in collected, analyzed, and reported in order to produce unbiased and order to produce unbiased and replicable results in an effort to replicable results in an effort to provide an accurate representation provide an accurate representation of observable phenomena.of observable phenomena.
The Scientific MethodThe Scientific Method
Recognized universally as the only Recognized universally as the only truly acceptable way to produce new truly acceptable way to produce new scientific understanding of the world scientific understanding of the world around us.around us.
Based on an empirical approachBased on an empirical approach– Decisions and outcomes are based on Decisions and outcomes are based on
datadata
Making an ObservationMaking an Observation
First an observation is made of a First an observation is made of a phenomenon or a group of phenomena.phenomenon or a group of phenomena.
This leads to the formulation of questions This leads to the formulation of questions or uncertainties that can be answered in a or uncertainties that can be answered in a scientifically rigorous way.scientifically rigorous way.
For example, … one may observe that For example, … one may observe that minorities may have worse employment minorities may have worse employment outcomes 1 year post injury than non-outcomes 1 year post injury than non-minorities.minorities.
Formulating a HypothesisFormulating a Hypothesis Next, a scientific hypothesis is formulated to Next, a scientific hypothesis is formulated to
explain an observation and to make quantitative explain an observation and to make quantitative predictions of new observations.predictions of new observations.
Often hypotheses are generated as a result of Often hypotheses are generated as a result of extensive background research and literature extensive background research and literature reviews.reviews.
May be stated as research hypotheses or May be stated as research hypotheses or statistical hypotheses.statistical hypotheses.
The role of the statistician in this step of the SM is The role of the statistician in this step of the SM is to state the hypothesis in a way so that valid to state the hypothesis in a way so that valid conclusions may be drawn and to correctly conclusions may be drawn and to correctly interpret the results of such conclusions.interpret the results of such conclusions.
Designing an ExperimentDesigning an Experiment An experiment is then designed that will An experiment is then designed that will
yield the data necessary to validly test an yield the data necessary to validly test an appropriate statistical hypothesis.appropriate statistical hypothesis.
Improperly designed experiments are the Improperly designed experiments are the leading cause of invalid results and leading cause of invalid results and unjustified conclusions.unjustified conclusions.
Well designed experiments ensure the Well designed experiments ensure the measurement of a phenomenon is both measurement of a phenomenon is both accurate (reliable) and precise (valid).accurate (reliable) and precise (valid).– Accuracy refers to the correctness of a measureAccuracy refers to the correctness of a measure– Precision refers to the consistency of a measurePrecision refers to the consistency of a measure
Designing an ExperimentDesigning an Experiment The DOE depends on the type of data that The DOE depends on the type of data that
needs to be collected to test a specific needs to be collected to test a specific hypothesis.hypothesis.
Data can be collected in a variety of waysData can be collected in a variety of ways– The standard is experimentation.The standard is experimentation.– A true experimental design is one that randomly A true experimental design is one that randomly
assigns subjects to an experimental (treatment) assigns subjects to an experimental (treatment) group and a control group.group and a control group. If all other potential factors are controlled, a cause-If all other potential factors are controlled, a cause-
effect relationship may be tested.effect relationship may be tested.
A statistician is a critical component for DOEA statistician is a critical component for DOE
Drawing ConclusionsDrawing Conclusions After executing the experiment or research, one After executing the experiment or research, one
would hope to have collected the data necessary would hope to have collected the data necessary to draw conclusions, with some degree of to draw conclusions, with some degree of confidence, about the hypotheses that were confidence, about the hypotheses that were posed.posed.
Often, hypotheses need to be modified and Often, hypotheses need to be modified and retested with new data and a different design.retested with new data and a different design.
Results are rarely considered to be conclusive.Results are rarely considered to be conclusive.– Results need to be replicated, often a large number of Results need to be replicated, often a large number of
times, before scientific credence is granted them.times, before scientific credence is granted them.
Traumatic Brain Injury (TBI)Traumatic Brain Injury (TBI)
……Dr Arango-Lasprilla spoke to you Dr Arango-Lasprilla spoke to you earlier about the TBI national earlier about the TBI national database…database…
Spinal Cord Injury (SCI)Spinal Cord Injury (SCI)
The occurrence of an acute The occurrence of an acute traumatictraumatic lesion of neural elements in the spinal lesion of neural elements in the spinal canal, resulting in temporary or canal, resulting in temporary or permanent sensory and/or motor permanent sensory and/or motor deficit.deficit.
Traumatic cases involve external Traumatic cases involve external events that trigger the injury rather events that trigger the injury rather than dieases or degeneration.than dieases or degeneration.
NIDRR NSCISCNIDRR NSCISC
Began in 1975 with funding from Began in 1975 with funding from NIDRR. Data were collected NIDRR. Data were collected retrospectively back to 1973 and retrospectively back to 1973 and prospectively since 1975.prospectively since 1975.
Internationally recognized as the Internationally recognized as the authoritative source of information authoritative source of information about the epidemiology and about the epidemiology and outcomes in SCI.outcomes in SCI.
National DatabaseNational Database
Demographic data and information on Demographic data and information on acute and rehabilitation experiences and acute and rehabilitation experiences and treatment outcomes (Form I)treatment outcomes (Form I)– 260 variables260 variables
And during follow-up (Form II) at 1, 2, 5, And during follow-up (Form II) at 1, 2, 5, and every 5 years thereafter.and every 5 years thereafter.– 174 variables174 variables
Over 30,000 cases from 27 centers with Over 30,000 cases from 27 centers with follow-up of up to 30 years.follow-up of up to 30 years.
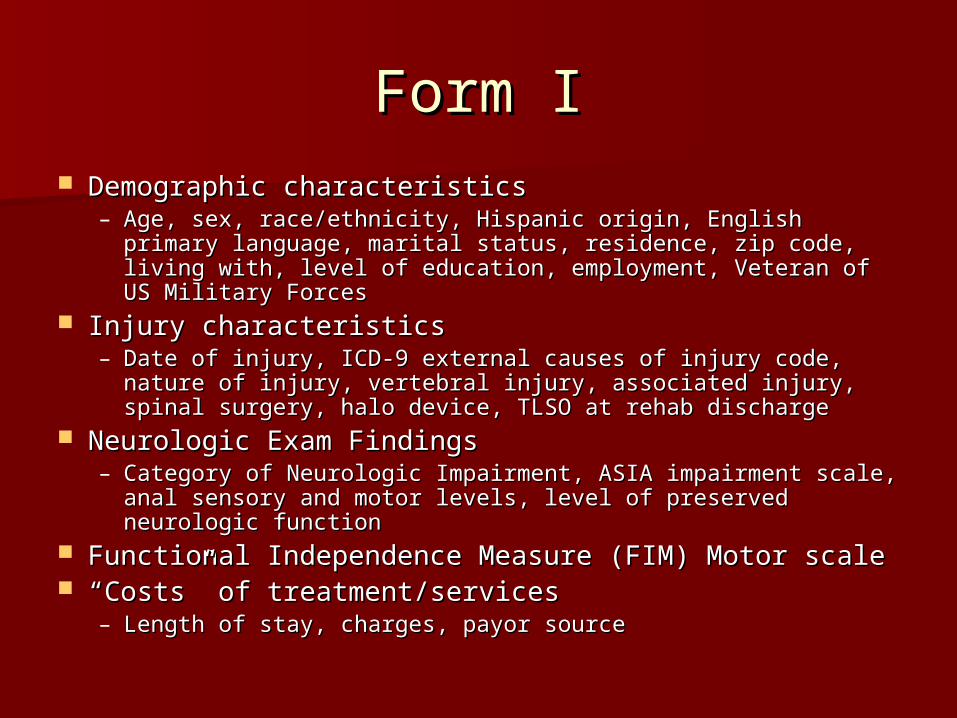
Form IForm I Demographic characteristicsDemographic characteristics
– Age, sex, race/ethnicity, Hispanic origin, English primary Age, sex, race/ethnicity, Hispanic origin, English primary language, marital status, residence, zip code, living with, language, marital status, residence, zip code, living with, level of education, employment, Veteran of US Military level of education, employment, Veteran of US Military ForcesForces
Injury characteristicsInjury characteristics– Date of injury, ICD-9 external causes of injury code, nature of Date of injury, ICD-9 external causes of injury code, nature of
injury, vertebral injury, associated injury, spinal surgery, halo injury, vertebral injury, associated injury, spinal surgery, halo device, TLSO at rehab dischargedevice, TLSO at rehab discharge
Neurologic Exam FindingsNeurologic Exam Findings– Category of Neurologic Impairment, ASIA impairment scale, Category of Neurologic Impairment, ASIA impairment scale,
anal sensory and motor levels, level of preserved neurologic anal sensory and motor levels, level of preserved neurologic functionfunction
Functional Independence Measure (FIM) Motor scaleFunctional Independence Measure (FIM) Motor scale ““Costs” of treatment/servicesCosts” of treatment/services
– Length of stay, charges, payor sourceLength of stay, charges, payor source
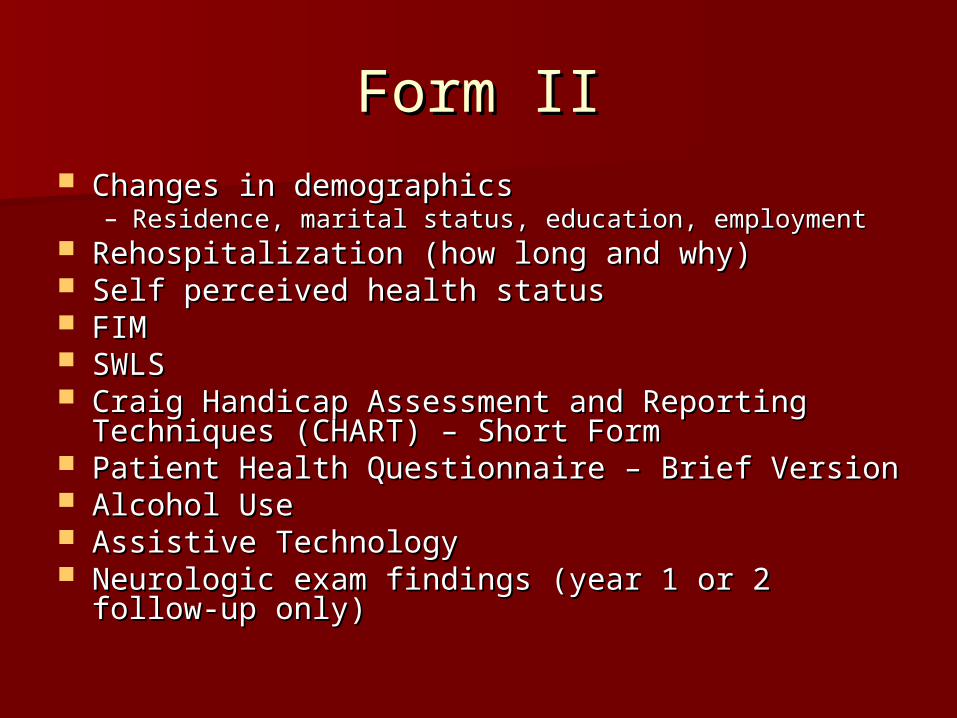
Form IIForm II Changes in demographicsChanges in demographics
– Residence, marital status, education, employmentResidence, marital status, education, employment Rehospitalization (how long and why)Rehospitalization (how long and why) Self perceived health statusSelf perceived health status FIMFIM SWLSSWLS Craig Handicap Assessment and Reporting Craig Handicap Assessment and Reporting
Techniques (CHART) – Short FormTechniques (CHART) – Short Form Patient Health Questionnaire – Brief VersionPatient Health Questionnaire – Brief Version Alcohol UseAlcohol Use Assistive TechnologyAssistive Technology Neurologic exam findings (year 1 or 2 follow-up Neurologic exam findings (year 1 or 2 follow-up
only)only)
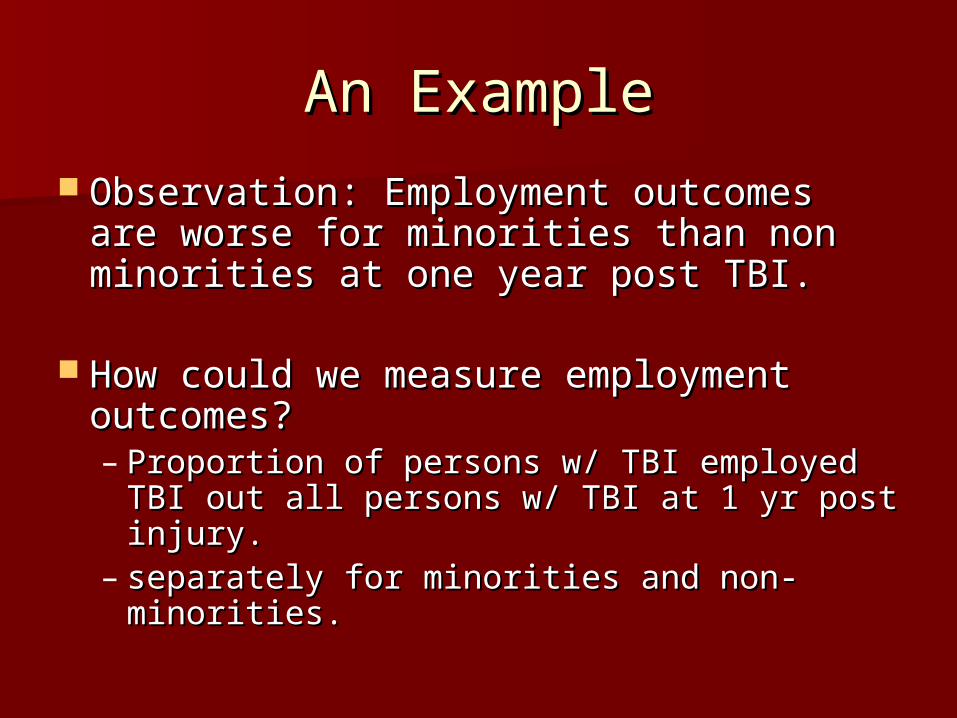
An ExampleAn Example
Observation: Employment outcomes Observation: Employment outcomes are worse for minorities than non are worse for minorities than non minorities at one year post TBI.minorities at one year post TBI.
How could we measure employment How could we measure employment outcomes?outcomes?– Proportion of persons w/ TBI employed TBI Proportion of persons w/ TBI employed TBI
out all persons w/ TBI at 1 yr post injury.out all persons w/ TBI at 1 yr post injury.– separately for minorities and non-separately for minorities and non-
minorities.minorities.
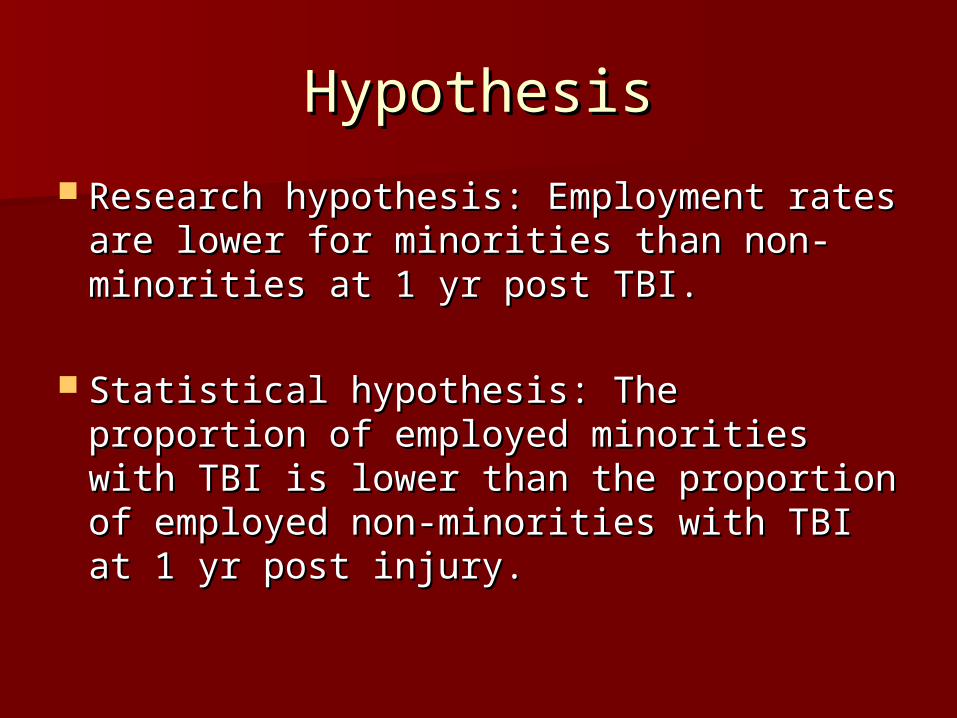
HypothesisHypothesis
Research hypothesis: Employment Research hypothesis: Employment rates are lower for minorities than rates are lower for minorities than non-minorities at 1 yr post TBI.non-minorities at 1 yr post TBI.
Statistical hypothesis: The proportion Statistical hypothesis: The proportion of employed minorities with TBI is of employed minorities with TBI is lower than the proportion of lower than the proportion of employed non-minorities with TBI at 1 employed non-minorities with TBI at 1 yr post injury.yr post injury.
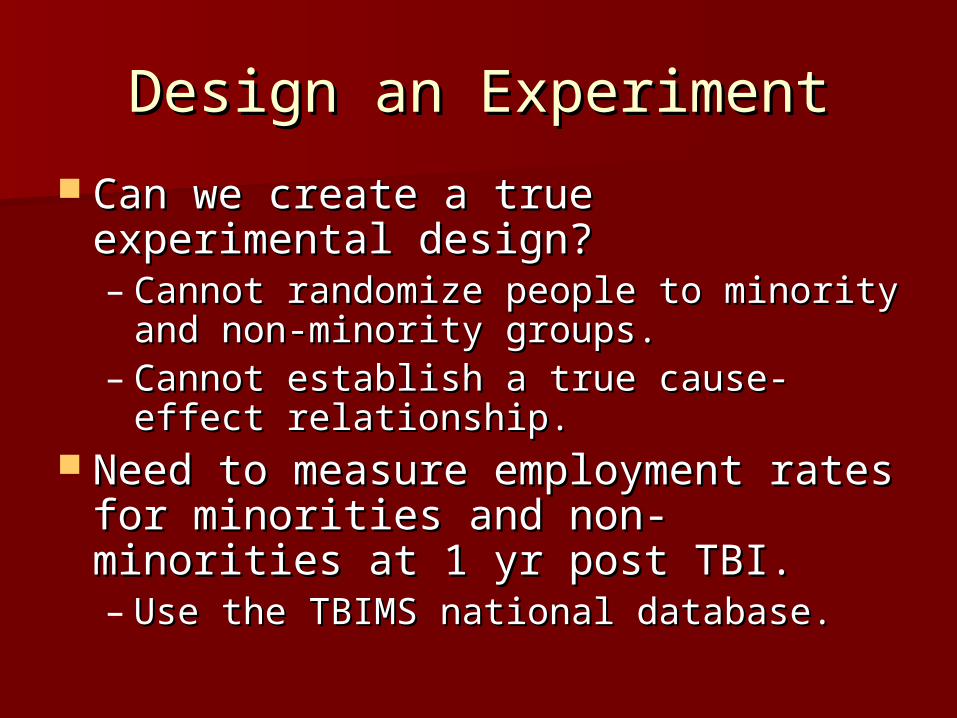
Design an ExperimentDesign an Experiment
Can we create a true experimental Can we create a true experimental design?design?– Cannot randomize people to minority Cannot randomize people to minority
and non-minority groups.and non-minority groups.– Cannot establish a true cause-effect Cannot establish a true cause-effect
relationship.relationship. Need to measure employment rates Need to measure employment rates
for minorities and non-minorities at 1 for minorities and non-minorities at 1 yr post TBI.yr post TBI.– Use the TBIMS national database.Use the TBIMS national database.
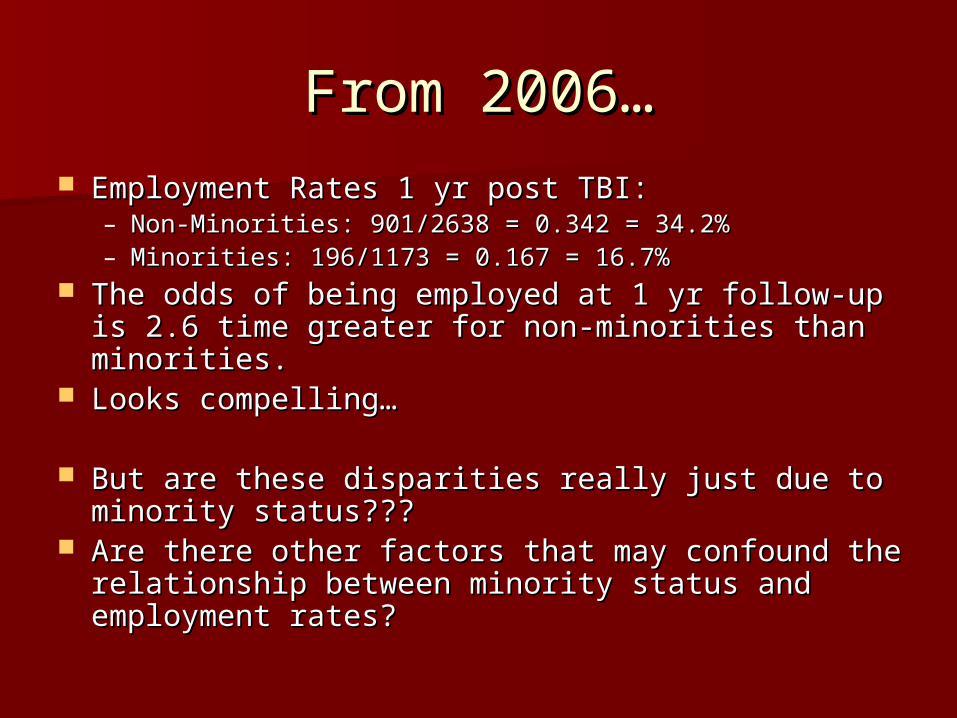
From 2006…From 2006… Employment Rates 1 yr post TBI:Employment Rates 1 yr post TBI:
– Non-Minorities: 901/2638 = 0.342 = 34.2%Non-Minorities: 901/2638 = 0.342 = 34.2%– Minorities: 196/1173 = 0.167 = 16.7%Minorities: 196/1173 = 0.167 = 16.7%
The odds of being employed at 1 yr follow-up is 2.6 The odds of being employed at 1 yr follow-up is 2.6 time greater for non-minorities than minorities.time greater for non-minorities than minorities.
Looks compelling…Looks compelling…
But are these disparities really just due to minority But are these disparities really just due to minority status???status???
Are there other factors that may confound the Are there other factors that may confound the relationship between minority status and relationship between minority status and employment rates?employment rates?
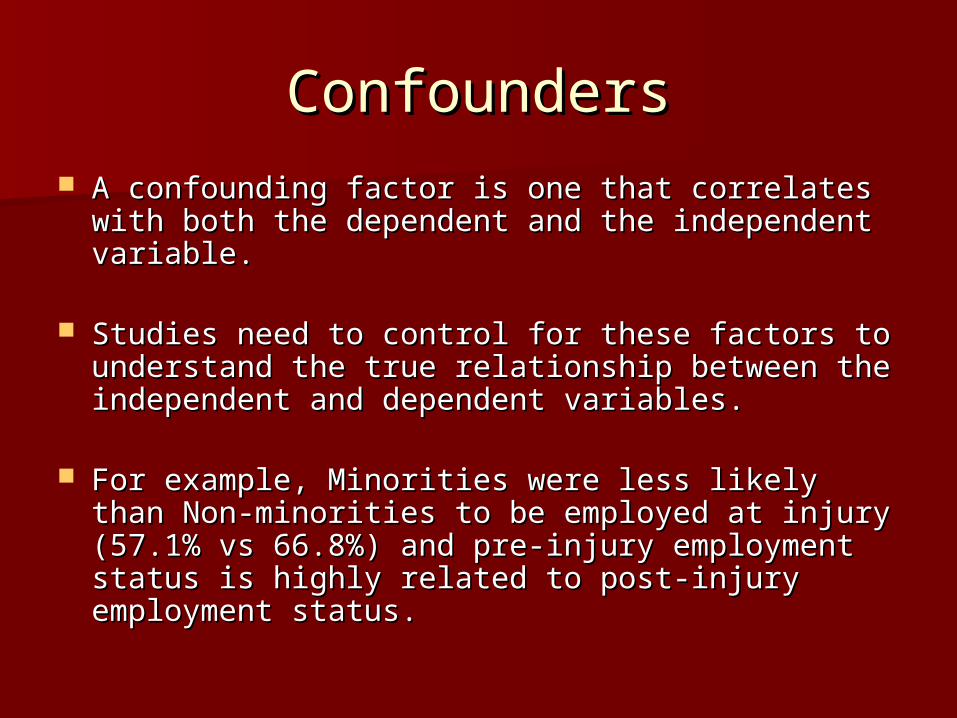
ConfoundersConfounders A confounding factor is one that correlates with A confounding factor is one that correlates with
both the dependent and the independent both the dependent and the independent variable.variable.
Studies need to control for these factors to Studies need to control for these factors to understand the true relationship between the understand the true relationship between the independent and dependent variables.independent and dependent variables.
For example, Minorities were less likely than Non-For example, Minorities were less likely than Non-minorities to be employed at injury (57.1% vs minorities to be employed at injury (57.1% vs 66.8%) and pre-injury employment status is 66.8%) and pre-injury employment status is highly related to post-injury employment status. highly related to post-injury employment status.
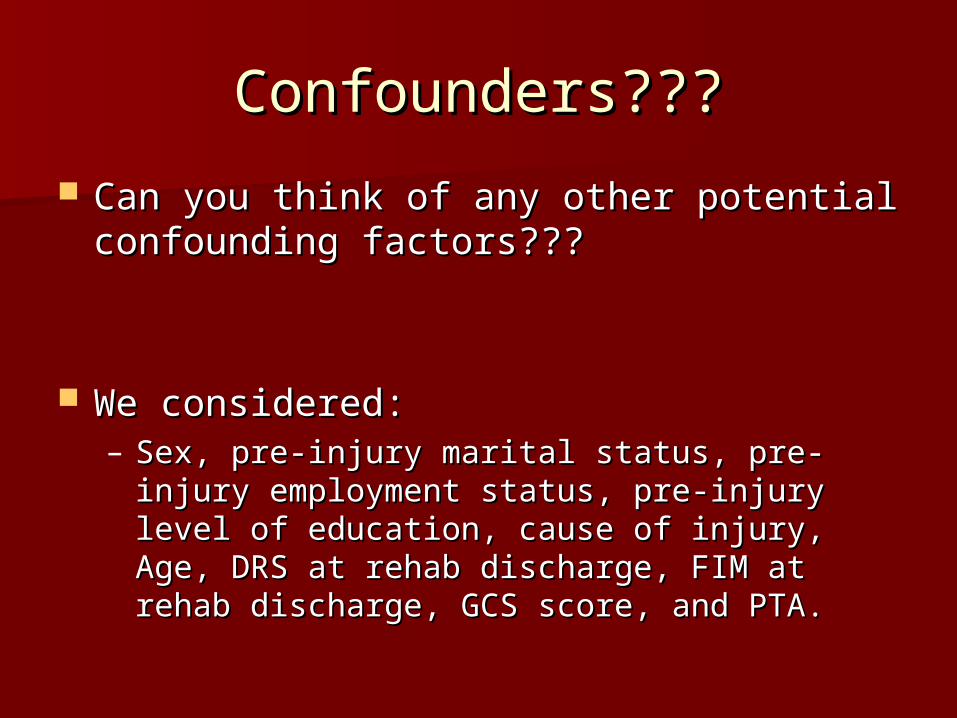
Confounders???Confounders???
Can you think of any other potential Can you think of any other potential confounding factors???confounding factors???
We considered:We considered:– Sex, pre-injury marital status, pre-injury Sex, pre-injury marital status, pre-injury
employment status, pre-injury level of employment status, pre-injury level of education, cause of injury, Age, DRS at rehab education, cause of injury, Age, DRS at rehab discharge, FIM at rehab discharge, GCS score, discharge, FIM at rehab discharge, GCS score, and PTA.and PTA.

Final ModelFinal Model
Found that the odds of being employed at Found that the odds of being employed at 1 yr follow-up were 2.17 times greater for 1 yr follow-up were 2.17 times greater for non-minorities than minoritiesnon-minorities than minorities– When controlling for pre-injury employment When controlling for pre-injury employment
status, DRS at discharge, Age, marital status, status, DRS at discharge, Age, marital status, sex, level of education, and cause of injury.sex, level of education, and cause of injury.
– Arango-Lasprilla, J.C., Arango-Lasprilla, J.C., Ketchum, J.M.Ketchum, J.M., Williams, K., Kreutzer, J.S., Marquez de la Plata, C.D., , Williams, K., Kreutzer, J.S., Marquez de la Plata, C.D., O’Neil-Pirozzi, T.M., and Wehman, P. (2008). Racial Differences in Employment Outcomes after O’Neil-Pirozzi, T.M., and Wehman, P. (2008). Racial Differences in Employment Outcomes after Traumatic Brain Injury.Traumatic Brain Injury. Archives of Physical Medicine and Rehabilitation Archives of Physical Medicine and Rehabilitation 89 (5):988 – 995. 89 (5):988 – 995.
Upcoming ProjectUpcoming Project
What is the rate of unemployment for What is the rate of unemployment for Hispanics and Blacks with disability Hispanics and Blacks with disability (TBI) compared to Whites at 1, 2, and (TBI) compared to Whites at 1, 2, and 5 years post-injury? 5 years post-injury?
How do the rates of unemployment How do the rates of unemployment post-TBI injury among the three post-TBI injury among the three groups (Whites, Blacks and groups (Whites, Blacks and Hispanics) change over time (1-5 Hispanics) change over time (1-5 years post-injury)?years post-injury)?
Specific HypothesesSpecific Hypotheses After adjusting for demographic and injury After adjusting for demographic and injury
characteristics:characteristics:– There will be significant differences among Caucasians, There will be significant differences among Caucasians,
Hispanics, and African Americans in unemployment rates Hispanics, and African Americans in unemployment rates at 1, 2, and 5 years post TBIat 1, 2, and 5 years post TBI
– Unemployment rates will significantly change over time Unemployment rates will significantly change over time for each race/ethnicity group. for each race/ethnicity group.
Specifically, African Americans and Hispanics will Specifically, African Americans and Hispanics will show greater rates of unemployment post-injury as show greater rates of unemployment post-injury as compared to Caucasians at all follow-up years and compared to Caucasians at all follow-up years and there will be significant decreases in there will be significant decreases in unemployment rates over time for all three unemployment rates over time for all three races/ethnicities (1-5 years) post-injury. races/ethnicities (1-5 years) post-injury. – We do not expect the decline in unemployment rates to We do not expect the decline in unemployment rates to
differ across the three race/ethnicity groups.differ across the three race/ethnicity groups.

Getting InvolvedGetting Involved
If you would like to get involved with If you would like to get involved with this research project or you have this research project or you have your own research question you your own research question you would like to address using the TBI or would like to address using the TBI or SCI national databases, please SCI national databases, please contact myself or Dr. Arango-contact myself or Dr. Arango-LasprillaLasprilla– [email protected]@vcu.edu– [email protected]@vcu.edu

Questions???Questions???
Related Documents