Heldermann Verlag Economic Quality Control ISSN 0940-5151 Vol 23 (2008), No. 1, 109 – 121 Statistical Sampling Strategies for Geometric Tolerance Inspection by CMM Bianca Maria Colosimo, Ester Gutierrez Moya, Giovanni Moroni and StefanoPetr`o Abstract: More and more often, procedures for profile/surface monitoring and inspection refer to geometric specifications. In fact, the number of form tolerance requirements (such as straightness, roundness, flatness, cylindricity, free-form profiles and surfaces) are increasingly appearing in technical drawings. Usually, Coordinate Measuring Machines (CMMs) are used to measure points on the specific feature under study in order to decide whether the machined item is conforming to requirements. In fact, measured points are used to compute the form error which has to be smaller than the tolerance value to avoid scrapping or reworking. The estimated form error is usually affected by uncertainty, which depends on both the sample size (number of points measured on the profile/surface) and the sampling strategy (location of the points on the profile/surface). The present research work focuses on the second issue and investigates the performance of several existing sampling strategies with the ones achieved by two newly presented approaches. These new approaches explore advantages arising by including a statistical analysis of a set of machined features in the sampling strategy design. Throughout the paper, a real case study concerning flatness tolerance is used as reference. Keywords : Sampling strategy, geometric tolerance, measuring, CMM, variable selection, PCA. 1 Introduction Inspection of geometric tolerances is a complex task, because geometric errors are related to three-dimensional features and estimation of this type of errors is usually based on a cloud of points that has to be measured on the machined surface. CMMs (Coordi- nate Measurement Machines) are the most common equipment for 3D measurement in the mechanical field, because of their accuracy and flexibility. Recently, approaches for geometric shape monitoring have been proposed in the SPC (Statistical Process Control) literature [10, 12]. These approaches assume that, for each specific nominal geometry (circle, cylinder, line, plane, etc.), a given set of points is measured via CMM in order to detect an out-of-control state of the manufacturing process, which processed the feature. A second common use of observed data points refers to inspection, where the aim is to decide whether or not the machined item is conforming to requirements (by comparing the actual form error to the tolerance limit). In order to perform monitoring, inspection, or both, a measurement strategy has to be designed. The first subtask of this strategy consists in selecting the sample size of the

Welcome message from author
This document is posted to help you gain knowledge. Please leave a comment to let me know what you think about it! Share it to your friends and learn new things together.
Transcript

© Heldermann Verlag Economic Quality ControlISSN 0940-5151 Vol 23 (2008), No. 1, 109 – 121
Statistical Sampling Strategies for Geometric
Tolerance Inspection by CMM
Bianca Maria Colosimo, Ester Gutierrez Moya, Giovanni Moroni andStefano Petro
Abstract: More and more often, procedures for profile/surface monitoring and inspectionrefer to geometric specifications. In fact, the number of form tolerance requirements (such asstraightness, roundness, flatness, cylindricity, free-form profiles and surfaces) are increasinglyappearing in technical drawings. Usually, Coordinate Measuring Machines (CMMs) are usedto measure points on the specific feature under study in order to decide whether the machineditem is conforming to requirements. In fact, measured points are used to compute the formerror which has to be smaller than the tolerance value to avoid scrapping or reworking. Theestimated form error is usually affected by uncertainty, which depends on both the sample size(number of points measured on the profile/surface) and the sampling strategy (location ofthe points on the profile/surface). The present research work focuses on the second issue andinvestigates the performance of several existing sampling strategies with the ones achievedby two newly presented approaches. These new approaches explore advantages arising byincluding a statistical analysis of a set of machined features in the sampling strategy design.Throughout the paper, a real case study concerning flatness tolerance is used as reference.
Keywords: Sampling strategy, geometric tolerance, measuring, CMM, variable selection, PCA.
1 Introduction
Inspection of geometric tolerances is a complex task, because geometric errors are relatedto three-dimensional features and estimation of this type of errors is usually based ona cloud of points that has to be measured on the machined surface. CMMs (Coordi-nate Measurement Machines) are the most common equipment for 3D measurement inthe mechanical field, because of their accuracy and flexibility. Recently, approaches forgeometric shape monitoring have been proposed in the SPC (Statistical Process Control)literature [10, 12]. These approaches assume that, for each specific nominal geometry(circle, cylinder, line, plane, etc.), a given set of points is measured via CMM in order todetect an out-of-control state of the manufacturing process, which processed the feature.A second common use of observed data points refers to inspection, where the aim is todecide whether or not the machined item is conforming to requirements (by comparingthe actual form error to the tolerance limit).
In order to perform monitoring, inspection, or both, a measurement strategy has to bedesigned. The first subtask of this strategy consists in selecting the sample size of the

110 Bianca Maria Colosimo, Ester Gutierrez Moya, Giovanni Moroni and Stefano Petro
cloud of points that has to be measured. The second subtask consists in selecting theexact location of each measured point. This paper deals with the second issue, whichwill be referred to as sampling strategy in the following. Note that the selection of asampling strategy becomes more and more relevant as the sample size decreases. In fact,when the cloud of points is particularly dense (i.e., thousands of points), the error inquestion is well estimated independently of the positions of the sampled points. However,on-line applications of tolerance estimation require often a reduced sample size, becausemeasurement costs are directly related to the number of points that have to be measured.When the sample size is reduced, the exact position of the measurement points plays arelevant role.
Most of the approaches proposed in the literature and in international standards, e.g., ISO12781 for flatness [16], suggest the use of strategies which are a priori defined, indepen-dently of the specific manufacturing process, which has been used to produce the feature.Examples are the uniform, random or quasi-random (e.g., Hammersley sequence [19]) dis-tribution of the sample points on the surface that has to be inspected. All these samplingstrategies can be referred to as “a-priori” strategies.
A second approach proposed in the literature consists in adopting adaptive samplingstrategies [2, 3, 13, 21]. Adaptive sampling is a multi-step methodology, which startswith a low density, usually uniformly spaced, sampling of the feature of interest. Forgiven information collected in this starting sample, the adaptive algorithm selects the nextsampling points. The procedure is iterated until a required precision of the error estimateis achieved. Although effective, adaptive sampling strategies are hard to implement intraditional CMMs, and this is probably why they did not receive great attention in theliterature and in industrial practice.
Given that each feature is obtained with a specific process, a different approach to sam-pling strategy consists in considering that each particular production process leaves aparticular “fingerprint” on the machined surface. This fingerprint will be referred to asthe “manufacturing signature”. As an example, consider the increase in the diameter ofcylindrical parts, which can be observed when workpieces are obtained by turning. Thisparticular signature is due to an inflection of the workpiece while the tool is moving farfrom the spindle. The manufacturing signature can be defined as the systematic patternwhich characterizes all the features machined by a given process. This systematic patternwill be obviously “masked” by additional random noise caused by the natural variabilityof the process (e.g., due to vibrations, dirt, non homogeneous material, etc.). This is whya statistical analysis of a set of machined features is required to obtain the manufacturingsignature estimate.
The knowledge of the manufacturing signature can obviously aid the selection of an appro-priate sampling strategy. Examples of manufacturing signature estimation can be foundin [7, 8], where different geometric features are modeled via Discrete Fourier Transform(DFT) and the identified models are then used to select a sampling strategy. However,these approaches focus mainly on dimensional inspection of geometric features (e.g., thediameter of cylindrical components) and the adopted model, namely DFT, induces auniformly spaced sampling strategy.

Statistical Sampling Strategies for Geometric Tolerance Inspection by CMM 111
A true attempt to link the statistical analysis of a set of machined features to samplingstrategy design has been proposed in [14, 22]. This method, called the “Extended Zone”(EZ), is a two-step approach: in the first step, a parametric model of the signature isidentified and estimated by using linear regression. In the second step, sampling pointsare selected to minimize the variance of the regression model coefficients.
In this paper we will further investigate the advantages attainable by applying statistical-based approaches to sampling strategy design. In particular, we will first explore the use ofa technique adopted for variate selection in multivariate statistics. This technique, knownas Principal Component Variables (PCV) selection will be adapted to the specific problemat hand (i.e., defining a sampling strategy for geometric tolerances) and is described inSection 2. A second new approach proposed in this paper will be based on the empiricaldistribution of points that mainly influence the geometric error estimate. This approachwill be referred to as “Extreme Points Selection” (EPS) and will be presented in Section 3.Eventually, Section 4 will present a comparison of all the different approaches (a polar gridwhich represents the ISO standard, Hammersley sequence, EZ, PCV, EPS) with referenceto a real case study related to flatness of surfaces obtained by face turning.
1.1 A Case Study Concerning Flatness and the Standard Sampling Strategy
The case study consists of planar surfaces obtained by face turning. The tested itemsare a set of 130 austempering iron disks of 90 mm diameter each. In particular, for eachdisk a set of 120 points were measured as shown in Figure 1. This sampling strategy canbe considered as a rectangular grid. A “Zeiss Prismo VAST HTG” CMM was used tomeasure data points. The main characteristics of this CMM are the specifications withrespect to volumetric length measuring MPEE and volumetric probing MPEP [15]:
• Maximum permissible error: MPEE = 2 + L/300 µm• Maximum permissible error: MPEP = 1.8 µm
Figure 1: The original sampling strategy for the manufactured disks.
112 Bianca Maria Colosimo, Ester Gutierrez Moya, Giovanni Moroni and Stefano Petro
tttFlatness form errorFlatness form error
(a) (b)
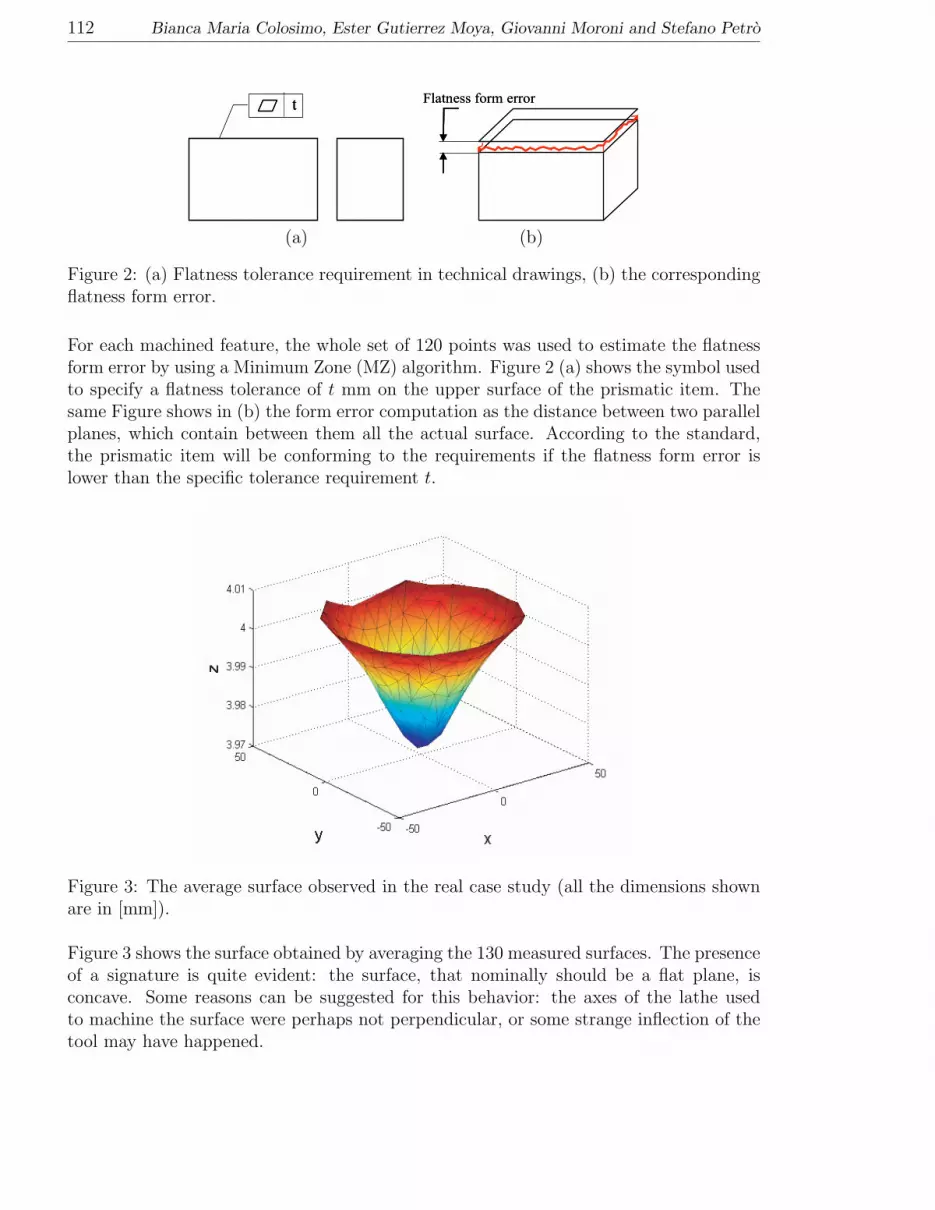
Figure 2: (a) Flatness tolerance requirement in technical drawings, (b) the correspondingflatness form error.
For each machined feature, the whole set of 120 points was used to estimate the flatnessform error by using a Minimum Zone (MZ) algorithm. Figure 2 (a) shows the symbol usedto specify a flatness tolerance of t mm on the upper surface of the prismatic item. Thesame Figure shows in (b) the form error computation as the distance between two parallelplanes, which contain between them all the actual surface. According to the standard,the prismatic item will be conforming to the requirements if the flatness form error islower than the specific tolerance requirement t.
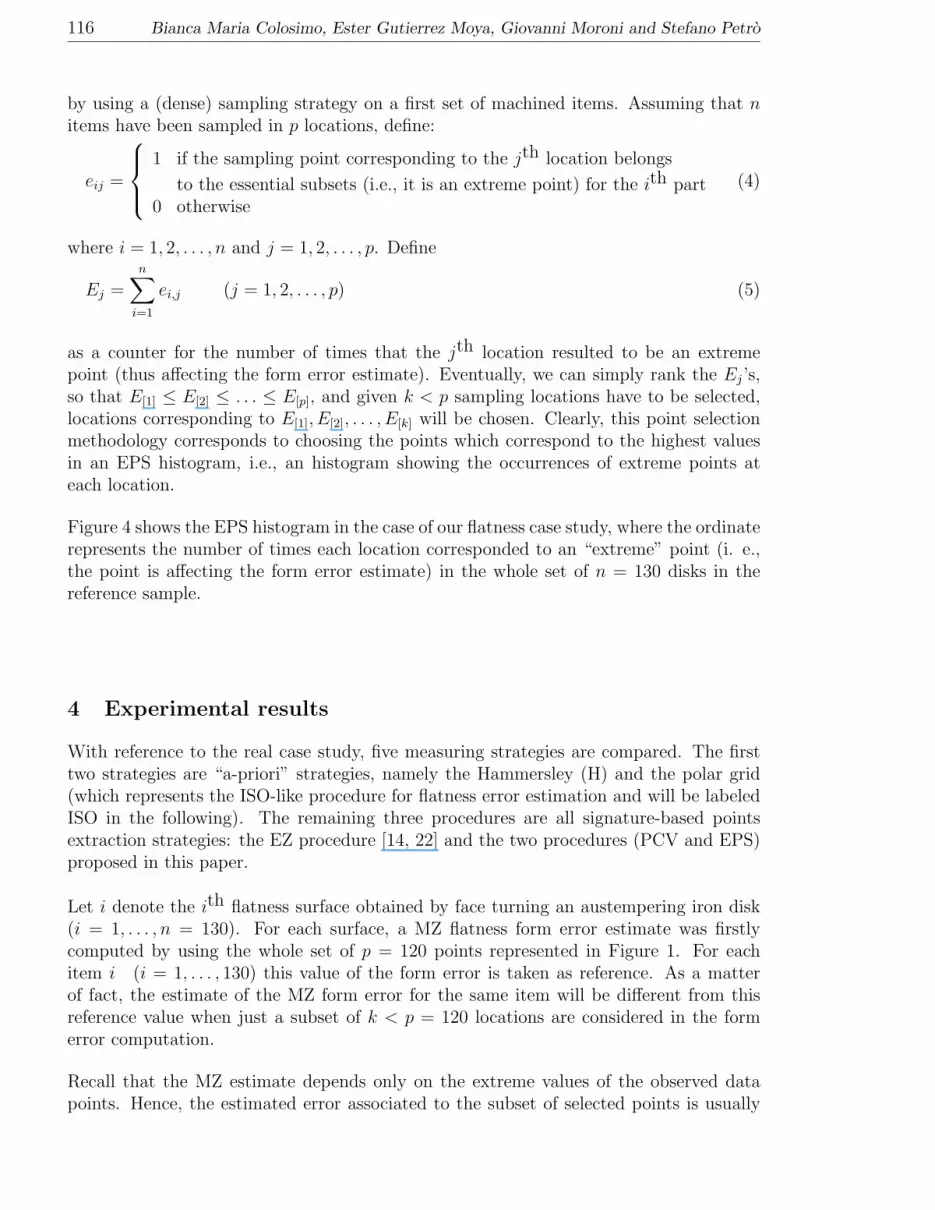
Figure 3: The average surface observed in the real case study (all the dimensions shownare in [mm]).
Figure 3 shows the surface obtained by averaging the 130 measured surfaces. The presenceof a signature is quite evident: the surface, that nominally should be a flat plane, isconcave. Some reasons can be suggested for this behavior: the axes of the lathe usedto machine the surface were perhaps not perpendicular, or some strange inflection of thetool may have happened.

Statistical Sampling Strategies for Geometric Tolerance Inspection by CMM 113
1.2 Sampling Strategy for Flatness: The ISO standard
The international standard ISO 12781 [16] defines requirements for a sampling strategythat is intended to be used for estimating flatness. Given that the harmonic contentor shape variation is considered the main contributor of the flatness error, the standardproposes sampling strategies which are constituted of densely sampled profiles (polar grid,rectangular grid, union jack, triangular grid and parallel profiles extraction). Dependingon the particular geometry, a point extraction strategy is also suggested (for instance, disksshould be inspected by means of a polar grid extraction strategy). Unfortunately, profileextraction can not be easily performed when common CMM with touch trigger probe isused. In fact, this solution should require measuring thousands of points, thus causing verylong measurement time, a solution which is prohibitive in industrial practice. Therefore,assuming a touch trigger CMM as reference, a polar-like location of measurement pointswill be considered as a representative of the ISO standard from now on.
2 A PCA-Based Selection Procedure: The Principal Compo-nent Variables (PCV)
Principal Components Analysis (PCA) is a well-known method for reducing the dimen-sionality of a multivariate data set, while preserving the variability of the original data asmuch as possible. An exhaustive description of PCA can be found in standard textbooksas [17].
With reference to geometric tolerances, PCA can aid discovering the manufacturing signa-ture, i.e., determining the systematic pattern characterizing a set of machined items [11].To this aim, the points sampled on a given profile or surface are modeled as a multivari-ate random vector of size p. Therefore, the p components of the random vector (or pvariables) are related to the p locations at which the data are collected on profiles and/orsurfaces. In particular, with reference to the flatness specification, the p-variate randomvector shows the values observed along the z direction at p different locations in the (x, y)plane (as the ones shown in Figure 1).
Based on PCA, several variable selection methods have been proposed in the literature [4,18, 20]. The main idea behind these selection procedures is to retain just few variables (i.e.,few points) among the initial set of p variables (i.e., an initial set of points sampled witha dense inspection strategy) while retaining most of the variability observed in this initialset. Among the different approaches for Principal Component variable selection, it hasbeen shown that the RM method is able to achieve effective results at low computationalcosts [6] and this is why we will refer to this approach in this paper.
The RM method [6, 5] is based on an optimality index aimed at selecting a subset of kvariables (i.e., a subset of locations) which can preserve most of the information containedin the whole set of p original variables (locations). In particular, the RM method is based

114 Bianca Maria Colosimo, Ester Gutierrez Moya, Giovanni Moroni and Stefano Petro
on computing a similarity index between the subspace spanned by the original set of pvariables and the one spanned by the selected subset of dimension k. This similarity indexis based on the definition of ”angle” between two matrices A and B. In particular, theangle cosine can be computed as
cos (A,B) =< A,B >
||A|| · ||B||(1)
where < A,B >= tr(ATB) is the inner product of two matrices while ||A|| =
√
tr(ATA)
is the norm of A [5]. The cosine of the angle between the two matrices given in expression(1) is sometimes called matrix correlation.
With reference to a set of geometric features inspected at p locations, let X represent
the n × p matrix containing in the ith row the set of p data observed on the ith item(i = 1, ..., n). Assume that the matrix X has been column-centered, as usually done inPCA (i.e., assume that the average path observed over the p locations has been subtractedfrom the original data). Let K denote the matrix obtained by selecting a subset K of kcolumns of X. The RM indicator is defined as the cosine of the angle between the originaldata matrix X and the matrix whose columns are obtained by regressing each of the poriginal columns on K (i.e., orthogonally projecting the original columns in the subspaceK of R
n spanned by K):
RM = cos (X,PKX) =
√
√
√
√
√
tr(
XTPKX)
tr(
XTX) (2)
where PK is the matrix of orthogonal projections on K. A different meaning of RM
can be seen introducing (rm)i as the multiple correlation coefficient between the ith PC(computed on the original data matrix X) and the k variables in K:
RM =
√
√
√
√
√
√
√
p∑
i=1
λi (rm)2i
p∑
i=1
λi
(3)
where λi is the eigenvalue of the covariance matrix of X associated to the ith PC (notethat the eigenvalue λi, for all i, does not depend on the choice of K). In this case RM canbe interpreted as a weighted average of the squares of the multiple correlations betweenthe PCs and the k selected variables, where the weights λis are the PCs’ variances.
An exact identification of the best subset of k variables would require an exhaustiveenumeration of all the possible subsets of size k that can be found starting from the orig-inal set of p variables. Unfortunately, this exhaustive enumeration requires a prohibitivecomputational time. Therefore, different heuristic algorithms have been proposed [5]. Inparticular, the present paper will investigate performance obtainable by using a simulatedannealing algorithm for subset selection (a freely available software can be found amongpackages running under “R” [9]).

Statistical Sampling Strategies for Geometric Tolerance Inspection by CMM 115
This sampling strategy will be referred to as “Principal Component Variables” (PCV) inthe following sections.
3 Extreme Points Selection (EPS)
When estimating the form error via the Minimum Zone algorithm (MZ), only few pointshold all the information needed, namely the elements of an “essential subset” [1]. In fact,the MZ form error focusses usually on the extreme bounds of the actual feature measured,since the aim is to compute the maximum deviation from a perfect or ideal geometry. Forinstance, when the flatness error is of interest, the maximum deviation from a perfectplane is represented by the distance between two parallel planes containing between themall the points measured on the actual surface (as shown in Figure 2(b)). Similarly, whenthe interest is in the circularity form error, the MZ algorithm requires the computationof the radial distance between two concentric circles containing between them all theobserved data and having the least radial separation. Therefore, only few extreme pointsaffect the form error computation and these points constitute the essential subset (ES).
When there is a manufacturing signature, points in the ES will tend to appear approx-imately in the same position. In fact, the manufacturing signature is defined as thesystematic pattern characterizing all the items produced by a specific process. When allthe machined items have the same systematic pattern, it is likely that the ES will beconstituted by a specific subset of points which are always in the same positions.
Figure 4: Extreme point histogram.
Therefore, the proposed procedure consists in identifying this subset of relevant points
116 Bianca Maria Colosimo, Ester Gutierrez Moya, Giovanni Moroni and Stefano Petro
by using a (dense) sampling strategy on a first set of machined items. Assuming that nitems have been sampled in p locations, define:
eij =
1 if the sampling point corresponding to the jth location belongs
to the essential subsets (i.e., it is an extreme point) for the ith part0 otherwise
(4)
where i = 1, 2, . . . , n and j = 1, 2, . . . , p. Define
Ej =n
∑
i=1
ei,j (j = 1, 2, . . . , p) (5)
as a counter for the number of times that the jth location resulted to be an extremepoint (thus affecting the form error estimate). Eventually, we can simply rank the Ej’s,so that E[1] ≤ E[2] ≤ . . . ≤ E[p], and given k < p sampling locations have to be selected,locations corresponding to E[1], E[2], . . . , E[k] will be chosen. Clearly, this point selectionmethodology corresponds to choosing the points which correspond to the highest valuesin an EPS histogram, i.e., an histogram showing the occurrences of extreme points ateach location.
Figure 4 shows the EPS histogram in the case of our flatness case study, where the ordinaterepresents the number of times each location corresponded to an “extreme” point (i. e.,the point is affecting the form error estimate) in the whole set of n = 130 disks in thereference sample.
4 Experimental results
With reference to the real case study, five measuring strategies are compared. The firsttwo strategies are “a-priori” strategies, namely the Hammersley (H) and the polar grid(which represents the ISO-like procedure for flatness error estimation and will be labeledISO in the following). The remaining three procedures are all signature-based pointsextraction strategies: the EZ procedure [14, 22] and the two procedures (PCV and EPS)proposed in this paper.
Let i denote the ith flatness surface obtained by face turning an austempering iron disk(i = 1, . . . , n = 130). For each surface, a MZ flatness form error estimate was firstlycomputed by using the whole set of p = 120 points represented in Figure 1. For eachitem i (i = 1, . . . , 130) this value of the form error is taken as reference. As a matterof fact, the estimate of the MZ form error for the same item will be different from thisreference value when just a subset of k < p = 120 locations are considered in the formerror computation.
Recall that the MZ estimate depends only on the extreme values of the observed datapoints. Hence, the estimated error associated to the subset of selected points is usually

Statistical Sampling Strategies for Geometric Tolerance Inspection by CMM 117
k 33
25
19
139
ISOH
ISOH
ISOH
ISOH
ISOH
0,020
0,015
0,010
0,005
0,000
Median performance
(95% confidence interval)
Figure 5: Performance comparison: Polar (ISO) vs. Hammersley (H) strategies as afunction of the number of selected points k.
lower than the reference one. In fact, when only few points out of the whole set of dataare selected, it is unlikely that these points are just the extreme ones. This is why theperformance indicator of the selection procedure is computed as the difference betweenthe reference form error (computed by using the entire data set) and the error computedby using just the specified subset chosen by the sampling strategy (H, ISO, EZ, PCV,EPS) for each machined item. Obviously the best procedure will be the one correspondingto the minimum performance indicator.
Figure 5 shows the performance comparison when the two a-priori strategies are consid-ered, namely the polar strategy (ISO) and the Hammersley procedure (H), for differentvalues of the sub-sample size k ∈ {9, 13, 19, 25, 33}. For each value k, the different sam-pling strategies are applied to all the flat surfaces (i = 1, 2, . . . , n = 130) under studyand a final 95% confidence interval of the median performance indicator is computed.Here the median is used because the computed performance indicators are not normallydistributed. As shown in Figure 5, the Hammersley sequence induces always a medianindicator which is greater than the one obtained by using a polar-grid (ISO) approach.Therefore, the ISO procedure should be preferred to the Hammersley’s one in the specificcase under study.
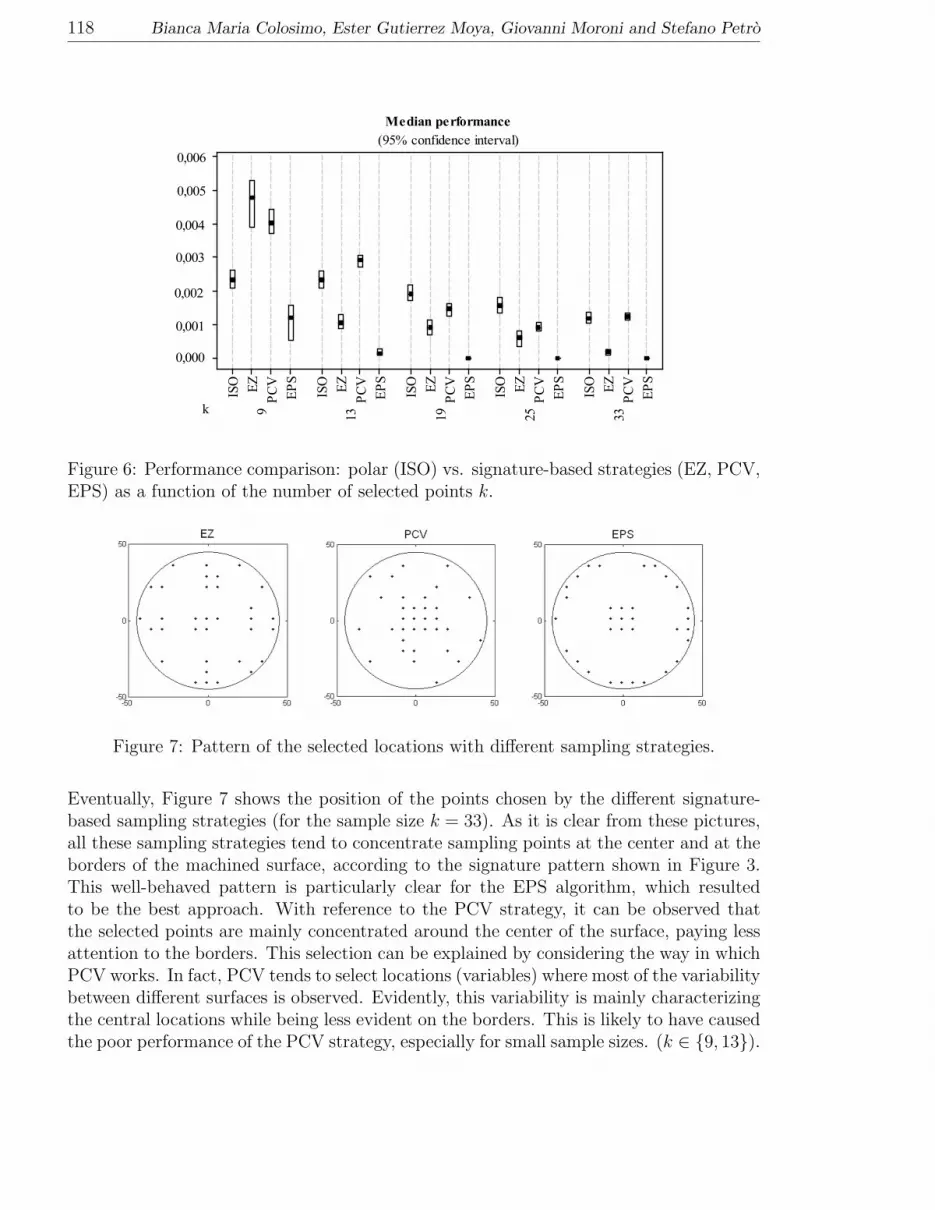
Figure 6 shows the comparison of this ISO (polar) strategy with the signature-basedsampling methods (EZ, PCV, EPS). Here again, the figure reports the 95% confidenceintervals on the median indicator obtained by using the different approaches for a subsetsize ranging from 9 to 33. Figure 6 shows that, with the exception of samples of sizes 9and 13, all the signature-based strategies perform better than the ISO-based approach. Inparticular, the EPS approach proposed in this paper outperforms all the other methods,independently of the actual value of the sample size k ∈ {9, 13, 19, 25, 33}.
118 Bianca Maria Colosimo, Ester Gutierrez Moya, Giovanni Moroni and Stefano Petro
k
332519139
EP
S
PC
VEZ
ISO
EP
S
PC
VEZ
ISO
EP
S
PC
VEZ
ISO
EP
S
PC
VEZ
ISO
EP
S
PC
VEZ
ISO
0,006
0,005
0,004
0,003
0,002
0,001
0,000
Median performance
(95% confidence interval)
Figure 6: Performance comparison: polar (ISO) vs. signature-based strategies (EZ, PCV,EPS) as a function of the number of selected points k.
Figure 7: Pattern of the selected locations with different sampling strategies.
Eventually, Figure 7 shows the position of the points chosen by the different signature-based sampling strategies (for the sample size k = 33). As it is clear from these pictures,all these sampling strategies tend to concentrate sampling points at the center and at theborders of the machined surface, according to the signature pattern shown in Figure 3.This well-behaved pattern is particularly clear for the EPS algorithm, which resultedto be the best approach. With reference to the PCV strategy, it can be observed thatthe selected points are mainly concentrated around the center of the surface, paying lessattention to the borders. This selection can be explained by considering the way in whichPCV works. In fact, PCV tends to select locations (variables) where most of the variabilitybetween different surfaces is observed. Evidently, this variability is mainly characterizingthe central locations while being less evident on the borders. This is likely to have causedthe poor performance of the PCV strategy, especially for small sample sizes. (k ∈ {9, 13}).

Statistical Sampling Strategies for Geometric Tolerance Inspection by CMM 119
5 Conclusions and further remarks
In the present paper, we showed that sampling strategies, which account for the infor-mation available by performing a statistical analysis of a set of machined items, can bevery effective for inspecting items when geometric form tolerances are of interest. Inparticular, the collected information is summarized in what we called the manufacturingsignature estimate, i.e. the model of the systematic pattern, which characterizes all thefeatures machined by a given process. As a main result of our study, a newly proposedsampling strategy (called Extreme Points Selection) is shown to outperform different ap-proaches proposed in the literature and in the ISO standard. Since measurement costsare proportional to measurement time, techniques aimed at obtaining small systematicerrors in geometric tolerance estimates while reducing the number of sampled points canbe effectively used in industrial practice.
The main limitation behind the application of the proposed method concerns situations, inwhich the signature changes without any advice (for instance because of a sudden changein the machine tool). In fact, signature-based sampling strategy can become “dangerous”when the signature changes, given that they will go on suggesting measurement pointlocations, which are no more relevant for describing the systematic pattern of machineditems. Therefore, a profile/surface monitoring technique [10, 12] should be always usedin conjunction with signature-based sampling strategies.
Acknowledgment: This work was carried out with the funding of the Italian Ministryof University and Research.
References
[1] Anthony, G. T., Anthony, H. M., Bittner, B., Butler, B. P., Cox, R., M. G.and Dri-eschner, Elligsen, R., Forbes, A. B., Gross, H., Hannaby, S. A., Harris, P. M., Kok,J. (1996): Reference software for finding Chebyshev best-fit geometric elements.Precision Engineering 19, 28–36.
[2] Badar, M. A., Raman, S., Pulat, P. (2003): Intelligent Search-Based Selection ofSample Points for Straightness and Flatness Estimation. Journal of ManufacturingScience and Engineering 125, 263.
[3] Badar, M. A., Raman, S., Pulat, P. S. (2005): Experimental verification of manu-facturing error pattern and its utilization in form tolerance sampling. InternationalJournal of Machine Tools and Manufacture 45, 63–73.
[4] Beale, E. M. L., Kendall, M. G., Mann, D. W. (1967): The Discarding of Variablesin Multivariate Analysis. Biometrika 54, 357–366.

120 Bianca Maria Colosimo, Ester Gutierrez Moya, Giovanni Moroni and Stefano Petro
[5] Cadima, J., Cerdeira, J. O., Minhoto, M. (2004): Computational aspects of algo-rithms for variable selection in the context of principal components. ComputationalStatistics and Data Analysis 47, 225–236.
[6] Cadima, J. F. C. L., Jolliffe, I. T. (2001): Variable Selection and the Interpreta-tion of Principal Subspaces. Journal of Agricultural, Biological, and EnvironmentalStatistics 6, 62–79.
[7] Capello, E., Semeraro, Q. (2001): The harmonic fitting method for the assessmentof the substitute geometry estimate error. Part I: 2D and 3D theory. InternationalJournal of Machine Tools and Manufacture 41, 1071–1102.
[8] Capello, E., Semeraro, Q. (2001): The harmonic fitting method for the assessmentof the substitute geometry estimate error. Part II: statistical approach, machiningprocess analysis and inspection plan optimisation. International Journal of MachineTools and Manufacture 41, 1103–1129.
[9] Cerdeira, J. O., Silva, P. D., Cadima, M., J.and Minhoto (2007): subselect: Selectingvariable subsets. R package version 0.9-9992.
[10] Colosimo, B. M., Mammarella, F., Petro, S. (2007): Quality Control Of Manu-factured Surfaces. Proceedings of the IX Intl. Workshop on Intelligent StatisticalQuality Control, Beijing.
[11] Colosimo, B. M., Pacella, M. (2007): On the use of Principal Component Analysisto Identify Systematic Patterns in Geometric Profiles. Quality & Reliability Engi-neering International 23, 707–725.
[12] Colosimo, B. M., Pacella, M., Semeraro, Q. (2008): Statistical Process Controlfor Geometric Specifications: on the Monitoring of Roundness Profiles. Journal ofQuality Technology 40, 1–18.
[13] Edgeworth, R., Wilhelm, R. G. (1999): Adaptive sampling for coordinate metrology.Precision Engineering 23, 144–154.
[14] Henke, R. P., Summerhays, K. D., Baldwin, J. M., Cassou, R. M., Brown, C. W.(1999): Methods for evaluation of systematic geometric deviations in machined partsand their relationships to process variables. Precision Engineering 23, 273–292.
[15] International Organization for Standardization, Geneva, Switzerland (2001):ISO/TS 10360-2: Geometrical Product Specifications (GPS) – Acceptance andreverification tests for coordinate measuring machines (CMM) – Part 2: CMMs
used for measuring size, 2nd edition.
[16] International Organization for Standardization, Geneva, Switzerland (2003):ISO/TS 12781-2: Geometrical Product Specifications (GPS) - Flatness - Part 2:
Specification operators, 1st edition.
[17] Jackson, J. E. (1991): A User’s Guide to Principal Components. Wiley-InterScience,New York.

Statistical Sampling Strategies for Geometric Tolerance Inspection by CMM 121
[18] Jolliffe, I. T. (1972): Discarding Variables in a Principal Component Analysis. I:Artificial Data. Applied Statistics 21, 160–173.
[19] Kim, W. S., Raman, S. (2000): On the selection of flatness measurement points incoordinate measuring machine inspection. International Journal of Machine Toolsand Manufacture 40, 427–443.
[20] McCabe, G. P. (1984): Principal Variables. Technometrics 26, 137–144.
[21] Rossi, A. (2001): A form of deviation-based method for coordinate measuring ma-chine sampling optimization in an assessment of roundness. Proceedings of the In-stitution of Mechanical Engineers, Part B. Journal of Engineering Manufacture 215,1505–1518.
[22] Summerhays, K. D., Henke, R. P., Baldwin, J. M., Cassou, R. M., Brown, C. W.(2002): Optimizing discrete point sample patterns and measurement data analysison internal cylindrical surfaces with systematic form deviations. Precision Engineer-ing 26, 105–121.
Bianca Maria ColosimoDipartimento di MeccanicaPolitecnico di MilanoVia la Masa 120156 Milano, Italye-mail: [email protected]
Ester Gutierrez MoyaDep. Industrial ManagementUniversity of Sevillec/Camino de los Descubrimientos s/n41092 Sevilla, Spaine-mail: [email protected]
Giovanni MoroniDipartimento di MeccanicaPolitecnico di MilanoVia la Masa 120156 Milano, Italye-mail: [email protected]
Stefano PetroDipartimento di MeccanicaPolitecnico di MilanoVia la Masa 120156 Milano, Italye-mail: [email protected]
Related Documents