Shifting left - using Statistical Process Control & Metrication An experience report of using SPC and test analytics Mike Jarred & Ilca Croufer

Welcome message from author
This document is posted to help you gain knowledge. Please leave a comment to let me know what you think about it! Share it to your friends and learn new things together.
Transcript

©2014 IDBS, Confidential
Shifting left - using Statistical Process Control & Metrication An experience report of using SPC and test analytics
Mike Jarred &
Ilca Croufer

©2014 IDBS, Confidential
Agenda
Introductions
5 challenges faced by testing
Statistical Process Control – an explanation!
Specific application of SPC to help solve challenges
3 examples of departmental and cross divisional change
• Problem statement analysis
Building trust and credibility with data
Additional benefits

©2014 IDBS, Confidential
Delivering software to regulated environments IDBS is a global provider of innovative enterprise data
management, analytics and modelling solutions
• Used by more than 200 pharmaceutical companies, major healthcare providers, global leaders in academic study, and high tech companies
• Our products enable increased efficiency, reduced costs and improved productivity of industrial R&D and clinical research
• Our platforms are enabling translational medicine – personalised medicine (right drug, right patient, right time)
Our customers work in highly regulated environments
• GxP (GLP, GCP, GMP etc…) FDA regulated, 21 CFR Part 11, EU Annexe 11
Our Test Department operates as a centre of excellence
• Repeatable processes and supporting toolsets, consistently applied

©2014 IDBS, Confidential
The seeds of change
Value of testing not understood – perceived by some stakeholders as a cost centre / overhead
Testing perceived as a bottleneck – impacting time to market
More people required than budget would accommodate – impact on operating costs
Ensure SDLC improvements were supporting business goals
- Testing process improvement driven by practitioners, but not necessarily aligned to business objectives
Unassociated targets across product delivery – meant it was hard to drive holistic improvements in SDLC

©2014 IDBS, Confidential
Statistical Process Control (SPC)
Methodology focused on quality control and process improvement involving statistical data analysis
SPC is based on the following principles:
- Define the process requiring control
- Measuring the process
- Analyse, Identify and eliminate unusual variation
from the process
- Improving the process to its best target value
- Monitor and control the process performance
over time

©2014 IDBS, Confidential
Common Cause vs Special Cause Variation
Common Cause Variation:
- Naturally present within the process
- Usually insignificant and predictable
Special Cause Variation:
- Assignable to a root cause
- Usually significant and unpredictable

©2014 IDBS, Confidential
Process & Variation
An activity which transforms inputs into outputs; (F(x) = Y)
X f(X) Y
Example: making a cup of tea, baking a cake, getting to work, etc.
Any process will have a certain degree of variation; some variation will be inherent to the process, some will not.
Variation in a Process = Common Cause Variation + Special Cause variation

©2014 IDBS, Confidential
Statistical Process Control – day to day example
Special Cause Variation
Days Journey Time
Monday 45 minutes
Tuesday 50 minutes
Wednesday 47 minutes
Thursday 120 minutes
Friday 49 minutes

©2014 IDBS, Confidential
Control Charts
Statistical tool used to
monitor the stability
of a process over time
Key features:
- UCL (Upper Control Limit) = mean + 3*sigma
- LCL (Lower Control Limit) = mean – 3*sigma
- central line (mean of data set)
A process is said to be in control when data points fall within limits of variation (i.e.: between Upper and Lower Control Limits)

©2014 IDBS, Confidential
Statistical Process Control - Benefits
a) Continuous Process Improvement
b) Process Baselines
c) Early visibility and reaction
d) Quantitative Management Decision Making
e) Economical Value

©2014 IDBS, Confidential
So, why SPC?
IDBS is not formally following a maturity model
Previous CMMi experience (level 2 – level 5) & Six Sigma
Understanding of TMMi
“Self assessment” of IDBS maturity levels (akin to a readiness review)
• Level 3 supporting processes in place to include SPC
Scientists and data analysis – cultural alignment!
©2014 IDBS, Confidential
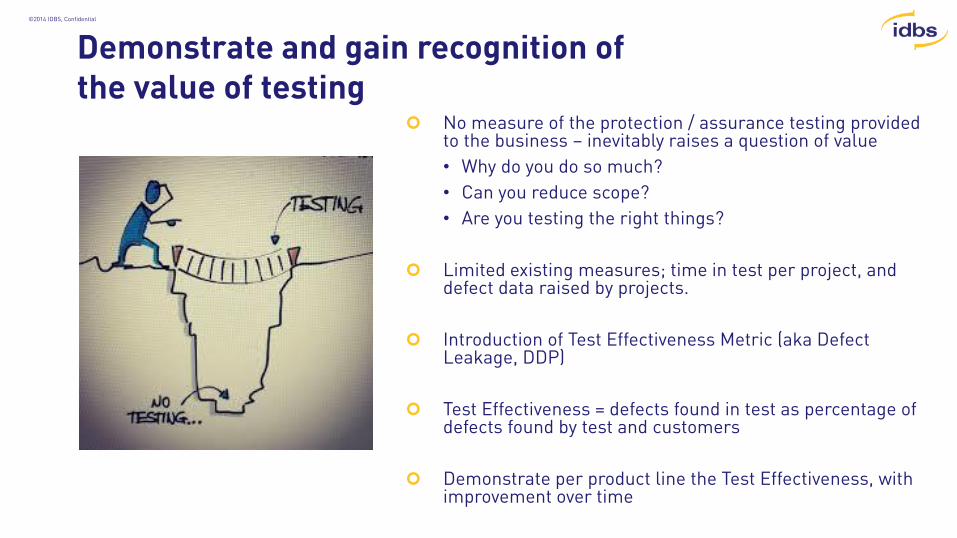
Demonstrate and gain recognition of the value of testing
No measure of the protection / assurance testing provided to the business – inevitably raises a question of value
• Why do you do so much?
• Can you reduce scope?
• Are you testing the right things?
Limited existing measures; time in test per project, and defect data raised by projects.
Introduction of Test Effectiveness Metric (aka Defect Leakage, DDP)
Test Effectiveness = defects found in test as percentage of defects found by test and customers
Demonstrate per product line the Test Effectiveness, with improvement over time

©2014 IDBS, Confidential

©2014 IDBS, Confidential
Testing – Optimised for business value

©2014 IDBS, Confidential
Changing the perception of test (and improve time to market…)
Once the opportunity cost (less projects being tested) was understood by Executive, testing no longer seen as a bottleneck, but the problem was a development issue requiring resolution.
Headcount / resourcing discussions reduced.
Only measure was time in test, and defect numbers raised by projects.
Time captured to demonstrate how much effort was being applied to rework (or, WASTE!)
Introduction of Initial Build Quality (IBQ) (% of tests that pass FIRST time they are run.
IBQ = 50 tests executed, 25 pass, 25 fail = 50% IBQ – measure of development quality process.

©2014 IDBS, Confidential
Ensure SDLC improvements were supporting business goals
Root Cause Analysis of control limit breaches drives change to process to reach departmental targets.

©2014 IDBS, Confidential
Problem statement: Late defect detection
IBQ & Test Effectiveness outliers
• Demonstrated quality problems, however defects often found late in projects, often deferred…
• Testing manual, CI tests lacked depth / breadth
Solution
• Introduction of automation architects to increase test coverage and early detection using Robot framework
• Automation on the desktop of >65% test group
• Automation tests shifted into nightly builds
• Robot buddies: Testers coaching development in improving automation coverage in unit tests and continuous integration

©2014 IDBS, Confidential
Problem statement: project prioritisation IBQ outliers
• Developers frequently switched between projects; inadequate time to become familiar with code and requirements
• This was because the priority of work was not understood and frequently changed.
Solution
• Introduction of a Portfolio Management Office – corporate service to align IT and Professional Services in delivering optimal business value
• Improved business planning & prioritisation of projects to maximise ROI of IT development
• Improved alignment of Sales, Product Management & Product Delivery

©2014 IDBS, Confidential
Problem statement: understanding edge cases
IBQ outliers, Test Effectiveness and customer raised issues
• Developers, Testers and Product Management had different understanding of requirements
• This was because our customer base was using our software in increasingly diverse ways…our understanding of use cases was behind the curve
Solution
• Introduction of Business Analysis as a vertical function in IDBS, it was previously shared between experts. Tester transitioned to Lead BA
• Assisted in product quality by renewing our understanding of use
cases (functional and non functional)
• Analytics from software logs – increased visibility on usage
patterns, operational profiles
• Enabling more agile teams by having correct customer representation
to define the backlog.

©2014 IDBS, Confidential
Implementation
AWARENESS: Internal Quality & Testing Conference (March 2012) • High Level Processes Under SPC
• Unit Test Coverage & IBQ, Overall Quality (Development Process Measures)
• Test Effectiveness (Test Process Measure)
• Support metrics – (support team SLA achievement)
• Root Cause Analysis (process improvements measures)
• Stakeholders : Product Delivery, Sales, Marketing, Product Management, Project Management, Development, Support
CONTROL: Quarterly Governance Board • Continuous engagement with stakeholders
• Product – Development – Test – Support form a supply chain of supplier / customer. Customers set targets for supplier.
• Once Performance baselines were understood trends towards targets monitored

©2014 IDBS, Confidential
Building Trust - Credibility of Metrics
Metrics provided by SPC needed credibility
Governance board were shown the following; • Approach taken in capturing data, including the source of data
• Historic data, (up to 4 years old) that not only provided the baseline but showed outliers (events) in the corporate memory they recognised, so future outliers would be trusted.
• The data was available in Quality Centre & Support works – it was simply a case of extracting it and presenting the information.

©2014 IDBS, Confidential
Positive Outcomes
Development & Testing leadership combined into one role • Holistic approach to improving software quality
• Working Groups ( Code Review , Technical Risk , Dev Impact Assessment, Developer Testing )
Decreased focus in supplier audits due to • Demonstrable closed loop quality improvements
• Auditors love it , it helps retain ISO 9001 certification and sell to new customers
Test Group now positioned as the ‘trusted advisor’ to executive team
Overall improvement initiatives in place to • Increase predictability of project outcomes
• Improve quality of software into test
• Move towards defect prevention culture – still on the journey
Investment in performance, security, business analysis to improve usability and quality improvements to products.

©2014 IDBS, Confidential
Success Factors
Standardised Testing Methodology, and tools, consistently applied
Access to a mathematician if you don’t have “an Ilca” - tools like Minitab for SPC
Ensure sponsorship – work out what is important to your sponsor and how this would help them achieve their goals.
Keep it simple – Senior Exec’s don’t have the time for detail, or necessarily understand the detail…
Stress metrics are used for process improvement – not individual performance management. You will fail otherwise…

©2014 IDBS, Confidential
Q&A
Related Documents