Top Banner
Statistical process control charts and SAS Ying Jiang Health Quality Council Saskatoon, SK
17

Statistical Process Control Charts - SAS Group Presentation… · Statistical process control chart • Shewhart chart; • In statistical process control, used to distinguish between

Feb 06, 2018

Download

Documents

phamanh
Welcome message from author
This document is posted to help you gain knowledge. Please leave a comment to let me know what you think about it! Share it to your friends and learn new things together.
Transcript
Page 1: Statistical Process Control Charts - SAS Group Presentation… · Statistical process control chart • Shewhart chart; • In statistical process control, used to distinguish between

Statistical process control charts

and SAS

Ying Jiang

Health Quality Council

Saskatoon, SK

Page 2: Statistical Process Control Charts - SAS Group Presentation… · Statistical process control chart • Shewhart chart; • In statistical process control, used to distinguish between

Outline

• Introduction

• SAS procedure

• Examples

Page 3: Statistical Process Control Charts - SAS Group Presentation… · Statistical process control chart • Shewhart chart; • In statistical process control, used to distinguish between

Statistical process control chart

• Shewhart chart;

• In statistical process control,

used to distinguish between

variation due to common

causes and variation due to

special causes;

Page 4: Statistical Process Control Charts - SAS Group Presentation… · Statistical process control chart • Shewhart chart; • In statistical process control, used to distinguish between

What does it look like?

X Axis: Sequence of data

Y Axis:

measure

Data Points (each

dot is “subgroup”) 3 sigma limits

3 sigma limits

Provost L, Murray S. The Healthcare Data Guide: Learning from Data for

Improvement. San Francisco: Jossey-Bass, Publication, 2011.

Page 5: Statistical Process Control Charts - SAS Group Presentation… · Statistical process control chart • Shewhart chart; • In statistical process control, used to distinguish between

Application

• Monitor system and correct if needed

• Find and evaluate causes of variation

Page 6: Statistical Process Control Charts - SAS Group Presentation… · Statistical process control chart • Shewhart chart; • In statistical process control, used to distinguish between

Types of Charts

• Classification data: P chart

• Count data: C chart or U chart

• Continuous data: I chart or X bar

and S chart

Page 7: Statistical Process Control Charts - SAS Group Presentation… · Statistical process control chart • Shewhart chart; • In statistical process control, used to distinguish between

Rules for Detecting Special Cause

Health care system

Provost L, Murray S. The Healthcare Data Guide: Learning from Data

for Improvement. San Francisco: Jossey-Bass, Publication, 2011.

Page 8: Statistical Process Control Charts - SAS Group Presentation… · Statistical process control chart • Shewhart chart; • In statistical process control, used to distinguish between

SAS syntax

• PROC SHEWHART ;

Page 9: Statistical Process Control Charts - SAS Group Presentation… · Statistical process control chart • Shewhart chart; • In statistical process control, used to distinguish between

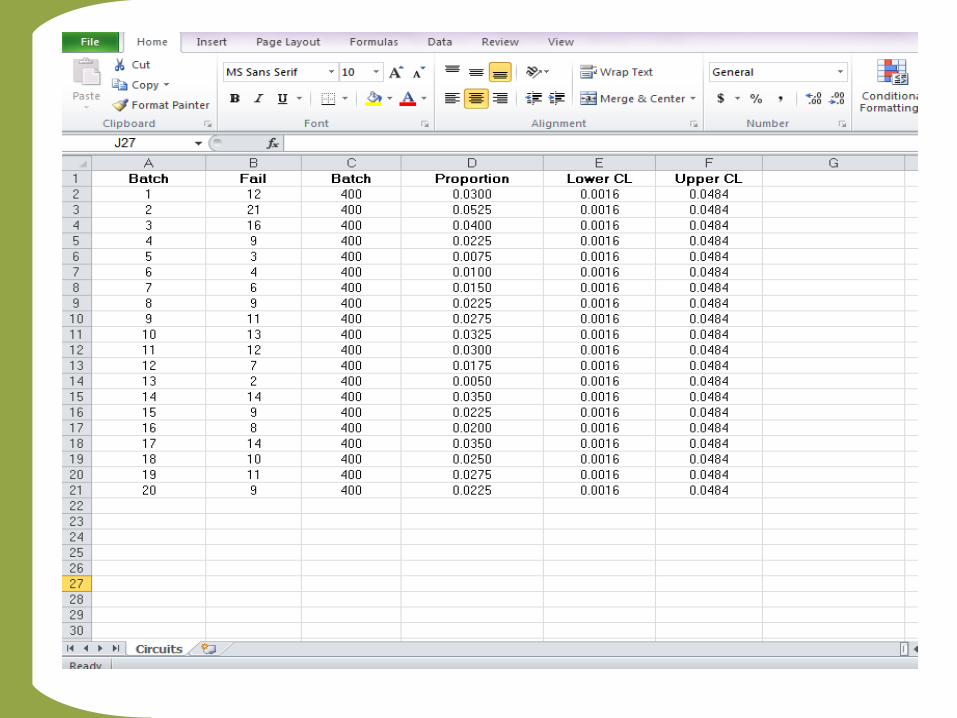
SAS Syntax Demo: P chart

Page 10: Statistical Process Control Charts - SAS Group Presentation… · Statistical process control chart • Shewhart chart; • In statistical process control, used to distinguish between

Chart Formula

P chart

𝑷𝒃𝒂𝒓 = 𝒑

𝒌*100

𝝈𝒑 =𝑷𝒃𝒂𝒓 ∗ (𝟏𝟎𝟎 − 𝑷𝒃𝒂𝒓)

𝒏

k=Number of subgroups

n=Number of sample units per subgroup

Page 11: Statistical Process Control Charts - SAS Group Presentation… · Statistical process control chart • Shewhart chart; • In statistical process control, used to distinguish between
Page 12: Statistical Process Control Charts - SAS Group Presentation… · Statistical process control chart • Shewhart chart; • In statistical process control, used to distinguish between

Quality Insight Online

http://www.qualityinsight.ca/indicators?key=5fd61a52e57954d63745

485b0b4d7cac

Page 13: Statistical Process Control Charts - SAS Group Presentation… · Statistical process control chart • Shewhart chart; • In statistical process control, used to distinguish between

Evaluation %

Alw

ays

All Saskatchewan Hospitalsp chart

UCL = 70.86CTL = 67.83LCL = 64.80

Ca

use

Ca

use

Ca

use

Ca

use

RTC StartsTC1 TC2 TC3

FEB20

09

APR20

09

JUN20

09

AUG20

09

OCT20

09

DEC20

09

FEB20

10

APR20

10

JUN20

10

AUG20

10

OCT20

10

DEC20

10

FEB20

11

APR20

11

JUN20

11

AUG20

11

OCT20

11

DEC20

11

FEB20

12

APR20

12

JUN20

12

JUL20

1240

50

60

70

80

90

Page 14: Statistical Process Control Charts - SAS Group Presentation… · Statistical process control chart • Shewhart chart; • In statistical process control, used to distinguish between

References

• Provost L, Murray S. The Healthcare Data

Guide: Learning from Data for Improvement.

San Francisco: Jossey-Bass, Publication, 2011.

• SAS/QC(R) 9.2 User's Guide

http://support.sas.com/documentation/cdl/en/q

cug/63922/HTML/default/viewer.htm#shewha

rt_toc.htm

Page 15: Statistical Process Control Charts - SAS Group Presentation… · Statistical process control chart • Shewhart chart; • In statistical process control, used to distinguish between

Thanks!

Questions?

Page 16: Statistical Process Control Charts - SAS Group Presentation… · Statistical process control chart • Shewhart chart; • In statistical process control, used to distinguish between
Page 17: Statistical Process Control Charts - SAS Group Presentation… · Statistical process control chart • Shewhart chart; • In statistical process control, used to distinguish between