Statistical presentation in international scientific publications 4. Reporting numbers Malcolm Campbell Lecturer in Statistics, School of Nursing, Midwifery & Social Work, The University of Manchester Statistical Editor, Health & Social Care in the Community

Welcome message from author
This document is posted to help you gain knowledge. Please leave a comment to let me know what you think about it! Share it to your friends and learn new things together.
Transcript

Statistical presentation in international scientific publications 4. Reporting numbers
Malcolm CampbellLecturer in Statistics, School of Nursing, Midwifery &
Social Work, The University of Manchester
Statistical Editor, Health & Social Care in the Community

26 March 2008 Statistical presentation - 4. Reporting numbers 2
4. Reporting numbersContents
• 4.1 Introduction
• 4.2 Reporting numbers and percentages
• 4.3 Reporting statistics
• 4.4 Reporting test results
• 4.5 Terminology and notation
26 March 2008 Statistical presentation - 4. Reporting numbers 3
4.1 IntroductionRationale for statistical reporting
• Be consistent and give the reader clear, concise but complete information– find a compromise between giving too little and too
much information
– this compromise may depend on the readership of the journal
• There are general conventions for reporting– numbers
– percentages
– statistics
– hypothesis tests
26 March 2008 Statistical presentation - 4. Reporting numbers 4
Reporting results in the Results sectionWhat should be reported (where applicable)
• numbers and percentages participating– by group if applicable
• characteristics of participants– also by group if applicable
• characteristics of non-participants– comparison with
participants
• baseline values of key variables– by group if applicable
• preliminary analyses– analyses for individual
variables involved in primary analyses, especially if the latter is multivariate
• assessment of assumptions for primary analyses
• primary analyses– those involved with main
research questions
• secondary analyses– those involved with
supporting research questions
26 March 2008 Statistical presentation - 4. Reporting numbers 5
4.2 Reporting numbers…Conventions (see BMJ stylebook; Lang and Secic, 1997)
• Use text for zero, one to nine and use digits from 10 onwards, unless– an age, a date or with a unit of measurement
• eg a 5 year old child; 7 June; 5 ml; 8 mm Hg; 6 weeks
– the start of a sentence
• eg Twenty-five patients failed to attend.
– reporting large general numbers
• eg five hundred; a thousand
• Report ranges of numbers using “to” without repeating units– eg 5 to 10 ml

26 March 2008 Statistical presentation - 4. Reporting numbers 6
… and percentagesMore conventions
• Reader should be aware of denominator– explicitly via the total, or implicitly via the numerator
• Use same number of decimal places consistently– usually none (eg 12%) or one (12.3%)
• Use numbers followed by “%” (eg 5%)– unless the start of a sentence
• eg Twenty-five percent of patients failed to attend.
– report ranges of percentages using “to”, repeating “%”• eg 5% to 10%
– usually best to use the style “number (percent%)”• eg Of those responding, 123 (45.6%) said …

26 March 2008 Statistical presentation - 4. Reporting numbers 7
Numerical precision for percentagesHow many decimal places? (Lang and Secic, 1997)
• If the sample is– “moderate” to “large”, use one decimal place
• eg Out of 150 patients, 75 (50.0%) said this …
– “small”, round to nearest integer• eg Out of 80 patients, 40 (50%) said that …
– “very small”, eg < 20, use actual numbers instead• eg Out of 30 patients, 15 said the other …
• Try to use same number of decimal places throughout the paper– perhaps outside Results and tables, use whole
numbers (BMJ stylebook)

26 March 2008 Statistical presentation - 4. Reporting numbers 8
How to round to n decimal placesHow software does it
• Values with digits from 0 to 4 in (n+1)st decimal place are rounded downwards– eg, to one decimal place, round 2.345 to 2.3
• Values with digits from 5 to 9 in (n+1)st decimal place are rounded upwards– eg, to one decimal place, round 3.450 to 3.5
• If after rounding, nth decimal place is 0, report it– eg if one decimal place is used, report 21.0, not 21
• “21.0” is in the range 20.05 inclusive to 21.05 exclusive
• “21” is in the range 20.5 inclusive to 21.5 exclusive
26 March 2008 Statistical presentation - 4. Reporting numbers 9
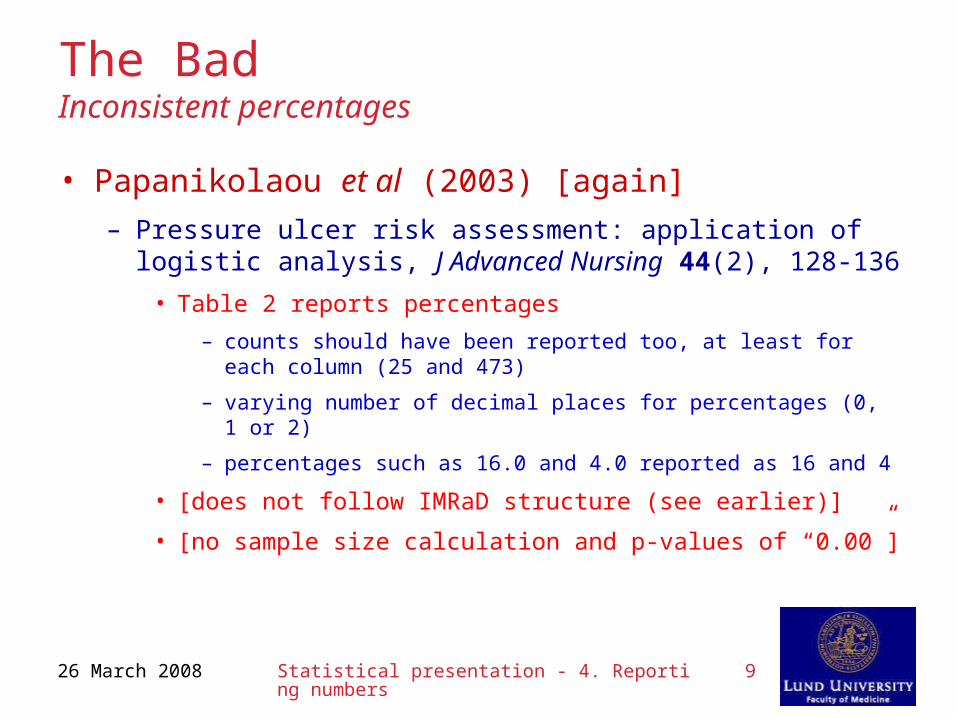
The BadInconsistent percentages
• Papanikolaou et al (2003) [again]– Pressure ulcer risk assessment: application of logistic
analysis, J Advanced Nursing 44(2), 128-136
• Table 2 reports percentages
– counts should have been reported too, at least for each column (25 and 473)
– varying number of decimal places for percentages (0, 1 or 2)
– percentages such as 16.0 and 4.0 reported as 16 and 4
• [does not follow IMRaD structure (see earlier)]
• [no sample size calculation and p-values of “0.00”]

26 March 2008 Statistical presentation - 4. Reporting numbers 10
Numerical precision for statisticsHow many decimal places? (Altman et al, 2000)
• For summary statistics such as means, standard deviations, standard errors, and confidence limits, use one more decimal place than the raw values– for medians and quartiles, possibly use raw value
• For most test statistics, use at most 2 decimal places
• Where possible, try to use same number of decimal places consistently throughout paper for each type of value
26 March 2008 Statistical presentation - 4. Reporting numbers 11
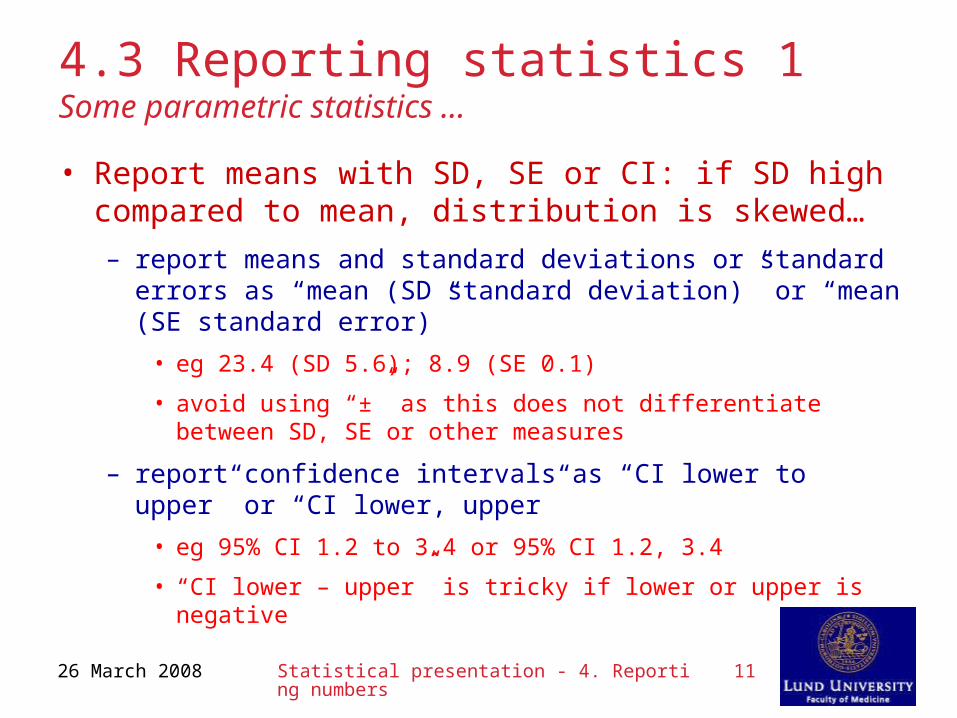
4.3 Reporting statistics 1Some parametric statistics …
• Report means with SD, SE or CI: if SD high compared to mean, distribution is skewed…– report means and standard deviations or standard errors
as “mean (SD standard deviation)” or “mean (SE standard error)”
• eg 23.4 (SD 5.6); 8.9 (SE 0.1)
• avoid using “±” as this does not differentiate between SD, SE or other measures
– report confidence intervals as “CI lower to upper” or “CI lower, upper”
• eg 95% CI 1.2 to 3.4 or 95% CI 1.2, 3.4
• “CI lower – upper” is tricky if lower or upper is negative

26 March 2008 Statistical presentation - 4. Reporting numbers 12
Reporting statistics 2… and some order/nonparametric statistics
• … And if the distribution is skewed, report medians with ranges or interquartile ranges– report ranges as “range minimum to maximum” or “range
minimum, maximum”
• eg range 5 to 67 or range 5, 67
• and not as the arithmetic difference 62
– report medians and central percentile ranges (such as interquartile range [IQR]) in the form “median (IQR lower to upper)” or “median (IQR lower, upper)”
• eg 45.6 (IQR 12.3 to 89.0) or 45.6 (IQR 12.3, 89.0)
• do not report arithmetic difference for the range
• if not IQR, identify the percentile range used
26 March 2008 Statistical presentation - 4. Reporting numbers 13
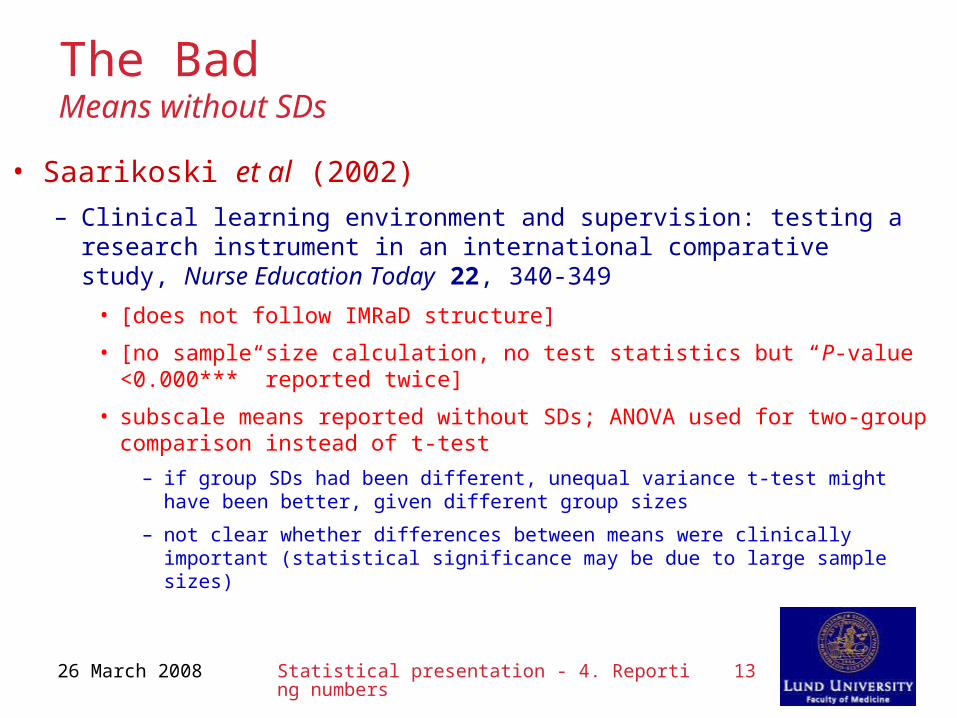
The BadMeans without SDs
• Saarikoski et al (2002)– Clinical learning environment and supervision: testing a
research instrument in an international comparative study, Nurse Education Today 22, 340-349
• [does not follow IMRaD structure]
• [no sample size calculation, no test statistics but “P-value <0.000***” reported twice]
• subscale means reported without SDs; ANOVA used for two-group comparison instead of t-test
– if group SDs had been different, unequal variance t-test might have been better, given different group sizes
– not clear whether differences between means were clinically important (statistical significance may be due to large sample sizes)
26 March 2008 Statistical presentation - 4. Reporting numbers 14
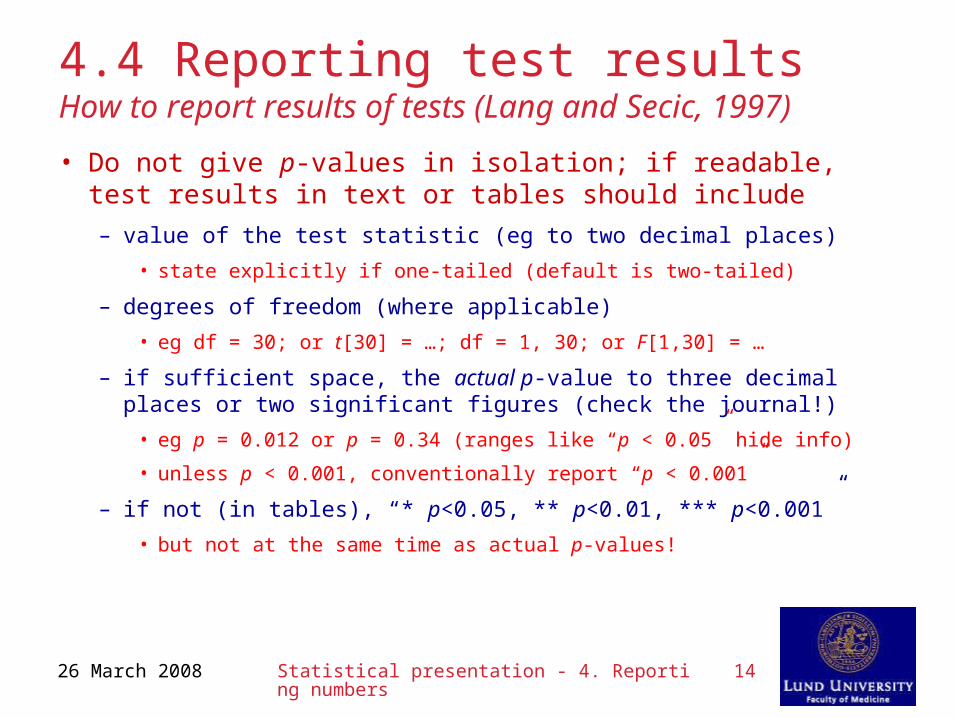
4.4 Reporting test resultsHow to report results of tests (Lang and Secic, 1997)
• Do not give p-values in isolation; if readable, test results in text or tables should include– value of the test statistic (eg to two decimal places)
• state explicitly if one-tailed (default is two-tailed)
– degrees of freedom (where applicable)
• eg df = 30; or t[30] = …; df = 1, 30; or F[1,30] = …
– if sufficient space, the actual p-value to three decimal places or two significant figures (check the journal!)
• eg p = 0.012 or p = 0.34 (ranges like “p < 0.05” hide info)
• unless p < 0.001, conventionally report “p < 0.001”
– if not (in tables), “* p<0.05, ** p<0.01, *** p<0.001”
• but not at the same time as actual p-values!
26 March 2008 Statistical presentation - 4. Reporting numbers 15
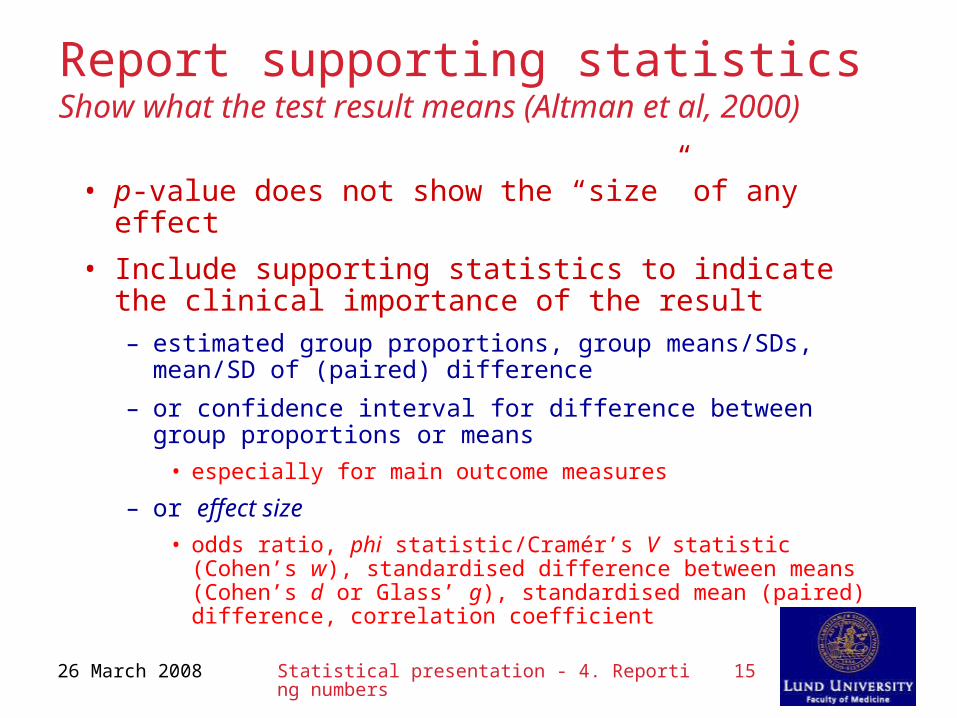
Report supporting statisticsShow what the test result means (Altman et al, 2000)
• p-value does not show the “size” of any effect
• Include supporting statistics to indicate the clinical importance of the result– estimated group proportions, group means/SDs,
mean/SD of (paired) difference
– or confidence interval for difference between group proportions or means
• especially for main outcome measures
– or effect size• odds ratio, phi statistic/Cramér’s V statistic (Cohen’s w),
standardised difference between means (Cohen’s d or Glass’ g), standardised mean (paired) difference, correlation coefficient
26 March 2008 Statistical presentation - 4. Reporting numbers 16
Non-significant resultsIt’s not the end of the world
• A non-significant test does not mean failure!– just that there is insufficient evidence to show a
statistically significant difference or relationship
• not enough data, or no difference or relationship
– this might be interesting in its own right
– sometimes the pattern of results is more important
• If a main analysis, give results and supporting statistics in full– reader still needs to know that the test has been
performed correctly
– supporting statistics may help interpreting overall pattern
26 March 2008 Statistical presentation - 4. Reporting numbers 17
The BadP-values in isolation
• Abayomi and Hackett (2004)– Assessment of malnutrition in mental health clients:
nurses’ judgement vs. a nutrition risk tool
– J Advanced Nursing 45(4), 430-437• [“Data were collated and analysed using the Statistical
Package for the Social Sciences (SPSS). The chi square test was used to assess relationships between variables…”]
• [main comparison is risk assessment by tool (yes/no) v risk assessment by nurse (yes/no), which should have been measured using kappa statistic, not chi-square]
• actual p-values given but no test statistics; no supporting statistics when comparing either risk assessment with reason for admission, gender, age (<40, >40)
26 March 2008 Statistical presentation - 4. Reporting numbers 18
The UglyP-values ranges only – not sure about the tests
• Paxton et al (1996) [again]– Evaluating the workload of practice nurses: a study,
Nursing Standard 10(21), 33-38
• study comparing workload of same 34 practice-employed and health board attached nurses before and after introduction of the New General Practitioner Contract
• [no sample size calculations]
• [chi square statistic said to be used for categorical variables, ignoring paired nature of data (see earlier)]
• [statistical methods for other variables (% of time, hours per FTE) not described]
• no test statistics reported – only p-value ranges – so can’t identify tests being used
26 March 2008 Statistical presentation - 4. Reporting numbers 19
The UglyGenerally poor reporting of results
• Zeitoun et al (2003)– A prospective, randomized study of ventilator-assisted
pneumonia in patients using a closed vs. open suction system, J Clinical Nursing 12(4), 484-489
• [not randomised, no justification for small sample size (24 open suction v 23 closed suction) and probably not enough for logistic regression]
• actual p-values (some 1.000s) but no test statistics
• entries in two tables not clear– probably mean(range) days of use of drugs
• no details of how logistic regression applied – details of “final” model shown in table
• odds ratio from logistic regression mistakenly interpreted as risk ratio (“a 0.014 less chance of developing VAP”)

26 March 2008 Statistical presentation - 4. Reporting numbers 20
4.5 Terminology and notationYet more conventions
• There are common conventions on the use of– reserved terminology
– standard statistical notation, including
• common abbreviations
• Roman characters
• Greek characters
26 March 2008 Statistical presentation - 4. Reporting numbers 21
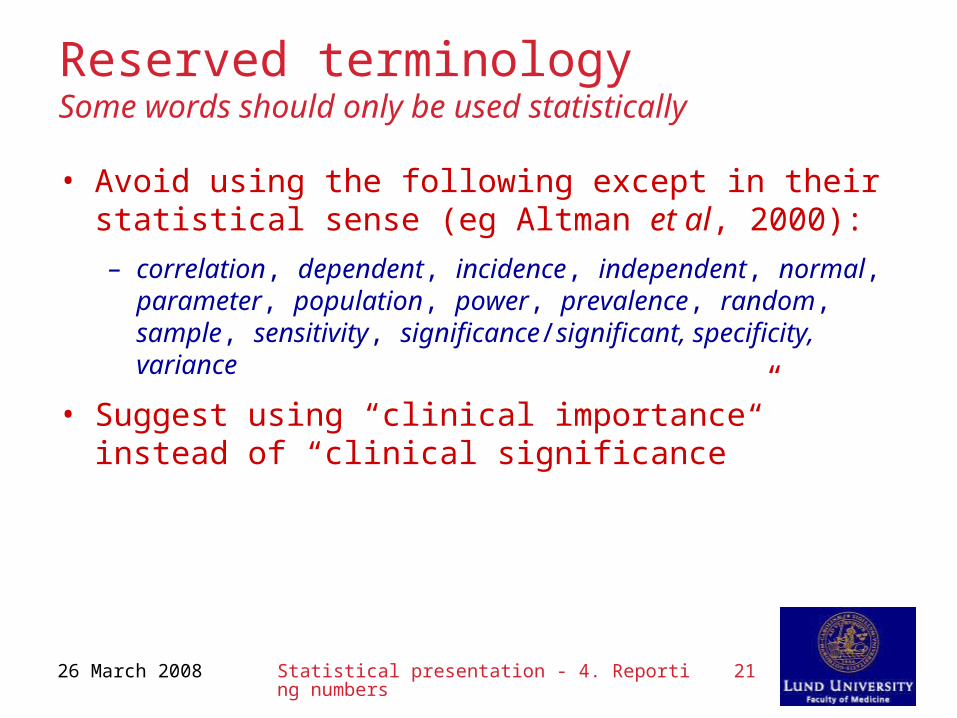
Reserved terminologySome words should only be used statistically
• Avoid using the following except in their statistical sense (eg Altman et al, 2000):– correlation, dependent, incidence, independent, normal,
parameter, population, power, prevalence, random, sample, sensitivity, significance/significant, specificity, variance
• Suggest using “clinical importance” instead of “clinical significance”

26 March 2008 Statistical presentation - 4. Reporting numbers 22
Statistical abbreviationsCommonly used in text or tables
• ANACOVA, ANCOVA – analysis of covariance
• ANOVA – analysis of variance
• CI – confidence interval
• ICC – intra-class correlation
• IQR – interquartile range
• MANOVA – multivariate analysis of variance
• NNT – number needed to treat
• SD - standard deviation
• SE - standard error
26 March 2008 Statistical presentation - 4. Reporting numbers 23
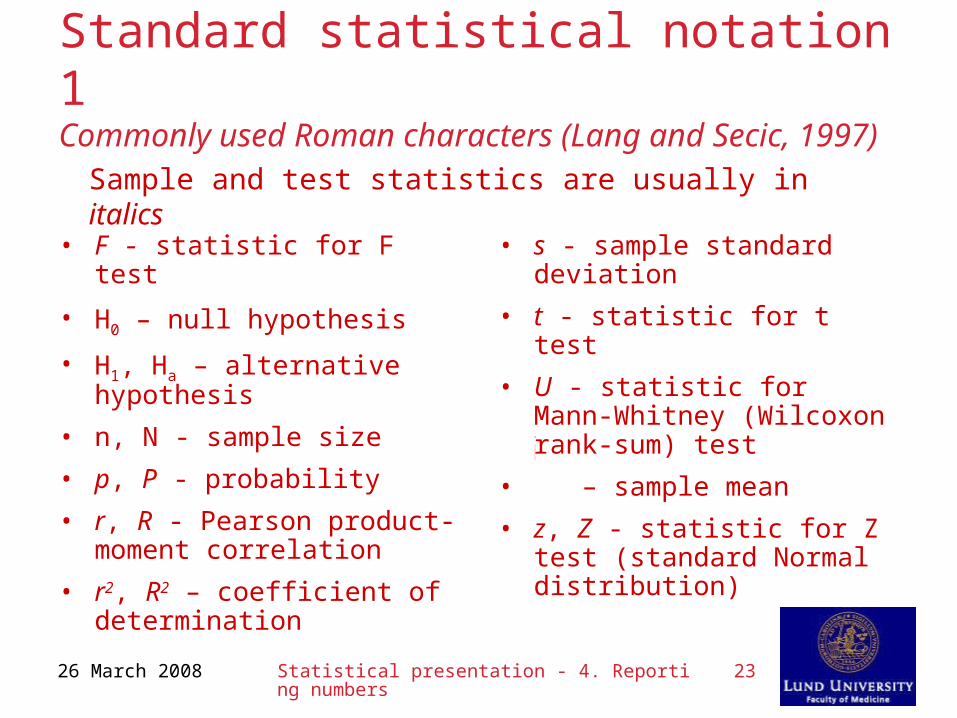
Standard statistical notation 1Commonly used Roman characters (Lang and Secic, 1997)
• F - statistic for F test
• H0 – null hypothesis
• H1, Ha – alternative hypothesis
• n, N - sample size
• p, P - probability
• r, R - Pearson product-moment correlation
• r2, R2 – coefficient of determination
• s - sample standard deviation
• t - statistic for t test
• U - statistic for Mann-Whitney (Wilcoxon rank-sum) test
• – sample mean
• z, Z - statistic for Z test (standard Normal distribution)
Sample and test statistics are usually in italics
x̄
26 March 2008 Statistical presentation - 4. Reporting numbers 24
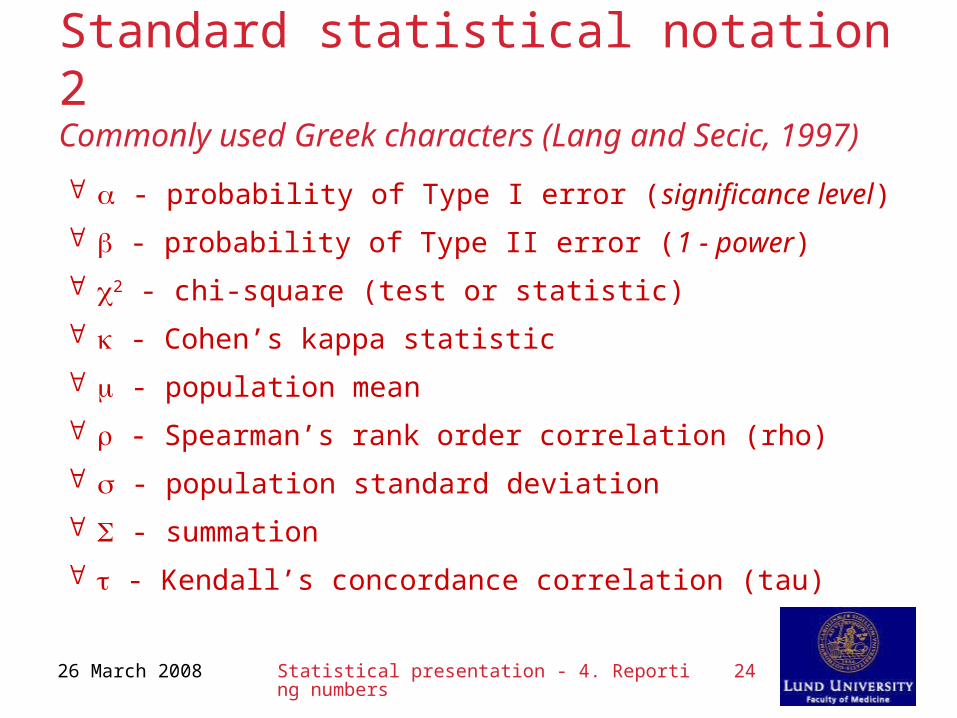
Standard statistical notation 2Commonly used Greek characters (Lang and Secic, 1997)
- probability of Type I error (significance level)
- probability of Type II error (1 - power)
2 - chi-square (test or statistic)
- Cohen’s kappa statistic
- population mean
- Spearman’s rank order correlation (rho)
- population standard deviation
- summation
- Kendall’s concordance correlation (tau)
Related Documents


