STATISTICAL POCKET BOOK Department of Census and Statistics Ministry of Economic policies & Plan Implementation 2021 Ministry of Economic policies & Plan Implementation Department of Census and Statistics

Welcome message from author
This document is posted to help you gain knowledge. Please leave a comment to let me know what you think about it! Share it to your friends and learn new things together.
Transcript
STATISTICALPOCKET BOOK
Department of Census and StatisticsMinistry of Economic policies & Plan Implementation
2021
SRI LANKA STATISTICAL POCKET BOOK 2021
STATISTICAL POCKETBOOK2021
Ministry of Economicpolicies & PlanImplementation
Department of Census and Statistics
ISBN : 978-955-702-233-8
The Vision of DCS
“To be the leader in the region in producing
timely statistical information to achieve the
country’s development goals.”
“Making contribution in the socioeconomic development of
the country by providing accurate timely statistics, more
Effectively by means of new technology, and utilising the
services of dedicated staff under a strategic leadership to
become a prosperous nation in the globalised environment.”
The Mission of DCS [email protected]
+94 11 2147000
+94 11 2147400
+94 11 2147011
Department of Census & Statistics
Sankyana Mandiraya
No. 306/71, Polduwa Road,
Battaramulla.
www.statistics.gov.lk
I
Statistical Pocket Book – 2021 Sri Lanka
Department of Census and Statistics Ministry of Economic Policies and Plan Implementation
Sri Lanka

II
STATISTICAL POCKET BOOK 2021
ISBN 978-955-702-233-8
Publication Division Department of Census and Statistics
“Sankyana Mandiraya” No. 306/71 Polduwa Road
Baththaramulla
Telephone- +94 11 2147000 E mail : [email protected]
Web : www. statistics.gov.lk
III
PREFACE
This Statistical Pocket Book is published annually. The 1st issue of the Statistical Pocket Book was published in year 1967. This is the fifty fourth issue. It contains summarized statistical information such as Population, Agriculture, Industry, National Accounts etc.This book is very useful to the administrators, students, tourists and the general public. This Pocket Book has been prepared by the Publications Division and headed by Mrs.G.G. Gunasekara (Director) with the guidance of Mrs. D.D.G.A. Seneviratne the Additional Director General of the Department of Census and Statistics. The preparation of this book and the verification of the data included in the report was carried out by Mrs. A.M.T.Deepthika Abeysinghe Development Officer, under the supervision of Mrs. A.K.J.Muthugalage, Statistician. I would like to express my appreciation to Mrs. U.V Jayakody (Director) and Mr. Vajira Sooriyaarachchi for their support in compiling the new book under the guidance of the Departmental Communication Committee and also all Divisions of the Department, other Ministries, Departments for providing data. It was profound assistance from the staff in the Publications Division to publish this book promptly and successfully.
December, 2021 P.M.P.Anura kumara Director General
IV
STATISTICAL POCKET BOOK 2021
EXPLANATORY NOTES
1. Symbols employed The following symbols have been used throughout this book .. Not available
- Nil or negligible 2. Rounding off figures
Where necessary each figure has been rounded off to the nearest final digit. For this reason there may be in some tables an apparent discrepancy between the sum of the constituent items and the total.
3. Wherever information has not been given in respect of any table, it is because the information was not available at the time of going to the press or because of the subject matter of the particular table was under review.
4. Explanations, where necessary, have been given in footnotes as far as space permits. A further explanation of the terms and expressions may be found in the Statistical Abstract of Sri Lanka.
V
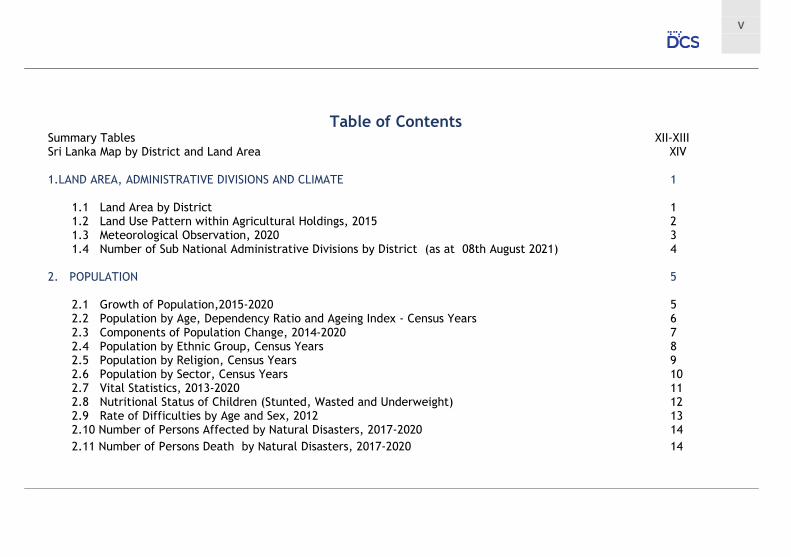
Table of Contents Summary Tables XII-XIII Sri Lanka Map by District and Land Area XIV 1.LAND AREA, ADMINISTRATIVE DIVISIONS AND CLIMATE 1
1.1 Land Area by District 1 1.2 Land Use Pattern within Agricultural Holdings, 2015 2 1.3 Meteorological Observation, 2020 3 1.4 Number of Sub National Administrative Divisions by District (as at 08th August 2021) 4
2. POPULATION 5
2.1 Growth of Population,2015-2020 5 2.2 Population by Age, Dependency Ratio and Ageing Index - Census Years 6 2.3 Components of Population Change, 2014-2020 7 2.4 Population by Ethnic Group, Census Years 8 2.5 Population by Religion, Census Years 9 2.6 Population by Sector, Census Years 10 2.7 Vital Statistics, 2013-2020 11 2.8 Nutritional Status of Children (Stunted, Wasted and Underweight) 12 2.9 Rate of Difficulties by Age and Sex, 2012 13
2.10 Number of Persons Affected by Natural Disasters, 2017-2020 14 2.11 Number of Persons Death by Natural Disasters, 2017-2020 14

VI
STATISTICAL POCKET BOOK 2021
3. EMPLOYMENT 15
3.1 Labour Force Status of the Household Population, 2016-2020 15 3.2 Employed Persons by Industry Group, 2016-2020 17 3.3 Employed Persons by Major Occupational Groups, 2016-2020 18 3.4 Composition of Employment by Economic Sector, 2020 19 3.5 Employment by Economic Sector by Sex, 2020 19 3.6 Percentage Distribution of Informal In Non - Agricultural 20 3.7 Unemployment Rate by Province and Sex, 2017-2020 21 3.8 Percentage Distribution of Employed and Unemployed Population by Level of 22 Education and Sex, 2017-2020 3.9 Index Numbers of Minimum Wages by Class of Workers, 2013-2020 23 3.10 Departures for Foreign Employment by Manpower Level and Sex, 2012-2020 24 3.11 Public and Semi Government Sector Employees by Census years, Sector and Sex 26 3.12 Public and Semi Government Sector Employees by Sector of Employment 27 and Age Group, 2016 3.13 Public and Semi Government Employees by Sector of Employment and Highest Level 28 of Education 2016 3.14 Public and Semi Government Employees by Sector of Employment, Computer Literate 29
and Internet Use 2016 4. POVERTY INDICES 30
4.1 Percentage of Poor Houesholds Based on the Official Poverty Line by District 30 4.2 Poverty Lines by District, 2015-2020 31 4.3 Poverty Headcount Index and Percentage of Poor Housholds Based on the Official Poverty Line 32
by Sector
VII
4.4 Average Monthly Household Income (at Current Price) and Gini Coefficient 32 for Household by Sector 4.5 Poverty Gap and Squared Poverty Gap Indices by Sector 33 4.6 Average Monthly Household Expenditure on Selected Food Items 34 4.7 Average Monthly Household Expenditure on Major Non-food Expenditure Group 35
5. PRICE INDICES 36
5.1 Movements of Colombo Consumers’ Price Index, 2016-2020 36 5.2 Producers’ Prices for Paddy, 2012-2020 37 5.3 All Island Retail Prices for Selected Building Materials , 2016-2020 38
6. AGRICULTURE, FORESTRY AND FISHING 39
6.1 Area and Yield of Paddy 39 6.2 Irrigable and Irrigated Extent of Paddy Land, 2012-2020 41 6.3 Extent Under Principal Crops and Food Crops, 2016-2020 42 6.4 Production Under Principal Crops and Food Crops, 2016-2020 43 6.5 Cost of Production of Principal Crops, 2009-2020 44 6.6 Per Capita Availability of Rice, 2012-2020 45 6.7 Per Capita Availability of Nutrition Per Day, 2014-2020 46 6.8 Livestock and Production of Milk and Eggs, 2015-2020 47 6.9 Volume Index of Agricultural Production, 2016-2020 48 6.10 Annual Fish Production by Fishing Sub - Sectors, 2013-2020 49 6.11 Operating Fishing Boats and Active Fishers, 2017-2020 49

VIII
STATISTICAL POCKET BOOK 2021
7. INDUSTRY 50
7.1 Energy Supply and Consumption, 2016-2020 50
7.2 Principal Indicators of Industrial Activity Classified by Industry Sector- 2018 51 8. TRANSPORT AND COMMUNICATION 52
8.1 Domestic and International Transport, 2017-2020 52 Department of Railway, Civil Aviation Authority of Sri Lanka 8.2 Registered Motor Vehicles, 2016-2020 53 8.3 Postal Services, 2016-2020 54 8.4 Telecommunication Services, 2017-2020 55
9. FOREIGN TRADE 56
9.1 Summary of Foreign Trade Statistics, 2012-2020 56 9.2 Composition of Imports, 2015-2020 57 9.3 Import Quantities by Principal Commodities, 2016-2020 58 9.4 Volume of Exports of Selected Minor Export Crops, 2016-2020 59 9.5 Quantity and Value of Imports of Major Commodities, 2012-2020 60 9.6 Quantity and Value of Exports of Major Commodities, 2012-2020 61 9.7 Foreign Exchange Rates (Annual Average Rates), 2013-2020 62 9.8 Index Numbers of External Trade, 2016-2020 63
10. NATIONAL ACCOUNTS 64
10.1 National Accounts Summary Indicators (Base - 2010), 2015-2020 64 10.2 Gross Domestic Product at Current Market Prices of Major Economic Activities 2015-2020 65
IX
10.3 Gross Domestic Product at Constant (2010) Market Prices of Major 66 Economic Activities, 2015-2020 10.4 Expenditure on Gross Domestic Product (GDP/GDE) at Current prices, (Base -2010) 2015-2020 67
11. PUBLIC FINANCE 68
11.1 Government Revenue 2016-2020 68 11.2 Composition of the Public Debt, 2016-2020 69 11.3 Government Expenditure and Lending Minus Repayments, 2016-2020 70
12. HEALTH 71
12.1 Government Medical Institutions, Medical Personnel and Patients Treated, 2011-2019 71 12.2 Expenditure on Health Services and Other Facilities, 2011-2019 72
13. EDUCATION 73
13.1 Number of Schools, Teachers, Pupils and Pupil Teacher Ratio by Type of Schools, 73 2017-2020 13.2 Performance of Candidates - G.C.E.(O/L) and G.C.E.(A/L), 2019-2020 74 13.3 University Education, 2019-2020 75 13.4 Expenditure on Education, 2019-2020 13.5 Number Literate and Literacy Rates by Census years & Sex 76 13.6 Students by Institute of Vocational & Technical Training Sector, 2019-2020 77 13.7 Income and Expenditure of Vocational and Technical Training Sector, 2019-2020 78 13.8 Institutional Development of Vocational and Technical Training Sector, 2019-2020 79
X
STATISTICAL POCKET BOOK 2021
14. TOURISM 80
14.1 Tourist Growth Trends, 2011-2020 80 14.2 Number of Establishment Employment in Tourist Industry by Category of 82 Establishment, 2017-2020 14.3 Percentage Distribution of Tourists by Purpose of Visit, 2012-2020 83
15. Local Government and Co-operative Development 84
15.1 Local Government Statistics, 2019 84 15.2 Type of Service Provided by Local Government Institutions, 2019 85 15.3 Number of Co-operative Societies, 2017-2020 86 15.4 Loans Granted by Rural Co-operative Credit Societies to its Members 87 by Purpose, 2019-2020 15.5 Number of Employees Attached to Co-operative Societies, 2017-2020 87 15.6 Loans Issued by Co-operative Rural Banks by Purpose, 2016-2020 88 15.7 Co-operative Rural Bank Deposits, Loans and Pawning Advances, 2016-2020 88
XI
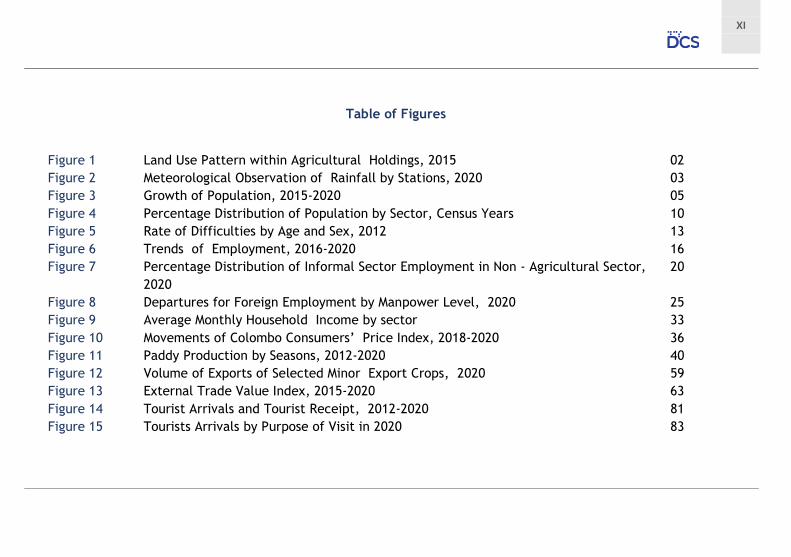
Table of Figures
Figure 1 Land Use Pattern within Agricultural Holdings, 2015 02 Figure 2 Meteorological Observation of Rainfall by Stations, 2020 03 Figure 3 Growth of Population, 2015-2020 05 Figure 4 Percentage Distribution of Population by Sector, Census Years 10 Figure 5 Rate of Difficulties by Age and Sex, 2012 13 Figure 6 Trends of Employment, 2016-2020 16 Figure 7 Percentage Distribution of Informal Sector Employment in Non - Agricultural Sector, 20
2020 Figure 8 Departures for Foreign Employment by Manpower Level, 2020 25 Figure 9 Average Monthly Household Income by sector 33 Figure 10 Movements of Colombo Consumers’ Price Index, 2018-2020 36 Figure 11 Paddy Production by Seasons, 2012-2020 40 Figure 12 Volume of Exports of Selected Minor Export Crops, 2020 59 Figure 13 External Trade Value Index, 2015-2020 63 Figure 14 Tourist Arrivals and Tourist Receipt, 2012-2020 81 Figure 15 Tourists Arrivals by Purpose of Visit in 2020 83
XII
STATISTICAL POCKET BOOK 2021
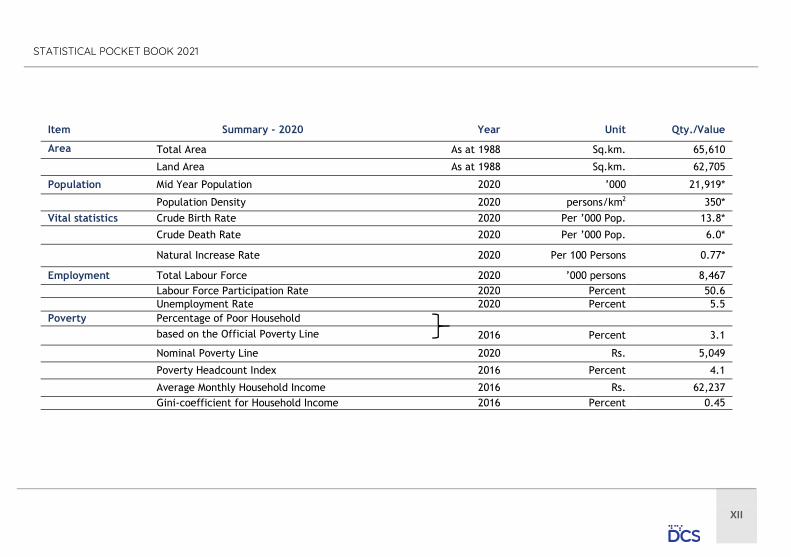
Item Summary - 2020 Year Unit Qty./Value
Area Total Area As at 1988 Sq.km. 65,610
Land Area As at 1988 Sq.km. 62,705
Population Mid Year Population 2020 ’000 21,919*
Population Density 2020 persons/km2 350*
Vital statistics Crude Birth Rate 2020 Per ’000 Pop. 13.8*
Crude Death Rate 2020 Per ’000 Pop. 6.0*
Natural Increase Rate 2020 Per 100 Persons 0.77*
Employment Total Labour Force 2020 ’000 persons 8,467
Labour Force Participation Rate 2020 Percent 50.6
Unemployment Rate 2020 Percent 5.5
Poverty Percentage of Poor Household
based on the Official Poverty Line 2016 Percent 3.1 Nominal Poverty Line 2020 Rs. 5,049
Poverty Headcount Index 2016 Percent 4.1
Average Monthly Household Income 2016 Rs. 62,237
Gini-coefficient for Household Income 2016 Percent 0.45

XIII
Item Summary (Contd.) - 2020 Year Unit Qty./Value
Agriculture Paddy Production Maha Season 2019/20 ’000 MT 3,197
Yala Season 2020 ’000 MT 1,924 Average Yield of Paddy Maha Season 2019/20 Kg/Net Hect. 4,531
Yala Season 2020 Kg/Net Hect. 4,552
Per Capita Availability of Nutrition per day
Energy 2020 Kilo Calories 3,227*
Protein 2020 Grams 80*
Fat 2020 Grams 69*
Trade Total Exports 2020 Rs. Mn. 1,989,785
Total Imports 2020 Rs. Mn. 2,891,600
Balance of Trade 2020 Rs. Mn. -910,814
National Accounts G.D.P. at Current Market Prices 2020 Rs.Mn. 14,972,995*
G.D.P. at Constant (2010) Prices 2020 Rs.Mn. 9,530,606*
Tourism Total no. of Tourist Arrivals 2020 Number 507,704*
Price Indices Colombo Consumers’ Price Index 2020 Number 135.4
(CCPI base 2013=100)
Inflation(Annual Average %) 2020 Percent 4.6

XIV
STATISTICAL POCKET BOOK 2021
1
1. LAND AREA, ADMINISTRATIVE DIVISIONS AND CLIMATE
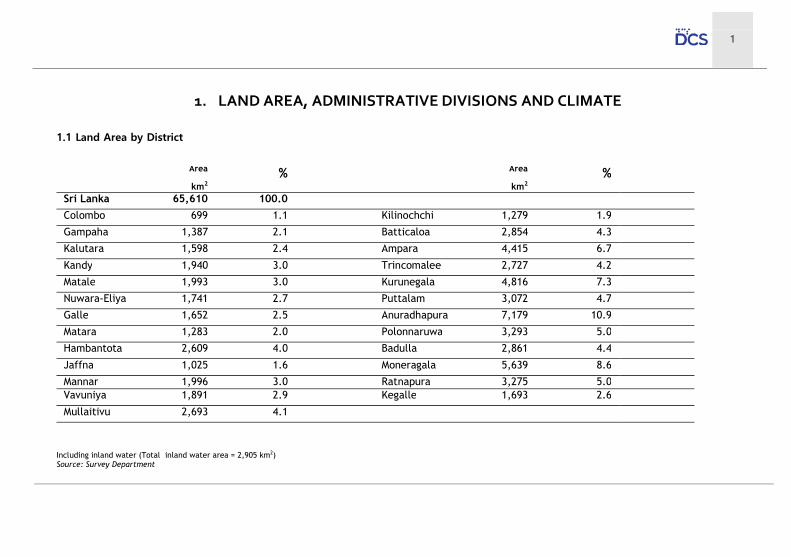
1.1 Land Area by District
Area
km2 % Area
km2 %
Sri Lanka 65,610 100.0
Colombo 699 1.1 Kilinochchi 1,279 1.9
Gampaha 1,387 2.1 Batticaloa 2,854 4.3
Kalutara 1,598 2.4 Ampara 4,415 6.7
Kandy 1,940 3.0 Trincomalee 2,727 4.2
Matale 1,993 3.0 Kurunegala 4,816 7.3
Nuwara-Eliya 1,741 2.7 Puttalam 3,072 4.7
Galle 1,652 2.5 Anuradhapura 7,179 10.9
Matara 1,283 2.0 Polonnaruwa 3,293 5.0
Hambantota 2,609 4.0 Badulla 2,861 4.4
Jaffna 1,025 1.6 Moneragala 5,639 8.6
Mannar 1,996 3.0 Ratnapura 3,275 5.0 Vavuniya 1,891 2.9 Kegalle 1,693 2.6
Mullaitivu 2,693 4.1
Including inland water (Total inland water area = 2,905 km2) Source: Survey Department

2
STATISTICAL POCKET BOOK 2021
Type Area (Hec) %
Total 6,561,000 100.0
Built up Lands 60,062 0.92
Home Gardens 1,450,744 22.12
Permanent Crops 732,442 11.15
Paddy 922,254 14.06
Temporary Crops 430,206 6.56
Forest Land 1,251,254 19.07
Scrub Land 779,604 11.88
Water Bodies 488,028 7.44
Other (Mangroves, Roads and Streams etc)
446,406 6.80
Source: Land Use Policy Planning Department
Built up Lands
1%
Home Gardens
22%
Permanent Crops11%
Paddy14%
Temporary Crops
7%
Forest Land19%
Scrub Land12%
Water Bodies
7%
Other (Mangroves,
Roads &Streams
etc)7%
Source:Land use policy planning department, Sri Lanka
Figure 1 Land Use Pattern within Agricultural Holdings, 2015
3
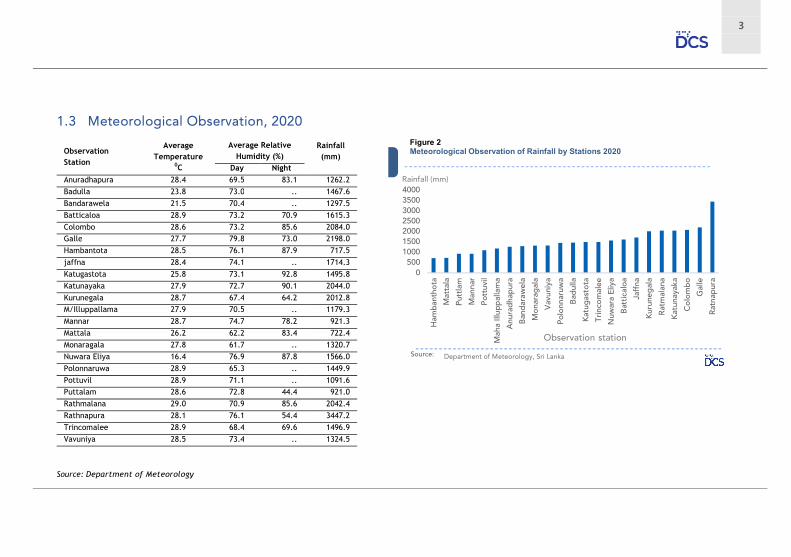
Observation Station
Average Temperature
0C
Average Relative Humidity (%)
Rainfall (mm)
Day Night
Anuradhapura 28.4 69.5 83.1 1262.2
Badulla 23.8 73.0 .. 1467.6
Bandarawela 21.5 70.4 .. 1297.5
Batticaloa 28.9 73.2 70.9 1615.3
Colombo 28.6 73.2 85.6 2084.0
Galle 27.7 79.8 73.0 2198.0
Hambantota 28.5 76.1 87.9 717.5
jaffna 28.4 74.1 .. 1714.3
Katugastota 25.8 73.1 92.8 1495.8
Katunayaka 27.9 72.7 90.1 2044.0
Kurunegala 28.7 67.4 64.2 2012.8
M/Illuppallama 27.9 70.5 .. 1179.3
Mannar 28.7 74.7 78.2 921.3
Mattala 26.2 62.2 83.4 722.4
Monaragala 27.8 61.7 .. 1320.7
Nuwara Eliya 16.4 76.9 87.8 1566.0
Polonnaruwa 28.9 65.3 .. 1449.9
Pottuvil 28.9 71.1 .. 1091.6
Puttalam 28.6 72.8 44.4 921.0
Rathmalana 29.0 70.9 85.6 2042.4
Rathnapura 28.1 76.1 54.4 3447.2
Trincomalee 28.9 68.4 69.6 1496.9
Vavuniya 28.5 73.4 .. 1324.5
Source: Department of Meteorology
Figure 2 Meteorological Observation of Rainfall by Stations 2020
4
STATISTICAL POCKET BOOK 2021
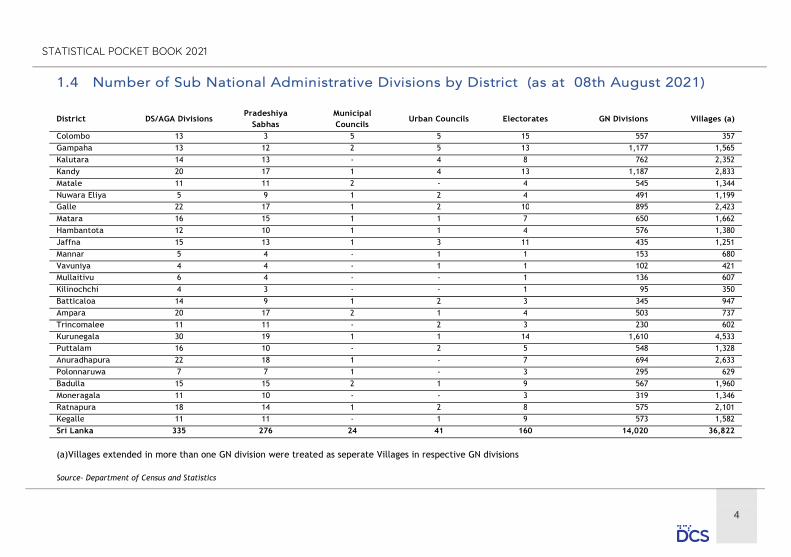
District DS/AGA Divisions Pradeshiya
Sabhas Municipal Councils
Urban Councils Electorates GN Divisions Villages (a)
Colombo 13 3 5 5 15 557 357
Gampaha 13 12 2 5 13 1,177 1,565
Kalutara 14 13 - 4 8 762 2,352
Kandy 20 17 1 4 13 1,187 2,833
Matale 11 11 2 - 4 545 1,344
Nuwara Eliya 5 9 1 2 4 491 1,199
Galle 22 17 1 2 10 895 2,423
Matara 16 15 1 1 7 650 1,662
Hambantota 12 10 1 1 4 576 1,380
Jaffna 15 13 1 3 11 435 1,251
Mannar 5 4 - 1 1 153 680
Vavuniya 4 4 - 1 1 102 421
Mullaitivu 6 4 - - 1 136 607
Kilinochchi 4 3 - - 1 95 350
Batticaloa 14 9 1 2 3 345 947
Ampara 20 17 2 1 4 503 737
Trincomalee 11 11 - 2 3 230 602
Kurunegala 30 19 1 1 14 1,610 4,533
Puttalam 16 10 - 2 5 548 1,328
Anuradhapura 22 18 1 - 7 694 2,633
Polonnaruwa 7 7 1 - 3 295 629
Badulla 15 15 2 1 9 567 1,960
Moneragala 11 10 - - 3 319 1,346
Ratnapura 18 14 1 2 8 575 2,101
Kegalle 11 11 - 1 9 573 1,582
Sri Lanka 335 276 24 41 160 14,020 36,822
(a)Villages extended in more than one GN division were treated as seperate Villages in respective GN divisions Source- Department of Census and Statistics
5
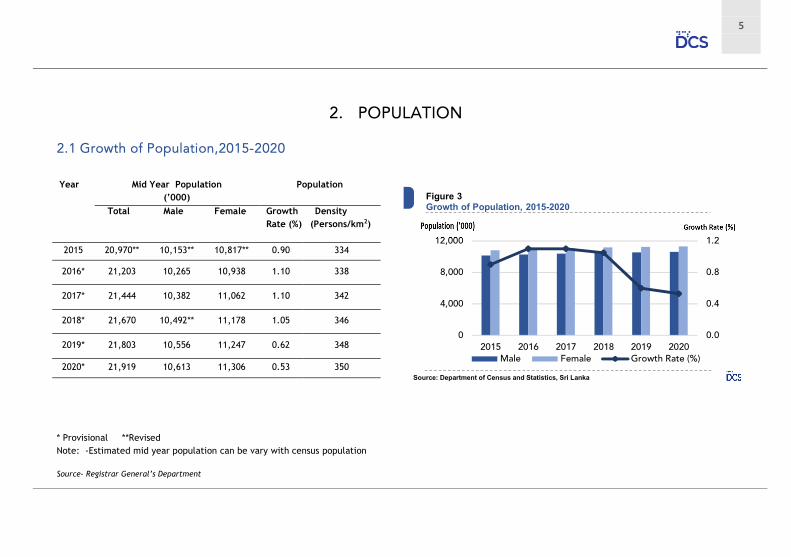
Year Mid Year Population
(’000) Population
Total Male Female Growth Density Rate (%) (Persons/km2)
2015 20,970** 10,153** 10,817** 0.90 334
2016* 21,203 10,265 10,938 1.10 338
2017* 21,444 10,382 11,062 1.10 342
2018* 21,670 10,492** 11,178 1.05 346
2019* 21,803 10,556 11,247 0.62 348
2020* 21,919 10,613 11,306 0.53 350
* Provisional **RevisedNote: -Estimated mid year population can be vary with census population Source- Registrar General’s Department
Figure 3Growth of Population, 2015-2020
Source: Department of Census and Statistics, Sri Lanka
6
STATISTICAL POCKET BOOK 2021
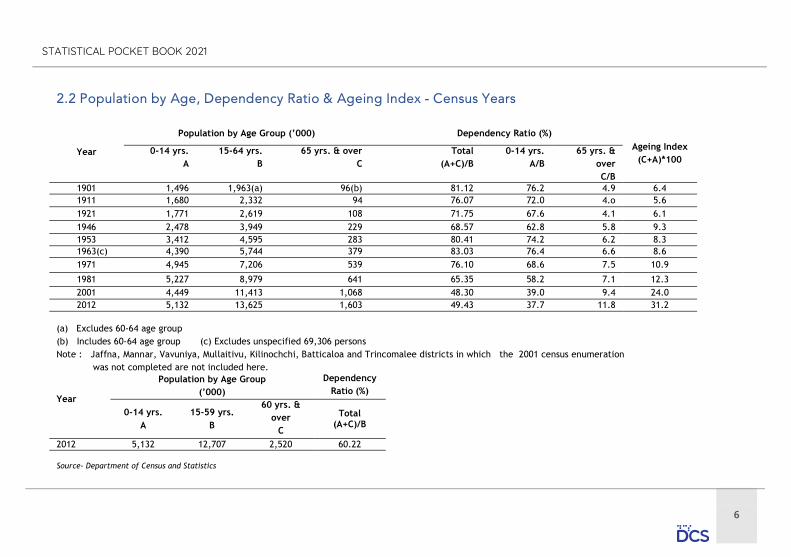
Year
Population by Age Group (’000) Dependency Ratio (%) Ageing Index
(C+A)*100 0-14 yrs.
A 15-64 yrs.
B 65 yrs. & over
C
Total (A+C)/B
0-14 yrs. A/B
65 yrs. & over C/B
1901 1,496 1,963(a) 96(b) 81.12 76.2 4.9 6.4 1911 1,680 2,332 94 76.07 72.0 4.o 5.6 1921 1,771 2,619 108 71.75 67.6 4.1 6.1 1946 2,478 3,949 229 68.57 62.8 5.8 9.3 1953 3,412 4,595 283 80.41 74.2 6.2 8.3
1963(c) 4,390 5,744 379 83.03 76.4 6.6 8.6 1971 4,945 7,206 539 76.10 68.6 7.5 10.9
1981 5,227 8,979 641 65.35 58.2 7.1 12.3 2001 4,449 11,413 1,068 48.30 39.0 9.4 24.0 2012 5,132 13,625 1,603 49.43 37.7 11.8 31.2
(a) Excludes 60-64 age group (b) Includes 60-64 age group (c) Excludes unspecified 69,306 persons Note : Jaffna, Mannar, Vavuniya, Mullaitivu, Kilinochchi, Batticaloa and Trincomalee districts in which the 2001 census enumeration was not completed are not included here.
Year
Population by Age Group (’000)
Dependency Ratio (%)
0-14 yrs. A
15-59 yrs. B
60 yrs. & over
C
Total (A+C)/B
2012 5,132 12,707 2,520 60.22 Source- Department of Census and Statistics

7
Year Mid Year Population (’000)
Births (Number)
Deaths (Number)
Natural Increase Rate (%)
Net Migration Rate (0/00)
2014 20,777** 349,715 127,758 1.07 -2.0
2015* 20,970** 334,821 131,614 0.97 0.7
2016* 21,203 331,073 130,765 0.94 2.1
2017* 21,444 326,052 139,822 0.87 2.3**
2018* 21,670 328,112 139,498 0.86 0.7**
2019* 21,803 319,010 146,053 0.86 -2.3
2020* 21,919 301,706 132,431 0.77 -4.3
* Provisional ** Revised Note: -Estimated mid year population can be vary with census population - % - Per 100 persons - %0 -Per 1000 persons
Source- Registrar General’s Department
8
STATISTICAL POCKET BOOK 2021
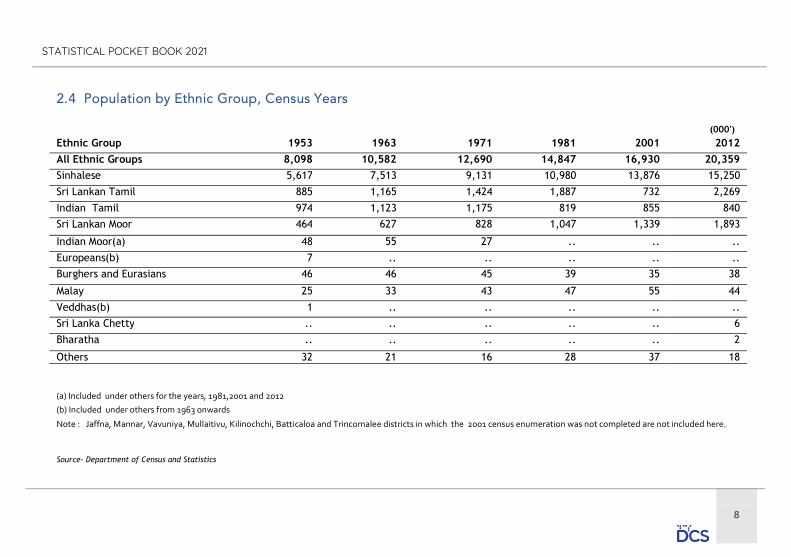
(000')
Ethnic Group 1953 1963 1971 1981 2001 2012
All Ethnic Groups 8,098 10,582 12,690 14,847 16,930 20,359
Sinhalese 5,617 7,513 9,131 10,980 13,876 15,250
Sri Lankan Tamil 885 1,165 1,424 1,887 732 2,269
Indian Tamil 974 1,123 1,175 819 855 840
Sri Lankan Moor 464 627 828 1,047 1,339 1,893
Indian Moor(a) 48 55 27 .. .. ..
Europeans(b) 7 .. .. .. .. ..
Burghers and Eurasians 46 46 45 39 35 38
Malay 25 33 43 47 55 44
Veddhas(b) 1 .. .. .. .. ..
Sri Lanka Chetty .. .. .. .. .. 6
Bharatha .. .. .. .. .. 2
Others 32 21 16 28 37 18 (a) Included under others for the years, 1981,2001 and 2012 (b) Included under others from 1963 onwards
Note : Jaffna, Mannar, Vavuniya, Mullaitivu, Kilinochchi, Batticaloa and Trincomalee districts in which the 2001 census enumeration was not completed are not included here. Source- Department of Census and Statistics

9
('000)
Religions 1953 1963 1971 1981 2001 2012
All Religions 8,097.9 10,582.0 12,690.0 14,846.7 16,929.7 20,359.4
Buddhist 5,209.4 7,003.3 8,536.9 10,288.3 12,986.6 14,272.1
Hindu 1,610.5 1,958.4 2,238.7 2,297.8 1,312.9 2,561.3
Islam 541.5 724.0 901.8 1,121.7 1,435.9 1,967.5
Roman Catholic and Other Christian 724.4 884.9 1,004.3 1,130.6 1,185.9 1,552.2
Other 11.9 11.4 8.3 8.3 8.4 6.4
Note: Jaffna, Mannar, Vavuniya, Mullaitivu, Kilinochchi, Batticaloa and Trincomalee districts in which the 2001 census enumeration was not completed are not included here Source- Department of Census and Statistics
10
STATISTICAL POCKET BOOK 2021
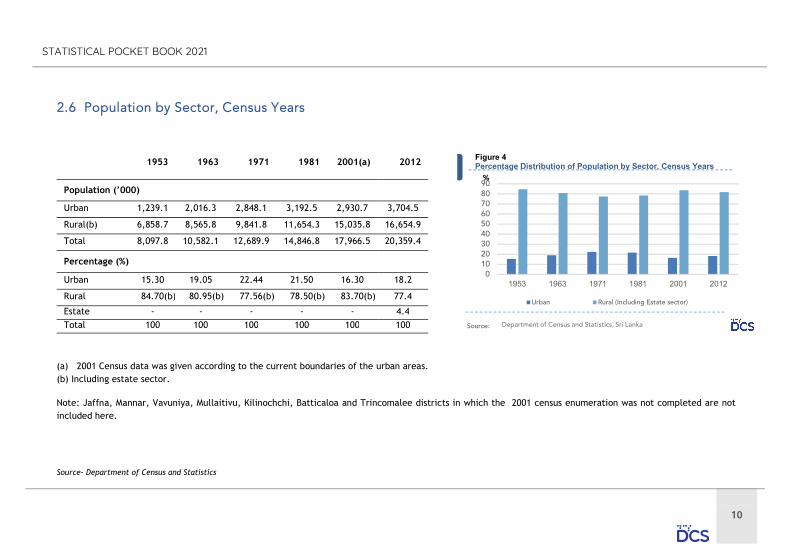
1953 1963 1971 1981 2001(a) 2012
Population (’000)
Urban 1,239.1 2,016.3 2,848.1 3,192.5 2,930.7 3,704.5
Rural(b) 6,858.7 8,565.8 9,841.8 11,654.3 15,035.8 16,654.9
Total 8,097.8 10,582.1 12,689.9 14,846.8 17,966.5 20,359.4
Percentage (%)
Urban 15.30 19.05 22.44 21.50 16.30 18.2
Rural 84.70(b) 80.95(b) 77.56(b) 78.50(b) 83.70(b) 77.4
Estate - - - - - 4.4
Total 100 100 100 100 100 100
(a) 2001 Census data was given according to the current boundaries of the urban areas.(b) Including estate sector. Note: Jaffna, Mannar, Vavuniya, Mullaitivu, Kilinochchi, Batticaloa and Trincomalee districts in which the 2001 census enumeration was not completed are not included here. Source- Department of Census and Statistics
1953 1963 1971 1981 2001 2012
%
Figure 4Percentage Distribution of Population by Sector, Census Years
11
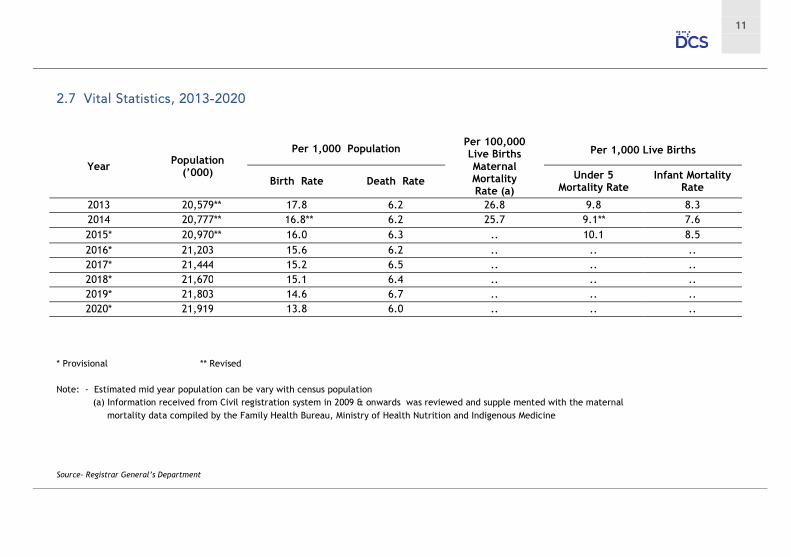
Year Population
(’000)
Per 1,000 Population Per 100,000 Live Births Maternal Mortality Rate (a)
Per 1,000 Live Births
Birth Rate Death Rate Under 5 Mortality Rate
Infant Mortality Rate
2013 20,579** 17.8 6.2 26.8 9.8 8.3 2014 20,777** 16.8** 6.2 25.7 9.1** 7.6 2015* 20,970** 16.0 6.3 .. 10.1 8.5 2016* 21,203 15.6 6.2 .. .. .. 2017* 21,444 15.2 6.5 .. .. .. 2018* 21,670 15.1 6.4 .. .. .. 2019* 21,803 14.6 6.7 .. .. .. 2020* 21,919 13.8 6.0 .. .. ..
* Provisional ** Revised Note: - Estimated mid year population can be vary with census population (a) Information received from Civil registration system in 2009 & onwards was reviewed and supple mented with the maternal mortality data compiled by the Family Health Bureau, Ministry of Health Nutrition and Indigenous Medicine
Source- Registrar General’s Department

12
STATISTICAL POCKET BOOK 2021
[ Percentage of children under 5 years classified as malnourished according to three anthropometric indices of nutritional status] (% of children)
Year Under weight (Weight - for - age)
Wasted (Weight - for- height)
Stunted (Height - for - age)
1993 37.7 15.5 23.8
2000 29.4 14.0 13.5
2006/07(a) 26.9 14.1 12.9
2016 (b) 20.5 15.1 17.3
Note: (a) Each of the indices is expressed in standard diviation units (SD) from the median of the NCHS/WHO/CDC child growth standards (b) Each of the indices is expressed in standard deviation units(SD) from the median of the WHO child Growth standards adopted in 2006. These indices are not comparable to those based on the previously used NCHS/CDC/WHO reference.
Source- Demographic & Health Survey 1993, 2000, 2006/07and 2016 Department of Census and Statistic
13
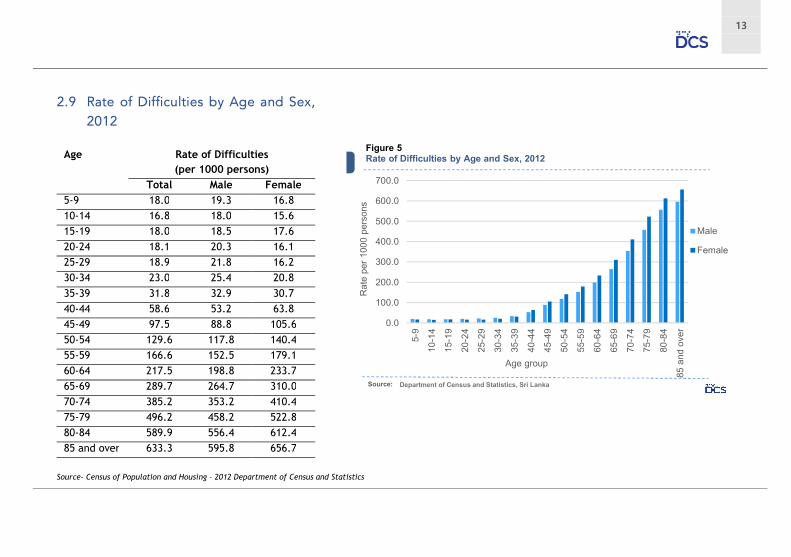
Age
Rate of Difficulties (per 1000 persons)
Total Male Female 5-9 18.0 19.3 16.8 10-14 16.8 18.0 15.6 15-19 18.0 18.5 17.6 20-24 18.1 20.3 16.1 25-29 18.9 21.8 16.2 30-34 23.0 25.4 20.8
35-39 31.8 32.9 30.7 40-44 58.6 53.2 63.8 45-49 97.5 88.8 105.6 50-54 129.6 117.8 140.4 55-59 166.6 152.5 179.1 60-64 217.5 198.8 233.7 65-69 289.7 264.7 310.0 70-74 385.2 353.2 410.4 75-79 496.2 458.2 522.8 80-84 589.9 556.4 612.4 85 and over 633.3 595.8 656.7
Source- Census of Population and Housing – 2012 Department of Census and Statistics
0.0
100.0
200.0
300.0
400.0
500.0
600.0
700.0
5-9
10-1
4
15-1
9
20-2
4
25-2
9
30-3
4
35-3
9
40-4
4
45-4
9
50-5
4
55-5
9
60-6
4
65-6
9
70-7
4
75-7
9
80-8
4
85 a
nd o
ver
Ra
te p
er 1
000
pers
ons
Age group
Male
Female
Figure 5Rate of Difficulties by Age and Sex, 2012
Source: Department of Census and Statistics, Sri Lanka
14
STATISTICAL POCKET BOOK 2021
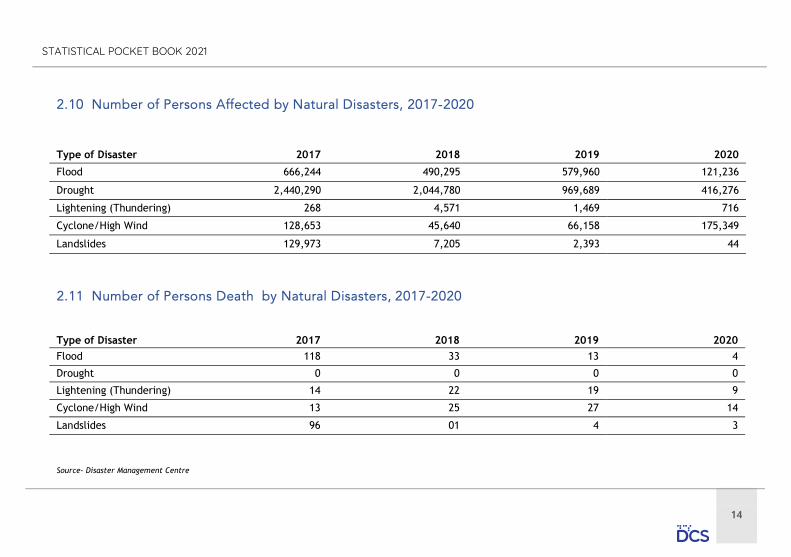
Type of Disaster 2017 2018 2019 2020
Flood 666,244 490,295 579,960 121,236
Drought 2,440,290 2,044,780 969,689 416,276
Lightening (Thundering) 268 4,571 1,469 716
Cyclone/High Wind 128,653 45,640 66,158 175,349
Landslides 129,973 7,205 2,393 44
Type of Disaster 2017 2018 2019 2020
Flood 118 33 13 4
Drought 0 0 0 0
Lightening (Thundering) 14 22 19 9
Cyclone/High Wind 13 25 27 14
Landslides 96 01 4 3
Source- Disaster Management Centre

15
3. EMPLOYMENT
Year
Household Population
’000 Persons (15 years and
over)
Total Labour Force
(’000 Persons)
Labour Force Participation
Rate (%)
Labour Force (’000 Persons)
Not in Labour Force
(’000 Persons)
Unemployment Rate
% No. of
Employed No. of
Unemployed
2016 15,449 8,311 53.8 7,948 363 7,138 4.4
2017 15,844 8,567 54.1 8,208 359 7,277 4.2
2018 16,196 8,388 51.8 8,015 373 7,808 4.4
2019 16,424 8,592 52.3 8,181 411 7,832 4.8
2020 16,739 8,467 50.6 7,999 468 8,272 5.5
Note: Covered All Districts A reweighting of Labor Force Statistics was done by the DCS for the data from 2011 onward, the table consist with reweighted estimate. For more information on re-weighting; visit:- http://www.statistics.gov.lk/ sample survey/Re-weightingLFS.pdf Source- Sri Lanka Labor Force Survey, Department of Census and Statistics

16
STATISTICAL POCKET BOOK 2021
0.0
2.0
4.0
6.0
0
2,000
4,000
6,000
8,000
10,000
2016 2017 2018 2019 2020
Un
empl
oym
ent
rate
%)
Em
ploy
ed p
erso
ns (
000
')
Employed persons Unemployment rate
Figure 6Trends of Employment, 2016-2020
Department of Census and Statistics, Sri LankaSource:
17
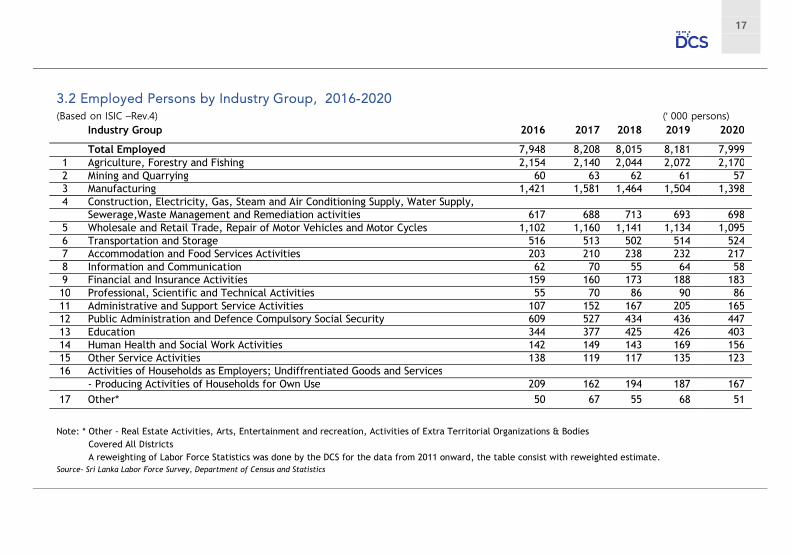
(Based on ISIC –Rev.4) (' 000 persons) Industry Group 2016 2017 2018 2019 2020
Total Employed 7,948 8,208 8,015 8,181 7,999 1 Agriculture, Forestry and Fishing 2,154 2,140 2,044 2,072 2,170 2 Mining and Quarrying 60 63 62 61 57 3 Manufacturing 1,421 1,581 1,464 1,504 1,398 4 Construction, Electricity, Gas, Steam and Air Conditioning Supply, Water Supply, Sewerage,Waste Management and Remediation activities 617 688 713 693 698 5 Wholesale and Retail Trade, Repair of Motor Vehicles and Motor Cycles 1,102 1,160 1,141 1,134 1,095 6 Transportation and Storage 516 513 502 514 524 7 Accommodation and Food Services Activities 203 210 238 232 217 8 Information and Communication 62 70 55 64 58 9 Financial and Insurance Activities 159 160 173 188 183 10 Professional, Scientific and Technical Activities 55 70 86 90 86 11 Administrative and Support Service Activities 107 152 167 205 165 12 Public Administration and Defence Compulsory Social Security 609 527 434 436 447 13 Education 344 377 425 426 403 14 Human Health and Social Work Activities 142 149 143 169 156 15 Other Service Activities 138 119 117 135 123 16 Activities of Households as Employers; Undiffrentiated Goods and Services - Producing Activities of Households for Own Use 209 162 194 187 167
17 Other* 50 67 55 68 51
Note: * Other - Real Estate Activities, Arts, Entertainment and recreation, Activities of Extra Territorial Organizations & Bodies Covered All Districts
A reweighting of Labor Force Statistics was done by the DCS for the data from 2011 onward, the table consist with reweighted estimate. Source- Sri Lanka Labor Force Survey, Department of Census and Statistics
18
STATISTICAL POCKET BOOK 2021
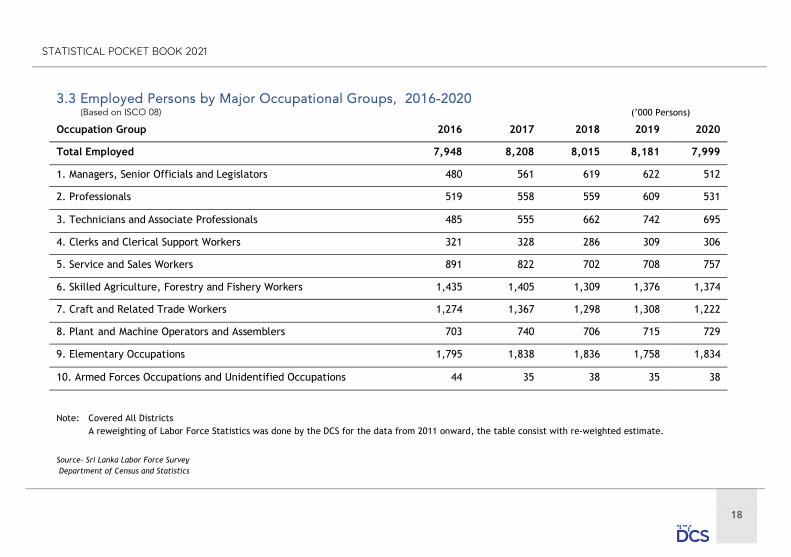
(’000 Persons)
Occupation Group 2016 2017 2018 2019 2020
Total Employed 7,948 8,208 8,015 8,181 7,999
1. Managers, Senior Officials and Legislators 480 561 619 622 512
2. Professionals 519 558 559 609 531
3. Technicians and Associate Professionals 485 555 662 742 695
4. Clerks and Clerical Support Workers 321 328 286 309 306
5. Service and Sales Workers 891 822 702 708 757
6. Skilled Agriculture, Forestry and Fishery Workers 1,435 1,405 1,309 1,376 1,374
7. Craft and Related Trade Workers 1,274 1,367 1,298 1,308 1,222
8. Plant and Machine Operators and Assemblers 703 740 706 715 729
9. Elementary Occupations 1,795 1,838 1,836 1,758 1,834
10. Armed Forces Occupations and Unidentified Occupations 44 35 38 35 38
Note: Covered All Districts A reweighting of Labor Force Statistics was done by the DCS for the data from 2011 onward, the table consist with re-weighted estimate.
Source- Sri Lanka Labor Force Survey Department of Census and Statistics

19
Total Formal Sector Informal Sector
No % No % No %
Total 7,999,093 100 3,352,613 41.9 4,646,480 58.1
Agricultural Employment 2,169,679 100 239,095 11.0 1,930,584 89.0
Non - Agricultural Employment 5,829,414 100 3,113,518 53.4 2,715,896 46.6
Note:Household population aged 15 years and above and data covers all districts
Total Formal Sector Informal Sector
No % No % No %
Total 7,999,093 100.0 3,352,613 41.9 4,646,480 58.1
Male 5,372,947 100 2,037,376 37.9 3,335,571 62.1
Female 2,626,146 100 1,315,237 50.1 1,310,909 49.9
Note:Household population aged 15 years and above and data covers all districts Source- Sri Lanka Labor Force Survey Department of Census and Statistics
20
STATISTICAL POCKET BOOK 2021
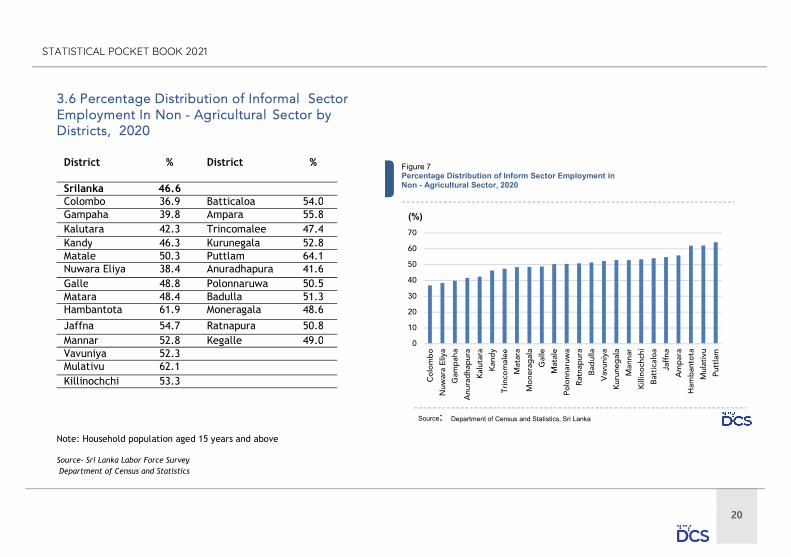
District % District %
Srilanka 46.6 Colombo 36.9 Batticaloa 54.0 Gampaha 39.8 Ampara 55.8 Kalutara 42.3 Trincomalee 47.4 Kandy 46.3 Kurunegala 52.8 Matale 50.3 Puttlam 64.1 Nuwara Eliya 38.4 Anuradhapura 41.6 Galle 48.8 Polonnaruwa 50.5 Matara 48.4 Badulla 51.3 Hambantota 61.9 Moneragala 48.6
Jaffna 54.7 Ratnapura 50.8 Mannar 52.8 Kegalle 49.0 Vavuniya 52.3 Mulativu 62.1 Killinochchi 53.3
Note: Household population aged 15 years and above Source- Sri Lanka Labor Force Survey Department of Census and Statistics
(%)
Figure 7Percentage Distribution of Inform Sector Employment in Non - Agricultural Sector, 2020
Source Department of Census and Statistics, Sri Lanka

21
2017 2018 2019 2020
Total Male Female Total Male Female Total Male Female Total Male Female
Sri Lanka 4.2 2.9 6.5 4.4 3.0 7.1 4.8 3.3 7.4 5.5 4.0 8.5
Western 3.2 2.8 4.0 3.1 2.4 4.5 4.0 3.2 5.6 5.5 4.4 7.6
Central 4.5 3.0 6.6 5.4 3.9 7.9 6,0 4.3 8.7 6.4 5.6 7.8
Southern 5.0 3.9 6.8 5.7 3.9 9.1 6.7 4.9 9.9 7.7 5.9 11.4
North Western 3.7 2.2 6.1 3.6 1.7 7.0 4.1 2.6 6.6 5.2 3.3 10.7
North Central 4.3 2.3 7.5 4.5 2.8 7.4 3.3 2.1 5.3 4.8 2.4 11.8
Uva 3.5 1.7 6.1 5.2 3.4 8.3 4.0 2.8 6.0 4.3 2.4 7.6
Sabaragamuwa 3.7 2.4 5.7 4.3 3.4 5.8 4.4 3.1 6.6 4.1 2.1 7.7 Eastern 6.0 3.3 13.0 6.0 4.0 11.8 6.4 3.1 15.8 4.7 3.3 7.6
Northern 7.7 4.1 15.5 5.6 2.7 13.0 5.0 3.0 10.3 5.4 3.9 8.0
These figures are to be treated with caution as the corresponding CV (Coefficient of variation) values are high. Note: Household population aged 15 years and above and data covers all districts A re-weighting of Labor Force Statistics was done by the DCS for the data from 2011 onward, the table consist with re-weighted estimate.
Source- Sri Lanka Labor Force Survey Department of Census and Statistics

22
STATISTICAL POCKET BOOK 2021
Employed Unemployed
Below Grade 6
Grade 6-10 G.C.E. (O/L)
NCGE
G.C.E. (A/L) HNCE
& Above
Below Grade 6
Grade 6-10 G.C.E. (O/L)
NCGE
G.C.E. (A/L) HNCE
& Above
T M F T M F T M F T M F T M F T M F T M F T M F
2017 15.8 15.7 16.1 46.1 49.8 39.4 17.3 17.6 16.8 20.8 16.9 27.7 3.1 2.0 3.9 30.3 37.5 24.8 24.7 30.0 20.7 41.9 30.5 50.7
2018 14.9 14.7 15.2 45.9 49.7 38.4 18.1 18.8 16.5 21.2 16.7 29.9 2.2 3.1 1.5 30.5 43.1 20.6 21.4 25.0 18.7 45.8 28.9 59.2
2019 14.0 14.1 13.8 45.8 49.6 38.4 17.4 18.0 16.3 22.8 18.2 31.6 2.9 2.9 2.9 31.4 42.2 22.5 23.9 27.0 21.4 41.9 28.0 53.3
2020 13.7 13.8 13.4 46.0 49.8 38.1 17.8 18.3 16.8 22.5 18.1 31.7 2.2 2.3 2.2 32.6 41.5 24.2 23.5 27.7 19.7 41.7 28.5 53.9
These figures are to be treated with caution as the corresponding CV (Coefficient of variation) values are high. Note: Household population aged 15 years and above and data covers all districts Are-weighting of Labor Force Statistics was done by the DCS for the data from 2011 onward, the table consist with re-weighted estimate. T= Total M=Male F= Female
Source- Sri Lanka Labor Force Survey Department of Census and Statistics
23
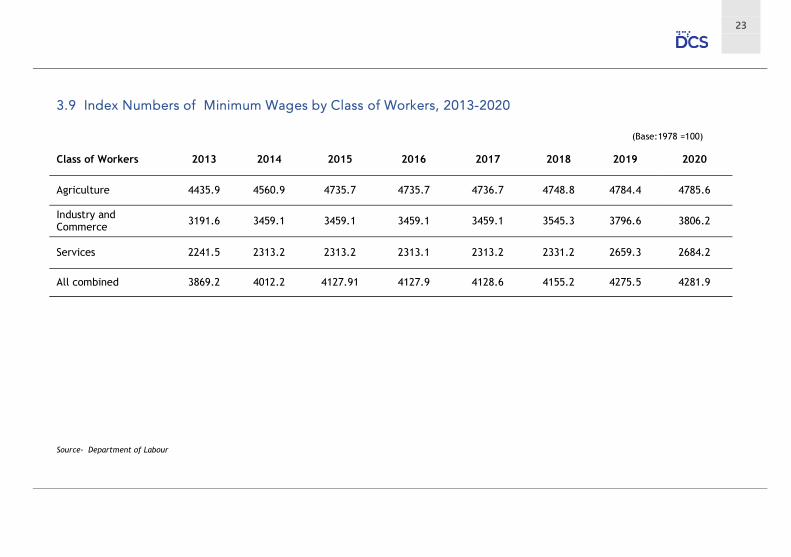
(Base:1978 =100)
Class of Workers 2013 2014 2015 2016 2017 2018 2019 2020
Agriculture 4435.9 4560.9 4735.7 4735.7 4736.7 4748.8 4784.4 4785.6
Industry and Commerce 3191.6 3459.1 3459.1 3459.1 3459.1 3545.3 3796.6 3806.2
Services 2241.5 2313.2 2313.2 2313.1 2313.2 2331.2 2659.3 2684.2
All combined 3869.2 4012.2 4127.91 4127.9 4128.6 4155.2 4275.5 4281.9
Source- Department of Labour

24
STATISTICAL POCKET BOOK 2021
Year
Professional Level
Middle
Level Clerical and
Related Skilled Semi Skilled Unskilled Housemaid Total
M F M F M F M F M F M F
2012 4,035 413 8,731 549 15,017 1,167 59,915 7,235 3,019 448 53,418 9,489 119,011 282,447 2013 4,647 504 15,963 547 25,070 1,491 65,460 8,247 2,968 444 61,077 9,900 96,900 293,218 2014 4,956 416 20,048 730 27,603 1,664 66,476 6,686 3,394 583 67,740 11,779 88,628 300,703 2015 5,828 423 6,269 682 11,050 1,451 77,030 4,652 4,394 453 68,217 9,768 73,226 263,443 2016 6,049 529 7,376 858 9,283 1,579 72,548 3,997 3,519 407 61,531 10,125 65,015 242,816 2017 5,937 442 6,264 863 7,670 1,601 65,068 3,912 2,957 340 51,372 9,682 55,884 211,992 2018 6,689 521 6,820 928 8,467 1,554 62,390 4,663 2,479 291 42,929 8,790 64,938 211,459 2019 8,989 872 4,788 937 7,543 1,620 57,532 5,179 2,672 278 40,733 10,455 61,489 203,087 2020* 2,714 240 1,318 180 2,097 396 14,880 1,853 665 84 10,915 3,146 15,387 53,875
* Provisional M=Male F= Female
Source- Sri Lanka Bureau of Foreign Employment
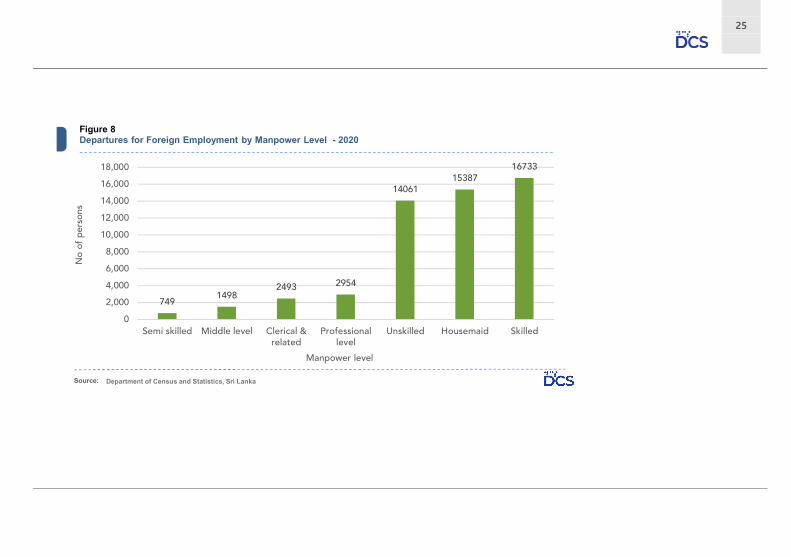
25
Figure 8Departures for Foreign Employment by Manpower Level - 2020
Source: Department of Census and Statistics, Sri Lanka

26
STATISTICAL POCKET BOOK 2021
Year Sector Male Female Total
No % No % No %
2002 State 209,187 25.0 86,547 10.4 295,734 35.4
Provincial Public 126,139 15.1 165,932 19.9 292,071 35.0
Semi Government 189,020 22.6 58,825 7.0 247,845 29.7
All 524,346 62.7 311,304 37.3 835,650 100.0
2006 State 227,763 27.3 106,514 12.7 334,277 40.0
Provincial Public 117,909 14.1 174,806 20.9 292,715 35.0
Semi Government 155,490 18.6 53,316 6.4 208,806 25.0
All 501,162 60.0 334,636 40.0 835,798 100.0
2016 State 294,299 26.5 191,172 17.2 485,471 43.8
Provincial Public 143,979 13.0 236,219 21.3 380,198 34.3
Semi Government 173,170 15.6 70,636 6.4 243,806 22.0
All 611,448 55.1 498,027 44.9 1,109,475 100.0
Source- Census of Public and Government Sector Employment 2002,2006 and 2016 Department of Census and Statistics
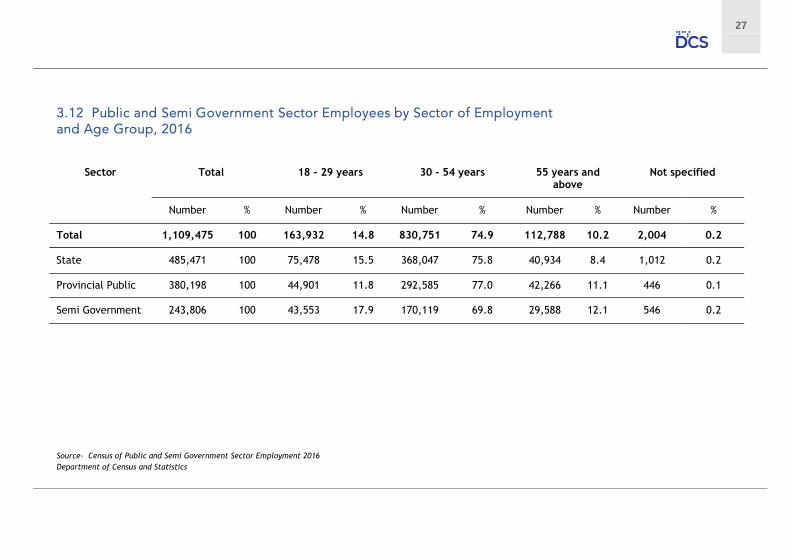
27
Sector
Total 18 - 29 years 30 - 54 years 55 years and above
Not specified
Number % Number % Number % Number % Number %
Total 1,109,475 100 163,932 14.8 830,751 74.9 112,788 10.2 2,004 0.2
State 485,471 100 75,478 15.5 368,047 75.8 40,934 8.4 1,012 0.2
Provincial Public 380,198 100 44,901 11.8 292,585 77.0 42,266 11.1 446 0.1
Semi Government 243,806 100 43,553 17.9 170,119 69.8 29,588 12.1 546 0.2
Source- Census of Public and Semi Government Sector Employment 2016 Department of Census and Statistics

28
STATISTICAL POCKET BOOK 2021
Sector Total Below G.C.E.(O.L.)
Passed G.C.E.(O.L.)
Passed G.C.E.(A.L.)
Degree Above Degree Not specified
Number % Number % Number % Number % Number % Number % Number %
Total 1,109,475 100 190,498 17.2 223,041 20.1 388,787 35.0 195,438 17.6 94,940 8.6 16,771 1.5
State 485,471 100 90,743 18.7 119,475 24.6 157,446 32.4 80,616 16.6 29,459 6.1 7,732 1.6
Provincial Public
380,198 100 41,969 11.0 45,032 11.0 150,202 39.5 89,487 23.5 49,868 13.1 3,640 1.0
Semi Government
243,806 100 57,786 24.0 58,534 23.7 81,139 33.3 25,335 10.4 15,613 6.4 5,399 2.2
Source- Census of Public and Semi Government Sector Employment 2016 Department of Census and Statistics

29
Sector Total Employees
Computer Literate Using Internet
Number % Number %
Total 1,109,475 741,460 66.8 624,693 56.3
State 485,471 309,390 63.7 262,833 54.1
Provincial Public 380,198 272,124 71.6 218,218 57.4
Semi Government 243,806 159,946 65.6 143,642 58.9
Source- Census of Public and Semi Government Sector Employment 2016 Department of Census and Statistics
30
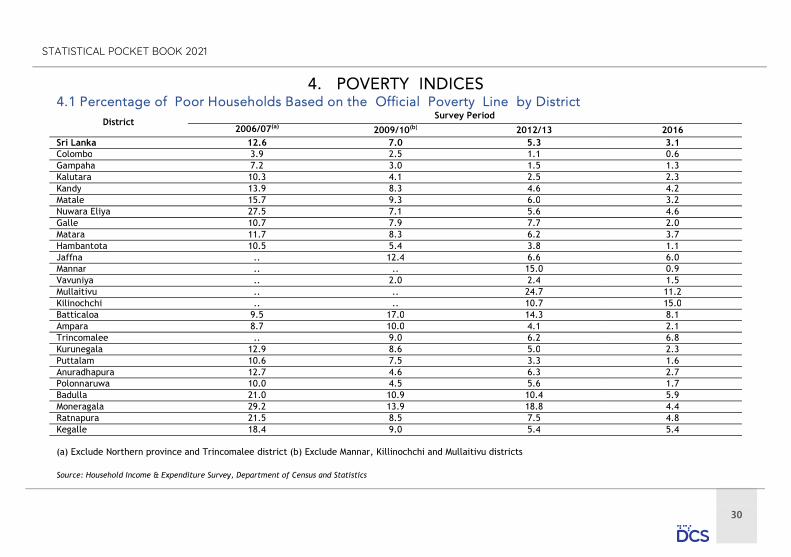
STATISTICAL POCKET BOOK 2021
District Survey Period
2006/07(a) 2009/10(b) 2012/13 2016 Sri Lanka 12.6 7.0 5.3 3.1 Colombo 3.9 2.5 1.1 0.6 Gampaha 7.2 3.0 1.5 1.3 Kalutara 10.3 4.1 2.5 2.3 Kandy 13.9 8.3 4.6 4.2 Matale 15.7 9.3 6.0 3.2 Nuwara Eliya 27.5 7.1 5.6 4.6 Galle 10.7 7.9 7.7 2.0 Matara 11.7 8.3 6.2 3.7 Hambantota 10.5 5.4 3.8 1.1 Jaffna .. 12.4 6.6 6.0 Mannar .. .. 15.0 0.9 Vavuniya .. 2.0 2.4 1.5 Mullaitivu .. .. 24.7 11.2 Kilinochchi .. .. 10.7 15.0 Batticaloa 9.5 17.0 14.3 8.1 Ampara 8.7 10.0 4.1 2.1 Trincomalee .. 9.0 6.2 6.8 Kurunegala 12.9 8.6 5.0 2.3 Puttalam 10.6 7.5 3.3 1.6 Anuradhapura 12.7 4.6 6.3 2.7 Polonnaruwa 10.0 4.5 5.6 1.7 Badulla 21.0 10.9 10.4 5.9 Moneragala 29.2 13.9 18.8 4.4 Ratnapura 21.5 8.5 7.5 4.8 Kegalle 18.4 9.0 5.4 5.4 (a) Exclude Northern province and Trincomalee district (b) Exclude Mannar, Killinochchi and Mullaitivu districts Source: Household Income & Expenditure Survey, Department of Census and Statistics
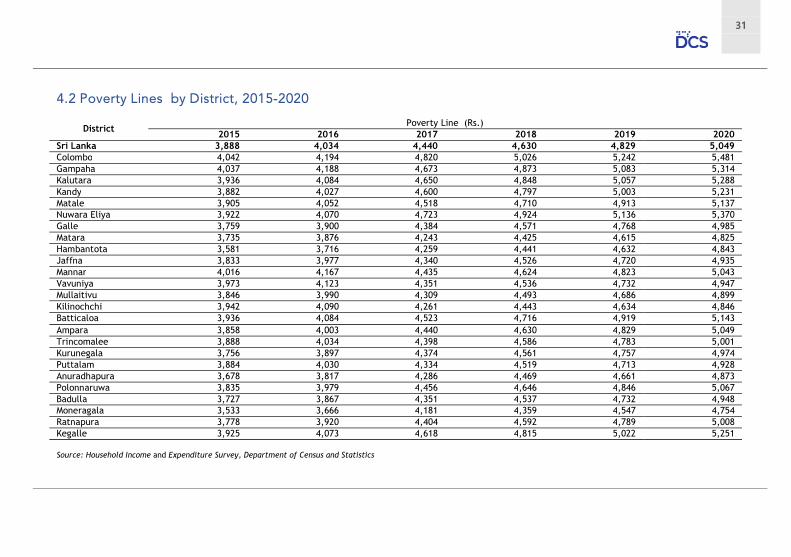
31
District Poverty Line (Rs.)
2015 2016 2017 2018 2019 2020 Sri Lanka 3,888 4,034 4,440 4,630 4,829 5,049 Colombo 4,042 4,194 4,820 5,026 5,242 5,481 Gampaha 4,037 4,188 4,673 4,873 5,083 5,314 Kalutara 3,936 4,084 4,650 4,848 5,057 5,288 Kandy 3,882 4,027 4,600 4,797 5,003 5,231 Matale 3,905 4,052 4,518 4,710 4,913 5,137 Nuwara Eliya 3,922 4,070 4,723 4,924 5,136 5,370 Galle 3,759 3,900 4,384 4,571 4,768 4,985 Matara 3,735 3,876 4,243 4,425 4,615 4,825 Hambantota 3,581 3,716 4,259 4,441 4,632 4,843 Jaffna 3,833 3,977 4,340 4,526 4,720 4,935 Mannar 4,016 4,167 4,435 4,624 4,823 5,043 Vavuniya 3,973 4,123 4,351 4,536 4,732 4,947 Mullaitivu 3,846 3,990 4,309 4,493 4,686 4,899 Kilinochchi 3,942 4,090 4,261 4,443 4,634 4,846 Batticaloa 3,936 4,084 4,523 4,716 4,919 5,143 Ampara 3,858 4,003 4,440 4,630 4,829 5,049 Trincomalee 3,888 4,034 4,398 4,586 4,783 5,001 Kurunegala 3,756 3,897 4,374 4,561 4,757 4,974 Puttalam 3,884 4,030 4,334 4,519 4,713 4,928 Anuradhapura 3,678 3,817 4,286 4,469 4,661 4,873 Polonnaruwa 3,835 3,979 4,456 4,646 4,846 5,067 Badulla 3,727 3,867 4,351 4,537 4,732 4,948 Moneragala 3,533 3,666 4,181 4,359 4,547 4,754 Ratnapura 3,778 3,920 4,404 4,592 4,789 5,008 Kegalle 3,925 4,073 4,618 4,815 5,022 5,251 Source: Household Income and Expenditure Survey, Department of Census and Statistics

32
STATISTICAL POCKET BOOK 2021
Sector Poverty Headcount Index Percentage of Poor Households
2006/07(a) 2009/10(b) 2012/13 2016 2006/07(a) 2009/10(b) 2012/13 2016
All Island 15.2 8.9 6.7 4.1 12.6 7.0 5.3 3.1
Urban 6.7 5.3 2.1 1.9 5.0 3.8 1.5 1.3
Rural 15.7 9.4 7.6 4.3 13.1 7.5 6.0 3.3
Estate 32.0 11.4 10.9 8.8 25.8 8.9 8.8 6.8
(a) Exclude Northern province and Trincomalee district (b) Exclude Mannar, Killinochchi and Mullaitivu districts
Sector
Average Monthly Household Income (Rs.)
Gini Coefficient for Household Income
2006/07(a) 2009/10(b) 2012/13 2016 2006/07(a) 2009/10(b) 2012/13 2016
All Island 26,286 36,451 45,878 62,237 0.49 0.49 0.48 0.45
Urban 41,928 47,783 69,880 88,692 0.54 0.48 0.51 0.48
Rural 24,039 35,228 41,478 58,137 0.46 0.49 0.45 0.44
Estate 19,292 24,162 30,220 34,804 0.57 0.43 0.39 0.36
(a) Exclude Northern province and Trincomalee district (b) Exclude Mannar, Killinochchi and Mullaitivu districts Source: Household Income & Expenditure Survey, Department of Census and Statistics

33
%
Sector Poverty Gap Index Squared Poverty Gap Index
2009 /10(a)
2012 /13
2016 2009 /10(a)
2012 /13
2016
All Island
1.7 1.2 0.6 0.5 0.3 0.1
Urban 1.3 0.3 0.3 0.4 0.1 0.1
Rural 1.8 1.4 0.6 0.5 0.4 0.2
Estate 2.1 1.6 1.2 0.6 0.4 0.3
(a) Exclude Mannar, Killinochchi and Mullaitivu districts
Source: Household Income and Expenditure Survey, Department of Census and Statistics
0
20,000
40,000
60,000
80,000
100,000
2006/07 2009/10 2012/13 2016
Rs
Urban Rural Estate
Figure 9Average Monthly Household Income by Sector
Source: Department of Census and Statistics, Sri Lanka
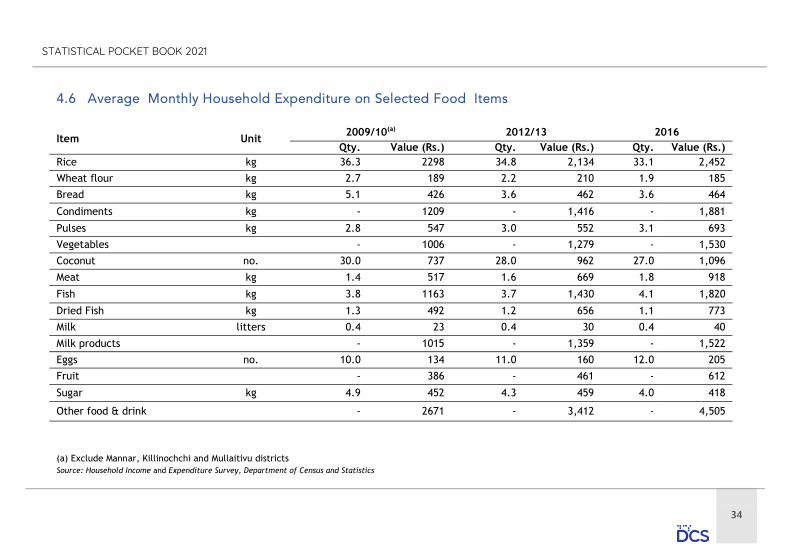
34
STATISTICAL POCKET BOOK 2021
Item Unit 2009/10(a) 2012/13 2016
Qty. Value (Rs.) Qty. Value (Rs.) Qty. Value (Rs.) Rice kg 36.3 2298 34.8 2,134 33.1 2,452
Wheat flour kg 2.7 189 2.2 210 1.9 185
Bread kg 5.1 426 3.6 462 3.6 464
Condiments kg - 1209 - 1,416 - 1,881
Pulses kg 2.8 547 3.0 552 3.1 693
Vegetables - 1006 - 1,279 - 1,530
Coconut no. 30.0 737 28.0 962 27.0 1,096
Meat kg 1.4 517 1.6 669 1.8 918
Fish kg 3.8 1163 3.7 1,430 4.1 1,820
Dried Fish kg 1.3 492 1.2 656 1.1 773
Milk litters 0.4 23 0.4 30 0.4 40
Milk products - 1015 - 1,359 - 1,522
Eggs no. 10.0 134 11.0 160 12.0 205
Fruit - 386 - 461 - 612
Sugar kg 4.9 452 4.3 459 4.0 418
Other food & drink - 2671 - 3,412 - 4,505
(a) Exclude Mannar, Killinochchi and Mullaitivu districts Source: Household Income and Expenditure Survey, Department of Census and Statistics
35
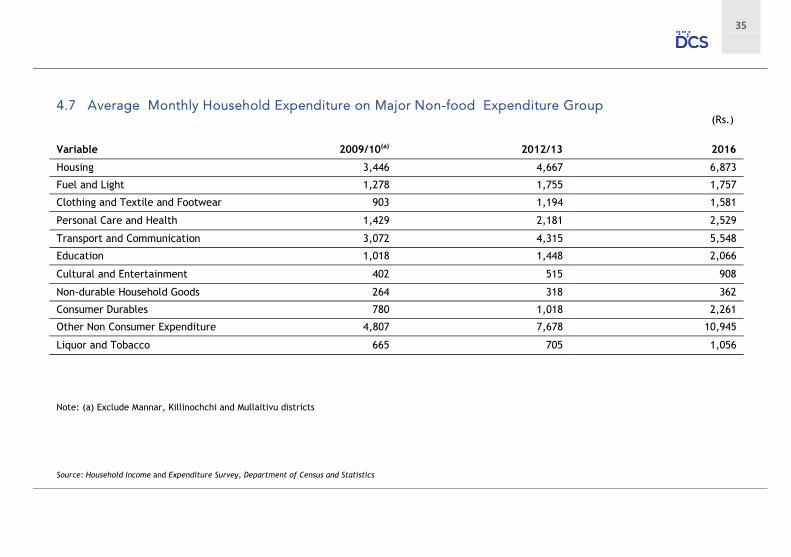
(Rs.)
Variable 2009/10(a) 2012/13 2016
Housing 3,446 4,667 6,873
Fuel and Light 1,278 1,755 1,757
Clothing and Textile and Footwear 903 1,194 1,581
Personal Care and Health 1,429 2,181 2,529
Transport and Communication 3,072 4,315 5,548
Education 1,018 1,448 2,066
Cultural and Entertainment 402 515 908
Non-durable Household Goods 264 318 362
Consumer Durables 780 1,018 2,261
Other Non Consumer Expenditure 4,807 7,678 10,945
Liquor and Tobacco 665 705 1,056
Note: (a) Exclude Mannar, Killinochchi and Mullaitivu districts Source: Household Income and Expenditure Survey, Department of Census and Statistics
36
STATISTICAL POCKET BOOK 2021
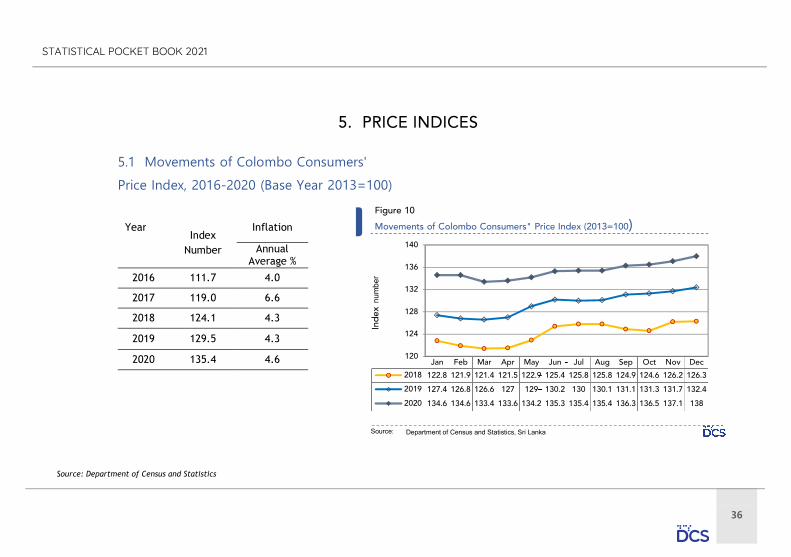
5.1 Movements of Colombo Consumers'
Price Index, 2016-2020 (Base Year 2013=100)
Year Index
Number
Inflation
Annual Average %
2016 111.7 4.0
2017 119.0 6.6
2018 124.1 4.3
2019 129.5 4.3
2020 135.4 4.6
Source: Department of Census and Statistics
Source Department of Census and Statistics, Sri Lanka
nu
mb
er
37
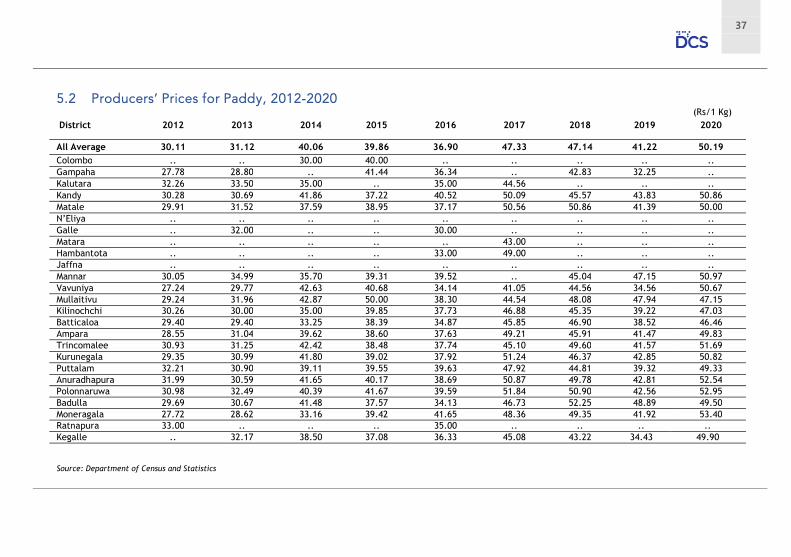
(Rs/1 Kg) District 2012 2013 2014 2015 2016 2017 2018 2019 2020
All Average 30.11 31.12 40.06 39.86 36.90 47.33 47.14 41.22 50.19 Colombo .. .. 30.00 40.00 .. .. .. .. .. Gampaha 27.78 28.80 .. 41.44 36.34 .. 42.83 32.25 .. Kalutara 32.26 33.50 35.00 .. 35.00 44.56 .. .. .. Kandy 30.28 30.69 41.86 37.22 40.52 50.09 45.57 43.83 50.86 Matale 29.91 31.52 37.59 38.95 37.17 50.56 50.86 41.39 50.00 N’Eliya .. .. .. .. .. .. .. .. .. Galle .. 32.00 .. .. 30.00 .. .. .. .. Matara .. .. .. .. .. 43.00 .. .. .. Hambantota .. .. .. .. 33.00 49.00 .. .. .. Jaffna .. .. .. .. .. .. .. .. .. Mannar 30.05 34.99 35.70 39.31 39.52 .. 45.04 47.15 50.97 Vavuniya 27.24 29.77 42.63 40.68 34.14 41.05 44.56 34.56 50.67 Mullaitivu 29.24 31.96 42.87 50.00 38.30 44.54 48.08 47.94 47.15 Kilinochchi 30.26 30.00 35.00 39.85 37.73 46.88 45.35 39.22 47.03 Batticaloa 29.40 29.40 33.25 38.39 34.87 45.85 46.90 38.52 46.46 Ampara 28.55 31.04 39.62 38.60 37.63 49.21 45.91 41.47 49.83 Trincomalee 30.93 31.25 42.42 38.48 37.74 45.10 49.60 41.57 51.69 Kurunegala 29.35 30.99 41.80 39.02 37.92 51.24 46.37 42.85 50.82 Puttalam 32.21 30.90 39.11 39.55 39.63 47.92 44.81 39.32 49.33 Anuradhapura 31.99 30.59 41.65 40.17 38.69 50.87 49.78 42.81 52.54 Polonnaruwa 30.98 32.49 40.39 41.67 39.59 51.84 50.90 42.56 52.95 Badulla 29.69 30.67 41.48 37.57 34.13 46.73 52.25 48.89 49.50 Moneragala 27.72 28.62 33.16 39.42 41.65 48.36 49.35 41.92 53.40 Ratnapura 33.00 .. .. .. 35.00 .. .. .. .. Kegalle .. 32.17 38.50 37.08 36.33 45.08 43.22 34.43 49.90
Source: Department of Census and Statistics
38
STATISTICAL POCKET BOOK 2021
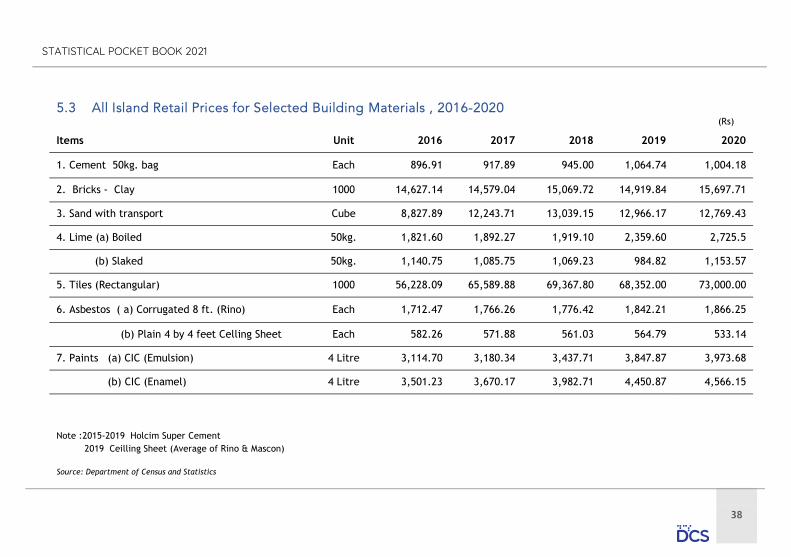
(Rs)
Items Unit 2016 2017 2018 2019 2020
1. Cement 50kg. bag Each 896.91 917.89 945.00 1,064.74 1,004.18
2. Bricks - Clay 1000 14,627.14 14,579.04 15,069.72 14,919.84 15,697.71
3. Sand with transport Cube 8,827.89 12,243.71 13,039.15 12,966.17 12,769.43
4. Lime (a) Boiled 50kg. 1,821.60 1,892.27 1,919.10 2,359.60 2,725.5
(b) Slaked 50kg. 1,140.75 1,085.75 1,069.23 984.82 1,153.57
5. Tiles (Rectangular) 1000 56,228.09 65,589.88 69,367.80 68,352.00 73,000.00
6. Asbestos ( a) Corrugated 8 ft. (Rino) Each 1,712.47 1,766.26 1,776.42 1,842.21 1,866.25
(b) Plain 4 by 4 feet Celling Sheet Each 582.26 571.88 561.03 564.79 533.14
7. Paints (a) CIC (Emulsion) 4 Litre 3,114.70 3,180.34 3,437.71 3,847.87 3,973.68
(b) CIC (Enamel) 4 Litre 3,501.23 3,670.17 3,982.71 4,450.87 4,566.15
Note :2015-2019 Holcim Super Cement 2019 Ceilling Sheet (Average of Rino & Mascon) Source: Department of Census and Statistics

39
Cultivated Year
Asweddumized Area(a) Hect.
Season Sown Area
Hect. Harvested Area
Hect. Production
'000MT Average Yield Kg/net Hect.
2011/12 789,428 Maha 702,075 684,636 2,717 4,444 2012 Yala 364,542 305,314 1,129 4,145 2012/13 845,844 Maha 779,635 741,591 2,846 4,408 2013 Yala 447,613 446,637 1,774 4,260 2013/14 877,858 Maha 651,289 579,875 2,236 4,222 2014 Yala 312,979 300,725 1,145 4,204 2014/15 885,110 Maha 772,626 734,967 2,877 4,364 2015 Yala 480,662 475,773 1,942 4,527 2015/16 886,202 Maha 756,005 742,724 2,903 4,349 2016 Yala 385,318 379,970 1,517 4,417 2016/17 892,945 Maha 542,556 382,856 1,474 4,301 2017 Yala 249,123 236,479 909 4,291 2017/18 857,611 Maha 667,191 619,928 2,399 4,302 2018 Yala 373,763 362,966 1,533 4,683 2018/19 865,827 Maha 748,027 724,120 3,073 4,747 2019 Yala 368,906 346,010 1,519 4,896 2019/20 869,111 Maha 752,248 739,911 3,197 4,531 2020 Yala 456,206 450,743 1,924 4,552
(a) Reason for Increase in the asweddumized extent is due to inclusion of new lands brought under paddy cultivation. Source: Department of Census and Statistics

40
STATISTICAL POCKET BOOK 2021
2011/122012
2012/132013
2013/142014
2014/152015
2015/162016
2016/172017
2017/182018
2018/192019
2019/202020
Pro
duct
ion
('000
MT)
Production Maha Production Yala
Figure 11Paddy Production by Seasons 2011 - 2020
41
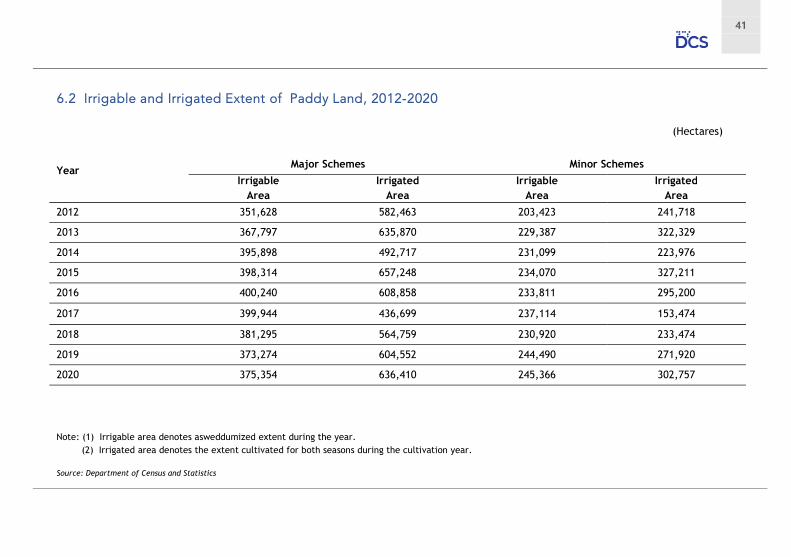
(Hectares)
Year
Major Schemes Minor Schemes
Irrigable Area
Irrigated Area
Irrigable Area
Irrigated Area
2012 351,628 582,463 203,423 241,718
2013 367,797 635,870 229,387 322,329
2014 395,898 492,717 231,099 223,976
2015 398,314 657,248 234,070 327,211
2016 400,240 608,858 233,811 295,200
2017 399,944 436,699 237,114 153,474
2018 381,295 564,759 230,920 233,474
2019 373,274 604,552 244,490 271,920
2020 375,354 636,410 245,366 302,757
Note: (1) Irrigable area denotes asweddumized extent during the year. (2) Irrigated area denotes the extent cultivated for both seasons during the cultivation year. Source: Department of Census and Statistics

42
STATISTICAL POCKET BOOK 2021
(Hectares) 2016 2017 2018 2019 2020 Paddy(a) 887,100 791,679 1,040,954 1,116,933 1,208,454 Tea 216,515(b) 202,540 (b) 202,540 200,296 264,688** Rubber 120,867(b) 136,632(b) 136,875 137,608 137,288* Coconut 440,457(b) 452,550 (b) 455,330 503,452 505,217* Kurakkan 6,151 4,205 6,770 4,192 4,570 Maize 67,629 52,544 70,895 63,450 78,249 Meneri 32 41 53 70 109 Sorghum 79 303 85 100 200 Green gram 11,301 7,371 8,615 6,156 10,889 Cowpea 8,220 6,807 9,499 7,196 11,518 Gingelly 14,044 9,065 11,872 6,035 11,654 Ground nuts 19,975 12,639 15,752 14,527 19,508 Manioc 22,753 22,087 22,361 20,592 20,689 Sweet potatoes 4,487 3,786 4,099 3,254 4,065 Potatoes 5,753 4,457 5,174 5,432 3,565 Chillies(green) 15,267 10,937 13,553 10,981 13,580 Mustard 141 123 235 81 73 Red onions 4,994 4,167 4,044 5,333 4,623 Big onions 3,983 3,026 1,448 924 2,305
* Provisional
** According to the tea land registration, conducted by the Sri Lanka Tea Board in 2018. (a) Asweddumized paddy area under major, minor and schemes (b) Census of Agriculture 2002 © Census of Agriculture 2013/14 Source : Department of Census and Statistics, Sri Lanka Tea Board, Department of Rubber Development, Ministry of Plantation.
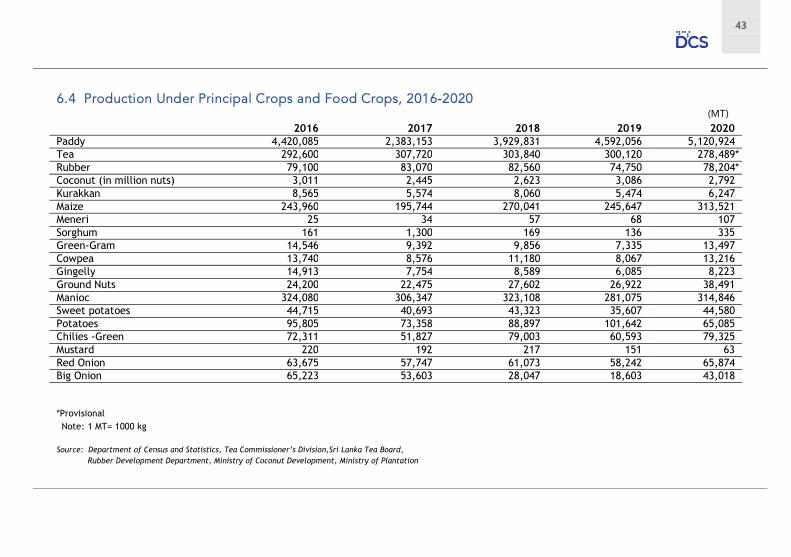
43
(MT) 2016 2017 2018 2019 2020
Paddy 4,420,085 2,383,153 3,929,831 4,592,056 5,120,924 Tea 292,600 307,720 303,840 300,120 278,489* Rubber 79,100 83,070 82,560 74,750 78,204* Coconut (in million nuts) 3,011 2,445 2,623 3,086 2,792 Kurakkan 8,565 5,574 8,060 5,474 6,247 Maize 243,960 195,744 270,041 245,647 313,521 Meneri 25 34 57 68 107 Sorghum 161 1,300 169 136 335 Green-Gram 14,546 9,392 9,856 7,335 13,497 Cowpea 13,740 8,576 11,180 8,067 13,216 Gingelly 14,913 7,754 8,589 6,085 8,223 Ground Nuts 24,200 22,475 27,602 26,922 38,491 Manioc 324,080 306,347 323,108 281,075 314,846 Sweet potatoes 44,715 40,693 43,323 35,607 44,580 Potatoes 95,805 73,358 88,897 101,642 65,085 Chilies -Green 72,311 51,827 79,003 60,593 79,325 Mustard 220 192 217 151 63 Red Onion 63,675 57,747 61,073 58,242 65,874 Big Onion 65,223 53,603 28,047 18,603 43,018 *Provisional Note: 1 MT= 1000 kg
Source: Department of Census and Statistics, Tea Commissioner’s Division,Sri Lanka Tea Board, Rubber Development Department, Ministry of Coconut Development, Ministry of Plantation
44
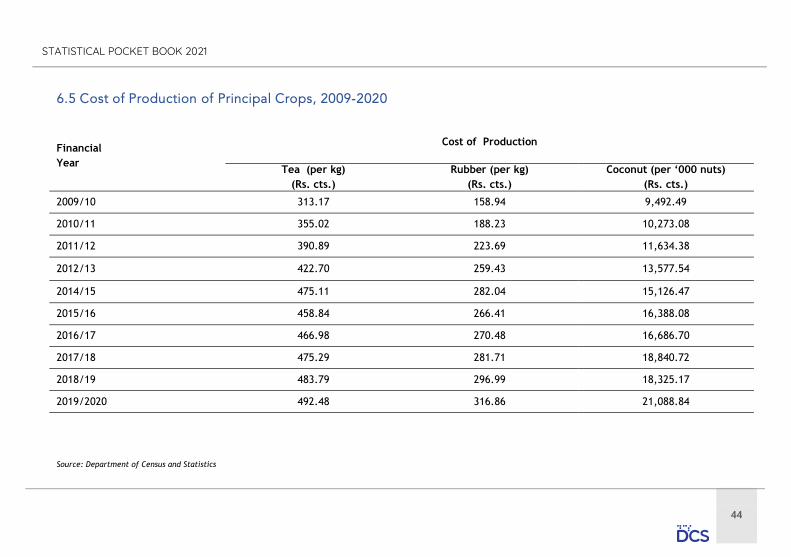
STATISTICAL POCKET BOOK 2021
Financial Year
Cost of Production
Tea (per kg) (Rs. cts.)
Rubber (per kg) (Rs. cts.)
Coconut (per ‘000 nuts) (Rs. cts.)
2009/10 313.17 158.94 9,492.49
2010/11 355.02 188.23 10,273.08
2011/12 390.89 223.69 11,634.38
2012/13 422.70 259.43 13,577.54
2014/15 475.11 282.04 15,126.47
2015/16 458.84 266.41 16,388.08
2016/17 466.98 270.48 16,686.70
2017/18 475.29 281.71 18,840.72
2018/19 483.79 296.99 18,325.17
2019/2020 492.48 316.86 21,088.84
Source: Department of Census and Statistics

45
Year Mid Year
Population ( ’000)
Paddy Rice
Production (MT ’000)
Total Supply (a) (MT ’000)
Available Supply
(Food net) (b) (MT’000)
Per Capita Availability
of Rice (kg./year)
2012 20,328 3,846 3,914 2,427 119
2013** 20,585 4,621 4,532 2,595 126
2014** 20,777 3,381 3,316 2,342 113
2015** 20,970 4,819 4,726 2,827 135
2016** 21,203 4,420 4,335 2,372 112
2017** 21,444 2,383 2,337 1,914 89
2018** 21,670 3,930 3,592 2,318 107
2019 21,803 4,592 4,236 2,514 115
2020* 21,919 5,121 4,723 2,792 127
*Provisional ** Revised (a) Local production + Imports – Exports + change in stocks (b Total supply – seed – waste – Animal feed - Manufacturing Source: Department of Census and Statistics
46
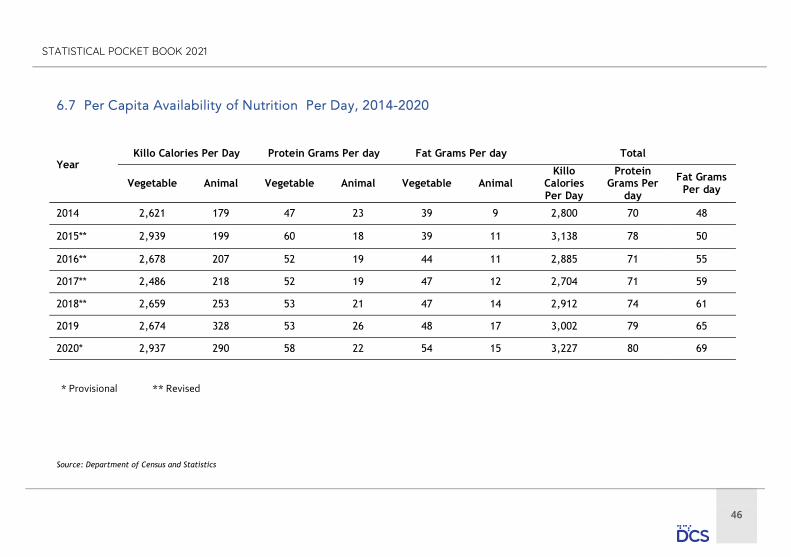
STATISTICAL POCKET BOOK 2021
Year
Killo Calories Per Day Protein Grams Per day Fat Grams Per day Total
Vegetable Animal Vegetable Animal Vegetable Animal Killo
Calories Per Day
Protein Grams Per
day
Fat Grams Per day
2014 2,621 179 47 23 39 9 2,800 70 48
2015** 2,939 199 60 18 39 11 3,138 78 50
2016** 2,678 207 52 19 44 11 2,885 71 55
2017** 2,486 218 52 19 47 12 2,704 71 59
2018** 2,659 253 53 21 47 14 2,912 74 61
2019 2,674 328 53 26 48 17 3,002 79 65
2020* 2,937 290 58 22 54 15 3,227 80 69
* Provisional ** Revised
Source: Department of Census and Statistics
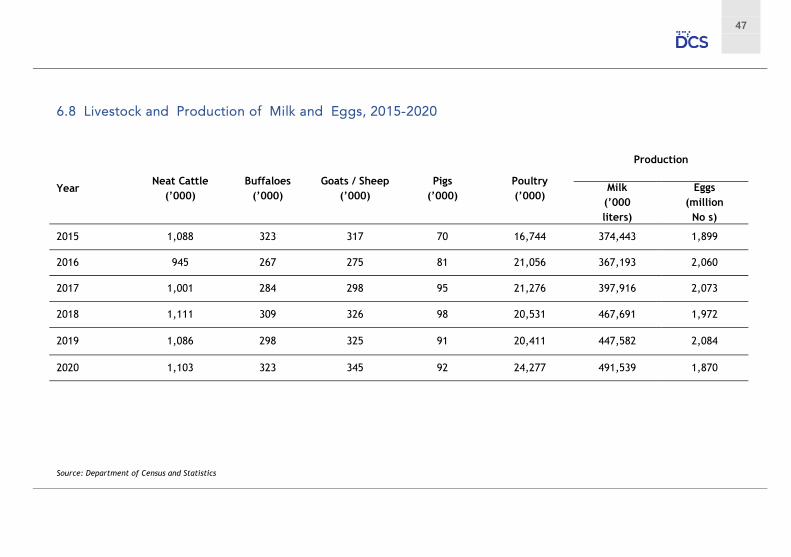
47
Year Neat Cattle
(’000) Buffaloes
(’000) Goats / Sheep
(’000) Pigs
(’000) Poultry (’000)
Production
Milk (’000 liters)
Eggs (million
No s)
2015 1,088 323 317 70 16,744 374,443 1,899
2016 945 267 275 81 21,056 367,193 2,060
2017 1,001 284 298 95 21,276 397,916 2,073
2018 1,111 309 326 98 20,531 467,691 1,972
2019 1,086 298 325 91 20,411 447,582 2,084
2020 1,103 323 345 92 24,277 491,539 1,870
Source: Department of Census and Statistics
48
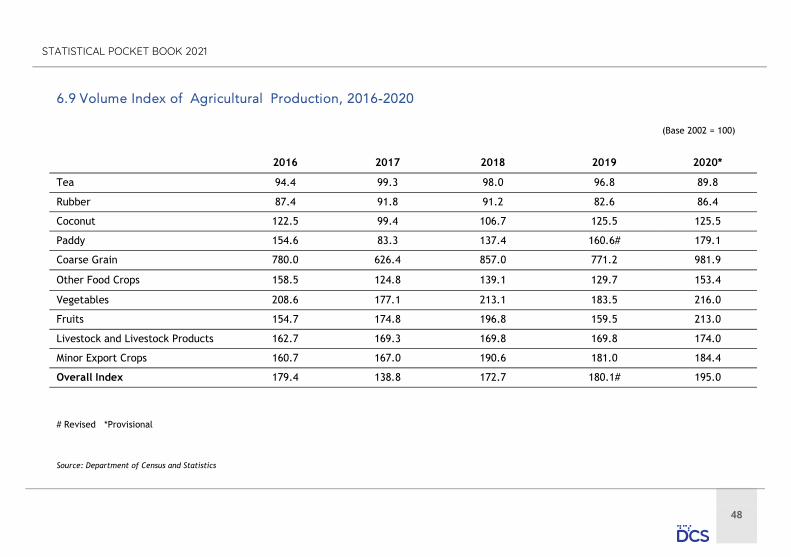
STATISTICAL POCKET BOOK 2021
(Base 2002 = 100)
2016 2017 2018 2019 2020*
Tea 94.4 99.3 98.0 96.8 89.8
Rubber 87.4 91.8 91.2 82.6 86.4
Coconut 122.5 99.4 106.7 125.5 125.5
Paddy 154.6 83.3 137.4 160.6# 179.1
Coarse Grain 780.0 626.4 857.0 771.2 981.9
Other Food Crops 158.5 124.8 139.1 129.7 153.4
Vegetables 208.6 177.1 213.1 183.5 216.0
Fruits 154.7 174.8 196.8 159.5 213.0
Livestock and Livestock Products 162.7 169.3 169.8 169.8 174.0
Minor Export Crops 160.7 167.0 190.6 181.0 184.4
Overall Index 179.4 138.8 172.7 180.1# 195.0
# Revised *Provisional
Source: Department of Census and Statistics
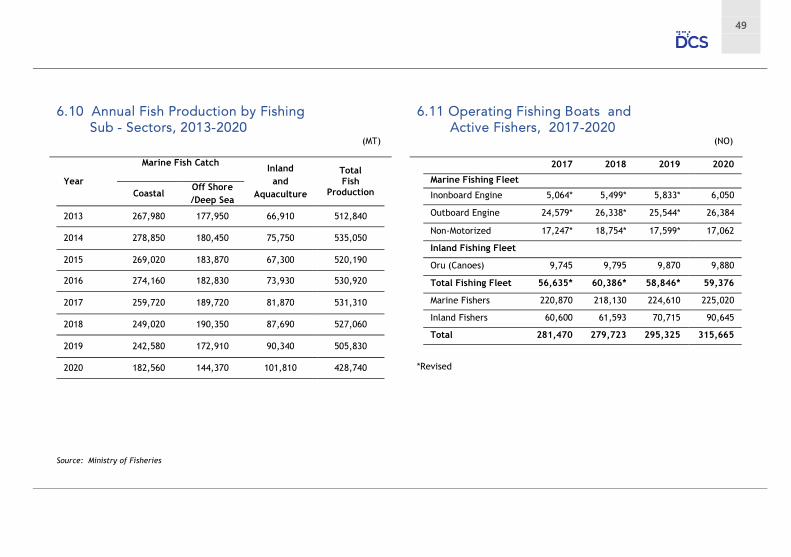
49
(MT) (NO)
Year
Marine Fish Catch
Inland and
Aquaculture
Total Fish
Production Coastal Off Shore /Deep Sea
2013 267,980 177,950 66,910 512,840
2014 278,850 180,450 75,750 535,050
2015 269,020 183,870 67,300 520,190
2016 274,160 182,830 73,930 530,920
2017 259,720 189,720 81,870 531,310
2018 249,020 190,350 87,690 527,060
2019 242,580 172,910 90,340 505,830
2020 182,560 144,370 101,810 428,740
*Revised
2017 2018 2019 2020
Marine Fishing Fleet
Inonboard Engine 5,064* 5,499* 5,833* 6,050
Outboard Engine 24,579* 26,338* 25,544* 26,384
Non-Motorized 17,247* 18,754* 17,599* 17,062
Inland Fishing Fleet
Oru (Canoes) 9,745 9,795 9,870 9,880
Total Fishing Fleet 56,635* 60,386* 58,846* 59,376
Marine Fishers 220,870 218,130 224,610 225,020
Inland Fishers 60,600 61,593 70,715 90,645
Total 281,470 279,723 295,325 315,665
Source: Ministry of Fisheries

50
STATISTICAL POCKET BOOK 2021
Item Unit 2016 2017 2018 2019 2020*
1. Electricity Units Generated (a) GWh 14,149 14,671 15,370** 15,918 15,713 CEB ” 10,827 10,693 11,800** 11,282 11,138 Hydro ” 3,481 3,059 5,149 3,784 3,911 Thermal - oil ” 2,297 2,529 1,886 2,137 1,465 Thermal - Coal ” 5,047 5,103 4,764 5,361 5,754 Wind ” 2 2 1 0 8 Private ” 3,322 3,978 3,570** 4,636 4,575 Mini Hydro ” 739 945 1,232** 1,011 1,047 Thermal ” 2,164 2,516 1,740 2,875 2,717 ORE (b) ” 419 517 598** 750 811 Total Sales ” 12,785 13,430 14,091 14,611 14,288 Domestic & Religious ” 4,272 4,463 4,641 4,863 5,172 Industrial ” 3,864 4,041 4,290 4,392 4,163 Commercial ” 2,987 3,222 3,412 3,563 3,239 LECO ” 1,553 1,595 1,640 1,684 1,605 Street Lighting ” 109 108 108 109 109 2. Petroleum Product Refined Products(Imported) MT 1,450 2,968 2,944 3,049 1612 Crude Oil(Processed) ” 1,685 1,499 1,763 1,843 1715 3. L.P. Gas Production MT 8,837 19,416 22,084 26,988 25,251
* Provisional ** Revised ORE - Other Renewable Energy (Wind, Biomass, Solar, Dendro and municipal waste etc. Note: (a) - Net Generation considered (b) Rooftop solor generation were considered for total generation since 2018 Source: Ceylon Petroleum Corporation, Ceylon Electricity Board.
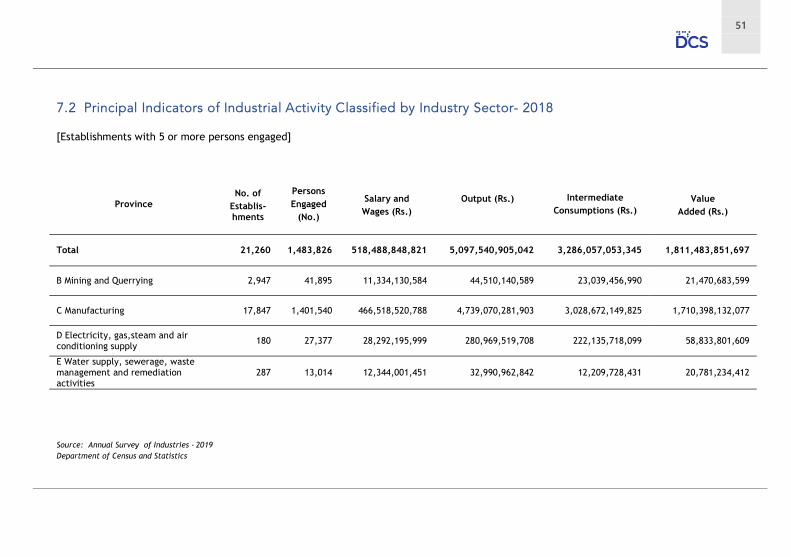
51
[Establishments with 5 or more persons engaged]
Province No. of
Establis- hments
Persons Engaged
(No.)
Salary and
Wages (Rs.) Output (Rs.)
Intermediate Consumptions (Rs.)
Value Added (Rs.)
Total 21,260 1,483,826 518,488,848,821 5,097,540,905,042 3,286,057,053,345 1,811,483,851,697
B Mining and Querrying 2,947 41,895 11,334,130,584 44,510,140,589 23,039,456,990 21,470,683,599
C Manufacturing 17,847 1,401,540 466,518,520,788 4,739,070,281,903 3,028,672,149,825 1,710,398,132,077
D Electricity, gas,steam and air conditioning supply
180 27,377 28,292,195,999 280,969,519,708 222,135,718,099 58,833,801,609
E Water supply, sewerage, waste management and remediation activities
287 13,014 12,344,001,451 32,990,962,842 12,209,728,431 20,781,234,412
Source: Annual Survey of Industries - 2019
Department of Census and Statistics

52
STATISTICAL POCKET BOOK 2021
2017 2018 2019 2020
Passengers (Thousand Persons) Railway 136,663 137,524 128,476 65,080
Ominibus Services 2,940,413 3,233,443 3,159,088 1,106,011
Sri Lanka Transport Board 1,005,205 952,778** 916,964 600,512*
National Carrier (Sri Lankan Airlines) 5,361 5,882 5,579 1,238
Foreign Airlines 4,559 4,917 4,321 1,135
Freight (Thousand metric tons) Railway 1,998 1,837 1,802 1,784
National Carrier (Sri Lankan Airlines) 128.87 135.64 122.82 56.15
Foreign Airlines 137.68 132.86 123.59 79.94
* Provisional ** Revised Source : Sri Lanka Transport Board, National Transport Commission Department of Railways, Civil Aviation Authority of Sri Lanka
53
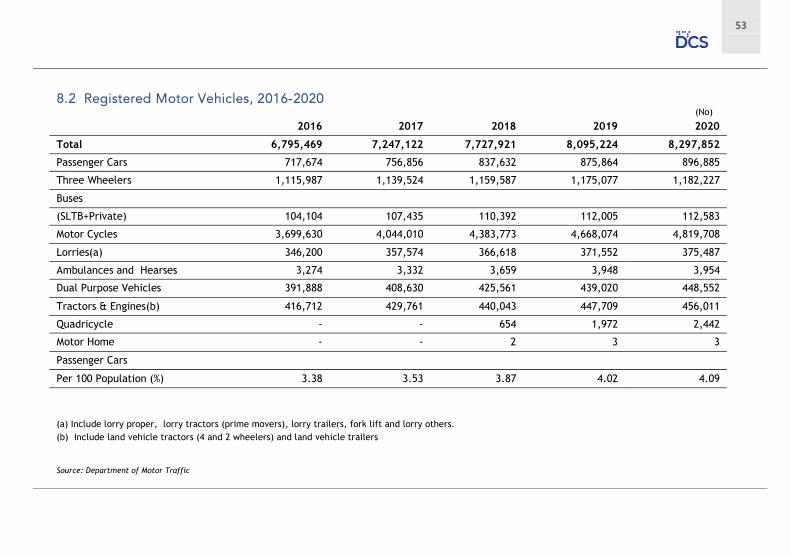
(No) 2016 2017 2018 2019 2020
Total 6,795,469 7,247,122 7,727,921 8,095,224 8,297,852
Passenger Cars 717,674 756,856 837,632 875,864 896,885
Three Wheelers 1,115,987 1,139,524 1,159,587 1,175,077 1,182,227
Buses
(SLTB+Private) 104,104 107,435 110,392 112,005 112,583
Motor Cycles 3,699,630 4,044,010 4,383,773 4,668,074 4,819,708
Lorries(a) 346,200 357,574 366,618 371,552 375,487
Ambulances and Hearses 3,274 3,332 3,659 3,948 3,954
Dual Purpose Vehicles 391,888 408,630 425,561 439,020 448,552
Tractors & Engines(b) 416,712 429,761 440,043 447,709 456,011
Quadricycle - - 654 1,972 2,442
Motor Home - - 2 3 3
Passenger Cars
Per 100 Population (%) 3.38 3.53 3.87 4.02 4.09
(a) Include lorry proper, lorry tractors (prime movers), lorry trailers, fork lift and lorry others. (b) Include land vehicle tractors (4 and 2 wheelers) and land vehicle trailers Source: Department of Motor Traffic
54
STATISTICAL POCKET BOOK 2021
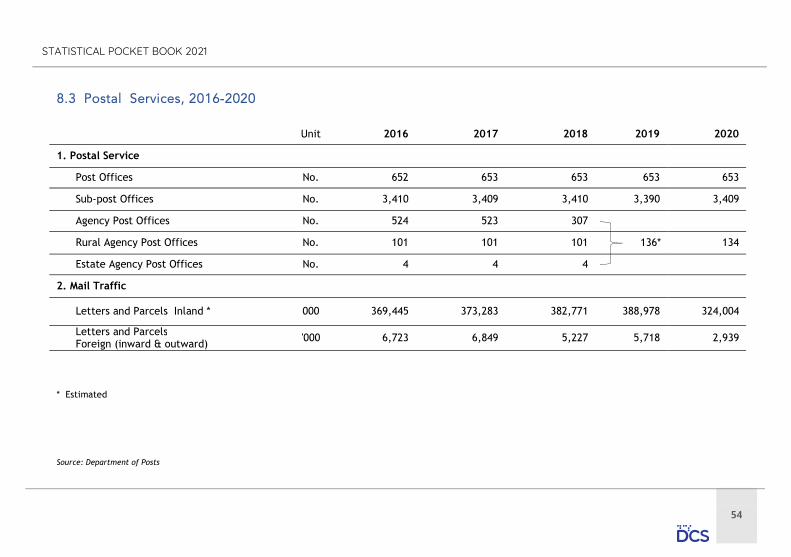
Unit 2016 2017 2018 2019 2020
1. Postal Service
Post Offices No. 652 653 653 653 653
Sub-post Offices No. 3,410 3,409 3,410 3,390 3,409
Agency Post Offices No. 524 523 307
Rural Agency Post Offices No. 101 101 101 136* 134
Estate Agency Post Offices No. 4 4 4
2. Mail Traffic
Letters and Parcels Inland * 000 369,445 373,283 382,771 388,978 324,004
Letters and Parcels Foreign (inward & outward)
'000 6,723 6,849 5,227 5,718 2,939
* Estimated Source: Department of Posts

55
2017 2018 2019 2020*
1. Fixed Access Services (No.)
Wire line Telephone Lines in Service 1,198,483 1,215,967 1,244,549 1,246,045
Wireless Local Loop Telephones & CDMA 1,404,695 1,268,649 1,055,218 1,367,095
2. Cellular Mobile (No. of subscribers) 28,199,083 32,528,104 32,884,099 28,739,277
3. Telephone Density
(Telephones per 100 persons, including cellular subscriptions)
143.6 161.5 161.3 143.0
4. Other Services
Public Pay Phones (No. of Booths) 5,137 2,135 476 461
Fixed Internet and E-mail (No. of Subscribers) 1,221,960 1,530,099 1,654,237 1,956,383
Mobile Broad Band (No.of Subscribers) ** 5,525,194 9,032,576 11,754,166 15,567,665
* Provisional ** Subscriptions rebased
Source : Telecommunications Regulatory Commission of Sri Lanka

56
STATISTICAL POCKET BOOK 2021
(Rs.Mn.)
Year Imports Exports Balance of
Trade Exports Re-Exports Total Exports
2012 2,282,652 1,171,468 24,210 1,195,678 -1,086,974
2013 2,317,405 1,292,319 27,877 1,320,196 -997,209
2014 2,512,833 1,442,019 33,048 1,475,067 -1,037,766
2015 2,581,365 1,388,186 32,379 1,420,565 -1,160,800
2016 2,841,383 1,487,652 48,515 1,536,167 -1,305,216
2017 3,251,281 1,739,728 50,155 1,789,882 -1,461,399
2018 3,587,048 1,893,443 80,817 1,974,260 -1,612,788
2019 3,482,346 2,103,220 37,656 2,140,876 -1,341,470
2020 2,891,600 1,834,145 146,640 1,980,785 -910,814
Source: Sri Lanka Customs
57
(Rs.Mn.)
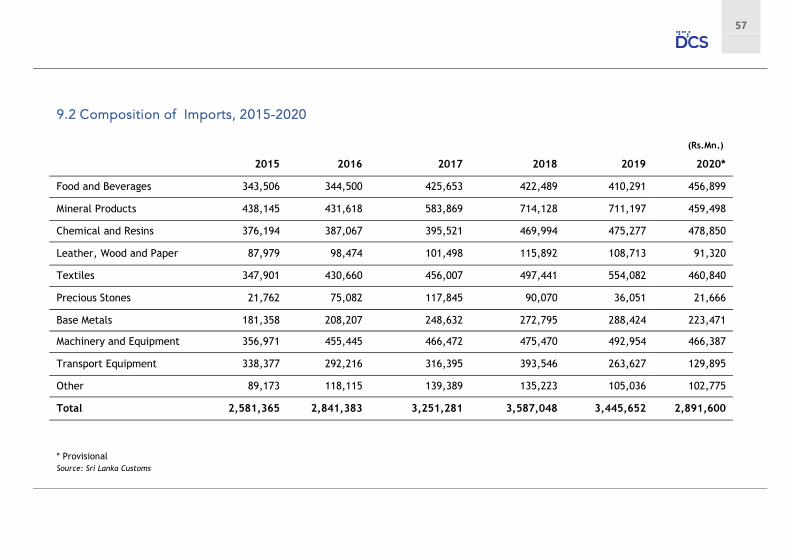
2015 2016 2017 2018 2019 2020*
Food and Beverages 343,506 344,500 425,653 422,489 410,291 456,899
Mineral Products 438,145 431,618 583,869 714,128 711,197 459,498
Chemical and Resins 376,194 387,067 395,521 469,994 475,277 478,850
Leather, Wood and Paper 87,979 98,474 101,498 115,892 108,713 91,320
Textiles 347,901 430,660 456,007 497,441 554,082 460,840
Precious Stones 21,762 75,082 117,845 90,070 36,051 21,666
Base Metals 181,358 208,207 248,632 272,795 288,424 223,471
Machinery and Equipment 356,971 455,445 466,472 475,470 492,954 466,387
Transport Equipment 338,377 292,216 316,395 393,546 263,627 129,895
Other 89,173 118,115 139,389 135,223 105,036 102,775
Total 2,581,365 2,841,383 3,251,281 3,587,048 3,445,652 2,891,600
* Provisional Source: Sri Lanka Customs
58
STATISTICAL POCKET BOOK 2021
(MT.)
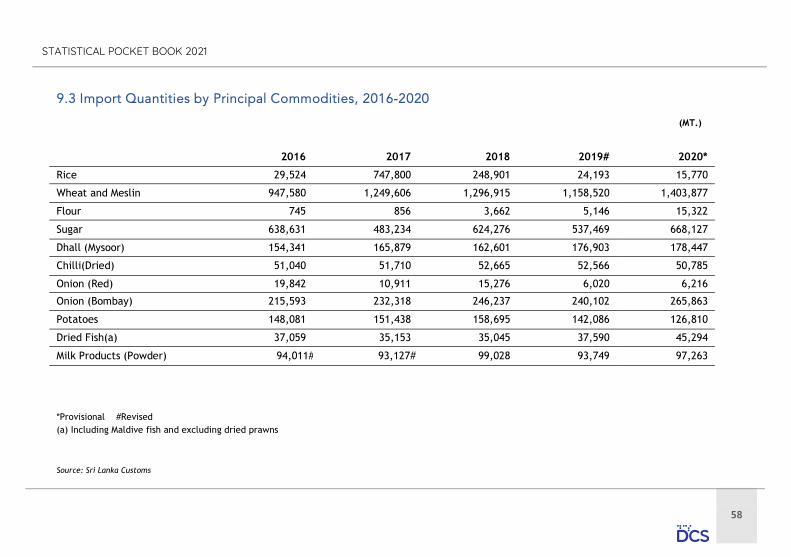
2016 2017 2018 2019# 2020*
Rice 29,524 747,800 248,901 24,193 15,770
Wheat and Meslin 947,580 1,249,606 1,296,915 1,158,520 1,403,877
Flour 745 856 3,662 5,146 15,322
Sugar 638,631 483,234 624,276 537,469 668,127
Dhall (Mysoor) 154,341 165,879 162,601 176,903 178,447
Chilli(Dried) 51,040 51,710 52,665 52,566 50,785
Onion (Red) 19,842 10,911 15,276 6,020 6,216
Onion (Bombay) 215,593 232,318 246,237 240,102 265,863
Potatoes 148,081 151,438 158,695 142,086 126,810
Dried Fish(a) 37,059 35,153 35,045 37,590 45,294
Milk Products (Powder) 94,011# 93,127# 99,028 93,749 97,263
*Provisional #Revised (a) Including Maldive fish and excluding dried prawns
Source: Sri Lanka Customs
59
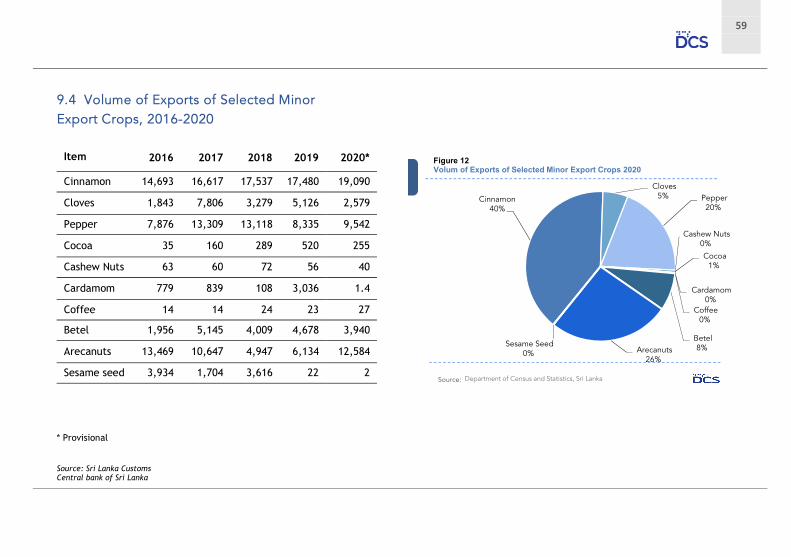
Item 2016 2017 2018 2019 2020*
Cinnamon 14,693 16,617 17,537 17,480 19,090
Cloves 1,843 7,806 3,279 5,126 2,579
Pepper 7,876 13,309 13,118 8,335 9,542
Cocoa 35 160 289 520 255
Cashew Nuts 63 60 72 56 40
Cardamom 779 839 108 3,036 1.4
Coffee 14 14 24 23 27
Betel 1,956 5,145 4,009 4,678 3,940
Arecanuts 13,469 10,647 4,947 6,134 12,584
Sesame seed 3,934 1,704 3,616 22 2
* Provisional Source: Sri Lanka Customs Central bank of Sri Lanka
Figure 12Volum of Exports of Selected Minor Export Crops 2020
60
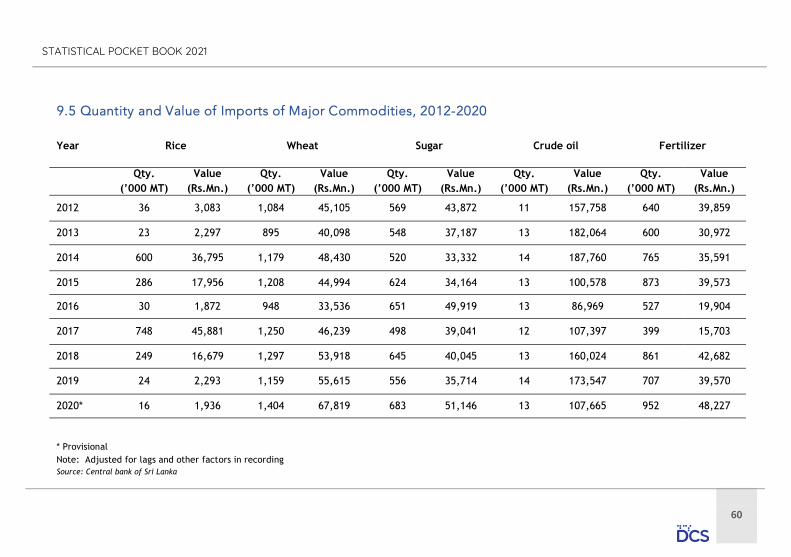
STATISTICAL POCKET BOOK 2021
Year
Rice Wheat
Sugar
Crude oil
Fertilizer
Qty. (’000 MT)
Value (Rs.Mn.)
Qty. (’000 MT)
Value (Rs.Mn.)
Qty. (’000 MT)
Value (Rs.Mn.)
Qty. (’000 MT)
Value (Rs.Mn.)
Qty. (’000 MT)
Value (Rs.Mn.)
2012 36 3,083 1,084 45,105 569 43,872 11 157,758 640 39,859
2013 23 2,297 895 40,098 548 37,187 13 182,064 600 30,972
2014 600 36,795 1,179 48,430 520 33,332 14 187,760 765 35,591
2015 286 17,956 1,208 44,994 624 34,164 13 100,578 873 39,573
2016 30 1,872 948 33,536 651 49,919 13 86,969 527 19,904
2017 748 45,881 1,250 46,239 498 39,041 12 107,397 399 15,703
2018 249 16,679 1,297 53,918 645 40,045 13 160,024 861 42,682
2019 24 2,293 1,159 55,615 556 35,714 14 173,547 707 39,570
2020* 16 1,936 1,404 67,819 683 51,146 13 107,665 952 48,227
* Provisional Note: Adjusted for lags and other factors in recording Source: Central bank of Sri Lanka
61
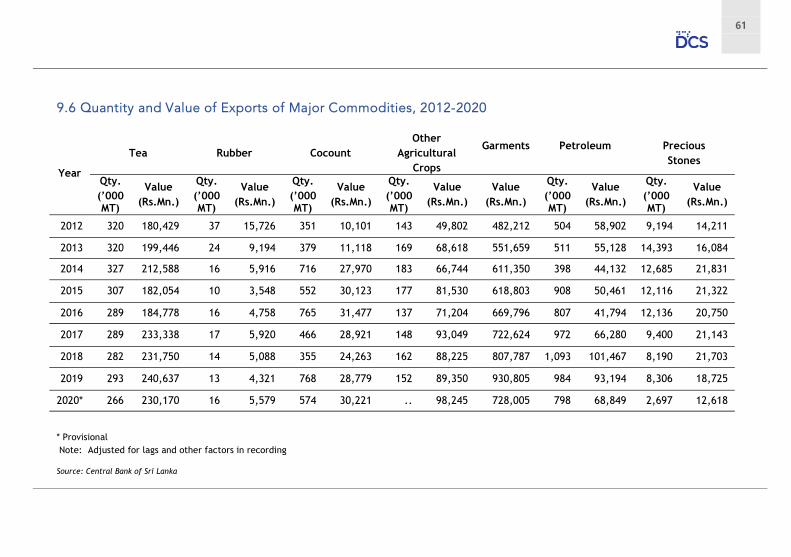
Year
Tea Rubber Cocount Other
Agricultural Crops
Garments
Petroleum
Precious Stones
Qty. (’000 MT)
Value (Rs.Mn.)
Qty. (’000 MT)
Value (Rs.Mn.)
Qty. (’000 MT)
Value (Rs.Mn.)
Qty. (’000 MT)
Value (Rs.Mn.)
Value (Rs.Mn.)
Qty. (’000 MT)
Value (Rs.Mn.)
Qty. (’000 MT)
Value (Rs.Mn.)
2012 320 180,429 37 15,726 351 10,101 143 49,802 482,212 504 58,902 9,194 14,211
2013 320 199,446 24 9,194 379 11,118 169 68,618 551,659 511 55,128 14,393 16,084
2014 327 212,588 16 5,916 716 27,970 183 66,744 611,350 398 44,132 12,685 21,831
2015 307 182,054 10 3,548 552 30,123 177 81,530 618,803 908 50,461 12,116 21,322
2016 289 184,778 16 4,758 765 31,477 137 71,204 669,796 807 41,794 12,136 20,750
2017 289 233,338 17 5,920 466 28,921 148 93,049 722,624 972 66,280 9,400 21,143
2018 282 231,750 14 5,088 355 24,263 162 88,225 807,787 1,093 101,467 8,190 21,703
2019 293 240,637 13 4,321 768 28,779 152 89,350 930,805 984 93,194 8,306 18,725
2020* 266 230,170 16 5,579 574 30,221 .. 98,245 728,005 798 68,849 2,697 12,618
* Provisional Note: Adjusted for lags and other factors in recording Source: Central Bank of Sri Lanka

62
STATISTICAL POCKET BOOK 2021
(Sri Lanka Rupees per unit of Foreign Currency)
Year
USA (US$)
UK (£)
Japan (¥)
India (Rs.) SDR (a) Euro
2013 129.12 202.08 1.32 2.21 196.19 171.51
2014 130.56 215.16 1.24 2.14 198.35 173.47
2015 135.94 207.99 1.12 2.12 190.16 150.84
2016 145.60 197.15 1.34 2.17 202.39 161.16
2017 152.45 196.47 1.36 2.34 211.49 171.73
2018 162.54 216.66 1.47 2.37 229.89 191.71
2019 178.77 228.19 1.64 2.53 246.97 200.14
2020 185.52 238.22 1.74 2.50 258.61 212.07
(a) Special Drawing Rights, the unit of account of the International Monetary Fund
Source: Central Bank of Sri Lanka
63
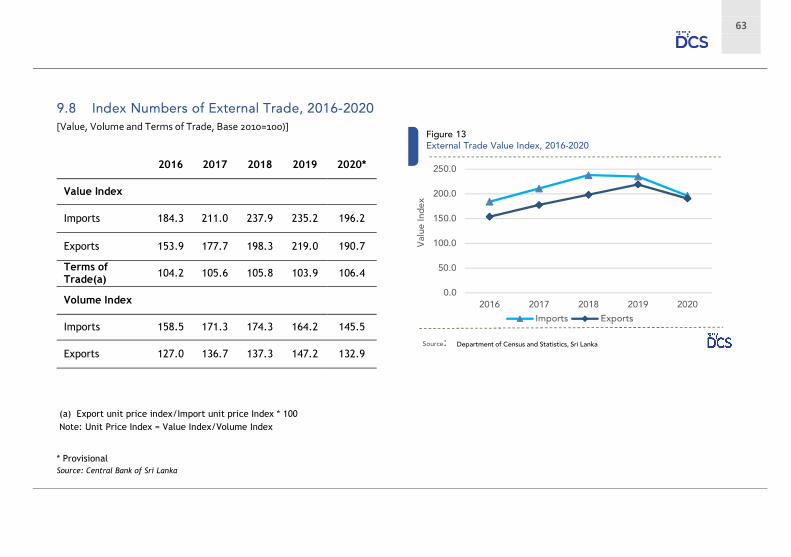
[Value, Volume and Terms of Trade, Base 2010=100)]
2016 2017 2018 2019 2020*
Value Index
Imports 184.3 211.0 237.9 235.2 196.2
Exports 153.9 177.7 198.3 219.0 190.7
Terms of Trade(a)
104.2 105.6 105.8 103.9 106.4
Volume Index
Imports 158.5 171.3 174.3 164.2 145.5
Exports 127.0 136.7 137.3 147.2 132.9
(a) Export unit price index/Import unit price Index * 100 Note: Unit Price Index = Value Index/Volume Index
* Provisional Source: Central Bank of Sri Lanka
64
STATISTICAL POCKET BOOK 2021
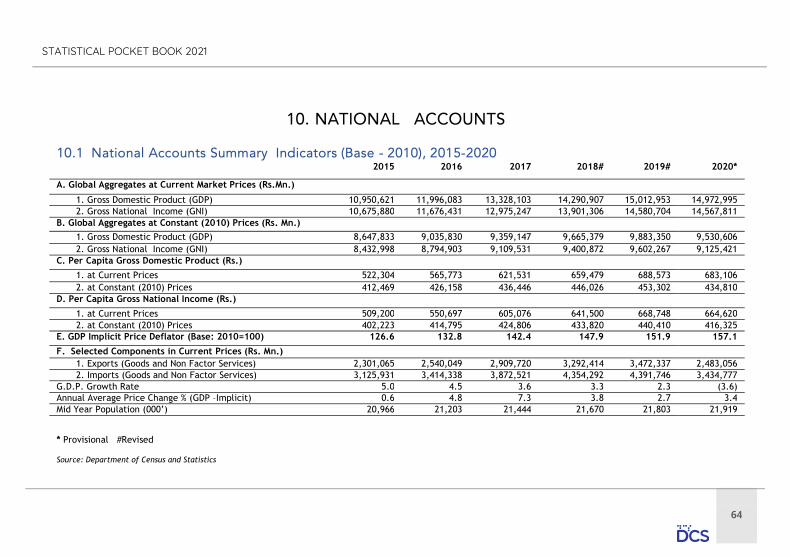
2015 2016 2017 2018# 2019# 2020*
A. Global Aggregates at Current Market Prices (Rs.Mn.)
1. Gross Domestic Product (GDP) 10,950,621 11,996,083 13,328,103 14,290,907 15,012,953 14,972,995 2. Gross National Income (GNI) 10,675,880 11,676,431 12,975,247 13,901,306 14,580,704 14,567,811 B. Global Aggregates at Constant (2010) Prices (Rs. Mn.)
1. Gross Domestic Product (GDP) 8,647,833 9,035,830 9,359,147 9,665,379 9,883,350 9,530,606 2. Gross National Income (GNI) 8,432,998 8,794,903 9,109,531 9,400,872 9,602,267 9,125,421 C. Per Capita Gross Domestic Product (Rs.)
1. at Current Prices 522,304 565,773 621,531 659,479 688,573 683,106 2. at Constant (2010) Prices 412,469 426,158 436,446 446,026 453,302 434,810 D. Per Capita Gross National Income (Rs.)
1. at Current Prices 509,200 550,697 605,076 641,500 668,748 664,620 2. at Constant (2010) Prices 402,223 414,795 424,806 433,820 440,410 416,325 E. GDP Implicit Price Deflator (Base: 2010=100) 126.6 132.8 142.4 147.9 151.9 157.1
F. Selected Components in Current Prices (Rs. Mn.) 1. Exports (Goods and Non Factor Services) 2,301,065 2,540,049 2,909,720 3,292,414 3,472,337 2,483,056 2. Imports (Goods and Non Factor Services) 3,125,931 3,414,338 3,872,521 4,354,292 4,391,746 3,434,777 G.D.P. Growth Rate 5.0 4.5 3.6 3.3 2.3 (3.6) Annual Average Price Change % (GDP –Implicit) 0.6 4.8 7.3 3.8 2.7 3.4 Mid Year Population (000’) 20,966 21,203 21,444 21,670 21,803 21,919
* Provisional #Revised
Source: Department of Census and Statistics
65
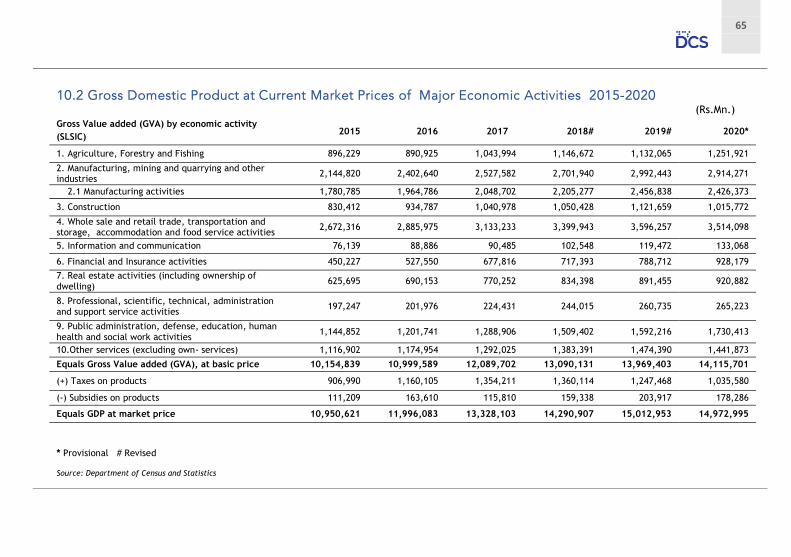
(Rs.Mn.) Gross Value added (GVA) by economic activity (SLSIC)
2015 2016 2017 2018# 2019# 2020*
1. Agriculture, Forestry and Fishing 896,229 890,925 1,043,994 1,146,672 1,132,065 1,251,921
2. Manufacturing, mining and quarrying and other industries
2,144,820 2,402,640 2,527,582 2,701,940 2,992,443 2,914,271
2.1 Manufacturing activities 1,780,785 1,964,786 2,048,702 2,205,277 2,456,838 2,426,373
3. Construction 830,412 934,787 1,040,978 1,050,428 1,121,659 1,015,772
4. Whole sale and retail trade, transportation and storage, accommodation and food service activities
2,672,316 2,885,975 3,133,233 3,399,943 3,596,257 3,514,098
5. Information and communication 76,139 88,886 90,485 102,548 119,472 133,068
6. Financial and Insurance activities 450,227 527,550 677,816 717,393 788,712 928,179
7. Real estate activities (including ownership of dwelling)
625,695 690,153 770,252 834,398 891,455 920,882
8. Professional, scientific, technical, administration and support service activities
197,247 201,976 224,431 244,015 260,735 265,223
9. Public administration, defense, education, human health and social work activities
1,144,852 1,201,741 1,288,906 1,509,402 1,592,216 1,730,413
10.Other services (excluding own- services) 1,116,902 1,174,954 1,292,025 1,383,391 1,474,390 1,441,873
Equals Gross Value added (GVA), at basic price 10,154,839 10,999,589 12,089,702 13,090,131 13,969,403 14,115,701
(+) Taxes on products 906,990 1,160,105 1,354,211 1,360,114 1,247,468 1,035,580
(-) Subsidies on products 111,209 163,610 115,810 159,338 203,917 178,286
Equals GDP at market price 10,950,621 11,996,083 13,328,103 14,290,907 15,012,953 14,972,995
* Provisional # Revised
Source: Department of Census and Statistics
66
STATISTICAL POCKET BOOK 2021
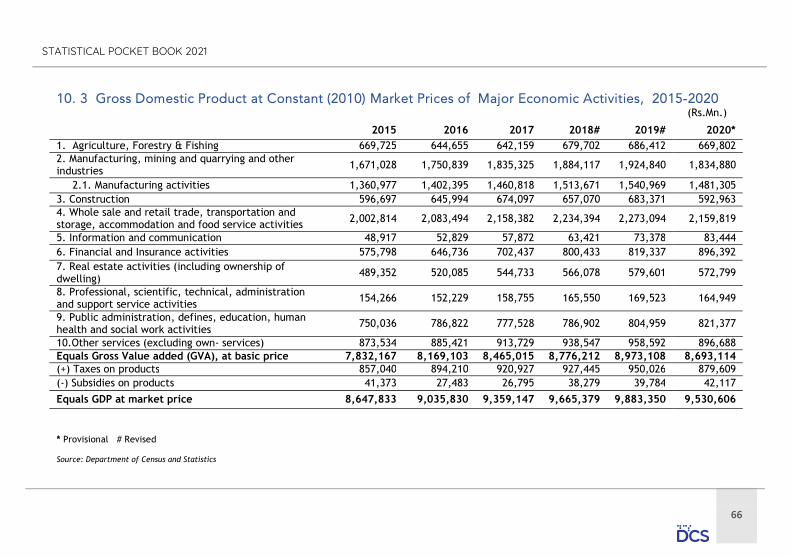
(Rs.Mn.)
2015 2016 2017 2018# 2019# 2020* 1. Agriculture, Forestry & Fishing 669,725 644,655 642,159 679,702 686,412 669,802 2. Manufacturing, mining and quarrying and other industries 1,671,028 1,750,839 1,835,325 1,884,117 1,924,840 1,834,880
2.1. Manufacturing activities 1,360,977 1,402,395 1,460,818 1,513,671 1,540,969 1,481,305 3. Construction 596,697 645,994 674,097 657,070 683,371 592,963 4. Whole sale and retail trade, transportation and storage, accommodation and food service activities 2,002,814 2,083,494 2,158,382 2,234,394 2,273,094 2,159,819
5. Information and communication 48,917 52,829 57,872 63,421 73,378 83,444 6. Financial and Insurance activities 575,798 646,736 702,437 800,433 819,337 896,392 7. Real estate activities (including ownership of dwelling)
489,352 520,085 544,733 566,078 579,601 572,799
8. Professional, scientific, technical, administration and support service activities
154,266 152,229 158,755 165,550 169,523 164,949
9. Public administration, defines, education, human health and social work activities
750,036 786,822 777,528 786,902 804,959 821,377
10.Other services (excluding own- services) 873,534 885,421 913,729 938,547 958,592 896,688 Equals Gross Value added (GVA), at basic price 7,832,167 8,169,103 8,465,015 8,776,212 8,973,108 8,693,114 (+) Taxes on products 857,040 894,210 920,927 927,445 950,026 879,609 (-) Subsidies on products 41,373 27,483 26,795 38,279 39,784 42,117
Equals GDP at market price 8,647,833 9,035,830 9,359,147 9,665,379 9,883,350 9,530,606
* Provisional # Revised
Source: Department of Census and Statistics

67
(Rs.Mn.)
2015 2016 2017 2018# 2019# 2020*
Value % Value % Value % Value % Value % Value %
Final Consumption Expenditure 8,360,930 76.4 9,529,202 79.4 10,079,907 75.6 11,086,732 77.6 11,902,168 79.3 12,146,234 81.1
household Final
Consumption Expenditure 1 7,376,176 67.4 8,514,456 71.0 8,942,501 67.1 9,776,077 68.4 10,485,180 69.8 10,589,745 70.7
Government final consumption expenditure2 984,755 9.0 1,014,746 8.5 1,137,406 8.5 1,310,655 9.2 1,416,989 9.4 1,556,489 10.4
Individual consumption expenditure 319,119 2.9 327,713 2.7 355,291 2.7 371,615 2.6 475,782 3.2 560,537 3.7
Collective consumption expenditure 665,636 6.1 687,032 5.7 782,115 5.9 939,040 6.6 941,207 6.3 995,952 6.7
Gross Capital Formation 3,414,556 31.2 3,341,171 27.9 4,210,997 31.6 4,266,053 29.9 4,030,195 26.8 3,778,482 25.2
Gross Fixed Capital formation3 2,814,288 25.7 3,210,061 26.8 3,516,741 26.4 3,763,859 26.3 4,070,434 27.1 3,809,794 25.4
Changes in inventories 563,196 5.1 43,722 0.4 559,619 4.20 392.576 2.7 (90,622) (0.6) (64,200) (0.4)
Acquisitions less disposals of valuables 37,071 0.3 87,388 0.7 134,638 1.0 109,618 0.8 50,382 0.3 32,888 0.2
External Balance of goods and services (824,865) (7.5) (874,289) (7.3) (962,801) (7.2) (1,061,878) (7.4) (919,410) (6.1) (951,721) (6.4)
Export of goods and services 2,301,065 21.0 2,540,049 21.2 2,909,720 21.8 3,292,414 23.0 3,472,337 23.1 2,483,056 16.6
Import of goods and services 3,125,931 28.5 3,414,338 28.5 3,872,521 29.1 4,354,292 30.5 4,391,746 29.3 3,434,777 22.9
Gross Domestic Product (GDP/GDE)@ mp 10,950,621 100.0 11,996,083 100.0 13,328,103 100.0 14,290,907 100.0 15,012,953 100.0 14,972,995 100.0
* Provisional # Revised
1. Detail table provided by COICOP classification 2. Detail table provided by COFOG classification 3. Detail table provided by type of asset Source: Department of Census and Statistics

68
STATISTICAL POCKET BOOK 2021
(Rs.Mn.)Item 2016 2017 2018 2019 2020*
1. Tax Revenue 1,463,689 1,670,178 1,712,318 1,734,925 1,216,542 1.1 Taxes on Foreign Trade 302,538 311,782 288,341 280,965 312,334 Imports 156,487 136,501 96,991 98,427 114,183 PAL/RDL/SCL/Other 146,051 175,280 191,351 182,538 198,151
1.2 Taxes on Domestic Goods and Services 747,147 921,244 959,365 843,355 555,718
VAT 283,470 443,760 461,740 443,877 233,786
Excise Duty 454,952 469,500 484,287 399,478 321,932 License Fee 8,726 7,984 13,339 - - 1.3 Taxes on Net Income and Profits 258,857 274,562 310,449 427,700 268,249 1.4 Stamp Duty/ Cess Levy/ SRL/NBT/DL/TL 155,147 162,591 154,162 182,905 80,241 2.Non Tax Revenue 222,374 161,353 207,656 155,974 151,417 2.1 Current Revenue 221,966 161,353 207,656 155,974 151,417 2.2 Capital Revenue 407 - - - - Total 1,686,062 1,831,531 1,919,973 1,890,899 1,367,960
* Provisional Value Added Tax (VAT,) Ports and Airports Development Levy (PAL) Regional Infrastructure Development Levy (RDL) Special Commodity Levt (SCL) Social Responsibility Leve (SRL) Nation Building Tax (NBT) Defence Levy (DL) Telecommunications Levy (TL) Sources: Central Bank of Sri Lanka
69
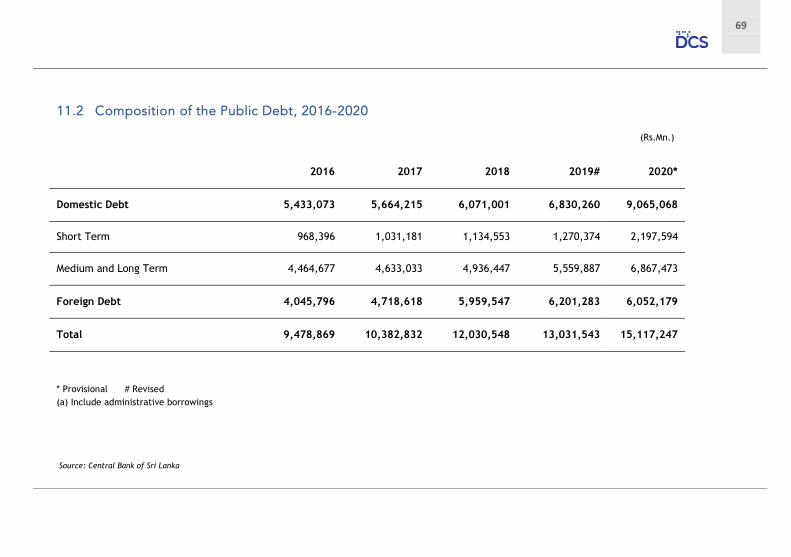
(Rs.Mn.)
2016 2017 2018 2019# 2020*
Domestic Debt 5,433,073 5,664,215 6,071,001 6,830,260 9,065,068
Short Term 968,396 1,031,181 1,134,553 1,270,374 2,197,594
Medium and Long Term 4,464,677 4,633,033 4,936,447 5,559,887 6,867,473
Foreign Debt 4,045,796 4,718,618 5,959,547 6,201,283 6,052,179
Total 9,478,869 10,382,832 12,030,548 13,031,543 15,117,247
* Provisional # Revised (a) Include administrative borrowings
Source: Central Bank of Sri Lanka

70
STATISTICAL POCKET BOOK 2021
(Rs.Mn.)
Item 2016 2017 2018 2019 2020*
1 Recurrent Expenditure 1,757,782 1,927,693 2,089,713 2,424,582 2,548,359
1.1 Expenditure on Goods and Services 740,250 756,591 806,002 848,278 974,351
1.2 Interest Payments 610,895 735,566 852,190 901,353 980,302
1.3 Transfer Payments 400,637 435,536 431,521 551,524 717,133
1.4 Adjustment for arrears as per the Ministry of Finance - - - 123,428 (123,428) 2 Capital Expenditure 577,036 638,343 612,561 619,069 795,368 2.1 Acquisition of Fixed Capital Assets 328,202 360,333 355,763 385,366 483,543 2.2 Capital Transfers 248,834 278,010 256,798 239,688 307,917 2.3 Other - - - (5,985) 3,907 3 . Lending Minus Repayments (934) 7,021 (9,046) (4,933) (3,552)
3.1 Net Lending through Advance Accounts 708 4,396 4,129 1,172 (529)
3.2 Lending to Public Enterprises 16,977 19,043 12,408 12,166 16,405 3.3 Loan Repayments in Public Enterprises (18,619) (16,418) (25,584) (18,271) (19,429)
4. Adjustment for arrears on capital expenditure as per the Ministry of Finance
- - - 299,178 (299,178)
Total 2,333,883 2,573,056 2,693,228 3,337,896 3,040,996
* Provisional Sources: Central Bank of Sri Lanka

71
(No)
Year
Hospitals (a)
Beds (a)
Central Dispen-
saries/PMCU’s
Doctors (b)
Asst./ Registered
Medical Practitioners
Nurses
Patients Treated (’000) Out In
Patients(c) Patients(c)
2011 638 73,939 459 15,273 1,063 35,870 50,682 5,611
2012 621 76,087 487 15,910 1,130 36,486 50,631 5,840
2013 624 78,243 461 16,690 1,064 35,629 53,859 5,926
2014 622 80,105 475 17,615 999 38,451 55,105 6,120
2015 631 80,581 474 18,243 936 42,420 54,652 6,360
2016 629 81,580 480 18,968 883 42,556 53,620 6,498
2017 628 83,275 496 19,800 818 45,480 55,520 6,910
2018 641 84,728 515 19,720 789 46,024 57,363 7,116
2019* 643 85,868 522 20,054 728 46,331 58,920 7,478
* Provisional (a) Excludes Central Dispensaries/Primary Medical Care Units (PMCU) but includes Central Dispensary/ PMCU and Maternity Homes and Maternity Hospitals (b) Doctors of all grades in the Ministry of Health, Nutrition and Indigenous Medicine (c) These figures indicate the number of patients visits Source: Ministry of Health
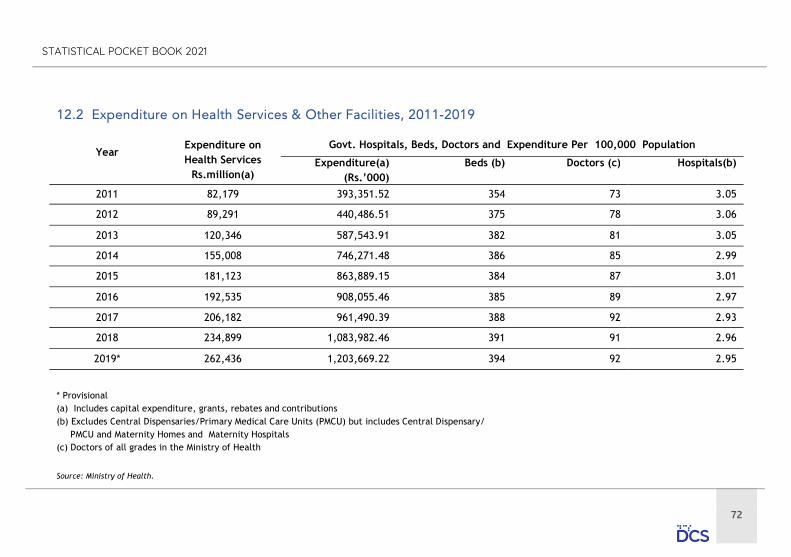
72
STATISTICAL POCKET BOOK 2021
Year
Expenditure on Health Services
Rs.million(a)
Govt. Hospitals, Beds, Doctors and Expenditure Per 100,000 Population
Expenditure(a) (Rs.’000)
Beds (b)
Doctors (c)
Hospitals(b)
2011 82,179 393,351.52 354 73 3.05
2012 89,291 440,486.51 375 78 3.06
2013 120,346 587,543.91 382 81 3.05
2014 155,008 746,271.48 386 85 2.99
2015 181,123 863,889.15 384 87 3.01
2016 192,535 908,055.46 385 89 2.97
2017 206,182 961,490.39 388 92 2.93
2018 234,899 1,083,982.46 391 91 2.96
2019* 262,436 1,203,669.22 394 92 2.95
* Provisional (a) Includes capital expenditure, grants, rebates and contributions (b) Excludes Central Dispensaries/Primary Medical Care Units (PMCU) but includes Central Dispensary/ PMCU and Maternity Homes and Maternity Hospitals (c) Doctors of all grades in the Ministry of Health Source: Ministry of Health.
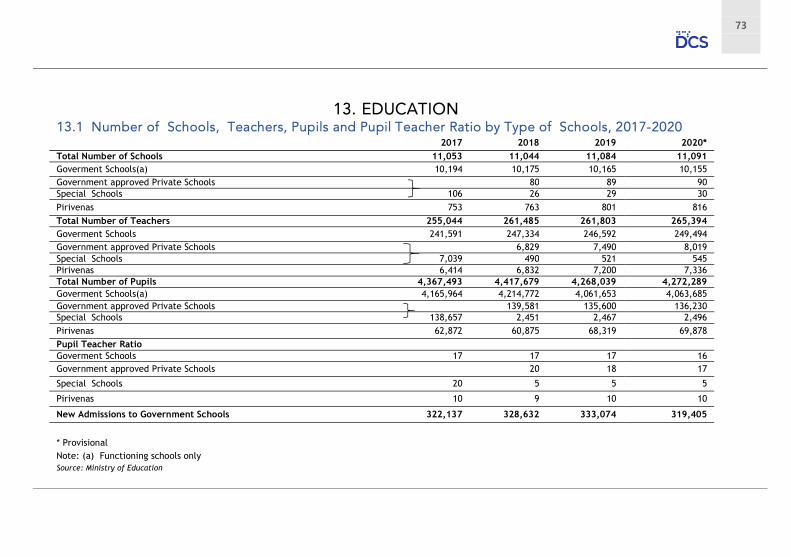
73
2017 2018 2019 2020*
Total Number of Schools 11,053 11,044 11,084 11,091 Goverment Schools(a) 10,194 10,175 10,165 10,155 Government approved Private Schools 80 89 90 Special Schools 106 26 29 30
Pirivenas 753 763 801 816
Total Number of Teachers 255,044 261,485 261,803 265,394 Goverment Schools 241,591 247,334 246,592 249,494 Government approved Private Schools 6,829 7,490 8,019 Special Schools 7,039 490 521 545 Pirivenas 6,414 6,832 7,200 7,336 Total Number of Pupils 4,367,493 4,417,679 4,268,039 4,272,289 Goverment Schools(a) 4,165,964 4,214,772 4,061,653 4,063,685 Government approved Private Schools 139,581 135,600 136,230 Special Schools 138,657 2,451 2,467 2,496 Pirivenas 62,872 60,875 68,319 69,878 Pupil Teacher Ratio Goverment Schools 17 17 17 16 Government approved Private Schools 20 18 17
Special Schools 20 5 5 5
Pirivenas 10 9 10 10
New Admissions to Government Schools 322,137 328,632 333,074 319,405
* Provisional Note: (a) Functioning schools only Source: Ministry of Education
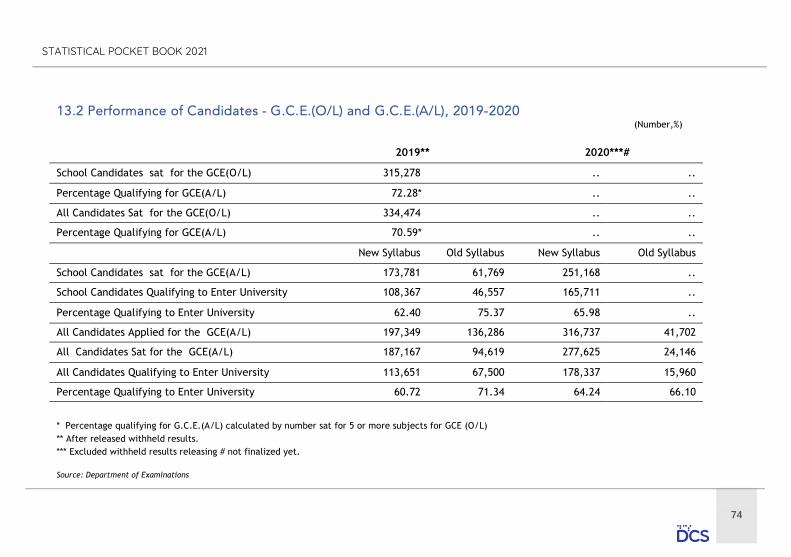
74
STATISTICAL POCKET BOOK 2021
(Number,%)
2019** 2020***#
School Candidates sat for the GCE(O/L) 315,278 .. ..
Percentage Qualifying for GCE(A/L) 72.28* .. ..
All Candidates Sat for the GCE(O/L) 334,474 .. ..
Percentage Qualifying for GCE(A/L) 70.59* .. ..
New Syllabus Old Syllabus New Syllabus Old Syllabus
School Candidates sat for the GCE(A/L) 173,781 61,769 251,168 ..
School Candidates Qualifying to Enter University 108,367 46,557 165,711 ..
Percentage Qualifying to Enter University 62.40 75.37 65.98 ..
All Candidates Applied for the GCE(A/L) 197,349 136,286 316,737 41,702
All Candidates Sat for the GCE(A/L) 187,167 94,619 277,625 24,146
All Candidates Qualifying to Enter University 113,651 67,500 178,337 15,960
Percentage Qualifying to Enter University 60.72 71.34 64.24 66.10
* Percentage qualifying for G.C.E.(A/L) calculated by number sat for 5 or more subjects for GCE (O/L) ** After released withheld results. *** Excluded withheld results releasing # not finalized yet. Source: Department of Examinations

75
2019 2020* 1. No. of Universities 15 15 No.of Other Higher Educational Institutions 20 20 2. No.of Students (Undergraduates)(a) Universities 100,944 106,641 Institutes 3,724 3,844 Open University 25,165 26,255 3. No. of Lecturers(b) 6,321 6,525 4. No. of Students (Postgraduates) 40,931 41,074 5. No. of Graduates(includes External & Open
University also)
Basic Degree 25,757 24,565 Arts and Education 9,907 11,795 Commerce & Management Studies 5,469 3,842 Law 771 814 Science 3,634 1,849 Engineering 1,026 1,516 Medicine 1,433 969 Dental Surgery 87 87 Agriculture 927 1,142 Veternery Science 54 10 Architecture & Quantity Surveying 242 115 Computer Sc/IT/ICT/MIT 1,210 1,175 Paramedical Stucies 749 1,006 Indigenous Medicine 248 245 6. New admissions for basic degrees 31,902 41,669* 7. Addmision as a percentage of eligible 18.98 22.98
* Provisional
Source – Central Bank of Sri Lanka
Item 2019 2020*
Total Government Expenditure 290.2 .. (a) Current 234.4 .. (b) Capital 55.8 ..
* Provisional (a) Excluding external degree courses (b) Excluding Temporary Staff Source: University Grants Commission

76
STATISTICAL POCKET BOOK 2021
[10 Years of Age and Over]
Census year
Population (’000) No. Literate(’000) Percentage Literate
Male Female Total Male Female Total Male Female Total
1953 3,110 2,693 5,803 2,510 1,496 4,006 80.7 55.6 69.0
1963 3,952 3,571 7,523 3,385 2,404 5,789 85.6 67.3 77.0
1971 4,839 4,515 9,354 4,143 3,201 7,344 85.6 70.9 78.5
1981 5,768 5,541 11,309 5,257 4,608 9,866 91.1 83.2 87.2
2001(a) 6,937 7,069 14,006 6,423 6,340 12,763 92.6 89.7 91.1
2012 8,046 8,736 16,782 7,807 8,304 16,111 96.8 94.6 95.6
(a) Jaffna, Mannar, Vavuniya, Mullaitivu, Kilinochchi, Batticaloa and Trincomalee districts in which the 2001 census enumeration was not completed are not included here.
Department of Census and Statistics

77
Institute
Year established
Total no. of Students
Intake Completed Dropped
2019 2020* 2019 2020* 2019 2020*
1. Dept.of Technical Education and Training (DTET) 1893 35,599 25,000 23,621 ** 10,636 3,159**
2. Vocational Training Authority(VTA) 1995 37,936 24,703 34,235 2,835 3,701 3,304
3. National Apprentice and Industrial Training Authority (NAITA)
1990 30,952 14,207 25,756 15,630 7,857 ..
4. National Institute of Business Management (NIBM) 1968 9,801 7,482 9,218 6,805 222 125
5. NSBM Green UniversityTown 2011 2,682 2,834 2,155 2,084 9 150
6. University of Vocational Technology (UNIVOTEC) 1999 1,040 0 301 0 34 34
7.Ceylon German Technical Training Institute(CGTTI) 1959 3,726 2,415 2,649 1,459 386 141
Full time courses 600 650 502 524 17 17
Part time courses 3,126 1,765 2,147 935 369 124
8. Ocean University 2014 1,851 1,236 733 .. 159 ..
9. Sri Lanka Institute of Printing (SLIOP) 1984 1,001 512 464 274 203 25
10. National Youth Corps 2002 11,067 11,515 7,416 9,684 3,651 1,831
11. National Youth Service Council 1969 22,280 13,232 17,457 10,794 4,369 2,438
* Provisional ** Completion and Dropout cannot be calculated as the courses for 2020 academic year are still on-going due to the Covid-19 pandemic. Source : State Ministry of Skills Development, Vocational Education, Research and Innovation. National Youth Corps, National Youth Service Council, Ministry of Youth and Sports.
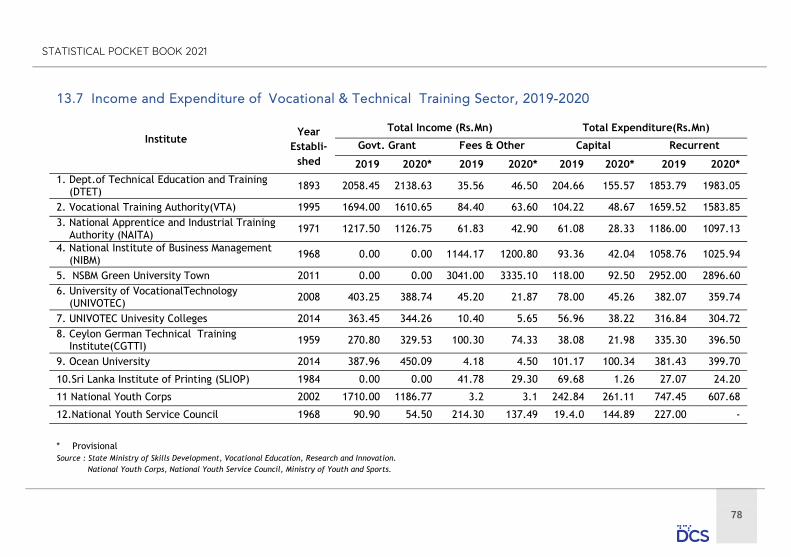
78
STATISTICAL POCKET BOOK 2021
Institute
Year Establi-
shed
Total Income (Rs.Mn) Total Expenditure(Rs.Mn)
Govt. Grant Fees & Other Capital Recurrent
2019 2020* 2019 2020* 2019 2020* 2019 2020* 1. Dept.of Technical Education and Training (DTET) 1893 2058.45 2138.63 35.56 46.50 204.66 155.57 1853.79 1983.05
2. Vocational Training Authority(VTA) 1995 1694.00 1610.65 84.40 63.60 104.22 48.67 1659.52 1583.85 3. National Apprentice and Industrial Training Authority (NAITA)
1971 1217.50 1126.75 61.83 42.90 61.08 28.33 1186.00 1097.13
4. National Institute of Business Management (NIBM)
1968 0.00 0.00 1144.17 1200.80 93.36 42.04 1058.76 1025.94
5. NSBM Green University Town 2011 0.00 0.00 3041.00 3335.10 118.00 92.50 2952.00 2896.60 6. University of VocationalTechnology (UNIVOTEC)
2008 403.25 388.74 45.20 21.87 78.00 45.26 382.07 359.74
7. UNIVOTEC Univesity Colleges 2014 363.45 344.26 10.40 5.65 56.96 38.22 316.84 304.72 8. Ceylon German Technical Training Institute(CGTTI) 1959 270.80 329.53 100.30 74.33 38.08 21.98 335.30 396.50
9. Ocean University 2014 387.96 450.09 4.18 4.50 101.17 100.34 381.43 399.70
10.Sri Lanka Institute of Printing (SLIOP) 1984 0.00 0.00 41.78 29.30 69.68 1.26 27.07 24.20
11 National Youth Corps 2002 1710.00 1186.77 3.2 3.1 242.84 261.11 747.45 607.68
12.National Youth Service Council 1968 90.90 54.50 214.30 137.49 19.4.0 144.89 227.00 -
* Provisional Source : State Ministry of Skills Development, Vocational Education, Research and Innovation. National Youth Corps, National Youth Service Council, Ministry of Youth and Sports.
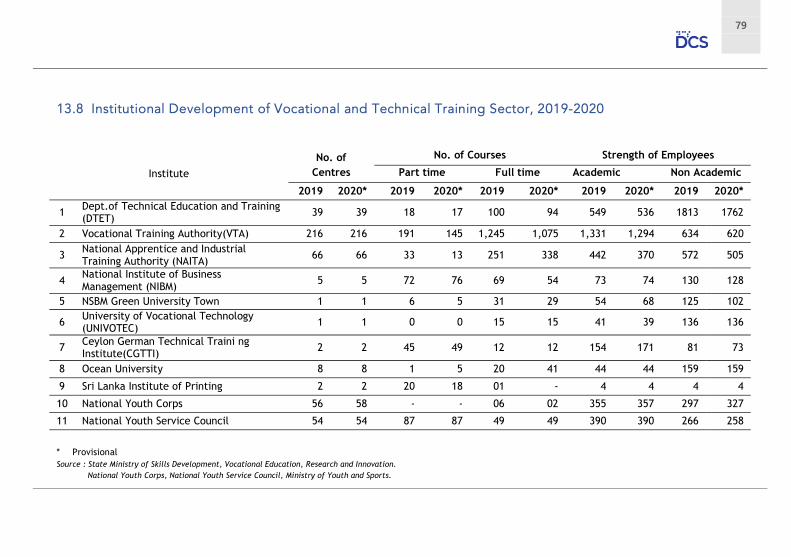
79
Institute
No. of Centres
No. of Courses Strength of Employees
Part time Full time Academic Non Academic
2019 2020* 2019 2020* 2019 2020* 2019 2020* 2019 2020*
1 Dept.of Technical Education and Training (DTET)
39 39 18 17 100 94 549 536 1813 1762
2 Vocational Training Authority(VTA) 216 216 191 145 1,245 1,075 1,331 1,294 634 620
3 National Apprentice and Industrial Training Authority (NAITA)
66 66 33 13 251 338 442 370 572 505
4 National Institute of Business Management (NIBM)
5 5 72 76 69 54 73 74 130 128
5 NSBM Green University Town 1 1 6 5 31 29 54 68 125 102
6 University of Vocational Technology (UNIVOTEC)
1 1 0 0 15 15 41 39 136 136
7 Ceylon German Technical Traini ng Institute(CGTTI)
2 2 45 49 12 12 154 171 81 73
8 Ocean University 8 8 1 5 20 41 44 44 159 159
9 Sri Lanka Institute of Printing 2 2 20 18 01 - 4 4 4 4
10 National Youth Corps 56 58 - - 06 02 355 357 297 327
11 National Youth Service Council 54 54 87 87 49 49 390 390 266 258
* Provisional Source : State Ministry of Skills Development, Vocational Education, Research and Innovation. National Youth Corps, National Youth Service Council, Ministry of Youth and Sports.
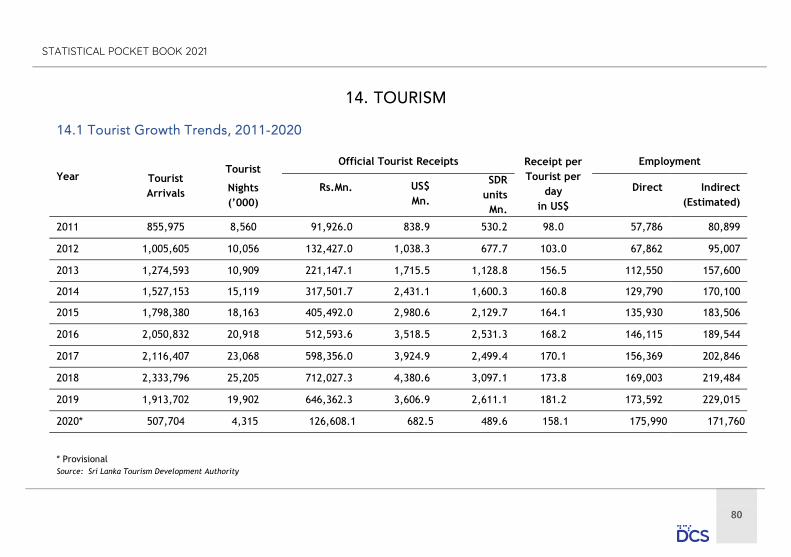
80
STATISTICAL POCKET BOOK 2021
Year
Tourist Arrivals
Tourist
Nights (’000)
Official Tourist Receipts Receipt per Tourist per
day in US$
Employment
Rs.Mn.
US$ Mn.
SDR units Mn.
Direct
Indirect (Estimated)
2011 855,975 8,560 91,926.0 838.9 530.2 98.0 57,786 80,899
2012 1,005,605 10,056 132,427.0 1,038.3 677.7 103.0 67,862 95,007
2013 1,274,593 10,909 221,147.1 1,715.5 1,128.8 156.5 112,550 157,600
2014 1,527,153 15,119 317,501.7 2,431.1 1,600.3 160.8 129,790 170,100
2015 1,798,380 18,163 405,492.0 2,980.6 2,129.7 164.1 135,930 183,506
2016 2,050,832 20,918 512,593.6 3,518.5 2,531.3 168.2 146,115 189,544
2017 2,116,407 23,068 598,356.0 3,924.9 2,499.4 170.1 156,369 202,846
2018 2,333,796 25,205 712,027.3 4,380.6 3,097.1 173.8 169,003 219,484
2019 1,913,702 19,902 646,362.3 3,606.9 2,611.1 181.2 173,592 229,015
2020* 507,704 4,315 126,608.1 682.5 489.6 158.1 175,990 171,760
* Provisional Source: Sri Lanka Tourism Development Authority
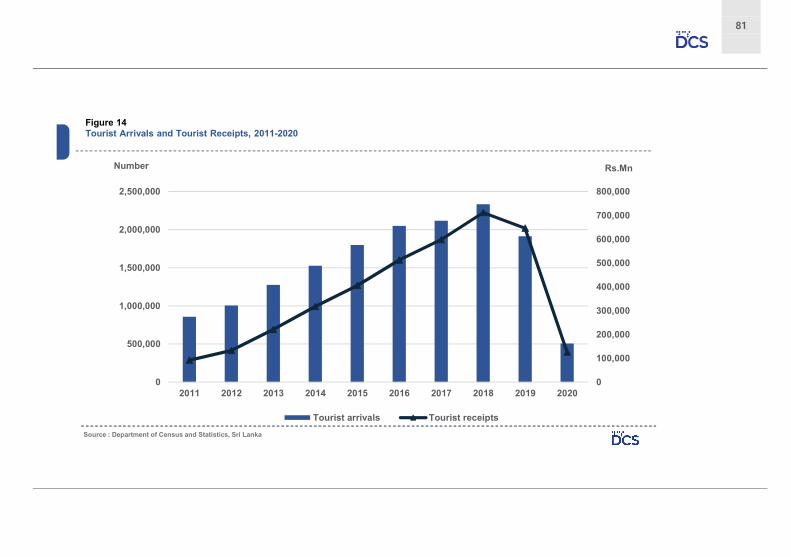
81
0
100,000
200,000
300,000
400,000
500,000
600,000
700,000
800,000
0
500,000
1,000,000
1,500,000
2,000,000
2,500,000
2011 2012 2013 2014 2015 2016 2017 2018 2019 2020
Rs.MnNumber
Tourist arrivals Tourist receipts
Figure 14 Tourist Arrivals and Tourist Receipts, 2011-2020
Source : Department of Census and Statistics, Sri Lanka

82
STATISTICAL POCKET BOOK 2021
Category of Establishments
No. of Establishments
Total Employed
2017 2018 2019 2020* 2017 2018 2019 2020*
1. Hotels and Restaurants 2,567 2,810 3,158 3,565 127,475 136,782 139,754 141,668
2. Travel Agents and Tour Operators 864 904 994 1,016 9,949 11,256 11,759 11,926
3. Airlines 28 32 37 42 7,521 8,267 8,629 8,752
4. Agencies Providing Recreational Facilities
80** 80 80 80 996 1,104 1,144 1,160
5. Guides - - - - 4,978 5,424 5,898 5,989
6. Tourist Shops 73 78 87 90 2,040 2,231 2,338 2,372
7. National Tourist Organisation 04 04 04 04 735 827 855 866
8. State Sector 18 18 18 18 2,675 3,112 3,215 3,257
Total 3,634 3,926 4,378 4,815 156,369 169,003 173,592 175,990
* Provisional ** Revised Source: Sri Lanka Tourism Development Authority
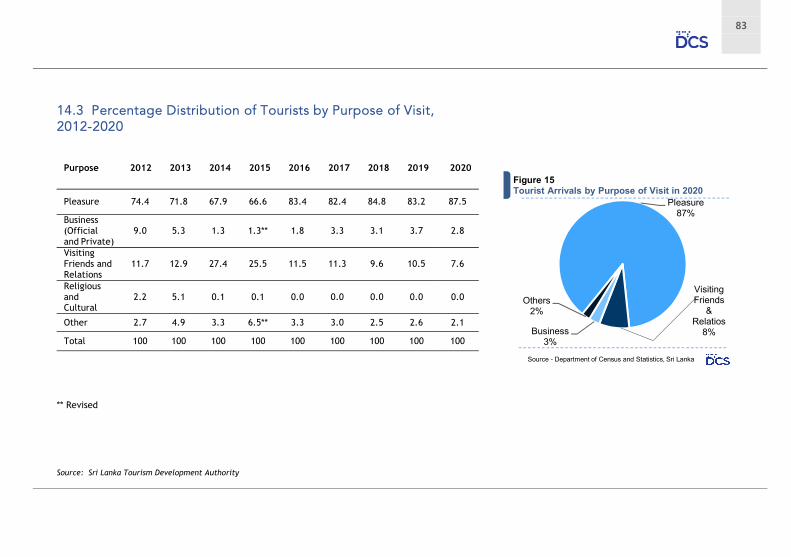
83
Purpose 2012 2013 2014 2015 2016 2017 2018 2019 2020
Pleasure 74.4 71.8 67.9 66.6 83.4 82.4 84.8 83.2 87.5
Business (Official and Private)
9.0 5.3 1.3 1.3** 1.8 3.3 3.1 3.7 2.8
Visiting Friends and Relations
11.7 12.9 27.4 25.5 11.5 11.3 9.6 10.5 7.6
Religious and Cultural
2.2 5.1 0.1 0.1 0.0 0.0 0.0 0.0 0.0
Other 2.7 4.9 3.3 6.5** 3.3 3.0 2.5 2.6 2.1
Total 100 100 100 100 100 100 100 100 100
** Revised Source: Sri Lanka Tourism Development Authority
Pleasure87%
Visiting Friends
& Relatios
8%Business3%
Others2%
Figure 15Tourist Arrivals by Purpose of Visit in 2020
Source - Department of Census and Statistics, Sri Lanka
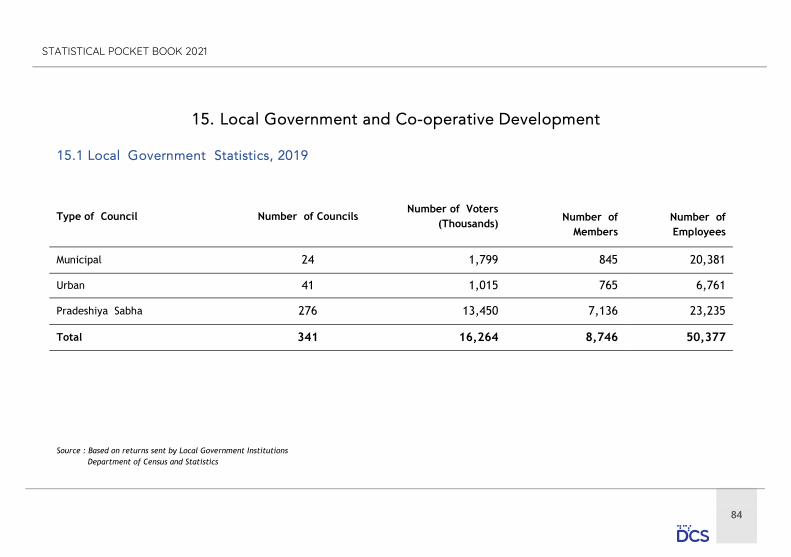
84
STATISTICAL POCKET BOOK 2021
Type of Council
Number of Councils
Number of Voters (Thousands)
Number of Members
Number of Employees
Municipal 24 1,799 845 20,381
Urban 41 1,015 765 6,761
Pradeshiya Sabha 276 13,450 7,136 23,235
Total 341 16,264 8,746 50,377
Source : Based on returns sent by Local Government Institutions Department of Census and Statistics

85
Type of Service Municipal Urban Pradeshiya Sabha
Total
Vehicular Road (Km) 4,824 3,673 130,920 139,417
Dispensaries 264 129 1,390 1,783
Cemeteries 162 148 9,372 9,682
Parks and Playground 383 226 1,879 2,488
Libraries 258 168 2,193 2,619
Source : Based on returns sent by Local Government Institutions Department of Census and Statistics

86
STATISTICAL POCKET BOOK 2021
(Number)
2017 2018 2019 2020
All Societies 10,098 9,546 9,044 10,240
Primary Societies Total 9,904 9,367 8,878 10,078 Credit 6,086 5,742 5,592 6,483 Agriculture 256 241 147 300 Industrial 238 210 182 258 School Co-operative 664 609 361 483 Multi-Purpose 304 270 266 277 Fisheries 935 873 898 916 Other Societies 1,421 1,422 1,432 1,361 Secondary Societies and Apex Level Unions Total 194 179 166 162 Banking Unions 35 33 19 16 National Co-operative Councils 1 5 1 0 District Co-operative Councils 25 28 26 22 Multi-Purpose Unions 21 4 3 5
Other Unions 112 109 117 119
Source : Department of Co-operative Development

87
2019 2020
Value % Value %
Total 78,043.45 100 118,231.79 100
Cultivation and Animal Husbandry 7188.50 9 9,955.93 8
Small Industries 8033.31 10 16,276.79 14
Housing and Electricity 23,033.88 29 34,787.46 29
Projects and Trade 11,540.23 14 23,822.82 20
Others 28,247.53 35 33,388.79 28
2017 2018 2019 2020
M.P.C. Societies 21,546 16,968
Rural Banks 13,020 17,524 6,701 6,007
Apex Unions 1,770 305 1,009 1,070
Sanasa 8,095 3,338 7,038 5,572
Other Societies(a) 4,883 2,418 4,914 4,256
Total 36,529 23,585 41,208 32,382
Source : Department of Co-operative Development (a) Textile/agri.industries
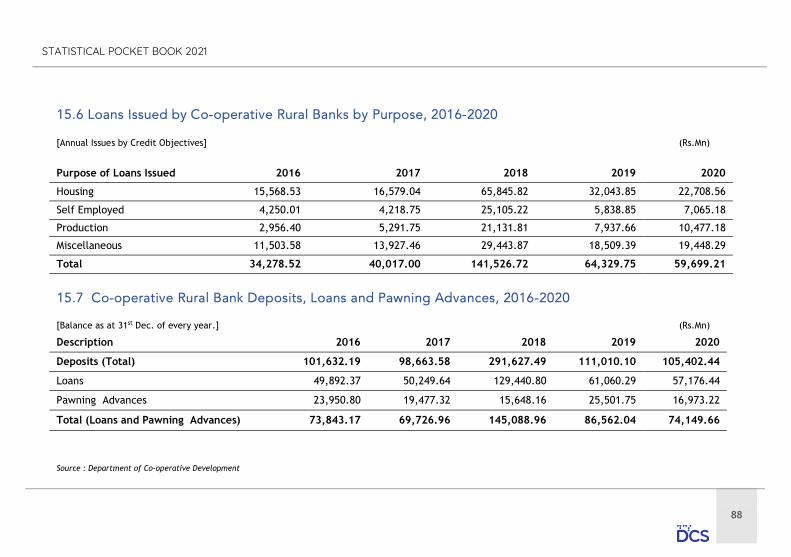
88
STATISTICAL POCKET BOOK 2021
[Annual Issues by Credit Objectives] (Rs.Mn)
Purpose of Loans Issued 2016 2017 2018 2019 2020
Housing 15,568.53 16,579.04 65,845.82 32,043.85 22,708.56
Self Employed 4,250.01 4,218.75 25,105.22 5,838.85 7,065.18
Production 2,956.40 5,291.75 21,131.81 7,937.66 10,477.18
Miscellaneous 11,503.58 13,927.46 29,443.87 18,509.39 19,448.29
Total 34,278.52 40,017.00 141,526.72 64,329.75 59,699.21
[Balance as at 31st Dec. of every year.] (Rs.Mn)
Description 2016 2017 2018 2019 2020
Deposits (Total) 101,632.19 98,663.58 291,627.49 111,010.10 105,402.44
Loans 49,892.37 50,249.64 129,440.80 61,060.29 57,176.44
Pawning Advances 23,950.80 19,477.32 15,648.16 25,501.75 16,973.22
Total (Loans and Pawning Advances) 73,843.17 69,726.96 145,088.96 86,562.04 74,149.66
Source : Department of Co-operative Development
STATISTICALPOCKET BOOK
Department of Census and StatisticsMinistry of Economic policies & Plan Implementation
2021
SRI LANKA STATISTICAL POCKET BOOK 2021
STATISTICAL POCKETBOOK2021
Ministry of Economicpolicies & PlanImplementation
Department of Census and Statistics
ISBN : 978-955-702-233-8
The Vision of DCS
“To be the leader in the region in producing
timely statistical information to achieve the
country’s development goals.”
“Making contribution in the socioeconomic development of
the country by providing accurate timely statistics, more
Effectively by means of new technology, and utilising the
services of dedicated staff under a strategic leadership to
become a prosperous nation in the globalised environment.”
The Mission of DCS [email protected]
+94 11 2147000
+94 11 2147400
+94 11 2147011
Department of Census & Statistics
Sankyana Mandiraya
No. 306/71, Polduwa Road,
Battaramulla.
www.statistics.gov.lk
Related Documents