This article has been accepted for inclusion in a future issue of this journal. Content is final as presented, with the exception of pagination. IEEE TRANSACTIONS ON MICROWAVE THEORY AND TECHNIQUES 1 Statistical Distribution of EVM Measurements for Direct-Modulation Radio-Over-Fiber Links Transporting OFDM Signals Philippos Assimakopoulos, Anthony Nkansah, Nathan J. Gomes, Senior Member, IEEE, and David Wake, Member, IEEE Abstract—The effect of distortion on the error vector magni- tude (EVM) performance of orthogonal frequency-division mul- tiplexing (OFDM) signals with different numbers of subcarriers and the connection to the peak-to-average power ratio (PAPR) of such signals is investigated. A low-cost and low-complexity directly modulated radio-over-fiber link is used in experiments as an ex- ample of a link limited by distortion. Statistical distributions of the EVM over a large number of transmitted OFDM frames are gained from experimental measurements and analyses of idealized processes. The measurement results show that as the number of subcarriers is reduced, the distribution means are more affected by extreme values. This effect results in mean EVMs for signals with different numbers of subcarriers that are not dependent in the ex- pected way on the statistical PAPR of the transmitted OFDM sig- nals. Instead, it is shown that in regions of moderate distortion, the median of the EVM is more closely related to the statistical PAPR and to the required back-off for signals with different numbers of subcarriers. Index Terms—Error vector magnitude (EVM), orthogonal fre- quency division multiplexing (OFDM), radio-over-fiber (RoF). I. INTRODUCTION P REVIOUS WORK has shown that intensity modu- lated and directly detected (IM-DD) radio-over-fiber (RoF) links with external or direct modulation can offer good performance when transporting wireless signals employing orthogonal frequency division muliplexing (OFDM) modula- tion in the microwave and millimeter-wave frequency ranges. Examples of this approach include the transport of signals conforming to WiMAX and WiFi standards at microwave [1]–[4] and millimeter-wave [5], [6] frequencies, as well as those proposed for future mobile standards [7]. A metric that is often used in the literature for quantifying the performance of such links is the error vector magnitude (EVM) [1]–[6]. One of the limitations in the dynamic range of IM-DD architectures comes from distortion arising from nonlinear com- ponents in the transport architecture. Manuscript received July 12, 2012; revised December 23, 2012; accepted Jan- uary 02, 2013. This work was supported in part by the European Union project “FUTON” (FP7-ICT-2007-215533). The authors are with the Broadband and Wireless Communications Group, University of Kent, Canterbury CT2 7NT, U.K. (e-mail: [email protected]). Color versions of one or more of the figures in this paper are available online at http://ieeexplore.ieee.org. Digital Object Identifier 10.1109/TMTT.2013.2247615 In the case of directly modulated IM-DD links with transmis- sion at microwave frequencies and short-to-medium reach, the major source of nonlinearity is the laser diode [8]. The transmission of OFDM signals through nonlinearities has been investigated extensively in the literature by using clipping and other simple nonlinear models [9]–[14]. Specifically for RoF implementations, the effects of the non- linearity of a Mach–Zehnder external modulator [15], [16] and that of a directly modulated laser diode using a simple polyno- mial model and making use of the output autocorrelation func- tion [17] have been investigated, while in [18], a comparison between a clipping function and such an RoF link with a laser diode at low bias was carried out. However, very little work [14], [19] has been carried out on exploring the effects of different numbers of subcarriers, and whether this results in a variation of required input power back-off due to changes in the peak-to-average power ratio (PAPR). In [19], a difference in back-off from the 1-dB com- pression point of 0.5 dB at 4% EVM between 64–2048 OFDM subcarriers was reported for a directly modulated RoF link. However, this comparison was not optimized for exploring the effects of different numbers of subcarriers. Different signal generation and equalization techniques were used and the comparison was carried out over a relatively small number of transmitted OFDM frames. In this paper, the goal is to investigate whether differences in the PAPR between signals with different numbers of subcar- riers lead to differences in the input power back-off required to maintain EVM performance. Section II covers the basic theory of OFDM and presents the predictions of the statistical PAPR for different numbers of OFDM subcarriers. Statistical analyses of the measured EVM results are then carried out from two per- spectives: the first examines the distribution of the mean EVM in each transmitted OFDM frame; the second examines the dis- tribution of the EVM of every subcarrier in all of the transmitted frames. The methodology is described in Section III. Section IV describes the RoF link-based measurement setup and presents EVM measurement results. Sections V and VI then present the results of the statistical analyses on the measured EVM for the two distributions of interest. Note that while the mean of the EVM can in principle be es- timated analytically (from the signal-to-noise ratio) using sta- tistical models [12], [15], [17], [18], [20], the aim here is to obtain the EVM distributions directly from measurements and 0018-9480/$31.00 © 2013 IEEE

Welcome message from author
This document is posted to help you gain knowledge. Please leave a comment to let me know what you think about it! Share it to your friends and learn new things together.
Transcript
This article has been accepted for inclusion in a future issue of this journal. Content is final as presented, with the exception of pagination.
IEEE TRANSACTIONS ON MICROWAVE THEORY AND TECHNIQUES 1
Statistical Distribution of EVM Measurementsfor Direct-Modulation Radio-Over-FiberLinks Transporting OFDM Signals
Philippos Assimakopoulos, Anthony Nkansah, Nathan J. Gomes, Senior Member, IEEE, andDavid Wake, Member, IEEE
Abstract—The effect of distortion on the error vector magni-tude (EVM) performance of orthogonal frequency-division mul-tiplexing (OFDM) signals with different numbers of subcarriersand the connection to the peak-to-average power ratio (PAPR) ofsuch signals is investigated. A low-cost and low-complexity directlymodulated radio-over-fiber link is used in experiments as an ex-ample of a link limited by distortion. Statistical distributions ofthe EVM over a large number of transmitted OFDM frames aregained from experimental measurements and analyses of idealizedprocesses. The measurement results show that as the number ofsubcarriers is reduced, the distributionmeans aremore affected byextreme values. This effect results in mean EVMs for signals withdifferent numbers of subcarriers that are not dependent in the ex-pected way on the statistical PAPR of the transmitted OFDM sig-nals. Instead, it is shown that in regions of moderate distortion, themedian of the EVM is more closely related to the statistical PAPRand to the required back-off for signals with different numbers ofsubcarriers.
Index Terms—Error vector magnitude (EVM), orthogonal fre-quency division multiplexing (OFDM), radio-over-fiber (RoF).
I. INTRODUCTION
P REVIOUS WORK has shown that intensity modu-lated and directly detected (IM-DD) radio-over-fiber
(RoF) links with external or direct modulation can offer goodperformance when transporting wireless signals employingorthogonal frequency division muliplexing (OFDM) modula-tion in the microwave and millimeter-wave frequency ranges.Examples of this approach include the transport of signalsconforming to WiMAX and WiFi standards at microwave[1]–[4] and millimeter-wave [5], [6] frequencies, as well asthose proposed for future mobile standards [7].A metric that is often used in the literature for quantifying the
performance of such links is the error vector magnitude (EVM)[1]–[6]. One of the limitations in the dynamic range of IM-DDarchitectures comes from distortion arising from nonlinear com-ponents in the transport architecture.
Manuscript received July 12, 2012; revisedDecember 23, 2012; accepted Jan-uary 02, 2013. This work was supported in part by the European Union project“FUTON” (FP7-ICT-2007-215533).The authors are with the Broadband and Wireless Communications Group,
University of Kent, Canterbury CT2 7NT, U.K. (e-mail: [email protected]).Color versions of one or more of the figures in this paper are available online
at http://ieeexplore.ieee.org.Digital Object Identifier 10.1109/TMTT.2013.2247615
In the case of directly modulated IM-DD links with transmis-sion at microwave frequencies and short-to-medium reach, themajor source of nonlinearity is the laser diode [8].The transmission of OFDM signals through nonlinearities has
been investigated extensively in the literature by using clippingand other simple nonlinear models [9]–[14].Specifically for RoF implementations, the effects of the non-
linearity of a Mach–Zehnder external modulator [15], [16] andthat of a directly modulated laser diode using a simple polyno-mial model and making use of the output autocorrelation func-tion [17] have been investigated, while in [18], a comparisonbetween a clipping function and such an RoF link with a laserdiode at low bias was carried out.However, very little work [14], [19] has been carried out
on exploring the effects of different numbers of subcarriers,and whether this results in a variation of required input powerback-off due to changes in the peak-to-average power ratio(PAPR). In [19], a difference in back-off from the 1-dB com-pression point of 0.5 dB at 4% EVM between 64–2048 OFDMsubcarriers was reported for a directly modulated RoF link.However, this comparison was not optimized for exploring theeffects of different numbers of subcarriers. Different signalgeneration and equalization techniques were used and thecomparison was carried out over a relatively small number oftransmitted OFDM frames.In this paper, the goal is to investigate whether differences
in the PAPR between signals with different numbers of subcar-riers lead to differences in the input power back-off required tomaintain EVM performance. Section II covers the basic theoryof OFDM and presents the predictions of the statistical PAPRfor different numbers of OFDM subcarriers. Statistical analysesof the measured EVM results are then carried out from two per-spectives: the first examines the distribution of the mean EVMin each transmitted OFDM frame; the second examines the dis-tribution of the EVM of every subcarrier in all of the transmittedframes. The methodology is described in Section III. Section IVdescribes the RoF link-based measurement setup and presentsEVM measurement results. Sections V and VI then present theresults of the statistical analyses on the measured EVM for thetwo distributions of interest.Note that while the mean of the EVM can in principle be es-
timated analytically (from the signal-to-noise ratio) using sta-tistical models [12], [15], [17], [18], [20], the aim here is toobtain the EVM distributions directly from measurements and
0018-9480/$31.00 © 2013 IEEE
This article has been accepted for inclusion in a future issue of this journal. Content is final as presented, with the exception of pagination.
2 IEEE TRANSACTIONS ON MICROWAVE THEORY AND TECHNIQUES
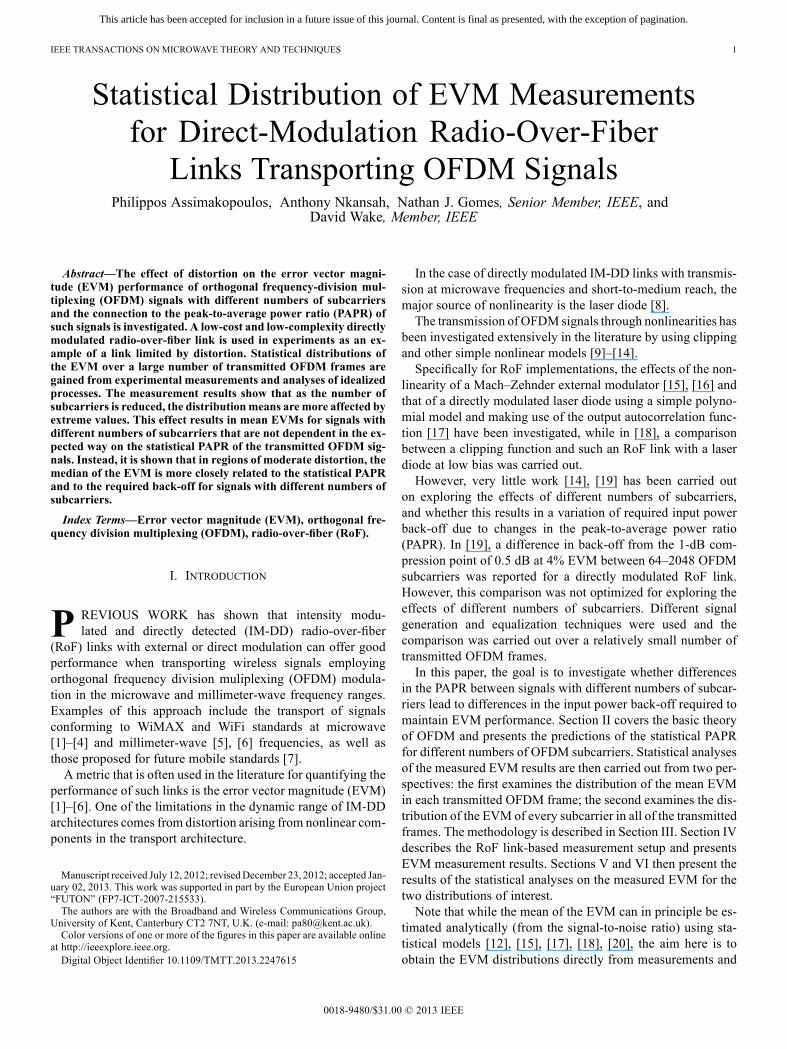
Fig. 1. OFDM transmitter and receiver architectures.
avoid any inherent approximations resulting from such a mod-eling process.
II. OFDM AND PAPR THEORY
The objective of this section is to examine the variation ofPAPRwith the number of OFDM subcarriers. Once this is done,the PAPR results can be related to the EVM performance to bepresented in the following sections.A simplified block diagram for the transmitter and receiver
sections of an OFDM system is shown in Fig. 1. Upper casecharacters are used for frequency-domain samples, while lowercase characters are used for time-domain samples. The inputdata bits arrive at a certain rate , go through a serial-to-parallel (S/P) conversion, and are mapped to quadrature am-plitude modulation (QAM) constellation points. The resultingQAM symbols form the vector of frequency-domain samples
. At this point, the rate of the samples is re-duced by the inverse fast Fourier transform (IFFT) size. The fre-quency-domain samples then go through the IFFT block, whichproduces the vector of time-domain samples .After parallel-to-serial (P/S) conversion, a cyclic prefix (CP) isappended at the beginning of each OFDM symbol. The resultingframes (note that the term “frame” is used here to denote anOFDM symbol that has a CP appended to it) then go through adigital-to-analog converter (DAC) before being up-converted topassband (modulating the RF carrier) for transmission througha physical channel. At the receiver, the opposite processes arecarried out to retrieve the original QAM symbols.The output of the IFFT modulator is given by [22]
(1)
where are the time-domain samples and are the fre-quency-domain samples at the output and input of the IFFTblock, respectively.The absolute PAPR over one OFDM frame before the DAC
is given by [23]
(2)
where is the expectation operator.In the case of quadrature phase-shift keying (QPSK) modu-
lation, the equality in (2) is obtained when have the samephase. The term absolute is used here to differentiate this quan-tity from the statistical PAPR that will be presented shortly.From (2), the absolute PAPR with QPSK modulation will havea value of . For example, for a 256-subcarrier system, theabsolute PAPR will be equal to 24.1 dB. However, all the car-riers being in phase is a highly improbable condition, and there-fore it is usually neglected. System designers usually assumePAPR values that are more practical and stem from a statisticalanalysis of the signal waveform. Assuming the underlying pro-cesses acting on the in-phase and quadrature components of (1)are independent and identically distributed (i.i.d.), the willalso be i.i.d. As the number of subcarriers increases, the centrallimit theorem (CLT) ([21, p. 214]) can be invoked: in-phase andquadrature components tend to zero mean Gaussian variableswith variance . The envelope, , corresponding tothe magnitude of the uncorrelated in-phase and quadrature com-ponents becomes Rayleigh distributed with parameter . Thecomplementary cumulative distribution function (CCDF) of thePAPR over samples at the output of the IFFT modulator willbe given by [23]
(3)
where . For , (3) gives the statistical PAPRper OFDM frame.When the OFDM signal goes through the DAC (assuming it
has sufficient dynamic range and does not itself limit the peaks),
This article has been accepted for inclusion in a future issue of this journal. Content is final as presented, with the exception of pagination.
ASSIMAKOPOULOS et al.: STATISTICAL DISTRIBUTION OF EVM MEASUREMENTS FOR DIRECT-MODULATION RoF LINKS TRANSPORTING OFDM SIGNALS 3
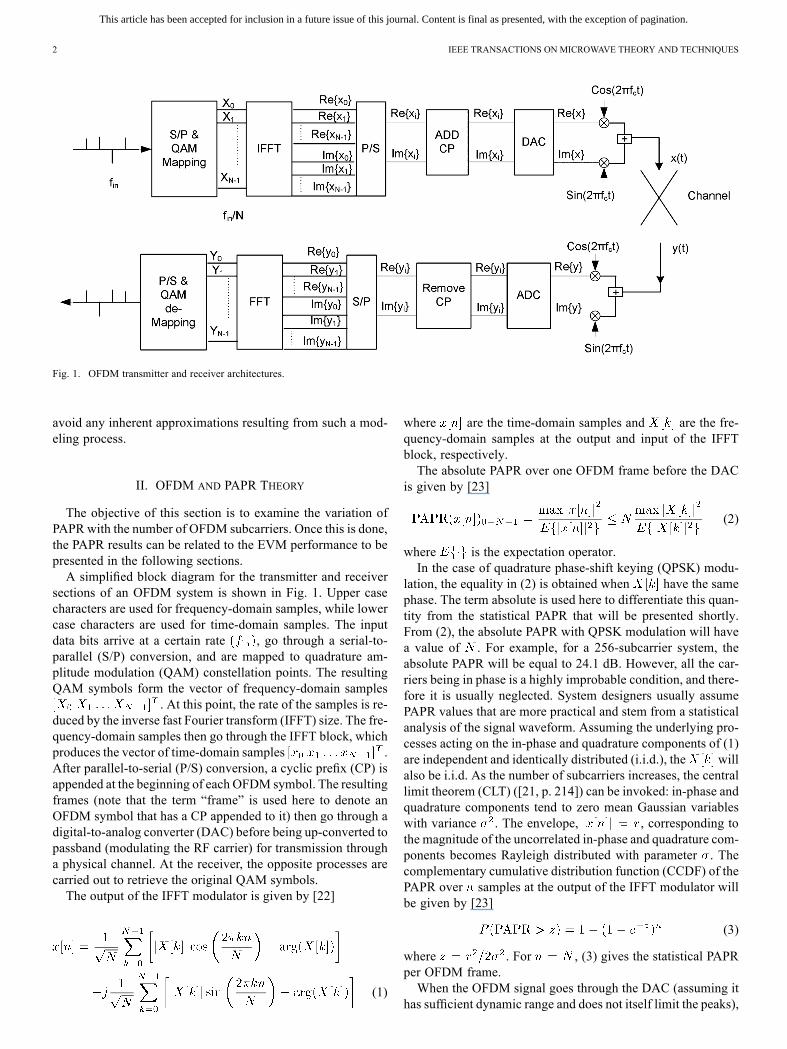
Fig. 2. CCDF plots of the PAPR of the up-converted OFDM signal. Solid linesare the theoretical results from (5), point traces are simulation results.
some peak regrowth may occur [23]. This can be avoided withthe use of oversampling. In that case, (3) will underestimate thePAPR, and for this reason, a factor, determined by simulations,is used in [24] to increase .Equation (3) describes the statistics of the PAPR of the
baseband OFDM signal, but in RoF systems it is the up-con-verted signal (modulating an RF carrier) that modulates thelaser diode. The up-converted signal can be described as anarrowband random process of the form [25]
(4)
where is the phase with a uniform distributionand is the RF carrier frequency. As (4) comprises the mul-tiplication of two random variables, the envelope, , with aRayleigh distribution, and the random phase, , with a co-sine distribution, the resulting distribution is Gaussian. Thus,the CCDF of the PAPR per OFDM frame can be given directlyin terms of the Gaussian distribution of the up-converted signal
(5)
where is the error function, , and is a factorempirically estimated (through simulations).Fig. 2 shows the statistical PAPR given by (5) for 128 sub-
carriers , 512 subcarriers , 2048 subcarriers, and 4096 subcarriers . Also shown, for com-
parison, is the PAPR obtained from a simulation in MATLAB,carried out by generating, oversampling by a factor of 4, andup-converting 4000 frames for each IFFT size, and by then cal-culating the PAPR for each frame. The factor, , and the one in[24] are related. The main difference between them is that, in[24], it is used to fit the baseband PAPR, while in this paper, itis used for the passband PAPR. Also, in [24], the authors pro-vide a single value for this correction factor for all IFFT sizes (asingle value that provides the closest match between theoreticaland simulation results for all IFFT sizes), while in this paper, adifferent value is given for this factor for each IFFT size.The probability distribution function (PDF) of the PAPR is
given by
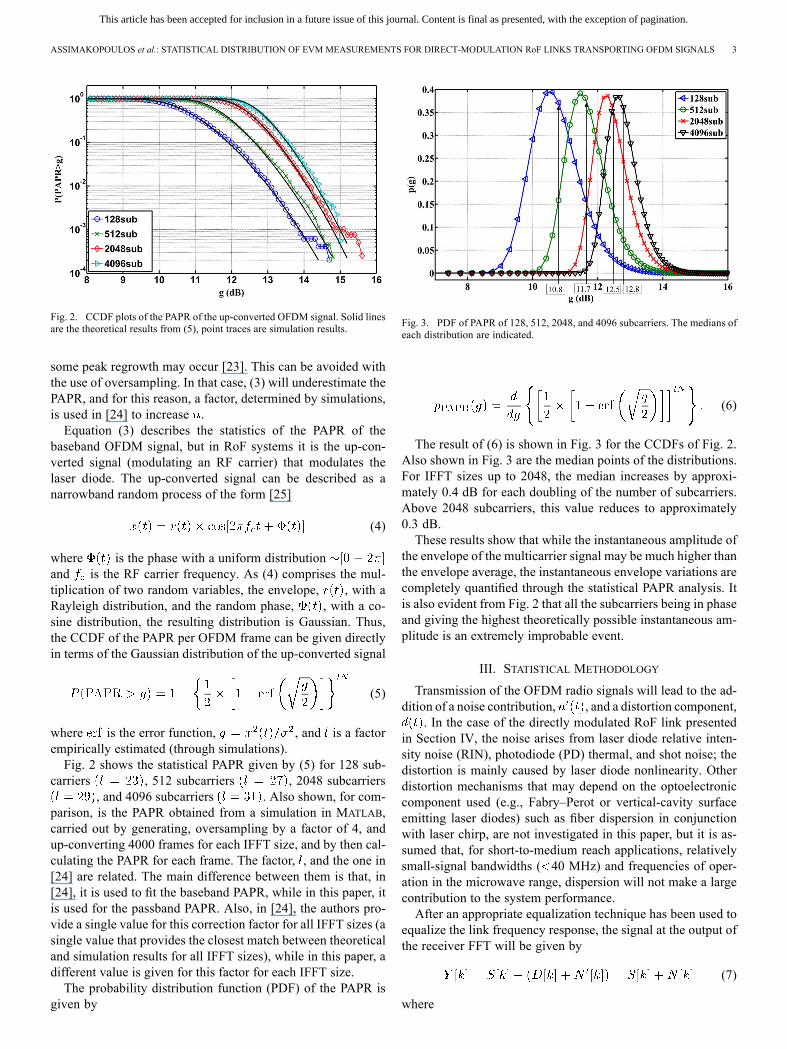
Fig. 3. PDF of PAPR of 128, 512, 2048, and 4096 subcarriers. The medians ofeach distribution are indicated.
(6)
The result of (6) is shown in Fig. 3 for the CCDFs of Fig. 2.Also shown in Fig. 3 are the median points of the distributions.For IFFT sizes up to 2048, the median increases by approxi-mately 0.4 dB for each doubling of the number of subcarriers.Above 2048 subcarriers, this value reduces to approximately0.3 dB.These results show that while the instantaneous amplitude of
the envelope of the multicarrier signal may be much higher thanthe envelope average, the instantaneous envelope variations arecompletely quantified through the statistical PAPR analysis. Itis also evident from Fig. 2 that all the subcarriers being in phaseand giving the highest theoretically possible instantaneous am-plitude is an extremely improbable event.
III. STATISTICAL METHODOLOGY
Transmission of the OFDM radio signals will lead to the ad-dition of a noise contribution, , and a distortion component,
. In the case of the directly modulated RoF link presentedin Section IV, the noise arises from laser diode relative inten-sity noise (RIN), photodiode (PD) thermal, and shot noise; thedistortion is mainly caused by laser diode nonlinearity. Otherdistortion mechanisms that may depend on the optoelectroniccomponent used (e.g., Fabry–Perot or vertical-cavity surfaceemitting laser diodes) such as fiber dispersion in conjunctionwith laser chirp, are not investigated in this paper, but it is as-sumed that, for short-to-medium reach applications, relativelysmall-signal bandwidths ( 40 MHz) and frequencies of oper-ation in the microwave range, dispersion will not make a largecontribution to the system performance.After an appropriate equalization technique has been used to
equalize the link frequency response, the signal at the output ofthe receiver FFT will be given by
(7)
where

This article has been accepted for inclusion in a future issue of this journal. Content is final as presented, with the exception of pagination.
4 IEEE TRANSACTIONS ON MICROWAVE THEORY AND TECHNIQUES
Fig. 4. Diagram showing how the EVM measurement results are interpreted for the employed statistical methodology.
(8)
(9)
The first part on the right-hand side of (7) represents theuseful signal sample, , while the terms in brackets repre-sent the samples of the distortion, , and noise contributions,
, at the location of subcarrier . Equation (7) assumes anadditive noise process that is uncorrelated with the output signal.This assumption is only valid for an input whose amplitude fol-lows a Gaussian distribution [9], [10]. It does not hold otherwise(e.g., for single-carrier QAM).There are two statistical distributions of interest. The first is
the distribution of the mean EVM of every transmitted OFDMframe (where each mean EVM value is obtained by averagingacross the EVM values of all the subcarriers within the frame).This distribution is termed the EVM per frame distribution. Thesecond is the distribution of all of the EVM values, i.e., of everyOFDM subcarrier in every transmitted OFDM frame. This istermed the raw EVM distribution. Fig. 4 shows how the resultsfrom an EVM measurement are interpreted for the analysis thatwill follow. A long time series of EVM measurements is ob-tained. Each of these measurements is a raw EVMvalue (to ). As the OFDM signal demodulation is inherentlydone per frame, there are sets of contiguous values from thistime series, which are from the same frame, where is thenumber of data subcarriers in themeasured OFDM frame. In thisway, the measurements are partitioned into sample sizes equalto the number of data subcarriers in the received OFDM frame.Therefore, in addition to the raw EVM values, a set ofmean values are obtained, which represent the EVM per framevalues. The raw EVM values within each frame correspond todifferent frequencies within the signal band and are “received”simultaneously (as they belong to the same frame), but due tothe P/S conversion in the receiver section of Fig. 1, these mea-surements are separated in time. The EVM for subcarrier isgiven by
tendsRayleigh
for (10)
where is the power of the total noise sample (i.e., in-cluding distortion and other noise contributions) in subcarrier
is the mean power of the constellation and is the stan-dard deviation of the in-phase and quadrature components of thetotal noise contribution.Note that now the frequency index is replaced with the index, to reflect the change to a time-domain representation for themeasurement results in accordance with the representation ofFig. 4. The real and imaginary components in the numerator of(10) will tend to Gaussian distributions due to the averaging inthe receiver fast Fourier transform (FFT) and the CLT, as islarge. Therefore, the numerator being the magnitude of the twocomponents will tend to a Rayleigh distribution. Since this isat the output of the FFT, the term is the root-mean-squarevoltage of the constellation.The measured EVM per frame is the arithmetic mean over a
whole frame
tends
for (11)
where is the number of data subcarriers in the frame.Assuming that the raw EVM is an i.i.d. process, with meanand variance , the EVM per frame will have a mean
and variance given by
(12)
(13)
Equations (12) and (13) are a direct result of the Weak Lawof Large Numbers [21]. They show that the EVM per frame willhave a variance inversely dependent on the number of subcar-riers, and a mean equal to the mean of the raw EVMdistribution.In terms of estimation theory, it can be said that is an unbi-ased estimator of the mean of the raw EVM, while is a biasedestimator of the variance of the raw EVM. Additionally, asis large, due to the CLT, the distribution of the EVM per framewill converge to a Gaussian distribution.In the literature, it is often assumed that the effects of dis-
tortion (above some input power level) are equivalent to thoseof an i.i.d. white noise process [20], [26]. But, when distortion
This article has been accepted for inclusion in a future issue of this journal. Content is final as presented, with the exception of pagination.
ASSIMAKOPOULOS et al.: STATISTICAL DISTRIBUTION OF EVM MEASUREMENTS FOR DIRECT-MODULATION RoF LINKS TRANSPORTING OFDM SIGNALS 5
Fig. 5. Detailed flowchart of the measurement procedure. RF amplifier: RFAmp. Laser diode: LD. Photodiode: PD.
takes effect, this assumption may not hold. The aim of the fol-lowing sections is to see whether (and under which conditions)the raw EVM distribution will converge to a Rayleigh distribu-tion in accordance with (10) and whether the EVM per framewill conform to (12) and (13), and also converge to a Gaussiandistribution.
IV. EXPERIMENTAL MEASUREMENTS
The measurement setup and procedure are illustratedin Fig. 5. The baseband OFDM signal is generated inMATLAB-Simulink and is then downloaded to an Agilentvector signal generator (VSG), which performs RF up-conver-sion. The up-converted signal directly modulates a Teradiandistributed feedback (DFB) laser and the resulting modu-lated light is transmitted through a 10-dB optical attenuator(emulating optical losses in fiber, connectors, etc.) and shortlength of fiber patch-cord before being directly received byan Appointech p-i-n PD. The optical attenuator also ensuresthat the PD is not saturated by the incident optical signal. AnRF amplifier is used at the input of the optical link in orderto control the input RF power into the laser diode. The signalis then received by an Agilent vector signal analyzer (VSA)where it is down-converted and saved as a MATLAB data file foroffline signal processing. Note that the VSG and VSA internalattenuators were set such that their DAC and analog-to-digitalconverter, respectively, are not driven into saturation by theinput OFDM signal. The offline processing includes timingsynchronization, blind equalization, and blind frequency offsetcorrection. The generated OFDM signals have a bandwidth of20 MHz and the RF frequency is 1.4 GHz. The ratio of datacarriers to zeros (null subcarriers) is based on the WiMAXspecifications [27], except for the case of 128 subcarriers,where 16 zeros are used. A short CP is used at a ratio of 1/8 ofthe symbol duration. Any distortion observed will be mainlydue to the laser diode, as both the VSG and RF amplifier wereoperated far below their individual compression points. Theinput 1-dB compression point (P1 dB) of the RoF link with noRF amplifiers was measured as 19 dBm.The measured results in this section are obtained as follows:
at every RF input power, 450OFDM frames are transmitted, andfor each frame, the mean EVM is calculated by averaging acrossthe EVM values of all the subcarriers within the frame. The final
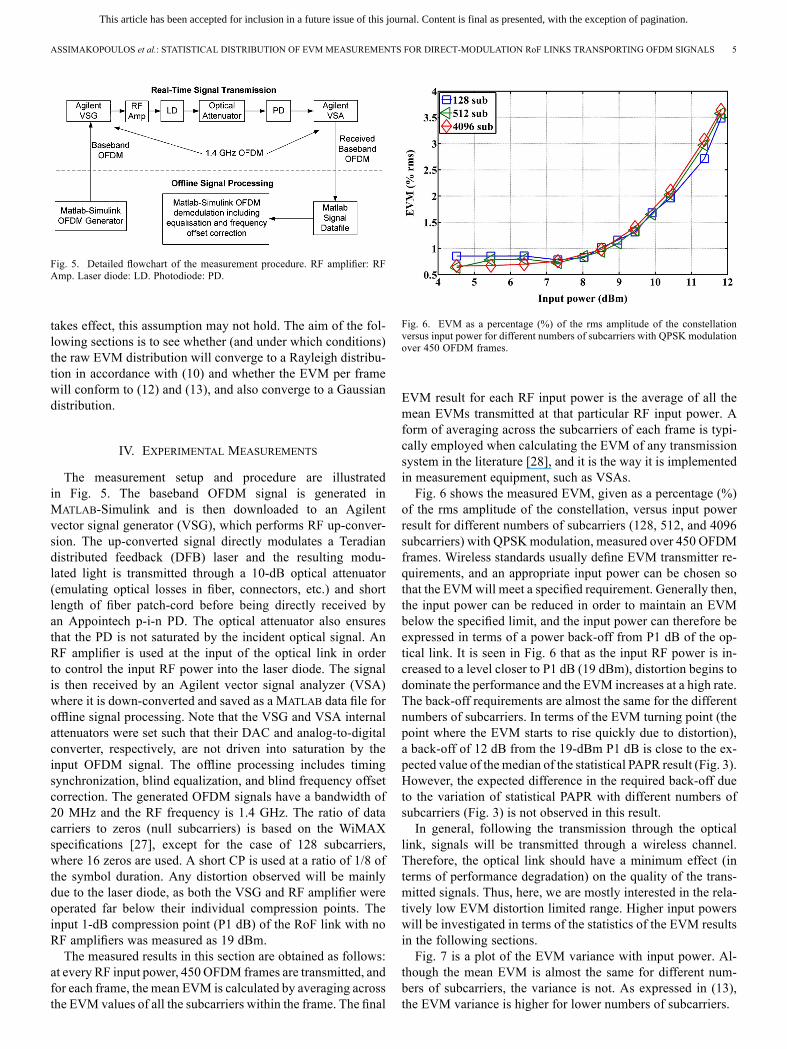
Fig. 6. EVM as a percentage (%) of the rms amplitude of the constellationversus input power for different numbers of subcarriers with QPSK modulationover 450 OFDM frames.
EVM result for each RF input power is the average of all themean EVMs transmitted at that particular RF input power. Aform of averaging across the subcarriers of each frame is typi-cally employed when calculating the EVM of any transmissionsystem in the literature [28], and it is the way it is implementedin measurement equipment, such as VSAs.Fig. 6 shows the measured EVM, given as a percentage (%)
of the rms amplitude of the constellation, versus input powerresult for different numbers of subcarriers (128, 512, and 4096subcarriers) with QPSKmodulation, measured over 450 OFDMframes. Wireless standards usually define EVM transmitter re-quirements, and an appropriate input power can be chosen sothat the EVMwill meet a specified requirement. Generally then,the input power can be reduced in order to maintain an EVMbelow the specified limit, and the input power can therefore beexpressed in terms of a power back-off from P1 dB of the op-tical link. It is seen in Fig. 6 that as the input RF power is in-creased to a level closer to P1 dB (19 dBm), distortion begins todominate the performance and the EVM increases at a high rate.The back-off requirements are almost the same for the differentnumbers of subcarriers. In terms of the EVM turning point (thepoint where the EVM starts to rise quickly due to distortion),a back-off of 12 dB from the 19-dBm P1 dB is close to the ex-pected value of themedian of the statistical PAPR result (Fig. 3).However, the expected difference in the required back-off dueto the variation of statistical PAPR with different numbers ofsubcarriers (Fig. 3) is not observed in this result.In general, following the transmission through the optical
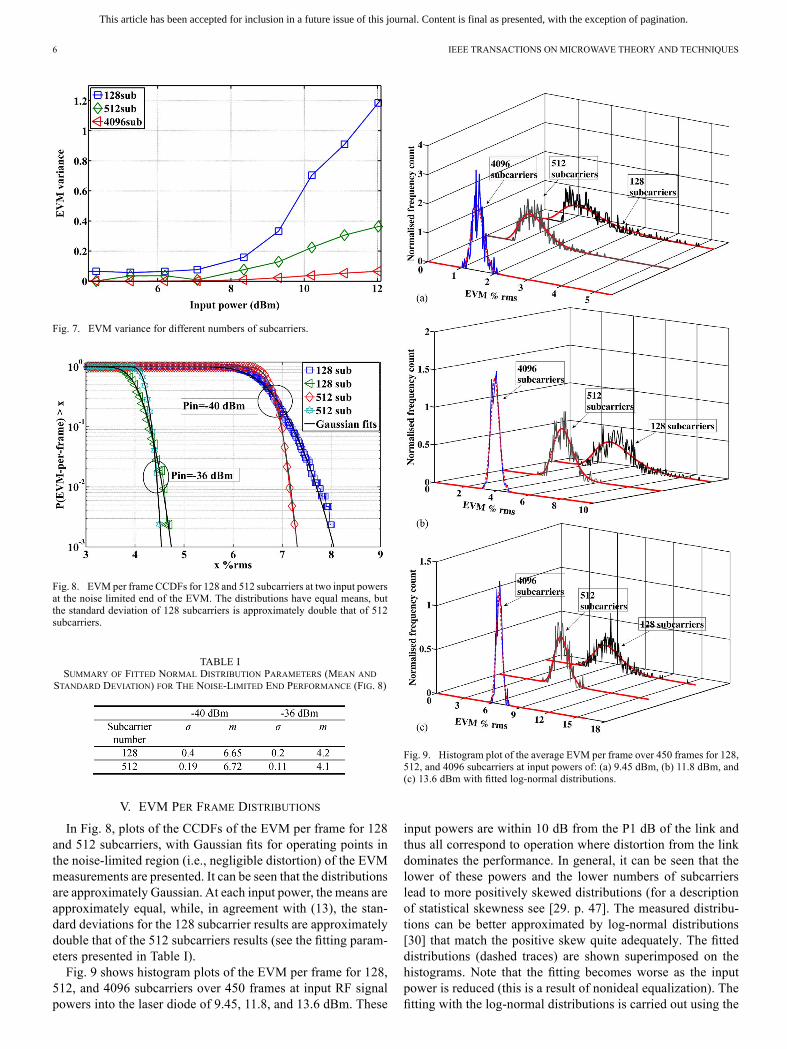
link, signals will be transmitted through a wireless channel.Therefore, the optical link should have a minimum effect (interms of performance degradation) on the quality of the trans-mitted signals. Thus, here, we are mostly interested in the rela-tively low EVM distortion limited range. Higher input powerswill be investigated in terms of the statistics of the EVM resultsin the following sections.Fig. 7 is a plot of the EVM variance with input power. Al-
though the mean EVM is almost the same for different num-bers of subcarriers, the variance is not. As expressed in (13),the EVM variance is higher for lower numbers of subcarriers.
This article has been accepted for inclusion in a future issue of this journal. Content is final as presented, with the exception of pagination.
6 IEEE TRANSACTIONS ON MICROWAVE THEORY AND TECHNIQUES
Fig. 7. EVM variance for different numbers of subcarriers.
Fig. 8. EVM per frame CCDFs for 128 and 512 subcarriers at two input powersat the noise limited end of the EVM. The distributions have equal means, butthe standard deviation of 128 subcarriers is approximately double that of 512subcarriers.
TABLE ISUMMARY OF FITTED NORMAL DISTRIBUTION PARAMETERS (MEAN AND
STANDARD DEVIATION) FOR THE NOISE-LIMITED END PERFORMANCE (FIG. 8)
V. EVM PER FRAME DISTRIBUTIONS
In Fig. 8, plots of the CCDFs of the EVM per frame for 128and 512 subcarriers, with Gaussian fits for operating points inthe noise-limited region (i.e., negligible distortion) of the EVMmeasurements are presented. It can be seen that the distributionsare approximately Gaussian. At each input power, the means areapproximately equal, while, in agreement with (13), the stan-dard deviations for the 128 subcarrier results are approximatelydouble that of the 512 subcarriers results (see the fitting param-eters presented in Table I).Fig. 9 shows histogram plots of the EVM per frame for 128,
512, and 4096 subcarriers over 450 frames at input RF signalpowers into the laser diode of 9.45, 11.8, and 13.6 dBm. These
Fig. 9. Histogram plot of the average EVM per frame over 450 frames for 128,512, and 4096 subcarriers at input powers of: (a) 9.45 dBm, (b) 11.8 dBm, and(c) 13.6 dBm with fitted log-normal distributions.
input powers are within 10 dB from the P1 dB of the link andthus all correspond to operation where distortion from the linkdominates the performance. In general, it can be seen that thelower of these powers and the lower numbers of subcarrierslead to more positively skewed distributions (for a descriptionof statistical skewness see [29. p. 47]. The measured distribu-tions can be better approximated by log-normal distributions[30] that match the positive skew quite adequately. The fitteddistributions (dashed traces) are shown superimposed on thehistograms. Note that the fitting becomes worse as the inputpower is reduced (this is a result of nonideal equalization). Thefitting with the log-normal distributions is carried out using the
This article has been accepted for inclusion in a future issue of this journal. Content is final as presented, with the exception of pagination.
ASSIMAKOPOULOS et al.: STATISTICAL DISTRIBUTION OF EVM MEASUREMENTS FOR DIRECT-MODULATION RoF LINKS TRANSPORTING OFDM SIGNALS 7
TABLE IISUMMARY OF FITTED LOG-NORMAL DISTRIBUTION PARAMETERS:
IS THE VARIANCE, IS THE MEDIAN, AND IS THE MEAN
Fig. 10. Comparison of measured CCDFs with normal CCDFs.
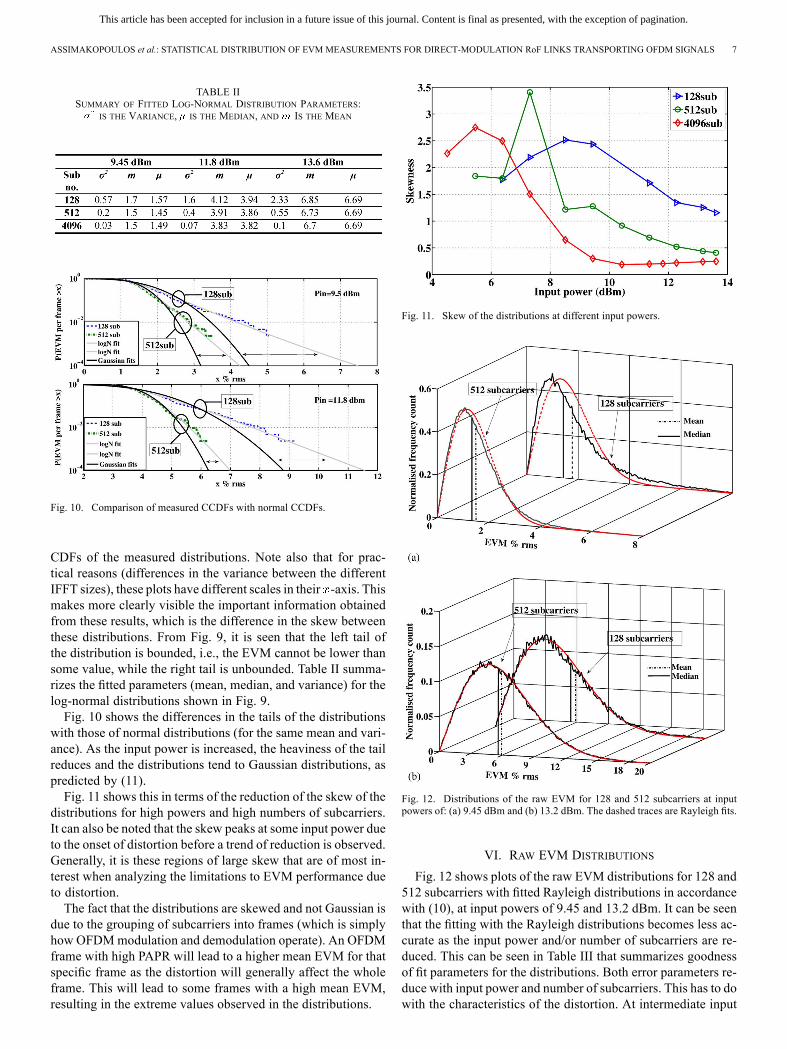
CDFs of the measured distributions. Note also that for prac-tical reasons (differences in the variance between the differentIFFT sizes), these plots have different scales in their -axis. Thismakes more clearly visible the important information obtainedfrom these results, which is the difference in the skew betweenthese distributions. From Fig. 9, it is seen that the left tail ofthe distribution is bounded, i.e., the EVM cannot be lower thansome value, while the right tail is unbounded. Table II summa-rizes the fitted parameters (mean, median, and variance) for thelog-normal distributions shown in Fig. 9.Fig. 10 shows the differences in the tails of the distributions
with those of normal distributions (for the same mean and vari-ance). As the input power is increased, the heaviness of the tailreduces and the distributions tend to Gaussian distributions, aspredicted by (11).Fig. 11 shows this in terms of the reduction of the skew of the
distributions for high powers and high numbers of subcarriers.It can also be noted that the skew peaks at some input power dueto the onset of distortion before a trend of reduction is observed.Generally, it is these regions of large skew that are of most in-terest when analyzing the limitations to EVM performance dueto distortion.The fact that the distributions are skewed and not Gaussian is
due to the grouping of subcarriers into frames (which is simplyhow OFDMmodulation and demodulation operate). An OFDMframe with high PAPR will lead to a higher mean EVM for thatspecific frame as the distortion will generally affect the wholeframe. This will lead to some frames with a high mean EVM,resulting in the extreme values observed in the distributions.
Fig. 11. Skew of the distributions at different input powers.
Fig. 12. Distributions of the raw EVM for 128 and 512 subcarriers at inputpowers of: (a) 9.45 dBm and (b) 13.2 dBm. The dashed traces are Rayleigh fits.
VI. RAW EVM DISTRIBUTIONS
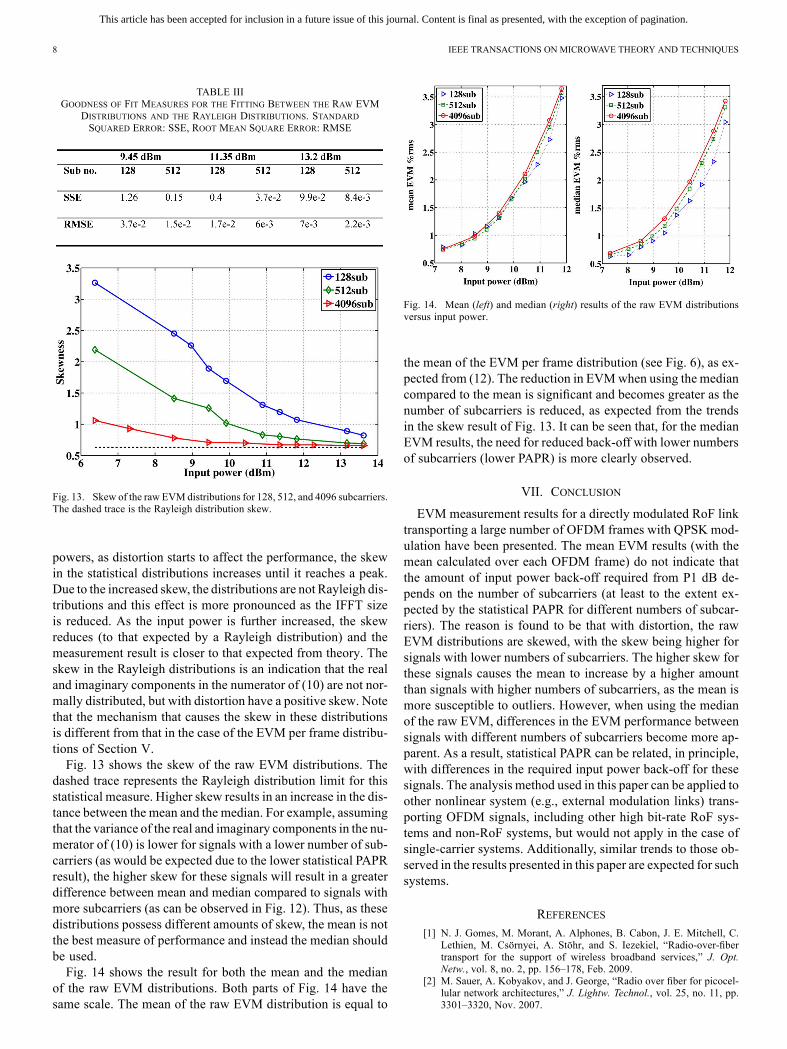
Fig. 12 shows plots of the raw EVM distributions for 128 and512 subcarriers with fitted Rayleigh distributions in accordancewith (10), at input powers of 9.45 and 13.2 dBm. It can be seenthat the fitting with the Rayleigh distributions becomes less ac-curate as the input power and/or number of subcarriers are re-duced. This can be seen in Table III that summarizes goodnessof fit parameters for the distributions. Both error parameters re-duce with input power and number of subcarriers. This has to dowith the characteristics of the distortion. At intermediate input
This article has been accepted for inclusion in a future issue of this journal. Content is final as presented, with the exception of pagination.
8 IEEE TRANSACTIONS ON MICROWAVE THEORY AND TECHNIQUES
TABLE IIIGOODNESS OF FIT MEASURES FOR THE FITTING BETWEEN THE RAW EVM
DISTRIBUTIONS AND THE RAYLEIGH DISTRIBUTIONS. STANDARDSQUARED ERROR: SSE, ROOT MEAN SQUARE ERROR: RMSE
Fig. 13. Skew of the raw EVM distributions for 128, 512, and 4096 subcarriers.The dashed trace is the Rayleigh distribution skew.
powers, as distortion starts to affect the performance, the skewin the statistical distributions increases until it reaches a peak.Due to the increased skew, the distributions are not Rayleigh dis-tributions and this effect is more pronounced as the IFFT sizeis reduced. As the input power is further increased, the skewreduces (to that expected by a Rayleigh distribution) and themeasurement result is closer to that expected from theory. Theskew in the Rayleigh distributions is an indication that the realand imaginary components in the numerator of (10) are not nor-mally distributed, but with distortion have a positive skew. Notethat the mechanism that causes the skew in these distributionsis different from that in the case of the EVM per frame distribu-tions of Section V.Fig. 13 shows the skew of the raw EVM distributions. The
dashed trace represents the Rayleigh distribution limit for thisstatistical measure. Higher skew results in an increase in the dis-tance between the mean and the median. For example, assumingthat the variance of the real and imaginary components in the nu-merator of (10) is lower for signals with a lower number of sub-carriers (as would be expected due to the lower statistical PAPRresult), the higher skew for these signals will result in a greaterdifference between mean and median compared to signals withmore subcarriers (as can be observed in Fig. 12). Thus, as thesedistributions possess different amounts of skew, the mean is notthe best measure of performance and instead the median shouldbe used.Fig. 14 shows the result for both the mean and the median
of the raw EVM distributions. Both parts of Fig. 14 have thesame scale. The mean of the raw EVM distribution is equal to
Fig. 14. Mean (left) and median (right) results of the raw EVM distributionsversus input power.
the mean of the EVM per frame distribution (see Fig. 6), as ex-pected from (12). The reduction in EVMwhen using the mediancompared to the mean is significant and becomes greater as thenumber of subcarriers is reduced, as expected from the trendsin the skew result of Fig. 13. It can be seen that, for the medianEVM results, the need for reduced back-off with lower numbersof subcarriers (lower PAPR) is more clearly observed.
VII. CONCLUSION
EVM measurement results for a directly modulated RoF linktransporting a large number of OFDM frames with QPSK mod-ulation have been presented. The mean EVM results (with themean calculated over each OFDM frame) do not indicate thatthe amount of input power back-off required from P1 dB de-pends on the number of subcarriers (at least to the extent ex-pected by the statistical PAPR for different numbers of subcar-riers). The reason is found to be that with distortion, the rawEVM distributions are skewed, with the skew being higher forsignals with lower numbers of subcarriers. The higher skew forthese signals causes the mean to increase by a higher amountthan signals with higher numbers of subcarriers, as the mean ismore susceptible to outliers. However, when using the medianof the raw EVM, differences in the EVM performance betweensignals with different numbers of subcarriers become more ap-parent. As a result, statistical PAPR can be related, in principle,with differences in the required input power back-off for thesesignals. The analysis method used in this paper can be applied toother nonlinear system (e.g., external modulation links) trans-porting OFDM signals, including other high bit-rate RoF sys-tems and non-RoF systems, but would not apply in the case ofsingle-carrier systems. Additionally, similar trends to those ob-served in the results presented in this paper are expected for suchsystems.
REFERENCES[1] N. J. Gomes, M. Morant, A. Alphones, B. Cabon, J. E. Mitchell, C.
Lethien, M. Csörnyei, A. Stöhr, and S. Iezekiel, “Radio-over-fibertransport for the support of wireless broadband services,” J. Opt.Netw., vol. 8, no. 2, pp. 156–178, Feb. 2009.
[2] M. Sauer, A. Kobyakov, and J. George, “Radio over fiber for picocel-lular network architectures,” J. Lightw. Technol., vol. 25, no. 11, pp.3301–3320, Nov. 2007.

This article has been accepted for inclusion in a future issue of this journal. Content is final as presented, with the exception of pagination.
ASSIMAKOPOULOS et al.: STATISTICAL DISTRIBUTION OF EVM MEASUREMENTS FOR DIRECT-MODULATION RoF LINKS TRANSPORTING OFDM SIGNALS 9
[3] Y. X. Guo, V. H. Pham, M. L. Yee, and L. C. Ong, “Improved radio-over-fiber transponder with multistage automatic gain control,” IEEETrans. Microw. Theory Techn., vol. 57, no. 11, pp. 2816–2823, Nov.2009.
[4] Z. Bouhamri, Y. Le Guennec, J. M. Duchamp, G. Maury, A. Schimpf,V. Dobremez, L. Bidaux, and B. Cabon, “Multistandard transmissionover plastic optical fiber,” IEEE Trans. Microw. Theory Techn., vol. 58,no. 11, pp. 3109–3116, Nov. 2010.
[5] A. Nkansah, A. Das, N. J. Gomes, and P. Shen, “Multilevel modulatedsignal transmission over serial single-mode and multimode fiber linksusing vertical-cavity surface-emitting lasers for millimeter-wave wire-less communications,” IEEE Trans. Microw. Theory Techn., vol. 55,no. 6, pp. 1219–1228, Jun. 2007.
[6] J. James, P. Shen, A. Nkansah, X. Liang, and N. J. Gomes, “Non-linearity and noise effects in multi-level signal millimeter-wave overfiber transmission using single and dual wavelengthmodulation,” IEEETrans. Microw. Theory Techn., vol. 58, no. 11, pp. 3189–3198, Nov.2010.
[7] D. Wake, A. Nkansah, N. J. Gomes, G. de Valicourt, R. Brenot, M.Violas, Z. Liu, F. Ferreira, and S. Pato, “A comparison of radio overfiber link types for the support of wideband radio channels,” J. Lightw.Technol., vol. 28, no. 16, pp. 2416–2422, Aug. 2010.
[8] C. H. Cox, III, E. I. Ackerman, G. E. Betts, and J. L. Prince, “Limits onthe performance of RF-over-fiber links and their impact on device de-sign,” IEEE Trans. Microw. Theory Techn., vol. 54, no. 2, pp. 906–920,Feb. 2006.
[9] D. Dardari, V. Tralli, and A. Vaccori, “A theoretical characterization ofnonlinear distortion effects in OFDM systems,” IEEE Trans. Commun.,vol. 48, no. 10, pp. 1755–1764, Oct. 2000.
[10] J. Minkoff, “The role of AM-to-PM conversion in memoryless non-linear systems,” IEEE Trans. Commun., vol. COM-33, no. 2, pp.139–144, Feb. 1985.
[11] X. Li and L. J. Cimini, “Effects of clipping and filtering on the perfor-mance of OFDM,” in Proc. IEEE 47th Veh. Technol. Conf., Phoenix,AZ, USA, 1997, pp. 1634–1638.
[12] R. Gross and D. Veeneman, “Clipping distortion in DMT ADSL sys-tems,” Electron. Lett., vol. 29, no. 24, pp. 2080–2081, Nov. 1993.
[13] R. O’Neill and L. N. Lopes, “Envelope variations and spectral splatterin clipped multicarrier signals,” in 6th IEEE Int. Pers., Indoor, MobileRadio Commun. Symp., 1995, pp. 71–75.
[14] M. R. D. Rodrigues, J. E. Mitchell, and I. Darwazeh, “On the errorprobability performance of non-linearly distorted OFDM signals,” inProc. 57th IEEE Veh. Technol. Conf., 2003, pp. 1278–1282.
[15] P. Horvath and I. Frigyes, “Effects of the nonlinearity of aMach–Zehnder modulator on OFDM radio-over-fiber transmis-sion,” IEEE Commun. Lett., vol. 9, no. 10, pp. 921–923, Oct. 2005.
[16] T. Bercelii, M. Csornyei, B. Klein, and T. Banky, “Nonlinear effects inoptical-wireless OFDM signal transmission,” in Int. Microw. Photon.Top. Meeting, Awaji, Japan, 2002, pp. 225–228.
[17] B. Zhang, Y. Lu, J. Zhang, and B. Yang, “Nonlinear effect of OFDMin radio-over-fiber transmission,” in Int. Microw. Millimeter-WaveTechnol. Conf., 2007, pp. 1–3.
[18] P. Assimakopoulos, L. Vieira, A. Nkansah, D. Wake, N. J. Gomes, andF. van Dijk, “Modelling of a DFB laser at low bias directly modulatedwith an OFDM signal for RoF applications,” in Proc. IEEE Int. Mi-crow. Photon. Top. Meeting, Valencia, Spain, 2009, pp. 1–4.
[19] D. Wake, A. Nkansah, and N. J. Gomes, “Radio over fiber link designfor next generation wireless systems,” J. Lightw. Technol., vol. 28, no.16, pp. 2456–2464, Aug. 2010.
[20] P. Banelli and S. Cacopardi, “Theoretical analysis and performance ofOFDM signals in nonlinear AWGN channels,” IEEE Trans. Commun.,vol. 48, no. 3, pp. 430–441, Mar. 2000.
[21] A. Papoulis, Probability, Random Variables, and Stochastic Processes,3rd ed. New York, NY, USA: McGraw-Hill, 1991.
[22] L. Hanzo, M. Munster, B. J. Choi, and T. Keller, OFDM andMC-CDMA for Broadband Multi-User Communications, WLANs andBroadcasting. New York, NY, USA: Wiley, 2003.
[23] J. Tellado, Multicarrier Modulation With Low PAR-Applications toDSL and Wireless. Norwell, MA, USA: Kluwer, 2002.
[24] R. van Nee and A. deWild, “Reducing the peak-to-average power ratioof OFDM,” in Proc. IEEE Veh. Technol. Conf., 1998, pp. 2072–2076.
[25] W. B. Davenport, Jr. and W. L. Root, An Introduction to the Theory ofRandom Signals and Noise. New York, NY, USA: IEEE Press, 1987.
[26] H. Ochiai and H. Imai, “Performance analysis of deliberately clippedOFDM signals,” IEEE Trans. Commun., vol. 50, no. 1, pp. 89–101,Jan. 2002.
[27] J. Andrews, A. Ghosh, and R. Muhamed, Fundamentals of WiMAX.Englewood Cliffs, NJ, USA: Prentice-Hall, 2007.
[28] M. D. McKinley, K. A. Remley, M. Myslinski, J. S. Kenney, D.Schreurs, and B. Nauwelaers, “EVM calculation for broadband mod-ulated signals,” in 64th ARFTG Conf. Dig., 2004, pp. 45–52.
[29] J. D. Jobson, Applied Multivariate Data Analysis: Regression and Ex-perimental Design. Berlin, Germany: Springer, 1991.
[30] E. Limpert, W. A. Stahel, and M. Abbt, “Log-normal dis-tributions across the sciences: Keys and clues,” BioScience,vol. 51, no. 5, pp. 341–352, May 2001. [Online]. Available:http://stat.ethz.ch/~stahel/lognormal/bioscience.pdf
Philippos Assimakopoulos received the B.Eng. degree in electronic engi-neering from the University of Bath, Bath, U.K., in 2003, and the M.Sc.degree in broadband and mobile communication networks and Ph.D. degree inelectronic engineering from the University of Kent, Canterbury, U.K., in 2007and 2012, respectively.He is currently with the Broadband and Wireless Communications Group,
University of Kent. His research interests include low-cost microwave RoF net-works for indoor and outdoor applications.
Anthony Nkansah received the B.Eng. degree (with honors) in electronic engi-neering, M.Sc. degree in broadband and mobile communication networks, andPh.D. degree in electronic engineering from the University of Kent, Canterbury,U.K., in 2000, 2001, and 2007, respectively.He is currently with the Broadband and Wireless Communications Group,
University of Kent. His research interests include low-cost microwave and mil-limeter-wave RoF networks and their deployment within premises.
Nathan J. Gomes (M’92–SM’06) received the B.Sc. degree from the Univer-sity of Sussex, Sussex, U.K., in 1984, and the Ph.D. degree from UniversityCollege London, London, U.K., in 1988, both in electronic engineering.From 1988 to 1989, he held a Royal Society European Exchange Fellow-
ship with ENST, Paris, France. Since late 1989, he has been with the Universityof Kent, Canterbury, U.K., where he is currently a Reader in broadband com-munications. His current research interests include RoF systems and networks,the photonic generation and transport of millimeter-wave signals, and photo-re-ceivers for such applications.
DavidWake (M’03) received the B.Sc. degree in applied physics from the Uni-versity of Wales, Cardiff, U.K., in 1979, and the Ph.D. degree from the Univer-sity of Surrey, Surrey, U.K., in 1987.He is currently a Senior Research Fellow with the University of Kent, Can-
terbury, U.K. From 2003 to 2005, he was the Director of Research and Devel-opment and Chief Scientist with Microwave Photonics Inc., Los Angeles, CA,USA, a startup company that was formed to develop a product set for the mo-bile communications industry based on novel RoF technology. In 2002, he co-founded Zinwave Ltd., a startup company aimed at exploiting innovative RoFtechnology for the mobile communications industry. He has been involved inRoF research for over 20 years, initially with BT Laboratories, where he wasthe Program Manager for the microwave photonics research domain, and thenwith University College London, as a Senior Research Fellow.
Related Documents


![OFDM error floor based EVM estimation Error Floor Based EVM Estimation.pdfAWGN source producing the same BER (and EVM) degradation. [1]: The resulting EVM(BER) curves were verified](https://static.cupdf.com/doc/110x72/5f2e7bc463c3260b31328bb2/ofdm-error-floor-based-evm-estimation-error-floor-based-evm-awgn-source-producing.jpg)


