Statistical Bulletin Office for National Statistics | 1 Annual Mid-year Population Estimates, 2011 and 2012 Coverage: UK Date: 08 August 2013 Geographical Area: Local Authority and County Theme: Population Key Points • The population of the UK was estimated to be 63.7 million in mid-2012, up from the estimated 63.3 million in mid-2011. This represents a growth of 419,900 (0.7%) in the year to 30 June 2012. • The estimated populations of the four constituent countries of the UK in mid-2012 are 53.5 million people in England, 5.3 million in Scotland, 3.1 million in Wales and 1.8 million in Northern Ireland. • In the UK there were 813,200 births and 558,800 deaths occurring in the year to 30 June 2012. This is the largest number of births seen since 1972. • The population of the UK aged 65 and over was 10.8 million (17% of the UK population) in mid-2012. • The estimated flow of international migrants to the UK in the year to 30 June 2012 was 517,800 and estimated outflow for the same period was 352,100. This means that UK net migration was 165,600 in the year to mid-2012. • The population increase of the UK in the year to 30 June 2012 was caused by there being 254,400 more births than deaths (61% of the increase) and 165,600 more international migrants arriving than emigrants leaving (39% of the increase). • The mid-2012 population of the UK ranks third, behind Germany and France when compared to other member states of the European Union. • The absolute increase in population of the UK was greater than that of any other European Union member state during the 12 months to 30 June 2012. Summary

Welcome message from author
This document is posted to help you gain knowledge. Please leave a comment to let me know what you think about it! Share it to your friends and learn new things together.
Transcript
Statistical Bulletin
Office for National Statistics | 1
Annual Mid-year PopulationEstimates, 2011 and 2012Coverage: UKDate: 08 August 2013Geographical Area: Local Authority and CountyTheme: Population
Key Points
• The population of the UK was estimated to be 63.7 million in mid-2012, up from the estimated63.3 million in mid-2011. This represents a growth of 419,900 (0.7%) in the year to 30 June 2012.
• The estimated populations of the four constituent countries of the UK in mid-2012 are 53.5 millionpeople in England, 5.3 million in Scotland, 3.1 million in Wales and 1.8 million in Northern Ireland.
• In the UK there were 813,200 births and 558,800 deaths occurring in the year to 30 June 2012.This is the largest number of births seen since 1972.
• The population of the UK aged 65 and over was 10.8 million (17% of the UK population) inmid-2012.
• The estimated flow of international migrants to the UK in the year to 30 June 2012 was 517,800and estimated outflow for the same period was 352,100. This means that UK net migration was165,600 in the year to mid-2012.
• The population increase of the UK in the year to 30 June 2012 was caused by there being254,400 more births than deaths (61% of the increase) and 165,600 more international migrantsarriving than emigrants leaving (39% of the increase).
• The mid-2012 population of the UK ranks third, behind Germany and France when compared toother member states of the European Union.
• The absolute increase in population of the UK was greater than that of any other European Unionmember state during the 12 months to 30 June 2012.
Summary

Annual Mid-year Population Estimates, 2011 and 2012 | 08 August 2013
Office for National Statistics | 2
This bulletin presents the main messages shown by the 2011 and 2012 mid-year populationestimates. It provides information on the size and age structure of the population of the UnitedKingdom (UK) at 30 June 2012 and includes the first publication of the census based 2011 mid-year population estimates for the UK. Estimates are presented for the regions of England, Scotland,Wales and Northern Ireland.
Introduction
The mid-year estimates refer to the population on 30 June of the reference year and are publishedannually. They are the official set of population estimates for the UK and its constituent countries,the regions of England and Wales and local authorities. This publication relates to mid-2011 andmid-2012 estimates of the UK. Population estimates for Northern Ireland are produced by NorthernIreland Statistics and Research Agency (NISRA) and for Scotland by National Records of Scotland(NRS). The timetables for population outputs are available for each country on their respectivewebsites.
The official 2012 mid-year estimates for the UK referred to in this bulletin, build on the 2011 censusbased mid-year estimates that are published concurrently with this release. The mid-2011 estimatesare updated to account for population change during the period between 1 July 2011 and 30 June2012 to give the mid-2012 estimates. A combination of registration, survey and administrative dataare used to estimate the different components of population change.
Mid-year population estimates relate to the usually resident population. They account for long-terminternational migrants (people who change their country of usual residence for a period of 12 monthsor more) but do not account for short-term migrants (people who come to or leave the country for aperiod of less than 12 months).
The mid-year population estimates are essential building blocks for a wide range of NationalStatistics. They are used directly as a base for other secondary population statistics, such aspopulation projections, population estimates for the very old and population estimates for smallgeographical areas. They are used for weighting survey estimates such as the Labour Force Surveyand other social surveys to ensure that they are representative of the total population, and they areused as denominators for rates or ratios, for example in health and economic indicators. They are animportant input for a wide number of economic and social statistics. Main users include central andlocal government and the health sector, where they are used for planning and monitoring servicedelivery, resource allocation and managing the economy. Additionally, they are used by a widerrange of organisations such as commercial companies (for market research), special interest groupsand academia as well as being of interest to the general public.
Further information on population estimates across the UK including methodology, quality and datasources is available in an information note (100.8 Kb Pdf).
Mid-2011 and mid-2012 UK population estimates
The mid-year population estimates series provide annual estimates of the size and composition ofthe UK population.
Annual Mid-year Population Estimates, 2011 and 2012 | 08 August 2013
Office for National Statistics | 3
The population of the United Kingdom
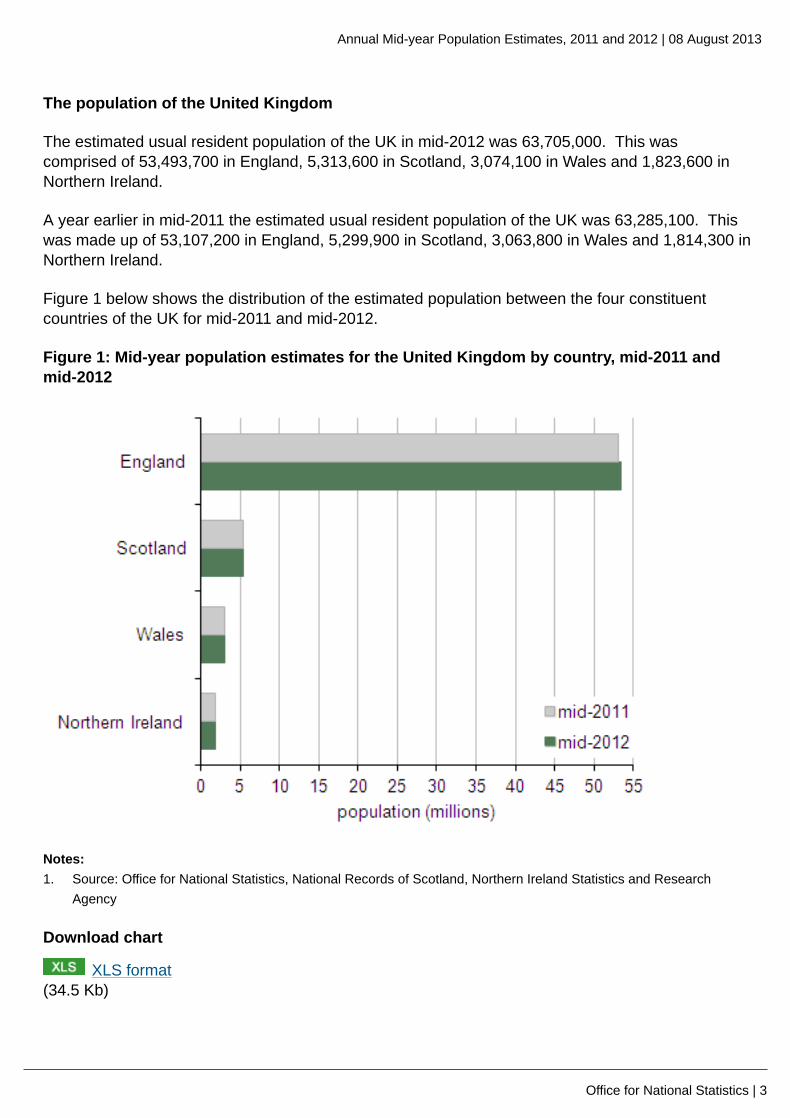
The estimated usual resident population of the UK in mid-2012 was 63,705,000. This wascomprised of 53,493,700 in England, 5,313,600 in Scotland, 3,074,100 in Wales and 1,823,600 inNorthern Ireland.
A year earlier in mid-2011 the estimated usual resident population of the UK was 63,285,100. Thiswas made up of 53,107,200 in England, 5,299,900 in Scotland, 3,063,800 in Wales and 1,814,300 inNorthern Ireland.
Figure 1 below shows the distribution of the estimated population between the four constituentcountries of the UK for mid-2011 and mid-2012.
Figure 1: Mid-year population estimates for the United Kingdom by country, mid-2011 andmid-2012
Notes:1. Source: Office for National Statistics, National Records of Scotland, Northern Ireland Statistics and Research
Agency
Download chart
XLS format(34.5 Kb)
Annual Mid-year Population Estimates, 2011 and 2012 | 08 August 2013
Office for National Statistics | 4
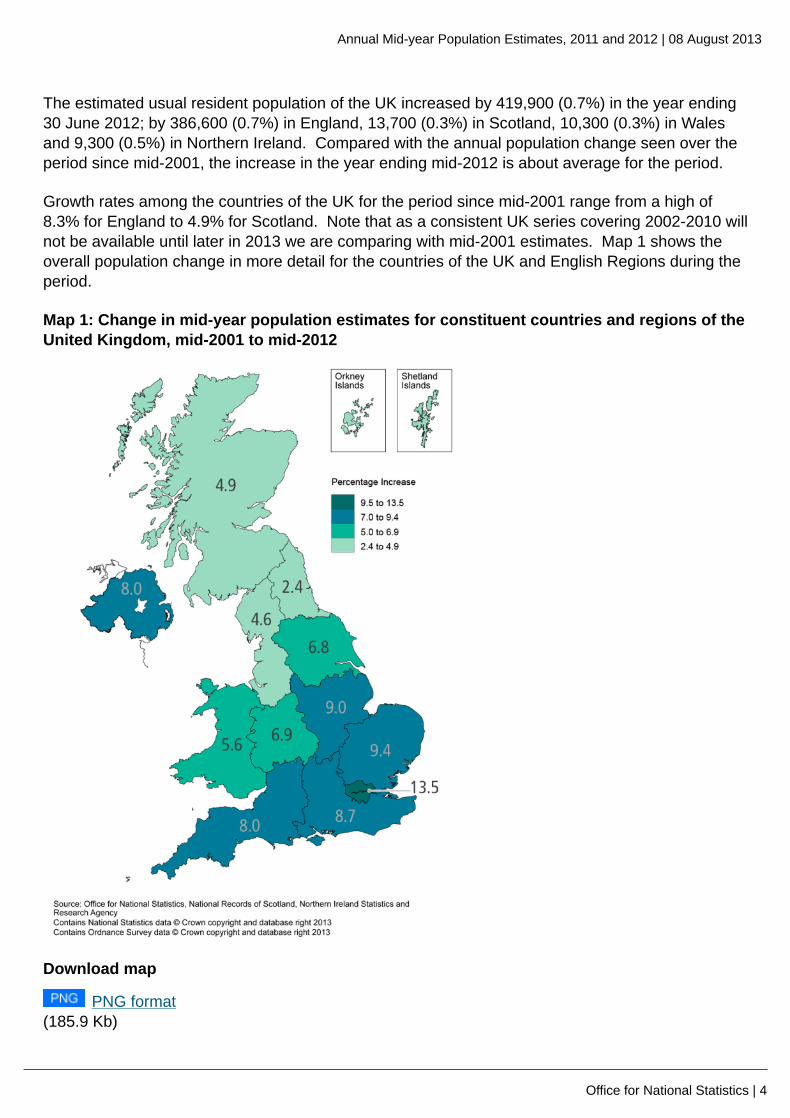
The estimated usual resident population of the UK increased by 419,900 (0.7%) in the year ending30 June 2012; by 386,600 (0.7%) in England, 13,700 (0.3%) in Scotland, 10,300 (0.3%) in Walesand 9,300 (0.5%) in Northern Ireland. Compared with the annual population change seen over theperiod since mid-2001, the increase in the year ending mid-2012 is about average for the period.
Growth rates among the countries of the UK for the period since mid-2001 range from a high of8.3% for England to 4.9% for Scotland. Note that as a consistent UK series covering 2002-2010 willnot be available until later in 2013 we are comparing with mid-2001 estimates. Map 1 shows theoverall population change in more detail for the countries of the UK and English Regions during theperiod.
Map 1: Change in mid-year population estimates for constituent countries and regions of theUnited Kingdom, mid-2001 to mid-2012
Download map
PNG format(185.9 Kb)
Annual Mid-year Population Estimates, 2011 and 2012 | 08 August 2013
Office for National Statistics | 5
The population of the UK has increased by about 4.6 million (7.8%) in the 11 years since 2001with London and the South of England having seen the greatest increases, and this trend broadlycontinues for the year to mid-2012.
Population Structure
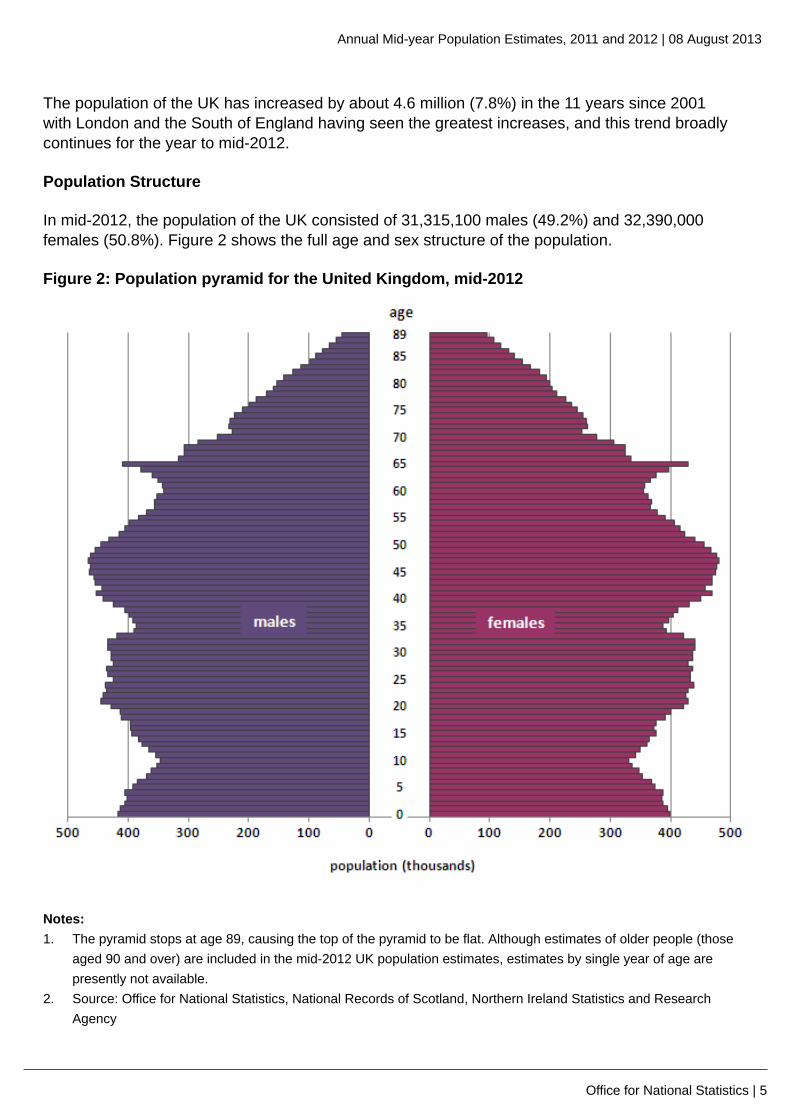
In mid-2012, the population of the UK consisted of 31,315,100 males (49.2%) and 32,390,000females (50.8%). Figure 2 shows the full age and sex structure of the population.
Figure 2: Population pyramid for the United Kingdom, mid-2012
Notes:1. The pyramid stops at age 89, causing the top of the pyramid to be flat. Although estimates of older people (those
aged 90 and over) are included in the mid-2012 UK population estimates, estimates by single year of age arepresently not available.
2. Source: Office for National Statistics, National Records of Scotland, Northern Ireland Statistics and ResearchAgency
Annual Mid-year Population Estimates, 2011 and 2012 | 08 August 2013
Office for National Statistics | 6
Download chart
XLS format(109.5 Kb)
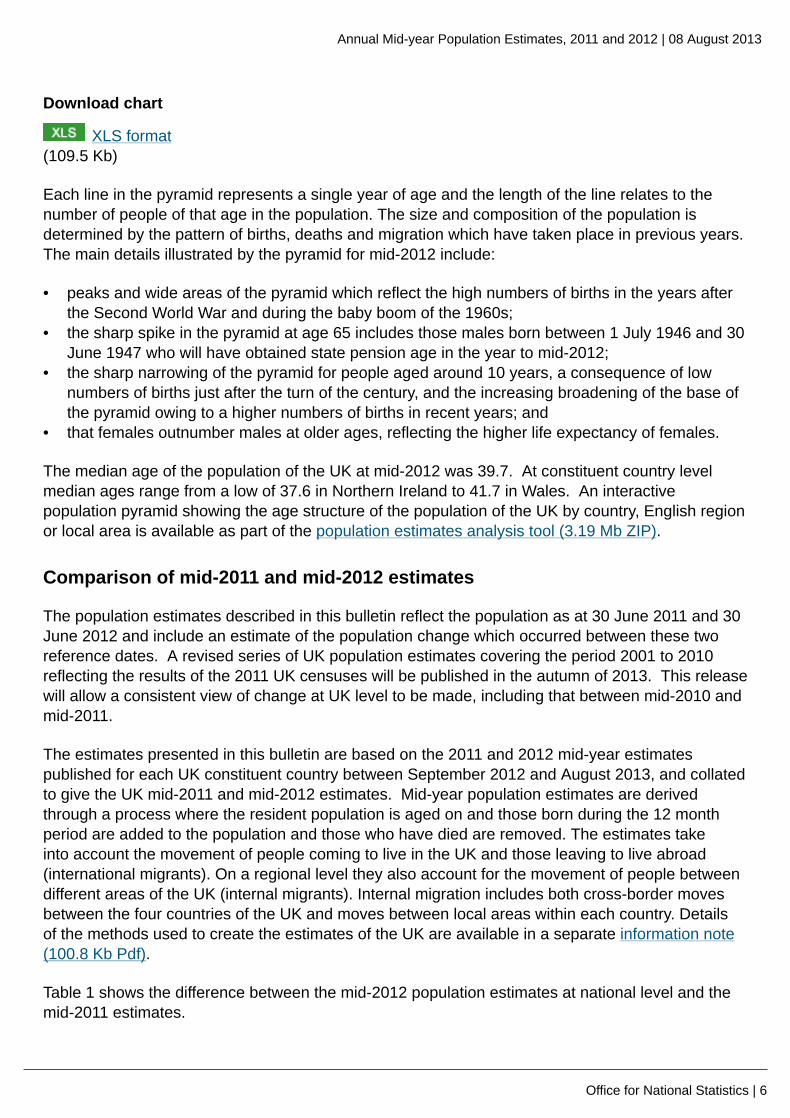
Each line in the pyramid represents a single year of age and the length of the line relates to thenumber of people of that age in the population. The size and composition of the population isdetermined by the pattern of births, deaths and migration which have taken place in previous years.The main details illustrated by the pyramid for mid-2012 include:
• peaks and wide areas of the pyramid which reflect the high numbers of births in the years afterthe Second World War and during the baby boom of the 1960s;
• the sharp spike in the pyramid at age 65 includes those males born between 1 July 1946 and 30June 1947 who will have obtained state pension age in the year to mid-2012;
• the sharp narrowing of the pyramid for people aged around 10 years, a consequence of lownumbers of births just after the turn of the century, and the increasing broadening of the base ofthe pyramid owing to a higher numbers of births in recent years; and
• that females outnumber males at older ages, reflecting the higher life expectancy of females.
The median age of the population of the UK at mid-2012 was 39.7. At constituent country levelmedian ages range from a low of 37.6 in Northern Ireland to 41.7 in Wales. An interactivepopulation pyramid showing the age structure of the population of the UK by country, English regionor local area is available as part of the population estimates analysis tool (3.19 Mb ZIP).
Comparison of mid-2011 and mid-2012 estimates
The population estimates described in this bulletin reflect the population as at 30 June 2011 and 30June 2012 and include an estimate of the population change which occurred between these tworeference dates. A revised series of UK population estimates covering the period 2001 to 2010reflecting the results of the 2011 UK censuses will be published in the autumn of 2013. This releasewill allow a consistent view of change at UK level to be made, including that between mid-2010 andmid-2011.
The estimates presented in this bulletin are based on the 2011 and 2012 mid-year estimatespublished for each UK constituent country between September 2012 and August 2013, and collatedto give the UK mid-2011 and mid-2012 estimates. Mid-year population estimates are derivedthrough a process where the resident population is aged on and those born during the 12 monthperiod are added to the population and those who have died are removed. The estimates takeinto account the movement of people coming to live in the UK and those leaving to live abroad(international migrants). On a regional level they also account for the movement of people betweendifferent areas of the UK (internal migrants). Internal migration includes both cross-border movesbetween the four countries of the UK and moves between local areas within each country. Detailsof the methods used to create the estimates of the UK are available in a separate information note(100.8 Kb Pdf).
Table 1 shows the difference between the mid-2012 population estimates at national level and themid-2011 estimates.
Annual Mid-year Population Estimates, 2011 and 2012 | 08 August 2013
Office for National Statistics | 7
Table 1: Mid-2012 population estimates compared with mid-2011 estimates, United Kingdom
Mid-2011 Population(thousands)
Mid-2012 Population(thousands)
Percentage Change
United Kingdom 63,285.2 63,705.0 0.66
England 53,107.2 53,493.7 0.73
Scotland 5,299.9 5,313.6 0.26
Wales 3,063.8 3,074.1 0.34
Northern Ireland 1,814.3 1,823.6 0.51
Table notes:1. Figures may not add exactly due to rounding2. Source: Office for National Statistics, National Records of Scotland, Northern Ireland Statistics and Research
Agency
Download table
XLS format(26 Kb)
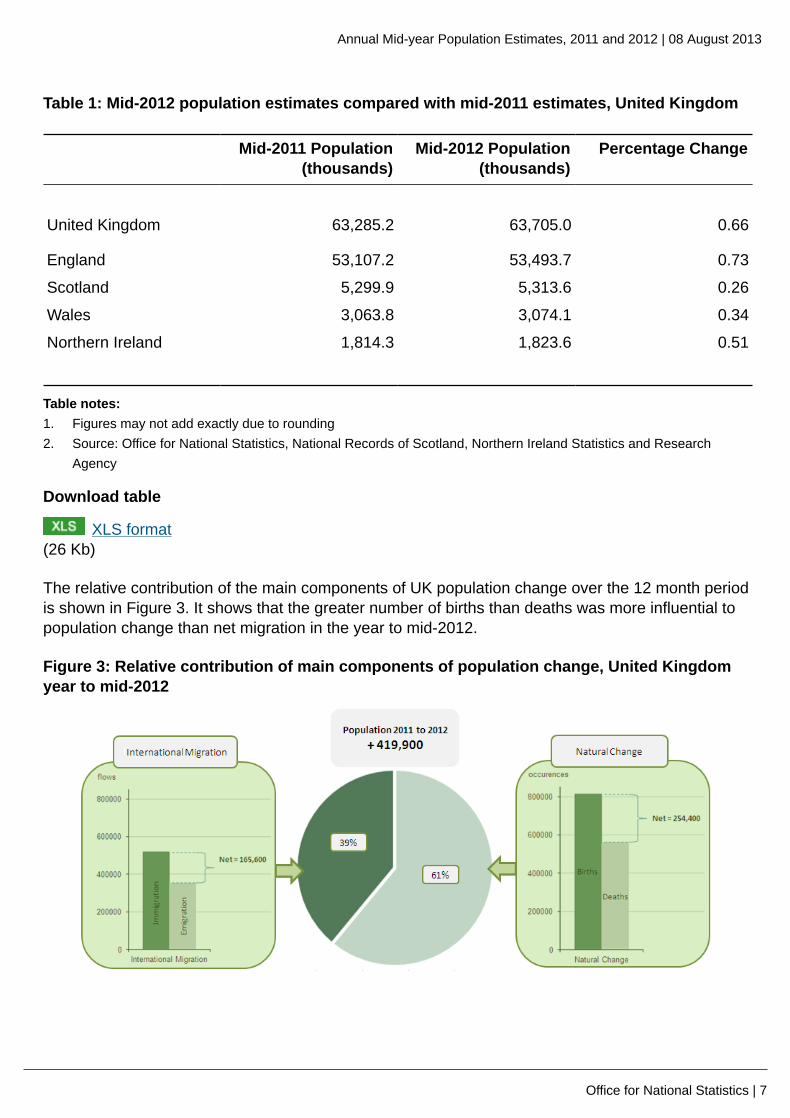
The relative contribution of the main components of UK population change over the 12 month periodis shown in Figure 3. It shows that the greater number of births than deaths was more influential topopulation change than net migration in the year to mid-2012.
Figure 3: Relative contribution of main components of population change, United Kingdomyear to mid-2012
Annual Mid-year Population Estimates, 2011 and 2012 | 08 August 2013
Office for National Statistics | 8
Notes:1. Source: Office for National Statistics, National Records of Scotland, Northern Ireland Statistics and Research
Agency
Download chart
XLS format(102.5 Kb)
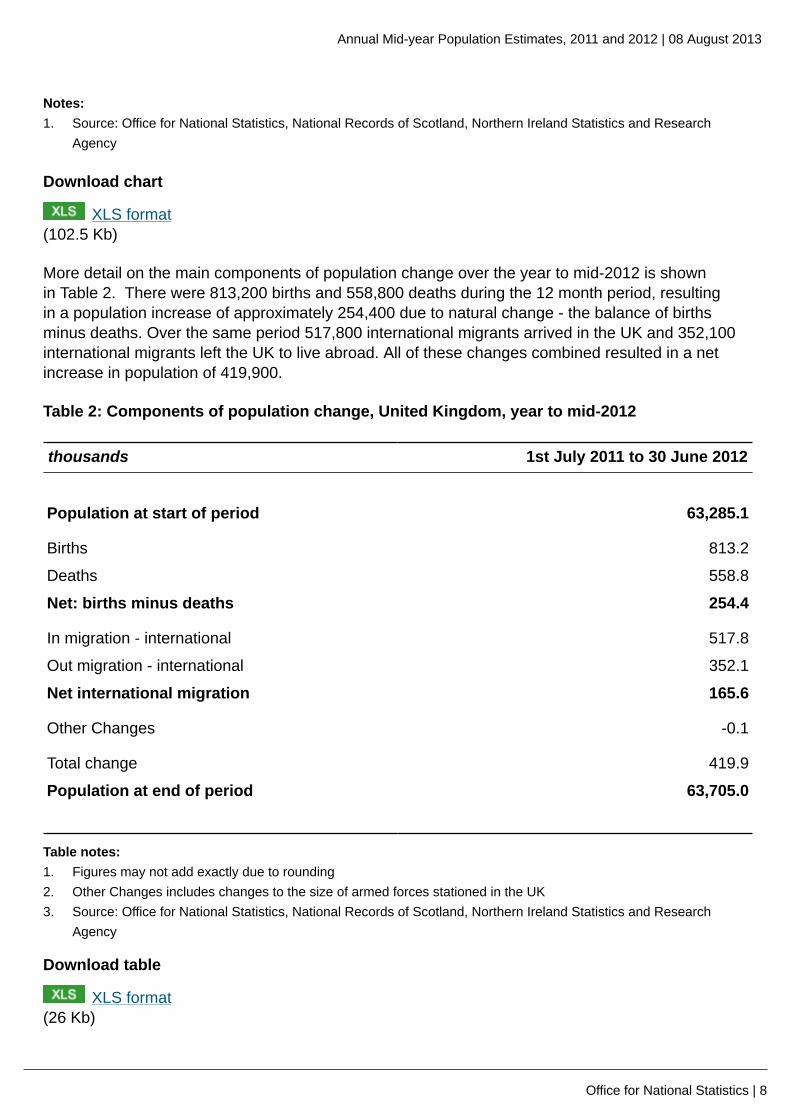
More detail on the main components of population change over the year to mid-2012 is shownin Table 2. There were 813,200 births and 558,800 deaths during the 12 month period, resultingin a population increase of approximately 254,400 due to natural change - the balance of birthsminus deaths. Over the same period 517,800 international migrants arrived in the UK and 352,100international migrants left the UK to live abroad. All of these changes combined resulted in a netincrease in population of 419,900.
Table 2: Components of population change, United Kingdom, year to mid-2012
thousands 1st July 2011 to 30 June 2012
Population at start of period 63,285.1
Births 813.2
Deaths 558.8
Net: births minus deaths 254.4
In migration - international 517.8
Out migration - international 352.1
Net international migration 165.6
Other Changes -0.1
Total change 419.9
Population at end of period 63,705.0
Table notes:1. Figures may not add exactly due to rounding2. Other Changes includes changes to the size of armed forces stationed in the UK3. Source: Office for National Statistics, National Records of Scotland, Northern Ireland Statistics and Research
Agency
Download table
XLS format(26 Kb)
Annual Mid-year Population Estimates, 2011 and 2012 | 08 August 2013
Office for National Statistics | 9
Regions of the UK
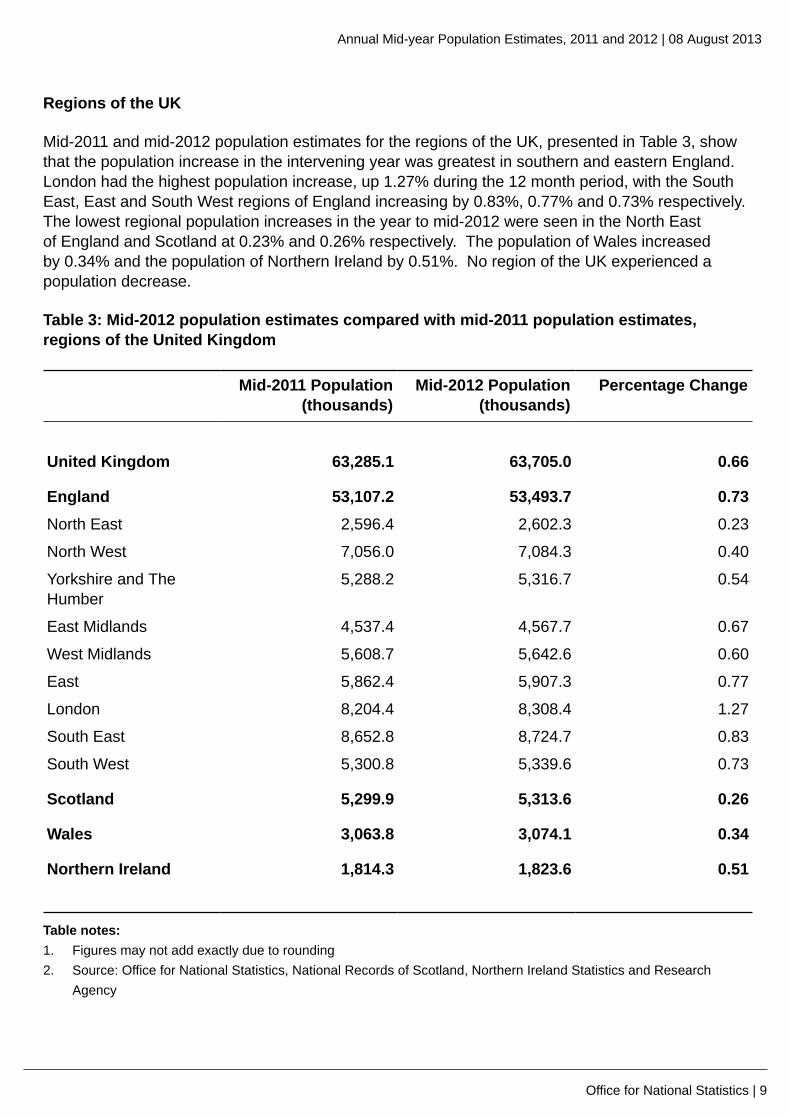
Mid-2011 and mid-2012 population estimates for the regions of the UK, presented in Table 3, showthat the population increase in the intervening year was greatest in southern and eastern England.London had the highest population increase, up 1.27% during the 12 month period, with the SouthEast, East and South West regions of England increasing by 0.83%, 0.77% and 0.73% respectively.The lowest regional population increases in the year to mid-2012 were seen in the North Eastof England and Scotland at 0.23% and 0.26% respectively. The population of Wales increasedby 0.34% and the population of Northern Ireland by 0.51%. No region of the UK experienced apopulation decrease.
Table 3: Mid-2012 population estimates compared with mid-2011 population estimates,regions of the United Kingdom
Mid-2011 Population(thousands)
Mid-2012 Population(thousands)
Percentage Change
United Kingdom 63,285.1 63,705.0 0.66
England 53,107.2 53,493.7 0.73
North East 2,596.4 2,602.3 0.23
North West 7,056.0 7,084.3 0.40
Yorkshire and TheHumber
5,288.2 5,316.7 0.54
East Midlands 4,537.4 4,567.7 0.67
West Midlands 5,608.7 5,642.6 0.60
East 5,862.4 5,907.3 0.77
London 8,204.4 8,308.4 1.27
South East 8,652.8 8,724.7 0.83
South West 5,300.8 5,339.6 0.73
Scotland 5,299.9 5,313.6 0.26
Wales 3,063.8 3,074.1 0.34
Northern Ireland 1,814.3 1,823.6 0.51
Table notes:1. Figures may not add exactly due to rounding2. Source: Office for National Statistics, National Records of Scotland, Northern Ireland Statistics and Research
Agency
Annual Mid-year Population Estimates, 2011 and 2012 | 08 August 2013
Office for National Statistics | 10
Download table
XLS format(27 Kb)
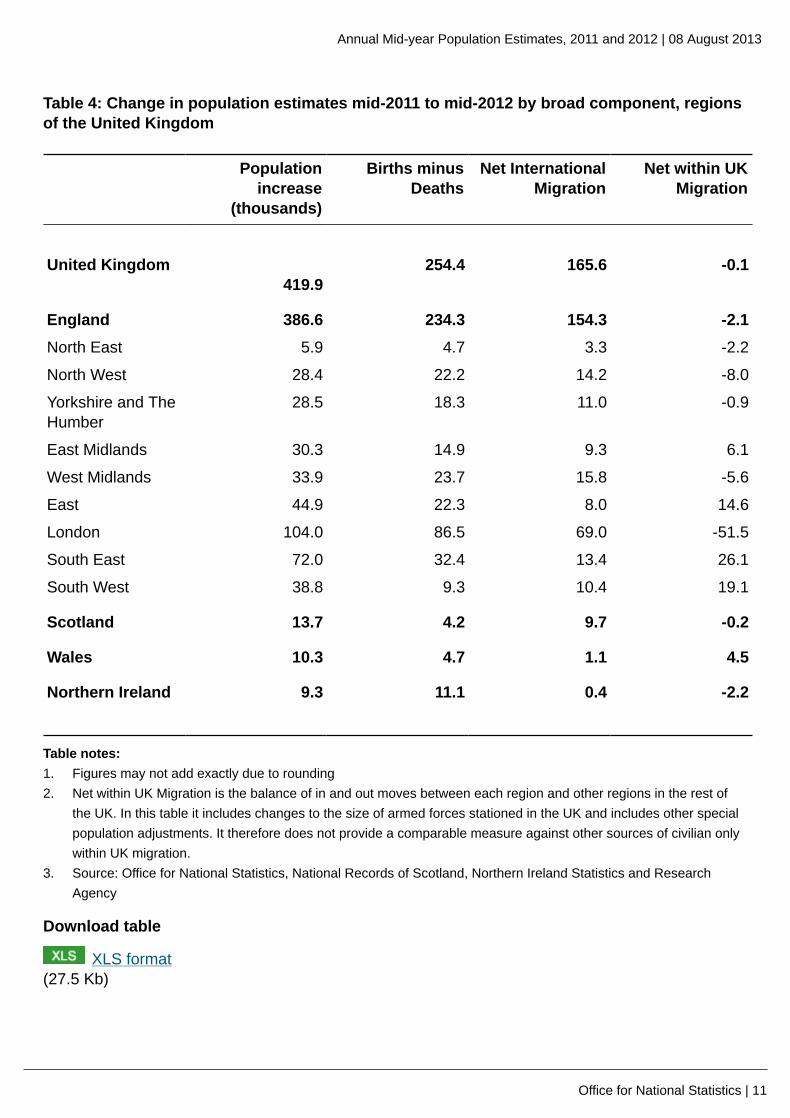
Table 4 presents the broad components of change which have contributed to the estimatedpopulation increase for the regions of the UK in the year to 30 June 2012.
London had the largest natural change of all regions with 86,000 more births than deaths; Scotlandhad the lowest natural change with just 4,200 more births than deaths.
London was the destination of over a third of international migrants arriving in the UK - contributingto it having the highest net international migration of all regions at 69,000; Northern Ireland had thelowest net international migration.
It should be noted that the net figures for births minus deaths and international migration arenot independent over time, as past immigrants contribute to the number of births and deaths insubsequent years. Data for the UK is not yet available but the percentage of live births in Englandand Wales to mothers born outside the UK continued to rise in the calendar year 2012, reaching25.9%, up from 17.7% in 2002. The percentage of live births in Northern Ireland to mothers bornoutside the UK was 17.6% in the calendar year 2012. This has stayed broadly similar over recentyears, but is higher than a decade ago (13.5% in 2002). These shifts are related to the increasedlevels of migration to the UK and further detail on this is available in the Births in England andWales, 2012 and the Births in Northern Ireland, 2012 releases.
More people from other parts of the UK moved to the South East of England than any other regionleading to a 26,000 population increase; although not a new phenomenon London saw the greatestoutflow of people to other parts of the UK of any region, with a net loss of over 51,000 people. Approximately two-thirds of the people moving out of London went to the South East and East ofEngland.
Annual Mid-year Population Estimates, 2011 and 2012 | 08 August 2013
Office for National Statistics | 11
Table 4: Change in population estimates mid-2011 to mid-2012 by broad component, regionsof the United Kingdom
Populationincrease
(thousands)
Births minusDeaths
Net InternationalMigration
Net within UKMigration
United Kingdom 419.9
254.4 165.6 -0.1
England 386.6 234.3 154.3 -2.1
North East 5.9 4.7 3.3 -2.2
North West 28.4 22.2 14.2 -8.0
Yorkshire and TheHumber
28.5 18.3 11.0 -0.9
East Midlands 30.3 14.9 9.3 6.1
West Midlands 33.9 23.7 15.8 -5.6
East 44.9 22.3 8.0 14.6
London 104.0 86.5 69.0 -51.5
South East 72.0 32.4 13.4 26.1
South West 38.8 9.3 10.4 19.1
Scotland 13.7 4.2 9.7 -0.2
Wales 10.3 4.7 1.1 4.5
Northern Ireland 9.3 11.1 0.4 -2.2
Table notes:1. Figures may not add exactly due to rounding2. Net within UK Migration is the balance of in and out moves between each region and other regions in the rest of
the UK. In this table it includes changes to the size of armed forces stationed in the UK and includes other specialpopulation adjustments. It therefore does not provide a comparable measure against other sources of civilian onlywithin UK migration.
3. Source: Office for National Statistics, National Records of Scotland, Northern Ireland Statistics and ResearchAgency
Download table
XLS format(27.5 Kb)
Annual Mid-year Population Estimates, 2011 and 2012 | 08 August 2013
Office for National Statistics | 12
Comparing the population structure with mid-2001 UK population estimates
The 2011 censuses carried out across the UK have provided a chance to revise the populationestimates made for the mid-years between 2001 and 2010; this work has already commencedand will be complete at UK level by the autumn of 2013. In the meantime, the last consistent UKpopulation estimates are those for mid-2001, and it is a useful opportunity to compare the populationestimates for mid-2012 with these and make some observations.
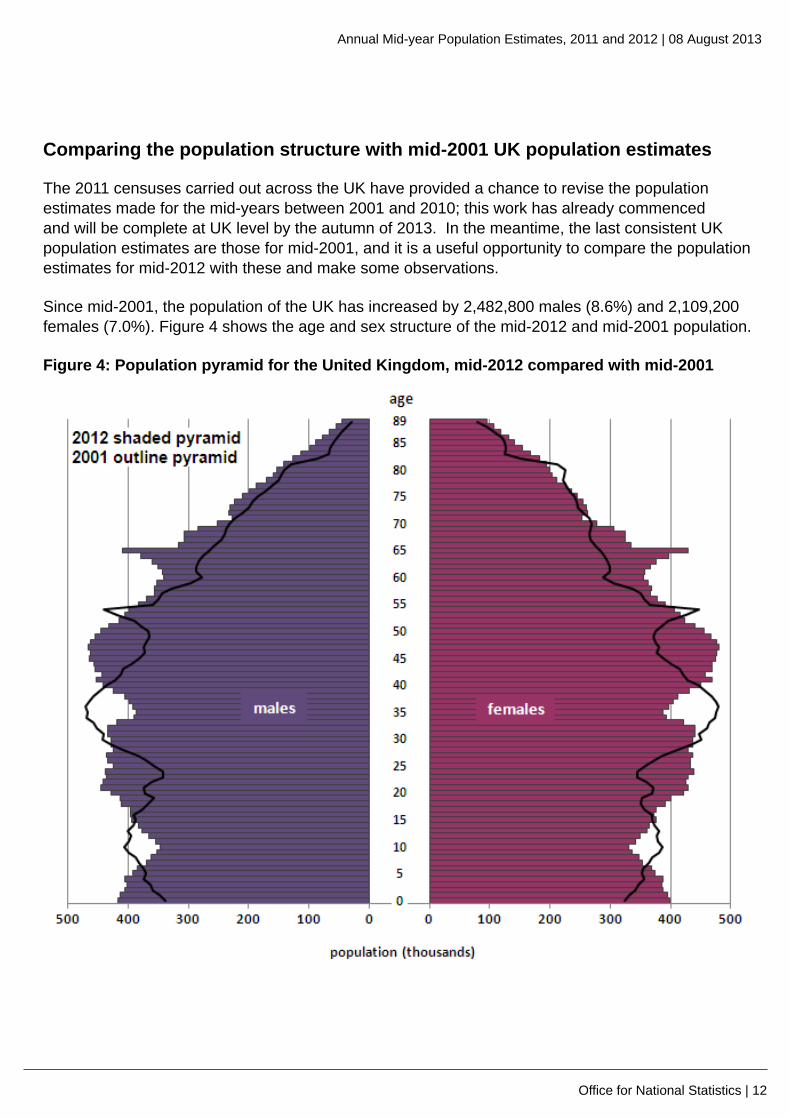
Since mid-2001, the population of the UK has increased by 2,482,800 males (8.6%) and 2,109,200females (7.0%). Figure 4 shows the age and sex structure of the mid-2012 and mid-2001 population.
Figure 4: Population pyramid for the United Kingdom, mid-2012 compared with mid-2001
Annual Mid-year Population Estimates, 2011 and 2012 | 08 August 2013
Office for National Statistics | 13
Notes:1. The pyramid stops at age 89, causing the top of the pyramid to be flat. Although older people (those aged 90 and
over) are included in the population estimates, estimates by single year of age are the subject of research which willbe published at a later date.
2. Data for Northern Ireland for mid-2001 are revised and based on the 2011 Census results. More information isavailable on the NISRA website.
3. Source: Office for National Statistics, National Records of Scotland, Northern Ireland Statistics and ResearchAgency
Download chart
XLS format(150 Kb)
The pyramid shows some important trends in the demographics of the UK:
• The number of males aged 75 and over in the UK has increased by 26% since mid-2001. Thiscompares to an increase of slightly more than 6% for females in this age group over the sameperiod. The faster improvement in male mortality is largely driven by changes seen in tobaccosmoking and advances in health treatments for circulatory illnesses. Male occupations over thesame period have also become less physical and safer.
• The effects of immigration to the UK that has happened since mid-2001. For most ages thepeaks and troughs present in the pyramid in mid-2001 are visible in the mid-2012 data shifted by11 years, demonstrating the cohort ageing of the population. The mid-2012 pyramid however,shows some difference in this pattern for those aged 23 to 33: here the profile is much wider andflatter than the mid-2001 pyramid would suggest. Such a change can only be generated by newpopulation being added from outside.
• The number of births has increased year on year. There are 581,800 more zero to six year oldsin mid-2012 than there were in mid-2001. The number of children aged 7 to 16 is 453,300 lessthan mid-2001 – a result of the lower births around the turn of the century.
European comparisons
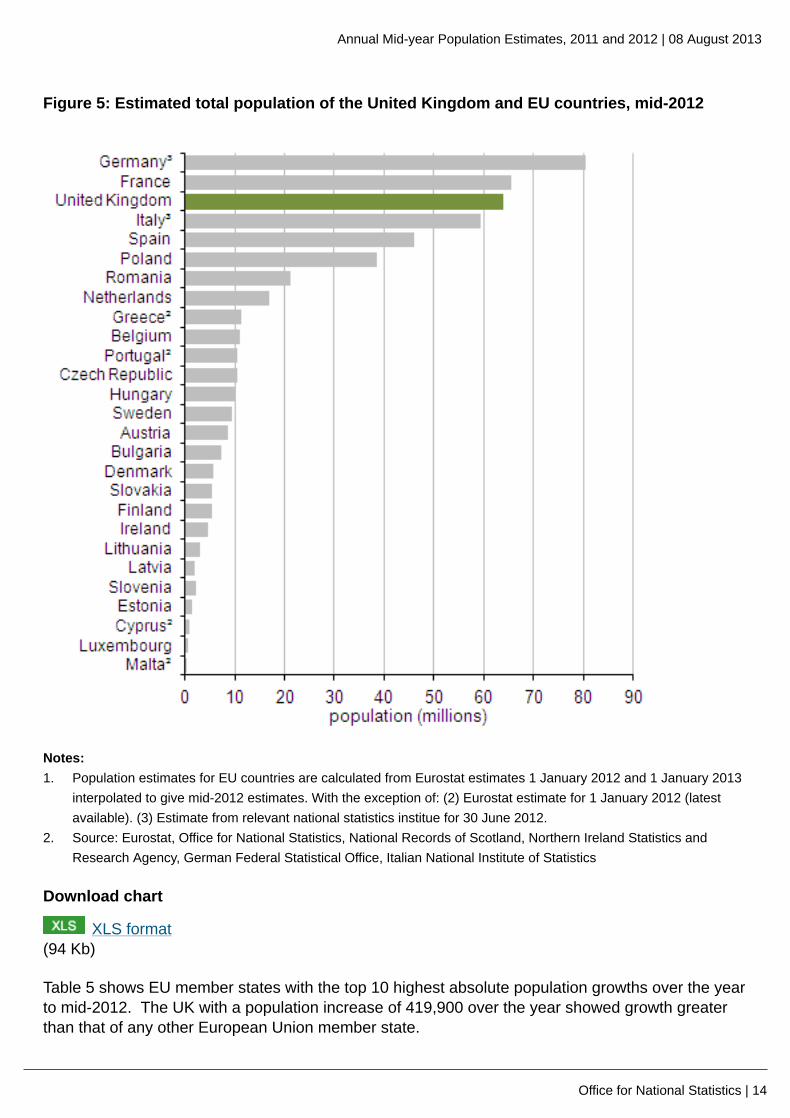
Figure 5 shows the estimated population of the UK compared alongside that of the member statesof the European Union (EU) at mid-2012. The population of the UK ranks third compared to otherEU member states; behind Germany and France. The UK has approximately 17 million fewer peoplethan Germany and 2 million fewer than France.
Annual Mid-year Population Estimates, 2011 and 2012 | 08 August 2013
Office for National Statistics | 14
Figure 5: Estimated total population of the United Kingdom and EU countries, mid-2012
Notes:1. Population estimates for EU countries are calculated from Eurostat estimates 1 January 2012 and 1 January 2013
interpolated to give mid-2012 estimates. With the exception of: (2) Eurostat estimate for 1 January 2012 (latestavailable). (3) Estimate from relevant national statistics institue for 30 June 2012.
2. Source: Eurostat, Office for National Statistics, National Records of Scotland, Northern Ireland Statistics andResearch Agency, German Federal Statistical Office, Italian National Institute of Statistics
Download chart
XLS format(94 Kb)
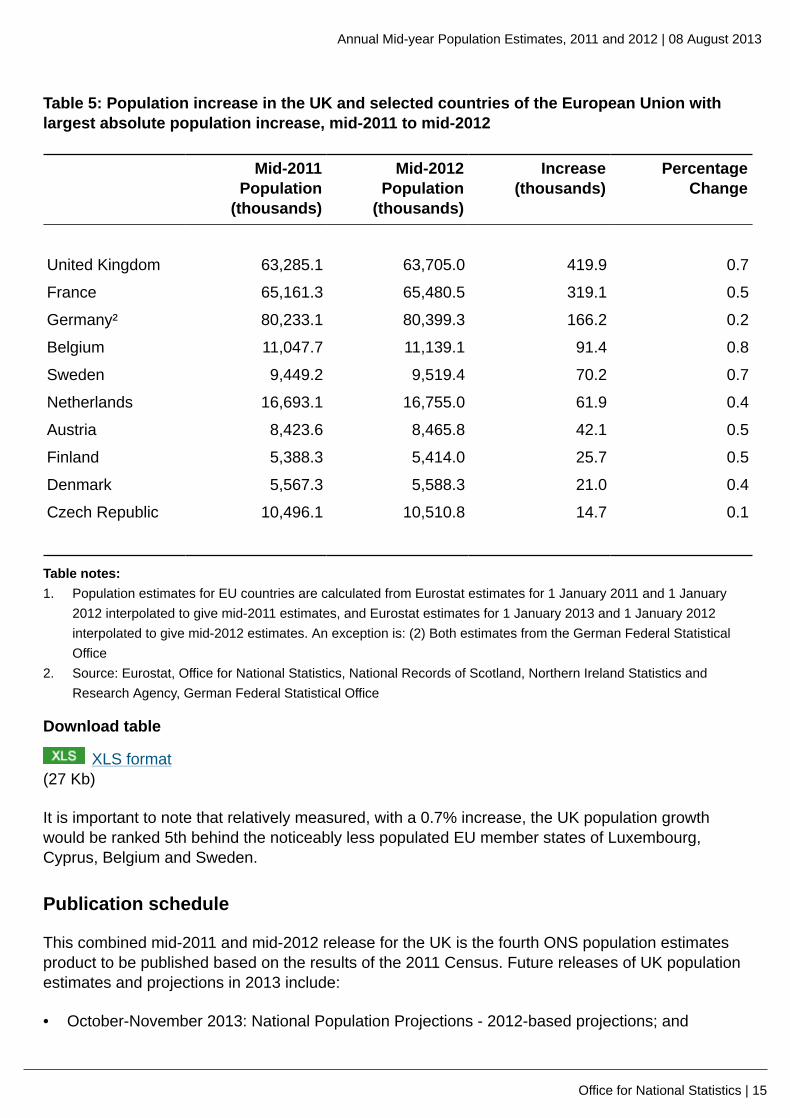
Table 5 shows EU member states with the top 10 highest absolute population growths over the yearto mid-2012. The UK with a population increase of 419,900 over the year showed growth greaterthan that of any other European Union member state.
Annual Mid-year Population Estimates, 2011 and 2012 | 08 August 2013
Office for National Statistics | 15
Table 5: Population increase in the UK and selected countries of the European Union withlargest absolute population increase, mid-2011 to mid-2012
Mid-2011Population
(thousands)
Mid-2012Population
(thousands)
Increase(thousands)
PercentageChange
United Kingdom 63,285.1 63,705.0 419.9 0.7
France 65,161.3 65,480.5 319.1 0.5
Germany² 80,233.1 80,399.3 166.2 0.2
Belgium 11,047.7 11,139.1 91.4 0.8
Sweden 9,449.2 9,519.4 70.2 0.7
Netherlands 16,693.1 16,755.0 61.9 0.4
Austria 8,423.6 8,465.8 42.1 0.5
Finland 5,388.3 5,414.0 25.7 0.5
Denmark 5,567.3 5,588.3 21.0 0.4
Czech Republic 10,496.1 10,510.8 14.7 0.1
Table notes:1. Population estimates for EU countries are calculated from Eurostat estimates for 1 January 2011 and 1 January
2012 interpolated to give mid-2011 estimates, and Eurostat estimates for 1 January 2013 and 1 January 2012interpolated to give mid-2012 estimates. An exception is: (2) Both estimates from the German Federal StatisticalOffice
2. Source: Eurostat, Office for National Statistics, National Records of Scotland, Northern Ireland Statistics andResearch Agency, German Federal Statistical Office
Download table
XLS format(27 Kb)
It is important to note that relatively measured, with a 0.7% increase, the UK population growthwould be ranked 5th behind the noticeably less populated EU member states of Luxembourg,Cyprus, Belgium and Sweden.
Publication schedule
This combined mid-2011 and mid-2012 release for the UK is the fourth ONS population estimatesproduct to be published based on the results of the 2011 Census. Future releases of UK populationestimates and projections in 2013 include:
• October-November 2013: National Population Projections - 2012-based projections; and
Annual Mid-year Population Estimates, 2011 and 2012 | 08 August 2013
Office for National Statistics | 16
• November-December 2013: Population Estimates for UK, England and Wales, Scotland andNorthern Ireland - Mid-2001 to Mid-2010 revised.
Dates given here are provisional. Any changes or confirmation of dates will be announced on the UKstatistics Publication Hub release calendar.
Background notes
1. National Statistics are produced to high professional standards set out in the Code of Practicefor Official Statistics. They undergo regular quality assurance reviews to ensure that they meetcustomer needs. They are produced free from any political interference.
2. An Overview of Population Statistics is available on the ONS website.
3. Mid-2012 population estimates data for England and Wales are available on the ONS website.Published tables for mid-2012 include England and Wales by single year of age and sex; regionand local authority; and detailed components of population change. Unformatted tables toenable re-use of the data are also published for local authorities by single year of age and sex.
4. Mid-2011 and mid-2012 population estimates data for Scotland are available on the NRSwebsite.
5. Mid-2011 and mid-2012 population estimates data for Northern Ireland are available on theNISRA website.
6. A population estimates analysis tool (3.19 Mb ZIP) is available for users to produce simplereports on the mid-2012 UK population data.
7. An information note (100.8 Kb Pdf) describing the methodology used to create the UKpopulation estimates and differences in approach within the UK is available.
8. Net migration estimates quoted in this report include net international migration and net flowsof asylum seekers where applicable. The net effects of moves between regions within the UK,together with moves of armed forces personnel at home and overseas are also included.
9. Population components in the mid-year estimates may vary from those published in other ONSoutputs due to definitional differences and context of use.
10. This is the first release of mid-2011 and mid-2012 UK population estimates. No revisions of thisdataset have been made.
11. Release number: MYE5BL1.
12. Next publication:
Autumn 2013

Annual Mid-year Population Estimates, 2011 and 2012 | 08 August 2013
Office for National Statistics | 17
Issued by:
Office for National Statistics, Government Buildings, Cardiff Road, Newport NP10 8XG
Media contact:
Tel: Media Relations Office 0845 6041858
Emergency on-call 07867 906553
Email: [email protected]
13. © Crown copyright 2013.
You may re-use this information (not including logos) free of charge in any format or medium,under the terms of the Open Government Licence or write to the Information Policy Team, TheNational Archives, Kew, London TW9 4DU
Email: [email protected]
14. Details of the policy governing the release of new data are available by visitingwww.statisticsauthority.gov.uk/assessment/code-of-practice/index.html or from the MediaRelations Office email: [email protected]
The United Kingdom Statistics Authority has designated these statistics as National Statistics, inaccordance with the Statistics and Registration Service Act 2007 and signifying compliance withthe Code of Practice for Official Statistics.
Designation can be broadly interpreted to mean that the statistics:
• meet identified user needs;• are well explained and readily accessible;• are produced according to sound methods; and• are managed impartially and objectively in the public interest.
Once statistics have been designated as National Statistics it is a statutory requirement that theCode of Practice shall continue to be observed.
Copyright
© Crown copyright 2013
You may use or re-use this information (not including logos) free of charge in any formator medium, under the terms of the Open Government Licence. To view this licence, visitwww.nationalarchives.gov.uk/doc/open-government-licence/ or write to the Information Policy Team,The National Archives, Kew, London TW9 4DU, or email: [email protected].

Annual Mid-year Population Estimates, 2011 and 2012 | 08 August 2013
Office for National Statistics | 18
This document is also available on our website at www.ons.gov.uk.
Statistical contacts
Name Phone Department EmailPete Large +44 (0)1329 444661 Population
Estimates [email protected]
Issuing Body:Office for National Statistics
Media Contact Details:Telephone: 0845 604 1858(8.30am-5.30pm Weekdays)
Emergency out of hours (limited service): 07867 906553
Email:[email protected]
Related Documents


