130 J. OPT. COMMUN. NETW./VOL. 4, NO. 2/FEBRUARY 2012 Velasco et al. Statistical Approach for Fast Impairment-Aware Provisioning in Dynamic All-Optical Networks L. Velasco, A. Jirattigalachote, M. Ruiz, P. Monti, L. Wosinska, and G. Junyent Abstract—Physical layer impairments (PLIs) need to be considered in the routing and wavelength assignment (RWA) process of all-optical networks to ensure the provisioning of good quality optical connections (i.e., lightpaths). A convenient way to model the impact of PLIs on the signal quality is to use the so-called Q-factor. In a dynamic provisioning environment, impairment-aware RWA (IA-RWA) algorithms include Q-factor evaluation in their on-line decisions on whether to accept a connection request or not. The Q-factor can be computed in either an approximated or an exact way. IA-RWA algorithms using an approximated Q-factor estimation (i.e., worst case) can be very fast and allow for a short setup delay. However, connection request blocking can be unnecessarily high because of the worst-case assumption for the Q-factor parameters. In contrast, an exact Q-factor computation results in a better blocking performance at the expense of a longer setup delay, mainly due to the time spent for the Q-factor computation itself. Moreover, an exact Q-factor approach requires extensions of the gen- eralized multi-protocol label switching suite. To overcome these problems, we propose a statistical approach for fast impairment-aware RWA (SAFIR) computation. The evaluation results reveal that SAFIR improves the blocking probability performance compared to the worst-case scenario without adding extra computational complexity and, consequently, without increasing the connection setup delay. Index Terms—All-optical networks; Cross-phase modulation (XPM); Impairment-aware RWA. I. I NTRODUCTION T he rapidly increasing traffic demand in communication networks requires further improvement of spectral effi- ciency in transparent dense wavelength division multiplexing (DWDM) networks where the signal is transmitted from source to destination through all-optical channels called lightpaths. With the absence of optical-to-electrical-to-optical (O/E/O) conversion at intermediate nodes, the optical signal might be degraded due to physical layer impairments (PLIs) induced by the transmission through optical fibers and components. Manuscript received July 20, 2011; revised January 3, 2012; accepted January 6, 2012; published January 30, 2012 (Doc. ID 151414). L. Velasco (e-mail: [email protected]), M. Ruiz, and G. Junyent are with the Advanced Broadband Communications Center (CCABA), Universitat Politècnica de Catalunya (UPC), Barcelona, Spain. A. Jirattigalachote, P. Monti, and L. Wosinska are with the School of Information and Communication Technology (ICT), Royal Institute of Technology (KTH), Kista, Sweden. Digital Object Identifier 10.1364/JOCN.4.000130 PLIs can be divided into non-linear and linear impairments. Non-linear impairments affect not only each wavelength chan- nel individually, but also cause disturbance and interference among channels traversing the same fiber link. The most important non-linear effects are self-phase modulation (SPM), cross-phase modulation (XPM), and four-wave mixing (FWM). Non-linear impairments become in general apparent as the signal power increases in long-haul links. On the other hand, linear impairments do not depend on the signal power. The most important linear impairments are fiber attenuation, am- plifier spontaneous emission (ASE) noise, chromatic dispersion (CD) (or group velocity dispersion (GVD)), and polarization mode dispersion (PMD). Linear and non-linear PLIs of a lightpath can be quantified by using the quality factor Q [1]. To provide good quality lightpaths, PLI information needs to be taken into account while solving the routing and wavelength assignment (RWA) problem. RWA consists in finding a physical route and in assigning a wavelength to a given connection request. The incorporation of PLI information into the RWA problem for transparent optical networks has recently received a lot of attention, resulting in the development of a number of impairment-aware RWA (IA-RWA) algorithms [1–10]. IA-RWA algorithms can be used either in the network planning phase, when the set of connection requests is known in advance (off-line algorithms) [2], or in the dynamic lightpath provisioning upon arrival of connection requests (dynamic algorithms). In dynamic IA-RWA algorithms, the Q-factor of candidate lightpaths is computed during the lightpath setup process, and only those lightpaths with a Q-factor above a pre-defined threshold are established. Two main approaches for dynamic IA-RWA can be considered, i.e., centralized and distributed. A distributed approach offers a shorter setup delay than a centralized one, but at the expense of a higher blocking probability [3,4]. In this paper, we focus on dynamic IA-RWA algorithm to be used in the distributed control plane of automatically switched optical networks (ASONs) [11]. When non-linear impairments are considered for RWA computation at each controller node of a distributed control plane, the information of the current network state (i.e., which wavelength channels are used on the fiber links) is needed for calculating the Q-factor of each wavelength that is end-to-end available for every candidate route. This translates into the need for standardized extensions of the generalized multi-protocol label switching (GMPLS) protocol set [12] in order to provide the necessary information for a distributed and accurate IA-RWA computation. 1943-0620/12/020130-12/$15.00 © 2012 Optical Society of America

Welcome message from author
This document is posted to help you gain knowledge. Please leave a comment to let me know what you think about it! Share it to your friends and learn new things together.
Transcript

130 J. OPT. COMMUN. NETW./VOL. 4, NO. 2/FEBRUARY 2012 Velasco et al.
Statistical Approach for FastImpairment-Aware Provisioning in
Dynamic All-Optical NetworksL. Velasco, A. Jirattigalachote, M. Ruiz, P. Monti, L. Wosinska, and G. Junyent
Abstract—Physical layer impairments (PLIs) need to beconsidered in the routing and wavelength assignment (RWA)process of all-optical networks to ensure the provisioning ofgood quality optical connections (i.e., lightpaths). A convenientway to model the impact of PLIs on the signal qualityis to use the so-called Q-factor. In a dynamic provisioningenvironment, impairment-aware RWA (IA-RWA) algorithmsinclude Q-factor evaluation in their on-line decisions onwhether to accept a connection request or not. The Q-factorcan be computed in either an approximated or an exact way.IA-RWA algorithms using an approximated Q-factor estimation(i.e., worst case) can be very fast and allow for a shortsetup delay. However, connection request blocking can beunnecessarily high because of the worst-case assumptionfor the Q-factor parameters. In contrast, an exact Q-factorcomputation results in a better blocking performance atthe expense of a longer setup delay, mainly due to thetime spent for the Q-factor computation itself. Moreover,an exact Q-factor approach requires extensions of the gen-eralized multi-protocol label switching suite. To overcomethese problems, we propose a statistical approach for fastimpairment-aware RWA (SAFIR) computation. The evaluationresults reveal that SAFIR improves the blocking probabilityperformance compared to the worst-case scenario withoutadding extra computational complexity and, consequently,without increasing the connection setup delay.
Index Terms—All-optical networks; Cross-phase modulation(XPM); Impairment-aware RWA.
I. INTRODUCTION
T he rapidly increasing traffic demand in communicationnetworks requires further improvement of spectral effi-
ciency in transparent dense wavelength division multiplexing(DWDM) networks where the signal is transmitted from sourceto destination through all-optical channels called lightpaths.With the absence of optical-to-electrical-to-optical (O/E/O)conversion at intermediate nodes, the optical signal might bedegraded due to physical layer impairments (PLIs) inducedby the transmission through optical fibers and components.
Manuscript received July 20, 2011; revised January 3, 2012; acceptedJanuary 6, 2012; published January 30, 2012 (Doc. ID 151414).
L. Velasco (e-mail: [email protected]), M. Ruiz, and G. Junyent are with theAdvanced Broadband Communications Center (CCABA), Universitat Politècnicade Catalunya (UPC), Barcelona, Spain.
A. Jirattigalachote, P. Monti, and L. Wosinska are with the School ofInformation and Communication Technology (ICT), Royal Institute of Technology(KTH), Kista, Sweden.
Digital Object Identifier 10.1364/JOCN.4.000130
PLIs can be divided into non-linear and linear impairments.Non-linear impairments affect not only each wavelength chan-nel individually, but also cause disturbance and interferenceamong channels traversing the same fiber link. The mostimportant non-linear effects are self-phase modulation (SPM),cross-phase modulation (XPM), and four-wave mixing (FWM).Non-linear impairments become in general apparent as thesignal power increases in long-haul links. On the other hand,linear impairments do not depend on the signal power. Themost important linear impairments are fiber attenuation, am-plifier spontaneous emission (ASE) noise, chromatic dispersion(CD) (or group velocity dispersion (GVD)), and polarizationmode dispersion (PMD). Linear and non-linear PLIs of alightpath can be quantified by using the quality factor Q [1].
To provide good quality lightpaths, PLI information needs tobe taken into account while solving the routing and wavelengthassignment (RWA) problem. RWA consists in finding a physicalroute and in assigning a wavelength to a given connectionrequest. The incorporation of PLI information into the RWAproblem for transparent optical networks has recently receiveda lot of attention, resulting in the development of a number ofimpairment-aware RWA (IA-RWA) algorithms [1–10]. IA-RWAalgorithms can be used either in the network planningphase, when the set of connection requests is known inadvance (off-line algorithms) [2], or in the dynamic lightpathprovisioning upon arrival of connection requests (dynamicalgorithms). In dynamic IA-RWA algorithms, the Q-factor ofcandidate lightpaths is computed during the lightpath setupprocess, and only those lightpaths with a Q-factor above apre-defined threshold are established. Two main approachesfor dynamic IA-RWA can be considered, i.e., centralized anddistributed. A distributed approach offers a shorter setupdelay than a centralized one, but at the expense of a higherblocking probability [3,4]. In this paper, we focus on dynamicIA-RWA algorithm to be used in the distributed control planeof automatically switched optical networks (ASONs) [11].
When non-linear impairments are considered for RWAcomputation at each controller node of a distributed controlplane, the information of the current network state (i.e., whichwavelength channels are used on the fiber links) is neededfor calculating the Q-factor of each wavelength that isend-to-end available for every candidate route. This translatesinto the need for standardized extensions of the generalizedmulti-protocol label switching (GMPLS) protocol set [12] inorder to provide the necessary information for a distributedand accurate IA-RWA computation.
1943-0620/12/020130-12/$15.00 © 2012 Optical Society of America

Velasco et al. VOL. 4, NO. 2/FEBRUARY 2012/J. OPT. COMMUN. NETW. 131
1
2
3
5
7
6
4
1 36
7
54
2
Q_Check(3-7)
Q_Check(2-5)
Control planeLightpath 1-6
set-up signaling
Q_Check(7-6)
Data plane
(2-5)
(3-7)
(2-5)
(7-6)
(3-7)
(7-6)
Fig. 1. (Color online) Example of Q-factor re-computation (Q_Check)when a new lightpath is established in the network.
Extensions of the signaling protocol to collect informationabout the already-established lightpaths along the route of anew lightpath during its setup signaling phase are studiedin [9,10]. Before establishing a new lightpath, the Q-factor ofthe already-established lightpaths sharing common links withthe new one is re-computed to ensure that their signal qualitieswill not be degraded below a specified threshold if the newlightpath were to be established. Figure 1 shows an example ofQ-factor re-computation after the arrival of a new connectionrequest. Assume that three lightpaths (2–5, 3–7, and 7–6)are already established in the optical data plane. When anew request for a connection between nodes 1 and 6 arrives,the RWA algorithm at the source node in the control plane(controller 1) computes a route through the links 1–2, 2–4, 4–5,and 5–6. Note that the new lightpath shares some of thoselinks with the already-established lightpaths, i.e., lightpaths2–5, 3–7, and 7–6. Since establishing a new lightpath mightaffect the signal quality of the already-established ones, theinformation about these lightpaths needs to be collected duringthe new connection setup signaling. At the destination node(controller 6), the Q-factor of both the new and all affectedlightpaths is computed, requiring a new protocol to requestQ-factor re-computation to be standardized. Moreover, if anyof these lightpaths have a Q-factor lower than a pre-definedthreshold, an error needs to be generated followed by anew route re-computation at the source node, and a newsignaling process is started. As a consequence, all theseprocesses, i.e., collecting lightpath information and Q-factorre-computation, not only add complexity and control overhead,but also increase the lightpath setup delay.
Several approaches have been proposed to prevent theprohibitively high control overhead of the (accurate) dis-tributed approach while reducing the lightpath setup delay.The authors of [8] consider impairments as fixed penalties foreach link assuming a fully loaded system, referred to as theworst-case approach. Advantages of this approach are (i) veryshort lightpath setup time (impairments of each link can bepre-computed), and (ii) GMPLS protocol extensions are not
needed. However, the blocking probability obtained using thisapproach might be unnecessarily high.
With respect to the Q-factor, XPM is the dominantnon-linear impairment, the value of the XPM variance beingseveral times greater than that of FWM [13]. For example, fora path with a Q-factor of 7.3 (bit error rate (BER) ≈ 1.44e−13),the values of the variance of XPM and FWM are 1.58e−4 and5.66e−6, respectively. Thus, in this case, the XPM variance ismore than 27 times greater than the FWM variance. Therefore,several works present not only analytical models to computethe XPM, but also ways to accelerate that computation. Theauthors in [14] studied the spectral characteristics of XPM inmulti-span optical systems and found that per span dispersioncompensation is the most effective way to minimize the effectof XPM. In [15], a generalized model of the XPM degradation infiber links consisting of multiple fiber segments with differentcharacteristics and optical amplifiers is presented. Althoughthis original model was subsequently simplified in other works(e.g., [16]), Q-factor computation times were still of the order ofseconds and thus impractical when used in the control plane,even using ad hoc hardware-accelerated computation [17].Other approaches to minimizing setup times in an on-lineprovisioning paradigm resort to the use of guard bands,i.e., leaving unused wavelength channels between lightpathsin order to reduce the effect of XPM [18].
To overcome the deficiencies of the existing IA-RWAapproaches, this paper proposes (i) a statistical model forfast and accurate estimation of XPM noise-like variancewhich allows one to obtain the Q-factor of a given lightpathwith computation times several orders of magnitude lowerwithout employing additional hardware, and (ii) a novel prob-abilistic approach, called SAFIR (statistical approach for fastimpairment-aware RWA), which uses the proposed statisticalXPM model and wavelength channel usage values (obtainedby network characterization) to calculate the Q-factor ofa lightpath without requiring Q-factor re-computation ofalready-established lightpaths or GMPLS extensions. Keepingin mind the lesson learnt from the guard band concept, ourapproach defines a parameter called the channel-interferencenegligible distance (η), which determines the range of neigh-boring wavelength channels that significantly interfere withthe one under study. In contrast with guard bands, channels inthe η range with respect to a given reference channel can beused as long as they can provide a Q value better than a givenQ threshold. Simulation results show that SAFIR drasticallyimproves the network efficiency, achieving performance similarto that of the accurate distributed approach, with a shortercomputation time.
The remainder of this paper is organized as follows.Section II introduces the general impairments model andpresents the proposed statistical XPM model. Section IIIdescribes the SAFIR approach based on network characteri-zation used to apply probability to the IA-RWA process. Thederived statistical XPM model and the probabilistic IA-RWAalgorithm are subsequently applied to different referencenetwork topologies in Section IV. Finally, Section V gives someconcluding remarks.

132 J. OPT. COMMUN. NETW./VOL. 4, NO. 2/FEBRUARY 2012 Velasco et al.
II. IMPAIRMENTS MODEL
This section first presents a description of how the Q-factoris computed, and then it describes in detail the proposedstatistical model for an approximation of the XPM value.
A. Q-factor Computation
As stated above, the effect of both linear and non-linear PLIscan be quantified by using the quality factor Q.
In [1] the authors present a Q-factor estimation model thatincludes the effects of ASE noise, the combined SPM/GVDand optical filtering effects, XPM, and FWM. Here, we extendthat model to include also the power penalty due to PMD.ASE, FWM, and XPM are calculated assuming that theyfollow a Gaussian distribution. The combined SPM/GVD andoptical filtering effects are quantified through an eye closuremetric calculated on the most degraded bit pattern. Thepower penalty due to PMD is calculated based on the lengthof a lightpath, the bit rate, and the fiber PMD parameter.Based on these assumptions, in this paper, the Q-factor ofa lightpath is calculated according to the following equation,where Ptransmitter is the transmitted signal power, peneyeis the relative eye closure penalty attributed to SPM/GVDand optical filtering effects, penPMD is the power penaltydue to PMD, and σ2
ASE, σ2XPM, and σ2
FWM are the electricalvariance of ASE noise, XPM, and FWM, respectively. A detailedanalytical expression of each term in Eq. (1) can be found in [1].
Q = peneye ·Ptransmitter
penPMD ·√σ2
ASE +σ2XPM +σ2
FWM
. (1)
peneye, penPMD, and σ2ASE can be computed beforehand,
since their values do not vary with the load of the network(i.e., the number of currently used wavelength channels).Nonetheless, the values of σ2
XPM and σ2FWM vary with the
load, and they need to be computed for every end-to-endunused wavelength of a candidate route. We computed thevalue of σ2
XPM for several link distances and number ofwavelengths scenarios on a dual-core-based computer with4 Gbytes of RAM, and the computation time took 50 mson average. As will be demonstrated, the lightpath setupprocess with a distributed control plane based on an IA-RWAalgorithm would be of the order of seconds (which is inline with [17]). As explained in the previous section, theQ-factor of each candidate lightpath needs to be evaluatedto choose the best performing lightpath and the Q-factor ofeach already-established lightpath needs to be re-computedto guarantee that the signal quality of already-establishedlightpaths is not affected after establishing a new one. Thisstrategy is obviously impractical in the control plane of ASONs.
To overcome this deficiency, we propose next a statisticalmodel for accurate and fast σ2
XPM computation. Since σ2XPM
is dominant over σ2FWM, the worst-case value of σ2
FWM isassumed in this paper, and thus it can be computed in advance.
B. Statistical XPM Model
Let G(N, E, W) represent a graph of an optical network,where N is the set of nodes, E is the set of fiber links, and Wis the set of wavelengths in ascending order of their respectivefrequencies. Every wavelength in W is assigned a wavelengthchannel labeled from 1 to |W |. Let α(e) be the number ofamplifiers along every link e ∈ E. σ2
XPM(e,λ) represents theXPM noise variance on reference channel λ of the link e, whichsuffers from interference with every other wavelength channelof link e used. σ2
XPM(e,λ, i) is the XPM noise variance onreference channel λ as a consequence of the interference withchannel i of link e.
Aiming at empirically describing the relation betweenσ2
XPM(e,λ) and σ2XPM(e,λ, i), we developed a factorial ex-
periment [19] consisting of thousands of XPM variancecomputations using the analytical model proposed in [16].Each computation is characterized by a unique combination ofexperimental variables: the number of in-line amplifiers alonga link, the number of wavelengths on a link, the referencechannel, and the status of the other channels (i.e., busy orfree). Note that, when the number of busy channels is equalto one, the σ2
XPM(e,λ) value obtained matches a specific case of
σ2XPM(e,λ, i). The results obtained using statistical correlation
are in perfect accordance with the following equation, deducedfrom [15,16], where δ i(e) is a binary variable which is equal to1 if channel i is busy, and 0 otherwise.
σ2XPM (e,λ)=
∑i∈Wi 6=λ
δi(e) ·σ2XPM (e,λ, i) . (2)
In conclusion, each channel occupied by an active lightpathadds some interference to the XPM variance of the referencechannel regardless of the status of the rest of the channels. Dueto this additive behavior, it is possible to find an alternativemodel to calculate σ2
XPM(e,λ) based on the modeling of
σ2XPM(e,λ, i). Note that the value of σ2
XPM(e,λ, i) is computedusing the equation presented in [1], where the effects of signalpower, fiber effective area, fiber length, fiber attenuation,non-linear index coefficient, dispersion coefficient, and thewalk-off parameter between the reference channel λ andchannel i are taken into account.
The first and most straightforward approach (hereafter,the full deterministic approach) consists in pre-computingand storing the whole set of possible σ2
XPM(e,λ, i) values.
σ2XPM(e,λ, i) depends on three discrete variables (i.e., α(e),λ,
and i), which in turn create the set of finite and countableσ2
XPM(e,λ, i) values. In fact, the size of this set is equal to |W |∗(|W | − 1)∗maxAmp, where maxAmp = max{α(e), e ∈ E}. Thisshows that the application of the full deterministic approachprovides an alternative valid method to obtain exact XPMvariance values in an on-line IA-RWA algorithm. However, thesize of σ2
XPM(e,λ, i) might become an issue in real networks.
As will be shown in Section IV, the size of the σ2XPM(e,λ, i) set
grows to the impractical value of 158,000 for 80 wavelengths.
To overcome the drawback of the full deterministicapproach, we propose a two-step approach, referred to as therestricted approximated approach, to reduce the size of the setof possible values necessary to model σ2
XPM(e,λ). The restricted

Velasco et al. VOL. 4, NO. 2/FEBRUARY 2012/J. OPT. COMMUN. NETW. 133
approximated approach aims at (i) reducing the range ofneighboring channels interfering with the reference channel,and (ii) obtaining polynomial models to describe σ2
XPM(e,λ, i).
To determine the range of neighboring channels thatsignificantly interfere with a reference channel, we defined thechannel-interference negligible distance (η) as the parameterrepresenting half of that range. Those channels at a distancegreater that η from the reference channel are assumed tohave negligible XPM interference on the reference channel.Equation (2) is modified to take into account the channel-interference negligible distance η as follows:
σ2XPM (e,λ)=
min(λ+η,|W |)∑i=max(1,λ−η)
δi(e) ·σ2XPM (e,λ, i)+εlink, i 6=λ,
(3)
where εlink represents the error caused by ignoring the effect ofthe channels at a distance greater than η from λ. Equation (3)describes an intermediate step between the full deterministicand the restricted approximated models. Note that when η =|W | − 1 the interference of every wavelength in the opticalspectrum is considered, and the model in Eq. (3) is equal to thefull deterministic model, i.e., εlink = 0. By using the σ2
XPM(e,λ)
model shown in Eq. (3), the number of σ2XPM(e,λ, i) values to
be computed in the worst case is reduced to 2η∗|W |∗maxAmp(from λ−η to λ+η), which, depending on the value of η, can besignificantly smaller than the number of σ2
XPM(e,λ, i) valuesneeded in the full deterministic approach.
The second step of the restricted approximated approach isto find a model that is able to estimate the impact (i.e., interfer-ence) of each channel in the range [λ−η,λ+η] on the value ofσ2
XPM(e,λ). Let s2XPM(e,λ, i) represent an approximate model of
σ2XPM(e,λ, i), such that σ2
XPM(e,λ, i)≈ s2XPM(e,λ, i). Keeping in
mind that σ2XPM(e,λ, i), λ, and α(e) are non-linearly related (as
shown in Section IV), we propose a polynomial model of degreeγ obtained by least squares interpolation [19] using α(e) and λ
as variables. The mathematical formulation of the polynomialis as follows:
s2XPM (e,λ, i)=
∑j∈[1,γ]
ui j ·λ j + ∑k∈[1,γ]
vik ·α(e)k
+ ∑j∈[1,γ]
∑k∈[1,γ]
wi jk ·λ j ·α(e)k +bi ±εpair , (4)
where u, v, w, and b are the polynomial coefficients.The superscripts on the variables in Eq. (4) indicate thecorresponding powers of the polynomial model. The number ofcoefficients of each σ2
XPM(e,λ, i) model is (γ2+2γ+1). Note thatsome of these coefficients could be zero. Moreover, for the sakeof simplicity, we modeled every σ2
XPM(e,λ, i) with the sameparameter γ obtained by adjusting the error of each model toa given target. Thus, the total number of coefficients for therestricted approximated model (Eqs. (3) and (4)) is bounded to2η∗ (γ2 +2γ+1).
The next section presents a provisioning approach that usesthis approximated PLI model, including the XPM model andthe worst case for FWM.
III. THE SAFIR APPROACH
This section presents SAFIR (Statistical Approach for FastImpairment-aware RWA), a provisioning approach that basesits decisions on a probabilistic value of the Q-factor of thelightpaths. SAFIR consists of three phases. First, before thenetwork is put into operation, the network is characterizedby obtaining an on-average usage distribution of each channelfor a given traffic matrix and intensity. In the second phase,i.e., during network operation, a probabilistic IA-RWA isused to accommodate dynamic connection requests. Thisprobabilistic provisioning strategy takes advantage of theapproximated impairments model described in the previoussection. During this phase, the actual traffic distributionis monitored to detect deviations from the expected trafficdistribution used in the first phase. When a significantdiscrepancy is detected, a network re-characterization phase(the third one) is triggered and the new channel usage data isdisseminated to every node in the network. It is worth notingthat the network design problem is out of the scope of thispaper. In this regard, we assume that the traffic matrix usedas a reference has been appropriately designed to cope withshort-term traffic fluctuations, see, e.g., [20], giving as a resultan expected traffic distribution and intensity.
A. Before Operation: Network Characterization
Before putting the network into operation, its potentialbehavior under the expected traffic distribution and intensityneeds to be studied and characterized. The objective of thischaracterization process is to obtain an on-average usagedistribution of each wavelength channel for the predictedtraffic distribution and intensity. To this end, a number ofsimulations are run using a modified first-fit (FF) heuristicfor the wavelength assignment, where the assignment orderis modified to mimic the XPM behavior described in Section IIwith a given η value (i.e., the XPM noise variance is neglectedfor channels at a distance greater than the given η), andwithout blocking any connection request due to a low value ofthe Q-factor.
The complete set of links of the given network is dividedinto several subsets as a function of their usage degree. Weconsider two subsets: subset 1, consisting of the most usedlinks, i.e., mainly links with short physical distance; and subset2, consisting of the least used links. Figure 2 shows an exampleof the cumulative distribution function of the usage probabilityobtained for three channels on links of subset 1 and subset2 of the European Optical Network—Basic Topology, EON-BT(presented in Section IV). As shown in the figure, channels insubset 1 have a higher usage probability than the channelsin subset 2. For instance, channel #9 is expected to be usedwith a probability of roughly 90% on links in subset 1 and witha probability of around 60% on links in subset 2. Note thata worst-case approach, which assumes that every channel isin use on every link [8], can be replaced with a probabilisticworst case using these probabilities. This already entails asignificant improvement of the proposed probabilistic approachwith respect to the worst-case one.

134 J. OPT. COMMUN. NETW./VOL. 4, NO. 2/FEBRUARY 2012 Velasco et al.
0%
10%
20%
30%
40%
50%
60%
70%
80%
90%
100%wl_0wl_2wl_9
= 0.8
= 0.9
= 0.95
Subset 2
Subset 1
Usage probability
Cum
ulat
ive
dist
ribu
tion
func
tion
0% 10% 20% 30% 40% 50% 60% 70% 80% 90% 100%
Fig. 2. (Color online) Cumulative distribution function of usageprobability for three wavelength channels in links of subsets 1 and 2.Accuracy levels of 0.8, 0.9, and 0.95 are also shown.
Furthermore, we defined an accuracy level (ρ) by under-sizing the usage probability and assuming some small error.As shown in Fig. 2, three accuracy levels are considered (0.8,0.9, and 0.95), thus obtaining different usage probabilities. Forinstance, wavelength channel #9 is in use with a probability of∼0.29, ∼0.35, and ∼0.41 on links in subset 2 assuming ρ equalto 0.8, 0.9, and 0.95, respectively.
As the final result of this stage, the usage probability (pi(e))of each wavelength channel i on the links in the definedsubsets is obtained. These values will be used to compute aprobabilistic Q-factor of each of the lightpaths to be establishedover the network.
B. In Operation: Probabilistic Q-factor
With SAFIR, a probabilistic version of the Q-factor definedin Eq. (1) is computed for each candidate route. Followingthe approximated PLI model defined in Section II, peneye,
penPMD, σ2ASE, and σ2
FWM are pre-computed and stored ateach controller node in the control plane. A set of valuesof peneye covering a specific range of lightpath distanceare also pre-computed. On the other hand, the XPM noisevariance for a given wavelength channel on a specific linkis calculated by using the model presented in Eq. (4). Notethat Eq. (3) cannot directly be applied in the context ofSAFIR since the Q-factor of already-established lightpaths isnot re-computed. Furthermore, although the usage status ofevery wavelength channel is flooded in the network, making itpossible to calculate the current Q-factor, the value obtainedmight be immediately outdated as a consequence of thenetwork dynamics. For these reasons, the deterministic δi(e)in Eq. (3) is substituted by the usage probability (pi(e)), and aprobabilistic version of the restricted approximated approachdescribed in Section II can be obtained as follows, where theσ2
XPM(e,λ) value computed represents a probabilistic boundwith a given accuracy level of the XPM noise variance that alightpath would experience on link e under the expected trafficdistribution and offered load.
TABLE ISAFIR’S PROBABILISTIC IA-RWA ALGORITHM
IN network, set of k_routes, Q_thresholdOUT route and wavelength1: Route candidateRoute2: initialize w ← 0;bestQ ← 03: for each route r i in k_routes do4: for each wavelength wi in W do5: if wi is end-to-end available in r i then6: thisQ ← compute prob. Q-factor(network, r i ,wi)7: if (thisQ > bestQ) then8: candidateRoute ←r i9: w ←wi ;bestQ ← thisQ10: if no candidateRoute found then11: return no route, lack of resources12: if bestQ <Q_ threshold then13: return no route, Q reasons14: return candidateRoute in wavelength w
Unavailable periodtime
On average QQ
Q_threshold
Instantaneous Q
Fig. 3. (Color online) Evaluation of the Q-factor of an opticalconnection.
σ2XPM(e,λ)=
min(λ+η,|W |)∑max(1,λ−η)
i 6=λ
pi(e) · s2XPM(e,λ, i). (5)
Using the above probabilistic Q-factor, Table I presents thepseudo-code of an algorithm that selects a route, from a setof pre-computed routes for the source and destination nodesof a connection request, and assigns a wavelength so that itsprobabilistic Q-factor is better than a given threshold. Foreach candidate route, the algorithm computes the probabilisticQ-factor of every unused wavelength channel and choosesthe lightpath with the maximum Q value. If no candidateroute is found, the request is blocked due to insufficientresources. If the Q-factor of the lightpath found is lowerthan a given Q_threshold, the connection request is blockedas a consequence of impairments constraints. Otherwise, thesignaling of the connection request on the route found usingthe assigned wavelength starts. In the SAFIR approach, eachsource controller node runs this algorithm for every incomingconnection request.
Although lightpaths are established only when theirprobabilistic Q-factor is above the threshold, there is noguarantee that a lightpath will not experience an XPM noisehigher than the prediction. This in turn will lead to a lowerQ-factor during part of its holding time (instantaneousQ). Toquantify the insufficient Q-factor experienced by a lightpath,we propose to adopt the concept of availability. Similar to theavailability defined in fault recovery [21], an optical connectionbecomes quality-of-transmission- (QoT-) unavailable when itexperiences a BER higher than the requested threshold.Otherwise it remains QoT-available (Fig. 3). Connection QoT-availability (QoT−A) is defined as the ratio between the time

Velasco et al. VOL. 4, NO. 2/FEBRUARY 2012/J. OPT. COMMUN. NETW. 135
that a connection is QoT-available (i.e., satisfies the opticalsignal quality requirement) and the total time the connectionis established in the network. Therefore, the inaccuracy of thedecisions made by SAFIR can be quantified in terms of theQoT-unavailability (QoT−U) of the provisioned connections (ortheir complementary QoT-availability, QoT−A = 1−QoT−U).Note, however, that even in the case of a lightpath experiencingQoT-unavailability, its on-averageQ value, measured over alonger time period, might be above the required Q threshold,as shown in Fig. 3. In this regard, the on-averageQ (BER)is the performance metric to be considered for service levelagreements (SLAs) between network operators and customers.
C. Changes in the Traffic Distribution: Re-charact-erization
We assumed that a traffic distribution is forecasted in thenetwork characterization phase. During network operation,traffic analysis must be done in order to determine the accu-racy of traffic forecast. It is obvious that any characterizationincludes some error. Let us assume a standard confidencelevel of 95%. According to this assumption, some differencesbetween the forecasted and the real traffic distributionmay exist. In addition, the traffic distribution can changein the long term. Thus, a mechanism to trigger networkre-characterization when the real traffic distribution moves toa new distribution (with a difference that is bigger than theconfidence interval considered) must be devised. This adaptivemechanism is based on the monitoring of the traffic patternto detect deviations with respect to the forecasted trafficdistribution.
It is important to distinguish whether the deviations in thetraffic distribution are within the confidence interval or not. Inthe latter case, a network re-characterization is triggered. Thechi-squared test [19] can be used to this end.
IV. PERFORMANCE EVALUATION
This section evaluates the PLI model proposed in Section II.First, the networks considered are characterized to obtainthe expected fiber usage values that will be applied bySAFIR. Then these networks are put into operation andthe performance of SAFIR is evaluated in terms of blockingprobability, QoT-availability, and setup time.
A. PLI Model Validation
Recall that our PLI model includes a statistical XPM modeland assumes the worst case for FWM.
To minimize the XPM model’s error while keeping the size ofthe model at a moderate level, the value of parameters η and γof the XPM model in Eqs. (3) and (4) need to be determined.We first studied the impact of η over both the number ofpolynomial models considered and the amount of informationthat the XPM model incorporates (i.e., the relative effect of2 ∗ η neighbor channels over the XPM variance for a given
0.8
0.9
1
0.8
0.9
1
0.9660.97
Fit
0 4 8 12 16 20
Goo
dnes
s-of
-fit
(R2 )
0 2 4 6 8 10
η γ
Fig. 4. (Color online) Selection of η and γ values. Fit of σ2XPM(e,λ)
against η (left) and goodness of fit of the XPM model against γ(η = 4)(right).
5e–7
5e–6
5e–5
5e–4
α(e) =3
α(e) =8
α(e) =1 3
α(e) =1 8
α(e) =2 3
Wavelength #
s2XPM
0 10 20 30 40 50 60 70 80
XPM
XPM
XPM
Fig. 5. (Color online) Analytical-to-statistical comparison for i =λ+1.
reference channel). Using Eq. (3), the amount of information inσ2
XPM(e,λ) against η is plotted in Fig. 4. The figure shows thatη= 4 adds about 97% of the total XPM effect, which, as will beproved, is enough for the model. Next, we used this value in ourXPM statistical model and we applied a polynomial fitting [19]over a set of data which included 80 wavelengths for eachof the 2∗ηs2
XPM(e,λ, i) models. Several γ-degree polynomialswere fitted, and the level of accuracy in terms of the Pearsoncorrelation coefficient (R2) [19] is plotted in Fig. 4. As shown,5-degree polynomials can be used while providing R2 values≥ 96%.
Using these values for η and γ, our restricted approximatedXPM model was compared against the analytical model in [16].The solid lines in Fig. 5 present σ2
XPM(e,λ, i) values for i =λ+ 1 of the links, with α(e) ranging from 3 to 23 and withλ = 1. . .79. The dotted lines show s2
XPM(e,λ, i) values for thesame range of values of α(e) and λ as before. It can be clearlyseen that the values of XPM variance obtained by using ourproposed statistical model are very close to that derived fromthe analytical model. The error introduced by the statisticalmodel is shown as a function of the value of σ2
XPM in Fig. 6.
The vast majority of σ2XPM values are obtained with an error
lower than ±5%, but a few of them are computed with highererror. However, most of these higher error values correspondto a low σ2
XPM value that adds a low or negligible total errorto the final Q-factor value of a lightpath, as will be proved

136 J. OPT. COMMUN. NETW./VOL. 4, NO. 2/FEBRUARY 2012 Velasco et al.
–5%
–10%
0%
5%
10%
Err
or (
%)
1e–6 1e–5 1e–4
Fig. 6. (Color online) Analytical-to-statistical error as a function ofσ2
XPM(e,λ, i) for η= 4 and γ= 5.
next. Interestingly, for higher σ2XPM values the error is within
±2.5%. In addition to these results, a final validation of thestatistical model applied to end-to-end lightpath provisioningis performed and presented later in this section.
Regarding the size of the XPM model, Table II shows thenumber of coefficients that need to be stored for the differentXPM models in the case of fiber links with up to 25 amplifiers(i.e., up to 2000 km) using 40 or 80 wavelengths. It is worthnoting that the number of coefficients to be stored is only 288in the case of our restricted approximated model. In addition,note that the number of coefficients in the proposed model isnot even dependent on the number of wavelengths considered.
The size of the complete PLI model, however, is slightlylarger, since all other impairments are also pre-computed andstored. The number of peneye values to be stored depends onthe assumptions for the values of the longest distance possiblefor a path and for the distance granularity. In our approach,a longest distance of 10,000 km and a distance granularity of25 km are assumed, and thus 400 peneye values are storedat each controller node. Moreover, |E| values for penPMD, |E|for σ2
ASE, and |E| ∗ |W | values for the worst-case σ2FWM are
also stored. In case of a network with 20 optical links and 80wavelengths, our approach requires storing at each controllernode in the control plane only 2328 PLI values, including theXPM variance.
Although the statistical XPM model has proved to providelow relative error (only 6%) when computing the XPM varianceof a given link, it should also be validated to compute the
TABLE IINUMBER OF COEFFICIENTS AND RELATIVE ERROR OF EACH
MODEL
|W | = 40 |W | = 80Relative error(εlink)
Full deterministic 39,000 158,000 0%Restricted (η= 4) 8000 16,000 3%Restricted approximated(η= 4 γ= 5)
288 6%
Q-factor of lightpaths, specifically when a decision needs tobe taken to accept or block a lightpath. To this end, andfor the rest of our experiments, we used three networktopologies: (i) the 16-node basic topology of the EON-BT [22],(ii) the 28-node ring topology of the European optical network(EON-RT) [22], and (iii) the 17-node NSF east networktopology (NSF-East) [23]. These three network topologies wereselected by considering their different average nodal degreeand link length. Figure 7 shows the topologies consideredand reviews their most relevant characteristics. Moreover, weassumed Q_threshold= 6(BER≈ 1e−9).
The proposed PLI model is validated using the networktopologies considered. We run several simulations for twovalues of offered network load, i.e., low and high, and theRWA decisions made by an exact analytical model [1] andour approximated impairments model are compared. Table IIIshows that the proposed PLI model makes incorrect decisionsonly in less than 0.11% of all cases. These results ensure thatour model is responsible only for a negligible increment in theblocking probability.
B. Network Characterization
As described in Section III, before putting SAFIR intooperation, an on-average usage distribution of each wavelengthchannel for a given traffic distribution and intensity should beobtained. To achieve this, we developed an ad hoc event-drivensimulator in Matlab [24]. A dynamic network environment wassimulated for the networks under study, in which incomingconnection requests arrive at the system following a Poissonprocess and are sequentially served without prior knowledgeof future incoming connection requests. The holding time ofthe connection requests is exponentially distributed with amean value equal to 2 h. Source/destination pairs are randomlychosen with equal probability (uniform distribution) among allnetwork nodes. Different values of the offered network loadare created by changing the arrival rate while keeping themean holding time constant. Furthermore, it is assumed thatthe bandwidth demand of each connection request is equal toone wavelength unit and that wavelength conversion capabilityis not available, i.e., the wavelength continuity constraint isenforced.
Figure 8 shows an example of the values obtained for pi(e)on a link e with a maximum capacity of 40 wavelengths forthe accuracy levels considered using η = 4 and γ = 5. It can benoticed that η affects the usage probability of the wavelengthchannels, since a clear distribution for the pi(e) values can beidentified. For instance, wavelength channels #0 and #39 havesignificantly higher usage probability as compared to channels#1. . . #η and #(39−η). . . #38.
C. SAFIR Performance Evaluation
The performance of SAFIR was compared against twobenchmarking impairment-aware strategies, i.e., a distributedapproach and a worst-case approach.
The distributed approach, referred to as the impairment-aware current state (IA-CS), computes the Q-factor of each

Velasco et al. VOL. 4, NO. 2/FEBRUARY 2012/J. OPT. COMMUN. NETW. 137
Fig. 7. (Color online) Network topologies considered: (a) 16-node EON-BT [22], (b) 17-node NSF-East [23], and (c) 28-node EON-RT [22].
TABLE IIIPLI MODEL FINAL VALIDATION (Q DECISIONS)
EON-BT EON-RT NSF-East
Load (Erlangs) 270 330 210 300 270 360
Decisions 10,027 9936 10,010 10,000 10,035 10,020Wrong 0 1 0 1 0 11% 0 0.01 0 0.01 0 0.11
candidate lightpath using the current state of the network. Forthis reason IA-CS requires accurate and complete knowledgeof the network resource usage. IA-CS works as follows. If theQ-factor of a candidate lightpath is lower than Q_threshold,the connection request is rejected; if the Q-factor is higherthan Q_threshold, IA-CS makes sure that this candidatelightpath will not affect the already-established connectionsby re-computing the Q-factor of the existing lightpaths thatshare fiber links with the new lightpath. If the Q-factor of everyalready-established lightpath is higher than the threshold, thenew lightpath is established; otherwise, the connection requestis blocked.
The worst-case approach, referred to as the Impairment-aware Worst Case (IA-WC), assumes that all wavelengths arein use on every link of the network, and hence the Q-factor isnot dependent on the load of the links. With this strategy, theinformation about the current network state is not needed andthe Q-factor re-computation of already-established lightpathsis not necessary.
Ad hoc event-driven simulators for all approaches consid-ered were implemented in Matlab. The number of shorterroutes (k) was fixed to 10 for all cases. We conducted anumber of simulations using the previously described uniformtraffic distribution. For all the blocking probability results, thesimulation time was set to achieve a confidence interval of 5%or better, with 95% confidence level.
Figure 9 shows the total blocking probability accountingfor both blocking due to insufficient resources, i.e., when no
20%
30%
40%
50%
60%
70%
1050 15 20 25 30 35
= 0.8
= 0.9
= 0.95
~ ~
Usa
ge p
roba
bilit
y
wavelength #
Fig. 8. Usage probability of each wavelength in a link (|W | = 40) foraccuracy levels of 0.8, 0.9, and 0.95, using η= 4 and γ= 5.
wavelength is available, and due to impairment constraints,i.e., when none of the candidate lightpaths can meetQ_threshold. To find the lower bound on the total blockingprobability we applied a conventional shortest path routingapproach with FF wavelength assignment, referred to asNoIA-RWA, i.e., a connection request is blocked due toinsufficient resources only. Different values of the offerednetwork load are considered in each network topology tested
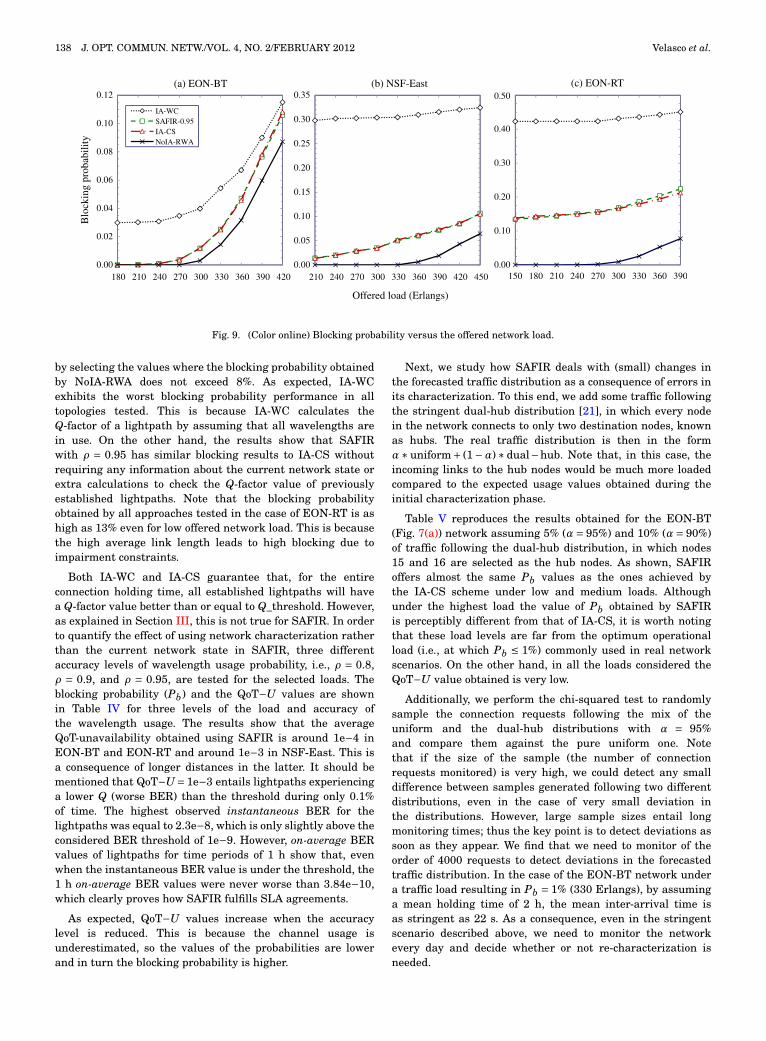
138 J. OPT. COMMUN. NETW./VOL. 4, NO. 2/FEBRUARY 2012 Velasco et al.
0.00
0.02
0.04
0.06
0.08
0.10
0.12
180 210 240 270 300 330 360 390 420
IA-WCSAFIR-0.95IA-CSNoIA-RWA
0.00
0.05
0.10
0.15
0.20
0.25
0.30
0.35
210 240 270 300 330 360 390 420 4500.00
0.10
0.20
0.30
0.40
0.50B
lock
ing
prob
abili
ty
300270240210180150 330 360 390
Offered load (Erlangs)
(a) EON-BT (b) NSF-East (c) EON-RT
Fig. 9. (Color online) Blocking probability versus the offered network load.
by selecting the values where the blocking probability obtainedby NoIA-RWA does not exceed 8%. As expected, IA-WCexhibits the worst blocking probability performance in alltopologies tested. This is because IA-WC calculates theQ-factor of a lightpath by assuming that all wavelengths arein use. On the other hand, the results show that SAFIRwith ρ = 0.95 has similar blocking results to IA-CS withoutrequiring any information about the current network state orextra calculations to check the Q-factor value of previouslyestablished lightpaths. Note that the blocking probabilityobtained by all approaches tested in the case of EON-RT is ashigh as 13% even for low offered network load. This is becausethe high average link length leads to high blocking due toimpairment constraints.
Both IA-WC and IA-CS guarantee that, for the entireconnection holding time, all established lightpaths will havea Q-factor value better than or equal to Q_threshold. However,as explained in Section III, this is not true for SAFIR. In orderto quantify the effect of using network characterization ratherthan the current network state in SAFIR, three differentaccuracy levels of wavelength usage probability, i.e., ρ = 0.8,ρ = 0.9, and ρ = 0.95, are tested for the selected loads. Theblocking probability (Pb) and the QoT−U values are shownin Table IV for three levels of the load and accuracy ofthe wavelength usage. The results show that the averageQoT-unavailability obtained using SAFIR is around 1e−4 inEON-BT and EON-RT and around 1e−3 in NSF-East. This isa consequence of longer distances in the latter. It should bementioned that QoT−U= 1e−3 entails lightpaths experiencinga lower Q (worse BER) than the threshold during only 0.1%of time. The highest observed instantaneous BER for thelightpaths was equal to 2.3e−8, which is only slightly above theconsidered BER threshold of 1e−9. However, on-average BERvalues of lightpaths for time periods of 1 h show that, evenwhen the instantaneous BER value is under the threshold, the1 h on-average BER values were never worse than 3.84e−10,which clearly proves how SAFIR fulfills SLA agreements.
As expected, QoT−U values increase when the accuracylevel is reduced. This is because the channel usage isunderestimated, so the values of the probabilities are lowerand in turn the blocking probability is higher.
Next, we study how SAFIR deals with (small) changes inthe forecasted traffic distribution as a consequence of errors inits characterization. To this end, we add some traffic followingthe stringent dual-hub distribution [21], in which every nodein the network connects to only two destination nodes, knownas hubs. The real traffic distribution is then in the formα∗uniform+ (1−α)∗ dual−hub. Note that, in this case, theincoming links to the hub nodes would be much more loadedcompared to the expected usage values obtained during theinitial characterization phase.
Table V reproduces the results obtained for the EON-BT(Fig. 7(a)) network assuming 5% (α= 95%) and 10% (α= 90%)of traffic following the dual-hub distribution, in which nodes15 and 16 are selected as the hub nodes. As shown, SAFIRoffers almost the same Pb values as the ones achieved bythe IA-CS scheme under low and medium loads. Althoughunder the highest load the value of Pb obtained by SAFIRis perceptibly different from that of IA-CS, it is worth notingthat these load levels are far from the optimum operationalload (i.e., at which Pb ≤ 1%) commonly used in real networkscenarios. On the other hand, in all the loads considered theQoT−U value obtained is very low.
Additionally, we perform the chi-squared test to randomlysample the connection requests following the mix of theuniform and the dual-hub distributions with α = 95%and compare them against the pure uniform one. Notethat if the size of the sample (the number of connectionrequests monitored) is very high, we could detect any smalldifference between samples generated following two differentdistributions, even in the case of very small deviation inthe distributions. However, large sample sizes entail longmonitoring times; thus the key point is to detect deviations assoon as they appear. We find that we need to monitor of theorder of 4000 requests to detect deviations in the forecastedtraffic distribution. In the case of the EON-BT network undera traffic load resulting in Pb = 1% (330 Erlangs), by assuminga mean holding time of 2 h, the mean inter-arrival time isas stringent as 22 s. As a consequence, even in the stringentscenario described above, we need to monitor the networkevery day and decide whether or not re-characterization isneeded.

Velasco et al. VOL. 4, NO. 2/FEBRUARY 2012/J. OPT. COMMUN. NETW. 139
TABLE IVBLOCKING PROBABILITY AND QOT-UNAVAILABILITY OF LIGHTPATHS USING SAFIR FOR DIFFERENT ACCURACY LEVELS
Low Load Medium Load High Load
Network ρ Pb QoT-U Pb QoT-U Pb QoT-U
EON-BT0.95 0% 0 1.19% 1.20e−5 10.60% 1.03e−40.9 0% 0 1.18% 2.38e−5 10.55% 1.27e−40.8 0% 0 1.13% 2.76e−5 10.33% 1.64e−4
NSF-East0.95 1.43% 1.26e−3 5.00% 1.86e−3 10.64% 2.44e−30.9 1.40% 1.31e−3 4.44% 1.85e−3 10.33% 2.68e−30.8 1.03% 1.57e−3 4.36% 1.96e−3 10.32% 2.78e−3
EON-RT0.95 13.49% 1.62e−5 15.69% 1.85e−4 22.41% 1.82e−60.9 12.85% 1.63e−5 14.73% 2.04e−4 21.42% 1.85e−50.8 12.09% 1.87e−5 13.63% 2.57e−4 20.36% 2.04e−5
TABLE VPb AND QOT-U CONSIDERING TRAFFIC DISTRIBUTION DEVIATIONS
Low Load Medium Load High Load
Dual-hub traffic Approach Pb QoT−U Pb QoT−U Pb QoT−U
5% SAFIR 0 0 1.2% 0 9.8% 0IA-CS 0 1.3% 12.7%
10% SAFIR 0 0 1.6% 7.7e−6 9.9% 7.4e−5IA-CS 0 1.5% 12.8%
TABLE VIMEAN TIMES CONSIDERED
tRWA 20 ms tOCC 0.5 mstlink 0.25 ms
+propagation timetswitch 5 ms
tconfig 2 ms
As mentioned in the introduction, the Q-factor computationtime strongly impacts the lightpath setup times when anIA-CS strategy is used. In order to better assess theadvantages of SAFIR, we quantified the lightpath setuptimes (tsetup) using an equation similar to the one presentedin [25], but adding the Q-factor computation time to consider aPLI-aware environment. tsetup can be computed as
tsetup = tRWA + (2n−1) · tOCC +2 · (n−1) · tlink + tconfig
+ tswitch + q · tQ , (6)
where tRWA represents the computation time of the RWAalgorithm (excluding the Q-factor computation), tQ is theQ-factor computation time, tOCC is the processing time in eachcontroller in the control plane, tlink is the propagation delay ineach control network link, tconfig is the software configurationtime of an optical node, tswitch is the time to perform theoptical switching, n represents the number of nodes traversedby the lightpath, and q is the number of Q-factor computations.Note that q includes both the number of Q-factor computationsperformed during the wavelength assignment process of a newlightpath and the number of computations needed to checkalready-established lightpaths, which could be calculated inparallel. Table VI specifies the values used for the parameters,which are in line with those in [25].
Two general strategies for the wavelength assignmentprocess were considered to compare the setup times: (i) firstfit (WA-FF), in which the first end-to-end available wavelength
Hardware-acceleratedcomputation
Computation by software
1e+1
1e+2
1e+3
1e+4
1e+5
10 00 300 400 500 600 700 800 900 1000
WA-FF q=2 WA-BFWA-FF q=3 SAFIRWA-FF q=4
t set
-up
(ms)
tQ (ms)
Fig. 10. (Color online) Lightpath setup time as a function of Q_factorcomputation time using the standard IA-CS strategy. The performanceof the SAFIR approach is shown for comparison.
with a Q value higher than the threshold is selected, thusminimizing the number of Q-factor computations, and (ii) bestfit (WA-BF), in which the wavelength with the best Q valueis selected after computing the Q-factor of every end-to-endavailable wavelength. A Q-factor computation time of the orderof 100 ms can be obtained using specific dedicated hardware,whereas the time to compute the Q-factor without specialhardware is in the order of seconds [10,17].
Figure 10 plots the lightpath setup time as a function of thetime needed to compute the Q-factor using the IA-CS strategywith both WA-FF and WA-BF. The route of all lightpathsconsidered consisted of four nodes (n = 4) with 600 km fiberlinks. For comparison purposes, the setup times achieved bySAFIR are also plotted assuming q = 1 and tQ = 10 ms. The

140 J. OPT. COMMUN. NETW./VOL. 4, NO. 2/FEBRUARY 2012 Velasco et al.
figure shows that a setup time shorter than 100 ms can beachieved by using SAFIR while a setup time of one or of severalseconds is needed using the IA-CS strategy. It is worth notingthat even by using the WA-FF heuristic at least two Q-factorcomputations can be expected, one to assign the wavelengthand then, once the Q_threshold is checked, another for thealready-established lightpaths.
V. CONCLUSIONS
In this paper, a PLI model for fast Q-factor computationin optical transparent WDM networks was proposed. Thismodel includes a statistical estimation of XPM. The accuracyof the model was validated via simulations. It was shown thatour statistical model obtains the XPM noise variance withmaximum 6% error when compared to the values offered byan analytical model. Moreover, the PLI model made a correctlightpath selection in 99.89% of all the cases, compared to anexact analytical impairments model.
Based on the advantages of our PLI model, a novelstatistics-based approach for fast impairment-aware RWA,referred to as SAFIR, was proposed. SAFIR uses networkcharacterization combined with the validated PLI model tocompute a probabilistic version of the lightpath Q-factor. Inthis way the information about the current network state is notneeded, implying no extension of GMPLS. In light of the resultsobtained, the total blocking probability achieved by SAFIR wasvery close to the one computed via a distributed approach inall network topologies tested for different accuracy levels ofwavelength channel usage probability.
Since the statistical values for channel usage in each linkmay affect the quality of the lightpaths provisioned by SAFIR,the QoT−U concept related to excessive BER was introducedto evaluate the inaccuracy of the proposed approach. In theentire set of the performed tests, the QoT−U of all establishedlightpaths was kept below 1e−3. Even for that QoT−U value,the 1 h on-average BER values were always above thethreshold.
Finally, lightpath setup times achieved by SAFIR were com-pared against those using the IA-CS strategy in distributed en-vironments. As proved, SAFIR offers setup times shorter than100 ms instead of several seconds obtained by the IA-CS strat-egy together with hardware-accelerated Q-factor computation.
In conclusion, SAFIR removes the prohibitively high controloverhead of the IA distributed approaches while providingcomparable network performance.
ACKNOWLEDGMENTS
A preliminary version of this paper was presented at theOFC Conference in 2010. The work presented in this paperwas supported by the Network of Excellence “Building theFuture Optical Network in Europe” (BONE), funded bythe European Commission through the 7th ICT—FrameworkProgramme, and by the Spanish science ministry through theTEC2011-27310 ELASTIC project.
REFERENCES
[1] A. Jirattigalachote, P. Monti, L. Wosinska, K. Katrinis, andA. Tzanakaki, “ICBR-Diff: an impairment constraint based rout-ing strategy with quality of signal differentiation,” J. Networks,vol. 5, pp. 1279–1289, 2010.
[2] P. Pavon-Marino, S. Azodolmolky, R. Aparicio-Pardo, B. Garcia-Manrubia, Y. Pointurier, M. Angelou, J. Sole-Pareta, J. Garcia-Haro, and I. Tomkos, “Offline impairment aware RWA algo-rithms for cross-layer planning of optical networks,” J. LightwaveTechnol., vol. 27, pp. 1763–1775, 2009.
[3] R. Martinez, C. Pinart, F. Cugini, N. Andriolli, L. Valcarenghi,P. Castoldi, L. Wosinska, J. Comellas, and G. Junyent, “Chal-lenges and requirements for introducing impairment-awarenessinto the management and control planes of ASON/GMPLS WDMnetworks,” IEEE Commun. Mag., vol. 44, no. 12, pp. 76–85, 2006.
[4] F. Agraz, S. Azodolmolky, M. Angelou, J. Perelló, L. Velasco,S. Spadaro, A. Francescon, C. V. Saradhi, Y. Pointurier, P. Kokki-nos, E. Varvarigos, M. Gunkel, and I. Tomkos, “Experimentaldemonstration of centralized and distributed impairment-awarecontrol plane schemes for dynamic transparent optical net-works,” in Optical Fiber Communication Conf. (OFC), 2010,PDPD5.
[5] S. Azodolmolky, M. Klinkowski, E. Marín, D. Careglio, J. Solé-Pareta, and I. Tomkos, “A survey on physical layer impairmentsaware routing and wavelength assignment algorithms in opticalnetworks,” Comput. Netw., vol. 53, pp. 926–944, 2009.
[6] R. Cardillo, V. Curri, and M. Mellia, “Considering transmissionimpairments in wavelength routed networks,” in Conf. on OpticalNetworking Design and Modeling (ONDM), 2005, pp. 421–429.
[7] D. Monoyios and K. Vlachos, “Multiobjective genetic algorithmsfor solving the impairment-aware routing and wavelength as-signment problem,” J. Opt. Commun. Netw., vol. 3, pp. 40–47,2011.
[8] S. Pachnicke, T. Paschenda, and P. Krummrich, “Assessment ofa constraint-based routing algorithm for translucent 10 Gbits/sDWDM networks considering fiber non-linearities,” J. Opt. Netw.,vol. 7, pp. 365–377, 2008.
[9] E. Salvadori, Y. Yabin, C. Saradhi, A. Zanardi, H. Woesner,M. Carcagni, G. Galimberti, G. Martinelli, A. Tanzi, and D. LaFauci, “Distributed optical control plane architectures for han-dling transmission impairments in transparent optical net-works,” J. Lightwave Technol., vol. 27, pp. 2224–2239, 2009.
[10] S. Azodolmolky, J. Perelló, M. Angelou, F. Agraz, L. Velasco,S. Spadaro, Y. Pointurier, A. Francescon, C. Vijaya, P. Kokkinos,E. Varvarigos, S. Al Zahr, M. Gagnaire, M. Gunkel, D. Kloni-dis, and I. Tomkos, “Experimental demonstration of an impair-ment aware network planning and operation tool for transpar-ent/translucent optical networks,” J. Lightwave Technol., vol. 29,pp. 439–448, 2011.
[11] “Architecture for the automatically switched optical network(ASON),” ITU Recommendation G.8080/Y.1304, Nov. 2001.
[12] E. Mannie, “Generalized multi-protocol label switching (GMPLS)architecture,” IETF RFC-3945, 2004.
[13] S. Ten, K. Ennser, J. Grochocinski, S. Burtsev, and V. daSilva,“Comparison of four-wave mixing and cross phase modulationpenalties in dense WDM systems,” in Optical Fiber Communi-cation Conf. (OFC), 1999, pp. 43–45.
[14] R. Hui, K. Demarest, and C. Allen, “Cross-phase modulation inmultispan WDM optical fiber systems,” J. Lightwave Technol.,vol. 17, pp. 1018–1026, 1999.
[15] A. Cartaxo, “Cross-phase modulation in intensity modulation-direct detection WDM systems with multiple optical amplifiers

Velasco et al. VOL. 4, NO. 2/FEBRUARY 2012/J. OPT. COMMUN. NETW. 141
and dispersion compensators,” J. Lightwave Technol., vol. 17, pp.178–190, 1999.
[16] S. Pachnicke and E. Voges, “Analytical assessment of the Q-factordue to cross-phase modulation (XPM) in multispan WDM trans-mission systems,” Proc. SPIE, vol. 5247, pp. 61–70, 2003.
[17] Y. Qin, S. Azodolmolky, M. Gunkel, R. Nejabati, and D. Sime-onidou, “Hardware accelerated impairment-aware control planefor future optical networks,” IEEE Commun. Lett., vol. 15, pp.1004–1006, 2011.
[18] N. Sambo, M. Secondini, F. Cugini, G. Bottari, P. Iovanna, F. Cav-aliere, and P. Castoldi, “Modeling and distributed provisioningin 10–40–100-Gb/s multirate wavelength switched optical net-works,” J. Lightwave Technol., vol. 29, pp. 1248–1257, 2011.
[19] D. Montgomery, Design and Analysis of Experiments. Wiley &Sons, 2004.
[20] D. Leung and W. Grover, “Capacity planning of survivablemesh-based transport networks under demand uncertainty,”Photonic Network Commun., vol. 10, pp. 123–140, 2005.
[21] W. Grover, Mesh-Based Survivable Transport Networks: Optionsand Strategies for Optical, MPLS, SONET and ATM Networking.Prentice Hall, 2003.
[22] S. Maesschalck, D. Colle, I. Lievens, M. Pickavet, P. Demeester,C. Mauz, M. Jaeger, R. Inkret, B. Mikac, and J. Derkacz,“Pan-European optical transport networks: An availability-basedcomparison,” Photonic Network Commun., vol. 5, pp. 203–225,2003.
[23] L. Song and B. Mukherjee, “Accumulated-downtime-orientedrestoration strategy with service differentiation in survivableWDM mesh networks,” J. Opt. Commun. Netw., vol. 1, pp.113–124, 2009.
[24] MATLAB [Online]. Available: http://www.mathworks.com/products/matlab/.
[25] L. Velasco, F. Agraz, R. Martínez, R. Casellas, S. Spadaro,R. Muñoz, and G. Junyent, “GMPLS-based multi-domain restora-tion: Analysis, strategies, policies and experimental assessment,”J. Opt. Commun. Netw., vol. 2, pp. 427–441, 2010.
Related Documents


![APPAAS: PROVISIONING OF CONTEXT-AWARE MOBILE … › obj › thesescanada › vol2 › ... · applications available for Android devices [48] and 585,000 applications available for](https://static.cupdf.com/doc/110x72/5f1a1d671eec6c62370a4340/appaas-provisioning-of-context-aware-mobile-a-obj-a-thesescanada-a-vol2-a.jpg)
