Materials 2012, 5, 12-26; doi:10.3390/ma5010012 materials ISSN 1996-1944 www.mdpi.com/journal/materials Article Statistical and Graphical Assessment of Circumferential and Radial Hardness Variation of AISI 4140, AISI 1020 and AA 6082 Aluminum Alloy Hamad Al-Khalid, Ayman Alaskari and Samy Oraby * Department of Mechanical Production Technology, College of Technological Studies, The Public Authority of Applied Education and Training (PAAET), P.O. Box 38322, Dhaya Abdalla Alsalim 72254, Kuwait; E-Mails: [email protected] (H.A.-K.); [email protected] (A.A.) * Author to whom correspondence should be addressed; E-Mail: [email protected]; Tel.: +965-99549119; Fax: +965-24832761. Received: 17 October 2011; in revised form: 6 December 2011 / Accepted: 15 December 2011 / Published: 23 December 2011 Abstract: Hardness homogeneity of the commonly used structural ferrous and nonferrous engineering materials is of vital importance in the design stage, therefore, reliable information regarding material properties homogeneity should be validated and any deviation should be addressed. In the current study the hardness variation, over wide spectrum radial locations of some ferrous and nonferrous structural engineering materials, was investigated. Measurements were performed over both faces (cross-section) of each stock bar according to a pre-specified stratified design, ensuring the coverage of the entire area both in radial and circumferential directions. Additionally the credibility of the apparatus and measuring procedures were examined through a statistically based calibration process of the hardness reference block. Statistical and response surface graphical analysis are used to examine the nature, adequacy and significance of the measured hardness values. Calibration of the apparatus reference block proved the reliability of the measuring system, where no strong evidence was found against the stochastic nature of hardness measures over the various stratified locations. Also, outlier elimination procedures were proved to be beneficial only at fewer measured points. Hardness measurements showed a dispersion domain that is within the acceptable confidence interval. For AISI 4140 and AISI 1020 steels, hardness is found to have a slight decrease trend as the diameter is reduced, while an opposite behavior is observed for OPEN ACCESS

Welcome message from author
This document is posted to help you gain knowledge. Please leave a comment to let me know what you think about it! Share it to your friends and learn new things together.
Transcript
Materials 2012, 5, 12-26; doi:10.3390/ma5010012
materials ISSN 1996-1944
www.mdpi.com/journal/materials
Article
Statistical and Graphical Assessment of Circumferential and Radial Hardness Variation of AISI 4140, AISI 1020 and AA 6082 Aluminum Alloy
Hamad Al-Khalid, Ayman Alaskari and Samy Oraby *
Department of Mechanical Production Technology, College of Technological Studies, The Public
Authority of Applied Education and Training (PAAET), P.O. Box 38322, Dhaya Abdalla
Alsalim 72254, Kuwait; E-Mails: [email protected] (H.A.-K.); [email protected] (A.A.)
* Author to whom correspondence should be addressed; E-Mail: [email protected];
Tel.: +965-99549119; Fax: +965-24832761.
Received: 17 October 2011; in revised form: 6 December 2011 / Accepted: 15 December 2011 /
Published: 23 December 2011
Abstract: Hardness homogeneity of the commonly used structural ferrous and nonferrous
engineering materials is of vital importance in the design stage, therefore, reliable
information regarding material properties homogeneity should be validated and any
deviation should be addressed. In the current study the hardness variation, over wide
spectrum radial locations of some ferrous and nonferrous structural engineering materials,
was investigated. Measurements were performed over both faces (cross-section) of each
stock bar according to a pre-specified stratified design, ensuring the coverage of the entire
area both in radial and circumferential directions. Additionally the credibility of the
apparatus and measuring procedures were examined through a statistically based
calibration process of the hardness reference block. Statistical and response surface
graphical analysis are used to examine the nature, adequacy and significance of the
measured hardness values. Calibration of the apparatus reference block proved the
reliability of the measuring system, where no strong evidence was found against the
stochastic nature of hardness measures over the various stratified locations. Also, outlier
elimination procedures were proved to be beneficial only at fewer measured points.
Hardness measurements showed a dispersion domain that is within the acceptable
confidence interval. For AISI 4140 and AISI 1020 steels, hardness is found to have a slight
decrease trend as the diameter is reduced, while an opposite behavior is observed for
OPEN ACCESS
Materials 2012, 5
13
AA 6082 aluminum alloy. However, no definite significant behavior was noticed regarding
the effect of the sector sequence (circumferential direction).
Keywords: hardness variation; AISI 4140; AISI 1020; AA 6082; reference block
calibration; statistical analysis; response surface
1. Introduction
In all industries, it is desired to introduce a better product quality to the market. The quality of the
product usually represents the processing effectiveness of three stages: materials selection, design and
manufacturing processes. At all those stages, the uniformity of the raw material properties is assumed
to be provided by the manufacturer. Moreover, the properties of the raw material are not necessarily
homogenous after processing or manufacturing of the product [1-3]. There are different reasons for
deviation and nonuniformity of the raw materials provided by the manufacturer. A soluble unequal
proportion of chemical elements in the alloy is one of the most important reasons for the different
properties of the raw material. Improper heat treatment especially for thicker material leads to different
microstructure phases across the workpiece material each has its own properties. Also surface finishing
and preparation changes the surface properties of the workpiece [4-6].
Knowledge of material properties should be available to consider the effects of undergoing loading
conditions not only on the product outer surface but also in the zone on specified distance from the
surface. Among the important material properties, hardness represents one of the most important factors
affecting product performance and its durability. Hardness data provide the basis for determining the
hardening coefficient, the residual stress, the degree of surface layer destruction, the yield point, the
strength, and the true fracture strength of the material.
In this paper, the hardness variations over the different diameters of some ferrous and nonferrous
structural engineering materials; such as-hot-rolled AISI 1020 and AISI 4140 quenched and tempered
hot alloy steel and AA6082 aluminum alloy in T6 conditions, were investigated. Measurements were
performed over both faces (cross-section) of each stock bar according to a prespecified stratified
design ensuring the coverage of the entire area both in diagonal and circumferential directions.
Additionally, the credibility of the apparatus and measuring procedures were examined through a
statistically based calibration process of the hardness reference block.
Statistical criteria, such as Descriptive, T-test Pairs, One-Way ANOVA and partial correlation
measures were used to detect the possible dependency of hardness values with the testing location over
the specified tested surface either diagonally (radial) or circumferentially. Graphical response surface,
surface map and contours were used to describe the data and to detect any possible trends.
2. Experimental Setup and Instrumentation
For universality purposes, three different types of materials were used in this study in the form of a
200 mm length and 150 mm diameter round bars. Specifications, mechanical properties and chemical
composition, as provided by manufacturer, are listed in Table 1. Both sides (faces) of each stock bar
Materials 2012, 5
14
were finished by low-feed-high speed face turning to create a flat surface with acceptable quality.
Further surface preparation was carried out using a very fine sandpaper so that the minimum finishing
requirement (Ra ≤ 1mm) is maintained where the measured Ra range over both surface was found to
be (0.97–1.04).
Table 1. Mechanical properties and chemical composition of the employed materials.
Material
Mechanical physical properties Chemical composition (wt %)
Tensile
Stren.
(MPa)
Yield
Stren.
(MPa)
Hardn.
(HRB)
Elo.
(%) C Mn Si P S Cr Mo Ni
AISI 1020 485 79 0.22 0.47 0.17 0.012 0.004
AISI 4140 1093 945 99 14 0.41 0.88 0.28 0.018 0.009 1.01 0.18 0.10
U.T.S 0.2 P.S. Si Fe Ti Mn Mg Cu Zn Zr Cr Ni Va
AA6082 326.6 273 8 1.04 0.19 0.018 0.58 0.8 0.025 0.003 0.001 0.003 0.001 0.004
Stationary hardness testers can only accommodate test pieces of limited size. Moreover, transportation
of the test pieces is often impractical, sometime impossible therefore; the portable hardness tester can
give a key solution. In the current study, hardness testing was carried out using a COMPUTEST SC
digital Rockwell portable Tester with many advanced features [7]. Instrument and measuring features
conform to both ASTM B724 and DIN 50157 standards. Measuring range and scales include HRC
(0–70) and HRB (0–120) using a static [5 kg (49N)] load and with preload of [1.2 kg (11.8 N)]
according to the Rockwell principle. Features are found appropriate for measuring the HRB nominal
hardness values of the three tested materials. Device calibration and measurement credibility were
evaluated in details using its reference block.
3. Results, Analysis and Discussion
In order to obtain significant outcome, indentation locations over the intended surface should be
carefully determined through the proper stratified design with the consideration of the trend and
frequency of hardness distribution in both the radial and circumferential directions. Data evaluation
included both of the descriptive graphical response surface methodology, to visualize the individual
and the interaction of the involved parameters and the appropriate statistical parameters such as Means,
T-Test, one-way ANOVA and Correlation, to determine the adequacy and significance of possible
evolving trends.
3.1. Apparatus Calibration and Hardness Variability of the Reference Block
Calibration of the measuring device using its reference block is one of the important factors
affecting the hardness measurement. The hardness reference block is of ultimate importance, supplying
the criteria to determine the standard value of a product, to verify hardness of testing machines and to
specify accuracy of quality control measurements. This procedure may provide the mutual benefit of
examining the accuracy of both the reference block and the measuring device. Therefore, to increase
the credibility of the recorded hardness, the device was calibrated using the reference hardness block
that is provided by manufacturer. As shown in Figure 1, the indentation locations were determined as
Materials 2012, 5
15
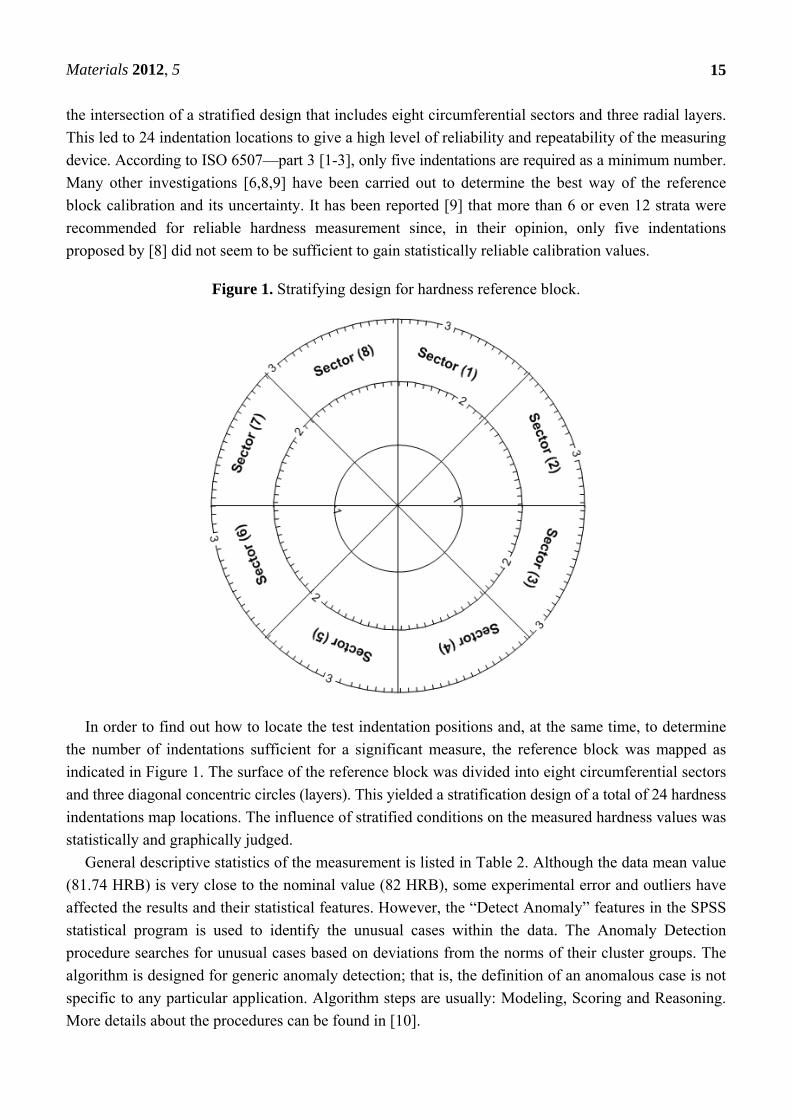
the intersection of a stratified design that includes eight circumferential sectors and three radial layers.
This led to 24 indentation locations to give a high level of reliability and repeatability of the measuring
device. According to ISO 6507—part 3 [1-3], only five indentations are required as a minimum number.
Many other investigations [6,8,9] have been carried out to determine the best way of the reference
block calibration and its uncertainty. It has been reported [9] that more than 6 or even 12 strata were
recommended for reliable hardness measurement since, in their opinion, only five indentations
proposed by [8] did not seem to be sufficient to gain statistically reliable calibration values.
Figure 1. Stratifying design for hardness reference block.
In order to find out how to locate the test indentation positions and, at the same time, to determine
the number of indentations sufficient for a significant measure, the reference block was mapped as
indicated in Figure 1. The surface of the reference block was divided into eight circumferential sectors
and three diagonal concentric circles (layers). This yielded a stratification design of a total of 24 hardness
indentations map locations. The influence of stratified conditions on the measured hardness values was
statistically and graphically judged.
General descriptive statistics of the measurement is listed in Table 2. Although the data mean value
(81.74 HRB) is very close to the nominal value (82 HRB), some experimental error and outliers have
affected the results and their statistical features. However, the “Detect Anomaly” features in the SPSS
statistical program is used to identify the unusual cases within the data. The Anomaly Detection
procedure searches for unusual cases based on deviations from the norms of their cluster groups. The
algorithm is designed for generic anomaly detection; that is, the definition of an anomalous case is not
specific to any particular application. Algorithm steps are usually: Modeling, Scoring and Reasoning.
More details about the procedures can be found in [10].
Materials 2012, 5
16
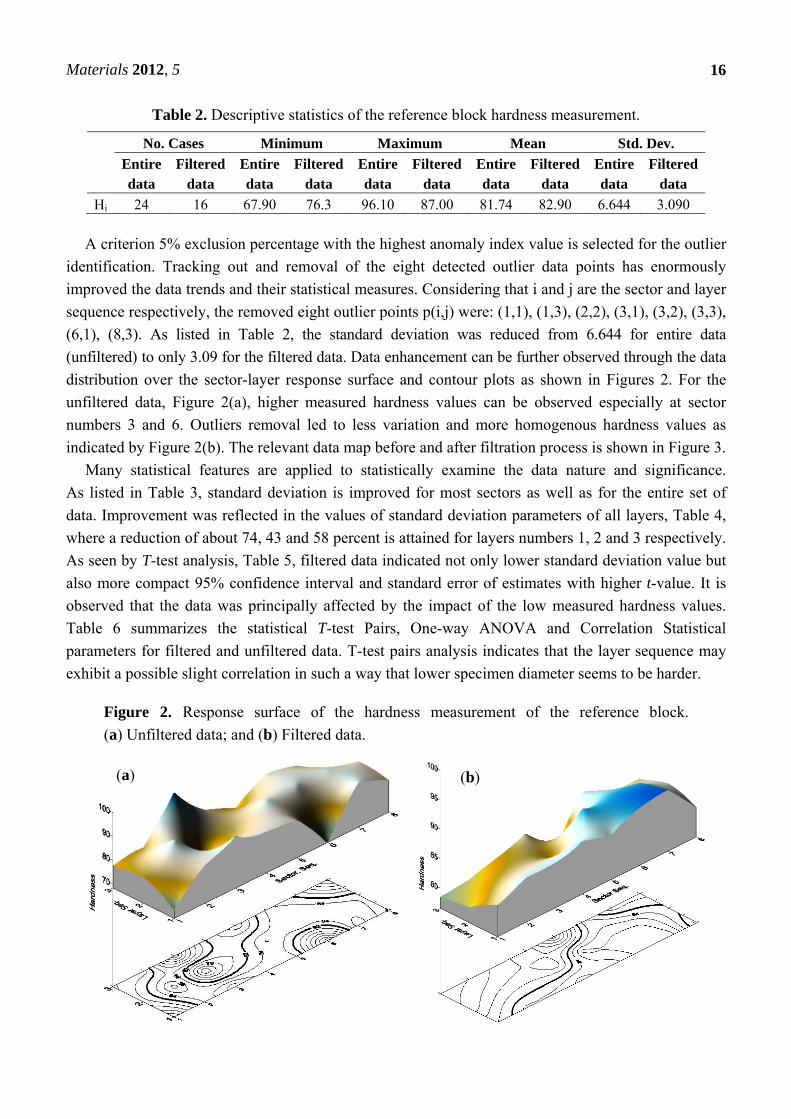
Table 2. Descriptive statistics of the reference block hardness measurement.
No. Cases Minimum Maximum Mean Std. Dev.
Entire data
Filtered data
Entire data
Filtereddata
Entiredata
Filtereddata
Entiredata
Filtered data
Entire data
Filtereddata
Hi 24 16 67.90 76.3 96.10 87.00 81.74 82.90 6.644 3.090
A criterion 5% exclusion percentage with the highest anomaly index value is selected for the outlier
identification. Tracking out and removal of the eight detected outlier data points has enormously
improved the data trends and their statistical measures. Considering that i and j are the sector and layer
sequence respectively, the removed eight outlier points p(i,j) were: (1,1), (1,3), (2,2), (3,1), (3,2), (3,3),
(6,1), (8,3). As listed in Table 2, the standard deviation was reduced from 6.644 for entire data
(unfiltered) to only 3.09 for the filtered data. Data enhancement can be further observed through the data
distribution over the sector-layer response surface and contour plots as shown in Figures 2. For the
unfiltered data, Figure 2(a), higher measured hardness values can be observed especially at sector
numbers 3 and 6. Outliers removal led to less variation and more homogenous hardness values as
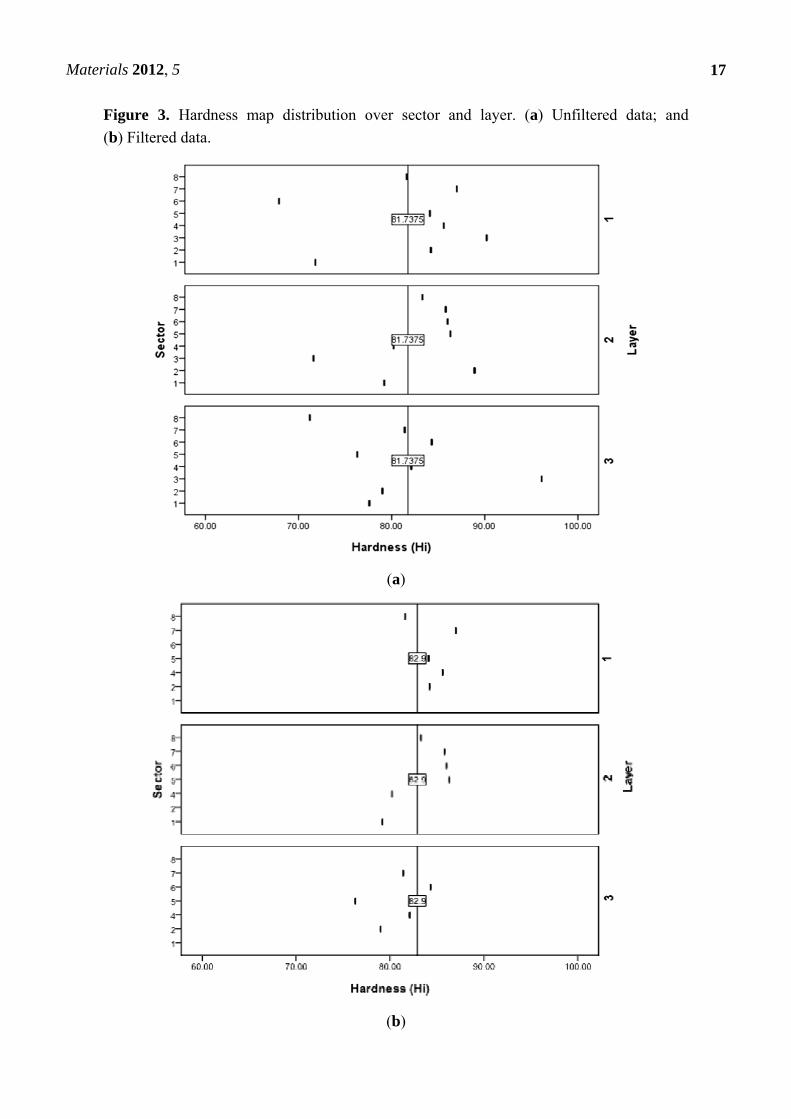
indicated by Figure 2(b). The relevant data map before and after filtration process is shown in Figure 3.
Many statistical features are applied to statistically examine the data nature and significance.
As listed in Table 3, standard deviation is improved for most sectors as well as for the entire set of
data. Improvement was reflected in the values of standard deviation parameters of all layers, Table 4,
where a reduction of about 74, 43 and 58 percent is attained for layers numbers 1, 2 and 3 respectively.
As seen by T-test analysis, Table 5, filtered data indicated not only lower standard deviation value but
also more compact 95% confidence interval and standard error of estimates with higher t-value. It is
observed that the data was principally affected by the impact of the low measured hardness values.
Table 6 summarizes the statistical T-test Pairs, One-way ANOVA and Correlation Statistical
parameters for filtered and unfiltered data. T-test pairs analysis indicates that the layer sequence may
exhibit a possible slight correlation in such a way that lower specimen diameter seems to be harder.
Figure 2. Response surface of the hardness measurement of the reference block.
(a) Unfiltered data; and (b) Filtered data.
(a) (b)
Materials 2012, 5
17
Figure 3. Hardness map distribution over sector and layer. (a) Unfiltered data; and
(b) Filtered data.
(a)
(b)
Materials 2012, 5
18
Table 3. MEANS statistical parameters of Hi-sector interaction.
Sector Filtered data Unfiltered data
Mean N Std. Dev. Mean N Std. Dev.
1 79.20 1 . 76.20 3 3.89
2 81.60 2 3.68 84.03 3 4.95 3 - - - 85.97 3 12.78 4 82.63 3 2.74 82.63 3 2.74
5 82.23 3 5.25 82.23 3 5.25 6 85.15 2 1.20 79.40 3 9.995 7 84.73 3 2.95 84.73 3 2.95
8 82.45 2 1.20 78.70 3 6.55
Total 82.90 16 3.09 81.74 24 6.64
Table 4. Means statistical parameters of Hi-layer interaction.
Layer Filtered data Unfiltered data
Mean N Std. Dev. Mean N Std. Dev.
1 84.50 5 2.01 81.55 8 7.71 2 83.47 6 3.12 82.66 8 5.53 3 80.62 5 3.07 81.00 8 7.31
Total 82.90 16 3.09 81.74 24 6.64
Table 5. T-test statistical parameters for filtered and unfiltered data.
N Mean Std. Dev. Std. Error t-value Sig. 95% Conference interval
Lower upper
16 82.9 3.09 0.7726 107.3 0.00 81.25 84.55 24 81.74 6.64 1.356 50.27 0.00 78.93 84.54
Table 6. T-test pairs, one-way ANOVA and correlation statistical parameters.
Layer
Filtered data Unfiltered data
N Corr. Sig. One-way ANOVA
N Corr. Sig. One-way ANOVA
F-ratio Sig. F-ratio Sig.
Pair 1 (Hi & Sector)
16 0.364 0.165 0.566 0.749 24 0.004 0.986 0.621 0.691
Pair 2 (Hi & Layer)
16 −0.513 0.042 2.581 0.114 24 −0.035 0.873 0.121 0.887
3.2. Hardness Variability of AISI 4140 Steel
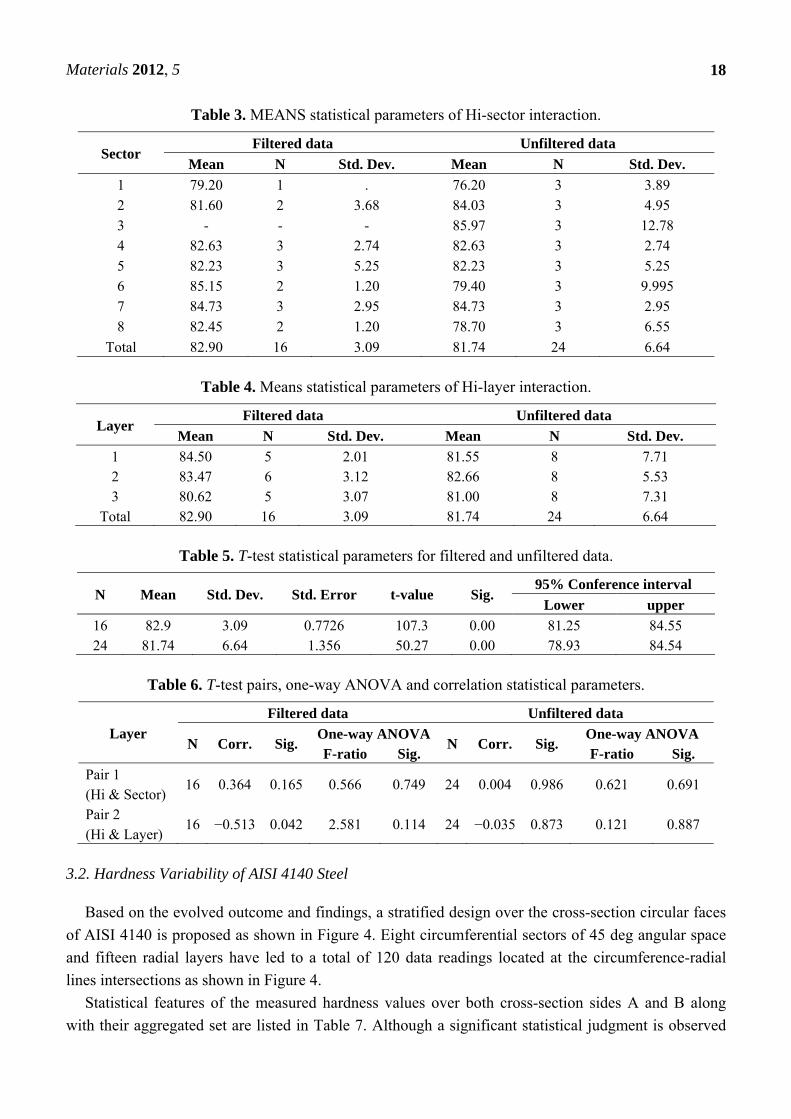
Based on the evolved outcome and findings, a stratified design over the cross-section circular faces
of AISI 4140 is proposed as shown in Figure 4. Eight circumferential sectors of 45 deg angular space
and fifteen radial layers have led to a total of 120 data readings located at the circumference-radial
lines intersections as shown in Figure 4.
Statistical features of the measured hardness values over both cross-section sides A and B along
with their aggregated set are listed in Table 7. Although a significant statistical judgment is observed
Materials 2012, 5
19
for readings taken on side B, the use of the entire data for both sides seems to improve the significance
and the adequacy of the data set.
Figure 4. Stratifying design for hardness measurements over cross section surface.
Table 7. Statistical analysis for entire data of both sides of AISI 4140 (Hm = HRB 99).
Side Range
Mean Std. Dev. Std.
Error t-value Sig.
95% Conference interval
Min Max Lower Upper
A 89 110.7 100.8 6.79 0.619 162.8 0.000 99.57 102.03 B 90 111.3 105.9 4.61 0.421 251.7 0.000 105.07 106.74
A+B 89 111.3 103.35 6.33 0.408 253.0 0.000 102.55 104.16
When data for each side is individually dealt with, the “Detect Anomaly” analysis, with the specified
criterion measures, as in the last section, suggested the exclusion removal of six data points from each
side. However, when data for both sides were considered, ten cases from side B and two cases from
side A were suggested for exclusion. As indicated in Table 8, statistical measures are rarely affected
after outlier removal. With increasing data points, it is expected that the outlier impact is diluted and
this justifies the emerged trend for the reference block when only 24-cases are considered.
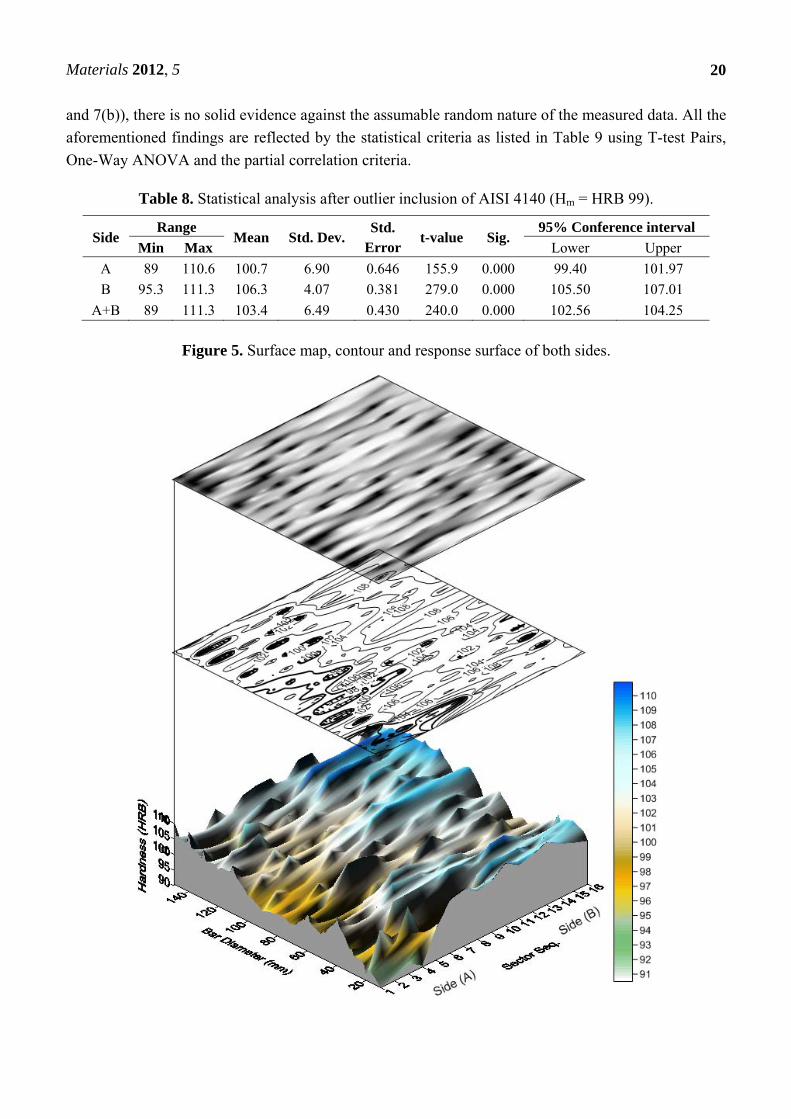
Figure 5 shows surface map, surface contour and response surface of the entire data of both section
sides. This is accompanied by a color scale to indicate the hardness levels as judged by the color
intensity. A hardness increasing trend at larger diameters or outer layers is observed over both sides.
Also, it is generally shown that over side B, the recorded hardness values have greater values (compare
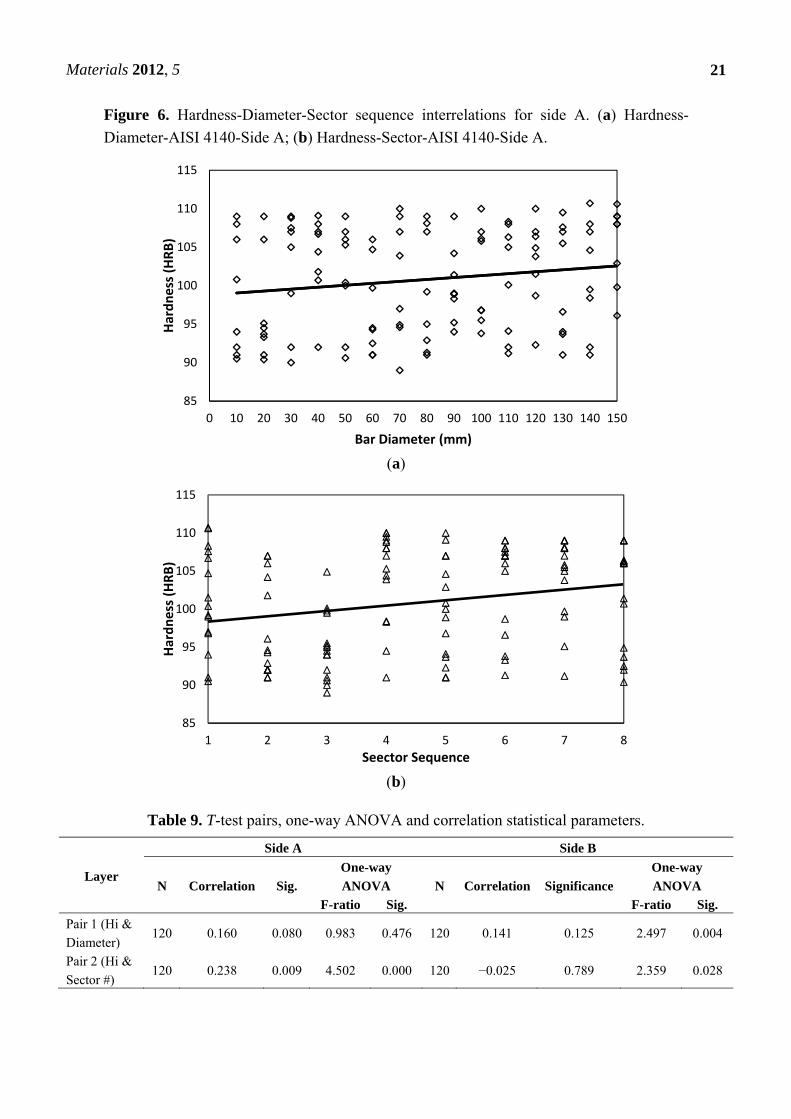
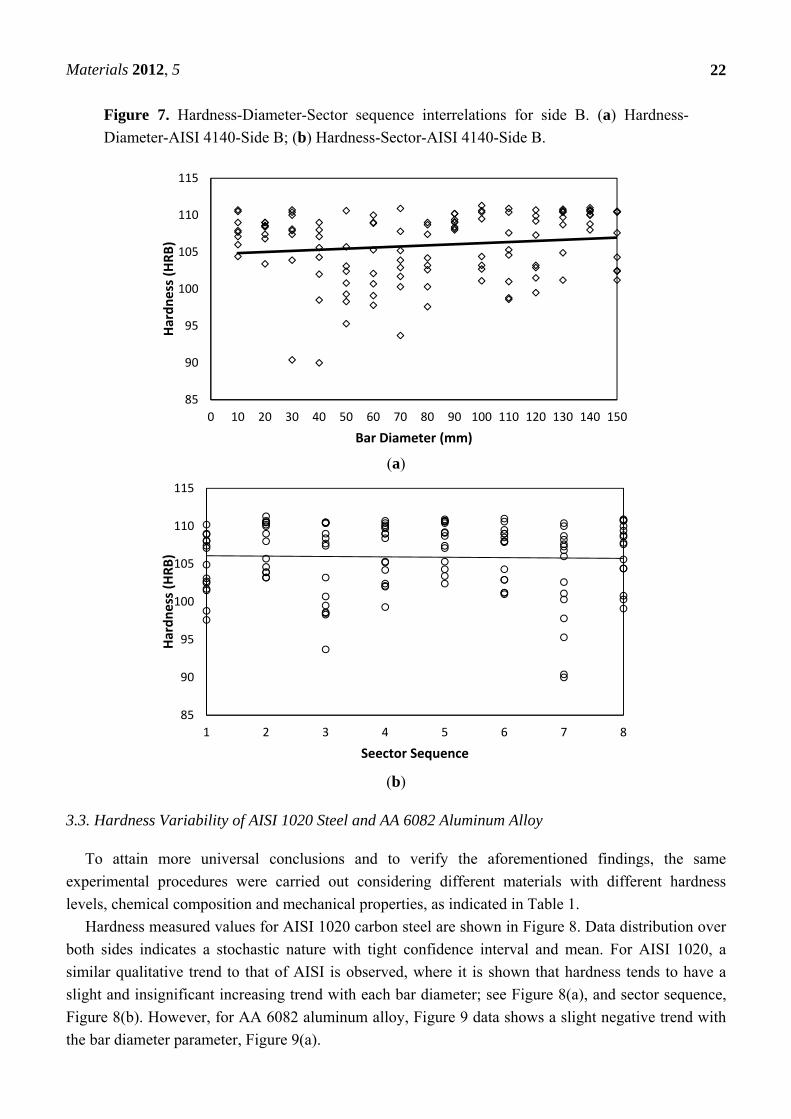
mean values of both sides in Tables 7 and 8). Possible trends are shown when the plain raw data are
plotted as in Figures 6 and 7. A slight positive trend and dependency on the bar diameter is detected;
see Figures 6(a) and 7(a). However, as far as the hardness-sector sequence is concerned, (Figures 6(b)
Materials 2012, 5
20
and 7(b)), there is no solid evidence against the assumable random nature of the measured data. All the
aforementioned findings are reflected by the statistical criteria as listed in Table 9 using T-test Pairs,
One-Way ANOVA and the partial correlation criteria.
Table 8. Statistical analysis after outlier inclusion of AISI 4140 (Hm = HRB 99).
Side Range
Mean Std. Dev. Std.
Error t-value Sig.
95% Conference interval
Min Max Lower Upper
A 89 110.6 100.7 6.90 0.646 155.9 0.000 99.40 101.97
B 95.3 111.3 106.3 4.07 0.381 279.0 0.000 105.50 107.01
A+B 89 111.3 103.4 6.49 0.430 240.0 0.000 102.56 104.25
Figure 5. Surface map, contour and response surface of both sides.
Materials 2012, 5
21
Figure 6. Hardness-Diameter-Sector sequence interrelations for side A. (a) Hardness-
Diameter-AISI 4140-Side A; (b) Hardness-Sector-AISI 4140-Side A.
(a)
(b)
Table 9. T-test pairs, one-way ANOVA and correlation statistical parameters.
Layer
Side A Side B
N Correlation Sig.
One-way
ANOVA N Correlation Significance
One-way
ANOVA
F-ratio Sig. F-ratio Sig.
Pair 1 (Hi &
Diameter) 120 0.160 0.080 0.983 0.476 120 0.141 0.125 2.497 0.004
Pair 2 (Hi &
Sector #) 120 0.238 0.009 4.502 0.000 120 −0.025 0.789 2.359 0.028
85
90
95
100
105
110
115
0 10 20 30 40 50 60 70 80 90 100 110 120 130 140 150
Har
dnes
s (H
RB)
Bar Diameter (mm)
85
90
95
100
105
110
115
1 2 3 4 5 6 7 8
Har
dnes
s (H
RB)
Seector Sequence
Materials 2012, 5
22
Figure 7. Hardness-Diameter-Sector sequence interrelations for side B. (a) Hardness-
Diameter-AISI 4140-Side B; (b) Hardness-Sector-AISI 4140-Side B.
(a)
(b)
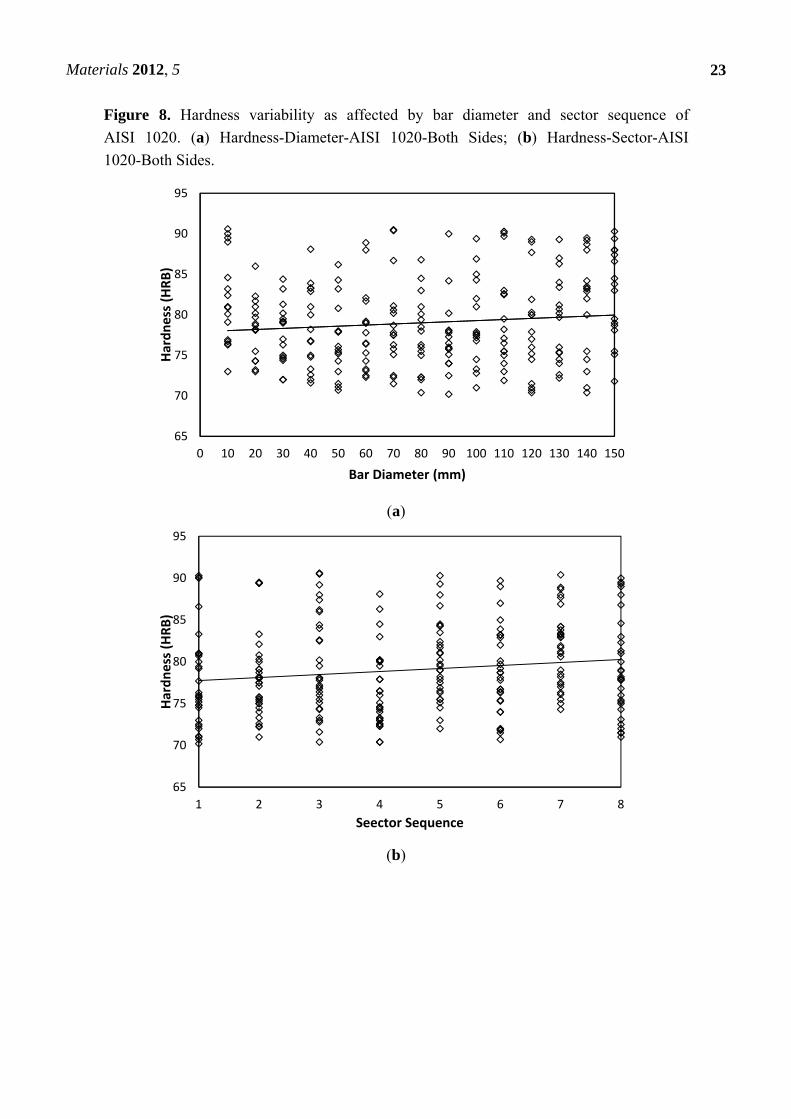
3.3. Hardness Variability of AISI 1020 Steel and AA 6082 Aluminum Alloy
To attain more universal conclusions and to verify the aforementioned findings, the same
experimental procedures were carried out considering different materials with different hardness
levels, chemical composition and mechanical properties, as indicated in Table 1.
Hardness measured values for AISI 1020 carbon steel are shown in Figure 8. Data distribution over
both sides indicates a stochastic nature with tight confidence interval and mean. For AISI 1020, a
similar qualitative trend to that of AISI is observed, where it is shown that hardness tends to have a
slight and insignificant increasing trend with each bar diameter; see Figure 8(a), and sector sequence,
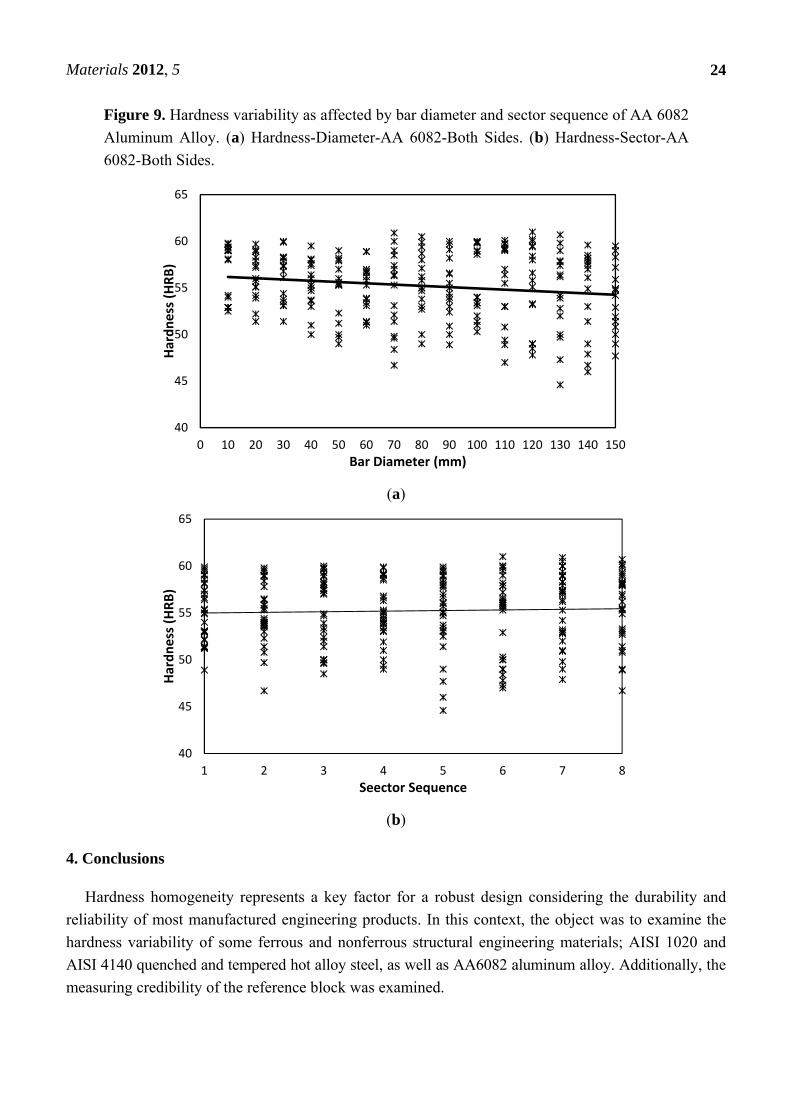
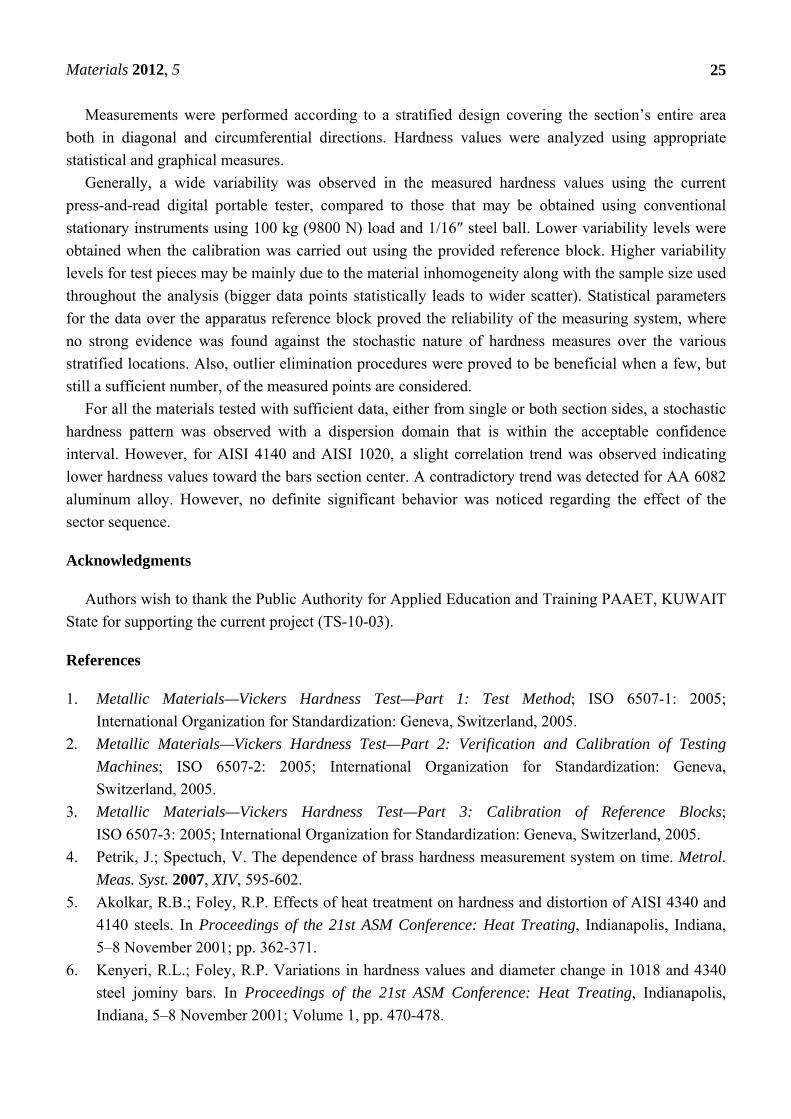
Figure 8(b). However, for AA 6082 aluminum alloy, Figure 9 data shows a slight negative trend with
the bar diameter parameter, Figure 9(a).
85
90
95
100
105
110
115
0 10 20 30 40 50 60 70 80 90 100 110 120 130 140 150
Har
dnes
s (H
RB)
Bar Diameter (mm)
85
90
95
100
105
110
115
1 2 3 4 5 6 7 8
Har
dnes
s (H
RB)
Seector Sequence
Materials 2012, 5
23
Figure 8. Hardness variability as affected by bar diameter and sector sequence of
AISI 1020. (a) Hardness-Diameter-AISI 1020-Both Sides; (b) Hardness-Sector-AISI
1020-Both Sides.
(a)
(b)
65
70
75
80
85
90
95
0 10 20 30 40 50 60 70 80 90 100 110 120 130 140 150
Har
dnes
s (H
RB)
Bar Diameter (mm)
65
70
75
80
85
90
95
1 2 3 4 5 6 7 8
Har
dnes
s (H
RB)
Seector Sequence
Materials 2012, 5
24
Figure 9. Hardness variability as affected by bar diameter and sector sequence of AA 6082
Aluminum Alloy. (a) Hardness-Diameter-AA 6082-Both Sides. (b) Hardness-Sector-AA
6082-Both Sides.
(a)
(b)
4. Conclusions
Hardness homogeneity represents a key factor for a robust design considering the durability and
reliability of most manufactured engineering products. In this context, the object was to examine the
hardness variability of some ferrous and nonferrous structural engineering materials; AISI 1020 and
AISI 4140 quenched and tempered hot alloy steel, as well as AA6082 aluminum alloy. Additionally, the
measuring credibility of the reference block was examined.
40
45
50
55
60
65
0 10 20 30 40 50 60 70 80 90 100 110 120 130 140 150
Har
dnes
s (H
RB)
Bar Diameter (mm)
40
45
50
55
60
65
1 2 3 4 5 6 7 8
Har
dnes
s (H
RB)
Seector Sequence
Materials 2012, 5
25
Measurements were performed according to a stratified design covering the section’s entire area
both in diagonal and circumferential directions. Hardness values were analyzed using appropriate
statistical and graphical measures.
Generally, a wide variability was observed in the measured hardness values using the current
press-and-read digital portable tester, compared to those that may be obtained using conventional
stationary instruments using 100 kg (9800 N) load and 1/16″ steel ball. Lower variability levels were
obtained when the calibration was carried out using the provided reference block. Higher variability
levels for test pieces may be mainly due to the material inhomogeneity along with the sample size used
throughout the analysis (bigger data points statistically leads to wider scatter). Statistical parameters
for the data over the apparatus reference block proved the reliability of the measuring system, where
no strong evidence was found against the stochastic nature of hardness measures over the various
stratified locations. Also, outlier elimination procedures were proved to be beneficial when a few, but
still a sufficient number, of the measured points are considered.
For all the materials tested with sufficient data, either from single or both section sides, a stochastic
hardness pattern was observed with a dispersion domain that is within the acceptable confidence
interval. However, for AISI 4140 and AISI 1020, a slight correlation trend was observed indicating
lower hardness values toward the bars section center. A contradictory trend was detected for AA 6082
aluminum alloy. However, no definite significant behavior was noticed regarding the effect of the
sector sequence.
Acknowledgments
Authors wish to thank the Public Authority for Applied Education and Training PAAET, KUWAIT
State for supporting the current project (TS-10-03).
References
1. Metallic Materials—Vickers Hardness Test—Part 1: Test Method; ISO 6507-1: 2005;
International Organization for Standardization: Geneva, Switzerland, 2005.
2. Metallic Materials—Vickers Hardness Test—Part 2: Verification and Calibration of Testing
Machines; ISO 6507-2: 2005; International Organization for Standardization: Geneva,
Switzerland, 2005.
3. Metallic Materials—Vickers Hardness Test—Part 3: Calibration of Reference Blocks;
ISO 6507-3: 2005; International Organization for Standardization: Geneva, Switzerland, 2005.
4. Petrik, J.; Spectuch, V. The dependence of brass hardness measurement system on time. Metrol.
Meas. Syst. 2007, XIV, 595-602.
5. Akolkar, R.B.; Foley, R.P. Effects of heat treatment on hardness and distortion of AISI 4340 and
4140 steels. In Proceedings of the 21st ASM Conference: Heat Treating, Indianapolis, Indiana,
5–8 November 2001; pp. 362-371.
6. Kenyeri, R.L.; Foley, R.P. Variations in hardness values and diameter change in 1018 and 4340
steel jominy bars. In Proceedings of the 21st ASM Conference: Heat Treating, Indianapolis,
Indiana, 5–8 November 2001; Volume 1, pp. 470-478.
Materials 2012, 5
26
7. Computest SC Portable Digital Hardness Tester; Qualitest: Ft. Lauderdale, FL, USA. Available
online: http://www.WorldofTest.com/computest.htm (accessed on 1 November 2011).
8. Kongkavitool, R.; Takagi, S.; Usuda, T. Test-location specification by means of hardness
mapping on vickers block surface. In Proceedings of the Recent Advancement of Theory and
Practice in Hardness Measurement, Tsukuba, Japan, 19–21 November 2007.
9. Koike, M.; Ishida, H. The role of hardness block in rockwell hardness calibration system.
In Proceedings of the XIV IMEKO World Congress, Tampere, Finland, 2–6 June 1997; Volume 3,
topic 3 and 5, pp. 270-275.
10. Chandola, V.; Banerjee, A.; Kumar, V. Anomaly detection: A survey. ACM Comput. Surv. 2009,
41, 1-72.
© 2012 by the authors; licensee MDPI, Basel, Switzerland. This article is an open access article
distributed under the terms and conditions of the Creative Commons Attribution license
(http://creativecommons.org/licenses/by/3.0/).
Related Documents