0 Statistical Analysis with Latent Variables Educ 231E (M231E), Spring 2004 Bengt Muthen, UCLA [email protected] 1 Statistical Analysis with Latent Variables: Logistics • UCLA lectures: 20 lectures through June 14 • UCLA lab sessions: Evening computer exercises once a week (TA: Karen Nylund) • Video conferencing: off-campus sites • Streaming video on the web from UCLA

Welcome message from author
This document is posted to help you gain knowledge. Please leave a comment to let me know what you think about it! Share it to your friends and learn new things together.
Transcript

0
Statistical Analysiswith Latent Variables
Educ 231E (M231E), Spring 2004
Bengt Muthen, UCLA
1
Statistical Analysis with Latent Variables: Logistics
• UCLA lectures: 20 lectures through June 14
• UCLA lab sessions: Evening computer exercises once a week (TA: Karen Nylund)
• Video conferencing: off-campus sites
• Streaming video on the web from UCLA

2
Web Addresses
• Course web site:http://www.gseis.ucla.edu/faculty/muthen/
courses.htm• Streaming video web site:
http://www.ats.ucla.edu/stat/seminars/default.htm
• Mplus web site:http://www.statmodel.com
3
Statistical Analysis with Latent VariablesED231E, Spring 2004 Syllabus
WEEK 1 (April 5 & 7)• Lecture 1: Overview of course content. A general latent variable modeling framework• Lecture 2: Confirmatory factor analysis
WEEK 2 (April 12 & 14)• Lecture 3: Multiple-group confirmatory factor analysis• Lecture 4: Structural equation modeling
WEEK 3 (April 19 & 21)• Lecture 5: Introductory growth modeling• Lecture 6: Growth modeling, cont’d

4
WEEK 4 (April 26 & 28)• Lecture 7: Growth modeling, cont’d• Lecture 8: Growth modeling, cont’d
WEEK 5 (May 3 & 5) • Lecture 9: Introduction to modeling with categorical dependent variables• Lecture 10: Modeling with a preponderance of zeros (zero inflation)
WEEK 6 (May 10 & 12)• Lecture 11: Discrete-time survival analysis• Lecture 12: Discrete-time survival analysis
5
WEEK 7 (May 17 & May 19)• Lecture 13: Cross-sectional mixture modeling - LCA• Lecture 14: Cross-sectional mixture modeling - LCRA
WEEK 8 (May 24 & 26)• Lecture 15: Longitudinal mixture modeling – LTA• Lecture 16: Longitudinal mixture modeling - GMM
WEEK 9 (June 2) May 31 cancelled due to Memorial Day• Lecture 17: Latent variable modeling with missing data
WEEK 10 (June 7 & 9)• Lecture 18: Multilevel latent variable modeling• Lecture 19: Multilevel latent variable modeling cont’d
FINAL’s WEEK (June 14)• Lecture 20: Multilevel mixture modeling

6
Statistical Analysis with Latent Variables:An Example
• Commonalities of biometric and psychometric themes:– Random effects
– Latent group (class) membership
– Missing data
– Multilevel data
– Measurement modeling
7
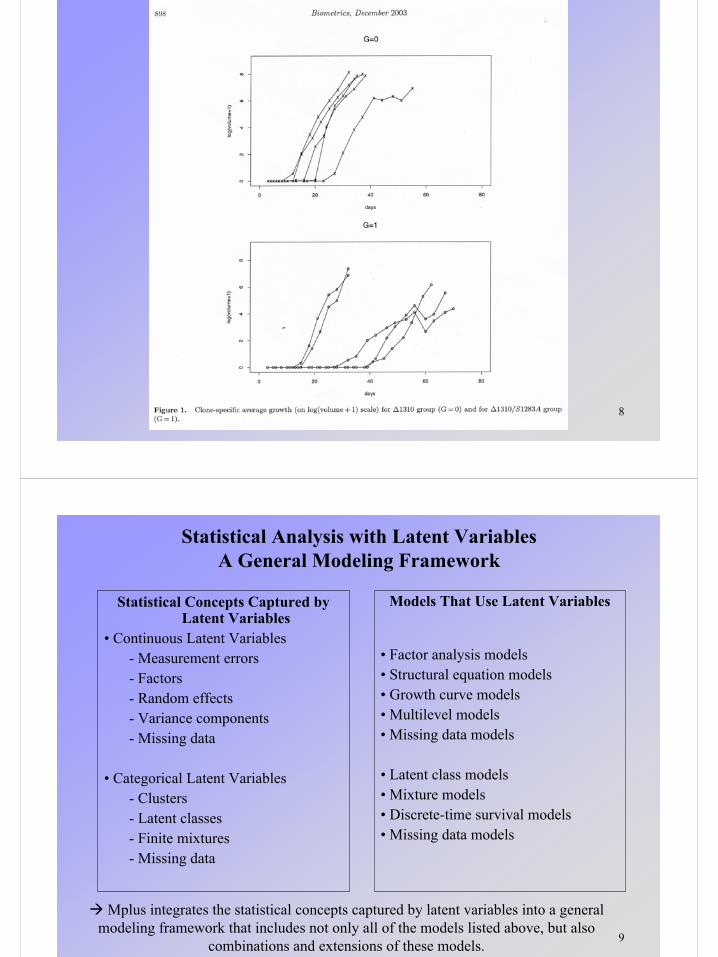
8
9
Statistical Analysis with Latent VariablesA General Modeling Framework
Statistical Concepts Captured by Latent Variables
• Continuous Latent Variables- Measurement errors- Factors- Random effects- Variance components- Missing data
• Categorical Latent Variables - Clusters- Latent classes- Finite mixtures- Missing data
Models That Use Latent Variables
• Factor analysis models• Structural equation models• Growth curve models• Multilevel models• Missing data models
• Latent class models• Mixture models• Discrete-time survival models• Missing data models
Mplus integrates the statistical concepts captured by latent variables into a general modeling framework that includes not only all of the models listed above, but also
combinations and extensions of these models.
10
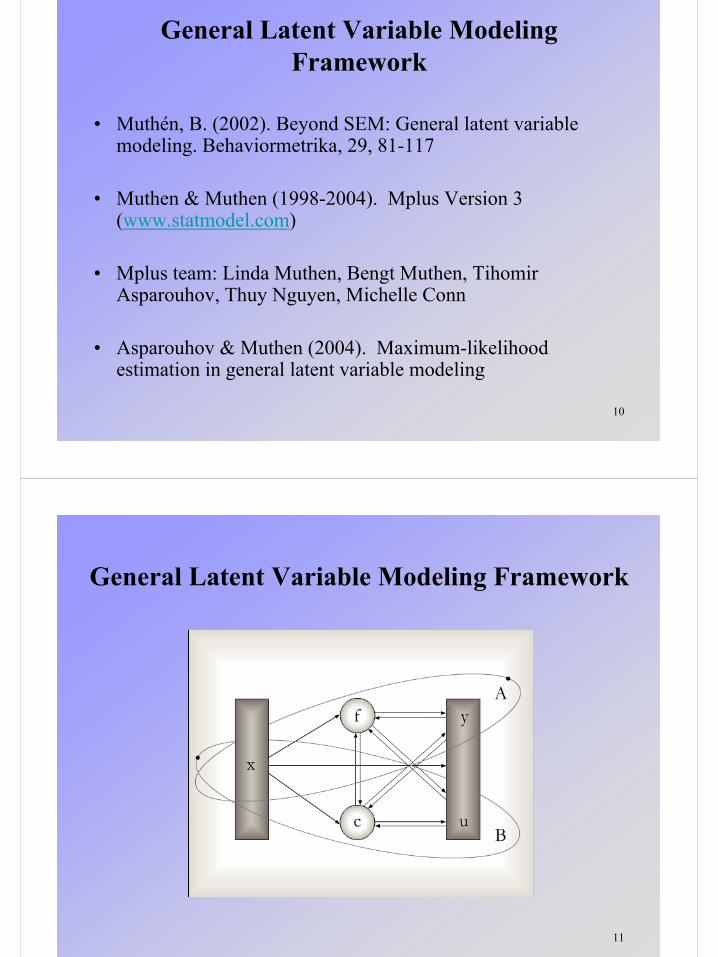
General Latent Variable Modeling Framework
• Muthén, B. (2002). Beyond SEM: General latent variable modeling. Behaviormetrika, 29, 81-117
• Muthen & Muthen (1998-2004). Mplus Version 3 (www.statmodel.com)
• Mplus team: Linda Muthen, Bengt Muthen, TihomirAsparouhov, Thuy Nguyen, Michelle Conn
• Asparouhov & Muthen (2004). Maximum-likelihood estimation in general latent variable modeling
11
General Latent Variable Modeling Framework

12
General Latent Variable Modeling Framework
13
General Latent Variable Modeling Framework

14
General Latent Variable Modeling Framework
15
Continuous Latent Variables:Two Examples
• Muthen (1992). Latent variable modeling in epidemiology. Alcohol Health & Research World, 16, 286-292– Blood pressure predicting coronary heart disease
• Nurses’ Health Study (Rosner, Willet & Spiegelman, 1989). Nutritional study of 89,538 women. – Dietary fat intake questionnaire for everyone
– Dietary diary for 173 women for 4 1-week periods at 3-month intervals

16
Measurement Error in a Covariate
0.020 40 60 80 100 120
0.2
0.4
0.6
0.8
1.0
0
Without measurement error(latent variable)
With measurement error(observed variable)
Blood Pressure (millimeters of mercury)
Pro
port
ion
With
Cor
onar
y H
eart
Dis
ease
17
Measurement Error in a Covariate
y1
f
y2
y3

18
Continuous Latent Variables
• Factor analysis, structural equation modeling – Constructs measured with multiple indicators
• Growth modeling– Growth factors, random effects: random intercepts
and random slopes representing individual differences of development over time (unobserved heterogeneity)
• Survival analysis– Frailties
19
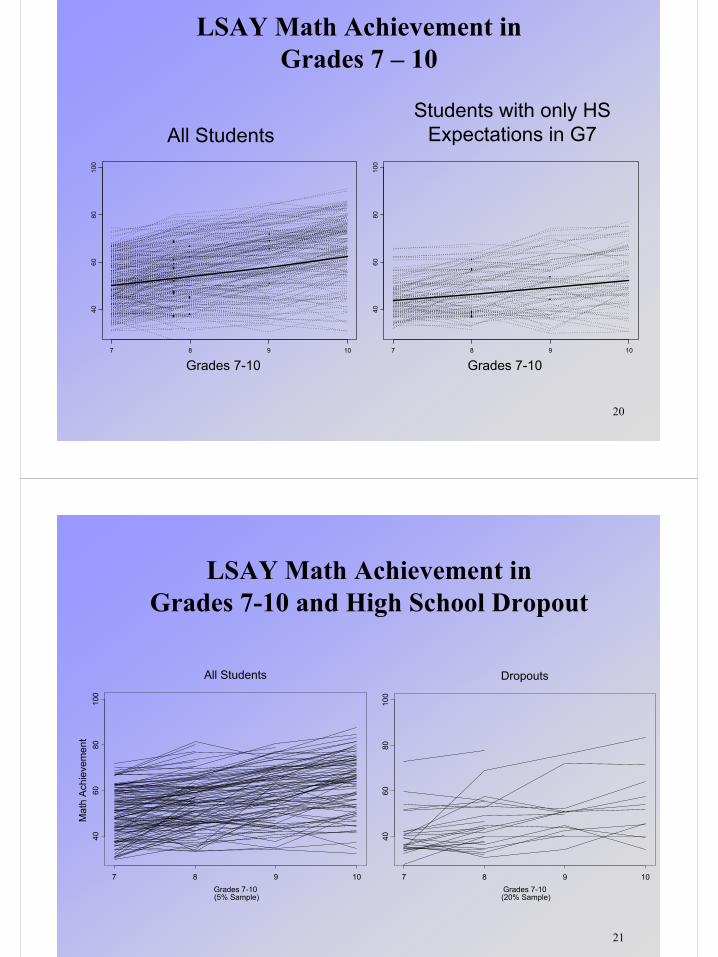
Growth Modeling of LSAY Math Achievement with Random Slopes
for Time-Varying Covariates
• Data source: LSAY, n = 2,271 students in public schools– Clustering of students within schools ignored in this analysis
• Outcome: grade 7, 8, 9, 10 math achievement
• Time-invariant covariates: female, mother’s education, home resources
• Time-varying covariates: highest math course taken during each grade (0 = no course; 1 = low, basic; 2 = average; 3 = high; 4 = pre-algebra; 5 = algebra I; 6 = geometry; 7 = algebra II, 8 = pre-calculus; 9 = calculus)
20
7 8 9 10
40
60
80
10
0
7 8 9 10
40
60
80
10
0
LSAY Math Achievement in Grades 7 – 10
All StudentsStudents with only HS
Expectations in G7
Grades 7-10 Grades 7-10
21
Mat
h A
chie
vem
ent
All Students
Grades 7-10 (5% Sample)
7 8 9 10
4060
8010
0
LSAY Math Achievement inGrades 7-10 and High School Dropout
Dropouts
Grades 7-10 (20% Sample)
7 8 9 10
4060
8010
0
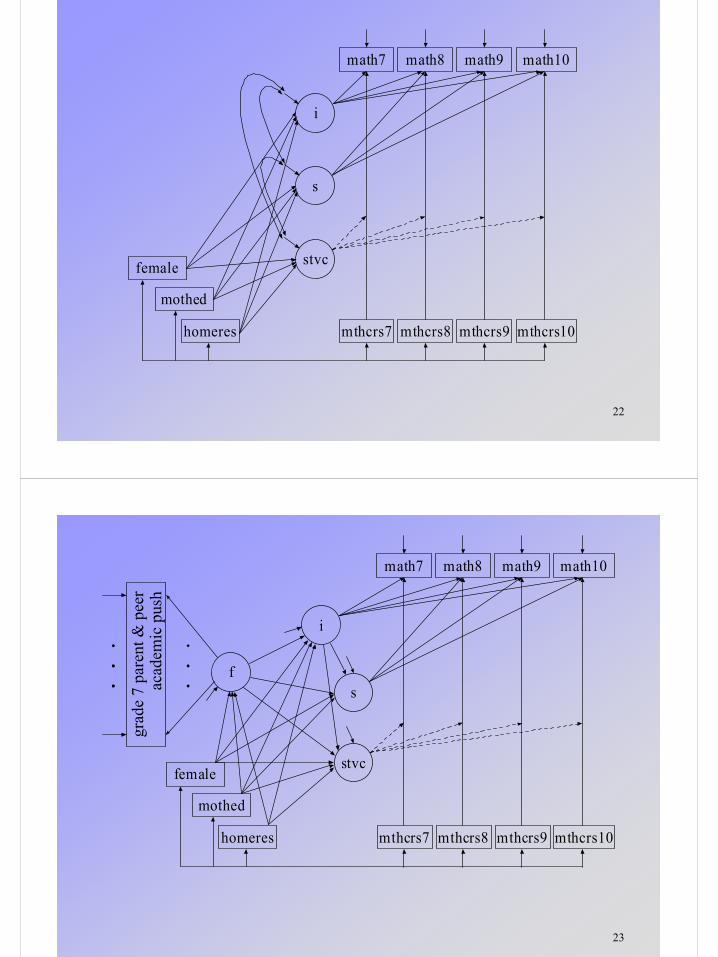
22
i
s
stvc
mothed
homeres
female
mthcrs7 mthcrs8 mthcrs9 mthcrs10
math7 math8 math9 math10
23
i
s
stvc
mothed
homeres
female
mthcrs7 mthcrs8 mthcrs9 mthcrs10
math7 math8 math9 math10
f
grad
e 7
pare
nt &
pee
rac
adem
ic p
ush

24
Onset (Survival) Followed by Growth
u1 u2 u3 u4
f
iy sy
y1 y2 y3 y4
Event History
Growth
x c
25
Categorical Latent Variables
• Mixture regression
• Latent class analysis
• Latent transition analysis

26
y
c
txx
CACE Mixture Modeling
27
Latent Class Analysis
Item Profiles
Item
u1
Item
u2
Item
u3
Item
u4
Class 1
Class 2
Class 3
u1
c
u2 u3 u4
x
28
u21 u22 u23 u24u11 u12 u13 u14
c1 c2
c
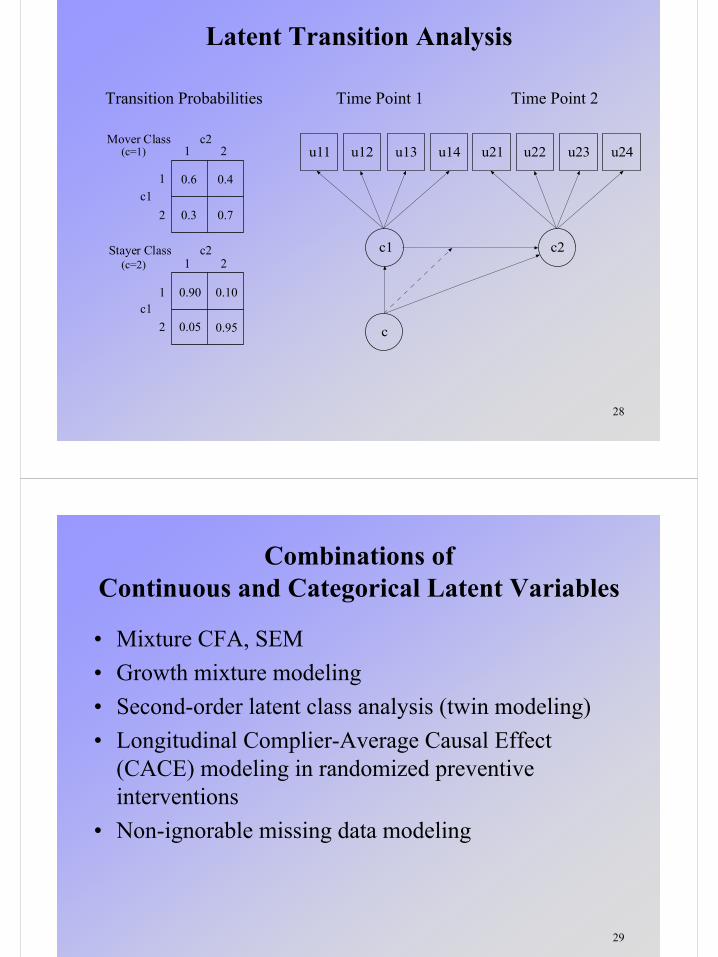
Latent Transition Analysis
Transition Probabilities
0.6 0.4
0.3 0.7
c21 2
1 2
1
2
1
2
c1
c1
Mover Class
Stayer Class c2
(c=1)
(c=2)
0.90 0.10
0.05 0.95
Time Point 1 Time Point 2
29
Combinations of Continuous and Categorical Latent Variables
• Mixture CFA, SEM
• Growth mixture modeling
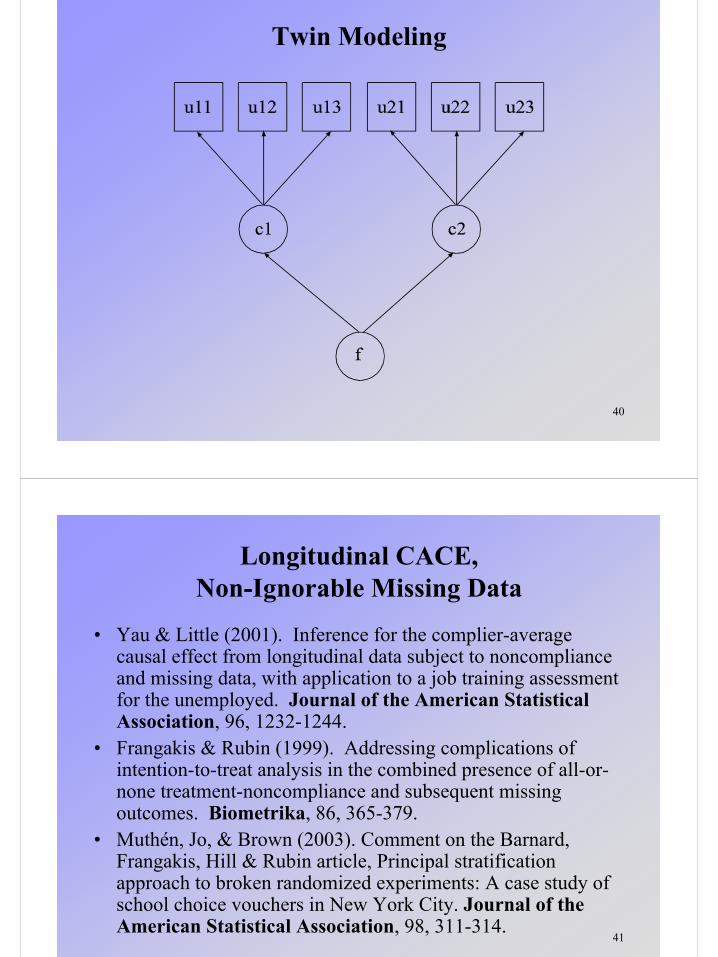
• Second-order latent class analysis (twin modeling)
• Longitudinal Complier-Average Causal Effect (CACE) modeling in randomized preventive interventions
• Non-ignorable missing data modeling
30
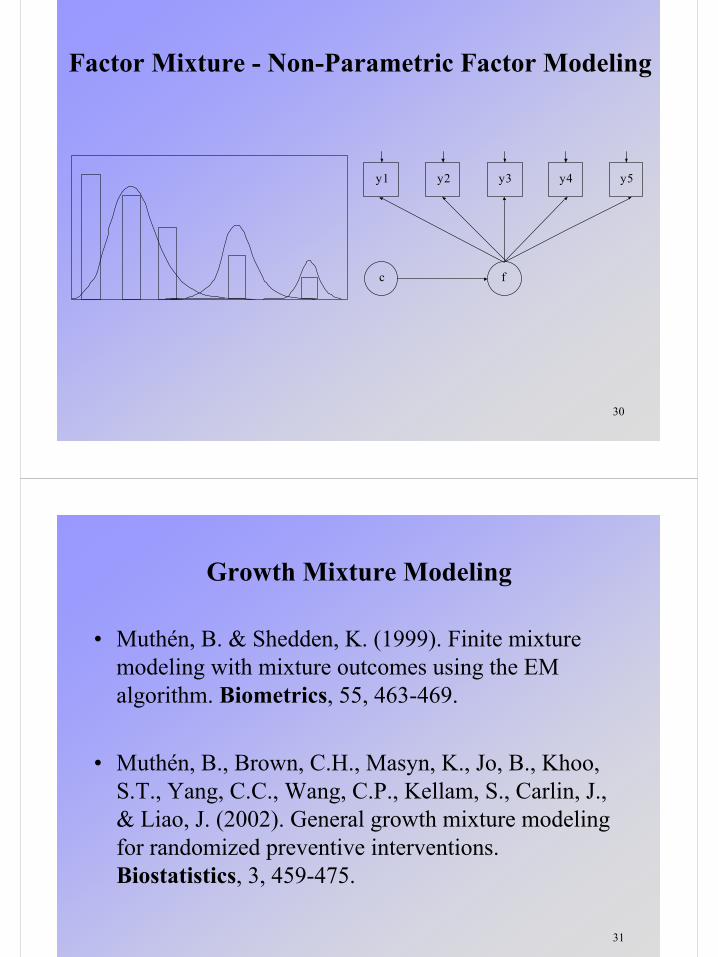
Factor Mixture - Non-Parametric Factor Modeling
y1 y2 y3 y4
c f
y5
31
Growth Mixture Modeling
• Muthén, B. & Shedden, K. (1999). Finite mixture modeling with mixture outcomes using the EM algorithm. Biometrics, 55, 463-469.
• Muthén, B., Brown, C.H., Masyn, K., Jo, B., Khoo, S.T., Yang, C.C., Wang, C.P., Kellam, S., Carlin, J., & Liao, J. (2002). General growth mixture modeling for randomized preventive interventions. Biostatistics, 3, 459-475.
32
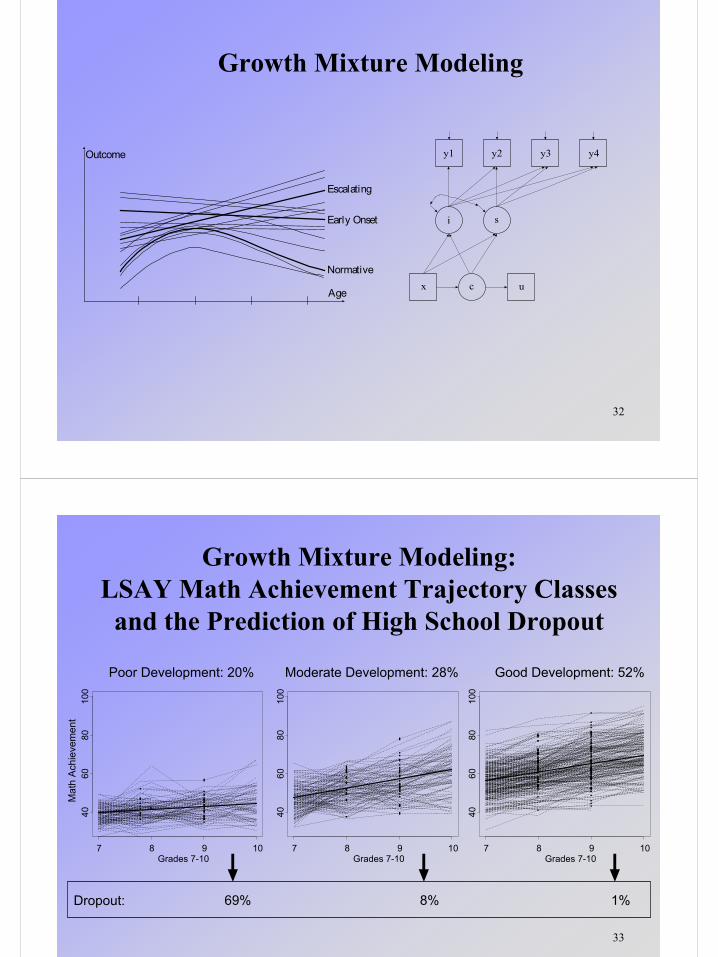
y1 y2 y3 y4
i s
x c u
Growth Mixture Modeling
Age
Outcome
Early Onset
Escalating
Normative
33
Growth Mixture Modeling: LSAY Math Achievement Trajectory Classes
and the Prediction of High School Dropout
Mat
h A
chie
vem
ent
Poor Development: 20% Moderate Development: 28% Good Development: 52%
69% 8% 1%Dropout:
7 8 9 10
4060
8010
0
Grades 7-107 8 9 10
4060
8010
0
Grades 7-107 8 9 10
4060
8010
0
Grades 7-10

34
1 2 3 4 5 6 7 8
-2-1
01
2
1 2 3 4
-3-2
-10
12
Predicting Reading Failure
Time points
Grade 1-2 Word RecognitionKindergarten Phonemic Awareness
Time points
35
1 2 3 4
-3-2
-10
12
Kindergarten Phonemic Awareness
Children in the Lowest Decile of End of Grade 2 Word Recognition
1 2 3 4
-3-2
-10
12
Time points Time points
All Children (10% sample)
36
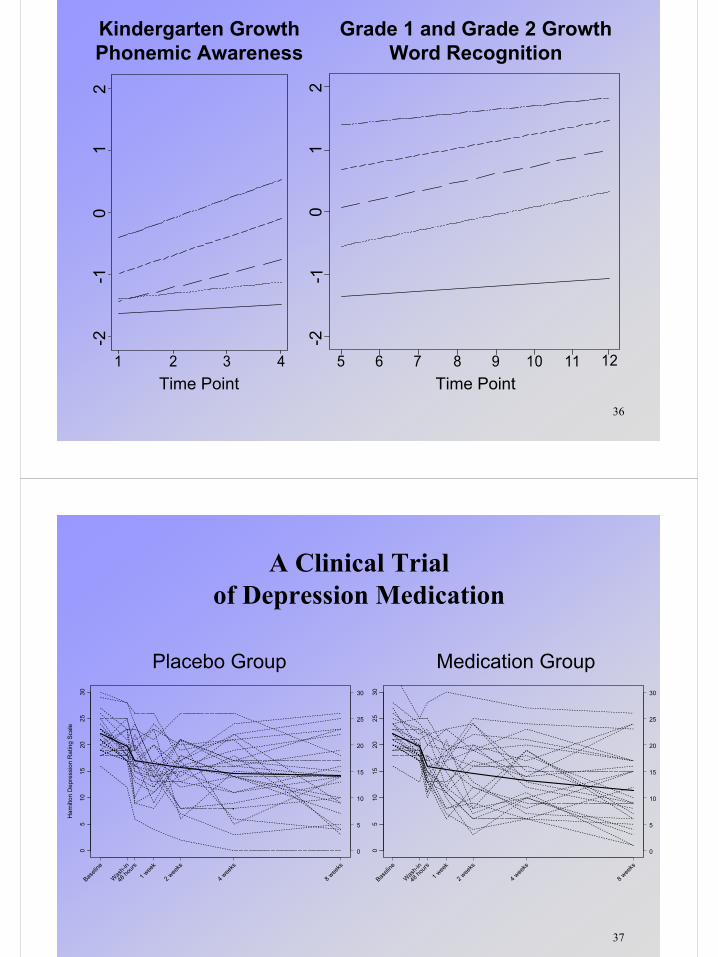
Kindergarten GrowthPhonemic Awareness
Grade 1 and Grade 2 GrowthWord Recognition
Time Point Time Point
-2-1
01
2
-2-1
01
2
5 6 7 8 9 10 11 121 2 3 4
37
A Clinical Trialof Depression Medication
Ham
ilton
Dep
ress
ion
Rat
ing
Sca
le
05
10
15
20
25
30
Baseli
ne
Was
h-in
48 h
ours
1 wee
k
2 wee
ks
4 wee
ks
8 wee
ks
0
5
10
15
20
25
30
05
10
15
20
25
30
Baseli
ne
Was
h-in
48 h
ours
1 wee
k
2 wee
ks
4 wee
ks
8 wee
ks
0
5
10
15
20
25
30
Placebo Group Medication Group

38
A Clinical Trialof Depression Medication
Placebo Non-Responders, 55% Placebo Responders, 45%
Ham
ilton
Dep
ress
ion
Rat
ing
Sca
le
05
1015
2025
30
Baseli
ne
Was
h-in
48 h
ours
1 wee
k
2 wee
ks
4 wee
ks
8 wee
ks
0
5
10
15
20
25
30
05
10
15
20
25
30
Baseli
ne
Was
h-in
48 h
ours
1 wee
k
2 wee
ks
4 wee
ks
8 wee
ks
0
5
10
15
20
25
30
39
A Clinical Trialon Depression Medication
Placebo Non-Responders, 21%
Ham
ilton
Dep
ress
ion
Rat
ing
Sca
le
05
1015
2025
30
Baseli
ne
Was
h-in
1 wee
k
2 wee
ks
4 wee
ks
8 wee
ks
0
5
10
15
20
25
30
Medication Non-Responders, 23%
05
1015
2025
30
Baseli
ne
Was
h-in
1 wee
k
2 wee
ks
4 wee
ks
8 wee
ks
0
5
10
15
20
25
30
Placebo Responders, 30%
Ham
ilton
Dep
ress
ion
Rat
ing
Sca
le
05
1015
2025
30
Baseli
ne
Was
h-in
1 wee
k
2 wee
ks
4 wee
ks
8 wee
ks
0
5
10
15
20
25
30
Medication Responders, 27%
05
1015
2025
30
Baseli
ne
Was
h-in
1 wee
k
2 wee
ks
4 wee
ks
8 wee
ks
0
5
10
15
20
25
30
40
Twin Modeling
41
Longitudinal CACE, Non-Ignorable Missing Data
• Yau & Little (2001). Inference for the complier-average causal effect from longitudinal data subject to noncompliance and missing data, with application to a job training assessment for the unemployed. Journal of the American Statistical Association, 96, 1232-1244.
• Frangakis & Rubin (1999). Addressing complications of intention-to-treat analysis in the combined presence of all-or-none treatment-noncompliance and subsequent missing outcomes. Biometrika, 86, 365-379.
• Muthén, Jo, & Brown (2003). Comment on the Barnard, Frangakis, Hill & Rubin article, Principal stratification approach to broken randomized experiments: A case study of school choice vouchers in New York City. Journal of the American Statistical Association, 98, 311-314.

42
Growth Mixture Modeling with Non-IgnorableMissingness as a Function of Latent Variables
Age
Outcome
Early Onset
Escalating
Normative
i
y2 y3 y4
s
x
c
y1
u1 u2 u3 u4
43
Growth Mixture Modeling with Non-IgnorableMissingness as a Function of Latent Variables
Age
Outcome
Early Onset
Escalating
Normative
i
y2 y3 y4
s
x
c
y1
u1 u2 u3 u4

44
Growth Mixture Modeling with Non-IgnorableMissingness as a Function of Latent Variables
Age
Outcome
Early Onset
Escalating
Normative
i
y2 y3 y4
s
x
c
y1
u1 u2 u3 u4
45
Multilevel Modeling with Continuous and Categorical Latent Variables
• Multilevel regression
• Multilevel CFA, SEM
• Multilevel growth modeling
• Multilevel discrete-time survival analysis
• Multilevel regression mixture analysis (CACE)
• Multilevel latent class analysis
• Multilevel growth mixture modeling

46
2-Level Regression of NELS Math Achievement
• Data source: NELS, n = 14,217 students in 913 schools
• Outcome: math achievement in grade 12
• Individual-level covariates: female, stud_ses
• School-level covariates: per_adva (percent teachers with an MA or higher), school type (public, private, catholic), family mean ses
47
BetweenWithin
m92
s1
s2
mean_ses
catholic
per_adva
private
s1
s2
stud_ses
female
m92
48
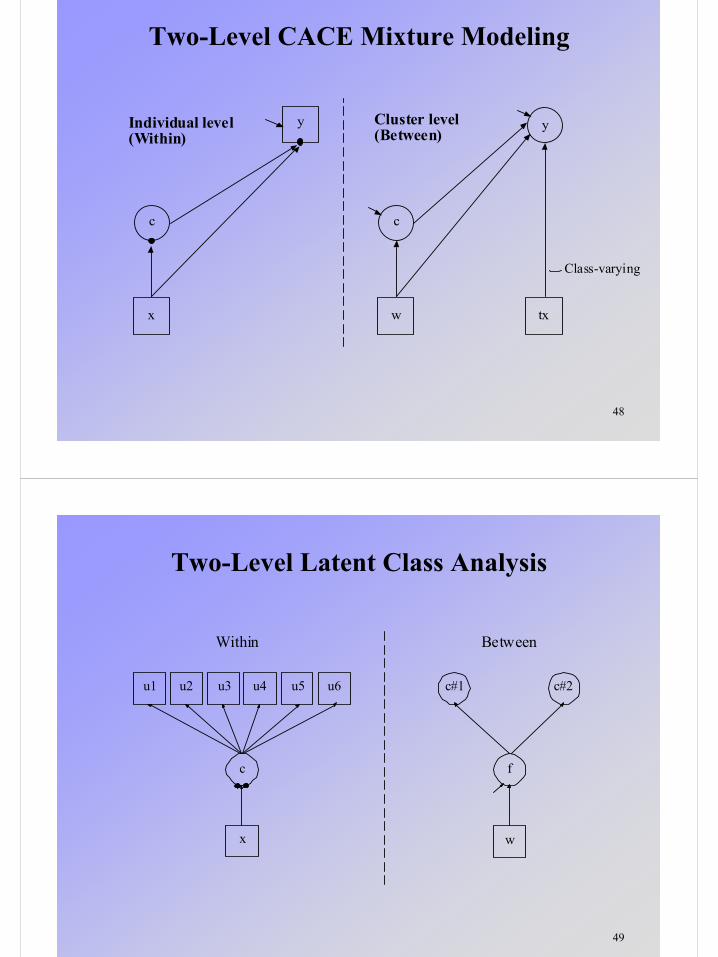
Two-Level CACE Mixture Modeling
y
c
x
Individual level(Within)
c
w
yCluster level(Between)
tx
Class-varying
49
Two-Level Latent Class Analysis
Between
c#1 c#2
f
w
u1 u2 u3 u4 u5 u6
c
x
Within

50
High SchoolDropout
Female
Hispanic
Black
Mother’s Ed.
Home Res.
Expectations
Drop Thoughts
Arrested
Expelled
c
i s
Math7 Math8 Math9 Math10
ib sb
School-Level Covariates
cb hb
51
References
• See course and Mplus web sites
Related Documents