Statistical Analysis Plan for Achievement for all University of Manchester INTERVENTION Achievement for All Schools Programme DEVELOPER Achievement for All 3As EVALUATOR University of Manchester TRIAL REGISTRATION NUMBER DOI 10.1186/ISRCTN67347514 TRIAL STATISTICIAN Dr Sophina Choudry TRIAL CHIEF INVESTIGATOR Dr Garry Squires and Prof Neil Humphrey SAP AUTHOR Dr Sophina Choudry SAP VERSION Version 1.0 SAP VERSION DATE 06/07/2017 EEF DATE OF APPROVAL DEVELOPER DATE OF APPROVAL Protocol and SAP changes Primary intention-to-treat (ITT) analysis We will apply a 2 level multilevel model rather than a 3 level multilevel model with time as the third level (as set out in the protocol). This is because including time as a third level would require more than one measurement point for the analysis to be feasible. Hence, time has been excluded from the analysis, as well as any cross-level interaction term (group*time; e.g. if AfA, if post-test). We also include ‘AfA target group’ as an explanatory variable in the subgroup analysis. We have done so because the AfA program has a specific focus on raising attainment for this particular group of students. Finally, we have also changed the primary outcome from KS2 total marks (for reading and writing) to KS2 reading marks only. This change has been requested by EEF following the introduction of new SATs and questions about the reliability of the writing component. Sensitivity analysis We have included a step by step model building approach from Model 1.2 to 1.4). Model 1.1 is the main analysis from which we will draw our primary conclusion about the effectiveness of AfA, and 1.2 onwards are sensitivity analyses. So the changes from protocol are to align our analyses with EEF's requirements and to justify the inclusion of covariates statistically. Please note that we have now also included model 1.5 and model 1.6, which have KS2 total marks and KS2 writing as outcome variables respectively. We will also check for correlation between reading and writing in order to address the concerns raised regarding low correlation in recent years (see Allen, 2016).

Welcome message from author
This document is posted to help you gain knowledge. Please leave a comment to let me know what you think about it! Share it to your friends and learn new things together.
Transcript
Statistical Analysis Plan for Achievement for all University of Manchester
INTERVENTION Achievement for All Schools Programme
DEVELOPER Achievement for All 3As
EVALUATOR University of Manchester
TRIAL REGISTRATION
NUMBER
DOI 10.1186/ISRCTN67347514
TRIAL STATISTICIAN
Dr Sophina Choudry
TRIAL CHIEF INVESTIGATOR
Dr Garry Squires and Prof Neil Humphrey
SAP AUTHOR Dr Sophina Choudry
SAP VERSION Version 1.0
SAP VERSION DATE
06/07/2017
EEF DATE OF APPROVAL
DEVELOPER DATE OF
APPROVAL
Protocol and SAP changes
Primary intention-to-treat (ITT) analysis
We will apply a 2 level multilevel model rather than a 3 level multilevel model with time as the third
level (as set out in the protocol). This is because including time as a third level would require more
than one measurement point for the analysis to be feasible. Hence, time has been excluded from the
analysis, as well as any cross-level interaction term (group*time; e.g. if AfA, if post-test). We also
include ‘AfA target group’ as an explanatory variable in the subgroup analysis. We have done so
because the AfA program has a specific focus on raising attainment for this particular group of
students. Finally, we have also changed the primary outcome from KS2 total marks (for reading and
writing) to KS2 reading marks only. This change has been requested by EEF following the
introduction of new SATs and questions about the reliability of the writing component.
Sensitivity analysis
We have included a step by step model building approach from Model 1.2 to 1.4). Model 1.1 is the
main analysis from which we will draw our primary conclusion about the effectiveness of AfA, and 1.2
onwards are sensitivity analyses. So the changes from protocol are to align our analyses with EEF's
requirements and to justify the inclusion of covariates statistically.
Please note that we have now also included model 1.5 and model 1.6, which have KS2 total marks
and KS2 writing as outcome variables respectively. We will also check for correlation between reading
and writing in order to address the concerns raised regarding low correlation in recent years (see
Allen, 2016).
Statistical Analysis Plan for Achievement for all University of Manchester
Table of contents
Introduction.............................................................................................................................................. 3
Intervention ...................................................................................................................................... 3
Trial .................................................................................................................................................. 3
Purpose ............................................................................................................................................ 3
Research Questions ........................................................................................................................ 4
Study design ........................................................................................................................................... 4
Population and Eligibility Criteria ..................................................................................................... 4
Sample Size ..................................................................................................................................... 5
Trial Design and Trial Arms ............................................................................................................. 5
Number and Timing of Measurement Points ................................................................................... 6
Randomisation ........................................................................................................................................ 6
Calculation of sample size ...................................................................................................................... 6
Follow-up ................................................................................................................................................. 8
Outcome measures ................................................................................................................................. 8
Primary outcome .............................................................................................................................. 8
Secondary outcomes ....................................................................................................................... 9
Analysis ................................................................................................................................................... 9
Primary intention-to-treat (ITT) analysis .......................................................................................... 9
Interim analyses ............................................................................................................................. 10
Imbalance at baseline .................................................................................................................... 10
Missing data ................................................................................................................................... 10
Subgroup analyses ........................................................................................................................ 11
Sensitivity Analysis ........................................................................................................................ 11
Implementation analysis ................................................................................................................ 12
Secondary outcome analyses ........................................................................................................ 13
Additional analyses ........................................................................................................................ 14
Effect size calculation .................................................................................................................... 15
References ............................................................................................................................................ 15
Report tables ......................................................................................................................................... 15
Appendix – Year 4 Data ........................................................................................................................ 19
Statistical Analysis Plan for Achievement for all University of Manchester
Introduction
Intervention
The Achievement for All (AfA) Schools Programme is a national school-based programme aiming to
address the gap in attainment between the lowest achieving 20% of children and their classmates. It
is essentially a school improvement programme that focuses on four areas: leadership and
governance in schools; teaching and learning; parent and carer engagement; and, wider outcomes
and opportunities.
The direct recipients of the AfA Schools Programme are the teachers in a school. Each AfA school
has a designated member of staff known as the AfA champion who works in collaboration with an AfA
coach (employed by AfA 3As) to identify the needs of the school in order to develop a tailored
program. Together they co-ordinate and select priority school/teacher develpment areas out of the
four mentioned above. Each AfA school also has a lead teacher who may be the same person as the
AfA champion (but not necessarily). A step-by-step guide is subsequently provided for participating
schools by the AfA coach. In addition, teachers are able to access an online learning platform (The
Bubble) containing four core, tailored (i.e. modules that have been selected by AfA coach based on
the school’s priority development area from a list of options– e.g. leadership for inclusion
collaborative action research, etc.) and partner modules (e.g. BBC Children in Need fun and
friendship, etc.). The four core modules are Leadership for inclusion; Teaching and Learning; Wider
Outcomes and Opportunities and Engaging with Parents and Carers. Each of these core development
areas contains a core module and a list of ‘tailored’ modules. For example, the core area Engaging
with Parents and Carers has one core module, namely, ‘structured conversations with parents’, and
two tailored modules called ‘early support’ and ‘welcoming and including families’. Teachers have the
opportunity to access these modules online to negotiate their own learning or have the AfA coaches
deliver them. Each AfA school gets up to 12 AfA coach ‘interactions’ in each school year. Their
designated AfA coach supports them in their attempts to enact changes in practice in the above
areas. Schools taking part in the intervention also have the opportunity to work towards a AfA quality
mark based on the AfA coach evaluation of the progress made against a set of AfA derived
standards. Not every school taking part in the AfA programme is awarded the quality mark.
Trial
This effectiveness trial comprises two distinct strands: (i) the randomised controlled trial (RCT) strand,
and (ii) the implementation and process evaluation (IPE) strand. The evaluation team are responsible
for a) initial consultation and guidance to ensure suitable groundwork for a robust trial (i.e. advising
how many schools AfA may wish to recruit, ethical considerations, research design); b) working with
identified schools to participate in data collection and analysis as part of the research for both the
RCT and IPE strand; and c) analysis and report writing.
Achievement for All (AfA 3As) are responsible for recruitment of schools to a pool of potential
participants and for delivery of the AfA Schools Programme.
Purpose
In the national pilot, the AfA Schools Programme was shown to be very promising, particularly in relation to vulnerable learners in the education system (including those with SEN and those from disadvantaged backgrounds). However, there is genuine uncertainty about the strength of the claims made around the potential of the programme to produce socially significant change in attainment and other outcomes for children The primary aim of the RCT strand of the study is to explore whether tailored whole school approaches delivered by Achievement for All (AfA 3As) can lead to improvements in children’s

4
academic performance in literacy (specifically, those in Years 4 and 5). The secondary aim of the RCT strand will be to explore whether there are improvements in maths, attendance and resilience-related outcomes. The aim of the IPE strand of the study is to understand and unpack the complex relations that underpin such a flexible, multifaceted model of implementation, where the tailored packages delivered by Achievement for All (AfA 3As) for one school are likely to be different to the package for another school. We will try and understand the process of delivery of the intervention through a case study approach, where schools will be the cases. This will allow us to account for exemplary practices of the model delivered, how these vary from case to case, and with what consequences for students’ attainment and other outcomes. If there is no overall impact of using Achievement for All (AfA 3As) compared to usual school improvement practices, then the IPE strand will help us to understand why this might be.
Research Questions
This RCT strand of the trial is designed to answer the following research questions:
1. Compared to usual practice, what is the impact of AfA on children’s literacy (primary outcome), maths, attendance
1 and resilience-related outcomes (secondary outcomes)?
a. After 5 terms of exposure (Year 5 cohort) (quant) b. After 6+ terms of exposure? (Year 4 cohort) (quant) c. What are the perceived impacts of AfA among intervention stakeholders (e.g.
teachers, head teachers)? (qual)
2. In relation to RQ1 above, are there differential intervention benefits in the above outcomes among pre-specified subgroups of children? (quant/qual)
a. Among children eligible for free school meals (FSM)? (quant) b. Among the target group of children identified by participating schools as belonging to
‘the lowest achieving 20%’? (quant) c. What processes underpin any differential intervention benefits identified? (qual)
The IPE strand of the trial is designed to answer the following research questions:
3. How is AfA implemented, and what difference does it make? (quant/qual) a. How and why does AfA implementation vary? (quant/qual) b. To what extent does implementation variability moderate intervention outcomes?
i. Do outcomes vary as a function of ‘on treatment’ status? (quant) ii. Do differential intervention benefits among specified subgroups vary as a
function of ‘on treatment’ status? (quant) iii. What are the proposed critical components of AfA, and to what extent does
their relative presence/absence influence outcomes? (quant/qual) c. To what extent does contextual variation influence the implementation of AfA (and,
subsequently, outcomes)? (quant/qual) i. How and why is this the case? (qual)
4. Is there evidence to support the AfA theory of change? (quant/qual)
Please note that RQ1c and RQ2c will be dealt with qualitative analysis of case study data obtained
during the IPE phase.
Study design
Population and Eligibility Criteria
The plan in the protocol was to recruit 160 primary schools by AfA. In the first instance AfA attempted
to recruit schools in the North East of England and then broadened out to other regions as required.
1
Among children in the AfA target group (‘the lowest achieving 20%’).
5
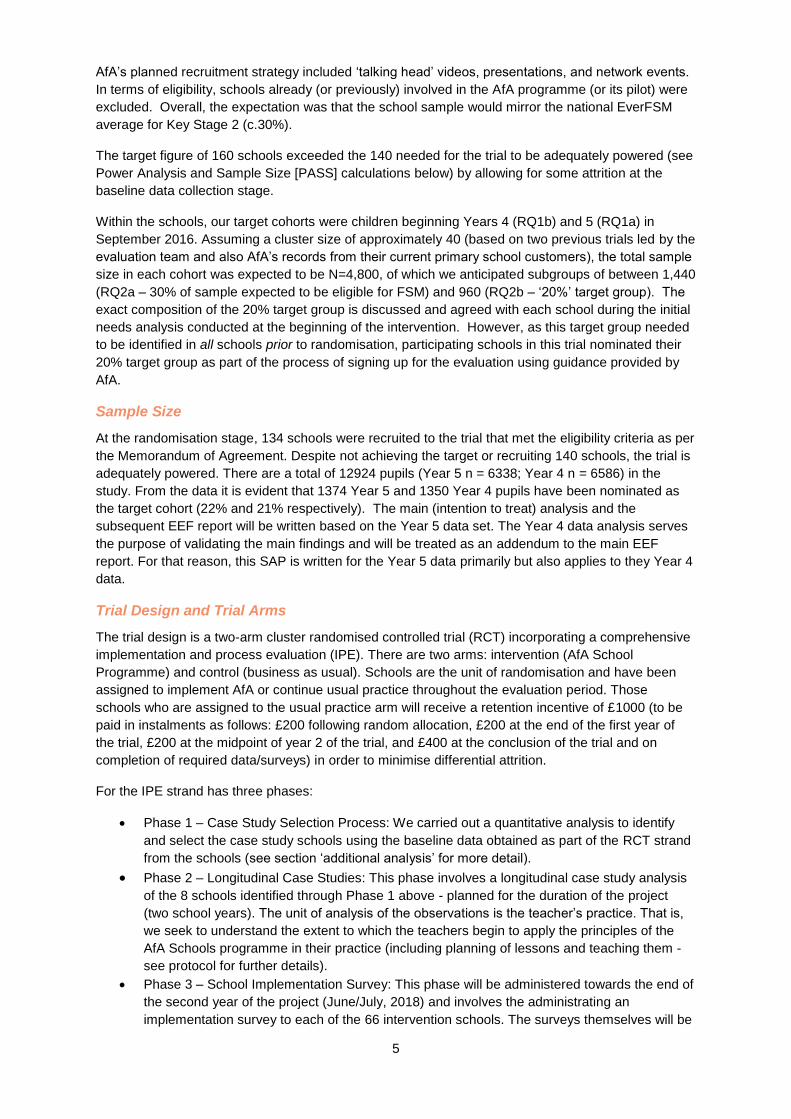
AfA’s planned recruitment strategy included ‘talking head’ videos, presentations, and network events.
In terms of eligibility, schools already (or previously) involved in the AfA programme (or its pilot) were
excluded. Overall, the expectation was that the school sample would mirror the national EverFSM
average for Key Stage 2 (c.30%).
The target figure of 160 schools exceeded the 140 needed for the trial to be adequately powered (see
Power Analysis and Sample Size [PASS] calculations below) by allowing for some attrition at the
baseline data collection stage.
Within the schools, our target cohorts were children beginning Years 4 (RQ1b) and 5 (RQ1a) in
September 2016. Assuming a cluster size of approximately 40 (based on two previous trials led by the
evaluation team and also AfA’s records from their current primary school customers), the total sample
size in each cohort was expected to be N=4,800, of which we anticipated subgroups of between 1,440
(RQ2a – 30% of sample expected to be eligible for FSM) and 960 (RQ2b – ‘20%’ target group). The
exact composition of the 20% target group is discussed and agreed with each school during the initial
needs analysis conducted at the beginning of the intervention. However, as this target group needed
to be identified in all schools prior to randomisation, participating schools in this trial nominated their
20% target group as part of the process of signing up for the evaluation using guidance provided by
AfA.
Sample Size
At the randomisation stage, 134 schools were recruited to the trial that met the eligibility criteria as per
the Memorandum of Agreement. Despite not achieving the target or recruiting 140 schools, the trial is
adequately powered. There are a total of 12924 pupils (Year 5 n = 6338; Year 4 n = 6586) in the
study. From the data it is evident that 1374 Year 5 and 1350 Year 4 pupils have been nominated as
the target cohort (22% and 21% respectively). The main (intention to treat) analysis and the
subsequent EEF report will be written based on the Year 5 data set. The Year 4 data analysis serves
the purpose of validating the main findings and will be treated as an addendum to the main EEF
report. For that reason, this SAP is written for the Year 5 data primarily but also applies to they Year 4
data.
Trial Design and Trial Arms
The trial design is a two-arm cluster randomised controlled trial (RCT) incorporating a comprehensive
implementation and process evaluation (IPE). There are two arms: intervention (AfA School
Programme) and control (business as usual). Schools are the unit of randomisation and have been
assigned to implement AfA or continue usual practice throughout the evaluation period. Those
schools who are assigned to the usual practice arm will receive a retention incentive of £1000 (to be
paid in instalments as follows: £200 following random allocation, £200 at the end of the first year of
the trial, £200 at the midpoint of year 2 of the trial, and £400 at the conclusion of the trial and on
completion of required data/surveys) in order to minimise differential attrition.
For the IPE strand has three phases:
Phase 1 – Case Study Selection Process: We carried out a quantitative analysis to identify
and select the case study schools using the baseline data obtained as part of the RCT strand
from the schools (see section ‘additional analysis’ for more detail).
Phase 2 – Longitudinal Case Studies: This phase involves a longitudinal case study analysis
of the 8 schools identified through Phase 1 above - planned for the duration of the project
(two school years). The unit of analysis of the observations is the teacher’s practice. That is,
we seek to understand the extent to which the teachers begin to apply the principles of the
AfA Schools programme in their practice (including planning of lessons and teaching them -
see protocol for further details).
Phase 3 – School Implementation Survey: This phase will be administered towards the end of
the second year of the project (June/July, 2018) and involves the administrating an
implementation survey to each of the 66 intervention schools. The surveys themselves will be

6
developed during the first year of the project based on the qualitative data collected in Phase
2 (see above).
Number and Timing of Measurement Points
Table 1 – Timeline for trial data points (RCT and IPE)
Activities
Lead-in
03/2016-
05/2016
09/2016 10/2016 05/2018 06/2018 07/2018 08/2018 05/2019
Primary outcome
measures (Y4
cohort)
KS1 pre-test
(sat in
summer
2015)
KS2
post-test
Secondary
outcome
measures (Y4
cohort)
% attendance
16/17 Resilience pre-test
Resilience
post-test
%
attendance
17/18
Primary outcome
measures (Y5
cohort)
KS1 pre-test
(sat in
summer
2014)
KS2
post-
test
Secondary
outcome
measures (Y5
cohort)
% attendance
16/17 Resilience pre-test
Resilience
post-test
%
attendance
17/18
Usual Practice
Survey (UPS) School UPS School UPS
Implementation
Survey School IS
Case Study Data
collection 03/2017 – 06/2018 (for Year 5)
Randomisation
Randomisation took place in November, 2016 after the baseline pre-test surveys for the secondary
outcome of ‘resilience’ were completed. The randomisation procedure was conducted independently
of the evaluation team by the Manchester Academic Health Science Centre Clinical Trial Units
(MAHSC-CTU) to eliminate selection bias. A minimisation algorithm was applied, utilising the
following school-level co-variates sourced from EDUBASE: %FSM, %SEN, and Attainment2. Given
the nature of the AfA intervention and the primary trial outcome, these are the most important
observables on which to obtain balance at baseline. a result of this process of the randomisation
outcome and in order to achieve balance based on the minimization protocol, 66 and 68 schools were
randomly allocated to the intervention arm and control arm respectively (rather than 67 in each
group).
Calculation of sample size
PASS calculations are based on our primary outcome measure using the software Optimal Design
Program (version 3.01) as recommended by EEF. At protocol stage, Achievement for All (3As) aimed
2 Any such information missing from EDUBASE will be sourced directly from the school in question.
7
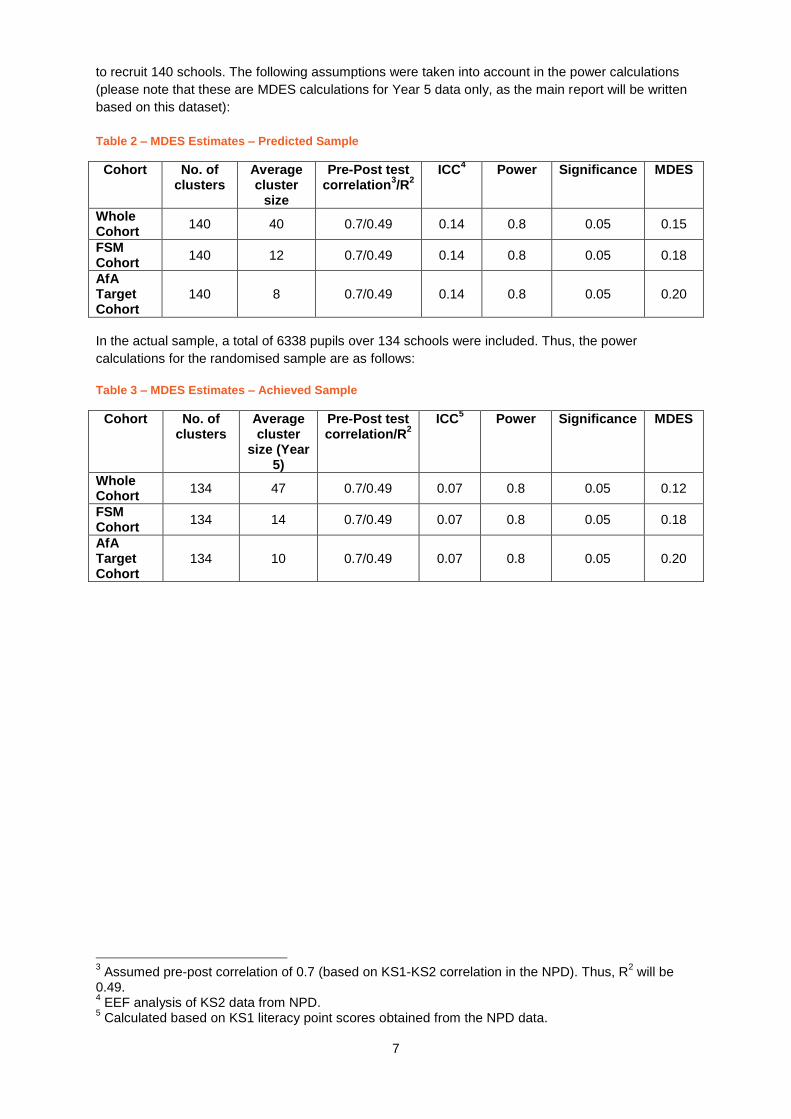
to recruit 140 schools. The following assumptions were taken into account in the power calculations
(please note that these are MDES calculations for Year 5 data only, as the main report will be written
based on this dataset):
Table 2 – MDES Estimates – Predicted Sample
Cohort No. of clusters
Average cluster
size
Pre-Post test correlation
3/R
2 ICC
4 Power Significance MDES
Whole Cohort
140 40 0.7/0.49 0.14 0.8 0.05 0.15
FSM Cohort
140 12 0.7/0.49 0.14 0.8 0.05 0.18
AfA Target Cohort
140 8 0.7/0.49 0.14 0.8 0.05 0.20
In the actual sample, a total of 6338 pupils over 134 schools were included. Thus, the power
calculations for the randomised sample are as follows:
Table 3 – MDES Estimates – Achieved Sample
Cohort No. of clusters
Average cluster
size (Year 5)
Pre-Post test correlation/R
2 ICC
5 Power Significance MDES
Whole Cohort
134 47 0.7/0.49 0.07 0.8 0.05 0.12
FSM Cohort
134 14 0.7/0.49 0.07 0.8 0.05 0.18
AfA Target Cohort
134 10 0.7/0.49 0.07 0.8 0.05 0.20
3 Assumed pre-post correlation of 0.7 (based on KS1-KS2 correlation in the NPD). Thus, R
2 will be
0.49. 4 EEF analysis of KS2 data from NPD.
5 Calculated based on KS1 literacy point scores obtained from the NPD data.

Statistical Analysis Plan for Achievement for all University of Manchester
Follow-up
Figure 1: Participant flow diagram for Year 5
Outcome measures
Primary outcome
The primary outcome measure for the trial is children’s academic attainment in reading for the year 5
cohort. Specifically, we are interested in the impact of AfA on the reading levels of (a) the AfA ‘target
group’ and (b) the wider population of children in our trial cohort as joint primary outcomes.
This data will be sourced from the National Pupil Database (NPD), with end of Key Stage 1 data used
as a pre-test covariate and end of Key Stage 2 data used as the main post-test outcome. Using NPD
data minimises attrition and bias (and in particular, preserves intention to treat (ITT) analyses without
Re
cru
itm
en
t A
na
lysis
F
ollo
w-u
p
Allo
ca
tion
Assessed for eligibility (school n = 141)
Randomised (school n = 134; pupil n = 6338)
Excluded (school n = 7) - Not meeting inclusion criteria (school n = 7)
Allocated to intervention (school n
= 66; pupil n = 3027)
Did not receive allocated
intervention (school n = 3; pupil n =
73)
Allocated to control (school n = 68;
pupil n = 3311)
Post-test data
collected Post-test data
collected
Analysed
Approached (school n = 145 tbc)
Declined to participate (school n = 4 tbc)
Lost to follow-up
Lost to follow-up
Not
analysed
Analysed Not
analysed
9
the need for imputation), greatly reduces the data burden on participating schools, and increases the
external validity of the evaluation (since this data provides the primary metrics by which schools in
England are judged). The variables used are:
Post-test - KS2 English Reading Marks (marks for reading only)
Pre-test - KS1 Literacy Point Score (reading and writing)
Secondary outcomes
Attendance
Attendance data (% half-days missed due to unauthorised absence) will be sourced from the NPD.
Given the uniformly high attendance rates across primary schools, our analyses of this outcome will
be restricted to children in the AfA target cohort.
Resilience-related outcomes
Children’s self-reported self-esteem, goals and aspirations, family connection and school connection
will be assessed using subscales of the Student Resilience Survey (SRS) (Sun & Stewart, 2007).
Pupils read ten statements (e.g. “I can do most things if I try”) and respond on a 5-point scale (where
1 = Never and 5 = Always). These outcomes will be captured via a secure online survey platform
(World App Key Survey). The domains or sub-scales to be assessed were agreed in discussion
between UoM, AfA and EEF as being those that provided the optimal fit to non-academic outcomes
noted in the AfA theory of change. The SRS is a relatively new instrument and although sub-scales
have been identified by Sun & Stewart (2007), we will need to check the consistency of the scales
within our data set. We will be carrying out a preliminary analysis using the baseline SRS data in
order to establish the factor structure of the items and validate the sub-scales. On the basis of this
analysis we may revise the subscale structure.
Other outcomes
Academic attainment in writing and maths for Year 5 pupils (and Year 4 and reported in the appendix)
will also be modelled.
Analysis
Primary intention-to-treat (ITT) analysis
RQ1: Compared to usual practice, what is the impact of AfA on children’s reading (primary
outcome), writing, maths, attendance6 and resilience-related outcomes (secondary
outcomes)?
a) After 5 terms of exposure (Year 5 cohort) (quant) b) After 6+ terms of exposure? (Year 4 cohort) (quant)
For RQ1, we will apply a two-level multi-level random slope and random intercept model using the
software MLWin Version 2.36, where pupils are clustered at the school level. A random intercept
model implies that for every school included in the analysis, the effect of all background variables on
individuals’ primary outcome (for example KS2 reading scores) is assumed constant. Only the
intercepts vary between schools, and the slopes of each school are parallel to each other. However,
when allowing within school variation (i.e. allowing the slopes to vary with the intercepts), one can
also analyse for the effect of background variables on individual students’ outcomes.
6
Among children in the AfA target group (‘the lowest achieving 20%’).

10
At the school level we will include the following explanatory variables: group (e.g. AfA, usual practice),
%FSM, %SEN and %KS2 Reading Writing Mathematics (RWM) combined level 4+ (given that these
were the minimisation variables – as per the EEF protocol). At the child level we will include prior KS1
literacy attainment as an explanatory variable given its established association with our primary trial
outcome. We will refer to this model as Model 1.1. Subsequently, we will carry out sensitivity analysis
by adding Special Educational Needs (SEN) and gender to Model 1.1 (see sensitivity analysis section
on page 11 for further details).
Equation 1 – Primary Outcome Analysis
Where:
YPost
= KS2 reading scores (for the primary outcome analysis)
YPre
= Key Stage 1 literacy point scores
Group = Condition at school level j
Rand = Randomisation variables at school level j (i.e. %FSM, %SEN and %RWM 4+ categorised as
low, middle and high)
X = control variables (e.g. FSM, AfA target group, etc. for model 1.2 onwards)
ε = error term for pupils i clustered at school level j
i = pupil i
j = school j
Interim analyses
N/A
Imbalance at baseline
As the analysis is based on Intention To Treat, even if schools allocated to the intervention arm do not
receive the AfA schools programme (see Participant Flow Diagram above), their data will be included
in the analysis. The primary outcome variable (KS2 literacy attainment) will be obtained from the
NPD, and thus attrition will not affect balance at baseline. The 3 schools identified to date that are not
receiving the intervention have agreed for the data to be collected, analysed and reported. We will
demonstrate equivalence at baseline for the primary and secondary outcomes. This process has
already started for data that has already been obtained (e.g. KS1 attainment data – see tables on
page 14 and onwards of this SAP).
Missing data
We will determine the missing values for intervention and control (including school attrition and other
reasons such as pupil absence on the day of the tests or incomplete tests) once we have obtained the
post-test data. We will assess the dataset for each outcome to determine the % incomplete cases,
then if this exceeds 5% we will perform sensitivity analyses in the form of Multiple Imputation for the
MLM models.
We will also investigate the missing data. In other words, we will introduce a binary variable for
complete (1) and incomplete cases (0). Here, a complete case is defined as a case that has the post-
test (KS2 literacy score) and pre-test (KS1 literacy score) data present. We will carry out a regression
analysis with this as an outcome variable and condition (treatment or control), FSM eligibility and AfA
target cohort (Yes/No) as explanatory variables. By doing so, we will be able to deduce students (e.g.
who are eligible for FSM) likelihood of completing the pre and post-test and thereby their likelihood of
having complete cases.

11
Subgroup analyses
RQ2: In relation to RQ1 above, are there differential intervention benefits in the above outcomes among pre-specified subgroups of children? (quant/qual)
a) Among children eligible for free school meals (FSM)? (quant) b) Among the target group of children identified by participating schools as belonging to ‘the lowest achieving 20%’? (quant)
Subgroup analysis will be performed to answer RQ2 by running the model presented in equation 1
(model 1.1) for the primary and secondary outcome variables and extending it to include cross level
interaction terms:
Model 2.1 – will include EverFSM and the interaction trial group*EverFSM (i.e. if treatment, if
EverFSM eligible).
Model 2.2 – will include AfA target group and the interaction trial group*AfA (if treatment, if
AfA target group).
In addition, Model 1.1 will be re-run with a subset of the main data using only FSM students.
Sensitivity Analysis
The sensitivity analysis will involve two elements: (a) Multiple Imputation (if necessary – see above;
we currently anticipate <5% missing data as both pre- and post-test are NPD-derived) and (b) re-
analysis of the main ITT model (Model 1.1) or carrying on from model 2.2, if the effects are found to
be significant with additional explanatory variables or different outcome variables.
Multiple imputation procedures will be carried out using the software REALCOM-IMPUTE assuming
that the data is missing at random (Carpenter et al., 2011). Thus we will be able to include partially
observed cases (i.e. cases that have either the KS2 literacy test score or the KS1 literacy test score
missing) of all 6338 pupils in the analysis and reduce bias. A range of demographic variables (e.g.
gender, FSM eligibility, AfA target group, SEND provision), explanatory outcome variables (i.e.
primary and secondary outcome variables), and the constant can be entered as auxiliary variables
and used to impute missing values. REALCOM-Impute default settings of 1000 iterations and a burn-
in of 100, refresh of 10, will be used, following guidance for multi-level imputation with mixed response
types (Carpenter et al., 2011). Such an approach is in line with the EEF protocol for intention to treat
analysis.
We will then also analyse the data by adding the following explanatory variables to Model 1.1:
Model 1.2 – will include SEN.
Model 1.3 – will include gender.
Model 1.4 – will include usual practice indicator(s) derived from the Usual Practice Survey in
order to provide a more robust estimate of the achieved relative strength of AfA.
For model 1.1 (main ITT model), we have used KS2 reading only as our primary outcome variable.
This is because evidence has shown that recent changes to assessment have led to lower correlation
between KS2 reading and KS2 writing (from 0.84 in 2015 to 0.34 in 2016 – see Allen, 2016). Hence,
we propose a sensitivity analysis in which we re-run the main ITT with KS2 English (reading and
writing) and also KS2 writing alone:
Model 1.5 – will include KS2 English total marks (reading and writing) as a secondary
outcome variable.
Model 1.6 – will include KS2 writing as a secondary outcome variable.
We will also check and analyse the attainment data that will be collected in 2018 and 2019 for a
changes in the correlation between KS2 reading and writing.

12
All the models above will be build step by step with the inclusion of these variables and the changes
in the log-likelihood and changes in variance partition coefficient (VPC) will be reported to ascertain, if
the introduction of a certain variable explains any further variation in the model. Importantly, we will
assess the extent to which our substantive finding of interest (the impact of AfA on our primary
outcome) is sensitive to the above changes to our basic analytical model.
Implementation analysis
RQ3: How is AfA implemented, and what difference does it make?
a) How and why does AfA implementation vary?
b) To what extent does implementation variability moderate intervention outcomes?
i) Do outcomes vary as a function of ‘on treatment’ status?
ii) Do differential intervention benefits among specified subgroups vary as a
function of ‘on treatment’ status?
iii) What are the proposed critical components of AfA, and to what extent does
their relative presence/absence influence outcomes?
Using the knowledge generated from our IDEA workshop and the first three terms of our longitudinal
implementation case studies, we will design a school-level implementation survey to be administered
through a secure online portal during the second year of the trial (2017/18) and completed by the
school’s AfA lead. This survey will be used to (a) document implementation activity across the schools
in the intervention arm of the trial, thus enabling us to (b) assess the relative presence/absence of
proposed critical components of AfA, and (c) document hypothesised change mechanisms/processes.
The data from the implementation survey will be used to measure and construct implementation
variables.
For RQ3a we will utilise data from schools allocated to the intervention arm of the trial. 2-level MLM
will be utilised (students clustered at school level). Only schools in the intervention arm will be
included in this analysis (i.e. 66 schools). The basic model will be fitted for the primary outcome
analysis (KS2 reading) and follow the same specification (including accompanying explanatory
variables) as specified in equation 1 – primary outcome analysis with the exception of removal the
group variable (if intervention or control). In addition, we will also introduce implementation variables
to determine the effect of implementation on the outcome variable. This model will be referred to as
model 3.1.
To answer RQ3b, we will add the following variables to model 3.1:
Model 3.2 - For RQ3b(i), on-treatment status will be introduced as an explanatory variable.
We will collect data from AfA to ascertain how many treatment schools will have been
awarded with their Quality Mark (QM) status7 by the end of their program. Schools that are
awarded a QM will be coded as on-treatment. Schools that will not have achieved QM will be
coded as off-treatment.
Model 3.3 - For RQ3b(ii), we will follow the above procedure but in addition introduce the sub-
group membership indicator (e.g. FSM eligibility) as an explanatory variable at the child level.
This will allow us to model cross-level interaction (on-treatment*sub-group, e.g. if on-
treatment, if FSM) to determine whether differential intervention benefits among specified
subgroups vary as a function of on-treatment implementation.
Model 3.4 For RQ3b(iii) we will introduce critical component indicators as explanatory
variables at the school level and model outcomes as specified above.
7 The AfA schools programme primary school quality scheme as two awards: Quality Mark (QM) and
Quality Lead (QL). All school who successfully complete the AfA programme are expected to achieve QM status. This is evaluated in the second year of the programme against AfA extended criteria. AfA’s estimate is that c.50% of schools will achieve QM status within the time period of this trial.

13
As before, we will build the model step by step with the inclusion of implementation variables and their
interactions for the above models and report on the change in the log-likelihood and change in
variance partition coefficient (VPC) to ascertain if the introduction of a certain variable or interaction
explains any further variation in the model.
Structural Equation Modeling
RQ3c: To what extent does contextual variation influence the implementation of AfA (and, subsequently, outcomes)? RQ4: Is there evidence to support the AfA theory of change? (quant/qual)
For RQ3c and RQ4 we will utilise Structural Equation Modeling (SEM), specifically, multi-level path
analysis using the software Mplus 7 version 1.4. We will analyse two relations in the SEM path
analysis (see figure 2):
The relation between contextual variations and the outcome;
and if this relation is mediated by implementation variables.
The contextual variation variables are the school level randomisation parameters (%FSM, % SEN,
%RWM 4+ categorized as low, medium and high). The outcome is KS2 reading scores and the
implementation variables are yet to be constructed (see above).
Mplus Model Specification: Context implementation outcomes paths
Type: 2 level model clustered at the school level
Analysis: (if categorical variable) robust weighted least squares (WLSMV)
Figure 2 - Mplus Model Specification – relations explored
The findings from this analysis will then inform RQ3c, as well as RQ4 by comparing the result to the
existing AfA theory of change.
Secondary outcome analyses
The secondary outcome analysis will follow the same principle as demonstrated with equation 1
above with different dependent variables. Thus, there will be one model for each of the subscales:
1. Secondary outcome model 1.1.1: attendance with a binary variable of up to 10% being coded
as 0 and more than 10% being coded as 1. Please note that the threshold for 10% is being
applied as per the Department for Education definition of persistence absence (see DfE,
2017).
2. Secondary outcome model 1.1.2: resilience related outcomes (Student Resilience Survey).
3. Secondary outcome model 1.1.3: KS2 mathematics attainment with KS1 mathematics points
as an individual background variable.
4. Secondary outcome model 1.1.4: KS2 writing scores as an outcome variable.
Contextual
Variation
Implementation
variables
Primary Outcome:
KS2 Reading
14
The primary and secondary outcome analysis will address RQ1.
Additional analyses
Besides basic descriptive analysis (e.g. mean, standard deviation for control and intervention groups),
we also carried out a 2 level multilevel model analysis using the baseline data obtained as part of the
RCT strand from the schools (through AfA) with the aim to identify case study schools (phase 1 of IPE
strand).
We applied a two level multi-level model (random intercept and slope model), where pupils are
clustered at school level:
Equation 2 – Case Study Selection Model
Where:
Y = Key Stage 1 literacy point scores (for the primary outcome)
X = control variables (i.e. Free School Meal eligibility, Special Educational Needs, and AfA target
group)
ε = error term for pupils clustered at school level
i = pupil i
j = school j
All intervention schools (n = 66) in the subset database were ranked according to their residuals and
relevant graphs were produced.
• The ranking took place according to the following criteria: i. Low attaining - schools with greater proportion of students with below average KS1
Literacy scores. ii. High attaining - schools with greater proportion of students with above average KS1
Literacy scores. iii. Adding more value to the AfA group - schools with greater proportion of AfA students with
above average KS1 literacy point mean. iv. Adding less value to the AfA group - schools with greater proportion of AfA students with
below average KS1 literacy point mean.
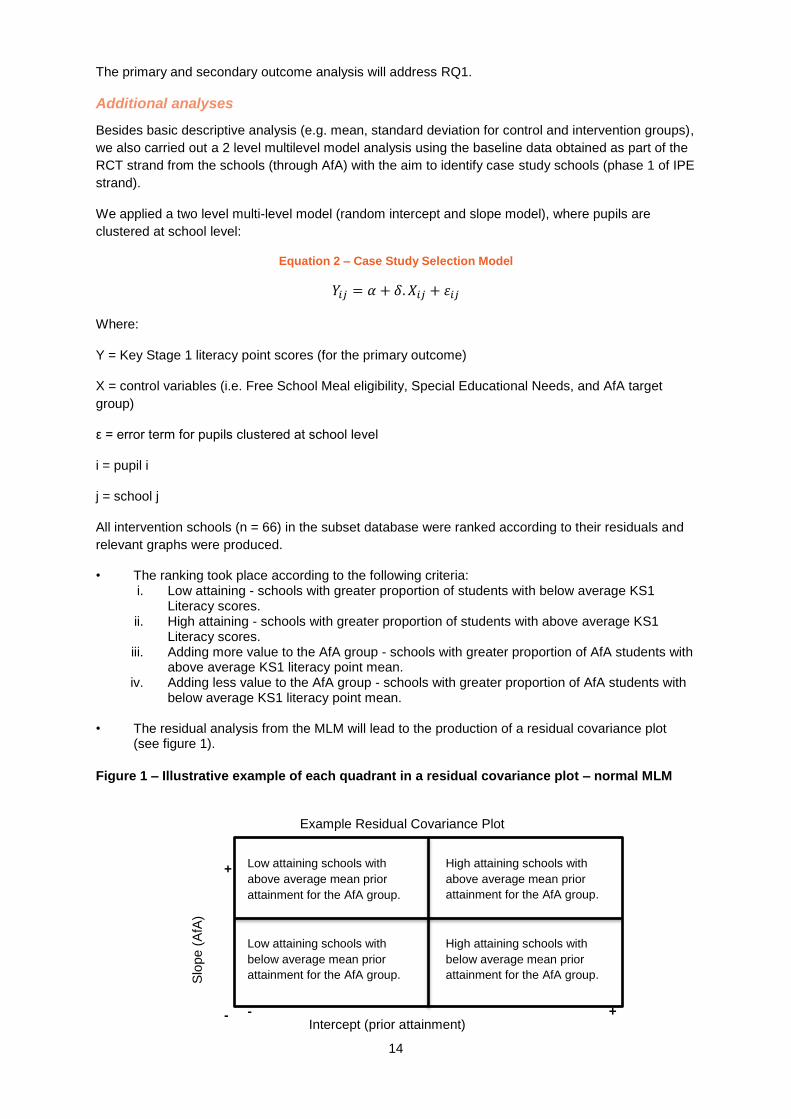
• The residual analysis from the MLM will lead to the production of a residual covariance plot (see figure 1).
Figure 1 – Illustrative example of each quadrant in a residual covariance plot – normal MLM
Intercept (prior attainment)
Example Residual Covariance Plot
Slo
pe (
AfA
)
+
+ - -
Low attaining schools with
above average mean prior
attainment for the AfA group.
Low attaining schools with
below average mean prior
attainment for the AfA group.
High attaining schools with
above average mean prior
attainment for the AfA group.
High attaining schools with
below average mean prior
attainment for the AfA group.

15
models
We identified 12 schools, 3 from each quadrant in figure 1, according to highest rank in the specific
category and contacted each of them with the intention to finalise 8 schools for the case study
analysis.
Effect size calculation
Effect sizes will be reported using Hedge’s g (Cohen’s d bias corrected) will be accompanied by 95%
confidence intervals as per EEF guidelines.
References
Allen, R. (2016, September 1st). Consistency in Key Stage 2 writing across local authorities appears
to be poor [Blog post]. Retrieved from http://educationdatalab.org.uk/2016/09/consistency-in-key-
stage-2-writing-across-local-authorities-appears-to-be-poor/
Carpenter, J. R., Goldstein, H., & Kenward, M. G. (2011). REALCOM-IMPUTE software for multilevel
multiple imputation with mixed response types. J stat softw, 45(5), 1-14.
Sun, J., & Stewart, D. (2007). Age and gender effects on resilience in children and adolescents.
International Journal of mental health promotion, 9(4), 16-25.
Report tables
MDES for Year 5
Stage
N [schools/pupils] (n=intervention;
n=control)
Correlation between pre-test (+other
covariates) & post-test
ICC Power Alpha
Minimum detectable effect size
(MDES)
Protocol 140/5600 (70/2800; 70/2800)
0.7 0.14 80% 0.05 0.20
Randomisation 136/6338 (66/3027; 68/3311)
0.7 0.07 80% 0.05 0.20
Analysis (i.e. available pre- and post-test)
80% 0.05
Balance at baseline – Year 5
Variable Intervention group Control group
School-level (categorical) n/N (missing) Percentage n/N
(missing) Percentage

16
School Type: Academy Converted Academy Sponsored Community School Foundation School Voluntary Added School Voluntary Controlled School
14/66 (0) 9/66 (0)
34/66 (0) 1/66 (0) 5/66 (0) 3/66 (0)
21% 14% 52% 2% 8% 5%
16/68 (0) 7/68 (0)
30/68 (0) 2/68 (0) 8/68 (0) 5/68 (0))
21% 13% 50% 1% 7% 4%
Ofsted rating: Outstanding Good Requires Improvement Inadequate
6/66 (0)
48/66 (0) 10/66 (0) 2/66 (0)
9% 73% 15% 3%
7/68 (0)
51/68 (0) 7/68 (0) 3/68 (0)
10% 75% 10% 4%
Location/Setting: Urban Rural
53/66 (0) 13/66 (0)
80% 20%
56/68 (0) 1268 (0)
78% 20%
School-level (continuous) n (missing) [Mean] n (missing) [Mean]
% of Pupil Eligible for FSM 66 (0) 18.2% 68 (0) 17.6%
% of SEN Pupil 66 (0) 14.3% 68 (0) 16.0%
% Reading, Writing and Mathematics Combined Attainment at KS2 4+
66 (0) 79.2% 68 (0) 79.6%
Pupil-level (categorical) n/N (missing) Percentage n/N
(missing) Percentage
Eligible for FSM: Yes 882/3027 (0) 29% 973/3311 (0) 29%
Special Educational Needs: S, E or K
512/3027 (20) 17% 622/3311 (0) 19%
Gender: Male 1560/3027 (0)
52% 1700/3311
(0) 51%
Gender: Female 1467/3027 (0)
48% 1611/3311
(0) 49%
Attendance %
Pupil-level (continuous) n (missing) Mean (SD) n (missing) Mean (SD)
Effect Size
KS1 reading point score 2836 (191) 15.49 (3.60) 3062 (249) 15.68 (3.66)
-0.05
KS1 mathematics point score
2836 (191) 15.92 (3.46) 3062 (249) 16.16 (3.47)
-0.07
KS2 reading score
KS2 mathematics score
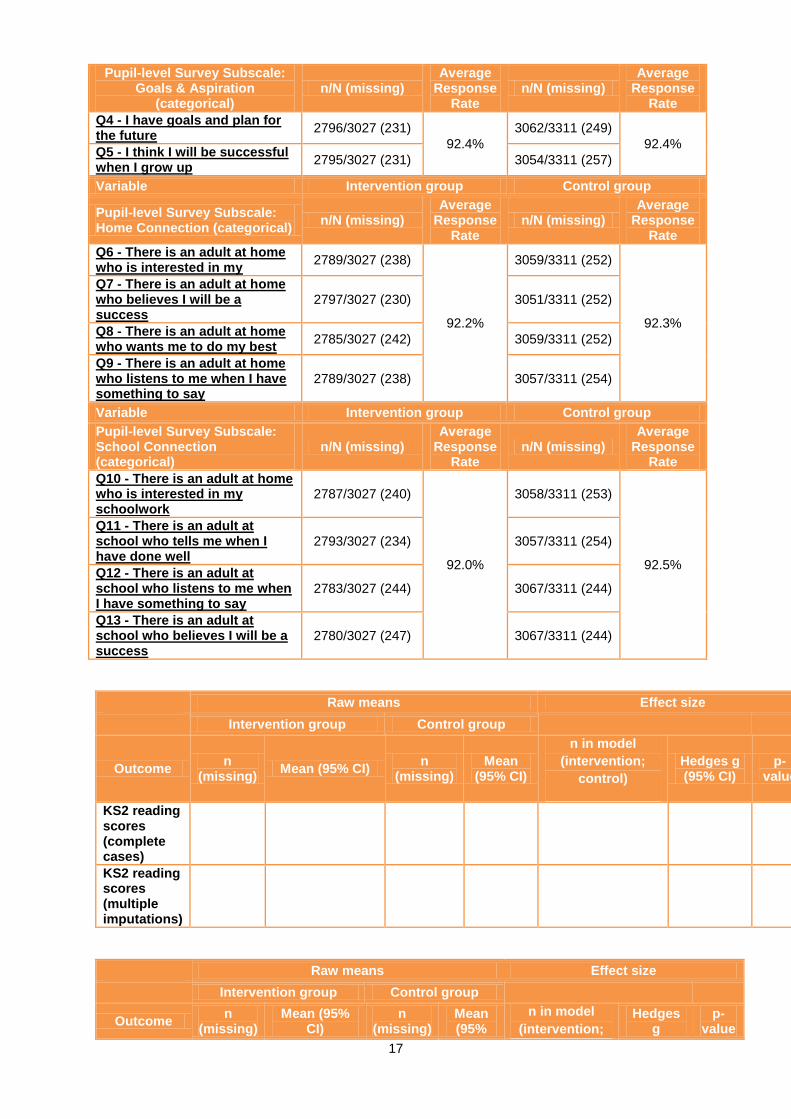
Balance at baseline – student resilience survey (secondary outcome) – Year 5
Variable Intervention group Control group
Pupil-level Survey Subscale: Self-Esteem (categorical)
n/N (missing) Average
Response Rate
n/N (missing) Average
Response Rate
Q1 - I can work out my problems
2813/3027 (214)
92.8%
3084/3311 (227)
92.9%
Q2 - I can do most things if I try
2802/3027 (225) 3073/3311 (238)
Q3 - There are many things that I do well
2810/3027 (217)
3075/3311 (236)
Variable Intervention group Control group
17
Pupil-level Survey Subscale: Goals & Aspiration
(categorical) n/N (missing)
Average Response
Rate n/N (missing)
Average Response
Rate
Q4 - I have goals and plan for the future
2796/3027 (231)
92.4%
3062/3311 (249)
92.4% Q5 - I think I will be successful when I grow up
2795/3027 (231) 3054/3311 (257)
Variable Intervention group Control group
Pupil-level Survey Subscale: Home Connection (categorical)
n/N (missing) Average
Response Rate
n/N (missing) Average
Response Rate
Q6 - There is an adult at home who is interested in my
2789/3027 (238)
92.2%
3059/3311 (252)
92.3%
Q7 - There is an adult at home who believes I will be a success
2797/3027 (230) 3051/3311 (252)
Q8 - There is an adult at home who wants me to do my best
2785/3027 (242) 3059/3311 (252)
Q9 - There is an adult at home who listens to me when I have something to say
2789/3027 (238) 3057/3311 (254)
Variable Intervention group Control group
Pupil-level Survey Subscale: School Connection (categorical)
n/N (missing) Average
Response Rate
n/N (missing) Average
Response Rate
Q10 - There is an adult at home who is interested in my schoolwork
2787/3027 (240)
92.0%
3058/3311 (253)
92.5%
Q11 - There is an adult at school who tells me when I have done well
2793/3027 (234) 3057/3311 (254)
Q12 - There is an adult at school who listens to me when I have something to say
2783/3027 (244) 3067/3311 (244)
Q13 - There is an adult at school who believes I will be a success
2780/3027 (247) 3067/3311 (244)
Raw means Effect size
Intervention group Control group
Outcome n
(missing) Mean (95% CI)
n (missing)
Mean (95% CI)
n in model
(intervention;
control)
Hedges g (95% CI)
p-value
KS2 reading scores (complete cases)
KS2 reading scores (multiple imputations)
Raw means Effect size
Intervention group Control group
Outcome n
(missing) Mean (95%
CI) n
(missing) Mean (95%
n in model
(intervention; Hedges
g p-
value
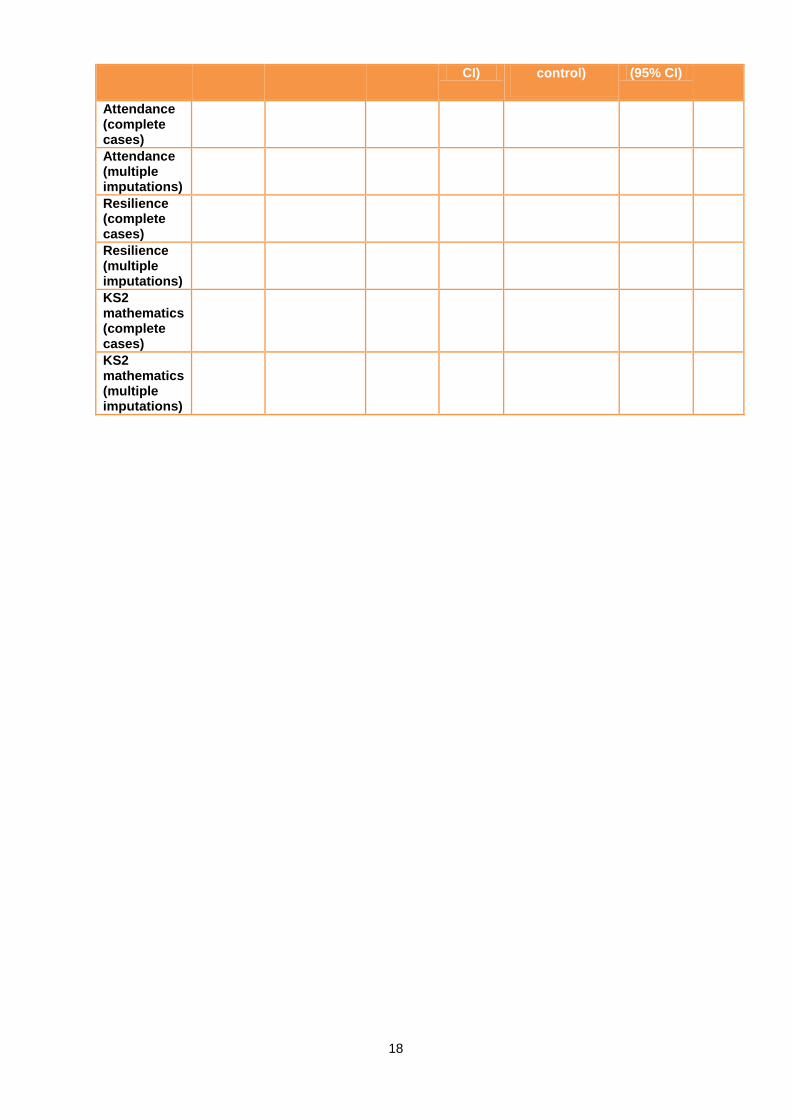
18
CI) control) (95% CI)
Attendance (complete cases)
Attendance (multiple imputations)
Resilience (complete cases)
Resilience (multiple imputations)
KS2 mathematics (complete cases)
KS2 mathematics (multiple imputations)

19
Appendix – Year 4 Data
Participant flow diagram for Year 4
Re
cru
itm
en
t A
na
lysis
F
ollo
w-u
p
Allo
ca
tion
Assessed for eligibility
(school n = 141)
Randomised (school n = 134; pupil n = 6586
(Year 4)
Excluded (school n = 7)
- Not meeting inclusion
criteria (school n = 7)
Allocated to intervention (school
n = 66; pupil n = 3133)
Did not receive allocated
intervention (school n = 3; pupil n
= 71)
Allocated to control (school n =
68; pupil n = 3453)
Post-test data
collected
Post-test data
collected
Analysed
Approached (school n = 145 tbc)
Declined to participate
(school n = 4 tbc)
Lost to follow-
up
Lost to follow-up
Not
analysed
Analysed Not
analysed
20
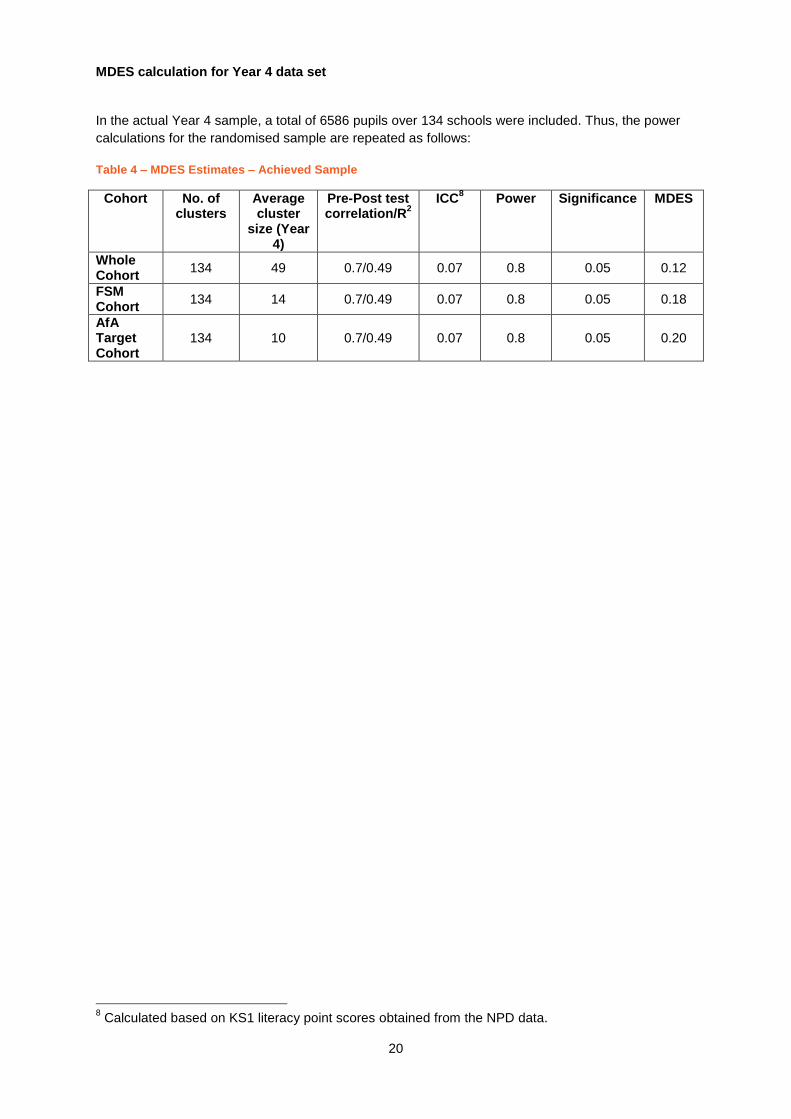
MDES calculation for Year 4 data set
In the actual Year 4 sample, a total of 6586 pupils over 134 schools were included. Thus, the power
calculations for the randomised sample are repeated as follows:
Table 4 – MDES Estimates – Achieved Sample
Cohort No. of clusters
Average cluster
size (Year 4)
Pre-Post test correlation/R
2 ICC
8 Power Significance MDES
Whole Cohort
134 49 0.7/0.49 0.07 0.8 0.05 0.12
FSM Cohort
134 14 0.7/0.49 0.07 0.8 0.05 0.18
AfA Target Cohort
134 10 0.7/0.49 0.07 0.8 0.05 0.20
8 Calculated based on KS1 literacy point scores obtained from the NPD data.
Related Documents