Statistical Analysis of Nuel Tournaments Department of Statistics University of California, Berkeley MoonSoo Choi Department of Industrial Engineering & Operations Research Under Guidance of Professor. David Aldous Department of Statistics First Draft Written on: 5/18/2013 This paper explores and presents visual analysis of N-uel tournaments and cognition/perception analysis of N-uel game players decision-making process under various visual representations.

Welcome message from author
This document is posted to help you gain knowledge. Please leave a comment to let me know what you think about it! Share it to your friends and learn new things together.
Transcript
Statistical Analysis of Nuel Tournaments Department of Statistics
University of California, Berkeley
MoonSoo Choi Department of Industrial Engineering & Operations Research
Under Guidance of
Professor. David Aldous Department of Statistics
First Draft Written on:
5/18/2013
This paper explores and presents visual analysis of N-uel tournaments and cognition/perception analysis of N-uel game players decision-making process under various visual representations.
1
Table of Contents
I. Abstract 2
II. Introduction 3
III. Probabilistic Model Design 4
IV. Experimental Model Design 9
V. Conclusion 11
VI. References 12

2
I. Abstract
Among numerous classical statistics paradoxes, N-uel (for N ℕ \ {1}, because N-uel where
N = 1 is clearly not that interesting!) problem shows that the fittest of all competitors does not
necessarily win this competition. Truel, Quadruel, and Nuel is simply an extension of a duel
tournament, which involves more than two people (Pirates of Caribbean three-way sword fight serves
as an appropriate visual representation). In addition, each N-uel player actually may possess different
winning maximization strategy, since the Nuel tournament is known to illustrate that a fitter/better
competitor in a multi-entry survival type competition does not necessarily possess significantly
higher chance of survival than others. It is my desire to see this process: I want to visualize the N-
uel process as a third-person observer, and if a person was playing this as a video game (which I plan
on developing via Java Programming), I also want to visualize the winning strategies each video
game participant follows.
3
II. Introduction
A Nuel tournament may involve wide spectrum of variables that leads to diverse game
design, such as number of players, shooting sequence, varying marksmanship, randomness in
shooting. In this project, I was particularly interested in observing non-simultaneous, sequential
Nuel tournaments.
Objectives of this project are to:
Gain a general mathematical understanding of Nuel tournaments, by constructing Markov
Chains and running simulations. Then, the simulation results will be compared to long-term
transition probabilities presented in Markov Chains.
Gain a behavioral understanding through programming and conducting experiments to
other people. The purpose of conducting experiments is to recognize any interesting
patterns among game participants’ responses, and to compare such responses against
theoretical probabilities computed by Markov Chain.
Perform theoretical analysis in order to interpret various Nuel tournaments. This objective
may involve both mathematical analysis of Markov Chains and a sensitivity analysis involving
varying levels of each players’ marksmanship.
Simulation and experiment is coded in Java programming, Markov Chains are generated from
MATLAB, and experiment results are presented in R.

4
III. Probabilistic Model Design
i. Variables, Parameters, and Assumptions
As the objective of this research is to merely examine the general scope of the Nuel Tournament, I decided to observe Nuel Tournaments with few variables in interest, which includes the following:
a) Number of Players (i.e. 3, 4, and 5)
Integer Variable
b) Sequence of shooting orders
Boolean Variable i. 1 if the strongest shoots first, then the shooting progresses in order of
decreasing marksmanship ii. 0 if the weakest shoots first, then the shooting progresses in order of
increasing marksmanship
c) Presence of a perfect player (i.e. the marksmanship of the player is 100%)
Boolean Variable i. 1 if a perfect-shot player present in the tournament ii. 0 otherwise
d) Player’s marksmanship (i.e. accuracy level – note that this does not imply survivability
level!)
Real Variable
Each of the variable above will be denoted respectively with the following notations throughout this paper: n, sn, Χ, and pi. Now I will discuss the parameters and the game design for the Nuel Tournament.
Parameter I) Each player with marksmanship level of pi is assumed to be i.i.d Parameter II) Each player with marksmanship level of pi is assumed to be uniformly distributed. Parameter III) Every tournament will be a “hunger-game” survival-style – that is, players in each
tournament will continue to play the rounds until there is only one survivor.
Parameter IV) 1 round will consist of each shooter attempting to shoot the shooter next to him (that is, shooting the shooter that possesses the next highest/lowest marksmanship within the tournament)
IV – i) The last person will attempt to shoot the first shooter of the tournament, and such
attempt will mark the end of the round (i.e. player n in a n IV – ii) As noted in parameter III, the rounds will continue until there is only survivor left in
the game
5
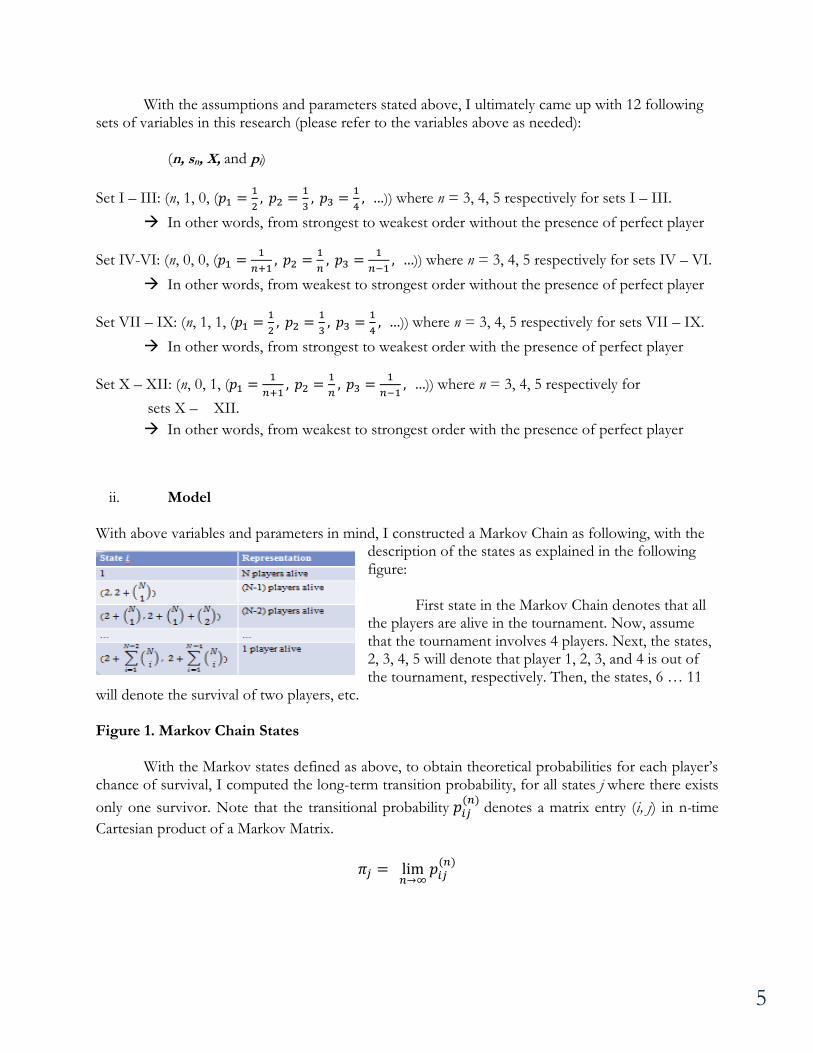
With the assumptions and parameters stated above, I ultimately came up with 12 following sets of variables in this research (please refer to the variables above as needed): (n, sn, Χ, and pi)
Set I – III: (n, 1, 0, (
)) where n = 3, 4, 5 respectively for sets I – III.
In other words, from strongest to weakest order without the presence of perfect player
Set IV-VI: (n, 0, 0, (
)) where n = 3, 4, 5 respectively for sets IV – VI.
In other words, from weakest to strongest order without the presence of perfect player
Set VII – IX: (n, 1, 1, (
)) where n = 3, 4, 5 respectively for sets VII – IX.
In other words, from strongest to weakest order with the presence of perfect player
Set X – XII: (n, 0, 1, (
)) where n = 3, 4, 5 respectively for
sets X – XII.
In other words, from weakest to strongest order with the presence of perfect player
ii. Model With above variables and parameters in mind, I constructed a Markov Chain as following, with the
description of the states as explained in the following figure:
First state in the Markov Chain denotes that all
the players are alive in the tournament. Now, assume that the tournament involves 4 players. Next, the states, 2, 3, 4, 5 will denote that player 1, 2, 3, and 4 is out of the tournament, respectively. Then, the states, 6 … 11
will denote the survival of two players, etc. Figure 1. Markov Chain States
With the Markov states defined as above, to obtain theoretical probabilities for each player’s chance of survival, I computed the long-term transition probability, for all states j where there exists
only one survivor. Note that the transitional probability
denotes a matrix entry (i, j) in n-time
Cartesian product of a Markov Matrix.
6
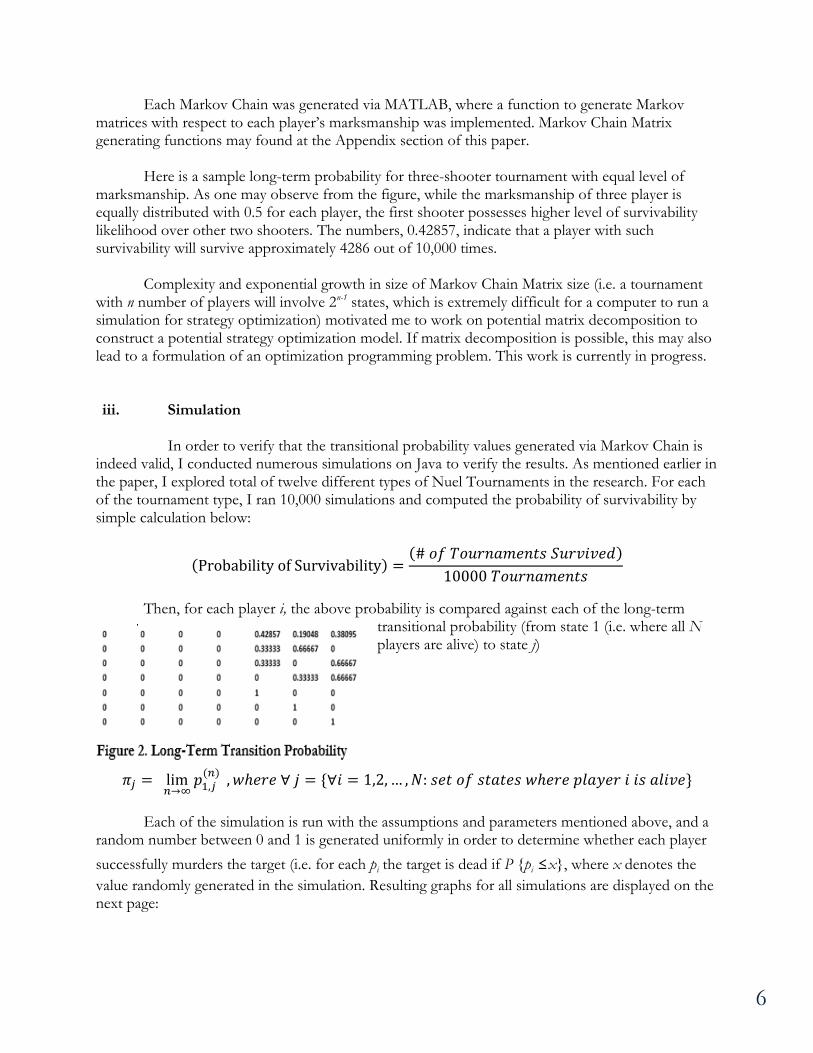
Each Markov Chain was generated via MATLAB, where a function to generate Markov matrices with respect to each player’s marksmanship was implemented. Markov Chain Matrix generating functions may found at the Appendix section of this paper.
Here is a sample long-term probability for three-shooter tournament with equal level of marksmanship. As one may observe from the figure, while the marksmanship of three player is equally distributed with 0.5 for each player, the first shooter possesses higher level of survivability likelihood over other two shooters. The numbers, 0.42857, indicate that a player with such survivability will survive approximately 4286 out of 10,000 times.
Complexity and exponential growth in size of Markov Chain Matrix size (i.e. a tournament with n number of players will involve 2n-1 states, which is extremely difficult for a computer to run a simulation for strategy optimization) motivated me to work on potential matrix decomposition to construct a potential strategy optimization model. If matrix decomposition is possible, this may also lead to a formulation of an optimization programming problem. This work is currently in progress. iii. Simulation
In order to verify that the transitional probability values generated via Markov Chain is
indeed valid, I conducted numerous simulations on Java to verify the results. As mentioned earlier in the paper, I explored total of twelve different types of Nuel Tournaments in the research. For each of the tournament type, I ran 10,000 simulations and computed the probability of survivability by simple calculation below:
Then, for each player i, the above probability is compared against each of the long-term
transitional probability (from state 1 (i.e. where all N players are alive) to state j)
Each of the simulation is run with the assumptions and parameters mentioned above, and a
random number between 0 and 1 is generated uniformly in order to determine whether each player
successfully murders the target (i.e. for each pi the target is dead if P {pi ≤x}, where x denotes the
value randomly generated in the simulation. Resulting graphs for all simulations are displayed on the next page:
7
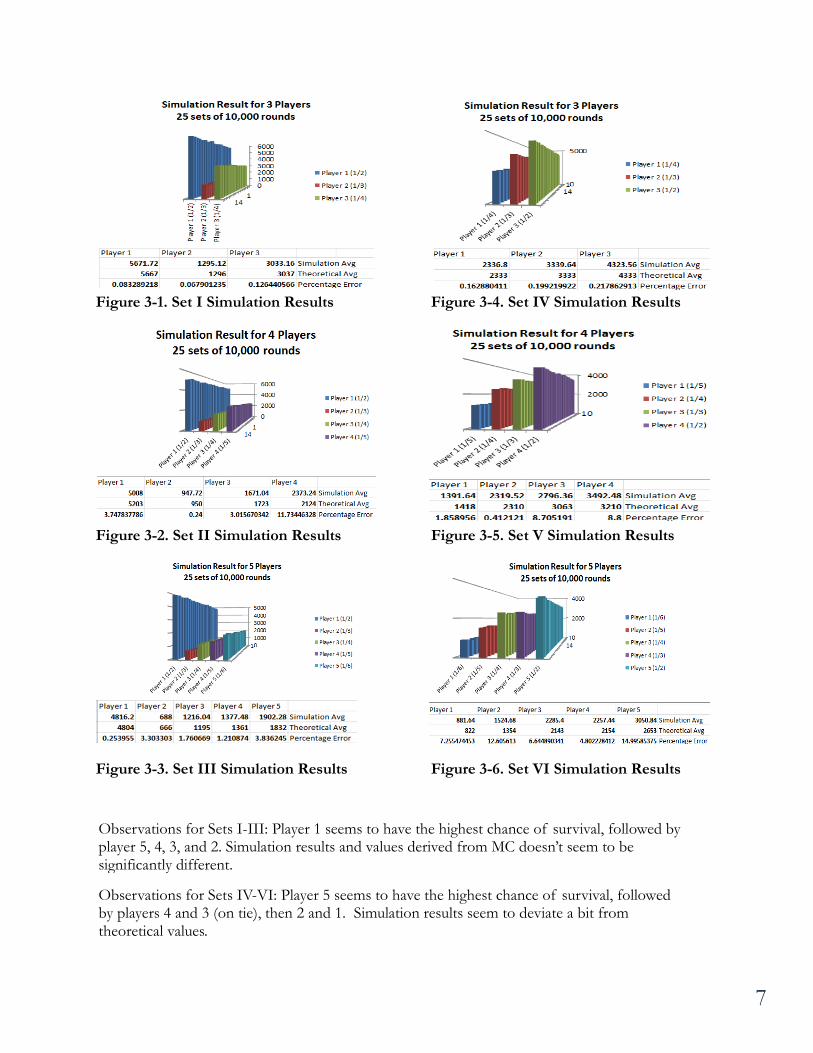
Figure 3-1. Set I Simulation Results Figure 3-4. Set IV Simulation Results Figure 3-2. Set II Simulation Results Figure 3-5. Set V Simulation Results Figure 3-3. Set III Simulation Results Figure 3-6. Set VI Simulation Results
Observations for Sets I-III: Player 1 seems to have the highest chance of survival, followed by player 5, 4, 3, and 2. Simulation results and values derived from MC doesn’t seem to be significantly different.
Observations for Sets IV-VI: Player 5 seems to have the highest chance of survival, followed by players 4 and 3 (on tie), then 2 and 1. Simulation results seem to deviate a bit from theoretical values.
8
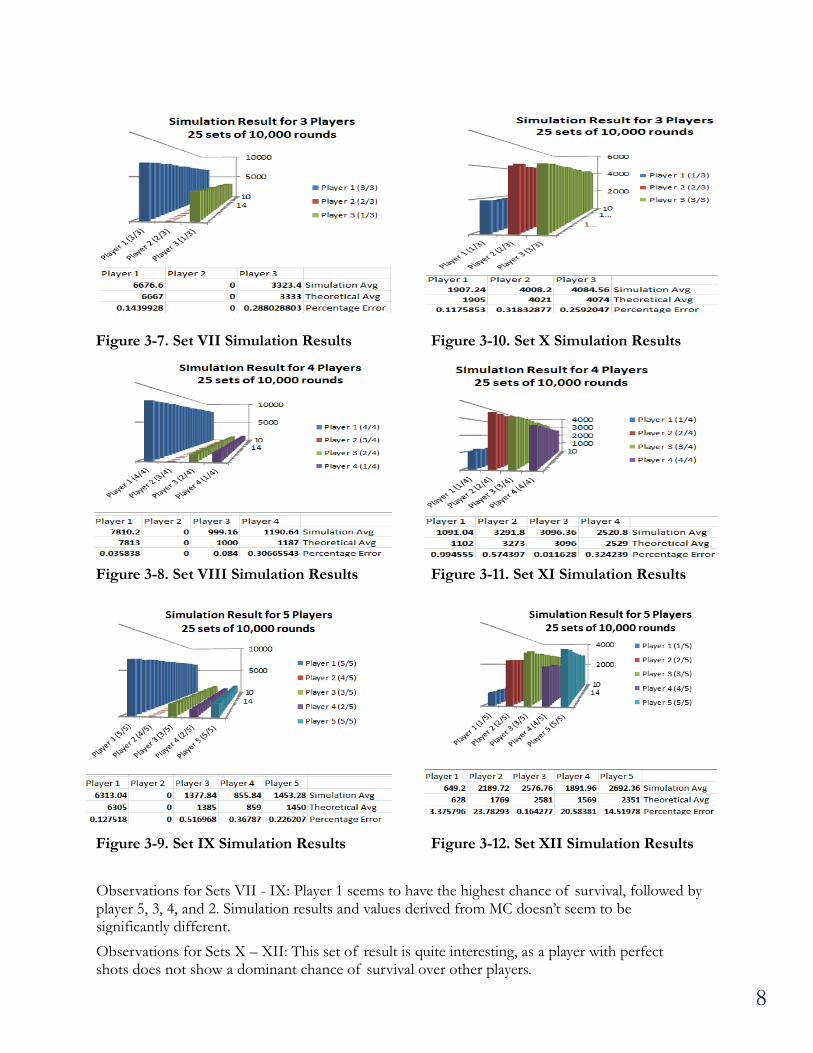
Figure 3-7. Set VII Simulation Results Figure 3-10. Set X Simulation Results Figure 3-8. Set VIII Simulation Results Figure 3-11. Set XI Simulation Results Figure 3-9. Set IX Simulation Results Figure 3-12. Set XII Simulation Results
Observations for Sets VII - IX: Player 1 seems to have the highest chance of survival, followed by player 5, 3, 4, and 2. Simulation results and values derived from MC doesn’t seem to be significantly different.
Observations for Sets X – XII: This set of result is quite interesting, as a player with perfect shots does not show a dominant chance of survival over other players.

9
IV. Experimental Method Design
As mentioned earlier in the introduction section, another objective of the research is to
compare people’s game optimization strategies against the results obtained from Markov Chain
long-term transitional probabilities and simulation results. In the experimental method design
section, I will discuss the experiment methods and the results.
i. Method
In each experimental session, participants were asked to play four different types of Nuel
games. Total of 27 college students at UC Berkeley (a cookie was provided for each participant for
incentive) were asked to participate in the experiment. For each game type, each participant was
asked to choose the player that each participant believed to have the highest chance of survival, with
the following rules:
1) Each participant plays 12 sets of the game as illustrated above.
2) Each participant plays each set until there is only one survivor.
3) For every round (i.e. where all players have a chance to shoot exactly once), the
participant may change his/her choice of winning player – that is, if the participant
believes that a certain group of alive players at given point of time may grant the
participant the benefit of changing his/her winning choice, then the participant is
welcome to do so.
4) Once a player that the participant chooses is dead, then the participant may not continue
to play that set and needs to move onto the next set.
The experiment is coded and run on Java
platform, as seen on Figure 4. Each circle
represents a player, and the level of
marksmanship of each player is coded
with different colors. Ones with higher
level of marksmanship is associated with
darker colors, and lower level of
marksmanship is associated with brighter
colors. Next page illustrates the results
from the experiment.
Figure 4. Demonstration of a Nuel
experiment program designed on Java
Eclipse platform.
10
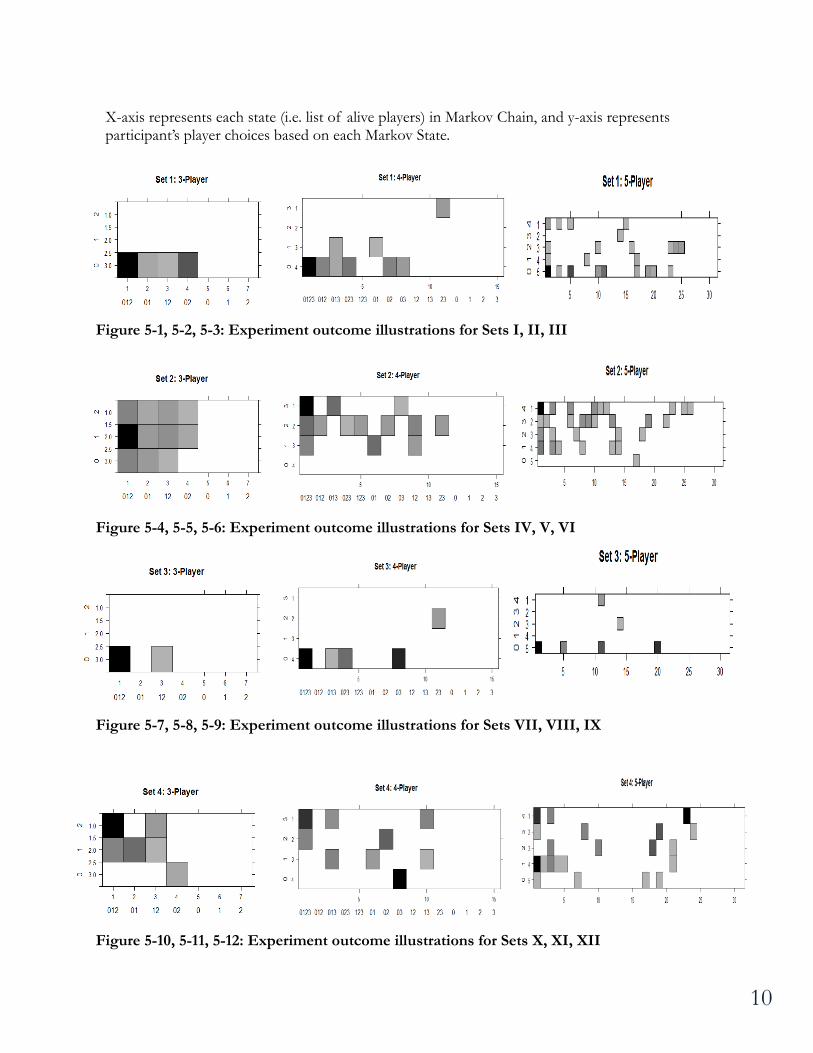
Figure 5-1, 5-2, 5-3: Experiment outcome illustrations for Sets I, II, III Figure 5-4, 5-5, 5-6: Experiment outcome illustrations for Sets IV, V, VI Figure 5-7, 5-8, 5-9: Experiment outcome illustrations for Sets VII, VIII, IX Figure 5-10, 5-11, 5-12: Experiment outcome illustrations for Sets X, XI, XII
X-axis represents each state (i.e. list of alive players) in Markov Chain, and y-axis represents participant’s player choices based on each Markov State.

11
V. Conclusion
Theoretical:
As the level of variance of simulation results from theoretical results was shown to be small,
turns out that the simulation results match quite closely with the results derived from MC long-
transition probabilities. One might be interested in running simulations under different
distributions of marksmanship probabilities, such as normal or gamma dist. A further sensitivity
analysis is required for further analysis.
Experimental:
I was able to observe variability patterns. Three significant factors that cause variability in
participants’ choices are: 1) number of players, 2) Presence of a player with perfect shot, 3)
Sequence (i.e. choices tend to vary more when weaker players shoot first). While there was no
time constraint, I also observed the approximate amount of time each experiment participate
spends on making decisions on which player is most likely to win. Experiment results revealed
that, the lesser the number of players are out there, the lesser the amount of time the experiment
participants are willing to spend, whether or not their choices are optimal strategies. Overall, a
significant conclusion is that participants do tend to choose players primarily based on accuracy
level and not the chance of survival. A further correlation analysis is required to recognize any
correlation patterns.
Future Work:
I am currently working on performing sensitivity analysis involving various ranges of player’s
marksmanship level and number of players involved in the tournament. Matrix decomposition
and formulation of linear/non-linear programming is also in progress, if possible. An interesting
result may be yielded if one performs extended research on Nuel tournaments involving
different situations involving coalitions, which may be a significant contribution to examination
of monopolization in business.
12
VI. References
[1] P. Amengual and R. Toral, “Truels, or Survival of the Weakest,” IEEE Transactions Computing in
Science & Engineering, September/October 2006, pp.88-89.
Programming Codes Available Upon Request on Github.
Acknowledgement:
I would like to thank Professor Aldous for providing this opportunity to me to freely expand my
ideas in this independent project, and always providing encouraging guidance.
Related Documents