DOI : https://dx.doi.org/10.26808/rs.st.i8v1.09 International Journal of Advanced Scientific and Technical Research Issue8 volume 1 January-February 2018 Available online on http://www.rspublication.com/ijst/index.html ISSN 2249-9954 ©2017 RS Publication, [email protected] Page 71 Statistical Analysis of Natural Radioactivity Measurements for the Soil of Marsa Alam-Shalateen Red-Sea Coast Area, Egypt Ghada I. El-shanshoury and A. A. Arafat Radiation Safety Department, Nuclear and Radiological Regulatory Authority (NRRA) ABSTRACT This study aims to analyze the data of soil samples from Marsa Alam-Shalateen area. The result of the study is helpful in radiological mapping of the area that has high concentrations as well as to be a baseline data for future studies. Statistical analysis is applied on thirty-three samples for measuring gamma emitting radionuclides (Th-232, Ra-226, and K-40) and calculating radiation hazard indices. This analysis is also helpful to identify the existing relationships between the radiological hazard parameters and radionuclides, and consequently assessing the health exposure implication of the public to the studied soil. In this work conventional statistical analysis (Basic statistics and Frequency histogram), and multivariate statistical analysis (Persons correlation coefficient analysis, Factor analysis and Cluster analysis) are employed. The results show that there is no potential radiological health hazard associated with the soil samples of the study area according to the world acceptable value. In addition, the radioactive elements demonstrate the complexity of minerals in soil samples. In factor analysis, the results show that the first rotated factor accounts for 57.3% of the total variance and is mainly characterized by high positive loading of concentrations of Th-232 and Ra-226. The second rotated factor accounts for 41.4% of the total variance and is mainly corresponds to high positive loading of K-40. Cluster Average linkage method indicated that the concentrations of Th-232 are more related to all radiological parameters levels than Ra-226 and K-40 concentrations. Moreover, Ra-226 concentrations follow Th-232 concentrations in terms of their correlation with the levels of the radiological parameters. While cluster Ward’s linkage method analysis reveals that the concentrations of Ra-226 and Th-232 are more linked to all radiological parameters data than K-40 concentrations. Cluster analysis showed that Marsa Alam-Shelateen Road km 33 is classified as the most location that has the highest value of radiation level when compared with other studied locations. Key Words: Radionuclides, Radiological hazard parameters, conventional statistical analysis and Multivariate statistical analysis. INTRODUCTION The Red Sea region is sparsely populated and not more than 5 million people are estimated to live along the coast. Jeddah, in Saudi Arabia, supports the largest population with over 2 million people (1). The adjacent land areas of the Red Sea are mostly arid, having deserted or semi-deserted regions with no major river inflow. Further, inland, the desert regions bordered by extensive mountain ranges (2). Egypt has about 700 km of coastline along the Red Sea proper, which is of great environmental, economical and recreational value. Commercial and subsistence fisheries provide a living for a large sector of the coastal population in Egypt (3). The Red Sea is considered one of the most important navigation paths in the world. Its importance was increased throughout the last three decades of the twentieth century after Suez Canal opening for navigation especially for oil tankers between the Middle East and Europe. A considerable amount of international trade is transported in Egypt through the Suez Canal including radioactive materials (4).

Welcome message from author
This document is posted to help you gain knowledge. Please leave a comment to let me know what you think about it! Share it to your friends and learn new things together.
Transcript
DOI : https://dx.doi.org/10.26808/rs.st.i8v1.09
International Journal of Advanced Scientific and Technical Research Issue8 volume 1 January-February 2018
Available online on http://www.rspublication.com/ijst/index.html ISSN 2249-9954
©2017 RS Publication, [email protected] Page 71
Statistical Analysis of Natural Radioactivity Measurements for the Soil
of Marsa Alam-Shalateen Red-Sea Coast Area, Egypt
Ghada I. El-shanshoury and A. A. Arafat
Radiation Safety Department, Nuclear and Radiological Regulatory Authority (NRRA)
ABSTRACT
This study aims to analyze the data of soil samples from Marsa Alam-Shalateen area. The result of the study
is helpful in radiological mapping of the area that has high concentrations as well as to be a baseline data for
future studies. Statistical analysis is applied on thirty-three samples for measuring gamma emitting radionuclides
(Th-232, Ra-226, and K-40) and calculating radiation hazard indices. This analysis is also helpful to identify the
existing relationships between the radiological hazard parameters and radionuclides, and consequently assessing
the health exposure implication of the public to the studied soil. In this work conventional statistical analysis
(Basic statistics and Frequency histogram), and multivariate statistical analysis (Persons correlation coefficient
analysis, Factor analysis and Cluster analysis) are employed. The results show that there is no potential
radiological health hazard associated with the soil samples of the study area according to the world acceptable
value. In addition, the radioactive elements demonstrate the complexity of minerals in soil samples. In factor
analysis, the results show that the first rotated factor accounts for 57.3% of the total variance and is mainly
characterized by high positive loading of concentrations of Th-232 and Ra-226. The second rotated factor
accounts for 41.4% of the total variance and is mainly corresponds to high positive loading of K-40. Cluster
Average linkage method indicated that the concentrations of Th-232 are more related to all radiological
parameters levels than Ra-226 and K-40 concentrations. Moreover, Ra-226 concentrations follow Th-232
concentrations in terms of their correlation with the levels of the radiological parameters. While cluster Ward’s
linkage method analysis reveals that the concentrations of Ra-226 and Th-232 are more linked to all radiological
parameters data than K-40 concentrations. Cluster analysis showed that Marsa Alam-Shelateen Road km 33 is
classified as the most location that has the highest value of radiation level when compared with other studied
locations.
Key Words: Radionuclides, Radiological hazard parameters, conventional statistical analysis and Multivariate
statistical analysis.
INTRODUCTION
The Red Sea region is sparsely populated and not more than 5 million people are estimated to live along the
coast. Jeddah, in Saudi Arabia, supports the largest population with over 2 million people (1). The adjacent land
areas of the Red Sea are mostly arid, having deserted or semi-deserted regions with no major river inflow.
Further, inland, the desert regions bordered by extensive mountain ranges (2). Egypt has about 700 km of
coastline along the Red Sea proper, which is of great environmental, economical and recreational value.
Commercial and subsistence fisheries provide a living for a large sector of the coastal population in Egypt (3).
The Red Sea is considered one of the most important navigation paths in the world. Its importance was
increased throughout the last three decades of the twentieth century after Suez Canal opening for navigation
especially for oil tankers between the Middle East and Europe. A considerable amount of international trade is
transported in Egypt through the Suez Canal including radioactive materials (4).
DOI : https://dx.doi.org/10.26808/rs.st.i8v1.09
International Journal of Advanced Scientific and Technical Research Issue8 volume 1 January-February 2018
Available online on http://www.rspublication.com/ijst/index.html ISSN 2249-9954
©2017 RS Publication, [email protected] Page 72
The major industries in the Red Sea region are oil exploration, oil production, oil processing, manufacturing
industries (fertilizers, chemicals, cement), tourism, fisheries and oil related maritime transport (5). Because of the
rich marine life and favorable climate, tourism has become important for many Red Sea countries, with over 1
million tourists per year expected in the future. An extensive area of the coastline was developed to accommodate
the increasing flux of tourists, especially in various areas along the Egyptian coastline (2). Also in 2017 Saudi
Arabia plans a huge Red Sea beach tourism project. The project will cover 50 islands and 34,000 square
kilometers between the cities of Umluj and Al Wajh to attract “luxury travelers from around the globe,” (6).
Fisheries in the Red Sea are of considerable socio-economic importance to the Red Sea countries in terms of
national food security and income generation for rural communities (2).
On the Red Sea coast, there are two main centers for phosphate ore mining: Safaga and Quseir and three
shipping harbors. Phosphate ore dust spilled over into the Sea during shipping is considered as a continuous
source for contaminating the Red Sea coastal environment (3) in addition to;
1- In the Gulf of Suez, the northern part of the red sea, there are about 90% of the Egyptian oil exploration
and production activities, which could be a significant source of environmental contamination with
technological enhanced naturally occurring radioactive materials (NORM) (3).
2- With highly intensive ship traffic, some of these ships are running by nuclear power or carrying
radioactive materials, which is a source of possible accidental contamination (7).
3- Also, the study on the concentrations of heavy metal pollution in the Egyptian Red Sea, over 50 years
period (1934–1984), has shown that the concentrations of most of the heavy metals has increased, due to
natural pollution from hot brine pools or due to man-made pollution from oil, heavy metal mining,
discharge of domestic industrial wastes and phosphate mining and transportation along the Red Sea
coastal areas (8).
So, the knowledge of the concentrations and distributions of radionuclides is of interest since it provides
useful information in the monitoring of environmental contamination by natural and manmade radioactivity. This
information is essential to create a scientific database of the radiological base-line levels and to identify the
radiological impacts of non-nuclear industries (e.g. phosphate mining, phosphate shipping and oil production
activities) or any accidental contamination on the coastal region of the Red Sea.
The Egyptian government gives an attention to develop Marsa-Alam Shalatin area because it is a tourist
area as well as it contains some mineral resources such as gold extracts from Sokary mine. The natural radiation
level of the soil is of great importance because of the harm it causes to public as a result of the use of soil in the
construction materials industry or exposure to soil during daily activities.
The coastal region of the Red Sea attracted the attention of several workers. Ahmed et al., 2006 (9) measured
the activity concentrations in different basement rocks in Wadi El Gemal area. Harb et al., 2008 (10), investigated
the radioactivity levels in granitic rocks along Idfu - Marsa Alam road. Yousef and Saleh, 2013 (11), found that
the activity concentrations of Th-232 and Ra-226 and K-40 in cataclastic rock samples taken from Abu Rusheid
area (45 km southwest of Marsa Alam). In addition, the natural background radioactivity was determined for
some unconsolidated shore sediment, soil, sea water and plant samples by some researchers (3,12-15). It is
obvious from the studies that an attention was given to determine the natural radioactivity of the rocks, shore
sediments, sea water and plant, while a little one was paid to the soil cover. Only one paper discussed the activity
concentrations and distributions of gamma ray emitter radionuclides, Ra-226 (U-238 series), Th-232 series and,
K-40 in soil and assessed their possible associated hazards (16).
The objective of this work is to establish baseline statistical information of background levels of naturally
occurring radionuclides due to 238U, 232Th series and 40K present in the soil samples, collected from Marsa
Alam-Shalateen area that previously published (16), and their relationship to radiological hazard parameters.
DOI : https://dx.doi.org/10.26808/rs.st.i8v1.09
International Journal of Advanced Scientific and Technical Research Issue8 volume 1 January-February 2018
Available online on http://www.rspublication.com/ijst/index.html ISSN 2249-9954
©2017 RS Publication, [email protected] Page 73
Various statistical analysis have been carried out for the radionuclides data obtained from soil sample and for
the calculated radiological hazard parameters. Conventional and multivariate statistical analysis for data treatment
is performed. the analysis is established in basic statistics that based on the descriptive statistics, frequency
histograms of the recorded radionuclides, Pearson's correlation coefficient for all radionuclides and radiological
hazard parameters, principal component analysis and cluster analysis is carried out through two axes; the first is to
identify similar characteristics between natural radioisotopes and radiological hazard parameters in the soil using
cluster variables. The other axis is to identify similar characteristics between radiological hazard parameters in the
soil using cluster observations.
MATERIAL AND STATISTICAL METHODS
1. Study Area
Marsa Alam-Shalateen area lies along the southern Red Sea coast, Egypt, 700 km from the capital Cairo.
It is situated between latitude 23О 07′ N in the south, latitude 25
О 47′ N in the north, the Red sea in the east, and
the Red Sea Hills in the west. The area is rich in its natural resources, cultural heritage and archaeological sites.
Wadi El Gemal, Qulan, and Abraq are important sites in the area because of their unique flora and fauna, and
therefore, they have been declared as natural protectorates (17). The area runs parallel to the coast for about 370
km. Access to the area is through a number of paved roads, such as Cairo-Halayeb international coastal road and,
Idfu- Marsa Alam road. Several thousands of people live in the coastal urban regions (Marsa Alam and Shalateen
cities) and as inland-Bedouin communities. The main economic activities of inhabitants are tourism, herding
(camel and sheep), fishing, mining works (such as gold, antimony and phosphate), goods trading and craft
productions (16). Thirty-three environmental samples from soil are collected in May 2015 from the study area for
radiological analysis, Ra-226, Th-232, K-40. The Global Positioning System device (GPS, eTrex, Personal
Navigator, Garmin Ltd) identifies the coordinates of all sampling points. These coordinates are converted into
distances so that the start location was from Shalateen coordinates. Table 1 shows the locations and their distances
(Km) under the study area beginning from Shalateen region.
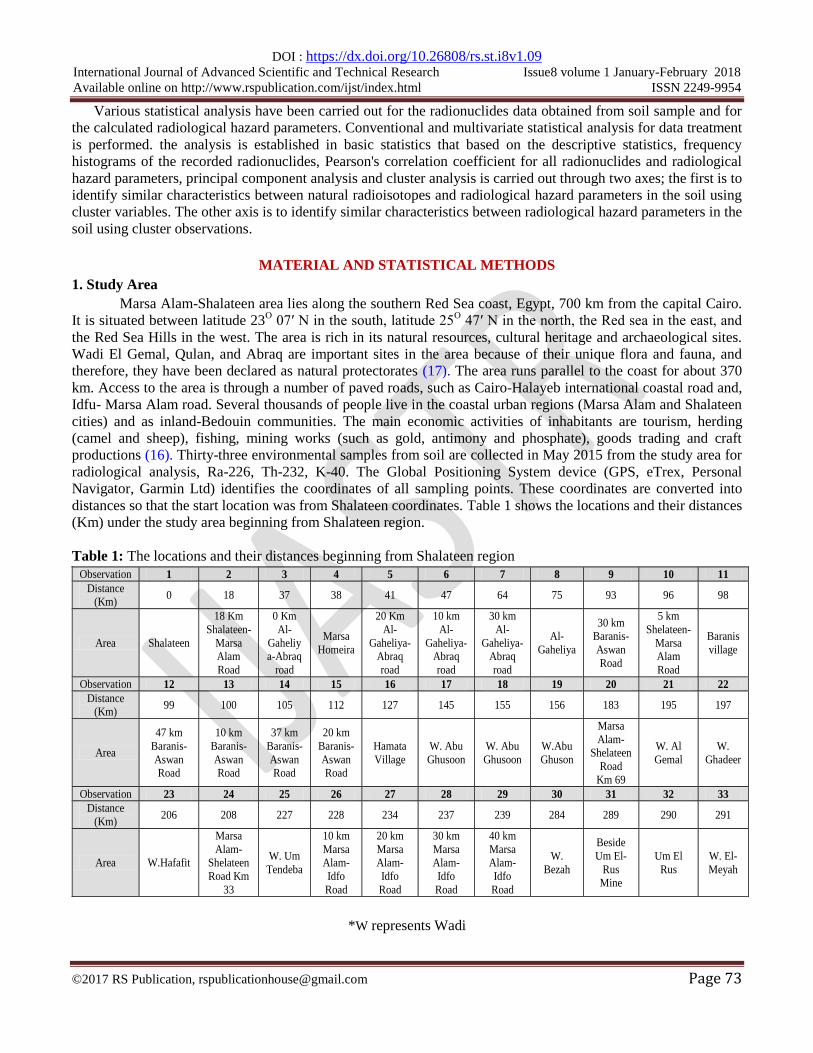
Table 1: The locations and their distances beginning from Shalateen region
Observation 1 2 3 4 5 6 7 8 9 10 11
Distance
(Km) 0 18 37 38 41 47 64 75 93 96 98
Area Shalateen
18 Km
Shalateen-
Marsa Alam
Road
0 Km
Al-
Gaheliya-Abraq
road
Marsa
Homeira
20 Km
Al-
Gaheliya-Abraq
road
10 km
Al-
Gaheliya-Abraq
road
30 km
Al-
Gaheliya-Abraq
road
Al-
Gaheliya
30 km Baranis-
Aswan
Road
5 km
Shelateen-
Marsa Alam
Road
Baranis
village
Observation 12 13 14 15 16 17 18 19 20 21 22
Distance (Km)
99 100 105 112 127 145 155 156 183 195 197
Area
47 km
Baranis-
Aswan Road
10 km
Baranis-
Aswan Road
37 km
Baranis-
Aswan Road
20 km
Baranis-
Aswan Road
Hamata
Village
W. Abu
Ghusoon
W. Abu
Ghusoon
W.Abu
Ghuson
Marsa
Alam-
Shelateen
Road
Km 69
W. Al
Gemal
W.
Ghadeer
Observation 23 24 25 26 27 28 29 30 31 32 33
Distance
(Km) 206 208 227 228 234 237 239 284 289 290 291
Area W.Hafafit
Marsa
Alam-Shelateen
Road Km
33
W. Um
Tendeba
10 km
Marsa Alam-
Idfo
Road
20 km
Marsa Alam-
Idfo
Road
30 km
Marsa Alam-
Idfo
Road
40 km
Marsa Alam-
Idfo
Road
W.
Bezah
Beside
Um El-
Rus Mine
Um El
Rus
W. El-
Meyah
*W represents Wadi
DOI : https://dx.doi.org/10.26808/rs.st.i8v1.09
International Journal of Advanced Scientific and Technical Research Issue8 volume 1 January-February 2018
Available online on http://www.rspublication.com/ijst/index.html ISSN 2249-9954
©2017 RS Publication, [email protected] Page 74
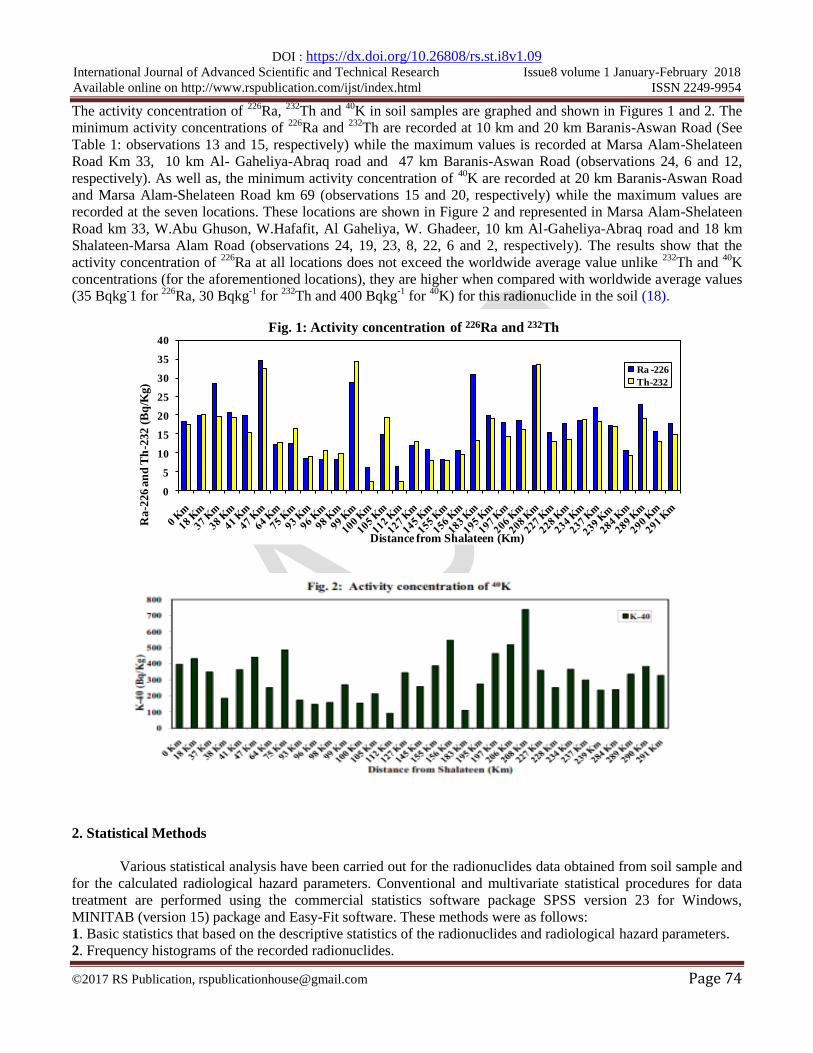
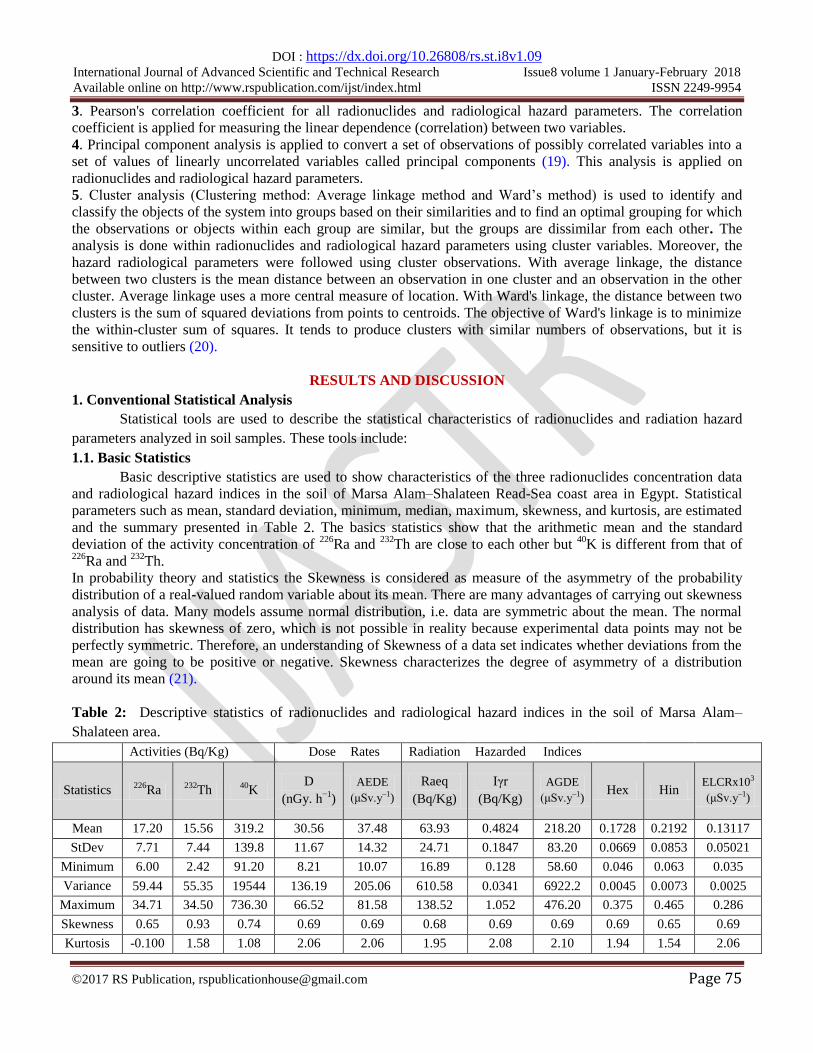
The activity concentration of 226
Ra, 232
Th and 40
K in soil samples are graphed and shown in Figures 1 and 2. The
minimum activity concentrations of 226
Ra and 232
Th are recorded at 10 km and 20 km Baranis-Aswan Road (See
Table 1: observations 13 and 15, respectively) while the maximum values is recorded at Marsa Alam-Shelateen
Road Km 33, 10 km Al- Gaheliya-Abraq road and 47 km Baranis-Aswan Road (observations 24, 6 and 12,
respectively). As well as, the minimum activity concentration of 40
K are recorded at 20 km Baranis-Aswan Road
and Marsa Alam-Shelateen Road km 69 (observations 15 and 20, respectively) while the maximum values are
recorded at the seven locations. These locations are shown in Figure 2 and represented in Marsa Alam-Shelateen
Road km 33, W.Abu Ghuson, W.Hafafit, Al Gaheliya, W. Ghadeer, 10 km Al-Gaheliya-Abraq road and 18 km
Shalateen-Marsa Alam Road (observations 24, 19, 23, 8, 22, 6 and 2, respectively). The results show that the
activity concentration of 226
Ra at all locations does not exceed the worldwide average value unlike 232
Th and 40
K
concentrations (for the aforementioned locations), they are higher when compared with worldwide average values
(35 Bqkg-1 for
226Ra, 30 Bqkg
-1 for
232Th and 400 Bqkg
-1 for
40K) for this radionuclide in the soil (18).
0
5
10
15
20
25
30
35
40
Ra
-226
an
d T
h-2
32
(B
q/K
g)
Distance from Shalateen (Km)
Ra -226
Th-232
Fig. 1: Activity concentration of 226Ra and 232Th
2. Statistical Methods
Various statistical analysis have been carried out for the radionuclides data obtained from soil sample and
for the calculated radiological hazard parameters. Conventional and multivariate statistical procedures for data
treatment are performed using the commercial statistics software package SPSS version 23 for Windows,
MINITAB (version 15) package and Easy-Fit software. These methods were as follows:
1. Basic statistics that based on the descriptive statistics of the radionuclides and radiological hazard parameters.
2. Frequency histograms of the recorded radionuclides.
DOI : https://dx.doi.org/10.26808/rs.st.i8v1.09
International Journal of Advanced Scientific and Technical Research Issue8 volume 1 January-February 2018
Available online on http://www.rspublication.com/ijst/index.html ISSN 2249-9954
©2017 RS Publication, [email protected] Page 75
3. Pearson's correlation coefficient for all radionuclides and radiological hazard parameters. The correlation
coefficient is applied for measuring the linear dependence (correlation) between two variables.
4. Principal component analysis is applied to convert a set of observations of possibly correlated variables into a
set of values of linearly uncorrelated variables called principal components (19). This analysis is applied on
radionuclides and radiological hazard parameters.
5. Cluster analysis (Clustering method: Average linkage method and Ward’s method) is used to identify and
classify the objects of the system into groups based on their similarities and to find an optimal grouping for which
the observations or objects within each group are similar, but the groups are dissimilar from each other. The
analysis is done within radionuclides and radiological hazard parameters using cluster variables. Moreover, the
hazard radiological parameters were followed using cluster observations. With average linkage, the distance
between two clusters is the mean distance between an observation in one cluster and an observation in the other
cluster. Average linkage uses a more central measure of location. With Ward's linkage, the distance between two
clusters is the sum of squared deviations from points to centroids. The objective of Ward's linkage is to minimize
the within-cluster sum of squares. It tends to produce clusters with similar numbers of observations, but it is
sensitive to outliers (20).
RESULTS AND DISCUSSION
1. Conventional Statistical Analysis
Statistical tools are used to describe the statistical characteristics of radionuclides and radiation hazard
parameters analyzed in soil samples. These tools include:
1.1. Basic Statistics
Basic descriptive statistics are used to show characteristics of the three radionuclides concentration data
and radiological hazard indices in the soil of Marsa Alam–Shalateen Read-Sea coast area in Egypt. Statistical
parameters such as mean, standard deviation, minimum, median, maximum, skewness, and kurtosis, are estimated
and the summary presented in Table 2. The basics statistics show that the arithmetic mean and the standard
deviation of the activity concentration of 226
Ra and 232
Th are close to each other but 40
K is different from that of 226
Ra and 232
Th.
In probability theory and statistics the Skewness is considered as measure of the asymmetry of the probability
distribution of a real-valued random variable about its mean. There are many advantages of carrying out skewness
analysis of data. Many models assume normal distribution, i.e. data are symmetric about the mean. The normal
distribution has skewness of zero, which is not possible in reality because experimental data points may not be
perfectly symmetric. Therefore, an understanding of Skewness of a data set indicates whether deviations from the
mean are going to be positive or negative. Skewness characterizes the degree of asymmetry of a distribution
around its mean (21).
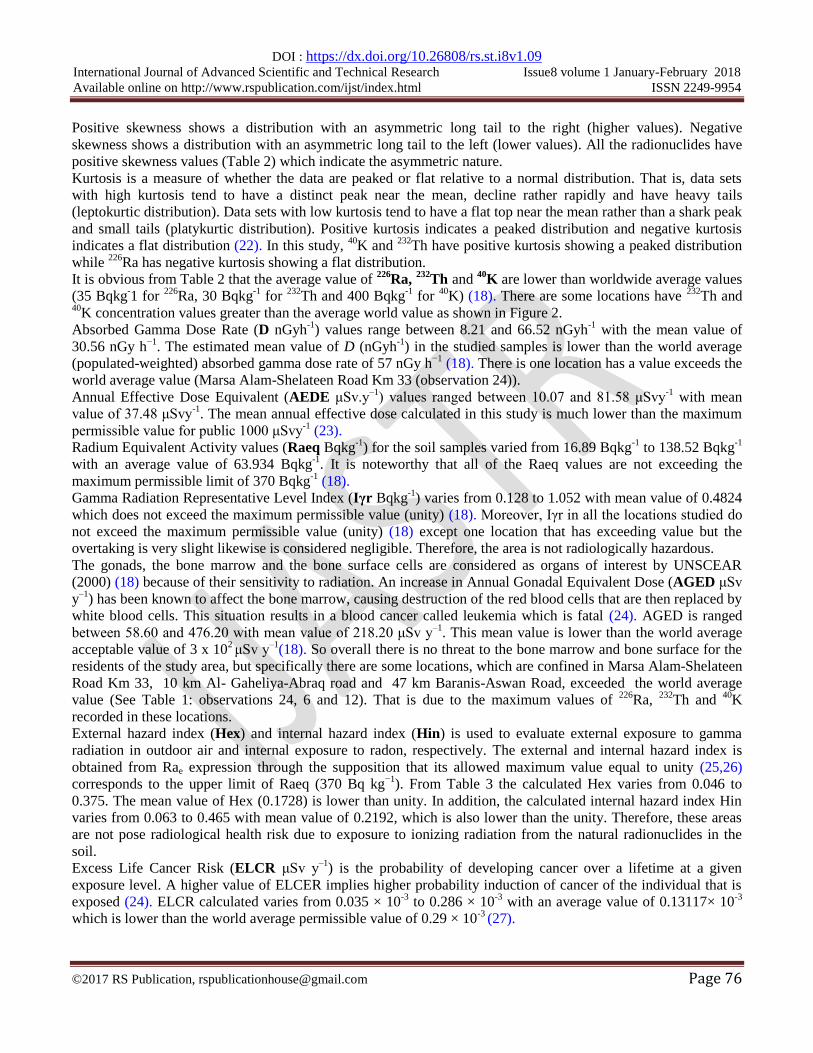
Table 2: Descriptive statistics of radionuclides and radiological hazard indices in the soil of Marsa Alam–
Shalateen area.
Activities (Bq/Kg) Dose Rates Radiation Hazarded Indices
Statistics 226
Ra 232
Th 40
K D
(nGy. h−1
)
AEDE
(μSv.y–1)
Raeq
(Bq/Kg)
Iγr
(Bq/Kg)
AGDE
(μSv.y–1) Hex Hin
ELCRx103
(μSv.y–1)
Mean 17.20 15.56 319.2 30.56 37.48 63.93 0.4824 218.20 0.1728 0.2192 0.13117
StDev 7.71 7.44 139.8 11.67 14.32 24.71 0.1847 83.20 0.0669 0.0853 0.05021
Minimum 6.00 2.42 91.20 8.21 10.07 16.89 0.128 58.60 0.046 0.063 0.035
Variance 59.44 55.35 19544 136.19 205.06 610.58 0.0341 6922.2 0.0045 0.0073 0.0025
Maximum 34.71 34.50 736.30 66.52 81.58 138.52 1.052 476.20 0.375 0.465 0.286
Skewness 0.65 0.93 0.74 0.69 0.69 0.68 0.69 0.69 0.69 0.65 0.69
Kurtosis -0.100 1.58 1.08 2.06 2.06 1.95 2.08 2.10 1.94 1.54 2.06
DOI : https://dx.doi.org/10.26808/rs.st.i8v1.09
International Journal of Advanced Scientific and Technical Research Issue8 volume 1 January-February 2018
Available online on http://www.rspublication.com/ijst/index.html ISSN 2249-9954
©2017 RS Publication, [email protected] Page 76
Positive skewness shows a distribution with an asymmetric long tail to the right (higher values). Negative
skewness shows a distribution with an asymmetric long tail to the left (lower values). All the radionuclides have
positive skewness values (Table 2) which indicate the asymmetric nature.
Kurtosis is a measure of whether the data are peaked or flat relative to a normal distribution. That is, data sets
with high kurtosis tend to have a distinct peak near the mean, decline rather rapidly and have heavy tails
(leptokurtic distribution). Data sets with low kurtosis tend to have a flat top near the mean rather than a shark peak
and small tails (platykurtic distribution). Positive kurtosis indicates a peaked distribution and negative kurtosis
indicates a flat distribution (22). In this study, 40
K and 232
Th have positive kurtosis showing a peaked distribution
while 226
Ra has negative kurtosis showing a flat distribution.
It is obvious from Table 2 that the average value of 226
Ra, 232
Th and 40
K are lower than worldwide average values
(35 Bqkg-1 for
226Ra, 30 Bqkg
-1 for
232Th and 400 Bqkg
-1 for
40K) (18). There are some locations have
232Th and
40K concentration values greater than the average world value as shown in Figure 2.
Absorbed Gamma Dose Rate (D nGyh-1
) values range between 8.21 and 66.52 nGyh-1
with the mean value of
30.56 nGy h−1
. The estimated mean value of D (nGyh-1
) in the studied samples is lower than the world average
(populated-weighted) absorbed gamma dose rate of 57 nGy h−1
(18). There is one location has a value exceeds the
world average value (Marsa Alam-Shelateen Road Km 33 (observation 24)).
Annual Effective Dose Equivalent (AEDE μSv.y–1
) values ranged between 10.07 and 81.58 μSvy-1
with mean
value of 37.48 μSvy-1
. The mean annual effective dose calculated in this study is much lower than the maximum
permissible value for public 1000 μSvy-1
(23).
Radium Equivalent Activity values (Raeq Bqkg-1
) for the soil samples varied from 16.89 Bqkg-1
to 138.52 Bqkg-1
with an average value of 63.934 Bqkg-1
. It is noteworthy that all of the Raeq values are not exceeding the
maximum permissible limit of 370 Bqkg-1
(18).
Gamma Radiation Representative Level Index (Iγr Bqkg-1
) varies from 0.128 to 1.052 with mean value of 0.4824
which does not exceed the maximum permissible value (unity) (18). Moreover, Iγr in all the locations studied do
not exceed the maximum permissible value (unity) (18) except one location that has exceeding value but the
overtaking is very slight likewise is considered negligible. Therefore, the area is not radiologically hazardous.
The gonads, the bone marrow and the bone surface cells are considered as organs of interest by UNSCEAR
(2000) (18) because of their sensitivity to radiation. An increase in Annual Gonadal Equivalent Dose (AGED μSv
y–1
) has been known to affect the bone marrow, causing destruction of the red blood cells that are then replaced by
white blood cells. This situation results in a blood cancer called leukemia which is fatal (24). AGED is ranged
between 58.60 and 476.20 with mean value of 218.20 μSv y–1
. This mean value is lower than the world average
acceptable value of 3 x 10² μSv y
–1(18). So overall there is no threat to the bone marrow and bone surface for the
residents of the study area, but specifically there are some locations, which are confined in Marsa Alam-Shelateen
Road Km 33, 10 km Al- Gaheliya-Abraq road and 47 km Baranis-Aswan Road, exceeded the world average
value (See Table 1: observations 24, 6 and 12). That is due to the maximum values of 226
Ra, 232
Th and 40
K
recorded in these locations.
External hazard index (Hex) and internal hazard index (Hin) is used to evaluate external exposure to gamma
radiation in outdoor air and internal exposure to radon, respectively. The external and internal hazard index is
obtained from Rae expression through the supposition that its allowed maximum value equal to unity (25,26)
corresponds to the upper limit of Raeq (370 Bq kg−1
). From Table 3 the calculated Hex varies from 0.046 to
0.375. The mean value of Hex (0.1728) is lower than unity. In addition, the calculated internal hazard index Hin
varies from 0.063 to 0.465 with mean value of 0.2192, which is also lower than the unity. Therefore, these areas
are not pose radiological health risk due to exposure to ionizing radiation from the natural radionuclides in the
soil.
Excess Life Cancer Risk (ELCR μSv y–1
) is the probability of developing cancer over a lifetime at a given
exposure level. A higher value of ELCER implies higher probability induction of cancer of the individual that is
exposed (24). ELCR calculated varies from 0.035 × 10⁻³
to 0.286 × 10⁻³
with an average value of 0.13117× 10⁻³
which is lower than the world average permissible value of 0.29 × 10⁻³
(27).
DOI : https://dx.doi.org/10.26808/rs.st.i8v1.09
International Journal of Advanced Scientific and Technical Research Issue8 volume 1 January-February 2018
Available online on http://www.rspublication.com/ijst/index.html ISSN 2249-9954
©2017 RS Publication, [email protected] Page 77
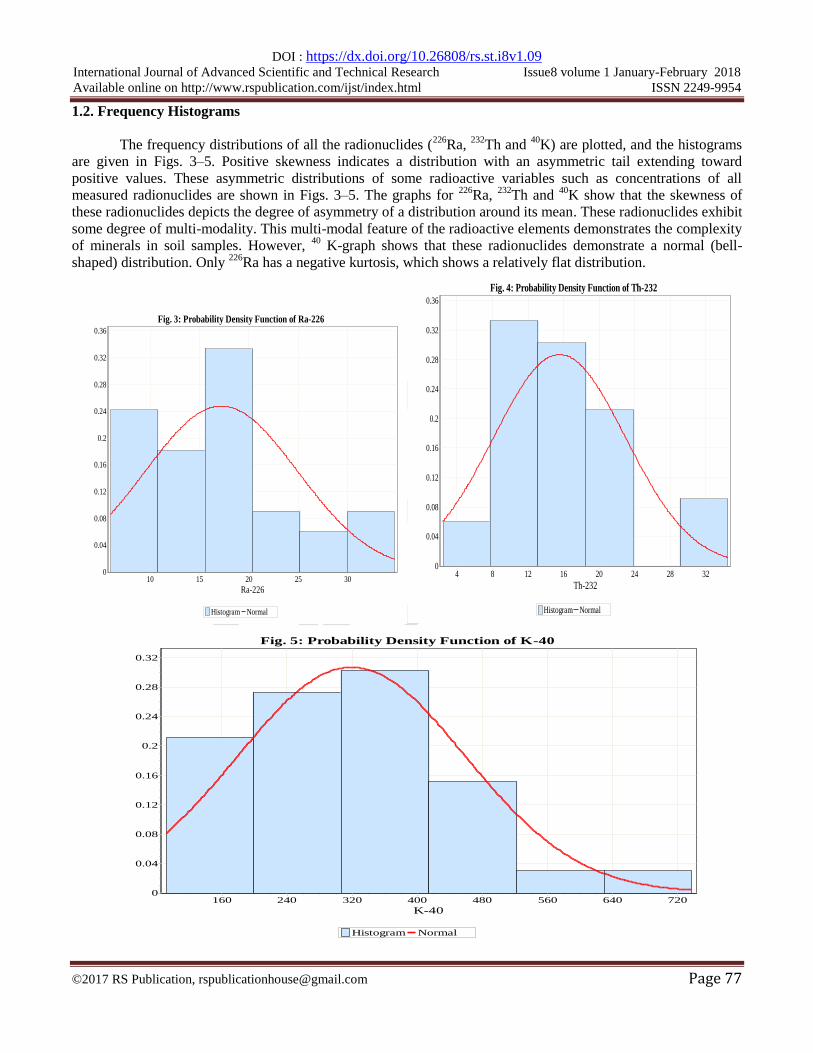
1.2. Frequency Histograms
The frequency distributions of all the radionuclides (226
Ra, 232
Th and 40
K) are plotted, and the histograms
are given in Figs. 3–5. Positive skewness indicates a distribution with an asymmetric tail extending toward
positive values. These asymmetric distributions of some radioactive variables such as concentrations of all
measured radionuclides are shown in Figs. 3–5. The graphs for 226
Ra, 232
Th and 40
K show that the skewness of
these radionuclides depicts the degree of asymmetry of a distribution around its mean. These radionuclides exhibit
some degree of multi-modality. This multi-modal feature of the radioactive elements demonstrates the complexity
of minerals in soil samples. However, 40
K-graph shows that these radionuclides demonstrate a normal (bell-
shaped) distribution. Only 226
Ra has a negative kurtosis, which shows a relatively flat distribution.
Fig. 3: Probability Density Function of Ra-226
Histogram Normal
Ra-2263025201510
f(R
a)
0.36
0.32
0.28
0.24
0.2
0.16
0.12
0.08
0.04
0
Fig. 4: Probability Density Function of Th-232
Histogram Normal
Th-23232282420161284
f(T
h)
0.36
0.32
0.28
0.24
0.2
0.16
0.12
0.08
0.04
0
Fig. 5: Probability Density Function of K-40
Histogram Normal
K-40720640560480400320240160
f(K)
0.32
0.28
0.24
0.2
0.16
0.12
0.08
0.04
0
DOI : https://dx.doi.org/10.26808/rs.st.i8v1.09
International Journal of Advanced Scientific and Technical Research Issue8 volume 1 January-February 2018
Available online on http://www.rspublication.com/ijst/index.html ISSN 2249-9954
©2017 RS Publication, [email protected] Page 78
2. Multivariate Statistical Analysis
The intention underlying the use of multivariate analysis is to achieve great efficiency of data
compression from the original data, and to gain some information useful in the interpretation of the data. This
method can also help to simplify and organize large data sets to provide meaningful insight, and can help to
indicate natural associations between samples and/or variables thus highlighting the information not available at
first glance (28). Multivariate analysis such as principal component analysis (PCA), and cluster analysis is used
to explain the correlation amongst a large number of variables in terms of a small number of factors without
losing much information.
Pearson correlation, Principal Component Analysis (PCA) and Cluster analysis are carried out in order to clarify
the relationship among the variables, especially the influence of soil parameters on the distribution of natural
radionuclides. Cluster analysis is a useful statistical method that presents visually the degree of association among
variables. The distance axis displays the degree of association between groups of variables, i.e., the lower the
value on the axis, the more significant correlation (29).
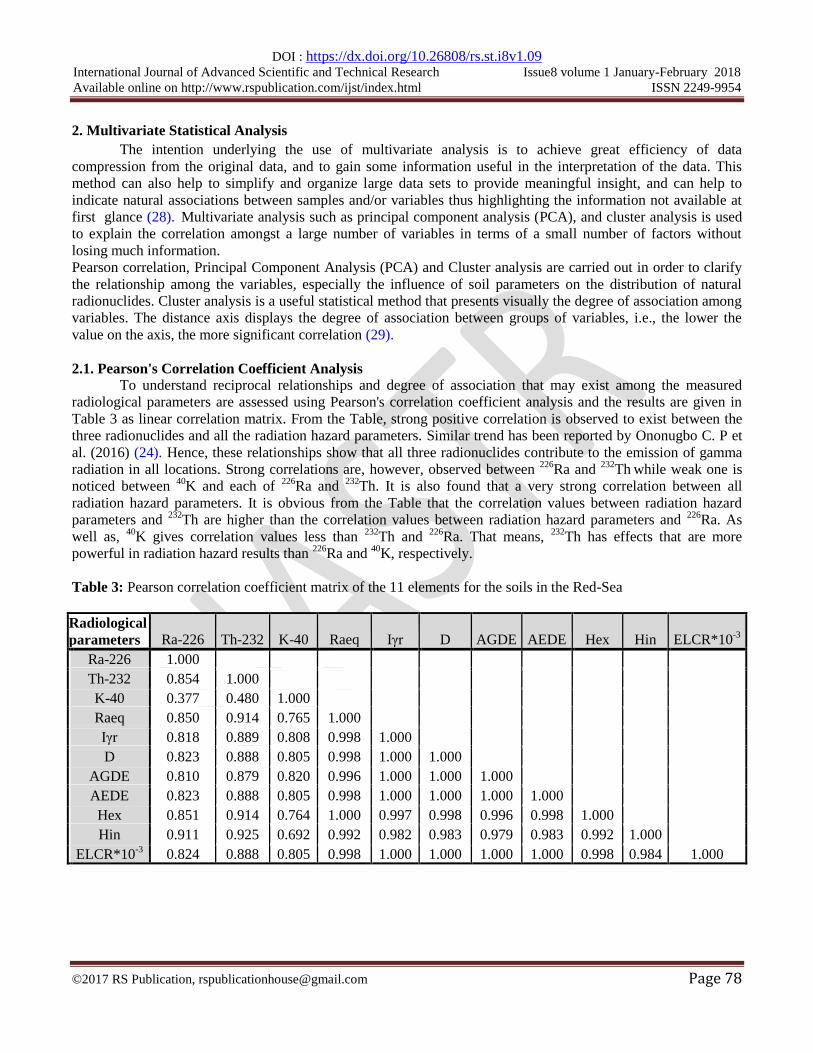
2.1. Pearson's Correlation Coefficient Analysis
To understand reciprocal relationships and degree of association that may exist among the measured
radiological parameters are assessed using Pearson's correlation coefficient analysis and the results are given in
Table 3 as linear correlation matrix. From the Table, strong positive correlation is observed to exist between the
three radionuclides and all the radiation hazard parameters. Similar trend has been reported by Ononugbo C. P et
al. (2016) (24). Hence, these relationships show that all three radionuclides contribute to the emission of gamma
radiation in all locations. Strong correlations are, however, observed between 226
Ra and 232
Th while weak one is
noticed between 40
K and each of 226
Ra and 232
Th. It is also found that a very strong correlation between all
radiation hazard parameters. It is obvious from the Table that the correlation values between radiation hazard
parameters and 232
Th are higher than the correlation values between radiation hazard parameters and 226
Ra. As
well as, 40
K gives correlation values less than 232
Th and 226
Ra. That means, 232
Th has effects that are more
powerful in radiation hazard results than 226
Ra and 40
K, respectively.
Table 3: Pearson correlation coefficient matrix of the 11 elements for the soils in the Red-Sea
Radiological
parameters Ra-226 Th-232 K-40 Raeq Iγr D AGDE AEDE Hex Hin ELCR*10-3
Ra-226 1.000
Th-232 0.854 1.000
K-40 0.377 0.480 1.000
Raeq 0.850 0.914 0.765 1.000
Iγr 0.818 0.889 0.808 0.998 1.000
D 0.823 0.888 0.805 0.998 1.000 1.000
AGDE 0.810 0.879 0.820 0.996 1.000 1.000 1.000
AEDE 0.823 0.888 0.805 0.998 1.000 1.000 1.000 1.000
Hex 0.851 0.914 0.764 1.000 0.997 0.998 0.996 0.998 1.000
Hin 0.911 0.925 0.692 0.992 0.982 0.983 0.979 0.983 0.992 1.000
ELCR*10-3
0.824 0.888 0.805 0.998 1.000 1.000 1.000 1.000 0.998 0.984 1.000
DOI : https://dx.doi.org/10.26808/rs.st.i8v1.09
International Journal of Advanced Scientific and Technical Research Issue8 volume 1 January-February 2018
Available online on http://www.rspublication.com/ijst/index.html ISSN 2249-9954
©2017 RS Publication, [email protected] Page 79
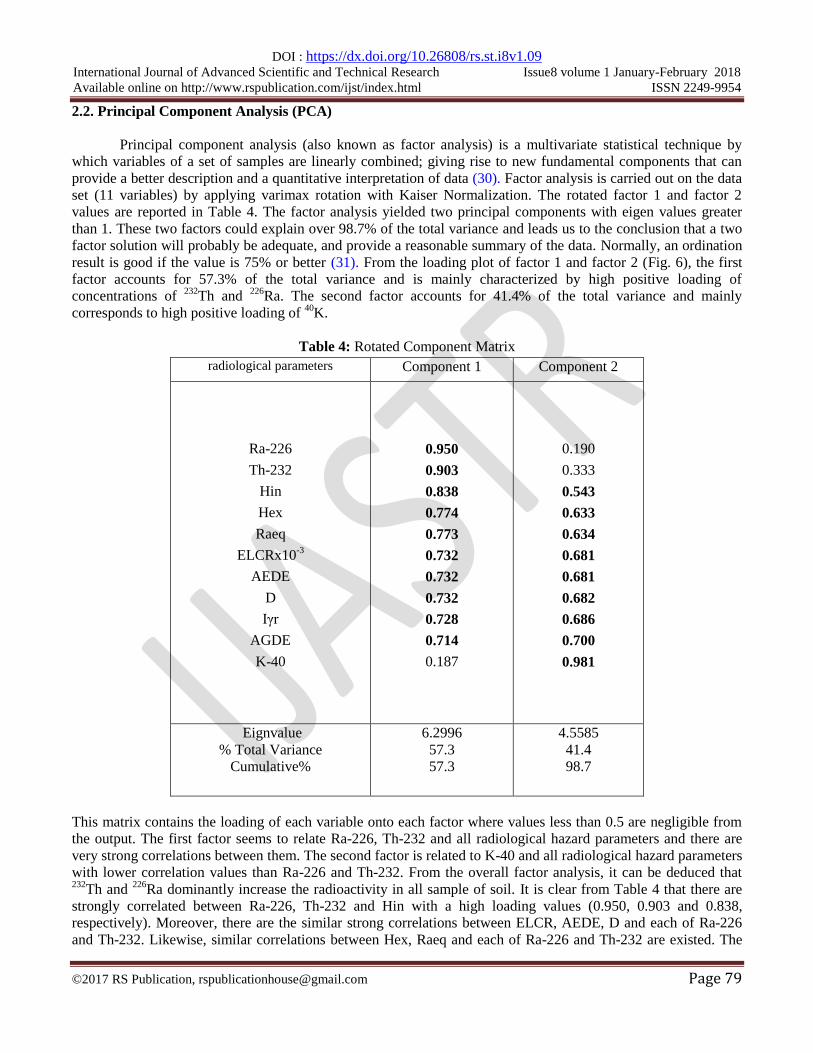
2.2. Principal Component Analysis (PCA)
Principal component analysis (also known as factor analysis) is a multivariate statistical technique by
which variables of a set of samples are linearly combined; giving rise to new fundamental components that can
provide a better description and a quantitative interpretation of data (30). Factor analysis is carried out on the data
set (11 variables) by applying varimax rotation with Kaiser Normalization. The rotated factor 1 and factor 2
values are reported in Table 4. The factor analysis yielded two principal components with eigen values greater
than 1. These two factors could explain over 98.7% of the total variance and leads us to the conclusion that a two
factor solution will probably be adequate, and provide a reasonable summary of the data. Normally, an ordination
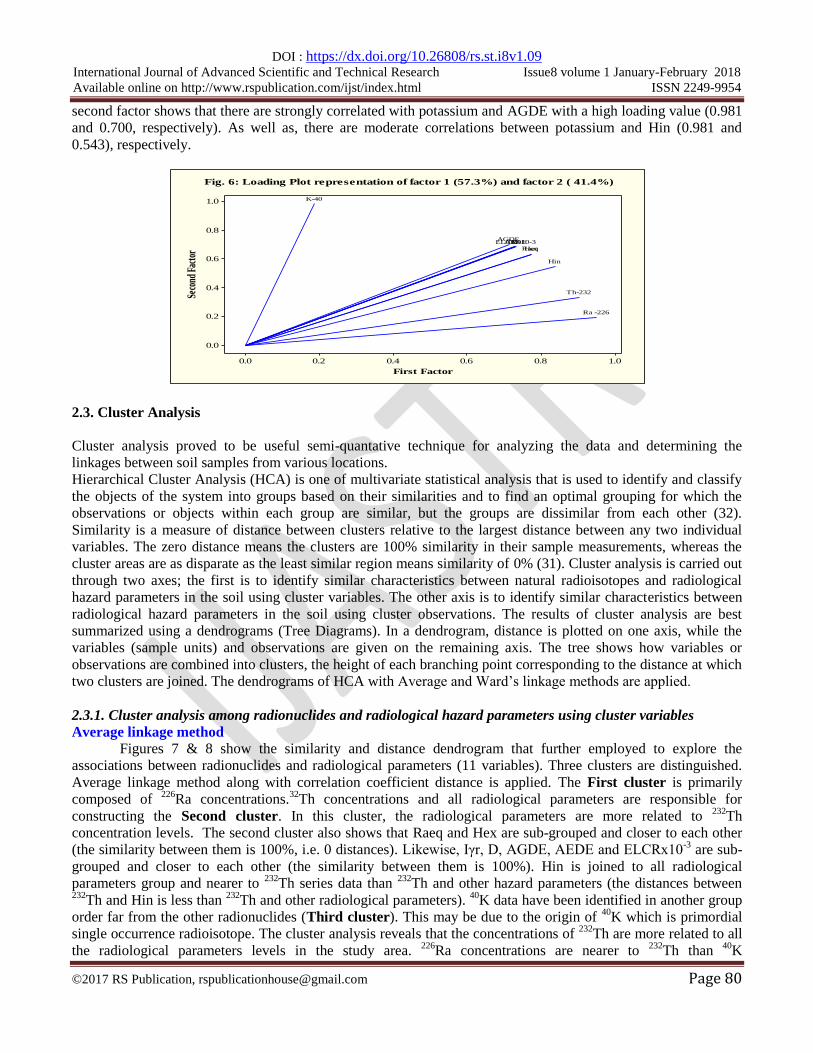
result is good if the value is 75% or better (31). From the loading plot of factor 1 and factor 2 (Fig. 6), the first
factor accounts for 57.3% of the total variance and is mainly characterized by high positive loading of
concentrations of 232
Th and 226
Ra. The second factor accounts for 41.4% of the total variance and mainly
corresponds to high positive loading of 40
K.
Table 4: Rotated Component Matrix
radiological parameters Component 1 Component 2
Ra-226
Th-232
Hin
Hex
Raeq
ELCRx10-3
AEDE
D
Iγr
AGDE
K-40
0.950
0.903
0.838
0.774
0.773
0.732
0.732
0.732
0.728
0.714
0.187
0.190
0.333
0.543
0.633
0.634
0.681
0.681
0.682
0.686
0.700
0.981
Eignvalue
% Total Variance
Cumulative%
6.2996
57.3
57.3
4.5585
41.4
98.7
This matrix contains the loading of each variable onto each factor where values less than 0.5 are negligible from
the output. The first factor seems to relate Ra-226, Th-232 and all radiological hazard parameters and there are
very strong correlations between them. The second factor is related to K-40 and all radiological hazard parameters
with lower correlation values than Ra-226 and Th-232. From the overall factor analysis, it can be deduced that 232
Th and 226
Ra dominantly increase the radioactivity in all sample of soil. It is clear from Table 4 that there are
strongly correlated between Ra-226, Th-232 and Hin with a high loading values (0.950, 0.903 and 0.838,
respectively). Moreover, there are the similar strong correlations between ELCR, AEDE, D and each of Ra-226
and Th-232. Likewise, similar correlations between Hex, Raeq and each of Ra-226 and Th-232 are existed. The
DOI : https://dx.doi.org/10.26808/rs.st.i8v1.09
International Journal of Advanced Scientific and Technical Research Issue8 volume 1 January-February 2018
Available online on http://www.rspublication.com/ijst/index.html ISSN 2249-9954
©2017 RS Publication, [email protected] Page 80
second factor shows that there are strongly correlated with potassium and AGDE with a high loading value (0.981
and 0.700, respectively). As well as, there are moderate correlations between potassium and Hin (0.981 and
0.543), respectively.
1.00.80.60.40.20.0
1.0
0.8
0.6
0.4
0.2
0.0
First Factor
Seco
nd F
acto
r
ELCRx10-3
Hin
Hex
AEDEAGDE
DIγ r
Raeq
K-40
Th-232
Ra -226
Fig. 6: Loading Plot representation of factor 1 (57.3%) and factor 2 ( 41.4%)
2.3. Cluster Analysis
Cluster analysis proved to be useful semi-quantative technique for analyzing the data and determining the
linkages between soil samples from various locations.
Hierarchical Cluster Analysis (HCA) is one of multivariate statistical analysis that is used to identify and classify
the objects of the system into groups based on their similarities and to find an optimal grouping for which the
observations or objects within each group are similar, but the groups are dissimilar from each other (32).
Similarity is a measure of distance between clusters relative to the largest distance between any two individual
variables. The zero distance means the clusters are 100% similarity in their sample measurements, whereas the
cluster areas are as disparate as the least similar region means similarity of 0% (31). Cluster analysis is carried out
through two axes; the first is to identify similar characteristics between natural radioisotopes and radiological
hazard parameters in the soil using cluster variables. The other axis is to identify similar characteristics between
radiological hazard parameters in the soil using cluster observations. The results of cluster analysis are best
summarized using a dendrograms (Tree Diagrams). In a dendrogram, distance is plotted on one axis, while the
variables (sample units) and observations are given on the remaining axis. The tree shows how variables or
observations are combined into clusters, the height of each branching point corresponding to the distance at which
two clusters are joined. The dendrograms of HCA with Average and Ward’s linkage methods are applied.
2.3.1. Cluster analysis among radionuclides and radiological hazard parameters using cluster variables
Average linkage method
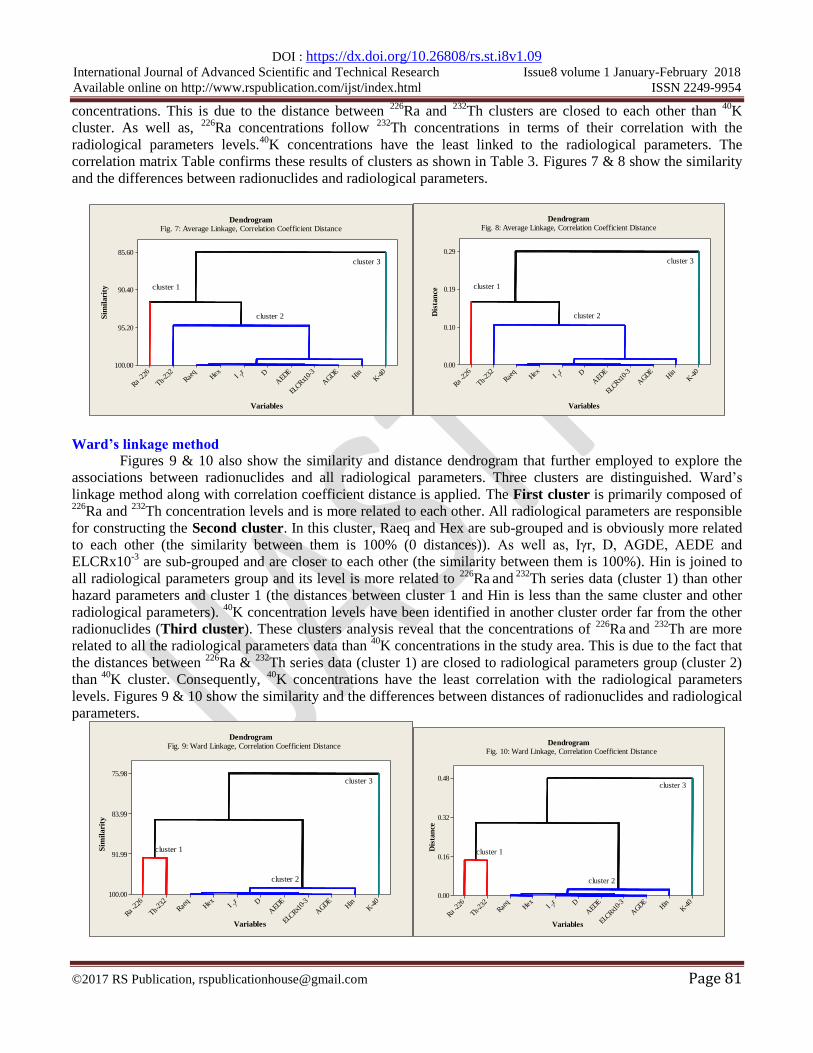
Figures 7 & 8 show the similarity and distance dendrogram that further employed to explore the
associations between radionuclides and radiological parameters (11 variables). Three clusters are distinguished.
Average linkage method along with correlation coefficient distance is applied. The First cluster is primarily
composed of 226
Ra concentrations.32
Th concentrations and all radiological parameters are responsible for
constructing the Second cluster. In this cluster, the radiological parameters are more related to 232
Th
concentration levels. The second cluster also shows that Raeq and Hex are sub-grouped and closer to each other
(the similarity between them is 100%, i.e. 0 distances). Likewise, Iγr, D, AGDE, AEDE and ELCRx10-3
are sub-
grouped and closer to each other (the similarity between them is 100%). Hin is joined to all radiological
parameters group and nearer to 232
Th series data than 232
Th and other hazard parameters (the distances between 232
Th and Hin is less than 232
Th and other radiological parameters). 40
K data have been identified in another group
order far from the other radionuclides (Third cluster). This may be due to the origin of 40
K which is primordial
single occurrence radioisotope. The cluster analysis reveals that the concentrations of 232
Th are more related to all
the radiological parameters levels in the study area. 226
Ra concentrations are nearer to 232
Th than 40
K
DOI : https://dx.doi.org/10.26808/rs.st.i8v1.09
International Journal of Advanced Scientific and Technical Research Issue8 volume 1 January-February 2018
Available online on http://www.rspublication.com/ijst/index.html ISSN 2249-9954
©2017 RS Publication, [email protected] Page 81
concentrations. This is due to the distance between 226
Ra and 232
Th clusters are closed to each other than 40
K
cluster. As well as, 226
Ra concentrations follow 232
Th concentrations in terms of their correlation with the
radiological parameters levels.40
K concentrations have the least linked to the radiological parameters. The
correlation matrix Table confirms these results of clusters as shown in Table 3. Figures 7 & 8 show the similarity
and the differences between radionuclides and radiological parameters.
K-4
0Hin
AGDE
ELCRx10-
3
AEDEDI γ
rHex
Raeq
Th-232
Ra -226
85.60
90.40
95.20
100.00
Variables
Sim
ilari
ty
DendrogramFig. 7: Average Linkage, Correlation Coefficient Distance
cluster 1
cluster 2
cluster 3
K-4
0Hin
AGDE
ELCRx1
0-3
AED
EDI γ r
Hex
Raeq
Th-23
2
Ra
-226
0.29
0.19
0.10
0.00
Variables
Dis
tan
ce
DendrogramFig. 8: Average Linkage, Correlation Coefficient Distance
cluster 1
cluster 2
cluster 3
Ward’s linkage method
Figures 9 & 10 also show the similarity and distance dendrogram that further employed to explore the
associations between radionuclides and all radiological parameters. Three clusters are distinguished. Ward’s
linkage method along with correlation coefficient distance is applied. The First cluster is primarily composed of 226
Ra and 232
Th concentration levels and is more related to each other. All radiological parameters are responsible
for constructing the Second cluster. In this cluster, Raeq and Hex are sub-grouped and is obviously more related
to each other (the similarity between them is 100% (0 distances)). As well as, Iγr, D, AGDE, AEDE and
ELCRx10-3
are sub-grouped and are closer to each other (the similarity between them is 100%). Hin is joined to
all radiological parameters group and its level is more related to 226
Ra and
232Th series data (cluster 1) than other
hazard parameters and cluster 1 (the distances between cluster 1 and Hin is less than the same cluster and other
radiological parameters). 40
K concentration levels have been identified in another cluster order far from the other
radionuclides (Third cluster). These clusters analysis reveal that the concentrations of 226
Ra and
232Th are more
related to all the radiological parameters data than 40
K concentrations in the study area. This is due to the fact that
the distances between 226
Ra & 232
Th series data (cluster 1) are closed to radiological parameters group (cluster 2)
than 40
K cluster. Consequently, 40
K concentrations have the least correlation with the radiological parameters
levels. Figures 9 & 10 show the similarity and the differences between distances of radionuclides and radiological
parameters.
K-4
0Hin
AGDE
ELCRx10-
3
AEDEDI γ
rHex
Raeq
Th-232
Ra -226
75.98
83.99
91.99
100.00
Variables
Sim
ilari
ty
DendrogramFig. 9: Ward Linkage, Correlation Coefficient Distance
cluster 1
cluster 2
cluster 3
K-4
0Hin
AGDE
ELCRx
10-3
AED
EDI γ r
HexRae
q
Th-23
2
Ra -2
26
0.48
0.32
0.16
0.00
Variables
Dis
tan
ce
DendrogramFig. 10: Ward Linkage, Correlation Coefficient Distance
cluster 1
cluster 2
cluster 3
DOI : https://dx.doi.org/10.26808/rs.st.i8v1.09
International Journal of Advanced Scientific and Technical Research Issue8 volume 1 January-February 2018
Available online on http://www.rspublication.com/ijst/index.html ISSN 2249-9954
©2017 RS Publication, [email protected] Page 82
2.3.2. Cluster analysis among hazard radiological parameters using cluster observations
Average linkage method
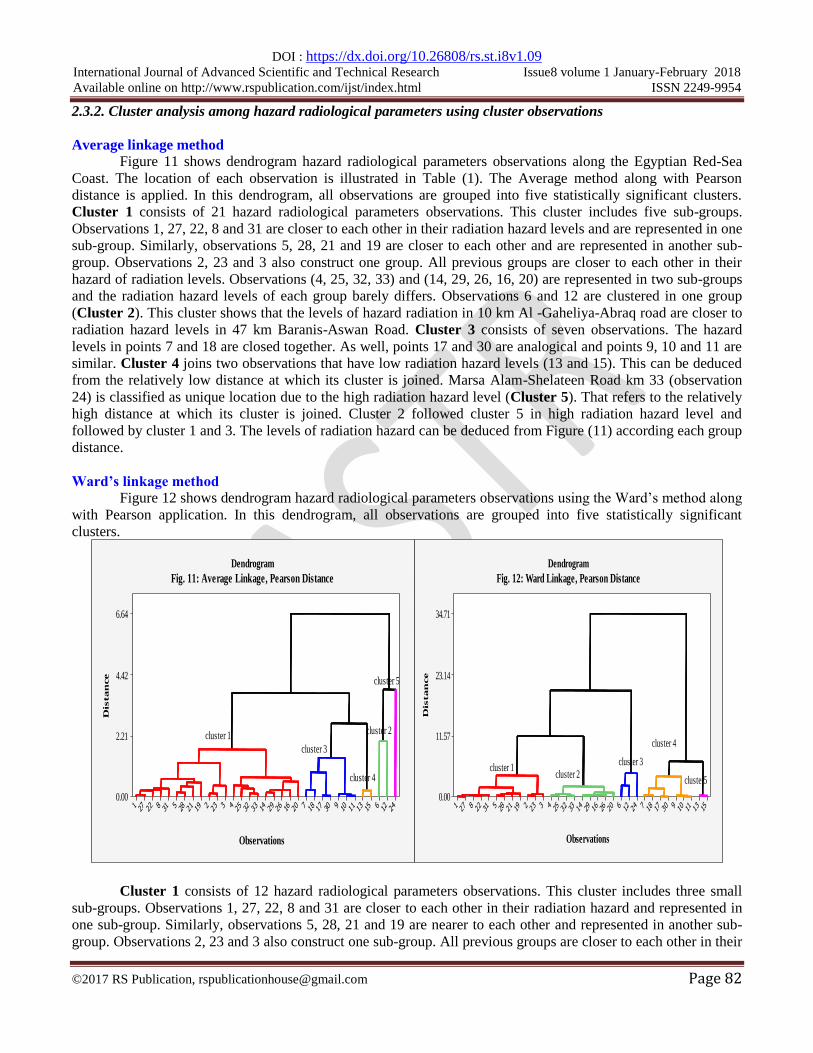
Figure 11 shows dendrogram hazard radiological parameters observations along the Egyptian Red-Sea
Coast. The location of each observation is illustrated in Table (1). The Average method along with Pearson
distance is applied. In this dendrogram, all observations are grouped into five statistically significant clusters.
Cluster 1 consists of 21 hazard radiological parameters observations. This cluster includes five sub-groups.
Observations 1, 27, 22, 8 and 31 are closer to each other in their radiation hazard levels and are represented in one
sub-group. Similarly, observations 5, 28, 21 and 19 are closer to each other and are represented in another sub-
group. Observations 2, 23 and 3 also construct one group. All previous groups are closer to each other in their
hazard of radiation levels. Observations (4, 25, 32, 33) and (14, 29, 26, 16, 20) are represented in two sub-groups
and the radiation hazard levels of each group barely differs. Observations 6 and 12 are clustered in one group
(Cluster 2). This cluster shows that the levels of hazard radiation in 10 km Al -Gaheliya-Abraq road are closer to
radiation hazard levels in 47 km Baranis-Aswan Road. Cluster 3 consists of seven observations. The hazard
levels in points 7 and 18 are closed together. As well, points 17 and 30 are analogical and points 9, 10 and 11 are
similar. Cluster 4 joins two observations that have low radiation hazard levels (13 and 15). This can be deduced
from the relatively low distance at which its cluster is joined. Marsa Alam-Shelateen Road km 33 (observation
24) is classified as unique location due to the high radiation hazard level (Cluster 5). That refers to the relatively
high distance at which its cluster is joined. Cluster 2 followed cluster 5 in high radiation hazard level and
followed by cluster 1 and 3. The levels of radiation hazard can be deduced from Figure (11) according each group
distance.
Ward’s linkage method
Figure 12 shows dendrogram hazard radiological parameters observations using the Ward’s method along
with Pearson application. In this dendrogram, all observations are grouped into five statistically significant
clusters.
241261513111093017187201626291433322543232192128531822271
6.64
4.42
2.21
0.00
Observations
Dis
tan
ce
Dendrogram
Fig. 11: Average Linkage, Pearson Distance
cluster 1
cluster 3
cluster 5
cluster 2
cluster 4
151311109301718724126202616291433322543232192128531228271
34.71
23.14
11.57
0.00
Observations
Dis
tan
ce
Dendrogram
Fig. 12: Ward Linkage, Pearson Distance
cluster 1cluster 2
cluster 3
cluster 4
cluster5
Cluster 1 consists of 12 hazard radiological parameters observations. This cluster includes three small
sub-groups. Observations 1, 27, 22, 8 and 31 are closer to each other in their radiation hazard and represented in
one sub-group. Similarly, observations 5, 28, 21 and 19 are nearer to each other and represented in another sub-
group. Observations 2, 23 and 3 also construct one sub-group. All previous groups are closer to each other in their
DOI : https://dx.doi.org/10.26808/rs.st.i8v1.09
International Journal of Advanced Scientific and Technical Research Issue8 volume 1 January-February 2018
Available online on http://www.rspublication.com/ijst/index.html ISSN 2249-9954
©2017 RS Publication, [email protected] Page 83
hazard of radiation. Groups (4, 25, 32, 33) and (14, 29, 26, 16, 20) are clustered in two sub-groups (Cluster 2)
and the radiation hazard levels of each group barely differs. Cluster 3 is composed of observations 6, 12 and 24.
This cluster shows that the levels of hazard radiation in 10 km Al -Gaheliya-Abraq road are closer to radiation
hazard levels in 47 km Baranis-Aswan Road. Marsa Alam-Shelateen Road km 33 (observation 24) is classified as
a most location that has a high radiation hazard level. This refers to the relatively high distance at which its cluster
is joined, followed by location 6 and 12. Cluster 4 consists of 7 observations. The hazard levels in locations 7
and 18 are closed together. As well, locations 17 and 30 are analogical and locations 9, 10 and 11 are similar.
Cluster 5 joins two observations that have low radiation hazard levels (13 and 15). This can be deduced from the
relatively low distance at which its cluster is joined. Cluster 1 followed cluster 3 in high radiation hazard levels
and followed by cluster 4 and 2, respectively. The levels of radiation hazard can be deduced from Figure 12
according each group distance.
In spite of, there are differences between the two methods (Average and Ward), but the cluster analysis of both
methods are considered realistic and acceptable.
CONCLUSION
The specific activity concentration of 226
Ra, 232
Th and 40
K of the soil are collected from 33 districts of
Marsa Alam-Shalateen area, Red Sea coast in Egypt. They had been determined using Hyper-Pure Germanium
(HPGe) detector. The average of activity concentrations of these radionuclides are lower than the safe limit
stipulated by UNSCEAR (2000). Strong positive correlation is observed to exist between the three radionuclides
and all the radiological hazard parameters. Hence, these relationships show that all three radionuclides contribute
to the emission of gamma radiation in all locations. Strong correlations are observed between 226
Ra and 232
Th
while weakly correlation between 40
K and each of 226
Ra and 232
Th. It is also found that a very strong correlation
between all radiation hazard parameters. The correlation values between radiation hazard parameters and 232
Th are
higher than the correlation values between radiation hazard parameters and 226
Ra. As well as, 40
K gives correlation
values less than 232
Th and 226
Ra. The result indicates that the average value of each radiological hazard parameters
are lower than the world average value reported in UNSCEAR. It implies therefore that there is no potential
radiological health hazard associated with the soil samples of Marsa Alam-Shalateen area. Specifically there are
some locations have Annual Gonadal Equivalent Dose (AGED) values that exceed the world average value.
The statistical method employed also revealed that the concentrations of 232
Th and
226Ra are more related to the all
the radiological parameters levels than 40
K concentrations, respectively. In addition, there are three regions have
high level concentrations which are confined in Marsa Alam-Shelateen Road Km 33, 10 km Al- Gaheliya-Abraq
road and 47 km Baranis-Aswan Road. It is therefore recommended to focus on further study at these locations
and the area that surround them. The result of this study could be helpful in radiological mapping of the area that
has high concentrations as well as to be a baseline data for future studies.
REFERENCES
1- UNEP, “Assessment of Land-based Sources and Activities Affecting the Marine Environment in the Red
Sea and Gulf of Aden”, UNEP Regional Seas Reports and Studies No.166, 1997.
2- PERSGA, “Status of the Living Marine Resources in the Red Sea and Gulf of Aden Region and their
Management”, 2000.
3- El- Mamoney M.H. and Khater A. E. M., “Environmental Characterization and Radio-ecological Impacts
of Non-Nuclear Industries on the Red Sea Coast”, Journal of Environmental Radioactivity, 73(2), pp.
151-68, 2004.
DOI : https://dx.doi.org/10.26808/rs.st.i8v1.09
International Journal of Advanced Scientific and Technical Research Issue8 volume 1 January-February 2018
Available online on http://www.rspublication.com/ijst/index.html ISSN 2249-9954
©2017 RS Publication, [email protected] Page 84
4- Abril J.M. and Abdel-Aal M.M., “Marine Radioactivity Studies in the Suez Canal. A Modelling Study
on Radionuclide Dispersion”, Journal of Environmental Radioactivity, Volume 48, Issue 3, pp. 261-386,
2000.
5- Al -Moubaraki A.H., Al-Judaibi A. and Asiri M., “Corrosion of C-Steel in the Red Sea: Effect of
Immersion Time and Inhibitor Concentration”, International Journal of ELECTROCHEMICAL
SCIENCE, 10, pp. 4252-4278, 2015.
6- Saudi Arabia Plans a Huge Red Sea Beach Tourism Project, 2017. available online:
https://www.bloomberg.com/news/articles/2017-08-01/saudi-arabia-unveils-plans-for-mega-red-sea-
tourism-project.
7- Hawkins J.P. and Roberts C.M., “The Growth of Coastal Tourism in the Red Sea: Present and Possible
Future Effects on Coral Reefs”. In: R.N. Ginsburg Proceedings of the Colloquium on Global Aspects of
Coral Reefs, Health, Hazards and History, University of Miami, Florida, pp.385–391, 1993.
8- Hanna R.G.M, “The Level of Heavy Metals in the Red Sea after 50 Years”, Science of the Total
Environment, 125, pp. 417–448, 1992.
9- Ahmed, N.K., Abbady A., El-Arabi A.M., Mitchel R., El-Kamel, A.H and Abbady A.G.E, “Comparative
Study of Natural Radioactivity of Some Selected Rocks from Egypt and Germany”, Indian Journal of
Pure and Applied Physics, Vol. 44, pp. 209-215, 2006.
10- Harb S., El-Kamel A.H., Abd El-Mageed A.I., Abbady A. and Rashed W., “Concentration of U-238, U-
235, Ra-226, Th-232 AND K-40 for Some Granite Samples in Eastern Desert of Egypt”,. In Proceedings
of the 3rd environmental physics conference, 19-23, Aswan, Egypt, 2008.
11- Yousef H.A., & Saleh G.M., “Measurement of the Natural Radioactivity in Cataclastic Rock Samples
Using RS-230 Spectrometer”, Greener Journal of Physical Sciences, 3(5), pp. 165-176, 2013.
12- Abdel-Razek Y.A., Bakhit A.F., and Nada A.A., “In Measurements of the Natural Radioactivity Along
Wadi Nugrus, Egypt”, IX Radiation Physics & Protection Conference, Nasr City, Cairo, Egypt, pp. 225-
231, 2008.
13- EL-Saharty A.A. and Dar M.A., “The Concentration Levels of Some Iisotopic Radionuclides in the
Coastal Sediments of the Red Sea, Egypt”, Isotope & Radiation Residence, 42(1), pp. 11-27, 2008.
14- El-Taher A. and Madkour A., “Distribution and Environmental Iimpacts of Metals and Natural
Radionuclides in Marine Sediments Iin-front of Different Wadies Mouth along the Egyptian Red Sea
Coast”. Applied Radiation and Isotopes, 69, pp. 550-558, 2011.
15- Salam, M.H.M., “Assessment of Radioactive and Chemical Pollutants in Water and Sediments of the
Egyptian Red Sea Coast”, Ph.D. Thesis, Faculty of science, Zagazig Univ., 156p, 2012.
16- Arafat A.A., Salama M.H.M., El-Sayed S.A. and Elfeel A.A., “Distribution of Natural Radionuclides and
Assessment of the Associated Hazards in the Environment of Marsa Alam-Shalateen area, Red Sea coast,
Egypt”, Journal of Radiation Research and Applied Sciences, Vol. 10, Issue 3, pp. 219-232, 2017.
17- Baha El Din S.M., “ Important Bird Areas in Africa and associated islands – Egypt”, pp. 241-264, 2001.
available online: http://www.birdlife.org.
18- UNSCEAR (United Nations Scientific Committee on the Effects of Atomic Radiation), “Sources and
effects of ionizing radiation”, United Nations, New York, Report to the General Assembly with Annexes.
2000.
19- Wikipedia, Principal component analysis, 2017.
En.wikipedia.org, available online: https://en.wikipedia.org/wiki/Principal_component_analysis.
20- MINITAB User’s Guide 2: “Data Analysis and Quality Tools”, Release 13 for Windows®, Minitab Inc.
2000.
21- Groeneveld R.A. and Meeden G., “Measuring skewness and kurtosis”. The Statistician 33 (4), pp. 391-
399, 1984.
22- Maimon O.Z. and Rokach L., “Decomposition Methodology for Knowledge Discovery and Data Mining:
Theory and Applications”, World Scientific publishing Co. Pte. Ltd., copyright 2005.
23- ICRP (International Commission on Radiological Protection), “Recommendations of the International
Commission on Radiological Protection”, ICRP Publication 60 Ann, 1990.
DOI : https://dx.doi.org/10.26808/rs.st.i8v1.09
International Journal of Advanced Scientific and Technical Research Issue8 volume 1 January-February 2018
Available online on http://www.rspublication.com/ijst/index.html ISSN 2249-9954
©2017 RS Publication, [email protected] Page 85
24- Ononugbo C.P., Avwiri G.O. and Tutumeni G., “Measurement of Natural Radioactivity and Evaluation of
Radiation Hazards in Soil of Abua/Odual Districts Using Multivariate Statistical Approach”, British
Journal of Environmental Sciences, Vol.4, No.1, pp. 35-48, 2016.
25- UNSCEAR (United Nations Scientific Committee on the Effects of Atomic Radiation), “Sources, effects
and risks of ionizing radiation”, United Nations, New York, Report to the General Assembly with
Annexes, 1988.
26- Beretka J., and Mathew P.J., “Natural radioactivity of Australian building materials, industrial wastes and
by-products”: Health Physics 48, pp. 87-95, 1985.
27- Taskin H., Karavus M., Ay P., Topuzoglu A., Hidiroglu S. and Karahan G., “Radionuclide concentration
in soil and lifetime cancer risk due to the gamma radioactivity in Kirklareli, Turkey”, Journal of
environmental radioactivity, 100, pp. 49-53, 2009.
28- Sivakumar S., Chandrasekaranb A., Ravisankarc R., Ravikumarc S.M., Prince Prakash Jebakumard J.,
Vijayagopale P., Vijayalakshmie I. and Jose M.T., “Measurement of Natural Radioactivity and
Evaluation of Radiation Hazards in Coastal Sediments of East Coast of Tamilnadu Using Statistical
Approachs”, Journal of Taibah University for Science, Vol. 8, pp. 375–384, 2014.
29- SureshGandhi M., Ravisankar R., Rajalakshmi A., Sivakumar S., Chandrasekaran A. and Pream Anand
D., “Measurements of Natural Gamma Radiation in Beach Sediments of North East Coast of Tamilnadu,
India by Gamma Ray Spectrometry with Multivariate Statistical Approach”, Journal of Radiation
Research and Applied Sciences, Vol. 7, Issue 1, pp. 7–17, 2014.
30- Ravisankar R., Vanasundari K., Suganya M., Raghu Y., Rajalakshmi A., Chandrasekaran A., Sivakumar
S., Chandramohan J., Chandramohan J., Vijayagopal P. and Venkatraman B., “Multivariate Statistical
Analysis of Radiological Data of building materials used in Tiruvannamalai, Tamilnadu, India”, Applied
Radiation and Isotopes, Vol. 85, pp. 114–127, 2014.
31- Tsai T.L., Liu C.C, Chuang C.Y., Wei H.J. and Men L.C., “The Effects of Physico-Chemical Properties
on Natural Radioactivity Levels, Associated Dose Rate and Evaluation of Radiation Hazard in the Soil of
Taiwan Using Statistical Analysis”, Journal of Radioanalytical and Nuclear Chemistry, 288:927–936,
2011.
32- Senthilkumar R.D., Narayanaswamy R., “Assessment of Radiological Hazards in the Industrial Effluent
Disposed Soil with Statistical Analyses”, Journal of Radiation Research and Applied Sciences, Vol. 9,
Issue 4, pp. 449–456, 2016.
Related Documents