hp://www.jamba.org.za Open Access Jàmbá - Journal of Disaster Risk Studies ISSN: (Online) 2072-845X, (Print) 1996-1421 Page 1 of 10 Original Research Authors: Eric M. Masereka 1 George M. Ochieng 2 Jacques Snyman 1 Affiliaons: 1 Department of Civil Engineering, Tshwane University of Technology, South Africa 2 Department of Civil Engineering, Vaal University of Technology, South Africa Corresponding author: Eric Masereka, [email protected] Dates: Received: 28 May 2017 Accepted: 01 Aug. 2017 Published: 26 Mar. 2018 How to cite this arcle: Masereka, E.M., Ochieng, G.M. & Snyman, J., 2018, ‘Stascal analysis of annual maximum daily rainfall for Nelspruit and its environs’, Jàmbá: Journal of Disaster Risk Studies 10(1), a499. hps://doi.org/10.4102/ jamba.v10i1.499 Copyright: © 2018. The Authors. Licensee: AOSIS. This work is licensed under the Creave Commons Aribuon License. Introducon Extreme high annual maximum daily rainfall (AMDR) events are among environmental events that have caused the most disastrous consequences for human society (Kysely, Picek & Huth 2006). Flood hazards caused by high extreme rainfall events have resulted in flood disasters that have accounted for 47% of all weather-related disasters affecting 2.3 billion people worldwide (Wahlstrom & Guha-Sair 2015). Death tolls because of floods have also risen in many parts of the world. In 2007, floods killed 3300 people in India and Bangladesh alone; in 2010, floods killed 2100 people in Pakistan and 1900 people in China, whereas in 2013, 6500 people died because of floods in India (Wahlstrom & Guha-Sair 2015). These flood events have been attributed to effects of human-induced climate change (Komi, Amisigo & Diekkriiger 2016). In order to formulate and develop strategies to manage and reduce flood disaster risk, it is necessary to carry out statistical analysis of the AMDR events that cause these flood disasters. Occurrences of floods in Nelspruit and its environs because of extreme high AMDR events have been documented. On 29 January 1974, heavy rains of 112.6 mm in 24 h caused floods that destroyed property in Nelspruit and its environs (SAWS 1994). On 29 January 1984, heavy rains of 110.5 mm in 24 h caused floods in which four lives were lost and several agricultural dams were destroyed (Kovacs et al 1984). On 08 February 1985, 126.0 mm of rain in 24 h caused damage to roads and bridges in Nelspruit and its environs (SAWS 1985). The heavy rains and storms of 106.2 mm on 06 February 2000 followed by 102.8 mm on 07 February 2000 caused a lot of damage. It was estimated that 1240 km of paved roads, 1306 km of gravel roads, 120 km of farm roads and 84 bridges were damaged. Also, these floods destroyed 16 large dams and 96 small farm dams (Smithers et al. 2000). On 18 January 2012, heavy rains of 109.0 mm caused floods and extensive damage in Nelspruit and its environs (News24 2012). On 11 March 2014, heavy rains of 107.3 mm in 24 h which was followed by 104.8 mm of rain of the previous 24 h caused the death of 11 people in Nelspruit and its environs (News24 2014). The areas that have been affected by flood hazards are mainly in the river courses and more so in the flood zones. Bridges, water pumping stations, farm roads and irrigation systems are among the infrastructures that are frequently affected by flood hazards. Despite the frequent extreme high AMDR events that have been causing floods resulting in loss of human lives and property, limited research has been carried out on the frequency and magnitude Nelspruit and its environs frequently experience extreme high annual maximum daily rainfall (AMDR) events resulting in flood hazards. These flood hazards have caused flood disasters that have resulted in loss of property and lives. The main objective of this study was to carry out statistical analysis of extreme high AMDR events that have caused flood hazards, which in turn have caused flood disasters in Nelspruit and its environs. Empirical continuous probability distribution functions (ECPDF) and theoretical continuous probability distribution functions (TCPDF) were applied to carry out the statistical analysis of the extreme high AMDR events. Annual maximum daily rainfall event of magnitude 100 mm was identified as a threshold. Events > 100 mm were considered as extreme high events resulting in flood disasters. The results of empirical frequency analysis showed that the return period of flood disasters was 10 years. The occurrence probability of flood disaster event at least once in 1, 2, 3, 4 and 5 years was 0.10, 0.19, 0.27, 0.34 and 0.41, respectively. Generalised logistic PDF was identified as the best-fit theoretical PDF for statistical analysis of the extreme high AMDR events in Nelspruit and its environs. The results of this study contributed to the understanding of frequency and magnitude of extreme high AMDR events that could lead to flood disasters. The results could be applied in developing flood disaster management strategies in Nelspruit and its environs. Stascal analysis of annual maximum daily rainfall for Nelspruit and its environs Read online: Scan this QR code with your smart phone or mobile device to read online.

Welcome message from author
This document is posted to help you gain knowledge. Please leave a comment to let me know what you think about it! Share it to your friends and learn new things together.
Transcript
httpwwwjambaorgza Open Access
Jagravembaacute - Journal of Disaster Risk Studies ISSN (Online) 2072-845X (Print) 1996-1421
Page 1 of 10 Original Research
Read onlineScan this QR code with your smart phone or mobile device to read online
AuthorsEric M Masereka1
George M Ochieng2
Jacques Snyman1
Affiliations1Department of Civil Engineering Tshwane University of Technology South Africa
2Department of Civil Engineering Vaal University of Technology South Africa
Corresponding authorEric Masereka maserekamaategmailcom
DatesReceived 28 May 2017Accepted 01 Aug 2017Published 26 Mar 2018
How to cite this articleMasereka EM Ochieng GM amp Snyman J 2018 lsquoStatistical analysis of annual maximum daily rainfall for Nelspruit and its environsrsquo Jagravembaacute Journal of Disaster Risk Studies 10(1) a499 httpsdoiorg104102jambav10i1499
Copyrightcopy 2018 The Authors Licensee AOSIS This work is licensed under the Creative Commons Attribution License
IntroductionExtreme high annual maximum daily rainfall (AMDR) events are among environmental events that have caused the most disastrous consequences for human society (Kysely Picek amp Huth 2006) Flood hazards caused by high extreme rainfall events have resulted in flood disasters that have accounted for 47 of all weather-related disasters affecting 23 billion people worldwide (Wahlstrom amp Guha-Sair 2015) Death tolls because of floods have also risen in many parts of the world In 2007 floods killed 3300 people in India and Bangladesh alone in 2010 floods killed 2100 people in Pakistan and 1900 people in China whereas in 2013 6500 people died because of floods in India (Wahlstrom amp Guha-Sair 2015) These flood events have been attributed to effects of human-induced climate change (Komi Amisigo amp Diekkriiger 2016) In order to formulate and develop strategies to manage and reduce flood disaster risk it is necessary to carry out statistical analysis of the AMDR events that cause these flood disasters
Occurrences of floods in Nelspruit and its environs because of extreme high AMDR events have been documented On 29 January 1974 heavy rains of 1126 mm in 24 h caused floods that destroyed property in Nelspruit and its environs (SAWS 1994) On 29 January 1984 heavy rains of 1105 mm in 24 h caused floods in which four lives were lost and several agricultural dams were destroyed (Kovacs et al 1984) On 08 February 1985 1260 mm of rain in 24 h caused damage to roads and bridges in Nelspruit and its environs (SAWS 1985) The heavy rains and storms of 1062 mm on 06 February 2000 followed by 1028 mm on 07 February 2000 caused a lot of damage It was estimated that 1240 km of paved roads 1306 km of gravel roads 120 km of farm roads and 84 bridges were damaged Also these floods destroyed 16 large dams and 96 small farm dams (Smithers et al 2000) On 18 January 2012 heavy rains of 1090 mm caused floods and extensive damage in Nelspruit and its environs (News24 2012) On 11 March 2014 heavy rains of 1073 mm in 24 h which was followed by 1048 mm of rain of the previous 24 h caused the death of 11 people in Nelspruit and its environs (News24 2014)
The areas that have been affected by flood hazards are mainly in the river courses and more so in the flood zones Bridges water pumping stations farm roads and irrigation systems are among the infrastructures that are frequently affected by flood hazards
Despite the frequent extreme high AMDR events that have been causing floods resulting in loss of human lives and property limited research has been carried out on the frequency and magnitude
Nelspruit and its environs frequently experience extreme high annual maximum daily rainfall (AMDR) events resulting in flood hazards These flood hazards have caused flood disasters that have resulted in loss of property and lives The main objective of this study was to carry out statistical analysis of extreme high AMDR events that have caused flood hazards which in turn have caused flood disasters in Nelspruit and its environs Empirical continuous probability distribution functions (ECPDF) and theoretical continuous probability distribution functions (TCPDF) were applied to carry out the statistical analysis of the extreme high AMDR events Annual maximum daily rainfall event of magnitude 100 mm was identified as a threshold Events gt 100 mm were considered as extreme high events resulting in flood disasters The results of empirical frequency analysis showed that the return period of flood disasters was 10 years The occurrence probability of flood disaster event at least once in 1 2 3 4 and 5 years was 010 019 027 034 and 041 respectively Generalised logistic PDF was identified as the best-fit theoretical PDF for statistical analysis of the extreme high AMDR events in Nelspruit and its environs The results of this study contributed to the understanding of frequency and magnitude of extreme high AMDR events that could lead to flood disasters The results could be applied in developing flood disaster management strategies in Nelspruit and its environs
Statistical analysis of annual maximum daily rainfall for Nelspruit and its environs
Read onlineScan this QR code with your smart phone or mobile device to read online
Page 2 of 10 Original Research
httpwwwjambaorgza Open Access
of extreme high AMDR events in Nelspruit and its environs (SAWS 2014)
Approaches to reduce flood disaster risk caused by extreme high AMDR include flood disaster mitigation early warning systems disaster preparedness recovery and support livelihood (Komi et al 2016) Of these approaches flood mitigation plays a pivotal role Mitigation of flood disaster can be carried out in two methods namely engineering method to control floods and regulatory method designed to decrease flood vulnerability (Komi et al 2016) The engineering method includes construction of structures like channel modifications retention walls levees and dikes The regulatory method includes flood plain zoning and building construction codes Results of statistical analysis of high extreme AMDR events are necessary to develop and formulate methods and strategies for flood disaster reduction and mitigation
The aim of this study was to carry out statistical analysis of extreme high AMDR events which cause flood hazards that result in flood disasters in Nelspruit and its environs The other objective of the study was the identification of the theoretical probability distribution function(s) (PDF) that best describe these extreme high AMDR events which cause flood hazards that result in flood disasters in Nelspruit and its environs
The initial studies of rainfall events that caused flood disasters in Nelspruit and environs were concentrated on atmospheric mechanisms that resulted in these heavy rainfall events Simpson (1996) studied cumulus clouds and the associated larger mesoscale systems that produced heavy storms in and around Nelspruit Schulze (1972) from his studies concluded that there was a high incidence of hail and thunder in North Eastern region of South Africa Kelbe (1984) studied cumulus cloud characteristics and observed that most of the severe storms occurred in the early summer months in the radius of 50 km around Nelspruit Studies on variability and probability of rainfall in relation to coefficients of variation of monthly and annual rainfall series at Nelspruit have been carried out Green (1969) came to a conclusion that the Type 111 model which had two independent parameters q and p was widely applicable in describing probability of monthly rainfall series Recently Mackellar New and Jack (2014) in the study of observed and modelled trends in rainfall and temperature for South Africa for the period of 1960ndash2010 reported that a cluster of rainfall stations in the Lowveld in Mpumalanga showed increase in precipitation None of the cited studies were focused on the frequency and magnitude analysis of extreme high AMDR events which caused flood hazards that resulted in flood disasters in Nelspruit and its environs This study was therefore carried out to fill the gap of frequency and magnitude analysis of AMDR events which cause flood hazards that result in flood disasters in Nelspruit and its environs which was the focus of this study
The steps of statistical analysis of hydrometeorological events involve selecting PDF to describe the phenomenon
of interest estimating parameters of that function and thus obtaining the risk estimates of satisfactory accuracy for the problem at hand (Stedinger Vogel amp Batchelder 2001) Several PDFs have been selected and applied for frequency analysis of rainfall events In United States of America (USA) Naghavi and Yu (1995) applied generalised extreme value (GEV) distribution function and found it suitable for frequency and magnitude analysis of AMDR events in Louisiana State Daud et al (2002) identified GEV as the best-fit PDF for frequency analysis of AMDR events in Malaysia Park et al (2010) also identified GEV as the best-fit PDF for frequency analysis of AMDR events in South Korea However other PDFs have also been identified as best-fit PDFs for frequency analysis of AMDR events Olumide Saidu and Oluwasesan (2013) in the study of frequency analysis of rainfall events at Tagwai Dam in Nigeria identified normal and Log-Gumbel PDFs as the best-fit PDFs for frequency analysis of the AMDR events Goula Bi et al (2010) identified and applied Gumbel and log normal PDFs for frequency analysis of AMDR events at 43 rainfall stations in Cot de Ivoire Mason et al (1999) identified Beta-K and Beta-P distributions as the best-fit PDFs for frequency analysis of AMDR events in South Africa Du Plessis and Burger (2015) identified GEV as the best-fit distribution function to analyse the frequency of short-duration rainfall intensities in Western Cape Province in South Africa In the study of cumulus cloud characteristics of the Eastern Transvaal Lowveld rainfall events of 100 mm or more in 24 h were identified as the events that resulted in floods in Nelspruit and its environs (Kelbe 1984) In this study AMDR event of magnitude of 100 mm was adopted as a threshold AMDR events of greater than 100 mm were considered as events which cause flood hazards resulting in flood disasters Also in this study a method based on ranking of statistics of chi-squared (CS) KolmogorovndashSmirnov (KS) and AndersonndashDarling (A2) goodness-of-fit tests developed by Masereka et al (2015) were applied to selected candidate and best-fit PDF for the analysis of magnitude and frequency of the AMDR events in Nelspruit and its environs
Materials and methodsLocation and climateNelspruit is located 330 km east of Pretoria in Crocodile River catchment (Figure 1) Crocodile River catchment is part of Incomati catchment (Figure 2) Its geographical coordinates are 25deg27primeS and 30deg58primeE Its altitude is 667 m asl Nelspruit normally receives about 667 mm of rain per year with most rainfall occurring in months of December January February and March On average it receives the lowest rainfall (2 mm) in June and the highest rainfall (119 mm) in December The monthly distribution of average daily maximum temperatures shows that the average midday temperatures for Nelspruit range from 214 degC in June to 279 degC in January The region is the coldest during July when the temperature drops to 62 degC on average during the night Maps of Crocodile River catchment and Incomati catchment are shown in Figures 1 and 2
Page 3 of 10 Original Research
httpwwwjambaorgza Open Access
0 5 10 20 30 40 Km
NIncoma catchment
Crocodile catchment
Country borders
Towns and cities
Primary rivers
Secondary RiversLatude and Longitude
Legend
Source DWS Nelspruit Office 2017 The Inkomati catchment management strategy viewed 12 February 2017 from httpwwwdwafgovzaIOCMAInkomatiInkomatiCMASQReportMar08fullpdf
FIGURE 1 Drainage system of Incomati catchment showing the position of Nelspruit and its environs
Legend
N
0 5 10 20 30 40 Km
Towns and Cities
Primary rivers
Secondary rivers
Latude and longitude
Dams and lakes
Crocodile catchment
Source DWS Nelspruit Office 2017 The Inkomati catchment management strategy viewed 12 February 2017 from httpwwwdwafgovzaIOCMAInkomatiInkomatiCMASQReportMar08fullpdf
FIGURE 2 The Crocodile River catchment showing Nelspruit and its environs
Page 4 of 10 Original Research
httpwwwjambaorgza Open Access
DataThe daily rainfall (mm) data for the years 1961ndash2015 for Nelspruit were obtained from WR 90 and WR 2005 studies which were carried out by Water Research Council (WRC) (Middleton amp Bailey 2005) In these studies the methods of ensuring and improving quality of daily rainfall data including data used in this study were outlined (Middleton amp Bailey 2005) From the daily rainfall data of each year the largest annual daily rainfall event was extracted The extracted largest annual daily rainfall events for the years 1961ndash2015 formed the AMDR events The AMDR events for the period 1961ndash2015 are presented in Table 1
MethodologyEmpirical frequency analysisEmpirical continuous probability distribution function (ECPDF) was applied to determine the return periods of the AMDR events for Nelspruit and its environs for the period 1961ndash2015 The probability of exceedances ( p) of the AMDR events was determined by the rank-order method This method involved ordering the events from the largest event to the smallest event Rank 1 was assigned to the largest event and rank 55 to the smallest event The data sample size was 55 events
To obtain p of each event Weibull formula (Weibull 1939) was applied
i n 1= +p [Eqn 1]
p is the exceedance probability for an event with rank i i is the rank of the event n is the sample size that was equal to 55 in this case The return period (T) of each event is defined as the inverse of its exceedance probability (Weibull 1939)
1=T p [Eqn 2]
The empirical return period of each AMDR event was determined by applying equation 2
Flood disaster risk analysisThe AMDR events ge 100 mm were identified as the events that caused flood hazards resulting in flood disasters in Nelspruit and its environs (Kelbe 1984) AMDR event of magnitude 100 mm was adopted as threshold AMDR events of magnitude 100 mm or ge 100 mm were taken as flood causing events therefore flood disaster events Based on this adoption the model for flood disaster risk analysis (exceedance probability of event X being equal to or greater than threshold xT at least once in N years) was developed as demonstrated below
Letting xT be the threshold of AMDR variable The exceedance probability ( p) of X being equal to or greater than xT at least once in N years of record was formulated as
( )= gep P X xT [Eqn 3]
1( ) ( )= lt = minusP p X x pT [Eqn 4]
TABLE 1 Annual maximum daily rainfall (mm) events for Nelspruit (1961ndash2015)Year Rainfall (mm)
1961 88401962 36801963 0001964 56501965 56201966 65101967 72201968 57601969 57001970 37701971 67201972 75601973 0001974 112601975 58001976 72401977 40601978 60501979 57001980 77001981 59401982 55301983 78001984 110501985 126001986 49501987 64701988 73201989 43501990 57701991 83501992 48001993 24501994 46801995 47401996 81401997 46001998 56001999 74802000 106202001 34602002 52202003 37102004 44202005 67002006 89202007 64502008 55602009 100302010 57902011 68802012 102402013 79002014 97302015 3780
Page 5 of 10 Original Research
httpwwwjambaorgza Open Access
P X x at least once in N years P X x all N yearsT T( ) ( )ge = minus lt 1
[Eqn 5]
P X x at least once in N years pTT
NN
( ) ( )ge = minus minus = minus minus
1 1 1 1 1
[Eqn 6]
Equation 6 was applied to determine the occurrence probability of flood disaster risk associated with AMDR events of magnitude ge 100 mm at least once in 1 2 3 4 and 5 years
Stochastic frequency analysisTheoretical continuous probability distribution functions (TCPDFs) were applied to estimate quantiles of AMDR events of return periods up to 50 years The estimation of the quantiles was carried out by first identifying the TCPDFs which adequately fitted the AMDR events Masereka et al (2015) have developed a methodology to identify candidate and best-fit TCPDFs for frequency analysis of hydrometeorological events This methodology was adopted to identify candidate and best-fit TCPDFs for frequency analysis of the AMDR events The identified candidate TCPDFs were subjected to three goodness-of-fit tests namely CS KolmogorovndashSmirnov (KS) and AndersonndashDarling (AD) to identify the best-fit TCPDF
Description of the goodness-of-fit testsThree goodness-of-fit tests which were applied to identify the best-fit TCPDF from the candidate TCPDFs are described below
Chi-square (x2) testChi-square (x2) is a goodness-of-fit test that compares how well the TCPDF fits the ECPDF The chi-square statistic is defined as (Olofintoye Sule amp Salami 2009)
x O EE
i i
ii
ksum= minus=
( )2 2
1 [Eqn 7]
where x2 is the test statistic Ol is the observed frequency in each category and El is the expected (theoretical) frequency in the corresponding category calculated by
2 1( ) ( )= minusE F x F xl [Eqn 8]
where F is the cumulative distribution function (CDF) of TCPDF being tested and x1 and x2 are the lower and upper limits of category i where i runs from 1 hellip hellip hellip k and k is the number of cells
KolmogorovndashSmirnov testThe KolmogorovndashSmirnov (KS) test is a non-parametric test applied to test whether the sample under consideration is
from a reference or hypothesised distribution or to compare whether two samples come from identical distribution (Kottegoda amp Rosso 1998) The KS test statistics are calculated from the largest vertical difference in absolute value between the theoretical value and the empirical cumulative distribution functions
By definition if a random sample x1 x2 hellip hellip hellip xn is from the same distribution with CDF F(x1) then KS test statistic D = max (D+ D-) where
max 1( )= minus
+D in
F x [Eqn 9]
and
max 11( )= minus minus
minusD F x in
[Eqn 10]
AndersonndashDarling testAndersonndashDarling (A2) is a goodness-of-fit test in which the fitting of an observed continuous PDF (sample) to an expected continuous PDF (parent) is carried out
The test statistic A2 is defined as (Mzezewa Misi amp Van Rensburg 2010)
A n in
i ln F x F xi
n
n isum ( )( ) ( ) ( )= minus minus minus + minus
=
minus +2 1 ln 12
11 1 [Eqn 11]
where n is the number of events in the sample
Identification of candidate theoretical continuous probability distribution functionsFrom the AMDR data probabilityndashprobability(PndashP) plots were constructed and applied to visually identify the candidate TCPDFs for analysis of magnitude and frequency of AMDR events The application of PndashP plots involved plotting ECPDF values against TCPDF values of 50 continuous and discrete PDFs supported by EasyFit software (Mathwave 2015) The three TCPDF curves closest to the diagonal of the plots were selected as the candidate TCPDFs (Mathwave 2015)
Quantilendashquantile (QndashQ) plots were applied to confirm the identified candidate TCPDFs The application of QndashQ plot involved plotting the AMDR data Xi (i = 1 hellip 55) against the X-axis and the corresponding values against the Y- axis F-1(Fn (X i) ndash 05n) where F-1(X) is the inverse cumulative TCPDF and Fn (X) is the ECPDF The proximity of the TCPDF plots to the displayed diagonal in EasyFit graph indicated the confirmation of the candidate TCPDFs (Mathwave 2015)
The best-fit theoretical continuous probability distribution functionBased on the test statistics X 2 KS and A2 of each candidate TCPDF the candidate TCPDFs were ranked The candidate
Page 6 of 10 Original Research
httpwwwjambaorgza Open Access
TCPDF with the lowest test statistic was ranked 1 and the candidate TCPDF with the largest test statistic was ranked 3 The total number of identified candidate TCPDF was 3 The candidate TCPDF with the least sum of ranks from the three goodness-of-fit was considered to be the best-fit TCPDF for the analysis of magnitude and frequency of the AMDR events
Quantile functionThe parameters of the identified best-fit TCPDF were estimated using maximum likelihood method using EasyFit 55 software (Mathwave 20157) Based on the PDF of the identified best-fit TCPDF the estimated parameters were applied to develop quantile function (QF) (Mathwave 2015) The developed QF was applied to estimate quantiles of AMDR of return periods of 2 3 4 5 10 15 20 25 and 50 years
To determine how well the developed QF fitted the AMDR events a probability difference (PndashD) plot was constructed PndashD plot is a plot of the difference between the ECPDF and the TCPDF (Mathwave 2015)
Diff x ( ) ( ) ( )= minusF X F Xn [Eqn 12]
where Fn (X ) was the ECPDF and F (X ) was the identified best-fit TCPDF which was generalised logistic (GL)
Confidence intervals of estimated quantilesThe model (equation 13) proposed by Stedinger Vogel and Foufoula-Georgiou (1993) to estimate 95 confidence intervals of quantiles estimated by the application of GL distribution function was applied to determine the confidence intervals of estimated quantiles of return periods of 2 3 4 10 15 20 25 and 50 years
( 2
2
)minus minus prop + minus propand and and andx Z x x Z xT I T T I T [Eqn 13]
where 2minus propZI is the upper 100 (prop2) percentile of the
normal distribution x Tand is the estimated quantile of return
period (T)
Results and discussionsDescriptive statistics of annual maximum daily rainfall eventsThe descriptive statistics of AMDR events of Nelspruit for the period 1961ndash2015 are presented in Table 2
The mean of AMDR events was 6274 mm The median was 5800 mm The Skewness of the AMDR events was positive
(009) indicating that the TCPDF of AMDR events had the tail that was on the right This tail was longer or taller than on the left These figures indicated that the AMDR events were not normally distributed
The plotting positions and return periodsEquation 2 expresses the relationship between plotting positions of AMDR events and the corresponding empirical return periods that are presented in Table 2 The empirical return period of 100 mm AMDR event that has been adopted in this study as a threshold is 917 years (Table 3) Results of several studies have also shown that the return period of flood hazards that result in flood disasters in Nelspruit and its environs is 10 years (Kelbe 1984)
Flood disaster risk analysis resultsIn this study the AMDR event of magnitude 100 mm was taken as threshold (xT) as indicated in sections above AMDR events equal to or greater than xT were considered as flood disaster events Taking xT = 100 mm from the sample data in this study (Table 3) the number of occurrence of events xT ge 100 mm was 6 and the number of intervals was 5 Therefore the empirical return period of event XT was 10 years (555 = 10 years)
The exceedance probability of flood disaster event (AMDR event X ge 100 mm) at least once in 1 2 3 4 and 5 years calculated by applying equation 6 is presented in Table 4
The exceedance probability of flood disaster event (ge 100 mm) occurring at least once in 5 years is 041 The results are important for decision-making on the acceptable level of risk because of flooding that should be associated with designing specific to infrastructure for the reduction of the risk of flood in Nelspruit and environs
Candidate theoretical continuous probability distribution functionsApplying PndashP and QndashQ plots GL GEV and Gumbel maximum (GM) were identified as the candidate TCPDFs for frequency analysis of the AMDR events by visual identification method The developed plots are presented in Figures 3 and 4
The PndashP plot (Figure 3) showed that GL GEV and GM distribution functions were closest to the plot diagonal This indicated that the GL GEV and GM were the candidate functions for frequency analysis of the AMDR events (Mathwave 2015) However it was not possible to identify the best-fit TCPDF for describing the AMDR events The QndashQ plot (Figure 4) showed that GL GEV and GM distribution functions
TABLE 2 Descriptive statistics of maximum annual daily rainfall (1961ndash2015)Statistic value Sample Range Mean Variance Standard deviation Coefficient of variation Standard error Skewness Excess kurtosis
V 55 126 6274 61187 2474 039 333 009 087
Page 7 of 10 Original Research
httpwwwjambaorgza Open Access
but overestimated by GM The diagonal line of the QndashQ plot was the reference If a distribution function curve lays on the diagonal this indicates that the function accurately estimates the quantiles (Mathwave 2015)
Best-fit theoretical continuous probability distribution functionThe results of identifying the best-fit PDF for frequency analysis of the AMDR events for Nelspruit and environs are presented in Table 5
The rankings of the candidate TCPDFs as the best-fit TCPDFs for the frequency analysis of AMDR events based on statistics of the three goodness-of-fit tests are presented in Table 5 The candidate TCPDF with the least sum of the rankings was GL distribution GL distribution was therefore identified as the best-fit TCPDF because it had the lowest sum of rankings
TABLE 3 Plotting positions and return periodsR X (mm) Pi T (years)
1 12600 002 55002 11260 004 27503 11050 005 18334 10620 007 13755 10240 090 11006 10030 011 9177 8920 013 7868 8840 015 6889 8350 016 61110 8140 018 55011 7930 020 50012 7900 022 45813 7800 024 42314 7700 025 39315 7560 027 36716 7480 029 34417 7320 031 32418 7240 033 30619 7220 035 28920 6880 036 27521 6720 038 26222 6700 040 25023 6510 042 23924 6470 044 22925 6450 045 22026 6050 047 21227 5940 049 20428 5800 051 19629 5790 053 19030 5770 055 18331 5760 056 17732 5706 058 17233 5700 060 16734 5650 062 16235 5620 064 15736 5600 065 15337 5560 067 14938 5530 069 14539 5220 071 14140 4950 073 13841 4800 075 13442 4740 076 13143 4680 078 12844 4600 080 12545 4420 082 12246 4350 084 12047 4060 085 11748 3780 087 11549 3770 089 11250 3710 091 11051 3680 093 10852 3460 095 10653 2450 096 10454 000 098 10254 000 098 102
TABLE 4 Exceedance probability of flood disaster event (X ge 100 mm)Year 1 2 3 4 5
P (gt 100) 010 019 027 034 041
underestimated AMDR quantiles of magnitudes lt 40 mm The three functions accurately estimated AMDR quantiles of magnitudes of the range 40 mm ndash 95 mm Between 95 mm and 110 mm all the three models overestimated the quantiles Quantiles gt 110 mm were underestimated by GL and GEV
P (Empirical)
1009080706050403020 100
P (M
odel
)
10
09
08
07
06
05
04
03
02
01
00
Gen extreme value
Gen logisc
Gumbel max
FIGURE 3 Probabilityndashprobability plot of annual maximum daily rainfall events for Nelspruit (1961ndash2015)
x
1201101009080706050403020100
Qua
nle
(Mod
el)
120110100
908070605040302010
0
Gen extreme value
Gen logisc
Gumbel max
FIGURE 4 Quantilendashquantile plot of annual maximum daily rainfall events for Nelspruit (1961ndash2015)
Page 8 of 10 Original Research
httpwwwjambaorgza Open Access
Generalised logistic probability distribution functionGeneralised logistic PDF is defined by the QF as (Shin et al 2011)
( )= sum + αβ
minus minus
minusβ1 1X TT [Eqn 14]
α is the scale parameter β is the shape parameter Σ is the location parameter
The parameters Σ α and β were estimated by applying the method of maximum likelihood (ML) in Mathwave software (Mathwave 2015) These parameters are shown in Table 6
The specific QF of GL probability function for estimating AMDR events for Nelspruit and environs was developed based on the parameters in Table 6 as indicated in Equation 15
( )= + minus minus
minus6161 27160 1 1
005X TT [Eqn 15]
Equation 15 was applied to estimate quantiles of return periods 2 3 4 5 10 15 20 25 and 50 years The estimated quantiles are presented in Table 7
The estimated quantiles of the AMDR events of return periods between 2 and 50 years which were obtained by applying equation 15 are presented in Table 7 The comparison of results of magnitude analysis of the AMDR events based on ECPDFs and TCPDFs (Table 7) shows that GL PDF fairly accurately estimates the AMDR events of magnitudes 6161 mm ndash 10151 mm The performance of GL PDF in estimating magnitudes of AMDR events is further demonstrated by the QndashQ plot results The QndashQ plot based on GL PDF is presented in Figure 5
The GL PDF was identified as the best-fit TCPDF in this study (Table 5) It should be noted that GL PDF accurately estimated the annual maximum daily rainfall events of range 40 mm ndash 90 mm (Figure 5) This range corresponds to quantiles of return period range 138ndash786 years (Table 1 Figure 5) GL PDF overestimated AMDR events of range 90 mm ndash 112 mm (Figure 5) This range corresponds to quantiles of return period range 917ndash2750 years (Table 1 Figure 5) GL PDF under estimated the annual maximum daily rainfall events which were gt 112 mm (Figure 5) These results demonstrate the fact that even the magnitude estimates obtained from the identified best-fit TCPDF should be used in infrastructure design with caution
PndashD plot resultsThe results of probability difference (PndashD) plot between ECPDF (based on the sample) and GL PDF are presented in Figure 6
The PndashD plot (Figure 6) showed that the probability difference between the AMDR events (the sample) and the quantiles estimated by GL gt 100 mm is lt 003 (3) This showed that GL estimated the quantiles gt 100 mm fairly accurately
Confidence intervalsThe 95 confidence interval of the estimated quantiles is presented in Table 8
TABLE 5 Best-fit distributionTCPDF KolmogorovndashSmirnov AndersonndashDarling Chi-squared Rank sum
Statistic Rank Statistic Rank Statistic Rank
Generalised extreme value (GEV) 009125 2 056426 2 46075 3 7Generalised logistic (GL) 007556 1 031126 1 30771 1 3Gumbel max (GM) 012881 3 118240 3 33621 2 8
TCPDF Theoretical continuous probability distribution functions
TABLE 6 Estimated parametersDistribution Parameters
Generalised logistic β = 005 α =1358 sum = 6161
TABLE 7 Quantilendashreturn periodRT(YRS) 2 3 4 5 10 15 20 25 50
XT (mm) 6161 7086 7613 7980 8987 9519 9879 10151 10964
x1201101009080706050403020100
Qua
nle
(Mod
el)
120110100
908070605040302010
0
Gen logistic
FIGURE 5 Quantilendashquantile plot of the annual maximum daily rainfall events for Nelspruit (1961ndash2015)
x1201101009080706050403020100
Prob
abili
ty d
iffer
ence
016
012
008
004
000
-004
-008
-012
-016
Gen logistic
FIGURE 6 Probabilityndashdifference plot between empirical continuous probability distribution function and generalised logistic probability distribution function for annual maximum daily rainfall events for Nelspruit (1961ndash2015)
Page 9 of 10 Original Research
httpwwwjambaorgza Open Access
From the confidence intervals the relative size of uncertainty at different return periods and the importance of different sources of uncertainty could be determined (Kjeldsen amp Jones 2004) However this was not part of this study
Discussions of the resultsIdentification of the thresholdFrom the literature AMDR events of magnitude 100 mm or greater led to flood hazards which resulted in flood disasters in Nelspruit and its environs Records of flood disasters from 1974 to 2014 cited in this article indicated that flood hazards which resulted in flood disasters in that period were caused by AMDR events of magnitudes ge 100 mm The AMDR event of magnitude 100 mm was adopted as a threshold The AMDR events of magnitude ge 100 mm were assumed to be flood disaster events
Return period based on empirical distribution function and plotting point methodFrom the empirical distribution function frequency analysis the return period of 100 mm AMDR event was 10 years The return period of 100 mm AMDR event was 917 years according to plotting point applying Weibull (1939) method (Table 3) The estimate of the return periods from the two methods was in agreement The results indicated that if the design return period of a hydraulic infrastructure being designed is less or equal to data record period estimation of quantiles by empirical distribution function or plotting point methods is recommendable
Best-fit theoretical continuous probability distribution functionGeneralised logistic probability distribution function was identified as the best-fit function for frequency analysis of AMDR events in Nelspruit and environs In other studies elsewhere different TCPDFs have been identified as the best-fit TCPDFs for frequency analysis of AMDR events In USA GEV was identified as the best-fit PDF for frequency analysis of AMDR events (Bonnin et al 2006 Naghavi amp Yu 1995) In Malaysia Daud et al (2002) identified Log-Gumbel as the best-fit function for frequency analysis of AMDR events In Cote de Ivoire Goula Bi et al (2010) identified Gumbel and Lognormal functions as the best-fit TCPDFs for frequency analysis of AMDR events in Cote de Ivoire and Smithers and Schulze (2001) proposed Log Pearson 3 function as the best-fit PDF for AMDR events in South Africa
The performance of GL TCPDF was assessed by applying QndashQ and PndashD plots (Figures 4 and 5) Both plots affirmed that
the performance of GL was satisfactory However there seem to be no universally accepted TCPDF for frequency analysis of AMDR events Therefore it is advisable to carry out best-fit TCPDF identification study first for designing any hydro meteorological infrastructure projects in specific regions or sites rather than just adopting any TCPDF
Practical implicationThe results of the study are applicable in flood hazard mapping The results can also be applied in formulating mitigation of flood hazard in two ways An engineering approach in designing flood control structures for example designing and planning storm water and flood management and control infrastructure like urban drainage systems culverts and bridges Regulatory approach designed to reduce vulnerability for example flood plain zoning The results of the study can also be applied in formulating methods of flood disaster risk reduction which include among others among others disaster preparedness
LimitationsThe main limitation of the study was the short period of record of daily rainfall events data from which the AMDR events were extracted The record was only 55 years Length of record data affects the performance of empirical distribution function to estimate return period of magnitudes and therefore the associated risks The performance is poor with short records Deciding on the magnitude of AMDR events as a threshold for frequency analysis was another limitation
RecommendationsFurther studies on the topics below are recommended
bull Hydrological deterministic studies should be carried out to determine the critical magnitude of AMDR events which result in flood disaster The magnitude of 100 mm applied in this study was adopted from literature
bull Further studies are recommended for determining the best-fit PDF for analysis of frequency and magnitude of AMDR events The goodness-of-fit method applied in this study should be tested with data from other catchments
bull A study on the effect of climate change on magnitude and frequency of AMDR events should be carried out
ConclusionThe main objective of this study was to carry out statistical analysis of AMDR events for Nelspruit and its environs
TABLE 8 Confidence intervals of estimated quantilesReturn period T (years) 2 3 4 5 10 15 20 25 50
x T and
Upper limit 6792 8214 9322 9689 12200 13589 13837 14353 15417
x T and 6161 7086 7686 7980 8987 9519 9879 10151 10964
x T and
Lower limit5530 5602 5791 5801 6391 6451 6523 6641 6732
Page 10 of 10 Original Research
httpwwwjambaorgza Open Access
From literature AMDR events of magnitude 100 mm or more were identified as events that cause flood hazards resulting in flood disasters in Nelspruit and its environs From the study the return period of AMDR event of magnitude 100 mm in Nelspruit and its environs was 10 years The occurrence probability of AMDR events of magnitude 100 mm or more at least once was 001 019 027 034 and 041 in 1 2 3 4 and 5 years respectively These results can be applied in developing systems that can be applied in disaster risk reduction in Nelspruit and its environs
From the study GL GEV and GM theoretical PDFs were identified as the suitable candidate TCPDFs for frequency analysis of maximum annual daily rainfall events of Nelspruit and its environs From the three candidate TCPDFs GL was identified as the best-fit TCPDF for frequency and magnitude analysis of AMDR events in Nelspruit and environs The performance of GL as the best-fit PDF for frequency analysis of AMDR events was evaluated by the use of QndashQ and DndashP plots The performance was found to be satisfactory It was therefore concluded that GL PDF is suitable for frequency analysis of AMDR events for Nelspruit and its environs
AcknowledgementsThe study was funded by the Department of Agriculture Mpumalanga Province The data were accessed from the work performed for WRC Supervision of the study was performed by Prof GM Ochieng of Vaal University of Technology and Prof J Synman of Tshwane University of Technology
Competing interestsThe authors declare that they have no financial or personal relationships that may have inappropriately influenced them in writing this article
Authorsrsquo contributionsEMM carried out the research GMO and JS supervised the research
ReferencesBonnin GM Martin D Lin B Parzybok T Yekta M amp Riley D 2006 Precipitation
frequency Atlas of the United States NOAA Atlas 14 vol 3 version 40 Puerto Rico and the US Virgin Islands viewed 06 May 2017 from httpwwwnwsnoaagov
Daud ZM Kassim AHM Desa MNM amp Nguyen VTV 2002 lsquoStatistical analysis of at-site extreme rainfall processes in peninsular Malaysiarsquo International Association of Hydrological Sciences Publication 274 61ndash68 httpsdoiorg105923cjce20140238
Du Plessis JA amp Burger GJ 2015 Investigation into increasing short-duration rainfall intensities in South Africa viewed 15 May 2017 from httpwwwwrcorgzapagesdefaultaspx
DWS Nelspruit Office 2017 The Inkomati catchment management strategy viewed 12 February 2017 from wwwdwagovza01InkomatiCMASQReport Mar08fullpdf
Goula Bi TA Soro GE Dao A Kouassi FW amp Srohourou B 2010 lsquoFrequency analysis and new cartography of extremes daily rainfall events in Cocircte drsquoIvoirersquo Journal of Applied Sciences 10 1684ndash1694 httpsdoiorg103923jas2010 16841694
Green GC 1969 lsquoVariability and probability of rainfall in relation to coefficients of variation of rainfall seriesrsquo Agrochemophysica 1 1ndash8
Kelbe B 1984 lsquoCumulus clouds characteristics of Eastern Transvaal Lowveldrsquo Water SA 10(2) 81ndash93 viewed 20 February 2017 from httpwwwacadamiaedu1801540
Kjeldsen TR amp Jones DA 2004 lsquoSampling variance of flood quantiles from the generalized logistic distribution using the method of L-momentsrsquo Hydrology and Earth System Sciences 8(2) 183ndash190 viewed 16 May 2017 from httpwwwhydrol-earth-syst-scinet81832004
Komi K Amisigo BA amp Diekkriiger B 2012 lsquoIntegrated flood risk assessment of rural communities in the Oti River Basin West Africarsquo Hydrology 3(4) viewed 15 April 2017 from httpwwwmdpicomaboutopenaccess
Kottegoda NT amp Rosso R 1998 Statistics probability and reliability for civil and environmental engineers McGraw-Hill New York viewed 18 April 2017 from httpwwwpwutacirFAStaffS_MousaviKottegodapdf
Kovacs ZP Du Plessis DB Bracher PR Dunn P amp Mallory GCL 1984 Documentation of the 1984 Domoina Flood viewed 17 May 2017 from httpwwwdwagovzaiwgsreportstr_122_1984domoina_floodspdf
Kysely J Picek J amp Huth R 2006 lsquoFormation of homogenous regions for regional frequency analysis of extreme precipitation in the Czech Republicrsquo Studia Geophysica et Geodaetica 51 327ndash344
Mackellar N New M amp Jack C 2014 lsquoObserved and modelled trends in rainfall and temperature for South Africa 1960ndash2010rsquo South African Journal of Science 1ndash13 viewed 13 May 2017 from httpwwwsajscoza
Masereka EM Otieno FAO Ochieng GM amp Snyman J 2015 lsquoBest fit and selection of probability distribution models for frequency analysis of extreme mean annual rainfall eventsrsquo International Journal of Engineering Research and Development 11(4) 34ndash53
Mason SJ Waylen PR Mimmack GM Rajaratnam B amp Harrison MJ 1999 lsquoChanges in extreme rainfall events in South Africarsquo Climatic Change 41 249ndash257 httpsdoiorg101023A1005450924499
Mathwave 2015 Mathwave viewed 20 May 2017 from httpwwwmathwavecomdownloadshtml
Middleton B amp Bailey AD 2005 Water resources of South Africa 2005 study (WR 2005) ndash 2011 update viewed 21 May 2017 from httpwwwwrcorgza
Mzezewa J Misi T amp Van Rensburg LD 2010 lsquoCharacterisation of rainfall at a semi-arid cotype in the Limpopo province (South Africa) and its implications for sustainable crop productionrsquo Water SA 36(1) 19ndash26 viewed 17 April 2017 from httpwwwscieloorgzascielophp3Fpid3DS1816-79502010000100003
Naghavi B amp Yu FX 1995 lsquoRegional frequency analysis of extreme precipitation in Louisianarsquo Journal of Hydraulic Engineering 121(11) 819ndash827 viewed 12 May 2017 from httpwwwserialsuniboitcgi-serstartitspoglidf-stclprog_art=3177745
News24 2012 Mpumalanga Floods viewed 11 June 2017 from httpwwwnews24comSouthAfricaMpumalanga_Floods
News24 2014 Mpumalanga Floods viewed 11 June 2017 from httpwwwnews24comgreenMpumalanga_Floods
Olofintoye OO Sule BF amp Salami AW 2009 lsquoBestndashfit probability distribution model for peak daily rainfall of selected cities in Nigeriarsquo New York Science Journal 2(3) viewed 30 May 2017 from httpwwwsciencepubnetNewYork
Olumide B Saidu AM amp Oluwasesan A 2013 lsquoEvaluation of best fit probability distribution models for the prediction of rainfall and runoff volume (Case Study Tagwai Dam Minna-Nigeria)rsquo Engineering and Technology 3(2) 94ndash98 viewed 11 May 2017 from httpiet-journalsorgarchive2013feb_vol_3_no_2635221356337pdf
Park JS Kang HS Lee YS amp Kim MK 2010 lsquoChanges in the extreme rainfall in South Korearsquo International Journal of Climatology 31 2290ndash2299 httpsdoiorg101002joc2236
SAWS 1985 Flood reports viewed 21 May 2017 from httpwwwweathersacozafloods
SAWS 1994 Flood reports viewed 05 May 2017 from httpwwwweathersacozafloods
Schulze BR 1972 World survey of climatology Ed Landsberg pp 501ndash555 Elsevier Amsterdam
Shin H Jung Y Jeog C amp Heo JH 2011 Assessment of modified Anderson-Darling test statistics for generalised extreme value and generalised logistic distributions viewed 20 May 2017 https wwwresearchgatenetpublication225839062
Simpson J 1996 lsquoPrecipitation augmentation from cumulus clouds and systems Scientific and technology foundationrsquo Advances in Geophysics 19 1ndash8
Smithers JC amp Schulze RE 2001 lsquoA methodology for the estimation of short duration design storms in South Africa using a regional approach based on L-momentsrsquo Journal of Hydrology 42ndash52 viewed 09 May 2017 from httpwwwwrcorgzaKnowledge20Hub20Documents106020web
Smithers JC Schulze RE Pike A amp Jewitt GPW 2000 A hydrological perspective of the February 2000 floods (A case study in the Sabie River Catchment) viewed 13 May 2017 from wwwwrcorgzaKnowledge20Hub20DocumentsWaterSA_2001_03_1377pdf
Stedinger JR Vogel RM amp Batchelder R 2008 lsquoAppraisal of the generalized likelihood uncertainty estimation (GLUE) methodrsquo Water Resources Research 44 W00B06 httpsdoiorg1010292008WR006822
Stedinger JR Vogel RM amp Foufoula-Georgiou E 1993 Frequency analysis of extreme events viewed 16 May 2017 from httpwwwresearchgatenet
Wahlstrom M amp Guha-Sapir D 2015 UN- 1995ndash2015 flood report Cop21 WeatherDisasterReports_2014 viewed 19 May 2017 from httpwwwFloodlistcomdealing with floodsflood figures 1995-2015
Weibull W 1939 Statistical theory of strength of materials viewed 18 May 2017 from httpwwwscriporg
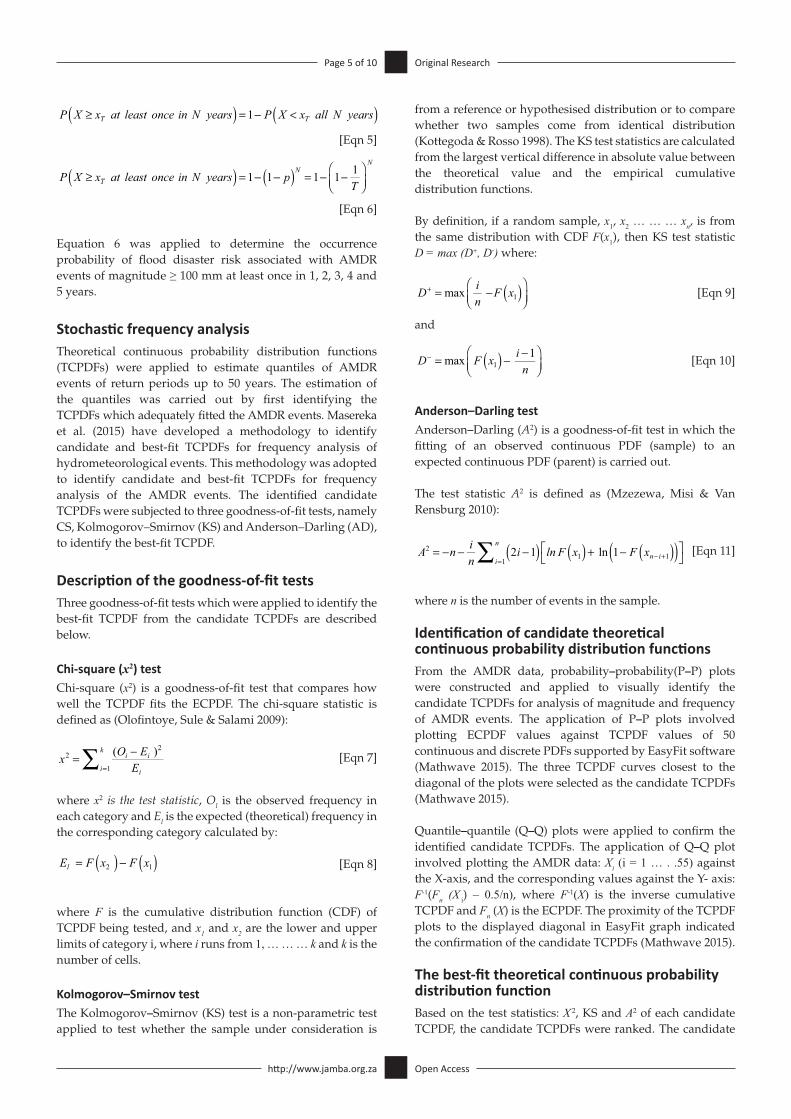
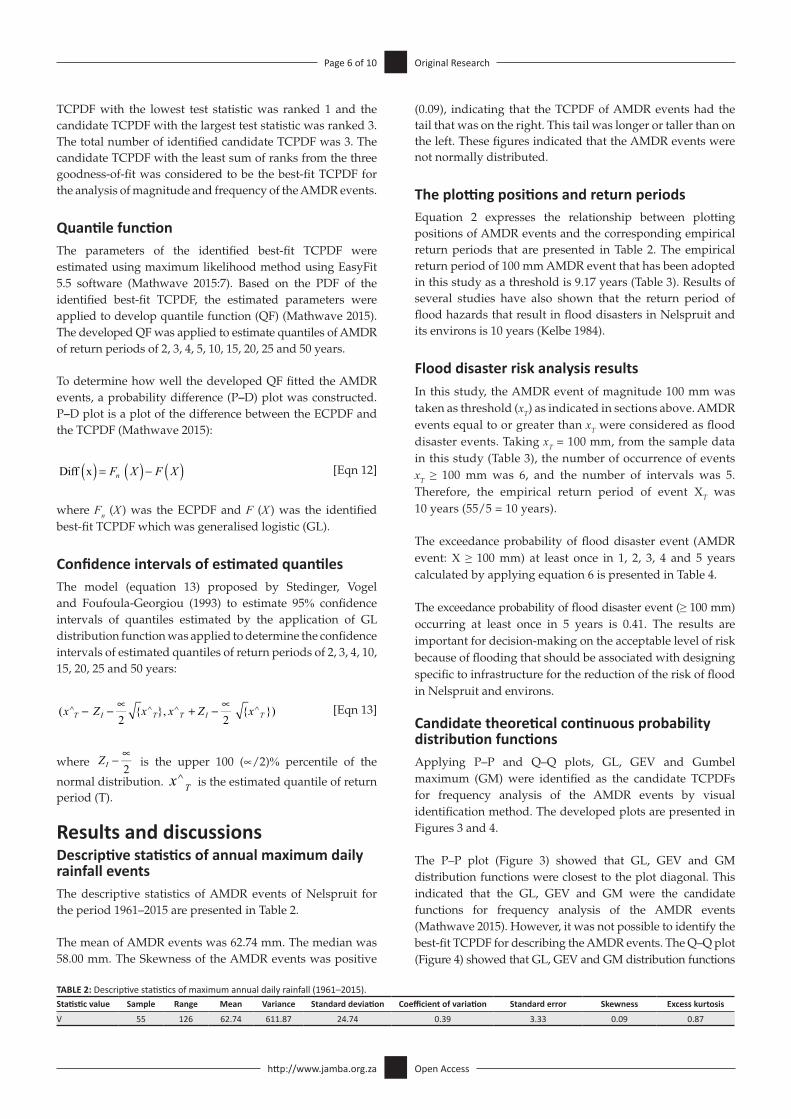
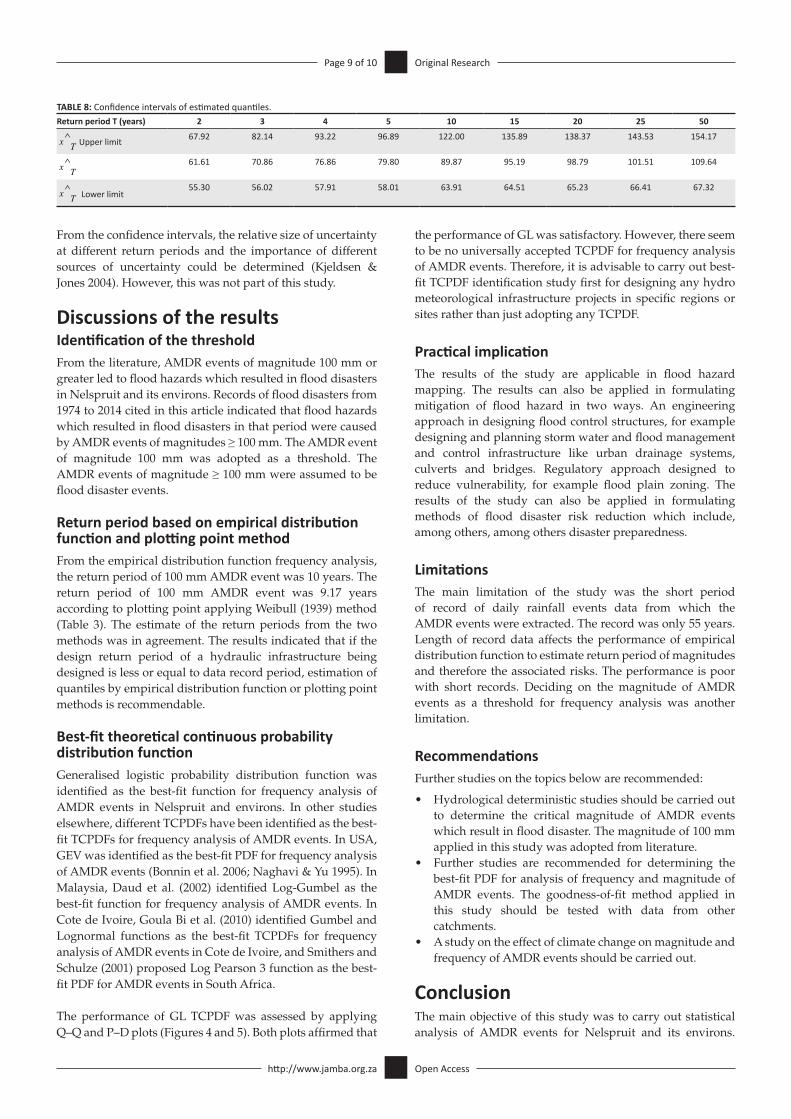
Related Documents


![Development of Rainfall Intensity Duration Frequency ... · The statistical analysis of daily as well as hourly rainfall data was carried out using Gumbel distribution . [13] [13]](https://static.cupdf.com/doc/110x72/5e06212655fa5837950da168/development-of-rainfall-intensity-duration-frequency-the-statistical-analysis.jpg)