Statistical analysis for exploring risk factors Kenichi Satoh (RIRBM) [email protected] http://home.hiroshima-u.ac.jp/ksatoh/ Statistical methods are useful to understand or summarize results of clinical trials etc… We will introduce you the exploring process of statistical data analysis.

Statistical analysis for exploring risk factorshome.hiroshima-u.ac.jp/.../Statisticalanalysis20170530.pdfStatistical analysis for exploring risk factors Kenichi Satoh (RIRBM) [email protected]
May 06, 2018
Welcome message from author
This document is posted to help you gain knowledge. Please leave a comment to let me know what you think about it! Share it to your friends and learn new things together.
Transcript

Statistical analysisfor exploring risk factors
Kenichi Satoh (RIRBM)
http://home.hiroshima-u.ac.jp/ksatoh/
Statistical methods are useful to understand or summarize results of clinical trials etc…We will introduce you the exploring process of statistical data analysis.

1. Baby weight data
• Univariate analysis
• Bi-variate analysis
• Multivariate analysis- Linear Regression analysis- Pass analysis 2. Decathlon data
• Multidimensional Scaling method
• Hierarchical Custer analysis

Baby weight dataBabyWeightMamWeight MamAge PregnancyDays Smoking
3087 48 28 304 03229 52 24 286 13204 61 33 273 13346 58 30 295 03579 56 21 290 02325 46 26 262 03159 55 30 318 13589 63 37 298 02969 52 25 299 12819 40 22 313 03191 59 34 285 13346 57 28 306 02444 45 30 291 13662 64 21 274 03241 53 29 283 0
Reference: 佐和隆光著回帰分析, 朝倉出店p57-表4.1
Which variables are related to baby weight?

Free Statistical Software “R”
https://www.r-project.org/index.htmlhttp://www.okadajp.org/RWiki/
Search Results by “Statistics R” in Amazon

Sorting, Stem-and leaf plot, Frequency, Histogram, Rug plot, Probability density function, Normal distribution, Boxplot, Quantile, percentile
Univariate analysis

Sorting and stem-and-leaf plot
“2|34” means there are two samples 23XX and 24XX, which are exactly given by 2325 and 2444.

Frequency, Histogram and Rug plot
Baby weight can be categorized by several intervals and table of frequency count is created.

Calculation of mean and s.d.
Variance is sometimes defined by using 1/(n-1) instead of 1/n because of statistical theory.
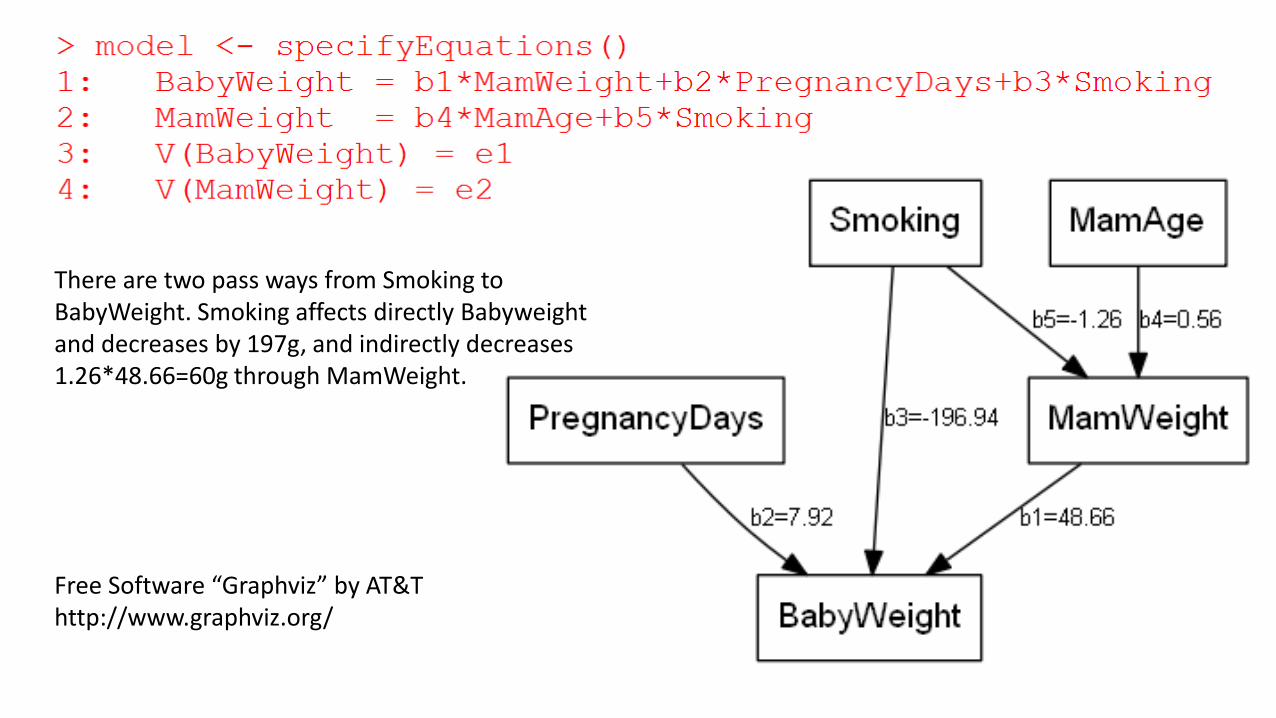
Normal distribution with mean and s.d.
95% of the distribution lies within two standard deviationsof the mean., i.e., (μ-2σ, μ+2σ).Only one data “2325” is outside of (2379, 3913).
https://en.wikipedia.org/wiki/Normal_distribution

Standardization
The shape of distribution is invariant.

Quantiles and Box plot
The 1st Quantile is the 25th percentile,…Notch of boxplot shows the 95% confidence interval of median, of which length decreases as the sample size increases.

Boxplot, t-test, Correlation Coefficient, Simple Regression, Regression line
Bivariate analysis

Boxplot by groups
“Smoking” is a dummy or indicator variable for mother smoking during pregnancy (1: smoking; 0: not smoking).It seems that there is a difference between median values among two groups.
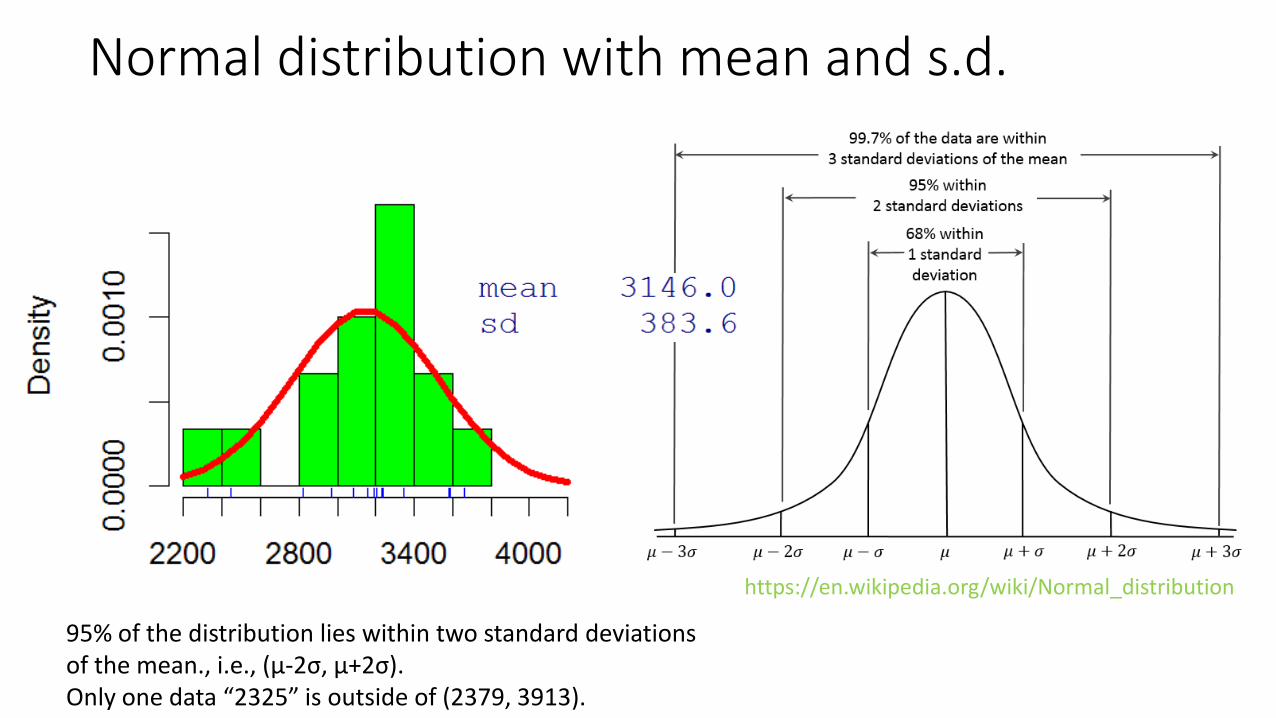
Comparing means between two groups
Null hypothesis of t-test is that there is no difference between mean values among two groups.When p-value is less than 0.05, the null hypothesis is rejected and we will consider that there is a statistically significant difference in means.

Simple regression
The Linear curve y=737+45x was fitted for the scatter plot, which implies that Baby weight increases by 450g when Mother weight increases by 10kg. The increment is statistically significant with p=0.0003.

Estimation of regression coefficients
Statistical method or models can be described by using linear algebra.

Correlation coefficient
Correlation coefficient is interpreted as a slope of simple regression line for standardized two covariates.

Correlation coefficient between two variables is a measurements expressing a goodness of fitting linear curve line.
The values is calculated within [-1,1] and its absolute value takes 1 only if all the data lies on a linear curve.
When correlation coefficient is about zero, there might be no relation between variables in general.

Correlation matrix, Multiple linear regression, Pass analysis
Multivariate analysis

Scatter plot matrices can be summarized as a correlation coefficient matrix. Those figure and table are useful to understand all relations on multi-variables at once.
Scatter plot matrices Correlation matrix

Multiple linear regression
Fitted regression model:
BabyWeight=-1675+55*MamWeight-23*MamAge+9*PregnancyDays-141*Smoking

Goodness of fittingThe goodness of fitting is obtained as multiple R-squared: R2, of which is a squared correlation coefficient between response and the fitted value.

Multiple linear regression⊆ Pass analysis⊆ Structural Equation Model
Multiple linear regression is a special case of Pass analysis,which is also special model among SEM.
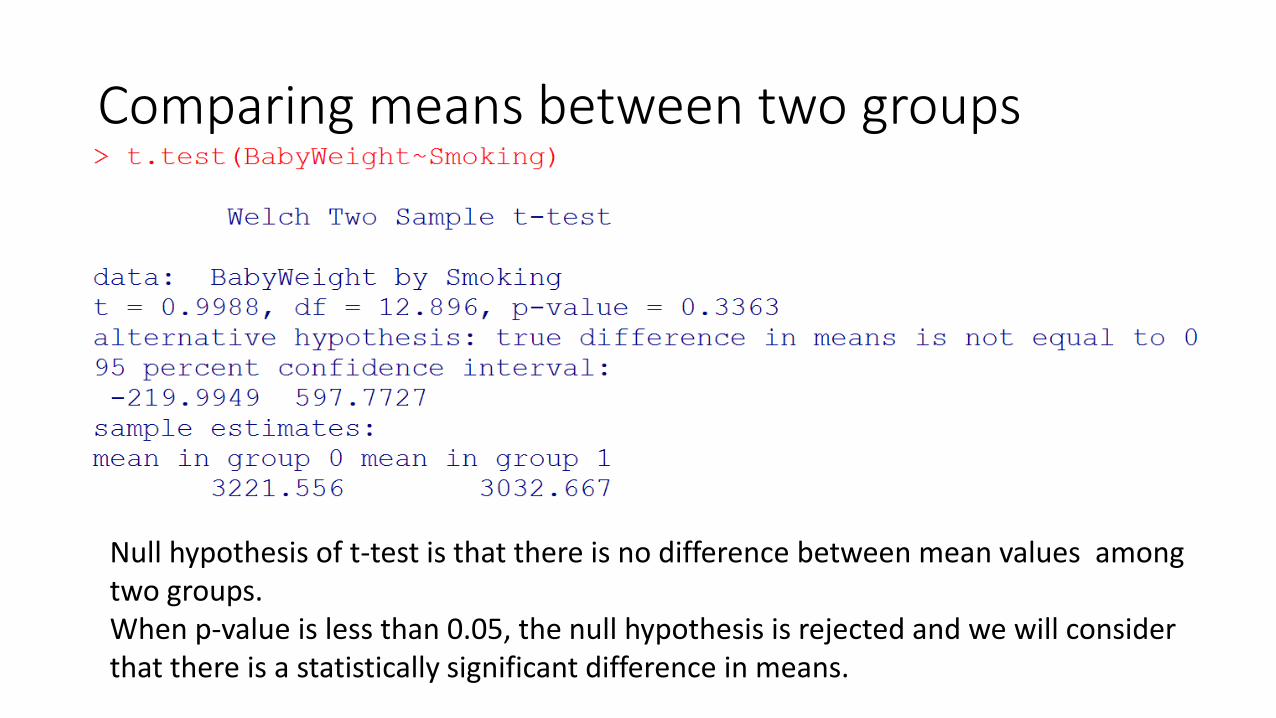
There are two pass ways from Smoking to BabyWeight. Smoking affects directly Babyweightand decreases by 197g, and indirectly decreases 1.26*48.66=60g through MamWeight.
Free Software “Graphviz” by AT&Thttp://www.graphviz.org/

Decathlon Data
Reference:
鈴木義一郎著例解多変量解析実教出版
Top 50 decathlon records in 1995 JAPAN.
There are 10 variables: Race100, LongJump, ShotPutHighJump, Race400, Hurdle110Discus, PoleVault, Javelin, Race1500.
Which variables are related each other?
id Race100 LongJump ShotPut HighJump Race400 Hurdle110 Discus PoleVault Javelin Race1500
1 11.28 6.91 13.38 1.93 50.25 14.7 44.66 4.9 56.1 285.312 11.02 6.8 12.81 1.93 48.42 15.72 38.84 4.6 65.65 285.543 10.9 7.08 12.38 1.87 48.49 14.58 35.84 4.6 56.9 280.624 11.34 7.02 12.08 2.05 50.55 14.73 37.14 4.5 57.76 279.045 11.24 7.03 11.57 1.96 48.89 14.89 31.34 4.7 61.96 280.776 10.81 6.67 12.81 1.93 48.97 15.04 33.96 3.9 57.26 279.097 11.34 6.77 12.4 1.98 50.03 14.82 33.14 4.3 51.98 275.088 11.29 6.69 11.67 1.9 51.43 14.66 34.36 4.4 52.82 267.419 10.83 6.83 11.67 1.8 48.35 15.11 33.68 4.3 49.54 275.69
10 11.23 6.67 12.39 1.84 50.33 15.81 37.68 4.5 54.54 280.6611 10.85 7.2 11.37 1.75 50.4 14.88 34.46 4.3 44.66 275.2412 11 6.9 11.5 1.85 49.8 15.5 36.22 4.5 52.52 28613 11.38 7.04 11.68 1.91 51.33 15.65 31.66 4.6 50.62 286.5914 11.49 6.8 10.7 1.95 49.4 15.21 32.72 3.8 54.26 268.5715 11.11 6.99 12.76 1.7 49.54 16.32 40.24 4.3 50.4 302.2316 11.62 6.88 12.41 1.88 52.93 16.52 37.36 4.7 52.94 291.2517 10.9 7.22 10.48 1.85 49.4 14.8 30.16 4 51.56 291.118 11.35 6.82 11.8 1.94 51.42 15.04 33.72 3.8 52.26 285.8519 11.1 6.86 11.17 1.8 49.71 15.28 30 4.4 48.84 285.6520 11.3 6.94 10.51 1.85 51 15.6 33.84 4.3 54.2 27521 11.42 6.66 12.25 1.75 52.7 15.87 40.84 4.2 57.26 299.5822 11.55 6.95 10.82 1.84 51.4 14.94 33.04 4.4 54.1 318.7123 11.2 6.35 10.8 1.7 50.8 14.8 34.64 4 56.86 274.324 11.39 6.98 10.33 1.94 51.52 16.31 29.82 4 52.78 277.7225 11 6.66 10.8 1.85 50.2 16 30.38 4 52.9 28126 11.77 6.63 10.4 1.92 50.33 15.15 33.4 3.8 47.48 279.8327 11.1 6.56 12.09 1.7 50.1 15.3 36.44 3.6 53.98 289.428 10.9 6.62 11.15 1.96 50.7 15.4 32.18 3.8 52.84 313.529 11.15 6.37 10.8 1.72 50.26 15.05 34.2 3.9 50.4 285.9530 11.72 6.53 11.09 1.8 49.99 16.04 31.74 3.8 57.74 274.9131 11.2 6.76 10.13 1.85 50.5 15.8 30.92 4 51.68 282.732 11.17 6.64 9.01 1.84 50.6 14.86 27.46 4.9 42.42 312.7333 11.41 6.38 10.87 1.94 51.48 15.88 33.22 4.1 46.22 289.9634 11.33 6.71 10.93 1.75 49.58 15.89 28.7 3.5 60.5 290.1335 11.2 6.67 10.63 1.87 52.3 16.6 30.8 4.3 53.82 289.536 11.57 6.43 11.35 1.75 50.3 16.32 35.48 4 47.56 280.2737 10.8 6.67 10.81 1.83 50.1 15.5 28.18 3.6 54.64 301.438 11.1 6.98 11.04 1.8 50.4 15.4 31.2 3.2 44.42 271.239 11.21 6.31 11.12 1.78 51.65 15.39 30.44 4.2 51.94 305.8340 11.2 6.65 10.32 1.75 50.6 15.5 30.08 3.8 48.76 276.841 11.32 6.81 9.65 1.7 51.42 15.7 24.5 4.4 43.94 271.8842 10.9 6.54 9.81 1.84 50.4 15.8 29.42 3.8 47.08 286.543 11.68 6.78 11.63 1.87 54.16 16.83 33.54 3.3 47.36 272.4444 11.56 6.56 9.42 1.85 51.54 15.89 28.04 4 48.1 275.5545 11.2 7.16 9.28 1.85 52.5 16.2 26.06 4.5 44.8 293.346 11.2 6.55 10.48 1.8 51.4 15.3 32.88 3.7 48.46 296.747 11.24 6.27 10.97 1.91 51.65 15.98 30.48 3.4 49.52 288.2448 11.06 6.91 9.94 2.15 52.47 15.53 27.5 3.1 44.42 315.2349 11.54 6.18 10.6 1.7 50.45 16.46 34.06 3.8 55.08 285.2250 11.21 6.52 10.16 1.81 50.56 16.16 31.96 3.8 41.38 287.47

Simple regressionCorrelation coefficient

Scatter plot matrices Correlation matrix

PrincipleComponent Analysisbased onCorrelation Matrix

Biplot of PCAbased onIndividual Data
1st and 2nd place player are good at throwing.3, 5, 9, 11, 17 are good at running.

Adjacency Matrix based on Correlation Matrix
a= 1 if |r|>0.3, otherwise a=0

Undirected Graph based onAdjacency Matrix

Distance
Distance between ShotPut and Discus canbe measured as two points in 50 dimensional space. Those variables are comparable by standardization.
Distance is a function d: M x M → R, that satisfies the following conditions:
i) d(x,y) ≥ 0, and d(x,y) = 0 if and only if x = y. ii) d(x,y) = d(y,x)iii) d(x,z) ≤ d(x,y) + d(y,z)

Relation betweenCorrelationand Distancefor Standardized Data

Distance matrix for Standardized Data
Distance between Discus and ShotPut is 4.18, which is the minimum distance among 10 athletics.

Multi-DimensionalScaling methodwhich makes a mapfrom Distances
Although original variables existsin 10-1=9⊆50 dimensional space,MDS method can put all variables in 2 dimensional plane at once.Needless to say, some information was lost by dimension reduction.

Custer analysisbased on Distance
The cluster dendrogram shows the similarity among variables according to distance matrix based on original 50 dimensional space.

Classification based on Cluster Analysis

Factor Analysisbased onCorrelation Matrix
In Factor analysis, several covariates are related by the common latent or unobserved factor. When the number of factors is two, the method is similar with Principle Component Analysis.

Classificationbased onFactor Analysis
Latent factors can be named for understanding the covariates group.

Visualization ofCorrelation matrixand its classification
The order of covariates are arranged according to high correlation group.Eventually, diagonal matrices shows some clusters of covariates groups. The color shows the height of correlation.
Related Documents