1999 DIRECTORATE OF ECONOMICS & STATISTICS, RAJASTHAN, JAIPUR

Welcome message from author
This document is posted to help you gain knowledge. Please leave a comment to let me know what you think about it! Share it to your friends and learn new things together.
Transcript
1999 DIRECTORATE OF ECONOMICS & STATISTICS, RAJASTHAN, JAIPUR
STATISTICAL ABSTR~CT
R~JASTHAN
1999
I I
DIRECTORATE OF ECONOMICS & STATISTICS
RAJASTHAN, JAIPUR
PREFACE
The "Statistical Abstract of Rajasthan - 1999" is the 40th edition in the
series. The information included in this issue pertains to the calendar year 1999
or Financial/Agriculture/Co-operative year 1998-99, except where· indicated
otherwise. The publication contains important information on different sectors
of the State's economy for the last 5 years at the State level, with districtwise
break-up of latest year. The concepts and definitions, of respective sectors have
been indicated at the beginning of each sector. Main results of Economic
Census, conducted during June, 1998 in the State have also been incorporated in
this issue alongwith the some new/changed tables of various sectors.
The cooperation extended by various departments/ agencies in providing the required data is appreciated. Besides, my appreciation goes to Shri Manoj
Sharma, Statistical Assistant also for his sincere efforts in bringing out this
publication.
I hope the information contained in the publication will be useful to readers,
planners, policy makers in understanding the changing Socio-Economic
Scenario of the State. There is always scope for improvement in the publication.
The D.E.S. shall be grateful for any suggestions in this regard.
JAIPUR NOVEMBER, 2000
(N.L. KHINCHI) Director,
Economics & Statistics, Rajasthan, Jaipur.
OFFICERS/OFFICIALS ASSOCIATED
WITH THE PUBLICATION
Joint Director
Shri D.K. Jain
Deputy Director
Shri D.C. Jain
Assistant Director
Shri RN. Meena
Statistical Assistant
Shri Manoj Sharma
Smt. Sudha Mathur
Smt. Santosh Jain
Shri Lal Chand Yadav
Computor
Shri Vijay Singh
Artist
Kamal Kant Sharma
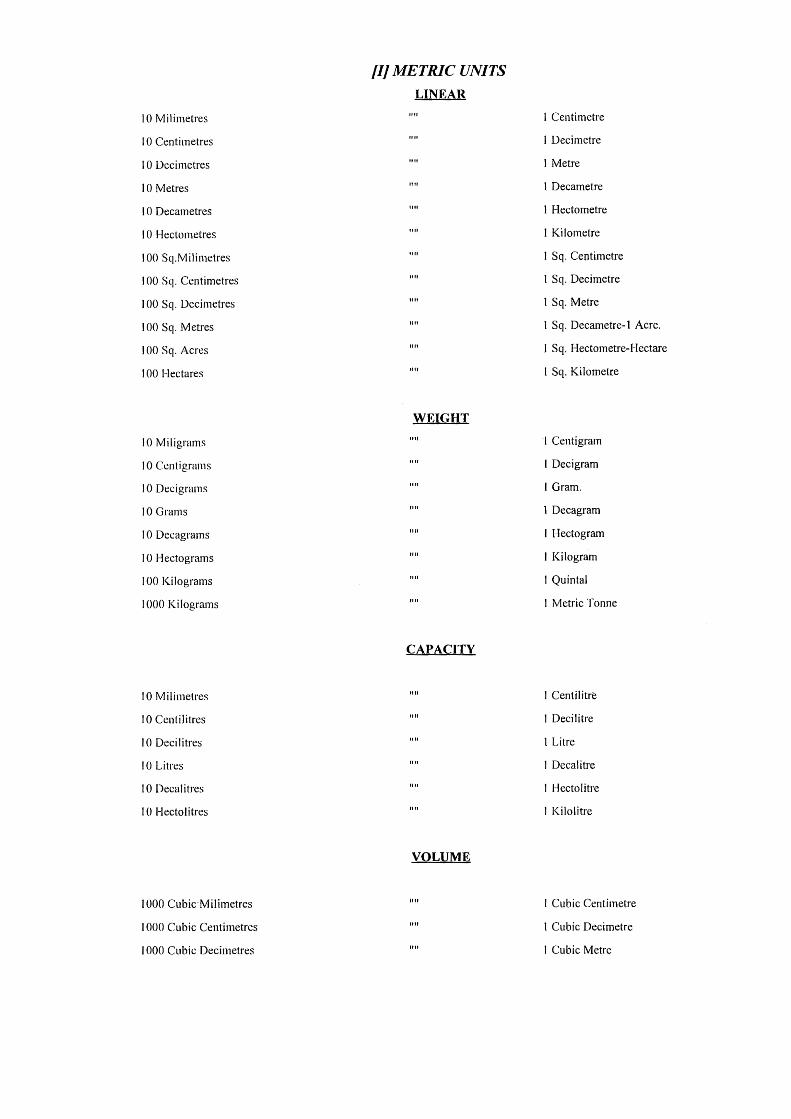
fl/ METRIC UNITS
LINEAR
I 0 Milimetres "" 1 Centimetre
I 0 Centimetres I Decimetre
I 0 Decimetres '"' 1 Metre
10 Metres "" 1 Decametre
I 0 Decametres 1 Hectometre
I 0 Hectometres I Kilometre
I 00 Sq.Milimetres I Sq. Centimetre
I 00 Sq. Centimetres 1111 1 Sq. Decimetre
I 00 Sq. Decimetres l Sq. Metre
I 00 Sq. Metres l Sq. Decametre-1 Acre.
I 00 Sq. Acres 1111 1 Sq. Hectometre-Hectare
I 00 Hectares lllt I Sq. Kilometre
WEIGHT
10 Miligrams "" 'I Centigram
I 0 Centigrams I Decigram
I 0 Decigrams I Gram.
I 0 Grams 1 Decagram
I 0 Decagrams 1111 1 Hectogram
I 0 Hectograms 1111 1 Kilogram
100 Kilograms 1111 I Quintal
I 000 Kilograms I Metric Tonne
CAPACITY
10 Milimelres 1111 I Centilitre
I 0 Centilitres I Decilitre
I 0 Decilitres l Litre
I 0 Litres I Decalitre
I 0 Decal i tres "" I Hectolitre
I 0 Hectolitres I Kilolitre
VOLUME
I 000 Cubic-Milimetres 1111 I Cubic Centimetre
I 000 Cubic Centimetres ttll 1 Cubic Decimetre
I 000 Cubic Decimetres I Cubic Metre
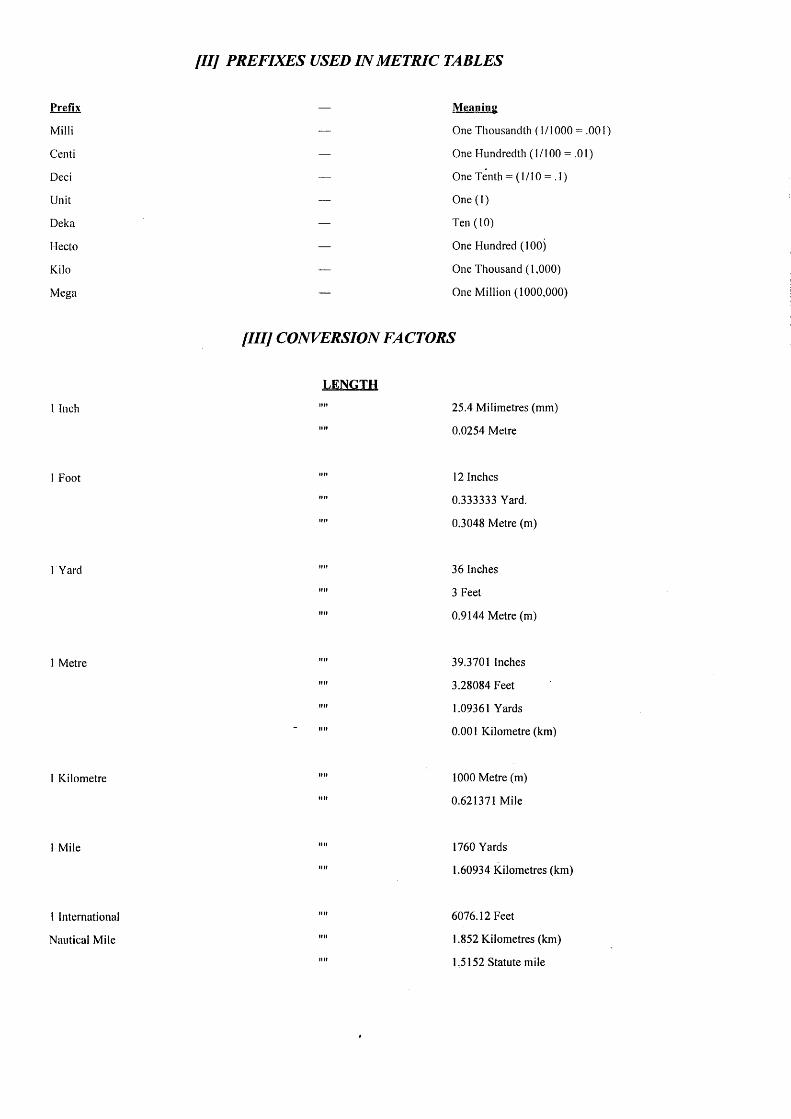
Prefix
Milli
Centi
Deci
Unit
Deka
1-Iecto
Kilo
Mega
l Inch
I Foot
1Yard
1 Metre
I Kilometre
1 Mile
l International
Nautical Mile
/II} PREFIXES USED IN METRIC TABLES
Meaning
One Thousandth ( 1/1000 = .001)
One Hundredth (1/100 = .01)
One Tenth = ( 1110 = . I)
One (1)
Ten (10)
One Hundred ( 100)
One Thousand ( 1,000)
One Million ( 1000,000)
/III} CONVERSION FACTORS
LENGTH
""
1111
'"'
1111
25.4 Milimetres (mm)
0.0254 Metre
12 Inches
0.333333 Yard.
0.3048 Metre (m)
36 Inches
3 Feet
0.9144 Metre (m)
39.3701 Inches
3.28084 Feet
1.09361 Yards
0.001 Kilometre (km)
1000 Metre (m)
0.621371 Mile
1760 Yards
1.60934 Kilometres (km)
6076.12 Feet
1.852 Kilometres (km)
1.5152 Statute mile
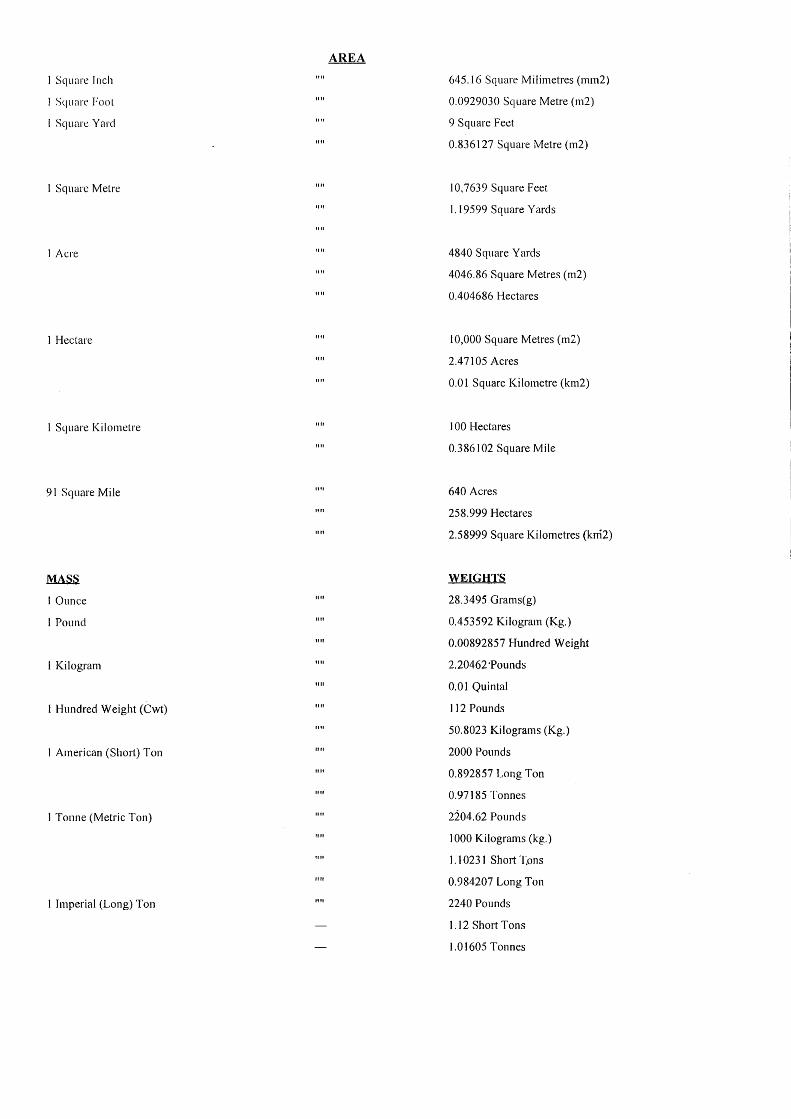
I Square Jnch
I Square Fool
I Square Yard
I Square Metre
I Acre
1 Hectare
I Square Kilometre
91 Square Mile
MASS
I Ounce
I Pound
l Kilogram
1 Hundred Weight (Cwt)
I American (Sho11) Ton
I Tonne (Metric Ton)
I Imperial (Long) Ton
645.16 Square Milimetres (1111112)
0.0929030 Square Metre (m2)
9 Square Feet
0.836127 Square Metre (m2)
10,7639 Square Feet
1.19599 Square Yards
4840 Square Yards
4046.86 Square Metres (m2)
0.404686 Hectares
10,000 Square Metres (m2)
2.47105 Acres
0.01 Square Kilometre (km2)
100 Hectares
0.386102 Square Mile
640 Acres
258.999 Hectares
2.58999 Square Kilometres (krri2)
WEIGHTS
28.3495 Grams(g)
0.453592 Kilogram (Kg.)
0.00892857 Hundred Weight
2.20462 ·Pounds
0.01 Quintal
112 Pounds
50.8023 Kilograms (Kg.)
2000 Pounds
0.892857 Long Ton
0.97185 Tonnes
2204.62 Pounds
1000 Kilograms (kg.)
1. 1023 1 Short T.ons
0.984207 Long Ton
2240 Pounds
1.12 Short Tons
1.01605 Tonnes
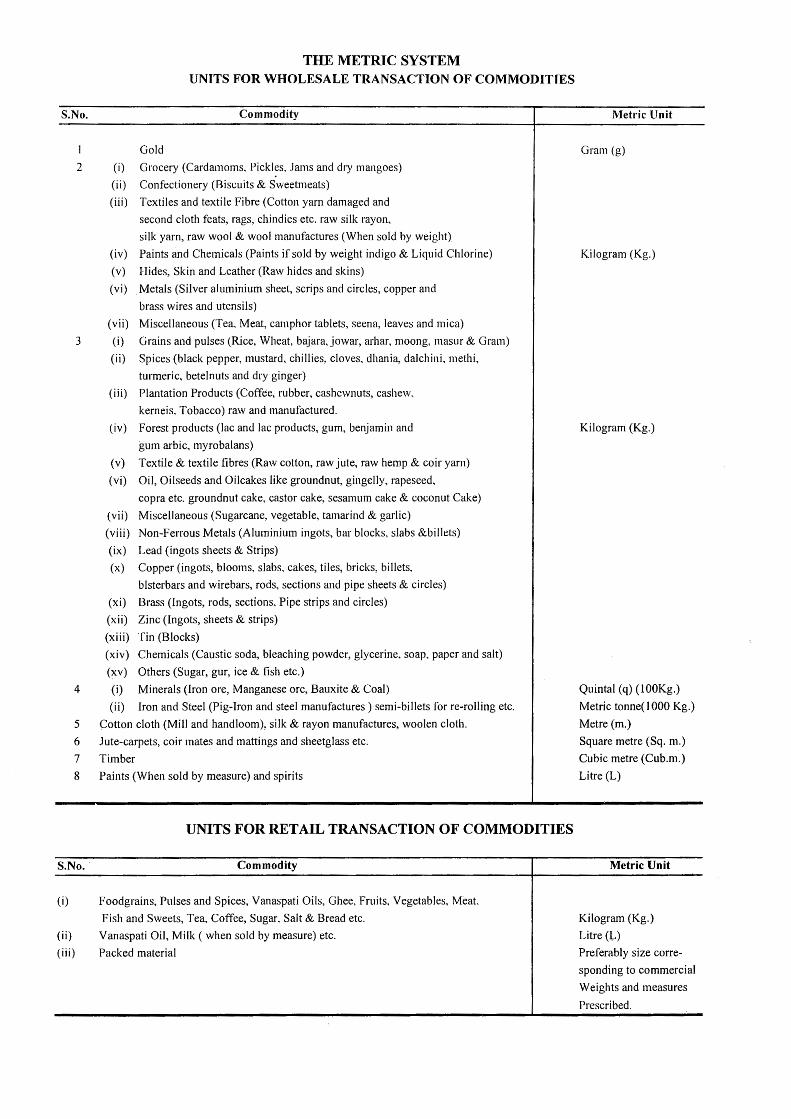
THE METRIC SYSTEM UNITS FOR WHOLESALE TRANSACTION OF COMMODITIES
S.No. Commodity
Gold
2 (i) Grocery (Cardamoms. Pickles. Jams and dry mangoes)
(ii) Confectionery (Biscuits & Sweetmeats)
(iii) Textiles and textile Fibre (Cotton yarn damaged and
second cloth feats, rags, chindies etc. raw silk rayon,
silk yarn, raw wool & wool manufactures (When sold by weight)
(iv) Paints and Chemicals (Paints if sold by weight indigo & Liquid Chlorine)
(v) Hides, Skin and Leather (Raw hides and skins)
(vi) Metals (Silver aluminium sheet, scrips and circles, copper and
brass wires and utensils)
(vii) Miscellaneous (Tea, Meat, camphor tablets, seena, leaves and mica)
3 (i) Grains and pulses (Rice, Wheat, bajara, jowar, arhar, moong, masur & Gram)
4
(ii) Spices (black pepper, mustard, chillies, cloves, dhania, dalchini, methi,
turmeric, betelnuts and dry ginger)
(iii) Plantation Products (Coffee, rubber, cashewnuts, cashew,
kerneis. Tobacco) raw and manufactured.
(iv) Forest products (lac and lac products, gum, benjamin and
gum arbic, myrobalans)
(v) Textile & textile fibres (Raw cotton, raw jute, raw hemp & coir yarn)
(vi) Oil, Oilseeds and Oilcakes like groundnut, gingelly, rapeseed,
copra etc. groundnut cake, castor cake, sesamum cake & coconut Cake)
(vii) Miscellaneous (Sugarcane, vegetable, tamarind & garlic)
(viii) Non-Ferrous Metals (Aluminium ingots, bar blocks, slabs &billets)
(ix) Lead (ingots sheets & Strips)
(x) Copper (ingots, blooms, slabs, cakes, tiles, bricks, billets,
blsterbars and wirebars, rods, sections and pipe sheets & circles)
(xi) Brass (Ingots, rods, sections, Pipe strips and circles)
(xii) Zinc (Ingots, sheets & strips)
(xiii) Tin (Blocks)
(xiv) Chemicals (Caustic soda, bleaching powder, glycerine, soap, paper and salt)
(xv) Others (Sugar, gur, ice & fish etc.)
(i) Minerals (Iron ore, Manganese ore, Bauxite & Coal)
(ii) Iron and Steel (Pig-Iron and steel manufactures) semi-billets for re-rolling etc.
5 Cotton cloth (Mill and handloom), silk & rayon manufactures, woolen cloth.
6 Jute-carpets, coir mates and mattings and sheetglass etc.
7 Timber
8 Paints (When sold by measure) and spirits
UNITS FOR RETAIL TRANSACTION OF COMMODITIES
S.No. Commodity
(i) Foodgrains, Pulses and Spices,Vanaspati Oils, Ghee, Fruits, Vegetables, Meat,
Fish and Sweets, Tea, Coffee, Sugar, Salt & Bread etc.
(ii) Vanaspati Oil, Milk (when sold by measure) etc.
(iii) Packed material
Metric Unit
Gram (g)
Kilogram (Kg.)
Kilogram (Kg.)
Quintal ( q) ( l OOKg.)
Metric tonne( 1000 Kg.)
Metre (m.)
Square metre (Sq. m.)
Cubic metre (Cub.m.)
Litre (L)
Metric Unit
Kilogram (Kg.)
Litre (L)
Preferably size corre
sponding to commercial
Weights and measures
Prescribed.
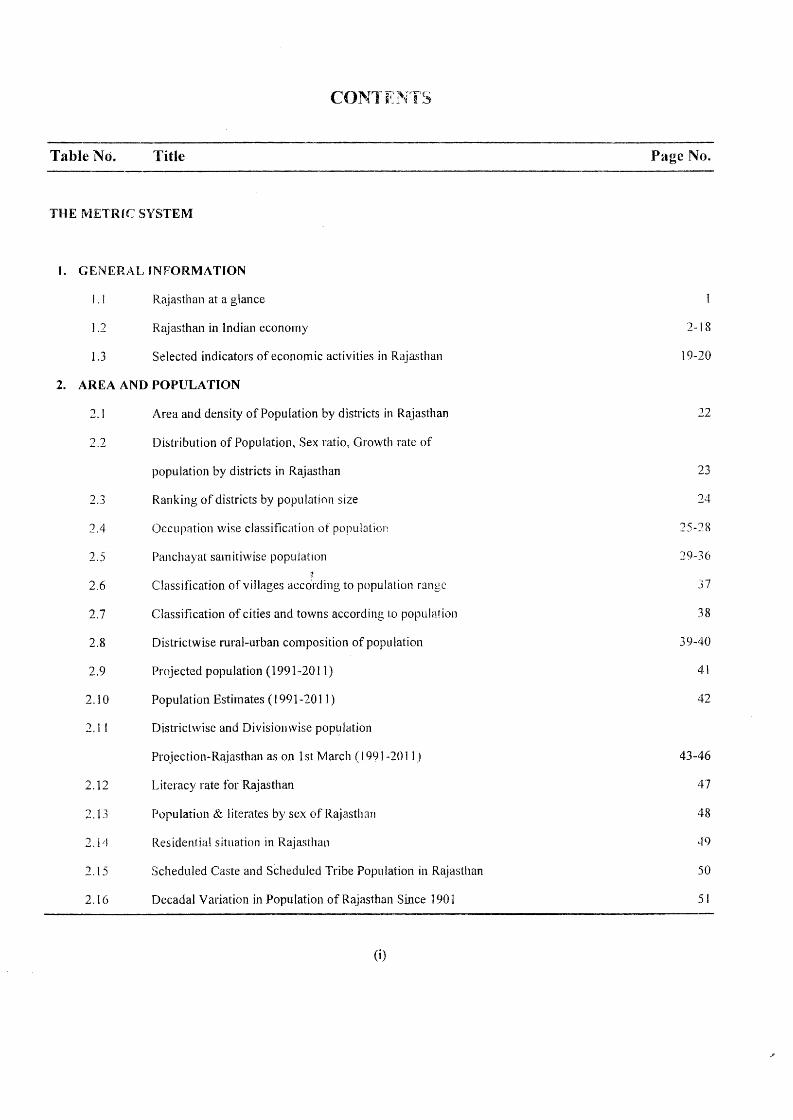
CONTEN'f'S
Table No. Title Page No.
THE METRIC SYSTEM
1. GENERAL INFORMATION
J. l Rajasthan at a glance
1.1 Rajasthan in Indian economy 2-18
1.3 Selected indicators of economic activities in Rajasthan 19-20
2. AREA AND POPULATION
2.1 Area and density of Population by districts in Rajasthan 22
2.2 Distribution of Population, Sex ratio, Growth rate of
population by districts in Rajasthan 23
2.3 Ranking of districts by population size 24
2.4 Occupation wise classification of population 15-7.8
2.5 Panchayat samiti\·vise population 29-36
t 2.6 Classification of villages according to population range 37
2.7 Classification of cities and towns according Lo population 38
2.8 Districtwise rural-urban composition of population 39-40
2.9 Projected population (1991-2011) 41
2.10 Population Estimates ( 1991-2011 ) 42
2.11 Districtwise and Divisionwise population
Projection-Rajasthan as on 1st March (l991-2011) 43-46
2.12 Literacy rate for Rajasthan 47
2.13 Population & literates by sex of Rajasthan 48
2.1 11 Residentia! situation in Rajasthan -l9
2.15 Scheduled Caste and Scheduled Tribe Population in Rajasthan 50
2.16 Decadal Variation in Population of Rajasthan Since 1901 51
(i)
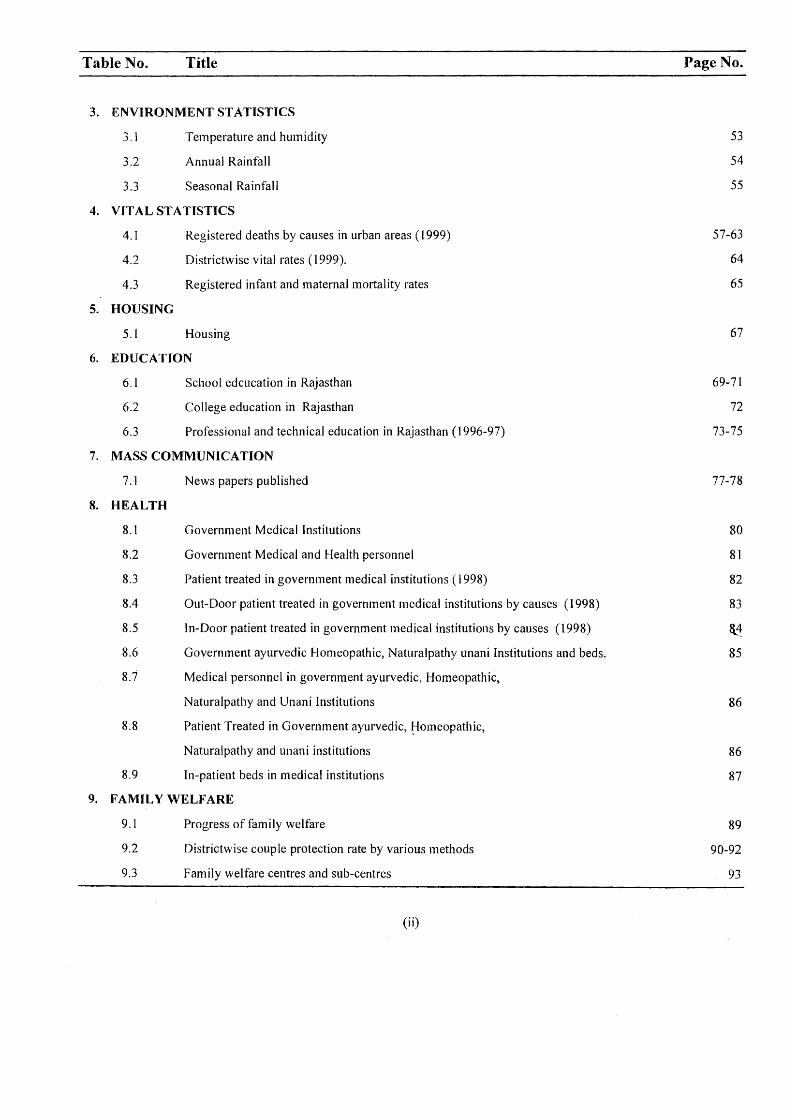
Table No. Title
3. ENVIRONMENT STATISTICS
3.1
3.2
3.3
Temperature and humidity
Annual Rainfall
Seasonal Rainfall
4. VITAL STATISTICS
4.1
4.2
4.3
5. HOUSING
5.1
Registered deaths by causes in urban areas (1999)
Districtwise vital rates ( 1999).
Registered infant and maternal mortality rates
Housing
6. EDUCATION
6.1
6.2
6.3
School edcucation in Rajasthan
College education in Rajasthan
Professional and technical education in Rajasthan (I 996-97)
7. MASS COMMUNICATION
7.1
8. HEALTH
8.1
8.2
8.3
8.4
8.5
8.6
8.7
8.8
8.9
News papers published
Government Medical Institutions
Government Medical and Health personnel
Patient treated in government medical institutions ( 1998)
Out-Door patient treated in government medical institutions by causes (1998)
In-Door patient treated in government medical institutions by causes (1998)
Government ayurvedic Homeopathic, Naturalpathy unani Institutions and beds.
Medical personnel in government ayurvedic, Homeopathic,
Naturalpathy and Unani Institutions
Patient Treated in Government ayurvedic, ~omeopathic,
Naturalpathy and unani institutions
In-patient beds in medical institutions
9. FAMILY WELFARE
9.1
9.2
9.3
Progress of family welfare
Districtwise couple protection rate by various methods
Family welfare centres and sub-centres
(ii)
Page No.
53
54
55
57-63
64
65
67
69-71
72
73-75
77-78
80
81
82
83
~1
85
86
86
87
89
90-92
93
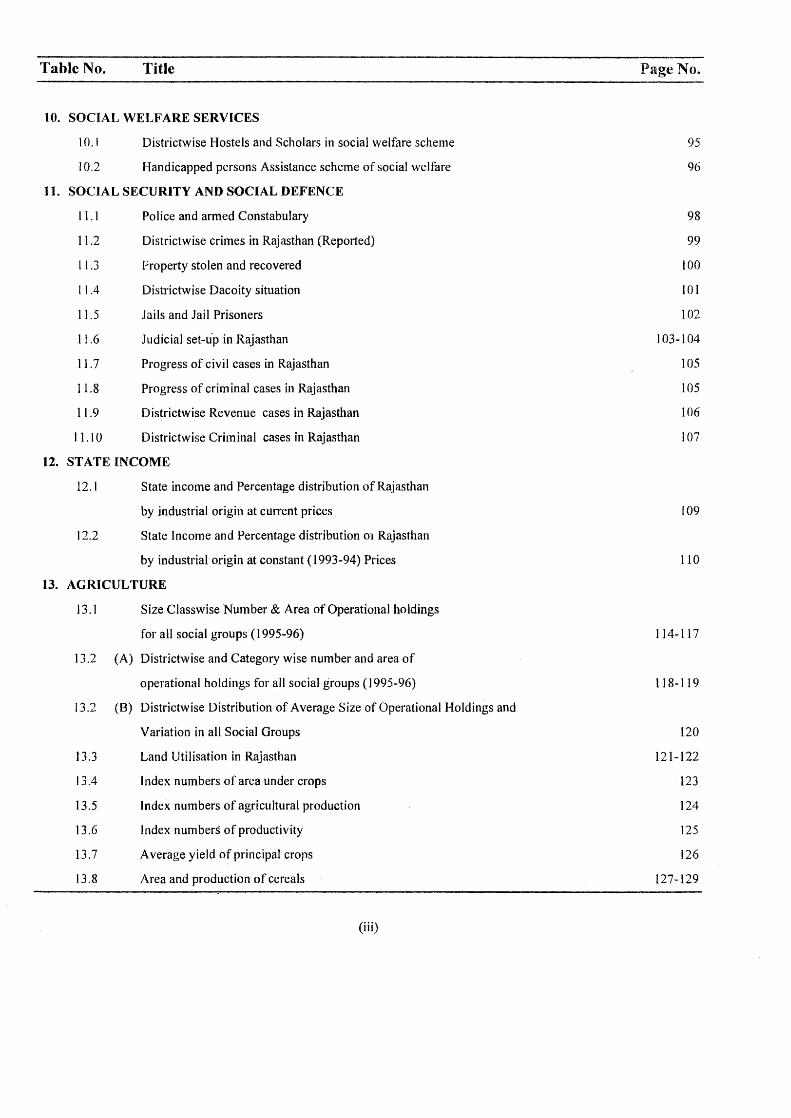
Table No. Title
10. SOCIAL WELFARE SERVICES
IO.I
10.2
Districtwise Hostels and Scholars in social welfare scheme
Handicapped persons Assistance scheme of social welfare
11. SOCIAL SECURITY AND SOCIAL DEFENCE
11.1
11.2
11.3
11.4
11.5
11.6
11.7
11.8
11.9
11.10
Police and armed Constabulary
Districtwise crimes in Rajasthan (Reported)
Property stolen and recovered
Districtwise Dacoity situation
Jails and Jail Prisoners
Judicial set-up in Rajasthan
Progress of civil cases in Rajasthan
Progress of criminal cases in Rajasthan
Districtwise Revenue cases in Rajasthan
Districtwise Criminal cases in Rajasthan
12. STATE INCOME
12. I State income and Percentage distribution of Rajasthan
by industrial origin at current prices
12.2 State Income and Percentage distribution 01 Rajasthan
by industrial origin at constant (1993-94) Prices
13. AG RI CULTURE
13 .1 Size CJasswise Number & Area of Operational holdings
for all social groups (1995-96)
13.2 (A) Districtwise and Category wise number and area of
13.2 (B)
13.3
13.4
13.5
13.6
13.7
13.8
operational holdings for all social groups ( 1995-96)
Districtwise Distribution of Average Size of Operational Holdings and
Variation in all Socia) Groups
Land Utilisation in Rajasthan
Index numbers of area under crops
Index numbers of agricultural production
Index numbers of productivity
Average yield of principal crops
Area and production of cereals
(iii)
Page No.
95
96
98
99
100
101
102
103-104
105
105
106
107
109
110
114-117
118-119
120
121-122
123
124
125
126
127-129
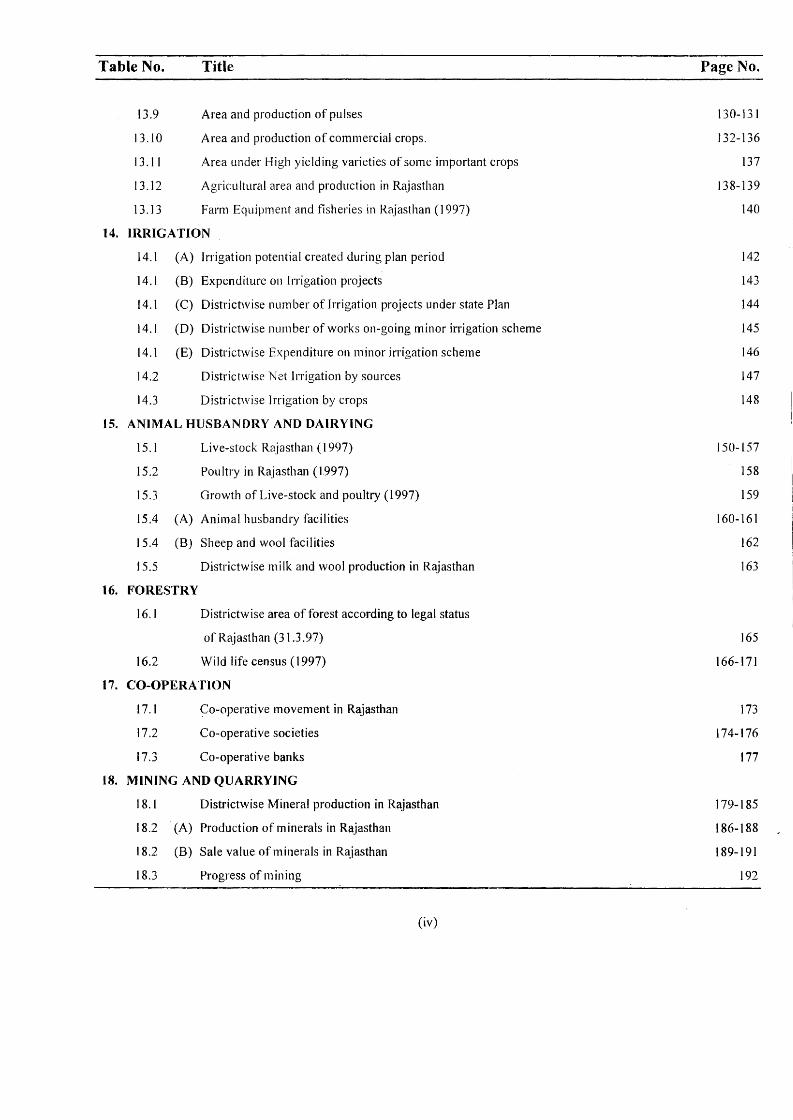
Table No. Title
13.9
13.10
13.11
13.12
13.13
Area and production of pulses
Area and production of commercial crops.
Area under High yielding varieties of some important crops
Agricultural area and production in Rajasthan
Farm Equipment and fisheries in Rajasthan (1997)
14. IRRIGATION
15.
16.
17.
14.1 (A) Irrigation potential created during plan period
14.1 (B) Expenditure on Irrigation projects
14. l (C) Districtwise number of Irrigation projects under state Plan
14.1 (D) Districtwise number of works on-going minor inigation scheme
14.1 (E) Districtwise Expenditure on minor irrigation scheme
14.2 Districtwise Net Irrigation by sources
14.3 Districtwise Irrigation by crops
ANIMAL HUSBANDRY AND DAIRYING
15.1 Live-stock Rajasthan ( 1997)
15.2 Poultry in Rajasthan (1.997)
15.3 Growth of Live-stock and poultry (1997)
15.4 (A) Animal husbandry facilities
15.4 (B) Sheep and wool facilities
15.5 Districtwise milk and wool production in Rajasthan
FORESTRY
16.1 Districtwise area of forest according to legal status
of Rajasthan (31.3.97)
16.2 Wild life census (1997)
CO-OPERATION
17.1
17.2
17.3
~a-operative movement in Rajasthan
Co-operative societies
Co-operative banks
18. MINING AND QUARRYING
18. l Districtwise Mineral production in Rajasthan
18.2 (A) Production of minerals in Rajasthan
18.2 (B) Sale value of minerals in Rajasthan
18.3 Progress of mining
(iv)
Page No.
130-131
132-136
137
138-139
140
142
143
144
145
146
147
148
I 50-157
158
159
160-161
162
163
165
166-171
173
174-176
177
179-185
186-188
189-191
192
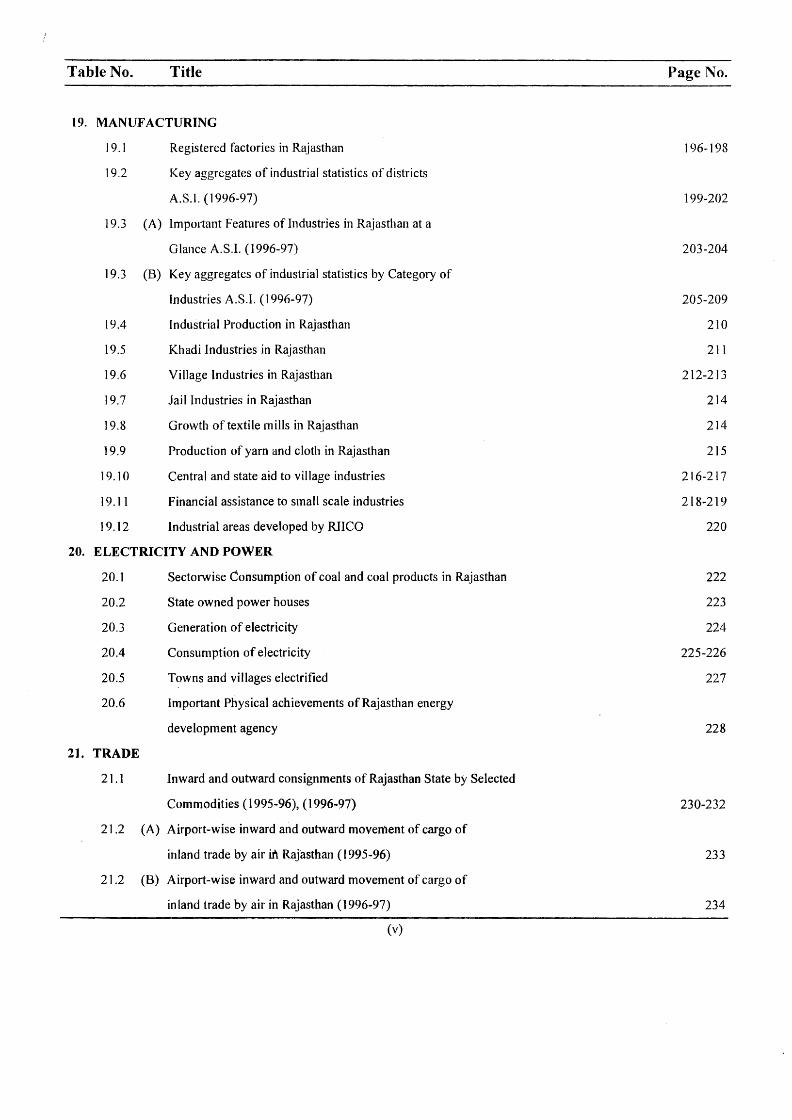
Table No. Title Page No.
19. MANUFACTURING
19.1 Registered factories in Rajasthan 196-198
19.2 Key aggregates of industrial statistics of districts
A.S.I. ( 1996-97) l 99-202
19.3 (A) Important Features of Industries in Rajasthan at a
Glance A.S.I. (1996-97) 203-204
19.3 (B) Key aggregates of industrial statistics by Category of
Industries A.S.l. (1996-97) 205-209
19.4 Industrial Production in Rajasthan 210
19.5 Khadi Industries in Rajasthan 211
19.6 Village Industries in Rajasthan 212-213
19.7 Jail Industries in Rajasthan 214
19.8 Growth of textile mills in Rajasthan 214
19.9 Production of yarn and cloth in Rajasthan 215
19.10 Central and state aid to village industries 216-217
19. l 1 Financial assistance to small scale industries 218-219
19.12 Industrial areas developed by RIICO 220
20. ELECTRICITY AND POWER
20.1 Sectorwise Consumption of coal and coal products in Rajasthan 222
20.2 State owned power houses 223
20.3 Generation of electricity 224
20.4 Consumption of electricity 225-226
20.5 Towns and villages electrified 227
20.6 Important Physical achievements of Rajasthan energy
development agency 228
21. TRADE
21.1 Inward and outward consignments of Rajasthan State by Selected
Commodities ( 1995-96), (1996-97) 230-232
21.2 (A) Airport-wise inward and outward movement of cargo of
inland trade by air ift Rajasthan ( 1995-96) 233
21.2 (B) Airport-wise inward and outward movement of cargo of
inland trade by air in Rajasthan (1996-97) 234
(v)
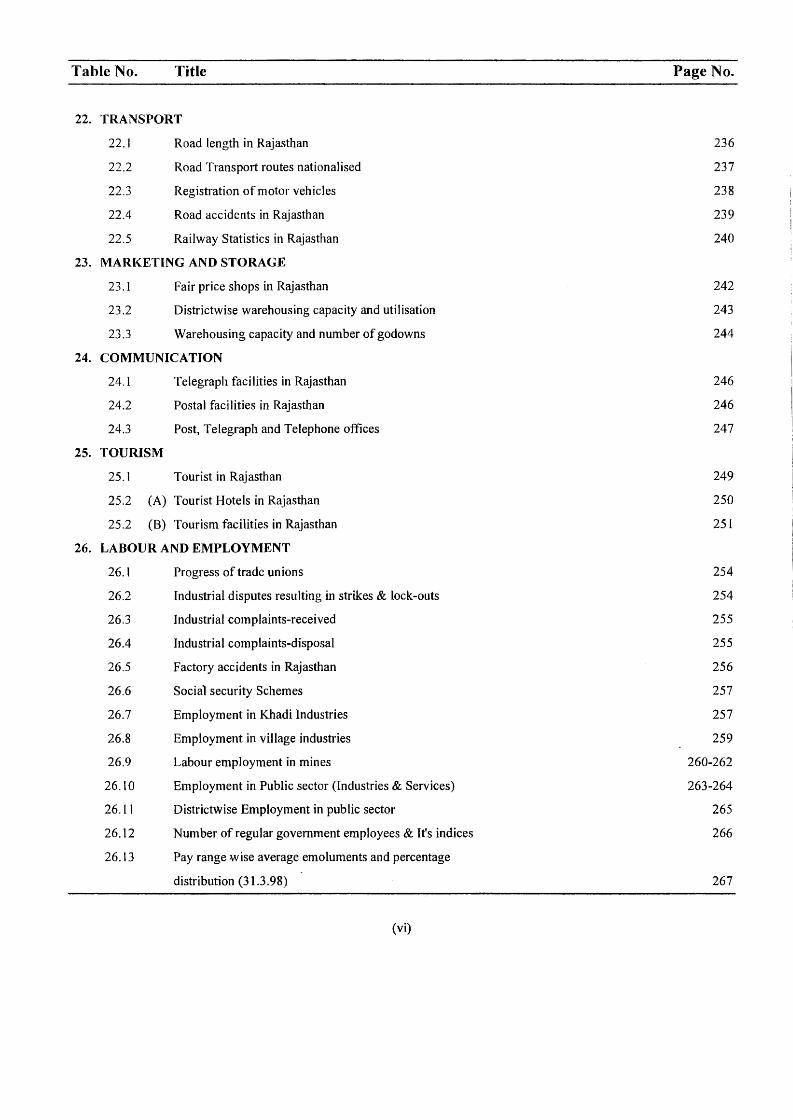
Table No. Title
22. TRANSPORT
22.1
22.2
22.3
22.4
22.5
Road length in Rajasthan
Road Transport routes nationalised
Registration of motor vehicles
Road accidents in Rajasthan
Railway Statistics in Rajasthan
23. MARKETING AND STORAGE
24.
25.
26.
23. l
23.2
23.3
Fair price shops in Rajasthan
Districtwise warehousing capacity and utilisation
Warehousing capacity and number of godowns
COMMUNICA TJON
24.1 Telegraph facilities in Rajasthan
24.2 Postal facilities in Rajasthan
24.3 Post, Telegraph and Telephone offices
TOURISM
25.1 Tourist in Rajasthan
25.2 (A) Tourist Hotels in Rajasthan
25.2 (B) Tourism facilities in Rajasthan
LABOUR AND EMPLOYMENT
26.1
26.2
26.3
26.4
26.5
26.6
26.7
26.8
26.9
26.IO
26.11
26.12
Progress of trade unions
Industrial disputes resulting in strikes & lock-outs
Industrial complaints-received
Industrial complaints-disposal
Factory accidents in Rajasthan
Social security Schemes
Employment in Khadi Industries
Employment in village industries
Labour employment in mines
Employment in Public sector (Industries & Services)
Districtwise Employment in public sector
Number of regular government employees & It's indices
26.13 Pay range :wise average emoluments and percentage
distribution (31.3.98)
(vi)
Page No.
236
237
238
239
240
242
243
244
246
246
247
249
250
251
254
254
255
255
256
257
257
259
260-262
263-264
265
266
267
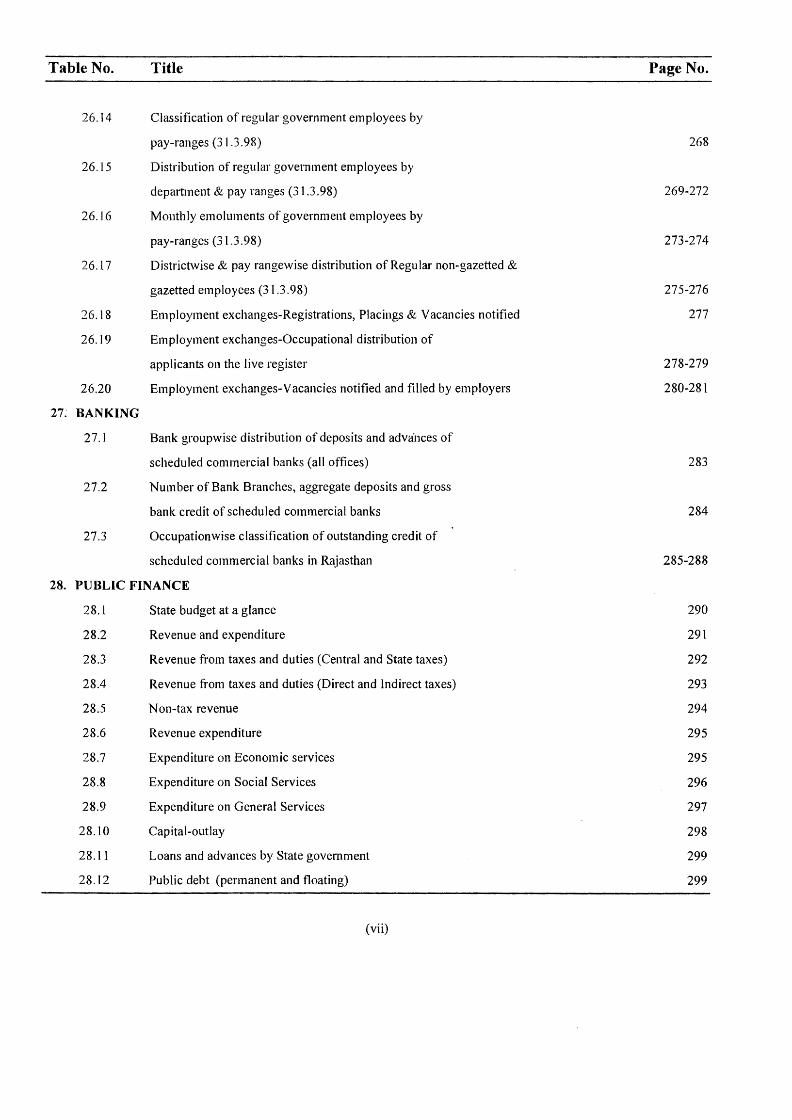
Table No. Title
27~
26. I 4 Classification of regular government employees by
pay-ranges (31.3.98)
26.15 Distribution of regular government employees by
department & pay ranges (31.3 .98)
26. 16 Monthly emoluments of government employees by
26.17
26.18
26.19
26.20
BANKING
27.1
27.2
27.3
pay-ranges (31.3.98)
Districtwise & pay rangewise distribution of Regular non-gazetted &
gazetted employees (3 l.3.98)
Employment exchanges-Registrations, Placings & Vacancies notified
Employment exchanges-Occupational distribution of
applicants on the Jive register
Employment exchanges-Vacancies notified and filled by employers
Bank groupwise distribution of deposits and advahces of
scheduled commercial banks (all offices)
Number of Bank Branches, aggregate deposits and gross
bank credit of scheduled commercial banks
Occupationwise classification of outstanding credit of
scheduled commercial banks in Rajasthan
28. PUBLIC FINANCE
28.1
28.2
28.3
28.4
28.5
28.6
28.7
28.8
28.9
28.10
28.11
28.12
State budget at a glance
Revenue and expenditure
Revenue from taxes and duties (Central and State taxes)
Revenue from taxes and duties (Direct and Indirect taxes)
Non-tax revenue
Revenue expenditure
Expenditure on Economic services
Expenditure on Social Services
Expenditure on General Services
Capital-outlay
Loans and advances by State government
Public debt (permanent and floating)
(vii)
Page No.
268
269-272
273-274
275-276
277
278-279
280-281
283
284
285-288
290
291
292
293
294
295
295
296
297
298
299
299
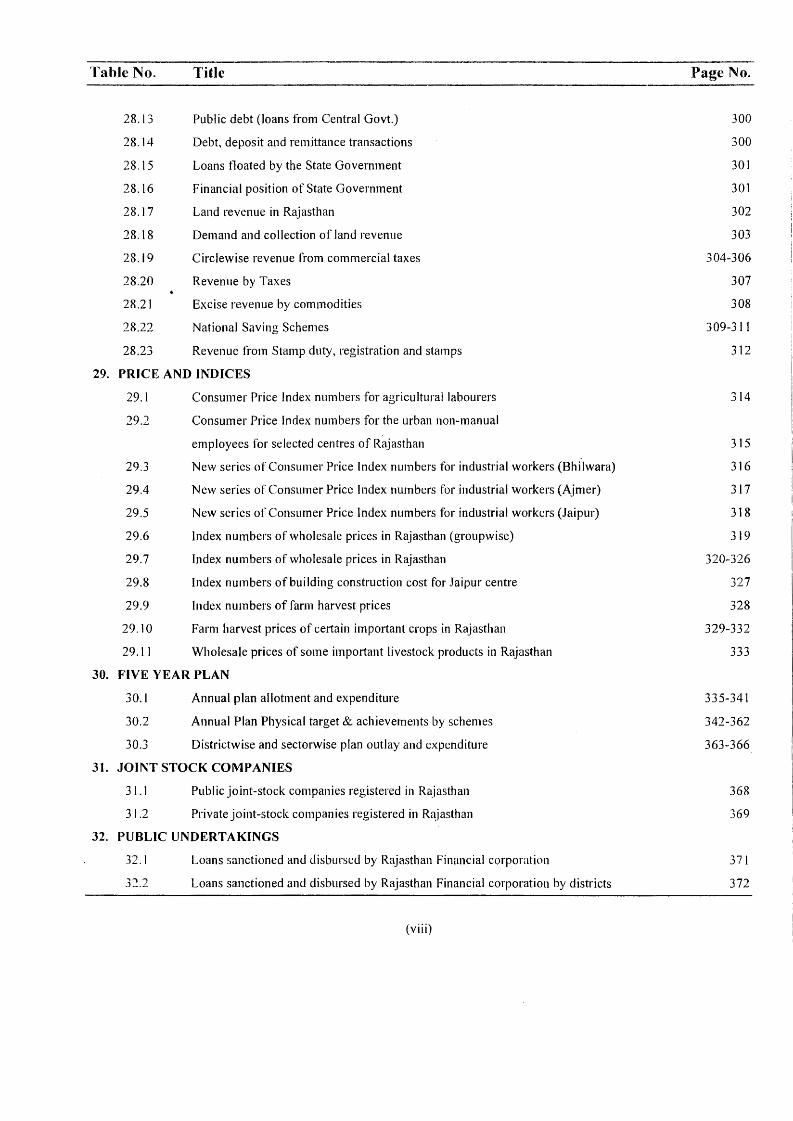
Table No.
28.13
28.14
28.15
28.16
28.17
28.18
28.19
28.20
28.21
28.22
28.23
Title
Public debt (loans from Central Govt.)
Debt, deposit and remittance transactions
Loans floated by the State Government
Financial position of State Government
Land revenue in Rajasthan
Demand and collection of land revenue
Circlewise revenue from commercial taxes
Revenue by Taxes
Excise revenue by commodities
National Saving Schemes
Revenue from Stamp duty, registration and stamps
29. PRICE AND INDICES
29.1 Consumer Price Index numbers for agricultural labourers
29.2 Consumer Price Index numbers for the urban non-manual
29.3
29.4
29.5
29.6
29.7
29.8
29.9
29.10
29.11
employees for selected centres of Rajasthan
New series of Consumer Price Index numbers for industrial workers (Bhilwara)
New series of Consumer Price Index numbers for industrial workers (Ajmer)
New series of Consumer Price Index numbers for industrial workers (Jaipur)
Index numbers of wholesale prices in Rajasthan (groupwise)
Index numbers of wholesale prices in Rajasthan
Index numbers of building construction cost for Jaipur centre
Index numbers of farm harvest prices
Farm harvest prices of certain important crops in Rajasthan
Wholesale prices of some important livestock products in Rajasthan
30. FIVE YEAR PLAN
30.l
30.2
30.3
Annual plan allotment and expenditure
Annual Plan Physical target & achievements by schemes
Districtwise and sectorwise plan outlay and expenditure
31. JOINT STOCK COMPANIES
3 I.l
31.2
Public joint-stock companies registered in Rajasthan
Private joint-stock companies registered in Rnjasthan
32. PUBLIC UNDERTAKINGS
32.1 ,, ') .. L: .. -..
Loans sanctioned and disbursed by Rajasthan Financial corporation
Loans sanctioned and disbursed by Rajasthan Financial corporation by districts
(viii)
Page No.
300
300
301
301
302
303
304-306
307
308
309-311
312
314
315
316
317
318
319
320-326
327
328
329-332
333
335-341
342-362
363-366
368
369
371
372
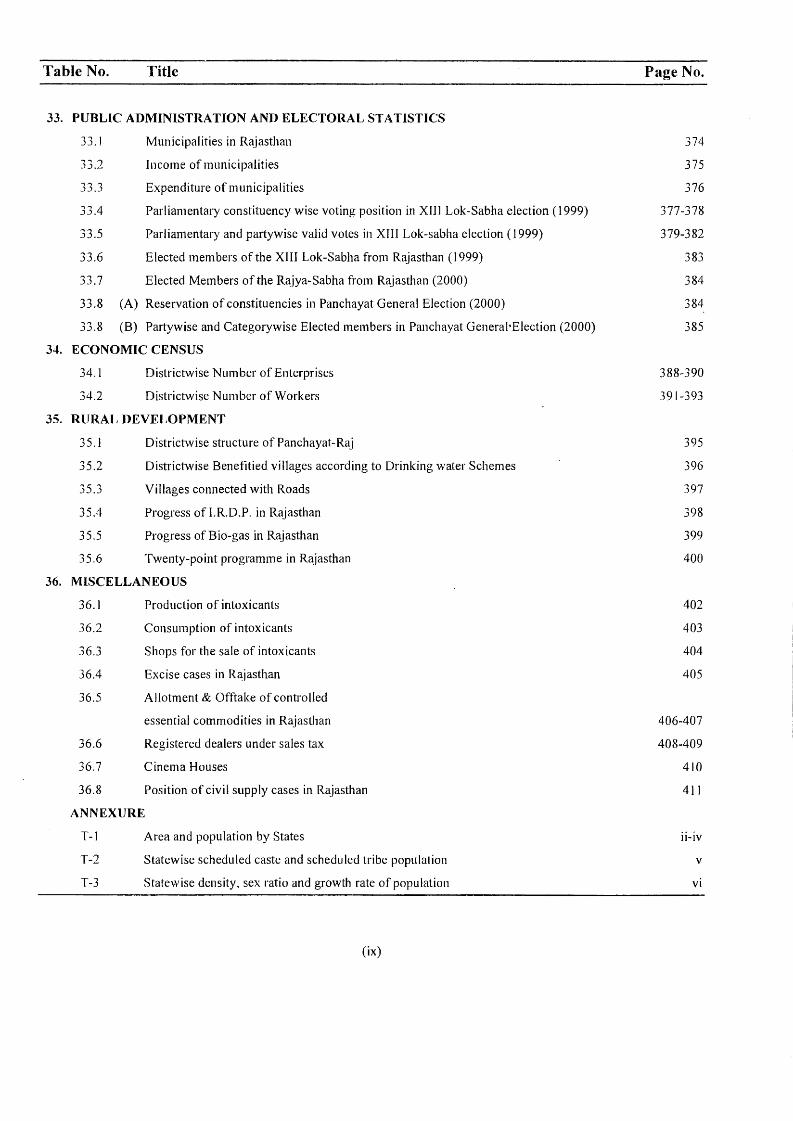
Table No. Title
33. PUBLIC ADMINISTRATION AND ELECTORAL STA TlSTICS
33. 1
33.2
33.3
33.4
33.5
33.6
33.7
33.8 (A)
Municipalities in Rajasthan
Income of municipalities
Expenditure of municipalities
Parliamentary constituency wise voting position in Xlll Lok-Sabha election (1999)
Parliamentary and partywise valid votes in XIII Lok-sabha election (1999)
Elected members of the XIII Lok-Sabha from Rajasthan ( 1999)
Elected Members of the Rajya-Sabha from Rajasthan (2000)
Reservation of constituencies in Panchayat General Election (2000)
33.8 (B) Partywise and Categorywise Elected members in Panchayat General·Election (2000)
34. ECONOMIC CENSUS
34.1
34.2
Districtwise Number of Enterprises
Districtwise Number of Workers
35. RURAL DEVELOPMENT
35.1
35.2
35.3
35.4
35.5
35.6
Districtwise structure of Panchayat-Raj
Districtwise Benefitied villages according to Drinking water Schemes
Villages connected with Roads
Progress of I.R.D.P. in Rajasthan
Progress of Bio-gas in Rajasthan
Twenty-point programme in Rajasthan
36. MISCELLANEOUS
36.l
36.2
36.3
36.4
Production of intoxicants
Consumption of intoxicants
Shops for the sale of intoxicants
Excise cases in Rajasthan
36.5 Allotment & Offtake of controlled
essential commodities in Rajasthan
36.6
36.7
36.8
Registered dealers under sales tax
Cinema Houses
Position of civil supply cases in Rajasthan
ANNEXURE
T-1
T-2
T-3
Area and population by States
Statewise scheduled caste and scheduled tribe population
Statewise density, sex ratio and growth rate of population
(ix)
Page No.
374
375
376
377-378
379-382
383
384
384
385
388-390
391-393
395
396
397
398
399
400
402
403
404
405
406-407
408-409
410
411
ii-iv
v
vi
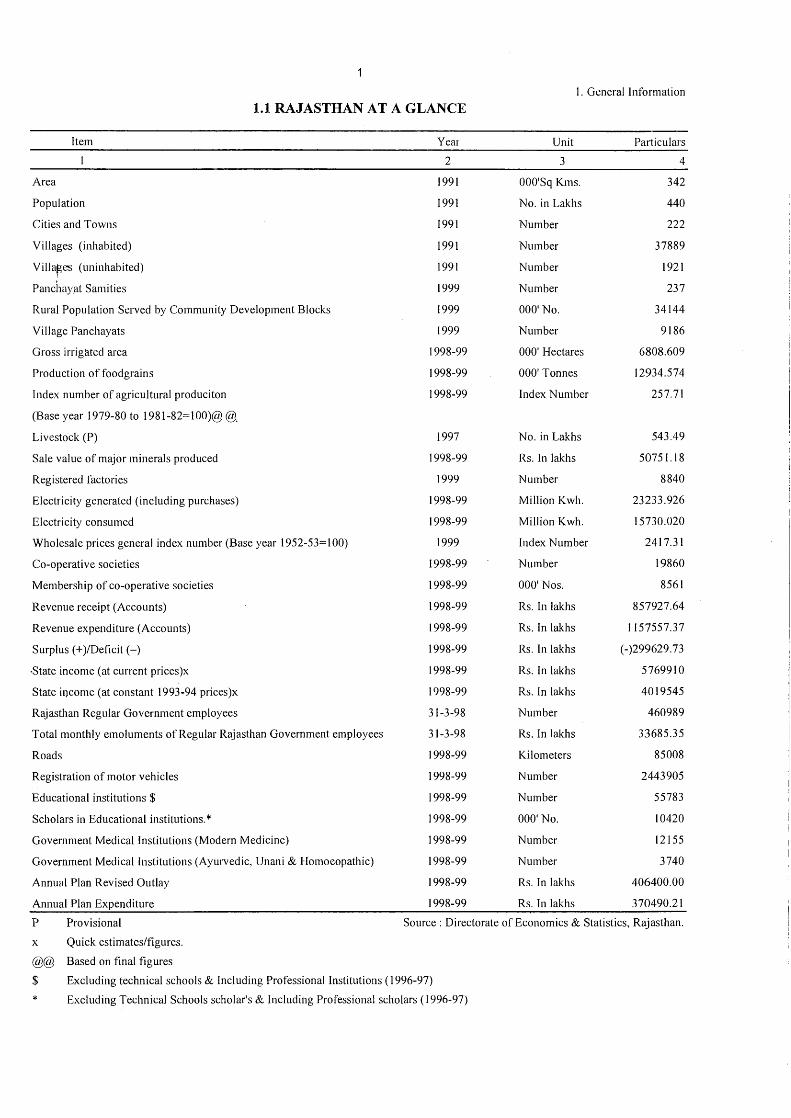
1.1 RAJASTHAN AT A GLANCE
Item
Area
Population
Cities and Towns
Villages (inhabited)
Villa~es (uninhabited)
Panchayat Samities
Rural Population Served by Community Development Blocks
Village Panchayats
Gross irrigated area
Production of foodgrains
Index number of agricultural produciton
(Base year 1979-80 to 1981-82= 100)@ @.
Livestock (P)
Sale value of major minerals produced
Registered factories
Electricity generated (including purchases)
Electricity consumed
Wholesale prices general index number (Base year 1952-53= 100)
Co-operative societies
Membership of co-operative societies
Revenue receipt (Accounts)
Revenue expenditure (Accounts)
Surplus (+)/Deficit(-)
-State income (at current prices)x
State i1wome (at constant 1993-94 prices)x
Rajasthan Regular Government employees
Total monthly emoluments of Regular Rajasthan Government employees
Roads
Registration of motor vehicles
Educational institutions $
Scholars in Educational institutions.*
Government Medical Institutions (Modern Medicine)
Government Medical Institutions (Ayurvedic, Unani & Homoeopathic)
Annual Plan Revised Outlay
Annual Plan Expenditure
Year
2
1991
1991
1991
1991
1991
1999
1999
1999
1998-99
1998-99
1998-99
1997
1998-99
1999
1998-99
1998-99
1999
1998-99
1998-99
1998-99
1998-99
1998-99
1998-99
1998-99
31-3-98
31-3-98
1998-99
1998-99
1998-99
1998-99
1998-99
1998-99
1998-99
1998-99
1. General Information
Unit Particulars
3 4
OOO'Sq Kms. 342
No. in Lakhs 440
Number 222
Number 37889
Number 1921
Number 237
000' No. 34144
Number 9186
000' Hectares 6808.609
000' Tonnes 12934.574
Index Number 257.71
No. in Lakhs 543.49
Rs. In lakhs 50751.18
Number 8840
Million Kwh. 23233.926
Million Kwh. 15730.020
Index Number 2417.31
Number 19860
000' Nos. 8561
Rs. In lakhs 857927.64
Rs. In lakhs 1157557.37
Rs. In lakhs (-)299629.73
Rs. In lakhs 5769910
Rs. In lakhs 4019545
Number 460989
Rs. In lakhs 33685.35
Kilometers 85008
Number 2443905
Number 55783
000' No. 10420
Number 12155
Number 3740
Rs. In lakhs 406400.00
Rs. In lakhs 370490.21
P Provisional Source : Directorate of Economics & Statistics, Rajasthan.
x Quick estimates/figures.
@@ Based on final figures
$ Excluding technical schools & Including Professional Institutions ( 1996-97)
* Excluding Technical Schools scholar's & Including Professional scholars (I 996-97)
2
I. General Information
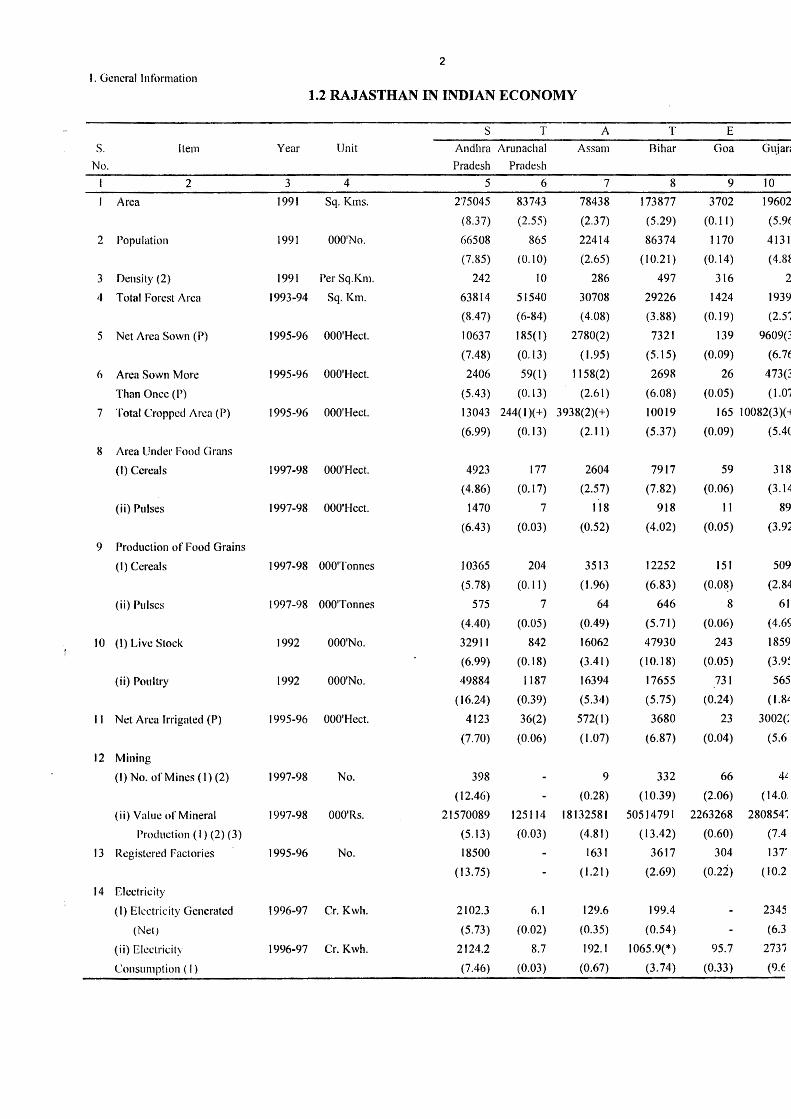
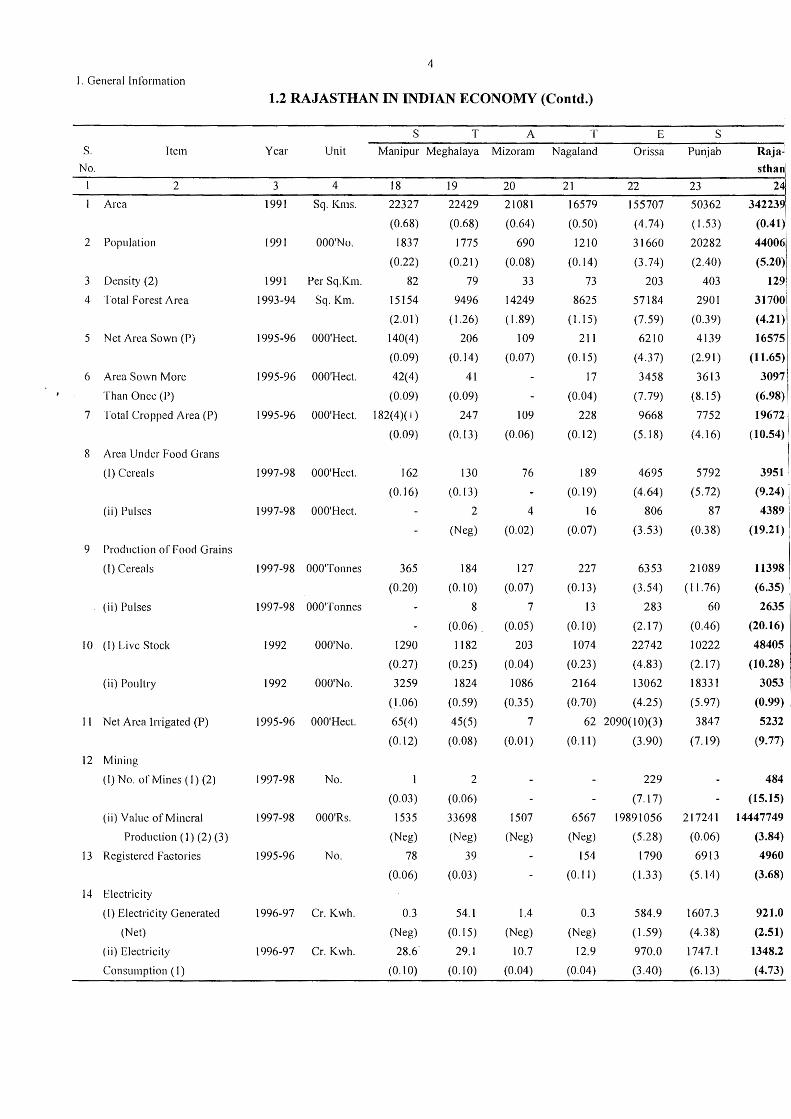
1.2 RAJASTHAN IN INDIAN ECONOMY
s T A T E
s. Item Year Unit Andhra Arunachal Assam Bihar Goa Gujan
No. Pradesh Pradesh
2 3 4 5 6 7 8 9 10
Area 1991 Sq. Kms. 275045 83743 78438 173877 3702 196021
(8.37) (2.55) (2.37) (5.29) (0.11) (5.961
2 Population 1991 OOO'No. 66508 865 22414 86374 1170 4131
(7.85) (0.10) (2.65) (10.21) (0. 14) (4.88
3 Density (2) 1991 Per Sq.Km. 242 to 286 497 316 21 4 Total Forest Area 1993-94 Sq. Km. 63814 51540 30708 29226 1424 1939)
(8.47) (6-84) ( 4.08) (3.88) (0.19) (2.57
5 Net Area Sown (P) 1995-96 OOO'Hect. 10637 185(1) 2780(2) 7321 139 9609(3
(7.48) (0.13) (1.95) (5. l 5) (0.09) (6.76
6 Area Sown More 1995-96 OOO'Hect. 2406 59( I) 1158(2) 2698 26 473(3'
Than Once ( P) (5.43) (0.13) (2.61) (6.08) (0.05) (t.07
7 Total Cropped Area (P) 1995-96 OOO'Hect. 13043 244(1 )(+) 3938(2)(+) 10019 165 10082(3 )( +
(6.99) (0. l 3) (2.11) (5.37) (0.09) (5.40
8 Area Under Food Grans
(I) Cereals 1997-98 OOO'Hect. 4923 177 2604 7917 59 318'.
(4.86) (0.17) (2.57) (7.82) (0.06) (3. 14
(ii) Pulses 1997-98 OOO'Hect. 1470 7 118 918 11 89:
(6.43) (0.03) (0.52) (4.02) (0.05) (3.92
9 Production of Food Grains
(I) Cereals 1997-98 OOO'Tonnes 10365 204 3513 12252 151 509 1
(5.78) (0.11) (1.96) (6.83) (0.0~) (2.84
(ii) Pulses 1997-98 OOO'Tonnes 575 7 64 646 8 61
(4.40) (0.05) (0.49) (5.71) (0.06) (4.6S
10 (I) Live Stock 1992 OOO'No. 32911 842 16062 47930 243 1859
(6.99) (0.18) (3.41) ( 10.18) (0.05) (3.9~
(ii) Poultry 1992 OOO'No. 49884 1187 16394 17655 731 565
(16.24) (0.39) (5.34) (5.75) (0.24) ( l.8L
11 Net Area Irrigated (P) 1995-96 OOO'Hect. 4123 36(2) 572( I) 3680 23 3002(:
(7.70) (0.06) (1.07) (6.87) (0.04) (5.6
12 Mining
(I) No. of Mines ( l) (2) 1997-98 No. 398 9 332 66 4~
( 12.46) (0.28) (10.39) (2.06) (14.0:
(ii) Value of Mineral 1997-98 OOO'Rs. 21570089 125114 18132581 50514791 2263268 280854~
Production ( l) (2) (3) (5.13) (0.03) (4.81) ( 13.42) (0.60) (7.41
13 Registered Factories 1995-96 No. 18500 1631 3617 304 IJT
(13.75) (1.21) (2.69) (0.22) (10.2
14 Electricity
(I) Electricity Generated 1996-97 Cr. Kwh. 2102.3 6.1 129.6 199.4 2345
(Net) (5.73) (0.02) (0.35) (0.54) (6.3
(ii) Electricity 1996-97 Cr. Kwh. 2124.2 8.7 192.I 1065.9(*) 95.7 2731
Consumption ( I) (7.46) (0.03) (0.67) (3. 74) (0.33) (9.6
Item ,),
2
Area
' Population
) Density (2)
I Total Forest Area
Net Arca Sown (P)
() Area Sown More
Than Once (P)
7 Total Cropped Area (P)
K Area Under Food Grans
(I) Cereals
(ii) Pulses
9 Production of Food Grains
(I) Cereals
(ii) Pulses
10 (I) Live Stock
(ii) Poultry
I I Net Area Irrigated (P)
12 Mining
(I) No. of Mines ( l) (2)
(ii) Value of Mineral
Production ( l) (2) (3)
13 Registered Factories
14 Electricity
(l) Eledricity Generated
(Net)
(ii) Electricity
Consumption ( l)
3
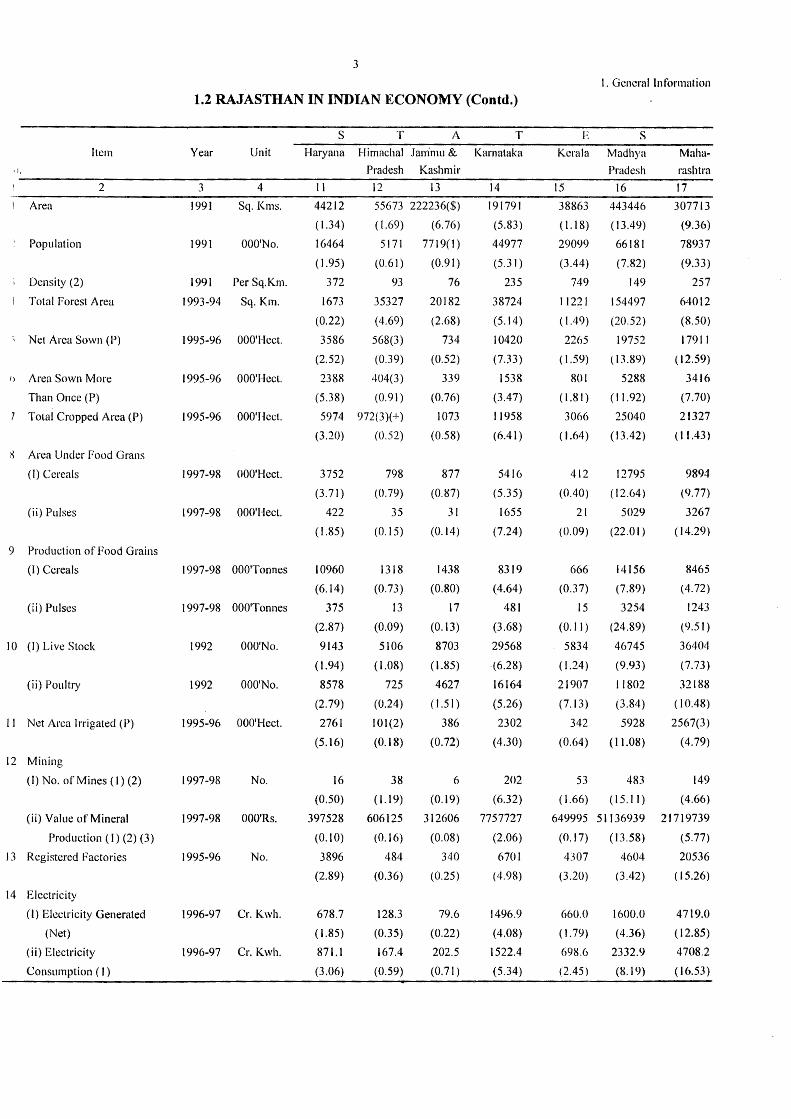
1.2 RAJASTHAN IN INDIAN ECONOMY (Contd.)
Year Unit
3 4
1991 Sq. Kms.
1991 OOO'No.
1991 Per Sq.Km.
1993-94 Sq. Km.
1995-96 OOO'Hect.
1995-96 OOO'Hcct.
1995-96 OOO'Hcct.
1997-98 OOO'Hect.
1997-98 OOO'Hect.
1997-98 OOO'Tonnes
1997-98 OOO'Tonnes
1992 OOO'No.
1992 OOO'No.
1995-96 OOO'Hect.
1997-98 No.
1997-98 OOO'Rs.
1995-96 No.
1996-97 Cr. Kwh.
1996-97 Cr. Kwh.
s Haryana
11
44212
( 1.34)
16464
( 1.95)
372
1673
(0.22)
3586
(2.52)
T A
Himachal Janimu &
Pradesh Kashmir
12 13
55673 222236($)
(l.69) (6.76)
5171
(0.61)
93
35327
(4.69)
568(3)
(0.39)
2388 404(3)
7719(1)
(0.91)
76
20182
(2.68)
734
(0.52)
339
(0.76)
1073
(0.58)
(5.38) (0.91)
5974 972(3)(+)
(3.20) (0.52)
3752
(3.71)
422
( 1.85)
10960
(6.14)
375
(2.87)
9143
( l.94)
8578
(2.79)
2761
(5.16)
16
(0.50)
397528
(0.10)
3896
(2.89)
678.7
( 1.85)
871.l
(3.06)
798
(0.79)
35
(0.15)
1318
(0.73)
13
(0.09)
5106
( 1.08)
725
(0.24)
I 01 (2)
(0.18)
38
( 1.19)
606125
(0.16)
484
(0.36)
128.3
(0.35)
167.4
(0.59)
877
(0.87)
31
(0.14)
1438
(0.80)
17
(0.13)
8703
( 1.85)
4627
(1.51)
386
(0. 72)
6
(0.19)
312606
(0.08)
340
(0.25)
79.6
(0.22)
202.5
(0.71)
T
Karnataka
14
191791
(5.83)
44977
(5.31)
235
38724
(5.14)
10420
(7.33)
1538
(3.47)
11958
(6.41)
5416
(5.35)
1655
(7.24)
8319
(4.64)
481
(3.68)
29568
(6.28)
16164
(5.26)
2302
(4.30)
202
(6.32)
7757727
(2.06)
6701
(4.98)
1496.9
(4.08)
1522.4
(5.34)
I. General Information
E
Kera la
15
38863
( 1.18)
29099
(3.44)
749
11221
( 1.49)
2265
( 1.59)
801
( 1.81)
3066
( 1.64)
412
(0.40)
21
(0.09)
666
(0.37)
15
(0.11)
5834
( 1.24)
21907
(7.13)
342
(0.64)
53
(1.66)
s Madhya
Pradesh
16
443446
( 13.49)
66181
(7.82)
149
154497
(20.52)
19752
( 13.89)
5288
( 11.92)
25040
(I 3.42)
12795
(12.64)
5029
(22.01)
14156
(7.89)
3254
(24.89)
46745
(9.93)
11802
(3.84)
5928
(11.08)
483
(I 5.11)
649995 51136939
(0.17) ( 13.58)
4307
(3.20)
660.0
(I. 79)
698.6
(2.45)
4604
(3.42)
1600.0
(4.36)
2332.9
(8.19)
Maha
rashtra
17
307713
(9.36)
78937
(9.33)
257
64012
(8.50)
17911
( 12.59)
3416
(7.70)
21327
(11.43)
9894
(9.77)
3267
( 14.29)
8465
(4. 72)
1243
(9.51)
36404
( 7. 73)
32188
(I 0.48)
2567(3)
(4.79)
149
(4.66)
21719739
(5.77)
20536
(15.26)
4719.0
( 12.85)
4708.2
( 16.53)
4
I. General Information
1.2 RAJASTHAN IN INDIAN ECONOMY (Contd.)
s T A T E s S. Item Year Unit Manipur Meghalaya Mizoram Nagai and Orissa Punjab Raja-!
No. sthan\ 2 3 4 18 19 20 21 22 23 2~
Area 1991 Sq. Kms. 22327 22429 21081 16579 155707 50362 3422391
(0.68) (0.68) (0.64) (0.50) (4.74) ( 1.53) (0.41)
2 Population 1991 OOO'No. 1837 1775 690 1210 31660 20282 44006
(0.22) (0.21) (0.08) (0. 14) (3. 74) (2.40) (5.20)
3 Density (2) 1991 Per Sq.Km. 82 79 33 73 203 403 129
4 Total Forest Area I 993-94 Sq. Km. 15154 9496 14249 8625 57184 2901 31700
(2.01) (l.26) ( 1.89) ( 1.15) (7.59) (0.39) (4.21)1
5 Net Area Sown (P) 1995-96 OOO'Hect. 140(4) 206 109 211 6210 4139 16575
(0.09) (0.14) (0.07) (0. 15) (4.37) (2.91) (11.65)
6 Area Sown More 1995-96 OOO'Hect. 42(4) 41 17 3458 3613 3097
Than Once (P) (0.09) (0.09) (0.04) (7.79) (8.15) (6.98)
7 Total Cropped Area (P) I 995-96 OOO'Hect. 182(4)(+) 247 109 228 9668 7752 19672
(0.09) (0. I 3) (0.06) (0.12) (5.18) (4. 16) (10.54)
8 Area Under Food Grans
(I) Cereals 1997-98 OOO'Hect. 162 130 76 189 4695 5792 3951
(0. 16) (0.13) (0.19) (4.64) (5.72) (9.24)
(ii) Pulses 1997-98 OOO'Hect. 2 4 16 806 87 4389
(Neg) (0.02) (0.07) (3.53) (0.38) (19.21)
9 Production of Food Grains
(I) Cereals 1997-98 OOO'Tonnes 365 184 127 227 6353 21089 11398
(0.20) (0.10) (0.07) (0.13) (3.54) (l 1. 76) (6.35)
(ii) Pulses 1997-98 OOO'Tonnes 8 7 13 283 60 2635
(0.06) . (0.05) (0.10) (2.17) (0.46) (20.16)
IO (I) Live Stock 1992 OOO'No. 1290 1182 203 1074 22742 10222 48405
(0.27) (0.25) (0.04) (0.23) (4.83) (2. I 7) (10.28)
(ii) Poultry 1992 OOO'No. 3259 1824 1086 2164 13062 18331 3053
(1.06) (0.59) (0.35) (0.70) (4.25) (5.97) (0.99)
I I Net Area Irrigated (P) 1995-96 OOO'Hect. 65(4) 45(5) 7 62 2090(10)(3) 3847 5232
(0.12) (0.08) (0.01) (0.11) (3.90) (7.19) (9.77)
12 Mining
(I) No. of Mines (I) (2) 1997-98 No. I 2 229 484
(0.03) (0.06) (7.17) (15.15) i
(ii) Value of Mineral 1997-98 OOO'Rs. 1535 33698 1507 6567 19891056 217241 14447749
Production (I) (2) (3) (Neg) (Neg) (Neg) (Neg) (5.28) (0.06) (3.84)
13 Registered FaGtories 1995-96 No. 78 39 154 1790 6913 4960
(0.06) (0.03) (0.11) (1.33) (5.14) (3.68)
14 Electricity
(I) Electricity Generated 1996-97 Cr. Kwh. 0.3 54.1 1.4 0.3 584.9 1607.3 921.0
(Net) (Neg) (0.15) (Neg) (Neg) (1.59) (4.38) (2.51)
(ii) Electricity 1996-97 Cr. Kwh. 28.6' 29.1 10.7 12.9 970.0 1747.1 1348.2
Consumption (I) (0.10) (0.10) (0.04) (0.04) (3.40) (6.13) (4.73)
5
l. General Information
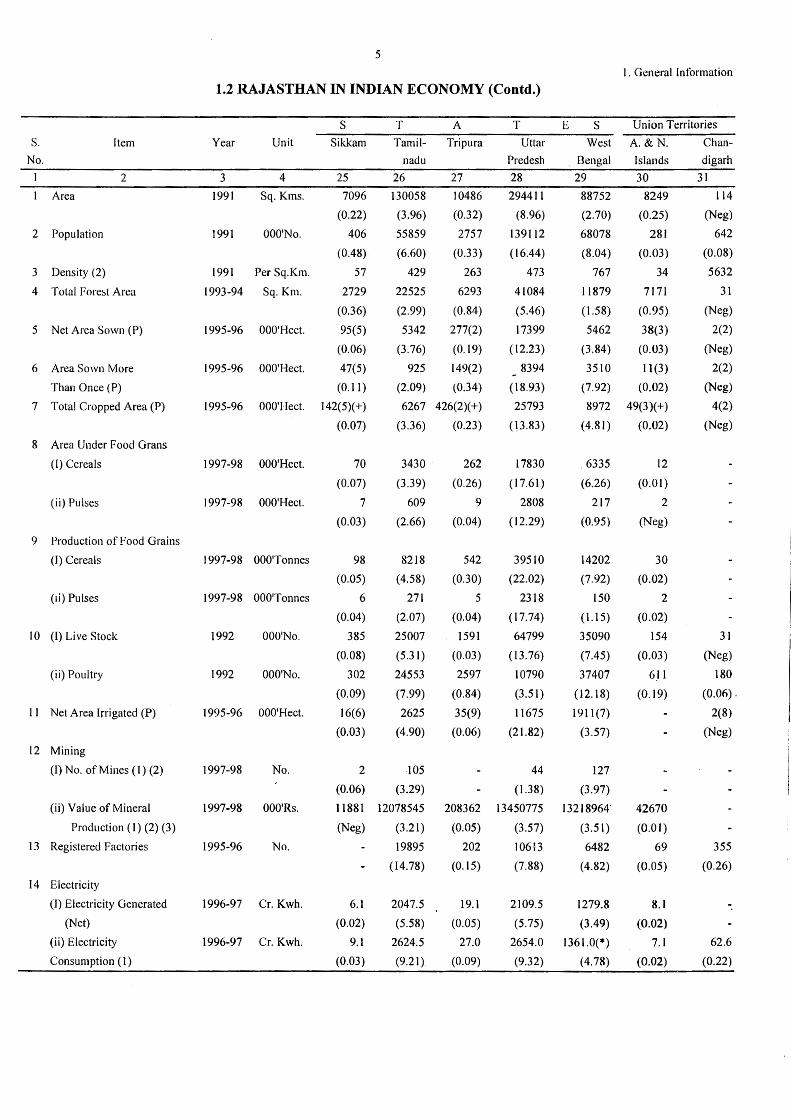
1.2 RAJASTHAN IN INDIAN ECONOMY (Contd.)
s T A T E s Union Territories
S. Item Year Unit Sikkam Tamil- Tripura Uttar West A.& N. Chan-
No. nadu Predesh . Bengal Islands digarh
2 3 4 25 26 27 28 29 30 31
Area 1991 Sq. Kms. 7096 130058 10486 294411 88752 8249 114
(0.22) (3.96) (0.32) (8.96) (2.70) (0.25) (Neg)
2 Population 1991 OOO'No. 406 55859 2757 139112 68078 281 642
(0.48) (6.60) (0.33) (16.44) (8.04) (0.03) (0.08)
3 Density (2) 1991 Per Sq.Km. 57 429 263 473 767 34 5632
4 Total Forest Area 1993-94 Sq. Km. 2729 22525 6293 41084 11879 7171 31
(0.36) (2.99) (0.84) (5.46) (1.58) (0.95) (Neg)
5 Net Area Sown (P) 1995-96 OOO'Hect. 95(5) 5342 277(2) 17399 5462 38(3) 2(2)
(0.06) (3.76) (0.19) ( 12.23) (3.84) (0.03) (Neg)
6 Area Sown More 1995-96 OOO'Hect. 47(5) 925 149(2) 8394 3510 11(3) 2(2)
Than Once (P) (0.11) (2.09) (0.34) (18.93) (7.92) (0.02) (Neg)
7 Total Cropped Area (P) 1995-96 OOO'Hect. 142(5)(+) 6267 426(2)(+) 25793 8972 49(3)(+) 4(2)
(0.07) (3.36) (0.23) p 3.83) (4.81) (0.02) (Neg)
8 Area Under Food Grans
(I) Cereals 1997-98 OOO'Hect. 70 3430 262 17830 . 6335 12
(0.07) (3.39) (0.26) (17.61) (6.26) (0.01)
(ii) Pulses 1997-98 OOO'Hect. 7 609 9 2808 217 2
(0.03) (2.66) (0.04) (12.29) (0.95) (Neg)
9 Production of Food Grains
(I) Cereals 1997-98 OOO'Tonnes 98 8218 542 39510 14202 30
(0.05) (4.58) (0.30) (22.02) (7.92) (0.02)
(1i) Pulses 1997-98 OOO'Tonnes 6 271 5 2318 150 2
(0.04) (2.07) (0.04) (17.74) ( 1.15) (0.02)
10 (I) Live Stock 1992 OOO'No. 385 25007 1591 64799 35090 154 31
(0.08) (5.31) (0.03) (13.76) (7.45) (0.03) (Neg)
(ii) Poultry 1992 OOO'No. 302 24553 2597 10790 37407 6,11 180
(0.09) (7.99) (0.84) (3.51) (12.18) (0.19) (0.06).
11 Net Area Irrigated (P) 1995-96 OOO'Hect. 16(6) 2625 35(9) 11675 1911(7) 2(8)
(0.03) (4.90) (0.06) (21.82) (3.57) (Neg)
12 Mining
(I) No. of Mines ( l) (2) 1997-98 No. 2 -105 44 127
(0.06) (3.29) (1.38) (3.97)
(ii) Value of Mineral 1997-98 OOO'Rs. 11881 12078545 208362 13450775 13218964' 42670
Production (l) (2) (3) (Neg) (3.21) (0.05) (3.57) (3.51) (0.01)
13 Registered Factories 1995-96 No. 19895 202 10613 6482 69 355
(14.78) (0.15) (7.88) (4.82) (0.05) (0.26)
14 Electricity
{I) Electricity Generated 1996-97 Cr. Kwh. 6.1 2047.5 19.1 2109.5 1279.8 8.1 -(Net) (0.02) (5.58) (0.05) (5.75) (3.49) (0.02)
(ii) Electricity 1996-97 Cr. Kwh. 9.1 2624.5 27.0 2654.0 1361.0(*) 7.1 62.6
Consumption ( 1) (0.03) (9.21) (0.09) (9.32) (4.78) (0.02) (0.22)
6
I. General Information
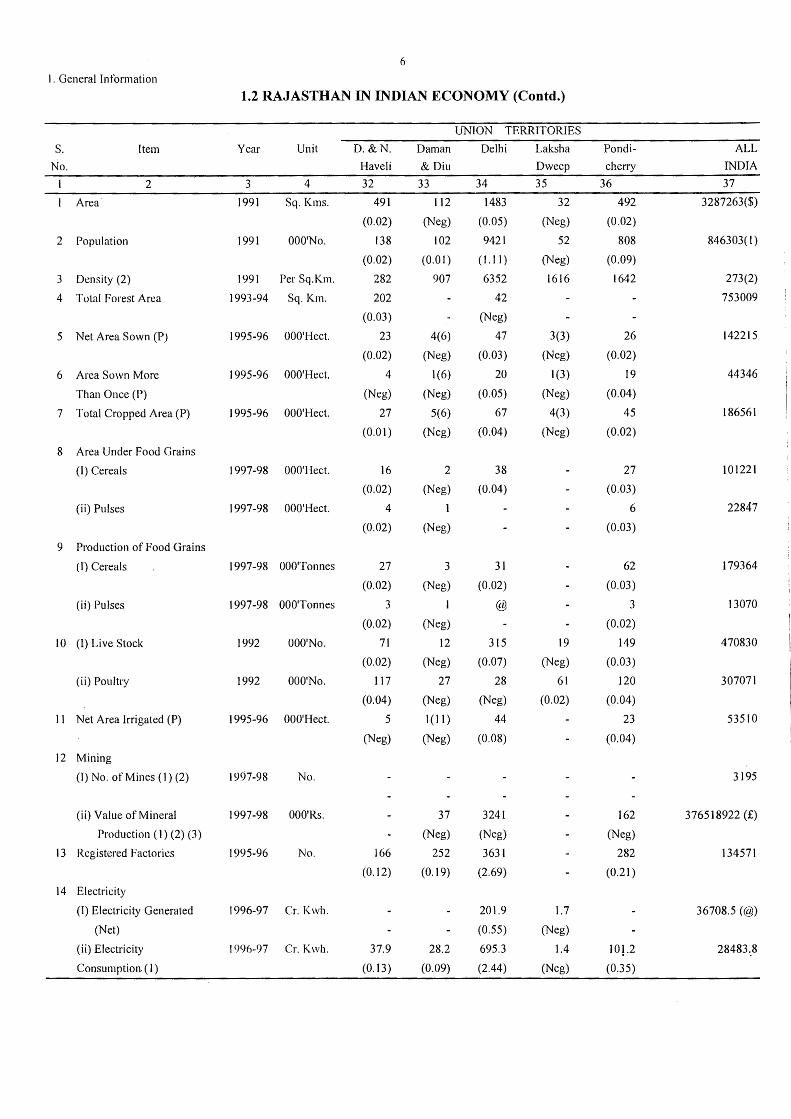
1.2 RAJASTHAN IN INDIAN ECONOMY (Contd.)
UNION TERRITORIES
S. Item Year Unit D.&N. Daman Delhi Laksha Pondi- ALL
No. Haveli &Diu Dweep cherry INDIA
2 3 4 32 33 34 35 36 37
Area 1991 Sq. Kms. 491 112 1483 32 492 3287263($)
(0.02) (Neg) (0.05) (Neg) (0.02)
2 Population 1991 OOO'No. 138 102 9421 52 808 846303( I)
(0.02) (0.0 I) ( 1.11) (Neg) (0.09)
3 Density (2) 1991 Per Sq.Km. 282 907 6352 1616 1642 273(2)
4 Total Forest Area 1993-94 Sq. Km. 202 42 753009
(0.03) (Neg)
5 Net Area Sown (P) 1995-96 OOO'Hect. 23 4(6) 47 3(3) 26 142215
(0.02) (Neg) (0.03) (Neg) (0.02)
6 Area Sown More 1995-96 OOO'Hect. 4 1(6) 20 1(3) 19 44346
Than Once (P) (Neg) (Neg) (0.05) (Neg) (0.04)
7 Total Cropped Area (P) I 995-96 OOO'Hect. 27 5(6) 67 4(3) 45 186561
(0.01) (Neg) (0.04) (Neg) (0.02)
8 Area Under Food Grains
(I) Cereals 1997-98 000'1-Iect. 16 2 38 27 101221
(0.02) (Neg) (0.04) (0.03)
(ii) Pulses 1997-98 OOO'Hect. 4 I 6 22847
(0.02) (Neg) (0.03)
9 Production of Food Grains
(T) Cereals 1997-98 OOO'Tonnes 27 3 31 62 179364
(0.02) (Neg) (0.02) (0.03)
(ii) Pulses 1997-98 OOO'Tonnes 3 1 @ 3 13070
(0.02) (Neg) (0.02)
10 (I) Live Stock 1992 OOO'No. 71 12 315 19 149 470830
(0.02) (Neg) (0.07) (Neg) (0.03)
(ii) Poultry 1992 OOO'No. 117 27 28 61 120 307071
(0.04) (Neg) (Neg) (0.02) (0.04)
11 Net Area Irrigated (P) 1995-96 OOO'Hect. 5 1(I1) 44 23 53510
(Neg) (Neg) (0.08) (0.04)
12 Mining
(I) No. of Mines (I) (2) 1997-98 No. 3195
(ii) Value of Mineral 1997-98 OOO'Rs. 37 3241 162 376518922 (£)
Production (I) (2) (3) (Neg) (Neg) (Neg)
13 Registered Factories 1995-96 No. 166 252 3631 282 134571
(0.12) (0.19) (2.69) (0.21)
14 Electricity
(I) Electricity Generated 1996-97 Cr. Kwh. 201.9 1.7 36708.5 (@)
(Net) (0.55) (Neg)
(ii) Electricity 1996-97 Cr. Kwh. 37.9 28.2 695.3 1.4 10}.2 28483.8
Consumption. ( 1) (0. 13) (0.09) (2.44) (Neg) (0.35)
7
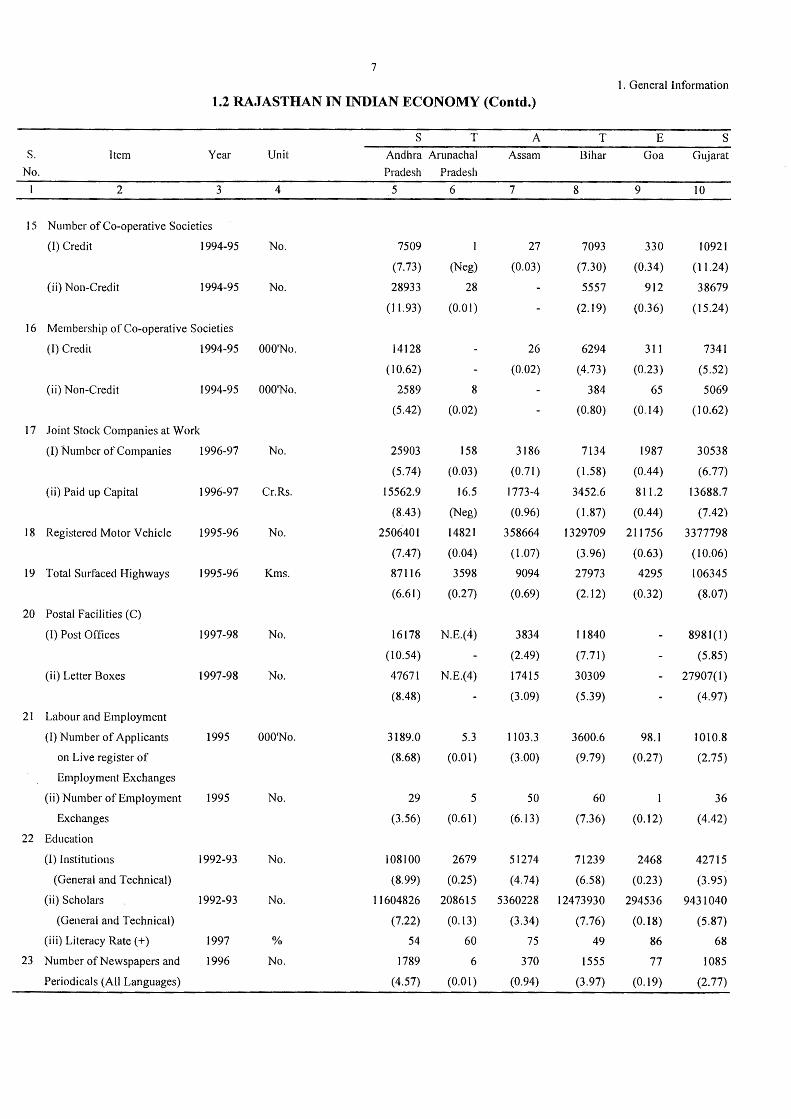
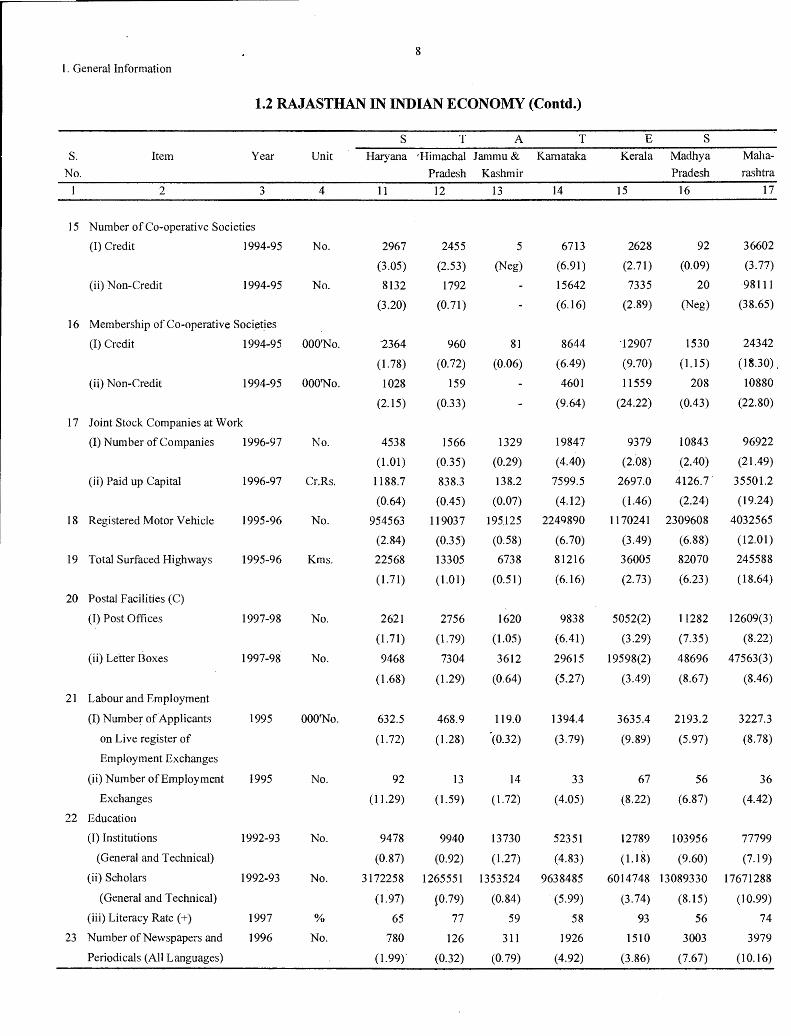
1.2 RAJASTHAN IN INDIAN ECONOMY (Contd.)
S. Item Year Unit
No.
2 3 4
15 Number of Co-operative Societies
(I) Credit 1994-95 No.
(ii) Non-Credit 1994-95 No.
16 Membership of Co-operative Societies
(I) Credit 1994-95 OOO'No.
(ii) Non-Credit 1994-95 OOO'No.
17 Joint Stock Companies at Work
(I) Number of Companies 1996-97
(ii) Paid up Capital
18 Registered Motor Vehicle
19 Total Surfaced Highways
20 Postal Facilities (C)
(I) Post Offices
(ii) Letter Boxes
21 Labour and Employment
(I) Number of Applicants
on Live register of
Employment Exchanges
(ii) Number of Employment
Exchanges
22 Education
1996-97
1995-96
1995-96
1997-98
1997-98
1995
1995
(I) Institutions 1992-93
(General and Technical)
(ii) Scholars 1992-93
(General and Technical)
(iii) Literacy Rate(+) 1997
23 Number of Newspapers and 1996
Periodicals (All Languages)
No.
Cr.Rs.
No.
Kms.
No.
No.
OOO'No.
No.
No.
No.
%
No.
s T
Andhra Arunachal
Pradesh Pradesh
5
7509
(7.73)
28933
(ll.93)
14128
(10.62)
2589
(5.42)
25903
(5.74)
15562.9
(8.43)
2506401
(7.47)
87116
(6.61)
6
(Neg)
28
(0.01)
8
(0.02)
158
(0.03)
16.5
(Neg)
14821
(0.04)
3598
(0.27)
16178 N.E.(4)
(10.54)
47671 N.E.(4)
(8.48)
3189.0
(8.68)
29
(3.56)
108100
(8. 99)
11604826
(7.22)
54
1789
(4.57)
5.3
(0.01)
5
(0.61)
2679
(0.25)
208615
(0.13)
60
6
(0.01)
A
Assam
7
27
(0.03)
26
(0.02)
3186
(0.71)
1773-4
(0.96)
358664
( 1.07)
9094
(0.69)
3834
(2.49)
17415
(3.09)
1103.3
(3.00)
50
(6.13)
51274
(4.74)
5360228
(3.34)
75
370
(0.94)
T
Bihar
8
7093
(7.30)
5557
(2.19)
6294
(4.73)
384
(0.80)
7134
(1.58)
3452.6
(1.87)
1329709
(3.96)
27973
(2.12)
11840
(7.71)
30309
(5.39)
3600.6
(9.79)
60
(7.36)
71239
(6.58)
12473930
(7. 76)
49
1555
(3.97)
1. General Information
E
Goa
9
330
(0.34)
912
(0.36)
311
(0.23)
65
(0.14)
1987
(0.44)
811.2
(0.44)
211756
(0.63)
4295
(0.32)
98.1
(0.27)
(0.12)
2468
(0.23)
294536
(0.18)
86
77
(0.19)
s Gujarat
10
10921
(11.24)
38679
(15.24)
7341
(5.52)
5069
(10.62)
30538
(6.77)
13688.7
(7.42)
3377798
(10.06)
106345
(8.07)
8981(1)
(5.85)
27907(1)
(4.97)
1010.8
(2.75)
36
(4.42)
42715
(3.95)
9431040
(5.87)
68
1085
(2.77)
8
I . General Information
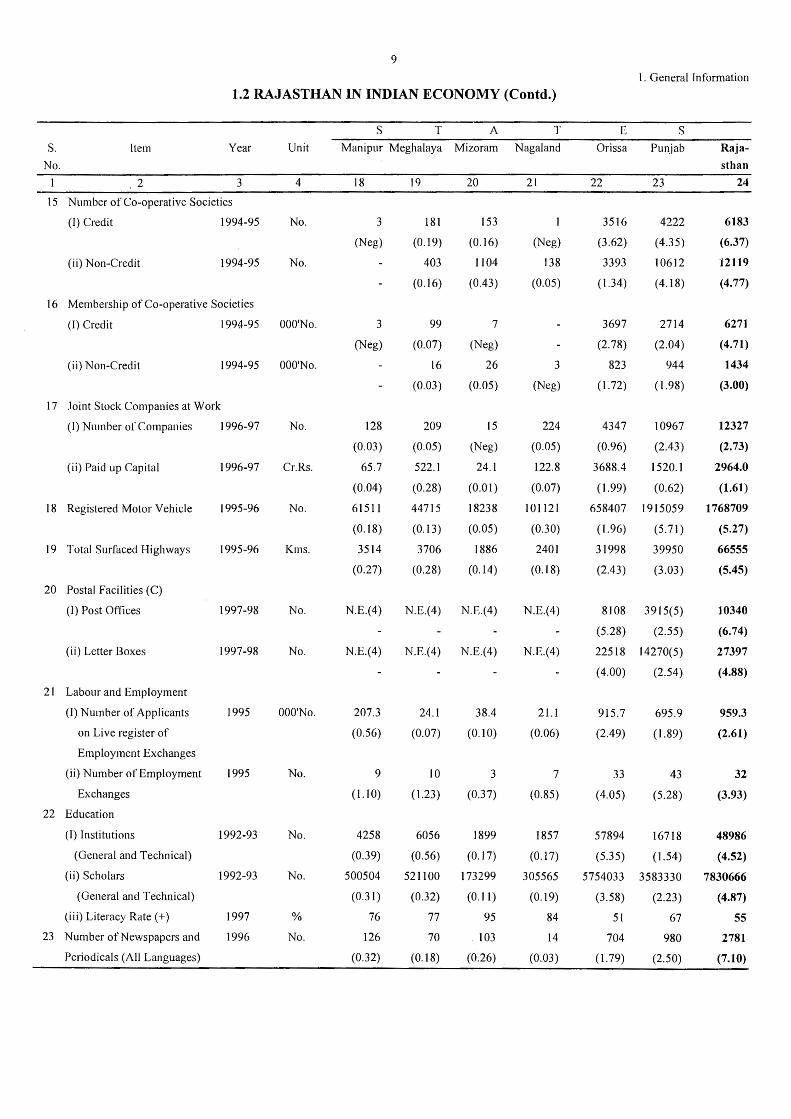
1.2 RAJASTHAN IN INDIAN ECONOMY (Contd.)
S. Item Year Unit
No.
2 3 4
15 Number of Co-operative Societies
(I) Credit 1994-95 No.
(ii) Non-Credit 1994-95 No.
16 Membership of Co-operative Soci~ties
(I) Credit 1994-95 OOO'No.
(ii) Non-Credit 1994-95 OOO'No.
17 Joint Stock Companies at Work
(I) Number of Companies 1996-97
(ii) Paid up Capital
18 Registered Motor Vehicle
19 Total Surfaced Highways
20 Postal Facilities (C)
(I) Post Offices
(ii) Letter Boxes
2 I Labour and Employment
(I) Number of Applicants
on Live register of
Employment Exchanges
(ii) Number of Employment
Exchanges
22 Education
(I) Institutions
(General and Technical)
(ii) Scholars
(General and Technical)
(iii) Literacy Rate(+)
23 Number of Newspapers and
Periodicals (All Languages)
1996-97
1995-96
1995-96
1997-98
1997-98
1995
1995
1992-93
1992-93
1997
1996
No.
Cr.Rs.
No.
Kms.
No.
No.
OOO'No.
No.
No.
No.
%
No.
s T A T
Haryana 'Himachal Jammu & Kamataka
Pradesh Kashmir
11
2967
(3.05)
8132
(3.20)
2364
(1.78)
1028
(2.15)
4538
(1.01)
1188.7
(0.64)
954563
(2.84)
22568
(1.71)
2621
(1.71)
9468
( 1.68)
632.5
(1.72)
92
(11.29)
9478
(0.87)
3172258
(1.97)
65
780
(1.99)'
12 13
2455
(2.53)
1792
(0.71)
960
(0.72)
159
(0.33)
1566
(0.35)
838.3
(0.45)
119037
(0.35)
13305
(LOI)
2756
(1.79)
7304
(1.29)
468.9
(1.28)
13
(1.59)
9940
(0.92)
1265551
{0.79)
77
126
(0.32)
5
(Neg)
81
(0.06)
1329
(0.29)
138.2
(0.07)
195.125
(0.58)
6738
(0.51)
1620
(1.05)
3612
(0.64)
119.0
.(0.32)
14
(I. 72)
13730
(1.27)
1353524
(0.84)
59
311
(0. 79)
14
6713
(6.91)
15642
(6.16)
8644
(6.49)
4601
(9.64)
19847
(4.40)
7599.5
(4.12)
2249890
(6.70)
81216
(6.16)
9838
(6.41)
29615
(5.27)
1394.4
(3.79)
33
(4.05)
52351
(4.83)
9638485
(5.99)
58
1926
(4.92)
E s Kerala Madhya
15
2628
(2.71)
7335
(2.89)
"12907
(9.70)
11559
(24.22)
9379
(2.08)
2697.0
( 1.46)
1170241
(3.49)
36005
(2.73)
5052(2)
(3.29)
19598(2)
(3.49)
3635.4
(9.89)
67
(8.22)
12789
(1.18)
Pradesh
16
92
(0.09)
20
(Neg)
1530
(1.15)
208
(0.43)
10843
(2.40)
4126.7
(2.24)
2309608
(6.88)
82070
(6.23)
11282
(7.35)
48696
(8.67)
2193.2
(5.97)
56
(6.87)
103956
(9.60)
6014748 13089330
(3.74) (8.15)
93 56
1510
(3.86)
3003
(7.67)
Maha
rashtra
17
36602
(3.77)
98111
(38.65)
24342
(IS.30),
10880
(22.80)
96922
(21.49)
35501.2
(19.24)
4032565
( 12.01)
245588
(18.64)
12609(3)
(8.22)
47563(3)
(8.46)
3227.3
(8.78)
36
(4.42)
77799
(7.19)
17671288
(10.99)
74
3979
(10.16)
9
1.2 RAJASTHAN IN INDIAN ECONOMY (Contd.)
S. Item Year Unit
No.
2 3 4
15 Number of Co-operative Societies
(I) Credit 1994-95 No.
(ii) Non-Credit 1994-95 No.
16 Membership of Co-operative Societies
(I) Credit 1994-95 OOO'No.
(ii) Non-Credit 1994-95 OOO'No.
17 Joint Stock Companies at Work
(I) Number of Companies
(ii) Paid up Capital
18 Registered Motor Vehicle
19 Total Surfaced Highways
20 Postal Facilities (C)
(I) Post Offices
(ii) Letter Boxes
21 Labour and Employment
{I) Number of Applicants
on Live register of
Employment Exchanges
(ii) Number of Employment
Exchanges
22 Education
(I) Institutions
(General and Technical)
(ii) Scholars
(General and Technical)
(iii) Literacy Rate ( +)
23 Number ofNewspapers and
Periodicals (All Languages)
1996-97
1996-97
1995-96
1995-96
1997-98
1997-98
1995
1995
1992-93
1992-93
1997
1996
No.
Cr.Rs.
No.
Kms.
No.
No.
OOO'No.
No.
No.
No.
%
No.
s T A T
Manipur Meghalaya Mizoram Nagaland
18
3
(Neg)
3
(Neg)
128
(0.03)
65.7
(0.04)
61511
(0.18)
3514
(0.27)
N.E.(4)
N.E.(4)
207.3
(0.56)
9
(1.10)
4258
(0.39)
500504
(0.31)
76
126
(0.32)
19
181
(0.19)
403
(0.16)
99
(0.07)
16
(0.03)
209
(0.05)
522.l
(0.28)
44715
(0.13)
3706
(0.28)
N.E.(4)
20
153
(0.16)
1104
(0.43)
7
(Neg)
26
(0.05)
15
(Neg)
24. l
(0.01)
18238
(0.05)
1886
(0.14)
N.E.(4)
N.E.(4) N.E.(4)
24.1
(0.07)
10
(1.23)
6056
(0.56)
521100
(0.32)
77
70
(0.18)
38.4
(0.10)
3
(0.37)
1899
(0.17)
173299
(0.11)
95
103
(0.26)
21
(Neg)
138
(0.05)
3
(Neg)
224
(0.05)
122.8
(0.07)
101121
(0.30)
2401
(0.18)
N.E.(4)
N.E.(4)
21. l
(0.06)
7
(0.85)
1857
(0.17)
305565
(0.19)
84
14
(0.03)
l. General Information
E
Orissa
22
3516
(3.62)
3393
(1.34)
3697
(2.78)
823
(1.72)
4347
(0.96)
3688.4
(1.99)
658407
(1.96)
31998
(2.43)
8108
(5.28)
s Punjab
23
4222
(4.35)
10612
( 4.18)
2714
(2.04)
944
(l .98)
10967
(2.43)
1520.1
(0.62)
1915059
(5.71)
39950
(3.03)
3915(5)
(2.55)
22518 14270(5)
(4.00) (2.54)
915.7
(2.49)
33
(4.05)
57894
(5.35)
5754033
(3.58)
51
704
(1.79)
695.9
(1.89)
43
(5.28)
16718
(l.54)
3583330
(2.23)
67
980
(2.50)
Raja
sthan
24
6183
(6.37)
12119
(4.77)
6271
(4.71)
1434
(3.00)
12327
(2.73)
2964.0
(1.61)
1768709
(5.27)
66555
(5.45)
10340
(6.74)
27397
(4.88)
959.3
(2.61)
32
(3.93)
48986
(4.52)
7830666
(4.87)
55
2781
(7.10)
10
1. General Information
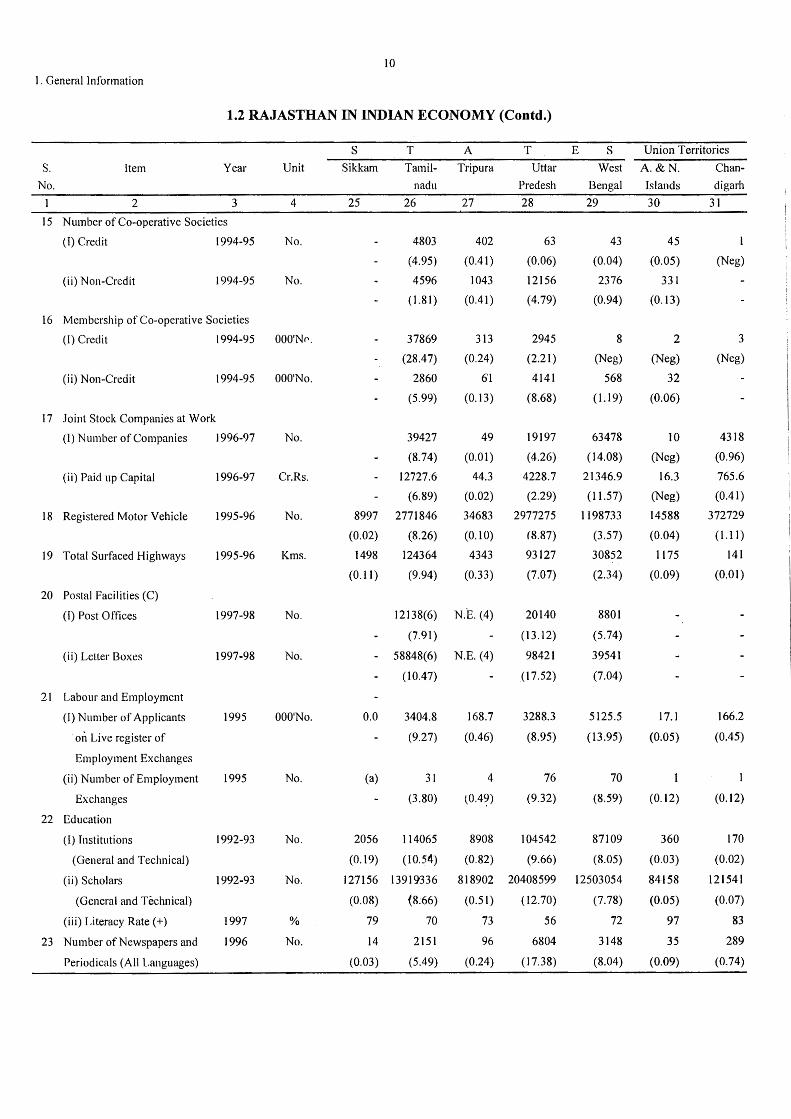
1.2 RAJASTHAN IN INDIAN ECONOMY (Contd.)
s T A T E s Union Territories
S. Item Year Unit Sikkam Tamil- Tripura Uttar West A.&N. Chan-
No. nadu Predesh Bengal Islands digarh
1 2 3 4 25 26 27 28 29 30 31
15 Number of Co-operative Societies
(I) Credit 1994-95 No. 4803 402 63 43 45 1
(4.95) (0 .41) (0.06) (0.04) (0.05) (Neg)
(ii) Non-Credit 1994-95 No. 4596 1043 12156 2376 331
( 1.81) (0.41) (4.79) (0.94) (0.13)
16 Membership of Co-operative Societies
(I) Credit 1994-95 OOO'Nr. 37869 313 2945 8 2 3
(28.47) (0.24) (2.21) (Neg) (Neg) (Neg)
(ii) Non-Credit 1994-95 OOO'No. 2860 6'1 4141 568 32
(5.99) (0.13) (8.68) ( 1.19) (0.06)
17 Joint Stock Companies at Work
(I) Number of Companies 1996-97 No. 39427 49 19197 63478 10 4318
(8.74) (0.01) (4.26) (14.08) (Neg) (0.96)
(ii) Paid up Capital 1996-97 Cr.Rs. 12727.6 44.3 4228.7 21346.9 16.3 765.6
(6.89) (0.02) (2.29) ( 11.57) (Neg) (0.41)
18 Registered Motor Vehicle 1995-96 No. 8997 2771846 34683 2977275 1198733 14588 372729
(0.02) (8.26) (0.10) (8.87) (3.57) (0.04) (I.II)
19 Total Surfaced Highways 1995-96 Kms. 1498 124364 4343 93127 30852 1175 141
(0.11) (9.94) (0.33) (7.07) (2.34) (0.09) (0.01)
20 Postal Facilities (C)
(I) Post Offices 1997-98 No. 12138(6) N.°E. (4) 20140 8801
(7.91) (13.12) (5.74)
(ii) Letter Boxes 1997-98 No. 58848(6) N.E. (4) 98421 39541
(10.47) (17.52) (7.04)
21 Labour and Employment
(I) Number of Applicants 1995 OOO'No. 0.0 3404.8 168.7 3288.3 5125.5 17.1 166.2
on Live register of (9.27) (0.46) (8.95) (13.95) (0.05) (0.45)
Employment Exchanges
(ii) Number of Employment 1995 No. (a) 31 4 76 70 1
Exchanges (3.80) l0.4?) (9.32) (8.59) (0.12) (0.12)
22 Education
(I) Institutions 1992-93 No. 2056 114065 8908 104542 87109 360 170
(General and Technical) (0.19) (10.54) (0.82) (9.66) (8.05) (0.03) (0.02)
(ii) Scholars 1992-93 No. 127156 13919336 818902 20408599 12503054 84158 121541
(General and Technical) (0.08) (8:66) (0.51) (12.70) (7.78) (0.05) (0.07)
(iii) Literacy Rate(+) 1997 % 79 70 73 56 72 97 83
23 Number of Newspapers and 1996 No. 14 2151 96 6804 3148 35 289
Periodicals (All Languages) (0.03) (5.49) (0.24) (17.38) (8.04) (0.09) (0.74)
11
l. General Information
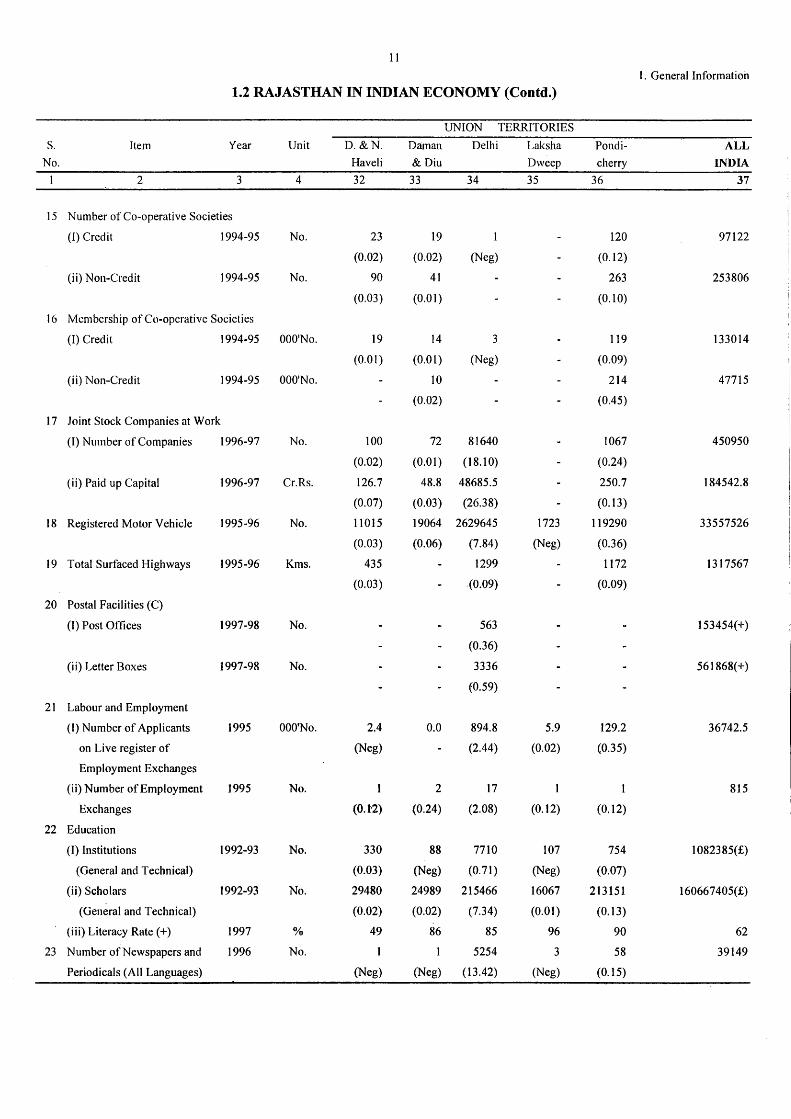
1.2 RAJASTHAN IN INDIAN ECONOMY (Contd.)
UNION TERRITORIES
s. Item Year Unit D.&N. Daman Delhi Laksha Pondi- ALL
No. Have Ii &Diu Dweep cherry INDIA
2 3 4 32 33 34 35 36 37
15 Number of Co-operative Societies
(I) Credit 1994-95 No. 23 19 120 97122
(0.02) (0.02) (Neg) (0.12)
(ii) Non-Credit 1994-95 No. 90 41 263 253806
(0.03) (0.01) (0.10)
16 Membership of Co-operative Societies
(I) Credit 1994-95 OOO'No. 19 14 3 119 133014
(0.01) (0.01) (Neg) (0.09)
(ii) Non-Credit 1994-95 OOO'No. 10 214 47715
(0.02) (0.45)
17 Joint Stock Companies at Work
(I) Number of Companies 1996-97 No. 100 72 81640 1067 450950
(0.02) (0.01) (18.10) (0.24)
(ii) Paid up Capital 1996-97 Cr.Rs. 126.7 48.8 48685.5 250.7 184542.8
(0.07) (0.03) (26.38) (0.13)
18 Registered Motor Vehicle 1995-96 No. 11015 19064 2629645 1723 119290 33557526
(0.03) (0.06) (7.84) (Neg) (0.36)
19 Total Surfaced Highways 1995-96 Kms. 435 1299 I 172 1317567
(0.03) .(0.09) (0.09)
20 Postal Facilities (C)
(I) Post Offices 1997-98 No. 563 153454(+)
(0.36)
(ii) Letter Boxes I 997-98 No. 3336 561868(+)
(0.59)
21 Labour and Employment
(I) Number of Applicants 1995 OOO'No. 2.4 0.0 894.8 5.9 129.2 36742.5
on Live register of (Neg) (2.44) (0.02) (0.35)
Employment Exchanges
(ii) Number of Employment 1995 No. 1 2 17 815
Exchanges (0.1'2) (0.24) (2.08) (0.12) (0.12)
22 Education
(I) Institutions 1992-93 No. 330 88 7710 107 754 1082385(£)
(General and Technical) (0.03) (Neg) (0. 71) (Neg) (0.07)
(ii) Scholars 1992-93 No. 29480 24989 215466 16067 213151 160667405(£)
(General and Technical) (0.02) (0.02) (7.34) (0.01) (0.13)
(iii) Literacy Rate(+) 1997 % 49 86 85 96 90 62
23 Number of Newspapers and 1996 No. 5254 3 58 39149
Periodicals (All Languages) (Neg) (Neg) (13.42) (Neg) (0.15)
12
I. General Information
1.2 RAJASTHAN IN INDIAN ECONOMY (Contd.)
s T A T E s S. Item Year Unit Andhra Arunachal Assam Bihar Goa Gujarat
No. Pradesh Pradesh
2 3 4 5 6 7 8 9 10
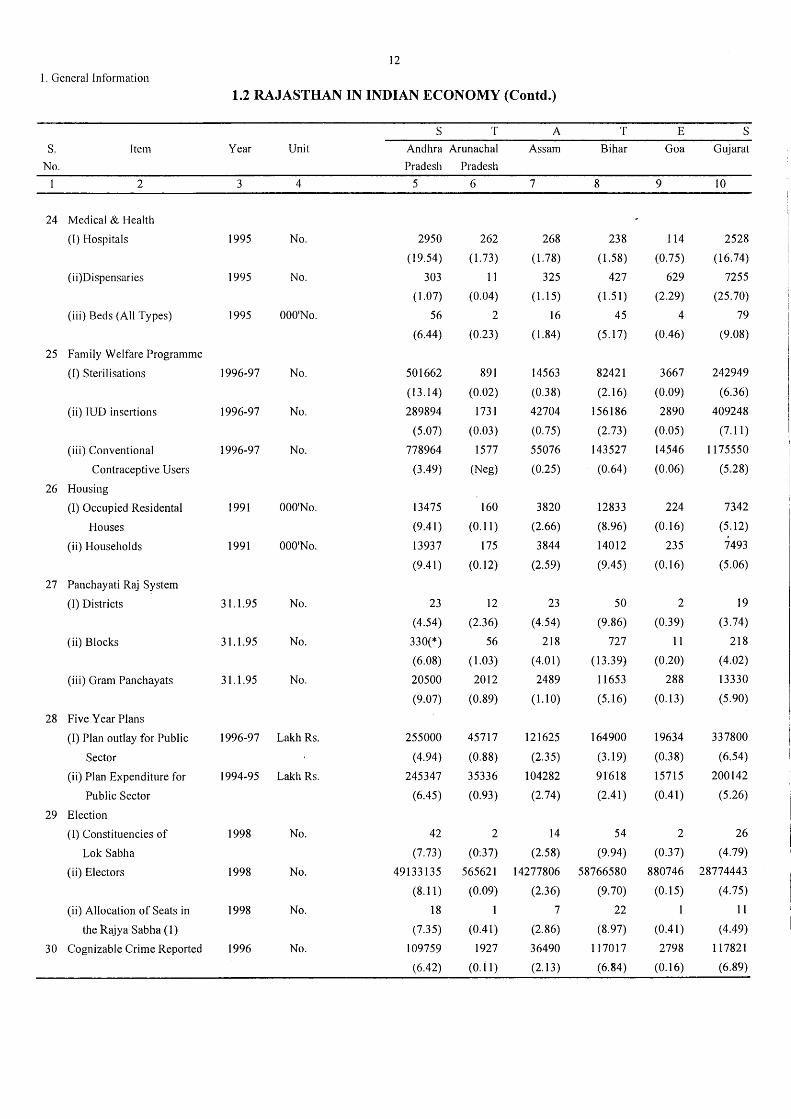
24 Medical & Health
(I) Hospitals 1995 No. 2950 262 268 238 114 2528
(19.54) (1.73) (1. 78) (1.58) (0.75) (16.74)
(ii)Dispensaries 1995 No. 303 11 325 427 629 7255
( l.07) (0.04) (1.15) (1.51) (2.29) (25.70)
(iii) Beds (All Types) 1995 OOO'No. 56 2 16 45 4 79
(6.44) (0.23) ( I.84) (5.17) (0.46) (9.08)
25 Family Welfare Programme
(I) Sterilisations 1996-97 No. 501662 891 14563 82421 3667 242949
(13.14) (0.02) (0.38) (2.16) (0.09) (6.36)
(ii) IUD insertions 1996-97 No. 289894 1731 42704 156186 2890 409248
(5.07) (0.03) (0.75) (2.73) (0.05) (7 .11)
(iii) Conventional 1996-97 No. 778964 1577 55076 143527 14546 1175550
Contraceptive Users (3.49) (Neg) (0.25) (0.64) (0.06) (5.28)
26 Housing
(I) Occupied Residental 1991 OOO'No. 13475 160 3820 12833 224 7342
Houses (9 .41) (0.11) (2.66) (8.96) (0.16) (5.12)
(ii) Households 1991 OOO'No. 13937 175 3844 14012 235 7493
(9.41) (0.12) (2.59) (9.45) (0.16) (5.06)
27 Panchayati Raj System
(I) Districts 31.1.95 No. 23 12 23 50 2 19
(4.54) (2.36) (4.54) (9.86) (0.39) (3.74)
(ii) Blocks 31.1.95 No. 330(*) 56 218 727 11 218
(6.08) (1.03) (4.01) (13.39) (0.20) (4.02)
(iii) Gram Panchayats 31.1.95 No. 20500 2012 2489 11653 288 13330
(9.07) (0.89) (1.10) (5.16) (0.13) (5.90)
28 Five Year Plans
(I) Plan outlay for Public 1996-97 Lakh Rs. 255000 45717 121625 164900 19634 337800
Sector (4.94) (0.88) (2.35) (3.19) (0.38) (6.54)
(ii) Plan Expenditure for 1994-95 Lakh Rs. 245347 35336 104282 91618 15715 200142
Public Sector (6.45) (0.93) (2.74) (2.41) (0.41) (5.26)
29 Election
(I) Constituencies of 1998 No. 42 2 14 54 2 26
Lok Sabha (7.73) (0:37) (2.58) (9.94) (0.37) (4.79)
(ii) Electors 1998 No. 49133135 565621 14277806 58766580 880746 28774443
(8.11) (0.09) (2.36) (9.70) (0.15) (4.75)
(ii) Allocation of Seats in 1998 No. 18 I 7 22 11
the Raj ya Sabha ( 1) (7.35) (0.41) (2.86) (8.97) (0.41) (4.49)
30 Cognizable Crime Reported 1996 No. 109759 1927 36490 117017 2798 117821
(6.42) (0.11) (2.13) (6.84) (0.16) (6.89)
13
1. General Information
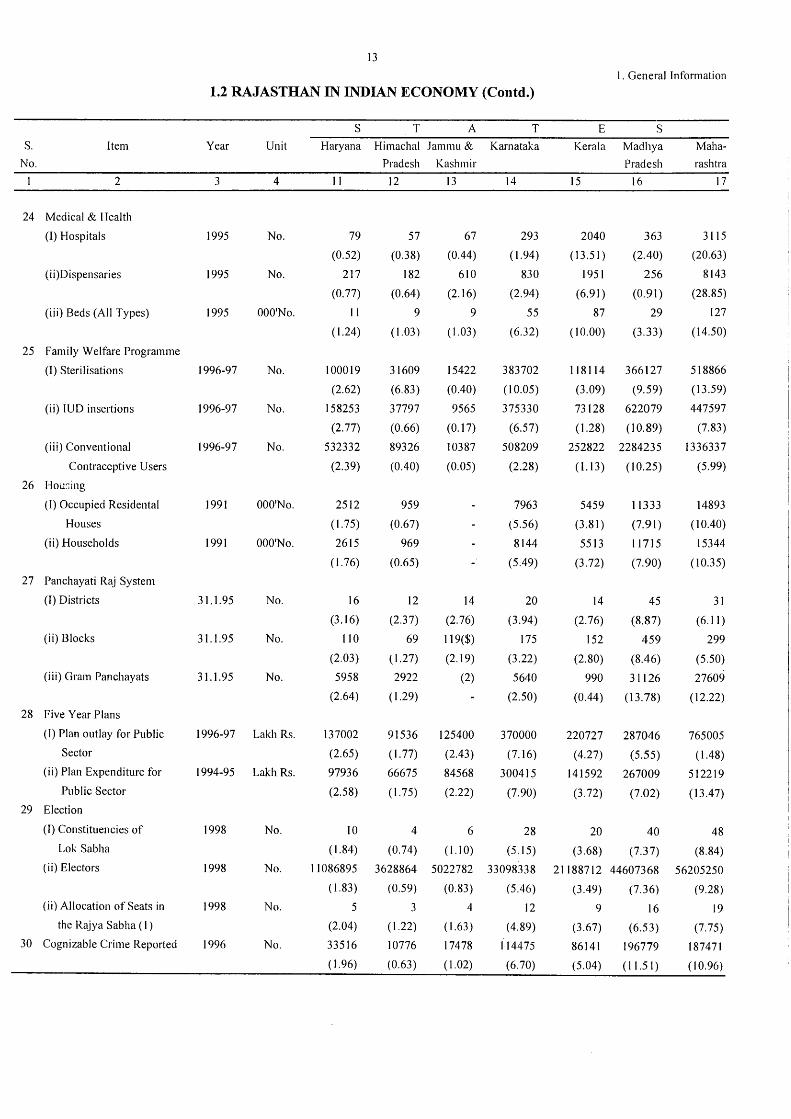
1.2 RAJASTHAN IN INDIAN ECONOMY (Contd.)
s T A T E s S. Item Year Unit Haryana Himachal Jammu & Karnataka Kera la Madhya Maha-
No. Pradesh Kashmir Pradesh rashtra
2 3 4 11 12 13 14 15 16 17
24 Medical & I Teal th
(I) Hospitals 1995 No. 79 57 67 293 2040 363 3115
(0.52) (0.38) (0.44) ( 1.94) (13.51) (2.40) (20.63)
(ii)Dispensaries 1995 No. 217 182 610 830 1951 256 8143
(0.77) (0.64) (2.16) (2.94) (6.91) (0.91) (28.85)
(iii) Beds (All Types) 1995 OOO'No. 11 9 9 55 87 29 127
(1.24) (1.03) ( 1.03) (6.32) (I 0.00) (3.33) (14.50)
25 Family Welfare Programme
(I) Sterilisations 1996-97 No. 100019 31609 15422 383702 118114 366127 518866
(2.62) (6.83) (0.40) ( 10.05) (3.09) (9.59) (13.59)
(ii) IUD insertions 1996-97 No. 158253 37797 9565 375330 73128 622079 447597
(2.77) (0.66) (0.17) (6.57) (1.28) (10.89) (7.83)
(iii) Conventional 1996-97 No. 532332 89326 10387 508209 252822 2284235 1336337
Contraceptive Users (2.39) (0.40) (0.05) (2.28) (l.13) (l 0.25) (5.99)
26 Hou::;ing
(I) Occupied Rcsidental 1991 OOO'No. 2512 959 7963 5459 11333 14893
Houses (I. 75) (0.67) (5.56) (3.81) (7.91) (I 0.40)
(ii) Households 1991 OOO'No. 2615 969 8144 5513 11715 15344
(1.76) (0.65) (5.49) (3.72) (7. 90) (10.35)
27 Panchayati Raj System
(J) Districts 31.1.95 No. 16 12 14 20 14 45 31
(3.16) (2.37) (2.76) (3.94) (2.76) (8.87) (6.11)
(ii) Blocks 31.1.95 No. 110 69 119($) 175 152 459 299
(2.03) ( 1.27) (2.19) (3.22) (2.80) (8.46) (5.50)
(iii) Gram Panchayats 31.1.95 No. 5958 2922 (2) 5640 990 31126 27609
(2.64) ( 1.29) (2.50) (0.44) (13.78) (12.22)
28 Five Year Plans
(I) Plan outlay for Public 1996-97 Lakh Rs. 137002 91536 125400 370000 220727 287046 765005
Sector (2.65) (I. 77) (2.43) (7.16) (4.27) (5.55) ( 1.48)
(ii) Plan Expenditure for 1994-95 Lakh Rs. 97936 66675 84568 300415 141592 267009 512219
Public Sector (2.58) (1.75) (2.22) (7.90) (3.72) (7.02) (13.47)
29 Election
(J) Constituencies of 1998 No. IO 4 6 28 20 40 48
Lok Sabha ( 1.84) (0.74) (I. I 0) (5.15) (3.68) (7.37) (8.84)
(ii) Electors 1998 No. 11086895 3628864 5022782 33098338 21188712 44607368 56205250
( 1.83) (0.59) (0.83) (5.46) (3.49) (7.36) (9.28)
(ii) Allocation of Seats in 1998 No. 5 3 4 12 9 16 19
the Rajya Sabha ( 1 ) (2.04) ( 1.22) (1.63) (4.89) (3.67) (6.53) (7.75)
30 Cognizable Crime Reported 1996 No. 33516 10776 17478 114475 86141 196779 187471
( 1.96) (0.63) (1.02) (6.70) (5.04) (11.51) (10.96)
14
I. General Information
1.2 RAJASTHAN IN INDIAN ECONOMY (Contd.)
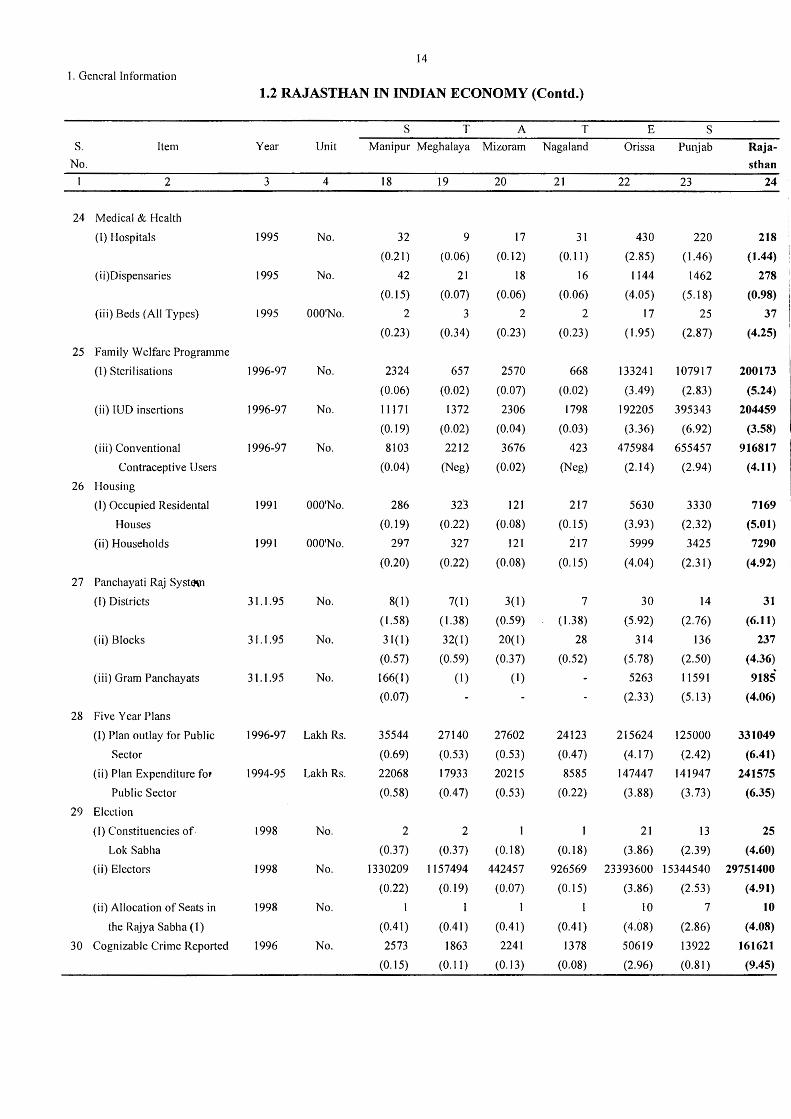
s T A T E s S. Item Year Unit Manipur Meghalaya Mizoram Nagai and Orissa Punjab Raja-
No. sthan
2 3 4 18 19 20 21 22 23 24
24 Medical & Health
(I) Hospitals 1995 No. 32 9 17 31 430 220 218
(0.21) (0.06) (0.12) (0.11) (2.85) (1.46) (1.44)
( ii)Dispensaries 1995 No. 42 21 18 16 1144 1462 278
(0.15) (0.07) (0.06) (0.06) (4.05) (5.18) (0.98)
(iii) Beds (All Types) 1995 OOO'No. 2 3 2 2 17 25 37
(0.23) (0.34) (0.23) (0.23) (1.95) (2.87) (4.25)
25 Family Welfare Programme
(I) Sterilisations 1996-97 No. 2324 657 2570 668 133241 107917 200173
(0.06) (0.02) (0.07) (0.02) (3.49) (2.83) (5.24)
(ii) IUD insertions 1996-97 No. 11171 1372 2306 1798 192205 395343 204459
(0.19) (0.02) (0.04) (0.03) (3.36) (6.92) (3.58)
(iii) Conventional 1996-97 No. 8103 2212 3676 423 475984 655457 916817
Contraceptive Users (0.04) (Neg) (0.02) (Neg) (2.14) (2.94) (4.11)
26 Housing
(I) Occupied Residental 1991 OOO'No. 286 323 121 217 5630 3330 7169
Houses (0.19) (0.22) (0.08) (0.15) (3.93) (2.32) (5.01)
(ii) Households 1991 OOO'No. 297 327 121 217 5999 3425 7290
(0.20) (0.22) (0.08) (0.15) (4.04) (2.31) (4.92)
27 Panchayati Raj Systfl\11
(I) Districts 31.1.95 No. 8(1) 7(1) 3(1) 7 30 14 31
( 1.58) ( 1.38) (0.59) (l.38) (5.92) (2.76) (6.11)
(ii) Blocks 31.1.95 No. 31(1) 32(1) 20(1) 28 314 136 237
(0.57) (0.59) (0.37) (0.52) (5.78) (2.50) (4.36)
(iii) Gram Panchayats 31.1.95 No. 166(1) (1) (1) 5263 11591 9185
(0.07) (2.33) (5.13) (4.06)
28 Five Year Plans
(I) Plan outlay for Public 1996-97 Lakh Rs. 35544 27140 27602 24123 215624 125000 331049
Sector (0.69) (0.53) (0.53) (0.47) (4.17) (2.42) (6.41)
(ii) Plan Expenditure for 1994-95 Lakh Rs. 22068 17933 20215 8585 147447 141947 241575
Public Sector (0.58) (0.47) (0.53) (0.22) (3.88) (3.73) (6.35)
29 Election
(I) Constituencies of, 1998 No. 2 2 I I 21 13 25
Lok Sabha (0.37) (0.37) (0.18) (0.18) (3.86) (2.39) (4.60)
(ii) Electors 1998 No. 1330209 1157494 442457 926569 23393600 15344540 29751400
(0.22) (0.19) (0.07) (0.15) (3.86) (2.53) (4.91)
(ii) Allocation of Seats in 1998 No. I 1 I I IO 7 10
the R~jya Sabha ( 1) (0.41) (0.41) (0.41) (0.41) ( 4.08) (2.86) (4.08)
30 Cognizable Crime Reported 1996 No. 2573 1863 2241 1378 50619 13922 161621
(0.15) (0.11) (0.13) (0.08) (2.96) (0.81) (9.45)
15
1.2 RAJASTHAN IN INDIAN ECONOMY (Contd.)
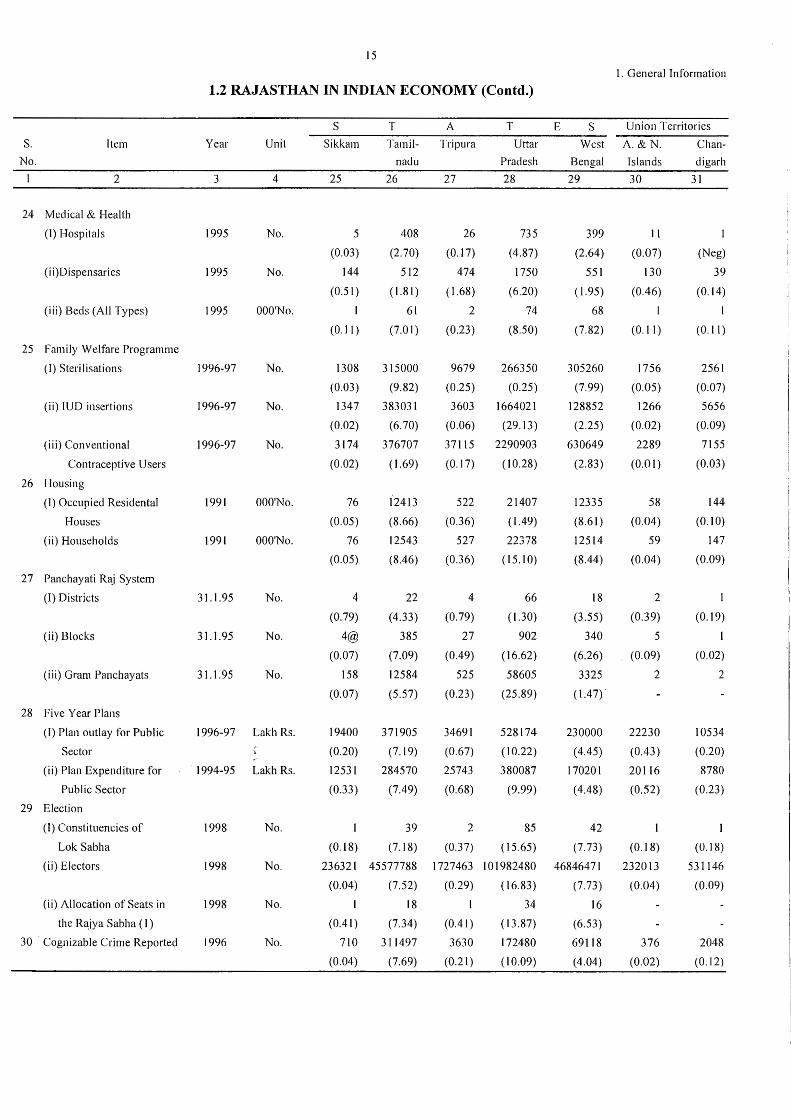
S. Item Year Unit
No.
2 3 4
24 Medical & Health
(I) Hospitals 1995 No.
(ii)Dispensaries 1995 No.
(iii) Beds (All Types) 1995 OOO'No.
25 Family Welfare Programme
(I) Sterilisations 1996-97 No.
(ii) IUD insertions 1996-97 No.
(iii) Conventional I 996-97 No.
Contraceptive Users
26 Housing
(I) Occupied Residental I 99 I OOO'No.
Houses
(ii) Households 1991 OOO'No.
27 Panchayati Raj System
(I) Districts 3 I. I .95 No.
(ii) Blocks 3 I. I .95 No.
(iii) Gram Panchayats 31.1.95 No.
28 Five Year Plans
(I) Plan outlay for Public 1996-97 Lakh Rs.
Sector
(ii) Plan Expenditure for I 994-95 Lakh Rs.
Public Sector
29 Election
(I) Constituencies of
Lok Sabha
(ii) Electors
(ii) Allocation of Seats in
the Raj ya Sabha (I)
30 Cognizable Crime Reported
1998 No.
1998 No.
1998 No.
1996 No.
s T A T
Sikkam Tamil- Tripura Uttar
Pradesh nadu
25 26 27 28
5
(0.03)
144
(0.51)
I
(0.11)
1308
(0.03)
1347
(0.02)
3174
(0.02)
76
(0.05)
76
(0.05)
4
(0.79)
4@
(0.07)
158
(0.07)
19400
(0.20)
12531
(0.33)
I
(0.18)
408
(2.70)
512
( 1.8 I)
61
(7.0 I)
315000
(9.82)
38303 I
(6.70)
376707
( 1.69)
12413
(8.66)
12543
(8.46)
22
(4.33)
385
(7.09)
12584
(5.57)
371905
(7.19)
284570
(7.49)
39
(7.18)
236321 45577788
(0.04) (7.52)
(0.41)
710
(0.04)
18
(7.34)
311497
(7.69)
26
(0.17)
474
(1.68)
2
(0.23)
9679
(0.25)
3603
(0.06)
37115
(0.17)
522
(0.36)
527
(0.36)
4
(0.79)
27
(0.49)
525
(0.23)
34691
(0.67)
25743
(0.68)
2
(0.37)
735
(4.87)
1750
(6.20)
74
(8.50)
266350
(0.25)
1664021
(29.13)
2290903
(10.28)
21407
( 1.49)
22378
(15.10)
66
(1.30)
902
(16.62)
58605
(25.89)
528174
(10.22)
380087
(9.99)
85
( 15.65)
1727463 101982480
(0.29) (16.83)
I
(0.41)
3630
(0.21)
34
(13.87)
172480
(10.09)
I. General Information
E s Union Territories
West A. & N.
Bengal Islands
29 30
399
(2.64)
551
(l.95)
68
(7.82)
305260
(7.99)
128852
(2.25)
630649
(2.83)
12335
(8.61)
12514
(8.44)
18
(3.55)
340
(6.26)
3325
(1.47)"
230000
( 4.45)
170201
( 4.48)
42
(7.73)
46846471
(7.73)
16
(6.53)
69118
(4.04)
11
(0.07)
130
(0.46)
(0.11)
1756
(0.05)
1266
(0.02)
2289
(0.0 I)
58
(0.04)
59
(0.04)
2
(0.39)
5
(0.09)
2
22230
(0.43)
20116
(0.52)
I
(0.18)
232013
(0.04)
376
(0.02)
Chan
digarh
31
1
(Neg)
39
(0.14)
I
(0.11)
2561
(0.07)
5656
(0.09)
7155
(0.03)
144
(0.10)
147
(0.09)
(0.19)
(0.02)
2
10534
(0.20)
8780
(0.23)
(0.18)
531146
(0.09)
2048
(0.12)
16
I. General Information
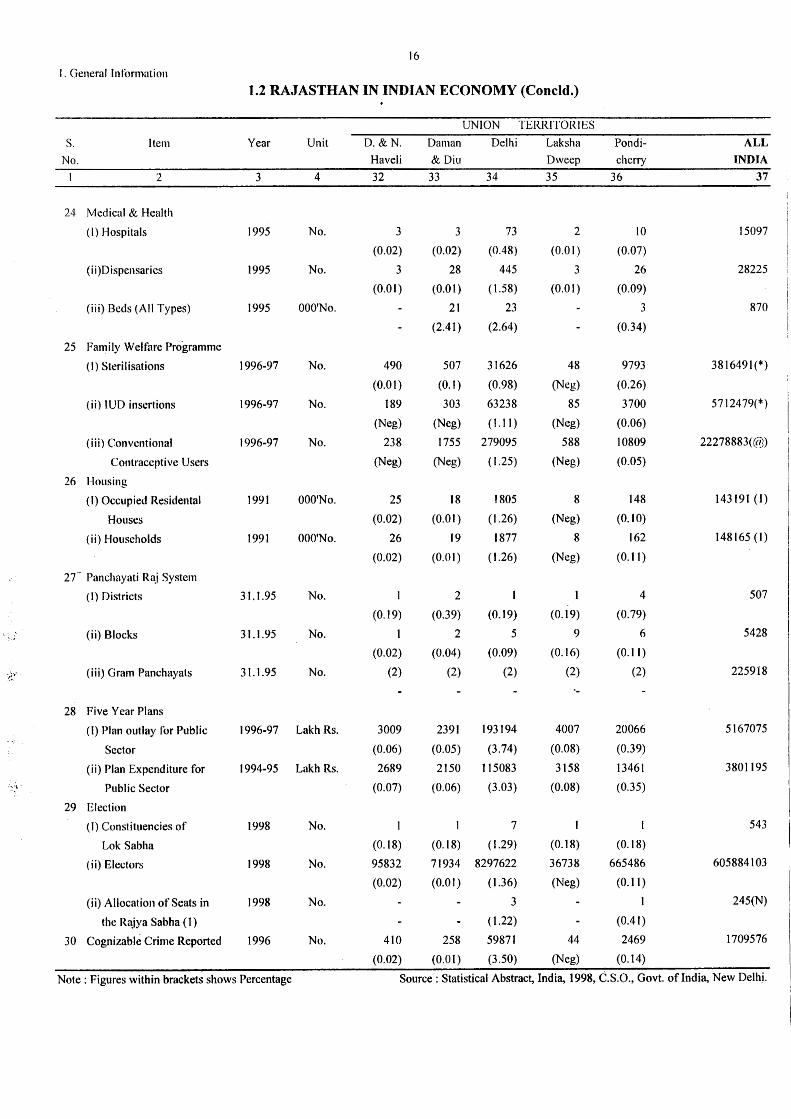
1.2 RAJASTHAN IN INDIAN ECONOMY (Concld.)
UNION TERRITORIES
S. Item Year Unit D.&N. Daman Delhi Laksha Pon di- ALL
No. Have Ii & Diu Dweep cherry INDIA
2 3 4 32 33 34 35 36 37
24 Medical & Health
(I) Hospitals 1995 No. 3 3 73 2 10 15097
(0.02) (0.02) (0.48) (0.01) (0.07)
(ii)Dispensaries 1995 No. 3 28 445 3 26 28225
(0.01) (0.01) ( 1.58) (0.01) (0.09)
(iii) Beds (All Types) 1995 OOO'No. 21 23 3 870
(2.41) (2.64) (0.34)
25 Family Welfare Programme
(I) Sterilisations 1996-97 No. 490 507 31626 48 9793 3816491(*)
(0.01) (0.1) (0.98) (Neg) (0.26)
(ii) IUD insertions 1996-97 No. 189 303 63238 85 3700 5712479(*)
(Neg) (Neg) ( 1.11) (Neg) (0.06)
(iii) Conventional 1996-97 No. 238 1755 279095 588 10809 22278883(@)
Contraceptive Users (Neg) (Neg) (1.25) (Neg) (0.05)
26 Housing
(I) Occupied Residental 1991 OOO'No. 25 18 1805 8 148 143191 (I)
Houses (0.02) (0.01) (1.26) (Neg) (0.10)
(ii) Households 1991 OOO'No. 26 19 1877 8 162 148165 (I)
(0.02) (0.01) ( 1.26) (Neg) (0.11)
2r Panchayati R~j System
(I) Districts 31.1.95 No. 2 1 l 4 507
(0.19) (0.39) (0.19) (0.19) (0. 79)
(ii) Blocks 31.1.95 No. 1 2 5 9 6 5428
(0.02) (0.04) (0.09) (0.16) (0.11)
·~·:~· (iii) Gram Panchayats 31.1.95 No. (2) (2) (2) (2) (2) 225918
28 Five Year Plans
(I) Plan outlay for Public 1996-97 Lakh Rs. 3009 2391 193194 4007 20066 5167075
Sector (0.06) (0.05) (3.74) (0.08) (0.39)
(ii) Plan Expenditure for 1994-95 Lakh Rs. 2689 2150 115083 3158 13461 3801195
·>:%· Public Sector (0.07) (0.06) (3.03) (0.08) (0.35)
29 Election
(I) Constituencies of 1998 No. 7 l 543
Lok Sabha (0.18) (0.18) (1.29) (0.18) (0.18)
(ii) Electors 1998 No. 95832 71934 8297622 36738 665486 605884103
(0.02) (0.01) ( 1.36) (Neg) (0.11)
(ii) Allocation of Seats in 1998 No. 3 I 245(N)
the R~jya Sabha ( 1) ( 1.22) (0.41)
30 Cognizable Crime Reported 1996 No. 410 258 59871 44 2469 1709576
(0.02) (0.01) (3.50) (Neg) (0.14)
Note: Figures within brackets shows Percentage Source: Statistical Abstract, India, 1998, C.S.O., Govt. oflndia, New Delh.i.
17 I. General Information
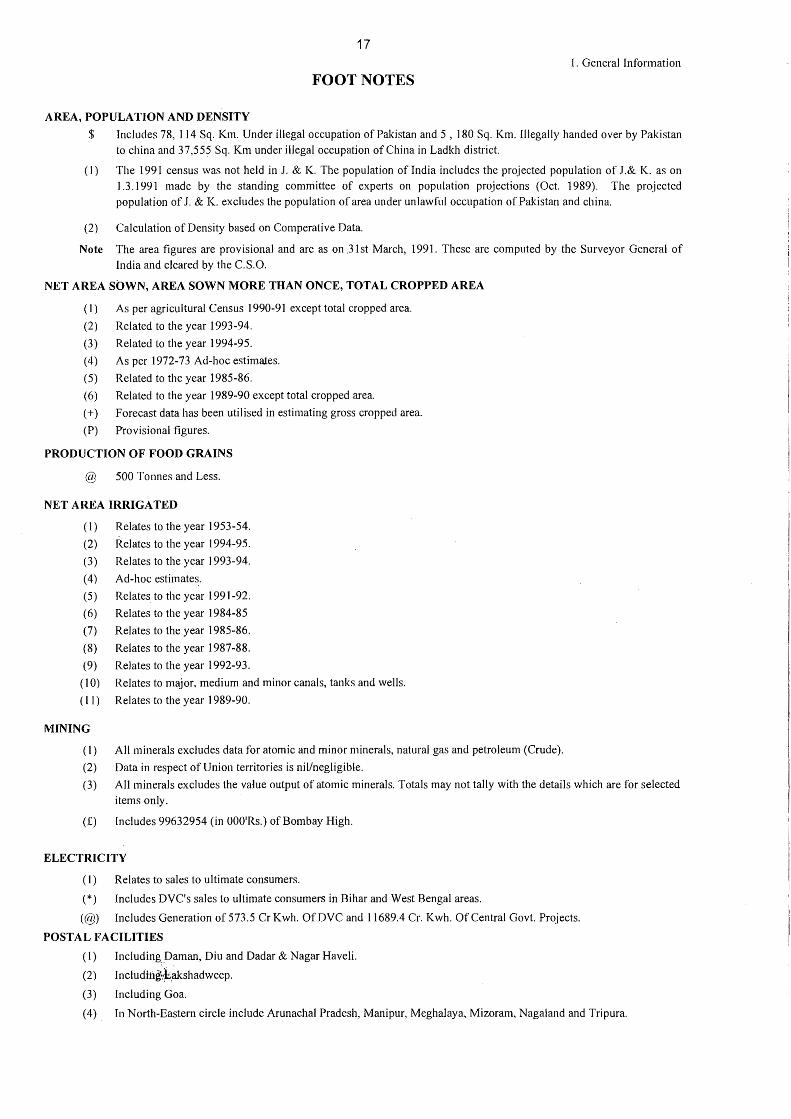
FOOTNOTES
AREA, POPULATION AND DENSITY
$ Includes 78, 1 I 4 Sq. Km. Under illegal occupation of Pakistan and 5 , 180 Sq. Km. Illegally handed over by Pakistan
to china and 37,555 Sq. Km under illegal occupation of China in Ladkh district.
(I) The 1991 census was not held in J. & K. The population of India includes the projected population of J.& K. as on
1.3.1991 made by the standing committee of experts on population projections (Oct. 1989). The projected
population of J. & K. excludes the population of area under unlawful occupation of Pakistan and china.
(2) Calculation of Density based on Comperative Data.
Note The area figures are provisional and are as on .3 lst March, 1991. These are computed by the Surveyor General of
India and cleared by the C.S.O.
NET AREA SOWN, AREA SOWN MORE THAN ONCE, TOTAL CROPPED AREA
( 1) As per agricultural Census I 990-91 except total cropped area.
(2) Related to the year 1993-94.
(3) Related to the year 1994-95.
( 4) As per 1972-73 Ad-hoc estimates.
(5) Related to the year 1985-86.
( 6) Related to the year 1989-90 except total cropped area.
(+) Forecast data has been utilised in estimating gross cropped area.
(P) Provisional figures.
PRODUCTION OF FOOD GRAINS
@ 500 Tonnes and Less.
NET AREA IRRIGATED
( 1) Relates to the year 1953-54.
(2) Relates to the year 1994-95.
(3) Relates to the year 1993-94.
( 4) Ad-hoc estimates.
(5) Relates to the year 1991-92.
(6) Relates to the year 1984-85
( 7) Relates to the year 1985-86.
(8) Relates to the year 1987-88.
(9) Relates to the year 1992-93.
( 10) Relates to major. medium and minor canals, tanks and wells.
( I I) Relates to the year 1989-90.
MINING
(I) All minerals excludes data for atomic and minor minerals, natural gas and petroleum (Crude).
(2) Data in respect of Union territories is nil/negligible.
(3) All minerals excludes the value output of atomic minerals. Totals may not tally with the details which are for selected
items only.
(£) Includes 99632954 (in OOO'Rs.) of Bombay High.
ELECTRICITY
(1) Relates to sales to ultimate consumers.
(*) Includes DVC's sales to ultimate consumers in Bihar and West Bengal areas.
(@) Includes Generation of 573.5 Cr Kwh. OfDVC and 11689.4 Cr. Kwh. Of Central Govt. Projects.
POSTAL FACILITIES
(I) Including_ Daman, Diu and Dadar & Nagar Haveli.
(2) Includi.bg~b,akshadweep.
(3) Including Goa.
(4). In North-Eastern circle include Arunachal Pradesh, Manipur, Meghalaya, Mizoram, Nagaland and Tripura.
18
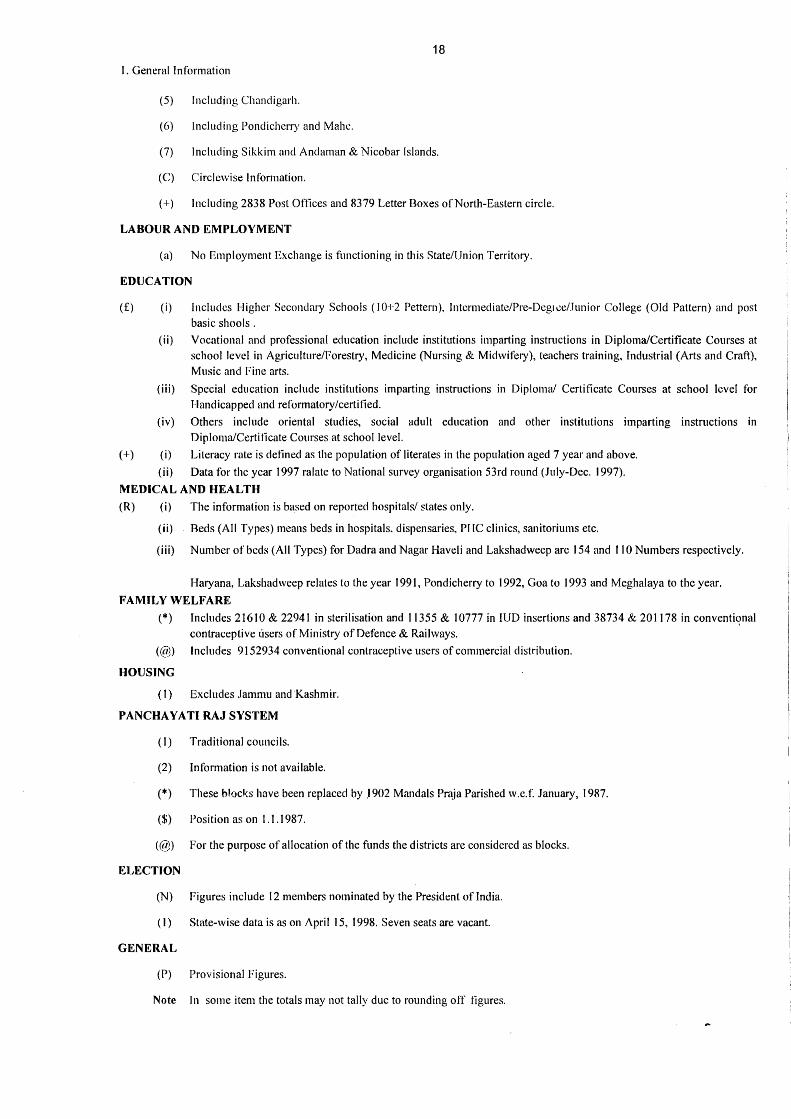
I. General Information
(5) Including Chandigarh.
(6) Including Ponclicherry and Mahe.
(7) Including Sikkim and Andaman & Nicobar Islands.
(C) Circlcwise Information.
(+) Including 2838 Post Offices and 8379 Letter Boxes of North-Eastern circle.
LABOUR AND EMPLOYMENT
(a) No Employment Exchange is functioning in this State/Union Territory.
EDUCATION
(£) (i) Includes Higher Secondary Schools (I 0+2 Pettern}, lntcrmediate/Pre-Deg1...:e/Junior College (Old Pattern) and post
basic shools .
(ii) Vocational and professional education include institutions imparting instructions in Diploma/Certificate Courses at
school level in Agriculture/Forestry, Medicine (Nursing & Midwifery), teachers training, Industrial (Arts and Craft),
Music and Fine arts.
(iii) Special education include institutions imparting instructions in Diploma/ Certificate Courses at school level for
Handicapped and reformatory/certified.
(iv) Others include oriental studies, social adult education and other institutions imparting instructions in
Diploma/Certificate Courses at school level.
(+) (i) Literacy rate is defined as the population of literates in the population aged 7 year and above.
(ii) Data for the year 1997 ralate to National survey organisation 53rd round (July-Dec. 1997).
MEDICAL AND HEALTH
(R) (i) The information is based on reported hospitals/ slates only.
(ii) Beds (All Types) means beds in hospitals, dispensaries, PHC clinics, sanitoriums etc.
(iii) Number of beds (All Types) for Dadra and Nagar Haveli and Lakshadweep are 154 and 110 Numbers respectively.
Haryana, Lakshadweep relates to the year 1991, Pondicherry to 1992, Goa to 1993 and Meghalaya to the year.
FAMILY WELFARE
(*) Includes 21610 & 22941 in sterilisation and 11355 & 10777 in IUD insertions and 38734 & 201178 in conventional
contraceptive t.'1sers of Ministry of Defence & Railways.
(@) Includes 9152934 conventional contraceptive users of commercial distribution.
HOUSING
(I) Excludes Jammu and Kashmir.
PANCHAYATIRAJSYSTEM
(I) Traditional councils.
(2) Information is not available.
(*) These blocks have been replaced by .1902 Mandals Praja Parished w.c.f. January, 1987.
($) Position as on 1.1.1987.
(@) For the purpose of allocation of the funds the districts are considered as blocks.
ELECTION
(N) Figures include 12 members nominated by the President of India.
( 1) State-wise data is as on Apri I 15, 1998. Seven seats are vacant.
GENERAL
(P) Provisional Figures.
Note Jn some item the totals may not tally due to rounding off figures.
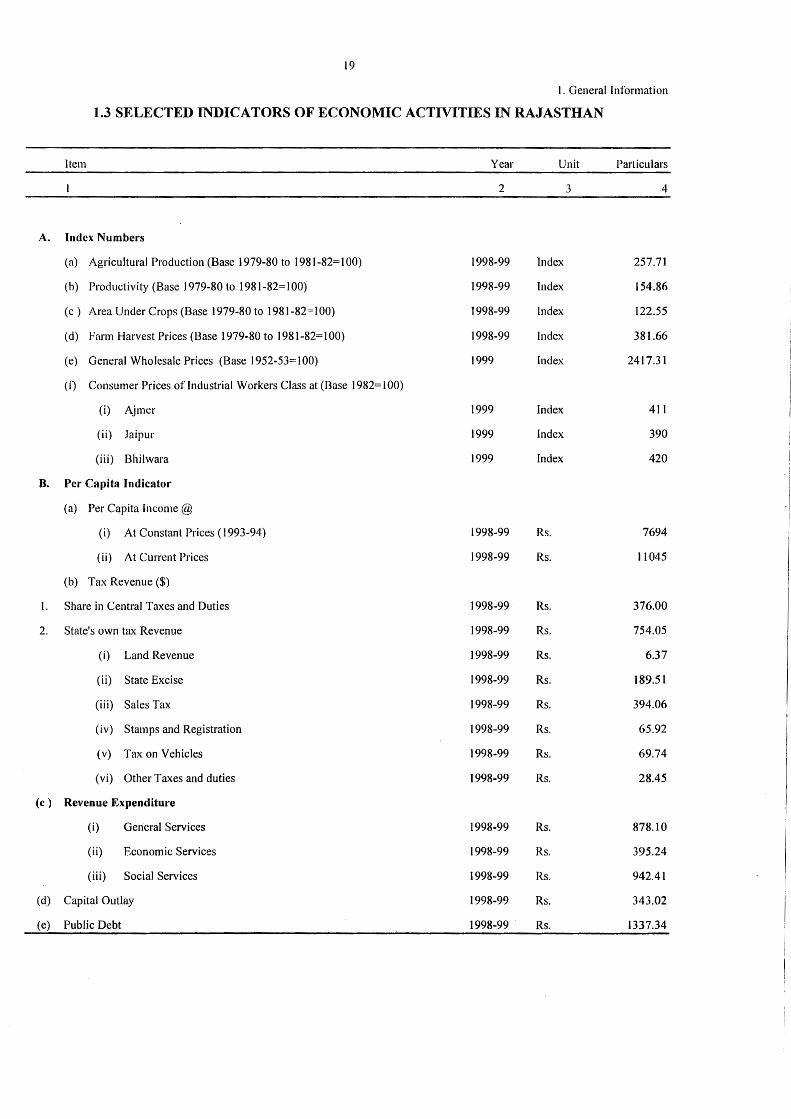
A.
B.
l.
2.
(c)
(d)
(e)
19
I. General Information
1.3 SELECTED INDICATORS OF ECONOMIC ACTIVITIES IN RAJASTHAN
Item Year Unit Parliculars
2 3 4
Index Numbers
(a) Agricultural Production (Base 1979-80 to 1981-82= 100) 1998-99 Index 257.71
(b) Productivity (Base 1979-80 to 1981-82= 100) 1998-99 Index 154.86
(c) Area Under Crops (Base 1979-80 to 1981-82= l 00) 1998-99 Index 122.55
(d) Farm Harvest Prices (Base 1979-80 to 1981-82= 100) 1998-99 Index 381.66
(e) General Wholesale Prices (Base 1952-53=100) 1999 Index 2417.31
(1) Consumer Prices of Industrial Workers Class at (Base 1982= l 00)
(i) Aimer 1999 Index 411
(ii) Jaipur 1999 Index 390
(iii) Bhilwara 1999 Index 420
Per Capita Indicator
(a) Per Capita Income @
(i) At Constant Prices ( 1993-94) 1998-99 Rs. 7694
(ii) At Current Prices 1998-99 Rs. 11045
(b) Tax Revenue ($)
Share in Central Taxes and Duties 1998-99 Rs. 376.00
State's own tax Revenue 1998-99 Rs. 754.05
(i) Land Revenue 1998-99 Rs. 6.37
(ii) State Excise 1998-99 Rs. 189.51
(iii) Sales Tax 1998-99 Rs. 394.06
(iv) Stamps and Registration 1998-99 Rs. 65.92
(v) Tax on Vehicles 1998-99 Rs. 69.74
(vi) Other Taxes and duties 1998-99 Rs. 28.45
Revenue Expenditure
(i) General Services 1998-99 Rs. 878.10
(ii) Economic Services 1998-99 Rs. 395.24
(iii) Social Services 1998-99 Rs. 942.41
Capital Outlay 1998-99 Rs. 343.02
Public Debt 1998-99 Rs. 1337.34
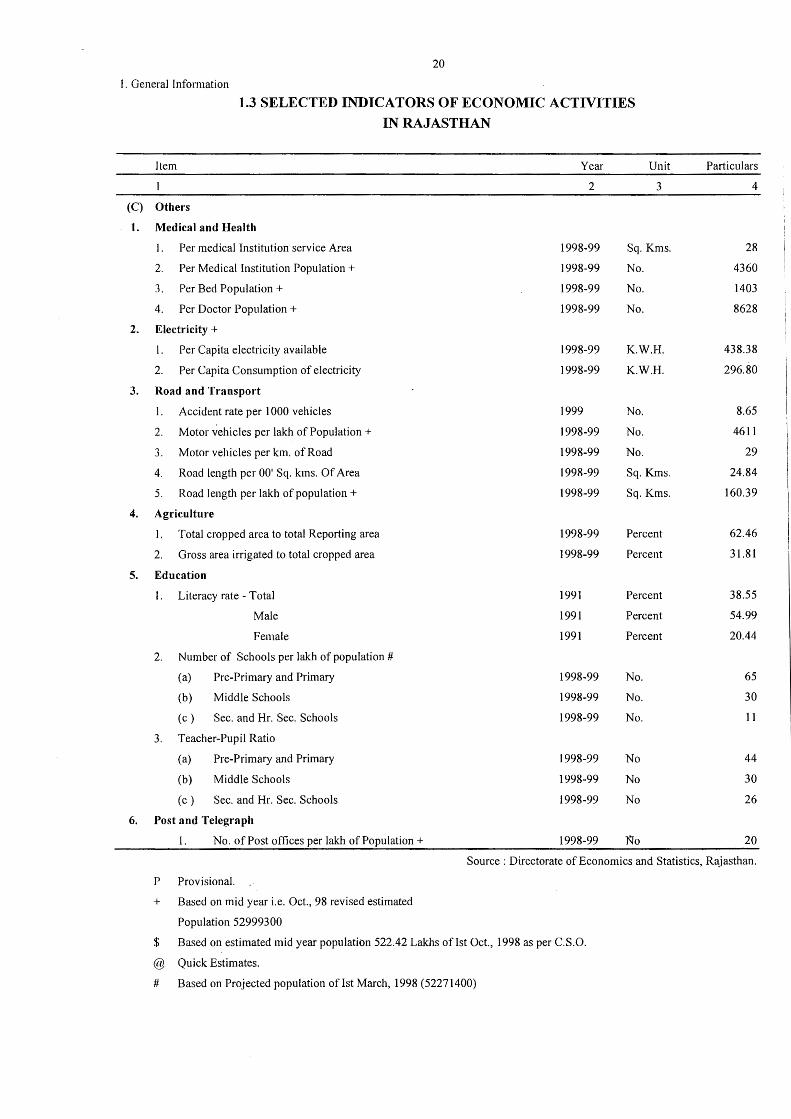
20
I. General Information
1.3 SELECTED INDICATORS OF ECONOMIC ACTIVITIES
IN RAJASTHAN
Item
(C) Others
1. Medical and Health
l . Per medical Institution service Area
2. Per Medical Institution Population +
3. Per Bed Population +
4. Per Doctor Population +
2. Electricity +
I. Per Capita electricity available
2. Per Capita Consumption of electricity
3. Road and Transport
I . Accident rate per 1000 vehicles
2. Motor vehicles per lakh of Population+
3. Motor vehicles per km. of Road
4. Road length per 00' Sq. kms. Of Area
5. Road length per lakh of population+
4. Agriculture
I. Total cropped area to total Reporting area
2. Gross area irrigated to total cropped area
5. Education
1. Literacy rate - Total
Male
Female
2. Number of Schools per lakh of population#
(a) Pre-Primary and Primary
(b) Middle Schools
( c ) Sec. and Hr. Sec. Schools
3. Teacher-Pupil Ratio
(a) Pre-Primary and Primary
(b) Middle Schools
( c ) Sec. and Hr. Sec. Schools
6. Post and Telegraph
l. No. of Post offices per lakh of Population +
Year Unit
2 3
1998-99 Sq. Kms.
1998-99 No.
1998-99 No.
1998-99 No.
1998-99 K.W.H.
1998-99 K.W.H.
1999 No.
1998-99 No.
1998-99 No.
1998-99 Sq. Kms.
1998-99 Sq. Kms.
1998-99 Percent
1998-99 Percent
1991 Percent
1991 Percent
1991 Percent
1998-99 No.
1998-99 No.
1998-99 No.
1998-99 No
1998-99 No
1998-99 No
1998-99 No
Particulars
4
28
4360
1403
8628
438.38
296.80
8.65
4611
29
24.84
160.39
62.46
31.81
38.55
54.99
20.44
65
30
11
44
30
26
20
Source : Directorate of Economics and Statistics, Rajasthan.
P Provisional.
+ Based on mid year i.e. Oct., 98 revised estimated
Population 52999300
$ Based on estimated mid year population 522.42 Lakhs of 1st Oct., 1998 as per C.S.O.
@ Quick Estimates.
# Based on Projected population oflst March, 1998 (52271400)
(2) AREA AND POPULATION
This section provides data relating to area and population of the State according to 1991 census, various tables give information on the classification of villages, cities and towns according to population, Number of literates, literacy rates, Sc/St population, residential situation in R~jasthan
etc.
Tables related to projected population up to the year 2011 classified as rural and urban with break up of Males and Females also given in this section. Divisionwise Population Prqjections also given in this section.
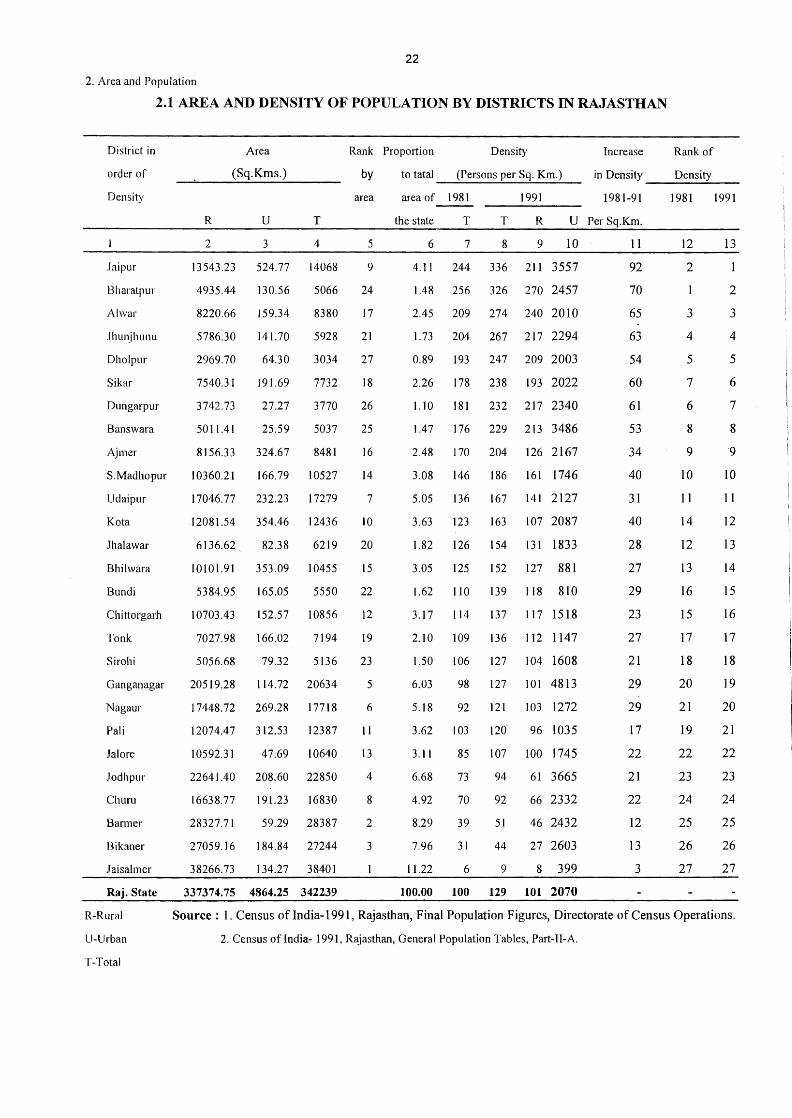
22
2. Area and Population
2.1 AREA AND DENSITY OF POPULATION BY DISTRICTS IN RAJASTHAN
District in
order of
Density
Jaipur
Bharatpur
Alwar
Jhunjhunu
Dholpur
Sikar
Dungarpur
Banswara
Ajmer
S.Madhopur
Udaipur
Ko ta
Jhalawar
Bhilwara
Bundi
Chittorgarh
Tonk
Sirohi
Ganganagar
Nagaur
Pali
Jal ore
Jodhpur
Churn
Barmer
Bikaner
Jaisalmer
Raj. State
R-Rural
U-Urban
T-Total
Area
(Sq.Krus.)
R u T
2 3 4
13543.23 524.77 14068
4935.44 130.56 5066
8220.66 159.34 8380
5786.30 141.70 5928
2969. 70 64.30 3034
7540.31 191.69 7732
3742.73 27.27 3770
501 l.41 25.59 5037
8156.33 324.67 8481
10360.21 166.79 10527
17046. 77 23 2.23 17279
12081.54 354.46 12436
6136.62 82.38 6219
10101.91 353.09 10455
5384.95 165.05 5550
10703.43 152.57 10856
7027.98 166.02 7194
5056.68 79.32 5136
20519.28 114.72 20634
17448.72 269.28 17718
12074.47 312.53 12387
10592.31 47.69 10640
22641.40 208.60 22850
16638.77 191.23 16830
28327.71 59.29 28387
27059.16 184.84 27244
38266. 73 134.27 38401
337374. 75 4864.25 342239
Rank Proportion
by to tatal
Density
(Persons per Sq. Km.)
area area of 1981 1991
Increase Rank of
in Density Density ------1981-91 1981 1991
the state T T R U Per Sq.Km.
5
9
24
17
21
27
18
26
25
16
14
7
10
20
15
22
12
19
23
5
6
11
13
4
8
2
3
6 7 8 9 10
4.11 244 336 211 3557
1.48 256 326 270 2457
2.45 209 274 240 2010
1. 73 204 267 217 2294
0.89 193 247 209 2003
2.26 178 238 193 2022
1. 10 181 23 2 217 2340
1.4 7 176 229 213 3486
2.48 170 204 126 2167
3.08 146 186 161 1746
5.05 136 167 141 2127
3.63 123 163 107 2087
1.82 126 154 131 1833
3.05 125 152 127 881
l.62 110 139 118 810
3.17 114 137 117 1518
2.10 109 13 6 112 1 14 7
1.50 106 127 104 1608
6.03 98 127 101 4813
5.18 92 121 103 1272
3.62 103 120 96 1035
3.11 85 107 100 1745
6.68 73 94 61 3665
4.92 70 92 66 2332
8.29 39 51 46 2432
7.96 31 44 27 2603
11.22 6 9 8 399
100.00 100 129 101 2070
11
92
70
65
63
54
60
61
53
34
40
31
40
28
27
29
23
27
21
29
29
17
22
21
22
12
13
3
12
2
3
4
5
7
6
8
9
10
11
14
12
13
16
15
17
18
20
21
19
22
23
24
25
26
27
13
2
3
4
5
6
7
8
·9
10
11
12
13
14
15
16
17
18
19
20
21
22
23
24
25
26
27
Source : 1. Census of India-1991, Rajasthan, Final Population Figures, Directorate of Census Operations.
2. Census oflndia- 1991, Rajasthan, General Population Tables, Part-II-A.
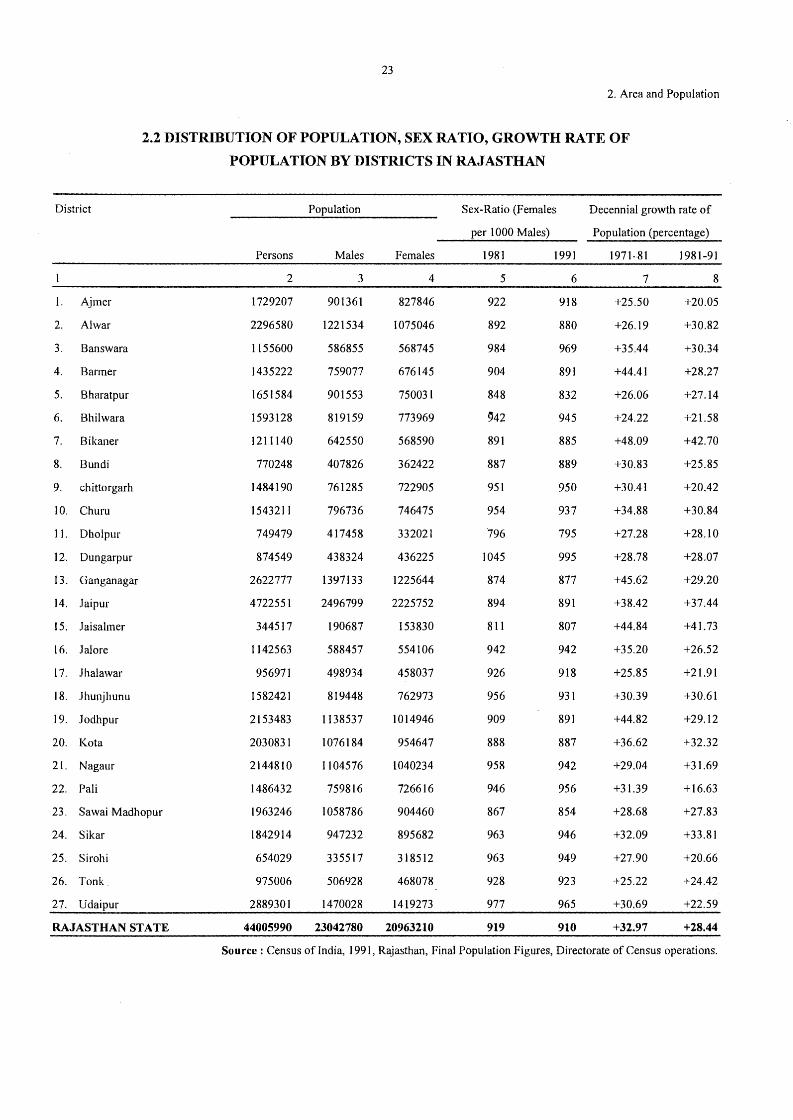
23
2. Area and Population
2.2 DISTRIBUTION OF POPULATION, SEX RATIO, GROWTH RATE OF
POPULATION BY DISTRICTS IN RAJASTHAN
District
I.
2.
3.
A_jmer
Al war
Banswara
4. Barmer
5. Bharatpur
6. Bhilwara
7. Bikaner
8. Bundi
9. chittorgarh
10. Churn
11. Dholpur
12. Dungarpur
13. Ganganagar
14. Jaipur
15. Jaisalmer
16. .lalore
17 . .Jhalawar
18. Jhunjhunu
19. Jodhpur
20. Kota
21. Nagaur
22. Pali
23. Sawai Madhopur
24. Sikar
25. Sirohi
26. Tonk.
27. Udaipur
RAJASTHAN STA TE
Persons
2
1729207
2296580
1155600
1435222
1651584
1593128
1211140
770248
1484190
1543211
749479
874549
2622777
4722551
344517
1142563
956971
1582421
2153483
2030831
2144810
1486432
1963246
1842914
654029
975006
2889301
44005990
Population
Males
3
901361
1221534
586855
759077
901553
819159
642550
407826
761285
796736
417458
438324
1397133
2496799
190687
588457
498934
819448
1138537
1076184
1104576
759816
1058786
947232
335517
506928
1470028
23042780
Females
4
827846
1075046
568745
676145
75003 l
773969
568590
362422
722905
746475
332021
436225
1225644
2225752
153830
554106
458037
762973
1014946
954647
1040234
726616
904460
895682
318512
468078
1419273
20963210
Sex-Ratio (Females
per 1000 Males)
1981 1991
5 6
922 918
892 880
984 969
904
848
~42
891
887
951
954
796
1045
874
894
811
942
926
956
909
888
958
946
867
963
963
928
977
919
891
832
945
885
889
950
937
795
995
877
891
807
942
918
931
891
887
942
956
854
946
949
923
965
910
Decennial growth rate of
Population (percentage)
1971-81
7
+25.50
+26.19
+35.44
+44.41
+26.06
+24.22
+48.09
+30.83
+30.41
+34.88
+27.28
+28.78
+45.62
+38.42
+44.84
+35.20
+25.85
+30.39
+44.82
+36.62
+29.04
+31.39
+28.68
+32.09
+27.90
+25.22
+30.69
+32.97
1981-91
8
+20.05
+30.82
+30.34
+28.27
+27.14
+21.58
+42.70
+25.85
+20.42
+30.84
+28.10
+28.07
+29.20
+37.44
+4 l.73
+26.52
+21.91
+30.61
+29.12
+32.32
+3 l.69
+16.63
+27.83
+33.81
+20.66
+24.42
+22.59
+28.44
Source : Census of India, 1991, R~jasthan, Fi.nal Population Figures, Directorate of Census operations.
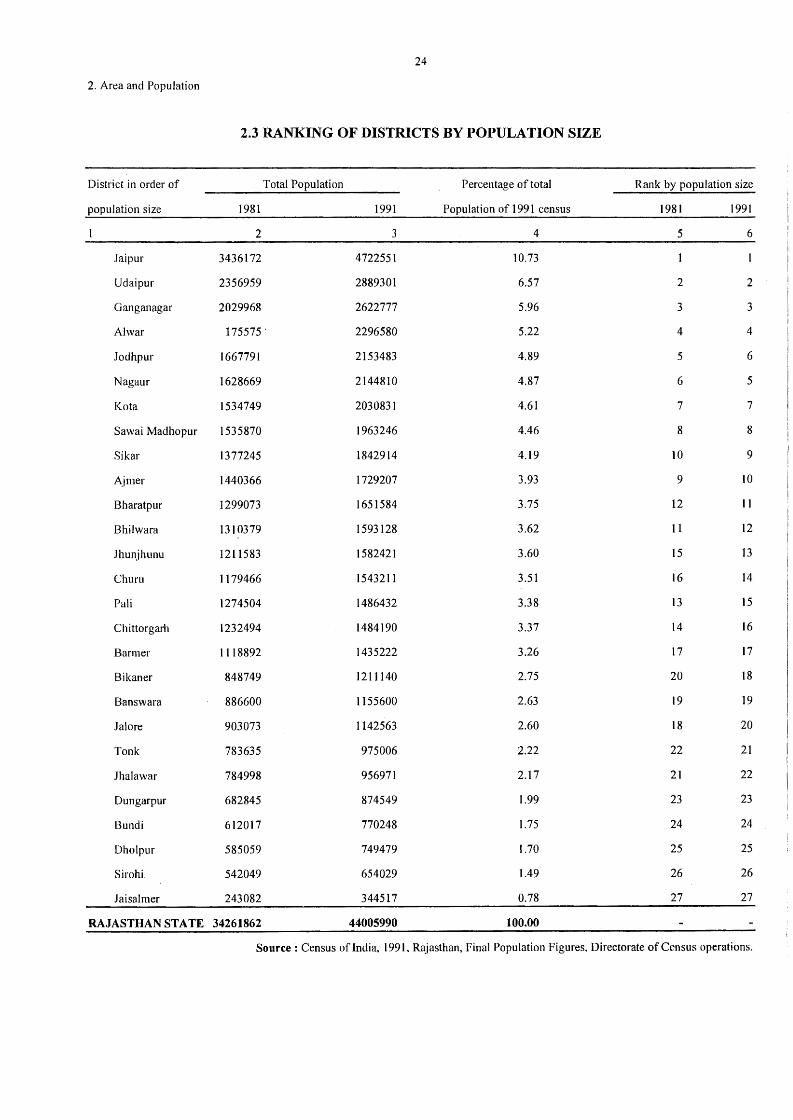
24
2. Area and Population
2.3 RANKING OF DISTRICTS BY POPULATION SIZE
District in order of Total Population Percentage of total Rank by population size
population size 1981 1991 Population of 1991 census 1981 1991
2 3 4 5 6
Jaipur 3436172 4722551 10.73
Udaipur 2356959 2889301 6.57 2 2
Ganganagar 2029968 2622777 5.96 3 3
Al war 175575· 2296580 5.22 4 4
Jodhpur 1667791 2153483 4.89 5 6
Nagaur 1628669 2144810 4.87 6 5
Ko ta 1534749 2030831 4.61 7 7
Sawai Madhopur 1535870 1963246 4.46 8 8
Sikar 1377245 1842914 4.19 10 9
Ajmer 1440366 1729207 3.93 9 IO
Bharatpur 1299073 1651584 3.75 12 11
Bhilwara 1310379 1593128 3.62 11 12
Jhunjhunu 1211583 1582421 3.60 15 13
Churn 1179466 1543211 3.51 16 14
Pali 1274504 1486432 3.38 13 15
Chittorgarh 1232494 1484190 3.37 14 16
Barmer 1118892 1435222 3.26 17 17
Bikaner 848749 1211140 2.75 20 18
Banswara 886600 1155600 2.63 19 19
Jal ore 903073 1142563 2.60 18 20
Tonk 783635 975006 2.22 22 21
.Jhalawar 784998 956971 2.17 21 22
Dungarpur 682845 874549 1.99 23 23
Bundi 612017 770248 1.75 24 24
Dholpur 585059 749479 l.70 25 25
Sirohi. 542049 654029 1.49 26 26
Jaisalmer 243082 344517 0.78 27 27
RAJASTHAN STATE 34261862 44005990 100.00
Source : Census of India, 1991, Rajasthan, Final Population Figures, Directorate of Census operations.
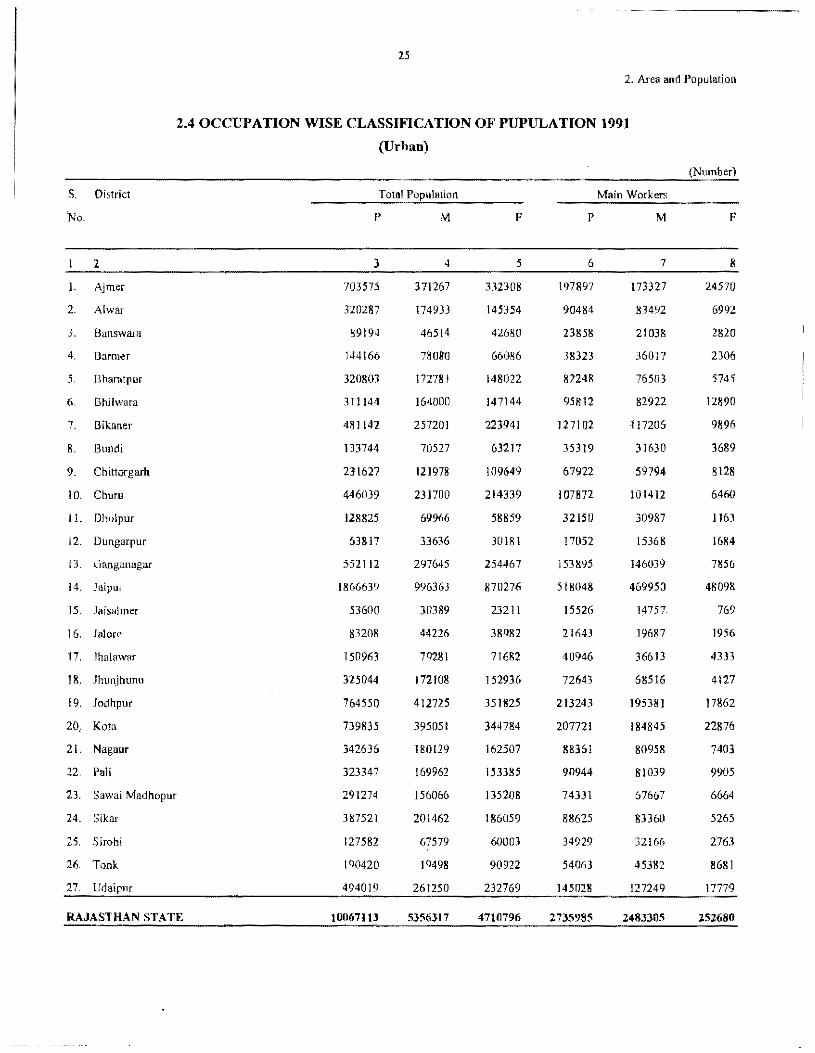
25
2. Area and Population
2.4 OCClJPATION WISE CLASSIFICATION OF PUPULATION 1991
(Urban)
(Number)
S. District Total Population Main \Vorkers
No. r M F p M F
2 3 4 5 6 7 8
L AJmer 703575 371267 332308 197897 173327 24570
2. Afwar 320287 174933 145354 90484 83492 6992
3. Bans\vara 89194 46514 42680 23858 21038 2820
4. Barmer 144166 78080 66086 38323 36017 2306
5. Bharatpur 320803 172781 148022 82248 76503 5745
6. Bhil\vara 3I1144 164000 147144 95812 82922 12890
7. I31kaner 481142 257201 223941 127102 .Ji7206 9896
8. Bundi 133744 70527 63217 35319 31630 3689
9. Chittorgarh 231627 121978 !09649 67922 59794 8128
10. Churu 446039 231700 214339 107872 101412 6460
IL Dhuipur 128825 69%6 58859 32150 30987 1163
12. Dungarpur 63817 33636 30181 17052 15368 1684
13. Ganganagar 552112 297645 254467 l 53895 146039 7856
14. Jaipur 1866639 996363 870276 518048 469950 48098
15. Jaisalrner 53600 30389 23211 15526 14757. 769
16. Jalorc 83208 44226 38982 21643 19687 1956
17. Jhalawar 150963 79281 71682 40946 36613 4333
18. Jhunjhunu 325044 172108 152936 72643 68516 4127
19. Jodhpur 764550 412725 351825 213243 195381 17862
20, Kora 739835 395051 344784 207721 184845 22876
21. Nagaur 342636 180129 162507 88361 80958 7403
22. Pali 323347 169962 153385 90944 81039 9905
23. Sawai Madhopur 291274 156066 135208 74331 67667 6664
24. Sikar 387521 201462 186059 88625 83360 5265
25. Sit-obi 127582 67579 60003 34929 32166 2763
26. Tonk 190420 19498 90922 54063 45382 8681
27. Udaipur 494019 261250 232769 145028 127249 17779
RAJASTHAN STATE 10067113 5356317 4710796 2735985 2483305 252680
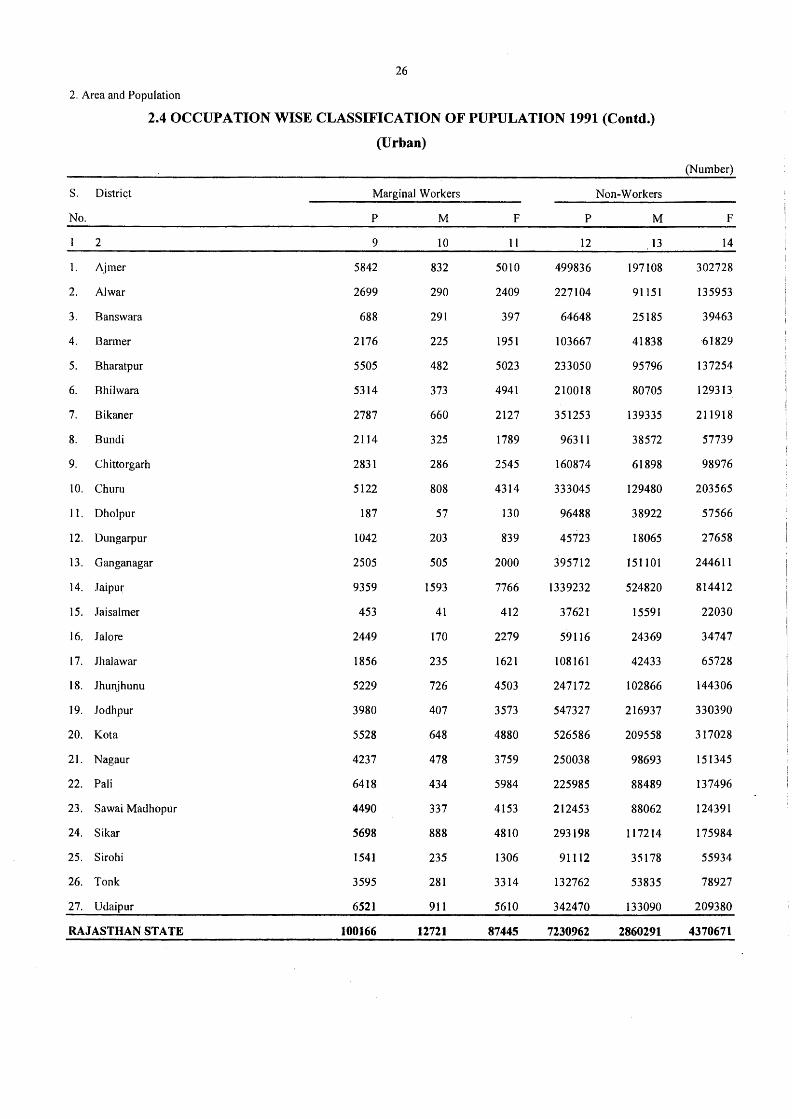
26
2. Area and Population
2.4 OCCUPATION WISE CLASSIFICATION OF PUPULATION 1991 (Contd.)
(Urban)
(Number)
s. District Marginal Workers Non-Workers
No. p M F p M F
2 9 10 11 12 13 14
1. Aimer 5842 832 5010 499836 197108 302728
2. Al war 2699 290 2409 227104 91151 135953
3. Banswara 688 291 397 64648 25185 39463
4. Barmer 2176 225 1951 103667 41838 61829
5. Bharatpur 5505 482 5023 233050 95796 137254
6. Bhilwara 5314 373 4941 210018 80705 129313
7. Bikaner 2787 660 2127 351253 139335 211918
8. Bundi 2114 325 1789 96311 38572 57739
9. Chittorgarh 2831 286 2545 160874 61898 98976
10. Churu 5122 808 4314 333045 129480 203565
11. Dholpur 187 57 130 96488 38922 57566
12. Dungarpur 1042 203 839 45723 18065 27658
13. Ganganagar 2505 505 2000 395712 151101 244611
14. Jaipur 9359 1593 7766 1339232 524820 814412
15. Jaisalmer 453 41 412 37621 15591 22030
16. Jal ore 2449 170 2279 59116 24369 34747
17. .Thalawar 1856 235 1621 108161 42433 65728
18. Jhunjhunu 5229 726 4503 247172 102866 144306
19. Jodhpur 3980 407 3573 547327 216937 330390
20. Ko ta 5528 648 4880 526586 209558 317028
21. Nagaur 4237 478 3759 250038 98693 151345
22. Pali 6418 434 5984 225985 88489 137496
23. Sawai Madhopur 4490 337 4153 212453 88062 124391
24. Sikar 5698 888 4810 293198 117214 175984
25. Sirohi 1541 235 1306 91112 35178 55934
26. Tonk 3595 281 3314 132762 53835 78927
27. Udaipur 6521 911 5610 342470 133090 209380
RAJASTHAN STATE 100166 12721 87445 7230962 2860291 4370671
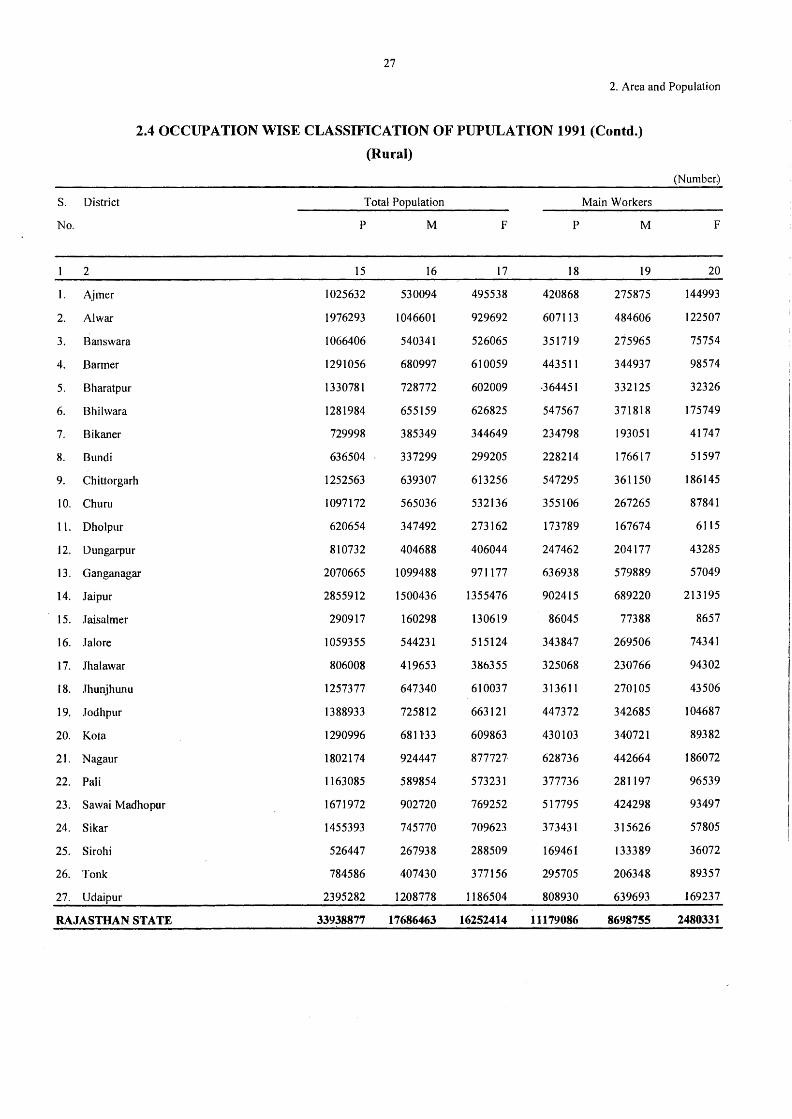
27
2. Area and Population
2.4 OCCUPATION WISE CLASSIFICATION OF PUPULATION 1991 (Contd.)
(Rural)
(Number)
S. District Total Population Main Workers
No. p M F p M F
2 15 16 17 18 19 20
I. Ajmer 1025632 530094 495538 420868 275875 144993
2. Al war 1976293 1046601 929692 607113 484606 122507
3. Banswara 1066406 540341 526065 351719 275965 75754
4. Barmer 1291056 680997 610059 443511 344937 98574
5. Bharatpur 1330781 728772 602009 -364451 332125 32326
6. Bhilwara 1281984 655159 626825 547567 371818 175749
7. Bikaner 729998 385349 344649 234798 193051 41747
8. Bundi 636504 337299 299205 228214 176617 51597
9. Chittorgarh 1252563 639307 613256 547295 361150 186145
10. Churn 1097172 565036 532136 355106 267265 87841
11. Dholpur 620654 347492 273162 173789 167674 6115
12. Dungarpur 810732 404688 406044 247462 204177 43285
13. Ganganagar 2070665 1099488 971177 636938 579889 57049
14. Jaipur 2855912 1500436 1355476 902415 689220 213195
15. Jaisalmer 290917 160298 130619 86045 77388 8657
16. Jal ore 1059355 544231 515124 343847 269506 74341
17. Jhalawar 806008 419653 386355 325068 230766 94302
18. Jhunjhunu 1257377 647340 610037 313611 270105 43506
19. Jodhpur 1388933 725812 663121 447372 342685 104687
20. Ko ta 1290996 6811'33 609863 430103 340721 89382
21. Nagaur 1802174 924447 877727 628736 442664 186072
22. Pali 1163085 589854 573231 377736 281197 96539
23. Sawai Madhopur 1671972 902720 769252 517795 424298 93497
24. Sikar 1455393 745770 709623 373431 315626 57805
25. Sirohi 526447 267938 288509 169461 133389 36072
26. Tonk 784586 407430 377156 295705 206348 89357
27. Udaipur 2395282 1208778 1186504 808930 639693 169237
RAJASTHAN STATE 33938877 17686463 16252414 11179086 8698755 2480331
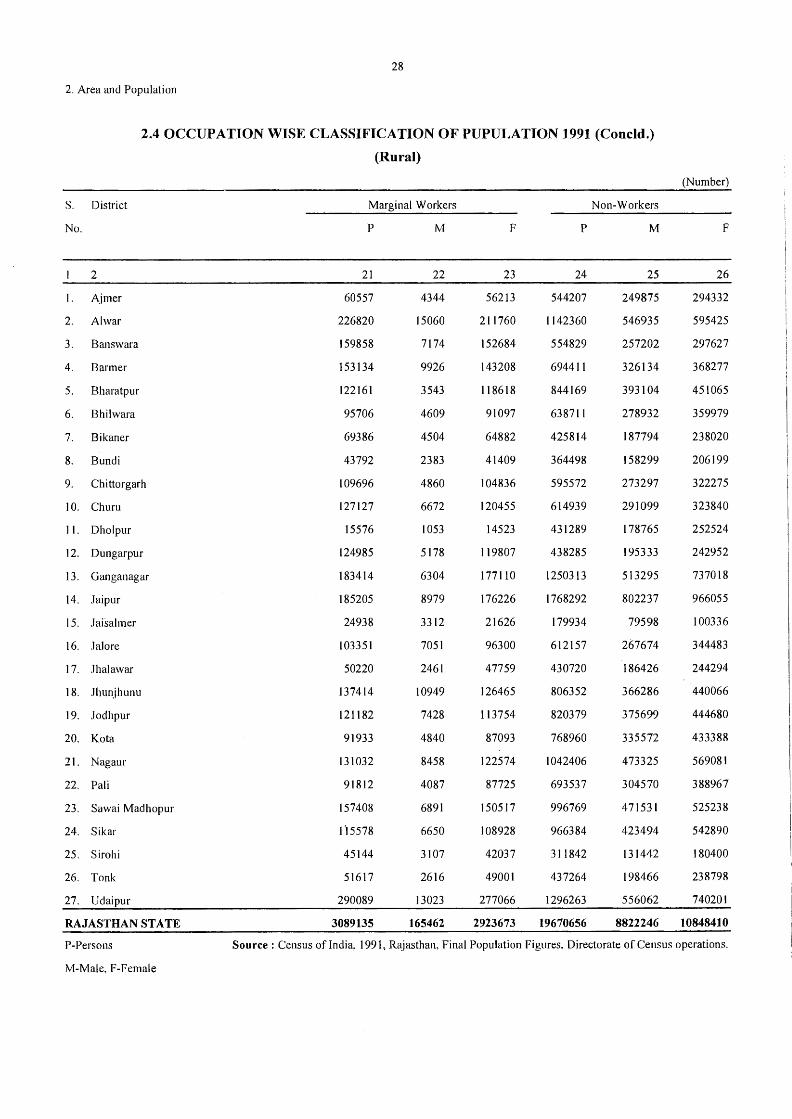
28
2. Area and Population
2.4 OCCUPATION WISE CLASSIFICATION OF PUPULATION 1991 (Concld.)
(Rural)
(Number)
S. District Marginal Workers Non-Workers
No. p M F p M F
2 21 22 23 24 25 26
I. Ajmer 60557 4344 56213 544207 249875 294332
2. Al war 226820 15060 211760 1142360 546935 595425
3. Banswara 159858 7174 152684 554829 257202 297627
4. Barmer 153134 9926 143208 694411 326134 368277
5. Bharatpur 122161 3543 118618 844169 393104 451065
6. Bhilwara 95706 4609 91097 638711 278932 359979
7. Bikaner 69386 4504 64882 425814 187794 238020
8. Bundi 43792 2383 41409 364498 158299 206199
9. Chittorgarh 109696 4860 104836 595572 273297 322275
IO. Churu 127127 6672 120455 614939 291099 323840
11. Dholpur 15576 1053 14523 431289 178765 252524
12. Dungarpur 124985 5178 119807 438285 195333 242952
13. Ganganagar 183414 6304 177110 1250313 513295 737018
14. Jaipur 185205 8979 176226 1768292 802237 966055
15. Jaisalmer 24938 3312 21626 179934 79598 100336
16. .lalore 103351 7051 96300 612157 267674 344483
17. Jhalawar 50220 2461 47759 430720 186426 244294
18. Jhunjhunu 137414 10949 126465 806352 366286 440066
19. Jodhpur 121182 7428 113754 820379 375699 444680
20. Ko ta 91933 4840 87093 768960 335572 433388
21. Nagaur 131032 8458 122574 1042406 473325 569081
22. Pali 91812 4087 87725 693537 304570 388967
23. Sawai Madhopur 157408 6891 150517 996769 471531 525238
24. Sikar 1'15578 6650 108928 966384 423494 542890
25. Sirohi 45144 3107 42037 311842 131442 180400
26. Tonk 51617 2616 49001 437264 198466 238798
27. Udaipur 290089 13023 277066 1296263 556062 740201
RAJASTHAN STATE 3089135 165462 2923673 19670656 8822246 10848410
P-Persons Source: Census of India, 1991, Rajasthan, Final Population Figures. Directorate of Census operations.
M-Male, F-Female
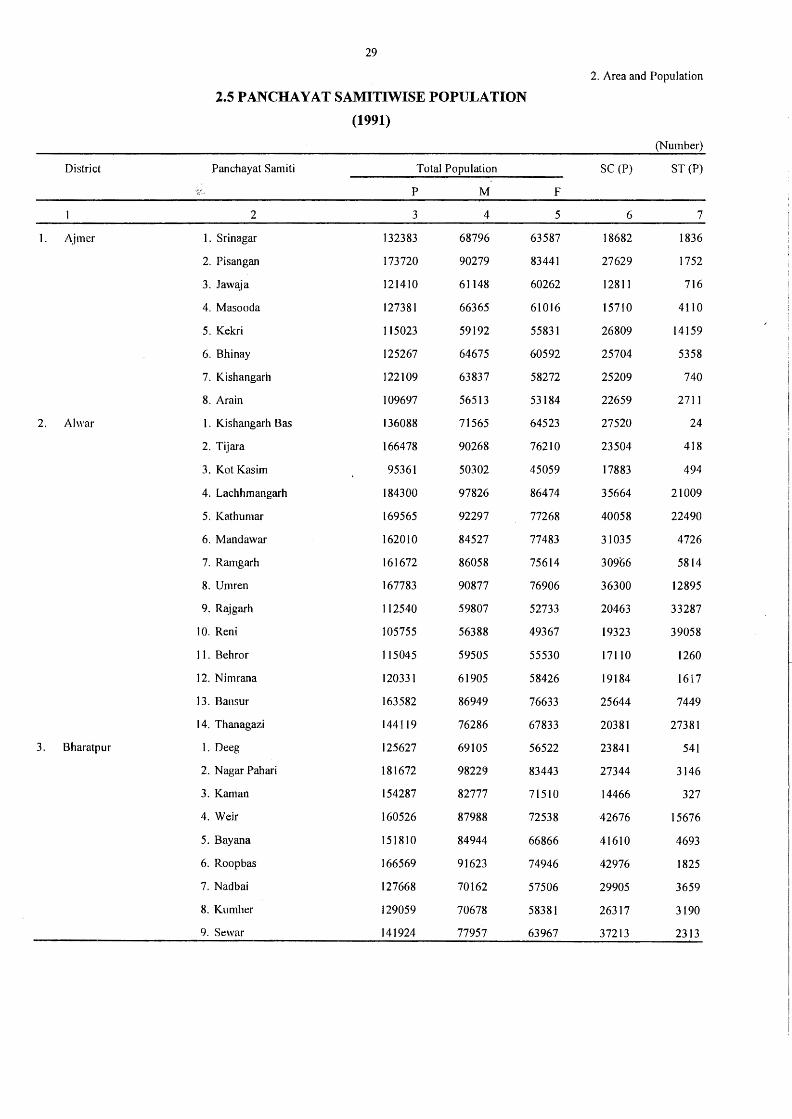
29
2. Area and Population
2.5 PANCHAYAT SAMITIWISE POPULATION
(1991)
(Number)
District Panchayat Samiti Total Population SC (P) ST (P)
p M F
2 3 4 5 6 7
1. Ajmer 1. Srinagar 132383 68796 63587 18682 1836
2. Pisangan 173720 90279 83441 27629 1752
3. Jaw~ja 121410 61148 60262 12811 716
4. Masooda 127381 66365 61016 15710 4110
5. Kekri 115023 59192 55831 26809 14159
6. Bhinay 125267 64675 60592 25704 5358
7. K ishangarh 122109 63837 58272 25209 740
8. Arain 109697 56513 53184 22659 2711
2. Al war I. Kishangarh Bas 136088 71565 64523 27520 24
2. Tijara 166478 90268 76210 23504 418
3. Kot Kasim 95361 50302 45059 17883 494
4. Lachhmangarh 184300 97826 86474 35664 21009
5. Kathumar 169565 92297 77268 40058 22490
6. Mandawar 162010 84527 77483 31035 4726
7. Ramgarh 161672 86058 75614 309b6 5814
8. Umren 167783 90877 76906 36300 12895
9. Rajgarh I 12540 59807 52733 20463 33287
10. Reni 105755 56388 49367 19323 39058
11. Behror 115045 59505 55530 171 IO 1260
12. Nimrana 120331 61905 58426 19184 1617
13. Bansur 163582 86949 76633 25644 7449
14. Thanagazi 144119 76286 67833 20381 27381
3. Bharatpur 1. Deeg 125627 69105 56522 23841 541
2. Nagar Pahari 181672 9822~ 83443 27344 3146
3. Kaman 154287 82777 71510 14466 327
4. Weir 160526 87988 72538 42676 15676
5. Bayana 151810 84944 66866 41610 4693
6. Roopbas 166569 91623 74946 42976 1825
7. Nadbai 127668 70162 57506 29905 3659
8. Kumher 129059 70678 58381 26317 3190
9. Sewar 141924 77957 63967 37213 2313
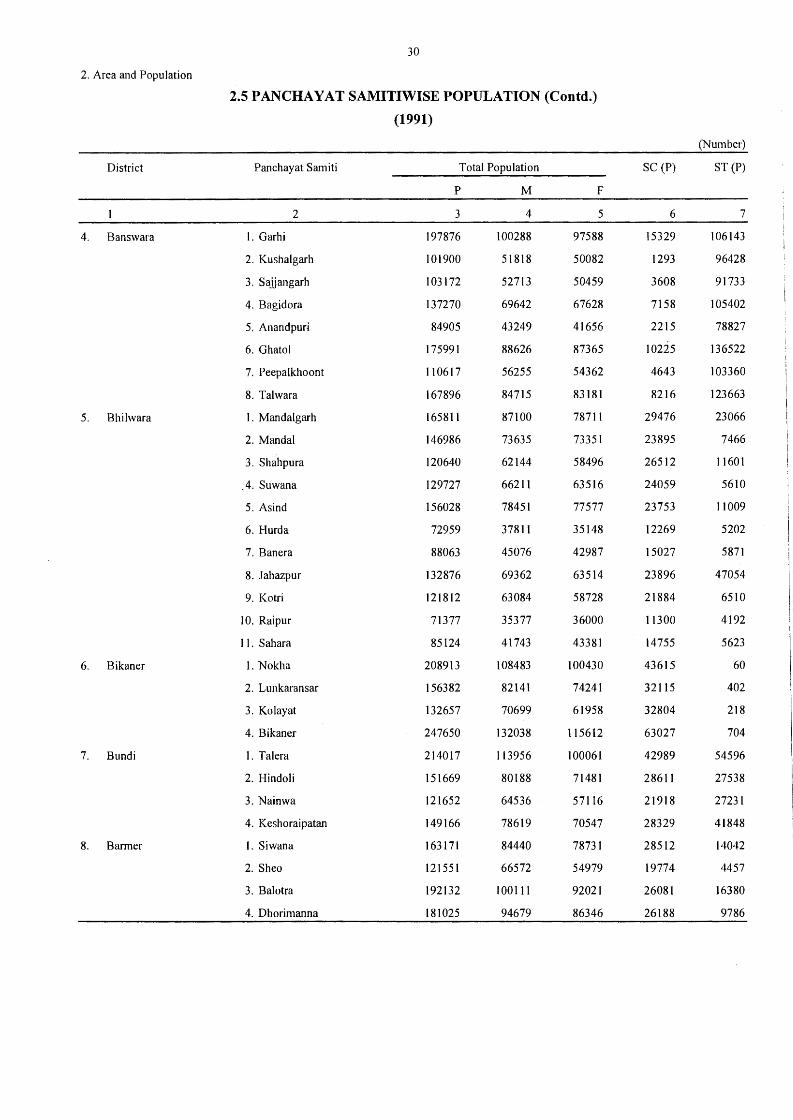
30
2. Area and Population
2.5 PANCHAYAT SAMITIWISE POPULATION (Contd.)
(1991)
(Number)
District Panchayat Samiti Total Population SC (P) ST (P)
p M F
2 3 4 5 6 7
4. Banswara l. Garhi 197876 100288 97588 15329 106143
2. Kushalgarh 101900 51818 50082 1293 96428
3. Sajjangarh 103172 52713 50459 3608 91733
4. Bagidora 137270 69642 67628 7158 105402
5. Anandpuri 84905 43249 41656 2215 78827
6. Ghatol 175991 88626 87365 10225 136522
7. Peepalkhoont 110617 56255 54362 4643 103360
8. Talwara 167896 84715 83181 8216 123663
5. Bhilwara I. Mandalgarh 165811 87100 7871 l 29476 23066
2. Manda! 146986 73635 73351 23895 7466
3. Shahpura 120640 62144 58496 26512 11601
.4. Suwana 129727 66211 63516 24059 5610
5. Asind 156028 78451 77577 23753 11009
6. Hurda 72959 37811 35148 12269 5202
7. Banera 88063 45076 42987 15027 5871
8. Jahazpur 132876 69362 63514 23896 47054
9. Kotri 121812 63084 58728 21884 6510
10. Raipur 71377 35377 36000 11300 4192
I I. Sahara 85124 41743 43381 14755 5623
6. Bikaner 1. Nokha 208913 108483 100430 43615 60
2. Lunkaransar 156382 82141 74241 32115 402
3. Kolayat 132657 70699 61958 32804 218
4. Bikaner 247650 132038 115612 63027 704
7. Bundi 1. Talera 214017 113956 100061 42989 54596
2. Hindoli 151669 80188 71481 28611 27538
3. Nainwa 121652 64536 57116 21918 27231
4. Keshoraipatan 149166 78619 70547 28329 41848
8. Barmer I. Siwana 163171 84440 78731 28512 14042
2. Sheo 121551 66572 54979 19774 4457
3. Balotra 192132 100111 92021 26081 16380
4. Dhorimanna 181025 94679 86346 26188 9786
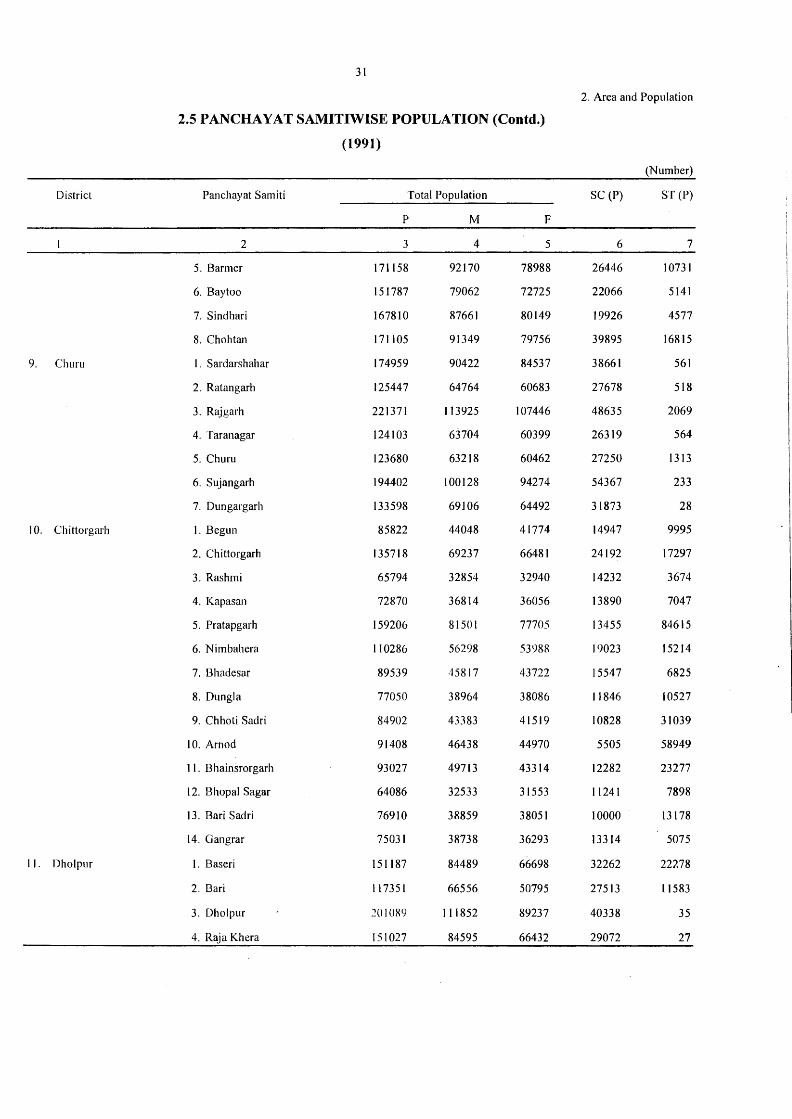
31
2. Area and Population
2.5 PANCHAYAT SAMITIWISE POPULATION (Contd.)
(1991)
(Number)
District Panchayat Samiti Total Population SC (P) ST (P)
p M F
2 3 4 5 6 7
5. Barmer 171158 92170 78988 26446 10731
6. Baytoo 151787 79062 72725 22066 5141
7. Sindhari 167810 87661 80149 19926 4577
8. Chohtan 171 I05 91349 79756 39895 16815
9. Churn I. Sardarshahar 174959 90422 84537 38661 561
2. Ratangarh 125447 64764 60683 27678 518
3. Rajgarh 221371 113925 107446 48635 2069
4. Taranagar 124103 63704 60399 26319 564
5. Churu 123680 63218 60462 27250 1313
6. Sujangarh 194402 100128 94274 54367 233
7. Dungargarh 133598 69106 64492 31873 28
IO. Chittorgarh I. Begun 85822 44048 41774 14947 9995
2. Chittorgarh 135718 69237 66481 24192 17297
3. Rashmi 65794 32854 32940 14232 3674
4. Kapasan 72870 36814 36056 13890 7047
5. Pratapgarh 159206 81501 77705 13455 84615
6. Nimbahera 110286 56298 53988 19023 15214
7. Bhadesar 89539 45817 43722 15547 6825
8. Dungla 77050 38964 38086 11846 10527
9. Chhoti Sadri 84902 43383 41519 10828 31039
10. Arnod 91408 46438 44970 5505 58949
11. Bhainsrorgarh 93027 49713 43314 12282 23277
12. Bhopal Sagar 64086 32533 31553 11241 7898
13. Bari Sadri 76910 38859 38051 10000 13178
14. Gangrar 75031 38738 36293 13314 5075
11. Dholpur 1. Baseri 151187 84489 66698 32262 22278
2. Bari 117351 66556 50795 27513 11583
3. Dholpur 201089 111852 89237 40338 35
4. Raja Khera 1:51027 84595 66432 29072 27
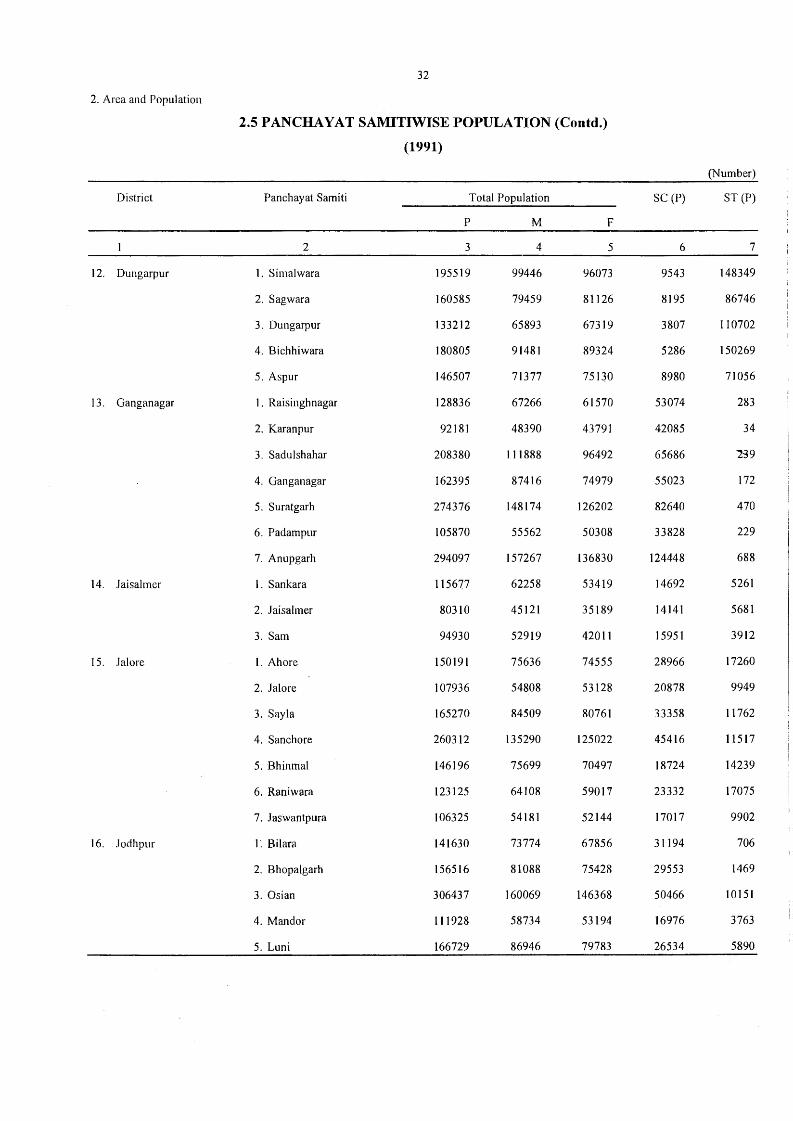
32
2. Area and Population
2.5 PANCHAYAT SAMITIWISE POPULATION (Contd.)
(1991)
(Number)
District Panchayat Samiti Total Population SC (P) ST (P)
p M F
2 3 4 5 6 7
12. Dungarpur 1. Simalwara 195519 99446 96073 9543 148349
2. Sagwara 160585 79459 81126 8195 86746
3. Dungarpur 133212 65893 67319 3807 110702
4. Bichhiwara 180805 91481 89324 5286 150269
5. Aspur 146507 71377 75130 8980 71056
13. Ganganagar 1. Raisinghnagar 128836 67266 61570 53074 283
2. Karanpur 92181 48390 43791 42085 34
3. Sadulshahar 208380 111888 96492 65686 £39
4. Ganganagar 162395 87416 74979 55023 172
5. S uratgarh 274376 148174 126202 82640 470
6. Padampur 105870 55562 50308 33828 229
7. Anupgarh 294097 157267 136830 124448 688
14. Jaisalmer I. Sankara 115677 62258 53419 14692 5261
2. Jaisalmer 80310 45121 35189 14141 5681
3. Sam 94930 52919 42011 15951 3912
15. Jal ore I. Ahore 150191 75636 74555 28966 17260
2. Jalore 107936 54808 53128 20878 9949
3. Sayla 165270 84509 80761 33358 11762
4. Sanchore 260312 135290 125022 45416 11517
5. Bhinmal 146196 75699 70497 18724 14239
6; Raniwara 123125 64108 5901'7 23332 17075
7. Jaswantpura 106325 54181 52144 17017 9902
16. Jodhpur L Bilara 141630 73774 67856 31194 706
2. Bhopalgarh 156516 81088 75428 29553 1469
3. Osian 306437 160069 146368 50466 10151
4. Mandor 111928 58734 53194 16976 3763
5. Luni 166729 86946 79783 26534 5890
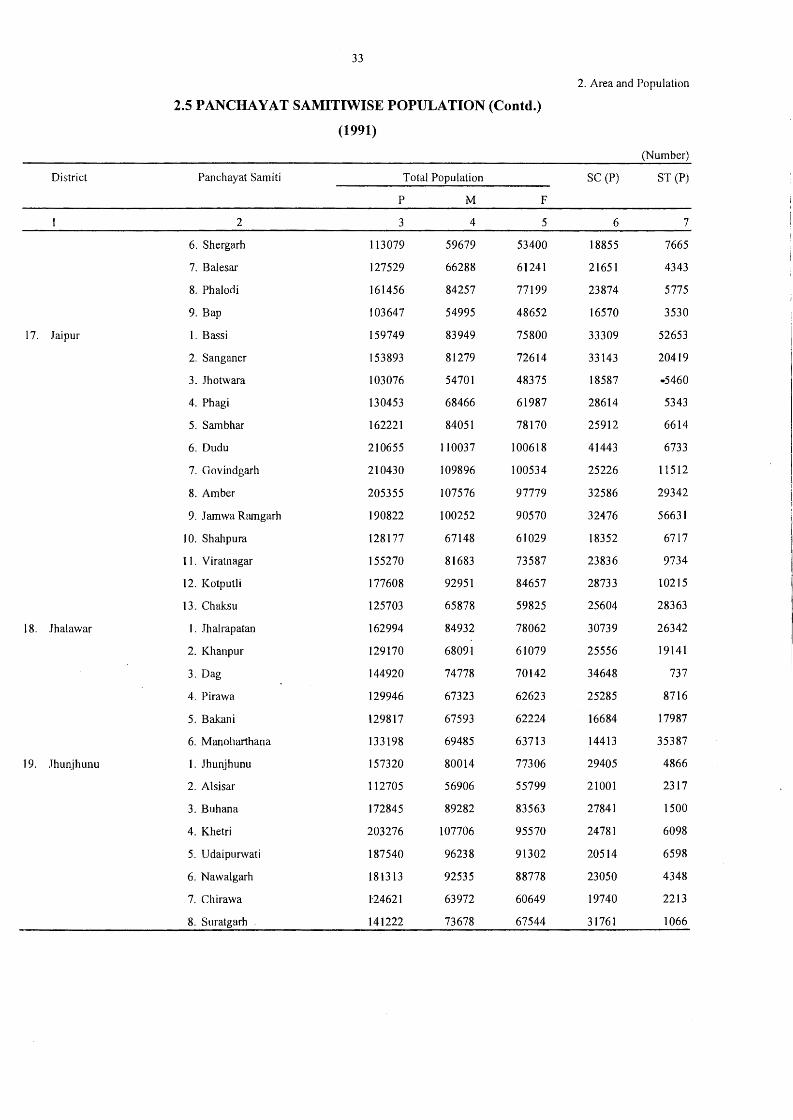
33
2. Area and Population
2.5 PANCHAYAT SAMITIWISE POPULATION (Contd.)
(1991)
(Number)
District Panchayat Samiti Total Population SC (P) ST (P)
p M F
2 3 4 5 6 7
6. Shergarh 113079 59679 53400 18855 7665
7. Balesar 127529 66288 61241 21651 4343
8. Phalodi 161456 84257 77199 23874 5775
9. Bap 103647 54995 48652 16570 3530
17. Jaipur 1. Bassi 159749 83949 75800 33309 52653
2. Sanganer 153893 81279 72614 33143 20419
3. Jhotwara 103076 54701 48375 18587 ·5460
4. Phagi 130453 68466 61987 28614 5343
5. Sambhar 162221 84051 78170 25912 6614
6. Dudu 210655 110037 100618 41443 6733
7. Govindgarh 210430 109896 100534 25226 11512
8. Amber 205355 107576 97779 32586 29342
9. J amwa Ramgarh 190822 100252 90570 32476 56631
l 0. Shahpura 128177 67148 61029 18352 6717
11. Viratnagar 155270 81683 73587 23836 9734
12. Kotputli 177608 92951 84657 28733 10215
13. Chaksu 125703 65878 59825 25604 28363
18. .Jhalawar 1. Jhalrapatan 162994 84932 78062 30739 26342
2. Khanpur 129170 6809-1 61079 25556 19141
3. Dag 144920 74778 70142 34648 737
4. Pirawa 129946 67323 62623 25285 8716
5. Bakani 129817 67593 62224 16684 17987
6. Manoharthana 133198 69485 63713 14413 35387
19. .Thunjhunu 1 . .Thunjhunu 157320 80014 77306 29405 4866
2. Alsisar 112705 56906 55799 21001 2317
3. Buhana 172845 89282 83563 27841 1500
4. Khetri 203276 107706 95570 24781 6098
5. Udaipurwati 187540 96238 91302 20514 6598
6. Nawalgarh 181313 92535 88778 23050 4348
7. Chirawa 1·24621 63972 60649 19740 2213
8. Suratgarh 141222 73678 67544 31761 1066
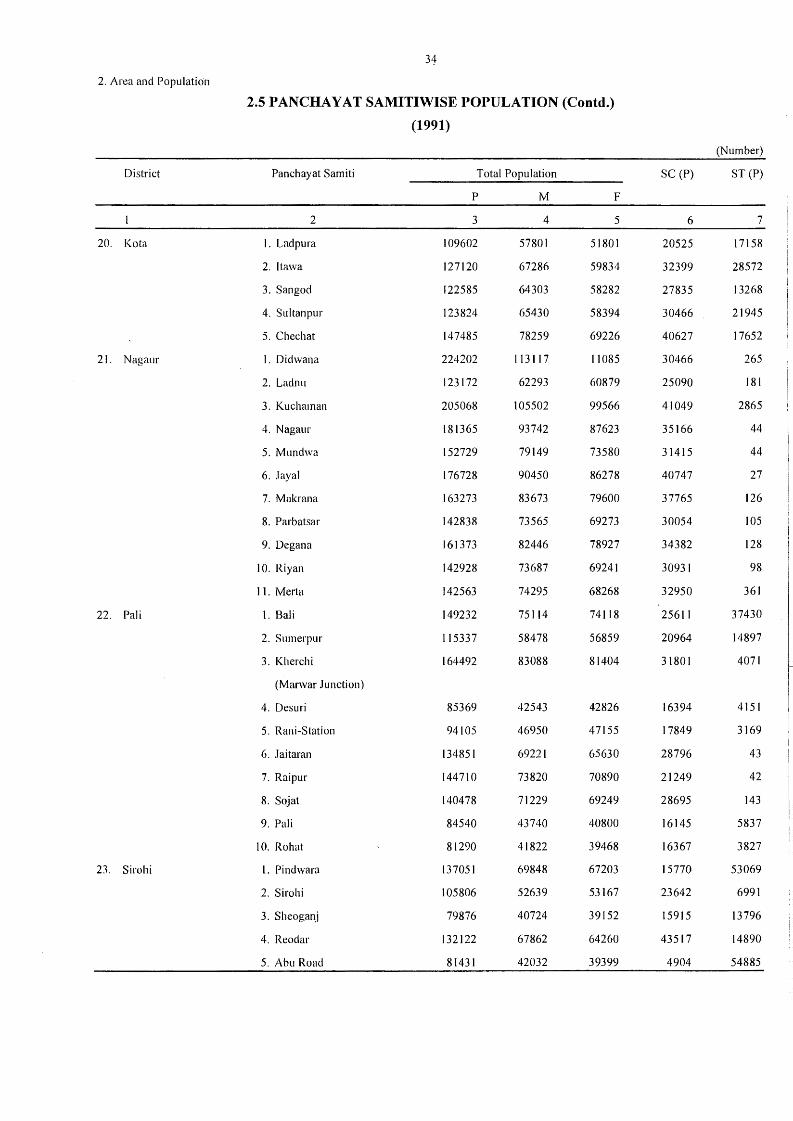
34
2. Area and Population
2.5 PANCHA Y AT SAMITIWISE POPULATION (Contd.)
(1991)
(Number)
District Panchayat Samiti Total Population SC (P) ST (P)
p M F
2 3 4 5 6 7
20. Ko ta I. Ladpura 109602 57801 51801 20525 17158
2. Itawa 127120 67286 59834 32399 28572
3. Sangod 122585 64303 58282 27835 13268
4. Sultanpur 123824 65430 58394 30466 21945
5. Chechat 147485 78259 69226 40627 17652
21. Nagaur I. Didwana 224202 113117 11085 30466 265
2. Ladnu 123172 62293 60879 25090 181
3. Kuchaman 205068 105502 99566 41049 2865
4. Nagaur 181365 93742 87623 35166 44
5. Mundwa 152729 79149 73580 31415 44
6. Jayal 176728 90450 86278 40747 27
7. Makrana 163273 83673 79600 37765 126
8. Parbatsar 142838 73565 69273 30054 105
9. Degana 161373 82446 78927 34382 128
10. Riyan 142928 73687 69241 30931 98
11. Merta 142563 74295 68268 32950 361
22. Pali l. Bali 149232 75114 74118 25611 37430
2. Sumerpur 115337 58478 56859 20964 14897
3. Kherchi 164492 83088 81404 31801 4071
(Marwar Junction)
4. Desuri 85369 42543 42826 16394 4151
5. Rani-Station 94105 46950 47155 17849 3169
6. Jaitaran 134851 69221 65630 28796 43
7. Raipur 144710 73820 70890 21249 42
8. Sojat 140478 71229 69249 28695 143
9. Pali 84540 43740 40800 16145 5837
10. Rohat 81290 41822 39468 16367 3827
23. Sirohi l. Pindwara 137051 69848 67203 15770 53069
2. Sirohi 105806 52639 53167 23642 6991
3. Sheoganj 79876 40724 39152 15915 13796
4. Reodar 132122 67862 64260 43517 14890
5. Abu Road 81431 42032 39399 4904 54885
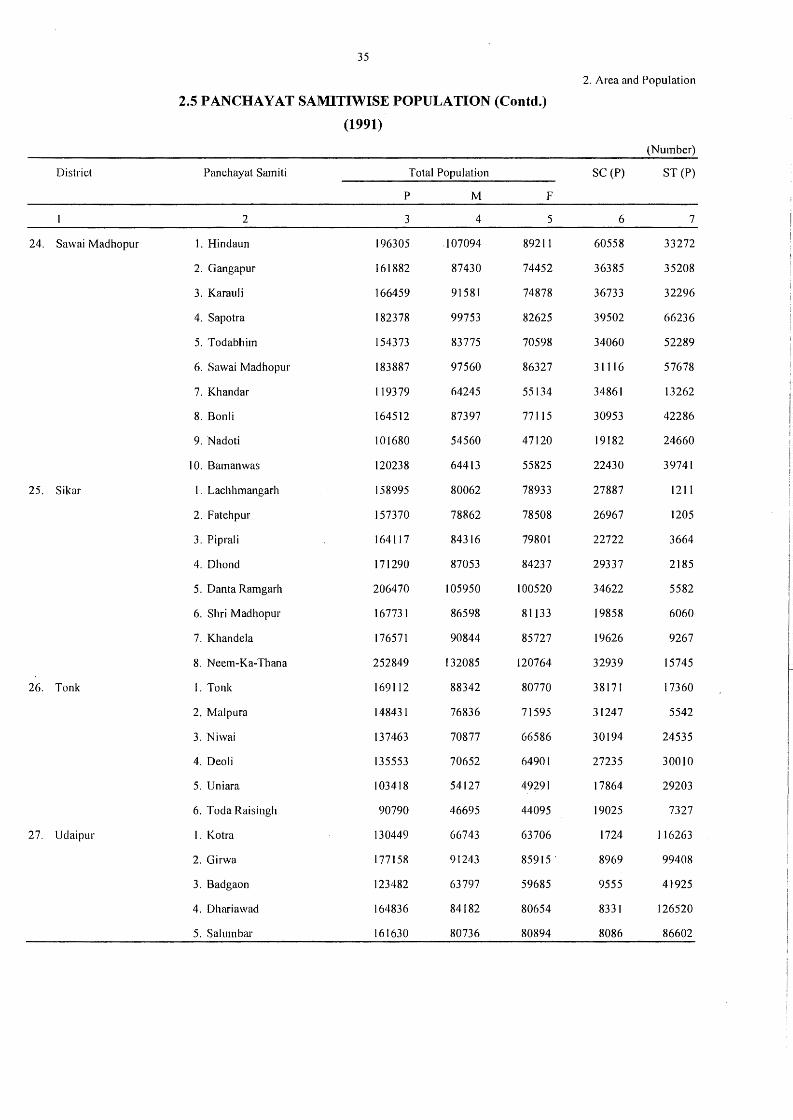
35
2. Area and Population
2.5 PANCHAYAT SAMITIWISE POPULATION (Contd.)
(1991)
(Number)
District Panchayat Samiti Total Population SC (P) ST (P)
p M F
2 3 4 5 6 7
24. Sawai Madhopur 1. Hindaun 196305 .107094 89211 60558 33272
2. Gangapur 161882 87430 74452 36385 35208
3. Karauli 166459 91581 74878 36733 32296
4. Sapotra 182378 99753 82625 39502 66236
5. Todabhim 154373 83775 70598 34060 52289
6. Sawai Madhopur 183887 97560 86327 31116 57678
7. Khandar 119379 64245 55134 34861 13262
8. Bonli 164512 87397 77115 30953 42286
9. Nadoti 101680 54560 47120 19182 24660
I 0. Bamanwas 120238 64413 55825 22430 39741
25. Sikar I . Lachhmangarh 158995 80062 78933 27887 1211
2. Fatehpur 157370 78862 78508 26967 1205
3. Piprali 164117 84316 79801 22722 3664
4. Dhond 171290 87053 84237 29337 2185
5. Danta Ramgarh 206470 105950 100520 34622 5582
6. Shri Madhopur 167731 86598 81133 19858 6060
7. Khandela 176571 90844 85727 19626 9267
8. Neem-Ka-Thana 252849 132085 120764 32939 15745
26. Tonk 1. Tonk 169112 88342 80770 38171 17360
2. Malpura 148431 76836 71595 31247 5542
3. Niwai 137463 70877 66586 30194 24535
4. Deoli 135553 70652 64901 27235 30010
5. Uniara 103418 54127 49291 17864 29203
6. Toda Raisingh 90790 46695 44095 19025 7327
27. Udaipur I. Kotra 130449 66743 63706 1724 116263
2. Girwa 177158 91243 85915' 8969 99408
3. Badgaon 123482 63797 59685 9555 41925
4. Dhariawad 164836 84182 80654 8331 126520
5. Salumbar 161630 80736 80894 8086 86602
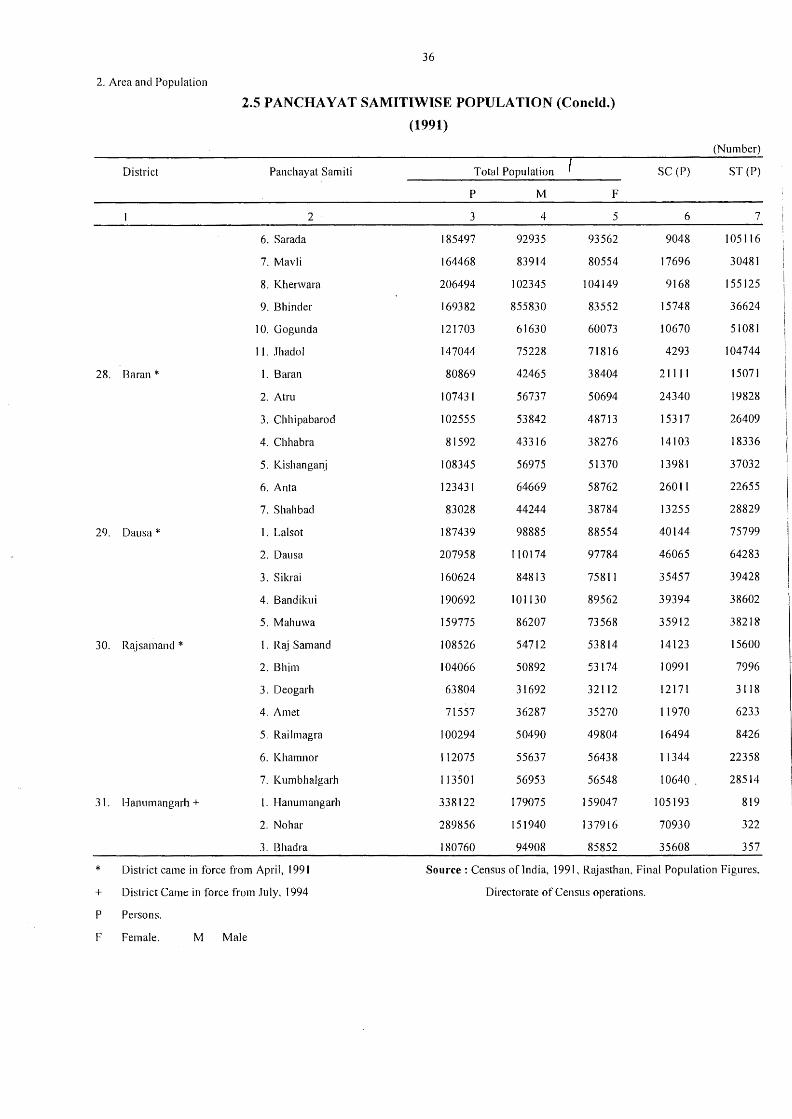
36
2. Area and Population
2.5 PAN CHAY AT SAMITIWISE POPULATION (Concld.)
(1991)
(Number)
District Panchayat Samiti Total Population SC (P) ST (P)
p M F
2 3 4 5 6 7
6. Sarada 185497 92935 93562 9048 105116
7. Mavli 164468 83914 80554 17696 30481
8. Kherwara 206494 102345 104149 9168 155125
9. Bhinder 169382 855830 83552 15748 36624
10. Gogunda 121703 61630 60073 10670 51081
11. Jhadol 147044 75228 71816 4293 104744
28. Baran* I. Baran 80869 42465 38404 21111 15071
2. Atru 107431 56737 50694 24340 19828
3. Cbhipabarod 102555 53842 48713 15317 26409
4. Chhabra 81592 43316 38276 14103 18336
5. Kishanganj 108345 56975 51370 13981 37032
6. Anta 123431 64669 58762 26011 22655
7. Shahbad 83028 44244 38784 13255 28829
29. Dausa * 1. Lalsot 187439 98885 88554 40144 75799
2. Dausa 207958 110174 97784 46065 64283
3. Sikrai 160624 84813 75811 35457 39428
4. Bandikui 190692 101130 89562 39394 38602
5. Mahuwa 159775 86207 73568 35912 38218
30. Rajsamand * 1 . Raj Samand 108526 54712 53814 14123 15600
2. Shim 104066 50892 53174 10991 7996
3. Deogarh 63804 31692 32112 12171 3I18
4. Amet 71557 36287 35270 11970 6233
5. Railmagra 100294 50490 49804 16494 8426
6. Khamnor 112075 55637 56438 11344 22358
7. Kumbhalgarh 113501 56953 56548 10640. 28514
31. Hanumangarh + I. Hanumangarh 338122 179075 159047 105193 819
2. Nohar 289856 151940 137916 70930 322
3. Bhadra 180760 94908 85852 35608 357
* District came in force from April, 1991 Source: Census oflndia, 1991, Rajasthan, Final Population Figures.
+ District Came in force from July, 1994 Directorate of Census operations.
p Persons.
F Female. M Male
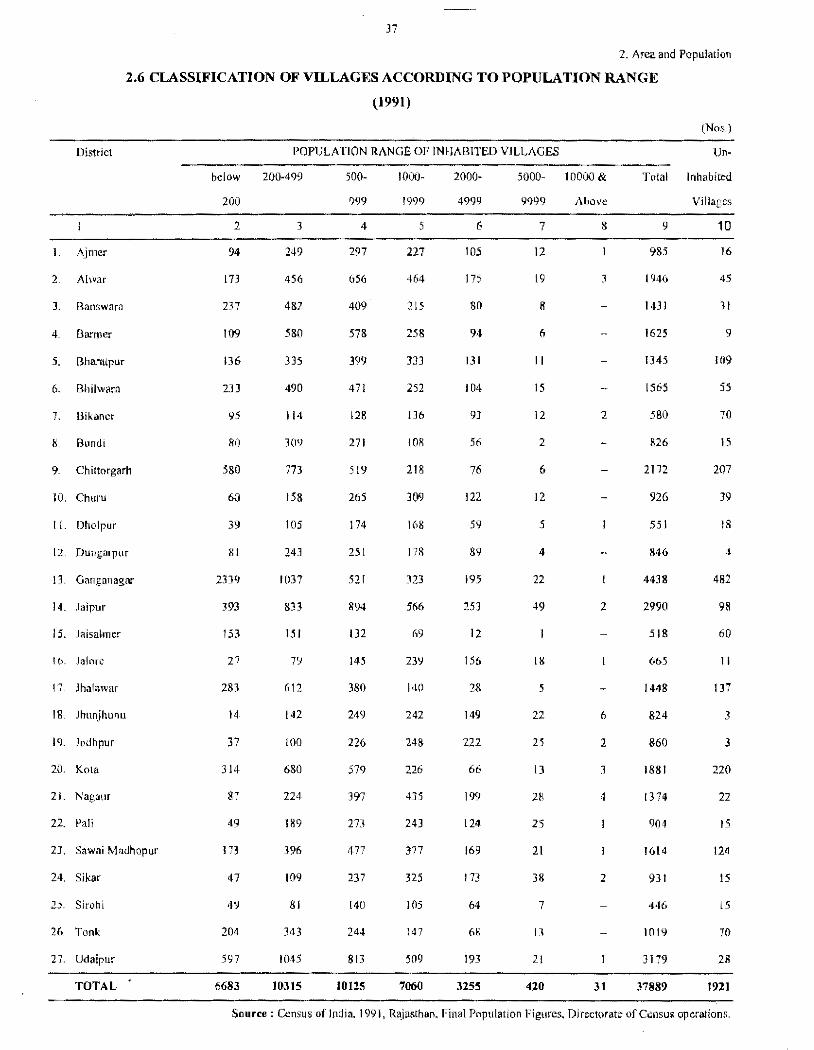
37
2. Arca and Population
2.6 CLASSIFICATION OF VILLAGES ACCORDING TO POPULATION RANGE
District
1. Ajn1cr
2. Ahvar
J, 13answara
5. llharatpur
6. Bhlhvara
7. llikancr
8. Bundt
9. Chittorgarh
10. Churu
11. Dholpur
12. Dungarpur
1 l Cranganagar
14. Jaipur
15. JRisahner
! 6. Ja!nrc
17. Jhalawar
18. Jhunjhunu
19. Jodhpur
20. Kota
21. Nagaur
22. Pali
23. Sawai Mndhopur
24. Sikar
25. Sirohi
26. Ton~
27. Udaipur
TOTAL
(1991)
POPULATION RANGE OP 1Nfltd31TED VILLAGES
below 20()..499
200
2
94
173
237
109
136
233
95
80
580
60
39
RI
2339
393
153
27
283
14
37
314
87
49
!73
47
49
204
597
6683
3
249
456
482
580
3]5
490
114
309
773
158
105
243
1037
833
151
79
612
142
100
680
224
189
396
!09
81
343
HH5
!0315
500-
999
4
297
656
409
578
399
471
128
271
519
265
174
251
521
894
132
145
380
249
226
579
397
273
477
237
140
244
813
!0125
1000-
1999
5
227
464
215
258
333
252
136
108
218
309
168
178
323
566
69
239
\ 4()
242
248
226
435
243
377
325
105
147
509
7060
2000-
4999
6
105
175
80
94
131
!04
93
56
76
122
59
89
195
253
12
156
2R
149
222
66
199
124
169
173
64
68
193
3255
5000- l 0000 &
9999
7
12
19
8
6
11
15
12
2
6
12
5
4
22
49
18
5
22
25
I)
28
25
21
38
7
13
21
420
Above
B
3
2
2
6
2
3
4
2
31
(Nos.)
lln~
Total Inhabited
9
985
1946
1431
1625
1345
1565
580
826
2172
926
551
846
4438
2990
518
665
1448
824
860
1881
1374
904
1614
931
446
1019
3179
37889
Villages
10
16
45
31
9
109
55
70
15
207
39
18
482
98
60
11
137
3
3
220
22
IS
124
15
15
70
28
1921
Source : Census of India. 1991, Rajasthon. Final Population Figures., Directorate of C~nsui operations,
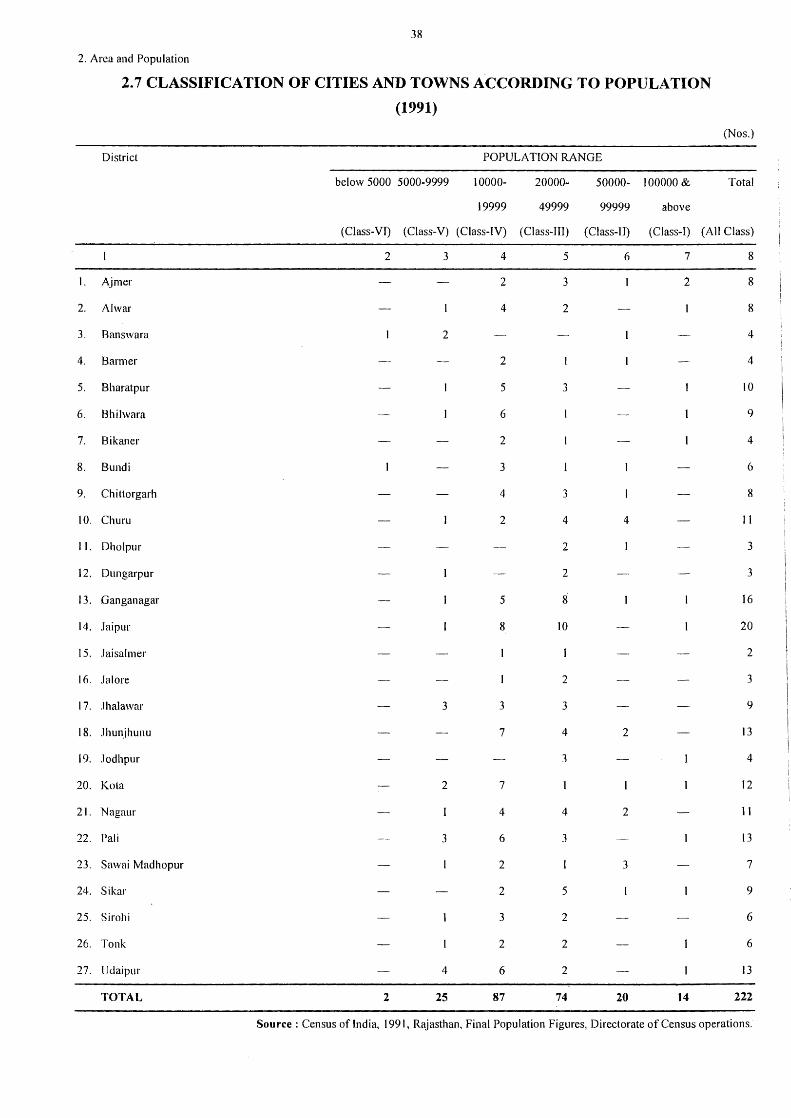
38
2. Area and Population
2.7 CLASSIFICATION OF CITIES AND TOWNS ACCORDING TO POPULATION
(1991)
(Nos.)
District POPULATION RANGE
below 5000 5000-9999 10000- 20000- 50000- 100000 & Total
19999 49999 99999 above
(Class-VI) (Class-V) (Class-IV) (Class-JU) (Class-II) (Class-I) (All Class)
2 3 4 5 6 7 8
I. Ajmer 2 3 2 8
2. Al war 4 2 8
3. Banswara 2 4
4. Barmer 2 4
5. Bharatpur 5 3 10
6. Bhilwara 6 9
7. Bikaner 2 4
8. Bundi 3 6
9. Chittorgarh 4 3 8
10. Churn 2 4 4 11
11. Dholpur 2 3
12. Dungarpur 2 3
13. Ganganagar 5 8 16
14. Jaipur 8 10 20
15. Jaisalmer 2
16. Jal ore 2 3
17. .lhalawar 3 3 3 9
18. .lhunjhunu 7 4 2 13
19. Jodhpur 3 4
20. Ko ta 2 7 12
21. Nagaur 4 4 2 11
22. Pali 3 6 3 13
23. Sawai Madhopur 2 3 7
24. Sikar 2 5 9
25. Sirohi 3 2 6
26. Tonk 2 2 6
27. Udaipur 4 6 2 13
TOTAL 2 25 87 74 20 14 222
Source : Census of India, l 991, Rajasthan, Final Population Figures, Directorate of Census operations.
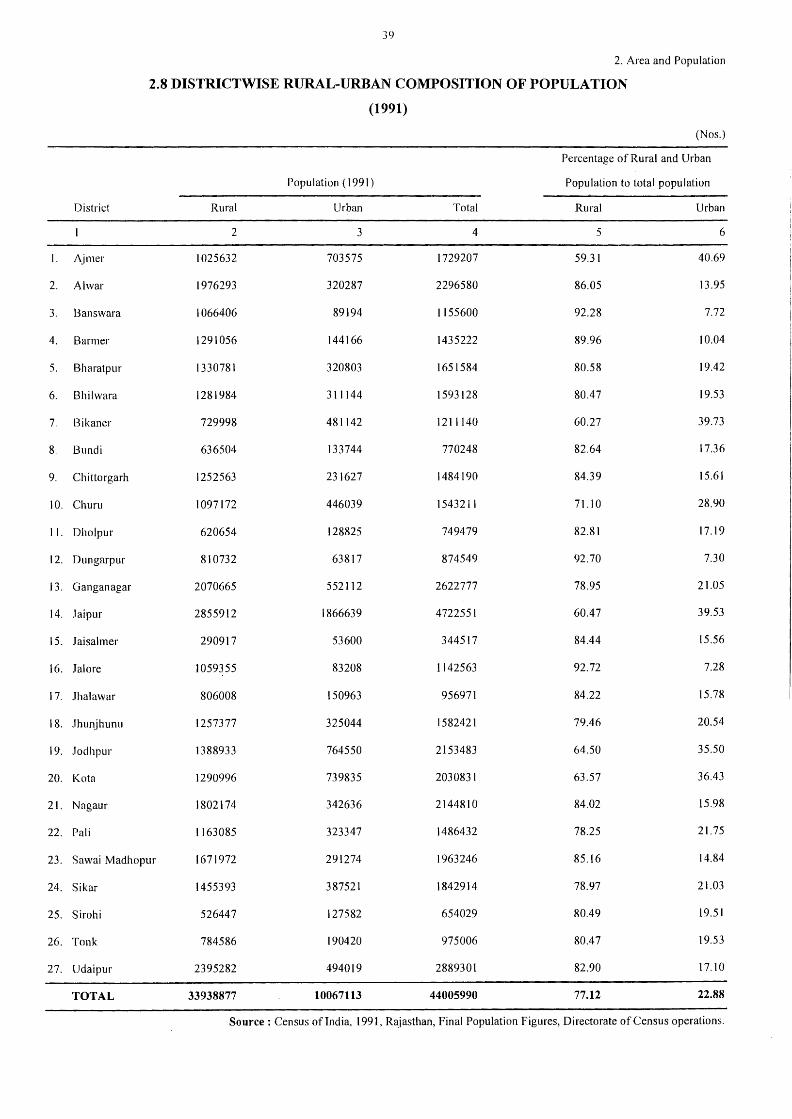
39
2. Area and Population
2.8 DISTRICTWISE RURAL-URBAN COMPOSITION OF POPULATION
(1991)
(Nos.)
Percentage of Rural and Urban
Population ( 1991) Population to total population
District Rural Urban Total Rural Urban
2 3 4 5 6
I. Ajmer 1025632 703575 1729207 59.31 40.69
2. Al war 1976293 320287 2296580 86.05 13.95
3. Banswara 1066406 89194 1155600 92.28 7.72
4. Barmer 1291056 144166 1435222 89.96 10.04
5. Bharatpur 1330781 320803 1651584 80.58 19.42
6. Bhilwara 1281984 311144 1593128 80.47 19.53
7. Bikaner 729998 481142 1211140 60.27 39.73
8. Bundi 636504 133744 770248 82.64 17.36
9. Ch ittorgarh 1252563 231627 1484190 84.39 15.61
IO. Churn 1097172 446039 1543211 71.10 28.90
11. Dholpur 620654 128825 749479 82.81 17.19
12. Dungarpur 810732 63817 874549 92.70 7.30
13. Ganganagar 2070665 552112 2622777 78.95 21.05
14. Jaipur 2855912 1866639 4722551 60.47 39.53
15. Jaisalmer 290917 53600 344517 84.44 15.56
16. .Ta lore 1059355 83208 1142563 92.72 7.28
17. Jhalawar 806008 150963 956971 84.22 15.78
18. Jhunjhunu 1257377 325044 1582421 79.46 20.54
19. .lodhpur 1388933 764550 2153483 64.50 35.50
20. Ko ta 1290996 739835 2030831 63.57 36.43
21. Nagaur 1802174 342636 2144810 84.02 15.98
22. Pali 1163085 323347 1486432 78.25 21.75
23. Sawai Madhopur 1671972 291274 1963246 85.16 14.84
24. Sikar 1455393 387521 1842914 78.97 21.03
25. Sirohi 526447 127582 654029 80.49 19.51
26. Tonk 784586 190420 975006 80.47 19.53
27. Udaipur 2395282 494019 2889301 82.90 17.10
TOTAL 33938877 10067113 44005990 77.12 22.88
Source : Census of India, 1991, R~jasthan, Final Population Figures, Directorate of Census operations.
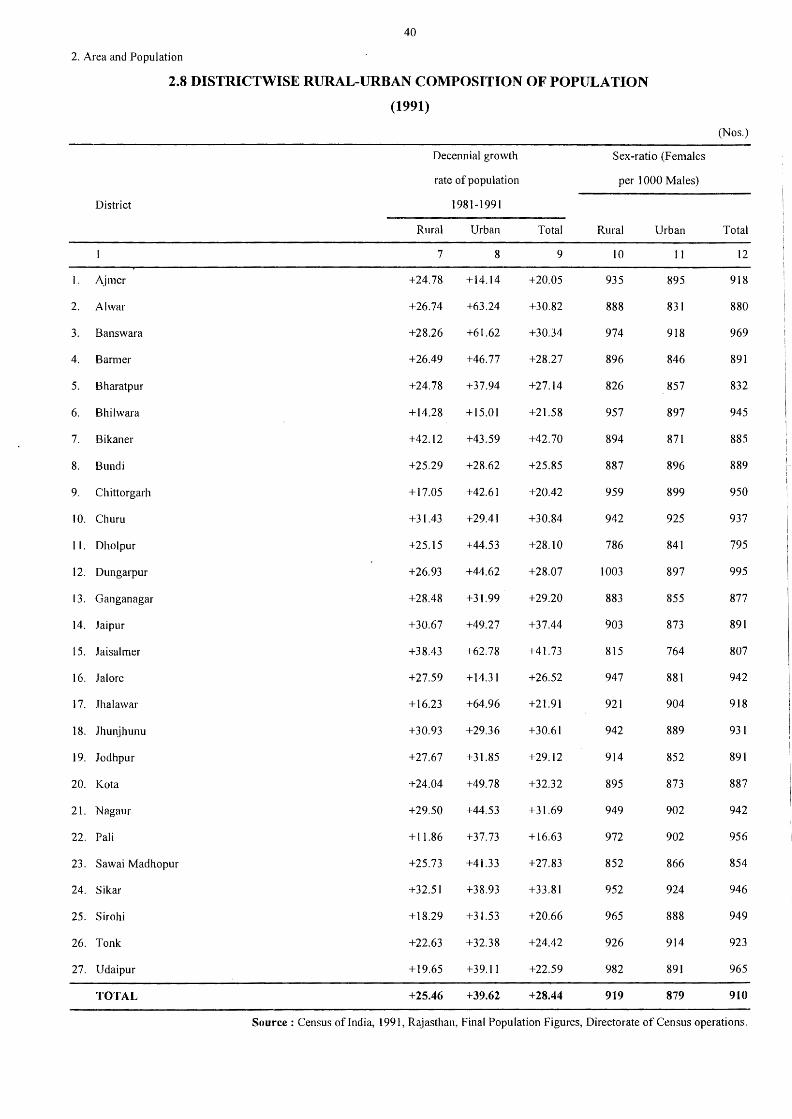
40
2. Area and Population
2.8 DISTRICTWISE RURAL-URBAN COMPOSITION OF POPULATION
(1991)
(Nos.)
Decennial growth Sex-ratio (Females
rate of population per I 000 Males)
District 1981-1991
Rural Urban Total Rural Urban Total
7 8 9 10 11 12
1. Ajmer +24.78 +14.14 +20.05 935 895 918
2. Al war +26.74 +63.24 +30.82 888 831 880
3. Banswara +28.26 +61.62 +30.34 974 918 969
4. Barmer +26.49 +46.77 +28.27 896 846 891
5. Bharatpur +24.78 +37.94 +27.14 826 857 832
6. Bhilwara +14.28 +15.01 +21.58 957 897 945
7. Bikaner +42.12 +43.59 +42.70 894 871 885
8. Bundi +25.29 +28.62 +25.85 887 896 889
9. Chittorgarh +17.05 +42.61 +20.42 959 899 950
IO. Churn +3 l.43 +29.41 +30.84 942 925 937
11. Dholpur +25.15 +44.53 +28.10 786 841 795
12. Dungarpur +26.93 +44.62 +28.07 1003 897 995
13. Ganganagar +28.48 +31.99 +29.20 883 855 877
14. Jaipur +30.67 +49.27 +37.44 903 873 891
15. Jaisalmer +38.43 +62.78 +41.73 815 764 807
16. Jalore +27.59 +14.31 +26.52 947 881 942
17. Jhalawar +16.23 +64.96 +21.91 921 904 918
18. Jhunjhunu +30.93 +29.36 +30.61 942 889 931
19. Jodhpur +27.67 +31.85 +29.12 914 852 891
20. Ko ta +24.04 +49.78 +32.32 895 873 887
21. Nagaur +29.50 +44.53 +31.69 949 902 942
22. Pali + 11.86 +37.73 +16.63 972 902 956
23. Sawai Madhopur +25.73 +41.33 +27.83 852 866 854
24. Sikar +32.51 +38.93 +33.81 952 924 946
25. Sirohi +18.29 +31.53 +20.66 965 888 949
26. Tonk +22.63 +32.38 +24.42 926 914 923
27. Udaipur + 19.65 +39.11 +22.59 982 891 965
TOTAL +25.46 +39.62 +28.44 919 879 910
Source : Census oflndia, 1991, Rajasthan, Final Population Figures, Directorate of Census operations.
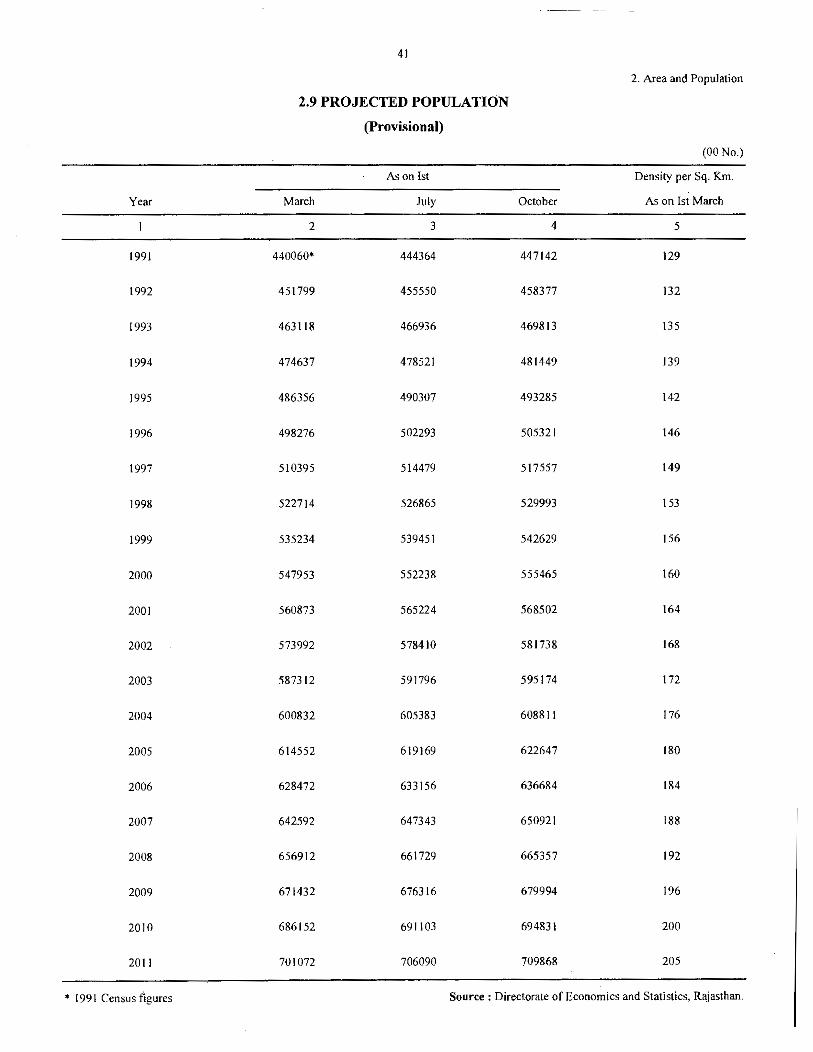
--- --
41
2. Area and Population
2.9 PROJECTED POPULATION
(Provisional)
(00 No_)
As on 1st Density per Sq. Km.
Year March July October As on Ist March
2 3 4 5
1991 440060* 444364 447142 129
1992 451799 455550 458377 132
!993 463118 466936 469813 135
1994 474637 478521 481449 139
1995 486356 490307 493285 142
1996 498276 502293 50532 I 146
1997 510395 514479 5 I 7557 149
1998 522714 526865 529993 I 53
1999 535234 539451 542629 156
2000 547953 552238 555465 160
2001 560873 565224 568502 164
2002 573992 5784 JO 581738 168
2003 587312 591796 595 I 74 172
2004 600832 605383 608811 176
2005 614552 619169 622647 180
2006 628472 633156 636684 184
2007 642592 647343 650921 188
2008 656912 661729 665357 192
2009 671432 676316 679994 196
2010 686152 691103 694831 200
201 I 701072 706090 709868 205
"' 1991 Census figures Source: Directorate of Economics and Statistics, Rajasthan.
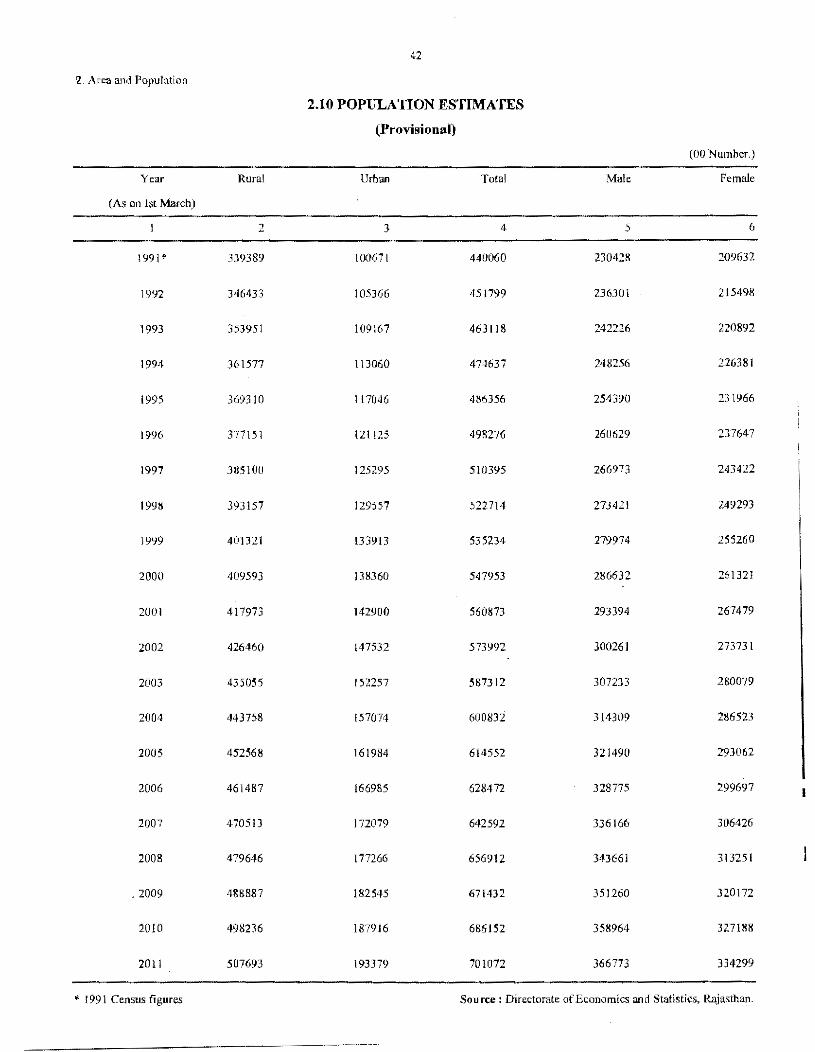
42
?.,, Area and Population
2.10 POPULATION ESTIMATES
(Provisional)
(00 Number.)
Year Rural Urboo Total Nfale Female
(As on !st March)
2 3 4 5 6
1991' 339389 I 00671 440060 230428 209632
1992 346433 105366 451799 236301 215498
1993 353951 I 09167 463118 242226 220892
1994 361577 I 13060 474637 248256 216381
1995 369310 117046 486356 254390 231966
1996 377151 121125 498276 260629 237647
1997 385100 125295 510395 266973 243422
1998 393157 129557 522714 273421 249293
1999 40])21 133913 535234 279974 255260
2000 409593 138360 547953 286632 261321
2001 417973 142900 560873 293394 267479
2002 426460 147532 573992 300261 273731
2003 435055 152257 587312 307233 280079
2004 443758 157074 600832 314309 286523
2005 452568 161984 614552 321490 293062
2006 461487 166985 628472 328775 299697
2007 470513 171079 642591 336166 306426
2008 479646 177266 656912 343661 313251
2009 488887 182545 671432 351260 320172
20!0 498236 187916 686152 358964 327188
2011 507693 193379 701072 366773 334299
* I 99 l Census figures Source: Directorate of Economics and Statistics:, Rajasthan.
-~·------
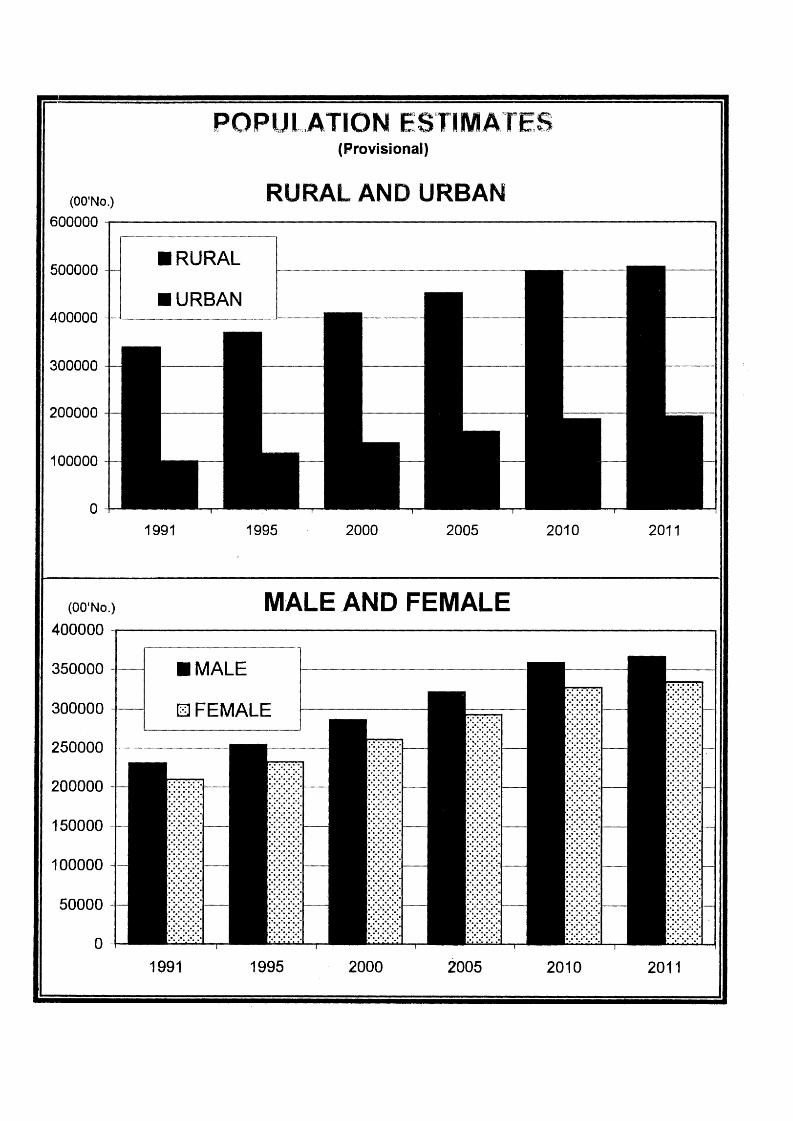
(Provisional)
(OO'No.) RURAL AND URBAN 600000
500000 •RURAL
•URBAN 400000
300000
200000
100000
0 1991 1995 2000 2005 2010 2011
(001No.) MALE AND FEMALE 400000 -r-----------------------------.
350000 •MALE
300000 - CJ FEMALE
250000 -t-----
200000
150000
100000
50000 -
0 1991 1995 2000 2005 2010 2011
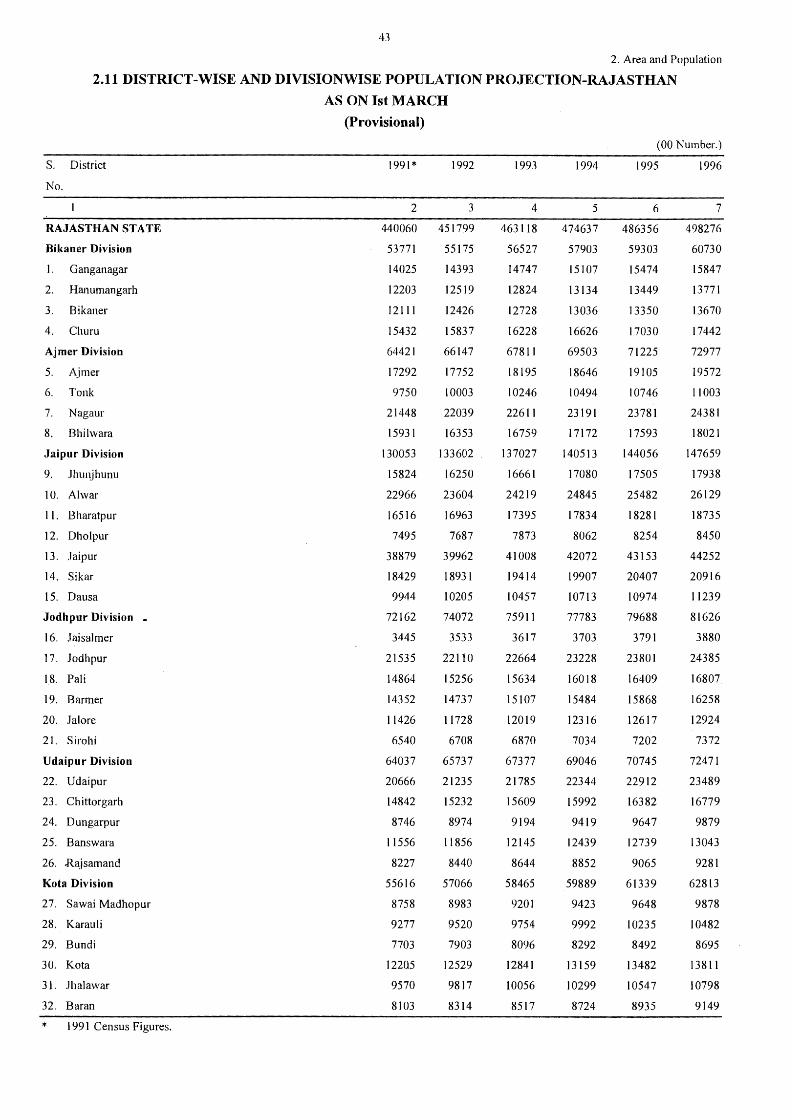
43
2. Area and Population
2.11 DISTRICT-WISE AND DIVISIONWISE POPULATION PROJECTION-RAJASTHAN
AS ON 1st MARCH
S. District
No.
RAJASTHAN STATE
Bikaner Division
I. Ganganagar
2. Hanumangarh
3. Bikaner
4. Churn
Ajmer Division
5. Ajmer
6. Tonk
7. Nagaur
8. Bhilwara
Jaipur Division
9. .lhUJ\jhunu
10. Alwar
11. Bharatpur
12. Dholpur
13. Jaipur
14. Sikar
15. Dausa
Jodhpur Division ..
16. Jaisalmer
17. .lodhpur
18. Pali
19. Barmer
20. Jalore
21. Sirohi
Udaipur Division
22. Udaipur
23. Chittorgarh
24. Dungarpur
25. Banswara
26. .Rajsarnand
Kota Division
27. Sawai Madhopur
28. Karauli
29. Bundi
30. Kota
31. .lhalawar
32. Baran
* 1991 Census Figures.
(Provisional)
1991*
2
440060
53771
14025
12203
12111
15432
64421
17292
9750
21448
15931
130053
15824
22966
16516
7495
38879
18429
9944
72162
3445
21535
14864
14352
11426
6540
64037
20666
14842
8746
11556
8227
55616
8758
9277
7703
12205
9570
8103
1992
3
451799
55175
14393
12519
12426
15837
66147
17752
10003
22039
16353
133602
16250
23604
16963
7687
39962
18931
10205
74072
3533
22110
15256
14737
11728
6708
65737
21235
15232
8974
11856
8440
57066
8983
9520
7903
12529
9817
8314
1993
4
463118
56527
14747
12824
12728
16228
67811
18195
10246
22611
16759
137027
16661
24219
17395
7873
41008
19414
10457
75911
3617
22664
15634
15107
12019
6870
67377
21785
15609
9194
12145
8644
58465
9201
9754
8096
12841
10056
8517
1994
5
474637
57903
15107
13134
13036
16626
69503
18646
10494
23191
17172
140513
17080
24845
17834
8062
42072
19907
10713
77783
3703
23228
16018
15484
12316
7034
69046
22344
15992
9419
12439
8852
59889
9423
9992
8292
13159
10299
8724
(00 Number.)
1995 1996
6
486356
59303
15474
13449
13350
17030
71225
19105
10746
23781
17593
144056
17505
25482
18281
8254
43153
20407
10974
79688
3791
23801
16409
15868
12617
7202
70745
22912
16382
9647
12739
9065
61339
9648
10235
8492
13482
10547
8935
7
498276
60730
15847
13771
13670
17442
72977
19572
11003
24381
18021
147659
17938
26129
18735
8450
44252
20916
11239
81626
3880
24385
16807
16258
12924
7372
72471
23489
16779
9879
13043
9281
62813
9878
10482
8695
13811
10798
9149
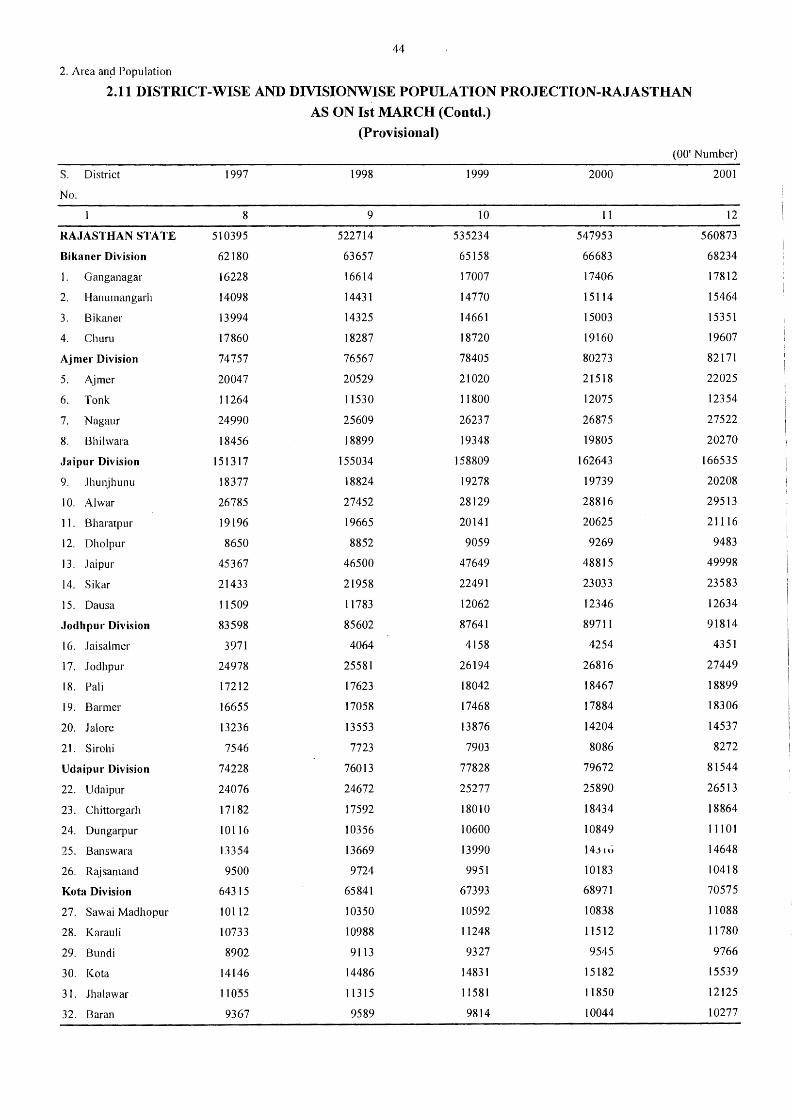
44
2. Area anp Population
2.11 DISTRICT-WISE AND DIVISIONWISE POPULATION PROJECTION-RAJASTHAN
AS ON 1st MARCH (Contd.)
(Provisional)
(001 Number)
S. District 1997 1998 1999 2000 2001
No.
8 9 10 11 12
RAJASTHAN STA TE 510395 522714 535234 547953 560873
Bikaner Division 62180 63657 65158 66683 68234
1. Ganganagar 16228 16614 17007 17406 17812
2. Hanumangarh 14098 14431 14770 15114 15464
3. Bikaner 13994 14325 14661 15003 I 5351
4. Churn 17860 18287 18720 19160 19607
Ajmer Division 74757 76567 78405 80273 82171
5. Ajmer 20047 20529 21020 21518 22025
6. Tonk 11264 11530 11800 12075 12354
7. Nagaur 24990 25609 26237 26875 27522
8. Bhilwara 18456 18899 19348 19805 20270
Jaipur Division 151317 155034 158809 162643 166535
9. Jhunjhunu 18377 18824 19278 19739 20208
JO. Al war 26785 27452 28129 28816 29513
11. Bhararpur 19196 19665 20141 20625 21116
12. Dholpur 8650 8852 9059 9269 9483
13. Jaipur 45367 46500 47649 48815 49998
14. Sikar 21433 21958 22491 23033 23583
15. Daus a 11509 11783 12062 12346 12634
Jodhpur Division 83598 85602 87641 89711 91814
16. Jaisalmer 3971 4064 4158 4254 4351
17. Jodhpur 24978 25581 26194 26816 27449
18. Pali 17212 17623 18042 18467 18899
19. Barmer 16655 17058 17468 17884 18306
20. Jal ore 13236 13553 13876 14204 14537
21. Sirohi 7546 7723 7903 8086 8272
Udaipur Division 74228 76013 77828 79672 81544
22. Udaipur 24076 24672 25277 25890 26513
23. Chittorgarh 17182 17592 18010 18434 18864
24. Dungarpur 10116 10356 10600 10849 11101
25. Banswara 13354 13669 13990 14J1u 14648
26. Rajsamand 9500 9724 9951 10183 10418
Kota Division 64315 65841 67393 68971 70575
27. Sawai Madhopur 10112 10350 10592 10838 11088
28. Karau Ii 10733 10988 11248 11512 11780
29. Bundi 8902 9113 9327 9545 9766
30. Ko ta 14146 14486 14831 15182 15539
3 l. Jhalawar 11055 11315 11581 11850 12125
32. Baran 9367 9589 9814 10044 10277
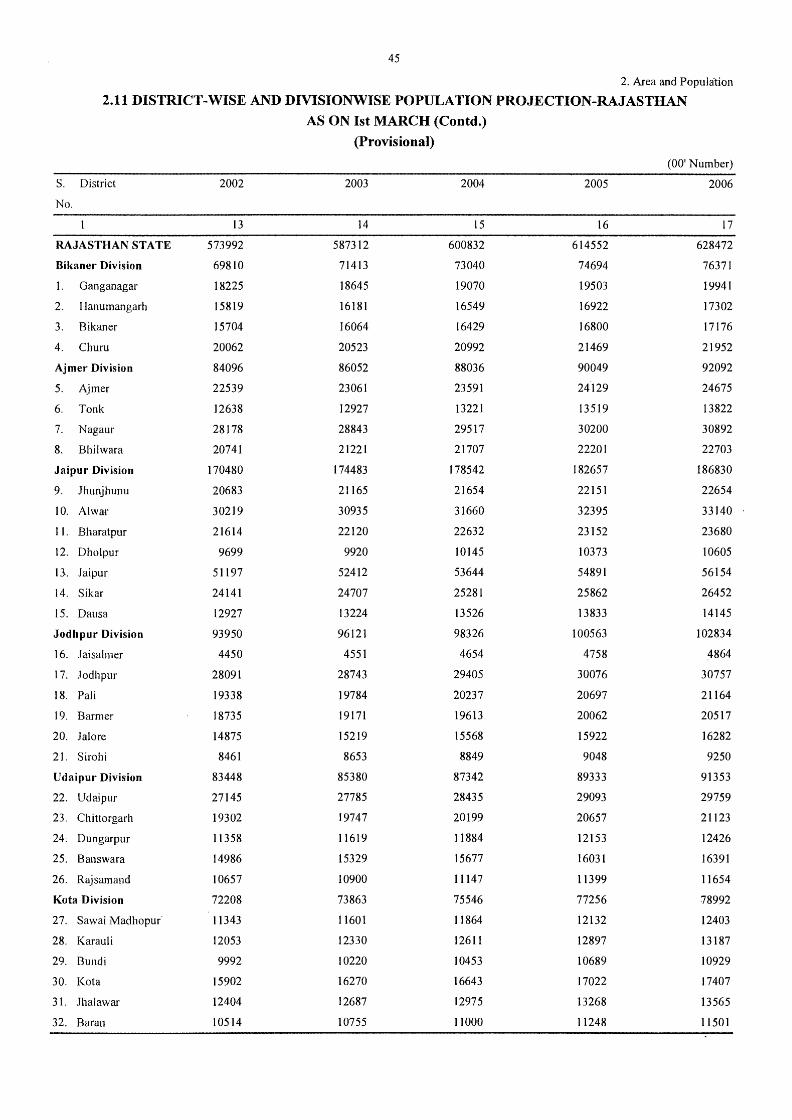
45
2. Area and Population
2.11 DISTRICT-WISE AND DIVISIONWISE POPULATION PROJECTION-RAJASTHAN
AS ON 1st MARCH (Contd.)
(Provisional)
(00' Number)
S. District 2002 2003 2004 2005 2006
No.
13 14 15 16 17
RAJASTHAN STA TE 573992 587312 600832 614552 628472
Bikaner Division 69810 71413 73040 74694 76371
1. Ganganagar 18225 18645 19070 19503 19941
2. Hanumangarh 15819 16181 16549 16922 17302
3. Bikaner 15704 16064 16429 16800 17176
4. Churn 20062 20523 20992 21469 21952
Ajmer Division 84096 86052 88036 90049 92092
5. Ajmer 22539 23061 23591 24129 24675
6. Tonk 12638 12927 13221 13519 13822
7. Nagaur 28178 28843 29517 30200 30892
8. Bhilwara 20741 21221 21707 22201 22703
Jaipur Division 170480 174483 178542 182657 186830
9. Jhunjhunu 20683 21165 21654 22151 22654
10. Al war 30219 30935 31660 32395 33140
11. Bharatpur 21614 22120 22632 23152 23680
12. Dholpur 9699 9920 10145 10373 10605
J.3.. Jaipur 51197 52412 53644 54891 56154
14. Sikar 24141 24707 25281 25862 26452
15. Dausa 12927 13224 13526 13833 14145
Jodhpur Division 93950 96121 98326 100563 102834
16. Jaisalmer 4450 4551 4654 4758 4864
17. Jodhpur 28091 28743 29405 30076 30757
18. Pali 19338 19784 20237 20697 21164
19. Barmer 18735 19171 19613 20062 20517
20. Jal ore 14875 15219 15568 15922 16282
21. Sirobi 8461 8653 8849 9048 9250
Udaipur Division 83448 85380 87342 89333 91353
22. Udaipur 27145 27785 28435 29093 29759
23. Chittorgarh 19302 19747 20199 20657 21123
24. Dungarpur 11358 11619 11884 12153 12426
25. Banswara 14986 15329 15677 16031 16391
26. Rajsamand 10657 10900 11147 11399 11654
Kota Division 72208 73863 75546 77256 78992
27. Sawai Madhopur 11343 11601 11864 12132 12403
28. Karau Ii 12053 12330 12611 12897 13187
29. Bundi 9992 10220 10453 10689 10929
30. Ko ta 15902 16270 16643 17022 17407
31. Jhalawar 12404 12687 12975 13268 13565
32. Baran 10514 10755 11000 11248 11501
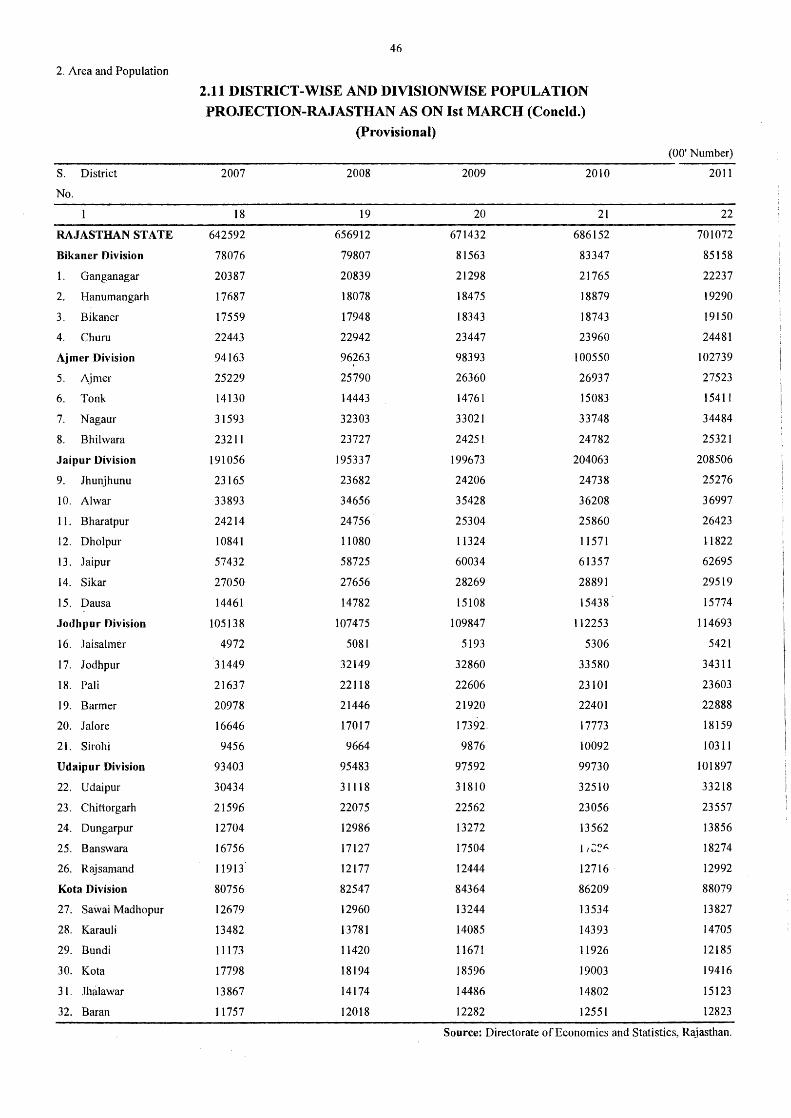
46
2. Area and Population
2.11 DISTRICT-WISE AND DIVISIONWISE POPULATION
PROJECTION-RAJASTHAN AS ON 1st MARCH (Concld.)
(Provisional)
(00' Number)
S. District 2007 2008 2009 2010 2011
No.
1 18 19 20 21 22
RAJASTHAN STATE 642592 656912 671432 686152 701072
Bikaner Division 78076 79807 81563 83347 85158
1. Ganganagar 20387 20839 21298 21765 22237
2. Hanumangarh 17687 18078 18475 18879 19290
3. Bikaner 17559 17948 18343 18743 19150
4. Chum 22443 22942 23447 23960 24481
Ajmer Division 94163 96263 98393 100550 102739
5. Ajmer 25229 25790 26360 26937 27523
6. Tonk 14130 14443 14761 15083 15411
7. Nagaur 31593 32303 33021 33748 34484
8. Bhilwara 23211 23727 24251 24782 25321
Jaipur Division 191056 195337 199673 204063 208506
9. Jhunjhunu 23165 23682 24206 24738 25276
10. Al war 33893 34656 35428 36208 36997
11. Bharatpur 24214 24756 25304 25860 26423
12. Dholpur 10841 11080 11324 11571 11822
13. Jaipur 57432 58725 60034 61357 62695
14. Sikar 27050 27656 28269 28891 29519
15. Dausa 14461 14782 15108 15438 15774
Jodhpur Division 105138 107475 109847 112253 114693
16. Jaisalmer 4972 5081 5193 5306 5421
17. Jodhpur 31449 32149 32860 33580 343I1
18. Pali 21637 22118 22606 23101 23603
19. Barmer 20978 21446 21920 22401 22888
20. Jal ore 16646 17017 17392. 17773 18159
21. Sirohi 9456 9664 9876 10092 10311
Udaipur Division 93403 95483 97592 99730 101897
22. Udaipur 30434 31118 31810 32510 33218
23. Chittorgarh 21596 22075 22562 23056 23557
24. Dungarpur 12704 12986 13272 13562 13856
25. Banswara 16756 17127 17504 1 ~<>r:, ,.., .... 18274
26. Rajsamand 11913 12177 12444 12716 12992
Kota Division 80756 82547 84364 86209 88079
27. Sawai Madhopur 12679 12960 13244 13534 13827
28. Karauli 13482 13781 14085 14393 14705
29. Bundi 11173 11420 11671 11926 12185
30. Ko ta 17798 18194 18596 19003 19416
31. Jhalawar 13867 14174 14486 14802 15123
32. Baran 11757 12018 12282 12551 12823
Source: Directorate of Economics and Statistics, Rajasthan.
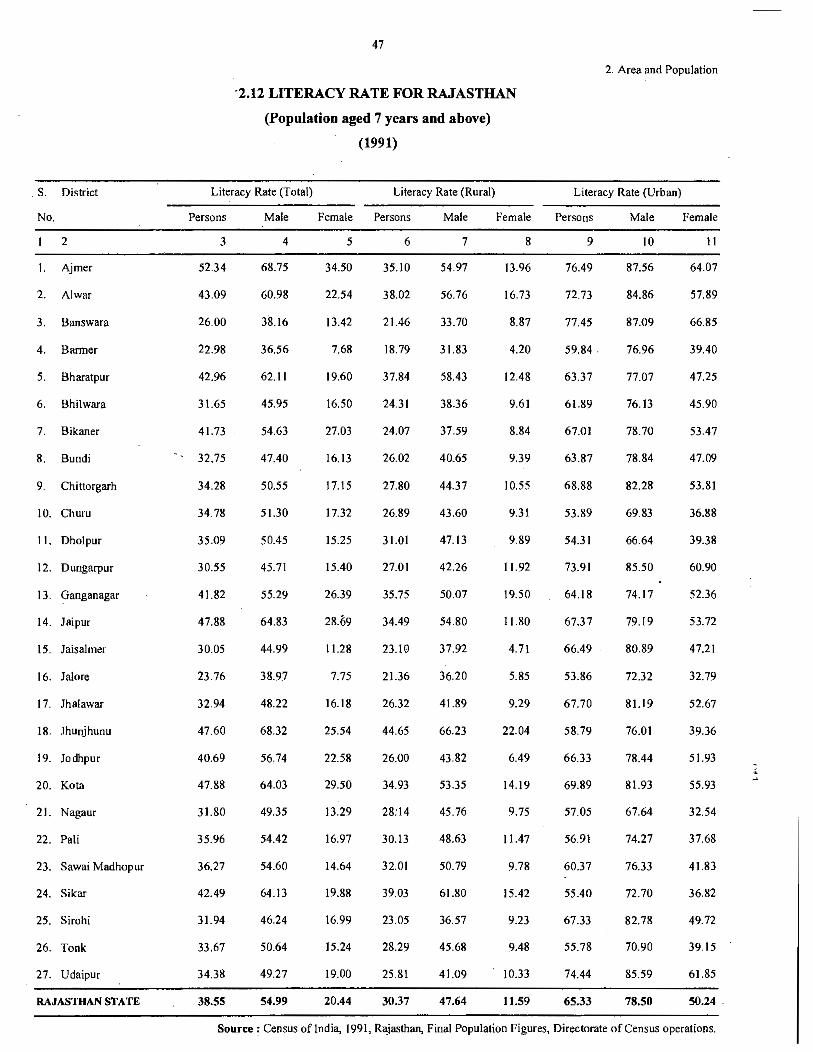
S. District
No.
2
I. Ajmer
2. Ahvar
3. Banswara
4. Barmer
5. Bharatpur
6. Bhilwara
7. Bikaner
8. Bundi
9. Chittorgarh
10. Churu
11. Dholpur
12. Dungarpur
13. 9anganagar
14. Jaipur
15. Jaisalmer
16. Jalore
17. Jhalawar
18. .lhunjhunu
19. Jodhpur
20. Kota
21. Nagaur
22. Pali
23. Sawai Madhopur
24. Sikar
25. Sirohi
26. Tonk
27. Udaipur
RAJASTHAN STATE
47
·2.12 LITERACY RATE FOR RAJASTHAN
(Population aged 7 years and above)
(1991)
Literacy Rate (Total) Literacy Rate (Rural)
Persons
3
52.34
43.09
26.00
22.98
42.96
31.65
41.73
32.75
34.28
34.78
35.09
30.55
41.82
47.88
30.05
23.76
32.94
47.60
40.69
47.88
31.80
35.96
36.27
42.49
31.94
33.67
34.38
38.55
Male
4
68.75
60.98
38.16
36.56
62.11
45.95
54.63
47.40
50.55
51.30
50.45
45.71
55.29
64.83
44.99
38.97
48.22
68.32
56.74
64.03
49.35
54.42
54.60
64.13
46.24
50.64
49.27
54.99
Female Persons Male
5 6 7
34.50 35.10 54.97
22.54 38.02 56.76
13.42 21.46 33.70
7.68 18.79 31.83
19.60 37.84 58.43
16.50 24.31 38.36
27.03 24.07 37.59
16.13 26.02 40.65
17.15 27.80 44.37
17.32 26.89 43.60
15.25 31.0I 47.13
15.40 27.01 42.26
26.39 35.75 50.07
28.69 34.49 54.80
11.28 23.10 37.92
7.75 21.36 36.20
16.18 26.32 41.89
25.54 44.65 66.23
22.58 26.00 43.82
29.50 34.93 53.35
13.29 28:14 45.76
16.97 30.13 48.63
14.64 32.01 50.79
19.88 39.03 61.80
16.99 23.05 36.57
15.24 28.29 45.68
19.00 25.81 41.09
20.44 30.37 47.64
Female
8
13.96
16.73
8.87
4.20
12.48
9.61
8.84
9.39
10.55
9.31
9.89
11.92
19.50
11.80
4.71
5.85
9.29
22.04
6.49
14.19
9.75
11.47
9.78
15.42
9.23
9.48
10.33
11.59
2. Area and Population
Literacy Rate (Urban)
Persons Male Female
9 10 11
76.49 87.56 64.07
72.73 84.86 57.89
77.45 87.09 66.85
59.84. 76.96 39.40
63.37 77.07 47.25
61.89 76.13 45.90
67.01 78.70 53.47
63.87 78.84 47.09
68.88 82.28 53.81
53.89 69.83 36.88
54.31 66.64 39.38
73.91 85.50 60.90
64.18 74.17 52.36
67.37 79.19 53.72
66.49 80.89 47.21
53.86 72.32 32.79
67.70 81.19 52.67
58.79 76.01 39.36
66.33 78.44 51.93
69.89 81.93 55.93
57.05 67.64 32.54
56.91 74.27 37.68
60.37 76.33 41.83
55.40 72.70 36.82
67.33 82.78 49.72
55.78 70.90 39 15
74.44 85.59 61.85
65.33 78.50 50.24
Source: Census of India, 1991, Rajasthan, Final Population Figures, Directorate of Census operations.
. -
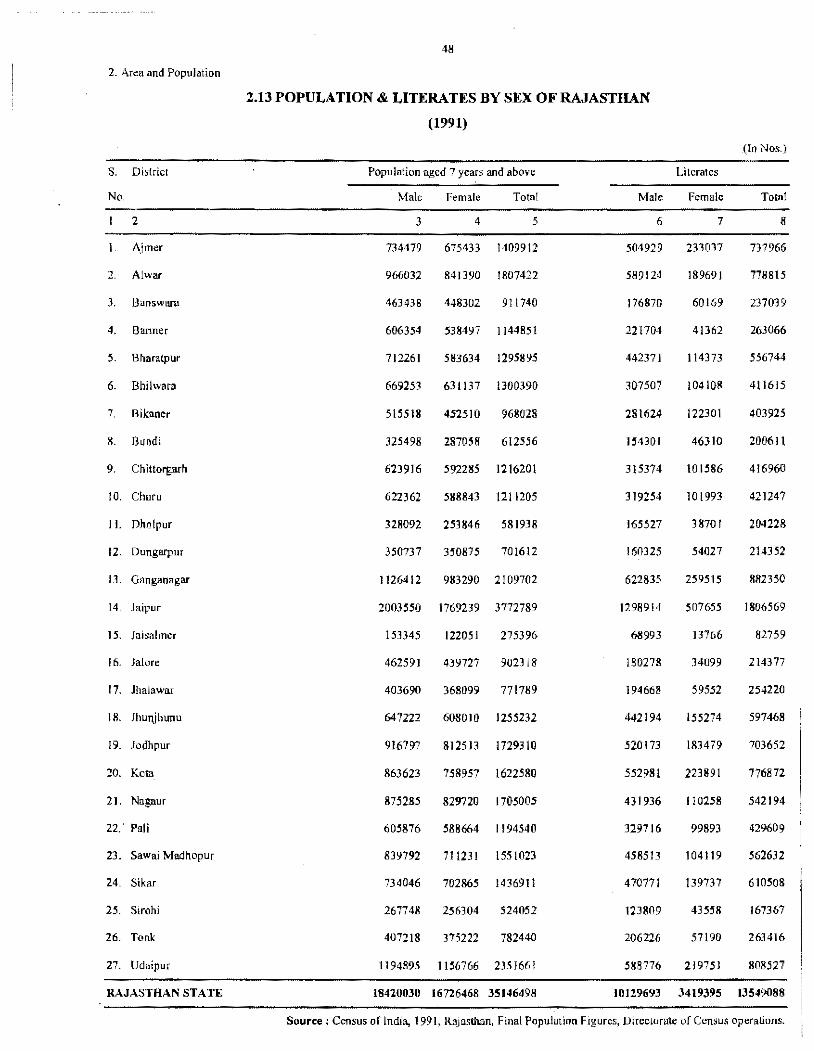
48
2. Area and Population
2.13 POPULATION & LITERATES BY SEX OF RAJASTHAN
(1991)
(ln Nos.)
s. District Population aged 7 years and above Literates
No. Male Female Total Male Female Total
2 3 4 5 6 7 8
I. Ajmer 734479 675433 1409912 504929 233037 737966
2. Al war 966032 841390 1807422 589124 189691 778815
3. Banswara 463438 448302 911740 176870 60169 237039
4. Banner 606354 538497 1144851 221704 41362 263066
5. Bharatpur 712261 583634 1295895 442371 114373 556744
6. Bhilwara 669253 631137 1300390 307507 !04 IOS 411615
7. Bikaner 515518 452510 968028 281624 122301 403925
8. Bundi 325498 287058 612556 154301 46310 200611
9. Ch ittorgarh 623916 592285 121620! 315374 101586 416960
10. Churu 622362 588843 1211205 319254 101993 421247
11. Dholpur 328092 253846 581938 165527 38701 204228
12. Dungarpur 350737 350875 701612 160325 54027 214352
13. Ganganagar 1126412 983290 2109702 622835 259515 882350
14. Jaipur 2003550 1769239 3772789 1298914 507655 1806569
15. Jalsalmer 153345 122051 275396 68993 13766 82759
16. Jalorc 462591 439727 902318 180278 34099 214377
17. Jhalawar 403690 368099 771789 194668 59552 254220
18. Jhunjhunu 647222 608010 1255232 442194 155274 597468
19. .lodhpur 916797 812513 1729310 520173 183479 703652
20. Ko ta 863623 758957 1622580 552981 223891 776872
21. Nagaur 875285 829720 1705005 431936 110258 542194
22. Pali 605876 588664 1194540 329716 99893 42%09
23. Sawai Madhopur 839792 711231 155 !023 458513 104119 562632
24. Sikar 734046 702865 1436911 470771 139737 610508
25. Sirohi 267748 256304 524052 123809 43558 167367
26. Tonk 407218 375222 782440 206226 57190 263416
27. Udaipur 1194895 1156766 2351661 588776 219751 808527
RAJASTHAN STATE 18420030 16726468 35146498 10129693 3419395 13549088
Source : Census of lndia, 1991, Rajasthan, Final Population Figures, Directorate of Census operations.
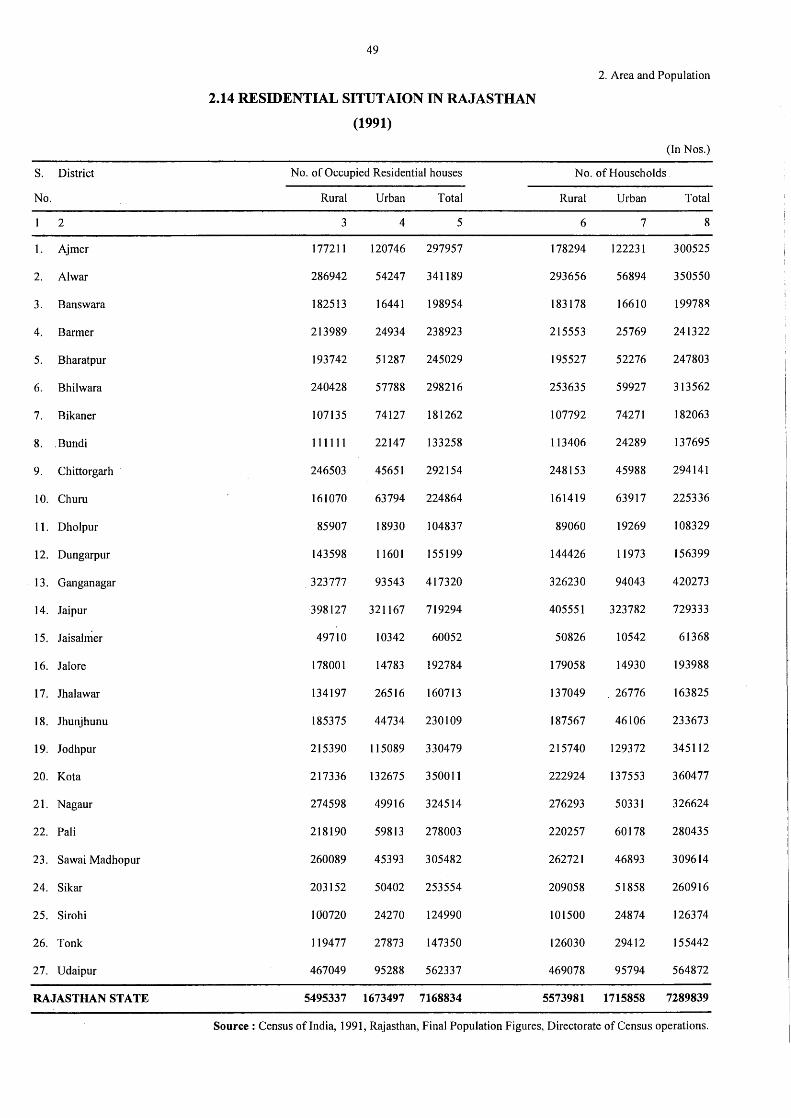
49
2. Area and Population
2.14 RESIDENTIAL SITUTAION IN RAJASTHAN
(1991)
(In Nos.)
S. District No. of Occupied Residential houses No. of Households
No. Rural Urban Total Rural Urban Total
2 3 4 5 6 7 8
1. Ajmer 177211 120746 297957 178294 122231 300525
2. Al war 286942 54247 341189 293656 56894 350550
3. Banswara 182513 16441 198954 183178 16610 19978~
4. Barmer 213989 24934 238923 215553 25769 241322
5. Bharatpur 193742 51287 245029 195527 52276 247803
6. Bhilwara 240428 57788 298216 253635 59927 313562
7. Bikaner 107135 74127 181262 107792 74271 182063
8. .Bundi 111111 22147 133258 113406 24289 137695
9. Chittorgarh 246503 45651 292154 248153 45988 294141
10. Chum 161070 63794 224864 161419 63917 225336
11. Dholpur 85907 18930 104837 89060 19269 108329
12. Dungarpur 143598 11601 155199 144426 11973 156399
13. Ganganagar 323777 93543 417320 326230 94043 420273
14. Jaipur 398127 321167 719294 405551 323782 729333
15. J aisalrrier 49710 10342 60052 50826 10542 61368
16. Jalore 178001 14783 192784 179058 14930 193988
17. Jhalawar 134197 26516 160713 137049 26776 163825
18. Jhunjhunu 185375 44734 230109 187567 46106 233673
19. Jodhpur 215390 115089 330479 215740 129372 345112
20. Ko ta 217336 132675 350011 222924 137553 360477
21. Nagaur 274598 49916 324514 276293 50331 326624
22. Pali 218190 59813 278003 220257 60178 280435
23. Sawai Madhopur 260089 45393 305482 262721 46893 309614
24. Sikar 203152 50402 253554 209058 51858 260916
25. Sirohi 100720 24270 124990 101500 24874 126374
26. Tonk 119477 27873 147350 126030 29412 155442
27. Udaipur 467049 95288 562337 469078 95794 564872
RAJASTHAN STATE 5495337 1673497 7168834 5573981 1715858 7289839
Source : Census oflndia, 1991, Rajasthan, Final Population Figures, Directorate of Census operations.
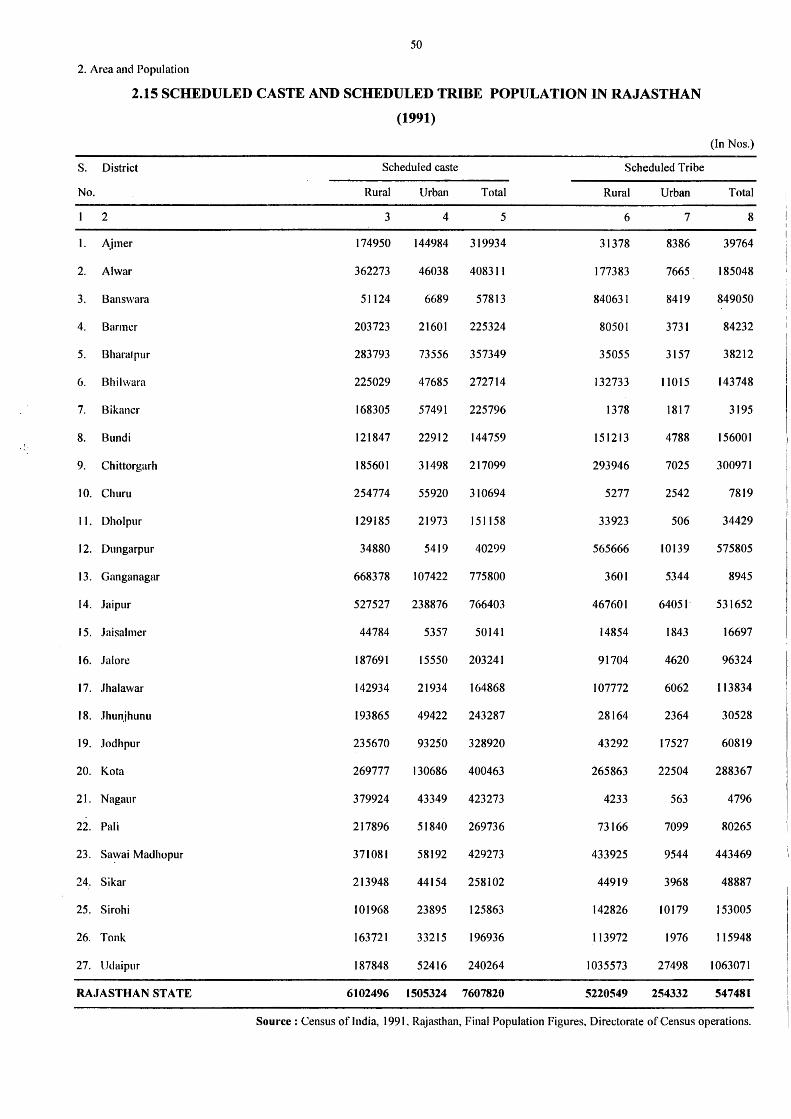
50
2. Area and Population
2.15 SCHEDULED CASTE AND SCHEDULED TRIBE POPULATION IN RAJASTHAN
(1991)
(In Nos.)
s. District Scheduled caste Scheduled Tribe
No. Rural Urban Total Rural Urban Total
2 3 4 5 6 7 8
I. Aimer 174950 144984 319934 31378 8386 39764
2. Al war 362273 46038 40831 I 177383 7665 185048
3. Banswara 51124 6689 57813 840631 8419 849050
4. Barmer 203723 21601 225324 80501 3731 84232
5. Bharalpur 283793 73556 357349 35055 3157 38212
6. Bhilwara 225029 47685 272714 132733 11015 143748
7. Bikancr 168305 57491 225796 1378 1817 3195
8. Bundi 121847 22912 144759 151213 4788 156001
9. Chittorgarh 185601 31498 217099 293946 7025 300971
10. Churu 254774 55920 310694 5277 2542 7819
11. Dholpur 129185 21973 151158 33923 506 34429
12. Dungarpur 34880 5419 40299 565666 10139 575805
13. Ganganagar 668378 107422 775800 3601 5344 8945
14. Jaipur 527527 238876 766403 467601 64051. 531652
15. .laisalmer 44784 5357 50141 14854 1843 16697
16. .la lore 187691 15550 203241 91704 4620 96324
17. Jhalawar 142934 21934 164868 107772 6062 113834
18. .Jhunjhunu 193865 49422 243287 28164 2364 30528
19. Jodhpur 235670 93250 328920 43292 17527 60819
20. Ko ta 269777 130686 400463 265863 22504 288367
21. Nagaur 379924 43349 423273 4233 563 4796
22. Pali 217896 51840 269736 73166 7099 80265
23. Sa~vai Madhopur 371081 58192 429273 433925 9544 443469
24. Sikar 213948 44154 258102 44919 3968 48887
25. Sirohi 101968 23895 125863 142826 10179 153005
26. Tonk 163721 33215 196936 113972 1976 115948
27. Udaipur 187848 52416 240264 1035573 27498 1063071
RAJASTHAN STA TE 6102496 1505324 7607820 5220549 254332 547481
Source : Census of India, 1991, Rajasthan, Final Population Figures, Directorate of Census operations.
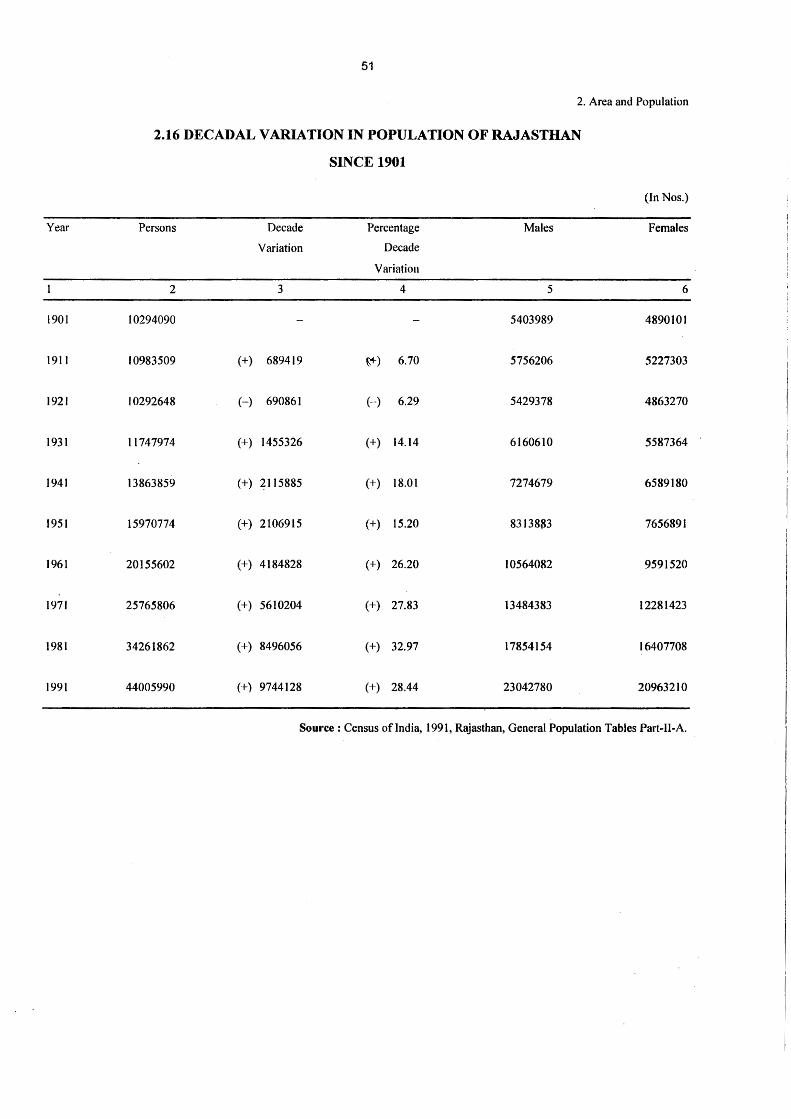
51
2. Area and Population
2.16 DECADAL VARIATION IN POPULATION OF RAJASTHAN
SINCE 1901
(In Nos.)
Year Persons Decade Percentage Males Females
Variation Decade
Variation
2 3 4 5 6
1901 10294090 5403989 4890101
191 I 10983509 (+) 689419 t+) 6.70 5756206 5227303
1921 10292648 (-) 690861 (-) 6.29 5429378 4863270
1931 11747974 (+) 1455326 (+) 14.14 6160610 5587364
1941 13863859 (+) 2115885 (+) 18.01 7274679 6589180
1951 15970774 (+) 2106915 (+) 15.20 8313883 7656891
1961 20155602 (+) 4184828 (+) 26.20 10564082 9591520
1971 25765806 (+) 5610204 (+) 27.83 13484383 12281423
1981 34261862 (+) 8496056 (+) 32.97 17854154 16407708
1991 44005990 (+) 9744128 (+) 28.44 23042780 20963210
Source: Census oflndia, 1991, Rajasthan, General Population Tables Part-II-A.
(3) ENVIRONMENT STATISTICS
TEMPERATURE - Observations of temperature of air in shed are recorded at most of
the observatories twice a day at 08.30 and 17.30 hours IST. For this purpose theresmometers are installed at a height of 4 feet 6 inch above the ground in Stevenson screens which provide free access to the air but at the same time protect the theremometers from direct rays of the sun.
HUMIDITY - Relative humidity is the measure of water vapours present in the
atmosphere relative to the corresponding amount for saturation. It is recorded at the principal observatories by standard record at 8.30 and 17.30 IST.
The temperature and humidity data has been supplied by Indian Meteorological Department, Jaipur.
RAIN FALL - Actual rain fall is recorded at the stations at 8.30 hour IST every day. The amount measured gives the rain fall of the previous 24 hours and the data is tabulated by the Board of Re_venue (Land records), Rajasthan.
Normal annual rain fall is the average ofrain fall data for the fifty years ending in 1950.
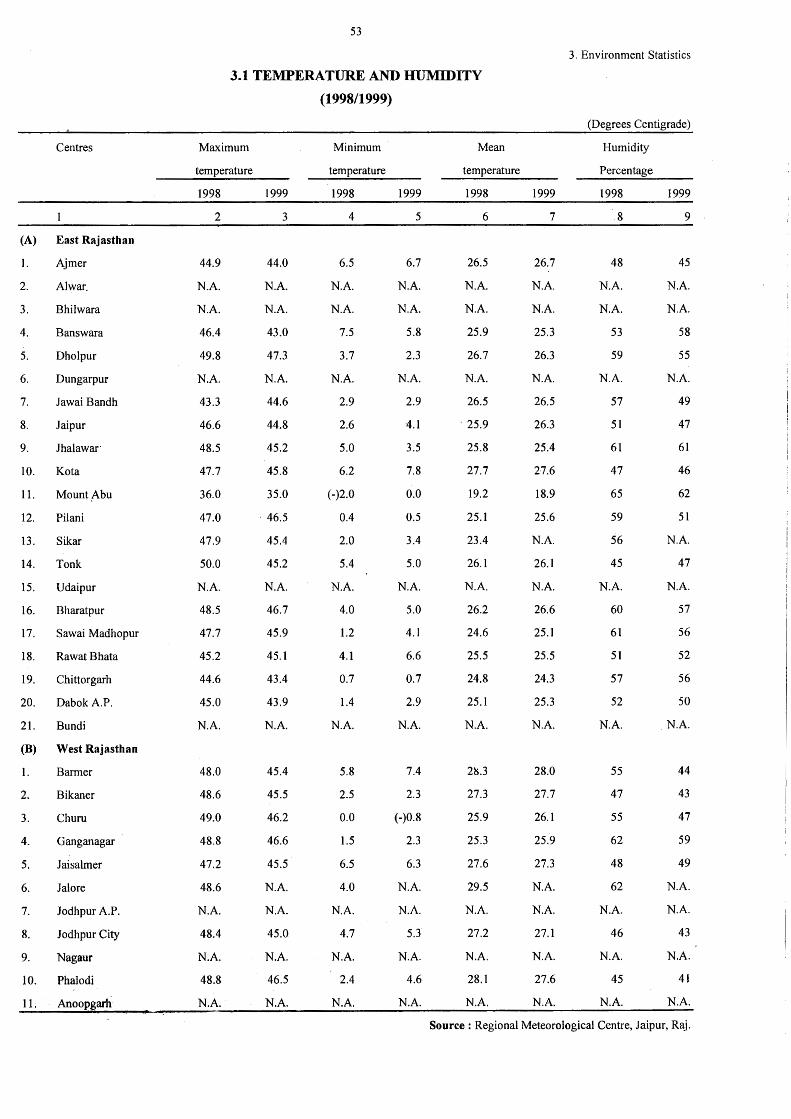
Centres
(A) East Rajasthan
1. Ajmer
2. Al war.
3. Bhilwara
4. Banswara
5. Dholpur
6. Dungarpur
7. Jawai Bandh
8. Jaipur
9. Jhalawar ·
10. Ko ta
11. Mount Abu
12. Pilani
13. Sikar
14. Tonk
15. Udaipur
16. Bharatpur
17. Sawai Madhopur
18. Rawat Bhata
19. Chittorgarh
20. Dabok A.P.
21. Bundi
(B) West Rajasthan
1. Barmer
2. Bikaner
3. Churu
4. Ganganagar
5. Jaisalmer
6. Jal ore
7. Jodhpur A.P.
8. Jodhpur City
9. Nagaur
10. Phalodi
11. Anoopgarh
53
3.1 TEMPERATURE AND HUMIDITY
(1998/1999)
Maximum
temperature
1998
2
44.9
N.A.
N.A.
46.4
49.8
N.A.
43.3
46.6
48.5
47.7
36.0
47.0
47.9
50.0
N.A.
48.5
47.7
45.2
44.6
45.0
N.A.
48.0
48.6
49.0
48.8
47.2
48.6
N.A.
48.4
N.A.
48.8
N.A.
1999
3
44.0
N.A.
N.A.
43.0
47.3
N.A.
44.6
44.8
45.2
45.8
35.0
. 46.5
45.4
45.2
N.A.
46.7
45.9
45.1
43.4
43.9
N.A.
45.4
45.5
46.2
46.6
45.5
N.A.
N.A.
45.0
N.A.
46.5
N.A.
Minimum
temperature
1998
4
6.5
N.A.
N.A.
7.5
3.7
N.A.
2.9
2.6
5.0
6.2
(-)2.0
0.4
2.0
5.4
N.A.
4.0
1.2
4.1
0.7
1.4
N.A.
5.8
2.5
0.0
1.5
6.5
4.0
N.A.
4.7
N.A.
2.4
N.A.
1999
5
6.7
N.A.
N.A.
5.8
2.3
N.A.
2.9
4.1
3.5
7.8
0.0
0.5
3.4
5.0
N.A.
5.0
4.1
6.6
0.7
2.9
N.A.
7.4
2.3
(-)0.8
2.3
6.3
N.A.
N.A.
5.3
N.A.
4.6
N.A.
Mean
temperature
1998
6
26.5
N.A.
N.A.
25.9
26.7
N.A.
26.5
'25.9
25.8
27.7
19.2
25.1
23.4
26.1
N.A.
26.2
24.6
25.5
24.8
25.l
N.A.
2~.3
27.3
25.9
25.3
27.6
29.5
N.A.
27.2
N.A.
28.l
N.A.
1999
7
26.7
N.A.
N.A.
25.3
26.3
N.A.
26.5
26.3
25.4
27.6
18.9
25.6
N.A.
26.1
N.A.
26.6
25.1
25.5
24.3
25.3
N.A.
28.0
27.7
26. l
25.9
27.3
N.A.
N.A.
27.1
N.A.
27.6
N.A.
3. Environment Statistics
(Degrees Centigrade)
Humidity
Percentage
1998
.8
48
N.A.
N.A.
53
59
N.A.
57
51
61
47
65
59
56
45
N.A.
60
61
51
57
52
N.A.
55
47
55
62
48
62
N.A.
46
N.A.
45
N.A.
1999
9
45
N.A.
N.A.
58
55
N.A.
49
47
61
46
62
51
N.A.
47
N.A.
57
56
52
56
50
. N.A.
44
43
47
59
49
N.A.
N.A.
43
N.A.
41
N.A.
Source: Regional Meteorological Centre, Jaipur, Raj.
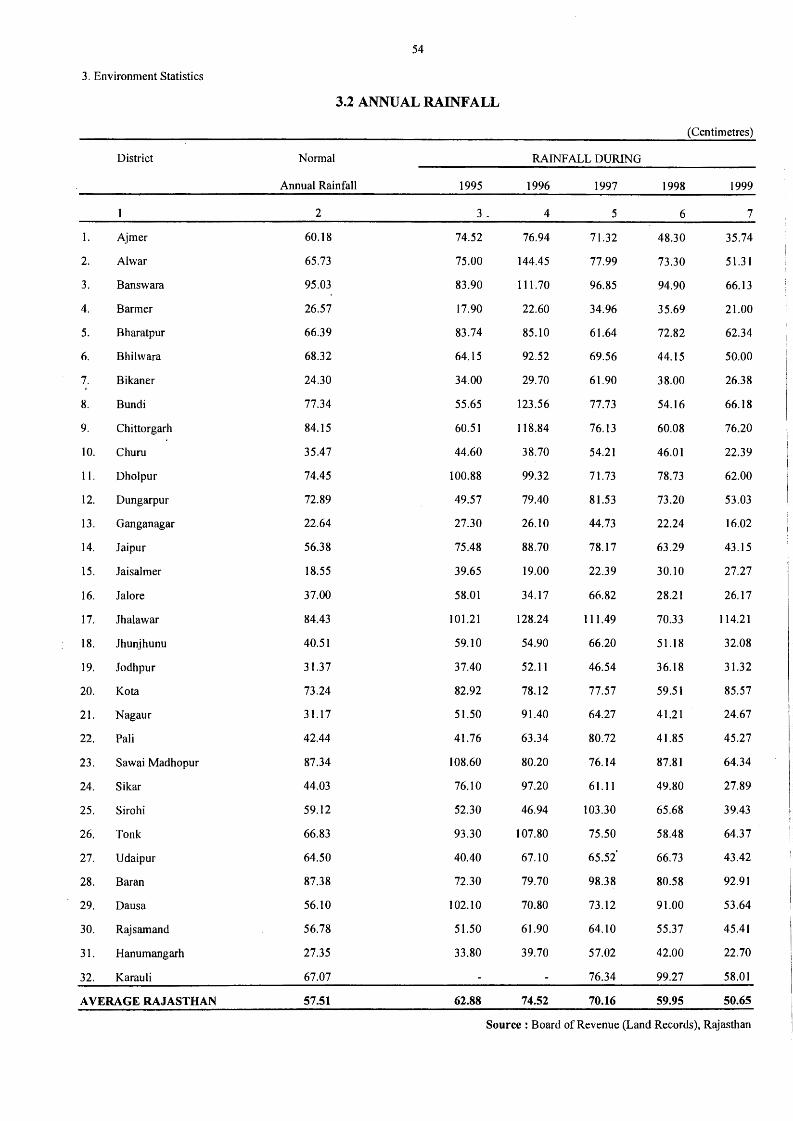
3. Environment Statistics
District
1. Ajmer
2. Al war
3. Banswara
4. Barmer
5. Bharatpur
6. Bhilwara
7. Bikaner
8. Bundi
9. Chittorgarh
10. Churu
11. Dholpur
12. Dungarpur
13. Ganganagar
14. Jaipur
15. Jaisalmer
16. Jalore
17. Jhalawar
18. Jhunjhunu
19. Jodhpur
20. Kota
21. Nagaur
22. Pali
23. Sawai Madhopur
24. Sikar
25. Sirohi
26. Tonk
27. Udaipur
28. Baran
29. Dausa
30. Rajsamand
31. Hanumangarh
32. Karauli
A VERA GE RAJASTHAN
54
3.2 ANNUAL RAINFALL
Normal
Annual Rainfall
2
60.18
65.73
95.03
26.57
66.39
68.32
24.30
77.34
84.15
35.47
74.45
72.89
22.64
56.38
18.55
37.00
84.43
40.51
31.37
73.24
31.17
42.44
87.34
44.03
59.12
66.83
64.50
87.38
56.10
56.78
27.35
67.07
57.51
1995
L
74.52
75.00
83.90
17.90
83.74
64.15
34.00
55.65
60.51
44.60
100.88
49.57
27.30
75.48
39.65
58.01
101.21
59.10
37.40
82.92
51.50
41.76
108.60
76.10
52.30
93.30
40.40
72.30
102.10
51.50
33.80
62.88
RAINFALL DURING
1996
4
76.94
144.45
111.70
22.60
85.10
92.52
29.70
123.56
118.84
38.70
99.32
79.40
26.10
88.70
19.00
34.17
128.24
54.90
52.11
78.12
91.40
63.34
80.20
97.20
46.94
107.80
67.10
79.70
70.80
61.90
39.70
74.52
1997
5
71.32
77.99
96.85
34.96
61.64
69.56
61.90
77.73
76.13
54.21
71.73
81.53
44.73
78.17
22.39
66.82
111.49
66.20
46.54
77.57
64.27
80.72
76.14
61.l l
103.30
75.50
65.5i
98.38
73.12
64.10
57.02
76.34
70.16
1998
6
48.30
73.30
94.90
35.69
72.82
44.15
38.00
54.16
60.08
46.01
78.73
73.20
22.24
63.29
30.10
28.21
70.33
51.18
36.18
59.51
41.21
41.85
87.81
49.80
65.68
58.48
66.73
80.58
91.00
55.37
42.00
99.27
59.95
(Centimetres)
1999
7
35.74
51.31
66.13
21.00
62.34
50.00
26.38
66.18
76.20
22.39
62.00
53.03
16.02
43.15
27.27
26.17
114.21
32.08
31.32
85.57
24.67
45.27
64.34
27.89
39.43
64.37
43.42
92.91
53.64
45.41
22.70
58.01
50.65
Source: Board of Revenue (Land Records), Rajasthan
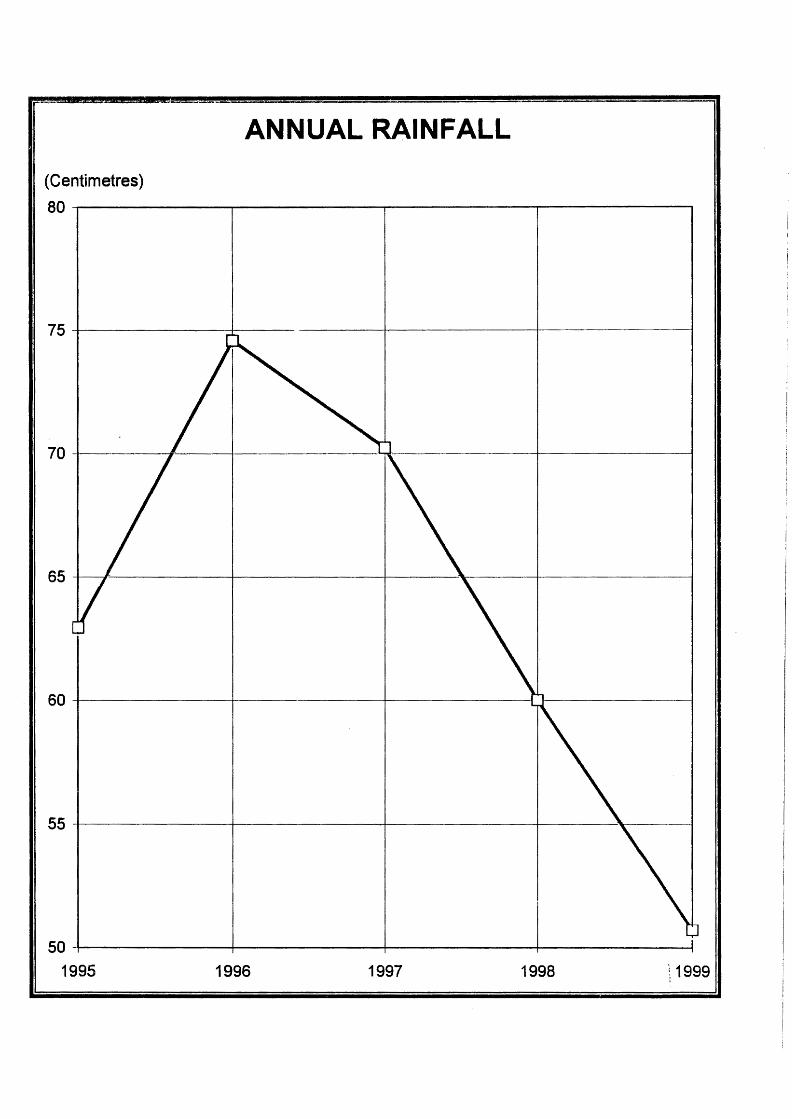
ANNUAL RAINFALL
(Centimetres) ao---~~~~~...--~~~~~r--~~~~__,.~~~~~---,
SO-+-~~~~~+-~~~~~~~~~~-+~~~~~~
1995 1996 1997 1998 ; 1999
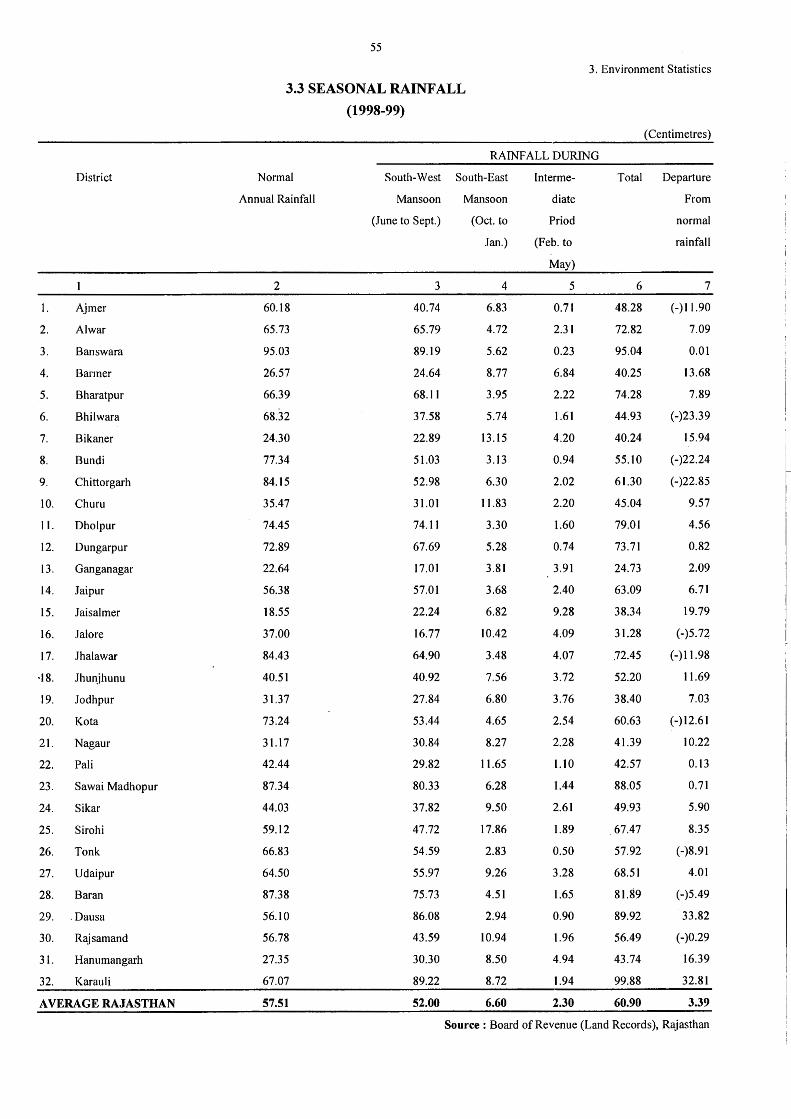
District
1. Ajmer
2. Al war
3. Banswara
4. Barmer
5. Bharatpur
6. Bhilwara
7. Bikaner
8. Bundi
9. Chittorgarh
10. Churn
11. Dholpur
12. Dungarpur
13. Ganganagar
14. Jaipur
15. Jaisalmer
16. Jalore
17. Jhalawar
·18. Jhunjhunu
19. Jodhpur
20. Kota
21. Nagaur
22. Pali
23. Sawaiiv1adhopur
24. Sikar
25. Sirohi
26. Tonk
27. Udaipur
28. Baran
29. . Dausa
30. Rajsamand
3 I. Hanumangarh
32. Karauli
A VERA GE RAJASTHAN
55
3.3 SEASONAL RAINFALL
(1998-99)
3. Environment Statistics
(Centimetres)
RAINFALL DURING
Normal
Annual Rainfall
2
60.18
65.73
95.03
26.57
66.39
68.32
24.30
77.34
84.15
35.47
74.45
72.89
22.64
56.38
18.55
37.00
84.43
40.51
31.37
73.24
31.17
42.44
87.34
44.03
59.12
66.83
64.50
87.38
56.10
56.78
27.35
67.07
57.51
South-West South-East
iv1ansoon iv1ansoon
(June to Sept.)
3
40.74
65.79
89.19
24.64
68.11
37.58
22.89
51.03
52.98
31.01
74.11
67.69
17.01
57.01
22.24
16.77
64.90
40.92
27.84
53.44
30.84
29.82
80.33
37.82
47.72
54.59
55.97
75.73
86.08
43.59
30.30
89.22
52.00
(Oct. to
Jan.)
4
6.83
4.72
5.62
8.77
3.95
5.74
13.15
3.13
6.30
11.83
3.30
5.28
3.81
3.68
6.82
10.42
3.48
7.56
6.80
4.65
8.27
11.65
6.28
9.50
17.86
2.83
9.26
4.51
2;94
10.94
8.50
8.72
6.60
Interme
diate
Priod
(Feb. to
iv1ay)
5
0.71
2.31
0.23
6.84
2.22
1.61
4.20
0.94
2.02
2.20
1.60
0.74
3.91
2.40
9.28
4.09
4.07
3.72
3.76
2.54
2.28
l.10
1.44
2.61
1.89
0.50
3.28
1.65
0.90
1.96
4.94
1.94
2.30
Total Departure
6
48.28
72.82
95.04
40.25
74.28
44.93
40.24
55.10
61.30
45.04
79.01
73.71
24.73
63.09
38.34
31.28
72.45
52.20
38.40
60.63
41.39
42.57
88.05
49.93
. 67.47
57.92
68.51
81.89
89.92
56.49
43.74
99.88
60.90
From
normal
rainfall
7
(-) 11.90
7.09
0.01
13.68
7.89
(-)23.39
15.94
(-)22.24
(-)22.85
9.57
4.56
0.82
2.09
6.71
19.79
(-)5.72
(-)11.98
11.69
7.03
(-)12.61
10.22
0.13
0.71
5.90
8.35
(-)8.91
4.01
(-)5.49
33.82
(-)0.29
16.39
32.81
3.39
Source: Board of Revenue (Land Records), Rajasthan
(4) VITAL STATISTICS
I. REGISTERED DEATHS BY CAUSES - The data are based on the reports received from the
district statistical officers of the Directorate of Economics and Statistics, Rajasthan. Cent percent
cases of deaths occuring in urban areas are not reported to the municipalities of the state. Consequently there is under registration to this extent.
2. REGISTERED BIRTHS, DEATHS, INFANT AND MATERNAL MORTALITY RATES -The birth, death and infants death rate has been given district wise. The rate:. have been worked out per thousand population. In case of infant and maternal mortality rates· the registration area is
changing from year to year and as such the actual number of towns under registration area for
each year has been given. The infant mortality and maternal rate were calculated on one thousand live births and one thousand total births (including still births) respectively. There has
been under registration to a certain extent in these rates.
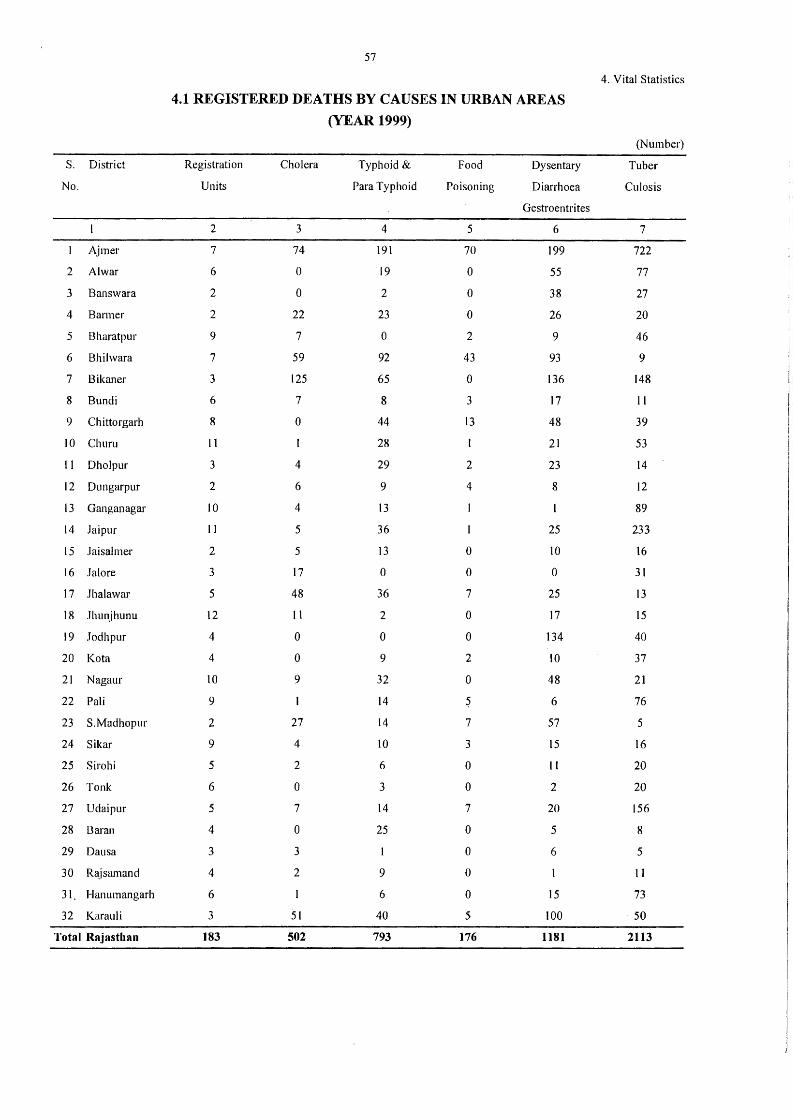
S. District
No.
Ajmer
2 Alwar
3 Banswara
4 Barmer
5 Bharatpur
6 Bhilwara
7 Bikaner
8 Bundi
9 Chittorgarh
10 Churu
I I Dholpur
12 Dungarpur
13 Ganganagar
14 Jaipur
15 .laisalmer
16 Jalore
17 Jhalawar
18 Jhunjhunu
19 Jodhpur
20 Kota
21 Nagaur
22 Pali
23 S.Madhopur
24 Sikar
25 Sirohi
26 Tonk
27 Udaipur
28 Baran
29 Dausa
30 Rajsamand
31 Hanumangarh
32 Karauli
Total Rajasthan
57
4.1 REGISTERED DEATHS BY CAUSES IN URBAN AREAS
(YEAR 1999)
Registration
Units
2
7
6
2
2
9
7
3
6
8
11
3
2
10
11
2
3
5
12
4
4
IO
9
2
9
5
6
5
4
3
4
6
3
183
Cholera
3
74
0
0
22
7
59
125
7
0
4
6
4
5
5
17
48
11
0
0
9
27
4
2
0
7
0
3
2
51
502
Typhoid &
Para Typhoid
4
191
19
2
23
0
92
65
8
44
28
29
9
13
36
13
0
36
2
0
9
32
14
14
10
6
3
14
25
9
6
40
793
Food
Poisoning
5
70
0
0
0
2
43
0
3
13
2
4
0
0
7
0
0
2
0
~
7
3
0
0
7
0
0
0
0
5
176
Dysentary
Diarrhoea
Gestroentrites
6
199
55
38
26
9
93
136
17
48
21
23
8
25
10
0
25
17
134
lO
48
6
57
15
11
2
20
5
6
15
100
1181
4. Vital Statistics
(Number)
Tuber
Culosis
7
722
77
27
20
46
9
148
11
39
53
14
12
89
233
16
31
13
15
40
37
21
76
5
16
20
20
156
8
5
11
73
50
2113
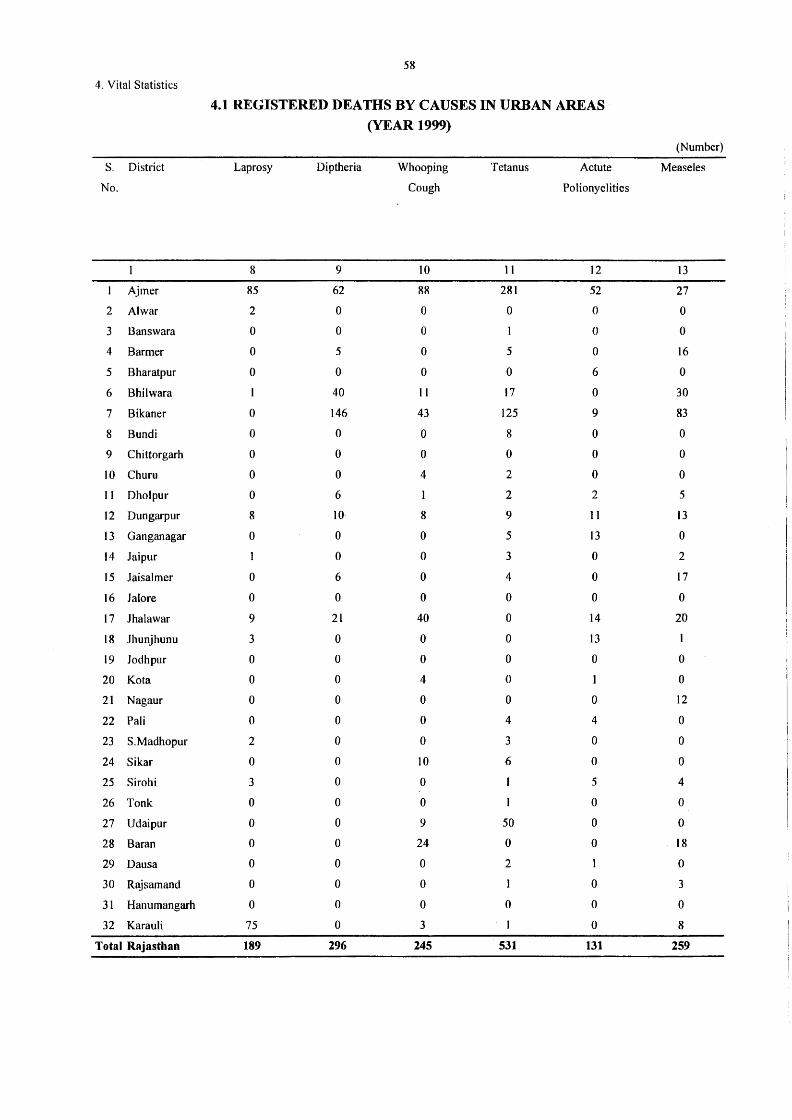
4. Vital Statistics
S. District
No.
Ajmer
2 Al war
3 Banswara
4 Barmer
5 Bharatpur
6 Bhilwara
7 Bikaner
8 Bundi
9 Chittorgarh
IO Churu
11 Dholpur
12 Dungarpur
13 Ganganagar
I4 Jaipur
15 Jaisalmer
16 Jal ore
17 Jhalawar
18 Jhunjhunu
19 Jodhpur
20 Ko ta
21 Nagaur
22 Pali
23 S.Madhopur
24 Sikar
25 Sirohi
26 Tonk
27 Udaipur
28 Baran
29 Dausa
30 R~jsamand
31 Hanumangarh
32 Karau Ii
Total Rajasthan
58
4.1 REGISTERED DEATHS BY CAUSES IN URBAN AREAS
(YEAR 1999)
Laprosy Diptheria
8 9
85 62
2 0
0 0
0 5
0 0
40
0 146
0 0
0 0
0 0
0 6
8 IO
0 0
1 0
0 6
0 0
9 21
3 0
0 0
0 0
0 0
0 0
2 0
0 0
3 0
0 0
0 0
0 0
0 0
0 0
0 0
75 0
189 296
Whooping
Cough
IO
88
0
0
0
0
11
43
0
0
4
I
8
0
0
0
0
40
0
0
4
0
0
0
IO
0
0
9
24
0
0
0
3
245
Tetanus
I I
281
0
5
0
17
125
8
0
2
2
9
5
3
4
0
0
0
0
0
0
4
3
6
50
0
2
1
0
531
Actute
Polionyelities
12
52
0
0
0
6
0
9
0
0
0
2
11
13
0
0
0
14
13
0
I
0
4
0
0
5
0
0
0
I
0
0
0
131
(Number)
Mease I es
I3
27
0
0
16
0
30
83
0
0
0
5
13
0
2
17
0
20
1
0
0
12
0
0
0
4
0
0
18
0
3
0
8
259
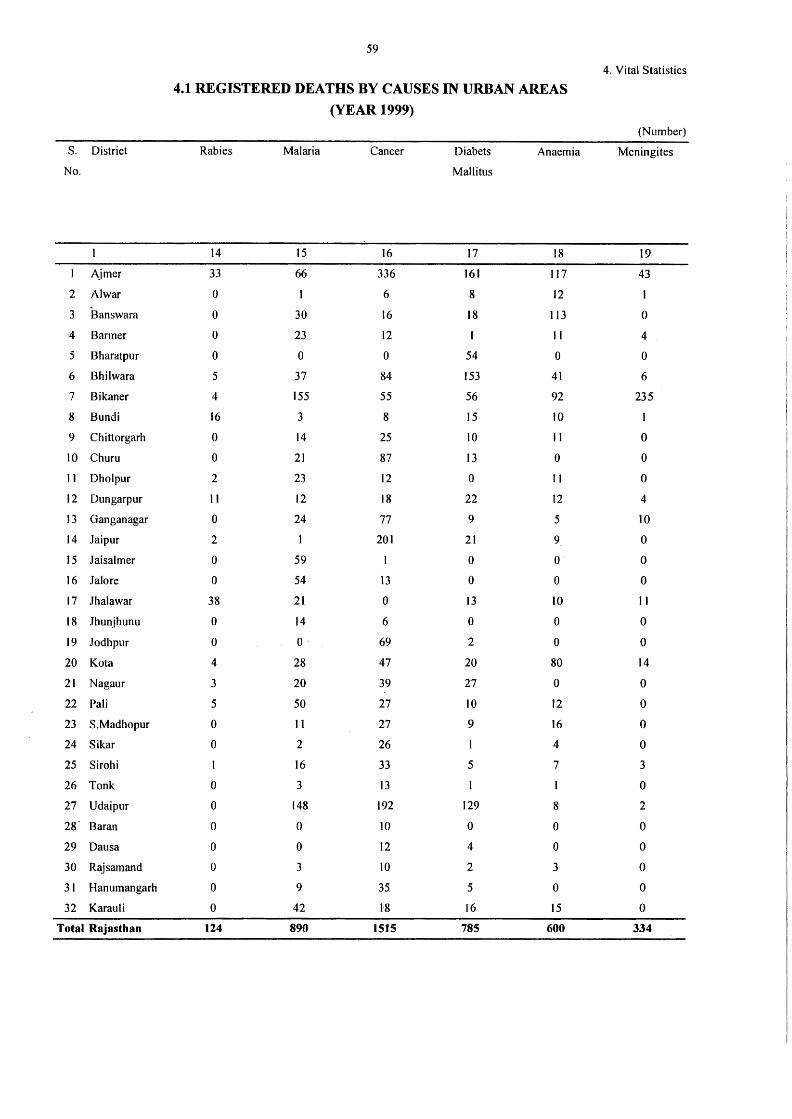
S. District
No.
1 Ajmer
2 Al war
3 Banswara
4 Barmer
5 Bharatpur
6 Bhilwara
7 Bikaner
8 Bundi
9 Chittorgarh
10 Churu
11 Dholpur
12 Dungarpur
13 Ganganagar
14 Jaipur
15 Jaisalmer
16 Jalore
17 .lhalawar
18 .Thunjhunu
19 Jodhpur
20 Ko ta
21 Nagaur
22 Pali
23 S.Madhopur
24 Sikar
25 Sirohi
26 Tonk
27 Udaipur
28" Baran
29 Dausa
30 Rajsamand
31 Hanumangarh
32 Karau Ii
Total Rajasthan
59
4.1 REGISTERED DEATHS BY CAUSES IN URBAN AREAS
(YEAR 1999)
Rabies Malaria Cancer
14 15 16
33 66 336
0 6
0 30 16
0 23 12
0 0 0
5 37 84
4 155 55
16 3 8
0 14 25
0 21 87
2 23 12
11 12 18
0 24 77
2 201
0 59 I
0 54 13
38 21 0
0 14 6
0 0 69
4 28 47
3 20 39
5 50 27
0 11 27
0 2 26
16 33
0 3 13
0 148 192
0 0 IO
0 0 12
0 3 10
0 9 35
0 42 1'8
124 890 1515
Di abets
Mallitus
17
161
8
18
I
54
153
56
15
10
13
0
22
9
21
0
0
13
0
2
20
27
10
9
I
5
129
0
4
2
5
16
785
Anaemia
18
117
12
113
11
0
41
92
10
11
0
11
12
5
9
0
0
IO
0
0
80
0
12
16
4
7
I
8
0
0
3
0
15
600
4. Vital Statistics
(Number)
Meningites
19
43
0
4
0
6
235
I
0
0
0
4
IO
0
0
0
11
0
0
14
0
0
0
0
3
0
2
0
0
0
0
0
334
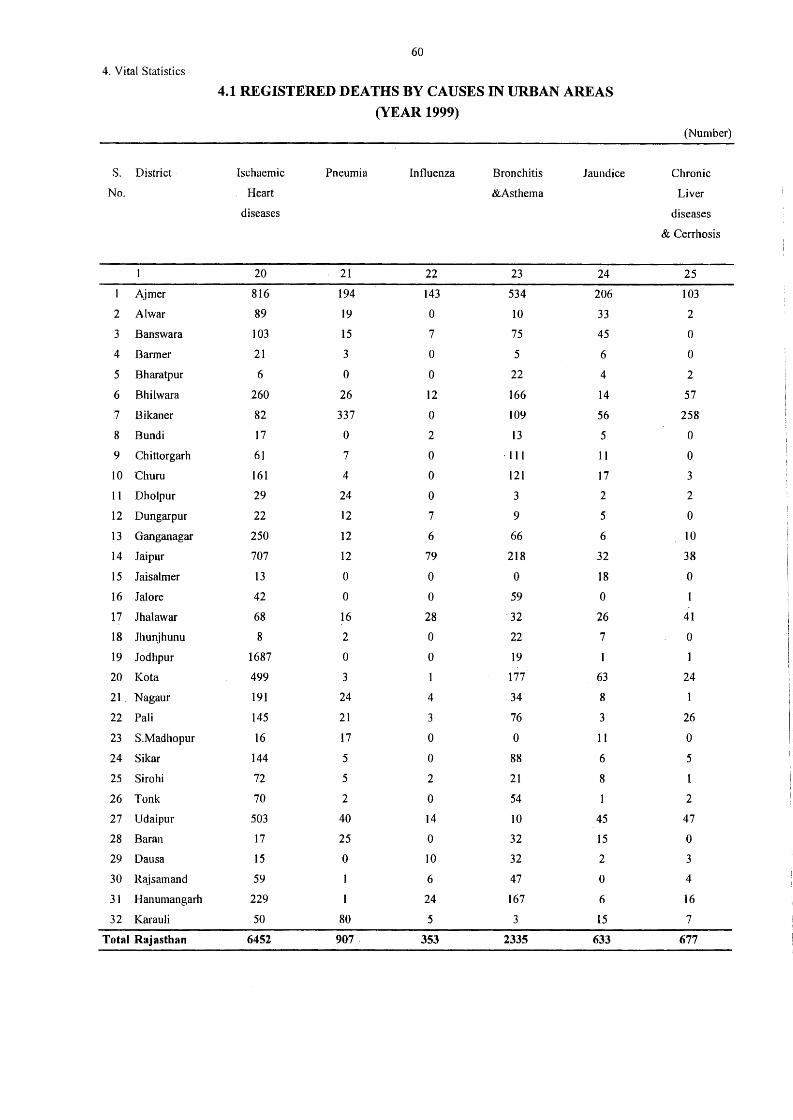
60
4. Vital Statistics
4.1 REGISTERED DEATHS BY CAUSES IN URBAN AREAS
(YEAR 1999) (Number)
S. District Ischaemic Pneumia Influenza Bronchitis Jaundice Chronic
No. Heart &Asthema Liver
diseases diseases
& Cerrhosis
20 21 22 23 24 25
Ajmer 816 194 143 534 206 103
2 Al war 89 19 0 10 33 2
3 Banswara 103 15 7 75 45 0
4 Barmer 21 3 0 5 6 0
5 Bharatpur 6 0 0 22 4 2
6 Bhilwara 260 26 12 166 14 57
7 Bikaner 82 337 0 109 56 258
8 Bundi 17 0 2 13 5 0
9 Chittorgarh 61 7 0 · 111 11 0
10 Chum 161 4 0 121 17 3
I 1 Dholpur 29 24 0 3 2 2
12 Dungarpur 22 12 7 9 5 0
13 Ganganagar 250 12 6 66 6 10
14 Jaipur 707 12 79 218 32 38
15 Jaisalmer 13 0 0 0 18 0
16 Jal ore 42 0 0 59 0
17 Jhalawar 68 16 28 32 26 41
18 Jhunjhunu 8 2 0 22 7 0
19 Jodhpur 1687 0 0 19
20 Ko ta 499 3 177 63 24
21 Nagaur 191 24 4 34 8
22 Pali 145 21 3 76 3 26
23 S.Madhopur 16 17 0 0 11 0
24 Sikar 144 5 0 88 6 5
25 Sirohi 72 5 2 21 8 1
26 Tonk 70 2 0 54 2
27 Udaipur 503 40 14 10 45 47
28 Baran 17 25 0 32 15 0
29 Dausa 15 0 10 32 2 3
30 Rajsamand 59 6 47 0 4
31 Hanumangarh 229 1 24 167 6 16
32 Karau Ii 50 80 5 3 15 7
Total Rajasthan 6452 907. 353 2335 633 677
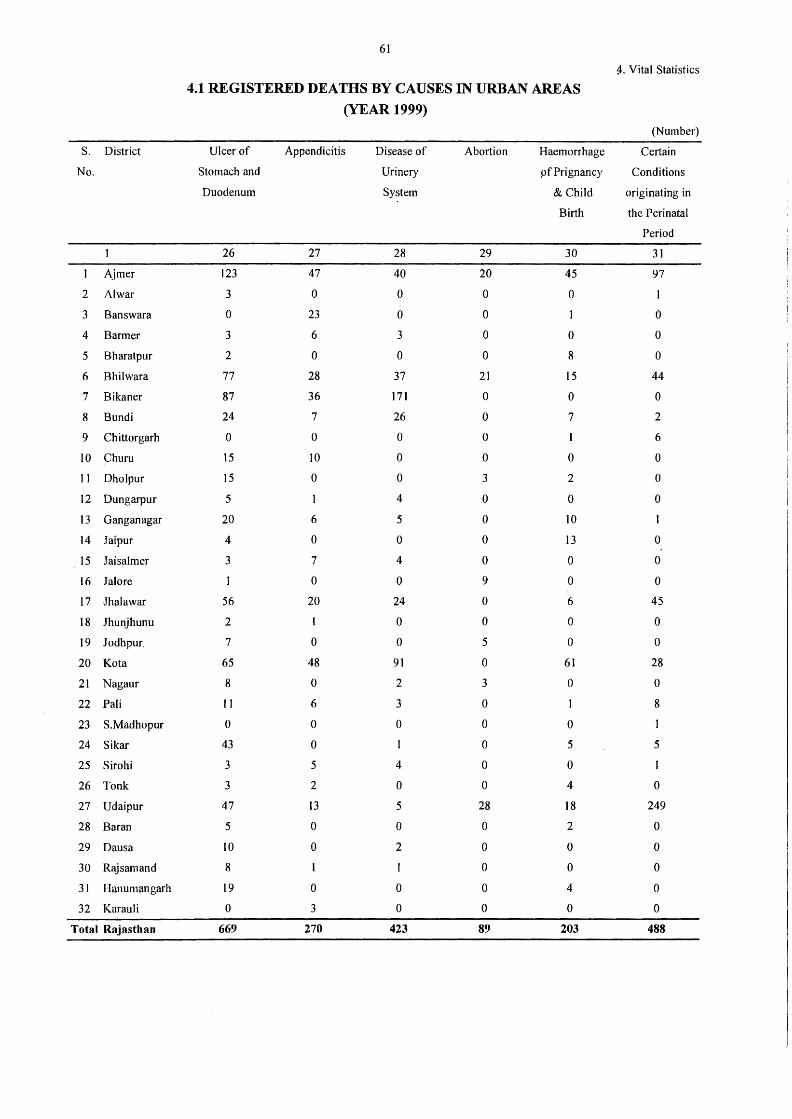
61
4-. Vital Statistics
4.1 REGISTERED DEATHS BY CAUSES IN URBAN AREAS
(YEAR 1999)
(Number)
S. District Ulcer of Appendicitis Disease of Abortion Haemorrhage Certain
No. Stomach and Urinery pf Prignancy Conditions
Duodenum System &Child originating in
Birth the Perinatal
Period
26 27 28 29 30 31
Ajmer 123 47 40 20 45 97
2 Al war 3 0 0 0 0
3 Banswara 0 23 0 0 0
4 Barmer 3 6 3 0 0 0
5 Bharatpur 2 0 0 0 8 0
6 Bhilwara 77 28 37 21 15 44
7 Bikaner 87 36 171 0 0 0
8 Bundi 24 7 26 0 7 2
9 Chittorgarh 0 0 0 0 6
10 Churu 15 10 0 0 0 0
11 Dholpur 15 0 0 3 2 0
12 Dungarpur 5 4 0 0 0
13 Ganganagar 20 6 5 0 10 I
14 Jaipur 4 0 0 0 13 0
15 Jaisalmer 3 7 4 0 0 0
16 Jalore 0 0 9 0 0
17 Jhalawar 56 20 24 0 6 45
18 Jhunjhunu 2 l 0 0 0 0
19 Jodhpur 7 0 0 5 0 0
20 Ko ta 65 48 91 0 61 28
21 Nagaur 8 0 2 3 0 0
22 Pali 11 6 3 0 8
23 S.Madhopur 0 0 0 0 0 t
24 Sikar 43 0 t 0 5 5
25 Sirohi 3 5 4 0 0 t
26 Tonk 3 2 0 0 4 0
27 Udaipur 47 13 5 28 18 249
28 Baran 5 0 0 0 2 0
29 Dausa 10 (} 2 0 0 0
30 R~jsamand 8 0 0 0
3 I Hanumangarh 19 0 0 0 4 0
32 Karau Ii 0 3 0 0 0 0
Total Rajasthan 669 270 423 89 203 488
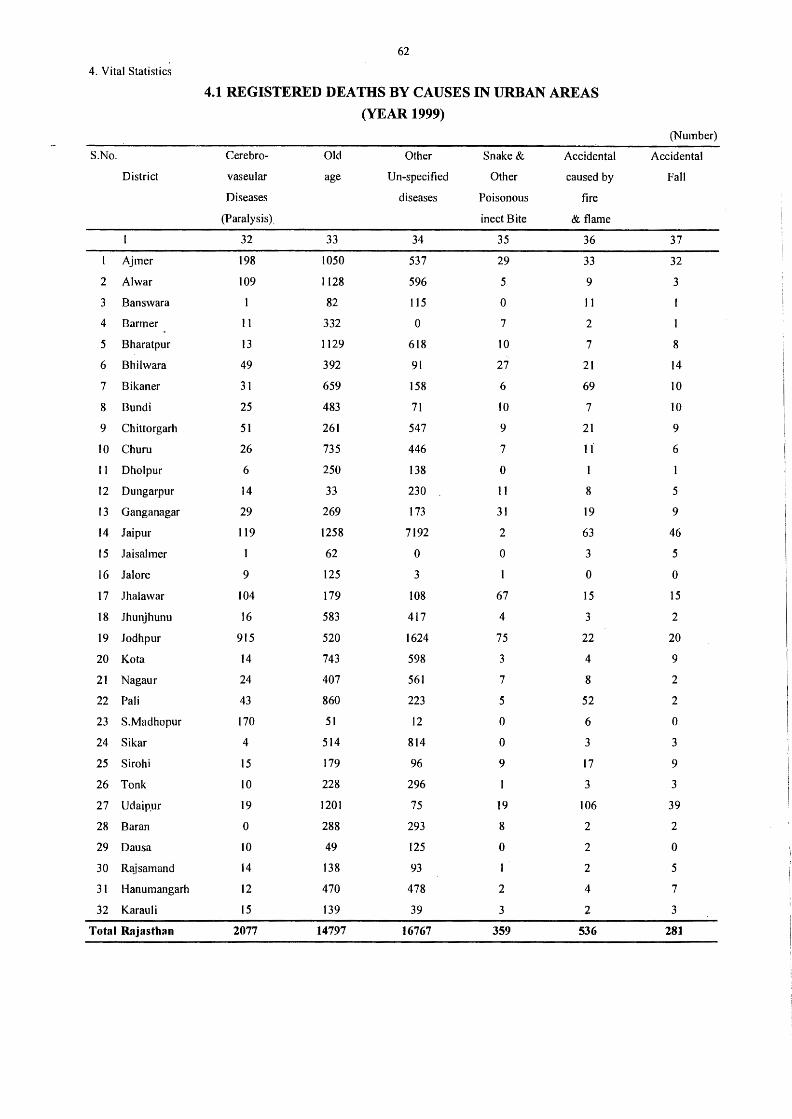
4. Vital Statistics
S.No.
District
Ajmer
2 Alwar
3 Banswara
4 Barmer
5 Bharatpur
6 Bhilwara
7 Bikaner
8 Bundi
9 Chittorgarh
IO Chum
11 Dholpur
12 Dungarpur
13 Ganganagar
14 Jaipur
15 Jaisalmer
16 Jalore
17 Jhalawar
l 8 Jhunjhunu
19 Jodhpur
20 Kota
21 Nagaur
22 Pali
23 S.Madhopur
24 Sikar
25 Sirohi
26 Tonk
27 Udaip.ur
28 Baran
29 Dausa
30 Rajsamand
3 l Hanumangarh
32 Karauli
Total Rajasthan
62
4.1 REGISTERED DEATHS BY CAUSES IN URBAN AREAS
(YEAR 1999)
Cerebro
vaseular
Diseases
(Paralysis).
32
198
109
11
13
49
31
25
51
26
6
14
29
119
9
104
16
915
14
24
43
170
4
15
10
19
0
IO
14
12
15
2077
Old
age
33
1050
1128
82
332
1129
392
659
483
261
735
250
33
269
1258
62
125
179
583
520
743
407
860
51
514
179
228
1201
288
49
138
470
139
14797
Other
Un-specified
diseases
34
537
596
I 15
0
618
91
158
71
547
446
138
230
173
7192
0
3
108
417
1624
598
561
223
12
814
96
296
75
293
125
93
478
39
16767
Snake &
Other
Poisonous
inect Bite
35
29
5
0
7
10
27
6
10
9
7
0
11
31
2
0
67
4
75
3
7
5
0
0
9
19
8
0
2
3
359
Accidental
caused by
fire
& flame
36
33
9
11
2
7
21
69
7
21
l 1
8
19
63
3
0
15
3
22
4
8
52
6
3
17
3
I06
2
2
2
4
2
536
(Number)
Accidental
Fall
37
32
3
8
14
10
IO
9
6
5
9
46
5
0
15
2
20
9
2
2
0
3
9
3
39
2
0
5
7
3
281
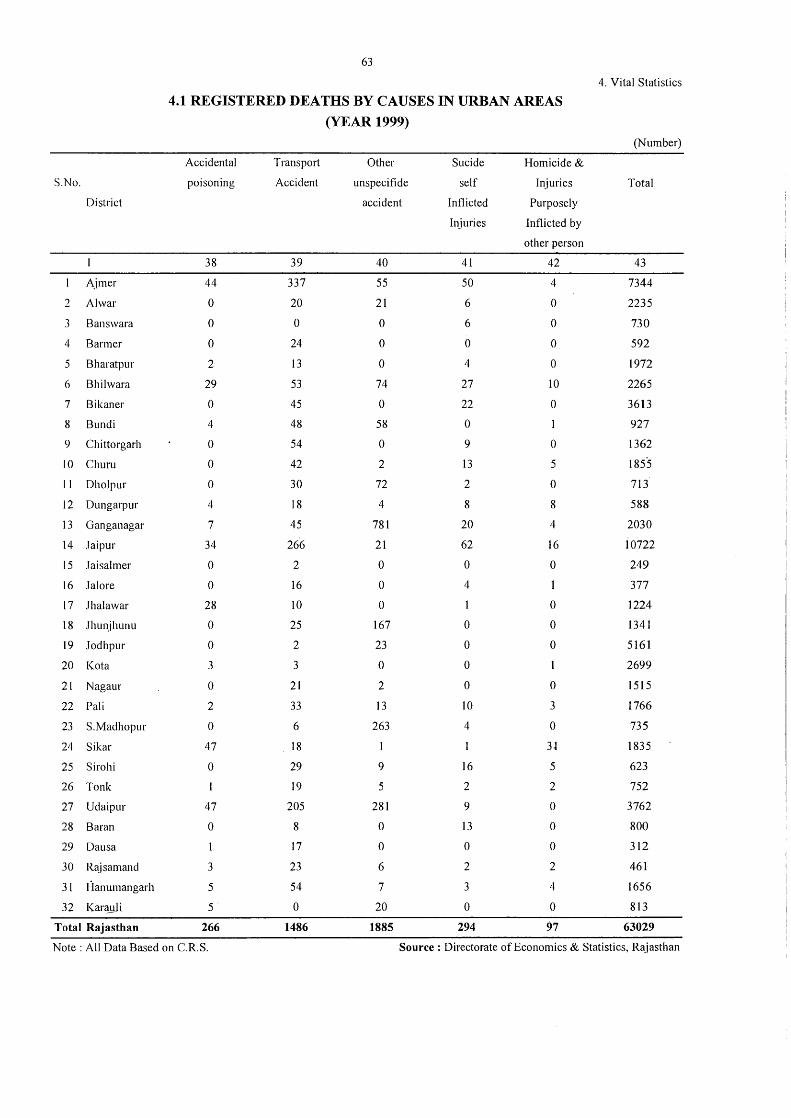
63
4. Vital Statistics
4.1 REGISTERED DEATHS BY CAUSES IN URBAN AREAS
(YEAR 1999)
(Number)
Accidental Transpo11 Other Sucide Homicide &
S.No. poisoning Accident unspecifide self Injuries Total
District accident Inflicted Purposely
Injuries Inflicted by
other person
38 39 40 41 42 43
Ajmer 44 337 55 50 4 7344
2 Al war 0 20 21 6 0 2235
3 Banswara 0 0 0 6 0 730
4 Barmer 0 24 0 0 0 592
5 Bharatpur 2 13 0 4 0 1972
6 Bhilwara 29 53 74 27 10 2265
7 Bikaner 0 45 0 22 0 3613
8 Bundi 4 48 58 0 I 927
9 Chittorgarh 0 54 0 9 0 1362
10 Churu 0 42 2 13 5 1855
11 Dholpur 0 30 72 2 0 713
12 Dungarpur 4 18 4 8 8 588
13 Ganganagar 7 45 781 20 4 2030
14 Jaipur 34 266 21 62 16 10722
15 Jaisalmer 0 2 0 0 0 249
16 .Jal ore 0 16 0 4 1 377
17 Jhalawar 28 IO 0 1 0 1224
18 Jhunjhunu 0 25 167 0 0 1341
19 Jodhpur 0 2 23 0 0 5161
20 Kot a 3 3 0 0 2699
21 Nagaur 0 21 2 0 0 1515
22 Pali 2 33 13 10 3 1766
23 S.Madhopur 0 6 263 4 0 735
24 Sikar 47 18 3.1 1835
25 Sirohi 0 29 9 16 5 623
26 Tonk 19 5 2 2 752
27 Udaipur 47 205 281 9 0 3762
28 Baran 0 8 0 13 0 800
29 Dausa 17 0 0 0 312
30 Rajsamand 3 23 6 2 2 461
31 Hanumangarh 5 54 7 3 4 1656
32 Karau Ii 5 0 20 0 0 813
Total Rajasthan 266 1486 1885 294 97 63029
Note : All Data Based on C.R.S. Source: Directorate of Economics & Statistics, Rajasthan
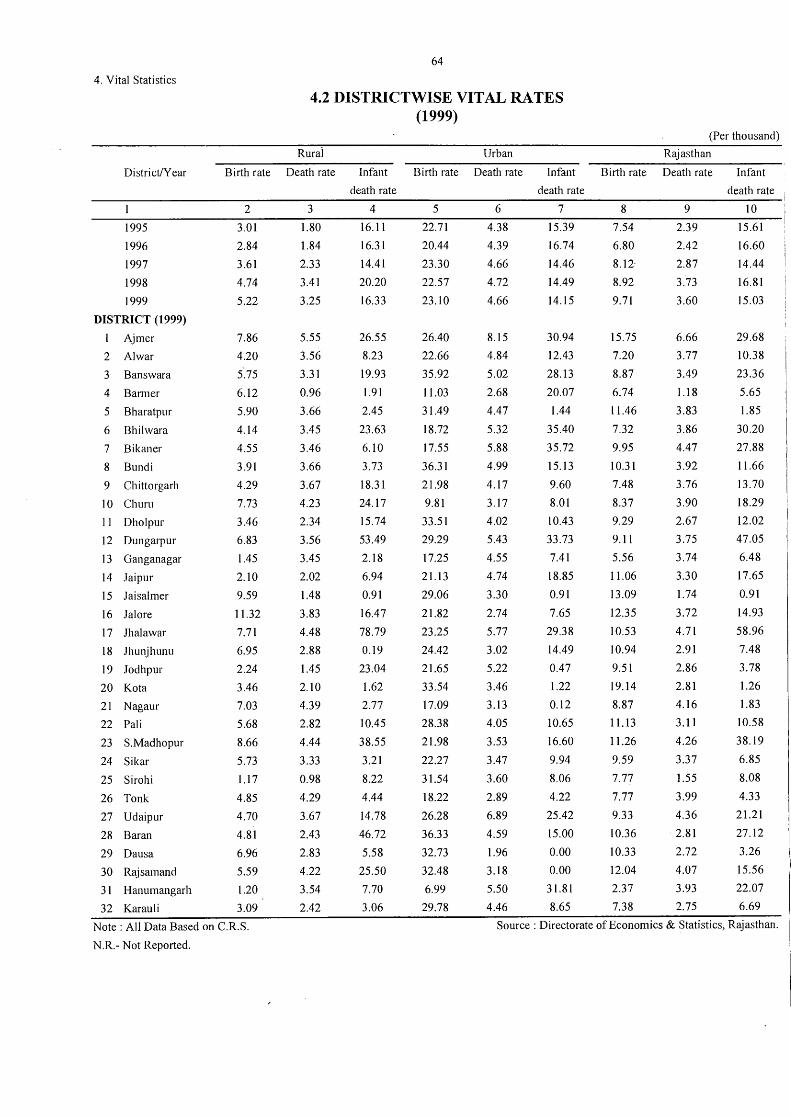
4. Vital Statistics
64
4.2 DISTRICTWISE VITAL RATES (1999)
Rurai Urban
(Per thousand) ··
Rajasthan
District/Year Birth rate Death rate Infant
death rate
Birth rate Death rate Infant
death rate
Birth rate Death rate Infant
death rate
1995
1996
1997
1998
1999
DISTRICT (1999)
Ajmer
2 Alwar
3 Banswara
4 Barmer
5 Bharatpur
6 Bhilwara
7 Bikaner
8 Bundi
9 Chittorgarh
10 Churu
11 Dholpur
12 Dungarpur
13 Ganganagar
14 Jaipur
15 Jaisalrner
16 Jalore
17 Jhalawar
18 Jhunjhunu
19 Jodhpur
20 Kata
21 Nagaur
22 Pali
23 S.Madhopur
24 Sikar
25 Sirohi
26 Tonk
27 Udaipur
28 Baran
29 Dausa
30 Rajsamand
2
3.01
2.84
3.61
4.74
5.22
7.86
4.20
5.75
6.12
5.90
4.14
4.55
3.91
4.29
7.73
3.46
6.83
1.45
2.10
9.59
11.32
7.71
6.95
2.24
3.46
7.03
5.68
8.66
5.73
1.17
4.85
4.70
4.81
6.96
5.59
31 Hanumangarh 1 .20
32 Karauli 3.09
Note : All Data Based on C.R.S.
N.R.- Not Reported.
3
1.80
1.84
2.33
3.41
3.25
5.55
3.56
3.31
0.96
3.66
3.45
3.46
3.66
3.67
4.23
2.34
3.56
3.45
2.02
1.48
3.83
4.48
2.88
1.45
2.10
4.39
2.82
4.44
3.33
0.98
4.29
3.67
2.43
2.83
4.22
3.54
2.42
4
16.11
16.31
14.41
20.20
16.33
26.55
8.23
19.93
1.91
2.45
23.63
6.10
3.73
18.31
24.17
15.74
53.49
2.18
6.94
0.91
16.47
78.79
0.19
23.04
1.62
2.77
10.45
38.55
3.21
8.22
4.44
14.78
46.72
5.58
25.50
7.70
3.06
5
22.71
20.44
23.30
22.57
23.10
26.40
22.66
35.92
11.03
31.49
18.72
17.55
36.31
21.98
9.81
33.51
29.29
17.25
21.13
29.06
21.82
23.25
24.42
21.65
33.54
17.09
28.38
21.98
22.27
31.54
18.22
26.28
36.33
32.73
32.48
6.99
29.78
6
4.38
4.39
4.66
4.72
4.66
8.15
4.84
5.02
2.68
4.47
5.32
5.88
4.99
4.17
3.17
4.02
5.43
4.55
4.74
3.30
2.74
5.77
3.02
5.22
3.46
3.13
4.05
3.53
3.47
3.60
2.89
6.89
4.59
1.96
3.18
5.50
4.46
7
15.39
16.74
14.46
14.49
14.15
30.94
12.43
28.13
20.07
1.44
35.40
35.72
15. 13
9.60
8.01
10.43
33.73
7.41
18.85
0.91
7.65
29.38
14.49
0.47
1.22
0.12
10.65
16.60
9.94
8.06
4.22
25.42
15.00
0.00
0.00
31.81
8.65
8
7.54
6.80
8.12·
8.92
9.71
15.75
7.20
8.87
6.74
11.46
7.32
9.95
10.31
7.48
8.37
9.29
9.11
5.56
11.06
13.09
12.35
10.53
10.94
9.51
19.14
8.87
11.13
11.26
9.59
7.77
7.77
9.33
10.36
10.33
12.04
2.37
7.38
9
2.39
2.42
2.87
3.73
3.60
6.66
3.77
3.49
1.18
3.83
3.86
4.47
3.92
3.76
3.90
2.67
3.75
3.74
3.30
1.74
3.72
4.71
2.91
2.86
2.81
4.16
3.11
4.26
3.37
1.55
3.99
4.36
2.81
2.72
4.07
3.93
2.75
10
15.61
16.60
14.44
16.81
15.03
29.68
10.38
23.36
5.65
1.85
30.20
27.88
11.66
13.70
18.29
12.02
47.05
6.48
17.65
0.91
14.93
58.96
7.48
3.78
1.26
1.83
10.58
38.19
6.85
8.08
4.33
21.21
27.12
3.26
15.56
22.07
6.69
Source: Directorate of Economics & Statistics, Rajasthan.
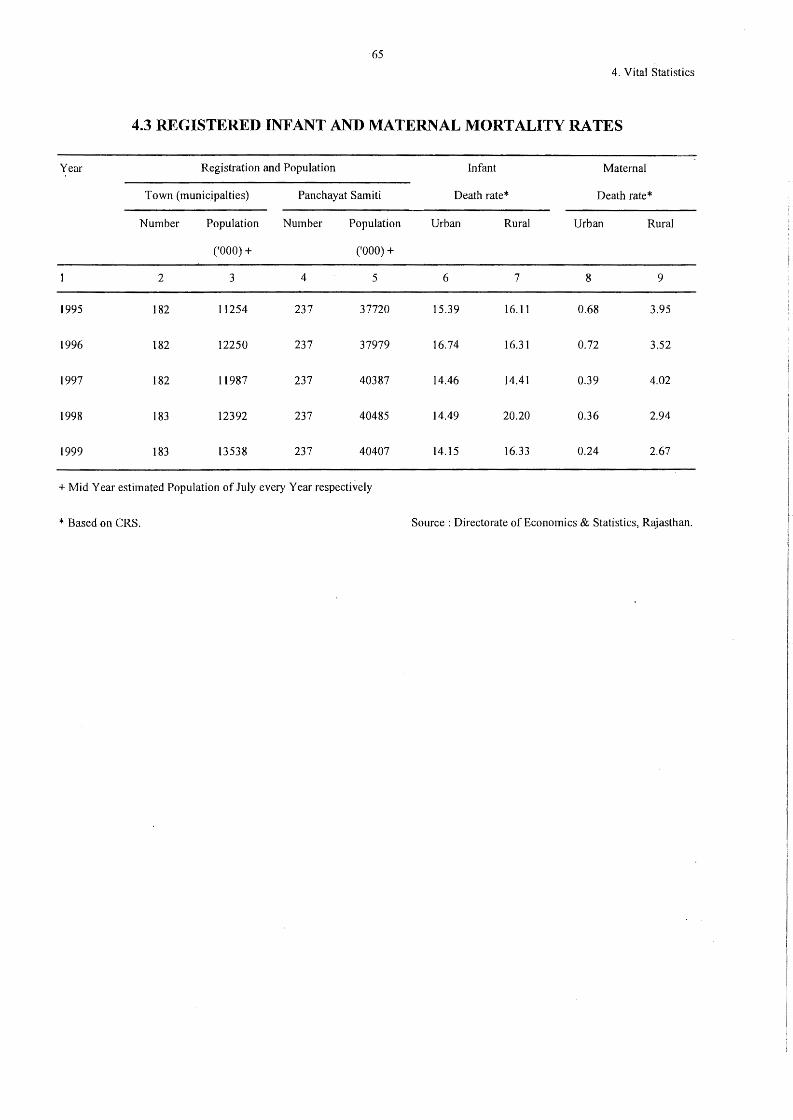
65
4. Vital Statistics
4.3 REGISTERED INFANT AND MATERNAL MORTALITY RATES
Year Registration and Population Infant Maternal
Town (municipalties) Panchayat Samiti Death rate* Death rate*
Number Population Number Population Urban Rural Urban Rural
('000) + ('000) +
2 3 4 5 6 7 8 9
1995 182 11254 237 37720 15.39 16.11 0.68 3.95
1996 182 12250 237 37979 16.74 16.31 0.72 3.52
1997 182 11987 237 40387 14.46 14.41 0.39 4.02
1998 183 12392 237 40485 14.49 20.20 0.36 2.94
1999 183 13538 237 40407 14.15 16.33 0.24 2.67
+Mid Year estimated Population of July every Year respectively
* Based on CRS. Source : Directorate of Economics & Statistics, R~jasthan.
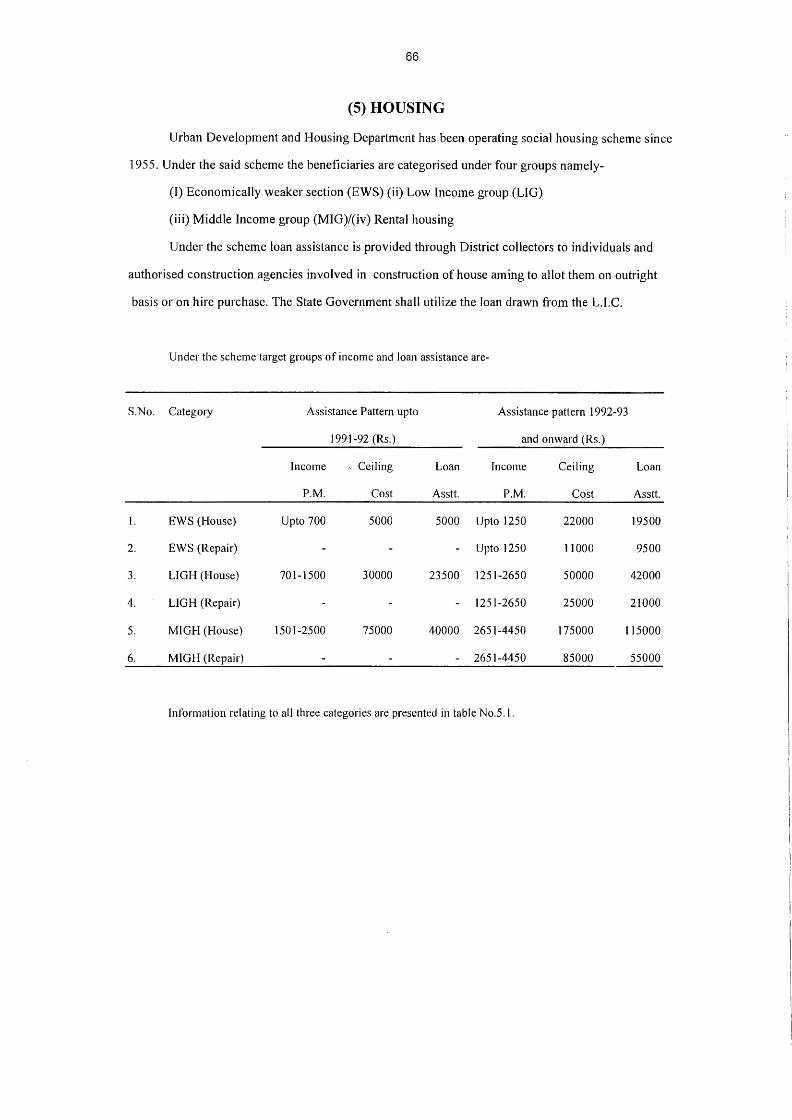
66
(5) HOUSING
Urban Development and Housing Department has been operating social housing scheme since
1955. Under the said scheme the beneficiaries are categorised under four groups namely
(I) Economically weaker section (EWS) (ii) Low Income group (LIG)
(iii) Middle Income group (MIG)/(iv) Rental housing
Under the scheme loan assistance is provided through District collectors to individuals and
authorised construction agencies involved in construction of house aming to allot them on outright
basis or on hire purchase. The State Government shall utilize the loan drawn from the L.I.C.
Under the scheme target groups of income and loan assistance are-
S.No. Category Assistance Pattern upto Assistance pattern 1992-93
1991-92 (Rs.) and onward (Rs.)
Income , Ceiling Loan Income Ceiling Loan
P.M. Cost Asstt. P.M. Cost Asstt.
I. EWS (House) Upto 700 5000 5000 Upto 1250 22000 19500
2. EWS (Repair) Upto 1250 11000 9500
3. UGH (House) 701-1500 30000 23500 1251-2650 50000 42000
4. UGH (Repair) 1251-2650 25000 21000
5. MIGH (House) 1501-2500 75000 40000 2651-4450 175000 115000
6. MIGH (Repair) 2651-4450 85000 55000
Information relating to all three categories are presented in table No.5.1.
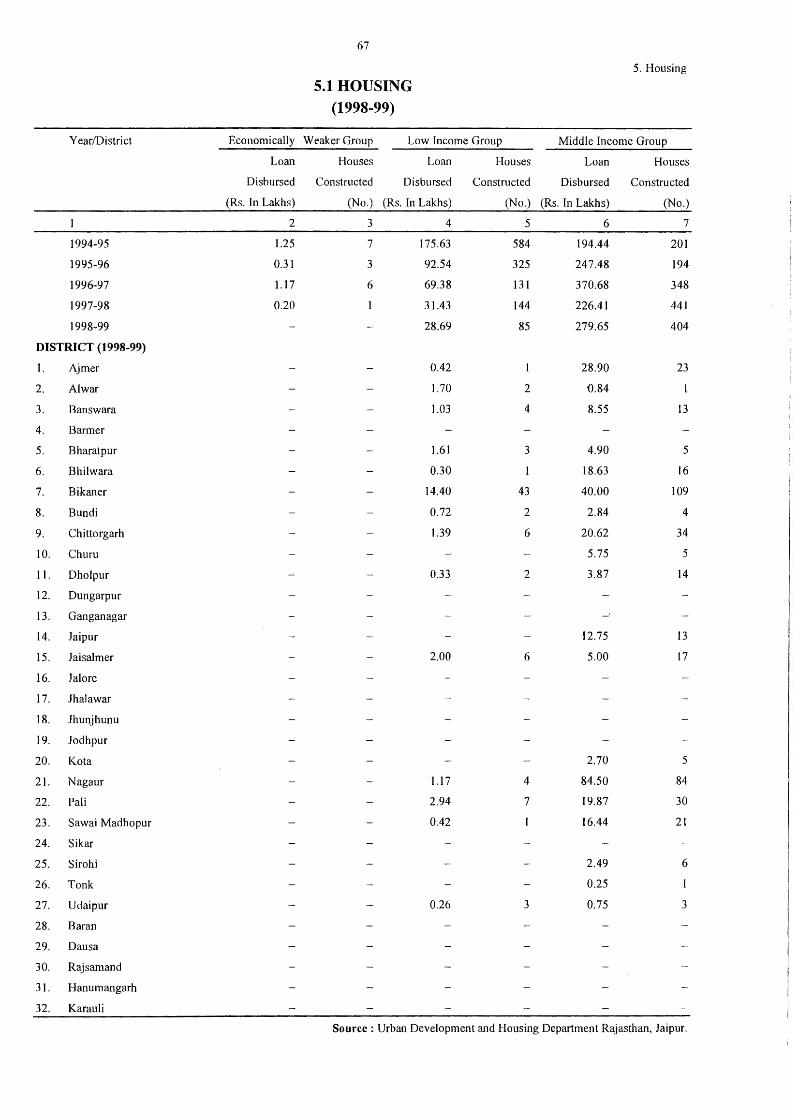
67
5. Housing
5.lHOUSING (1998-99)
Year/District Economically Weaker Group Low Income Group Middle Income Group
Loan Houses Loan Houses Loan Houses
Disbursed Constructed Disbursed Constructed Disbursed Constructed
(Rs. In Lakhs) (No.) (Rs. In Lakhs) (No.) (Rs. In Lakhs) (No.)
2 3 4 5 6 7
1994-95 1.25 7 175.63 584 194.44 201
1995-96 0.31 3 92.54 325 247.48 194
1996-97 1.17 6 69.38 131 370.68 348
1997-98 0.20 31.43 144 226.41 441
1998-99 28.69 85 279.65 404
DISTRICT (1998-99)
1. Ajmer 0.42 28.90 23
2. Al war 1.70 2 '(),84
3. Banswara 1.03 4 8.55 13
4. Barmer
5. Bharatpur 1.61 3 4.90 5
6. Bhilwara 0.30 18.63 16
7. Bikaner 14.40 43 40.00 109
8. Bundi 0.72 2 2.84 4
9. Chittorgarh 1.39 6 20.62 34
IO. Churn 5.75 5
11. Dholpur 0.33 2 3.87 14
12. Dungarpur
13. Ganganagar
14. Jaipur 12.75 13
15. Jaisalmer 2.00 6 5.00 17
16. Jal ore
17. Jhalawar
18. Jhunjhunu
19. Jodhpur
20. Ko ta 2.70 5
21. Nagaur 1.17 4 84.50 84
22. Pali 2.94 7 19.87 30
23. Sawai Madhopur 0.42 16.44 21
24. Sikar
25. Sirohi 2.49 6
26. Tonk 0.25
27. Udaipur 0.26 3 0.75 3
28. Baran
29. Dausa
30. Rajsamand
31. Hanumangarh
32. Karauli
Source : Urban Development and Housing Department Rajasthan, Jaipur.
(6) EDUCATION
This section presents data on educational statistics supplied by the Director of Elementary Education, Director of Secondary Education, Rajasthan, and Directorate of college Education, Rajasthan who in turn collects it from the educational institutions of all standards for submission to the Ministry of Education, Government of India.
LITERATE AND EDUCATED PERSONS- A literate person has been defined as one who can. both read and write, while an educated person can not only read and write but has also passed a written examination as proof of educational standard attained.
Schools/Colleges of Agriculture, Commerce, Engineering, "Law, Medicine, Physical Education, Teacher's Training, Vaterinary Science etc. Comes under Professional Education while those for Music, Dancing, Fine arts, Oriental Studies, Social education etc. come under special education. All other types of studies comes under General Education. Co-educational institutions are covered under institution for boys.
SCHOLAR means a student admited and getting education in any of the above referred institutions as regular student on roll as on 3 lst March of the reporting year.
TEACHERS means a whole time person appointed by the management for teaching as on 3 lst March of the reporting year.
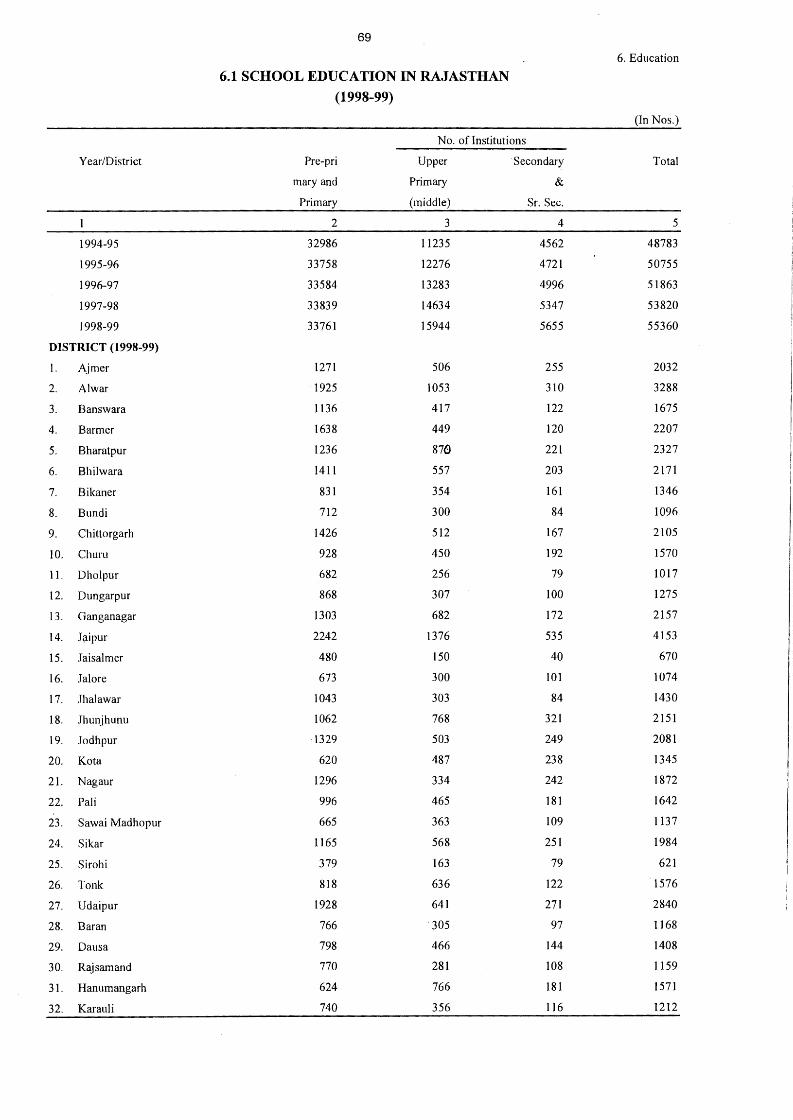
69
6. Education
6.1 SCHOOL EDUCATION IN RAJASTHAN
(1998-99)
(In Nos.)
No. of Institutions
Year/District Pre-pri Upper Secondary Total
mary and Primary &
Primary (middle) Sr. Sec.
2 3 4 5
1994-95 32986 11235 4562 48783
1995-96 33758 12276 4721 50755
1996-97 33584 13283 4996 51863
1997-98 33839 14634 5347 53820
1998-99 33761 15944 5655 55360
DISTRICT (1998-99)
I. Aimer 1271 506 255 2032
2. Al war 1925 1053 310 3288
3. Banswara 1136 417 122 1675
4. Barmer 1638 449 120 2207
5. Bharatpur 1236 87(;) 221 2327
6. Bhilwara 1411 557 203 2171
7. Bikaner 831 354 161 1346
8. Bundi 712 300 84 1096
9. Chittorgarh 1426 512 167 2105
10. Churu 928 450 192 1570
11. Dholpur 682 256 79 1017
12. Dungarpur 868 307 100 1275
13. Ganganagar 1303 682 172 2157
14. J~ipur 2242 1376 535 4153
15. Jaisalmer 480 150 40 670
16. Jal ore 673 300 101 1074
17. Jhalawar 1043 303 84 1430
18. Jhunjhunu 1062 768 321 2151
19. .Todhpur 1329 503 249 2081
20. Ko ta 620 487 238 1345
21. Nagaur 1296 334 242 1872
22. Pali 996 465 181 1642
23. Sawai Madhopur 665 363 109 1137
24. Sikar 1165 568 251 1984
25. Sirohi 379 163 79 621
26. Tonk 818 636 122 1576
27. Udaipur 1928 641 271 2840
28. Baran 766 305 97 1168
29. Dausa 798 466 144 1408
30. Rajsamand 770 281 108 1159
31. Hanumangarh 624 766 181 1571
32. Karauli 740 356 116 1212
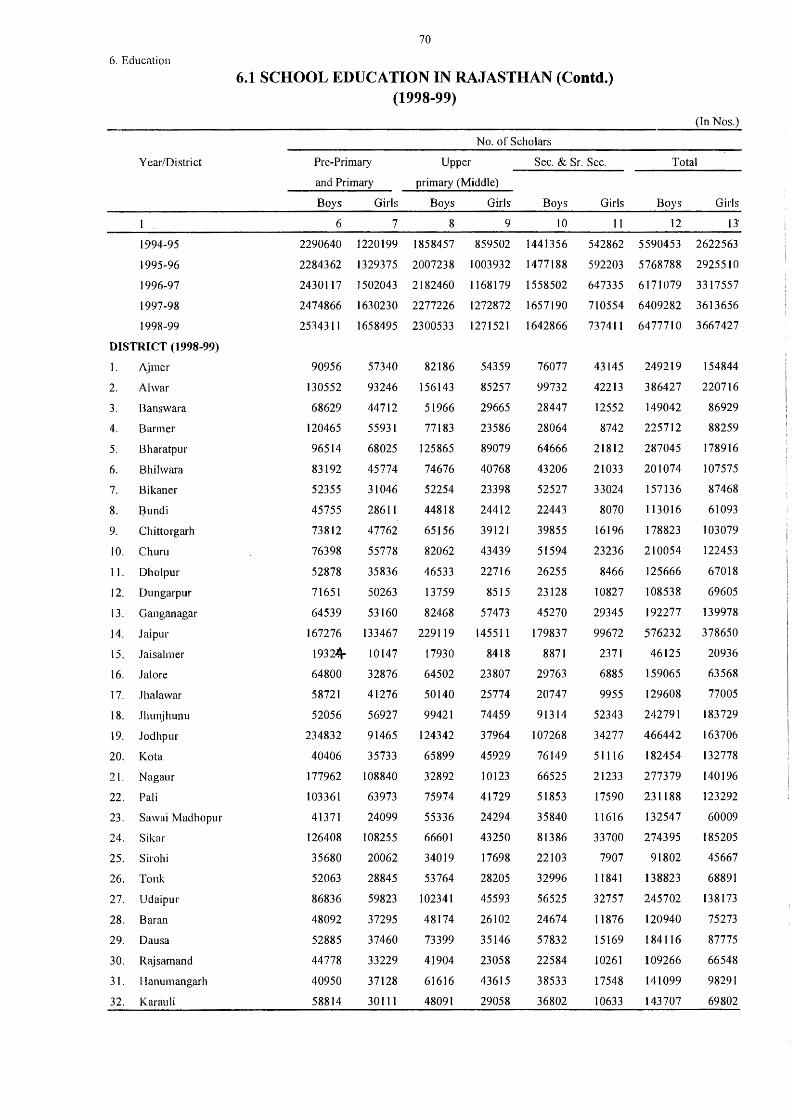
6. Education
Year/District
1994-95
1995-96
1996-97
1997-98
1998-99
DISTRICT (1998-99)
I.
2.
3.
4.
5.
6.
7.
8.
9.
Ajmer
Al war
Banswara
Barmer
Bharatpur
Bhilwara
Bikaner
~undi
Chittorgarh
10. Chum
11. Dholpur
12. Dungarpur
13. Ganganagar
14. Jaipur
15. Jaisalrner
16. Jalore
I 7. Jhalawar
18. Jhunjhunu
19. Jodhpur
20. Kota
21. Nagaur
22. Pali
23. Sawai Madhopur
24. Sikar
25. Sirohi
26. Tonk
27. Udaipur
28. Baran
29. Dausa
30. Rajsamand
j l. Hanumangarh
32. Karauli
70
6.1 SCHOOL EDUCATION IN RAJASTHAN (Contd.) (1998-99)
Pre-Primary
and Primary
No. of Scholars
Upper Sec. & Sr. Sec.
primary (Middle)
Boys Girls Boys Girls Boys Girls
6 7 8 9 10 11
(In Nos.)
Total
Boys Girls
12
2290640 1220199 1858457 859502 1441356 542862 5590453 2622563
2284362 1329375 2007238 1003932 1477188 592203 5768788 2925510
2430117 1502043 2182460 1168179 1558502 647335 6171079 3317557
2474866 1630230 2277226 1272872 1657190 710554 6409282 3613656
2534311 1658495 2300533 1271521 1642866 737411 6477710 3667427
90956
130552
68629
120465
96514
83192
52355
45755
73812
76398
52878
71651
64539
167276
1932+
64800
58721
52056
234832
40406
177962
103361
41371
126408
35680
52063
86836
48092
52885
44778
40950
58814
57340
93246
44712
55931
68025
45774
31046
28611
47762
55778
35836
50263
53160
133467
10147
32876
41276
56927
91465
35733
108840
63973
24099
108255
20062
28845
59823
37295
37460
33229
37128
30111
82186
156143
51966
77183
125865
74676
52254
44818
65156
82062
46533
13759
82468
229119
17930
64502
50140
99421
124342
65899
32892
75974
55336
66601
34019
53764
102341
48174
73399
41904
61616
48091
54359
85257
29665
23586
89079
40768
23398
24412
39121
43439
22716
8515
57473
145511
8418
23807
25774
74459
37964
45929
10123
41729
24294
43250
17698
28205
45593
26102
35146
23058
43615
29058
76077
99732
28447
28064
64666
43206
52527
22443
39855
51594
26255
23128
45270
179837
8871
29763
20747
91314
107268
76149
66525
51853
35840
81386
22103
32996
56525
24674
57832
22584
38533
36802
43145
42213
12552
8742
21812
21033
33024
8070
16196
23236
8466
10827
29345
99672
2371
6885
9955
52343
34277
51116
21233
17590
11616
33700
7907
11841
32757
11876
15169
10261
17548
10633
249219 154844
386427 220716
149042 86929
225712 88259
287045 178916
201074 107575
157136 87468
113016 61093
178823 103079
210054
125666
108538
192277
576232
46125
159065
129608
242791
466442
182454
277379
231188
132547
274395
91802
138823
245702
120940
184116
109266
141099
143707
122453
67018
69605
139978
378650
20936
63568
77005
183729
163706
132778
140196
123292
60009
185205
45667
68891
138173
75273
87775
66548
98291
69802
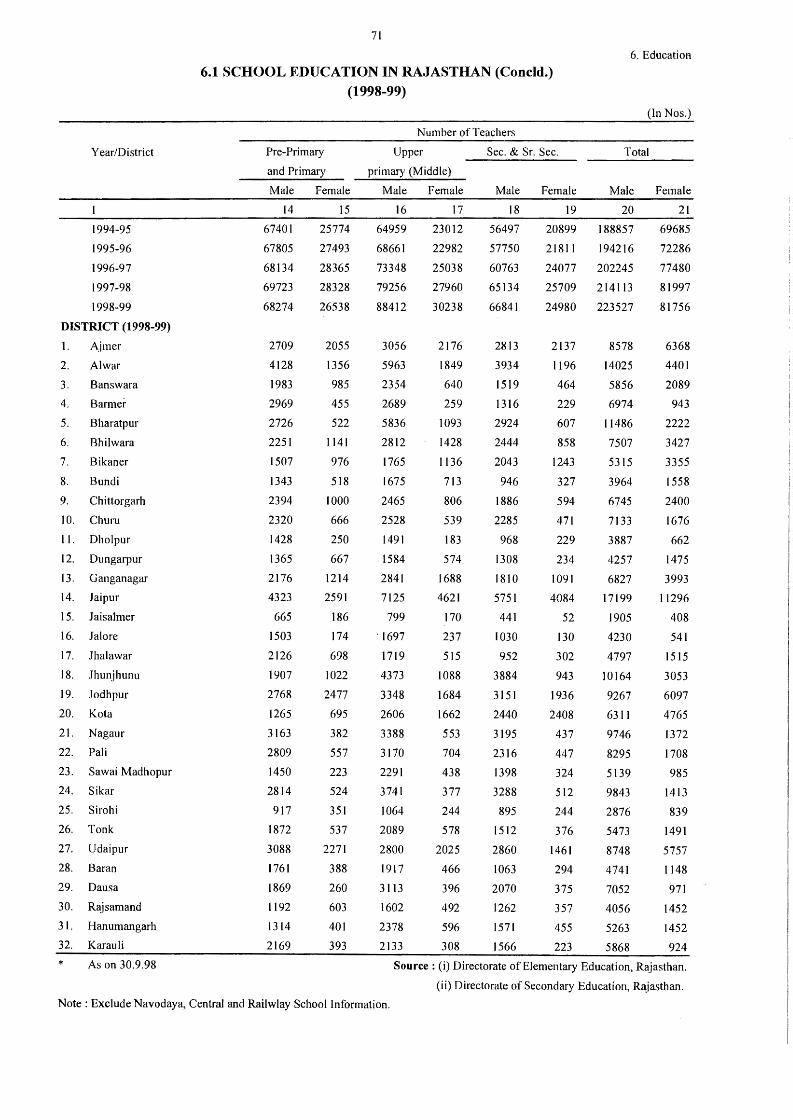
Year/District
1994-95
1995-96
1996-97
1997-98
1998-99
DISTRICT (1998-99)
1. Ajmer
2. Al war
3. Banswara
4. Barmer
5. Bharatpur
6. Bhilwara
7. Bikaner
8. Bundi
9. Chittorgarh
10. Churu
11. Dholpur
12. Dungarpur
13. Ganganagar
14. Jaipur
15. .Taisalmer
16. Jalore
17. Jhalawar
18. Jhunjhunu
19. Jodhpur
20. Kota
21. Nagaur
22. Pali
23. Sawai Madhopur
24. Sikar
25. Sirohi
26. Tonk
27. Udaipur
28. Baran
29. Dausa
30. Rajsamand
3 I. Hanumangarh
32. Karauli
* As on 30.9.98
71
6.1 SCHOOL EDUCATION IN RAJASTHAN (Concld.) (1998-99)
Pre-Primary
and Primary
Male Female
14 15
67401 25774
67805 27493
68134 28365
69723 28328
68274 26538
2709
4128
1983
2969
2726
2251
1507
1343
2394
2320
1428
1365
2176
4323
665
1503
2126
1907
2768
1265
3163
2809
1450
2814
917
1872
3088
1761
1869
I 192
1314
2169
2055
1356
985
455
522
1141
976
518
1000
666
250
667
1214
2591
186
174
698
1022
2477
695
382
557
223
524
351
537
2271
388
260
603
401
393
Number of Teachers
Upper Sec. & Sr. Sec.
primary (Middle)
Male
16
64959
68661
73348
79256
88412
3056
5963
2354
2689
5836
2812
1765
1675
2465
2528
1491
1584
2841
7125
799
"1697
1719
4373
3348
2606
3388
3170
2291
3741
1064
2089
2800
1917
3113
1602
2378
2133
Female
17
23012
22982
25038
27960
30238
2176
1849
640
259
1093
1428
1136
713
806
539
183
574
1688
4621
170
237
515
1088
1684
1662
553
704
438
377
244
578
2025
466
396
492
596
308
Male
18
56497
57750
60763
65134
66841
2813
3934
1519
1316
2924
2444
2043
946
1886
2285
968
1308
1810
5751
441
1030
952
3884
3151
2440
3195
2316
1398
3288
895
1512
2860
1063
2070
1262
1571
1566
Female
19
20899
21811
24077
25709
24980
2137
1196
464
229
607
858
1243
327
594
471
229
234
1091
4084
52
130
302
943
1936
2408
437
447
324
512
244
376
1461
294
375
357
455
223
6. Education.
(In Nos.)
Total
Male
20
188857
194216
202245
214113
223527
8578
14025
5856
6974
11486
7507
5315
3964
6745
7133
3887
4257
6827
17199
1905
4230
4797
10164
9267
6311
9746
8295
5139
9843
2876
5473
8748
4741
7052
4056
5263
5868
Female
21
69685
72286
77480
81997
81756
6368
4401
2089
943
2222
3427
3355
1558
2400
1676
662
1475
3993
11296
408
541
1515
3053
6097
4765
1372
1708
985
1413
839
1491
5757
1148
971
1452
1452
924
Source : (i) Directorate of Elementary Education, Rajasthan.
(ii) Directorate of Secondary Education, R3;jasthan.
Note : Exclude Navodaya, Central and Railwlay School Information.
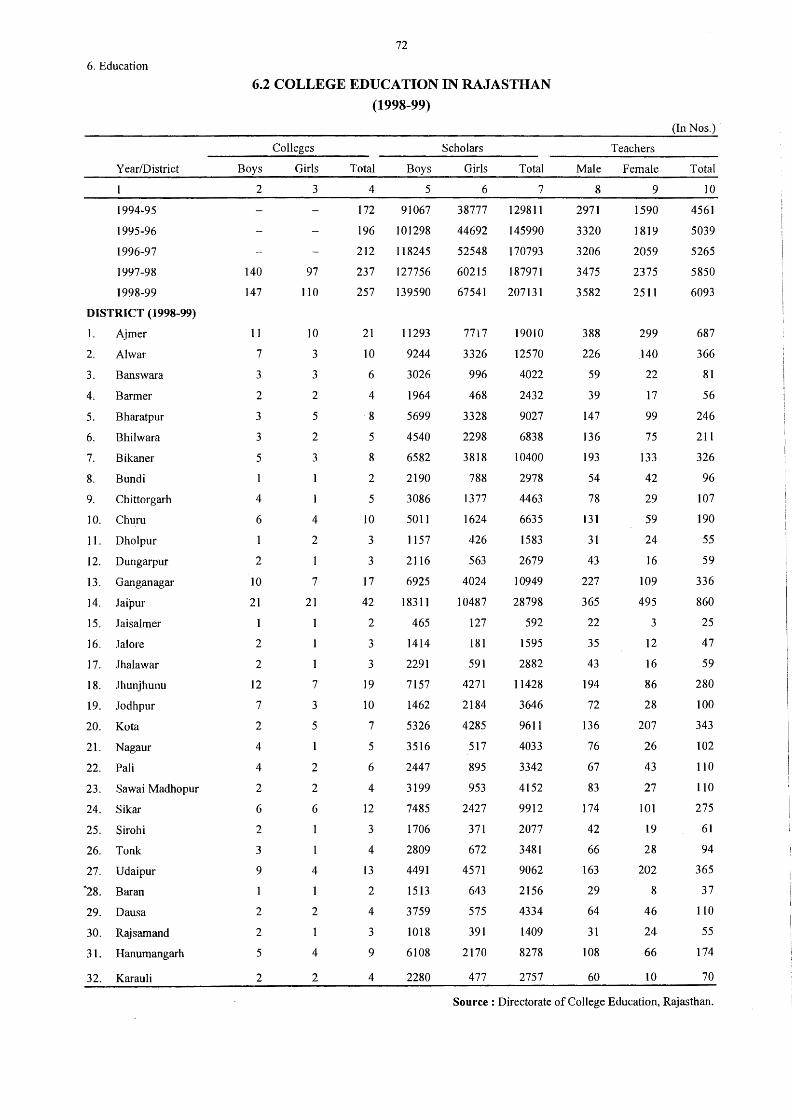
6. Education
Year/District
1994-95
1995-96
1996-97
1997-98
1998-99
DISTRICT (1998-99)
1. Ajmer
2. Alwar
3. Banswara
4. Barmer
5. Bharatpur
6. Bhilwara
7. Bikaner
8. Bundi
9. Chittorgarh
10. Churu
11. Dholpur
12. Dungarpur
13. Ganganagar
14. Jaipur
15. Jaisalmer
16. Jalore
17. Jhalawar
18. Jhunjhunu
19. Jodhpur
20. Kota
21. Nagaur
22. Pali
23. Sawai Madhopur
24. Sikar
25. Sirohi
26. Tonk
27. Udaipur
~28. Baran
29. Dausa
30. Rajsamand
31. Hanumangarh
32. Karauli
72
6.2 COLLEGE EDUCATION IN RAJASTHAN
(1998-99)
Colleges
Boys Girls
2 3
140 97
147 110
11
7
3
2
3
3
5
1
4
6
1
2
10
21
2
2
12
7
2
4
4
2
6
2
3
9
2
2
5
2
10
3
3
2
5
2
3
4
2
7
21
7
3
5
2
2
6
4
1
2
4
2
Total
4
172
196
212
237
257
21
10
6
4
8
5
8
2
5
10
3
3
17
42
2
3
3
19
10
7
5
6
4
12
3
4
13
2
4
3
9
4
Scholars
Boys Girls
5 6
91067 38777
101298 44692
118245 52548
127756 60215
139590 67541
11293
9244
3026
1964
5699
4540
6582
2190
3086
5011
1157
2116
6925
18311
465
1414
2291
7157
1462
5326
3516
2447
3199
7485
1706
2809
4491
1513
3759
1018
6108
2280
7717
3326
996
468
3328
2298
3818
788
1377
1624
426
563
4024
10487
127
181
591
4271
2184
4285
517
895
953
2427
371
672
4571
643
575
391
2170
477
Total
7
129811
145990
170793
187971
207131
19010
12570
4022
2432
9027
6838
10400
2978
4463
6635
1583
2679
10949
28798
592
1595
2882
11428
3646
9611
4033
3342
4152
9912
2077
3481
9062
2156
4334
1409
8278
2757
Teachers
Male Female
8 9
2971 1590
3320 1819
3206 2059
3475 2375
3582 2511
388
226
59
39
147
136
193
54
78
131
31
43
227
365
22
35
43
194
72
136
76
67
83
174
42
66
163
29
64
31
108
60
299
140
22
17
99
75
133
42
29
59
24
16
109
495
3
12
16
86
28
207
26
43
27
101
19
28
202
8
46
24
66
10
(In Nos.)
Total
10
4561
5039
5265
5850
6093
687
366
81
56
246
211
326
96
107
190
55
59
336
860
25
47
59
280
100
343
102
1 IO
110
275
61
94
365
37
110
55
174
70
Source : Directorate of College Education, Rajasthan.
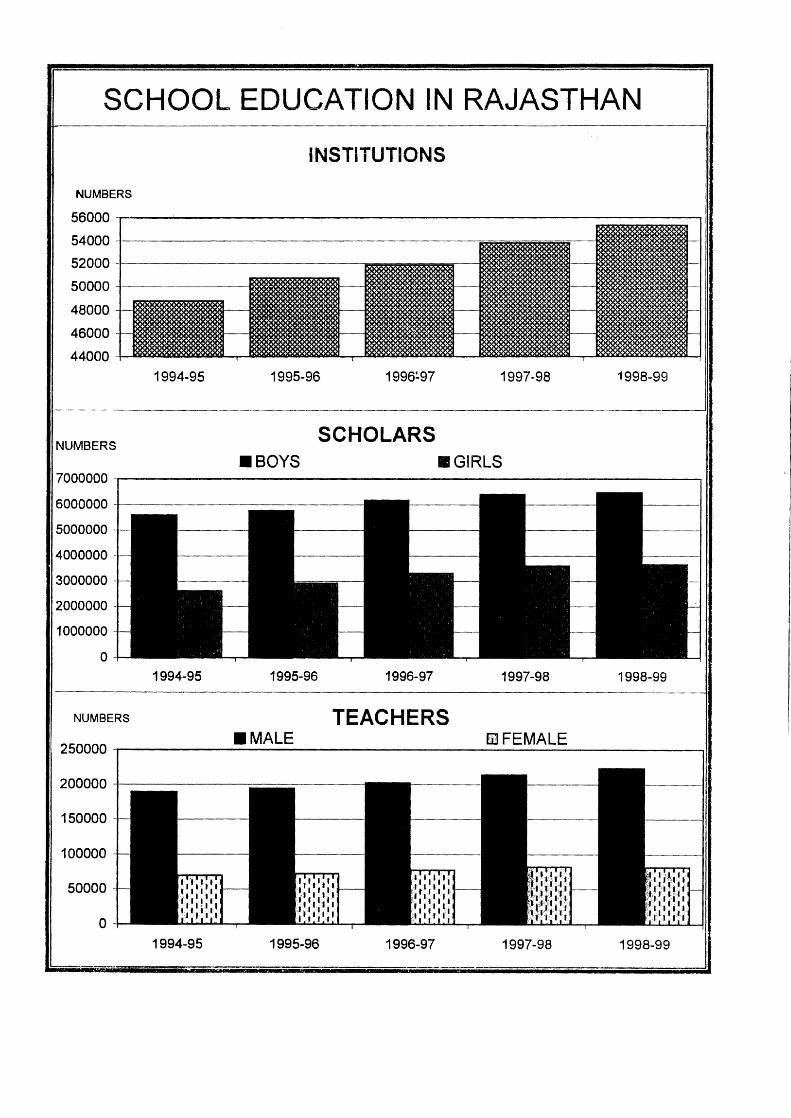
SCHOOL EDUCATION IN RAJASTHAN
INSTITUTIONS
NUMBERS
56000---~--~~~~~~~~~~~~~~~~~~~~~~~~--
54000 -+------------------
52000 -t-------------
50000 -t-------
48000
46000
44000
NUMBERS
1994-95 1995-96 1996~97
SCHOLARS
1997-98
•BOYS •GIRLS 7000000
6000000
5000000
4000000
3000000 -
2000000
1000000
0 1994-95 1995-96 1996-97 1997-98
NUMBERS TEACHERS 250000
•MALE EE FEMALE
200000
150000
100000
50000
0 1994-95 1995-96 1996-97 1997-98
---- ~.~~-
1998-99
1998-99
1998-99
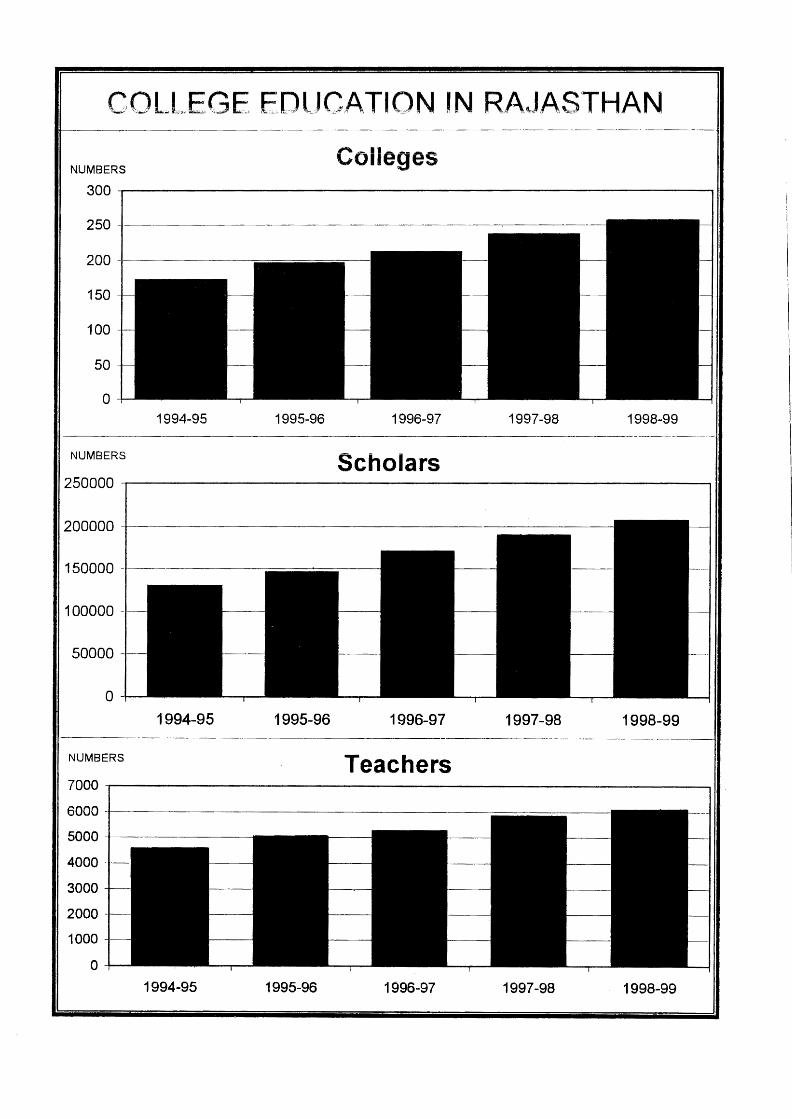
COLL.E,GE. E.DlJC,A.TION ~N RA.~JA.STHAN
NUMBERS Colleges
300
250
200
150
100
50
0 1994-95 1995-96 1996-97 1997-98 1998-99
NUMBERS Scholars 250000
200000
150000 -
100000
50000
0
1994-95 1995-96 1996-97 1997-98 1998-99
NUMBERS Teachers 7000
6000
5000
4000
3000
2000
1000
o 1994-95 1995-96 1996-97 1997-98 1998-99
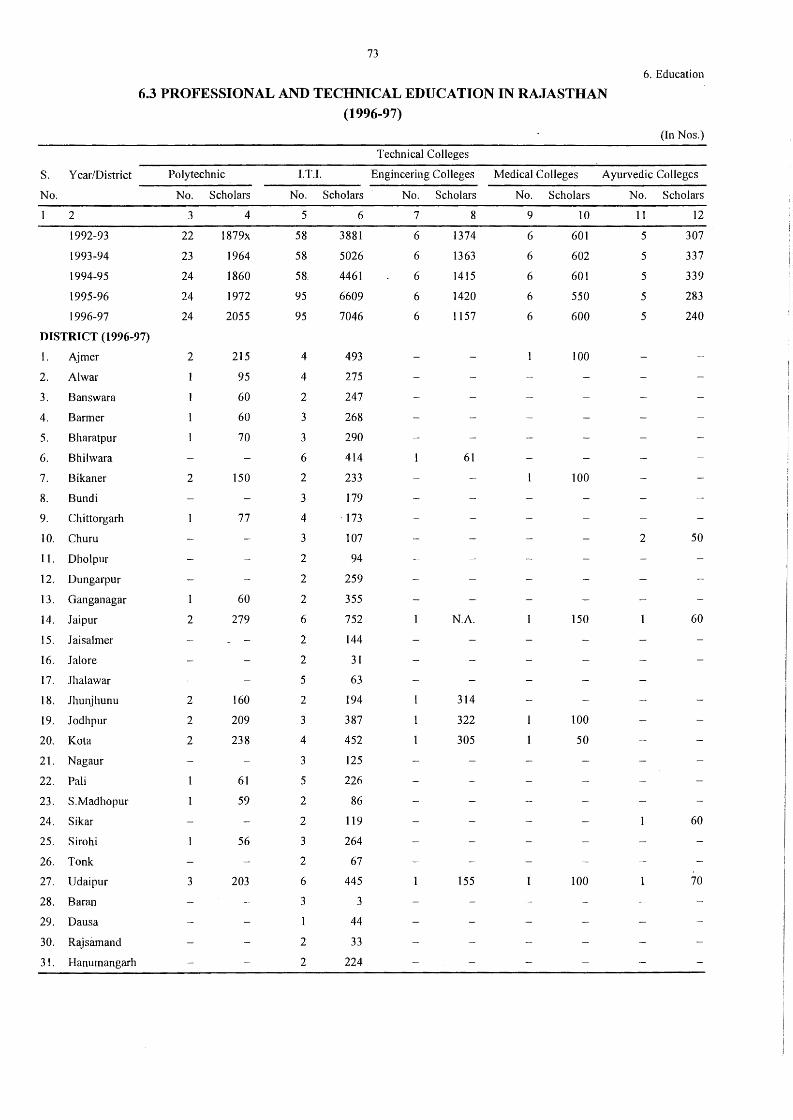
73
6. Education
6.3 PROFESSIONAL AND TECHNICAL EDUCATION IN RAJASTHAN (1996-97)
(In Nos.)
Technical Colleges
S. Year/District Polytechnic I.T.I. Engineering Colleges Medical Colleges Ayurvedic Colleges
No. No. Scholars No. Scholars No. Scholars No. Scholars No. Scholars
2 3 4 5 6 7 8 9 10 11 12
1992-93 22 1879x 58 3881 6 1374 6 601 5 307
1993-94 23 1964 58 5026 6 1363 6 602 5 337
1994-95 24 1860 58. 4461 6 1415 6 601 5 339
1995-96 24 1972 95 6609 6 1420 6 550 5 283
1996-97 24 2055 95 7046 6 1157 6 600 5 240
DISTRICT (1996-97)
1. Ajmer 2 215 4 493 100
2. Al war 1 95 4 275
3. Banswara 60 2 247
4. Barmer 60 3 268
5. Bharatpur 70 3 290
6. Bhilwara 6 414 61
7. Bikaner 2 150 2 233 100
8. Bundi 3 179
9. Chittorgarh 77 4 173
10. Chum 3 107 2 50
l 1. Dholpur 2 94
12. Dungarpur 2 259
13. Ganganagar 60 2 355
14. Jaipur 2 279 6 752 N.A. 150 60
15. Jaisalmer 2 144
16. Jal ore 2 31
17. Jhalawar 5 63
18. Jhunjhunu 2 160 2 194 314
19. Jodhpur 2 209 3 387 322 100
20. Kota 2 238 4 452 305 50
21. Nagaur 3 125
22. Pali 61 5 226
23. S.Madhopur 59 2 86
24. Sikar 2 119 60
25. Sirohi 56 3 264
26. Tonk 2 67
27. Udaipur 3 203 6 445 155 100 70
28. Baran 3 3
29. Daus a 44
30. R~jsi:unand 2 33
3 l. Hanumangarh 2 224
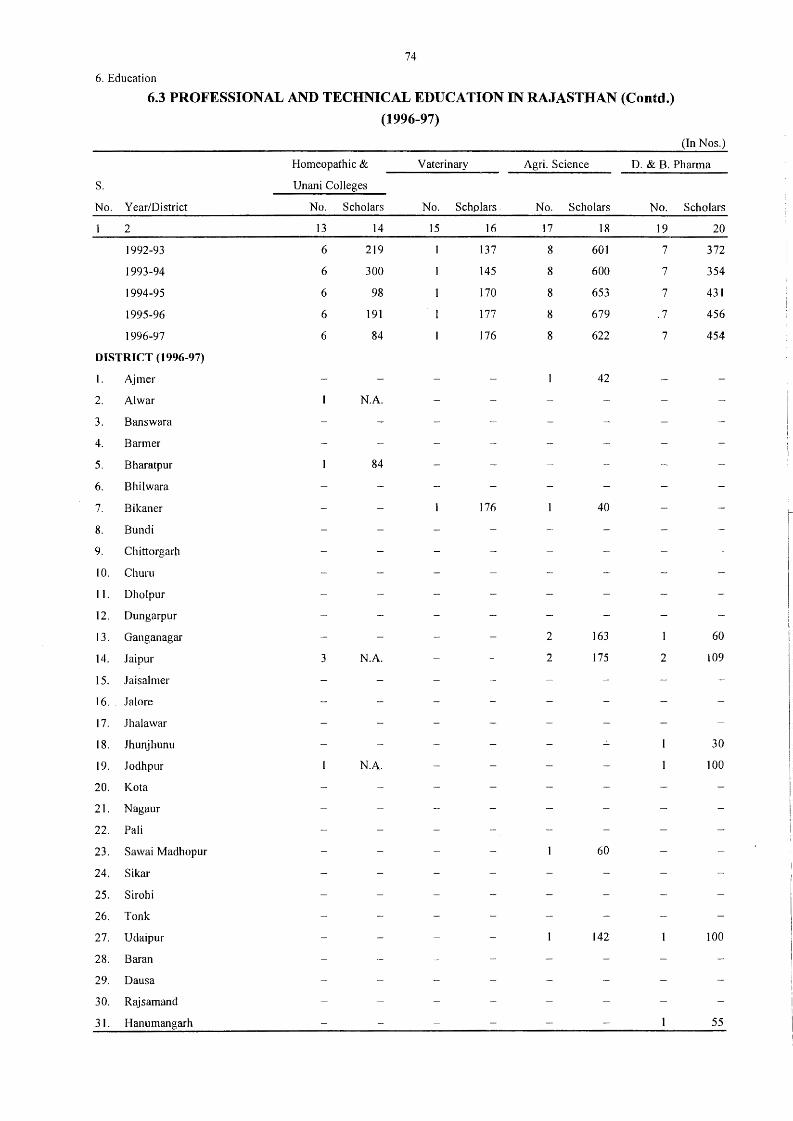
74
6. Education
6.3 PROFESSIONAL AND TECHNICAL EDUCATION IN RAJASTHAN (Contd.)
(1996-97)
(In Nos.)
Homeopathic & Vaterinary Science D. & B. Pharma
S. Unani Colleges
No. Year/District No. Scholars No. Scholars No. Scholars No. Scholars
2 13 14 15 16 17 18 19 20
1992-93 6 219 137 8 601 7 372
1993-94 6 300 145 8 600 7 354
1994-95 6 98 170 8 653 7 431
1995-96 6 191 177 8 679 .7 456
1996-97 6 84 176 8 622 7 454
DISTRICT (1996-97)
I. Ajmer 42
2. Al war N.A.
3. Banswara
4. Barmer
5. Bharatpur 84
6. Bhilwara
7. Bikaner 176 40
8. Bundi
9. Chittorgarh
10. Churn
11. Dholpur
12. Dungarpur
13. Gang an agar 2 163 60
14. Jaipur 3 N.A. 2 175 2 109
15. Jaisalmer
16. Jal ore
17. Jhalawar
18. Jhunjhunu 30
19. Jodhpur N.A. 100
20. Ko ta
21. Nagaur
22. Pali
23. Sawai Madhopur 60
24. Sikar
25. Sirohi
26. Tonk
27. Udaipur 142 100
28. Baran
29. Dausa
30. Rajsamand
31. Hanumangarh 55
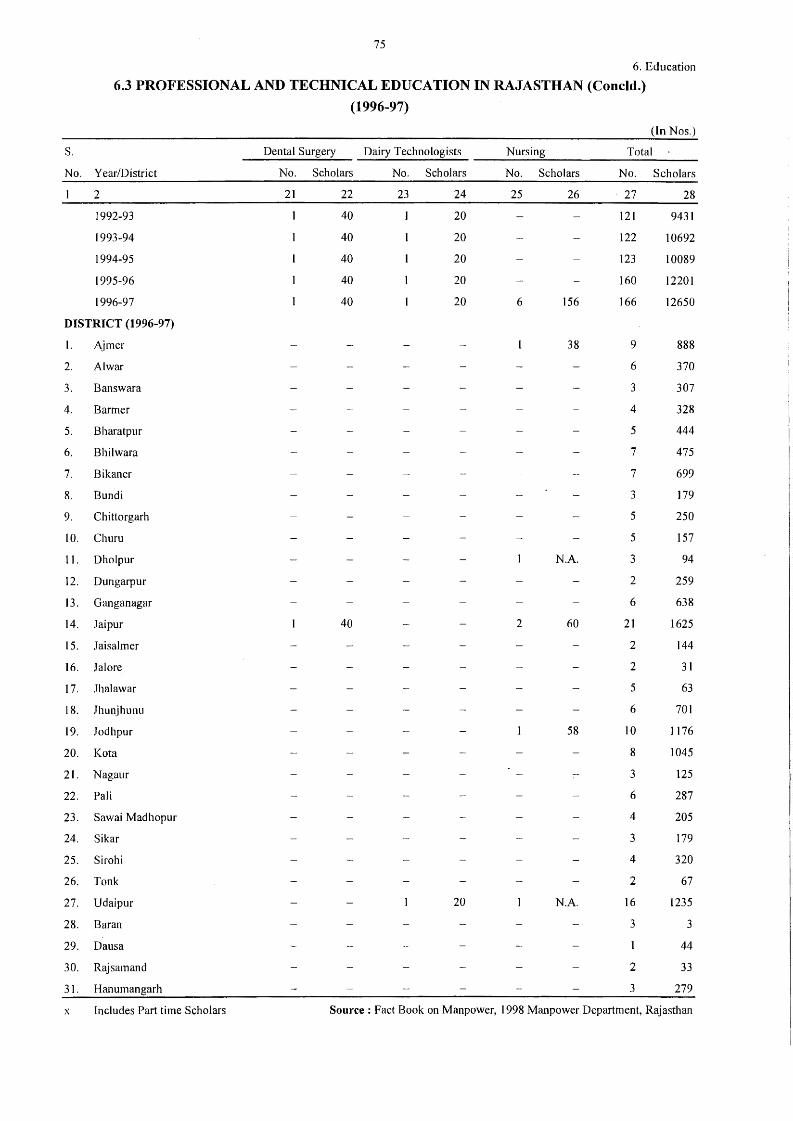
75
6. Education
6.3 PROFESSIONAL AND TECHNICAL EDUCATION IN RAJASTHAN (Concld.)
(1996-97)
(ln Nos.)
s. Dental Surgery Dairy Technologists Nursing Total
No. Year/District No. Scholars No. Scholars No. Scholars No. Scholars
2 21 22 23 24 25 26 27 28
1992-93 40 20 121 9431
1993-94 40 20 122 10692
1994-95 40 20 123 10089
1995-96 40 20 160 12201
1996-97 40 20 6 156 166 12650
DISTRICT (1996-97)
I. Aimer 38 9 888
2. Al war 6 370
3. Banswara 3 307
4. Barmer 4 328
5. Bharatpur 5 444
6. Bhilwara 7 475
7. Bikaner 7 699
8. Bundi 3 179
9. Chittorgarh 5 250
IO. Churu 5 157
11. Dholpur N.A. 3 94
12. Dungarpur 2 259
13. Ganganagar 6 638
14. Jaipur 40 2 60 21 1625
15. Jaisalmer 2 144
16. Jal ore 2 31
17. Jhalawar 5 63
18. Jhunjhunu 6 701
19. Jodhpur 58 10 J 176
20. Ko ta 8 1045
21. Nagaur 3 125
22. Pali 6 287
23. Sawai Madhopur 4 205
24. Sikar 3 179
25. Sirohi 4 320
26. Tonk 2 67
27. Udaipur 20 N.A. 16 1235
28. Baran 3 3
29. Dausa 44
30. Rajsamand 2 33
31. Hanumangarh 3 279
x Includes Part time Scholars Source : Fact Book on Manpower, 1998 Manpower Department, Rajasthan
(7) MASS COMMUNICATION
This section contains tables of news papers published daily, weekly, fornightly,
monthly and quarterly.
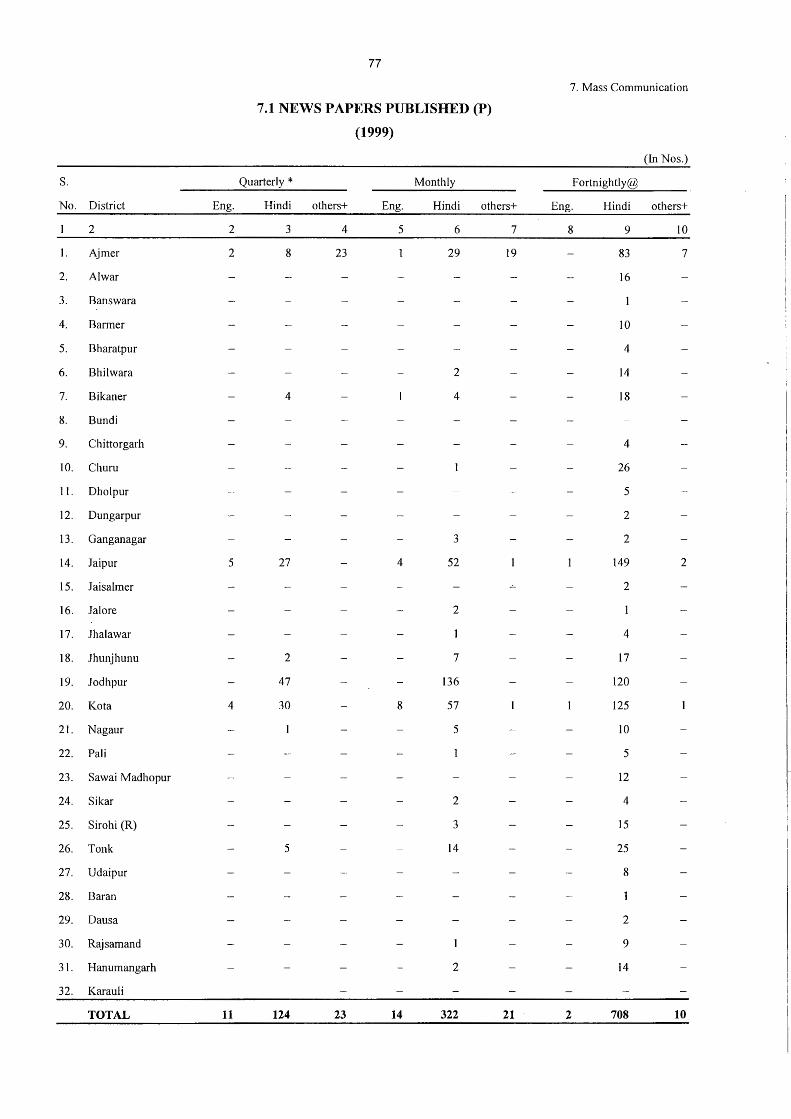
77
7. Mass Communication
7.1 NEWS PAPERS PUBLISHED (P)
(1999)
(In Nos.)
S. Quarterly* Monthly Fortnightly@
No. District Eng. Hindi others+ Eng. Hindi others+ Eng. Hindi others+
2 2 3 4 5 6 7 8 9 10
I. Ajmer 2 8 23 29 19 83 7
2. Al war 16
3. Banswara
4. Barmer 10
5. Bharatpur 4
6. Bhilwara 2 14
7. Bikaner 4 4 18
8. Bundi
9. Chittorgarh 4
10. Chum 26
11. Dholpur 5
12. Dungarpur 2
13. Ganganagar 3 2
14. Jaipur 5 27 4 52 149 2
15. Jaisalmer 2
16. Jal ore 2
17. Jhalawar 4
18. Jhunjhunu 2 7 17
19. Jodhpur 47 136 120
20. Ko ta 4 30 8 57 125
21. Nagaur 5 IO
22. Pali 5
23. Sawai Madhopur 12
24. Sikar 2 4
25. Sirohi (R) 3 15
26. Tonk 5 14 25
27. Udaipur 8
28. Baran
29. Daus a 2
30. Rajsamand 9
31. Hanumangarh 2 14
32. Karauli
TOTAL 11 124 23 14 322 21 2 708 10
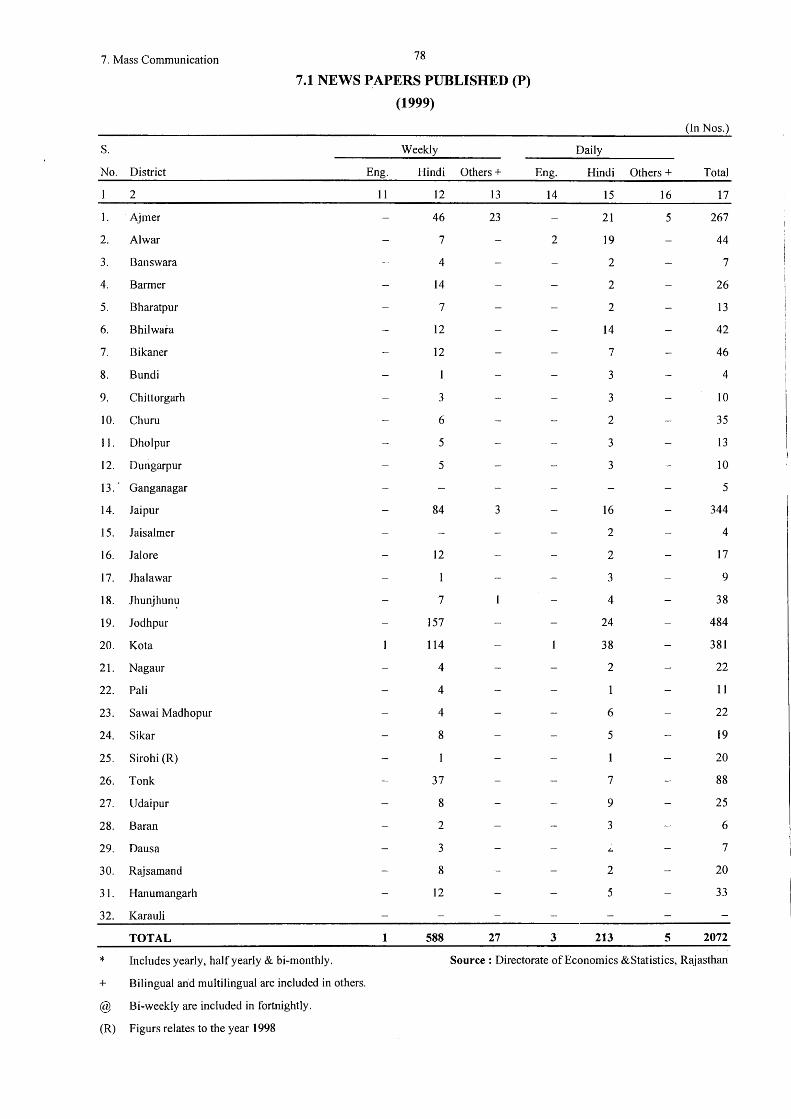
7. Mass Communication 78
7.1 NEWS ~APERS PUBLISHED (P)
(1999)
(In Nos.)
S. Weekly Daily
No. District Eng. Hindi Others+ Eng. Hindi Others+ Total
2 11 12 13 14 15 16 17
I. Ajmer 46 23 21 5 267
2. Al war 7 2 19 44
3. Banswara 4 2 7
4. Barmer 14 2 26
5. Bharatpur 7 2 13
6. Bhilwara 12 14 42
7. Bikaner 12 7 46
8. Bundi 3 4
9. Chittorgarh 3 3 IO
IO. Churn 6 2 35
I 1. Dholpur 5 3 13
12. Dungarpur 5 3 IO
13 .. Ganganagar 5
14. Jaipur 84 3 16 344
15. Jaisalmer 2 4
16. .Tai ore 12 2 17
17. .Th ala war 3 9
18. Jhunjhun1:1 7 4 38
19. Jodhpur 157 24 484
20. Ko ta 114 38 381
21. Nagaur 4 2 22
22. Pali 4 11
23. Sawai Madhopur 4 6 22
24. Sikar 8 5 19
25. Sirohi (R) 20
26. Tonk 37 7 88
27. Udaipur 8 9 25
28. Baran 2 3 6
29. Dausa 3 7
30. Rajsamand 8 2 20
31. Hanumangarh 12 5 33
32. Karauli
TOTAL 1 588 27 3 213 5 2072
* Includes yearly, half yearly & bi-monthly. Source : Directorate of Economics &Statistics, Rajasthan
+ Bilingual arid multilingualare included in others.
@ Bi-weekly are included in fortnightly.
(R) Figurs relates to the year 1998
(8)HEALTH
I. GOVERNMENT MEDICAL INSTITUTIONS- The distinction between a hospital and a
dispensary has been made on the basis of provision of in-patient beds. A hospital has beds
where as a dispensary has none. T.B. clinics without beds have been grouped under
dispensaries. The term general hospital here signifies those hospitals where patients of all
diseases may find treatment and as such the Zanana hospitals have been grouped under
General Hospital.
The Primary health Centre is a composite institution providing facilities of in-door and
out-door treatment, maternity & preventive health work. The information contained relates
to those primary health centres which are actually functioning during the year.
2. IN PATIENT BEDS- The classification of in-patient beds is made according to diseases.
As such the general beds here signity all those beds which are not meant for any particular
disease and this includes the beds available in maternity & child welfare centres also.
3. MEDICAL & HEALTH PERSONNEL - The number of medical personnel is based on the
sanctioned strength of State Public Hospitals, Dispensaries, Primary health centres, Family
planning centres, maternity & child welfare centres, clinics, health workers etc.
4. PATIENTS TREATED - The number of patients treated is the number of patients who
come to Government medical institutions for treatJ.nent, Patients classified by diseases may
not tally with the total patients due to administrative difficulties in registration syste1n at
different stages.
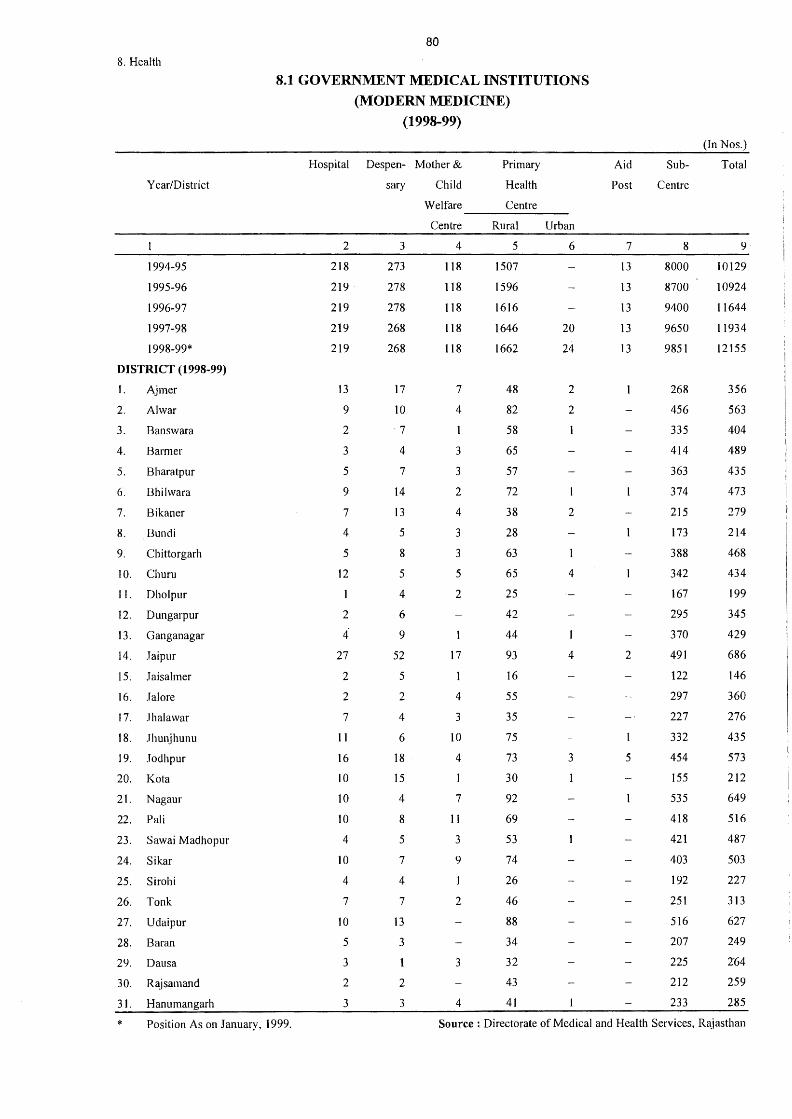
8. Health
Year/District
1994-95
1995-96
1996-97
1997-98
1998-99*
DISTRICT (1998-99)
1. Ajmer
2. Al war
3. Banswara
4. Barmer
5. Bharatpur
6. Bhilwara
7. Bikaner
8. Bundi
9. Chittorgarh
10. Chum
JI. Dholpur
12. Dungarpur
13. Ganganagar
14. Jaipur
15. .Jaisalmer
16. .Jalore
17. .Jhalawar
18. Jhunjhunu
19. Jodhpur
20. Kota
21. Nagaur
22. Pali
23. SawaiMadhopur
24.
25.
26.
27.
28.
29.
30.
31.
Sikar
Sirohi
Tonk
Udaipur
Baran
Daus a
Rajsamand
Hanumangarh
80
8.1 GOVERNMENT MEDICAL INSTITUTIONS
(MODERN MEDICINE)
(1998-99)
Hospital Despen- Mother &
2
218
219
219
219
219
13
9
2
3
5
9
7
4
5
12
1
2
4 27
2
2
7
11
16
10
10
IO
4
10
4
7
IO
5
3
2
3
sary Child
3
273
278
278
268
268
17
IO
7
4
7
14
13
5
8
5
4
6
9
52
5
2
4
6
18
15
4
8
5
7
4
7
13
3
2
3
Welfare
Centre
4
118
118
118
118
118
7
4
3
3
2
4
3
3
5
2
I
17
4
3
10
4
7
II
3
9
2
3
4
Primary
Health
Centre
Rural Urban
5
1507
1596
1616
1646
1662
48
82
58
65
57
72
38
28
63
65
25
42
44
93
16
55
35
75
73
30
92
69
53
74
26
46
88
34
32
43
41
6
20
24
2
2
2
4
4
3
Aid
Post
7
13
13
13
13
13
2
5
Sub-
Centre
8
8000
8700
9400
9650
9851
268
456
335
414
363
374
215
173
388
342
167
295
370
491
122
297
227
332
454
155
535
418
421
403
192
251
516
207
225
212
233
(In Nos.)
Total
10129
10924
11644
11934
12155
356
563
404
489
435
473
279
214
468
434
199
345
429
686
146
360
276
435
573
212
649
516
487
503
227
313
627
249
204
259
285
* Position As on January, 1999. Source : Directorate of Medical and Health Services, Rajasthan
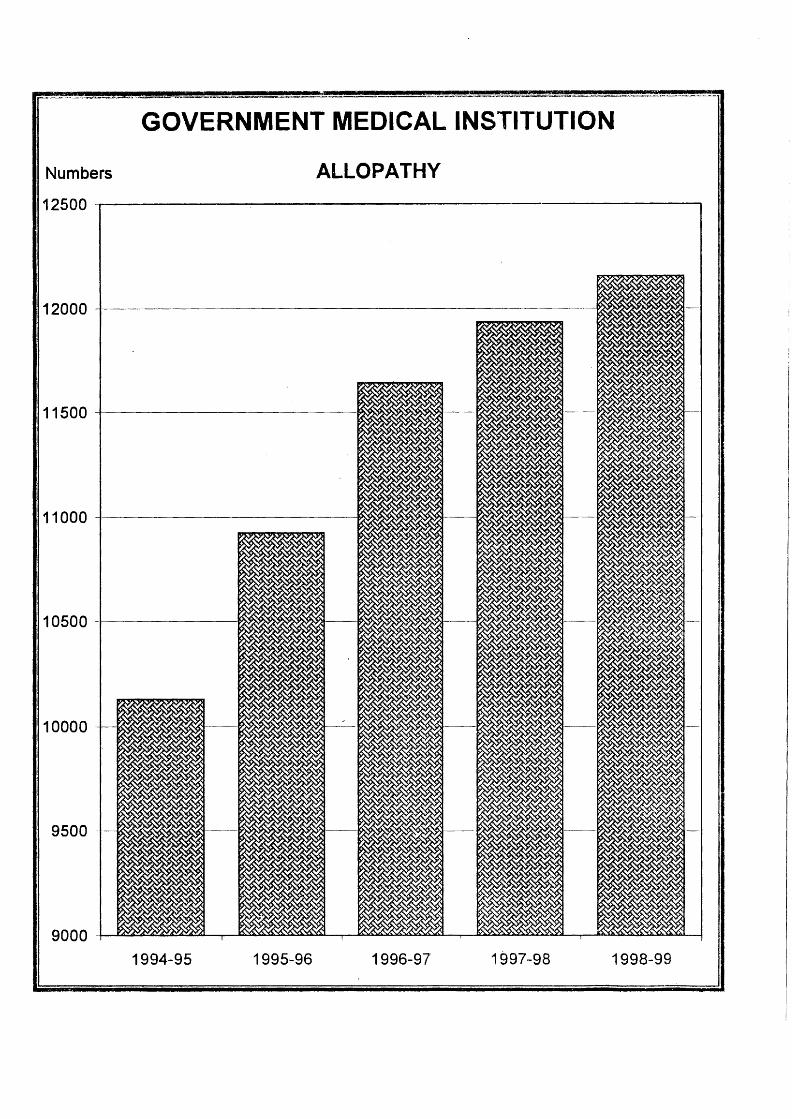
GOVERNMENT MEDICAL INSTITUTION
Numbers ALLOPATHY 12500
12000
11500 I 11000
.... s~~~~· .. ~L -<-' '.A;<:
9000 1994-95 1995-96 1996-97 1997-98 1998-99
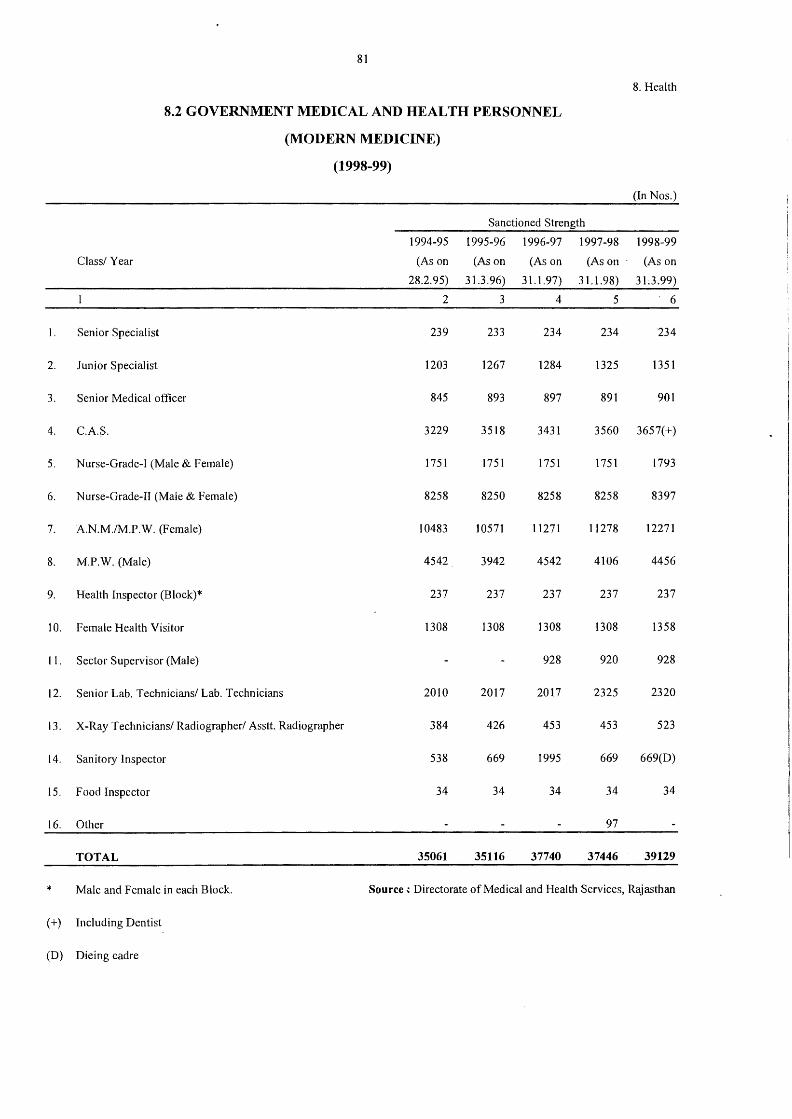
81
8. Health
8.2 GOVERNMENT MEDICAL AND HEALTH PERSONNEL
(MODERN MEDICINE)
(1998-99)
(In Nos.)
Sanctioned Strength
1994-95 1995-96 1996-97 1997-98 1998-99
Class/ Year (As on (As on (As on (As on · (As on
28.2.95) 31.3.96) 31.1.97) 31.1.98) 3L3.99)
2 3 4 5 6
1. Senior Specialist 239 233 234 234 234
2. Junior Specialist 1203 1267 1284 1325 1351
3. Senior Medical officer 845 893 897 891 901
4. C.A.S. 3229 3518 3431 3560 3657(+)
5. Nurse-Grade-I (Male & Female) 1751 1751 1751 1751 1793
6. Nurse-Grade-II (Male & Female) 8258 8250 8258 8258 8397
7. AN.M./M.P.W. (Female) 10483 10571 11271 11278 12271
8. M.P.W. (Male) 4542 3942 4542 4106 4456
9. Health Inspector (Block)* 237 237 237 237 237
IO. Female Health Visitor 1308 1308 1308 1308 1358
11. Sector Supervisor (Male) 928 920 928
12. Senior Lab. Technicians/ Lab. Technicians 2010 2017 2017 2325 2320
13. X-Ray Technicians/ Radiographer/ Asstt. Radiographer 384 426 453 453 523
14. Sanitary Inspector 538 669 1995 669 669(D)
15. Food Inspector 34 34 34 34 34
16. Other 97
TOTAL 35061 35116 37740 37446 39129
* Male and Female in each Block. Source~ Directorate of Medical and Health Services, Rajasthan
(+) Including Dentist
(D) Dieing cadre
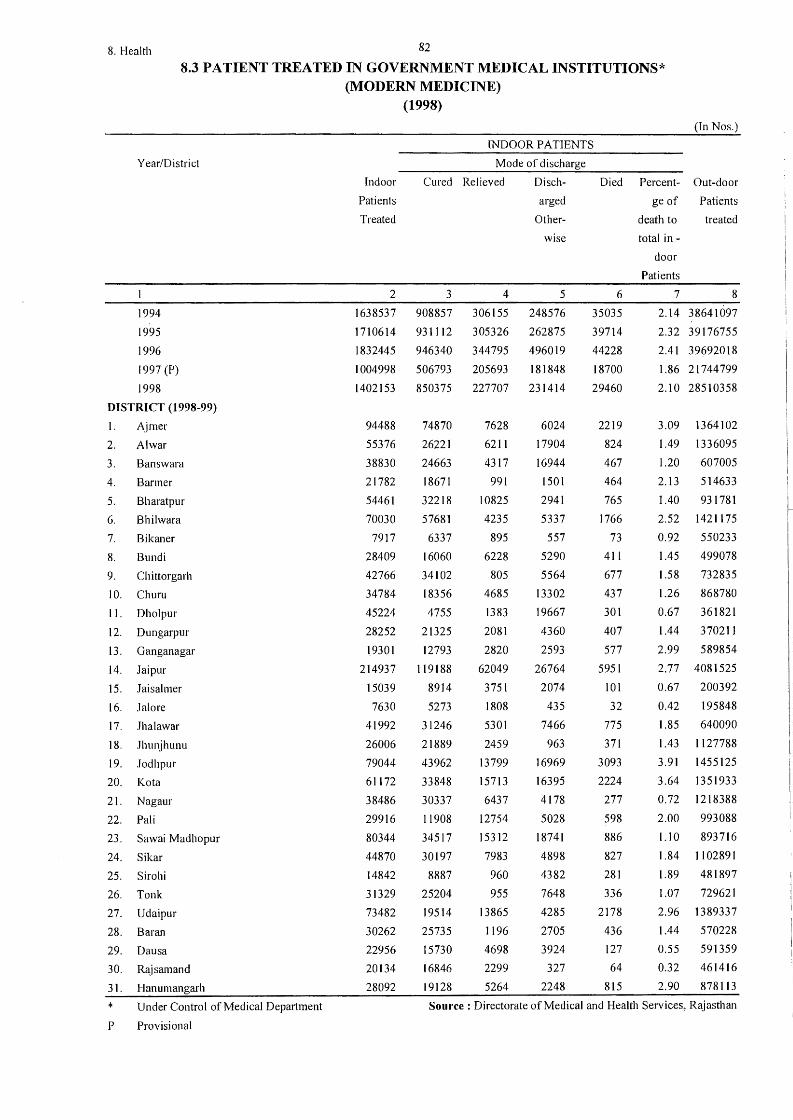
8. Health 82
8.3 PATIENT TREATED IN GOVERNMENT MEDICAL INSTITUTIONS* (MODERN MEDICINE)
Year/District
1994
1995
1996
1997 (P)
1998
DISTRICT (1998-99)
1. Ajmer
2. Al war
3. Banswara
4. Barmer
5. Bharatpur
6. Bhilwara
7. Bikaner
8. Bundi
9. Chittorgarh
10. Churu
11. Dholpur
12. Dungarpur
13. Ganganagar
14. Jaipur
15. Jaisalmer
16. Jalore
17. Jhalawar
18. Jhunjhunu
19. Jodhpur
20. Kata
21. Nagaur
22. Pali
23. Sawai Madhopur
24. Sikar
25. Sirohi
26. Tonk
27. Udaipur
28. Baran
29. Dausa
30. Rajsamand
3 1. Hanumangarh
* Under Control of Medical Department
P Provisional
(1998)
(In Nos.)
INDOOR PATIENTS
Mode of discharge
Indoor
Patients
Treated
Cured Relieved Disch
arged
Other-
2 3
1638537 908857
1710614 931t12
1832445 946340
I 004998 506793
1402153 850375
94488
55376
38830
21782
54461
70030
7917
28409
42766
34784
45224
28252
19301
214937
15039
7630
41992
26006
79044
61172
38486
29916
80344
44870
14842
31329
73482
30262
22956
20134
28092
74870
26221
24663
18671
32218
57681
6337
16060
34102
18356
4755
21325
12793
119188
8914
5273
31246
21889
43962
33848
30337
11908
34517
30197
8887
25204
19514
25735
15730
16846
19128
4
306155
305326
344795
205693
227707
7628
6211
4317
991
10825
4235
895
6228
805
4685
1383
2081
2820
62049
3751
1808
5301
2459
13799
15713
6437
12754
15312
7983
960
955
13865
1196
4698
2299
5264
wise
5
248576
262875
496019
181848
231414
6024
17904
16944
1501
2941
5337
557
5290
5564
13302
19667
4360
2593
26764
2074
435
7466
963
16969
16395
4178
5028
18741
4898
4382
7648
4285
2705
3924
327
2248
Died Percent- Out-door
6
35035
39714
44228
18700
29460
2219
824
467
464
765
1766
73
411
677
437
301
407
577
5951
101
32
775
371
3093
2224
277
598
886
827
281
336
2178
436
127
64
815
ge of Patients
death to treated
total in -
door
Patients
7 8
2.14 38641097
2.32 39176755
2.41 39692018
1.86 21744799
2.10 28510358
3.09 1364102
1.49 1336095
1.20 607005
2.13 514633
1.40 931781
2.52 1421175
0.92 550233
1.45 499078
1.58 732835
1.26 868780
0.67 361821
1.44 370211
2.99 589854
2.77 4081525
0.67 200392
0.42 195848
1.85 640090
1.43 1127788
3.91 1455125
3.64 1351933
0.72 1218388
2.00 993088
l.10 893716
1.84 1102891
l .89 481897
1.07 729621
2.96 1389337
1.44 570228
0.55 591359
0.32 461416
2.90 878113
Source : Directorate of Medical and Health Services, Rajasthan
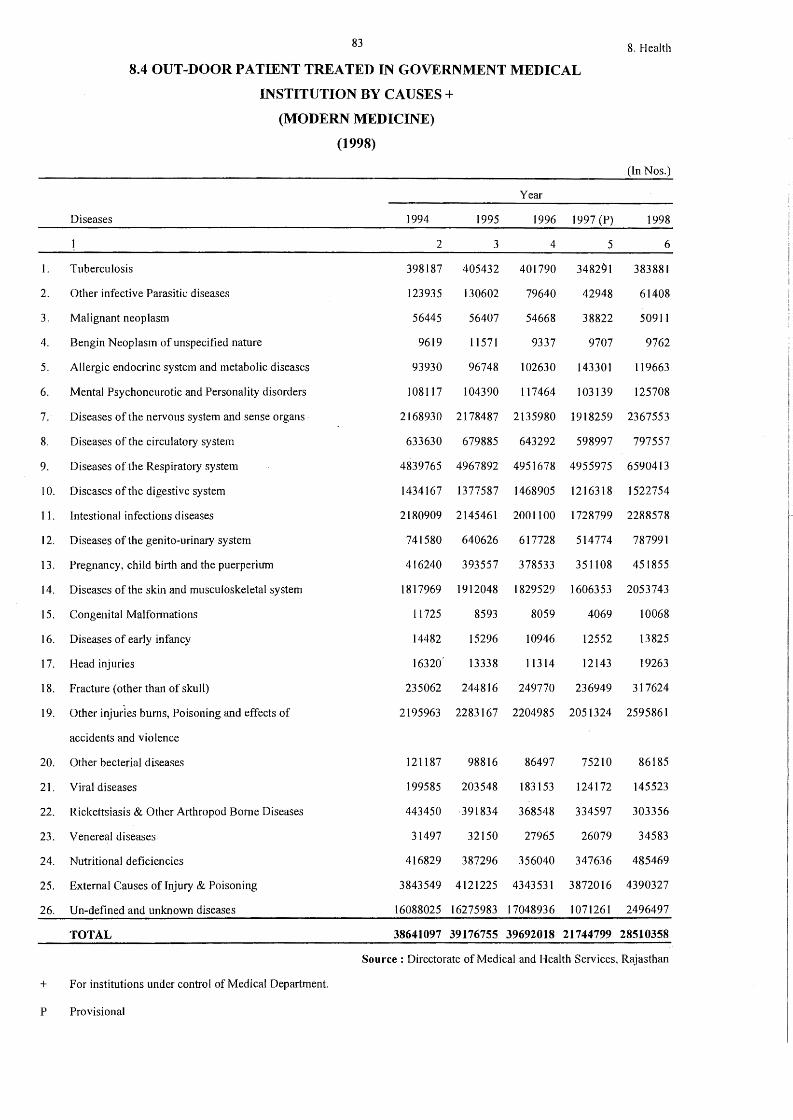
83 8. Health
8.4 OUT-DOOR PATIENT TREATED IN GOVERNMENT MEDICAL
INSTITUTION BY CAUSES+
(MODERN MEDICINE)
(1998)
(In Nos.)
Year
Diseases 1994 1995 1996 1997 (P) 1998
2 3 4 5 6
I. Tuberculosis 398187 405432 401790 348291 383881
2. Other infective Parasitit; diseases 123935 130602 79640 42948 61408
3. Malignant neoplasm 56445 56407 54668 38822 50911
4. Bengin Neoplasm of unspecified nature 9619 11571 9337 9707 9762
5. Allergic endocrine system and metabolic diseases 93930 96748 102630 143301 119663
6. Mental Psychoneurotic and Personality disorders 108117 104390 117464 103139 125708
7. Diseases of the nervous system and sense organs 2168930 2178487 2135980 1918259 2367553
8. Diseases of the circulatory system 633630 679885 643292 598997 797557
9. Diseases of the Respiratory system 4839765 4967892 4951678 4955975 6590413
10. Diseases of the digestive system 1434167 1377587 1468905 1216318 1522754
11. Intestional infections diseases 2180909 2145461 2001100 1728799 2288578
12. Diseases of the genito-urinary system 741580 640626 617728 514774 787991
13. Pregnancy, child bitih and the puerperium 416240 393557 378533 351108 451855
14. Diseases of the skin and musculoskeletal system 1817969 1912048 1829529 1606353 2053743
15. Congenital Malformations 11725 8593 8059 4069 10068
16. Diseases of early infancy 14482 15296 10946 12552 13825
17. Head injuries 16320 13338 11314 12143 19263
18. Fracture (other than of skull) 235062 244816 249770 236949 317624
19. Other injuries burns, Poisoning and effects of 2195963 2283167 2204985 2051324 2595861
accidents and violence
20. Other becterial diseases 121187 98816 86497 75210 86185
21. Viral diseases 199585 203548 183153 124172 145523
22. Rickettsiasis & Other Arthropod Borne Diseases 443450 ·391834 368548 334597 303356
23. Venereal diseases 31497 32150 27965 26079 34583
24. Nutritional deficiencies 416829 387296 356040 347636 485469
25. External Causes of Injury & Poisoning 3843549 4121225 4343531 3872016 4390327
26. Un-defined and unknown diseases 16088025 16275983 17048936 1071261 2496497
TOTAL 38641097 39176755 39692018 21744799 28510358
Source : Directorate of Medical and Health Services, Rajasthan
+ For institutions under control of Medical Department.
p Provisional
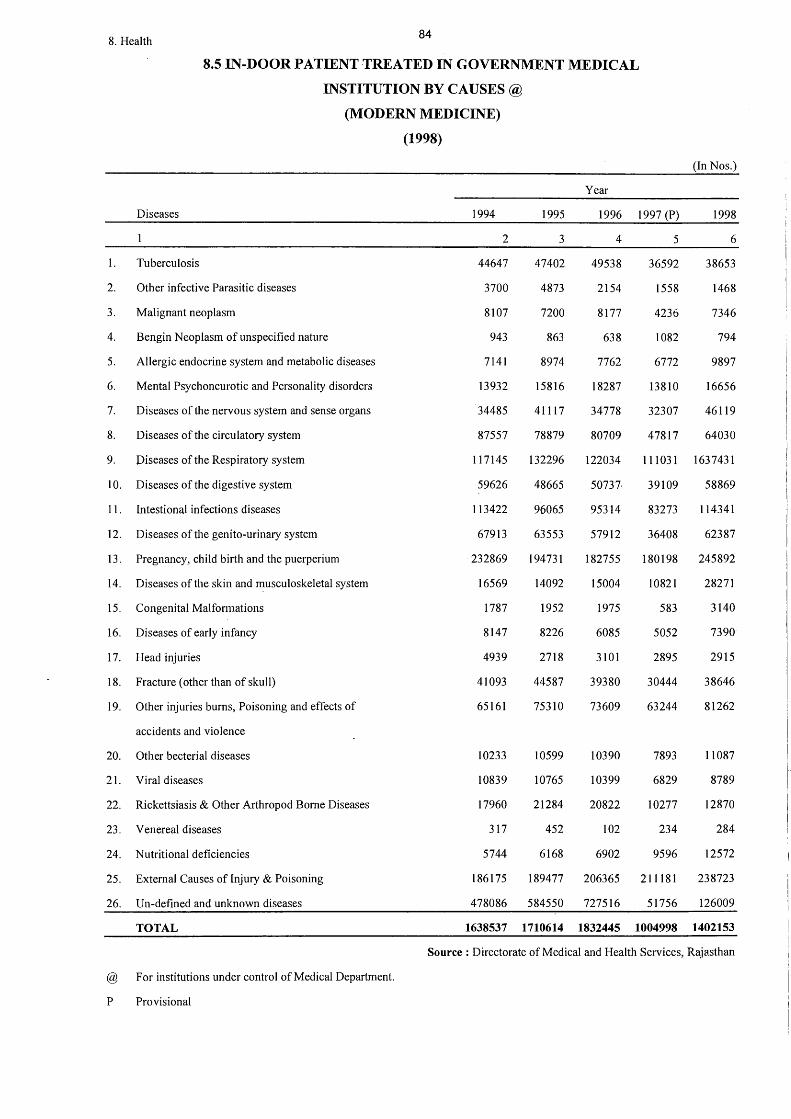
8. Health 84
8.5 IN-DOOR PATIENT TREATED IN GOVERNMENT MEDICAL
INSTITUTION BY CAUSES @
(MODERN MEDICINE)
(1998)
(In Nos.)
Year
Diseases 1994 1995 1996 1997 (P) 1998
2 3 4 5 6
1. Tuberculosis 44647 47402 49538 36592 38653
2. Other infective Parasitic diseases 3700 4873 2154 1558 1468
3. Malignant neoplasm 8107 7200 8177 4236 7346
4. Bengin Neoplasm of unspecified nature 943 863 638 1082 794
5. Allergic endocrine system and metabolic diseases 7141 8974 7762 6772 9897
6. Mental Psychoneurotic and Personality disorders 13932 15816 18287 13810 16656
7. Diseases of the nervous system and sense organs 34485 41117 34778 32307 46119
8. Diseases of the circulatory system 87557 78879 80709 47817 64030
9. Diseases of the Respiratory system 1I7145 132296 122034 111031 1637431
10. Diseases of the digestive system 59626 48665 50737- 39109 58869
11. Intestional infections diseases 113422 96065 95314 83273 114341
12. Diseases of the genito-urinary system 67913 63553 57912 36408 62387
13. Pregnancy, child birth and the puerperium 232869 194731 182755 180198 245892
14. Diseases of the skin and musculoskeletal system 16569 14092 15004 10821 28271
15. Congenital Malformations 1787 1952 1975 583 3140
16. Diseases of early infancy 8147 8226 6085 5052 7390
17. Head injuries 4939 2718 3101 2895 2915
18. Fracture (other than of skull) 41093 44587 39380 30444 38646
19. Other injuries burns, Poisoning and effects of 65161 75310 73609 63244 81262
accidents and violence
20. Other becterial diseases 10233 10599 10390 7893 11087
21. Viral diseases 10839 10765 10399 6829 8789
22. Rickettsiasis & Other Arthropod Borne Diseases 17960 21284 20822 10277 12870
23. Venereal diseases 317 452 102 234 284
24. Nutritional deficiencies 5744 6168 6902 9596 12572
25. External Causes of Injury & Poisoning 186175 189477 206365 211181 238723
26. Un-defined and unknown diseases 478086 584550 727516 51756 126009
TOTAL 1638537 1710614 1832445 1004998 1402153
Source : Directorate of Medical and Health Services, R~jasthan
@ For institutions under control of Medical Department.
p Provisional
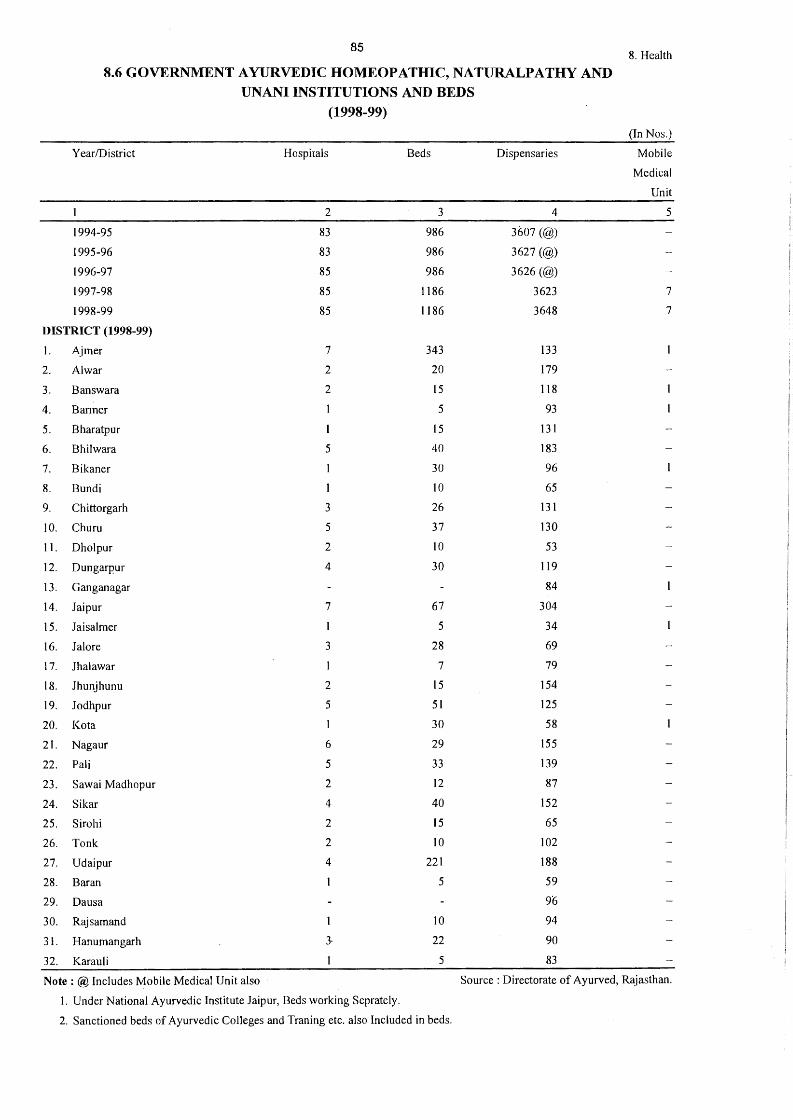
85 8. Health
8.6 GOVERNMENT AYURVEDIC HOMEOPATHIC, NATURALPATHY AND UNANI INSTITUTIONS AND BEDS
(1998-99)
(In Nos.)
Year/District Hospirnls Beds Dispensaries Mobile
Medical
Unit
2 3 4 5
1994-95 83 986 3607 (@)
1995-96 83 986 3627 (@)
1996-97 85 986 3626 (@)
1997-98 85 1186 3623 7
1998-99 85 1186 3648 7
DISTRICT (1998-99)
1. Ajrner 7 343 133
2. Al war 2 20 179
3. Banswara 2 15 118
4. Banner 5 93
5. Bharatpur l 15 131
6. Bhilwara 5 40 183
7. Bikaner 30 96
8. Bundi I 10 65
9. Chittorgarh 3 26 131
10. Chum 5 37 130
11. Dholpur 2 10 53
12. Dungarpur 4 30 119
13. Ganganagar 84
14. Jaipur 7 67 304
15. Jaisalmer l 5 34
16. Jalore 3 28 69
17. Jhalawar 7 79
18. Jhunjhunu 2 15 154
19. Jodhpur 5 51 125
20. Ko ta 30 58
21. Nagaur 6 29 155
22. Pali 5 33 139
23. Sawai Madhopur 2 12 87
24. Sikar 4 40 152
25. Sirohi 2 15 65
26. Tonk 2 10 102
27. Udaipur 4 221 188
28. Baran 5 59
29. Dausa 96
30. Rajsamand 1 10 94
3 l. Hanumangarh 3- 22 90
32. Karauli 5 83
Note : @ Includes Mobile Medical Unit also Source : Directorate of Ayurved, Rajasthan.
I. Under National Ayurvedic Institute Jaipur, Beds working Seprately.
2. Sanctioned beds of Ayurvedic Colleges and Traning etc. also Included in beds.
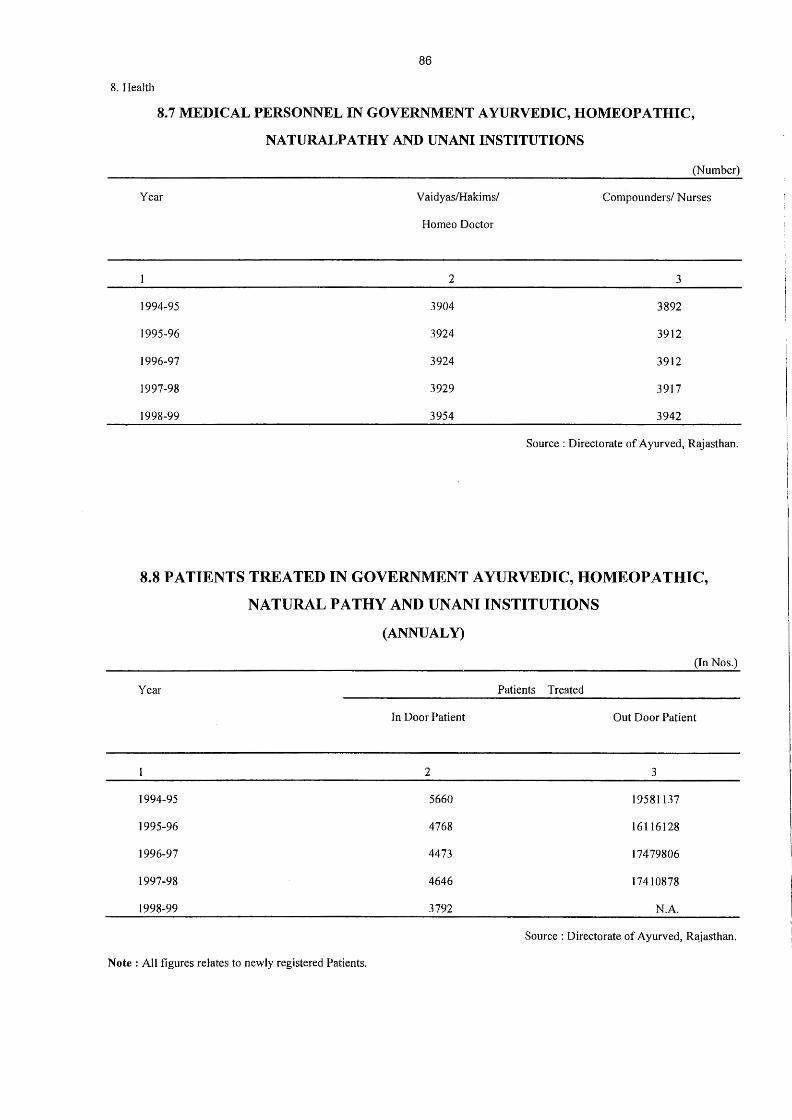
86
8. Health
8.7 MEDICAL PERSONNEL IN GOVERNMENT AYURVEDIC, HOMEOPATHIC,
NATURALPATHY AND UNANI INSTITUTIONS
Year
1994-95
1995-96
1996-97
1997-98
1998-99
Vaidyas/Hakims/
Homeo Doctor
2
3904
3924
3924
3929
3954
(Number)
Com pounders/ Nurses
3
3892
3912
3912
3917
3942
Source: Directorate of Ayurved, Rajasthan.
8.8 PATIENTS TREATED IN GOVERNMENT A YURVEDIC, HOMEOPATHIC,
NATURAL P ATHY AND UNANI INSTITUTIONS
(ANNUALY)
(In Nos.)
Year Patients Treated
In Door Patient Out Door Patient
2 3
1994-95 5660 19581137
1995-96 4768 16116128
1996-97 4473 17479806
1997-98 4646 17410878
1998-99 3792 N.A.
Source : Directorate of Ayurved, Rajasthan.
Note : All figures relates to newly registered Patients.
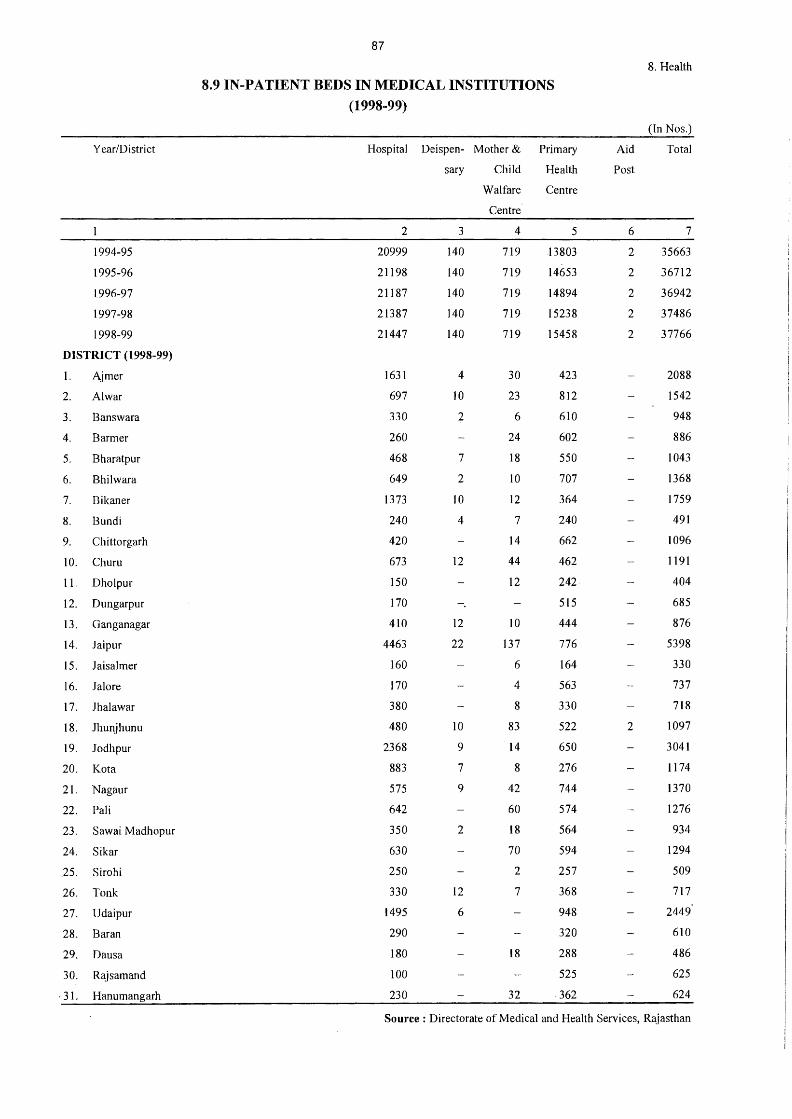
87
8. Health
8.9 IN-PATIENT BEDS IN MEDICAL INSTITUTIONS
(1998-99)
(In Nos.)
Year/District Hospital Deispen- Mother& Primary Aid Total
sary Child Health Post
Wal fare Centre
Centre
2 3 4 5 6 7
1994-95 20999 140 719 13803 2 35663
1995-96 21198 140 719 14653 2 36712
1996-97 21187 140 719 14894 2 36942
1997-98 21387 140 719 15238 2 37486
1998-99 21447 140 719 15458 2 37766
DISTRICT (1998-99)
l. Ajmer 1631 4 30 423 2088
2. Al war 697 JO 23 812 1542
3. Banswara 330 2 6 610 948
4. Barmer 260 24 602 886
5. Bharatpur 468 7 18 550 1043
6. Bhilwara 649 2 10 707 1368
7. Bikaner 1373 10 12 364 1759
8. Bundi 240 4 7 240 491
9. Chittorgarh 420 14 662 1096
10. Churn 673 12 44 462 1191
11. Dholpur 150 12 242 404
12. Dungarpur 170 -. 515 685
13. Ganganagar 410 12 IO 444 876
14. Jaipur 4463 22 137 776 5398
15. Jaisalmer 160 6 164 330
16. Jal ore 170 4 563 737
17. Jhalawar 380 8 330 718
18. Jhunjhunu 480 10 83 522 2 1097
19. Jodhpur 2368 9 14 650 3041
20. Ko ta 883 7 8 276 1174
21 Nagaur 575 9 42 744 1370
22. Pali 642 60 574 1276
23. Sawai Madhopur 350 2 18 564 934
24. Sikar 630 70 594 1294
25. Sirohi 250 2 257 509
26. Tonk 330 12 7 368 717
27. Udaipur 1495 6 948 2449
28. Baran 290 320 610
29. Dausa 180 18 288 486
30. Rajsarnand 100 525 625
. 31. Hanurnangarh 230 32 362 624
Source : Directorate of Medical and Health Services, Rajasthan
(9) FAMILY WELFARE
This Section contains tables on progress of family welfare. Couples currently and
effectively protected under welfare methods and family welfare Centres and Sub-centres.
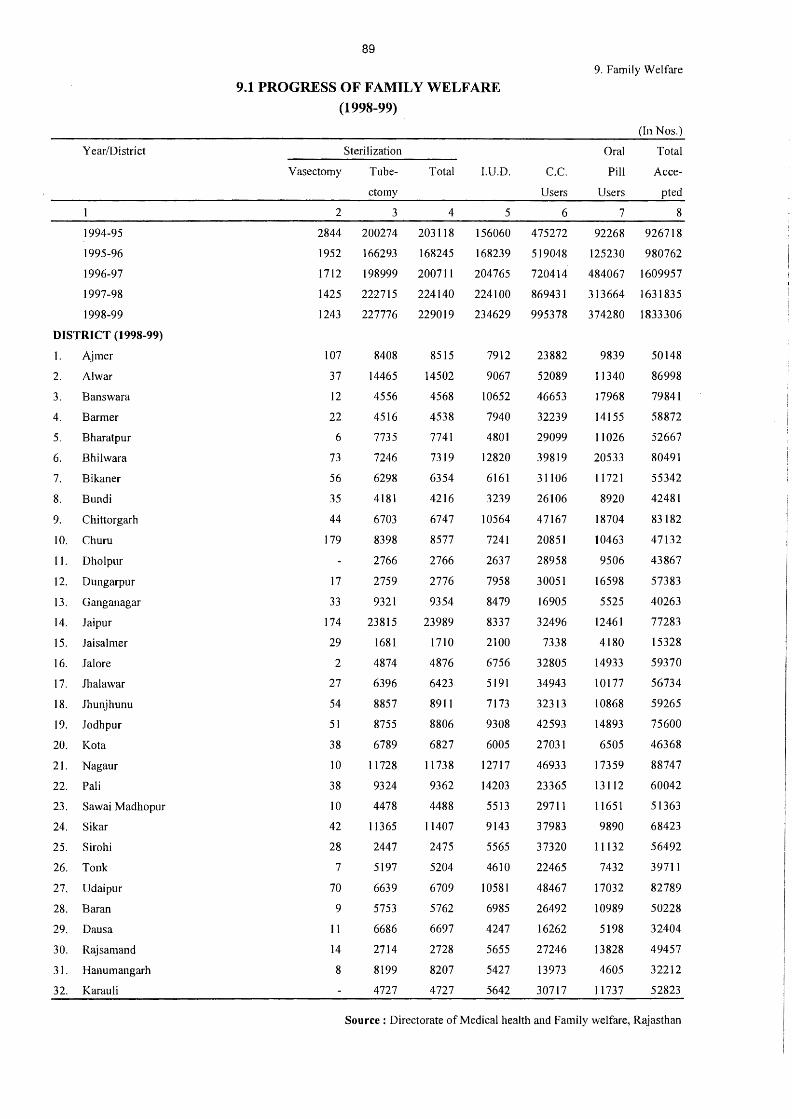
Year/District
1994-95
1995-96
1996-97
1997-98
1998-99
DISTRICT (1998-99)
l. Ajmer
2. Al war
3. Banswara
4. Barmer
5. Bharatpur
6. Bhilwara
7. Bikaner
8. Bundi
9. Chittorgarh
10. Chum
11. Dholpur
12. Dungarpur
13. Ganganagar
14. Jaipur
15. Jaisalmer
16. Jalore
17. Jhalawar
18. Jhunjhunu
19. Jodhpur
20. Kota
21. Nagaur
22. Pali
23. Sawai Madhopur
24. Sikar
25. Sirohi
26. Tonk
27. Udaipur
28. Baran
29. Dausa
30. Rajsamand
31. Hanumangarh
32. Karauli
89
9.1 PROGRESS OF FAMILY WELFARE
(1998-99)
Sterilization
Vasectomy Tube- Total I.U.D.
ctomy
2 3 4 5
c.c. Users
6
2844 200274 203118 156060 475272
1952 166293 168245 168239 519048
1712 198999 200711 204765 720414
1425 222715 224140 224100 869431
1243 227776 229019 234629 995378
107
37
12
22
6
73
56
35
44
179
17
33
174
29
2
27
54
51
38
10
38
IO
42
28
7
70
9
11
14
8
8408
14465
4556
4516
7735
7246
6298
4181
6703
8398
2766
2759
9321
23815
1681
4874
6396
8857
8755
6789
11728
9324
4478
11365
2447
5197
6639
5753
6686
2714
8199
4727
8515
14502
4568
4538
7741
7319
6354
4216
6747
8577
2766
2776
9354
23989
1710
4876
6423
8911
8806
6827
11738
9362
4488
11407
2475
5204
6709
5762
6697
2728
8207
4727
7912
9067
10652
7940
4801
12820
6161
3239
10564
7241
2637
7958
8479
8337
2100
6756
5191
7173
9308
6005
12717
14203
5513
9143
5565
4610
10581
6985
4247
5655
5427
5642
23882
52089
46653
32239
29099
39819
31106
26106
47167
20851
28958
30051
16905
32496
7338
32805
34943
32313
42593
27031
46933
23365
29711
37983
37320
22465
48467
26492
16262
27246
13973
30717
9. Family Welfare
Oral
Pill
Users
7
(In Nos.)
Total
Acce
pted
8
92268 926718
125230 980762
484067 1609957
313664 I 631835
374280 1833306
9839
11340
17968
14155
11026
20533
11721
8920
18704
10463
9506
16598
5525
12461
4180
14933
10177
10868
14893
6505
17359
13112
11651
9890
11132
7432
17032
10989
5198
13828
4605
11737
50148
86998
79841
58872
52667
80491
55342
42481
83182
47132
43867
57383
40263
77283
15328
59370
56734
59265
75600
46368
88747
60042
51363
68423
56492
39711
82789
50228
32404
49457
32212
52823
Source : Directorate of Medical health and Family welfare, Rajasthan
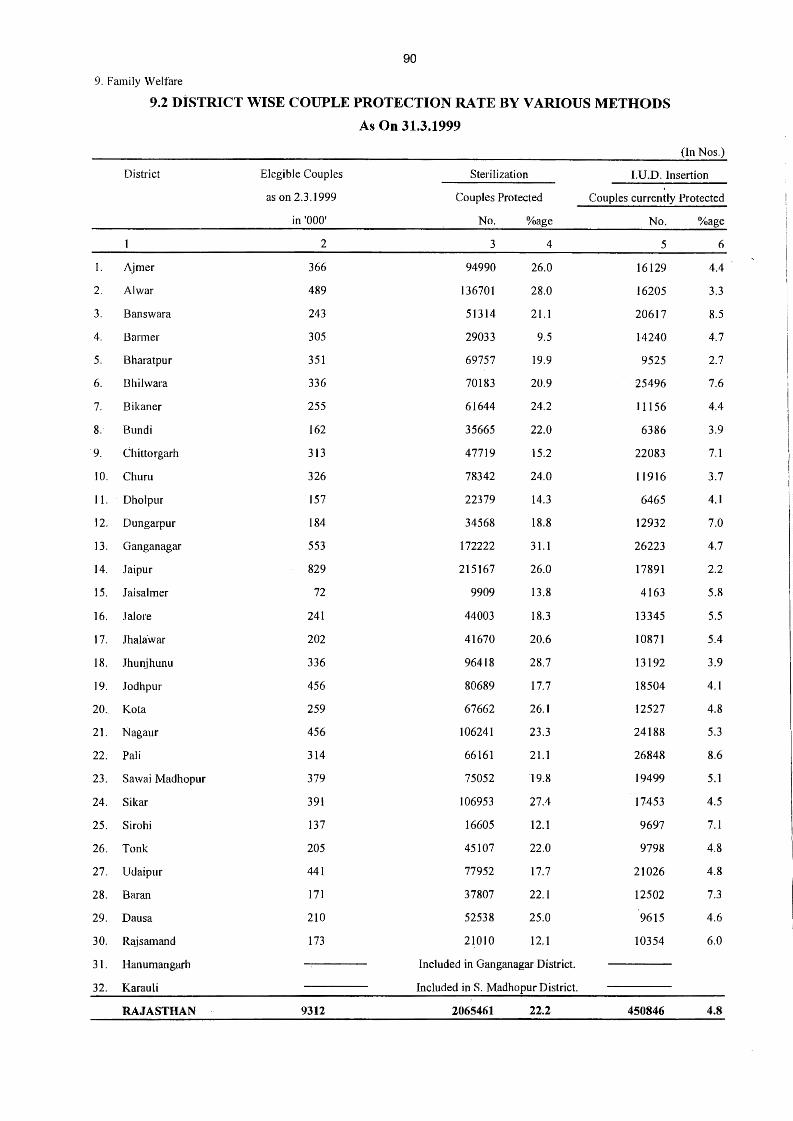
90
9. Family Welfare
9.2 DiSTRICT WISE COUPLE PROTECTION RATE BY VARIOUS METHODS
As On 31.3.1999
(In Nos.)
District Elegible Couples Sterilization I.U.D. Insertion
as on 2.3.1999 Couples Protected Couples currently Protected
in '000' No. %age No. %age
2 3 4 5 6
I. Ajmer 366 94990 26.0 16129 4.4
2. Al war 489 136701 28.0 16205 3.3
3. Banswara 243 51314 21.1 20617 8.5
4. Barmer 305 29033 9.5 14240 4.7
5. Bharatpur 351 69757 19.9 9525 2.7
6. Bhilwara 336 70183 20.9 25496 7.6
7. Bikaner 255 61644 24.2 11156 4.4
8. Bundi 162 35665 22.0 6386 3.9
·9. Chittorgarh 313 47719 15.2 22083 7.1
JO. Churn 326 78342 24.0 11916 3.7
11. Dholpur 157 22379 14.3 6465 4.1
12. Dungarpur 184 34568 18.8 12932 7.0
13. Ganganagar 553 172222 31.l 26223 4.7
14. Jaipur 829 215167 26.0 17891 2.2
15. Jaisalmer 72 9909 13.8 4163 5.8
16. Jal ore 241 44003 18.3 13345 5.5
17. Jhalawar 202 41670 20.6 10871 5.4
18. .Thunjhunu 336 96418 28.7 13192 3.9
19. Jodhpur 456 80689 17.7 18504 4.1
20. Ko ta 259 67662 26. l 12527 4.8
21. Nagaur 456 106241 23.3 24188 5.3
22. Pali 314 66161 21.l 26848 8.6
23. Sawai Madhopur 379 75052 19.8 19499 5.1
24. Sikar 391 106953 27.4 17453 4.5
25. Sirohi 137 16605 12.1 9697 7.1
26. Tonk 205 45107 22.0 9798 4.8
27. Udaipur 441 77952 17.7 21026 4.8
28. Baran 171 37807 22.l 12502 7.3
29. Dausa 210 52538 25.0 9615 4.6
30. Rajsamand 173 21010 12.1 10354 6.0
31. Hanumangarh Included in Ganganagar District.
32. Karau Ii Included in S. Madhopur District.
RAJASTHAN 9312 2065461 22.2 450846 4.8
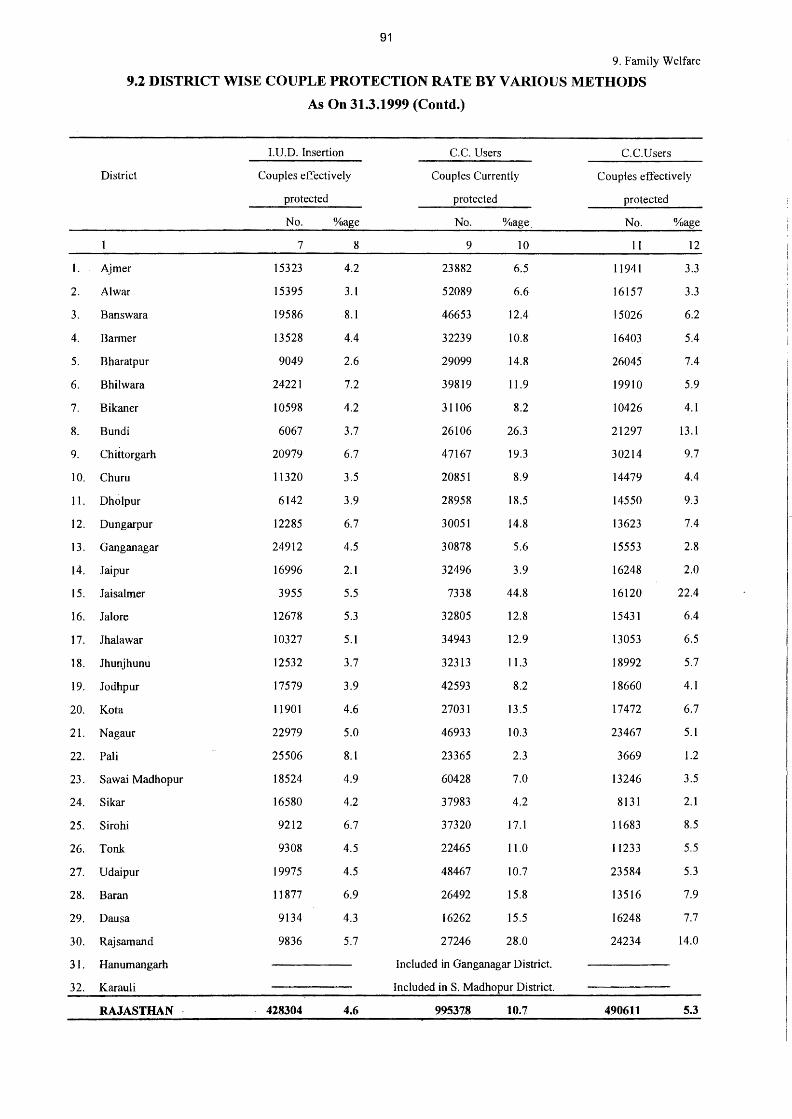
91
9. Family Welfare
9.2 DISTRICT WISE COUPLE PROTECTION RATE BY VARIOUS METHODS
District
I. Aimer
2. Al war
3. Banswara
4. Barmer
5. Bharatpur
6. Bhilwara
7. Bikaner
8. Bundi
9. Chittorgarh
10. Churn
11. Dholpur
12. Dungarpur
13. Ganganagar
14. Jaipur
15. Jaisalmer
16. Jalore
17. Jhalawar
18. Jhunjhunu
19. Jodhpur
20. Kota
21. Nagaur
22. Pali
23. SawaiMadhopur
24. Sikar
25. Sirohi
26. Tonk
27. Udaipur
28. Baran
29. Dausa
30. Rajsamand
31. Hanumangarh
32. Karauli
RAJASTHAN
As On 31.3.1999 (Contd.)
I.U.D. Insertion
Couples eEectively
protected
No.
7
15323
15395
19586
13528
9049
24221
10598
6067
20979
11320
6142
12285
24912
16996
3955
12678
10327
12532
17579
11901
22979
25506
18524
16580
9212
9308
19975
11877
9134
9836
428304
%age
8
4.2
3.1
8.1
4.4
2.6
7.2
4.2
3.7
6.7
3.5
3.9
6.7
4.5
2.1
5.5
5.3
5.1
3.7
3.9
4.6
5.0
8.1
4.9
4.2
6.7
4.5
4.5
6.9
4.3
5.7
4.6
C.C. Users
Couples Currently
protected
No.
9
23882
52089
46653
32239
29099
39819
31106
26106
47167
20851
28958
30051
30878
32496
7338
32805
34943
32313
42593
27031
46933
23365
60428
37983
37320
22465
48467
26492
16262
27246
%age
10
6.5
6.6
12.4
10.8
14.8
11.9
8.2
26.3
19.3
8.9
18.5
14.8
5.6
3.9
44.8
12.8
12.9
11.3
8.2
13.5
10.3
2.3
7.0
4.2
17.1
11.0
10.7
15.8
15.5
28.0
Included in Ganganagar District.
Included in S. Madhopur District.
995378 10.7
C.C.Users
Couples effectively
protected
No.
11
11941
16157
15026
16403
26045
19910
10426
21297
30214
14479
14550
13623
15553
16248
16120
15431
13053
18992
18660
17472
23467
3669
13246
8131
11683
11233
23584
13516
16248
24234
490611
%age
12
3.3
3.3
6.2
5.4
7.4
5.9
4.1
13.l
9.7
4.4
9.3
7.4
2.8
2.0
22.4
6.4
6.5
5.7
4.1
6.7
5.1
1.2
3.5
2.1
8.5
5.5
5.3
7.9
7.7
14.0
5.3
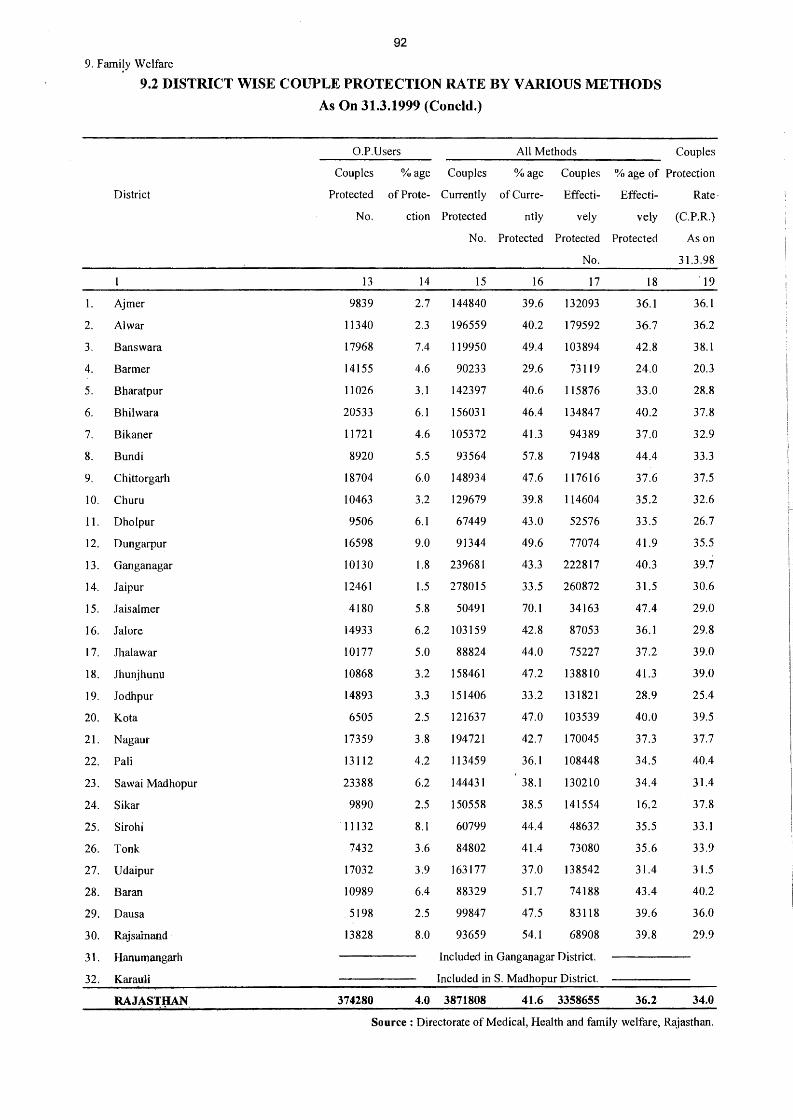
92
9. Farni!Y Welfare
9.2 DISTRICT WISE COUPLE PROTECTION RATE BY VARIOUS METHODS
As On 31.3.1999 (Concld.)
District
I. Ajmer
2. Al war
3. Banswara
4. Barmer
5. Bharatpur
6. Bhilwara
7. Bikaner
8. Bundi
9. Chittorgarh
10. Churu
11. Dholpur
12. Dungarpur
13. Ganganagar
14. Jaipur
15. .Taisalmer
16. Jalore
17. Jhalawar
18. Jhunjhunu
19. Jodhpur
20. Kota
21. Nagaur
22. Pali
23. Sawai Madhopur
24. Sikar
25. Sirohi
26. Tonk
27. Udaipur
28. Baran
29. Dausa
30. Rajsainand
3 l. Hanumangarh
32. Karauli
RAJAS'IJIAN.
O.P.Users All Methods Couples
Couples % age Couples % age Couples % age of Protection
Protected of Prote- Currently of Curre- Effecti- Effecti- Rate·
No.
13
9839
11340
17968
14155
11026
20533
11721
8920
18704
10463
9506
16598
10130
12461
4180
14933
10177
10868
14893
6505
17359
13112
23388
9890
11132
7432
17032
10989
5198
13828
374280
ction Protected ntly vely vely (C.P.R.)
No. Protected Protected Protected As on
No. 31.3.98
14 15 16 17
2.7 144840 39.6 132093
2.3 196559 40.2 179592
7.4 119950 49.4 103894
4.6 90233 29.6 73119
3.1 142397 40.6 115876
6.1 156031 46.4 134847
4.6 105372 41.3 94389
5.5 93564 57.8 71948
6.0 148934 47.6 117616
3.2 129679 39.8 114604
6.1 67449 43.0 52576
9.0 91344 49.6 77074
1.8 239681 43.3 222817
1.5 278015 33.5 260872
5.8 50491 70.l 34163
6.2 103159 42.8 87053
5.0 88824 44.0 75227
3.2 158461 47.2 138810
3.3 151406 33.2 131821
2.5 121637 47.0 103539
3.8 194721 42.7 170045
4.2 113459 36. l 108448
6.2 144431 38.1 130210
2.5 150558 38.5 141554
8.1 60799 44.4 4863?.
3.6 84802 41.4 73080
3.9 163177 37.0 138542
6.4 88329 51.7 74188
2.5 99847 47.5 83118
8.0 93659 54.1 68908
Included in Ganganagar District.
Included in S. Madhopur District.
4.0 3871808 41.6 3358655
18
36.l
36.7
42.8
24.0
33.0
40.2
37.0
44.4
37.6
35.2
33.5
41.9
40.3
31.5
47.4
36.1
37.2
41.3
28.9
40.0
37.3
34.5
34.4
16.2
35.5
35.6
31.4
43.4
39.6
39.8
36.2
19
36.1
36.2
38.1
20.3
28.8
37.8
32.9
33.3
37.5
32.6
26.7
35.5
39.7
30.6
29.0
29.8
39.0
39.0
25.4
39.5
37.7
40.4
31.4
37.8
33.1
33.9
31.5
40.2
36.0
29.9
34.0
Source : Directorate of Medical, Health and family welfare, Rajasthan.
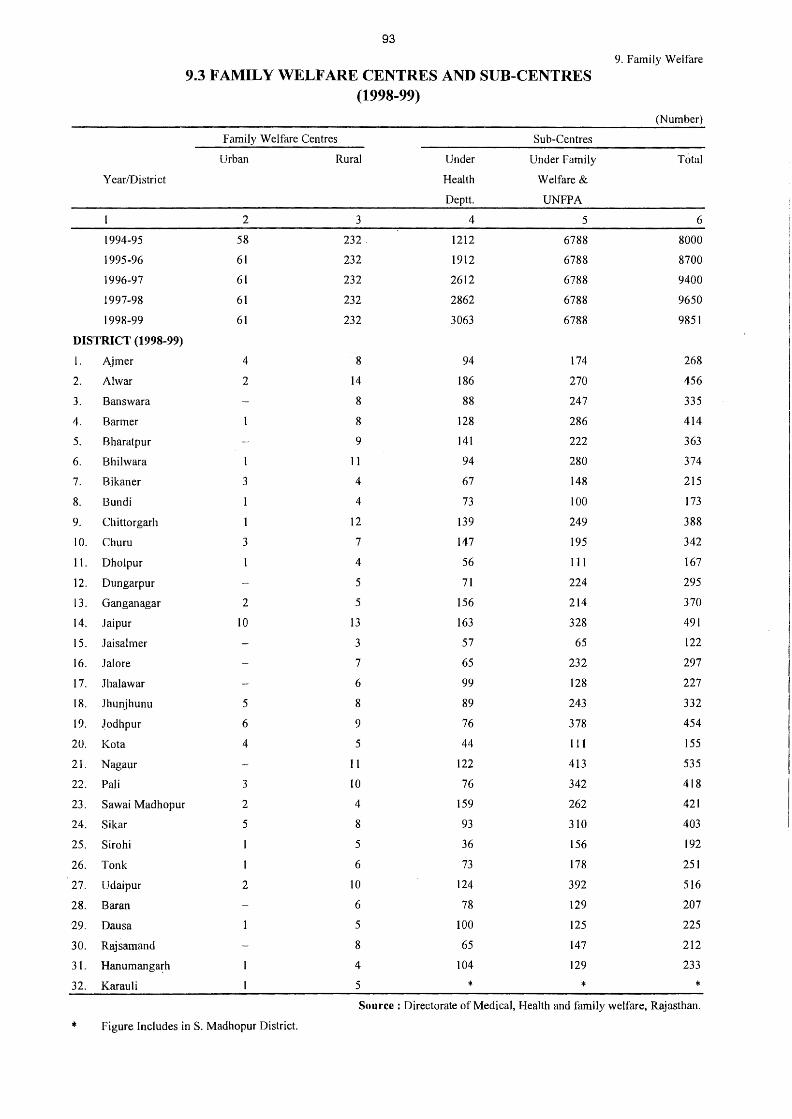
93
9. Family Welfare
9.3 FAMILY WELFARE CENTRES AND SUB-CENTRES (1998-99)
(Number)
Family Welfare Centres Sub-Centres
Urban Rural Under Under Family Total
Year/District Health Welfare &
Deptt. UNFPA
2 3 4 5 6
1994-95 58 232 1212 6788 8000
1995-96 61 232 1912 6788 8700
1996-97 61 232 2612 6788 9400
1997-98 61 232 2862 6788 9650
1998-99 61 232 3063 6788 9851
DISTRICT (1998-99)
I. Ajmer 4 8 94 174 268
2. Alwar 2 14 186 270 456
3. Banswara 8 88 247 335
4. Barmer 8 128 286 414
5. Bharatpur 9 141 222 363
6. Bhilwara 1 11 94 280 374
7. Bikaner 3 4 67 148 215
8. Bundi 4 73 100 173
9. Chittorgarh I 12 139 249 388
10. Churn 3 7 147 195 342
11. Dholpur 4 56 111 167
12. Dungarpur 5 71 224 295
13. Ganganagar 2 5 156 214 370
14. Jaipur 10 13 163 328 491
15. Jaisalmer 3 57 65 122
16. Jal ore 7 65 232 297
17. Jhalawar 6 99 128 227
18. Jhunjhunu 5 8 89 243 332
19. Jodhpur 6 9 76 378 454
20. Ko ta 4 5 44 111 155
21. Nagaur 11 122 413 535
22. Pali 3 10 76 342 418
23. Sawai Madhopur 2 4 159 262 421
24. Sikar 5 8 93 310 403
25. Sirohi 5 36 156 192
26. Tonk 6 73 178 251
27. Udaipur 2 10 124 392 516
28. Baran 6 78 129 207
29. Dausa 5 100 125 225
30. Rajsamand 8 65 147 212
31. Hanumanga~h 4 104 129 233
32. Karauli 5 * * * Source : Directorate of Medical, Health and family welfare, Rajasthan.
* Figure Includes in S. Madhopur District.
(10) SOCIAL WELFARE SERVICES
This section presents data relating to Number of hostels, scholars and handicapped
persons scheme controlled by the Social Welfare Department
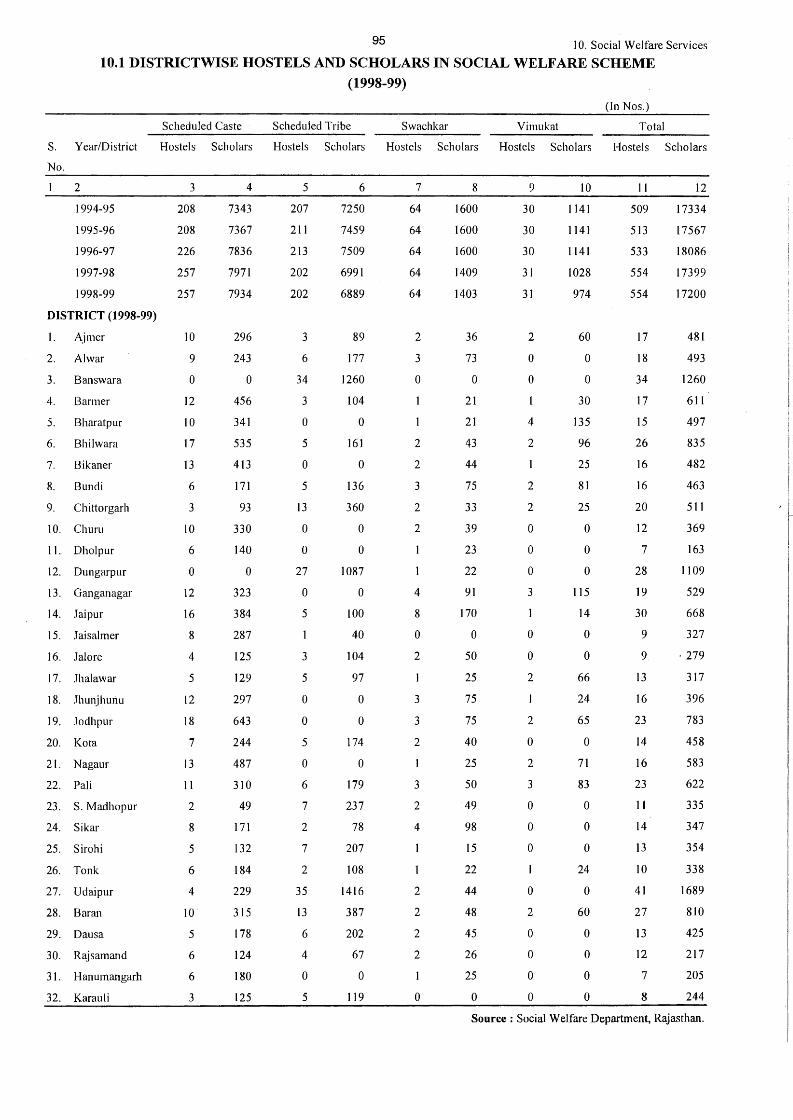
95 IO. Social Welfare Services
10.1 DISTRICTWISE HOSTELS AND SCHOLARS IN SOCIAL WELFARE SCHEME
(1998-99)
(In Nos.)
Scheduled Caste Scheduled Tribe Swachkar Vimukat Total
S. Year/District Hostels Scholars Hostels Scholars Hostels Scholars Hostels Scholars Hostels Scholars
No.
2 3
1994-95 208
1995-96 208
1996-97 226
1997-98 257
1998-99 257
DISTRICT (1998-99)
I. Ajmer I 0
2. Alwar 9
3. Banswara 0
4. Barmer 12
5. Bharatpur IO
6. Bhilwara 17
7. Bikaner 13
8. Bundi 6
9. Chittorgarh 3
IO. Churu 10
11. Dholpur 6
12. Dungarpur 0
l 3. Ganganagar 12
14. Jaipur 16
15. Jaisalmer 8
16. .Jalore 4
I 7. Jhalawar 5
18. Jhunjhunu 12
19. Jodhpur 18
20. Kota 7
21. Nagaur 13
22. Pali 11
23. S. Madhopur 2
24. Sikar 8
25. Sirohi 5
26. Tonk 6
27. Udaipur 4
28. Baran IO
29. Dausa 5
30. Rajsamand 6
31. Hanumangarh 6
32. Karauli 3
4
7343
7367
7836
7971
7934
296
243
0
456
341
535
413
171
93
330
140
0
323
384
287
125
129
297
643
244
487
310
49
171
132
184
229
315
178
124
180
125
5
207
211
213
202
202
3
6
34
3
0
5
0
5
13
0
0
27
0
5
3
5
0
0
5
0
6
7
2
7
2
35
13
6
4
0
5
6
7250
7459
7509
6991
6889
89
177
1260
I04
0
161
0
136
360
0
0
1087
0
100
40
104
97
0
0
174
0
179
237
78
207
I08
1416
387
202
67
0
119
7
64
64
64
64
64
2
3
0
2
2
3
2
2
4
8
0
2
3
3
2
3
2
4
2
2
2
2
0
8
1600
1600
1600
1409
1403
36
73
0
21
21
43
44
75
33
39
23
22
91
170
0
50
25
75
75
40
25
50
49
98
15
22
44
48
45
26
25
0
9
30
30
30
31
31
2
0
0
4
2
2
2
0
0
0
3
0
0
2
2
0
2
3
0
0
0
0
2
0
0
0
0
10
1141
1141
1141
1028
974
60
0
0
30
135
96
25
81
25
0
0
0
115
14
0
0
66
24
65
0
71
83
0
0
0
24
0
60
0
0
0
0
11
509
513
533
554
554
17
18
34
17
15
26
16
16
20
12
7
28
19
30
9
9
13
16
23
14
16
23
1 t
14
13
IO
41
27
13
12
7
8
12
17334
17567
18086
17399
17200
481
493
1260
611
497
835
482
463
511
369
163
1109
529
668
327
. 279
317
396
783
458
583
622
335
347
354
338
1689
810
425
217
205
244
Source: Social Welfare Department, Rajasthan.
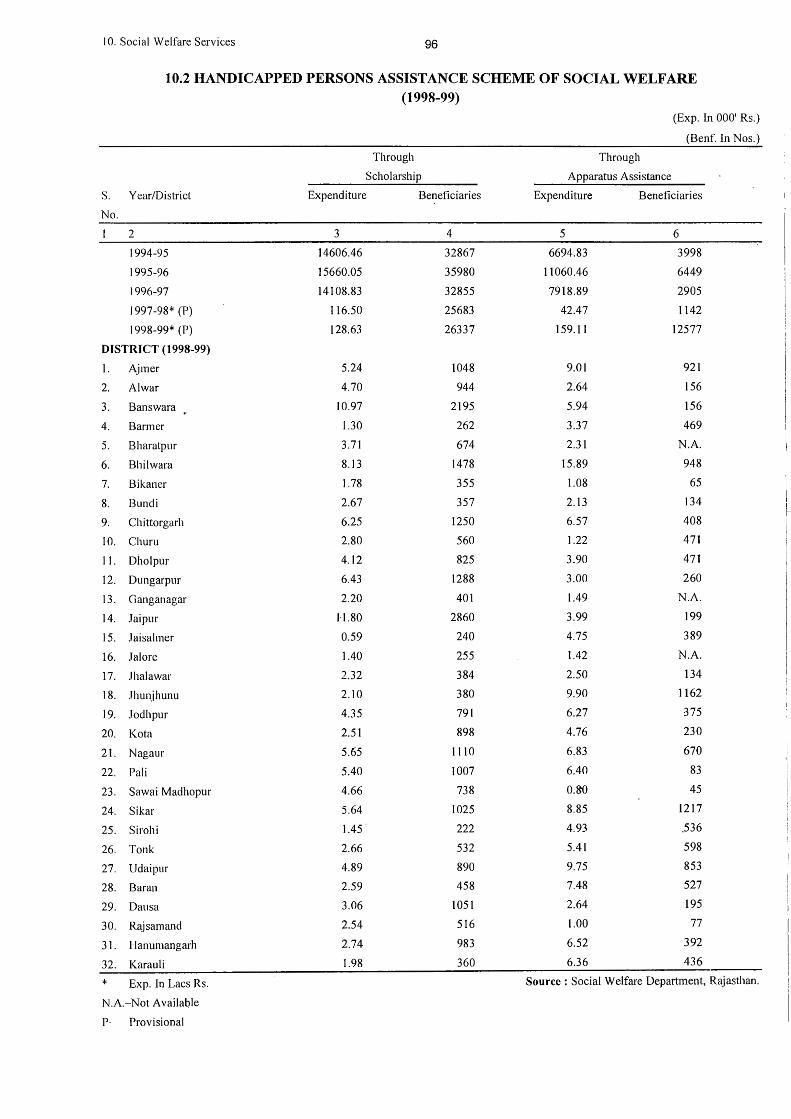
I 0. Social Welfare Services 96
10.2 HANDICAPPED PERSONS ASSISTANCE SCHEME OF SOCIAL WELFARE (1998-99)
(Exp. In 000' Rs.)
(Benf. In Nos.)
Through Through
Scholarship Apparatus Assistance
S. Year/District Expenditure Beneficiaries Expenditure Beneficiaries
No.
2 3 4 5 6
1994-95 14606.46 32867 6694.83 3998
1995-96 15660.05 35980 11060.46 6449
1996-97 14108.83 32855 7918.89 2905
1997-98* (P) 116.50 25683 42.47 1142
1998-99* (P) 128.63 26337 159.l l 12577
DISTRICT (1998-99)
I. Ajmer 5.24 1048 9.01 921
2. Al war 4.70 944 2.64 156
3. Banswara 10.97 2195 5.94 156
4. Barmer 1.30 262 3.37 469
5. Bharatpur 3.71 674 2.31 N.A.
6. Bhilwara 8.13 1478 15.89 948
7. Bikaner 1.78 355 1.08 65
8. Bundi 2.67 357 2.13 134
9. Chittorgarh 6.25 1250 6.57 408
10. Churn 2.80 560 1.22 471
11. Dholpur 4.12 825 3.90 471
12. Dungarpur 6.43 1288 3.00 260
13. Ganganagar 2.20 401 1.49 N.A.
14. Jaipur 1·1.80 2860 3.99 199
15. .Jaisalmer 0.59 240 4.75 389
16. Jal ore 1.40 255 1.42 N.A.
17. .Jhalawar 2.32 384 2.50 134
18. .Jhunjhunu 2.10 380 9.90 1162
19. .Jodhpur 4.35 791 6.27 375
20. Ko ta 2.51 898 4.76 230
21. Nagaur 5.65 1110 6.83 670
22. Pali 5.40 1007 6.40 83
23. Sawai Madhopur 4.66 738 0.80 45
24. Sikar 5.64 1025 8.85 1217
25. Sirohi 1.45. 222 4.93 .536
26. Tonk 2.66 532 5.41 598
27. Udaipur 4.89 890 9.75 853
28. Baran 2.59 458 7.48 527
29. Daus a 3.06 1051 2.64 195
30. Rajsamand 2.54 516 1.00 77
31. Hanumangarh 2.74 983 6.52 392
32. Karau Ii 1.98 360 6.36 436
* Exp. In Lacs Rs. Source: Social Welfare Department, Rajasthan.
N.A.-Not Available
P- Provisional
(11) SOCIAL SECURITY AND SOCIAL DEFENCE
This section presents data relating to crime cases, police, prisons and administration of
Civil & Criminal Justice. This data has been compiled from the returns furnished by the
departments concerned. The balance shown in table No. 11.9 and 11.10 may not tally with
the previous balance in the reference year, due to infrormation has not been received from
some of the Judicial courts in the Districts.
An attempt has also been made to depict districtwise Judicial set-up in the State.
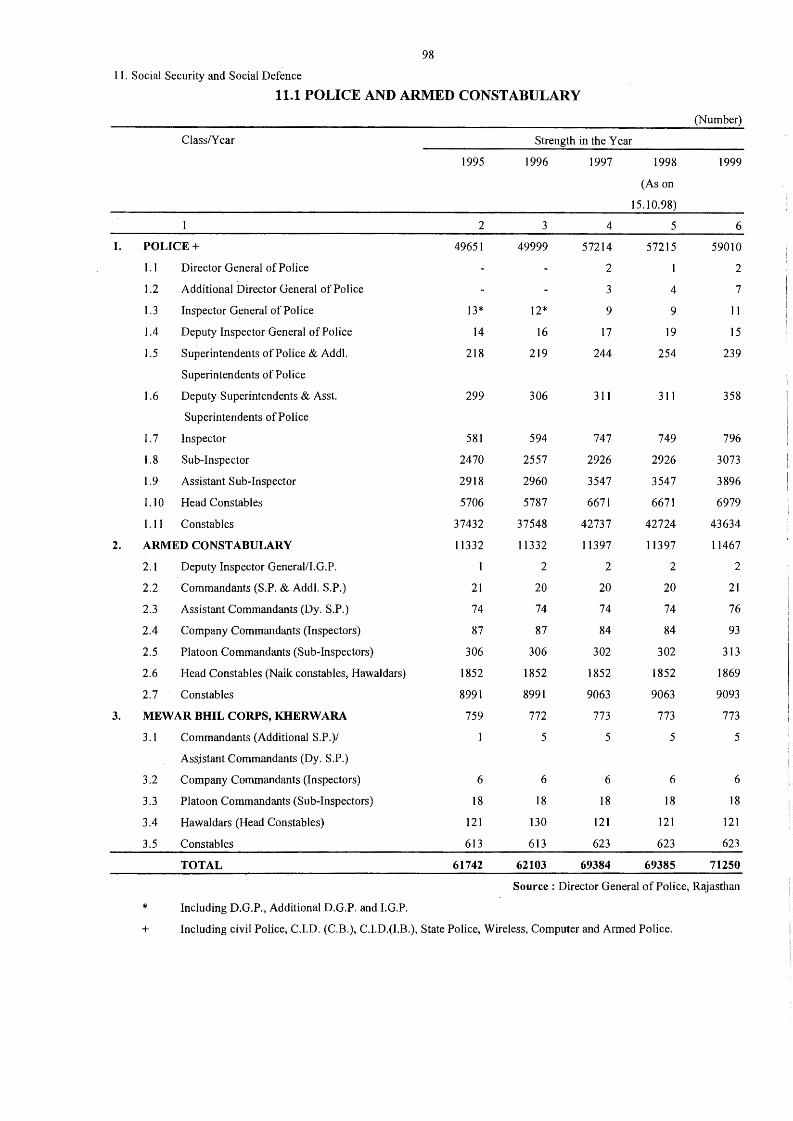
98
I I. Social Security and Social Defence
11.1 POLICE AND ARMED CONSTABULARY
(Number)
ClassNear Strength in the Year
1995 1996 1997 1998 1999
(As on
15.10.98)
2 3 4 5 6
l. POLICE+ 49651 49999 57214 57215 59010
1.1 Director General of Police 2 2
1.2 Additional Director General of Police 3 4 7
1.3 Inspector General of Police 13* 12* 9 9 11
1.4 Deputy Inspector General of Police 14 16 17 19 15
1.5 Superintendents of Police & Addi. 218 219 244 254 239
Superintendents of Police
1.6 Deputy Superintendents & Asst. 299 306 311 311 358
Superintendents of Police
1.7 Inspector 581 594 747 749 796
1.8 Sub-Inspector 2470 2557 2926 2926 3073
l.9 Assistant Sub-Inspector 2918 2960 3547 3547 3896
1.10 Head Constables 5706 5787 6671 6671 6979
l.l 1 Constables 37432 37548 42737 42724 43634
2. ARMED CONSTABULARY 11332 11332 11397 11397 11467
2. I Deputy Inspector General/I. G .P. 2 2 2 2
2.2 Commandants (S.P. & Addi. S.P.) 21 20 20 20 21
2.3 Assistant Commandants (Dy. S.P.) 74 74 74 74 76
.2.4 Company Commandants (Inspectors) 87 87 84 84 93
2.5 Platoon Commandants (Sub-Inspectors) 306 306 302 302 313
2.6 Head Constables (Naik constables, Hawaldars) 1852 1852 1852 1852 1869
2.7 Constables 8991 8991 9063 9063 9093
3. MEW AR BHIL CORPS, KHERW ARA 759 772 773 773 773
3.1 Commandants (Additional S.P.)/ 5 5 5 5
Ass,istant Commandants (Dy. S.P.)
3.2 Company Commandants (Inspectors) 6 6 6 6 6
3.3 Platoon Commandants (Sub-Inspectors) 18 18 18 18 18
3.4 Hawaldars (Head Constables) 121 130 121 121 121
3.5 Constables 613 613 623 623 623
TOTAL 61742 62103 69384 69385 71250
Source : Director General of Police, R~jasthan
* Including D.G.P., Additional D.G.P. and 1.G.P.
+ Including civil Police, C.I.D. (C.B.), C.l.D.(l.B.), State Police, Wireless, Computer and Armed Police.
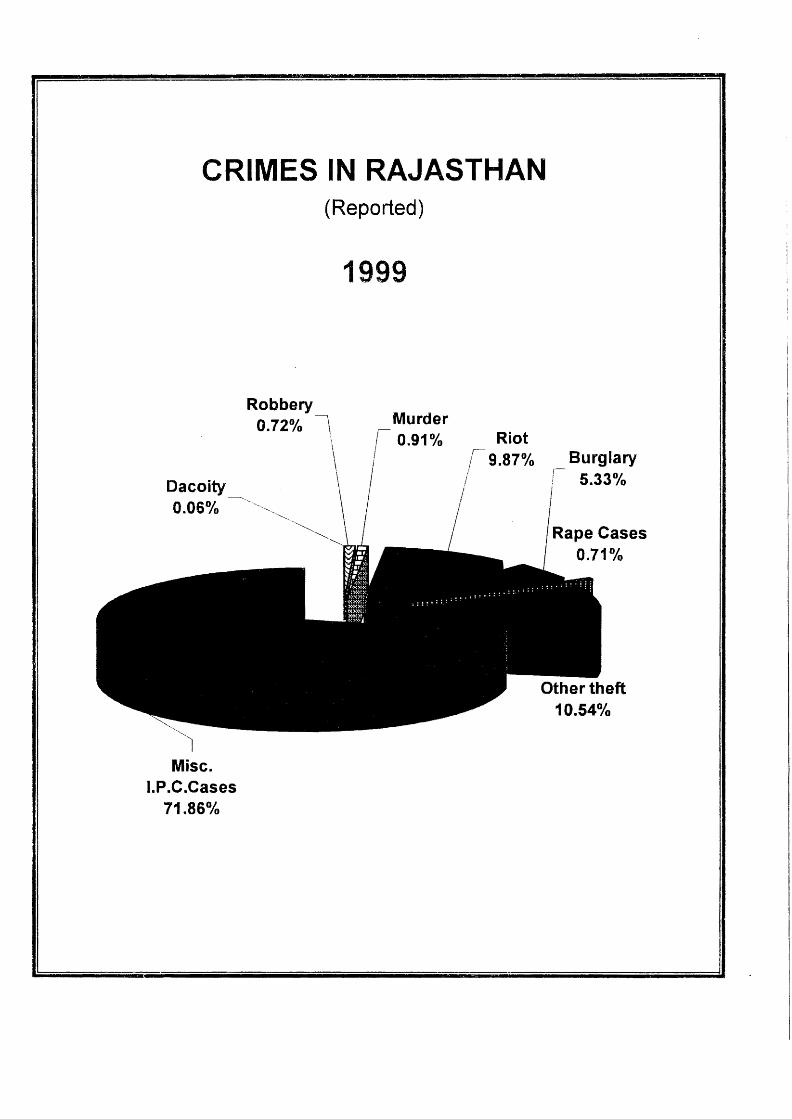
CRIMES IN RAJASTHAN (Reported)
Misc. l.P .C.Cases
71.86%
Robbery 0.72% l
\
1999
Murder
'r 0.91% Riot / 9.87% Burglary I 5.33%
Rape Cases 0.71%
10.54%
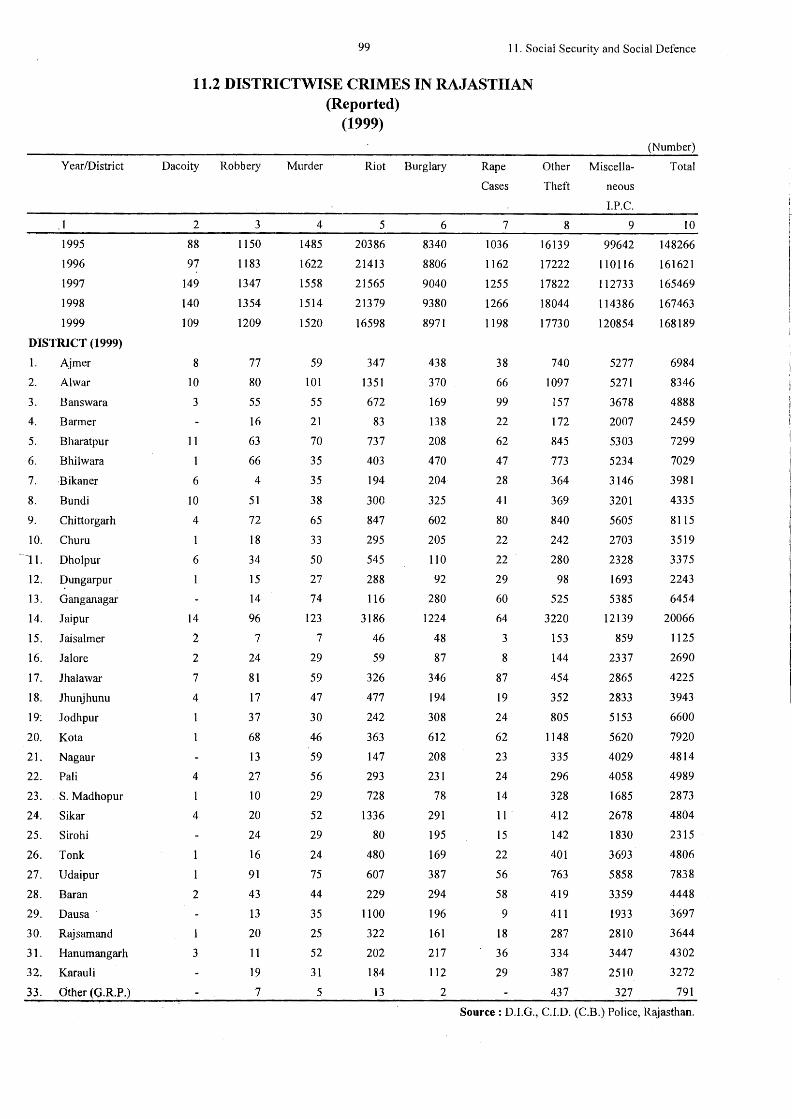
Year/District
. I
1995
1996
1997
1998
1999
DISTRICT (1999)
I. Ajmer
2. Al war
3. Banswara
4. Barmer
5. Bharatpur
6. Bhilwara
7. ·Bikaner
8. Bundi
9. Chittorgarh
IO. Churu
11. Dholpur
12. Dungarpur
13. Ganganagar
14. Jaipur
15. Jaisalmer
16. Jalore
17. Jhalawar
18. Jhunjhunu
19: Jodhpur
20. Kota
21. Nagaur
22. Pali
23. S. Madhopur
24. Sikar
25. Sirohi
26. Tonk
27. Udaipur
28. Baran
29. Dausa
30. Rajsamand
31. Hanumangarh
32. Karauli
33. Other (G.R.P.)
99 11. Social Security and Social Defence
11.2 DISTRICTWISE CRIMES IN RAJASTHAN (Reported)
Dacoity
2
88
97
149
140
109
8
10
3
11
1
6
10
4
6
14
2
2
7
4
l
4
1
4
2
3
Robbery
3
1150
1183
1347
1354
1209
77
80
55
16
63
66
4
51
72
18
34
15
14
96
7
24
81
17
37
68
13
27
10
20
24
16
91
43
13
20
11
19
7
Murder
4
1485
1622
1558
1514
1520
59
101
55
21
70
35
35
38
65
33
50
27
74
123
7
29
59
47
30
46
59
56
29
52
29
24
75
44
35
25
52
31
5
(1999)
Riot Burglary
5 6
20386 8340
21413 8806
21565 9040
21379 9380
16598 8971
347
1351
672
83
737
403
194
300
847
295
545
288
116
3186
46
59
326
477
242
363
147
293
728
1336
80
480
607
229
1100
322
202
184
13
438
370
169
138
208
470
204
325
602
205
llO
92
280
1224
48
87
346
194
308
612
208
231
78
291
195
169
387
294
196
161
217
112
2
Rape
Cases
7
1036
1162
1255
1266
1198
38
66
99
22
62
47
28
41
80
22
22
29
60
64
3
8
87
19
24
62
23
24
14 11 '
15
22
56
58
9
18
36
29
Other
Theft
8
16139
17222
17822
18044
17730
740
1097
157
172
845
773
364
369
840
242
280
98
525
3220
153
144
454
352
805
1148
335
296
328
412
142
401
763
419
411
287
334
387
437
Miscella-
neous
I.P.C.
9
99642
110116
112733
114386
120854
5277
5271
3678
2007
5303
5234
3146
3201
5605
2703
2328
1693
5385
12139
859
2337
2865
2833
5153
5620
4029
4058
1685
2678
1830
3693
5858
3359
1933
2810
3447
2510
327
(Number)
Total
IO
148266
161621
165469
167463
168189
6984
8346
4888
2459
7299
7029
3981
4335
8115
3519
3375
2243
6454
20066
1125
2690
4225
3943
6600
7920
4814
4989
2873
4804
2315
4806
7838
4448
3697
3644
4302
3272
791
Source: D.I.G., C.I.D. (C.B.) Police, Rajasthan.
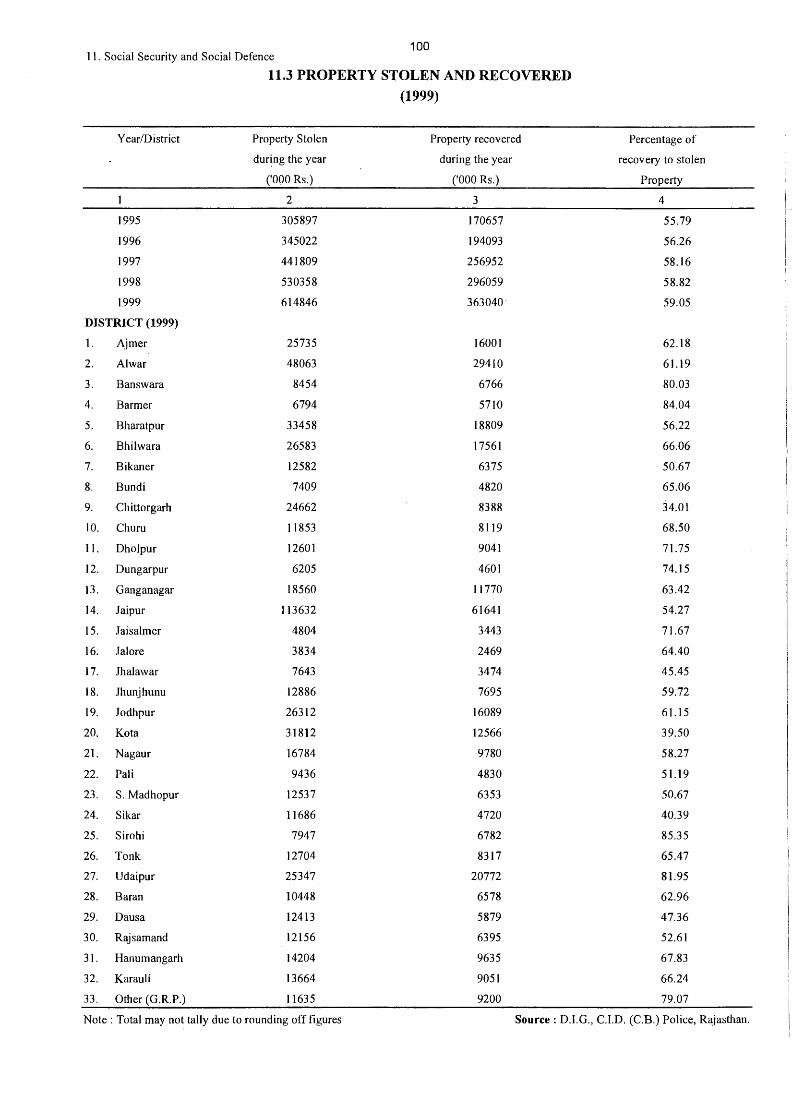
100 1 1. Social Security and Social Defence
11.3 PROPERTY STOLEN AND RECOVERED
(1999)
Year/District Property Stolen Property recovered Percentage of
dur~ng the year during the year recovery to stolen
('000 Rs.) ('000 Rs.) Property
2 3 4
1995 305897 170657 55.79
1996 345022 194093 56.26
1997 441809 256952 58.16
1998 530358 296059 58.82
I.999 614846 363040· 59.05
DISTRICT (1999)
1. Aimer 25735 16001 62.18
2. Al war 48063 29410 61.19
3. Banswara 8454 6766 80.03
4. Barmer 6794 57l0 84.04
5. Bharatpur 33458 18809 56.22
6. Bhilwara 26583 17561 66.06
7. Bikaner 12582 6375 50.67
8. Bundi 7409 4820 65.06
9. Chittorgarh 24662 8388 34.0l
IO. Churn I 1853 8119 68.50
11. Dholpur 12601 9041 71.75
12. Dungarpur 6205 4601 74.15
13. Ganganagar 18560 11770 63.42
14. Jaipur 113632 61641 54.27
15. Jaisalmer 4804 3443 71.67
16. Jal ore 3834 2469 64.40
17. Jhalawar 7643 3474 45.45
18. Jhunjhmm 12886 7695 59.72
19. Jodhpur 26312 16089 61.15
20. Ko ta 31812 12566 39.50
21. Nagaur 16784 9780 58.27
22. Pali 9436 4830 51.19
23. S. Madhopur 12537 6353 50.67
24. Sikar 11686 4720 40.39
25. Sirohi 7947 6782 85.35
26. Tonk 12704 8317 65.47
27. Udaipur 25347 20772 81.95
28. Baran 10448 6578 62.96
29. Daus a 12413 5879 47.36
30. Rajsamand 12156 6395 52.61
31. Hanumangarh 14204 9635 67.83
32. Karau Ii 13664 9051 66.24
33. Other (G.R.P.) 11635 9200 79.07
Note : Total may not tally due to rounding off figures Source: D.l.G., C.I.D. (C.B.) Police, Rajasthan.
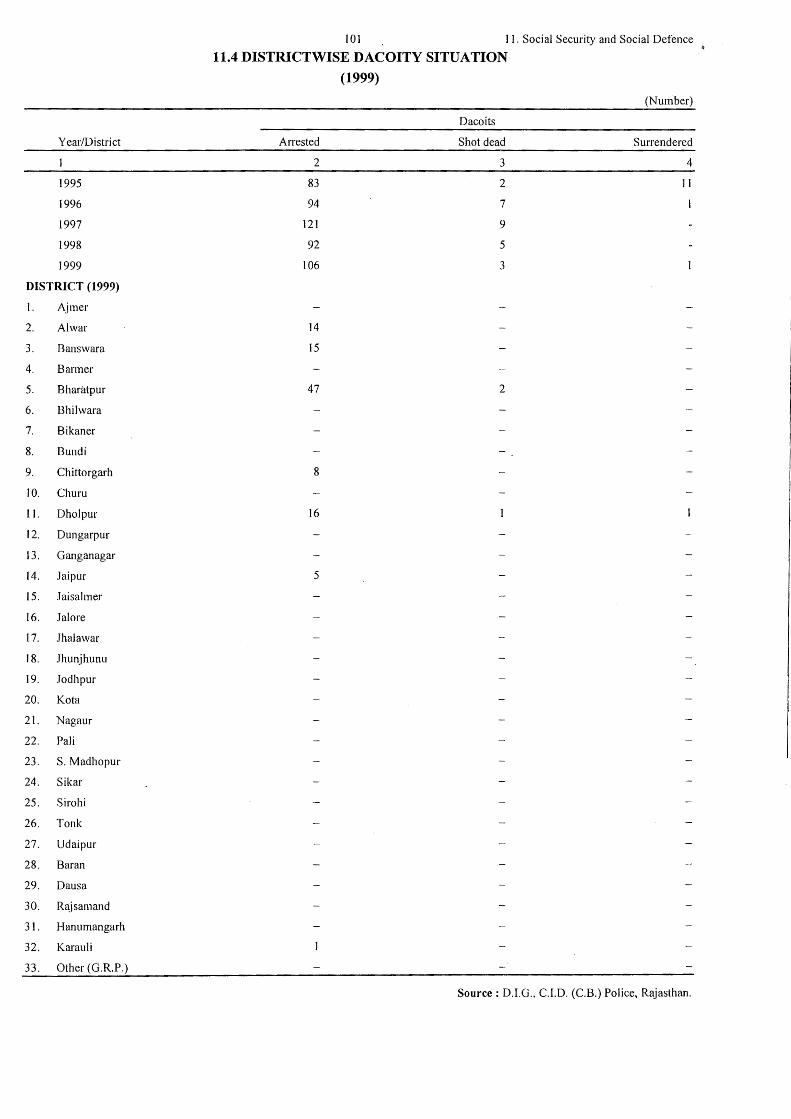
Year/District
1995
1996
1997
1998
1999
DISTRICT (1999)
l. Ajmer
2. Al war
3. Banswara
4. Barmer
5. Bharatpur
6. Bhilwara
7. Bikaner
8. Bundi
9. Chittorgarh
10. Churu
11. Dholpur
12. Dungarpur
13. Ganganagar
14. Jaipur
15. Jaisalmer
16. Jalore
17. Jhalawar
18. Jhunjhunu
19. .Todhpur
20. Ko ta
21. Nagaur
22. Pali
23. S. Madhopur
24. Sikar
25. Sirohi
26. Tonk
27. Udaipur
28. Baran
29. Daus a
30. Rajsamand
31. Hanumangarh
32. Karauli
33. Other (G.R.P.)
l 0 l 11. Social Security and Social Defence
11.4 DISTRICTWISE DACOITY SITUATION
Arrested
2
83
94
121
92
106
14
15
47
8
16
5
(1999)
(Number)
Dacoits
Shot dead Surrendered
3 4
2 11
7
9
5
3
2
Source: D.I.G., C.I.D. (C.B.) Police, Rajasthan.
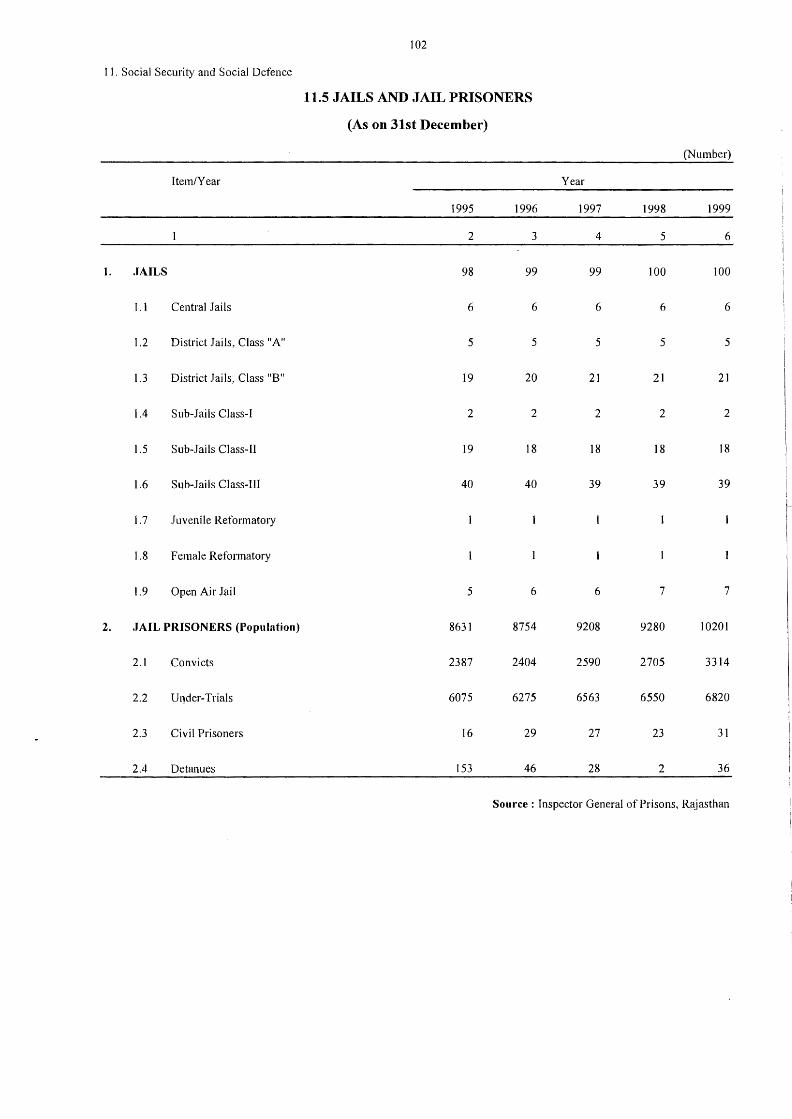
102
11. Social Security and Social Defence
11.5 JAILS AND JAIL PRISONERS
(As on 31st December)
(Number)
Item/Year Year
1995 1996 1997 1998 1999
2 3 4 5 6
l. JAILS 98 99 99 100 100
I.I Central Jails 6 6 6 6 6
1.2 District Jails, Class "A" 5 5 5 5 5
1.3 District Jails, Class "B" 19 20 21 21 21
1.4 Sub-Jails Class-I 2 2 2 2 2
1.5 Sub-Jails Class-II 19 18 18 18 18
l.6 Sub-Jails Class-III 40 40 39 39 39
l.7 Juvenile Reformatory
1.8 Female Reformatory
1.9 Open Air Jail 5 6 6 7 7
2. JAIL PRISONERS (Population) 8631 8754 9208 9280 10201
2.1 Convicts 2387 2404 2590 2705 3314
2.2 U qder-Trials 6075 6275 6563 6550 6820
2.3 Civil Prisoners 16 29 27 23 31
2.4 Detanues 153 46 28 2 36
Source: Inspector General of Prisons, Rajasthan
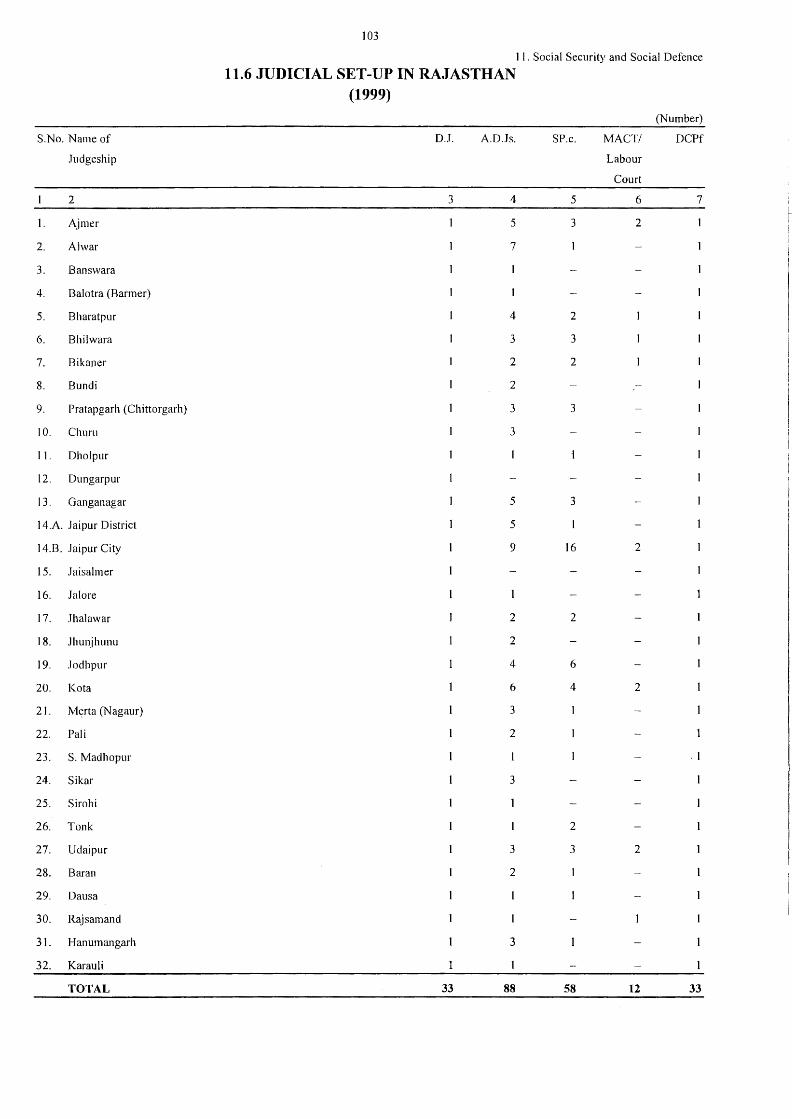
103
1 I . Social Security and Social Defence
11.6 JUDICIAL SET-UP IN RAJASTHAN (1999)
(Number)
S.No. Name of D.J. A.DJs. SP.c. MACT/ DC Pf
Judgeship Labour
Court
2 3 4 5 6 7
1. Ajmer 5 3 2
2. Al war 7
3. Banswara
4. Balotra (Barmer)
5. Bharatpur 4 2
6. Bhilwara 3 3
7. Bikaner 2 2
8. Bundi 2
9. Pratapgarh (Chittorgarh) 3 3
10. Churn 3
1 I. Dholpur
12. Dungarpur
13. Ganganagar 5 3
14.A. Jaipur District 5
14.B. Jaipur City 9 16 2
15. Jaisalmer
16. Jal ore
17. .Thal a war 2 2
18. Jhunjhunu 2
19. .lodhpur 4 6
20. Ko ta 6 4 2
21. Merta (Nagaur) 3
22. Pali 2
23. S. Madhopur . I
24. Sikar 3
25. Sirohi
26. Tonk 2
27. Udaipur 3 3 2
28. Baran 2
29. Dausa
30. Rajsamand
31. Hanumangarh 3
32. Karauli
TOTAL 33 88 58 12 33
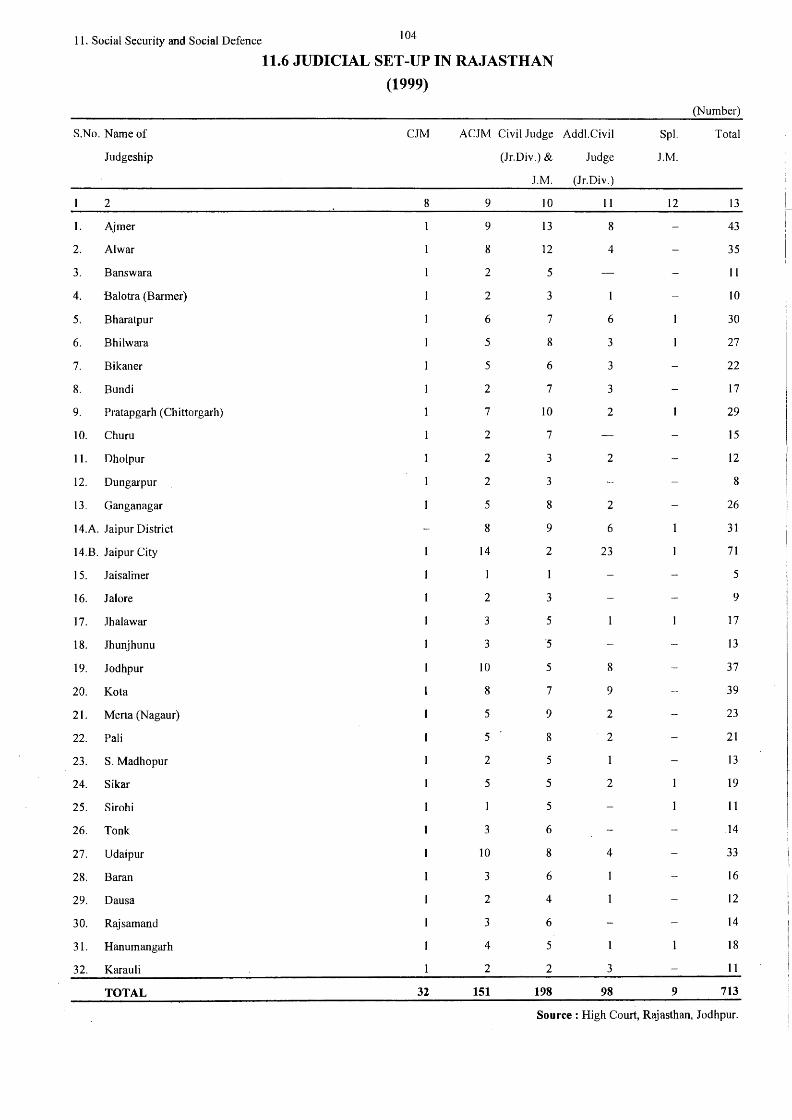
11. Social Security and Social Defence 104
11.6 JUDICIAL SET-UP IN RAJASTHAN
(1999)
(Number)
S.No. Name of CJM ACJM Civil Judge Addi.Civil Spl. Total
Judgeship (Jr.Div.) & Judge J.M.
J.M. (Jr.Div.)
2 8 9 10 11 12 13
1. Ajmer 9 13 8 43
2. Al war 8 12 4 35
3. Banswara 2 5 11
4. Balotra (Barmer) 2 3 10
5. Bharatpur 6 7 6 30
6. Bhilwara 5 8 3 27
7. Bikaner 5 6 3 22
8. Bundi 2 7 3 17
9. Pratapgarh (Chittorgarh) 7 IO 2 29
IO. Churu 2 7 15
11. Dholpur 2 3 2 12
12. Dungarpur 2 3 8
13. Ganganagar 5 8 2 26
14.A. Jaipur District 8 9 6 31
14.B. Jaipur City 14 2 23 71
15. Jaisaliner 5
16. Jal ore 2 3 9
17. .lhalawar 3 5 17
18. Jhunjhunu 3 j 13
19. Jodhpur IO 5 8 37
20. Ko ta 8 7 9 39
21. Merta (Nagaur) 5 9 2 23
22. Pali 5 8 2 21
23. S.Madhopur 2 5 13
24. Sikar 5 5 2 19
25. Sirohi 5 11
26. Tonk 3 6 .14
27. Udaipur 10 8 4 33
28. Baran 3 6 16
29. Dausa 2 4 12
30. Rajsamand 3 6 14
31. Hanumangarh 4 5 18
32. Karauli 2 2 3 11
TOTAL 32 151 198 98 9 713
Source : High Court, Rajasthan, Jodhpur.
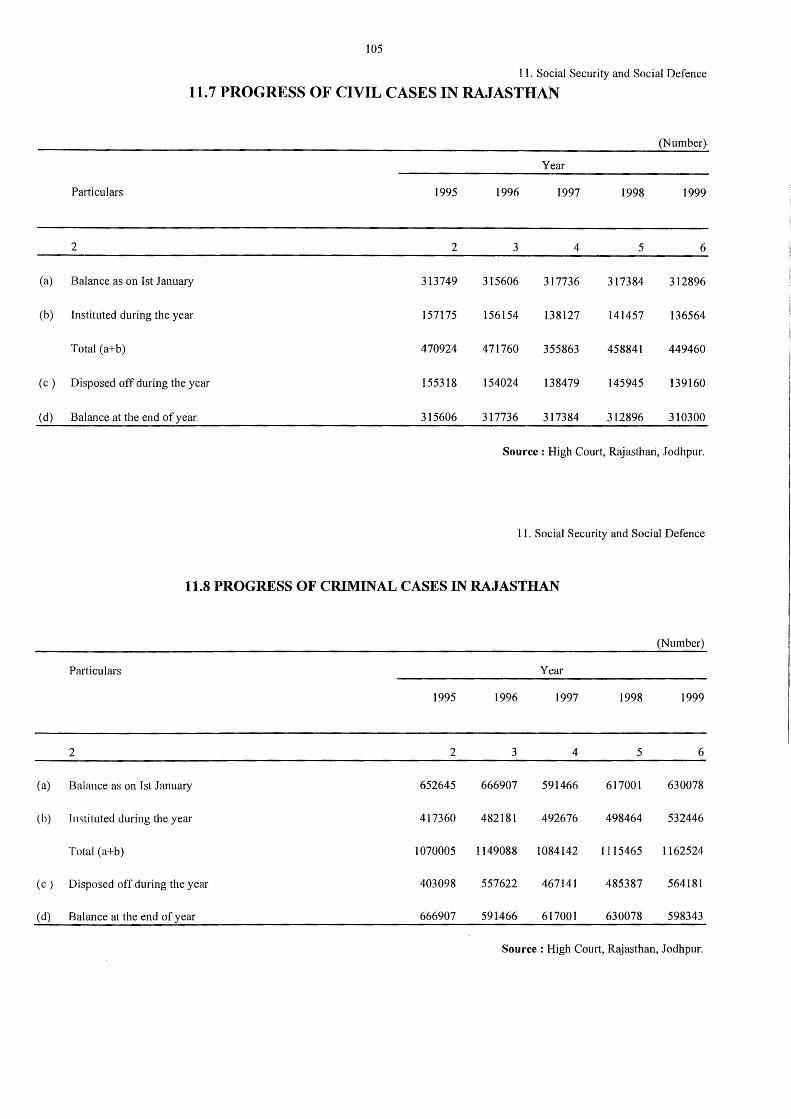
105
11. Social Security and Social Defence
11.7 PROGRESS OF CIVIL CASES IN RAJASTHAN
(Number}
Year
Particulars 1995 1996 1997 1998 1999
2 2 3 4 5 6
(a) Balance as on Ist January 313749 315606 317736 317384 312896
(b) Instituted during the year 157175 156154 138127 141457 136564
Total (a+b) 470924 471760 355863 458841 449460
(c) Disposed off during the year 155318 154024 138479 145945 139160
(d) Balance at the end of year 315606 317736 317384 312896 310300
Source : High Court, Rajasthari, Jodhpur.
11. Social Security and Social Defence
11.8 PROGRESS OF CRIMINAL CASES IN RAJASTHAN
(Number)
Particulars Year
1995 1996 1997 1998 1999
2 2 3 4 5 6
(a) Balance as on 1st January 652645 666907 591466 617001 630078
(b) Instituted during the year 417360 482181 492676 498464 532446
Total (a+b) 1070005 1149088 1084142 1115465 1162524
(c) Disposed off during the year 403098 557622 467141 485387 564181
(d) Balance at the end of year 666907 591466 617001 630078 598343
Source : High Court, Rajasthan, Jodhpur.
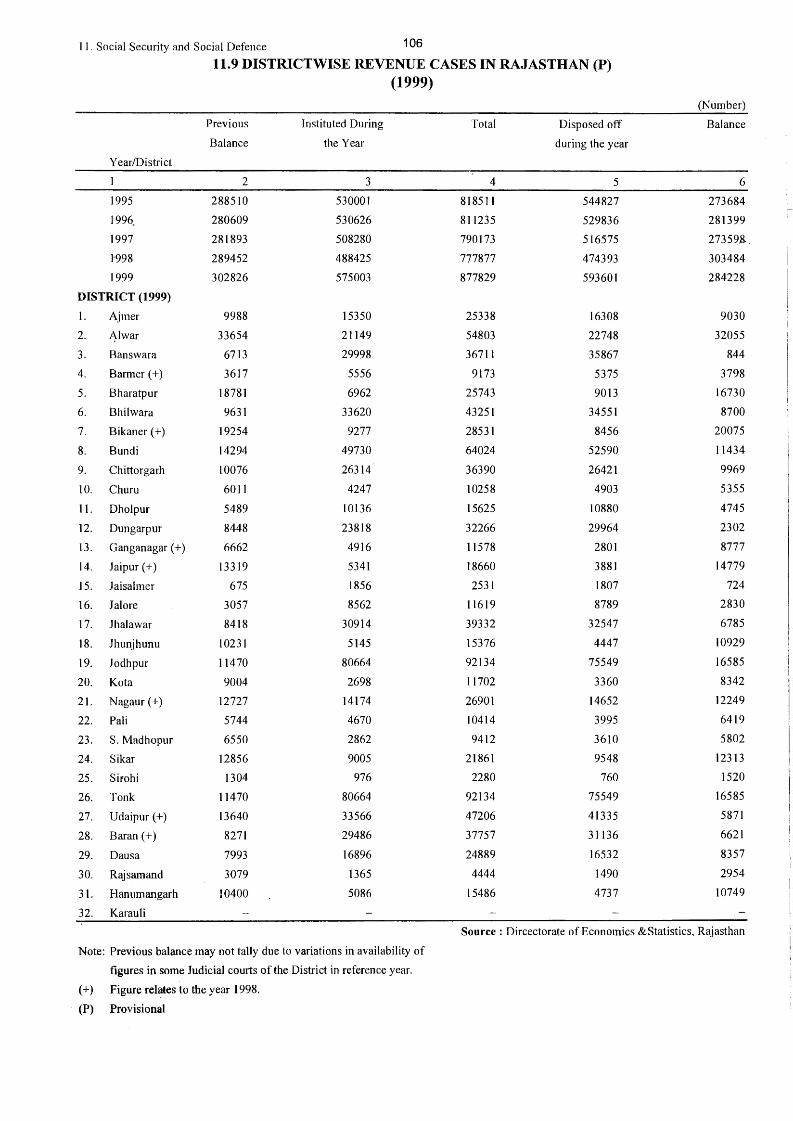
11. Social Security and Social Defence 106
11.9 DISTRICTWISE REVENUE CASES IN RAJASTHAN (P) (1999)
(Number)
Previous Instituted During Total Disposed off Balance
Balance the Year during the year
Year/District
2 3 4 5 6
1995 288510 530001 818511 544827 273684
1996. 280609 530626 811235 529836 281399
1997 281893 508280 790173 516575 2735915..
1"998 289452 488425 777877 474393 303484
1999 302826 575003 877829 593601 284228
DISTRICT (1999)
1. Ajmer 9988 15350 25338 16308 9030
2. ~!war 33654 21149 54803 22748 32055
3. Banswara 6713 29998 36711 35867 844
4. Barmer(+) 3617 5556 9173 5375 3798
5. Bharatpur 18781 6962 25743 9013 16730
6. Bhilwara 9631 33620 43251 34551 8700
7. Bikaner (+) 19254 9277 28531 8456 20075
8. Bundi 14294 49730 64024 52590 11434
9. Chittorgarh 10076 26314 36390 26421 9969
10. Churn 6011 4247 10258 4903 5355
11. Dholpur 5489 10136 15625 10880 4745
12. Dungarpur 8448 23818 32266 29964 2302
13. Ganganagar ( +) 6662 4916 11578 2801 8777
14. Jaipur(+) 13319 5341 18660 3881 14779
15. Jaisalmer 675 1856 2531 1807 724
16. Jal ore 3057 8562 11619 8789 2830
17. Jhalawar 8418 30914 39332 32547 6785
18. Jhunjhunu 10231 5145 15376 4447 10929
19. .Todhpur 11470 80664 92134 75549 16585
20. Ko ta 9004 2698 11702 3360 8342
21. Nagaur (+) 12727 14174 26901 14652 12249
22. Pali 5744 4670 10414 3995 6419
23. S. Madhopur 6550 2862 9412 3610 5802
24. Sikar 12856 9005 21861 9548 12313
25. Sirohi 1304 976 2280 760 1520
26. Tonk 11470 80664 92134 75549 16585
27. Udaipur (+) 13640 33566 47206 41335 5871
28. Baran(+) 8271 29486 37757 31136 6621
29. Dausa 7993 16896 24889 16532 8357
30. Rajsamand 3079 1365 4444 1490 2954
31. Hanumangarh 10400 5086 15486 4737 10749
32. Karau Ji
Source : Dircectorate of Economics &Statistics, Rajasthan
Note: Previous balance may not tal1y due to variations in availability of
figures in some Judicial courts of the District in reference year.
(+) Figure relates to the year 1998.
(P) Provisional
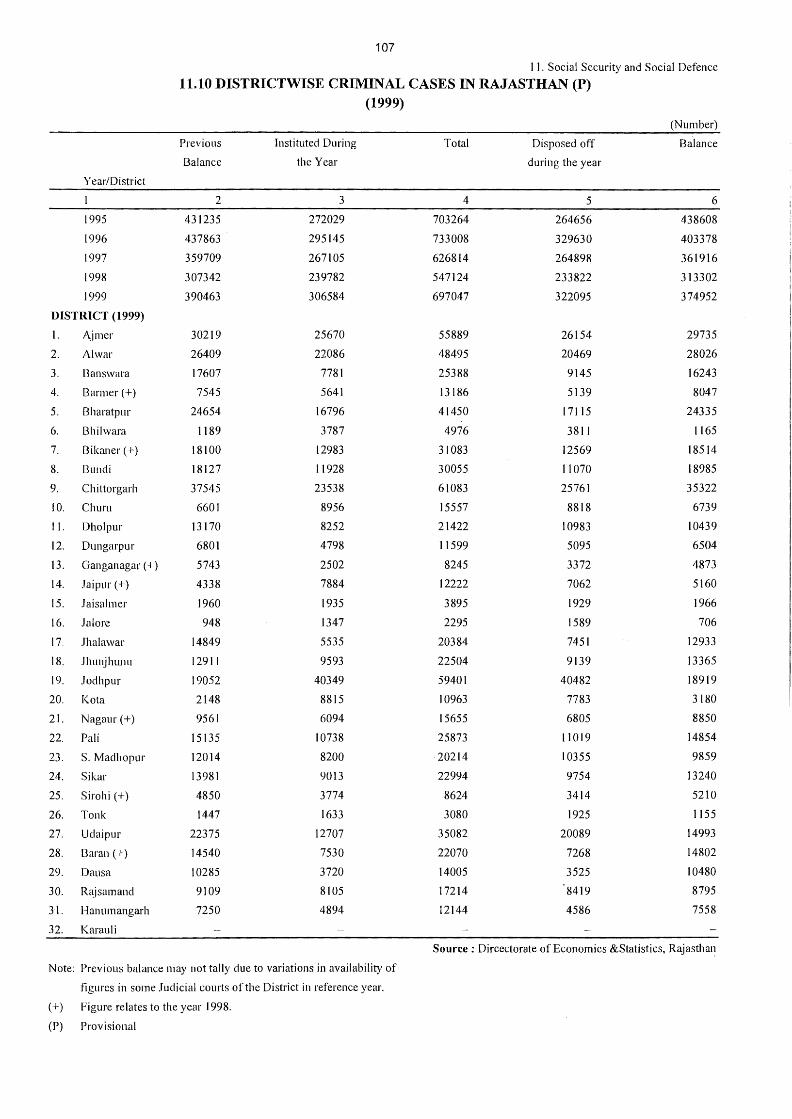
107
11. Social Security and Social Defence 11.10 DISTRICTWISE CRIMINAL CASES IN RAJASTHAN (P)
(1999)
(Number)
Previous Instituted During Total Disposed off Balance
Balance the Year during the year
Year/District
2 3 4 5 6
1995 431235 272029 703264 264656 438608
1996 437863 295145 733008 329630 403378
1997 359709 267105 626814 264898 361916
1998 307342 239782 547124 233822 313302
1999 390463 306584 697047 322095 374952
DISTRICT (1999)
I. Ajmer 30219 25670 55889 26154 29735
2. Al war 26409 22086 48495 20469 28026
3. Banswara 17607 7781 25388 9145 16243
4. Barmer(+) 7545 5641 13186 5139 8047
5. Bharatpur 24654 16796 41450 17115 24335
6. Bhilwara 1189 3787 4976 3811 1165
7. Bikaner(+) 18100 12983 31083 12569 18514
8. Bundi 18127 11928 30055 11070 18985
9. Chittorgarh 37545 23538 61083 25761 35322
10. Churu 6601 8956 15557 8818 6739
I I. Dholpur 13170 8252 21422 10983 10439
12. Dungarpur 6801 4798 11599 5095 6504
13. Ganganagar ( +) 5743 2502 8245 3372 4873
14. Jaipur(+) 4338 7884 12222 7062 5160
15. Jaisalmer 1960 1935 3895 1929 1966
16. Jal ore 948 1347 2295 1589 706
17. Jhalawar 14849 5535 20384 7451 12933
18. .lhunjhunu 12911 9593 22504 9139 13365
19. Jodhpur 19052 40349 59401 40482 18919
20. Ko ta 2148 8815 10963 7783 3180
21. Nagaur (+) 9561 6094 15655 6805 8850
22. Pali 15135 10738 25873 11019 14854
23. S. Madhopur 12014 8200 ·20214 10355 9859
24. Sikar 13981 9013 22994 9754 13240
25. Sirohi (+) 4850 3774 8624 3414 5210
26. Tonk 1447 1633 3080 1925 1155
27. Udaipur 22375 12707 35082 20089 14993
28. Baran(+) 14540 7530 22070 7268 14802
29. Dausa 10285 3720 14005 3525 10480
30. Rajsamand 9109 8105 17214 8419 8795
31. Hanumangarh 7250 4894 12144 4586 7558
32. Karau Ii
Source: Dircectorate of Economics &Statistics, Rajasthar~
Note: Previous balance may not tally due to variations in availability of
figures in some Judicial courts of the District in reference year.
(+) Figure relates to the year 1998.
(P) Provisional
(12) STATE INCOME
This section deals with information pertaining to State Income by Industrial origin.
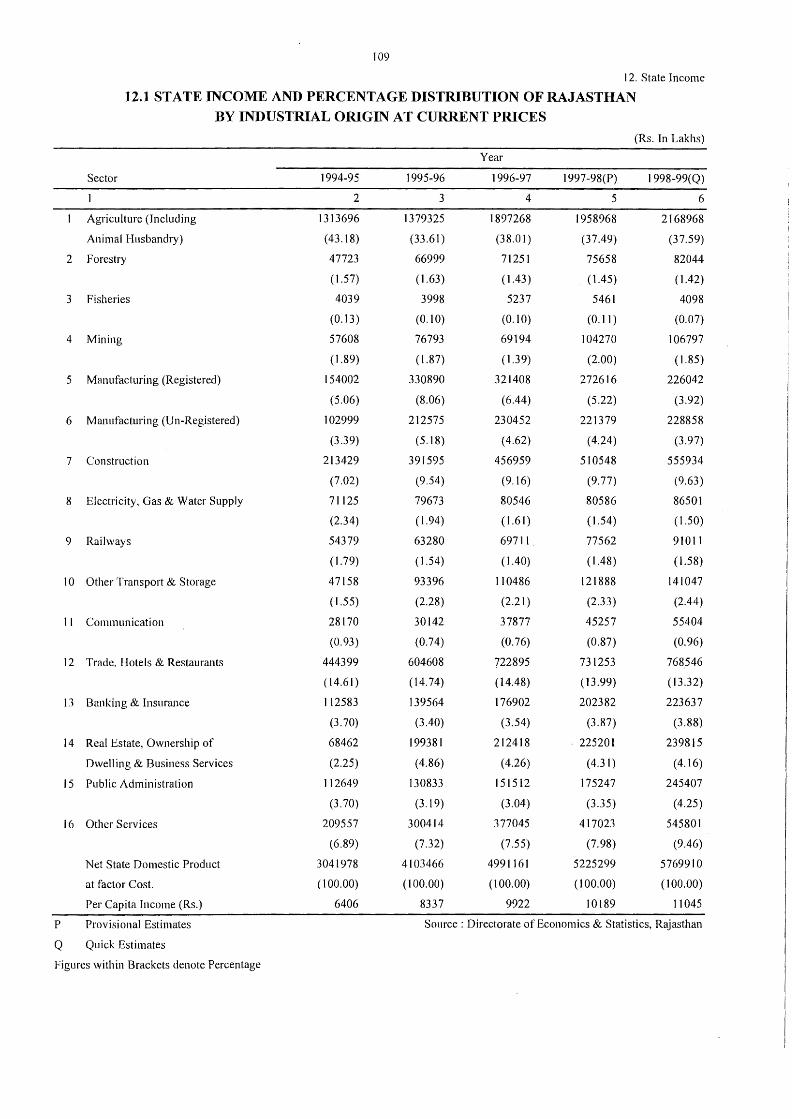
109
12. State Income
12.1 STATE INCOME AND PERCENTAGE DISTRIBUTION OF RAJASTHAN BY INDUSTRIAL ORIGIN AT CURRENT PRICES
(Rs. In Lakhs)
Year
Sector 1994-95 1995-96 1996-97 1997-98(P) I 998-99(Q)
2 3 4 5 6
Agriculture (Including 1313696 1379325 1897268 1958968 2168968
Animal Husbandry) (43.18) (33.61) (38.01) (37.49) (37.59)
2 Forestry 47723 66999 71251 75658 82044
(l .57) (1.63) (1.43) (1.45) ( l .42)
3 Fisheries 4039 3998 5237 5461 4098
(0.13) (0.10) (0.10) (0.11) (0.07)
4 Mining 57608 76793 69194 104270 106797
(1.89) (l .87) ( 1.39) (2.00) ( l.85)
5 Manufacturing (Registered) 154002 330890 321408 272616 226042
(5.06) (8.06) (6.44) (5.22) (3.92)
6 Manufacturing (Un-Registered) 102999 212575 230452 221379 228858
(3.39) (5.18) (4.62) (4.24) (3.97)
7 Construction 213429 391595 456959 510548 555934
(7.02) (9.54) (9.16) (9.77) (9.63)
8 Electricity, Gas & Water Supply 71125 79673 80546 80586 86501
(2.34) ( 1.94) ( 1.61) (l.54) (1.50)
9 Railways 54379 63280 69711 77562 91011
( 1.79) ( 1.54) ( 1.40) (1.48) ( l.58)
IO Other Transport & Storage 47158 93396 110486 121888 14l047
( 1.55) (2.28) (2.21) (2.33) (2.44)
11 Communication 28170 30142 37877 45257 55404
(0.93) (0.74) (0.76) (0.87) (0.96)
12 Trade. Hotels & Restaurants 444399 604608 722895 731253 768546
( 14.61) (14.74) (14.48) (13.99) (13.32)
13 Banking & Insurance 112583 139564 176902 202382 223637
(3.70) (3.40) (3.54) (3.87) (3.88)
14 Real Estate, Ownership of 68462 199381 212418 . 225201 239815
Dwelling & Business Services (2.25) (4.86) (4.26) (4.31) (4.16)
15 Public Administration 112649 130833 151512 175247 245407
(3. 70) (3.19) (3.04) (3.35) (4.25)
16 Other Services 209557 300414 377045 417023 545801
(6.89) (7.32) (7.55) (7.98) (9.46)
Net State Domestic Product 3041978 4103466 4991161 5225299 5769910
at factor Cost. ( 100.00) ( 100.00) (100.00) (100.00) (100.00)
Per Capita Income (Rs.) 6406 8337 9922 10189 11045
p Provisional Estimates Source : Directorate of Economics & Statistics, Rajasthan
Q Quick Estimates
Figures within Brackets denote Percentage
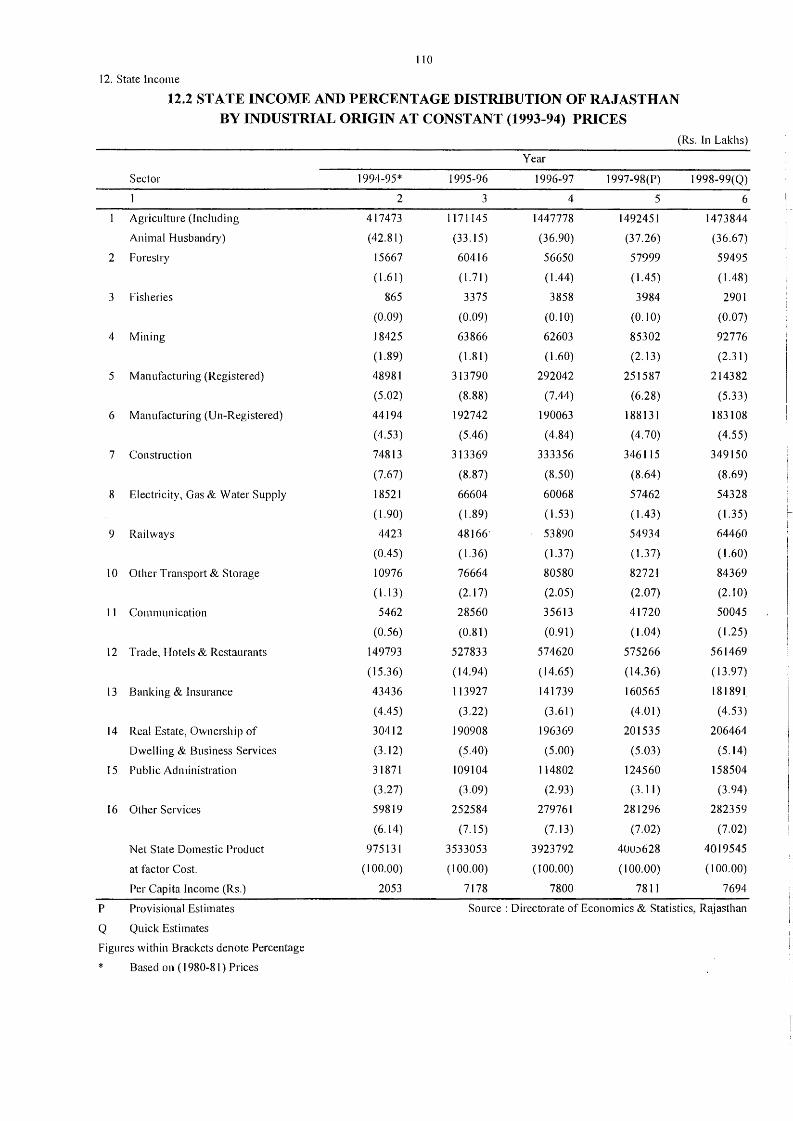
1 JO
12. State Income
12.2 STATE INCOME AND PERCENTAGE DISTRIBUTION OF RAJASTHAN BY INDUSTRIAL ORIGIN AT CONSTANT (1993-94) PRICES
(Rs. In Lakhs)
Year
Sector 1994-95* 1995-96 1996-97 1997-98(P) l 998-99{Q)
2 3 4 5 6
Agriculture (Including 417473 1171145 1447778 1492451 1473844
Animal Husbandry) (42.81) (33.15) (36.90) (37.26) (36.67)
2 Forestry 15667 60416 56650 57999 59495
( l.61) (1.71) (1.44) (1.45) ( 1.48)
3 Fisheries 865 3375 3858 3984 2901
(0.09) (0.09) (0.10) (0.10) (0.07)
4 Mining 18425 63866 62603 85302 92776
(1.89) (1.81) (l.60) (2.13) (2.31)
5 Manufacturing (Registered) 48981 313790 292042 251587 214382
(5.02) (8.88) (7.44) (6.28) (5.33)
6 Manufacturing (Un-Registered) 44194 192742 190063 188131 183108
(4.53) (5.46) ( 4.84) ( 4. 70) (4.55)
7 Construction 74813 313369 333356 346115 349150
(7.67) (8.87) (8.50) (8.64) (8.69)
8 Electricity, Gas & Water Supply 18521 66604 60068 57462 54328
(l.90) ( 1.89) (1.53) (1.43) (1.35)
9 Railways 4423 48166• 53890 54934 64460
(0.45) ( 1.36) (1.37) ( l.37) (1.60)
10 Other Transport & Storage 10976 76664 80580 82721 84369
(l.13) (2.17) (2.05) (2.07) (2.10)
1 I Communication 5462 28560 35613 41720 50045
(0.56) (0.81) (0.91) ( 1.04) (1.25)
12 Trade, Hotels & Restaurants 149793 527833 574620 575266 561469
(15.36) (14.94) ( 14.65) (14.36) ( 13.97)
13 Banking & Insurance 43436 113927 141739 160565 181891
(4.45) (3.22) (3.61) (4.01) (4.53)
14 Real Estate, Ownership of 30412 190908 196369 201535 206464
Dwelling & Business Services (3.12) (5.40) (5.00) (5.03) (5.14)
15 Public Administration 31871 109104 114802 124560 158504
(3.27) (3.09) (2.93) (3.11) (3.94)
16 Other Services 59819 252584 279761 281296 282359
(6.14) (7.15) (7.13) (7.02) (7.02)
Net State Domestic Product 975131 3533053 3923792 4lJU)628 4019545
at factor Cost. (100.00) (100.00) ( 100.00) ( 100.00) (100.00)
Per Capita Income (Rs.) 2053 7178 7800 7811 7694
p Provisional Estimates Source : Directorate of Economics & Statistics, Rajasthan
Q Quick Estimates
Figures within Brackets denote Percentage
* Based on ( 1980-81) Prices
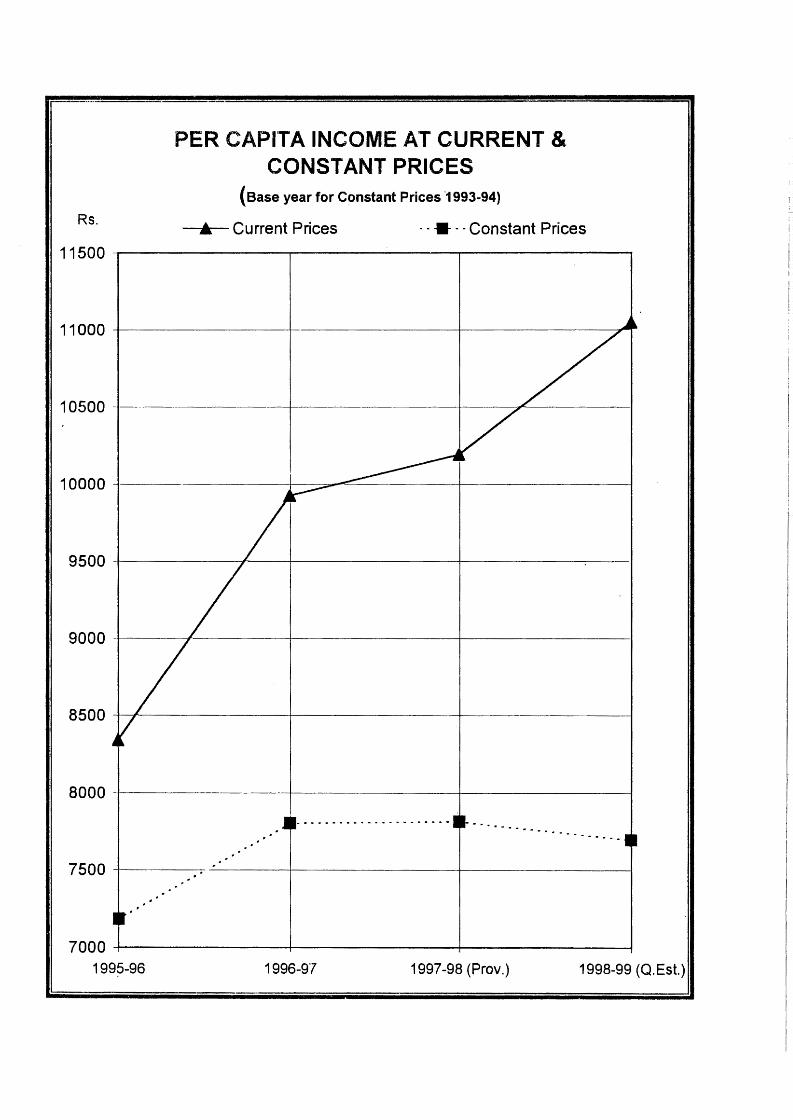
Rs.
PER CAPITA INCOME AT CURRENT & CONSTANT PRICES
{Base year for Constant Prices ·1993-94)
A Current Prices · · • · · Constant Prices
..... --. ... .. .. ... .. .. - ......
7500 -4--------'--- -------t-----------+--------1
7000-+-~~~~~~-1-~~~~~~-+-~~~~~~----1
1995-96 1996-9"7 1997-98 (Prov.) 1998-99 (Q.Est.)
(13) AGRICULTURE
OPERA TI ON AL HOLDINGS - This information of operational holdings by size of holdings and irrigation facilities was collected from all the villages at the time of Agriculture census in the year, 1990-91 and 1995-96.
LAND UTILISATION - The main purpose of the table for land Utilisation is to indicate broadly the ways in which the land of the State is utilised. The classification of area was formely available under five classes, which has been implified to fall in line with standard classification as laid down by the Ministry of Food and Agriculture, Government of India.
REPORTED AREA - Reported area for land utilisation purpose is based on the returns of area estimates prepared by the Revenue staff of the state.
FOREST - The area shown under forest in the table on Land utilisation may not tally wit? that given by the Forest Department because (i) The Forest Department reports, forests worked out by the Fore.st Department while the table on Agriculture Statistics includes in addition, forest area administered by district officers and (ii) certain villages and other lands not covered by the forest but worked out by Forest Department as forest, are not treated as forests in the returns of Agricultural Statistics.
AREA NOT AVAILABLE FOR CULTIVATION - This stands for all land which is absolutely barren or uncultivable covered by buildings, Water or roads or otherwise appropriated for non-agricultural purpose Under sub-Head" Land put to nonagricultural use" is included land occupied buildings, roads, railways or under water and other lands put to uses other than agriculture while under the sub-head" Barren and unculturable land" includes mountains, desert etc.
OTHER UNCULTIVATED LAND EXCLUDING FALLOW LAND - This denotes land available for cultivation but not taken up and includes culturable waste, permanent pastures and other grazing land and land under miscellaneous trees, crops and groves. The last one is that type of culturable land which is not included under area sown but is put to some agricultural use.
FALLOW LAND - It includes current fallow i.e. land which is left fallow during the current year only and other fallow land i.e. lands which were taken up for cultivation but are temporary out of cultivation for a period of not less than one year and more than 5 years.
NET AREA SOWN - Area Sown More Than Once and Total Cropped Area in computing the net area sown, area sown more than once have been counted only once under the head "Area Sown more than once" area sown with two and more than two crops in the same year is counted as many times as the crop is sown. Total cropped area is the total of net area sown and area sown more than once.
INDEX NUMBER -
COVERAGE : The present series of Index Numbers of Agricultural Producti?n in Rajasthan covers 34 principal crops for which forecasts are issued by the Board of Revenue from time to time. These crops occupy major Portion of the gross sown in the State. These 34 crops are further sub-divided into two main groups, namely, food-crops and non-food crops and seven sub-groups, namely cereals, pulses, oil-seeds, fibres, spices & condiments, vegetables and others.
The data about the crops included for the preparation of index cover about 83 percent of the cropped area and as such the trends in their production are fair representation of trend of the entire agricultural production in the State.
BASE PERIOD - The bas~ period for these indices has been changed from the triennium 1967-68 to 1969-70 to the triennium 1979-80 to 1981-82 considering the recommendation of the Economics & Statistical Advisor, Ministry of Agriculture & Irrigation, Govt. of India, Technical Committee on Index Numbers related to agriculture economy and of the technical committee on Prices & Cost of living. This is also reasonable period from the point of view of weather, Agriculture production and prices in Rajasthan.
WEIGHTS - Weights have been assigned to the different commodities in the same proportion which is the average value of its production bears to the total. average value of production of all commodities during the period. The production has been valued at the annual harvest prices of the commodities prevailing each year during the base period.
METHOD OF CONSTRUCTION OF INDEX NUMBER - The percentage production relative for each crop for the current year has been calculated with the corresponding estimated production in the base period. To obtain group-level indices these production relatives have been multiplied with the weights of the respective crops. The aggregative of the products has been divided by the total weights.
The Concept of production utilised in the construction of index number is that of gross production of crops Revised estimates of yield for each year have further been processed as indicated above to get the estimates yield for which figures have been used for construction of the index number.
AVERAGE YIELD OF PRINCIPAL CROPS - It has been calculated by dividing production figures by area.
AREA AND PRODUCTION OF CROPS - The figures of area and production are given for principle cereals, Pulses and commercial crops. The area figures are compiled by the Board of Revenue (Land Records), R~jasthan from the Agricultural Statistical returns prepared by the Revenue staff.· While the production figures for the state as a whole are estimated on the basis of crop cutting experiment results for Bajra, Maize, Jowar, Sesamum, Cotton, Groundnut, Sugarcane, Paddy, Wheat, Barly, Gram linseed and Rape & mustard. For other crops it is calculated on the basis of average normal yield of past 10 years. For estimating upon different crops and for the remaining districts the estimates are only tentative. The total of the district tallies with the production for the State as a whole.
The figures as given are those based final forecasts, as well as those based on revised estimates as issue from time to time alongwith the final forecasts for the following year. The data relates to the agriculture year ending June.
FARM AND FISHERY EQUIPMENT - The figures relating to the Farm and fishery equipment actual use for 1997 are based on 16th Quinquennial Livestock Census. The data in compiled form is supplied to the Directorate, by the Board of Revenue (Land
Records), Rajasthan.
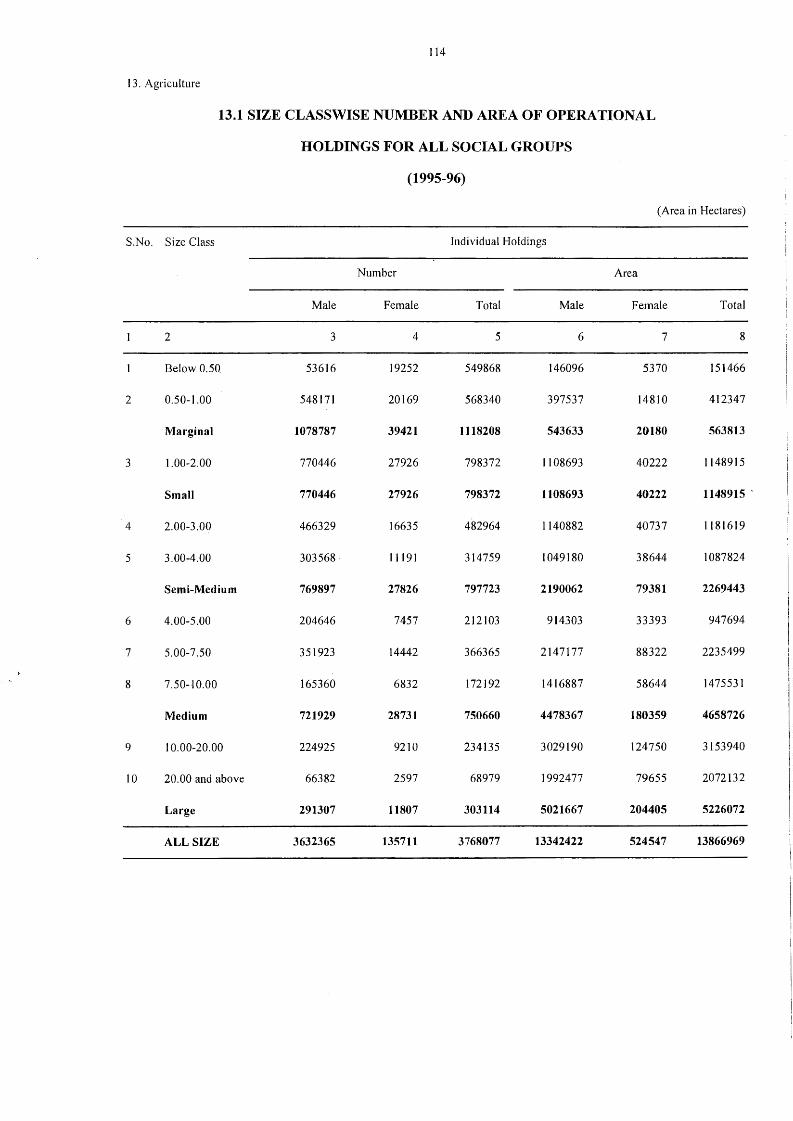
114
13. Agriculture
13.1 SIZE CLASSWISE NUMBER AND AREA OF OPERATIONAL
HOLDINGS FOR ALL SOCIAL GROUPS
(1995-96)
(Area in Hectares)
S.No. Size Class Individual Holdings
Number Area
Male Female Total Male Female Total
2 3 4 5 6 7 8
Below 0.50 53616 19252 549868 146096 5370 151466
2 0.50-1.00 548171 20169 568340 397537 14810 412347
Marginal 1078787 39421 1118208 543633 20180 563813
3 1.00-2.00 770446 27926 798372 1108693 40222 1148915
Small 770446 27926 798372 1108693 40222 1148915 '
4 2.00-3.00 466329 16635 482964 1140882 40737 1181619
5 3.00-4.00 303568· 11191 314759 1049180 38644 1087824
Semi-Medium 769897 27826 797723 2190062 79381 2269443
6 4.00-5.00 204646 7457 212103 914303 33393 947694
7 5.00-7.50 351923 14442 366365 2147177 88322 2235499
8 7.50-10.00 165360 6832 172192 1416887 58644 1475531
Medium 721929 28731 750660 4478367 180359 4658726
9 10.00-20.00 224925 9210 234135 3029190 124750 3153940
10 20.00 and above 66382 2597 68979 1992477 79655 2072132
Large 291307 11807 303114 5021667 204405 5226072
ALL SIZE 3632365 135711 3768077 13342422 524547 13866969
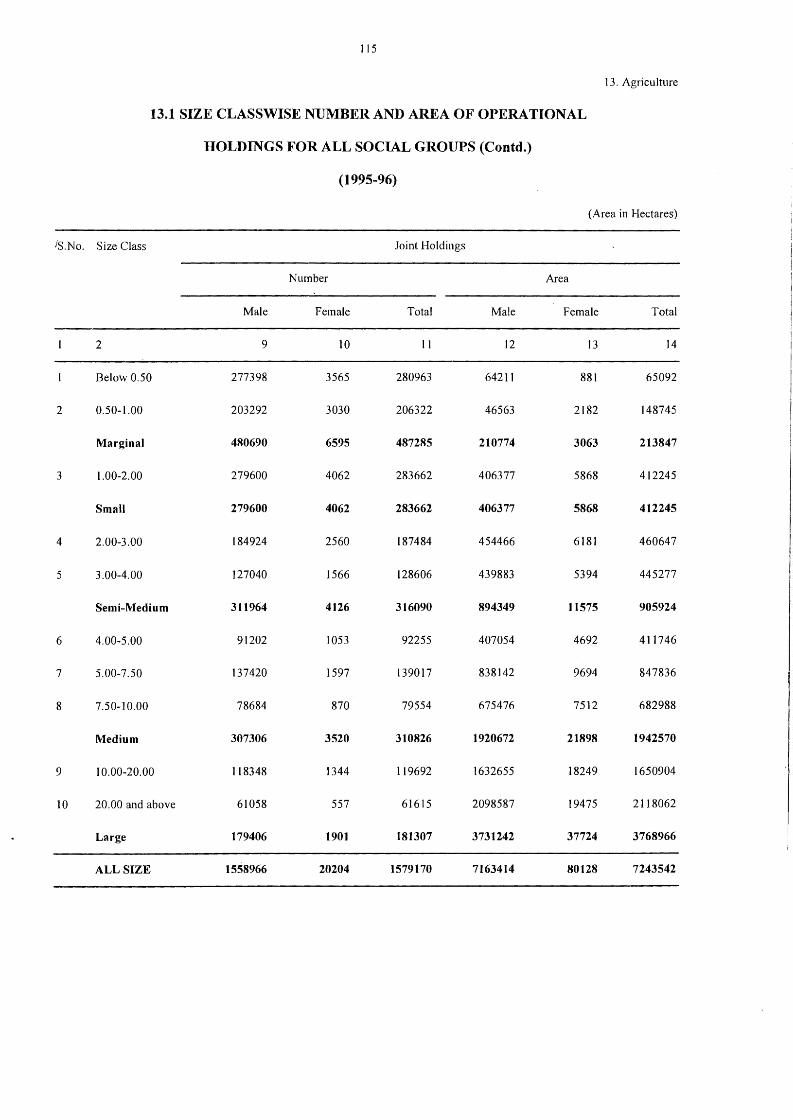
115
13. Agriculture
13.1 SIZE CLASS WISE NUMBER AND AREA OF OPERATIONAL
HOLDINGS FOR ALL SOCIAL GROUPS (Contd.)
(1995-96)
(Area in Hectares)
IS.No. Size Class Joint Holdings
Number Area
Male Female Total Male Female Total
2 9 10 11 12 13 14
Below 0.50 277398 3565 280963 6421 I 881 65092
2 0.50-1.00 203292 3030 206322 46563 2182 148745
Marginal 480690 6595 487285 210774 3063 213847
3 l .00-2.00 279600 4062 283662 406377 5868 412245
Small 279600 4062 283662 406377 5868 412245
4 2.00-3.00 184924 2560 187484 454466 6181 460647
5 3.00-4.00 127040 1566 128606 439883 5394 445277
Semi-Medium 311964 4126 316090 894349 11575 905924
6 4.00-5.00 91202 1053 92255 407054 4692 411746
7 5.00-7.50 137420 1597 139017 838142 9694 847836
8 7.50-10.00 78684 870 79554 675476 7512 682988
Medium 307306 3520 310826 1920672 21898 1942570
9 J 0.00-20.00 118348 1344 119692 1632655 18249 1650904
10 20.00 and above 61058 557 61615 2098587 19475 2118062
Large 179406 1901 181307 3731242 37724 3768966
ALL SIZE 1558966 20204 1579170 7163414 80128 7243542
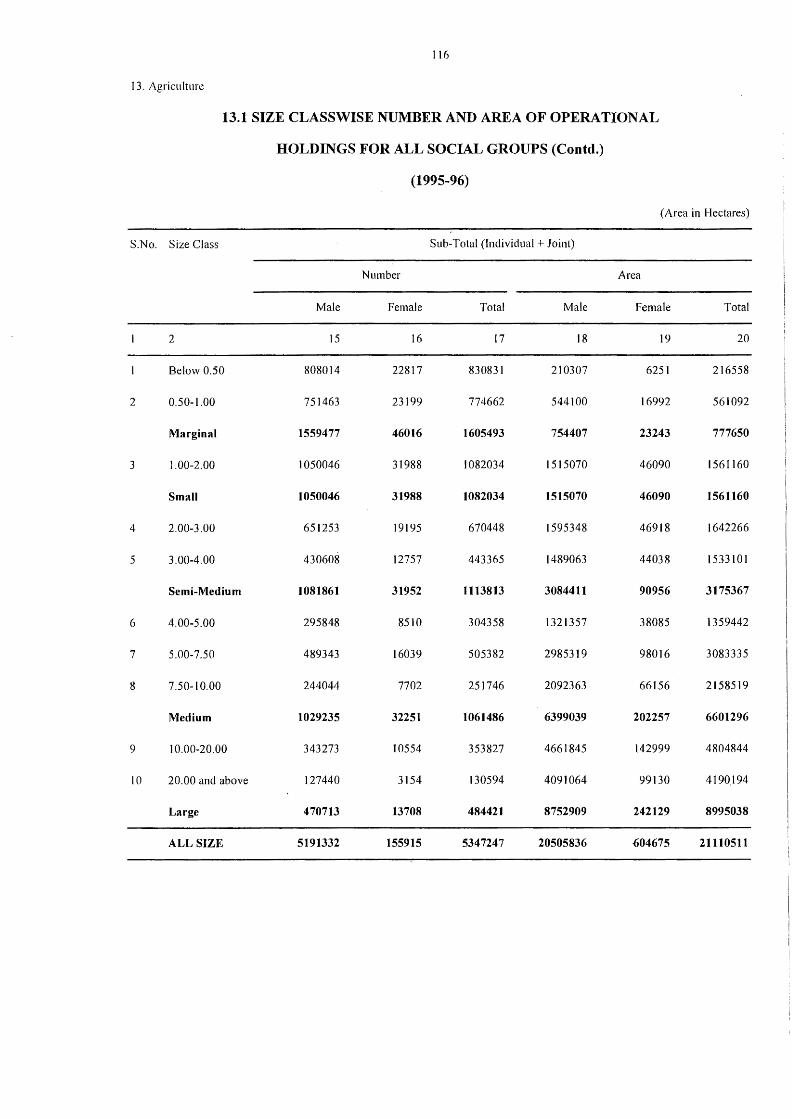
116
13. Agriculture
13.1 SIZE CLASSWISE NUMBER AND AREA OF OPERATIONAL
HOLDINGS FOR ALL SOCIAL GROUPS (Contd.)
(1995-96)
(Area in Hectares)
S.No. Size Class Sub-Total (Individual+ Joint)
Number Area
Male Female Total Male Female Total
2 15 16 17 18 19 20
Below 0.50 808014 22817 830831 210307 6251 216558
2 0.50-1.00 751463 23199 774662 544100 16992 561092
Marginal 1559477 46016 1605493 754407 23243 777650
3 l .00-2.00 1050046 31988 1082034 1515070 46090 1561160
Small 1050046 31988 1082034 1515070 46090 1561160
4 2.00-3.00 651253 19195 670448 1595348 46918 1642266
5 3.00-4.00 430608 12757 443365 1489063 44038 1533101
Semi-Medium 1081861 31952 1113813 3084411 90956 3175367
6 4.00-5.00 295848 8510 304358 1321357 38085 1359442
7 5.00-7.50 489343 16039 505382 2985319 98016 3083335
8 7.50-10.00 244044 7702 251746 2092363 66156 2158519
Medium 1029235 32251 1061486 6399039 202257 6601296
9 I 0.00-20.00 343273 10554 353827 4661845 142999 4804844
10 20.00 and above 127440 3154 130594 4091064 99130 4190.194
Large 470713 13708 484421 8752909 242129 8995038
ALL SIZE 5191332 155915 5347247 20505836 ()04675 21110511
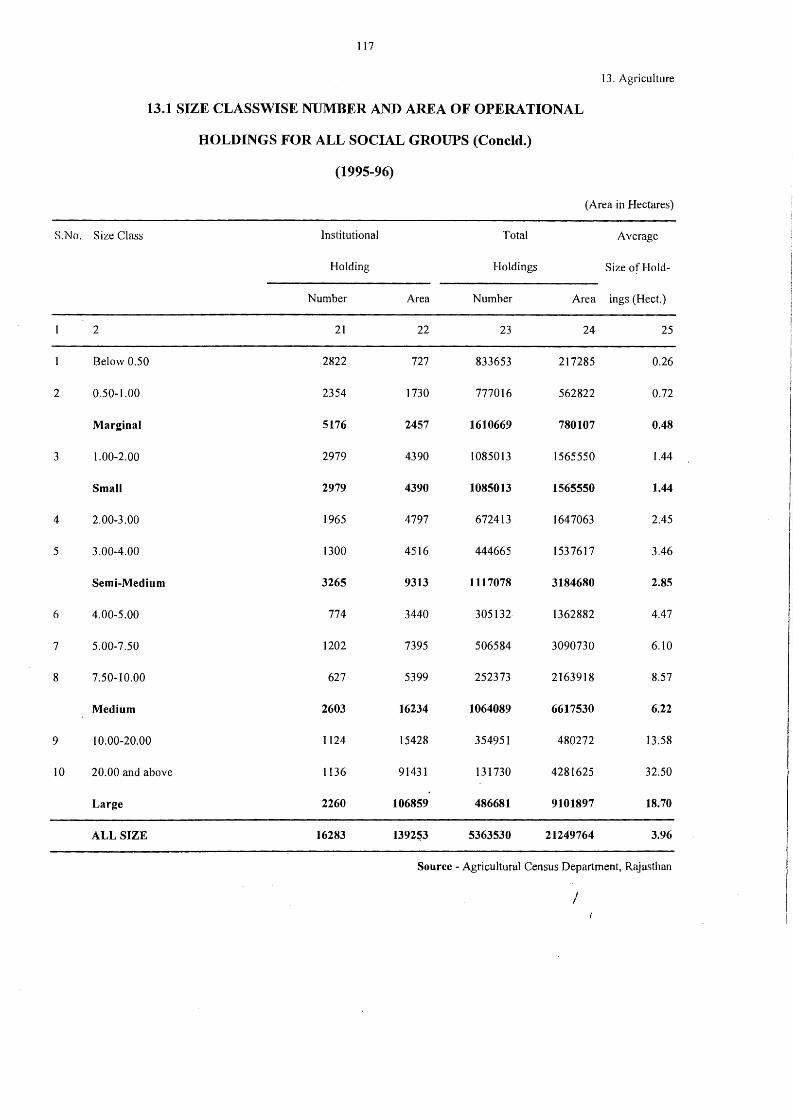
117
13. Agriculture
13.1 SIZE CLASSWISE NUMBER AND AREA OF OPERATIONAL
HOLDINGS FOR ALL SOCIAL GROUPS (Concld.)
(1995-96)
(Area in Hectares)
S.No. Size Class Institutional Total Average
Holding Holdings Size of Hold-
Number Area Number Area ings (Hect.)
2 21 22 23 24 25
Below 0.50 2822 727 833653 217285 0.26
2 0.50-1.00 2354 1730 777016 562822 0.72
Marginal 5176 2457 1610669 780107 0.48
3 1.00-2.00 2979 4390 1085013 1565550 1.44
Small 2979 4390 1085013 1565550 1.44
4 2.00-3.00 1965 4797 672413 1647063 2.45
5 3.00-4.00 1300 4516 444665 1537617 3.46
Semi-Medium 3265 9313 1117078 3184680 2.85
6 4.00-5.00 774 3440 305132 1362882 4.47
7 5.00-7.50 1202 7395 506584 3090730 6.10
8 7.50-10.00 627 5399 252373 2163918 8.57
Medium 2603 16234 1064089 6617530 6.22
9 I 0.00-20.00 1124 15428 354951 480272 13.58
10 20.00 and above 1136 91431 131730 4281625 32.50
Large 2260 106859 486681 9101897 18.70
ALL SIZE 16283 1392$3 5363530 21249764 3.96
Source - Agricultural Census Department, Rajasthan
I
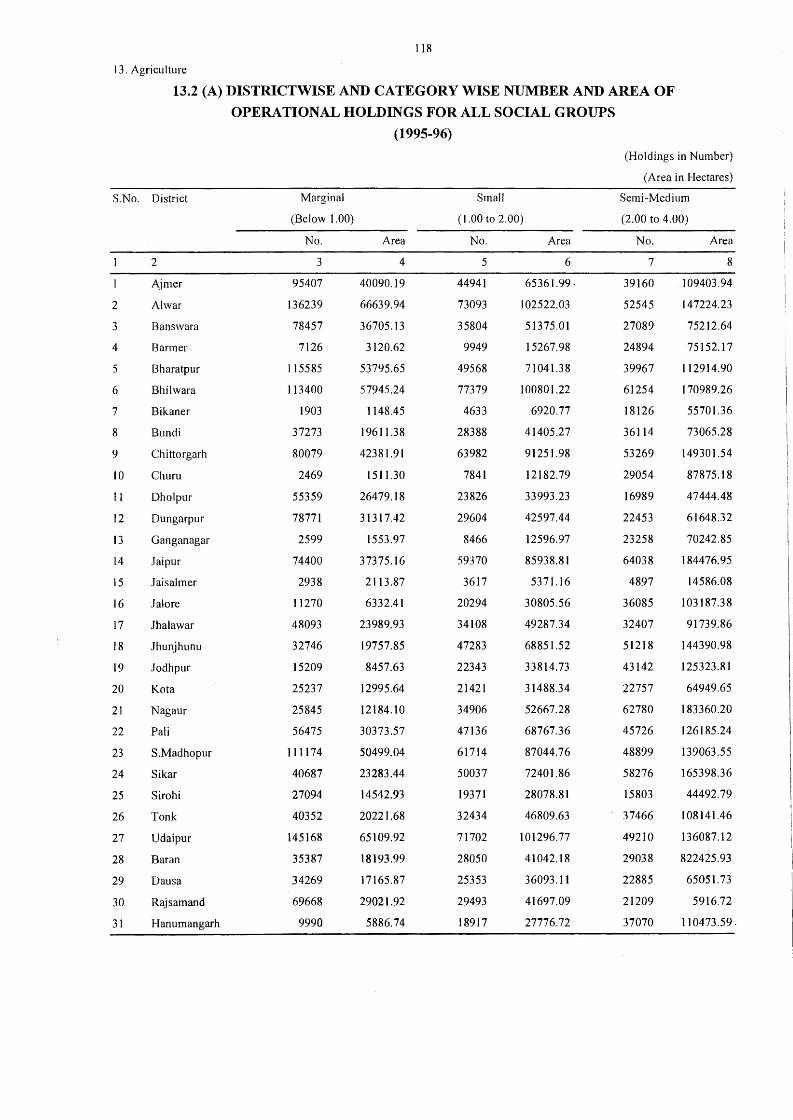
118
13. Agriculture
13.2 (A) DISTRICTWISE AND CATEGORY WISE NUMBER AND AREA OF
OPERATIONAL HOLDINGS FOR ALL SOCIAL GROUPS
(1995-96)
(Holdings in Number)
(Area in Hectares)
S.No. District Marginal
(Below 1.00)
Small
(1.00 to 2.00)
Semi-Medium
2
3
4
5
6
7
8
9
10
l l
12
13
14
15
16
17
18
19
20
21
22
23
24
25
26
27
28
29
30
31
2
Aimer
Al war
Banswara
Barmer
Bharatpur
Bhilwara
Bikaner
Bundi
Chittorgarh
Chum
Dholpur
Dungarpur
Ganganagar
Jaipur
Jaisalmer
Jalore
Jhalawar
Jhunjhunu
Jodhpur
Ko ta
Nagaur
Pali
S.Madhopur
Sikar
Sirohi
Tonk
Udaipur
Baran
Dausa
Rajsamand
Hanumangarh
No.
3
95407
136239
78457
7126
I 15585
113400
1903
37273
80079
2469
55359
78771
2599
74400
2938
11270
48093
32746
15209
25237
25845
56475
111174
40687
27094
40352
145168
35387
34269
69668
9990
Area
4
40090.19
66639.94
36705.13
3120.62
53795.65
57945.24
1148.45
19611.38
42381.91
1511.30
26479.18
31317.42
1553.97
37375.16
2113.87
6332.41
23989.93
19757.85
8457.63
12995.64
12184.10
30373.57
50499.04
23283.44
14542.93
20221.68
65109.92
18193.99
17165.87
29021.92
5886.74
No.
5
44941
73093
35804
9949
49568
77379
4633
28388
63982
7841
23826
29604
8466
59370
3617
20294
34108
47283
22343
21421
34906
47136
61714
50037
19371
32434
71702
28050
25353
29493
18917
Area
6
65361.99-
102522.03
51375.01
15267.98
71041.38
100801.22
6920.77
41405.27
91251.98
12182.79
33993.23
42597.44
12596.97
85938.81
5371.16
30805.56
49287.34
68851.52
33814.73
31488.34
52667.28
68767.36
87044.76
72401.86
28078.81
46809.63
101296.77
41042.18
36093.11
41697.09
27776.72
(2.00 to 4.00)
No.
7
39160
52545
27089
24894
39967
61254
18126
36114
53269
29054
16989
22453
23258
64038
4897
36085
32407
51218
43142
22757
62780
45726
48899
58276
15803
37466
49210
29038
22885
21209
37070
Area
8
109403.94
147224.23
75212.64
75152.17
112914.90
170989.26
55701.36
73065.28
149301.54
87875.18
47444.48
61648.32
70242.85
184476:95
14586.08
103187.38
91739.86
144390.98
125323.81
64949.65
183360.20
126185.24
139063.55
165398.36
44492.79
I 08141.46
136087.12
822425.93
65051.73
5916.72
110473.59.
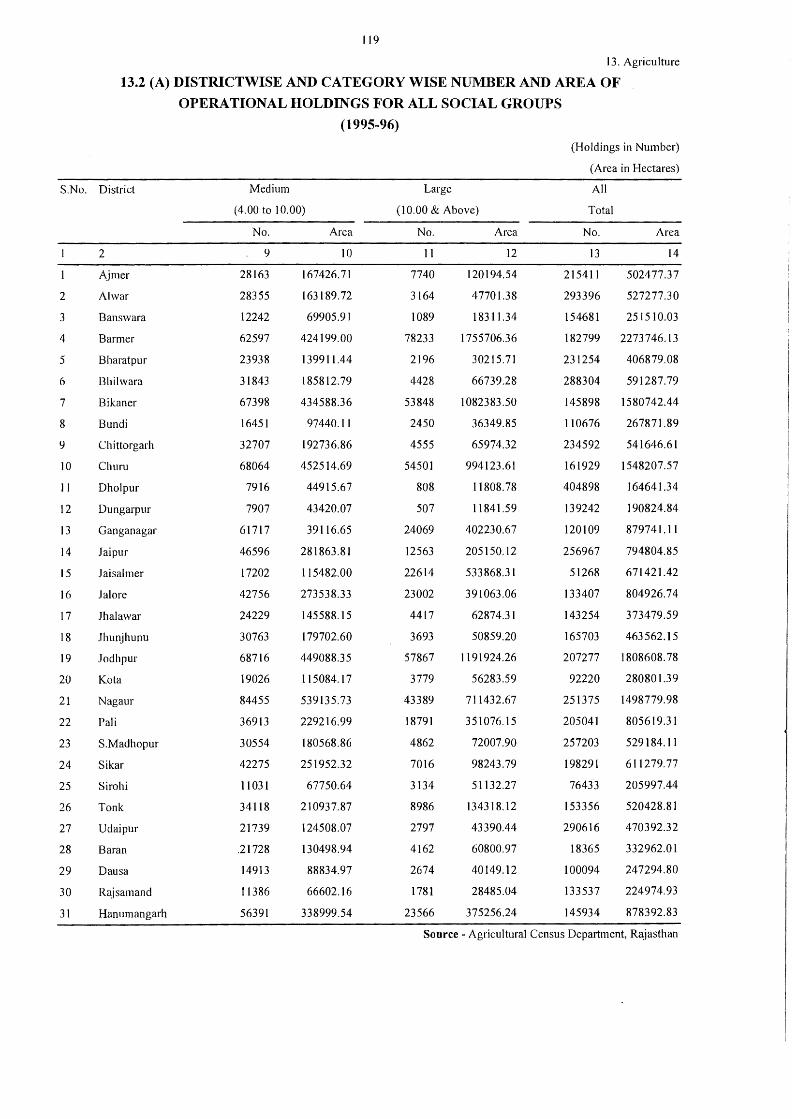
119
13. Agriculture
13.2 (A) DISTRICTWISE AND CATEGORY WISE NUMBER AND AREA OF
OPERATIONAL HOLDINGS FOR ALL SOCIAL GROUPS
(1995-96)
(Holdings in Number)
(Area in Hectares)
S.No. District Medium Large
(10.00 & Above)
All
2
3
4
5
6
7
8
9
10
11
12
13
14
15
16
17
18
19
20
21
22
23
24
25
26
27
28
29
30
31
2
Ajmer
Al war
Banswara
Barmer
Bharatpur
Bhilwara
Bikaner
Bundi
Chittorgarh
Churn
Dholpur
Dungarpur
Ganganagar
Jaipur
Jaisalmer
Jal ore
Jhalawar
Jhunjhunu
Jodhpur
Ko ta
Nagaur
Pali
S.Madhopur
Sikar
Sirohi
Tonk
Udaipur
Baran
Dausa
Rajsamand
Hanumangarh
(4.00 to 10.00)
No.
9
28163
28355
12242
62597
23938
31843
67398
16451
32707
68064
7916
7907
61717
46596
17202
42756
24229
30763
68716
19026
84455
36913
30554
42275
11031
34118
21739
.21728
14913
11386
56391
Area
10
167426.71
163189.72
69905.91
424199.00
139911.44
185812.79
434588.36
97440. I 1
192736.86
452514.69
44915.67
43420.07
39116.65
281863.81
115482.00
273538.33
145588.15
179702.60
449088.35
115084. 17
539135.73
229216.99
180568.86
251952.32
67750.64
210937.87
124508.07
130498.94
88834.97
66602.16
338999.54
No.
11
7740
3164
1089
78233
2196
4428
53848
2450
4555
54501
808
507
24069
12563
22614
23002
4417
3693
57867
3779
43389
18791
4862
7016
3134
8986
2797
4162
2674
1781
23566
Area
12
120194.54
47701.38
18311.34
1755706.36
30215.71
66739.28
1082383.50
36349.85
65974.32
994123.61
11808.78
11841.59
402230.67
205150.12
533868.31
391063.06
62874.31
50859.20
1191924.26
56283.59
711432.67
351076.15
72007.90
98243.79
51132.27
134318.12
43390.44
60800.97
40149.12
28485.04
375256.24
Total
No.
13
215411
293396
154681
182799
231254
288304
145898
110676
234592
161929
404898
139242
120109
256967
51268
133407
143254
165703
207277
92220
251375
205041
257203
198291
76433
153356
290616
18365
100094
133537
145934
Area
14
502477.37
527277.30
251510.03
2273746.13
406879.08
591287.79
1580742.44
267871.89
541646.61
1548207.57
164641.34
190824.84
879741.11
794804.85
671421.42
804926.74
373479.59
463562.15
1808608.78
280801.39
1498779.98
805619.31
529184.11
611279.77
205997.44
520428.81
470392.32
332962.01
247294.80
224974.93
878392.83
Source - Agricultural Census Department, Rajasthan
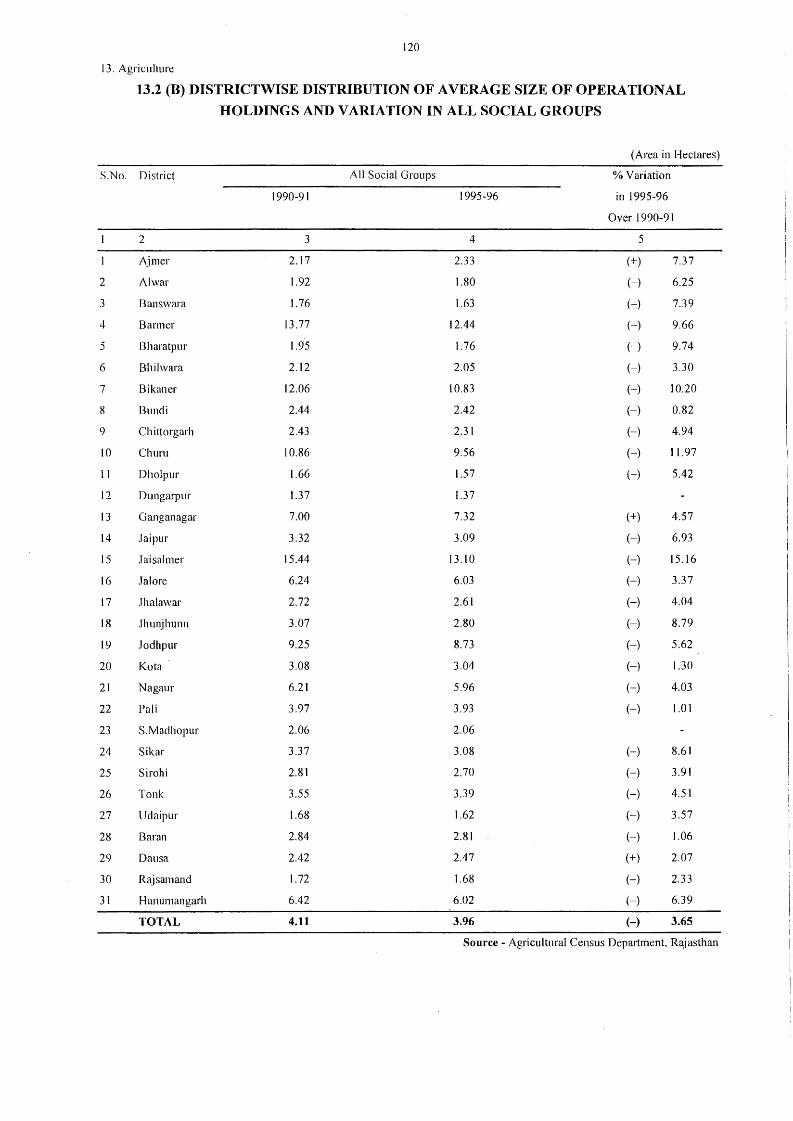
120
13. Agriculture
13.2 (B) DISTRICTWISE DISTRIBUTION OF A VERA GE SIZE OF OPERA TI ON AL
HOLDINGS AND VARIATION IN ALL SOCIAL GROUPS
(Area in Hectares)
S.No. District All Social Groups % Variation
1990-91 1995-96 in 1995-96
Over 1990-91
2 3 4 5
Ajmer 2.17 2.33 (+) 7.37
2 Al war l.92 l.80 (-) 6.25
3 Banswara 1.76 1.63 H 7.39
4 Barmer 13.77 12.44 (-) 9.66
5 Bharatpur I.95 1.76 H 9.74
6 Bhilwara 2.12 2.05 (-) 3.30
7 Bikaner 12.06 10.83 H 10.20
8 Bundi 2.44 2.42 H 0.82
9 Chittorgarh 2.43 2.31 (-) 4.94
JO Churu 10.86 9.56 (-) 11.97
11 Dholpur l.66 1.57 (-) 5.42
12 Dungarpur 1.37 1.37
13 Ganganagar 7.00 7.32 (+) 4.57
14 Jaipur 3.32 3.09 (-) 6.93
15 Jaisalmer 15.44 13.10 (-) 15.16
16 Jal ore 6.24 6.03 (-) 3.37
17 .Jhalawar 2.72 2.61 (-) 4.04
18 .Jhunjhunu 3.07 2.80 (-) 8.79
19 Jodhpur 9.25 8.73 5.62
20 Ko ta 3.08 3.04 1.30
21 Nagaur 6.21 5.96 (-) 4.03
22 Pali 3.97 3.93 (-) 1.01
23 S.Madhopur 2.06 2.06
24 Sikar 3.37 3.08 (-) 8.61
25 Sirohi 2.81 2.70 (-) 3.91
26 Tonk 3.55 3.39 (-) 4.51
27 Udaipur l.68 1.62 (-) 3.57
28 Baran 2.84 2.81 (-) 1.06
29 Dausa 2.42 2.47 (+) 2.07
30 Rajsamand 1.72 1.68 (-) 2.33
31 Hanumangarh 6.42 6.02 (-) 6.39
TOTAL 4.11 3.96 (-) 3.65
Source - Agricultural Census Department. R3;jasthan
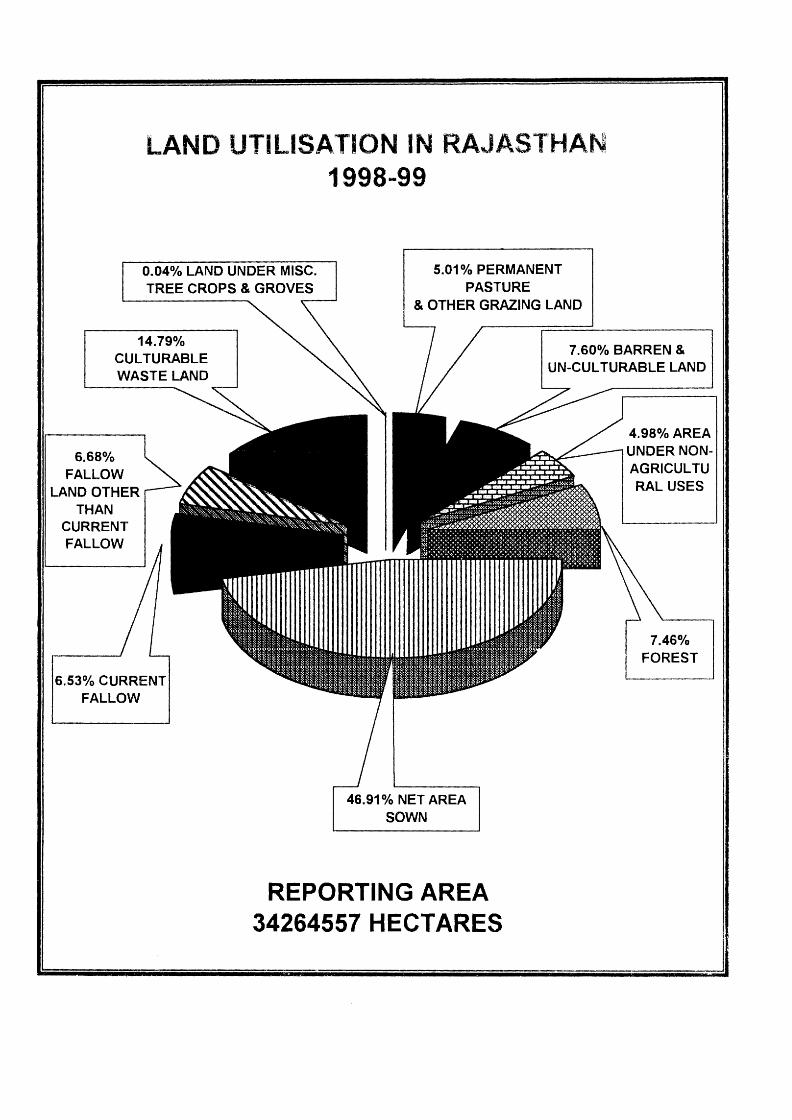
LAND UTILISATION IN RA,JASTHAN 1998-99
0.04% LAND UNDER MISC. TREE CROPS & GROVES
5.01 o/o PERMANENT PASTURE
& OTHER GRAZING LAND
14.79% CULTURABLE WASTE LAND
7. 60% BARREN & UN-CUL TURABLE LAND
6.68% FALLOW
LAND OTHER THAN
CURRENT FALLOW
6.53% CURRENT FALLOW
46.91% NET AREA SOWN
REPORTING AREA 34264557 HECT ARES
4.98% AREA UNDER NONAGRICULTU RAL USES
7.46% FOREST
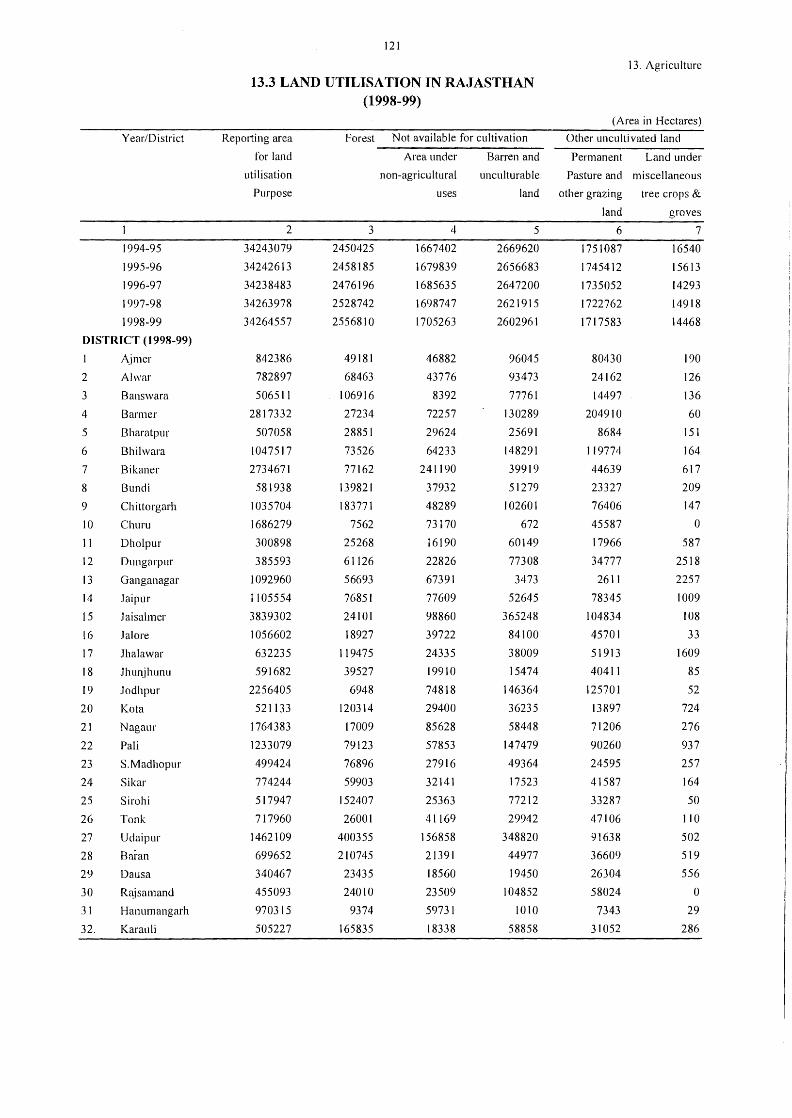
121
13. Agriculture
13.3 LAND UTILISATION IN RAJASTHAN (1998-99)
(Area in Hectares)
Year/District Repo1ting area Forest Not available for cultivation Other uncultivated land
for land Area under Barren and Permanent Land under
utilisation non-agricultural unculturable Pasture and miscellaneous
Purpose uses land other grazing tree crops &
land groves
2 3 4 5 6 7
1994-95 34243079 2450425 1667402 2669620 1751087 16540
1995-96 34242613 2458185 1679839 2656683 1745412 15613
1996-97 34238483 2476196 1685635 2647200 1735052 14293
1997-98 34263978 2528742 1698747 2621915 1722762 14918
1998-99 34264557 2556810 1705263 2602961 1717583 14468
DISTRICT (1998-99)
1 Ajmer 842386 49181 46882 96045 80430 190
2 Ahvar 782897 68463 43776 93473 24162 126
3 Banswara 506511 106916 8392 77761 14497 136
4 Barmer 2817332 27234 72257 130289 204910 60
5 Bharatpur 507058 28851 29624 25691 8684 151
6 Bhilwara 1047517 73526 64233 148291 119774 164
7 Bikaner 2734671 77162 241190 39919 44639 617
8 Bundi 581938 139821 37932 51279 23327 209
9 Chittorgarh 1035704 183771 48289 102601 76406 147
10 Churn 1686279 7562 73170 672 45587 0
11 Dholpur 300898 25268 16190 60149 17966 587
12 Dungarpur 385593 61126 22826 77308 34777 2518
13 Ganganagar 1092960 56693 67391 3473 2611 2257
14 Jaipur 1105554 76851 77609 52645 78345 1009
15 .laisalmer 3839302 24101 98860 365248 104834 108
16 Jal ore 1056602 18927 39722 84100 45701 33
17 Jhalawar 632235 119475 24335 38009 51913 1609
18 Jhunjhunu 591682 39527 19910 15474 40411 85
19 Jodhpur 2256405 6948 74818 146364 125701 52
20 Kot a 521133 120314 29400 36235 13897 724
21 Nagaur 1764383 17009 85628 58448 71206 276
22 Pali 1233079 79123 57853 147479 90260 937
23 S.Madhopur 499424 76896 27916 49364 24595 257
24 Sikar 774244 59903 32141 17523 41587 164
25 Sirohi 517947 152407 25363 77212 33287 50
26 Tonk 717960 26001 41169 29942 47106 110
27 Udaipur 1462109 400355 156858 348820 91638 502
28 Bai·an 699652 210745 21391 44977 36609 519
29 Daus a 340467 23435 18560 19450 26304 556
30 Rajsamand 455093 24010 23509 104852 58024 0
31 Hanumangarh 970315 9374 59731 1010 7343 29
32. Karau Ii 505227 165835 18338 58858 31052 286
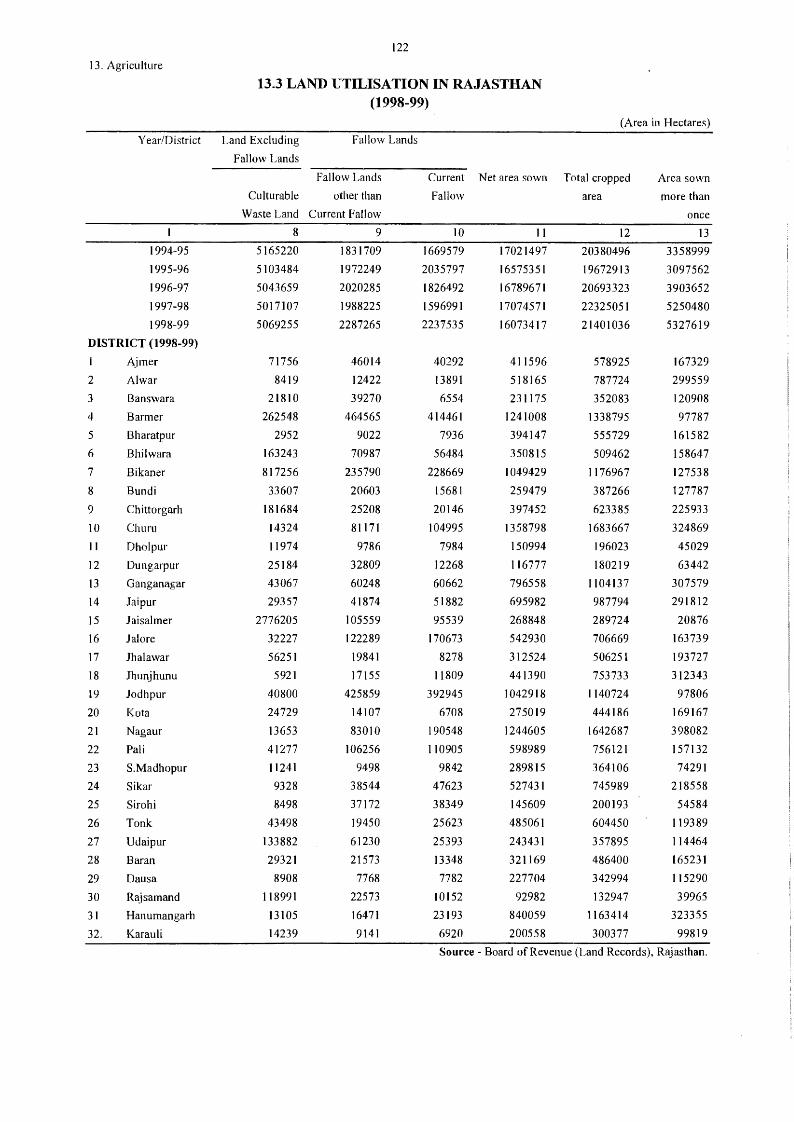
122
13. Agriculture
13.3 LAND UTILISATION IN RAJASTHAN (1998-99)
(Area in Hectares) Year/District Land Excluding Fallow Lands
Fallow Lands
Fallow Lands Current Net area sown Total cropped Area sown Culturable other than Fallow area more than
Waste Land Current Fallow once I 10 11 12 13
1994-95 5165220 1831709 1669579 17021497 20380496 3358999 1995-96 5103484 1972249 2035797 16575351 19672913 3097562
1996-97 5043659 2020285 1826492 16789671 20693323 3903652
1997-98 5017107 1988225 1596991 17074571 22325051 5250480
1998-99 5069255 2287265 2237535 16073417 21401036 5327619
DISTRICT (1998-99)
Ajmer 71756 46014 40292 411596 578925 167329
2 Al war 8419 12422 13891 518165 787724 299559
3 Banswara 21810 39270 6554 231175 352083 120908
4 Barmer 262548 464565 414461 1241008 1338795 97787
5 Bharatpur 2952 9022 7936 394147 555729 161582
6 Bhilwara 163243 70987 56484 350815 509462 158647
7 Bikaner 817256 235790 228669 1049429 1176967 127538
8 Bundi 33607 20603 15681 259479 387266 127787
9 Chittorgarh 181684 25208 20146 397452 623385 225933
10 Churu 14324 81171 104995 1358798 1683667 324869
11 Dholpur 11974 9786 7984 150994 196023 45029
12 Dungarpur 25184 32809 12268 116777 180219 63442
13 Ganganagar 43067 60248 60662 796558 1104137 307579
14 Jaipur 29357 41874 51882 695982 987794 291812
15 Jaisalmer 2776205 105559 95539 268848 289724 20876
16 Jalore 32227 122289 170673 542930 706669 163739
17 Jhalawar 56251 19841 8278 312524 506251 193727
18 Jhunjhunu 5921 17155 11809 441390 753733 312343
19 Jodhpur 40800 425859 392945 1042918 1140724 97806
20 Ko ta 24729 14107 6708 275019 444186 169167
21 13653 83010 190548 1244605 1642687 398082
22 Pali 41277 106256 110905 598989 756121 157132
23 S.Madhopur 11241 9498 9842 289815 364106 74291
24 Sikar 9328 38544 47623 527431 745989 218558
25 Sirohi 8498 37172 38349 145609 200193 54584
26 Tonk 43498 19450 25623 485061 604450 119389
27 Udaipur 133882 61230 25393 243431 357895 114464
28 Baran 29321 21573 13348 321169 486400 165231
29 Dausa 8908 7768 7782 227704 342994 115290
30 Rajsamand 118991 22573 10152 92982 132947 39965
31 Hanumangarh 13105 16471 23193 840059 1163414 323355
32. Karau Ii 14239 9141 6920 200558 300377 99819
Source - Board of Revenue (Land Records), Rajasthan.
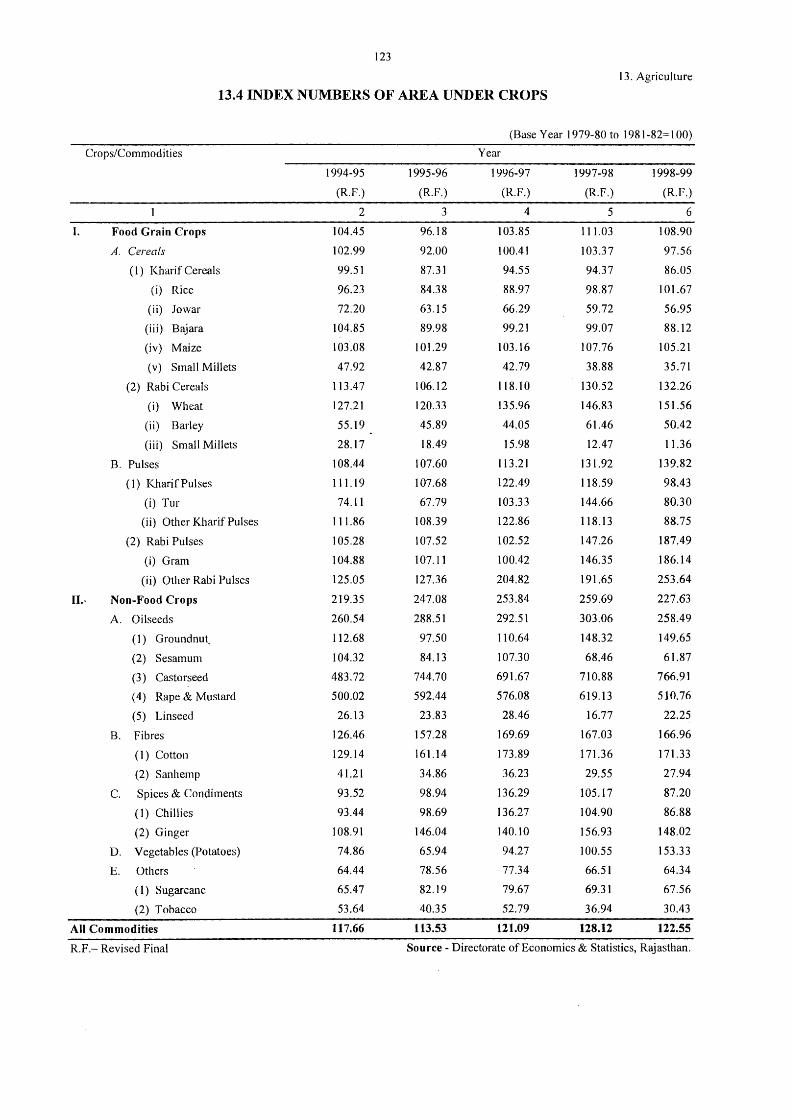
123
13. Agriculture
13.4 INDEX NUMBERS OF AREA UNDER CROPS
(Base Year 1979-80 to 1981-82= I 00)
Crops/Commodities Year
1994-95 1995-96 1996-97 1997-98 1998-99
(R.F.) (R.F.) (R.F.) (R.F.) (R.F.)
2 3 4 5 6
I. Food Grain Crops 104.45 96.18 103.85 111.03 108.90
A. Cereals 102.99 92.00 100.41 103.37 97.56
( 1) Kharif Cereals 99.51 87.3] 94.55 94.37 86.05
(i) Rice 96.23 84.38 88.97 98.87 101.67
(ii) Jo war 72.20 63.15 66.29 59.72 56.95
(iii) Bajara 104.85 89.98 99.21 99.07 88.12
(iv) Maize 103.08 101.29 103.16 107.76 105.21
(v) Small Millets 47.92 42.87 42.79 38.88 35.71
(2) Rabi Cereals 113.47 106.12 118.10 130.52 132.26
(i) Wheat 127.21 120.33 135.96 146.83 151.56
(ii) Barley 55.19 45.89 44.05 61.46 50.42
(iii) Small Millets 28.17 18.49 15.98 12.47 11.36
B. Pulses 108.44 107.60 113.21 131.92 139.82
( 1) Kharif Pulses 111.19 107.68 122.49 118.59 98.43
(i) Tur 74.11 67.79 103.33 144.66 80.30
(ii) Other Kharif Pulses 111.86 108.39 122.86 118.13 88.75
(2) Rabi Pulses 105.28 107.52 102.52 147.26 187.49
(i) Gram 104.88 107.11 100.42 146.35 186.14
(ii) Other Rabi Pulses 125.05 127.36 204.82 191.65 253.64
II.· Non-Food Crops 219.35 247.08 253.84 259.69 227.63
A. Oilseeds 260.54 288.51 292.5 l 303.06 258.49
(1) Groundnut. I 12.68 97.50 110.64 148.32 149.65
(2) Sesamum 104.32 84.13 107.30 68.46 61.87
(3) Castorseed 483.72 744.70 691.67 710.88 766.91
(4) Rape & Mustard 500.02 592.44 576.08 619.13 510.76
(5) Linseed 26.13 23.83 28.46 16.77 22.25
B. Fibres 126.46 157.28 169.69 167.03 166.96
(1) Cotton 129.14 161.14 173.89 171.36 171.33
(2) Sanhemp 41.21 34.86 36.23 29.55 27.94
C. Spices & Condiments 93.52 98.94 136.29 105.17 87.20
( 1) Chillies 93.44 98.69 136.27 104.90 86.88
(2) Ginger 108.91 146.04 140.10 156.93 148.02
D. Vegetables (Potatoes) 74.86 65.94 94.27 100.55 153.33
E. Others 64.44 78.56 77.34 66.51 64.34
( 1) Sugarcane 65.47 82.19 79.67 69.31 67.56
(2) Tobacco 53.64 40.35 52.79 36.94 30.43
All Commodities 117.66 113.53 121.09 128.12 122.55
R.F.-Revised Final Source - Directorate of Economics & Statistics, Rajasthan.
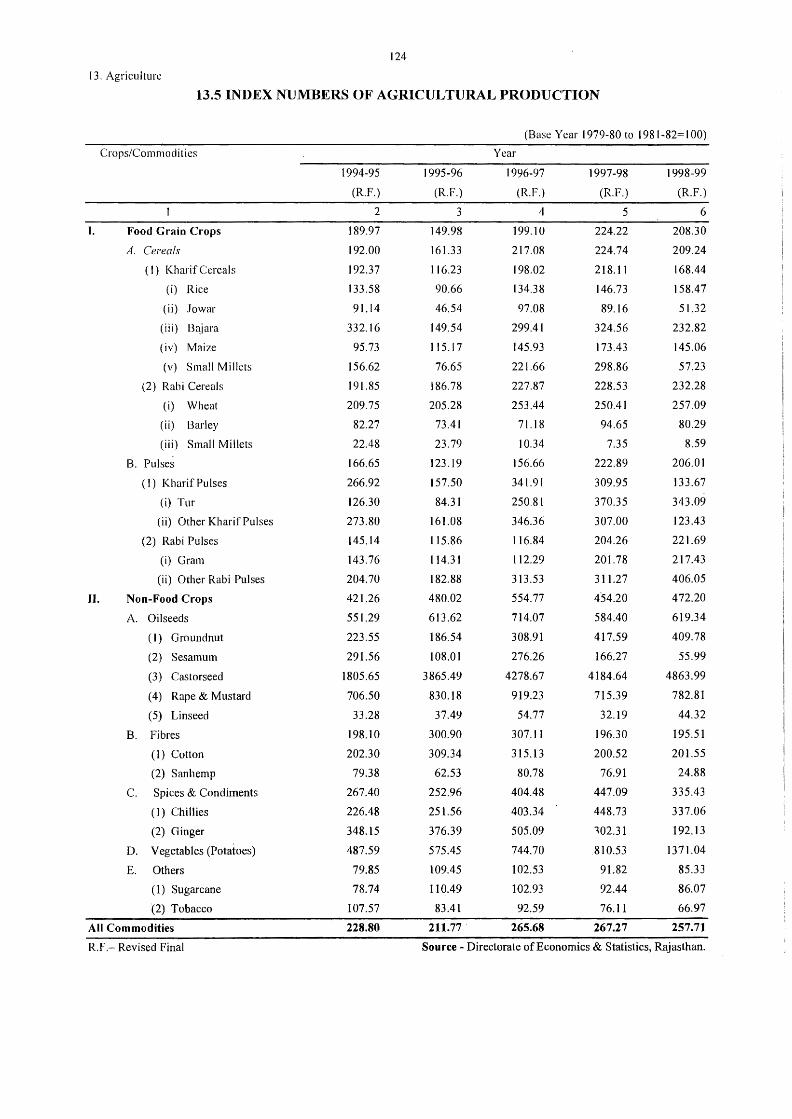
124
13. Agriculture
13.5 INDEX NUMBERS OF AGRICULTURAL PRODUCTION
(Base Y car 1979-80 to 1981-82= 100)
Crops/Commodities Year
1994-95 1995-96 1996-97 1997-98 1998-99
(R.F.) (R.F.) (R.F.) (R.F.) (R.F.)
2 3 4 5 6
I. Food Grain Crops 189.97 149.98 199.10 224.22 208.30
A. Cereals 192.00 161.33 217.08 224.74 209.24
(I ) Kharif Cereals 192.37 116.23 198.02 218.11 168.44
(i) Rice 133.58 90.66 134.38 146.73 158.47
(ii) Jo war 91.14 46.54 97.08 89.16 51.32
(iii) Bajara 332.16 149.54 299.41 324.56 232.82
(iv) Maize 95.73 I 15.17 145.93 173.43 145.06
(v) Small Millets 156.62 76.65 221.66 298.86 57.23
(2) Rabi Cereals I 91.85 186.78 227.87 228.53 232.28
(i) Wheat 209.75 205.28 253.44 250.41 257.09
(ii) Barley 82.27 73.41 71.18 94.65 80.29
(iii) Small Millets 22.48 23.79 10.34 7.35 8.59
B. Pulses 166.65 123.19 156.66 222.89 206.01
(I) Kharif Pulses 266.92 157.50 341.91 309.95 133.67
(i) Tur 126.30 84.31 250.81 370.35 343.09
(ii) Other Kharif Pulses 273.80 I 61.08 346.36 307.00 123.43
(2) Rabi Pulses 145.14 115.86 I 16.84 204.26 221.69
(i) Gram 143.76 114.31 112.29 201.78 217.43
(ii) Other Rabi Pulses 204.70 182.88 313.53 311.27 406.05
II. Non-Food Crops 421.26 480.02 554.77 454.20 472.20
A. Oilseeds 551.29 613.62 714.07 584.40 619.34
(I) Groundnut 223.55 186.54 308.91 417.59 409.78
(2) Sesamum 291.56 108.01 276.26 166.27 55.99
(3) Castorseed 1805.65 3865.49 4278.67 4184.64 4863.99
(4) Rape & Mustard 706.50 830.18 919.23 715.39 782.81
(5) Linseed 33.28 37.49 54.77 32.19 44.32
B. Fibres 198. IO 300.90 307.11 196.30 195.51
(1) Cotton 202.30 309.34 315.13 200.52 201.55
(2) Sanhemp 79.38 62.53 80.78 76.91 24.88
C. Spices & Condiments 267.40 252.96 404.48 447.09 335.43
(I) Chillies 226.48 251.56 403.34 448.73 337.06
(2) Ginger 348.15 376.39 505.09 102.31 192.13
D. Vegetables (Potatoes) 487.59 575.45 744.70 810.53 1371.04
E. Others 79.85 109.45 102.53 91.82 85.33
( 1) Sugarcane 78.74 110.49 102.93 92.44 86.07
(2) Tobacco 107.57 83.41 92.59 76.11 66.97
All Commodities 228.80 211.77. 265.68 267.27 257.71
R.F.- Revised Final Source - Directorate of Economics & Statistics, Rajasthan.
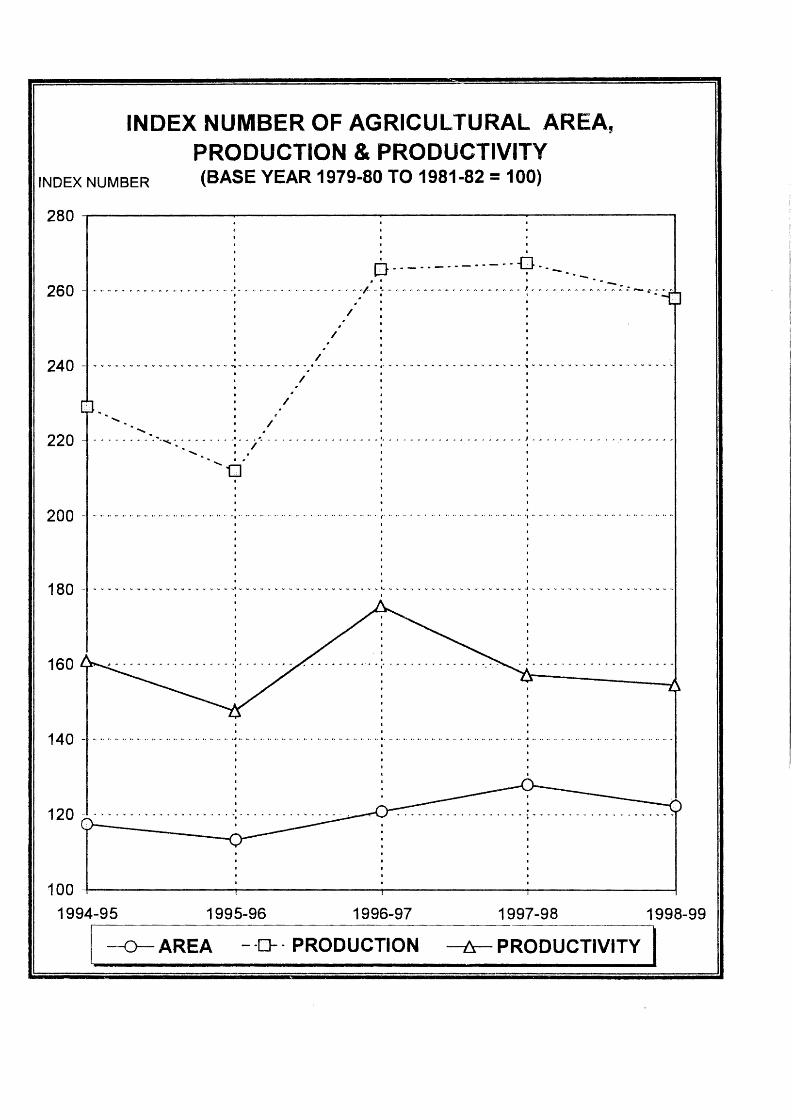
INDEX NUMBER OF AGRICULTURAL AREA, PRODUCTION & PRODUCTIVITY
INDEX NUMBER (BASE YEAR 1979-80 TO 1981-82 = 100)
. -0 0-------------- ' ·-----. . . . .. ....... 260 .. •· .. •· ... '•·" ", .... •·. •· .. •· .. ··: ............ ,, . . ......... "·/.· .. :·· •· .. . . ..... •· ... •·. •· .......... '; ... •· .. •· ......... : .~ - :· ;; .. .
• II I •
: / . : ' . . : / . : . . ' : / : : ' 240 - ................... ·:· ........ ·,· ......... :·............ . ..... ~ .................... . ' / . . ' . . . . . f / I t . . . . . . . / . .
'.. I I I l 220 .......... · ............... ·'·. ·'·............. . . '· .................. J ••••. • ••••.•••••••••• 'rt-. I / • I '
'• I I : : '-...8· : : I I
t I
I ' t I
200 - ........................................ : .................... " ................. ~· .. " .. ' .. ' .. ' ....................... : ...................................... . I I I . . . . .
I I . . I I . . . . . . 180 ......................................................................................................... ..
160 . . ~ ... ,. ........... ,,. ..... .,. ...... ,..,, .... , ... ~,,. ...... II! .... ,.. ..... .,. .......... - ...... ,.,, ... ,._.,.,. __ .. ,. ...... ,,. ...... . . . .
I I I
14 0 - .................................... " ,; •· ................ " . " .......... " " .. : ... " " " .. " .... •· .... " .. " ........... : ...................................... .. . . . . . . . . ' • t I . . . I I . . I t . ' . . 120 .......................................... . ..., .. ,, ................ " .......... -.................. -,, ........ -... -..... -................. ... ,, ______ . .
I
. . 100 -i--------,------...,.---------· -------!
1994-95 1995-96 1996-97 1997-98 1998-99
I --0- AREA - -0-. PRODUCTION -tr- PRODUCTIVITY I
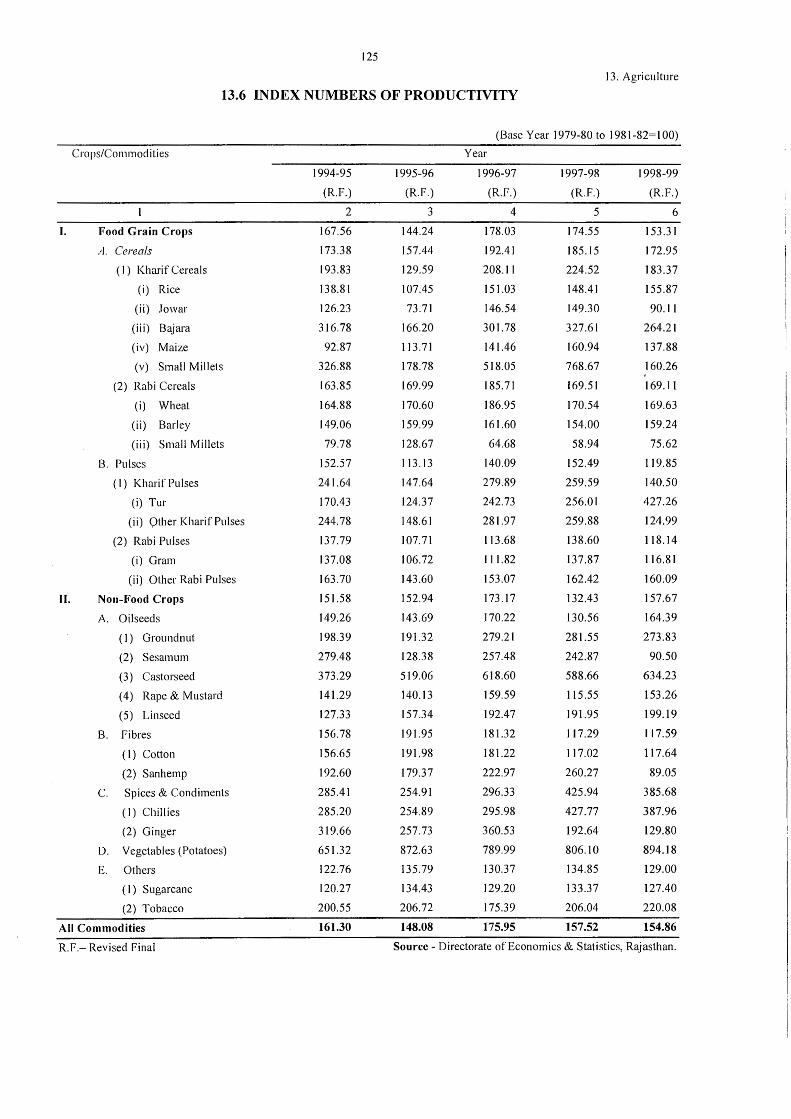
125
13. Agriculture
13.6 INDEX NUMBERS OF PRODUCTIVITY
(Base Year 1979-80 to 1981-82= 100)
Crops/Commodities Year
1994-95 1995-96 1996-97 1997-98 1998-99
(R.F.) (R.F.) (R.F.) (R.F.) (R.F.)
2 3 4 5 6
I. Food Grain Crops 167.56 144.24 178.03 174.55 153.3 l
A. Cereals 173.38 157.44 192.41 185.15 172.95
( 1) Kharif Cereals 193.83 129.59 208. l 1 224.52 183.37
(i) Rice 138.81 107.45 151.03 148.41 155.87
(ii) Jo war 126.23 73.71 146.54 149.30 90.l 1
(iii) Bajara 316.78 166.20 301 .78 327.61 264.21
(iv) Maize 92.87 113.71 l 41.46 160.94 137.88
(v) Small Millets 326.88 178.78 518.05 768.67 160.26
(2) Rabi Cereals 163.85 169.99 185.71 169.51 169.11
(i) Wheat 164.88 170.60 186.95 170.54 169.63
(ii) Barley 149.06 159.99 161.60 154.00 159.24
(iii) Small Millets 79.78 128.67 64.68 58.94 75.62
B. Pulses 152.57 113.13 140.09 152.49 119.85
( 1) Kharif Pulses 241.64 147.64 279.89 259.59 140.50
(i) Tur 170.43 124.37 242.73 256.01 427.26
(ii) Other Kharif Pulses 244.78 148.61 281.97 259.88 124.99
(2) Rabi Pulses 137.79 107.71 113.68 138.60 l 18.14
(i) Gram 137.08 106.72 111.82 137.87 116.81
(ii) Other Rabi Pulses 163.70 143.60 153.07 162.42 160.09
II. Non-Food Crops 151.58 152.94 173.17 132.43 157.67
A. Oilseeds 149.26 143.69 170.22 130.56 164.39
(l) Groundnut 198.39 191.32 279.21 281.55 273.83
(2) Sesamum 279.48 128.38 257.48 242.87 90.50
(3) Castorseed 373.29 519.06 618.60 588.66 634.23
(4) Rape & Mustard 141.29 140.13 159.59 115.55 153.26
(5) Linseed 127.33 157.34 192.47 191.95 199.19
B. Fibres 156. 78 191.95 181.32 117.29 117.59
( 1) Cotton 156.65 191.98 181.22 117.02 117.64
(2) Sanhemp 192.60 179.37 222.97 260.27 89.05
C. Spices & Condiments 285.41 254.91 296.33 425.94 385.68
(I) Chillies 285.20 254.89 295.98 427.77 387.96
(2) Ginger 319.66 257.73 360.53 192.64 129.80
D. Vegetables (Potatoes) 65 l.32 872.63 789.99 806.10 894.18
E. Others 122.76 135.79 130.37 134.85 129.00
( 1) Sugarcane 120.27 134.43 129.20 133.37 127.40
(2) Tobacco 200.55 206.72 175.39 206.04 220.08
All Commodities 161.30 148.08 175.95 157.52 154.86
R.F.- Revised Final Source - Directorate of Economics & Statistics, Rajasthan.
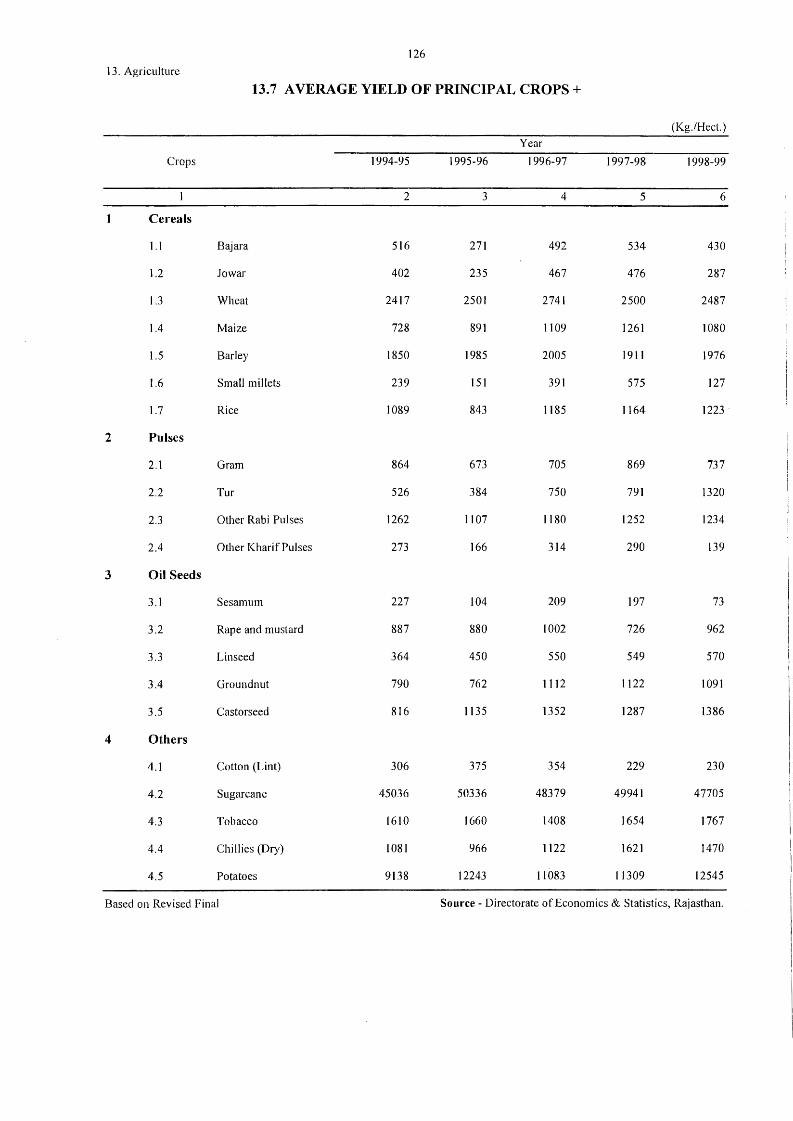
126
13. Agriculture
13.7 AVERAGE YIELD OF PRINCIPAL CROPS+
Crops 1994-95 1995-96 1996-97 1997-98 1998-99
2 3 4 5 6
Cereals
I.I Bajara 516 271 492 534 430
1.2 Jowar 402 235 467 476 287
1.3 Wheat 2417 2501 2741 2500 2487
1.4 Maize 728 891 1109 1261 1080
1.5 Barley 1850 1985 2005 1911 1976
1.6 Small millets 239 151 391 575 127
1.7 Rice 1089 843 1185 1164 1223
2 Pulses
2.1 Gram 864 673 705 869 737
2.2 Tur 526 384 750 791 1320
2.3 Other Rabi Pulses 1262 1107 1180 1252 1234
2.4 Other Kharif Pulses 273 166 314 290 139
3 Oil Seeds
3.1 Sesamum 227 104 209 197 73
3.2 Rape and mustard 887 880 1002 726 962
3.3 Linseed 364 450 550 549 570
3.4 Groundnut 790 762 1112 1122 1091
3.5 Castorseed 816 1135 1352 1287 1386
4 Others
4.1 Cotton (Lint) 306 375 354 229 230
4.2 Sugarcane 45036 50336 48379 49941 47705
4.3 Tobacco 1610 1660 1408 1654 1767
4.4 Chillies (Dry) 1081 966 1122 1621 1470
4.5 Potatoes 9138 12243 11083 11309 12545
Based on Revised Final Source - Directorate of Economics & Statistics, Rajasthan.
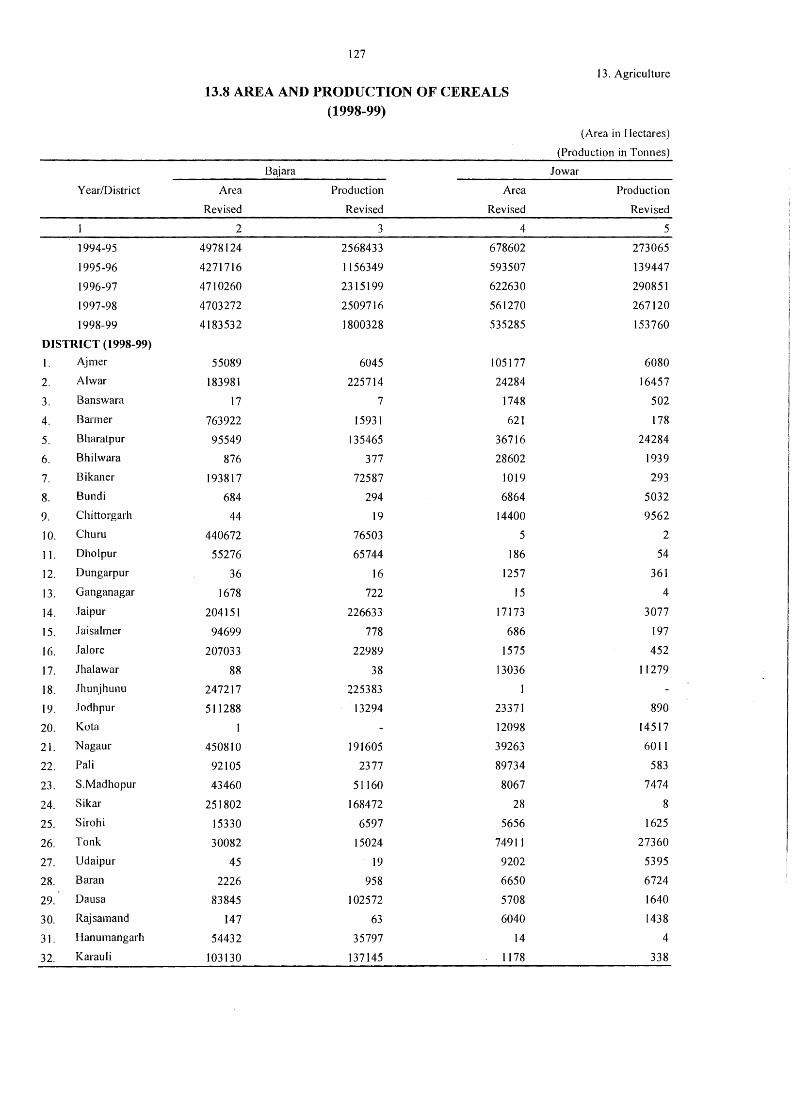
127
13. Agriculture
13.8 AREA AND PRODUCTION OF CEREALS (1998-99)
(Area in Hectares)
(Production in Tonnes)
Bajara Jo war
Year/District Area Production Area Production
Revised Revised Revised Revised
2 3 4 5
1994-95 4978124 2568433 678602 273065
1995-96 4271716 1156349 593507 139447
1996-97 4710260 2315199 622630 290851
1997-98 4703272 2509716 561270 267120
1998-99 4183532 1800328 535285 153760
DISTRICT (1998-99)
I. Ajmer 55089 6045 105177 6080
2. Al war 183981 225714 24284 16457
3. Banswara 17 7 1748 502
4. Barmer 763922 15931 621 178
5. Bharatpur 95549 135465 36716 24284
6. Bhilwara 876 377 28602 1939
7. Bikaner 193817 72587 1019 293
8. Bundi 684 294 6864 5032
9. Chittorgarh 44 19 14400 9562
10. Churn 440672 76503 5 2
11. Dholpur 55276 65744 186 54
12. Dungarpur 36 16 1257 361
13. Ganganagar 1678 722 15 4
14. Jaipur 204151 226633 17173 3077
15. .Jaisahner 94699 778 686 197
16. Jal ore 207033 22989 1575 452
17. Jhalawar 88 38 13036 11279
18. Jhunjhunu 247217 225383
19. Jodhpur 511288 13294 23371 890
20. Ko ta I 12098 14517
21. Nagaur 450810 191605 39263 6011
22. Pali 92105 2377 89734 583
23. S.Madhopur 43460 5I160 8067 7474
24. Sikar 251802 168472 28 8
25. Sirohi 15330 6597 5656 1625
26. Tonk 30082 15024 74911 27360
27. Udaipur 45 19 9202 5395
28. Baran 2226 958 6650 6724
29. Dausa 83845 102572 5708 1640
30. Rajsamand 147 63 6040 1438
31. Hanumangarh 54432 35797 14 4
32. Karau Ii 103130 137145 1178 338
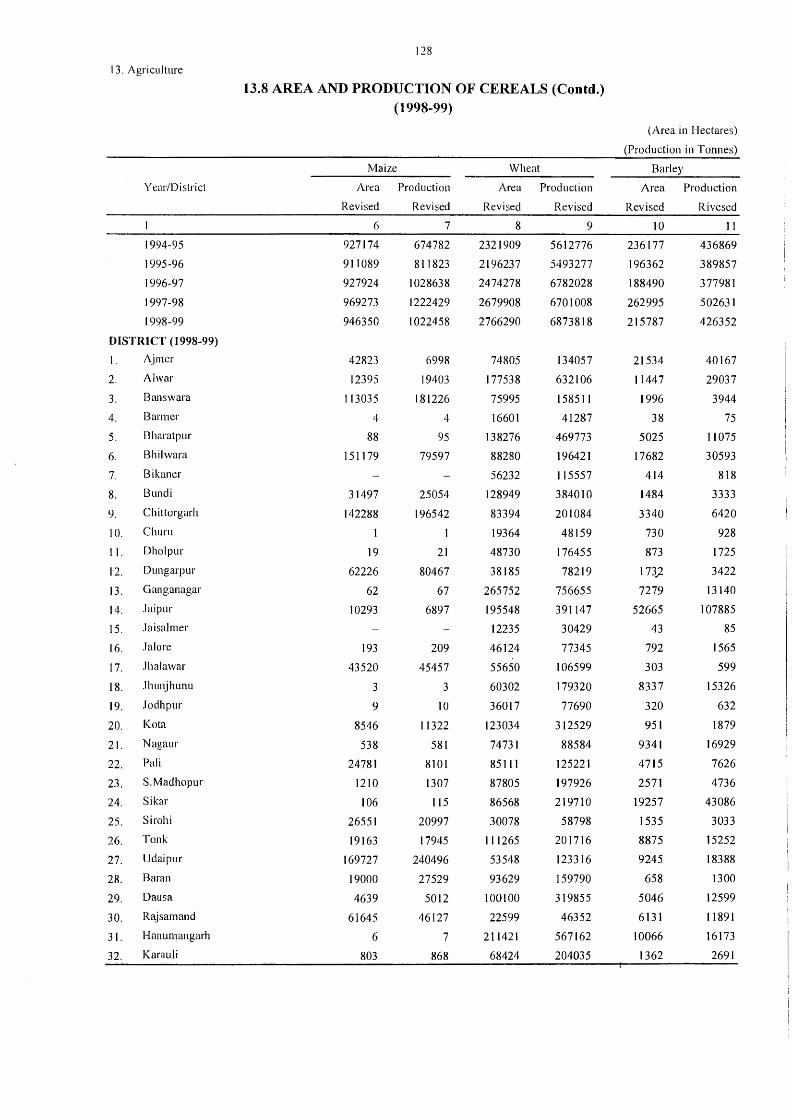
13. Agriculture
Year/Dislrict
1994-95
1995-96
1996-97
1997-98
1998-99
DISTRICT (1998-99)
I. /\jmcr
2. Al war
3. Banswara
4. Banner
5. Bharatpur
6. Bhilwara
7. Bikaner
8. Bundi
9. Chittorgarh
10. Churn
11. Dholpur
12. Dungarpur
13. Ganganagar
14. Jaipur
I 5. Jaisalmer
16. Jalore
I 7. Jhalawar
18. Jhunjhunu
19. .Jodhpur
20. Kota
21. Nagaur
22. Pali
23. S.Madhopur
24. Sikar
25. Sirohi
26. Tonk
27. Udaipur
28. Baran
29. Dausa
30. Rajsamand
3 I. Hanumangarh
32. Karauli
128
13.8 AREA AND PRODUCTION OF CEREALS (Contd.) (1998-99)
Maize
Area
Revised
6
927174
911089
927924
969273
946350
42823
12395
113035
4
88
151179
31497
142288
19
62226
62
10293
193
43520
3
9
8546
538
24781
1210
106
26551
19163
169727
19000
4639
61645
6
803
Production
Revised
7
674782
811823
1028638
1222429
1022458
6998
1.9403
181226
4
95
79597
25054
196542
21
80467
67
6897
209
45457
3
10
I 1322
581
8101
1307
115
20997
17945
240496
27529
5012
46127
7
868
Wheat
Area
Revised
8
2321909
2196237
2474278
2679908
2766290
74805
177538
75995
16601
138276
88280
56232
128949
83394
19364
48730
38185
265752
195548
12235
46124
55650
60302
36017
123034
74731
85111
87805
86568
30078
111265
53548
93629
100100
22599
211421
68424
Production
Revised
9
5612776
5493277
6782028
6701008
6873818
134057
632106
158511
41287
469773
196421
115557
384010
201084
48159
176455
78219
756655
391147
30429
77345
106599
179320
77690
312529
88584
125221
197926
219710
58798
201716
123316
159790
319855
46352
567162
204035
(Area in Hectares)
(Production in Tonnes)
Barley
Area
Revised
10
236177
196362
188490
262995
215787
21534
11447
1996
38
5025
17682
414
1484
3340
730
873
173)
7279
52665
43
792
303
8337
320
951
9341
4715
2571
19257
1535
8875
9245
658
5046
6131
10066
1362
Production
Rivcsed
11
436869
389857
377981
502631
426352
40167
29037
3944
75
11075
30593
818
3333
6420
928
1725
3422
13140
107885
85
1565
599
15326
632
1879
16929
7626
4736
43086
3033
15252
18388
1300
12599
11891
16173
2691
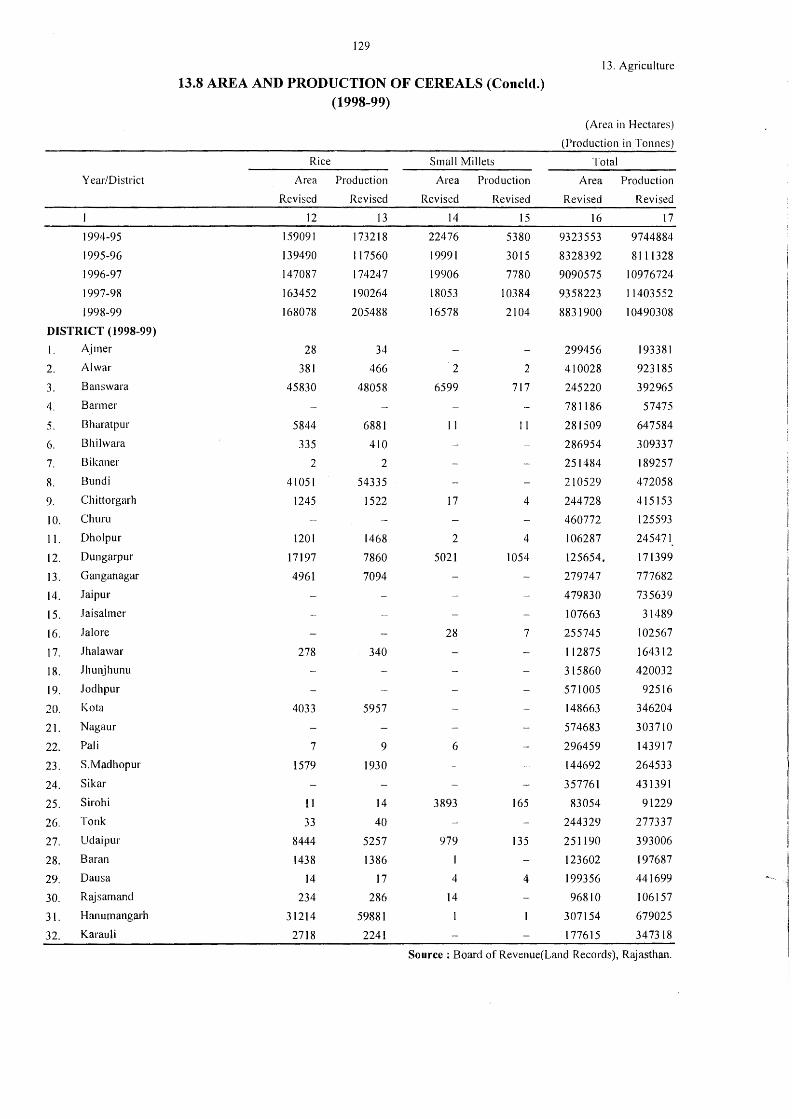
129
13. Agriculture
13.8 AREA AND PRODUCTION OF CEREALS (Concld.) (1998-99)
(Area in Hectares)
(Production in Tonnes)
Rice Small Millets Total
Year/District Area Production Area Production Area Production
Revised Revised Revised Revised Revised Revised
12 13 14 15 16 17
1994-95 159091 173218 22476 5380 9323553 9744884
1995-96 139490 117560 19991 3015 8328392 8111328
1996-97 147087 174247 19906 7780 9090575 10976724
1997-98 163452 190264 18053 10384 9358223 11403552
1998-99 168078 205488 16578 2104 8831900 10490308
DISTRICT (1998-99)
I. Ajmer 28 34 299456 193381
2. Al war 381 466 2 2 410028 923185
3. Banswara 45830 48058 6599 717 245220 392965
4. Barmer 781186 57475
5. Bharatpur 5844 6881 11 11 281509 647584
6. Bhilwara 335 410 286954 309337
7. Bikaner 2 2 251484 189257
8. Bundi 41051 54335 210529 472058
9. Chittorgarh 1245 1522 17 4 244728 415153
10. Churu 460772 125593
11. Dholpur 1201 1468 2 4 106287 245471
12. Dungarpur 17197 7860 5021 1054 125654. 171399
13. Ganganagar 4961 7094 279747 777682
14. Jaipur 479830 735639
15. Jaisalmer 107663 31489
16. Jal ore 28 7 255745 102567
17. Jhalawar 278 340 112875 164312
18. Jhunjhunu 315860 420032
19. Jodhpur 571005 92516
20. Ko ta 4033 5957 148663 346204
21. Nagaur 574683 303710
22. Pali 7 9 6 296459 143917
23. S.Madhopur 1579 1930 144692 264533
24. Sikar 357761 431391
25. Sirohi 11 14 3893 165 83054 91229
26. Tonk 33 40 244329 277337
27. Udaipur 8444 5257 979 135 251190 393006
28. Baran 1438 1386 123602 197687
29. Dausa 14 17 4 4 199356 441699
30. Rajsamand 234 286 14 96810 106157
31. Hanumangarh 31214 59881 307154 679025
32. Karau Ii 2718 2241 177615 347318
Source: Board ofRevenue(Land Records), Rajasthan.
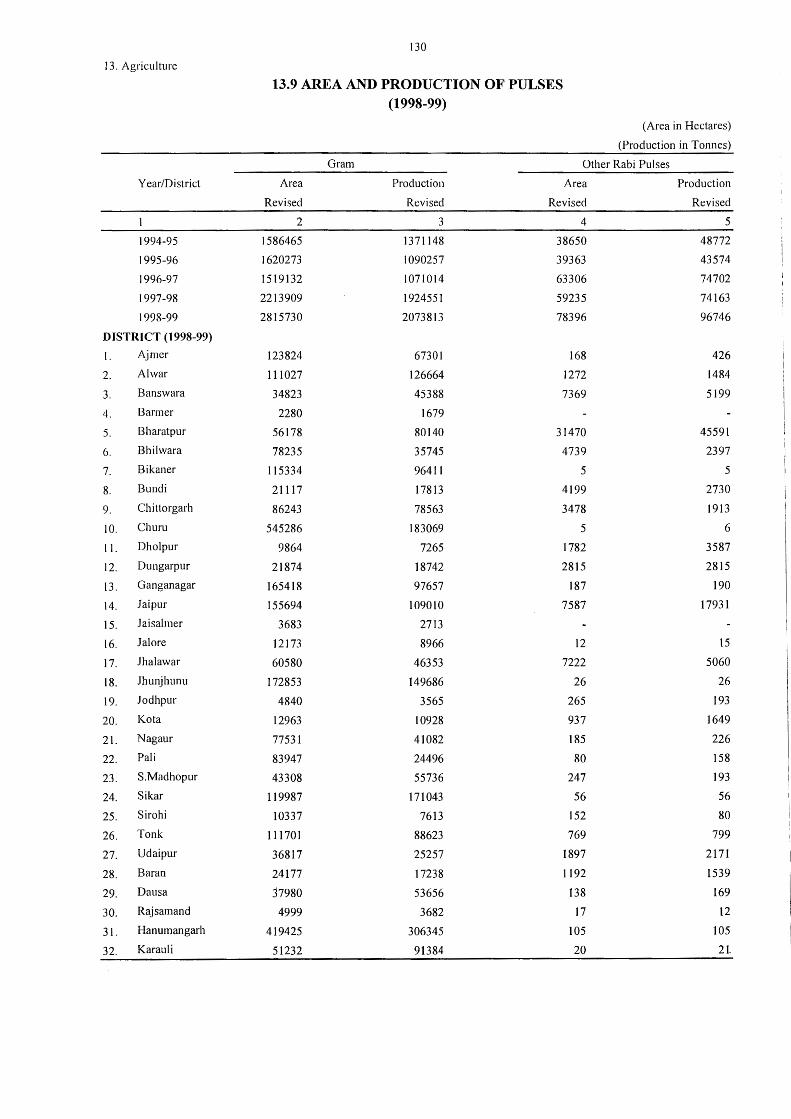
130
13. Agriculture
13.9 AREA AND PRODUCTION OF PULSES (1998-99)
(Area in Hectares)
(Production in Tonnes)
Gram Other Rabi Pulses
Year/District Area Production Area Production
Revised Revised Revised Revised
2 3 4 5
1994-95 1586465 1371148 38650 48772
1995-96 1620273 1090257 39363 43574
1996-97 1519132 1071014 63306 74702
1997-98 2213909 1924551 59235 74163
1998-99 2815730 2073813 78396 96746
DISTRICT (1998-99)
I. Ajmer 123824 67301 168 426
2. Al war 111027 126664 1272 1484
3. Banswara 34823 45388 7369 5199
4. Barmer 2280 1679
5. Bharatpur 56178 80140 31470 45591
6. Bhilwara 78235 35745 4739 2397
7. Bikaner 115334 96411 5 5
8. Bundi 21117 17813 4199 2730
9. Chittorgarh 86243 78563 3478 1913
10. Churn 545286 183069 5 6
11. Dholpur 9864 7265 1782 3587
12. Dungarpur 21874 18742 2815 2815
13. Ganganagar 165418 97657 187 190
14. Jaipur 155694 109010 7587 17931
15. Jaisalmer 3683 2713
16. Jal ore 12173 8966 12 15
17. Jhalawar 60580 46353 7222 5060
18. Jhunjhunu 172853 149686 26 26
19. Jodhpur 4840 3565 265 193
20. Ko ta 12963 10928 937 1649
21. Nagaur 77531 41082 185 226
22. Pali 83947 24496 80 158
23. S.Madhopur 43308 55736 247 193
24. Sikar 119987 171043 56 56
25. Sirohi 10337 7613 152 80
26. Tonk 111701 88623 769 799
27. Udaipur 36817 25257 1897 2171
28. Baran 24177 17238 1192 1539
29. Dausa :37980 53656 138 169
30. Rajsamand 4999 3682 17 12
31. Hanumangarh 419425 306345 105 105
32. Karauli 51232 91384 20 21.
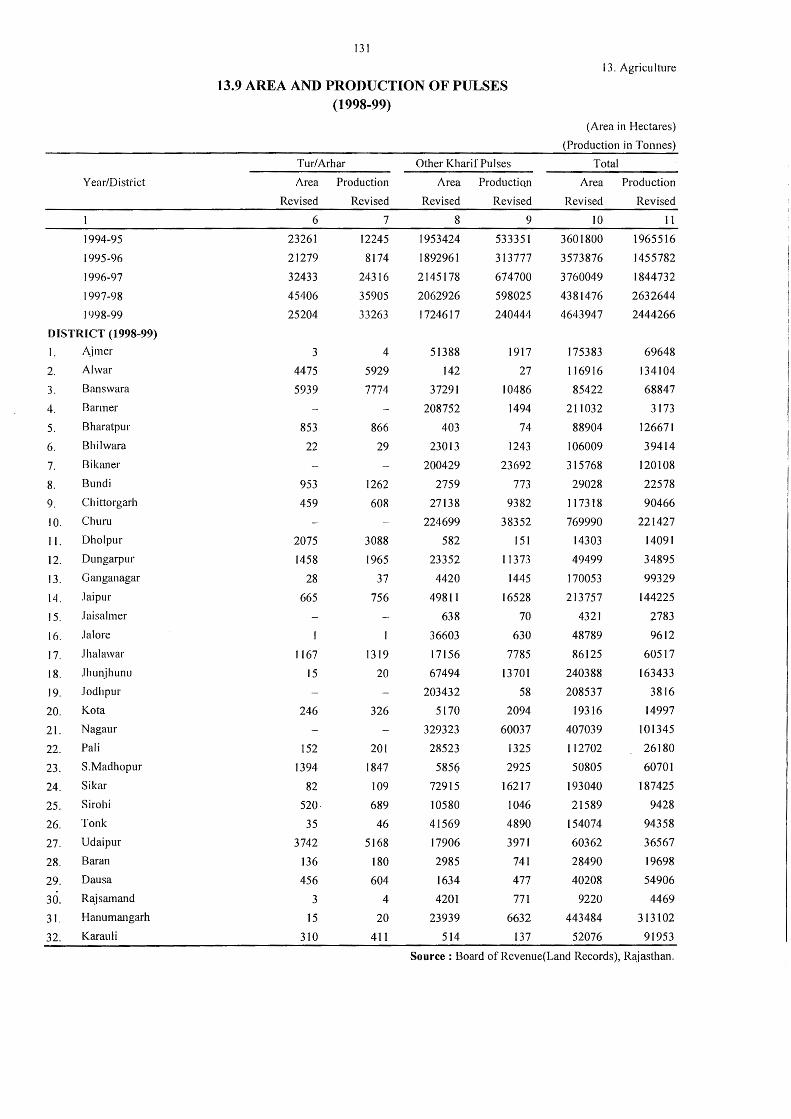
131
13. Agriculture
13.9 AREA AND PRODUCTION OF PULSES (1998-99)
(Area in Hectares)
(Production in Tonnes)
Tur/Arhar Other Kharif Pulses Total
Year/Disti"ict Area Production Area ProductiQn Area Production
Revised Revised Revised Revised Revised Revised
I 6 7 8 9 10 11
1994-95 23261 12245 1953424 533351 3601800 1965516
1995-96 21279 8174 1892961 313777 3573876 1455782
1996-97 32433 24316 2145178 674700 3760049 1844732
1997-98 45406 35905 2062926 598025 4381476 2632644
1998-99 25204 33263 1724617 240444 4643947 2444266
DISTRICT (1998-99)
I. Ajmer 3 4 51388 1917 175383 69648
2. Al war 4475 5929 142 27 116916 134104
3. Banswara 5939 7774 37291 10486 85422 68847
4. Barmer 208752 1494 211032 3173
5. Bharatpur 853 866 403 74 88904 126671
6. Bhilwara 22 29 23013 1243 106009 39414
7. Bikaner 200429 23692 315768 120108
8. Bundi 953 1262 2759 773 29028 22578
9. Chittorgarh 459 608 27138 9382 117318 90466
IO. Churn 224699 38352 769990 221427
11. Dholpur 2075 3088 582 151 14303 14091
12. Dungarpur 1458 1965 23352 11373 49499 34895
13. Ganganagar 28 37 4420 1445 170053 99329
14. Jaipur 665 756 49811 16528 213757 144225
15. Jaisalmer 638 70 4321 2783
16. Jal ore 36603 630 48789 9612
17. Jhalawar 1167 1319 17156 7785 86125 60517
18. Jhunjhunu 15 20 67494 13701 240388 163433
19. Jodhpur 203432 58 208537 3816
20. Ko ta 246 326 5170 2094 19316 14997
21. Nagaur 329323 60037 407039 101345
22. Pali 152 201 28523 1325 112702 26180
23. S.Madhopur 1394 1847 5856 2925 50805 60701
24. Sikar 82 109 72915 16217 193040 187425
25. Sirohi 520· 689 10580 1046 21589 9428
26. Tonk 35 46 41569 4890 154074 94358
27. Udaipur 3742 5168 17906 3971 60362 36567
28. Baran 136 180 2985 741 28490 19698
29. Daus a 456 604 1634 477 40208 54906
30. Rajsamand 3 4 4201 771 9220 4469
31. Hanumangarh 15 20 23939 6632 443484 313102
32. Karau Ii 310 411 514 137 52076 91953
Source: Board of Revenue(Land Records), Rajasthan.
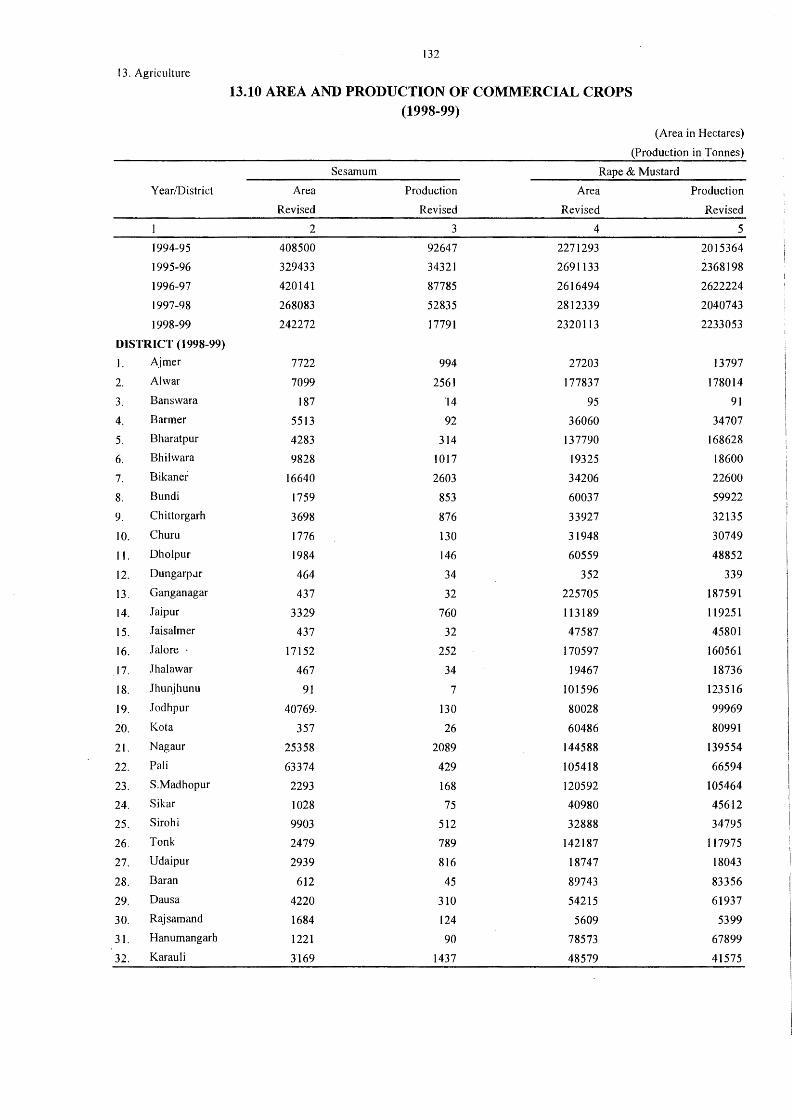
132
13. Agriculture
13.10 AREA AND PRODUCTION OF COMMERCIAL CROPS (1998-99)
(Area in Hectares)
(Production in _Tonnes)
Sesamum Rape & Mustard
Year/District Area Production Area Production
Revised Revised Revised Revised
2 3 4 5
1994-95 408500 92647 2271293 2015364
1995-96 329433 34321 2691133 2368198
1996-97 420141 87785 2616494 2622224
1997-98 268083 52835 2812339 2040743
1998-99 242272 17791 2320113 2233053
DISTRICT {1998-99)
1. Ajmer 7722 994 27203 13797
2. Al war 7099 2561 177837 178014
3. Banswara 187 '14 95 91
4. Barmer 5513 92 36060 34707
5. Bharatpur 4283 314 137790 168628
6. Bhilwara 9828 1017 19325 18600
7. Bikaner 16640 2603 34206 22600
8. Bundi 1759 853 60037 59922
9. Chittorgarh 3698 876 33927 32135
10. Chum 1776 130 31948 30749
11. Dholpur 1984 146 60559 48852
12. Dungarp..ir 464 34 352 339
13. Ganganagar 437 32 225705 187591
14. Jaipur 3329 760 113189 119251
15. .Taisalmer 437 32 47587 45801
16. Jalore · 17152 252 170597 160561
17. Jhalawar 467 34 19467 18736
18. Jhunjhunu 91 7 101596 123516
19. Jodhpur 40769. 130 80028 99969
20. Ko ta 357 26 60486 80991
21. Nagaur 25358 2089 144588 139554
22. Pali 63374 429 105418 66594
23. S.Madhopur 2293 168 120592 105464
24. Sikar 1028 75 40980 45612
25. Sirohi 9903 512 32888 34795
26. Tonk 2479 789 142187 117975
27. Udaipur 2939 816 18747 18043
28. Baran 612 45 89743 83356
29. Dausa 4220 310 54215 61937
30. Rajsamand 1684 124 5609 5399
31. Hanumangarh 1221 90 78573 67899
32. Karau Ii Jl69 1437 48579 41575
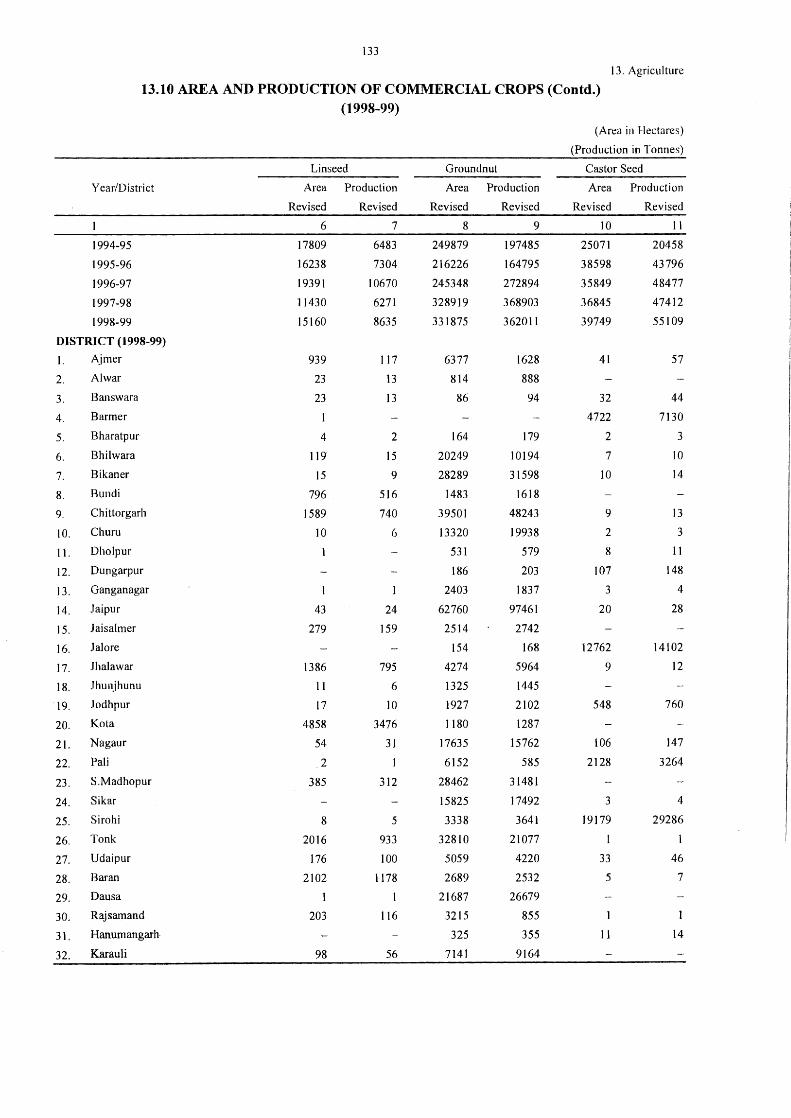
133
13. Agriculture
13.10 AREA AND PRODUCTION OF COMMERCIAL CROPS (Contd.) (1998-99)
(Area in Hectares)
(Production in Tonnes)
Linseed Groundnut Castor Seed
Year/District Area Production Area Production Area Production
Revised Revised Revised Revised Revised Revised
6 7 8 9 10 11
1994-95 17809 6483 249879 197485 25071 20458
1995-96 16238 7304 216226 164795 38598 43796
1996-97 19391 10670 245348 272894 35849 48477
1997-98 11430 6271 328919 368903 36845 47412
1998-99 15160 8635 331875 362011 39749 55109
DISTRICT (1998-99)
l. Ajmer 939 117 6377 1628 41 57
2. Al war 23 13 814 888
3. Banswara 23 13 86 94 32 44
4. Barmer 4722 7130
5. Bharatpur 4 2 164 179 2 3
6. Bhilwara 11g 15 20249 10194 7 10
7. Bikaner 15 9 28289 31598 10 14
8. Bundi 796 516 1483 1618
9. Chittorgarh 1589 740 39501 48243 9 13
10. Churn IO 6 13320 19938 2 3
11. Dholpur 531 579 8 11
12. Dungarpur 186 203 107 148
13. Ganganagar l 2403 1837 3 4
14. Jaipur 43 24 62760 97461 20 28
15. Jaisalmer 279 159 2514 2742
16. Jal ore 154 168 12762 14102
17. Jhalawar 1386 795 4274 5964 9 12
18. Jhunjhunu II 6 1325 1445
19. fodhpur 17 IO 1927 2102 548 760
20. Ko ta 4858 3476 1180 1287
21. Nagaur 54 31 17635 15762 106 147
22. Pali 2 6152 585 2128 3264
23. S.Madhopur 385 312 28462 31481
24. Sikar 15825 17492 3 4
25. Sirohi 8 5 3338 3641 19179 29286
26. Tonk 2016 933 328IO 21077
27. Udaipur 176 100 5059 4220 33 46
28. Baran 2102 1178 2689 2532 5 7
29. Dausa 21687 26679
30. Rajsamand 203 I 16 3215 855 1
31. Hanumangarh 325 355 l I 14
32. Karauli 98 56 7141 9164
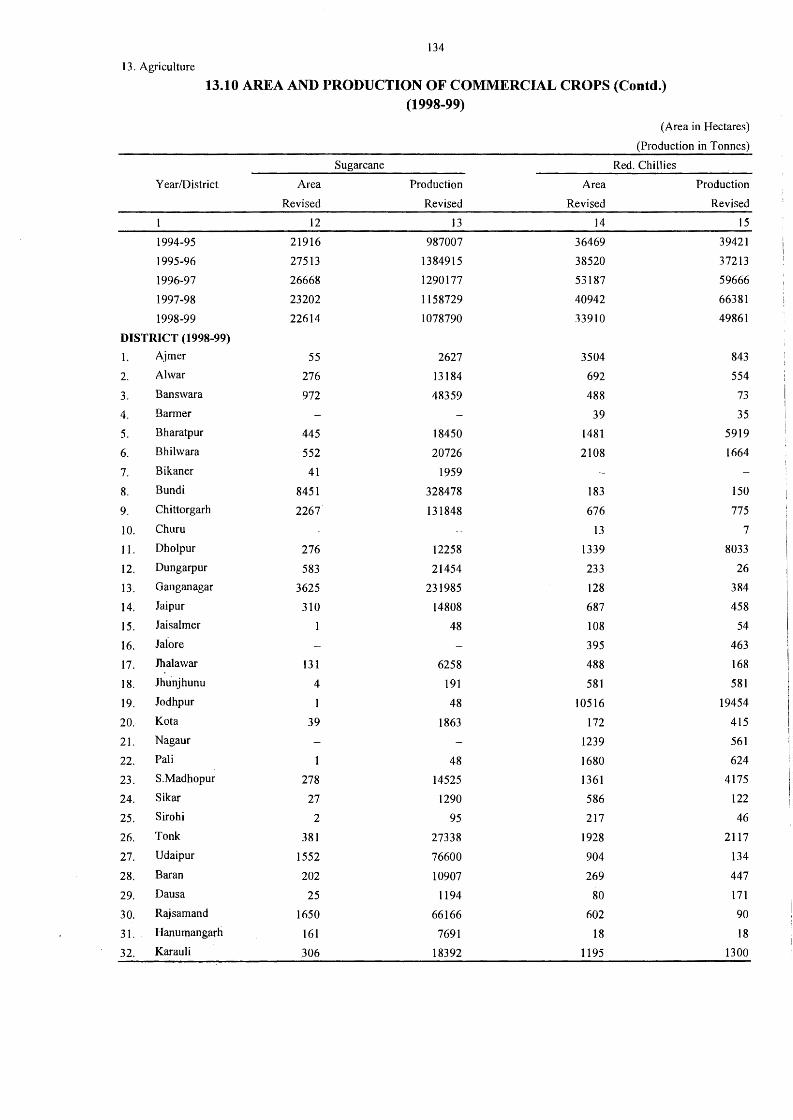
134
13. Agriculture
13.10 AREA AND PRODUCTION OF COMMERCIAL CROPS (Contd.) (1998-99)
(Area in Hectares)
(Production in Tonnes)
Sugarcane Red. Chillies
Year/District Area Production Area Production
Revised Revised Revised Revised
l 12 13 14 15
1994-95 21916 987007 36469 39421
1995-96 27513 1384915 38520 37213
1996-97 26668 1290177 53187 59666
1997-98 23202 1158729 40942 66381
1998-99 22614 1078790 33910 49861
DISTRICT (1998-99)
1. Ajmer 55 2627 3504 843
2. Al war 276 13184 692 554
3. Banswara 972 48359 488 73
4. Barmer 39 35
5. Bharatpur 445 18450 1481 5919
6. Bhilwara 552 20726 2108 1664
7. Bikaner 41 1959
8. Bundi 8451 328478 183 150
9. Chittorgarh 2267 131848 676 775
10. Churu 13 7
11. Dholpur 276 12258 1339 8033
12. Dungarpur 583 21454 233 26
13. Ganganagar 3625 231985 128 384
14. Jaipur 310 14808 687 458
15. Jaisalmer 1 48 108 54
16. Jalore 395 463
17. Jhalawar 131 6258 488 168
18. Jhunjhunu 4 191 581 581
19. Jodhpur 1 48 10516 19454
20. Ko ta 39 1863 172 415
21. Nagaur 1239 561
22. Pali 48 1680 624
23. S.Madhopur 278 14525 1361 4175
24. Sikar 27 1290 586 122
25. Sirohi 2 95 217 46
26. Tonk 381 27338 1928 2117
27. Udaipur 1552 76600 904 134
28. Baran 202 10907 269 447
29. Dausa 25 1194 80 171
30. Rajsamand 1650 66166 602 90
31. Hanumangarli 161 7691 18 18
32. Karau Ii 306 18392 1195 1300
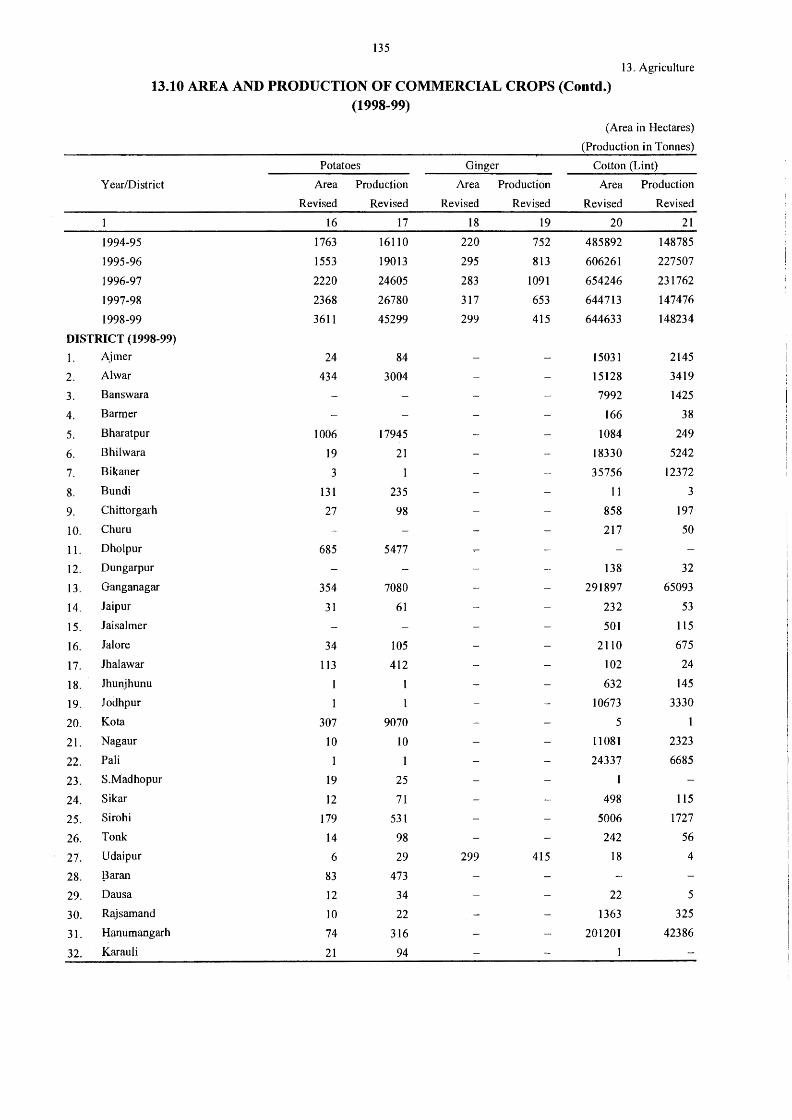
135
13. Agriculture
13.10 AREA AND PRODUCTION OF COMMERCIAL CROPS (Contd.) (1998-99)
(Area in Hectares)
(Production in Tonnes)
Potatoes Ginger Cotton (Lint)
Year/District Area Production Area Production Area Production
Revised Revised Revised Revised Revised Revised
16 17 18 19 20 21
1994-95 1763 16110 220 752 485892 148785
1995-96 1553 19013 295 813 606261 227507
1996-97 2220 24605 283 1091 654246 231762
1997-98 2368 26780 317 653 644713 147476
1998-99 3611 45299 299 415 644633 148234
DISTRICT (1998-99)
I. Ajmer 24 84 15031 2145
2. Al war 434 3004 15128 3419
3. Banswara 7992 1425
4. Barmer 166 38
5. Bharatpur 1006 17945 1084 249
6. Bhilwara 19 21 18330 5242
7. Bikaner 3 1 35756 12372
8. Bundi 131 235 11 3
9. Chittorgarh 27 98 858 197
10. Chum 217 50
11. Dholpur 685 5477
12. Dungarpur 138 32
13. Ganganagar 354 7080 291897 65093
14. Jaipur 31 61 232 53
15. Jaisalmer 501 115
16. Jal ore 34 105 2110 675
17. Jhalawar 113 412 102 24
18. Jhunjhunu 632 145
19. Jodhpur 1 10673 3330
20. Ko ta 307 9070 5 1
21. Nagaur IO IO 11081 2323
22. Pali 1 24337 6685
23. S.Madhopur 19 25 1
24. Sikar 12 71 498 115
25. Sirohi 179 531 5006 1727
26. Tonk 14 98 242 56
27. Udaipur 6 29 299 415 18 4
28. !3aran 83 473
29. Dausa l2 34 22 5
30. Rajsamand 10 22 1363 325
31. Hanumangarh 74 316 201201 42386
32. Karau Ii 21 94
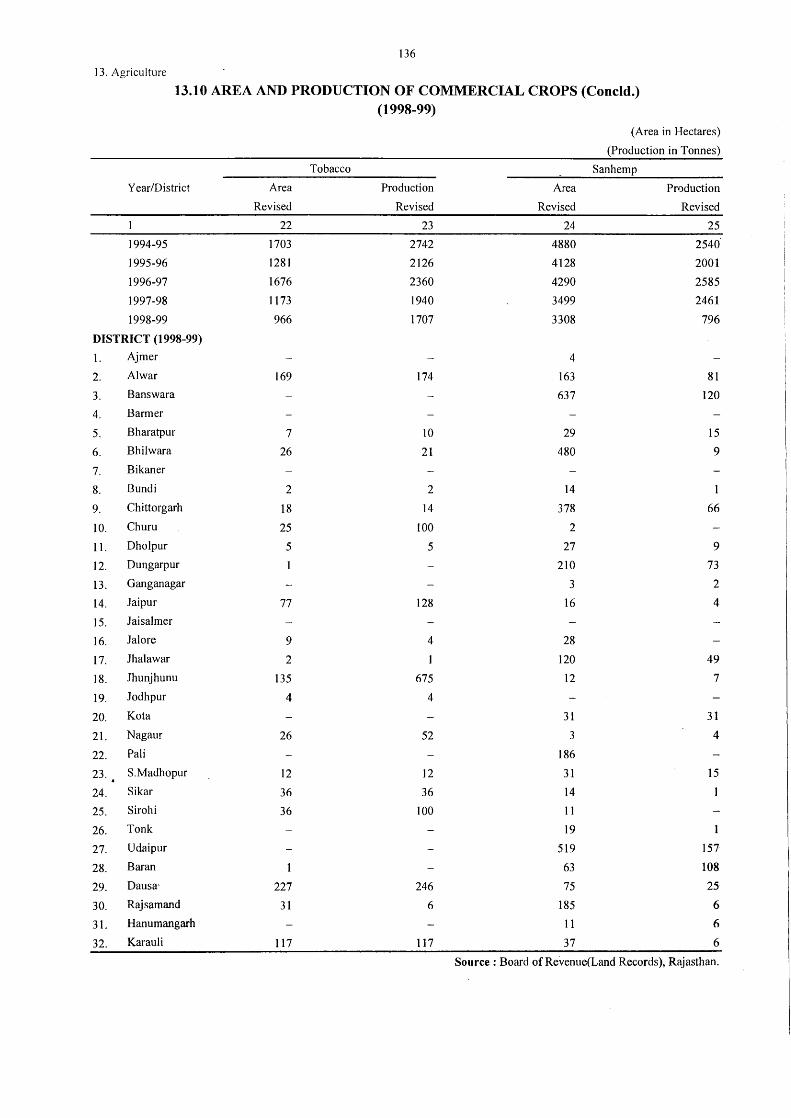
136
13. Agriculture
13.10 AREA AND PRODUCTION OF COMMERCIAL CROPS (Concld.) (1998-99)
(Area in Hectares)
(Production in Tonnes)
Tobacco Sanhemp
Year/District Area Production Area Production
Revised Revised Revised Revised
22 23 24 25
1994-95 1703 2742 4880 2540
1995-96 1281 2126 4128 2001
1996-97 1676 2360 4290 2585
1997-98 1173 1940 3499 2461
1998-99 966 1707 3308 796
DISTRICT (1998-99)
I. Ajmer 4
2. Al war 169 174 163 81
3. Banswara 637 120
4. Barmer
5. Bharatpur 7 10 29 15
6. Bhilwara 26 21 480 9
7. Bikaner
8. Bundi 2 2 14 1
9. Chittorgarh 18 14 378 66
10. Chum 25 100 2
11. Dholpur 5 5 27 9
12. Dungarpur 210 73
13. Gang an agar 3 2
14. Jaipur 77 128 16 4
15. Jaisalmer
16. Jal ore 9 4 28
17. Jhalawar 2 1 120 49
18. .Thunjhunu 135 675 12 7
19. Jodhpur 4 4
20. Ko ta 31 31
21. Nagaur 26 52 3 4
22. Pali 186
23. S.Madhopur 12 12 31 15
24. Sikar 36 36 14
25. Sirohi 36 100 11
26. Tonk 19
27. Udaipur 519 157
28. Baran 63 108
29. Dausa· 227 246 75 25
30. Rajsamand 31 6 185 6
31. Hanumangarh 11 6
32. Karau Ii 117 117 37 6
Source: Board of Revenue(Land Records), Rajasthan.
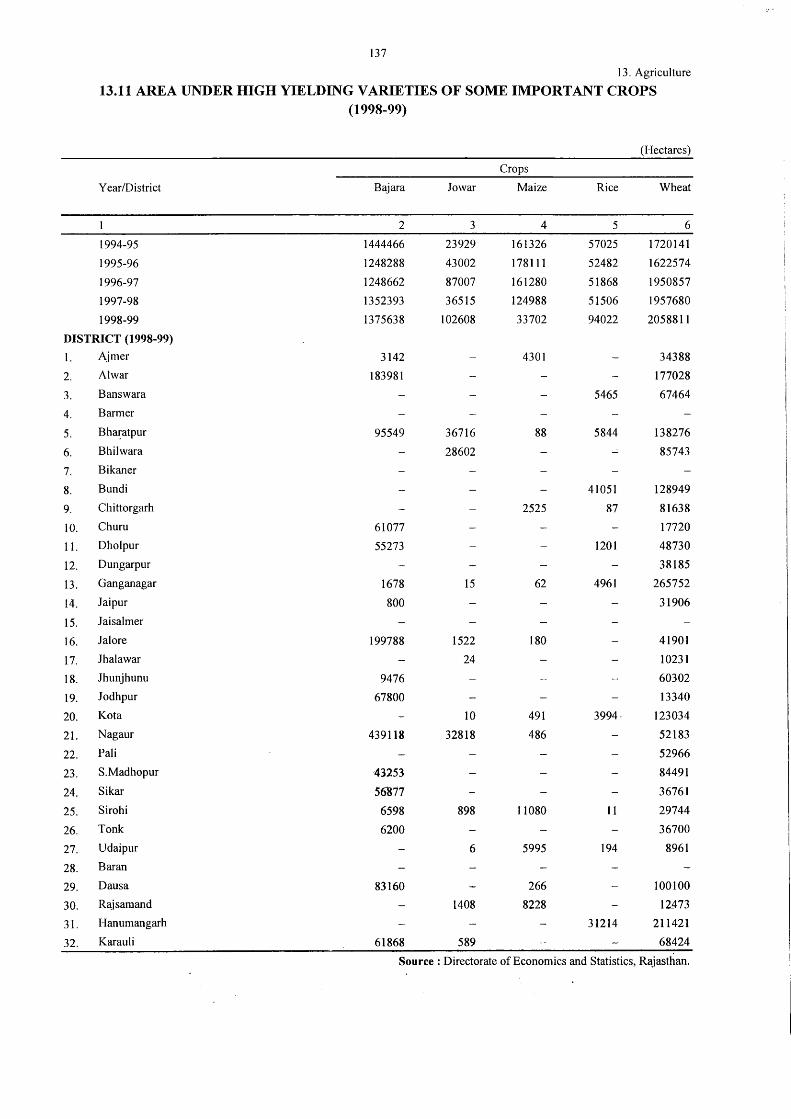
137
13. Agriculture
13.11 AREA UNDER IDGH YIELDING VARIETIES OF SOME IMPORTANT CROPS (1998-99)
(Hectares)
Crops
Year/District Bajara Jo war Maize Rice Wheat
2 3 4 5 6
1994-95 1444466 23929 161326 57025 1720141
1995-96 1248288 43002 178111 52482 1622574
1996-97 1248662 87007 161280 51868 1950857
1997-98 1352393 36515 124988 51506 1957680
1998-99 1375638 102608 33702 94022 2058811
DISTRICT (1998-99)
1. Ajmer 3142 4301 34388
2. Al war 183981 177028
3. Banswara 5465 67464
4. Barmer
5. Bha~atpur 95549 36716 88 5844 138276
6. Bhilwara 28602 85743
7. Bikaner
8. Bundi 41051 128949
9. Chittorgarh 2525 87 81638
10. Churn 61077 17720
11. Dholpur 55273 1201 48730
12. Dungarpur 38185
13. Ganganagar 1678 15 62 4961 265752
14. Jaipur 800 31906
15. Jaisalmer
16. Jalore 199788 1522 180 41901
17. Jhalawar 24 10231
18. Jhunjhunu 9476 60302
19. Jodhpur 67800 13340
20. Ko ta 10 491 3994, 123034
21. Nagaur 439118 32818 486 52183
22. Pali 52966
23. S.Madhopur 43253 84491
24. Sikar 56877 36761
25. Sirohi 6598 898 11080 11 29744
26. Tonk 6200 36700
27. Udaipur 6 5995 194 8961
28. Baran
29. Daus a 83160 266 100100
30. Rajsamand 1408 8228 12473
31. Hanumangarh 31214 211421
32. Karau Ii 61868 589 68424
Source: Directorate of Economics and Statistics, Rajasthan.
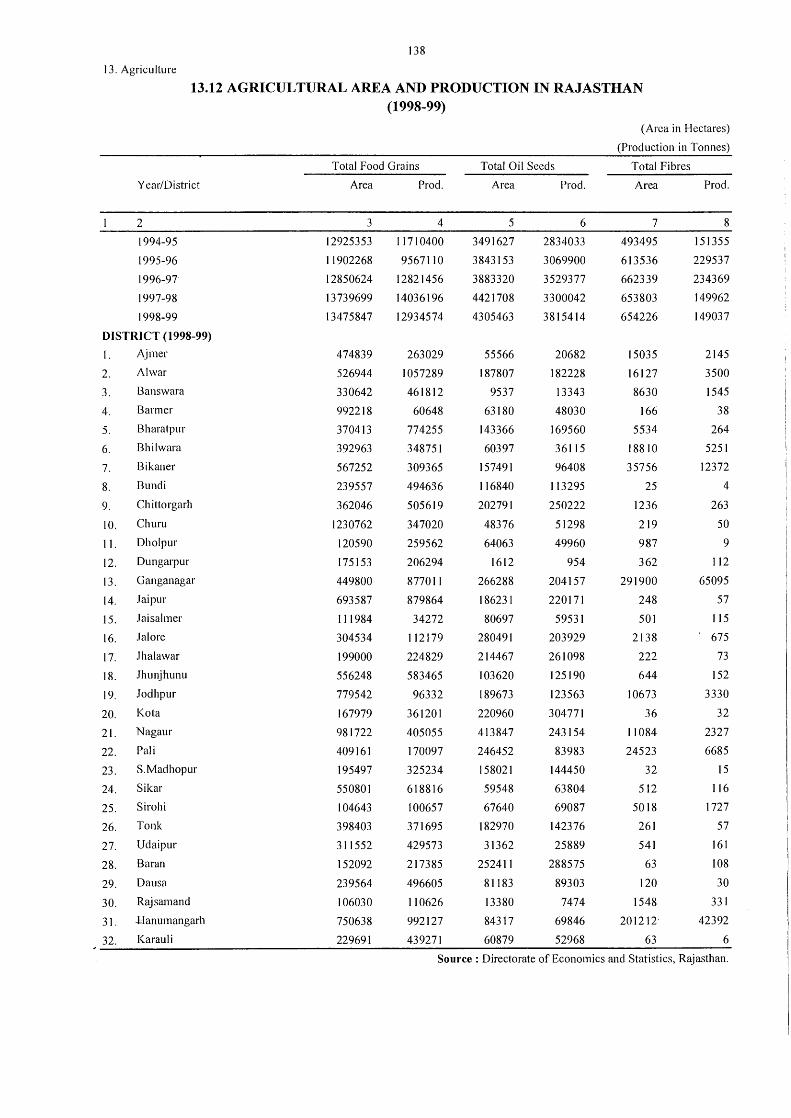
138
13. Agriculture
13.12 AGRICULTURAL AREA AND PRODUCTION IN RAJASTHAN (1998-99)
Year/District
2
1994-95
1995-96
1996-97
1997-98
1998-99
DISTRICT (1998-99)
I. Ajmer
2. Al war
3. Banswara
4. Barmer
5. Bharatpur
6. Bhilwara
7. Bikaner
8. Bundi
9. Chittorgarh
10. Churu
11. Dholpur
12. Dungarpur
13. Ganganagar
14. Jaipur
15. .Jaisalmer
16. .Jalore
17. Jhalawar
18. Jhunjhunu
19. Jodhpur
20. Kota
21. Nagaur
22. Pali
23. S.Madhopur
24. Sikar
25. Sirohi
26. Tonk
27. Udaipur
28. Baran
29. Dausa
30. Rajsamand
31. .Hanumangarh
32. Karauli
Total Food Grains
Area Prod.
3
12925353
11902268
12850624
13739699
13475847
474839
526944
330642
992218
370413
392963
567252
239557
362046
1230762
120590
175153
449800
693587
111984
304534
199000
556248
779542
167979
981722
409161
195497
550801
104643
398403
311552
152092
239564
106030
750638
229691
4
11710400
9567110
12821456
14036196
12934574
263029
1057289
461812
60648
774255
348751
309365
494636
505619
347020
259562
206294
877011
879864
34272
112179
224829
583465
96332
361201
405055
170097
325234
618816
100657
371695
429573
217385
496605
110626
992127
439271
Total Oil Seeds
Area Prod.
5
3491627
3843153
3883320
4421708
4305463
55566
187807
9537
63180
143366
60397
157491
116840
202791
48376
64063
1612
266288
186231
80697
280491
214467
103620
189673
220960
413847
246452
158021
59548
67640
182970
31362
252411
81183
13380
84317
60879
6
2834033
3069900
3529377
3300042
3815414
20682
182228
13343
48030
169560
36115
96408
113295
250222
51298
49960
954
204157
220171
59531
203929
261098
125190
123563
304771
243154
83983
144450
63804
69087
142376
25889
288575
89303
7474
69846
52968
(Arca in Hectares)
(Production in Tonnes)
Total Fibres
Area Prod.
7
493495
613536
662339
653803
654226
15035
16127
8630
166
5534
18810
35756
25
1236
219
987
362
291900
248
501
2138
222
644
10673
36
11084
24523
32
512
5018
261
541
63
120
1548
201212·
63
8
151355
229537
234369
149962
149037
2145
3500
1545
38
264
5251
12372
4
263
50
9
112
65095
57
115
675
73
152
3330
32
2327
6685
15
116
1727
57
161
108
30
331
42392
6
Source : Directorate of Economics and Statistics, Rajasthan.
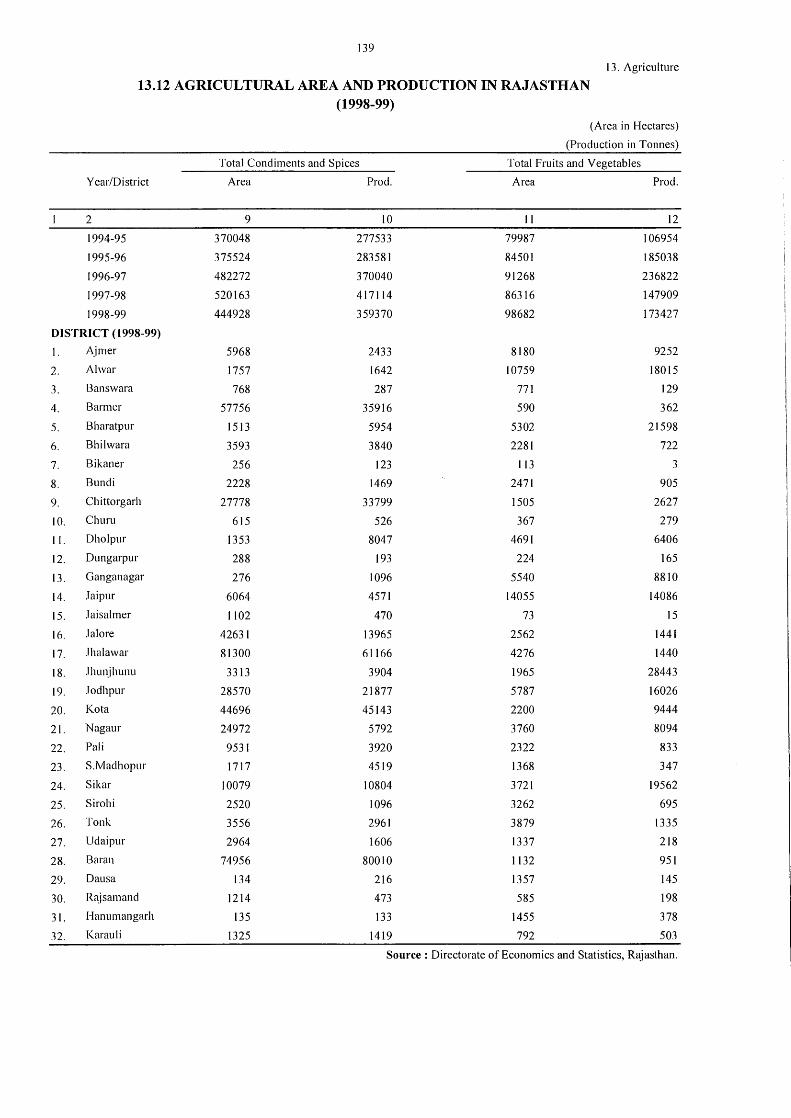
139
13. Agriculture
13.12 AGRICULTURAL AREA AND PRODUCTION IN RAJASTHAN (1998-99)
(Area in Hectares)
(Production in Tonnes)
Total Condiments and Spices Total Fruits and Vegetables
Year/District Area Prod. Area Prod.
2 9 10 II 12
1994-95 370048 277533 79987 106954
1995-96 375524 283581 84501 185038
1996-97 482272 370040 91268 236822
1997-98 520163 417114 86316 147909
1998-99 444928 359370 98682 173427
DISTRICT (1998-99)
I. Ajmer 5968 2433 8180 9252
2. Al war 1757 1642 10759 18015
3. Banswara 768 287 771 129
4. Banner 57756 35916 590 362
5. Bharatpur 1513 5954 5302 21598
6. Bhilwara 3593 3840 2281 722
7. Bikaner 256 123 113 3
8. Bundi 2228 1469 2471 905
9. Chittorgarh 27778 33799 1505 2627
10. Churn 615 526 367 279
I I. Dholpur 1353 8047 4691 6406
12. Dungarpur 288 193 224 165
13. Ganganagar 276 1096 5540 8810
14. Jaipur 6064 4571 14055 14086
15. .Taisalmer 1102 470 73 15
16. .la lore 42631 13965 2562 1441
17. Jhalawar 81300 61166 4276 1440
18. .lhunjhunu 3313 3904 1965 28443
19. Jodhpur 28570 21877 5787 16026
20. Ko ta 44696 45143 2200 9444
21. Nagaur 24972 5792 3760 8094
22. Pali 9531 3920 2322 833
23. S.Madhopur 1717 4519 1368 347
24. Sikar 10079 10804 3721 19562
25. Sirohi 2520 1096 3262 695
26. Tonk 3556 2961 3879 1335
27. Udaipur 2964 1606 1337 218
28. Baran 74956 80010 1132 951
29. Dausa 134 216 1357 145
30. Rnjsamand 1214 473 585 198
31. Hanumangarh 135 133 1455 378
32. Karau Ii 1325 1419 792 503
Source : Directorate of Economics and Statistics, Rajasthan.
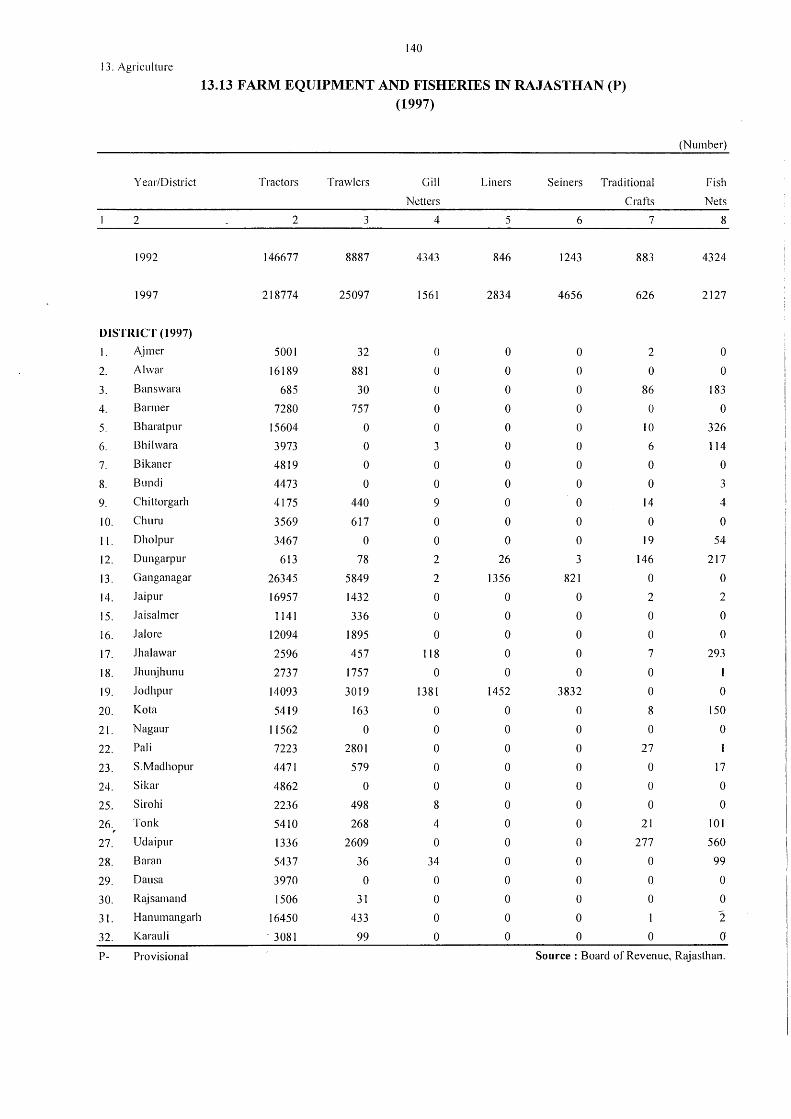
13. Agriculture
Year/District
2
1992
1997
DISTRICT (1997)
I. Ajrner
2. Al war
3. Banswara
4. Barmer
5. Bharatpur
6. Bhilwara
7. Bikaner
8. Bundi
9. Chittorgarh
10. Churu
11. Dholpur
12. Dungarpur
13. Ganganagar
14. Jaipur
15. Jaisalmer
16. Jalore
17. Jhalawar
18. Jhunjhunu
19. Jodhpur
20. Kota
21. Nagaur
22. Pali
23. S.Madhopur
24. Sikar
25. Sirohi
26. Tonk
27. Udaipur
28. Baran
29. Dausa
30. Rajsamand
31. Hanumangarh
32. Karauli
P- Provisional
140
13.13 FARM EQUIPMENT AND FISHERIES IN RAJASTHAN (P) (1997)
Tractors
2
146677
218774
5001
16189
685
7280
15604
3973
4819
4473
4175
3569
3467
613
26345
16957
1141
12094
2596
2737
14093
5419
11562
7223
4471
4862
2236
5410
1336
5437
3970
1506
16450
. 3081
Trawlers
3
8887
25097
32
881
30
757
0
0
0
0
440
617
0
78
5849
1432
336
1895
457
1757
3019
163
0
2801
579
0
498
268
2609
36
0
31
433
99
Gill
Netters
4
4343
1561
0
0
0
0
0
3
0
0
9
0
0
2
2
0
0
0
118
0
1381
0
0
0
0
0
8
4
0
34
0
0
0
0
Liners
5
846
2834
0
0
0
0
0
0
0
0
0
0
0
26
1356
0
0
0
0
0
1452
0
0
0
0
0
0
0
0
0
0
0
0
0
Seiners Traditional
6
1243
4656
0
0
0
0
0
0
0
0
0
0
0
3
821
0
0
0
0
0
3832
0
0
0
0
0
0
0
0
0
0
0
0
0
Crafts
7
883
626
2
0
86
0
10
6
0
0
14
0
19
146
0
2
0
0
7
0
0
8
0
27
0
0
0
21
277
0
0
0
I
0
(Number)
Fish
Nets
8
4324
2127
0
0
183
0
326
114
0
3
4
0
54
217
0
2
0
0
293
l
0
150
0
17
0
0
101
560
99
0
0
2 a
Source : Board of Revenue, Rajasthan.
(14) IRRIGATION
NET IRRIGATED AREA - The area irrigated from different sources represents the net irrigated area. If two or more crops are irrigated in the same year from the same source the area is counted only once.
GROSS IRRIGATED AREA - Total area irrigated under different crops represents the
gross irrigated area and includes area irrigated under more than one crop during the same
year. Area irrigated more than once in a single harvest is counted only once.
The data on irrigation by sources and crops is compiled by the Board of Revenue
(Land Records), Rajasthan from the data contained in the Annu~I Agricultural Statistics
Returns prepared by the Revenue Staff. The information on irrigation works is supplied by
the irrigation department, Rajasthan. The data Contained in Table No. 14.1 relates only to
plan works in progress.
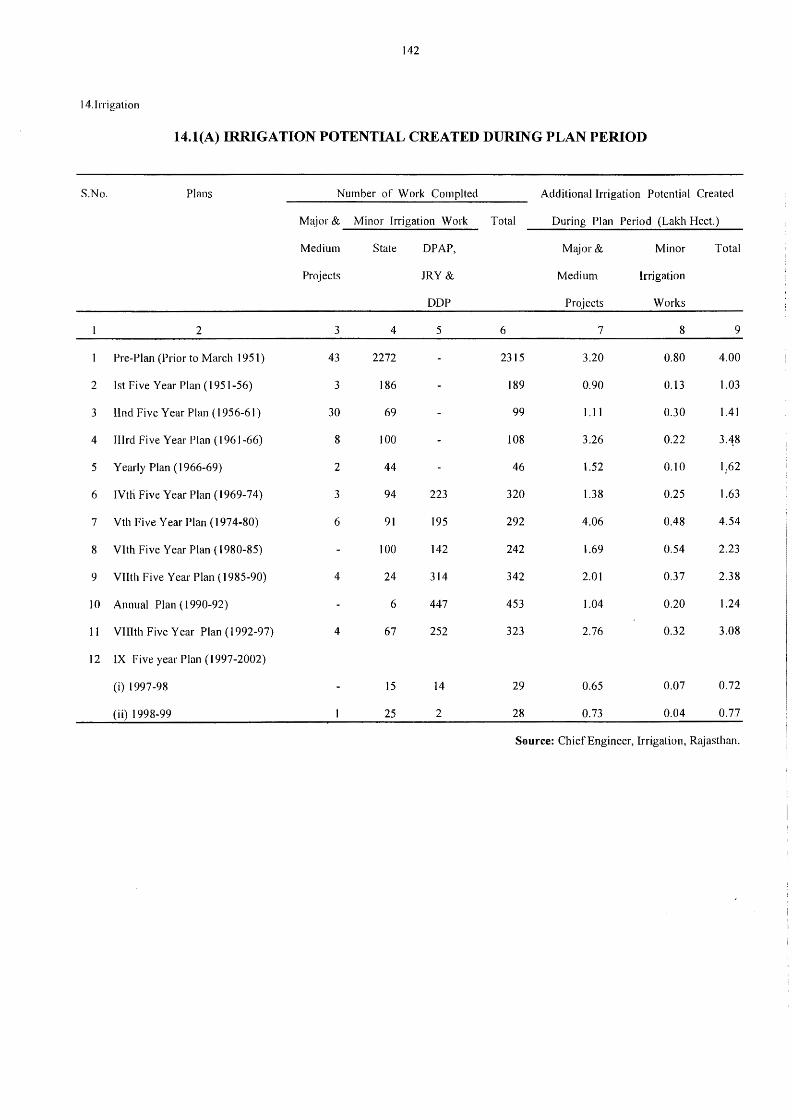
142
14. Irrigation
14.l(A) IRRIGATION POTENTIAL CREATED DURING PLAN PERIOD
S.No. Plans Number of Work Complted Additional Irrigation Potential Created
Major & Minor Irrigation Work Total During Plan Period (Lakh Hect.)
Medium State OPAP, Major& Minor Total
Projects JRY & Medium Irrigation
DDP Projects Works
2 3 4 5 6 7 8 9
Pre-Plan (Prior to March 1951) 43 2272 2315 3.20 0.80 4.00
2 Ist Five Year Plan (1951-56) 3 186 189 0.90 0.13 1.03
3 llnd Five Year Plan ( 1956-61) 30 69 99 1.11 0.30 1.41
4 Illrd Five Year Plan (1961-66) 8 100 108 3.26 0.22 3.48
5 Yearly Plan ( 1966-69) 2 44 46 1.52 0.10 1;62
6 IVtti Five Year Plan (1969-74) 3 94 223 320 1.38 0.25 1.63
7 Vth Five Year Plan (1974-80) 6 91 195 292 4.06 0.48 4.54
8 VI th Five Year Plan ( 1980-85) 100 142 242 1.69 0.54 2.23
9 Vllth Five Year Plan ( 1985-90) 4 24 314 342 2.01 0.37 2.38
10 Annual Plan ( 1990-92) 6 447 453 1.04 0.20 1.24
11 VIII th Five Year Plan ( 1992-97) 4 67 252 323 2.76 0.32 3.08
12 IX Five year Plan (1997-2002)
(i) 1997-98 15 14 29 0.65 0.07 0.72
(ii) 1998-99 25 2 28 0.73 0.04 0.77
Source: Chief Engineer, Irrigation, Rajasthan.
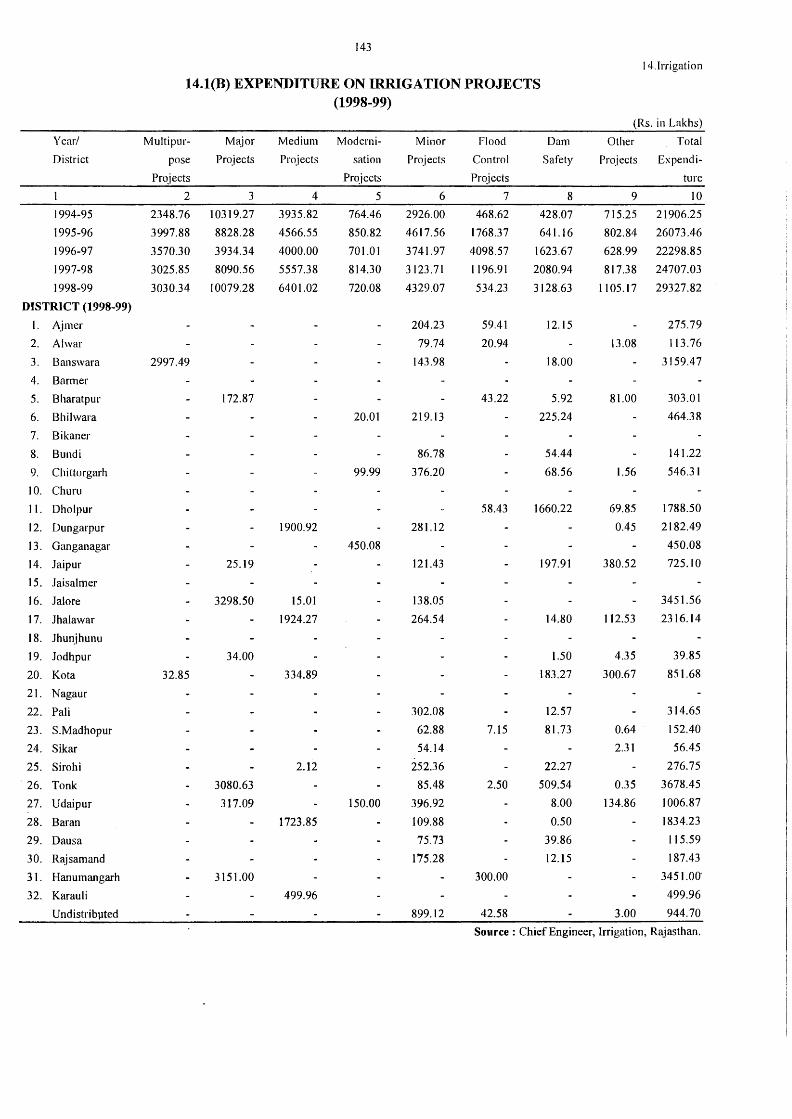
143
14.Irrigation
14.l(B) EXPENDITURE ON IRRIGATION PROJECTS (1998-99)
(Rs. in Lakhs)
Year/ Multipur- Major Medium Moderni- Minor Flood Dam Other Total
District pose Projects Projects sat ion Projects Control Safety Projects Expendi-
Projects Projects Projects tu re
2 3 4 5 6 7 8 9 IO
1994-95 2348.76 10319.27 3935.82 764.46 2926.00 468.62 428.07 715.25 21906.25
1995-96 3997.88 8828.28 4566.55 850.82 4617.56 1768.37 641.16 802.84 26073.46
1996-97 3570.30 3934.34 4000.00 701.0 I 3741.97 4098.57 1623.67 628.99 22298.85
1997-98 3025.85 8090.56 5557.38 814.30 3123.71 1196.91 2080.94 817.38 24707.03
1998-99 3030.34 10079.28 6401.02 720.08 4329.07 534.23 3128.63 I 105.17 29327.82
DISTRICT (1998-99)
I. Ajmer 204.23 59.41 12.15 275.79
2. Al war 79.74 20.94 13.08 113.76
3. Banswara 2997.49 143.98 18.00 3159.47
4. Barmer
5. Bharatpur 172.87 43.22 5.92 81.00 303.01
6. Bhilwara 20.01 219.13 225.24 464.38
7. Bikaner
8. Bundi 86.78 54.44 141.22
9. Chittorgarh 99.99 376.20 68.56 1.56 546.31
IO. Churu
11. Dholpur 58.43 1660.22 69.85 1788.50
12. Dungarpur 1900.92 281.12 0.45 2182.49
13. Ganganagar 450.08 450.08
14. Jaipur 25.19 121.43 197.91 380.52 725.IO
15. Jaisalmer
16. Jalore 3298.50 15.01 138.05 3451.56
17. Jhalawar 1924.27 264.54 14.80 112.53 2316.14
18. Jhunjhunu
19. Jodhpur 34.00 1.50 4.35 39.85
20. Ko ta 32.85 334.89 183.27 300.67 851.68
21. Nagaur
22. Pali 302.08 12.57 314.65
23. S.Madhopur 62.88 7.15 81.73 0.64 152.40
24. Sikar 54.14 2.31 56.45
25. Sirohi 2.12 252.36 22.27 276.75
. 26. Tonk 3080.63 85.48 2.50 509.54 0.35 3678.45
27. Udaipur 317.09 150.00 396.92 8.00 134.86 1006.87
28. Baran 1723.85 109.88 0.50 1834.23
29. Dausa 75.73 39.86 115.59
30. Rajsamand 175.28 12.15 187.43
31. Hanumangarh 3151.00 300.00 3451.00'
32. Karau ti 499.96 499.96
Undistribµted 899.12 42.58 3.00 944.70
Source : Chief Engineer, Irrigation, Rajasthan.
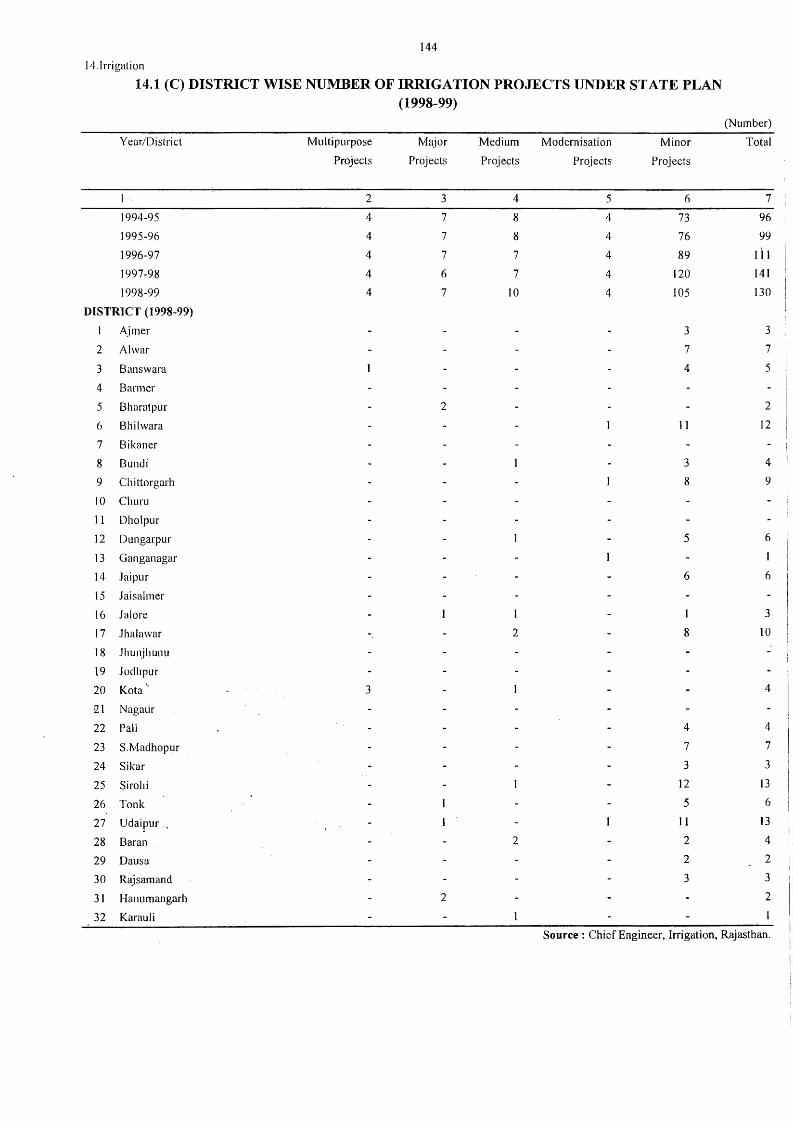
144
14.lrrigation
14.1 (C) DISTRICT WISE NUMBER OF IRRIGATION PROJECTS UNDER STATE PLAN (1998-99)
(Number)
Year/District Multipurpose Ma,jor Medium Modernisation Minor Total
Projects Projects Projects Projects Projects
2 3 4 5 6 7
1994-95 4 7 8 4 73 96
1995-96 4 7 8 4 76 99
1996-97 4 7 7 4 89 I1 t 1997-98 4 6 7 4 120 141
1998-99 4 7 10 4 105 130
DISTRICT (1998-99)
l Ajmer 3 3
2 Al war 7 7
3 Banswara 4 5
4 Barmer
5 Bharatpur 2 2
6 Bliilwara 11 12
7 Bikaner
8 Bundi 3 4
9 Chittorgarh 8 9
IO Churu
11 Dholpur
12 Dungarpur 5 6
13 Ganganagar 1
14 Jaipur 6 6
15 Jaisalrner
16 Jal ore I 3
17 Jhalawar 2 8 10
18 .Jhunjhunu
19 Jodhpur
20 Ko ta ·- 3 4
iZ l Nagmir
22 Pali 4 4
23 S.Madhopur 7 7
24 Sikar 3 3
25 Sirohi 12 13
26 Tonk 5 6
27 Udaipur 11 13
28 Baran 2 2 4
29 Daus a 2 2
30 Rajsamand 3 3
31 Hanumangarh 2 2
32 Karau Ii
Source : Chief Engineer, Irrigation, Rajasthan.
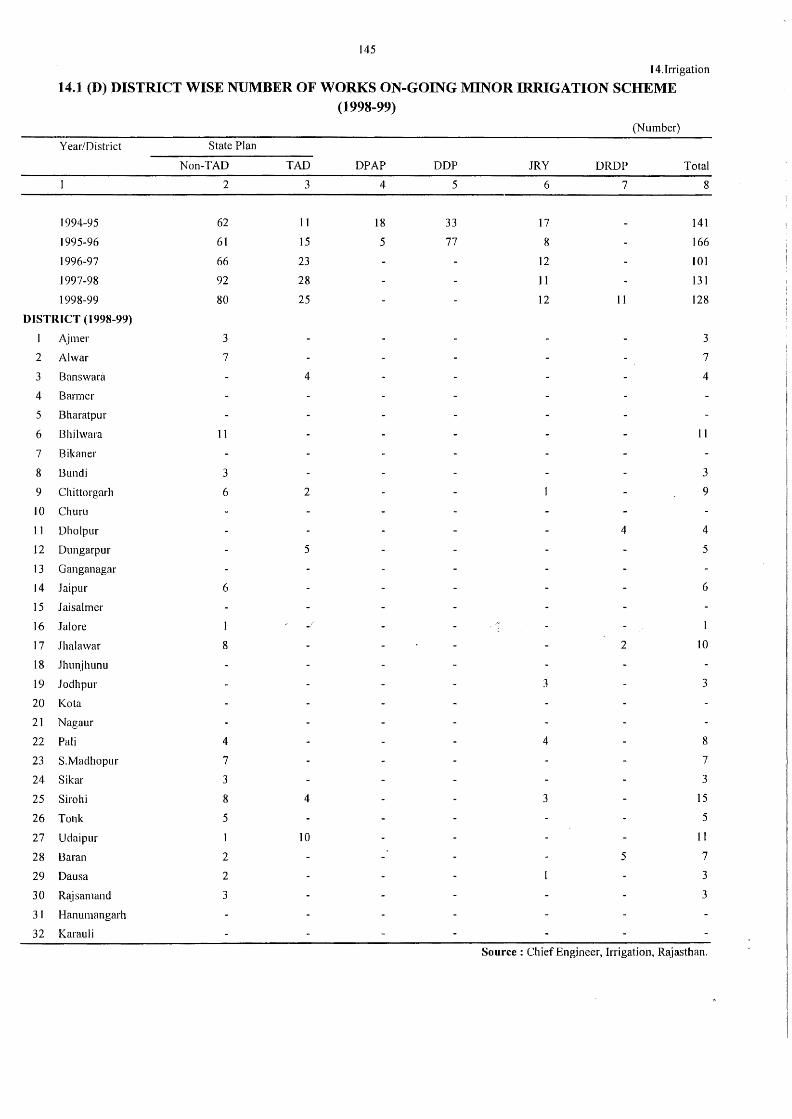
145
14.Irrigation
14.1 (D) DISTRICT WISE NUMBER OF WORKS ON-GOING MINOR IRRIGATION SCHEME (1998-99)
(Number)
Year/District State Plan
Non-TAD TAD DPAP DDP JRY DRDP Total
2 3 4 5 6 7 8
1994-95 62 11 18 33 17 141
1995-96 61 15 5 77 8 166
1996-97 66 23 12 101
I 997-98 92 28 I I 131
1998-99 80 25 12 II 128
DISTRICT (1998-99)
l Ajmer 3 3
2 Al war 7 7
3 Banswara 4 4
4 Barmer
5 Bharatpur
6 Bhilwara 11 11
7 Bikaner
8 Bundi 3 3
9 Chittorgarh 6 2 9
10 Churn
11 Dholpur 4 4
12 Dungarpur 5 5
13 Ganganagar
14 Jaipur 6 6
15 Jaisalmer
16 Jal ore I
17 Jhalawar 8 2 IO
18 Jhunjhunu
19 Jodhpur 3 3
20 Ko ta
21 Nagaur
22 Pali 4 4 8
23 S.Madhopur 7 7
24 Sikar 3 3
25 Sirohi 8 4 3 15
26 Tonk 5 5
27 Udaipur IO II
28 Baran 2 5 7
29 Daus a 2 3
30 Rajsamand 3 3
31 Hanumangarh
32 Karau Ii
Source: Chief Engineer, Irrigation, Rajasthan.
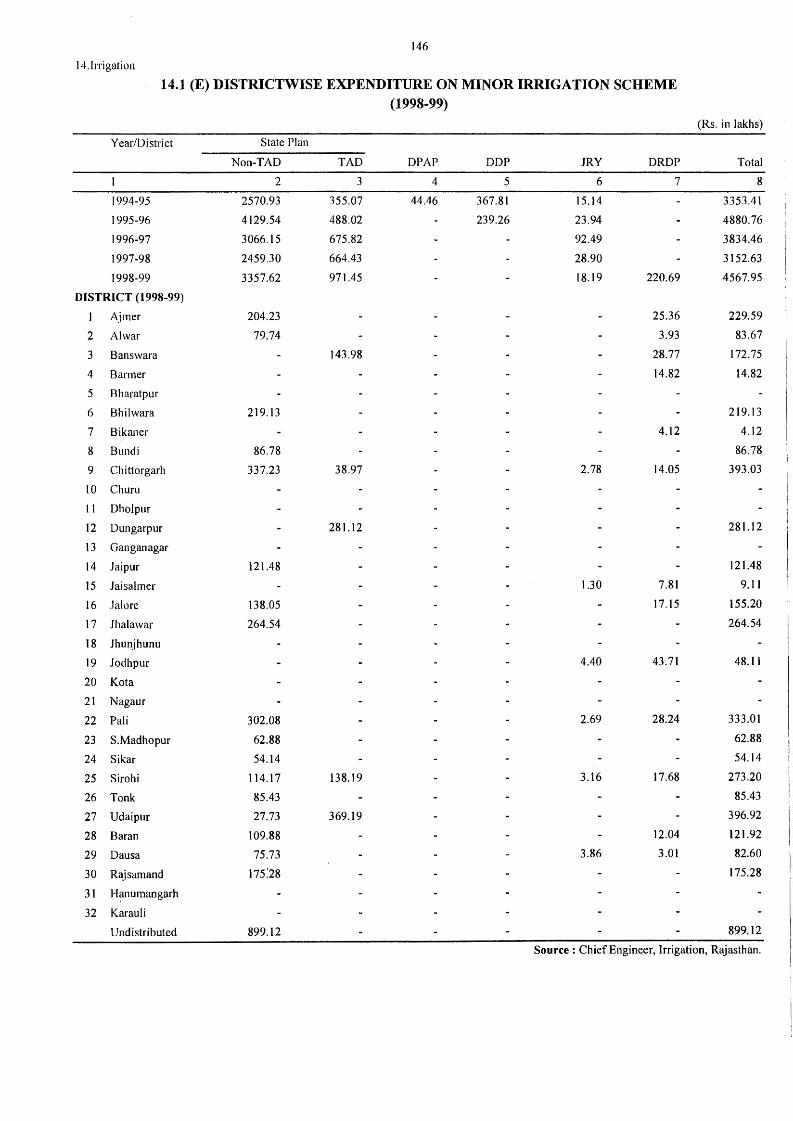
146
14. lrrigation
14.1 (E) DISTRICTWISE EXPENDITURE ON MINOR IRRIGATION SCHEME (1998-99)
(Rs. in lakhs)
Year/District State Plan
Non-TAD TAD DPAP DDP .TRY DROP Total
2 3 4 5 6 7 8
1994-95 2570.93 355.07 44.46 367.81 15.14 3353.41
1995-96 4129.54 488.02 239.26 23.94 4880.76
1996-97 3066.15 675.82 92.49 3834.46
1997-98 2459.30 664.43 28.90 3152.63
1998-99 3357.62 971.45 18.19 220.69 4567.95
DISTRICT (1998-99)
I Ajmer 204.23 25.36 229.59
2 Al war 79.74 3.93 83.67
3 Banswara 143.98 28.77 172.75
4 Barmer 14.82 l4.82
5 Bharatpur
6 Bhilwara 219.13 219.13
7 Bikaner 4.12 4.12
8 Bundi 86.78 86.78
9 Chittorgarh 337.23 38.97 2.78 14.05 393.03
IO Churn
11 Dholpur
12 Dungarpur 281.12 281.12
13 Ganganagar
14 Jaipur 121.48 121.48
15 Jaisalmer 1.30 7.81 9.11
16 Jal ore 138.05 17.15 155.20
17 Jhalawar 264.54 264.54
18 Jhunjhunu
19 Jodhpur 4.40 43.71 48.11
20 Ko ta
21 Nagaur
22 Pali 302.08 2.69 28.24 333.01
23 S.Madhopur 62.88 62.88
24 Sikar 54.14 54.14
25 Sirohi 114.17 138.19 3.16 17.68 273.20
26 Tonk 85.43 85.43
27 Udaipur 27.73 369.19 396.92
28 Baran 109.88 12.04 121.92
29 Dausa 75.73 3.86 3.01 82.60
30 Rajsamand 115:28 175.28
31 H~numangarh
32 Karau Ii
Undistributed 899.12 899.12
Source: Chief Engineer, Irrigation, Rajasthan.
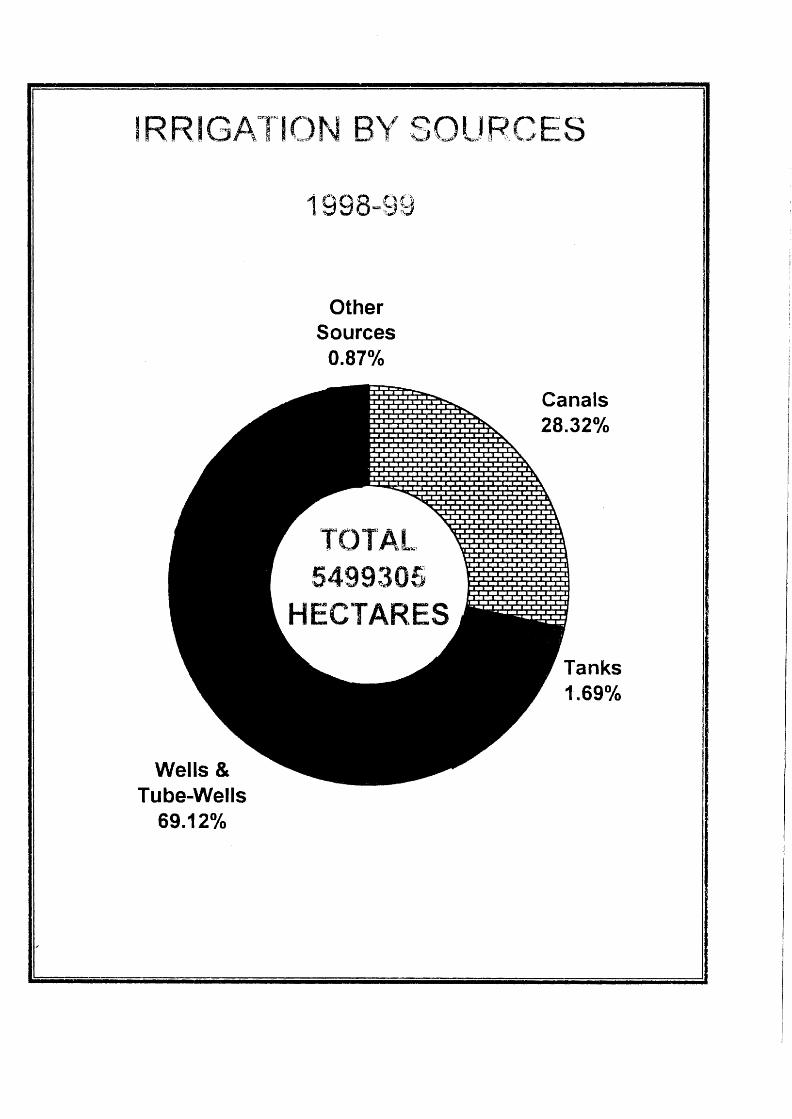
Wells & Tube-Wells
69.12°/o
Other Sources
0.87%
TOT~A:~l~, ~-l 5499305
HECTARES
1.69°/o
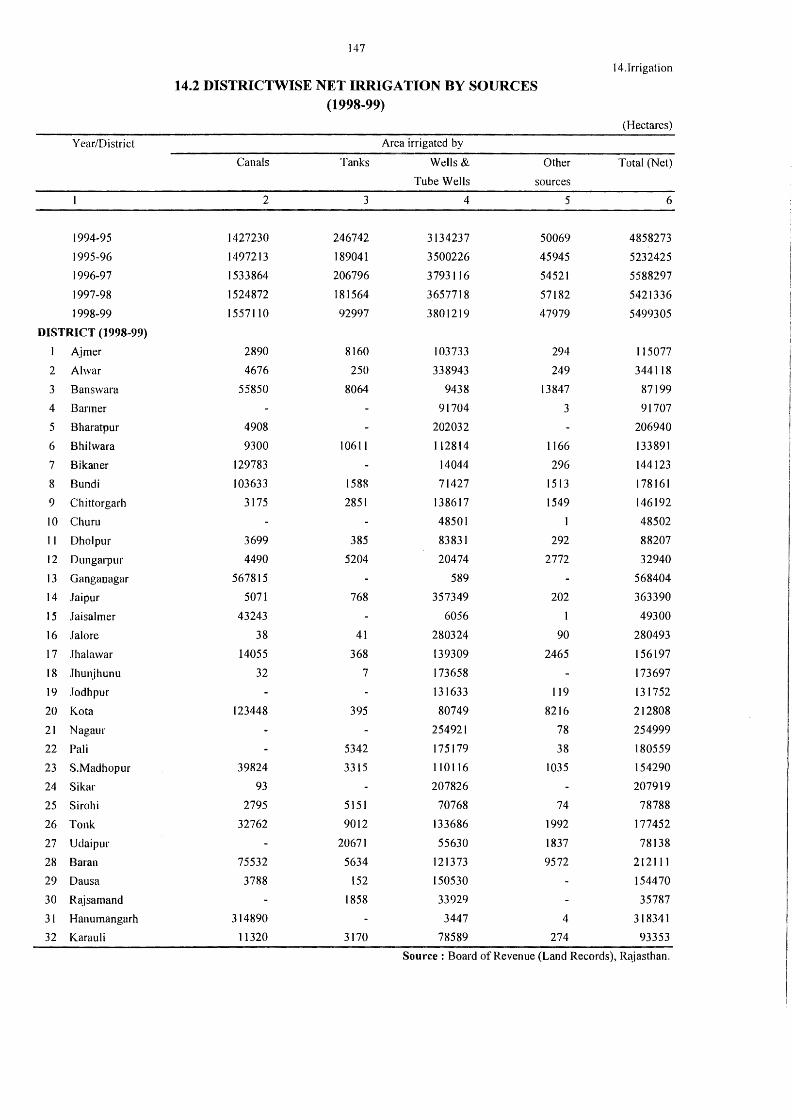
147
14.Jrrigation
14.2 DISTRICTWISE NET IRRIGATION BY SOURCES (1998-99)
(Hectares)
Year/District Area irrigated by
Canals Tanks Wells & Other Total (Net)
Tube Wells sources
2 3 4 5 6
1994-95 1427230 246742 3134237 50069 4858273
1995-96 1497213 189041 3500226 45945 5232425
1996-97 1533864 206796 3793116 54521 5588297
1997-98 1524872 181564 3657718 57182 5421336
1998-99 1557110 92997 3801219 47979 5499305
DISTRICT (1998-99)
I Ajmer 2890 8160 103733 294 115077
2 Al war 4676 250 338943 249 344118
3 Banswara 55850 8064 9438 13847 87199
4 Barmer 91704 3 91707
5 Bharatpur 4908 202032 206940
6 Bhilwara 9300 10611 112814 1166 133891
7 Bikaner 129783 14044 296 144123
8 Bundi 103633 1588 71427 1513 178161
9 Chittorgarh 3175 2851 138617 1549 146192
IO Churn 48501 48502
11 Dholpur 3699 385 83831 292 88207
12 Dungarpur 4490 5204 20474 2772 32940
13 Gangaoagar 567815 589 568404
14 Jaipur 5071 768 357349 202 363390
15 Jaisalmer 43243 6056 I 49300
16 Jal ore 38 41 280324 90 280493
17 Jhalawar 14055 368 139309 2465 156197
18 Jhunjhunu 32 7 173658 173697
19 Jodhpur 131633 119 131752
20 Ko ta 123448 395 80749 8216 212808
21 Nagaur 254921 78 254999
22 Pali 5342 175179 38 180559
23 S.Madhopur 39824 3315 110116 1035 154290
24 Sikar 93 207826 207919
25 Sirohi 2795 5151 70768 74 78788
26 Tonk 32762 9012 133686 1992 177452
27 Udaipur 20671 55630 1837 78138
28 Baran 75532 5634 121373 9572 212111
29 Dausa 3788 152 150530 154470
30 Rajsamand 1858 33929 35787
31 Hanumangarh 314890 3447 4 318341
32 Karau Ii 11320 3170 78589 274 93353
Source: Board of Revenue (Land Records), R~jasthan.
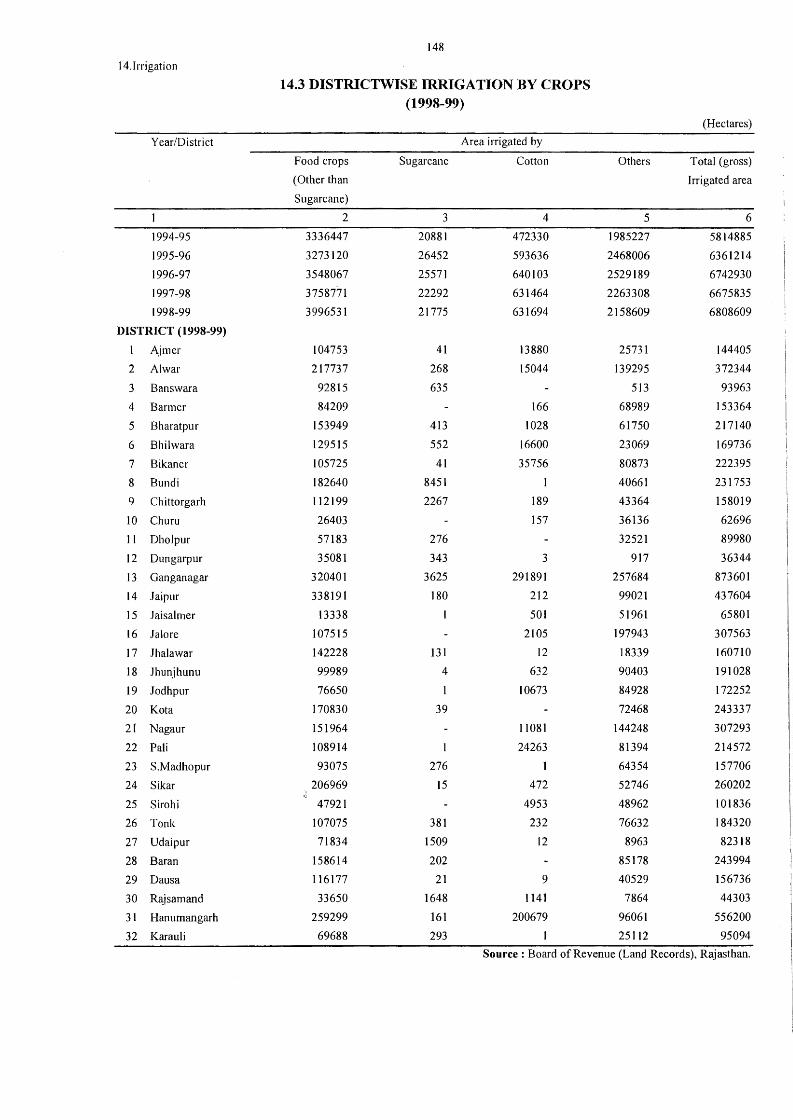
148
14.Irrigation
14.3 DISTRICTWISE IRRIGATION BY CROPS (1998-99)
(Hectares)
Year/District Area irrigated by
Food crops Sugarcane Cotton Others Total (gross)
(Other than Irrigated area
Sugarcane)
2 3 4 5 6
1994-95 3336447 20881 472330 1985227 5814885
1995-96 3273120 26452 593636 2468006 6361214
1996-97 3548067 25571 640103 2529189 6742930
1997-98 3758771 22292 631464 2263308 6675835
1998-99 3996531 21775 631694 2158609 6808609
DISTRICT (1998-99)
I Ajrner 104753 41 13880 25731 144405
2 Al war 217737 268 15044 139295 372344
3 Banswara 92815 635 513 93963
4 Barmer 84209 166 68989 153364
5 Bharatpur 153949 413 1028 61750 217140
6 Bhilwara 129515 552 16600 23069 169736
7 Bikaner 105725 41 35756 80873 222395
8 Bundi 182640 8451 1 40661 231753
9 Chittorgarh 112199 2267 189 43364 158019
10 Churu 26403 157 36136 62696
11 Dholpur 57183 276 32521 89980
12 Dungarpur 35081 343 3 917 36344
13 Ganganagar 320401 3625 291891 257684 873601
14 Jaipur 338191 180 212 99021 437604
15 Jaisalmer 13338 501 51961 65801
16 Jal ore 107515 2105 197943 307563
17 Jhalawar 142228 131 12 18339 160710
18 Jhunjhunu 99989 4 632 90403 191028
19 Jodhpur 76650 I 10673 84928 172252
20 Kata 170830 39 72468 243337
21 Nagaur 151964 11081 144248 307293
22 Pali 108914 1 24263 81394 214572
23 S.Madhopur 93075 276 64354 157706
24 Sikar 206969 15 472 52746 260202
25 Sirohi 47921 4953 48962 101836
26 Tonk 107075 381 232 76632 184320
27 Udaipur 71834 1509 12 8963 82318
28 Baran 158614 202 85178 243994
29 Dausa 116177 21 9 40529 156736
30 Rajsarnand 33650 1648 1141 7864 44303
31 Hanurnangarh 259299 161 200679 96061 556200
32 Karau Ii 69688 293 25112 95094
Source: Board of Revenue (Land Records), Rajasthan.
(15) ANIMAL HUSBANDRY & DAIRYING
The data given in this section on Live-stock and Pultry are based on Sixteenth
quinouennial Census of Li.ve-stock Rajasthan, 1997.
The data on Animal Husbandry facilities and sheep & wool facilities is supplied by
the Animal Husbandry Department, Rajasthan and sheep & wool Department also. There it
is collected as an administrative by-product.
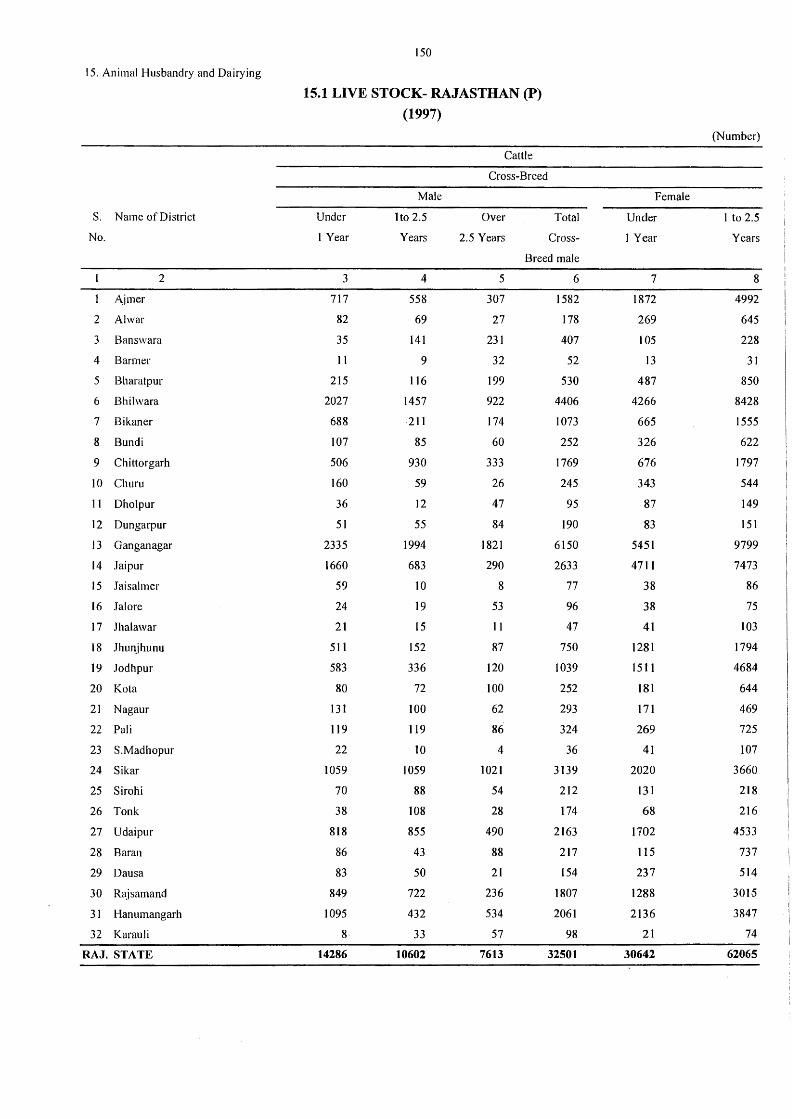
150
15. Animal Husbandry and Dairying
15.1 LIVE STOCK- RAJASTHAN (P)
(1997)
(Number)
Cattle
Cross-Breed
Male Female
S. Name of District Under lto 2.5 Over Total Under 1 to 2.5
No. I Year Years 2.5 Years Cross- 1 Year Years
Breed male
2 3 4 5 6 7 8
Ajmer 717 558 307 1582 1872 4992
2 Al war 82 69 27 178 269 645
3 Banswara 35 141 231 407 105 228
4 Barmer 11 9 32 52 13 31
5 Bharatpur 215 116 199 530 487 850
6 Bhilwara 2027 1457 922 4406 4266 8428
7 Bikaner 688 211 174 1073 665 1555
8 Bundi 107 85 60 252 326 622
9 Chittorgarh 506 930 333 1769 676 1797
IO Chum 160 59 26 245 343 544
11 Dholpur 36 12 47 95 87 149
12 Dungarpur 51 55 84 190 83 151
13 Ganganagar 2335 1994 1821 6150 5451 9799
14 .Jaipur 1660 683 290 2633 4711 7473
15 Jaisalmer 59 10 8 77 38 86
16 Jal ore 24 19 53 96 38 75
17 .Jhalawar 21 15 11 47 41 103
18 Jhunjhunu 511 152 87 750 1281 1794
19 Jodhpur 583 336 120 1039 1511 4684
20 Ko ta 80 72 100 252 181 644
21 Nagaur 131 100 62 293 171 469
22 Pali 119 119 86 324 269 725
23 S.Madhopur 22 10 4 36 41 107
24 Sikar 1059 1059 1021 3139 2020 3660
25 Sirohi 70 88 54 212 131 218
26 Tonk 38 108 28 174 68 216
27 Udaipur 818 855 490 2163 1702 4533
28 Baran 86 43 88 217 115 737
29 Dausa 83 50 21 154 237 514
30 Rajsamand 849 722 236 1807 1288 3015
31 Hanumangarh 1095 432 534 2061 2136 3847
32 Karau Ii 8 33 57 98 21 74
RAJ. STATE 14286 10602 7613 32501 30642 62065
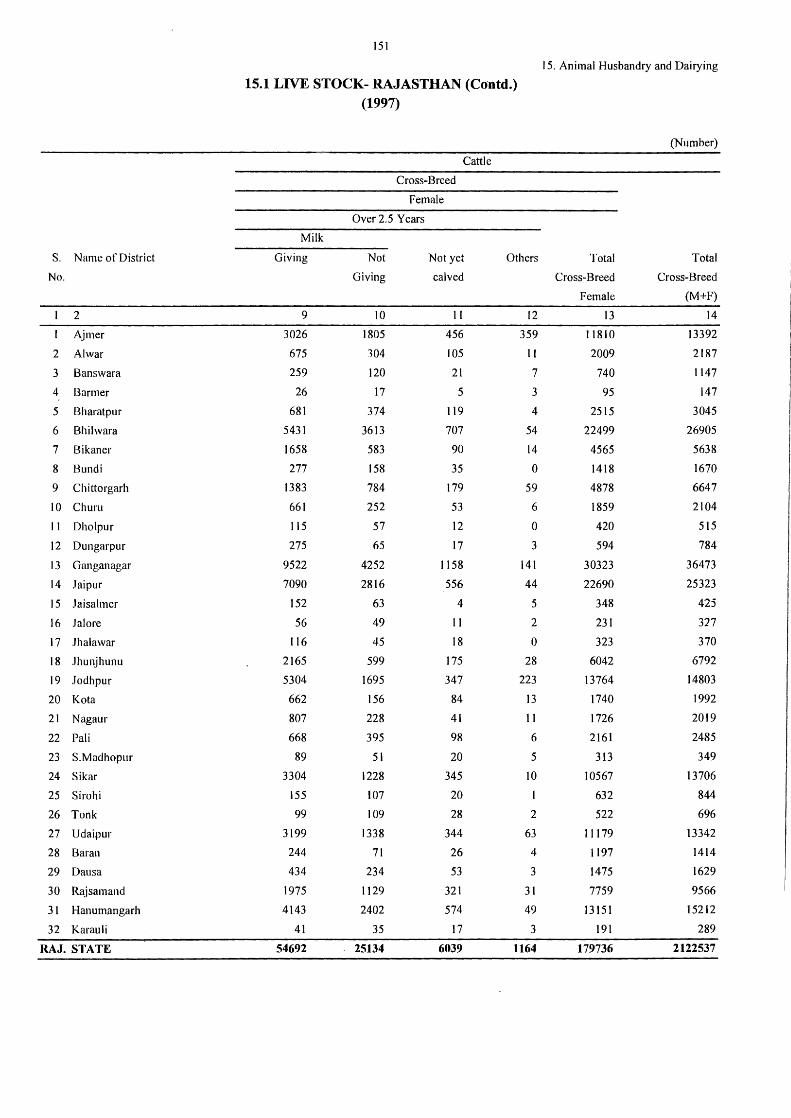
151
15. Animal Husbandry and Dairying
15.1 LIVE STOCK- RAJASTHAN (Contd.) (1997)
(Number) Cattle
Cross-Breed
Female
Over 2.5 Years
Milk
S. Name of District Giving Not Not yet Others Total Total
No. Giving calved Cross-Breed Cross-Breed
Female (M+F)
2 9 10 11 12 13 14
I Ajmer 3026 1805 456 359 I 1810 13392
2 Al war 675 304 105 11 2009 2187
3 Banswara 259 120 21 7 740 1147
4 Barmer 26 17 5 3 95 147
5 Bharatpur 681 374 119 4 2515 3045
6 Bhilwara 5431 3613 707 54 22499 26905
7 Bikaner 1658 583 90 14 4565 5638
8 Bundi 277 158 35 0 1418 1670
9 Chittorgarh 1383 784 179 59 4878 6647
10 Churu 661 252 53 6 1859 2104
11 Dholpur 115 57 12 0 420 515
12 Dungarpur 275 65 17 3 594 784
13 Ganganagar 9522 4252 1158 141 30323 36473
14 Jaipur 7090 2816 556 44 22690 25323
15 .Jaisalmer 152 63 4 5 348 425
16 Jal ore 56 49 11 2 231 327
17 .Jhalawar 116 45 18 0 323 370
18 .Jhunjhunu 2165 599 175 28 6042 6792
19 .Jodhpur 5304 1695 347 223 13764 14803
20 Ko ta 662 156 84 13 1740 1992
21 Nagaur 807 228 41 11 1726 2019
22 Pali 668 395 98 6 2161 2485
23 S.Madhopur 89 51 20 5 313 349
24 Sikar 3304 1228 345 10 10567 13706
25 Sirohi 155 107 20 632 844
26 Tonk 99 109 28 2 522 696
27 Udaipur 3199 1338 344 63 11179 13342
28 Baran 244 71 26 4 1197 1414
29 Dausa 434 234 53 3 1475 1629
30 Rajsamand 1975 1129 321 31 7759 9566
31 Hanumangarh 4143 2402 574 49 13151 15212
32 Karau Ii 41 35 17 3 191 289
RAJ. STATE 54692 25134 6039 1164 179736 2122537
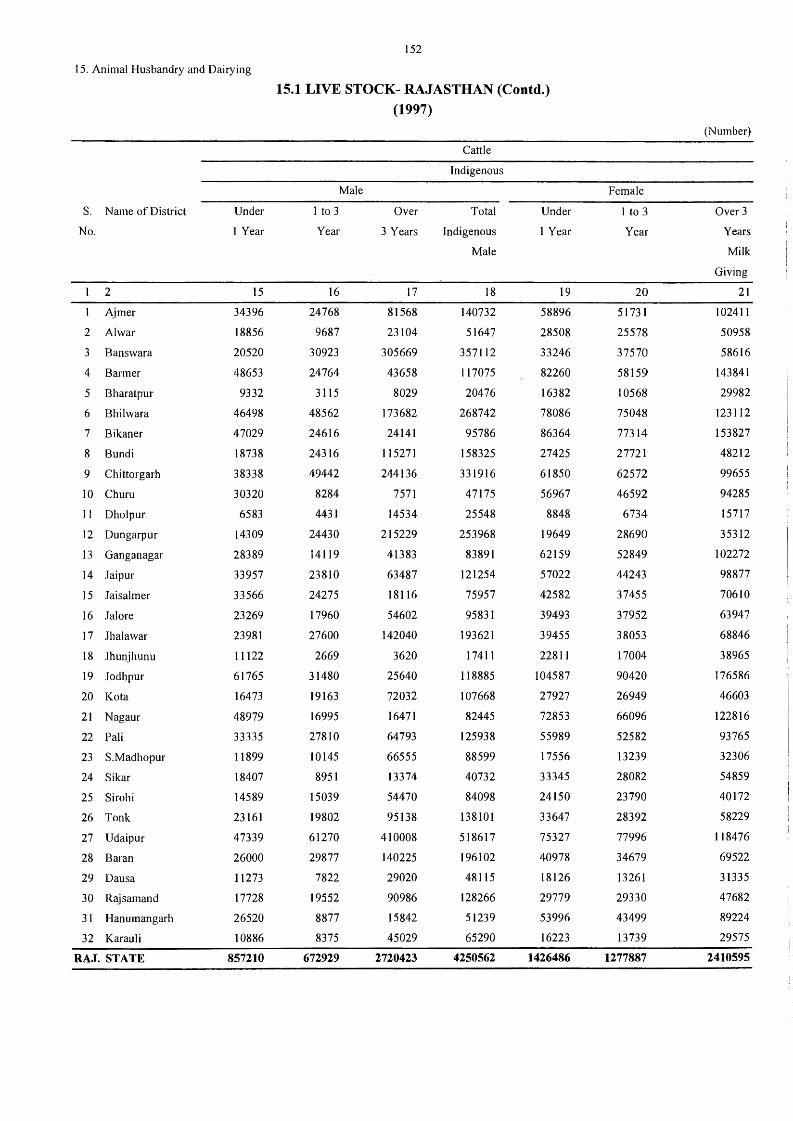
I 5. Animal Husbandry and Dairying
S. Name of District
No.
2
Ajmer
2 Alwar
3 Banswara
4 Barmer
5 Bharatpur
6 Bhilwara
7 Bikaner
8 Bundi
9 Chittorgarh
10 Churu
11 Dholpur
12 Dungarpur
13 Ganganagar
14 Jaipur
15 .Taisalmer
16 Jalore
17 Jhalawar
18 Jhunjhunu
19 Jodhpur
20 Kota
21 Nagaur
22 Pali
23 S.Madhopur
24 Sikar
25 Sirohi
26 Tonk
27 Udaipur
28 Baran
29 Dausa
30 Rajsamand
3 l Hanumangarh
32 Karauli
RAJ. STATE
Under
1 Year
15
34396
18856
20520
48653
9332
46498
47029
18738
38338
30320
6583
14309
28389
33957
33566
23269
23981
11122
61765
16473
48979
33335
11899
18407
14589
23161
47339
26000
11273
17728
26520
10886
857210
152
15.1 LIVE STOCK- RAJASTHAN (Contd.)
(1997)
Male
1 to 3
Year
16
24768
9687
30923
24764
3115
48562
24616
24316
49442
8284
4431
24430
14119
23810
24275
17960
27600
2669
31480
19163
16995
27810
10145
8951
15039
19802
61270
29877
7822
19552
8877
8375
672929
Over
3 Years
17
81568
23104
305669
43658
8029
173682
24141
115271
244136
7571
14534
215229
41383
63487
18116
54602
142040
3620
25640
72032
16471
64793
66555
13374
54470
95138
410008
140225
29020
90986
15842
45029
2720423
Cattle
Indigenous
Total
Indigenous
Male
18
140732
51647
357112
117075
20476
268742
95786
158325
331916
47175
25548
253968
83891
121254
75957
95831
193621
17411
118885
107668
82445
125938
88599
40732
84098
138101
518617
196102
48115
128266
51239
65290
4250562
Under
1 Year
19
58896
28508
33246
82260
16382
78086
86364
27425
61850
56967
8848
19649
62159
57022
42582
39493
39455
22811
104587
27927
72853
55989
17556
33345
24150
33647
75327
40978
18126
29779
53996
16223
1426486
Female
I to 3
Year
20
51731
25578
37570
58159
10568
75048
77314
27721
62572
46592
6734
28690
52849
44243
37455
37952
38053
17004
90420
26949
66096
52582
13239
28082
23790
28392
77996
34679
13261
29330
43499
13739
1277887
(Number)
Over 3
Years
Milk
Giving
21
102411
50958
58616
143841
29982
123112
153827
48212
99655
94285
15717
35312
102272
98877
70610
63947
68846
38965
176586
46603
122816
93765
32306
54859
40172
58229
118476
69522
31335
47682
89224
29575
2410595
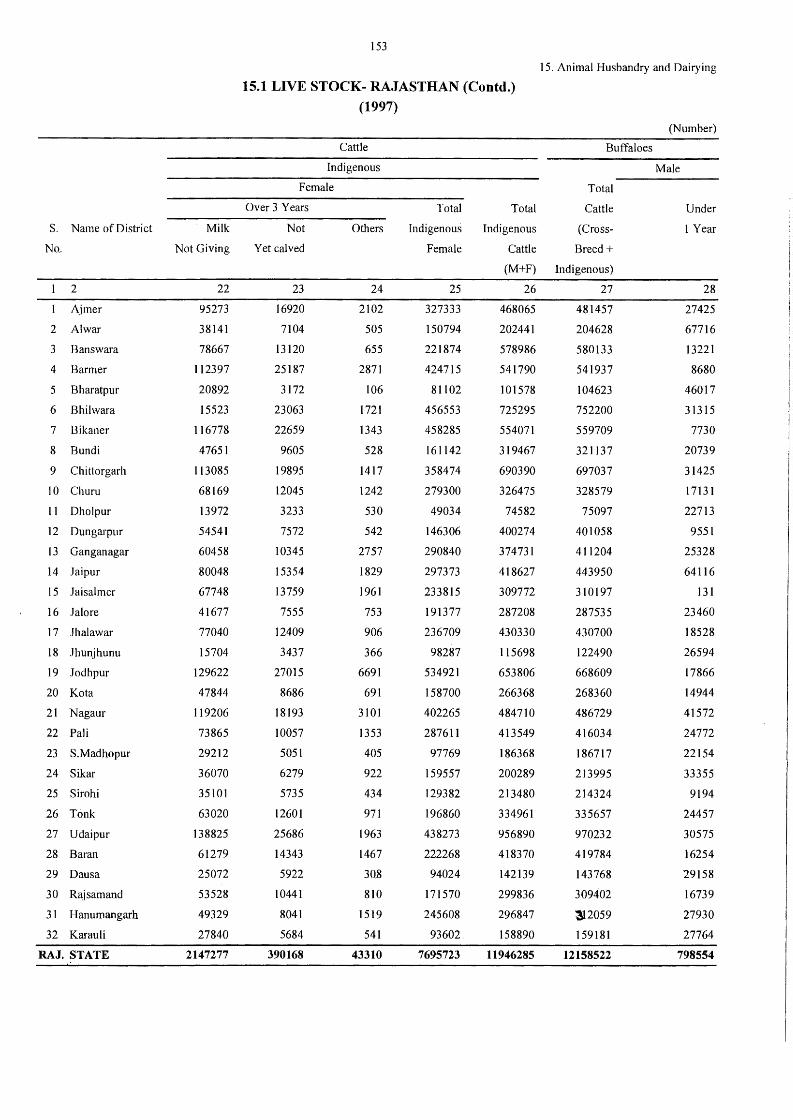
S. Name of District
No..
2
Ajmer
2 Alwar
3 Banswara
4 Barmer
5 Bharatpur
6 Bhilwara
7 Bikaner
8 Bundi
9 Chittorgarh
10 Churu
11 Dholpur
12 Dungarpur
13 Ganganagar
14 Jaipur
15 .Jaisalmer
16 Jalore
17 Jhalawar
18 Jhunjhunu
19 Jodhpur
20 Kota
21 Nagaur
22 Pali
23 S.Madhopur
24 Sikar
25 Sirohi
26 TOnk
27 Udaipur
28 Baran
29 Dausa
30 Rajsamand
31 Hanumangarh
32 Karauli
RAJ. STATE
Milk
Not Giving
22
95273
38141
78667
112397
20892
15523
116778
47651
113085
68169
13972
54541
60458
80048
67748
41677
77040
15704
129622
47844
119206
73865
29212
36070
35101
63020
138825
61279
25072
53528
49329
27840
2147277
153
15.1 LIVE STOCK- RAJASTHAN (Contd.) (1997)
Cattle
Indigenous
Female
Over 3 Years
Not
Yet calved
23
16920
7104
13120
25187
3172
23063
22659
9605
19895
12045
3233
7572
10345
15354
13759
7555
12409
3437
27015
8686
18193
10057
5051
6279
5735
12601
25686
14343
5922
10441
8041
5684
390168
Others
24
2102
505
655
2871
106
1721
1343
528
1417
1242
530
542
2757
1829
1961
753
906
366
6691
691
3101
1353
405
922
434
971
1963
1467
3Q8
810
1519
541
43310
Total
Indigenous
Female
25
327333
150794
221874
424715
81102
456553
458285
161142
358474
279300
49034
146306
290840
297373
233815
191377
236709
98287
534921
158700
402265
287611
97769
159557
129382
196860
438273
222268
94024
171570
245608
93602
7695723
Total
Indigenous
Cattle
(M+F)
26
468065
202441
578986
541790
101578
725295
554071
319467
690390
326475
74582
400274
374731
418627
309772
287208
430330
115698
653806
266368
484710
413549
186368
200289
213480
334961
956890
418370
142139
299836
296847
158890
11946285
15. Animal Husbandry and Dairying
Buffaloes
Total
Cattle
(Cross
Breed +
Indigenous)
27
481457
204628
580133
541937
104623
752200
559709
321137
697037
328579
75097
401058
411204
443950
310197
287535
430700
122490
668609
268360
486729
416034
186717
213995
214324
335657
970232
419784
143768
309402
312059
159181
12158522
(Number)
Male
Under
I Year
28
27425
67716
13221
8680
46017
31315
7730
20739
31425
17131
22713
9551
25328
64116
131
23460
18528
26594
17866
14944
41572
24772
22154
33355
9194
24457
30575
16254
29158
16739
27930
27764
798554
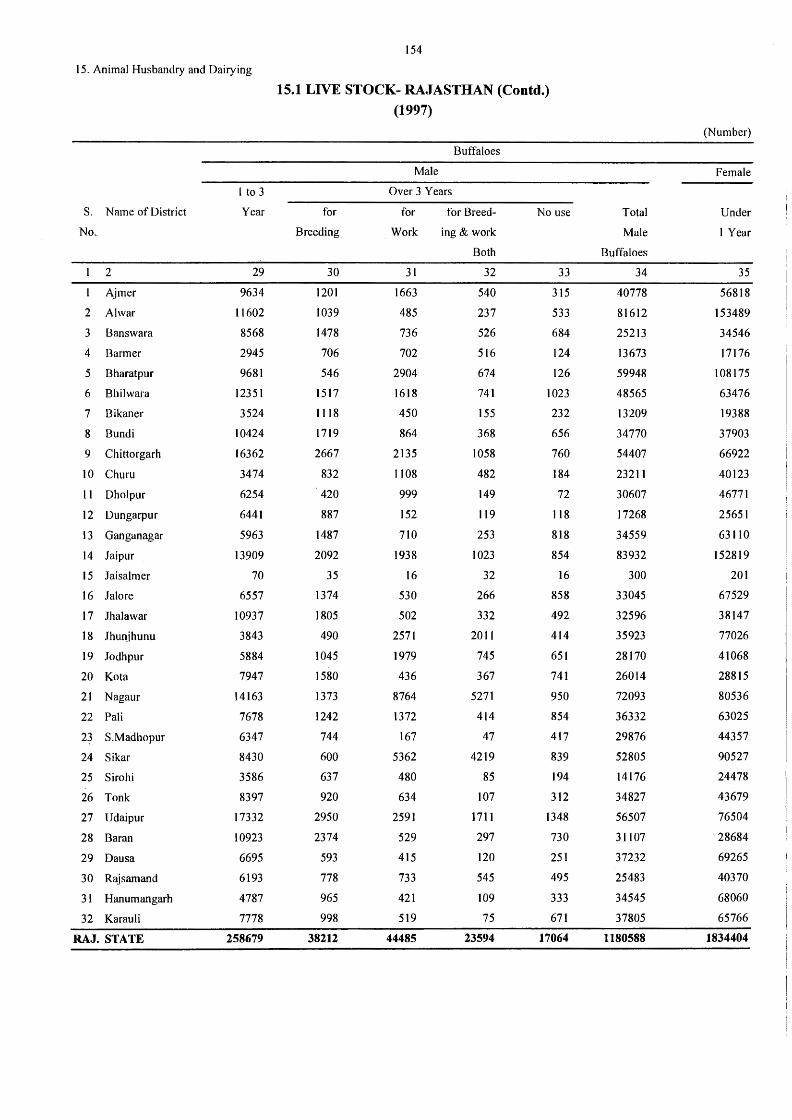
15. Animal Husbandry and Dairying
S. Name of District
No ..
2
Ajmer
2 Alwar
3 Banswara
4 Barmer
5 Bharatpur
6 Bhilwara
7 Bikaner
8 Bundi
9 Chittorgarh
IO Churn
11 Dholpur
12 Dungarpur
13 Ganganagar
14 Jaipur
15 Jaisalmer
16 Jalore
17 Jhalawar
18 Jhunjhunu
19 Jodhpur
20 Kota
21 Nagaur
22 Pali
23 S.Madhopur
24 Sikar
25 Sirohi
26 Tonk
27 Udaipur
28 Baran
29 Dausa
30 Rajsamand
31 Hanumangarh
32 Karauli
RAJ. STATE
I to 3
Year
29
9634
11602
8568
2945
9681
12351
3524
10424
16362
3474
6254
6441
5963
13909
70
6557
10937
3843
5884
7947
14163
7678
6347
8430
3586
8397
17332
10923
6695
6193
4787
7778
258679
154
15.1 LIVE STOCK- RAJASTHAN (Contd.) (1997)
for
Breeding
30
1201
1039
1478
706
546
1517
1118
1719
2667
832
420
887
1487
2092
35
1374
1805
490
1045
1580
1373
1242
744
600
637
920
2950
2374
593
778
965
998
38212
Buffaloes
Male
Over 3 Years
for for Breed-
Work ing & work
Both
31 32
1663 540
485 237
736 526
702 516
2904 674
1618
450
864
2135
1108
999
152
710
1938
16
530
502
2571
1979
436
8764
1372
167
5362
480
634
2591
529
415
733
421
519
44485
741
155
368
1058
482
149
119
253
1023
32
266
332
2011
745
367
5271
414
47
4219
85
107
1711
297
120
545
109
75
23594
No use
33
315
533
684
124
126
1023
232
656
760
184
72
118
818
854
16
858
492
414
651
741
950
854
417
839
194
312
1348
730
251
495
333
671
17064
Total
Male
Buffaloes
34
40778
81612
25213
13673
59948
48565
13209
34770
54407
23211
30607
17268
34559
83932
300
33045
32596
35923
28170
26014
72093
36332
29876
52805
14176
34827
56507
31107
37232
25483
34545
37805
1180588
(Number)
Female
Under
I Year
35
56818
153489
34546
17176
108175
63476
19388
37903
66922
40123
46771
25651
63110
152819
201
67529
38147
77026
41068
28815
80536
63025
44357
90527
24478
43679
76504
28684
69265
40370
68060
65766
1834404
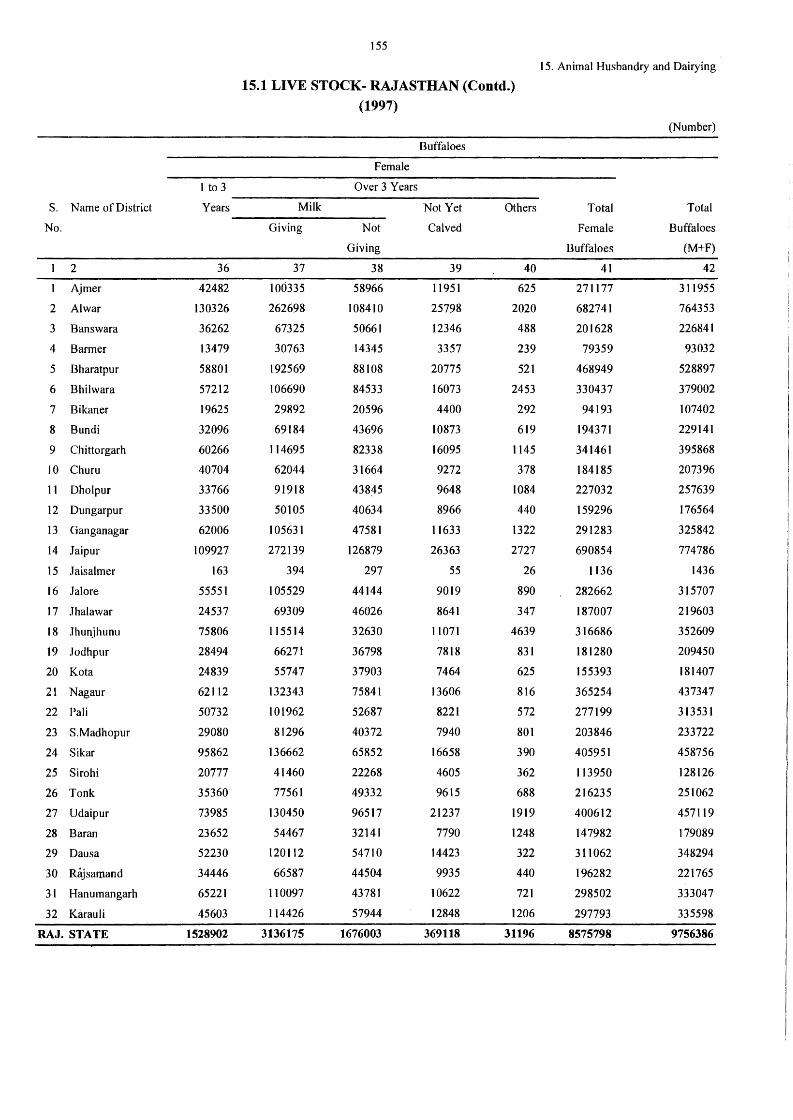
S. Name of District
No.
2
Ajmer
2 Alwar
3 Banswara
4 Barmer
5 Bharatpur
6 Bhilwara
7 Bikaner
8 Bundi
9 Chittorgarh
10 Churu
11 Dholpur
12 Dungarpur
13 Ganganagar
14 Jaipur
15 Jaisalmer
16 Jalore
17 .Jhalawar
18 Jhunjhunu
19 Jodhpur
20 Kota
21 Nagaur
22 Pali
23 S.Madhopur
24 Sikar
25 Sirohi
26 Tonk
27 Udaipur
28 Baran
29 Dausa
30 Rajsamand
31 Hanumangarh
32 Karauli
RAJ. STATE
1to3
Years
36
42482
130326
36262
13479
58801
57212
19625
32096
60266
40704
33766
33500
62006
109927
163
55551
24537
75806
28494
24839
62112
50732
29080
95862
20777
35360
73985
23652
52230
34446
65221
45603
1528902
155
15.1 LIVE STOCK- RAJASTHAN (Contd.) (1997)
Milk
Giving
37
100335
262698
67325
30763
192569
106690
29892
69184
114695
62044
91918
50105
105631
272139
394
105529
69309
115514
66271
55747
132343
101962
81296
136662
41460
77561
130450
54467
l201l2
66587
110097
114426
3136175
Female
Over 3 Years
Not
Giving
38
58966
108410
50661
14345
88108
84533
20596
43696
82338
31664
43845
40634
47581
126879
297
44144
46026
32630
36798
37903
75841
52687
40372
65852
22268
49332
96517
32141
54710
44504
43781
57944
1676003
Buffaloes
Not Yet
Calved
39
11951
25798
12346
3357
20775
16073
4400
10873
16095
9272
9648
8966
11633
26363
55
9019
8641
11071
7818
7464
13606
8221
7940
16658
4605
9615
21237
7790
14423
9935
10622
12848
369118
Others
40
625
2020
488
239
521
2453
292
619
1145
378
1084
440
1322
2727
26
890
347
4639
831
625
816
572
801
390
362
688
1919
1248
322
440
721
1206
31196
15. Animal Husbandry and Dairying
Total
Female
Buffaloes
41
271177
682741
201628
79359
468949
330437
94193
194371
341461
184185
227032
159296
291283
690854
1136
282662
187007
316686
181280
155393
365254
277199
203846
405951
113950
216235
400612
147982
311062
196282
298502
297793
8575798
(Number)
Total
Buffaloes
(M+F)
42
311955
764353
226841
93032
528897
379002
107402
229141
395868
207396
257639
176564
325842
774786
1436
315707
219603
352609
209450
181407
437347
313531
233722
458756
128126
251062
457119
179089
348294
221765
333047
335598
9756386
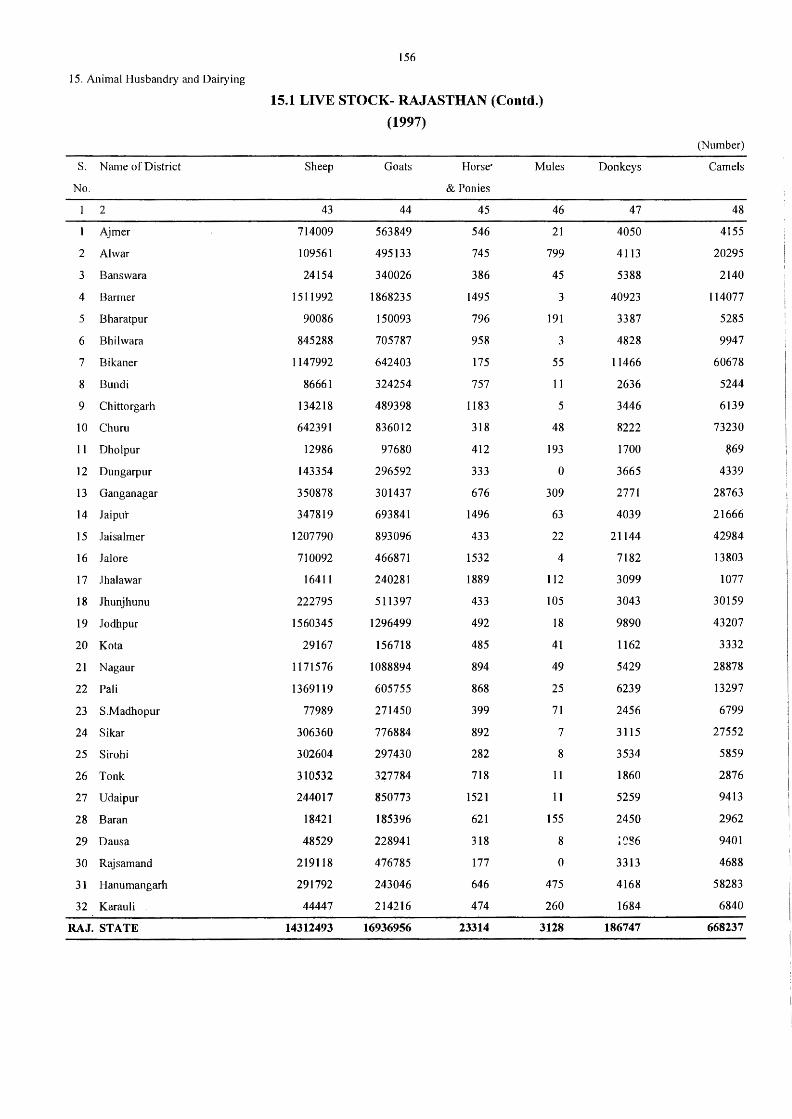
15. Animal Husbandry and Dairying
S. Name of District
No.
2
A,jmer
2 Alwar
3 Banswara
4 Barmer
5 Bharatpur
6 Bhilwara
7 Bikaner
8 Bundi
9 Chittorgarh
IO Chum
l l Dholpur
12 Dungarpur
13 Ganganagar
14 Jaipur
15 Jaisalmer
16 .Jalore
17 Jhalawar
18 Jhunjhunu
19 Jodhpur
20 Kata
21 Nagaur
22 Pali
23 S.Madhopur
24 Sikar
25 Sirohi
26 Tonk
27 Udaipur
28 Baran
29 Dausa
30 Rajsamand
31 Hanumangarh
32 Karauli
RAJ. STATE
156
15.1 LIVE STOCK- RAJASTHAN (Contd.)
(1997)
Sheep
43
714009
109561
24154
1511992
90086
845288
1147992
86661
134218
642391
12986
143354
350878
347819
1207790
710092
16411
222795
1560345
29167
1171576
1369119
77989
306360
302604
310532
244017
18421
48529
219118
291792
44447
14312493
Goats
44
563849
495133
340026
1868235
150093
705787
642403
324254
489398
836012
97680
296592
301437
693841
893096
466871
240281
511397
1296499
156718
1088894
605755
271450
776884
297430
327784
850773
185396
228941
476785
243046
214216
16936956
Horse·
& Ponies
45
546
745
386
1495
796
958
175
757
1183
318
412
333
676
1496
433
1532
1889
433
492
485
894
868
399
892
282
718
1521
621
318
177
646
474
23314
Mules
46
21
799
45
3
191
3
55
11
5
48
193
0
309
63
22
4
112
105
18
41
49
25
71
7
8
11
11
155
8
0
475
260
3128
Donkeys
47
4050
4113
5388
40923
3387
4828
11466
2636
3446
8222
1700
3665
2771
4039
21144
7182
3099
3043
9890
1162
5429
6239
2456
3115
3534
1860
5259
2450
3313
4168
1684
186747
(Number)
Camels
48
4155
20295
2140
114077
5285
9947
60678
5244
6139
73230
669
4339
28763
21666
42984
13803
1077
30159
43207
3332
28878
13297
6799
27552
5859
2876
9413
2962
9401
4688
58283
6840
668237
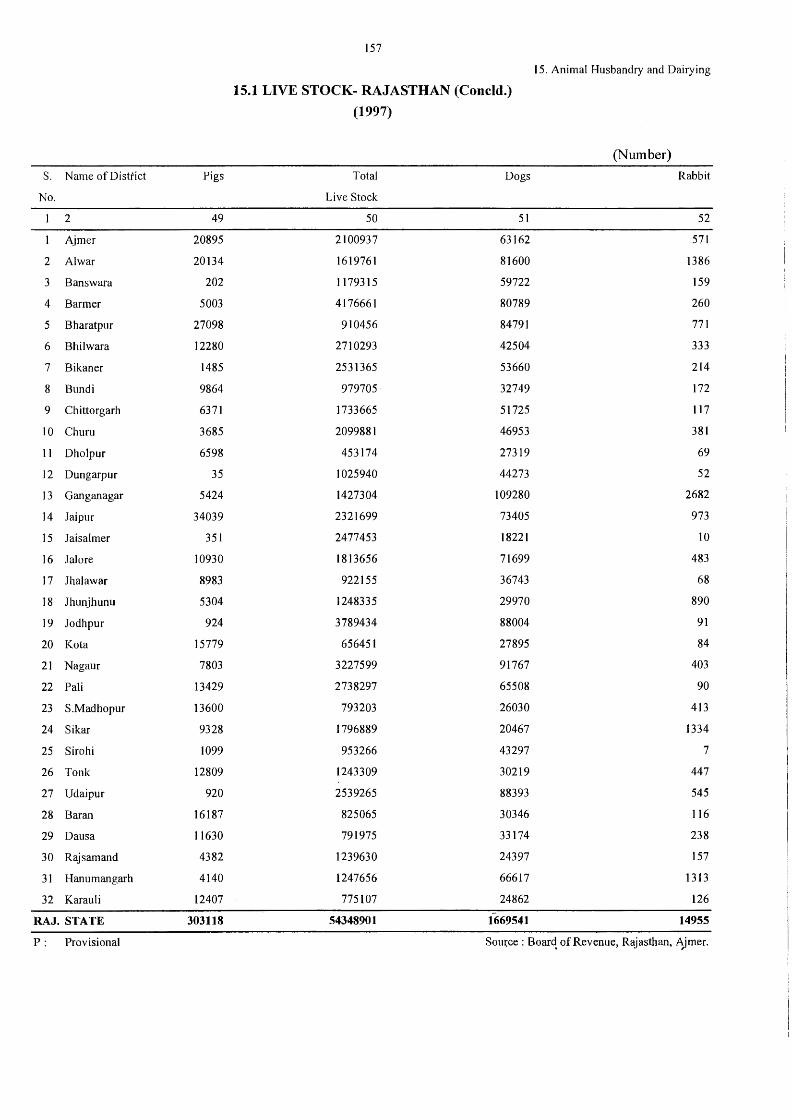
157
15. Animal Husbandry and Dairying
15.1 LIVE STOCK- RAJASTHAN (Concld.)
(1997)
(Number)
S. Name of District Pigs Total Dogs Rabbit
No. Live Stock
2 49 50 51 52
Ajmer 20895 2100937 63162 571
2 Al war 20134 1619761 81600 1386
3 Banswara 202 1179315 59722 159
4 Barmer 5003 4176661 80789 260
5 Bharatpur 27098 910456 84791 771
6 Bhilwara 12280 2710293 42504 333
7 Bikaner 1485 2531365 53660 214
8 Bundi 9864 979705 32749 172
9 Chittorgarh 6371 1733665 51725 117
IO Churn 3685 2099881 46953 381
11 Dholpur 6598 453174 27319 69
12 Dungarpur 35 1025940 44273 52
13 Ganganagar 5424 1427304 109280 2682
14 Jaipur 34039 2321699 73405 973
15 Jaisalmer 351 2477453 18221 10
16 Jal ore 10930 1813656 71699 483
17 Jhalawar 8983 922155 36743 68
18 Jhunjhunu 5304 1248335 29970 890
19 Jodhpur 924 3789434 88004 91
20 Ko ta 15779 656451 27895 84
21 Nagaur 7803 3227599 91767 403
22 Pali 13429 2738297 65508 90
23 S.Madhopur 13600 793203 26030 413
24 Sikar 9328 1796889 20467 1334
25 Sirohi 1099 953266 43297 7
26 Tonk 12809 1243309 30219 447
27 Udaipur 920 2539265 88393 545
28 Baran 16187 825065 30346 116
29 Dausa 11630 791975 33174 238
30 Rajsamand 4382 1239630 24397 157
31 Hanumangarh 4140 1247656 66617 1313
32 Karau Ii 12407 775107 24862 126
RAJ. STATE 303118 54348901 1669541 14955
P: Provisional Source : Boarq of Revenue, Rajasthan, Ajmer.
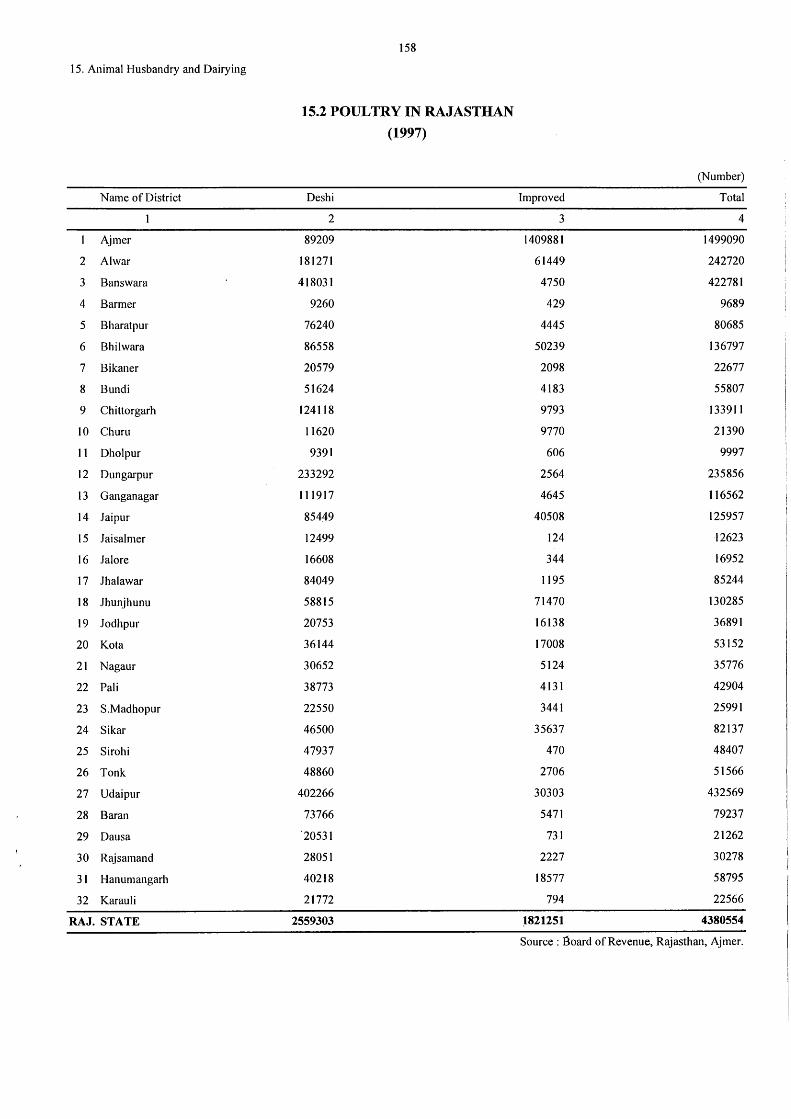
158
15. Animal Husbandry and Dairying
15.2 POULTRY IN RAJASTHAN
(1997)
(Number)
Name of District Des hi Improved Total
2 3 4
A,jmer 89209 1409881 1499090
2 Al war 181271 61449 242720
3 Banswara 418031 4750 422781
4 Barmer 9260 429 9689
5 Bharatpur 76240 4445 80685
6 Bhilwara 86558 50239 136797
7 Bikaner 20579 2098 22677
8 Bundi 51624 4183 55807
9 Chittorgarh 124118 9793 133911
10 Chum 11620 9770 21390
11 Dholpur 9391 606 9997
12 Dungarpur 233292 2564 235856
13 Ganganagar 111917 4645 116562
14 Jaipur 854.49 40508 125957
15 .Jaisalmer 12499 124 12623
16 Jal ore 16608 344 16952
17 Jhalawar 84049 1195 85244
18 Jhunjhunu 58815 71470 130285
19 Jodhpur 20753 16138 36891
20 Ko ta 36144 17008 53152
21 Nagaur 30652 5124 35776
22 Pali 38773 4131 42904
23 S.Madhopur 22550 3441 25991
24 Sikar 46500 35637 82137
25 Sirohi 47937 470 48407
26 Tonk 48860 2706 51566
27 Udaipur 402266 30303 432569
28 Baran 73766 5471 79237
29 Dausa '20531 731 21262
30 Rajsamand 28051 2227 30278
31 Hanumangarh 40218 18577 58795
32 Karau Ii 21772 794 22566
RAJ. STATE 2559303 ~821251 4380554
Source: goard of Revenue, Rajasthan, Ajmer.
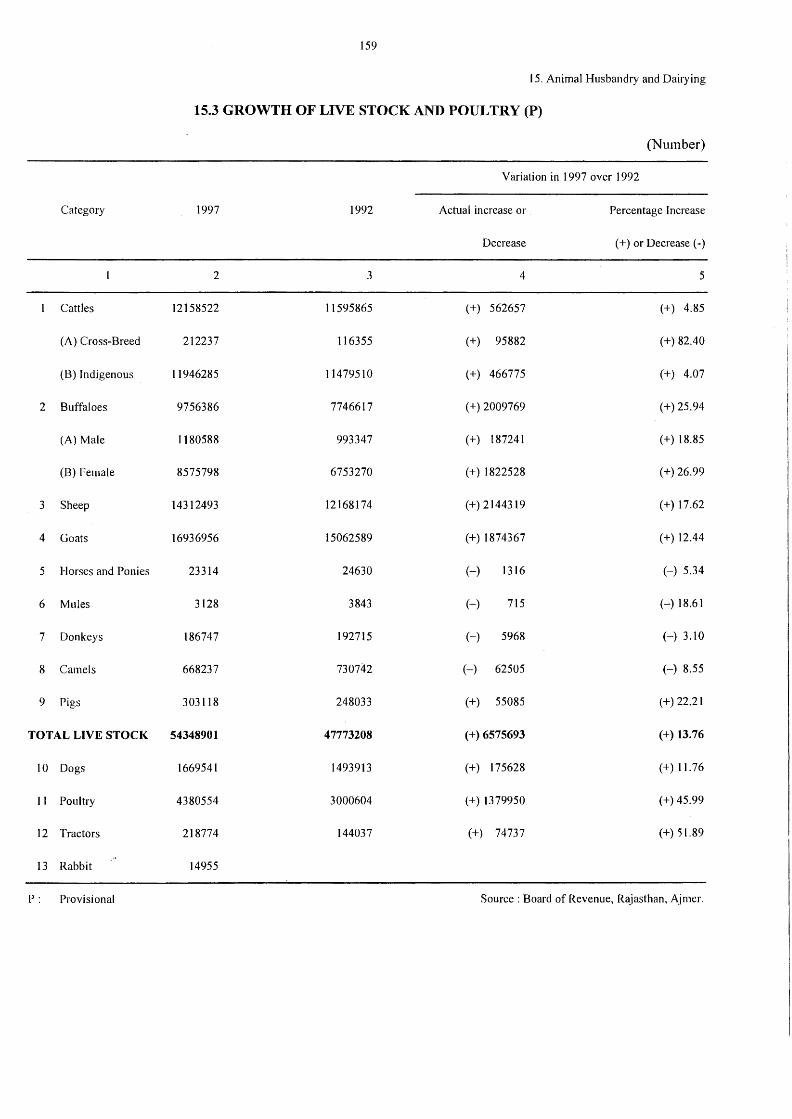
159
15. Animal Husbandry and Dairying
15.3 GROWTH OF LIVE STOCK AND POULTRY (P)
(Number)
Variation in 1997 over 1992
Category 1997 1992 Actual increase or Percentage Increase
Decrease (+)or Decrease(·)
2 3 4 5
Catties 12158522 11595865 (+) 562657 (+) 4.85
(A) Cross-Breed 212237 116355 (+) 95882 (+) 82.40
(B) Indigenous 11946285 114795 IO (+) 466775 (+) 4.07
2 Buffaloes 9756386 7746617 (+) 2009769 (+) 25.94
(A) Male 1180588 993347 (+) 187241 (+) 18.85
(B) Female 8575798 6753270 (+) 1822528 (+) 26.99
3 Sheep 14312493 12168174 (+) 2144319 (+) 17.62
4 Goats 16936956 15062589 (+) 1874367 (+) 12.44
5 Horses and Ponies 23314 24630 H 1316 (-) 5.34
6 Mules 3128 3843 H 715 H 18.61
7 Donkeys 186747 192715 (-) 5968 (-) 3.10
8 Camels 668237 730742 H 62505 H 8.55
9 Pigs 303118 248033 (+) 55085 (+) 22.21
TOTAL LIVE STOCK 54348901 47773208 (+) 6575693 (+) 13.76
10 Dogs 1669541 1493913 (+) 175628 (+) 11.76
11 Poultry 4380554 3000604 (+) 1379950 (+) 45.99
12 Tractors 218774 144037 (+) 74737 (+) 51.89
13 Rabbit 14955
P: Provisional Source : Board of Revenue, Rajasthan, Aj mer.
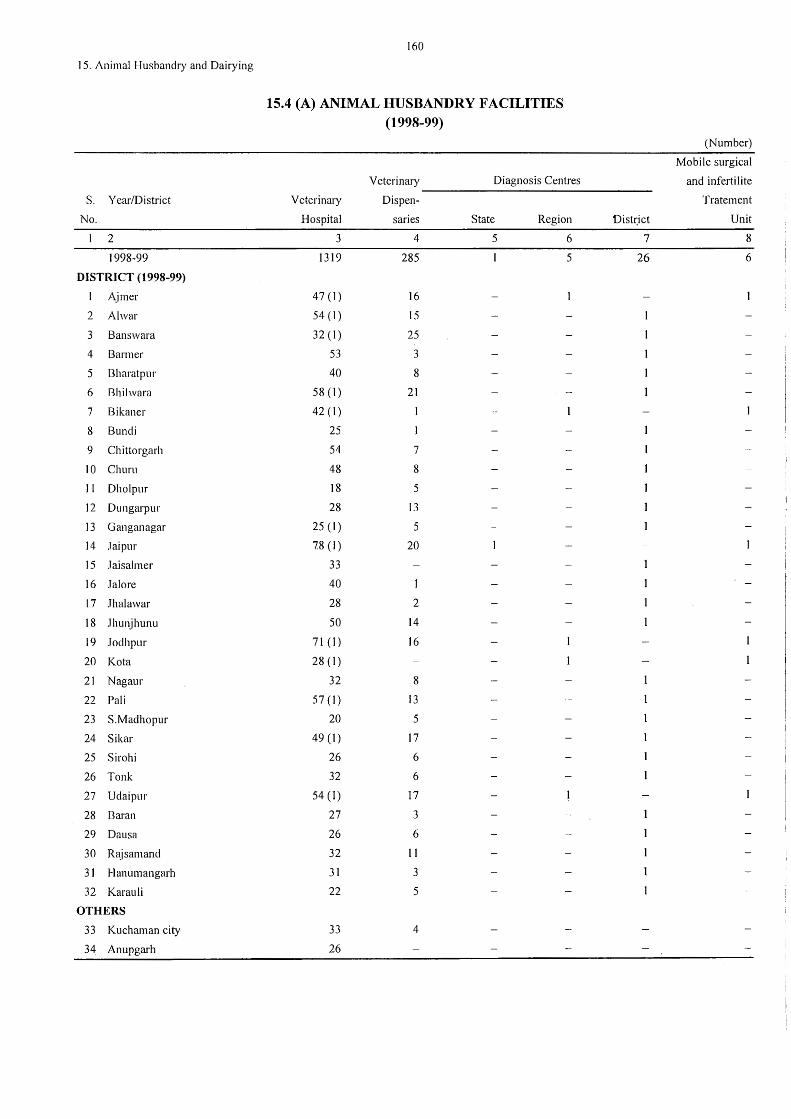
15. Animal Husbandry and Dairying
S. Year/District
No.
2
1998-99
DISTRICT (1998-99)
Ajmer
2 Al war
3 Banswara
4 Barmer
5 Bharatpur
6 Bhilwara
7 Bikaner
8 Bundi
9 Chittorgarh
10 Churu
11 Dholpur
12 Dungarpur
13 Ganganagar
14 Jaipur
15 Jaisalmer
16 Jal ore
17 Jhalawar
18 Jhunjhunu
19 Jodhpur
20 Ko ta
21 Nagaur
22 Pali
23 S.Madhopur
24 Sikar
25 Sirohi
26 Tonk
27 Udaipur
28 Baran
29 Dausa
30 Rajsamand
31 Hanumangarh
32 Karau Ii
OTHERS
33 Kuchaman city
34 Anupgarh
160
15.4 (A) ANIMAL HUSBANDRY FACILITIES (1998-99)
Veterinary Diagnosis Centres ~~~~~~~~~~~~~~~~
Veterinary
Hospital
3
1319
47 (1)
54 (1)
32 (1)
53
40
58 (1)
42 (1)
25
54
48
18
28
25 (1)
78 (1)
33
40
28
50
71 (1)
28 (1)
32
57 (1)
20
49 (1)
26
32
54 (1)
27
26
32
31
22
33
26
Dispen-
saries
4
285
16
15
25
3
8
21
I
7
8
5
13
5
20
2
14
16
8
13
5
17
6
6
17
3
6
11
3
5
4
State Region Dist~ict
5 6 7
5 26
(Number)
Mobile surgical
and infertilite
Tratement
Unit
8
6
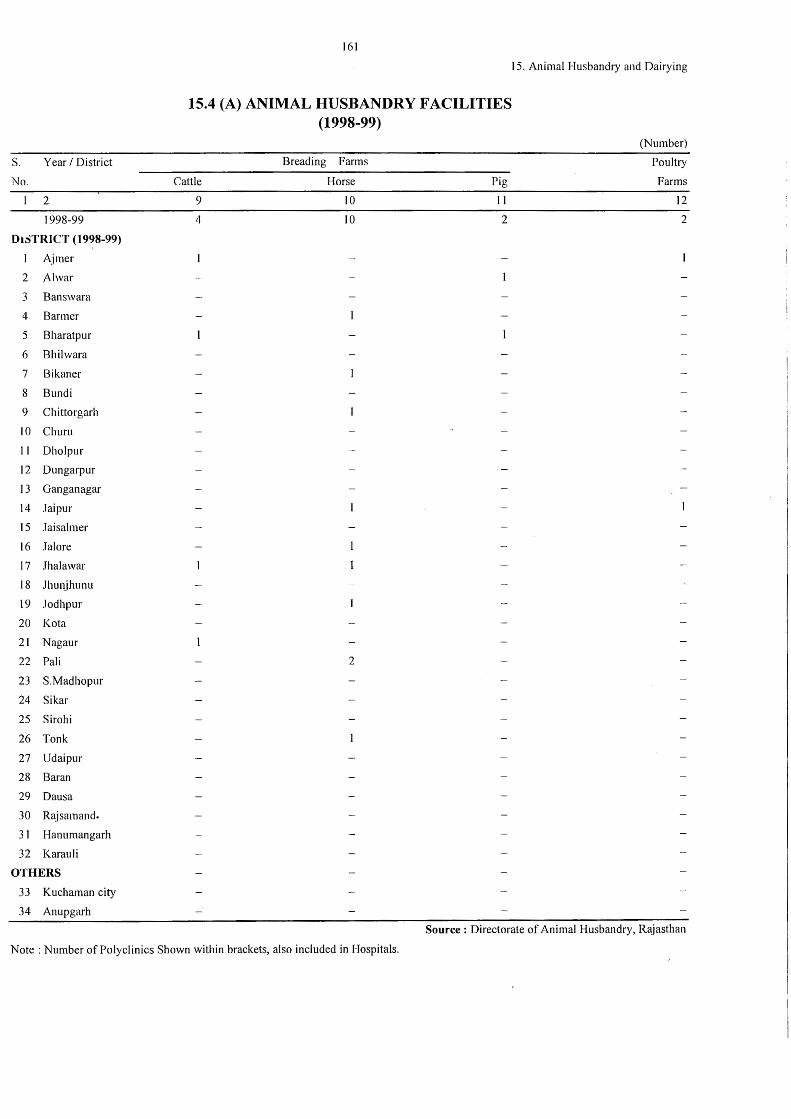
S. Year I District
No.
2
1998-99
Dt~TRICT (1998-99)
Ajmer
2 Al war
3 Banswara
4 Barmer
5 Bharatpur
6 Bhilwara
7 Bikaner
8 Bundi
9 Chittorgarh
10 Churu
11 Dholpur
12 Dungarpur
13 Ganganagar
14 Jaipur
15 Jaisalmer
16 Jal ore
17 Jhalawar
18 Jhunjhunu
19 Jodhpur
20 Ko ta
21 Nagaur
22 Pali
23 S.Madhopur
24 Sikar
25 Sirohi
26 Tonk
27 Udaipur
28 Baran
29 Daus a
30 Rajsamand.
31 Hanumangarh
32 Karau Ii
OTHERS
33 Kuchaman city
34 Anupgarh
161
15.4 (A) ANIMAL HUSBANDRY FACILITIES (1998-99)
Breading Farms
Cattle Horse Pig
9 10 11
4 10 2
2
15. Animal Husbandry and Dairying
(Number)
Poultry
Farms
12
2
Source: Directorate of Animal Husbandry, Rajasthan
Note : Number of Polyclinics Shown within brackets, also included in Hospitals.
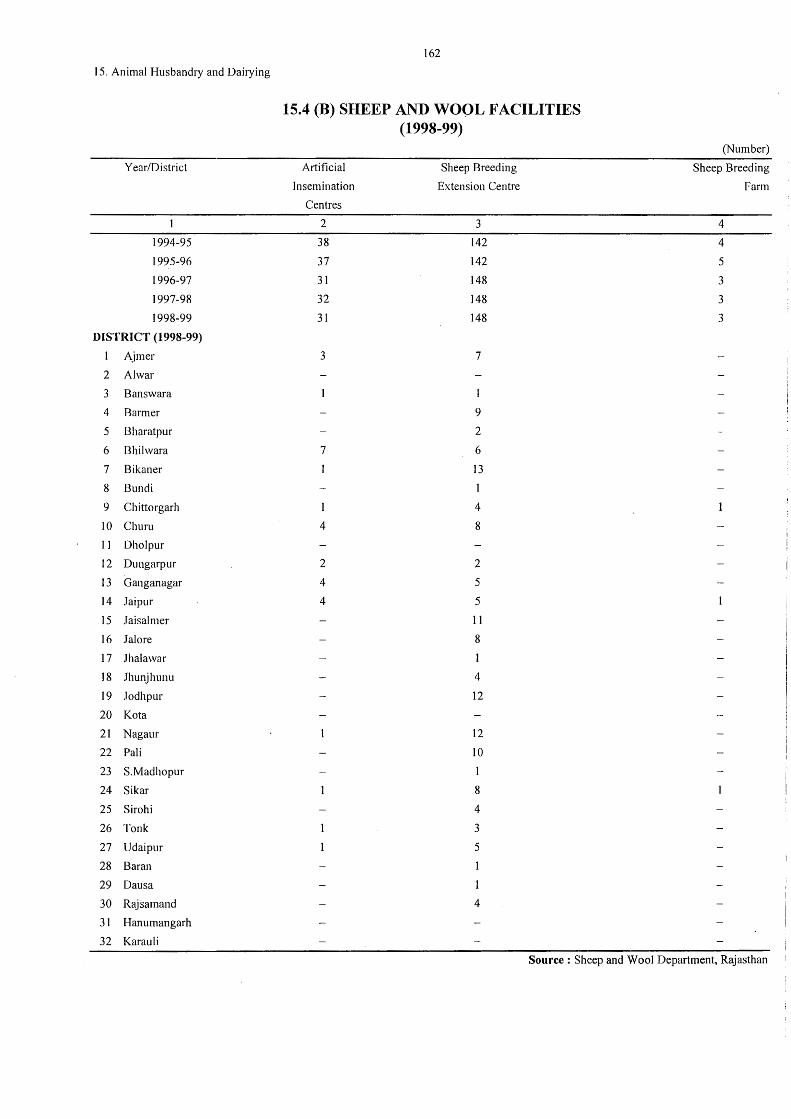
15. Animal Husbandry and Dairying
Year/District
1
1994-95
1995-96
1996-97
1997-98
1998-99
DISTRICT (1998-99)
Aimer
2 Al war
3 Banswara
4 Barmer
5 Bharatpur
6 Bhilwara
7 Bikaner
8 Bundi
9 Chittorgarh
10 Churn
11 Dholpur
12 Dungarpur
13 Ganganagar
14 Jaipur
15 Jaisalmer
16 Jal ore
17 Jhalawar
18 Jhunjhunu
19 .lodhpur
20 Ko ta
21 Nagaur
22 Pali
23 S.Madhopur
24 Sikar
25 Sirohi
26 Tonk
27 Udaipur
28 Baran
29 Dausa
30 Rajsamand
31 Hanumangarh
32 Karau Ii
162
15.4 (B) SHEEP AND WOOL FACILITIES (1998-99)
Artificial
Insemination
Centres
2
38
37
31
32
31
3
7
l
4
2
4
4
Sheep Breeding
Extension Centre
3
142
142
148
148
148
7
9
2
6
13
1
4
8
2
5
5
11
8
4
12
12
10
1
8
4
3
5
4
(Number)
Sheep Breeding
Farm
4
4
5
3
3
3
Source: Sheep and Wool Department, Rajasthan
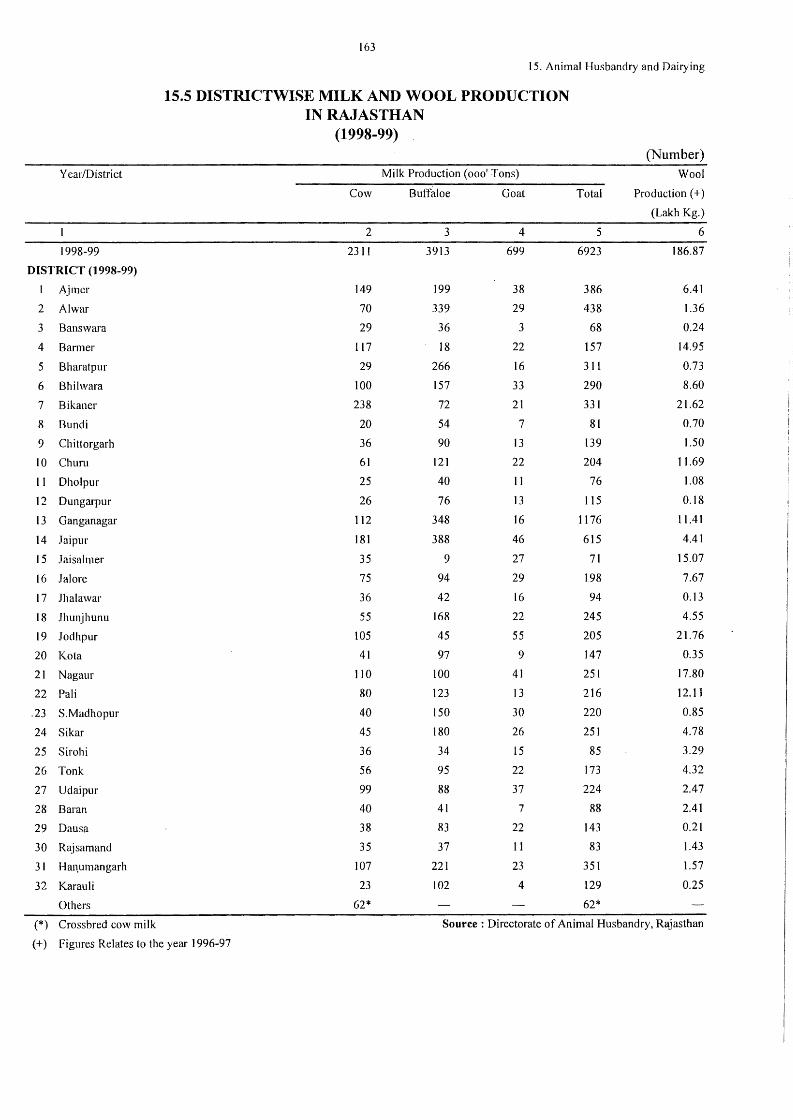
163
15. Animal Husbandry and Dairying
15.5 DISTRICTWISE MILK AND WOOL PRODUCTION IN RAJASTHAN
(1998-99) (Number)
Year/District Milk Production (0001 Tons) Wool
Cow Buffaloe Goat Total Production ( +)
(Lakh Kg.)
I 2 3 4 5 6
1998-99 2311 3913 699 6923 186.87
DISTRICT (1998-99)
I Ajmcr 149 199 38 386 6.41
2 Al war 70 339 29 438 1.36
3 Banswara 29 36 3 68 0.24
4 Barmer 117 18 22 157 14.95
5 Bharatpur 29 266 16 311 0.73
6 Bhilwara 100 157 33 290 8.60
7 Bikaner 238 72 21 331 21.62
8 Bundi 20 54 7 81 0.70
9 Chittorgarh 36 90 13 139 1.50
IO Chum 61 121 22 204 11.69
11 Dholpur 25 40 11 76 1.08
12 Dungarpur 26 76 13 115 0.18
13 Ganganagar 112 348 16 1176 11.41
14 Jaipur 181 388 46 615 4.41
15 Jaisalmer 35 9 27 71 15.07
16 Jalore 75 94 29 198 7.67
17 Jhalawar 36 42 16 94 0.13
18 Jhunjhunu 55 168 22 245 4.55
19 Jodhpur 105 45 55 205 21.76
20 Ko ta 41 97 9 147 0.35
21 Nagaur 110 100 41 251 17.80
22 Pali 80 123 13 216 12.11
.23 S.Madhopur 40 150 30 220 0.85
24 Sikar 45 180 26 251 4.78
25 Sirohi 36 34 15 85 3.29
26 Tonk 56 95 22 173 4.32
27 Udaipur 99 88 37 224 2.47
28 Baran 40 41 7 88 2.41
29 Dausa 38 83 22 143 0.21
30 Rajsamand 35 37 11 83 1.43
31 Haqumangarh 107 221 23 351 1.57
32 Karau Ii 23 102 4 129 0.25
Others 62* 62*
(*) Crossbred cow milk Source : Directorate of Animal Husbandry, Rajasthan
(+) Figures Relates to the year 1996-97
(16) FORESTRY
1n this section table 16.1 presents data relating to total area of forest according to legal
status. Table 16.2 associated with wild-life census of Rajasthan, which was held in the year
1997.
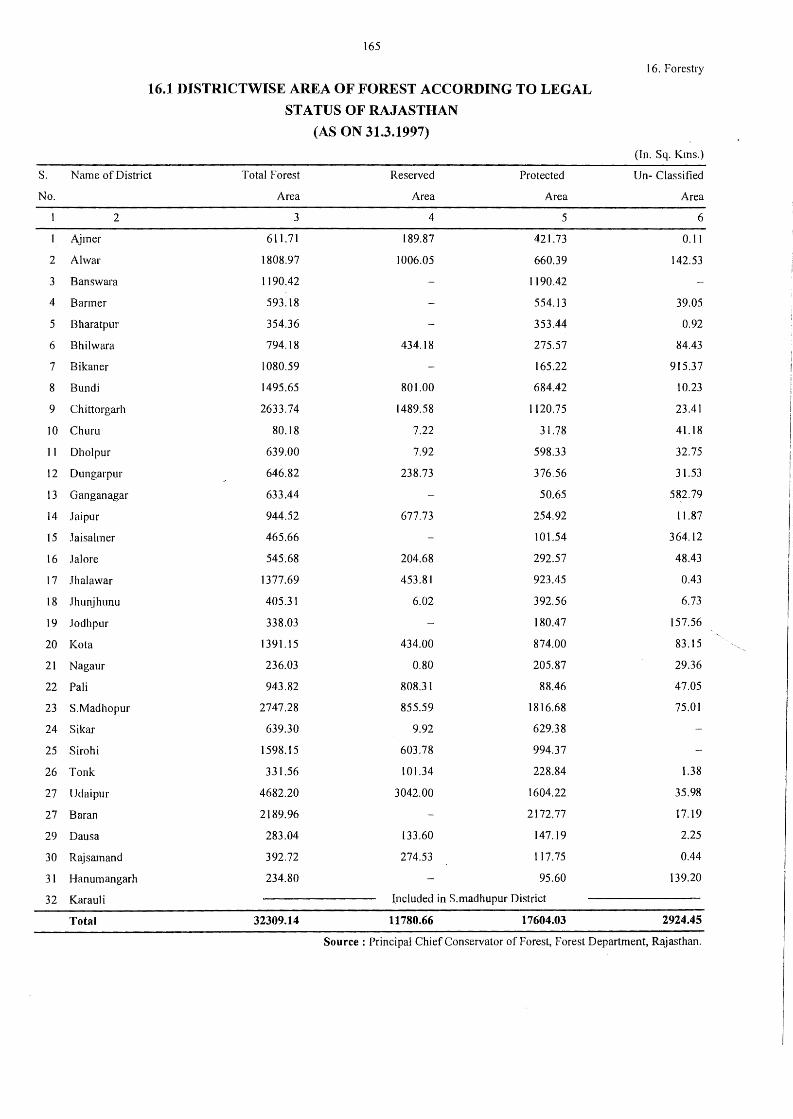
165
16. Forestry
16.l DISTRICTWISE AREA OF FOREST ACCORDING TO LEGAL
STATUS OF RAJASTHAN
(AS ON 31.3.1997)
(In. Sq. Kms.)
s. Name of District Total Forest Reserved Protected Un- Classified
No. Area Area Area Area
2 3 4 5 6
Ajmer 611.71 189.87 421.73 0.11
2 Al war 1808.97 1006.05 660.39 142.53
3 Banswara 1190.42 1190.42
4 Barmer 593.18 554.13 39.05
5 Bharatpur 354.36 353.44 0.92
6 Bhilwara 794.18 434.18 275.57 84.43
7 Bikaner 1080.59 165.22 915.37
8 Bundi 1495.65 801.00 684.42 10.23
9 Chittorgarh 2633.74 1489.58 1120.75 23.41
IO Churu 80.18 7.22 31.78 41.18
11 Dholpur 639.00 7.92 598.33 32.75
12 Dungarpur 646.82 238.73 376.56 31.53
13 Ganganagar 633.44 50.65 582.79
14 Jaipur 944.52 677.73 254.92 11.87
15 .laisalmer 465.66 101.54 364.12
16 Jal ore 545.68 204.68 292.57 48.43
17 Jhalawar 1377.69 453.81 923.45 0.43
18 Jhunjhunu 405.31 6.02 392.56 6.73
19 Jodhpur 338.03 180.47 157.56
20 Ko ta 1391.15 434.00 874.00 83.15
21 Nagaur 236.03 0.80 205.87 29.36
22 Pali 943.82 808.31 88.46 47.05
23 S.Madhopur 2747.28 855.59 1816.68 75.01
24 Sikar 639.30 9.92 629.38
25 Sirohi 1598.15 603.78 994.37
26 Tonk 331.56 101.34 228.84 1.38
27 Udaipur 4682.20 3042.00 1604.22 35.98
27 Baran 2189.96 2172.77 17.19
29 Daus a 283.04 133.60 147.19 2.25
30 Rajsamand 392.72 274.53 117.75 0.44
31 Hanumangarh 234.80 95.60 139.20
32 Karauli Included in S.madhupur District
Total 32309.14 11780.66 17604.03 2924.45
Source: Principal Chief Conservator of Forest, Forest Department, Rajasthan.
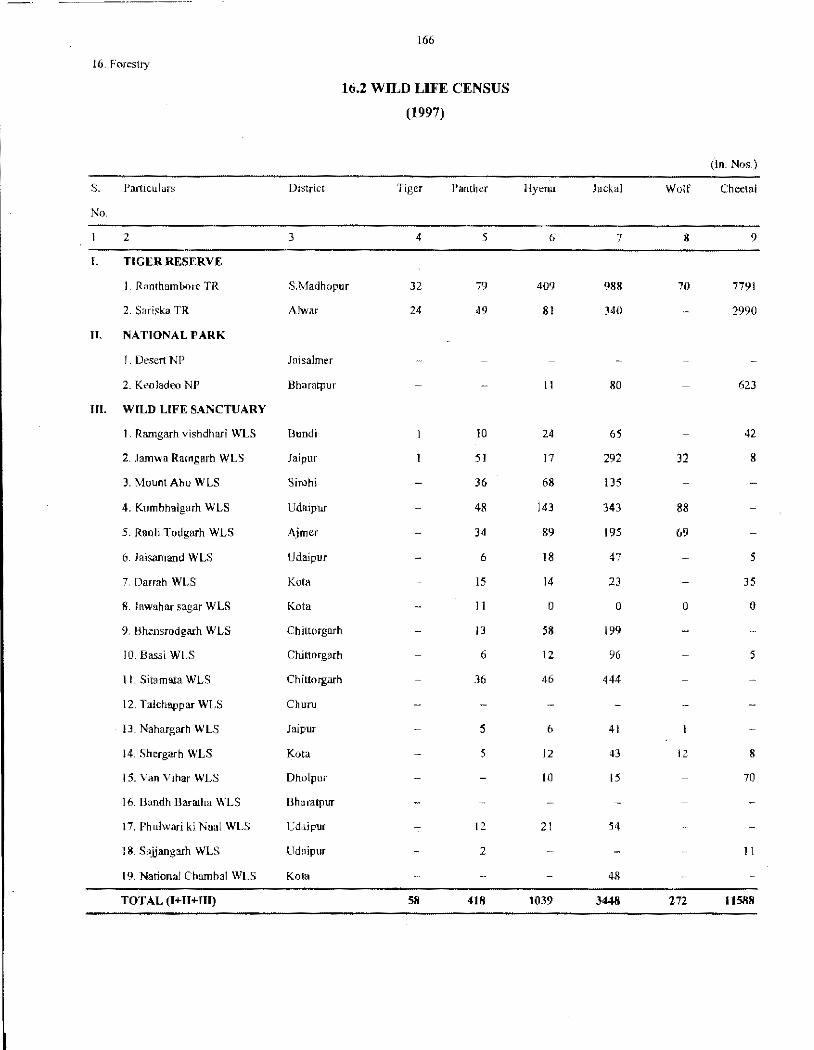
166
!6. Forestry
16.2 wn,n LIJiE CENSUS
(1997)
(In. Nos.)
S. Particuhirs District Tiger Panther Hyena Jackal Wolf Chcetal
No.
2 3 4 5 7 8 9
[, TIGER RESERVE
I. Ranthambore TR S.Madhopur 32 79 409 988 70 779!
2. Sariska TR Alwar 24 49 81 340 2990
II. NATIONAL PARK
I. Desert h'P Juisalmer
2. Keoladeo NP Bharntpur 11 80 623
Ill. WILD LIFE SANCTUARY
I. Rarngarh vishdhari WLS OtJndi JO 24 65 42
2. Jan1wa Ramgarh WLS Jaipur 51 17 292 32 8
3. Moont Aho WLS Sirohi 36 68 135
4. Kumbhalgurh WLS l;daipllr 48 143 343 88
5. Raoh T odgarh WLS Ajmcr J.1 89 195 69
6. .laisarnand WLS Udaipur 6 18 47 5
7. Darrah WLS KoIB 15 14 23 35
8. Jr\\vahar sagar \VLS Ko ta I I 0 0 0 0
9. Bhensrodgarh WLS Ch ittorgarh I 3 58 199
10. Bassi WLS Chinorgarh 6 12 96 5
11. Sitamata WLS Chittorgnrh J6 46 444
12. Ta!chappar Wl.S Churu
13. Nahargarh WLS Jaipur 5 6 41
14 Shergarh WLS Ko ta 5 12 43 12 8
15. Van Vihar WLS Dholpur 10 15 70
16. Bandh Bararha WLS Bharatpur
17. Phulwari ki Naol WLS Cdaipur 12 21 54
18. Sajjangarh WLS llduipur 2 11
19. National Chambal WLS Ko ta 48
TOT AL (IHl+III) 5li 418 1039 3<148 272 1151i8
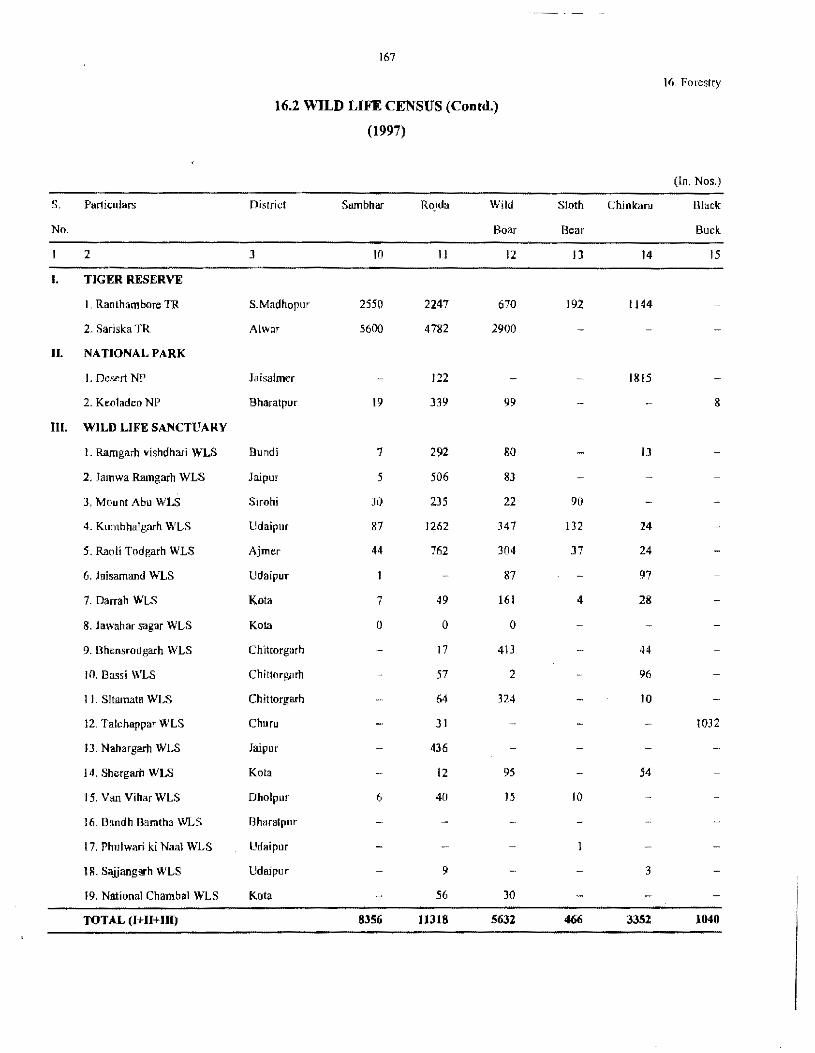
167
16. Forestry
16.2 WILD LIFE CENSUS (Contd.)
(1997)
(In. Nos.)
s. Par1iculars Oistrict Sambhar Rojda Wild Sloth Chinkar1J Illa ck
No. Boar Bear Buck
2 J ID II 12 l) 14 15
I. TIGER RESERVE
1. Ranthambore TR s.r-.1ndhopur 2550 2247 670 192 1144
2. Sariska TR Alw:i.r 5600 4782 2900
II. NATIONAL PARK
I. Desert NP Jaisalmer 122 1815
2. Keoladco NP Bharatpur 19 )39 99 8
Ill. WILD LIFE SANCTUARY
l. Ramgarh vishdhari WLS Bundi 7 292 80 IJ
2. lmnwa Ramgarh WLS Jaipur 5 506 8J
J. Mount Abu WLS Sirohi JO 2J5 22 90
4. Kumbhalgarh WLS Udaipur 87 1262 347 132 24
5. Raoli Todgarh WLS Ajmer 44 762 304 J7 24
6. JEtisamand WLS Udaipu.- 87 97
7. Darrah WLS Kota 7 49 161 4 28
8. Jawahar sagar WLS Kola 0 0 0
9. Bhensrndgarh WLS Chittorgarh 17 41l 44
JO. llassi WLS Chittorgarh 57 2 96
11. Sitamata WLS Ch ittorgarh 64 324 10
12. Talchappar WLS Churu JI IOJ2
lJ. Nahargarh WLS Jaipur 436
14. Shcrgarll WLS Kota 12 95 54
15. Van Vihar WLS Dholpur 6 40 15 IO
16. Bandh Baratha WLS Bharalpur
17. Phulwari ki Naal WLS Udaipor
IH. Saijangarh WLS Udaipur 9 l
19. National Chambal WLS Kot a 56 30
TOTAL (l+Il+III) 8JS6 11318 5632 ~ 3351 1040
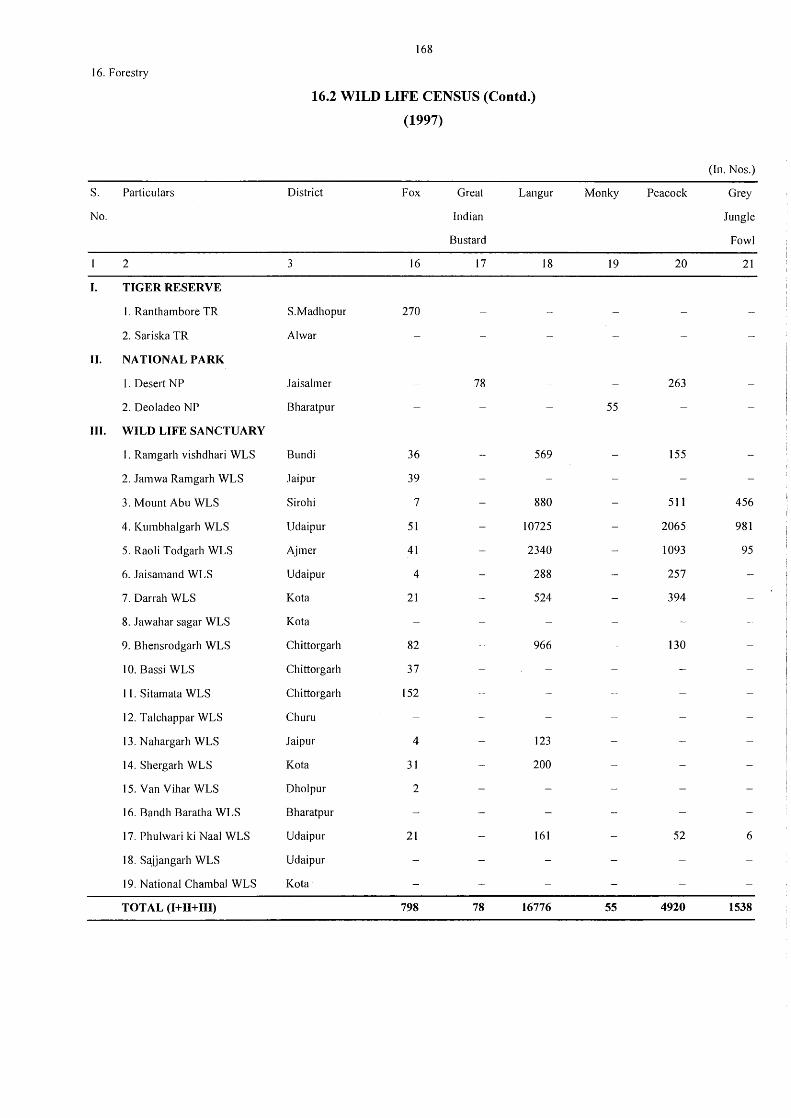
168
16. Forestry
16.2 WILD LIFE CENSUS (Contd.)
(1997)
(In. Nos.)
S. Patiiculars District Fox Great Langur Monky Peacock Grey
No. Indian Jungle
Bustard Fowl
2 3 16 17 18 19 20 21
I. TIGER RESERVE
1. Ranthambore TR S.Madhopur 270
2. Sariska TR Al war
II. NATIONAL PARK
1. Desert NP Jaisalmer 78 263
2. Deoladeo NP Bharatpur 55
Ill. WILD LIFE SANCTUARY
1 . Ramgarh vishdhari WLS Bundi 36 569 155
2. Jamwa Ramgarh WLS Jaipur 39
3. Mount Abu WLS Sirohi 7 880 511 456
4. Kumbhalgarh WLS Udaipur 51 10725 2065 981
5. Raoli Todgarh WLS Ajmer 41 2340 1093 95
6. Jaisamand WLS Udaipur 4 288 257
7. Darrah WLS Ko ta 21 524 394
8. Jawahar sagar WLS Ko ta
9. Bhensrodgarh WLS Chittorgarh 82 966 130
10. Bassi WLS Chittorgarh 37
11. Sitamata WLS Chittorgarh 152
12. Talchappar WLS Churn
13. N ahargarh WLS Jaipur 4 123
14. Shergarh WLS Ko ta 31 200
15. Van Vihar WLS Dholpur 2
16. Bandh Baratha WLS Bharatpur
17. Phulwari ki Naal WLS Udaipur 21 161 52 6
18. Sajjangarh WLS Udaipur
19. National Chambal WLS Ko ta
TOTAL (l+Il+III) 798 78 16776 55 4920 1538
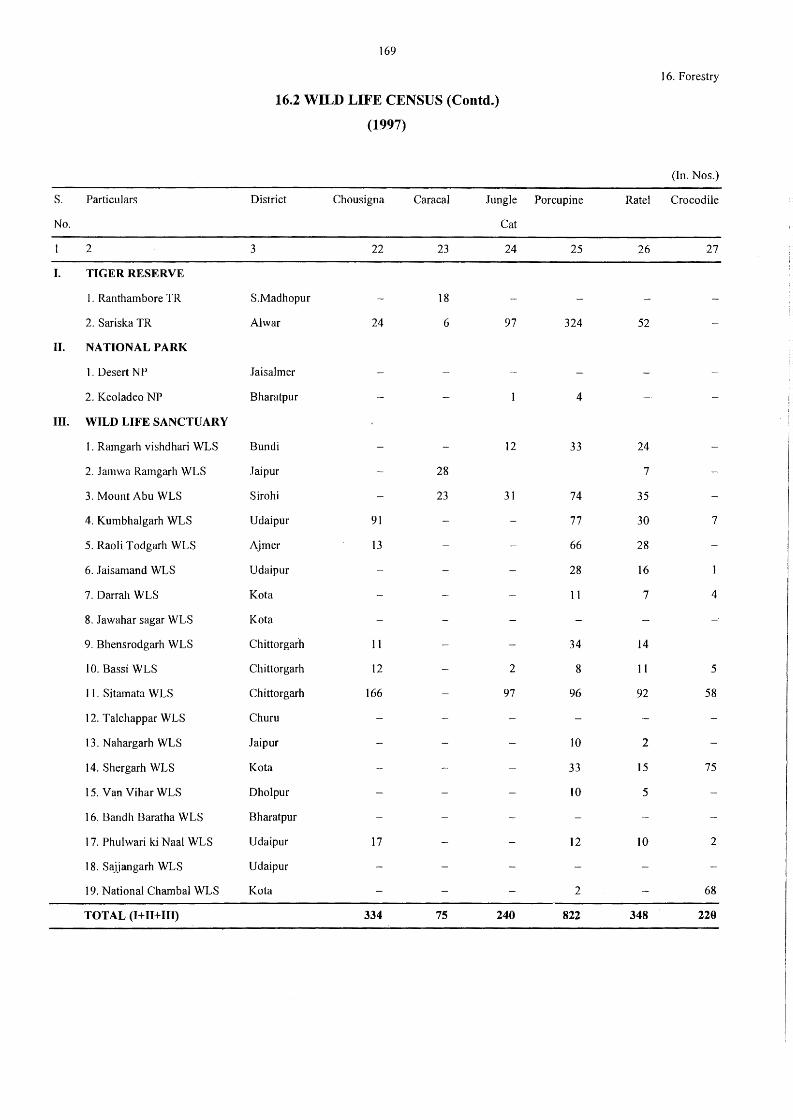
169
16. Forestry
16.2 WILD LIFE CENSUS (Contd.)
(1997)
(In. Nos.)
S. Particulars District Chousigna Caracal Jungle Porcupine Ratel Crocodile
No. Cat
2 3 22 23 24 25 26 27
I. TIGER RESERVE
I. Ranthambore TR S.Madhopur 18
2. Sariska TR Al war 24 6 97 324 52
II. NATIONAL PARK
1. Desert NP Jaisalmer
2. Keoladeo NP Bharatpur 4
III. WILD LIFE SANCTUARY
1. Ramgarh vishdhari WLS Bundi 12 33 24
2. Jamwa Ramgarh WLS Jaipur 28 7
3. Mount Abu WLS Sirohi 23 31 74 35
4. Kumbhalgarh WLS Udaipur 91 77 30 7
5. Raoli Todgarh WLS Ajmer 13 66 28
6. Jaisamand WLS Udaipur 28 16
7. Darrah WLS Kot a 11 7 4
8. Jawahar sagar WLS Kot a
9. Bhensrodgarh WLS Chittorgarh 11 34 14
10. Bassi WLS Chittorgarh 12 2 8 11 5
11. Sitamata WLS Chittorgarh 166 97 96 92 58
12. Talchappar WLS Chum
13. N ahargarh WLS Jaipur 10 2
14. Shergarh WLS Ko ta 33 15 75
15. Van Vihar WLS Dholpur 10 5
16. Bandh Baratha WLS Bharatpur
17. Phulwari ki Naal WLS Udaipur 17 12 10 2
18. Sajjangarh WLS Udaipur
19. National Chambal WLS Ko ta 2 68
TOTAL (I+II+IIl) 334 75 240 822 348 229
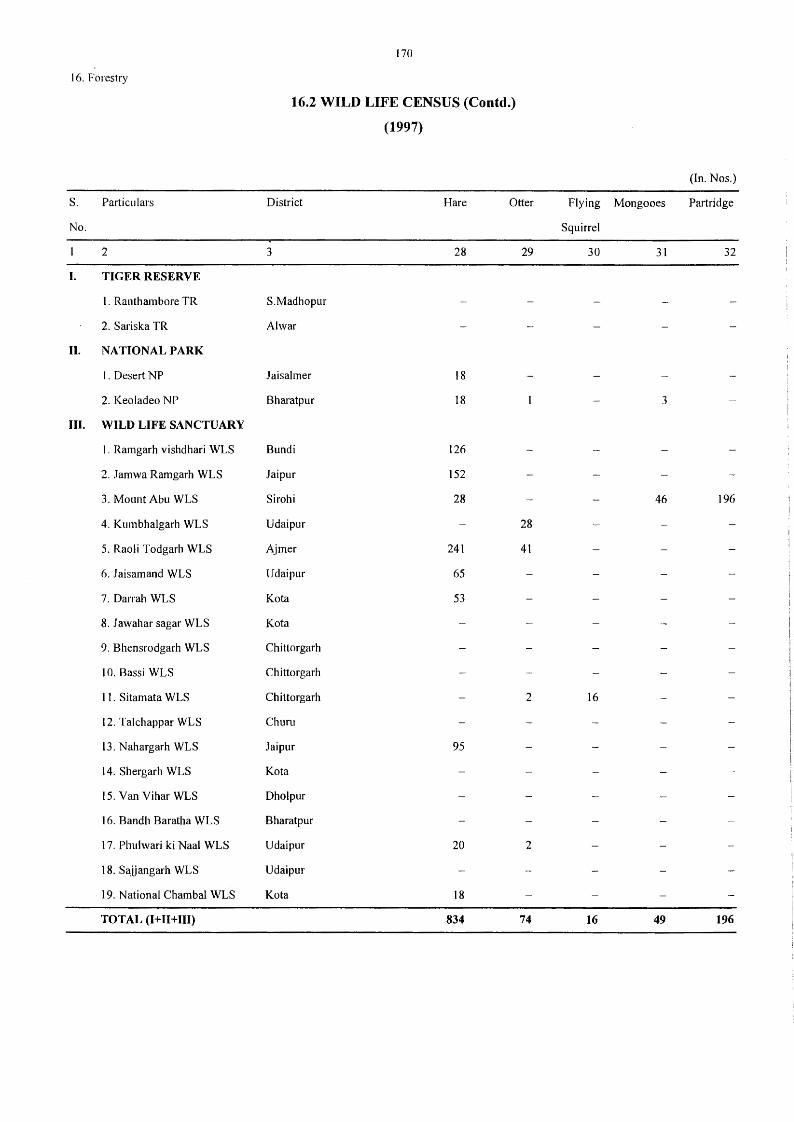
170
16. Forestry
16.2 WILD LIFE CENSUS (Contd.)
(1997)
(In. Nos.)
S. Particulars District Hare Otter Flying Mongooes Partridge
No. Squirrel
2 3 28 29 30 31 32
I. TIGER RESERVE
1. Ranthambore TR S.Madhopur
2. Sariska TR Al war
II. NATIONAL PARK
I. Desert NP Jaisalmer 18
2. Keoladeo NP Bharatpur 18 3
HI. WILD LIFE SANCTUARY
I. Ramgarh vishdhari WLS Bundi 126
2. Jamwa Ramgarh WLS Jaipur 152
3. Mount Abu WLS Sirohi 28 46 196
4. Kumbhalgarh WLS Udaipur 28
5. Raoli Todgarh WLS Ajmer 241 41
6. J aisamand WLS Udaipur 65
7. Darrah WLS Ko ta 53
8. Jawahar sagar WLS Ko ta
9. Bhensrodgarh WLS Chittorgarh
10. Bassi WLS Chittorgarh
11. Sitamata WLS Chittorgarh 2 16
12. Talchappar WLS Chum
13. Nahargarh WLS Jaipur 95
14. Shergarh WLS Ko ta
15. Van Vihar WLS Dholpur
16. Bandh Baratha WLS Bharatpur
17. Phulwari ki Na.al WLS Udaipur 20 2
18. Sajjangarh WLS Udaipur
19. National Chambal WLS Ko ta 18
TOTAL (I+II+lll) 834 74 16 49 196
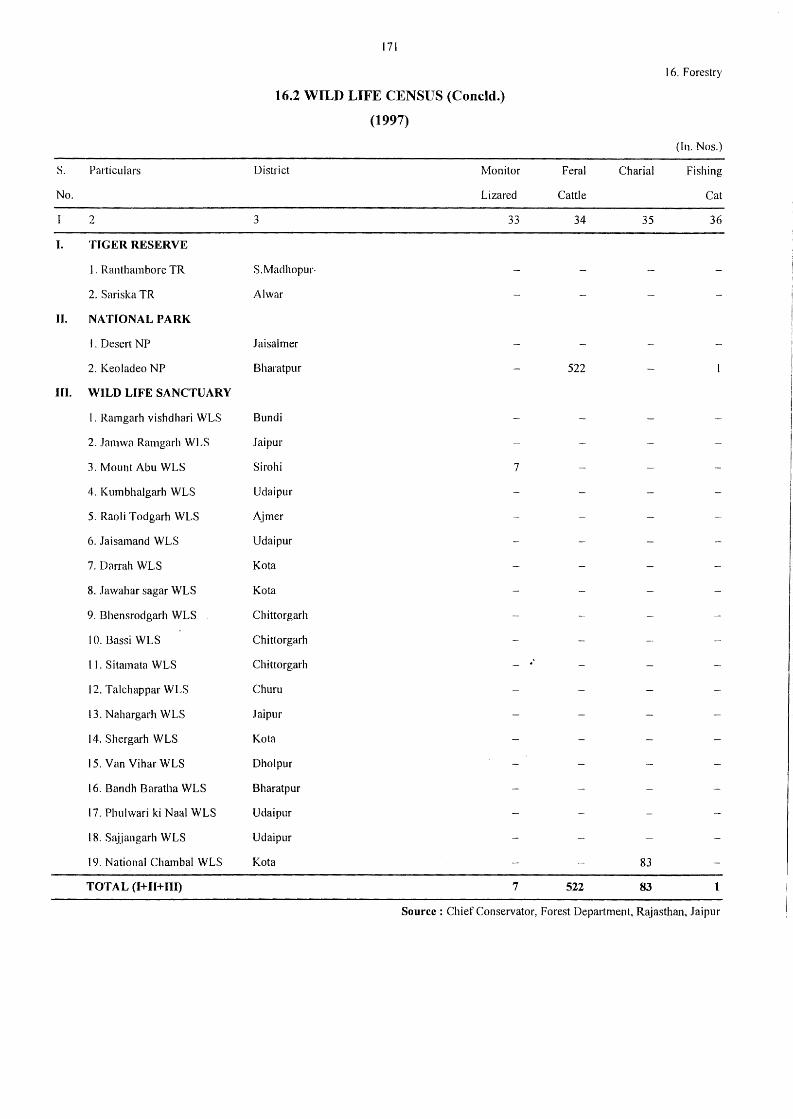
171
16. Forestry
16.2 WILD LIFE CENSUS (Concld.)
(1997)
(In. Nos.)
S. Particulars District Monitor Feral Chari al Fishing
No. Lizared Cattle Cat
2 3 33 34 35 36
I. TIGER RESERVE
I. Ranthambore TR S.Madhopur-
2. Sariska TR Al war
JI. NATIONAL PARK
I. Desert NP Jaisalmer
2. Keoladeo NP Bharatpur 522
HI. WILD LIFE SANCTUARY
I. Ramgarh vishdhari WLS Bundi
2. Jamwa Rarngarh WLS Jaipur
3. Mount Abu WLS Sirohi 7
4. Kumbhalgarh WLS Udaipur
5. Raoli Todgarh WLS Ajmer
6. Jaisamand WLS Udaipur
7. Darrah WLS Kata
8. Jawahar sagar WLS Ko ta
9. Bhensrodgarh WLS Chittorgarh
I 0. Bassi WLS Chittorgarh
11. Sitamata WLS Chittorgarh . 12. Talchappar WLS Churn
13. Nahargarh WLS Jaipur
14. Shergarh WLS Ko ta
15. Van ViharWLS Dholpur
16. Bandh Baratha WLS Bharatpur
17. Phulwari ki Naal WLS Udaipur
18. Sajjangarh WLS Udaipur
19. National Chambal WLS Kot a 83
TOTAL (l+JJ+III) 7 522 83
Source : Chief Conservator, Forest Department, Rajasthan, Jaipur
(17) CO-OPERATIVE
CO-OPERATIVE SOCIETY - The Co-operative society means the society which has been
registered under the Raj asthan co-operative society Act, 1953.
SHARE CAPITAL - It denotes the paid-up amount.
WORKING CAPITAL - It includes share capital, deposits, borrowings of land mortage
banks and societies and reserves.
LOAN ADVANCED - These are loans issued to members.
RECOVERIES - these are amounts recovered against the loans advanced.
The data relates to the co-operative year ending 30th June of every year and is supplied by
the Registrar, Co-operative Societies, R~jasthan.
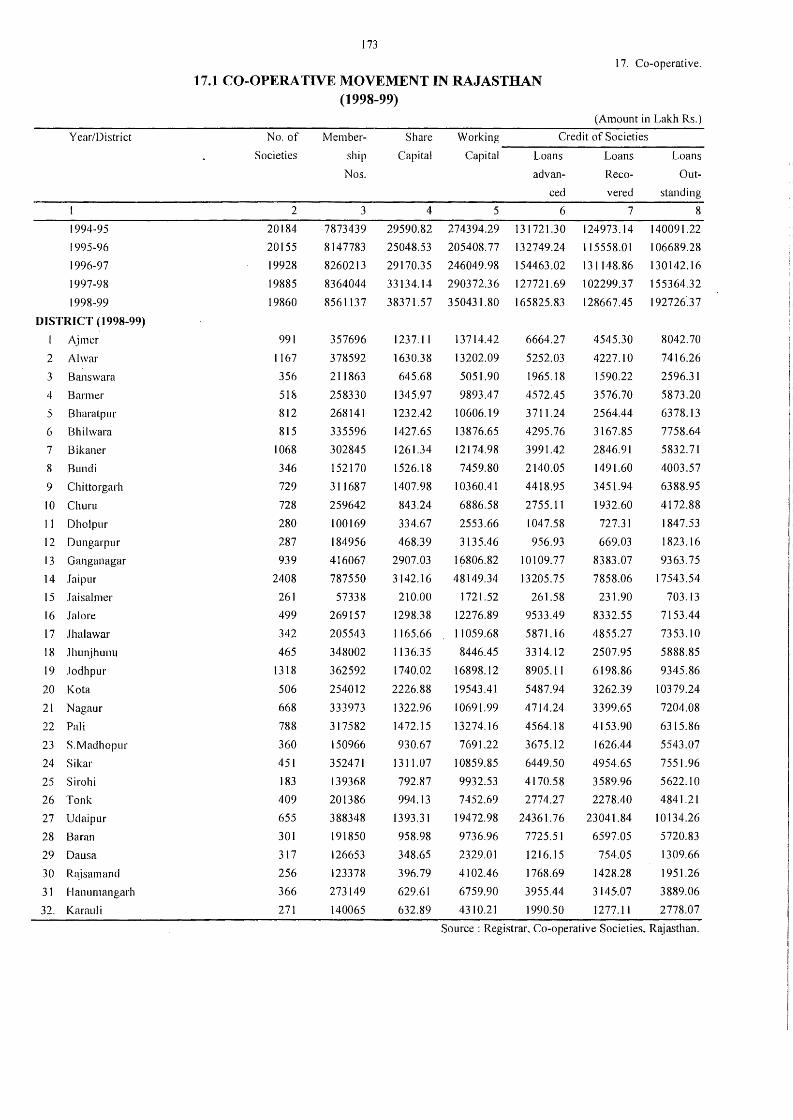
Year/District
1994-95
1995-96
1996-97
1997-98
1998-99
DISTRICT (1998-99)
Ajmcr
2 Alwar
3 Banswara
4 Barmer
5 Bharalpur
6 Bhilwara
7 Bikaner
8 Bundi
9 Chittorgarh
IO Churu
11 Dholpur
12 Dungarpur
13 Ganganagar
14 Jaipur
15 .laisalmer
16 Jalore
17 Jhalawar
18 Jhunjhunu
I 9 .Jodhpur
20 Kota
21 Nagaur
22 Pali
23 S.Madhopur
24 Sikar
25 Sirohi
26 Tonk
27 Udaipur
28 Baran
29 Dausa
30 Rajsamand
31 1-lanumangarh
32. Karauli
173
17. Co-operative.
17.1 CO-OPERATIVE MOVEMENT IN RAJASTHAN (1998-99)
No. of
Societies
2
20184
20155
19928
19885
19860
991
1167
356
518
812
815
1068
346
729
728
280
287
939
2408
261
499
342
465
1318
506
668
788
360
451
183
409
655
301
317
256
366
271
Member
ship
Nos.
3
7873439
8147783
8260213
8364044
8561137
357696
378592
211863
258330
268141
335596
302845
152170
3] 1687
259642
100169
184956
416067
787550
57338
269157
205543
348002
362592
254012
333973
317582
150966
352471
139368
201386
388348
191850
126653
123378
273149
140065
Share
Capital
4
Working
Capital
5
29590.82 274394.29
25048.53 205408. 77
29170.35 246049.98
33] 34.14 290372.36
38371.57 350431.80
1237.11
1630.38
645.68
1345.97
1232.42
1427.65
1261.34
1526.18
1407.98
843.24
334.67
468.39
2907.03
3142.16
210.00
1298.38
1165.66
1136.35
1740.02
2226.88
1322.96
1472.15
930.67
1311.07
792.87
994.13
1393.31
958.98
348.65
396.79
629.61
632.89
I 3714.42
13202.09
5051.90
9893.47
10606.19
13876.65
12174.98
7459.80
10360.41
6886.58
2553.66
3135.46
16806.82
48149.34
1721.52
12276.89
11059.68
8446.45
16898.12
19543.41
10691.99
13274.16
7691.22
10859.85
9932.53
7452.69
19472.98
9736.96
2329.01
4102.46
6759.90
4310.21
(Amount in Lakh Rs.)
Credit of Societies ~~~~~~~~~~~~~
Loans Loans
adv an- Reco-
ced
6
131721.30
132749.24
154463.02
127721.69
165825.83
6664.27
5252.03
1965.18
4572.45
3711.24
4295.76
3991.42
2140.05
4418.95
2755.11
I 047.58
956.93
10109.77
13205.75
261.58
9533.49
5871.16
3314.12
8905.11
5487.94
4714.24
4564.18
3675.12
6449.50
4170.58
2774.27
24361.76
7725.51
1216.15
1768.69
3955.44
1990.50
vered
7
124973.14
115558.01
131148.86
102299.37
128667.45
4545.30
4227.10
1590.22
3576.70
2564.44
3167.85
2846.91
1491.60
3451.94
1932.60
727.31
669.03
8383.07
7858.06
231.90
8332.55
4855.27
2507.95
6198.86
3262.39
3399.65
4153.90
1626.44
4954.65
3589.96
2278.40
23041.84
6597.05
754.05
1428.28
3145-.07
1277.11
Loans
Out
standing
8
140091.22
106689.28
130142.16
155364.32
192726 .. 37
8042.70
7416.26
2596.31
5873.20
6378.13
7758.64
5832.71
4003.57
6388.95
4172.88
1847.53
1823.16
9363.75
17543.54
703.13
7153.44
7353.10
5888.85
9345.86
10379.24
7204.08
6315.86
5543.07
7551.96
5622.10
4841.21
I 0134.26
5720.83
1309.66
1951.26
3889.06
2778.07
Source : Registrar, Co-operative Societies, Rajasthan.
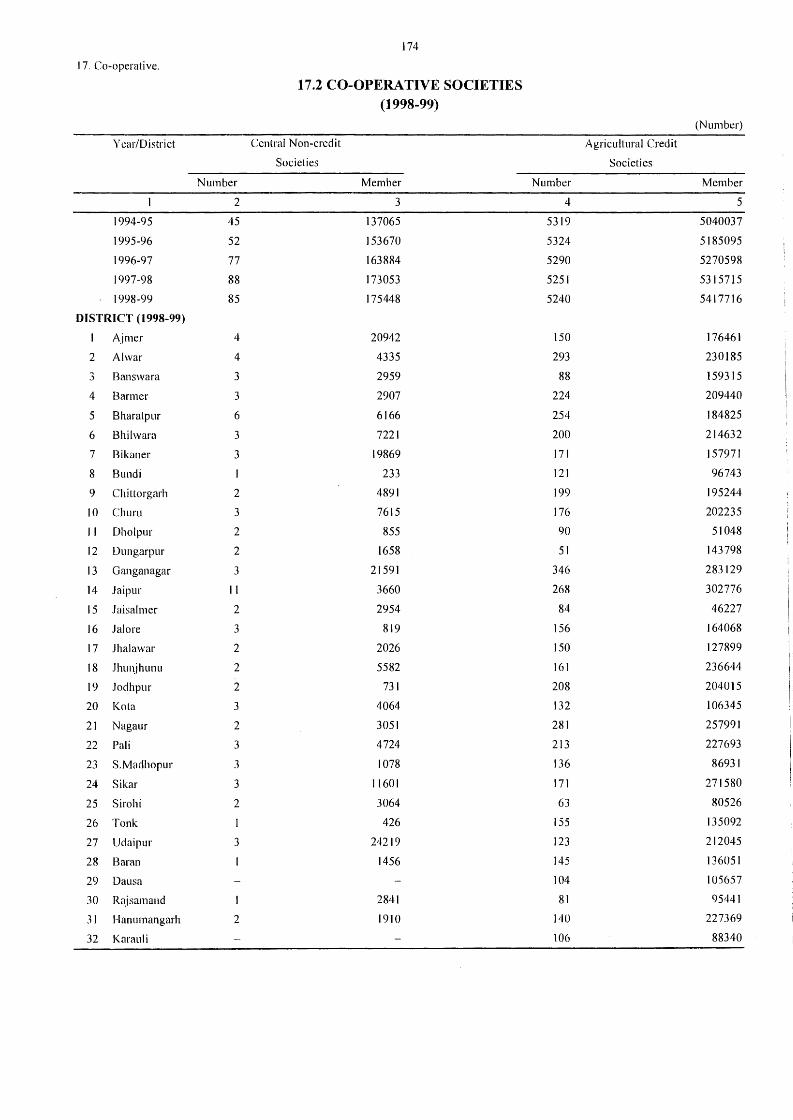
174
17. Co-operative.
17.2 CO-OPERATIVE SOCIETIES (1998-99)
(Number)
Year/District Ccnlral Non-credit Agricultural Credit
Societies Societies
Number Member Number Member
2 3 4 5
1994-95 45 137065 5319 5040037
1995-96 52 153670 5324 5185095
1996-97 77 163884 5290 5270598
1997-98 88 173053 5251 5315715
1998-99 85 175448 5240 5417716
DISTRICT (1998-99)
Ajmer 4 20942 150 176461
2 Al war 4 4335 293 230185
3 Banswara 3 2959 88 159315
4 Barmer 3 2907 224 209440
5 Bharalpur 6 6166 254 184825
6 Bhilwara 3 7221 200 214632
7 Bikaner 3 19869 171 157971
8 Bundi 233 121 96743
9 Chittorgarh 2 4891 199 195244
10 Churu 3 7615 176 202235
11 Dholpur 2 855 90 51048
12 Dungarpur 2 1658 51 143798
13 Ganganagar 3 21591 346 283129
14 Jaipur 11 3660 268 302776
15 Jaisalmer 2 2954 84 46227
16 Jal ore 3 819 156 164068
17 .lhalawar 2 2026 150 127899
18 Jhut\jhunu 2 5582 161 236644
19 Jodhpur 2 731 208 204015
20 Kola 3 4064 132 106345
21 Nagaur 2 3051 281 257991
22 Pali 3 4724 213 227693
23 S.Madhopur 3 1078 136 86931
24 Sikar 3 11601 171 271580
25 Sirohi 2 3064 63 80526
26 Tonk 426 155 135092
27 Udaipur 3 24219 123 212045
28 Baran 1456 145 136051
29 Dausa 104 105657
30 Rajsamand 2841 81 95441
31 Hanumangarh 2 1910 140 227369
32 Karau Ii 106 88340
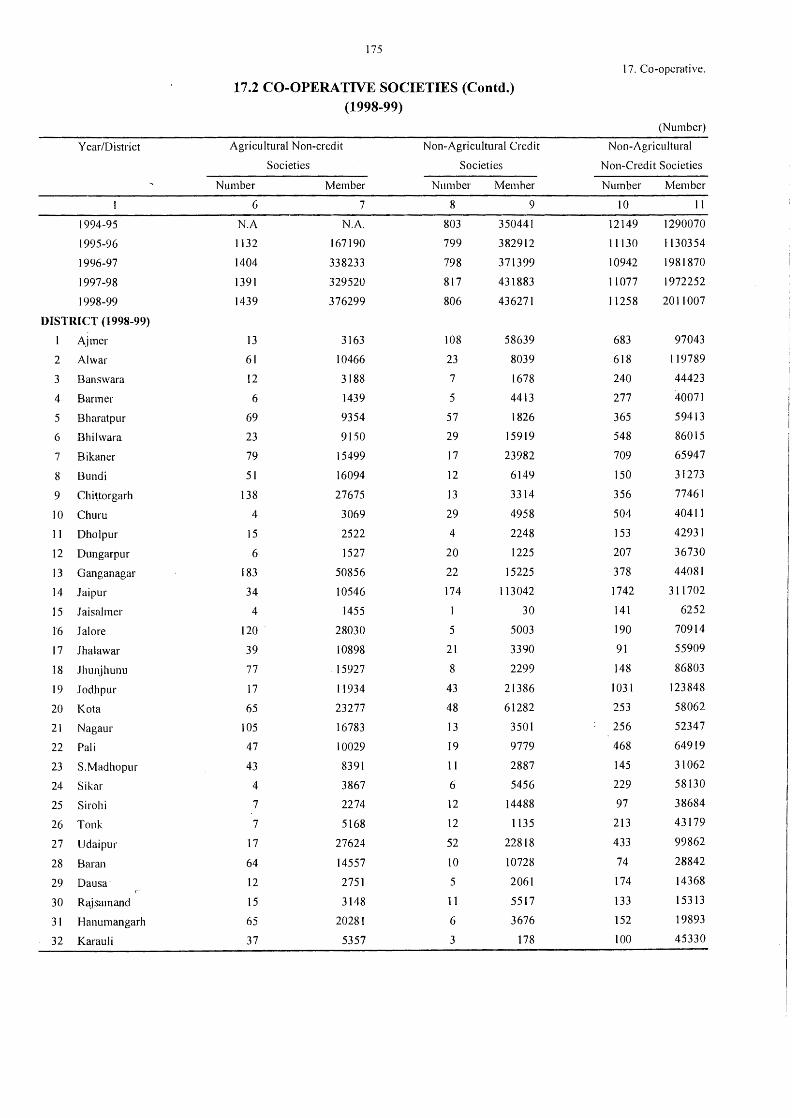
Year/District
1994-95
1995-96
1996-97
1997-98
1998-99
DISTRICT (1998-99)
1 Ajmer
2 Alwar
3 Banswara
4 Barmer
5 Bharatpur
6 Bhilwara
7 Bikaner
8 Bundi
9 Chittorgarh
10 Churn
11 Dholpur
12 Dungarpur
13 Ganganagar
14 Jaipur
15 Jaisalmer
l6 Jalore
17 Jhalawar
18 Jhunjhunu
19 .Todhpur
20 Kata
21 Nagaur
22 Pali
23 S.Madhopur
24 Sikar
25 Sirolli
26 Tonk
27 Udaipur
28 Baran
29 Dausa·
30 Rajsamand
3 I Hanumangarh
32 Karauli
175
17.2 CO-OPERATIVE SOCIETIES (Contd.) (1998-99)
Agricultural Non-credit
Societies
Number
6
N.A
1132
1404
1391
1439
13
61
12
6
69
23
79
51
138
4
15
6
183
34
4
120
39
77
17
65
105
47
43
4
7
7
17
64
12
15
65
37
Member
7
N.A.
167190
338233
329520
376299
3163
10466
3188
1439
9354
9150
15499
16094
27675
3069
2522
1527
50856
10546
1455
28030
10898
15927
I 1934
23277
16783
10029
8391
3867
2274
5168
27624
14557
2751
3148
20281
5357
Non-Agricultural Credit
Societies
Number
8
803
799
798
817
806
108
23
7
5
57
29
17
12
13
29
4
20
22
174
5
21
8
43
48
13
19
11
6
12
12
52
10
5
11
6
3
Member
9
350441
382912
371399
431883
436271
58639
8039
1678
4413
1826
15919
23982
6149
3314
4958
2248
1225
15225
113042
30
5003
3390
2299
21386
61282
3501
9779
2887
5456
14488
1135
22818
10728
2061
5517
3676
178
17. Co-operative.
(Number)
Non-Agricultural
Non-Credit Societies
Number
10
12149
11130
10942
11077
11258
683
618
240
277
365
548
709
150
356
504
153
207
378
1742
141
190
91
148
1031
253
256
468
145
229
97
213
433
74
174
133
152
100
Member
11
1290070
1130354
1981870
1972252
2011007
97043
119789
44423
40071
59413
86015
65947
31273
77461
40411
42931
36730
44081
311702
6252
70914
55909
86803
123848
58062
52347
64919
31062
58130
38684
43179
99862
28842
14368
15313
19893
45330
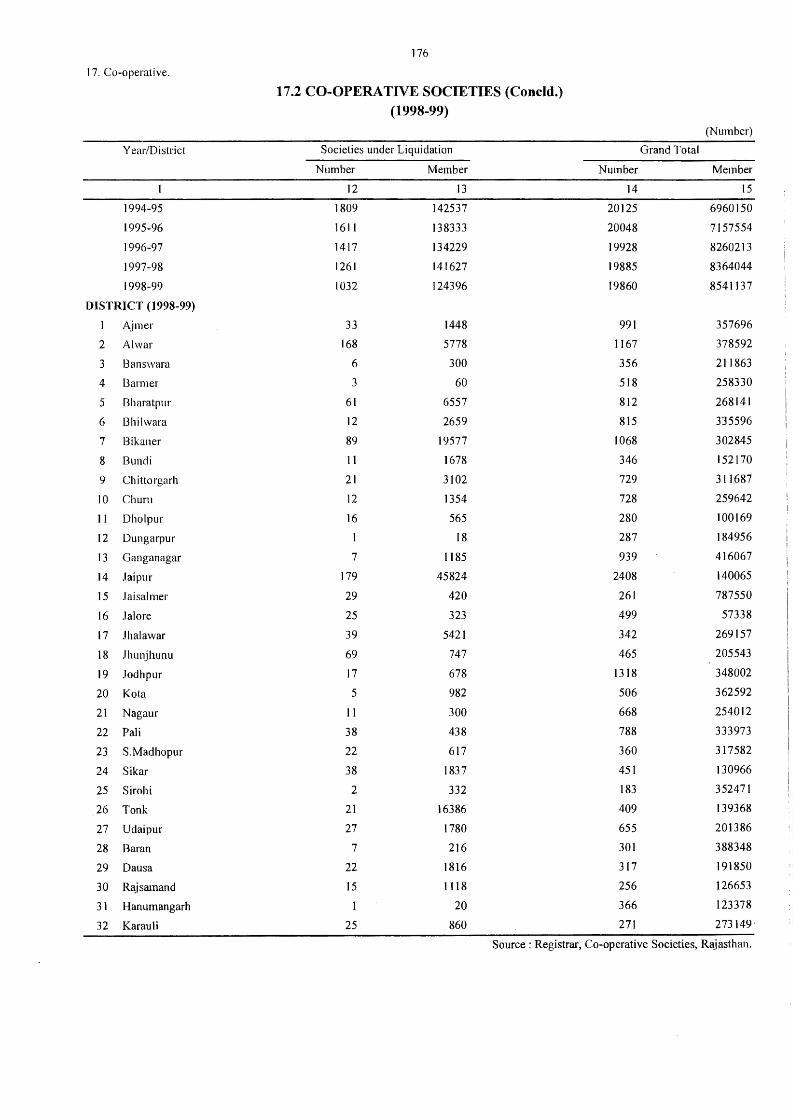
176
17. Co-operative.
17.2 CO-OPERATIVE SOCIETIES (Concld.) (1998-99)
(Number)
Year/District Societies under Liquidation Grand Total
Number Member Number Member
12 13 14 15
1994-95 1809 142537 20125 6960150
1995-96 1611 138333 20048 7157554
1996-97 1417 134229 19928 8260213
1997-98 1261 141627 19885 8364044
1998-99 1032 124396 19860 8541137
DISTRICT (1998-99)
I Ajmer 33 1448 991 357696
2 Al war 168 5778 I 167 378592
3 Banswara 6 300 356 211863
4 Barmer 3 60 518 258330
5 Bharatpur 61 6557 812 268141
6 13hilwara 12 2659 815 J35596
7 Bikaner 89 19577 1068 302845
8 Bundi 11 1678 346 152170
9 Chi tto rgarh 21 3102 729 311687
10 Churn 12 1354 728 259642
11 Dholpur 16 565 280 100169
12 Dungarpur I 18 287 184956
13 Ganganagar 7 1185 939 416067
14 Jaipur 179 45824 2408 140065
15 Jaisalmer 29 420 261 787550
16 Jal ore 25 323 499 57338
17 Jhalawar 39 5421 342 269157
18 Jhunjhunu 69 747 465 205543
19 Jodhpur 17 678 1318 348002
20 Ko ta 5 982 506 362592
21 Nagaur 11 300 668 254012
22 Pali 38 438 788 333973
23 S.Madhopur 22 617 360 317582
24 Sikar 38 1837 451 130966
25 Sirohi 2 332 183 352471
26 Tonk 21 16386 409 139368
27 Udaipur 27 1780 655 201386
28 Baran 7 216 301 388348
29 Daus a 22 1816 317 191850
30 Rajsamand 15 1118 256 126653
31 Hanumangarh 20 366 123378
32 Karau Ji 25 860 271 273149.
Source: Registrar, Co-operative Societies, Rajasthan.
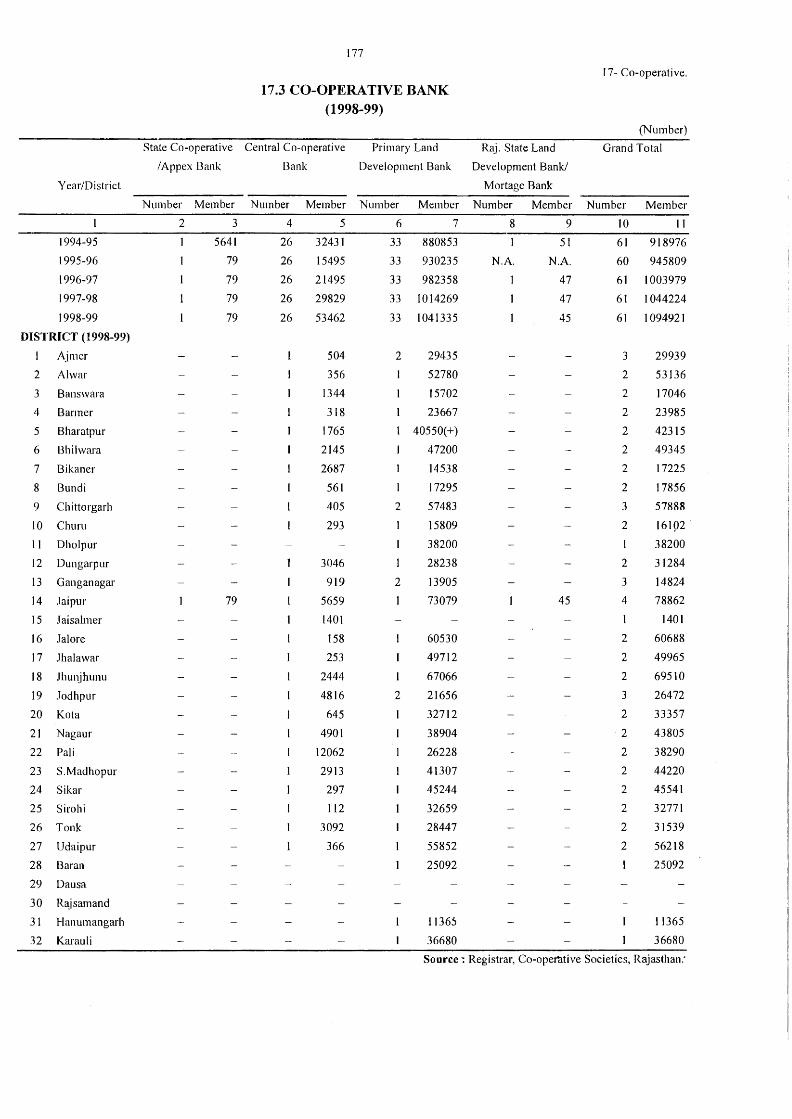
177
17- Co-operative.
17.3 CO-OPERATIVE BANK (1998-99)
(Number)
State Co-operative Central Co-operative Primary Land Raj. State Land Grand Total
/Appex Bank Bank Development Bank Development Bank/
Year/District Mortage Bank
Number Member Number Member Number Member Number Member Number Member
2 3 4 5 6 7 8 9 10 11
1994-95 5641 26 32431 33 880853 51 61 918976
1995-96 79 26 15495 33 930235 N.A. N.A. 60 945809
1996-97 79 26 21495 33 982358 1 47 61 1003979
1997-98 79 26 29829 33 1014269 47 61 1044224
1998-99 79 26 53462 33 1041335 45 61 1094921
DISTRICT (1998-99)
I Ajmer 504 2 29435 3 29939
2 Al war 356 I 52780 2 53136
3 Banswara 1344 15702 2 17046
4 Barmer 318 23667 2 23985
5 Bharatpur 1765 40550(+) 2 42315
6 Bhilwara 2145 47200 2 49345
7 Bikaner 2687 14538 2 17225
8 Bundi 561 17295 2 17856
9 Chittorgarh 405 2 57483 3 57888
10 Churu 293 15809 2 16192
11 Dholpur 38200 38200
12 Dungarpur 3046 28238 2 31284
13 Ganganagar 919 2 13905 3 14824
14 Jaipur 79 5659 1 73079 45 4 78862
15 Jaisalmer 1401 1401
16 Jal ore 158 60530 2 60688
17 Jhalawar 253 49712 2 49965
18 Jhunjhunu 2444 67066 2 69510
19 Jodhpur 4816 2 21656 3 26472
20 Kot a 645 I 32712 2 33357
21 Nagaur 4901 38904 2 43805
22 Pali 12062 26228 2 38290
23 S.Madhopur 2913 41307 2 44220
24 Sikar 297 45244 2 45541
25 Sirolli 112 32659 2 32771
26 Tonk 3092 28447 2 31539
27 Udaipur 366 55852 2 56218
28 Baran 25092 25092
29 Dausa
30 Rajsamand
31 Hanumangarh 11365 11365
32 Karau Ii 36680 36680
Source~ Registrar, Co-operative Societies, Rajasthan:
(18) MINING & QUARRYING
The mineral statistics are collected and compiled by the Directorate of Mines and Geology, Rajasthan to supply the data in case of major and minor minerals is a statutory obligation on the part of the leases but in case of certain minor minerals and specially building materials, where rent cum-royalty leases are granted the production, sale value and average number of persons employed per day are estimated on the basis of royalty collection through royalty collection contractors.
In Table No. 18.l the data is obtained from Indian Bureau ofMine·s, Nagpur.

179
18. Mining and Quarrying
18.1 DISTRICTWISE MINERAL PRODUCTION IN RAJASTHAN
Unit
District/ of
Mineral Quantity
1 2
TOTAL RAJASTHAN
1.AJMER
Asbestos
Emerald
Tonne
Kg.
Fels par Tonne
Garnet (Abrasive ) Tonne
Limestone OOOt
Magnesite Tonne
Mica Tonne
Mica (Waste & Ser) Tonne
Quartz Tonne
Steatite Tonne
Vermiculite Tonne
Wallastonite Tonne
SUBTOTAL
2.ALWAR
Copper Ore
Barytes
Fe I spar
Fireclay
Ochre
Quartz
Silica Sand
Steatite
Dolomite
SUBTOTAL
3. BANSWARA
Graphite
Limestone
Phosphorite
Steatite
Dolomite
SUBTOTAL
4.BARMER
Gypsum
Silica Sand
SUBTOTAL
Tonne
Tonne
Tonne
Tonne
Tonne
Tonne
Tonne
Tonne
Tonne
Tonne
OOOt
Tonne
Tonne
Tonne
Tonne
Tonne
(1998-99)
1996-97
No. of Quantity
Mines
Value
(Rs.'000)
3 4 5
556
7
0
16
0
3
0
22
2
0
52
0
3
0
1
0
2
2
9
l
3
0
1
5
3661
0
34805
10
1013
0
16
72
22804
120
0
0
1021
644
316
0
259
2334
0
I 1895
40
0
3169
4 237903
3 2152
7
5748613
J82
0
2717
2
66367
0
77
0
1516
7
0
71068
0
1223
193
47
0
52
256
0
1771
3342
2378
0
2170
7890
32369
244
32613
1997-98
No. of Quantity
Mines.
Value
(Rs.'000)
6 7 8
526
6
27
l
0
3
0
19
2
0
59
4
0
1
0
2
7
1
3
0
5
3691
3508
42
1561
0
11
150
40490
0
16
363
280
24
0
330
1061
10
0
3105
5 285605
3 579
8
7747773
388
3109
9
146422
0
49
0
3488
0
153466
334
112
6
0
54
506
298
834
0
186
1318
42882
68
42950
1998-99
No. of Quantity
Mines
Value
(Rs.'000)
9 10 11
501
9
24
l
l
3
0
19
4
0
62
3
0
2
0
7
2
2746
41580
2
1619
319
7
27
33493
0
58
373
394
0
322
360
660
5650
23310
5 252732
2 136
7
9697983
343
3849
146391
199
67
0
3076
0
15
153941
391
177
0
81
54
66
769
2410
1399
3809
39273
14
39287
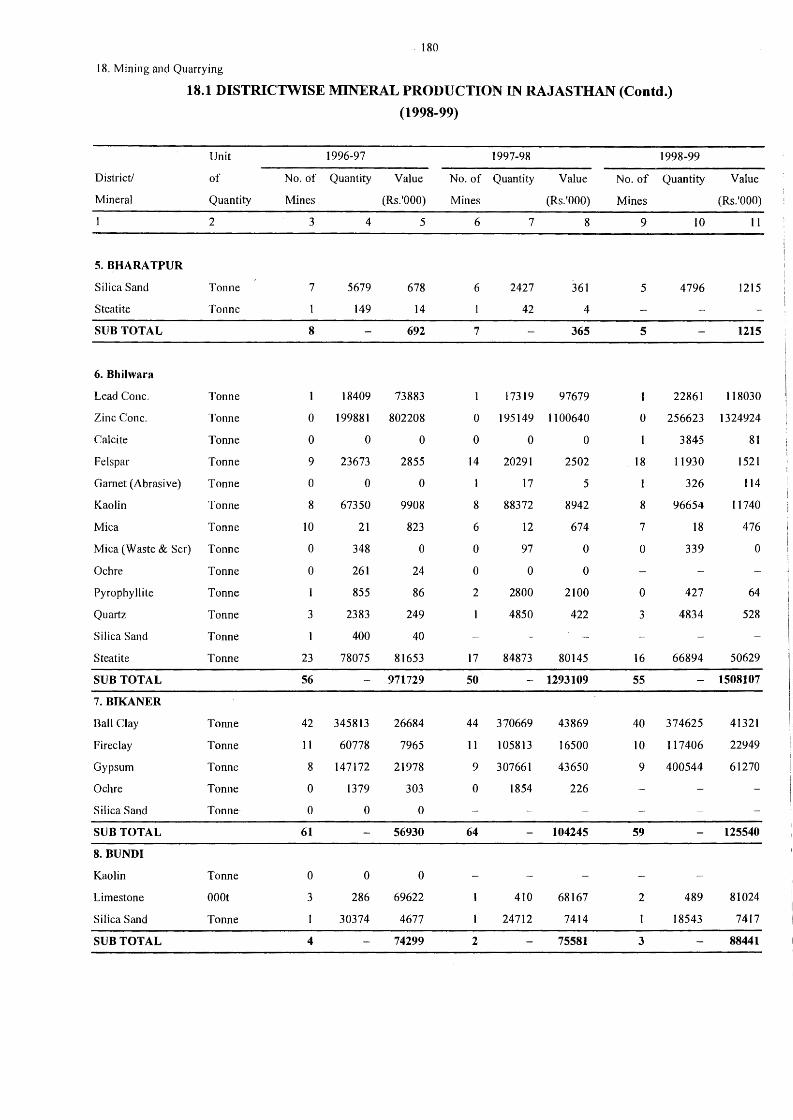
. 180
18. Mining and Quarrying
District/
Mineral
5. BHARA TPUR
Silica Sand
Steatite
SUBTOTAL
6. Bhilwara
Lead Cone.
18.1 DISTRICTWISE MINERAL PRODUCTION IN RAJASTHAN (Contd.)
(1998-99)
Unit
of
Quantity
2
Tonne
Tonne
1996-97
No. of Quantity
Mines
3
7
8
4
5679
149
18409
Value
(Rs.'000)
5
678
14
692
73883
1997-98
No. of Quantity
Mines
6
6
7
7
2427
42
17319
Value
(Rs.'000)
8
361
4
365
97679
1998-99
No. of Quantity
Mines
9 IO
5 4796
5
22861
Value
(Rs.'000)
11
1215
1215
118030
Zinc Cone.
Tonne
Tonne 0 199881 802208 0 195149 1100640 0 256623 1324924
Calcite
Felspar
Garnet (Abrasive)
Tonne
Tonne
Tonne
Kaolin Tonne
Mica Tonne
Mica (Waste & Ser) Tonne
Ochre
Pyrophy llite
Quartz
Silica Sand
Steatite
SUBTOTAL
7. BIKANER
Ball Clay
Fireclay
Gypsum
Ochre
Silica Sand
SUBTOTAL
8. BUNDI
Kaolin
Limestone
Silica Sand
SUBTOTAL
Tonne
Tonne
Tonne
Tonne
Tonne
Tonne
Tonne
Tonne
Tonne
Tonne
Tonne
OOOt
Tonne
0
9
0
8
10
0
0
3
23
56
0
23673
0
67350
21
348
261
855
2383
400
78075
42 345813
11 60778
8 147172
0
0
61
0
3
4
1379
0
0
286
30374
0
2855
0
9908
823
0
24
86
249
40
81653
971729
26684
7965
21978
303
0
56930
0
69622
4677
74299
0
14
8
6
0
0
2
17
0
20291
17
88372
12
97
0
2800
4850
84873
0
2502
5
8942
674
0
0
2100
422
80145
50 - 1293109
44 370669
11 105813
9 307661
0
64
2
1854
410
24712
43869
16500
43650
226
68167
7414
75581
18
8
7
0
0
3
16
55
3845
11930
326
96654
18
339
427
4834
66894
40 374625
IO 117406
9 400544
59
2
3
489
18543
81
1521
114
11740
476
0
64
528
50629
1508107
41321
22949
61270
125540
81024
7417
88441
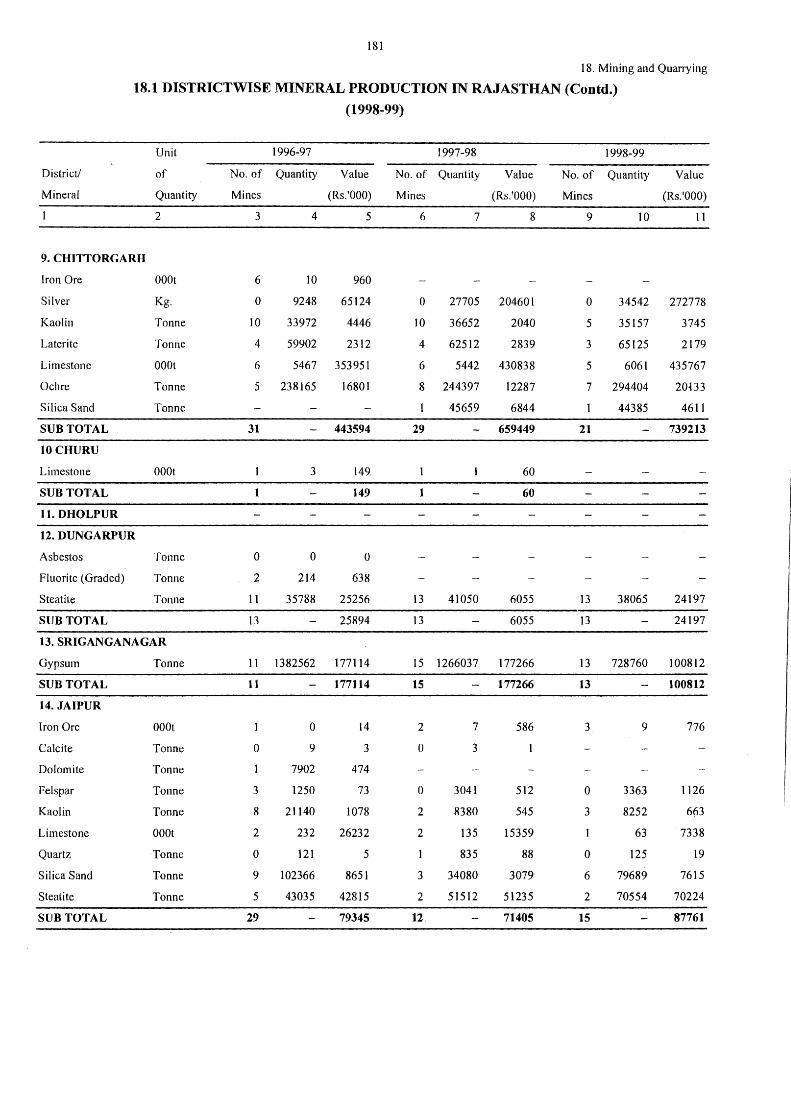
181
18. Mining and Quarrying
18.1 DISTRICTWISE MINERAL PRODUCTION IN RAJASTHAN (Contd.)
District/
Mineral
9. CHITTORGARH
Iron Ore
Silver
Kaolin
Laterite
Limestone
Ochre
Silica Sand
SUBTOTAL
lOCHURU
Limestone
SUBTOTAL
11. DHOLPUR
12. DUNGARPUR
Asbestos
Fluorite (Graded)
Steatite
SUBTOTAL
Unit
of
Quantity
2
OOOt
Kg.
Tonne
Tonne
OOOt
Tonne
Tonne
OOOt
Tonne
Tonne
Tonne
13. SRIGANGANAGAR
Gypsum
SUBTOTAL
14. JAIPUR
Iron Ore
Calcite
Dolomite
Felspar
Kaolin
Limestone
Quartz
Silica Sand
Steatite
SUBTOTAL
Tonne
OOOt
Tonne
Tonne
Tonne
Tonne
OOOt
Tonne
Tonne
Tonne
(1998-99)
1996-97
No. of Quantity Value
Mines (Rs.'000)
3 4 5
6 10 960
0 9248 65124
10 33972 4446
4 59902 2312
6 5467 353951
5 238165 16801
31
0
2
11
13
3
0
214
35788
443594
149
149
0
638
25256
25894
11 1382562 177114
11
0
3
8
2
0
0
9
7902
1250
21140
232
121
9 102366
5 43035
29
177114
14
3
474
73
1078
26232
5
8651
42815
79345
1997-98
No. of Quantity
Mines
6 7
Value
(Rs.'000)
8
0 27705 204601
IO 36652 2040
4 62512 2839
6 5442 430838
8 244397 12287
45659 6844
29 659449
60
60
13 41050 6055
13 6055
15 1266037 177266
15
2
0
0
2
2
3
2
12
7
3
3041
8380
135
835
34080
51512
177266
586
512
545
15359
88
3079
51235
71405
1998-99
No. of Quantity
Mines
9 10
Value
(Rs.'000)
11
0 34542 272778
5 35157 3745
3 65125 2179
5 6061 435767
7 294404 20~33
44385 4611
21 739213
13 38065 24197
13 24197
13 728760 100812
13
3
0
3
0
6
2
15
9
3363
8252
63
125
79689
70554
100812
776
1126
663
7338
19
7615
70224
87761
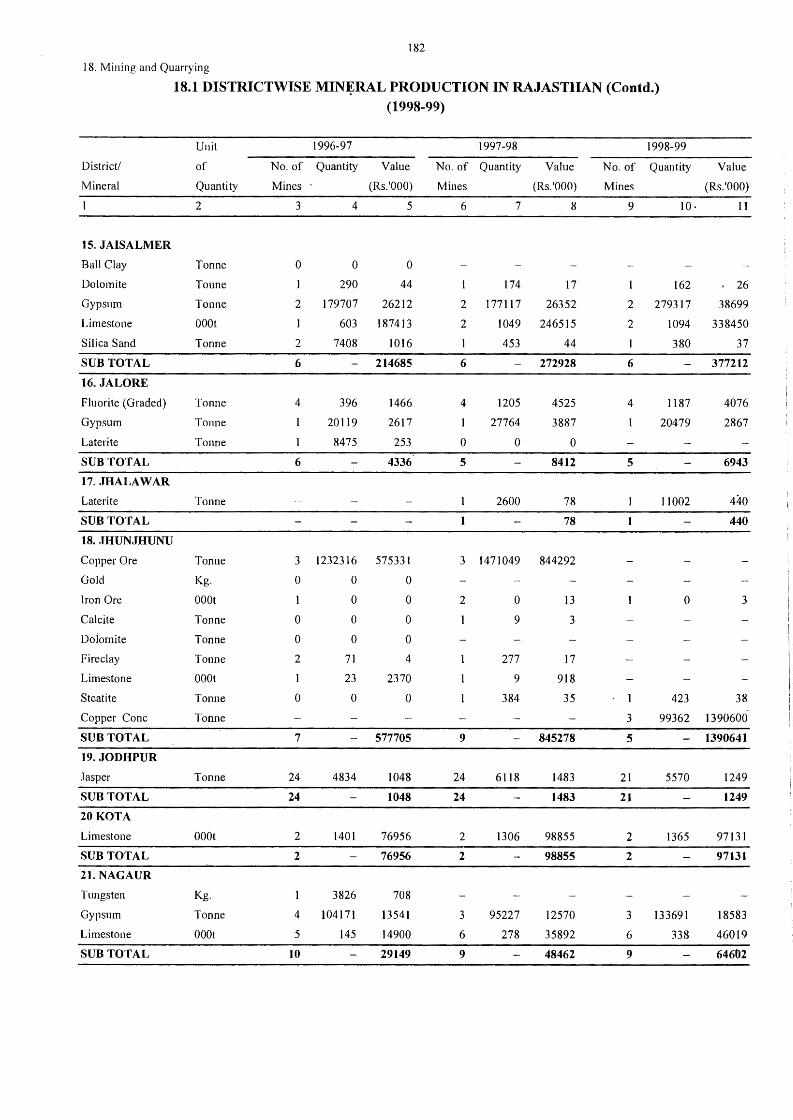
182
18. Mining and Quarrying
18.1 DISTRICTWISE MIN~RAL PRODUCTION IN RAJASTHAN (Contd.) (1998-99)
Unit 1996-97 1997-98 1998-99
District/ of No. of Quantity Value No. of Quantity Value No. of Quantity Value
Mineral Quantity Mines (Rs.'000) Mines (Rs.'000) Mines (Rs.'000)
2 3 4 5 6 7 8 9 IO· 11
15. JAISALMER
Ball Clay Tonne 0 0 0
Dolomite Tonne 1 290 44 174 17 162 26
Gypsum Tonne 2 179707 26212 2 177117 26352 2 279317 38699
Limestone OOOt 1 603 187413 2 1049 246515 2 1094 338450
Silica Sand Tonne 2 7408 1016 453 44 1 380 37
SUBTOTAL 6 214685 6 272928 6 377212
16. JALORE
Fluorite (Graded) Tonne 4 396 1466 4 1205 4525 4 1187 4076
Gypsum Tonne 20119 2617 27764 3887 20479 2867
Laterite Tonne 1 8475 253 0 0 0
SUBTOTAL 6 4336 5 8412 5 6943
17. JHALAWAR
Laterite Tonne 1 2600 78 11002 440
SUBTOTAL 1 78 440
18. JHUNJHUNU
Copper Ore Tonne 3 1232316 575331 3 1471049 844292
Gold Kg. 0 0 0
Iron Ore OOOt 0 0 2 0 13 0 3
Calcite Tonne 0 0 0 9 3
Dolomite Tonne 0 0 0
Fireclay Tonne 2 71 4 277 17
Limestone OOOt 1 23 2370 9 918
Steatite Tonne 0 0 0 384 35 423 38
Copper Cone Tonne 3 99362 1390600
SUBTOTAL 7 577705 9 845278 5 - 1390641
19.JODHPUR
Jasper Tonne 24 4834 104"8 24 6118 1483 21 5570 1249
SUBTOTAL 24 1048 24 1483 21 1249
20KOTA
Limestone OOOt 2 1401 76956 2 1306 98855 2 1365 97131
SUBTOTAL 2 76956 2 98855 2 97131
21. NAGAUR
Tungsten Kg. 3826 708
Gypsum Tonne 4 104171 13541 3 95227 12570 3 133691 18583
Limestone OOOt 5 145 14900 6 278 35892 6 338 46019
SUBTOTAL 10 29149 9 48462 9 64602
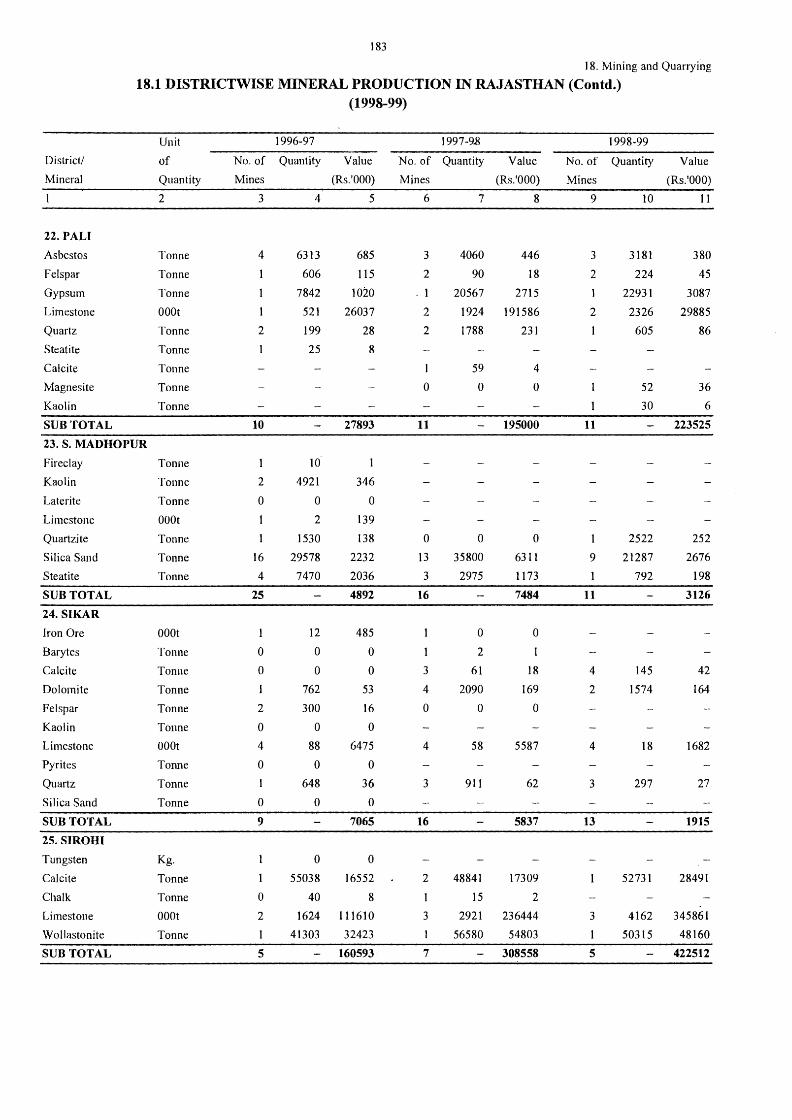
183
18. Mining and Quarrying
18.1 DISTRICTWISE MINERAL PRODUCTION IN RAJASTHAN (Contd.)
District/
Mineral
22. PALI
Asbestos
Felspar
Gypsum
Limestone
Quartz
Steatite
Calcite
Magnesite
Kaolin
SUBTOTAL
23. S. MADHOPUR
Fireclay
Kaolin
Laterite
Limestone
Quartzite
Silica Sand
Steatite
SUBTOTAL
24. Sil(AR
Iron Ore
Barytes
Calcite
Dolomite
Fe I spar
Kaolin
Limestone
Pyrites
Quartz
Silica Sand
SUBTOTAL
25. SIROHI
Tungsten
Calcite
Chalk
Limestone
Wollastonite
SUBTOTAL
Unit
of
Quantity
2
Tonne
Tonne
Tonne
OOOt
Tonne
Tonne
Tonne
Tonne
Tonne
Tonne
Tonne
Tonne
OOOt
Tonne
Tonne
Tonne
OOOt
Tonne
Tonne
Tonne
Tonne
Tonne
OOOt
Tonne
Tonne
Tonne
Kg.
Tonne
Tonne
OOOt
Tonne
(1998-99)
1996-97
No. of Quantity
Mines
Value
(Rs.'000)
3
4
1
2
10
2
0
1
16
4
25
0
0
I
2
0
4
0
1
0
9
0
2
5
4 5
6313
606
7842
521
199
25
10·
4921
0
2
1530
29578
7470
12
0
0
762
300
0
88
0
648
0
0
685
115
1020
26037
28
8
27893
I
346
0
139
138
2232
2036
4892
485
0
0
53
16
0
6475
0
36
0
7065
0
55038 16552
40 8
1624 111610
41303 32423
160593
1997-9..8
No. of Quantity
Mines
Value
(Rs.'000)
6
3
2
' 1
2
2
I
0
11
0
13
3
16
I
3
4
0
4
3
16
2
3
7
7 8
4060 446
90 18
20567 2715
1924 191586
1788 231
59
0
0
35800
2975
0
2
61
2090
0
58
911
4
0
195000
0
6311
1173
7484
0
I
18
169
0
5587
62
5837
48841 17309
15 2
2921 236444
56580 54803
308558
1998-99
No. of Quantity
Mines
Value
(Rs.'000)
9
3
2
1
2
11
1
9
11
4
2
4
3
13
3
5
10 11
3181
224
22931
2326
605
52
30
2522
21287
792
145
1574
18
297
380
45
3087
29885
86
36
6
223525
252
2676
198
3126
42
164
1682
27
1915
52731 28491
4162 345861
50315 48160
422512
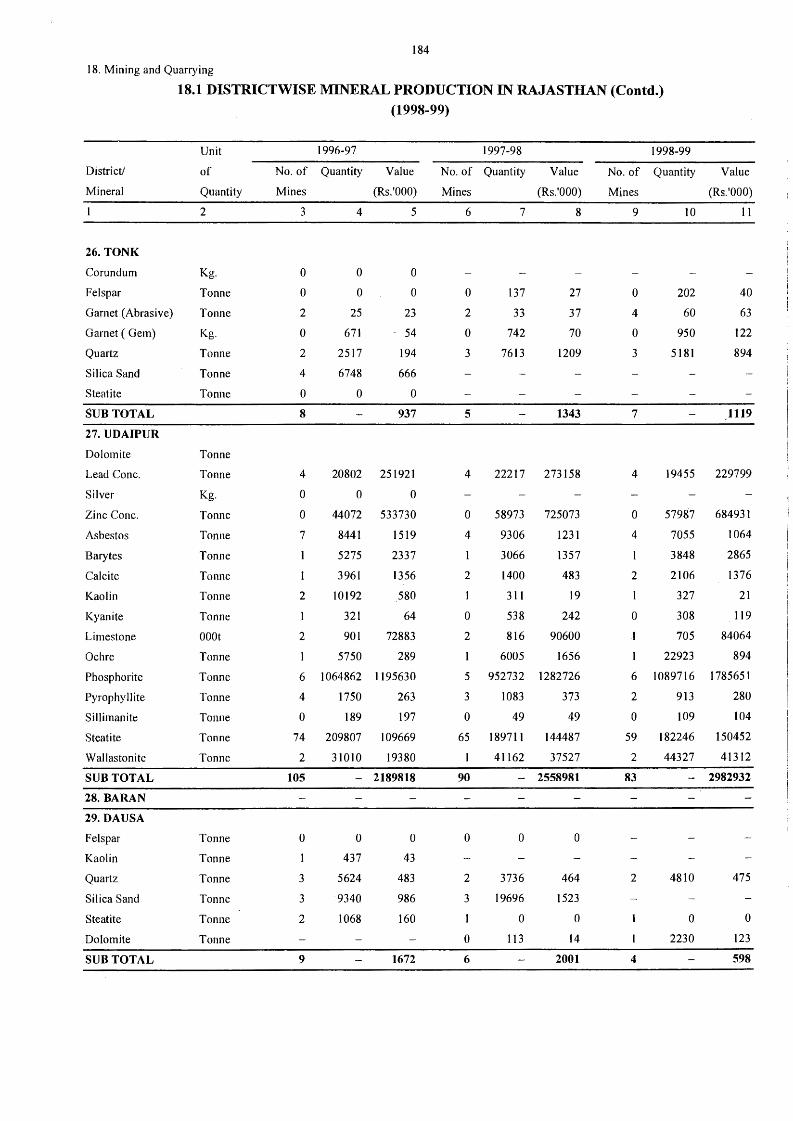
184
18. Mining and Quarrying
District/
Mineral
26. TONK
Corundum
Felspar
Garnet (Abrasive)
Garnet (Gem)
Quartz
Silica Sand
Steatite
SUBTOTAL
27. UDAIPUR
Dolomite
Lead Cone.
Silver
Zinc Cone.
Asbestos
Barytes
Calcite
Kaolin
Kyanite
Limestone
Ochre
Phosphorite
Pyrophy 11 ite
Sillimanite
Steatite
Wallastonite
SUBTOTAL
28. BARAN
29. DAUSA
Felspar
Kaolin
Quartz
Silica Sand
Steatite
Dolomite
SUBTOTAL
18.1 DISTRICTWISE MINERAL PRODUCTION IN RAJASTHAN (Contd.) (1998-99)
Unit
of
Quantity
2
Kg.
Tonne
Tonne
Kg.
Tonne
Tonne
Tonne
Tonne
Tonne
Kg.
Tonne
Tonne
Tonne
Tonne
Tonne
Tonne
OOOt
Tonne
Tonne
Tonne
Tonne
Tonne
Tonne
Tonne
Tonne
Tonne
Tonne
Tonne
Tonne
1996-97
No. of Quantity
Mines
Value
(Rs.'000)
3
0
0
2
0
2
4
0
8
4
0
4 5
0
0
25
671
2517
6748
0
0
0
23
- 54
194
666
0
937
20802 251921
0 0
0 44072 533730
7 8441 1519
5275 2337
1 3961 1356
2 10192 _580
321 64
2 901 72883
5750 289
6 1064862 1195630
4 1750 263
0 189 197
74 209807 109669
2 31010 19380
105
0
l
3
3
2
0
437
5624
9340
1068
2189818
0
43
483
986
160
1672
1997-98
No. of Quantity
Mines
Value
(Rs.'000)
6
0
2
0
3
5
4
7 8
137
33
742
7613
27
37
70
1209
1343
22217 273158
0 58973 725073
4 9306 1231
3066 1357
2 1400 483
l 311 19
0 538 242
2 816 90600
6005 1656
5 952732 1282726
3 1083 373
0 49 49
65 189711 144487
41162 37527
90
0
2
3
0
6
- 2558981
0
3736
19696
0
113
0
464
1523
0
14
2001
1998-99
No. of Quantity
Mines
Value
(Rs.'000)
9
0
4
0
3
7
4
10 11
202
60
950
5181
40
63
122
894
1119
19455 229799
0 57987 684931
4 7055 1064
3848 2865
2 2106 1376
327 21
0 308 119
I 705 84064
1 22923 894
6 1089716 1785651
2 913 280
0 109 104
59 182246 150452
2 44327 41312
83
2
4
- 2982932
4810
0
2230
475
0
123
598
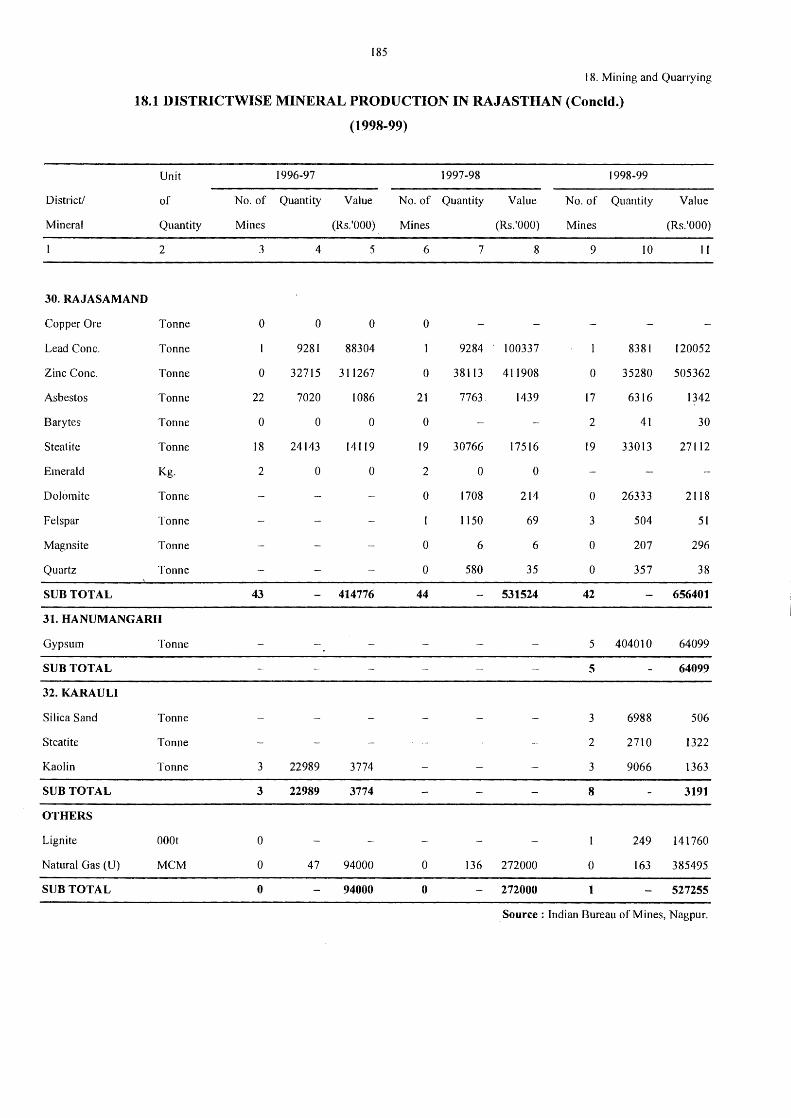
185
18. Mining and Quarrying
18.1 DISTRICTWISE MINERAL PRODUCTION IN RAJASTHAN (Concld.)
(1998-99)
Unit 1996-97 1997-98 1998-99
District/ of No. of Quantity Value No. of Quantity Value No. of Quantity Value
Mineral Quantity Mines (Rs.'000) Mines (Rs.'000) Mines (Rs.'000)
2 3 4 5 6 7 8 9 IO 11
30. RAJASAMAND
Copper Ore Tonne 0 0 0 0
Lead Cone. Tonne 9281 88304 9284 100337 8381 120052
Zinc Cone. Tonne 0 32715 311267 0 38113 411908 0 35280 505362
Asbestos Tonne 22 7020 1086 21 7763 1439 17 6316 1342
Barytes Tonne 0 0 0 0 2 41 30
Steatite Tonne 18 24143 14119 19 30766 17516 19 33013 27112
Emerald Kg. 2 0 0 2 0 0
Dolomite Tonne 0 1708 214 0 26333 2118
Felspar Tonne 1150 69 3 504 51
Magnsite Tonne 0 6 6 0 207 296
Quartz Tonne 0 580 35 0 357 38
SUBTOTAL 43 414776 44 531524 42 656401
31. HANUMANGARH
Gypsum Tonne 5 404010 64099
SUBTOTAL 5 64099
32. KARAULI
Silica Sand Tonne 3 6988 506
Steatite Tonne 2 2710 1322
Kaolin Tonne 3 22989 3774 3 9066 1363
SUBTOTAL 3 22989 3774 8 3191
OTHERS
Lignite OOOt 0 249 141760
Natural Gas ( U) MCM 0 47 94000 0 136 272000 0 163 385495
SUBTOTAL 0 94000 0 272000 t 527255
Source: Indian Bureau of Mines, Nagpur.
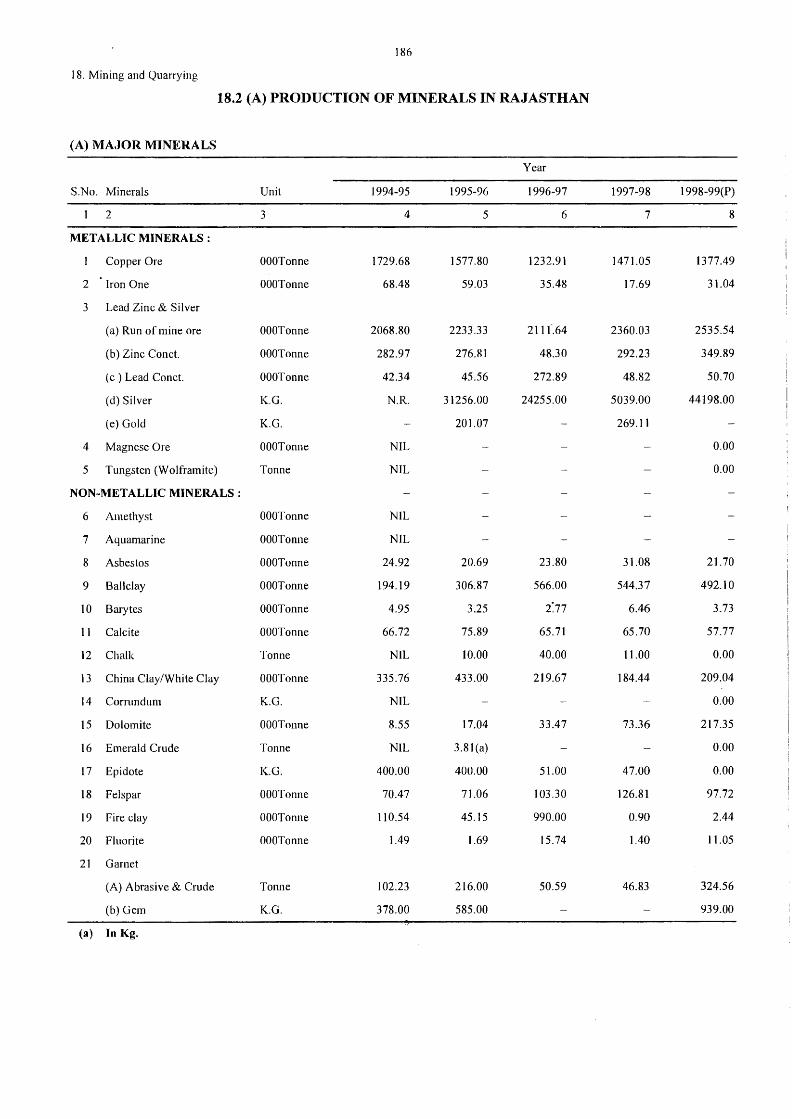
186
18. Mining and Quarrying
18.2 (A) PRODUCTION OF MINERALS IN RAJASTHAN
(A) MAJOR MINERALS
Year
S.No. Minerals Unit 1994-95 1995-96 1996-97 1997-98 1998-99(P)
2 3 4 5 6 7 8
METALLIC MINERALS:
Copper Ore OOOTonne 1729.68 1577.80 1232.91 1471.05 1377.49
2 Iron One OOOTonne 68.48 59.03 35.48 17.69 31.04
3 Lead Zinc & Silver
(a) Run of mine ore OOOTonne 2068.80 2233.33 2llf.64 2360.03 2535.54
(b) Zinc Conct. OOOTonne 282.97 276.81 48.30 292.23 349.89
( c ) Lead Con ct. OOOTonne 42.34 45.56 272.89 48.82 50.70
(d) Silver K.G. N.R. 31256.00 24255.00 5039.00 44198.00
(e) Gold K.G. 201.07 269.11
4 Magnese Ore OOOTonne NIL 0.00
5 Tungsten (Wolframite) Tonne NIL 0.00
NON-METALLIC MINERALS :
6 Amethyst OOOTonne NIL
7 Aquamarine OOOTonne NIL
8 Asbestos OOOTonne 24.92 20.69 23.80 31.08 21.70
9 Ball clay OOOTonne 194.19 306.87 566.00 544.37 492.10
10 Barytes OOOTonne 4.95 3.25 2:11 6.46 3.73
11 Calcite OOOTonne 66.72 75.89 65.71 65.70 57.77
12 Chalk Tonne NIL 10.00 40.00 11.00 0.00
13 China Clay/White Clay OOOTonne 335.76 433.00 219.67 184.44 209.04
14 Corrundum K.G. NIL 0.00
15 Dolomite OOOTonne 8.55 17.04 33.47 73.36 217.35
16 Emerald Crude Tonne NIL 3.8l(a) 0.00
17 Epidote K.G. 400.00 400.00 51.00 47.00 0.00
18 Felspar OOOTonne 70.47 71.06 103.30 126.81 97.72
19 Fire clay OOOTonne 110.54 45.15 990.00 0.90 2.44
20 Fluorite OOOTonne l.49 1.69 15.74 1.40 11.05
21 Garnet
(A) Abrasive & Crude Tonne 102.23 216.00 50.59 46.83 324.56
(b) Gem K.G. 378.00 585.00 939.00
(a) In Kg.
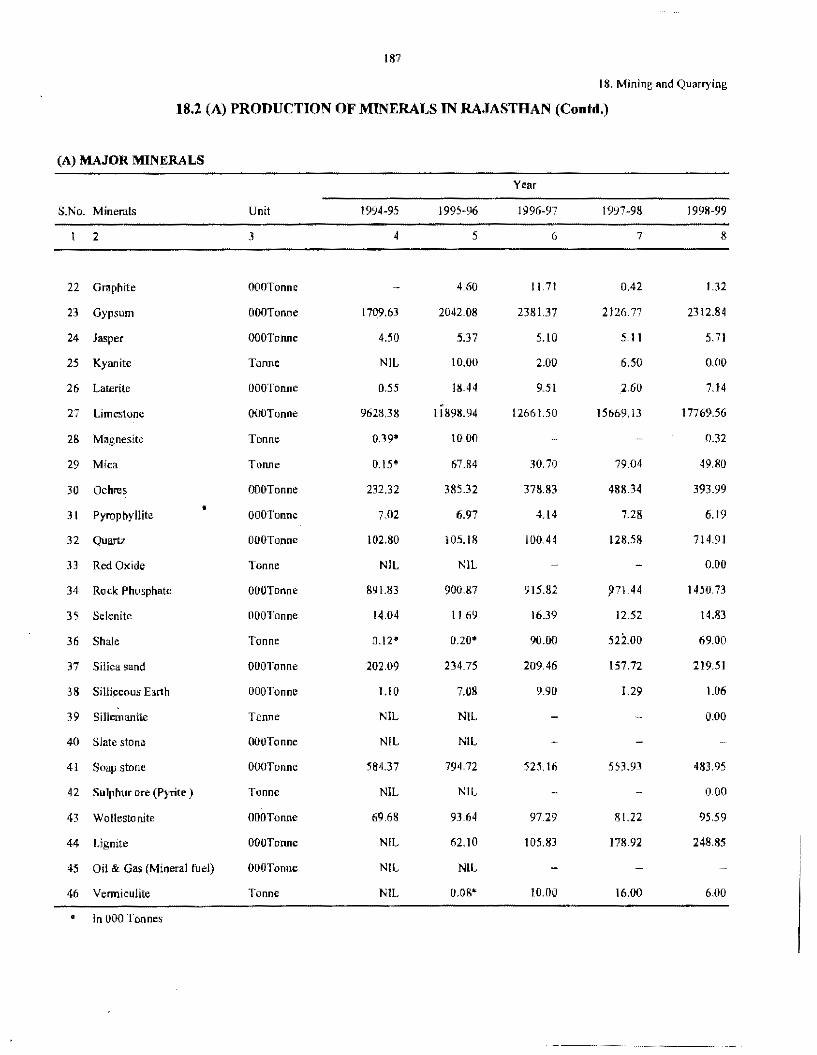
187
18. Mining and Quarrying
18.2 (A) PRODUCTION OF MINERALS IN RAJASTHAN (Contd.)
(A) MAJOR MINERALS
Year
S.l'o. Minerals Unit 1994-95 1995-96 1996-97 1997-98 1998-99
2 3 4 5 6 7 8
22 Graphite OOOTonne 4.60 11.71 0.42 1.32
23 Gypsum OOOTonne 1709.63 2042.08 2381.37 2126. 77 2312.84
24 Jasper OOOTonne 4.50 5.37 5.IO 5.11 5.71
25 Kyanite Tonne NJL I0.00 2.00 6.50 0.00
26 Laterfte OOOTonne 0.55 18.44 9.51 2.60 7.14
27 Limestone OOOTonne 9628.38 11898.94 1266 l.50 15669.13 17769.56
28 Magnesite Tonne 0.39* I0.00 0.32
29 Mica Tonne 0.15* 67.84 30.70 79.04 49.80
30 Ochres OOOTonne 232.32 385.32 378.83 488.34 393.99
• 31 Pyrophyllite OOOTonne 7.02 6m 4.14 7.28 6.19
32 Quartz OOOTonne 102.80 105.18 100.44 128.58 714.91
33 Red Oxide Tonne NlL NIL 0.00
34 Rock Phosphate OOOTonne 891.83 900.87 915.82 ?71.44 1450.73
35 Selenite OOOTonne 14.04 11.69 16.39 12.52 14.83
36 Shale Tonne 0.12• 0.20• 90.00 sfroo 69.00
37 Silica sand OOOTonne 202.09 234.75 209.46 157.72 219.51
38 Silli~eous Earth OOOTonnc 1.10 7.08 9.90 1.29 1.06
39 SiHen1anite Tonne NIL Nil 0.00
40 Slate stone OOOTonne NIL NIL
41 Soap stone OOOTonne 584.37 794.72 525.16 553.93 483.95
42 Sulphur ore (Pyrite) Tonne NIL NIL 0.00
43 Wollestonite OOOTonne 69.68 93.64 97.29 81.22 95.59
44 Lignite OOOTonne NIL 62.10 105.83 178.92 248.85
45 Oil & Gas (Mineral fuel) OOOTonne NIL. NIL
46 Vermiculite Tonne NlL 0.08• 10.00 16.00 6.00
• in 000 Tonnes
---.. ·--~- ..
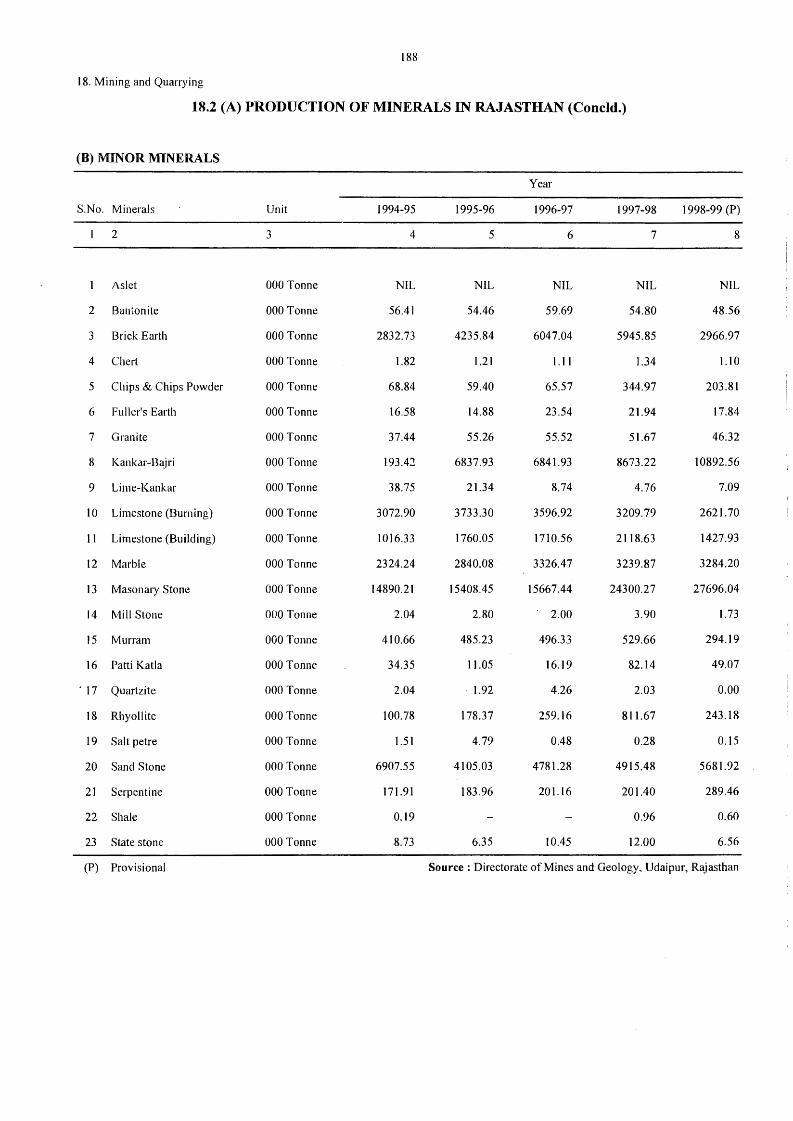
188
18. Mining and Quarrying
18.2 (A) PRODUCTION OF MINERALS IN RAJASTHAN (Concld.)
(B) MINOR MINERALS
Year
S.No. Minerals Unit 1994-95 1995-96 1996-97 1997-98 1998-99 (P)
2 3 4 5 6 7 8
As let 000 Tonne NIL NIL NIL NIL NIL
2 Bantonite 000 Tonne 56.41 54.46 59.69 54.80 48.56
3 Brick Earth 000 Tonne 2832.73 4235.84 6047.04 5945.85 2966.97
4 Chert 000 Tonne 1.82 1.21 l.11 1.34 l.10
5 Chips & Chips Powder 000 Tonne 68.84 59.40 65.57 344.97 203.81
6 Fuller's Earth 000 Tonne 16.58 14.88 23.54 21.94 17.84
7 Granite 000 Tonne 37.44 55.26 55.52 51.67 46.32
8 Kankar-Bajri 000 Tonne 193.4:! 6837.93 6841.93 8673.22 10892.56
9 Lime-Kankar 000 Tonne 38.75 21.34 8.74 4.76 7.09
10 Limestone (Burning) 000 Tonne 3072.90 3733.30 3596.92 3209.79 2621.70
11 Limestone (Building) 000 Tonne 1016.33 1760.05 1710.56 2118.63 1427.93
12 Marble 000 Tonne 2324.24 2840.08 3326.47 3239.87 3284.20
13 Masonary Stone 000 Tonne 14890.21 15408.45 15667.44 24300.27 27696.04
14 Mill Stone 000 Tonne 2.04 2.80 2.00 3.90 1.73
15 Murram 000 Tonne 410.66 485.23 496.33 529.66 294.19
16 Patti Katia 000 Tonne 34.35 11.05 16.19 82.14 49.07
. 17 Quartzite 000 Tonne 2.04 . 1.92 4.26 2.03 0.00
18 Rhyollite 000 Tonne 100.78 178.37 259.16 811.67 243.18
19 Saltpetre 000 Tonne 1.51 4.79 0.48 0.28 0.15
20 Sand Stone 000 Tonne 6907.55 4105.03 4781.28 4915.48 5681.92
21 Serpentine 000 Tonne 171.91 183.96 20Ll6 201.40 289.46
22 Shale 000 Tonne 0.19 0.96 0.60
23 State stone 000 Tonne 8.73 6.35 10.45 12.00 6.56
(P) Provisional Source: Directorate of Mines and Geology, Udaipur, Rajasthan
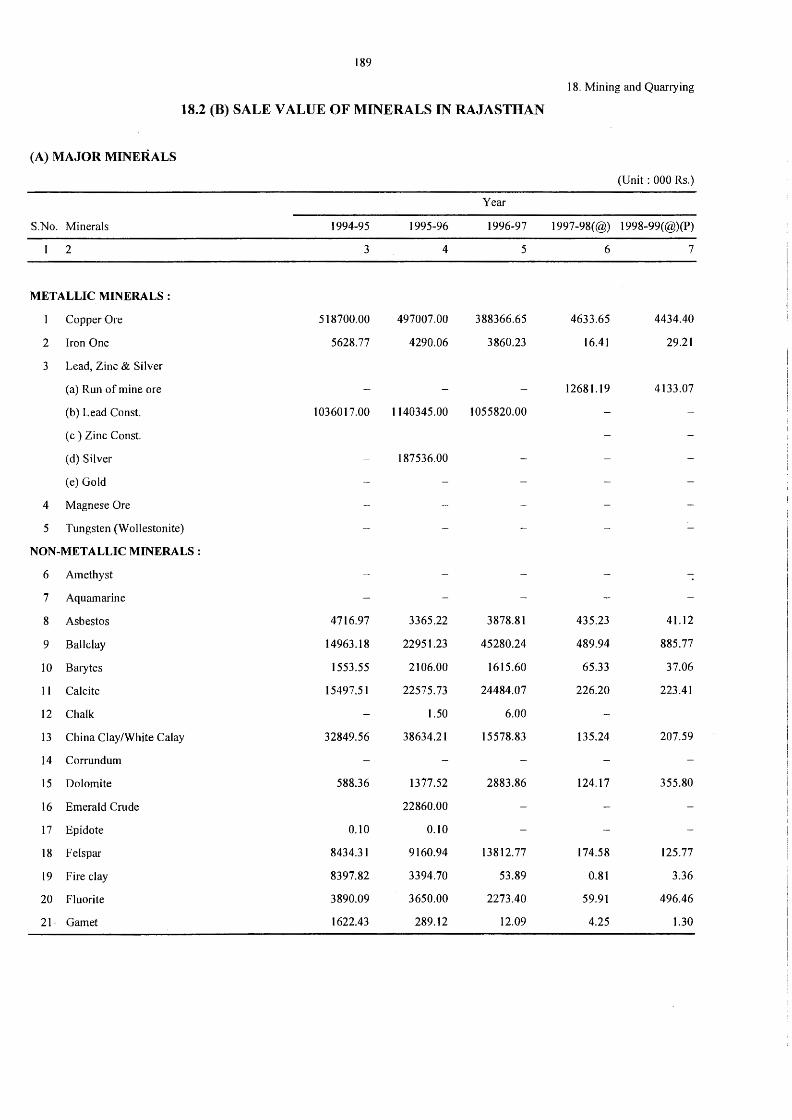
189
18. Mining and Quarrying
18.2 (B) SALE VALUE OF MINERALS IN RAJASTHAN
(A) MAJOR MINERALS
(Unit: 000 Rs.)
Year
S.No. Minerals 1994-95 1995-96 1996-97 1997-98(@) 1998-99(@)(P)
2 3 4 5 6 7
METALLIC MINERALS :
Copper Ore 518700.00 497007.00 388366.65 4633.65 4434.40
2 Iron One 5628.77 4290.06 3860.23 16.41 29.21
3 Lead, Zinc & Silver
(a) Run of mine ore 12681.19 4133.07
(b) Lead Const 1036017.00 1140345.00 1055820.00
( c ) Zinc Const.
(d) Silver 187536.00
(e) Gold
4 Magnese Ore
5 Tungsten (Wollestonite)
NON-METALLIC MINERALS :
6 Amethyst
7 Aquamarine
8 Asbestos 4716.97 3365.22 3878.81 435.23 41.12
9 Ball clay 14963.18 22951.23 45280.24 489.94 885.77
IO Barytes 1553.55 2106.00 16 I 5.60 65.33 37.06
I I Calcite 15497.51 22575.73 24484.07 226.20 223.41
12 Chalk 1.50 6.00
13 China Clay/White Calay 32849.56 38634.21 15578.83 135.24 207.59
14 Corrundum
15 Dolomite 588.36 1377.52 2883.86 124.17 355.80
16 Emerald Crude 22860.00
17 Epidote 0.10 0.10
18 Felspar 8434.31 9160.94 13812.77 174.58 125.77
19 Fire clay 8397.82 3394.70 53.89 0.81 3.36
20 Fluorite 3890.09 3650.00 2273.40 59.91 496.46
21 · Gamet 1622.43 289.12 12.09 4.25 1.30
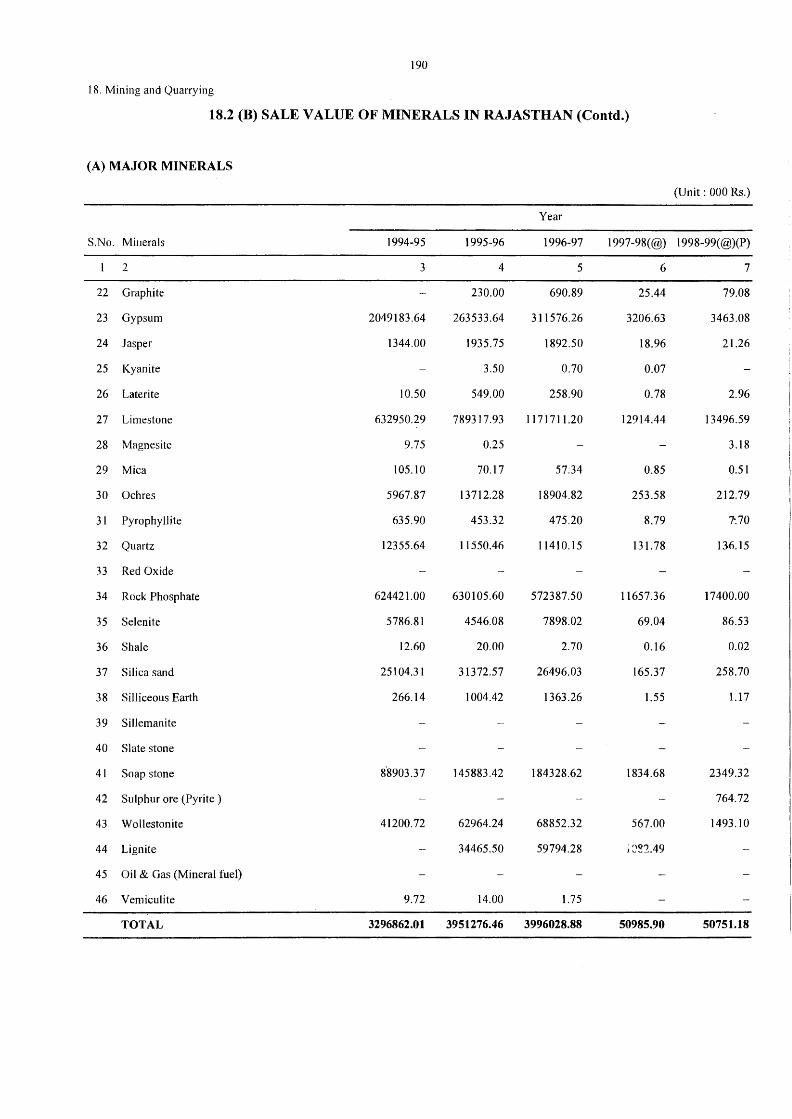
190
18. Mining and Quarrying
18.2 (B) SALE VALUE OF MINERALS IN RAJASTHAN (Contd.)
(A) MAJOR MINERALS
(Unit: 000 Rs.)
Year
S.No. Minerals 1994-95 1995-96 1996-97 1997-98(@) l 998-99(@)(P)
2 3 4 5 6 7
22 Graphite 230.00 690.89 25.44 79.08
23 Gypsum 2049183.64 263533.64 311576.26 3206.63 3463.08
24 Jasper 1344.00 1935.75 1892.50 18.96 21.26
25 Kyanite 3.50 0.70 O.Q7
26 Late rite 10.50 549.00 258.90 0.78 2.96
27 Limestone 632950.29 7893 I 7.93 1171711.20 12914.44 13496.59
28 Magnesite 9.75 0.25 3.18
29 Mica 105.IO 70.17 57.34 0.85 0.51
30 Ochres 5967.87 13712.28 18904.82 253.58 212.79
31 Pyrophyllite 635.90 453.32 475.20 8.79 7'.70
32 Quartz 12355.64 11550.46 11410.15 131. 78 B6.15
33 Red Oxide
34 Rock Phosphate 624421.00 630105.60 572387.50 11657.36 17400.00
35 Selenite 5786.81 4546.08 7898.02 69.04 86.53
36 Shale 12.60 20.00 2.70 0.16 0.02
37 Silica sand 25104.31 31372.57 26496.03 165.37 258.70
38 Silliceous Earth 266.14 1004.42 1363.26 1.55 1.17
39 Sillemanite
40 Slate stone
41 Soap stone 8'8903.37 145883.42 184328.62 1834.68 2349.32
42 Sulphur ore (Pyrite ) 764.72
43 Wollestonite 41200.72 62964.24 68852.32 567.00 1493.10
44 Lignite 34465.50 59794.28 ;'.:'~2.49
45 Oil & Gas (Mineral fuel)
46 Vemiculite 9.72 14.00 1.75
TOTAL 3296862.01 3951276.46 3996028.88 50985.90 50751.18
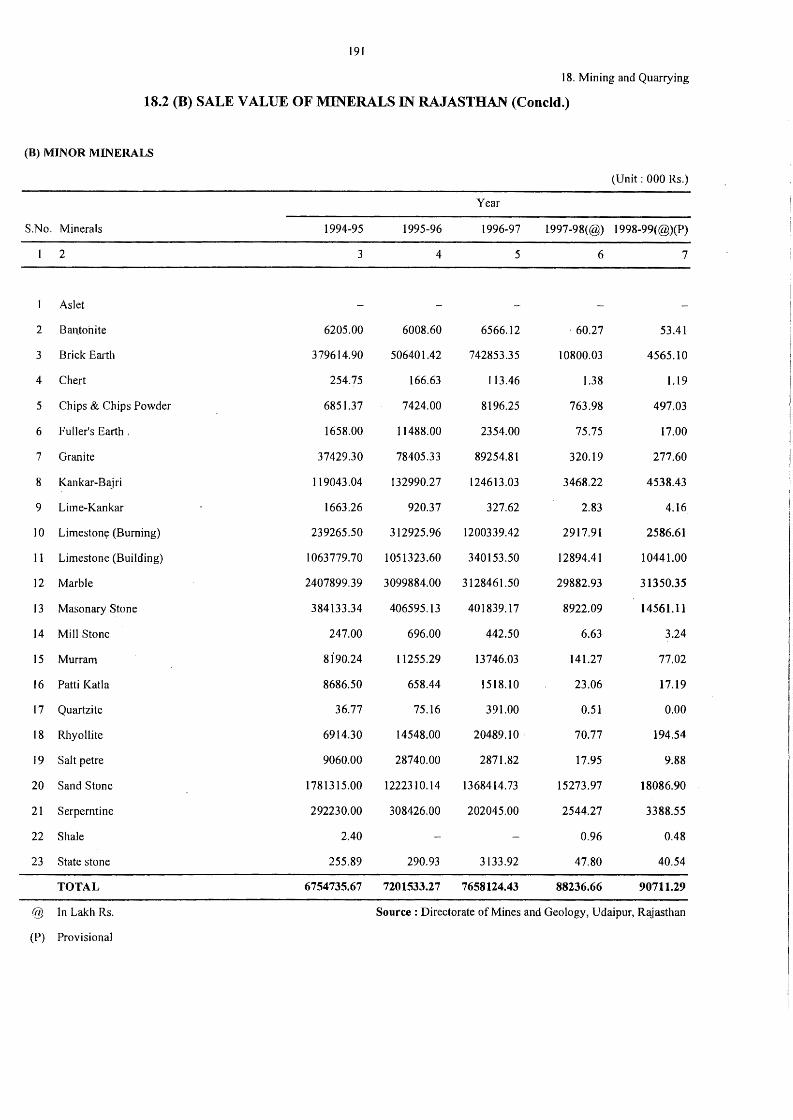
191
18. Mining and Quarrying
18.2 (B) SALE VALUE OF MINERALS IN RAJASTHAN (Concld.)
(B) MINOR MINERALS
(Unit: 000 Rs.)
Year
S.No. Minerals 1994-95 1995-96 1996-97 1997-98(@) l 998-99(@)(P)
2 3 4 5 6 7
As let
2 Ban.tohite 6205.00 6008.60 6566.12 . 60.27 53.41
3 Brick Earth 379614.90 506401.42 742853.35 10800.03 4565.10
4 Chert 254.75 166.63 113.46 1.38 l.19
5 Chips & Chips Powder 6851.37 7424.00 8196.25 763.98 497.03
6 Fuller's Earth . 1658.00 11488.00 2354.00 75.75 17.00
7 Granite 37429.30 78405.33 89254.81 320.19 277.60
8 Kankar-Bajri 119043.04 132990.27 124613.03 3468.22 4538.43
9 Lime-Kankar 1663.26 920.37 327.62 2.83 4.16
IO Limestony (Burning) 239265.50 312925.96 1200339.42 2917.91 2586.61
11 Limestone (Building) 1063779.70 1051323.60 340153.50 12894.41 10441.00
12 Marble 2407899.39 3099884.00 3128461.50 29882.93 31350.35
13 Masonary Stone 384133.34 406595.13 401839.17 8922.09 14561.11
14 Mill Stone 247.00 696.00 442.50 6.63 3.24
15 Murram 8i90.24 11255.29 13746.03 141.27 77.02
16 Patti Katia 8686.50 658.44 1518.10 23.06 17.19
17 Quartzite 36.77 75.16 391.00 0.51 0.00
18 Rhyollite 6914.30 14548.00 20489.10 70.77 194.54
19 Saltpetre 9060.00 28740.00 2871.82 17.95 9.88
20 Sand Stone 1781315.00 1222310.14 1368414.73 15273.97 18086.90
21 Serperntine 292230.00 308426.00 202045.00 2544.27 3388.55
22 Shale 2.40 0.96 0.48
23 State stone 255.89 290.93 3133.92 47.80 40.54
TOTAL 6754735.67 7201533.27 7658124.43 88236.66 90711.29
@ In Lakh Rs. Source: Directorate of Mines and Geology, Udaipur, Rajasthan
(P) Provisional
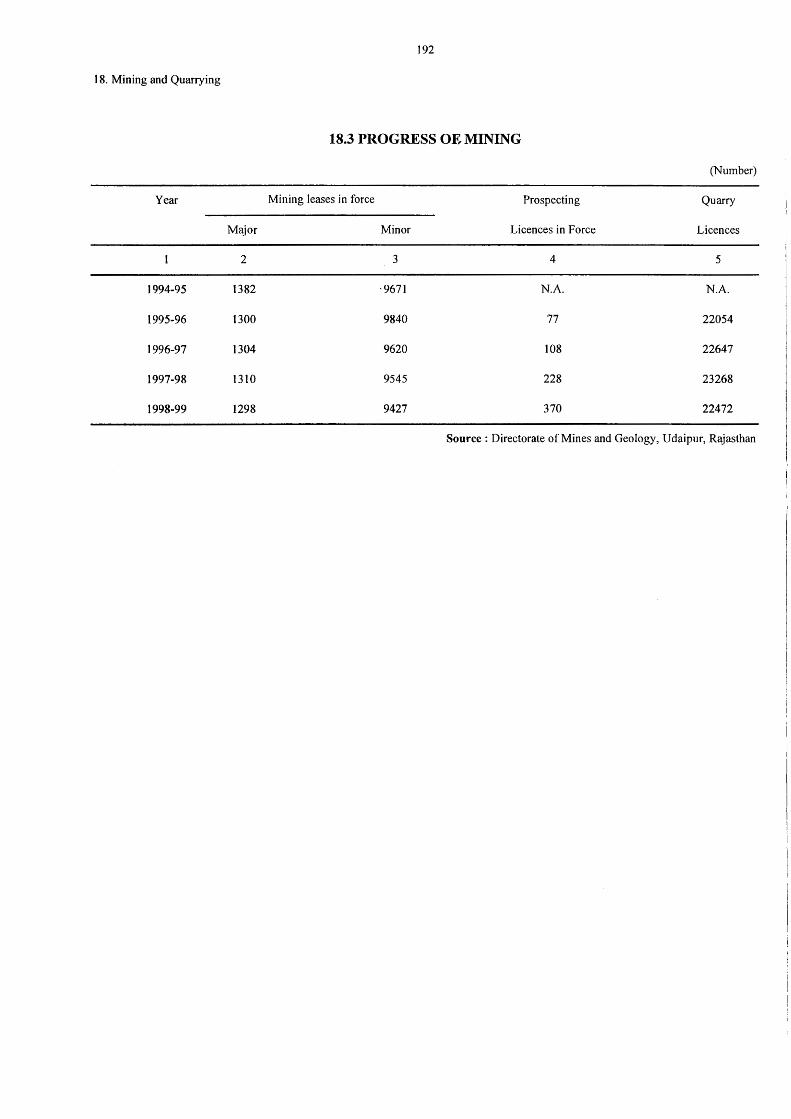
18. Mining and Quarrying
Year
1994-95
1995-96
1996-97
1997-98
1998-99
Major
2
1382
1300
1304
1310
1298
192
18.3 PROGRESS OE MINING
(Number)
Mining leases in force Prospecting Quarry
Minor Licences in Force Licences
3 4 5
·9671 N.A. N.A.
9840 77 22054
9620 108 22647
9545 228 23268
9427 370 22472
Source : Directorate of Mines and Geology, Udaipur, Rajasthan
(19) MANUFACTURING
ANNUAL SURVEY OF INDUSTRIES - Till the year 1960, the data with regard to
Industrial statistics was collected under the Census of Manufacturing Industries. Since 1961 it
has been started to be collected under the Annual Survey of Industries under Collection of
Statistics Act, 1953. The coverage of this survey extends to all the factories registered under
section 2(m) (i) and 2 (m) (ii) of the Indian Factories Act, 1948. Undersized factories have been
excluded. Undersized factory is that factory which did not employ at least 10 workers with the
aid of power, or at least 20 workers without the aid of power, throughout the reference year. The
data so collected relates to the accounting year of the factories ending on any day during Ist
April and 31st March of the reference year.· The following are the important definitions and
concepts used for this survey.
PRODUCTIVE CAPITAL - It includes both fixed and working capital. Fixed capital
comprises of land, building including those under construction, improvement of land, other
construction plant and machinery, tools (including un-installed), transport equipments, other
fixed assets such as furniture, fixture etc. and excludes intangible assets. Working capital
consists of stock of materials, store fuels, se!!1i-finished goods including working in progress,
finished product~ and by products, cash in hand and at the bank and the algebraic sum of sundry
creditors as represented· by (a) outstanding factory payments e.g. rent, wages, interest and
dividend (b) purch~ses of goods and services, (c) short term service loans and advances and
sundry debtors comprising amount due to the factory on account of sale of goods and services
and advances towards purchase and tax payment.
WORKER • As defined under section 2 (i) of the Indian Factories Act, 1948, a worker
means a person employed directly or through any agency, whether for wages or not in any
manufacturing process or in cleaning any part of the machinery directly or premises used for a
manufacturing process, or any other kind of work incidental to, or connected with
manufacturing process or the subject of the manufacturing process.
PERSON OTHER THAN WORKERS - This head includes person employed in
administrative and clerical jobs. within factory area and all those engaged in effecting delivery of
the output.
NUMBER OF PERSONS EMPLOYED - The average number of persons employed in each
factory has been computed by taking the total attendance of persons in all the shifts on all
working days and dividing it by the number of days worked. These averages are aggregate for
all factories in the State or industry as the case may be and the aggregate is taken as the number
of person, employed in the State or industry respectively. It includes attending and on leave with
pay such as sick leave or paid vacation and also those engaged in welfare activities.
WAGES - The term wages is used in the same sense as defined in section 2 (iv) of the
Payment of wages Act, 1956 and denotes all remuneration capable of being expressed in terms
of money which would, in the terms of contract of employment expressed or implied were
fulfilled by payable more or less regularly for each pay period whether conditional upon regular
attendance, good work, conduct or behaviour of the persons employed or otherwise, to a person
in respect of his employment or of work done in such employment and includes any bonus or
other additional remuneration of the nature aforesaid which would be so payable and any sum
payable to such person by reason for the termination.of his employment does not include -
(a) The value of any house, accomodation, supply of light, water, medical attendance other amenity
for any service specifically excluded by general or special order of the S~ate Government.
(b) any contribution paid by the employer to any pension fund or provident fund.
(c) any travelling allowance of the value of any travelling concession.
(d) any sum paid to person empl9yed to defray special expenses entailed on him by nature of his
employment.
( e) any gratuity payable on discharge.
OTHER BENEFIT - This includes various benefits over and above wages such as free or
subsidised housing, food grains at conce~sional rates etc.
PURCHASE VALUE OF FUELS AND RAW-MATERIALS CONSUMED - This is the
purchase value of fuels and raw-materials (inclusive of transport charges and other incidental
cost), actually consumed in the factory included and the purchase value of goods sold in the
same condition as purchase and value of productions reported for sale in the previous year but
consumed during the current year for further manufacture. The value of fuel or materials
manufactured within the factory and consumed for further processing has not been accounted:
OTHER EXPENSES - This head includes transportation charges directors, and managing
agents fees and interest paid etc.
DEPRICIATION - Depriciation on fixed assets is calculated at the rates allowed by the
income tax authorities for assessing taxable income.
EX-FACTORY SELLING VALUE OF PRODUCTS AND BY-PRODUCTS - This
represents the value of products and by- Products of the factory and is exclusive of transport
charges from the factory commission to selling agent etc. The term includes all products made
during the year for sale (whether actually sold during the year or not).
VALUE OF WORK DONE FOR OTHER - This means value of work done by the factory .
for others on payment when the materials are supplied by them.
OUTPUT - It is the aggregate of products and by-products manufactured for sale and of
work done for customers and adjusted for the difference in value of stocks of semi-finished
goods at the beginning and the end of the survey year.
VALUE ADDED BY MANUFACTURE - This represents that part of the value of product
which in created in the factory and is computed by deducting the value of input comprising cost
of materials, fuels; amount paid for work done by other concerns, other expenses which include
cost of transport, fee of directors and managing agents, interest charges etc; and depriciation of
fixed assets.
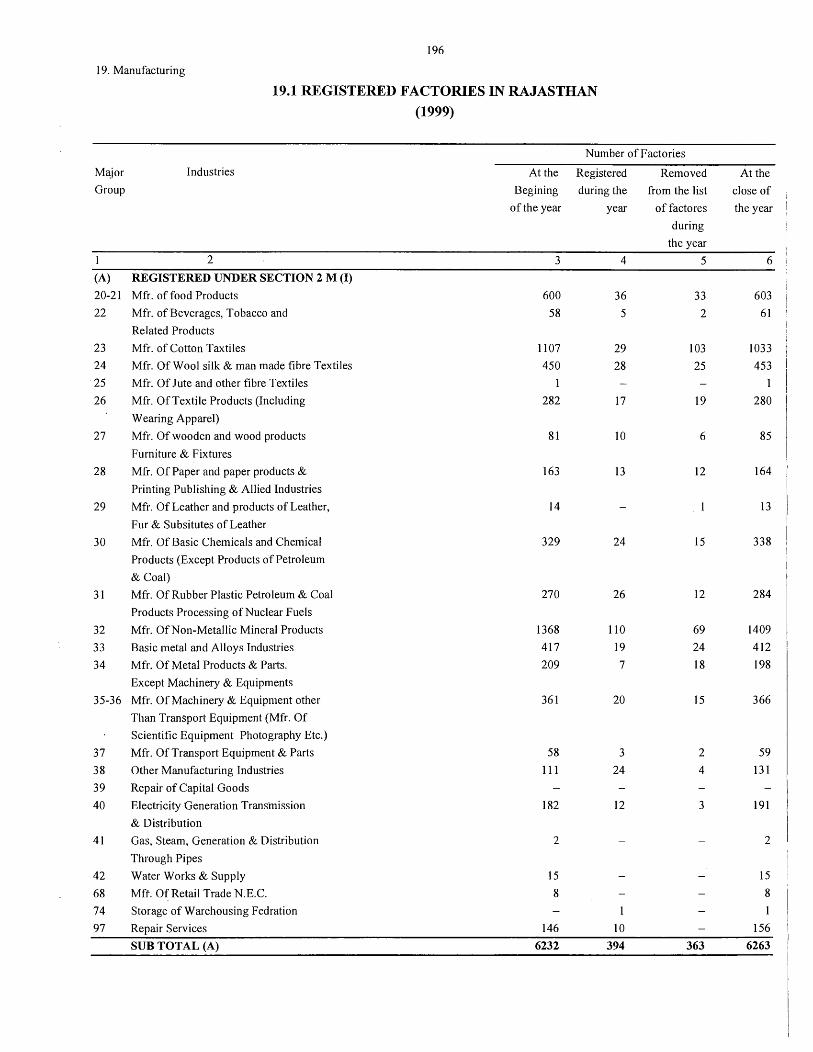
196
19. Manufacturing
19.1 REGISTERED FACTORIES IN RAJASTHAN
(1999)
Number of factories
Major Industries At the Registered Removed At the
Group Begining during the from the list close of
of the year year offactores the year
during
the year
l 2 3 4 5 6
(A) REGISTERED UNDER SECTION 2 M (I)
20-21 Mfr. of food Products 600 36 33 603
22 Mfr. ofBeverages, Tobacco and 58 5 2 61
Related Products
23 Mfr. of Cotton Tax tiles 1107 29 103 1033
24 Mfr. Of Wool silk & man made fibre Textiles 450 28 25 453
25 Mfr. Of Jute and other fibre Textiles 1
26 Mfr. Of Textile Products (Including 282 17 19 280
Wearing Apparel)
27 Mfr. Of wooden and wood products 81 10 6 85
Furniture & Fixtures
28 Mfr. Of Paper and paper products & 163 13 12 164
Printing Publishing & Allied Industries
29 Mfr. Of Leather and products of Leather, 14 13
Fur & Subsitutes of Leather
30 Mfr. Of Basic Chemicals and Chemical 329 24 15 338
Products (Except Products of Petroleum
& Coal)
31 Mfr. Of Rubber Plastic Petroleum & Coal 270 26 12 284
Products Processing of Nuclear Fuels
32 Mfr. Of Non-Metallic Mineral Products 1368 110 69 1409
33 Basic metal and Alloys Industries 417 19 24 412
34 Mfr. Of Metal Products & Parts. 209 7 18 198
Except Machinery & Equipments
35-36 Mfr. Of Machinery & Equipment other 361 20 15 366
Than Transport Equipment (Mfr. Of
Scientific Equipment Photography Etc.)
37 Mfr. Of Transport Equipment & Parts 58 3 2 59
38 Other Manufacturing Industries 111 24 4 131
39 Repair of Capital Goods
40 Electricity Generation Transmission 182 12 3 191
& Distribution
41 Gas, Steam, Generation & Distribution 2 2
Through Pipes
42 Water Works & Supply 15 15
68 Mft. Of Retail Trade N.E.C. 8 8
74 Storage of Warehousing Fedration
97 Repair Services 146 10 156
SUB TOTAL (A) 6232 394 363 6263
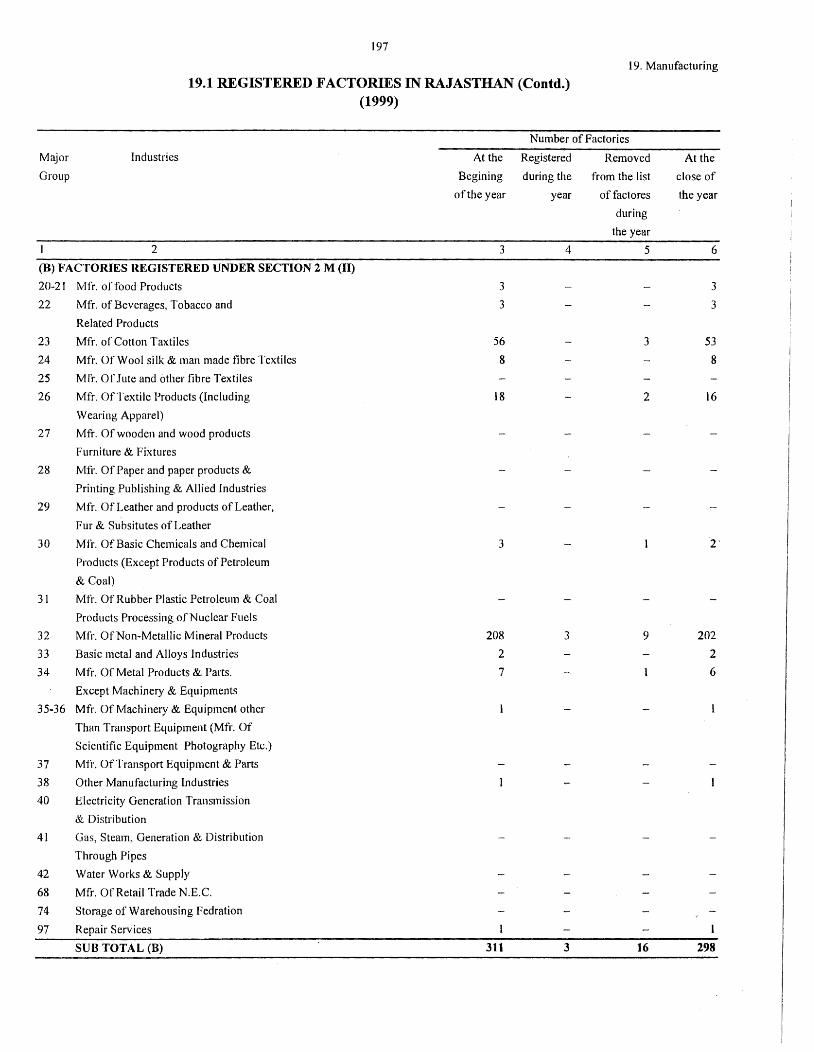
197
19. Manufacturing
19.1 REGISTERED FACTORIES IN RAJASTHAN (Contd.) (1999)
Number of Factories
Major Industries Atthe Registered Removed At the
Group Begining during the from the list close of
of the year year of factores the year
during
the year
2 3 4 5 6
(B) FACTORIES REGISTERED UNDER SECTION 2 M (II)
20-21 Mfr. of food Products 3 3
22 Mfr. of Beverages, Tobacco and 3 3
Related Products
23 Mfr. of Cotton Taxtiles 56 3 53
24 Mfr. Of Wool silk & man made fibre Textiles 8 8
25 Mfr. Of Jute and other fibre Textiles
26 Mfr. Of Textile Products (Including 18 2 16
Wearing Apparel)
27 Mfr. Of wooden and wood products
Furniture & Fixtures
28 Mfr. Of Paper and paper products &
Printing Publishing & Allied Industries
29 Mfr. Of Leather and products of Leather,
Fur & Subsitutes of Leather
30 Mfr. Of Basic Chemicals and Chemical 3 2·
Products (Except Products of Petroleum
& Coal)
31 Mfr. Of Rubber Plastic Petroleum & Coal
Products Processing of Nuclear Fuels
32 Mfr. Of Non~Metallic Mineral Products 208 3 9 202
33 Basic metal and Alloys Industries 2 2
34 Mfr. Of Metal Products & Parts. 7 6
Except Machinery & Equipments
35-36 Mfr. Of Machinery & Equipment other
Than Transport Equipment (Mfr. Of
Scientific Equipment Photography Etc.)
37 Mfr. Of Transport Equipment & Parts
38 Other Manufacturing Industries
40 Electricity Generation Transmission
& Distribution
41 Gas, Steam, Generation & Distribution
Through Pipes
42 Water Works & Supply
68 Mfr. Of Retail Trade N.E.C.
74 Storage of Warehousing F edration
97 Repair Services
SUB TOTAL (B) 311 3 16 298
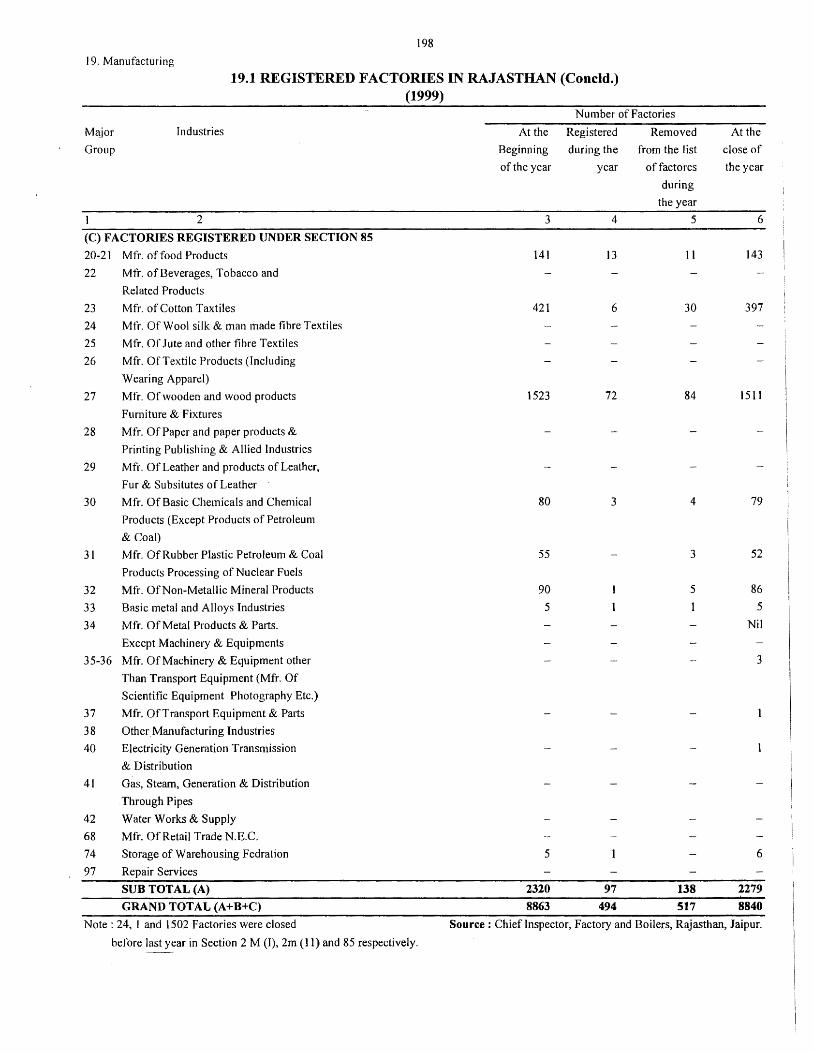
198
19. Manufacturing
19.1 REGISTERED FACTORIES IN RAJASTHAN (Concld.) (1999)
Number of Factories
M(\jor Industries At the Registered Removed At the
Group Beginning during the from the I ist close of
of the year year of factores the year
during
the year
1 2 3 4 5 6
(C) FACTORIES REGISTERED UNDER SECTION 85
20-21 Mfr. of food Products 141 13 11 143
'22 Mfr. of Beverages, Tobacco and
Related Products
23 Mfr. of Cotton Taxtiles 421 6 30 397
24 Mfr. Of Wool silk & man made fibre Textiles
25 Mfr. Of Jute and other fibre Textiles
26 Mfr. Of Textile Products (Including
Wearing Apparel)
27 Mfr. Of wooden and wood products 1523 72 84 1511
Furniture & Fixtures
28 Mfr. Of Paper and paper products &
Printing Publishing & Allied Industries
29 Mfr. Of Leather and products of Leather,
Fur & Su bsitutes of Leather
30 Mfr. Of Basic Chemicals and Chemical 80 3 4 79
Products (Except Products of Petroleum
& Coal)
31 Mfr. Of Rubber Plastic Petroleum & Coal 55 3 52
Products Processing of Nuclear Fuels
32 Mfr. Of Non-Metallic Mineral Products 90 5 86
33 Basic metal and Alloys Industries 5 5
34 Mfr. Of Metal Products & Parts. Nil
Except Machinery & Equipments
35-36 Mfr. Of Machinery & Equipment other 3
Than Transport Equipment (Mfr. Of
Scientific Equipment Photography Etc.)
37 Mfr. Of Transport Equipment & Parts
38 Other. Manufacturing Industries
40 Electricity Generation Transmission
& Distribution
41 Gas, Steam, Generation & Distribution
Through Pipes
42 Water Works & Supply
68 Mfr. Of Retail Trade N.E.C.
74 Storage of Warehousing Fedration 5 6
97 Repair Services
SUB TOTAL (A) 2320 97 138 2279 GRAND TOTAL (A+B+C) 8863 494 517 8840
Note : 24, I and 1502 Factories were closed Source : Chief Inspector, Factory and Boilers, Rajasthan, Jaipur.
before last year in Section 2 M (I), 2m (11) and 85 respectively.
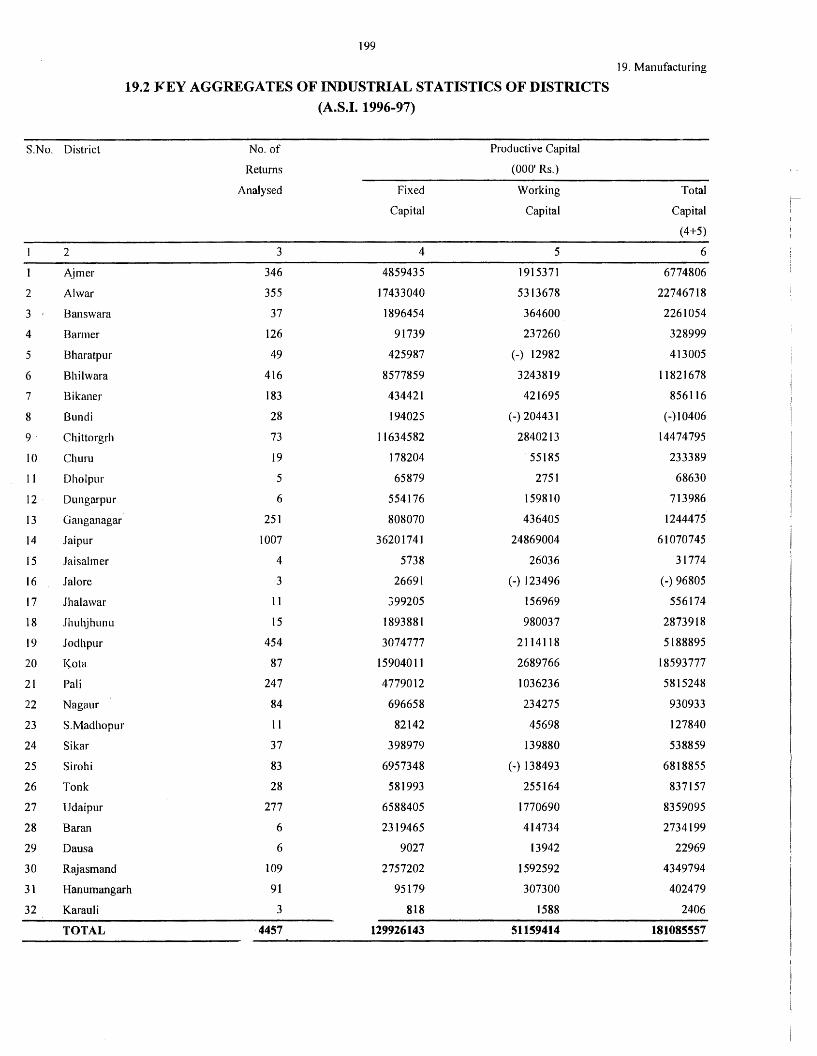
199
19. Manufacturing
19.2 J<EY AGGREGATES OF INDUSTRIAL STATISTICS OF DISTRICTS (A.S.I. 1996-97)
S.No. District No. of Productive Capital
Returns (000' Rs.)
Analysed Fixed Working Total
Capital Capital Capital
(4+5)
2 3 4 5 6
Ajmer 346 4859435 1915371 6774806
2 Al war 355 17433040 5313678 22746718
3 Banswara 37 1896454 364600 2261054
4 Barmer 126 91739 237260 328999
5 Bharatpur 49 425987 (-) 12982 413005
6 Bhilwara 416 8577859 3243819 11821678
7 Bikaner 183 434421 421695 856116
8 Bundi 28 194025 (-) 204431 (-)10406
9 Chittorgrh 73 11634582 2840213 14474795
10 Churn 19 178204 55185 233389
11 Dholpur 5 65879 2751 68630
12 Dungarpur 6 554176 159810 713986
13 Ganganagar 251 808070 436405 1244475
14 Jaipur 1007 36201741 24869004 61070745
15 .Jaisalmer 4 5738 26036 31774
16 Jal ore 3 26691 (-) 123496 (-) 96805
17 Jhalawar 11 399205 156969 556174
18 Jhuhjhunu 15 1893881 980037 2873918
19 Jodhpur 454 3074777 2114118 5188895
20 Ko ta 87 1590401] 2689766 18593777
21 Pali 247 4779012 1036236 5815248
22 Nagaur 84 696658 234275 930933
23 S.Madhopur 11 82142 45698 127840
24 Sikar 37 398979 139880 538859
25 Sirohi 83 6957348 (-) 138493 6818855
26 Tonk 28 581993 255164 837157
27 Udaipur 277 6588405 1770690 8359095
28 Baran 6 2319465 414734 2734199
29 Dausa 6 9027 13942 22969
30 Rajasmand 109 2757202 1592592 4349794
31 Hanumangarh 91 95179 307300 402479
32 Karau Ii 3 818 1588 2406
TOTAL 4457 129926143 51159414 181085557
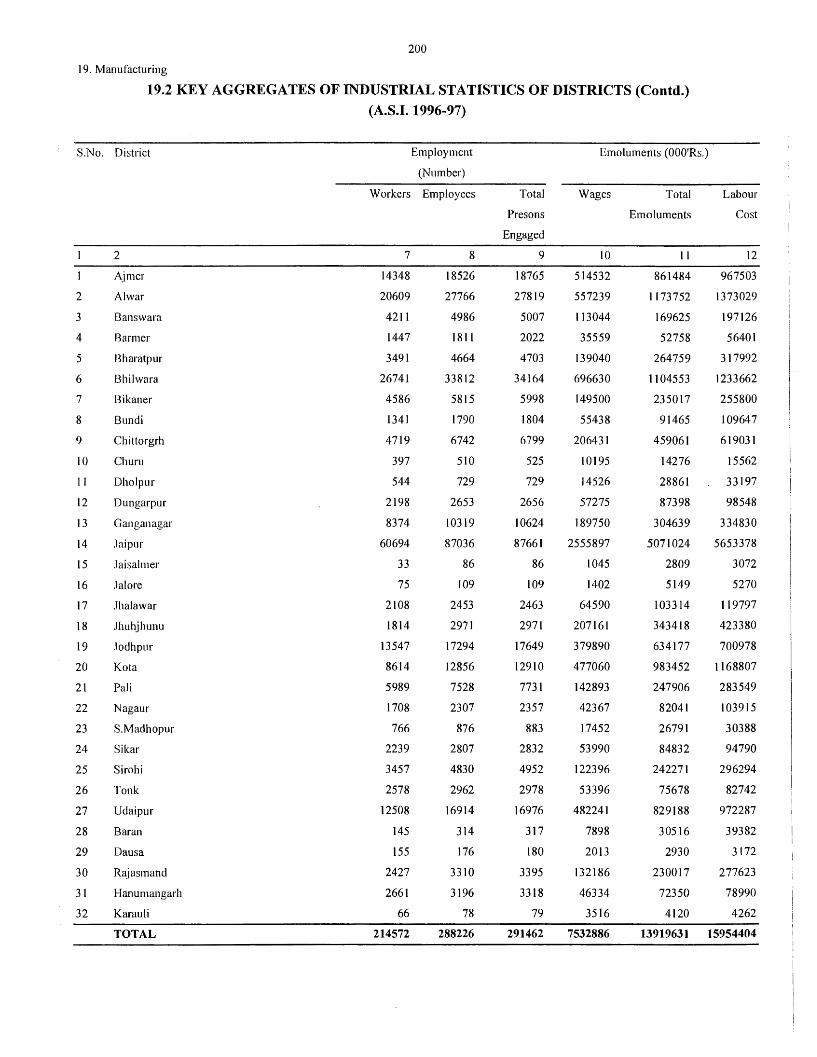
200
19. Manufacturing
19.2 KEY AGGREGATES OF INDUSTRIAL STATISTICS OF DISTRICTS (Contd.) (A.S.I. 1996-97)
S.No. District Employment Emoluments (OOO'Rs.)
(Number)
Workers Employees Total Wages Total Labour
Presons Emoluments Cost
Engaged
2 7 8 9 10 11 12
Ajmer 14348 18526 18765 514532 861484 967503
2 Al war 20609 27766 27819 557239 1173752 1373029
3 Banswara 4211 4986 5007 113044 169625 197126
4 Barmer 1447 1811 2022 35559 52758 56401
5 Bharatpur 3491 4664 4703 139040 264759 317992
6 Bhilwara 26741 33812 34164 696630 1104553 1233662
7 Bikaner 4586 5815 5998 149500 235017 255800
8 Bundi 1341 1790 1804 55438 91465 109647
9 Chittorgrh 4719 6742 6799 206431 459061 619031
10 Churn 397 510 525 10195 14276 15562
11 Dholpur 544 729 729 14526 28861 33197
12 Dungarpur 2198 2653 2656 57275 87398 98548
13 Ganganagar 8374 10319 10624 189750 304639 334830
14 Jaipur 60694 87036 87661 2555897 5071024 5653378
15 Jaisalmer 33 86 86 1045 2809 3072
16 .lalore 75 109 109 1402 5149 5270
17 Jhalawar 2108 2453 2463 64590 103314 119797
18 Jhuhjhunu 1814 2971 2971 207161 343418 423380
19 Jodhpur 13547 17294 17649 379890 634177 700978
20 Ko ta 8614 12856 12910 477060 983452 1168807
21 Pali 5989 7528 7731 142893 247906 283549
22 Nagaur 1708 2307 2357 42367 82041 103915
23 S.Madhopur 766 876 883 17452 26791 30388
24 Sikar 2239 2807 2832 53990 84832 94790
25 Sirohi 3457 4830 4952 122396 242271 296294
26 Tonk 2578 2962 2978 53396 75678 82742
27 Udaipur 12508 16914 16976 482241 829188 972287
28 Baran 145 314 317 7898 30516 39382
29 Dausa 155 176 180 2013 2930 3172
30 Rajasmand 2427 3310 3395 132186 230017 277623
31 Hanumangarh 2661 3196 3318 46334 72350 78990
32 Karau Ii 66 78 79 3516 4120 4262
TOTAL 214572 288226 291462 7532886 13919631 15954404
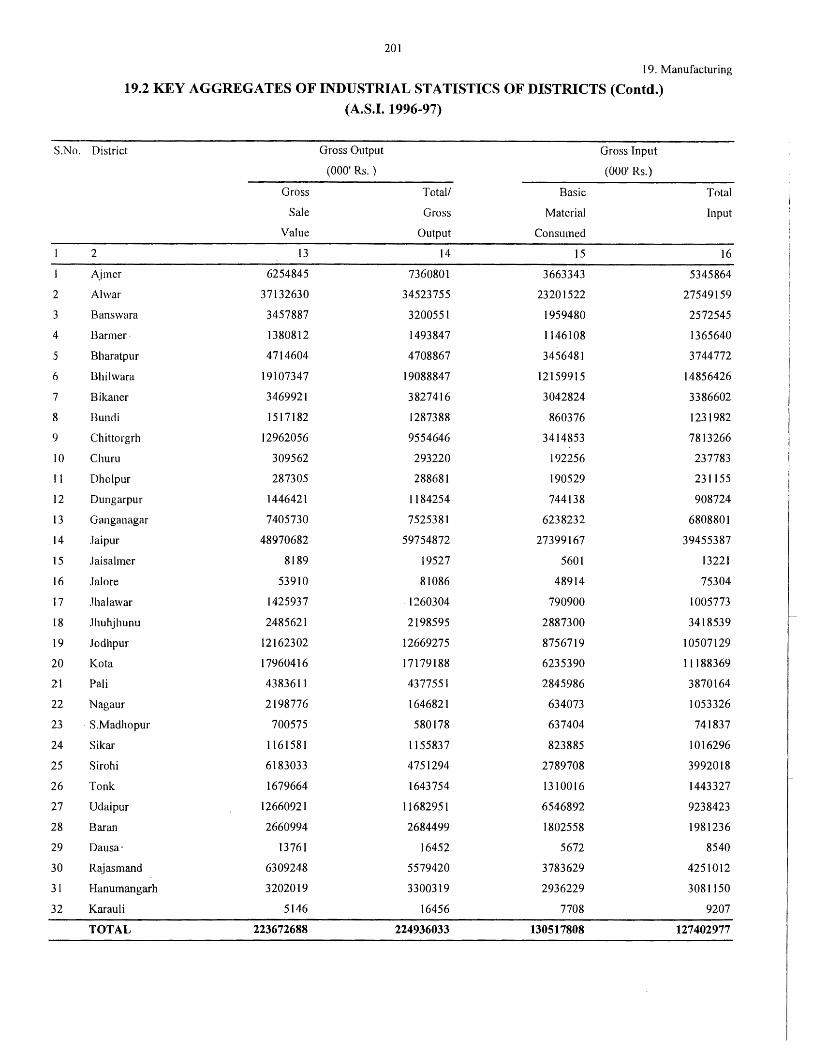
201
19. Manufacturing
19.2 KEY AGGREGATES OF INDUSTRIAL STATISTICS OF DISTRICTS (Contd.) (A.S.I. 1996-97)
S.No. District Gross Output Gross Input
(000' Rs.) (000' Rs.)
Gross Total/ Basic Total
Sale Gross Material Input
Value Output Consumed
2 13 14 15 16
Ajmer 6254845 7360801 3663343 5345864
2 Ahvar 37132630 34523755 23201522 27549159
3 Banswara 3457887 3200551 1959480 2572545
4 Barmer· 1380812 1493847 1146108 1365640
5 Bharatpur 4714604 4708867 3456481 3744772
6 Bhilwara 19107347 19088847 12159915 14856426
7 Bikaner 3469921 3827416 3042824 3386602
8 Bundi 1517182 1287388 860376 1231982
9 Chittorgrh 12962056 9554646 3414853 7813266
IO Chum 309562 293220 192256 237783
I I Dholpur 287305 288681 190529 231155
12 Dungarpur 1446421 1184254 744138 908724
13 Ganganagar 7405730 7525381 6238232 6808801
14 Jaipur 48970682 59754872 27399167 39455387
15 Jaisalmer 8189 19527 5601 13221
16 Jal ore 53910 81086 48914 75304
17 Jhalawar 1425937 1:260304 790900 1005773
18 Jhuhjhunu 2485621 2198595 2887300 3418539
19 Jodhpur 12162302 12669275 8756719 10507129
20 Ko ta 17960416 17179188 6235390 11188369
21 Pali 4383611 4377551 2845986 3870164
22 Nagaur 2198776 1646821 634073 1053326
23 · S.Madhopur 700575 580178 637404 741837
24 Sikar 1161581 1155837 823885 1016296
25 Sirohi 6183033 4751294 2789708 3992018
26 Tonk 1679664 1643754 1310016 1443327
27 Udaipur 12660921 11682951 6546892 9238423
28 Baran 2660994 2684499 1802558 1981236
29 Dausa· 13761 16452 5672 8540
30 Rajasmand 6309248 5579420 3783629 4251012
31 Hanumangarh 3202019 3300319 2936229 3081150
32 Karau Ii 5146 16456 7708 9207
TOTAL 223672688 224936033 130517808 127402977
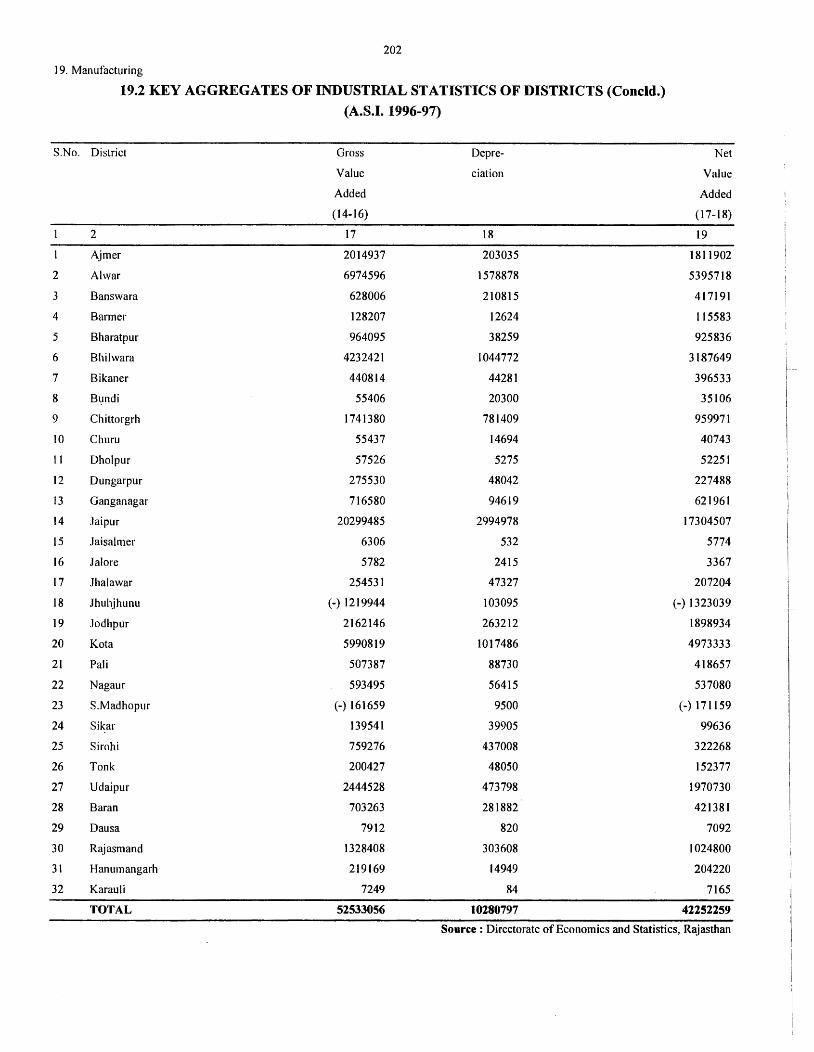
202
19. Manufacturing
19.2 KEY AGGREGATES OF INDUSTRIAL STATISTICS OF DISTRICTS (Concld.)
(A.S.I. 1996-97)
S.No. District Gross Depre- Net
Value ciation Value
Added Added
(14-16) (17-18)
2 17 18 19
Ajmer 2014937 203035 1811902
2 Al war 6974596 1578878 5395718
3 Banswara 628006 210815 417191
4 Barmer 128207 12624 115583
5 Bharatpur 964095 38259 925836
6 Bhilwara 4232421 1044772 3187649
7 Bikaner 440814 44281 396533
8 Bundi 55406 20300 35!06
9 Chittorgrh 1741380 781409 959971
10 Churu 55437 14694 40743
11 Dholpur 57526 5275 52251
12 Dungarpur 275530 48042 227488
13 Ganganagar 716580 94619 621961
14 Jaipur 20299485 2994978 17304507
15 Jaisalmer 6306 532 5774
16 Jalore 5782 2415 3367
17 Jhalawar 254531 47327 207204
18 Jhuhjhunu (-) 1219944 103095 (-) 1323039
19 Jodhpur 2162146 263212 1898934
20 Ko ta 5990819 1017486 4973333
21 Pali 507387 88730 418657
22 Nagaur 593495 56415 537080
23 S.Madhopur (-) 161659 9500 (-) 171159
24 Sikar 139541 39905 99636
25 Sirohi 759276 437008 322268
26 Tonk 200427 48050 152377
27 Udaipur 2444528 473798 1970730
28 Baran 703263 281882 421381
29 Dausa 7912 820 7092
30 Rajasmand 1328408 303608 1024800
31 Hanumangarh 219169 14949 204220
32 Karau Ii 7249 84 7165
TOTAL 52533056 10280797 42252259
Source : Directorate of Economics and Statistics, Rajasthan
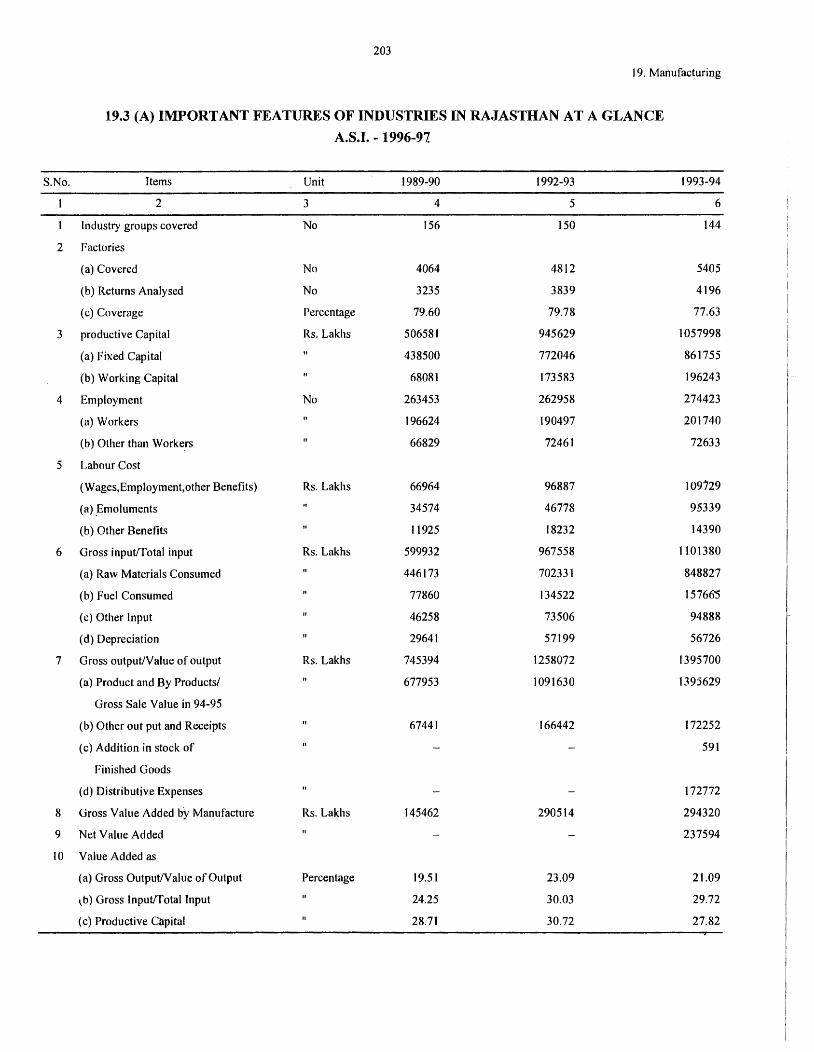
203
19. Manufacturing
19.3 (A) IMPORTANT FEATURES OF INDUSTRIES IN RAJASTHAN AT A GLANCE
A.S.I. - 1996-97.
S.No. Items Unit 1989-90 1992-93 1993-94
2 3 4 5 6
Industry groups covered No 156 150 144
2 Factories
(a) Covered No 4064 4812 5405
(b) Returns Analysed No 3235 3839 4196
(c) Coverage Percentage 79.60 79.78 77.63
3 productive Capital Rs. Lakhs 506581 945629 1057998
(a) Fixed Capital 438500 772046 861755
(b) Working Capital 68081 173583 196243
4 Employment No 263453 262958 274423
(a) Workers 196624 190497 201740
(b) Other than Worke.rs 66829 72461 72633
5 Labour Cost
(Wages,Employment,other Benefits) Rs. Lakhs 66964 96887 109729
(a) _Emoluments 34574 46778 95339
(b) Other Benefits I 1925 18232 14390
6 Gross input/Total input Rs. Lakhs 599932 967558 1101380
(a) Raw Materials Consumed 446173 702331 848827
(b) Fuel Consumed 77860 134522 15766'5
(c) Other Input 46258 73506 94888
( d) Depreciation 29641 57199 56726
7 Gross output/Value of output Rs. Lakhs 745394 1258072 1395700
{a} Product and By Products/ 677953 1091630 1395629
Gross Sale Value in 94-95
(b) Other out put and Receipts 67441 166442 172252
(c} Addition in stock of 591
Finished Goods
( d) Distributive Expenses 172772
8 Gross Value Added by Manufacture Rs. Lakhs 145462 290514 294320
9 Net Value Added 237594
IO Value Added as
(a) Gross Output/Value of Output Percentage 19.51 23.09 21.09
\b) Gross Input/Total Input 24.25 30.03 29.72
( c) Productive Capital 28.71 30.72 27.82
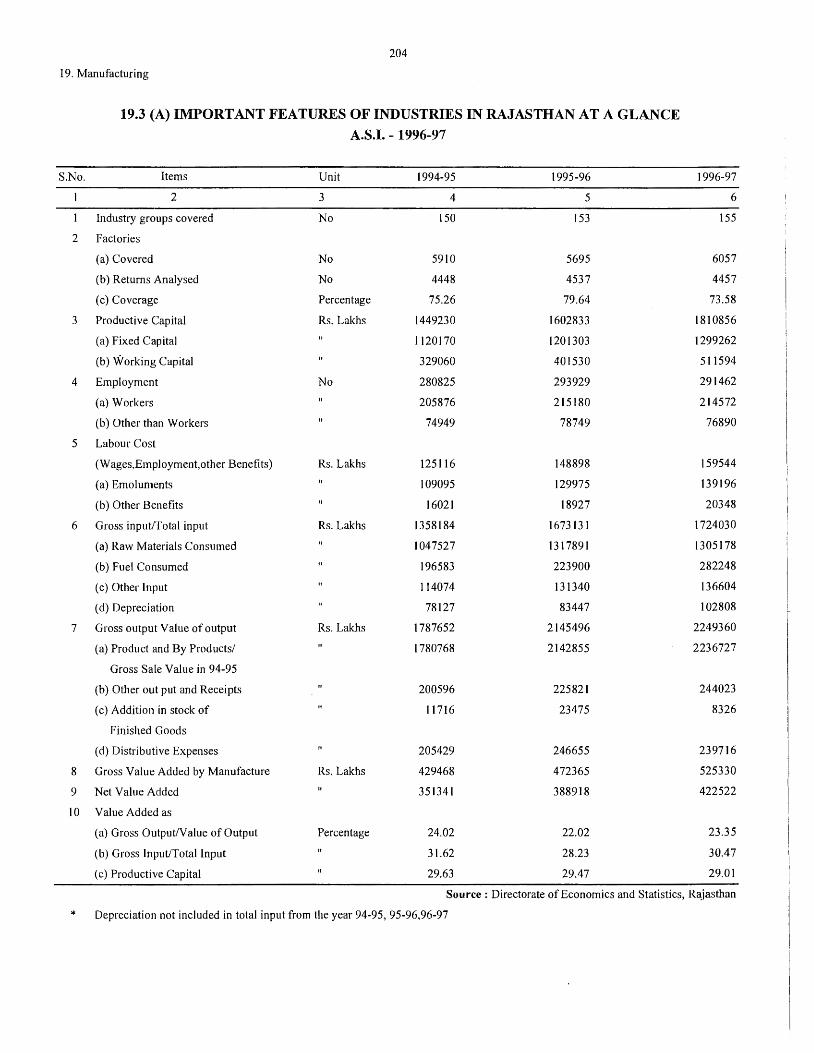
204
19. Manufacturing
19.3 (A) IMPORTANT FEATURES OF INDUSTRIES IN RAJASTHAN AT A GLANCE
A.S.I. - 1996-97
S.No. Items Unit 1994-95 1995-96 1996-97
2 3 4 5 6
Industry groups covered No 150 153 155
2 Factories
(a) Covered No 5910 5695 6057
(b) Returns Analysed No 4448 4537 4457
(c) Coverage Percentage 75.26 79.64 73.58
3 Productive Capital Rs. Lakhs 1449230 1602833 1810856
(a) Fixed Capital l 120170 1201303 1299262
(b) Working Capital 329060 401530 511594
4 Employment No 280825 293929 291462
(a) Workers 205876 215180 214572
(b) Other than Workers 74949 78749 76890
5 Labour Cost
(Wages,Employment,other Benefits) Rs. Lakhs 125116 148898 159544
(a) Emoluments 109095 129975 139196
(b) Other Benefits 16021 18927 20348
6 Gross input/Total input Rs. Lakhs 1358184 1673131 1724030
(a) Raw Materials Consumed 1047527 1317891 1305178
(b) Fuel Consumed 196583 223900 282248
( c) Other Input 114074 131340 136604
( d) Depreciation 78127 83447 102808
7 Gross output Value of output Rs. Lakhs 1787652 2145496 2249360
(a) Product and By Products/ 1780768 2142855 2236727
Gross Sale Value in 94-95
(b) Other out put and Receipts 200596 225821 244023
(c) Addition in stock of 11716 23475 8326
Finished Goods
(d) Distributive Expenses 205429 246655 239716
8 Gross Value Added by Manufacture Rs. Lakhs 429468 472365 525330
9 Net Value Added 351341 388918 422522
10 Value Added as
(a) Gross Output/Value of Output Percentage 24.02 22.02 23.35
(b) Gross Input/Total Input 31.62 28.23 30.47
(c) Productive Capital 29.63 29.47 29.01
Source: Directorate of Economics and Statistics, Rajasthan
* Depreciation not included in total input from the year 94-95, 95-96,96-97
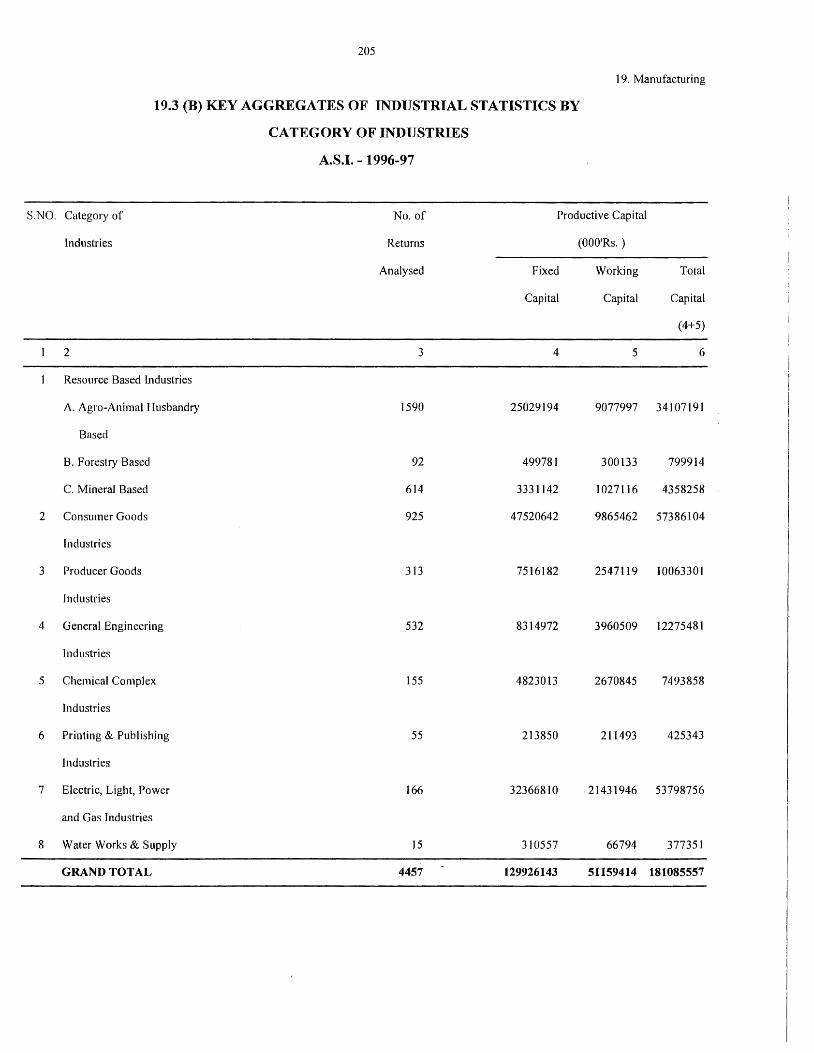
S.NO.
2
3
4
5
6
7
8
205
19. Manufacturing
19.3 (B) KEY AGGREGATES OF INDUSTRIAL STATISTICS BY
CATEGORY OF INDUSTRIES
A.S.I. - 1996-97
Category of No. of Productive Capital
Industries Returns (OOO'Rs.)
Analysed Fixed Working
Capital Capital
2 3 4 5
Resource Based Industries
A. Agro-Animal Husbandry 1590 25029194 9077997
Based
B. Forestry Based 92 499781 300133
C. Mineral Based 614 3331142 1027116
Consumer Goods 925 47520642 9865462
Industries
Producer Goods 313 7516182 2547119
Industries
General Engineering 532 8314972 3960509
Industries
Chemical Complex 155 4823013 2670845
Industries
Printing & Publishing 55 213850 211493
Industries
Electric, Light, Power 166 32366810 21431946
and Gas Industries
Water Works & Supply 15 310557 66794
GRAND TOTAL 4457 129926143 51159414
Total
Capital
(4+5)
6
34107191
799914
4358258
57386104
10063301
12275481
7493858
425343
53798756
377351
181085557
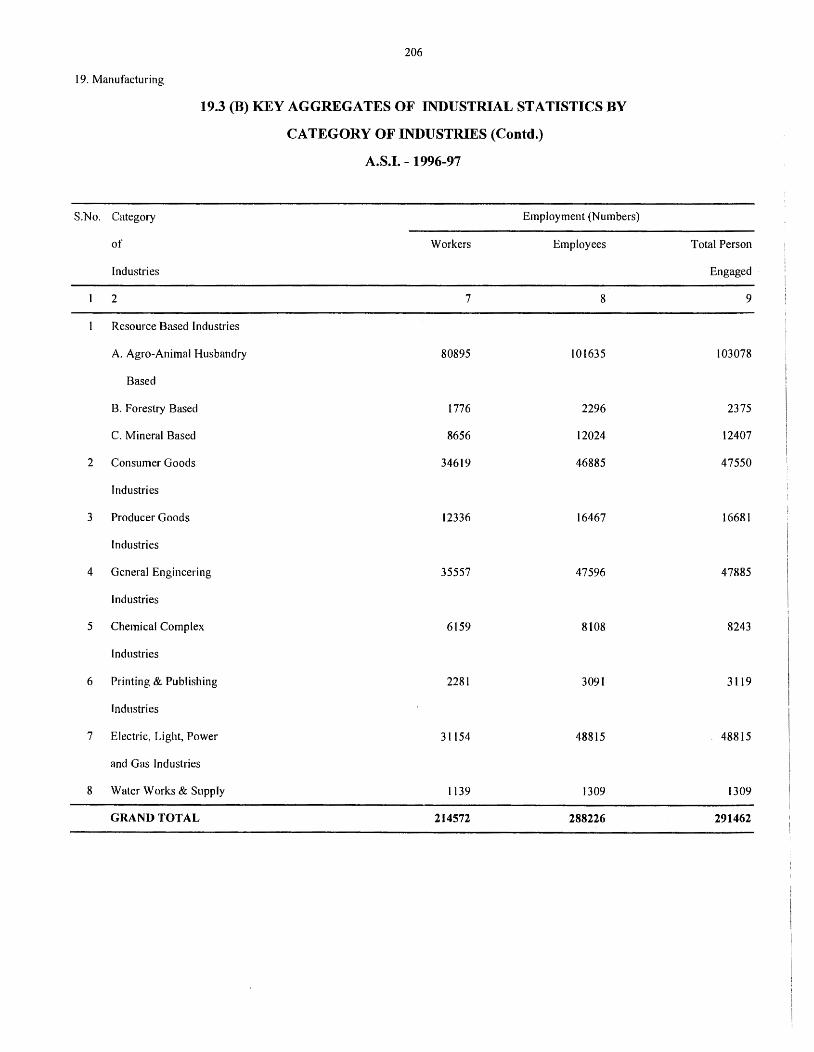
206
19. Manufacturing
S.No.
2
3
4
5
6
7
8
19.3 (B) KEY AGGREGATES OF INDUSTRIAL STATISTICS BY
CATEGORY OF INDUSTRIES (Contd.)
A.S.I. - 1996-97
Category Employment (Numbers)
of Workers Employees
Industries
2 7 8
Resource Based Industries
A. Agro-Animal Husbandry 80895 101635
Based
B. Forestry Based 1776 2296
C. Mineral Based 8656 12024
Consumer Goods 34619 46885
Industries
Producer Goods 12336 16467
Industries
General Engineering 35557 47596
Industries
Chemical Complex 6159 8108
Industries
Printing & Publishing 2281 3091
Industries
Electric, Light, Power 31154 48815
and Gas Industries
Water Works & Supply 1139 1309
GRAND TOTAL 214572 288226
Total Person
Engaged
9
103078
2375
12407
47550
16681
47885
8243
3119
48815
1309
291462
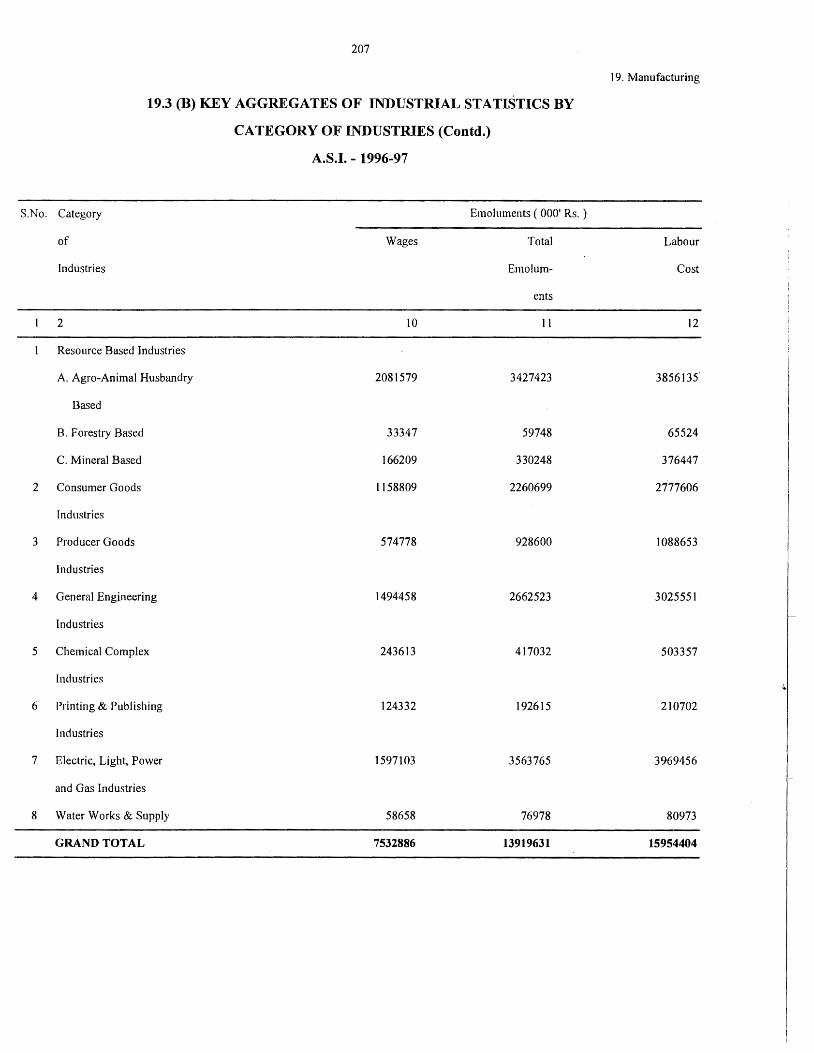
S.No.
2
3
4
5
6
7
8
207
19.3 (B) KEY AGGREGATES OF INDUSTRIAL STATISTICS BY
CATEGORY OF INDUSTRIES (Contd.)
A.S.I. - 1996-97
Category Emoluments ( 000' Rs. )
of Wages Total
Industries Emolum-
en ts
2 IO 11
Resource Based Industries
A. Agro-Animal Husbandry 2081579 3427423
Based
B. Fores try Based 33347 59748
C. Mineral Based 166209 330248
Consumer Goods 1158809 2260699
Industries
Producer Goods 574778 928600
Industries
General Engineering 1494458 2662523
Industries
Chemical Complex 243613 417032
Industries
Printing & Publishing 124332 192615
Industries
Electric, Light, Power 1597103 3563765
and Gas Industries
Water Works & Supply 58658 76978
GRAND TOTAL 7532886 13919631
19. Manufacturing
Labour
Cost
12
3856135
65524
376447
2777606
1088653
3025551
503357
.\.
210702
3969456
80973
15954404
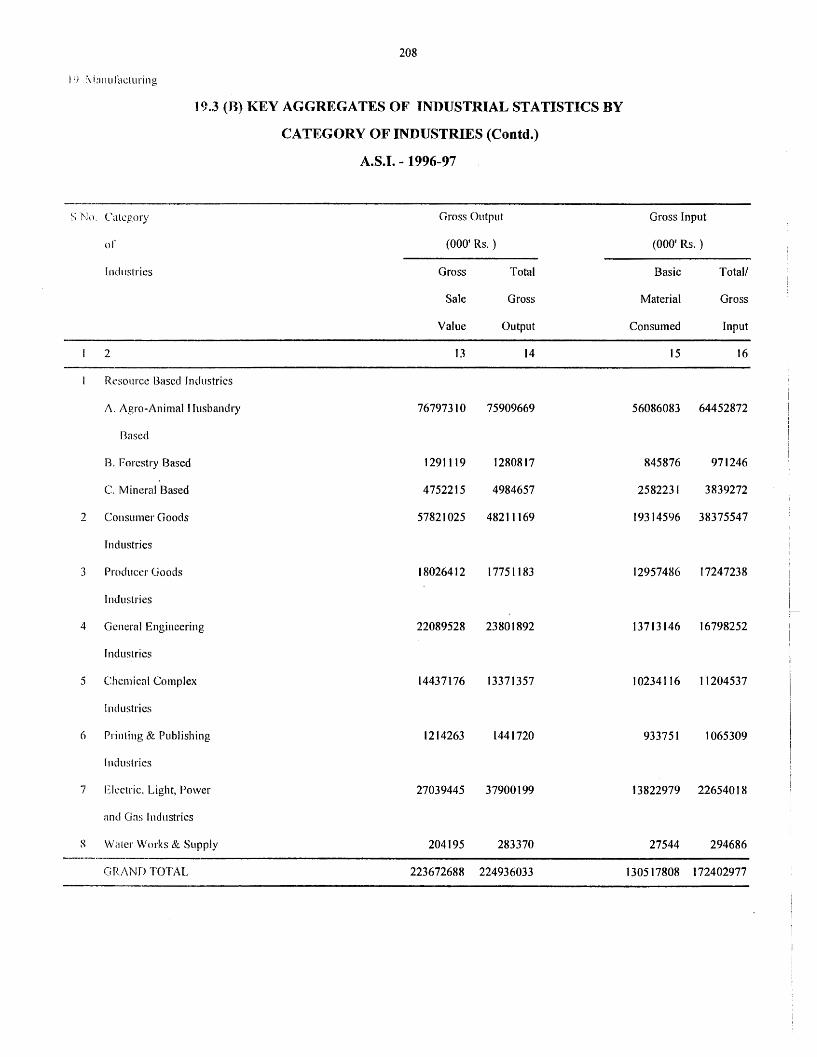
208
I lJ \ innufocturing
SNo.
2
3
4
5
6
7
8
19.3 (B) KEY AGGREGATES OF INDUSTRIAL STATISTICS BY
CATEGORY OF INDUSTRIES (Contd.)
A.S.I. - 1996-97
Category Gross Output
or (000' Rs.)
Industries Gross Total
Sale Gross
Value Output
2 13 14
Resource Based Industries
J\. Agro-Animal Jlusbandry 76797310 75909669
Based
B. Fores try Based 1291119 1280817
C. Mineral Based 4752215 4984657
Consumer Goods 57821025 48211169
Industries
Producer Goods 18026412 17751183
Industries
General Engineering 22089528 23801892
Industries
Chemical Complex 14437176 13371357
Industries
Printing & Publishing 1214263 1441720
Industries
Electric, Light, Power 27039445 37900199
and Gns Industries
Water Works & Supply 204195 283370
GR;\ND TOTAL 223672688 224936033
Gross Input
(000' Rs.)
Basic Total/
Material Gross
Consumed Input
15 16
56086083 64452872
845876 971246
2582231 3839272
19314596 38375547
12957486 17247238
13713146 16798252
10234116 11204537
933751 1065309
13822979 22654018
27544 294686
130517808 172402977
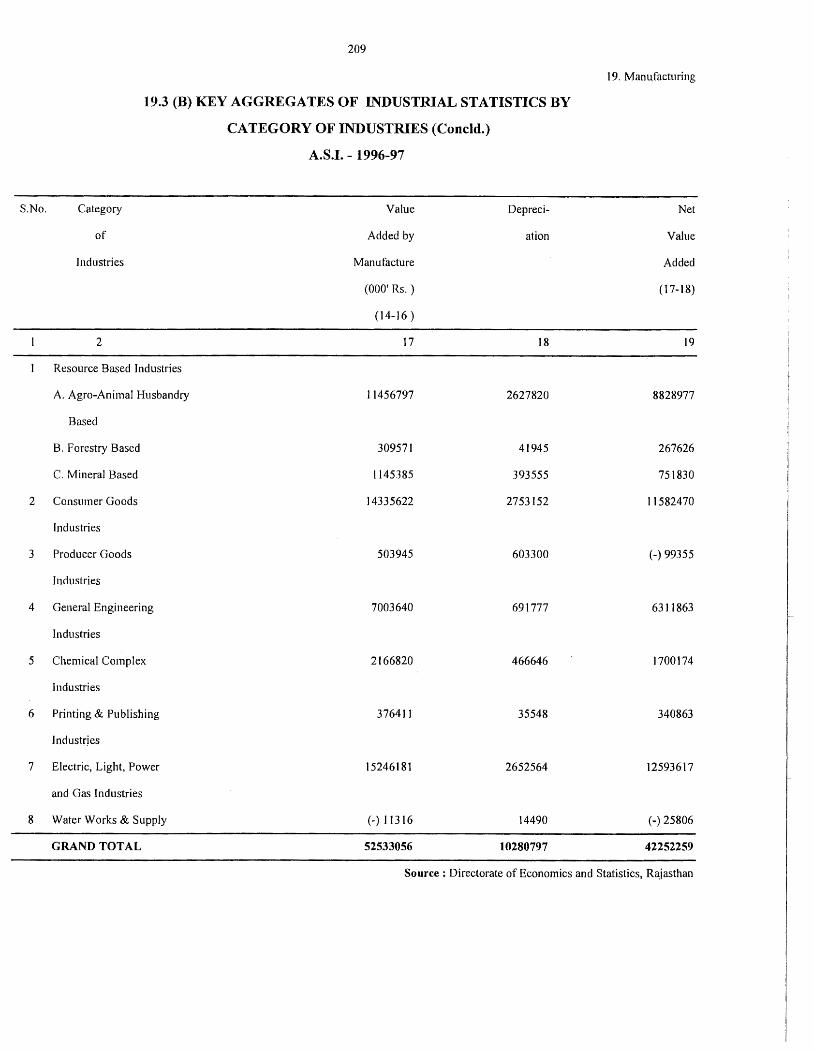
S.No.
2
3
4
5
6
7
8
209
19.3 (B) KEY AGGREGATES OF INDUSTRIAL STATISTICS BY
CATEGORY OF INDUSTRIES (Concld.)
A.S.I. - 1996-97
Category Value Depreci-
of Added by ation
Industries Manufacture
(000' Rs.)
(14-16)
2 17 18
Resource Based Industries
A. Agro-Animal Husbandry 11456797 2627820
Based
B. Forestry Based 309571 41945
C. Mineral Based 1145385 393555
Consumer Goods 14335622 2753152
Industries
Producer Goods 503945 603300
Industries
General Engineering 7003640 691777
Industries
Chemical Complex 2166820 466646
Industries
Printing & Publishing 376411 35548
Industries
Electric, Light, Power 15246181 2652564
and Gas Industries
Water Works & Supply (-)11316 14490
GRAND TOTAL 52533056 10280797
19. Manufacturing
Net
Value
Added
(17-18)
19
8828977
267626
751830
11582470
(-)99355
6311863
1700174
340863
12593617
(-) 25806
42252259
Source : Directorate of Economics and Statistics, Rajasthan
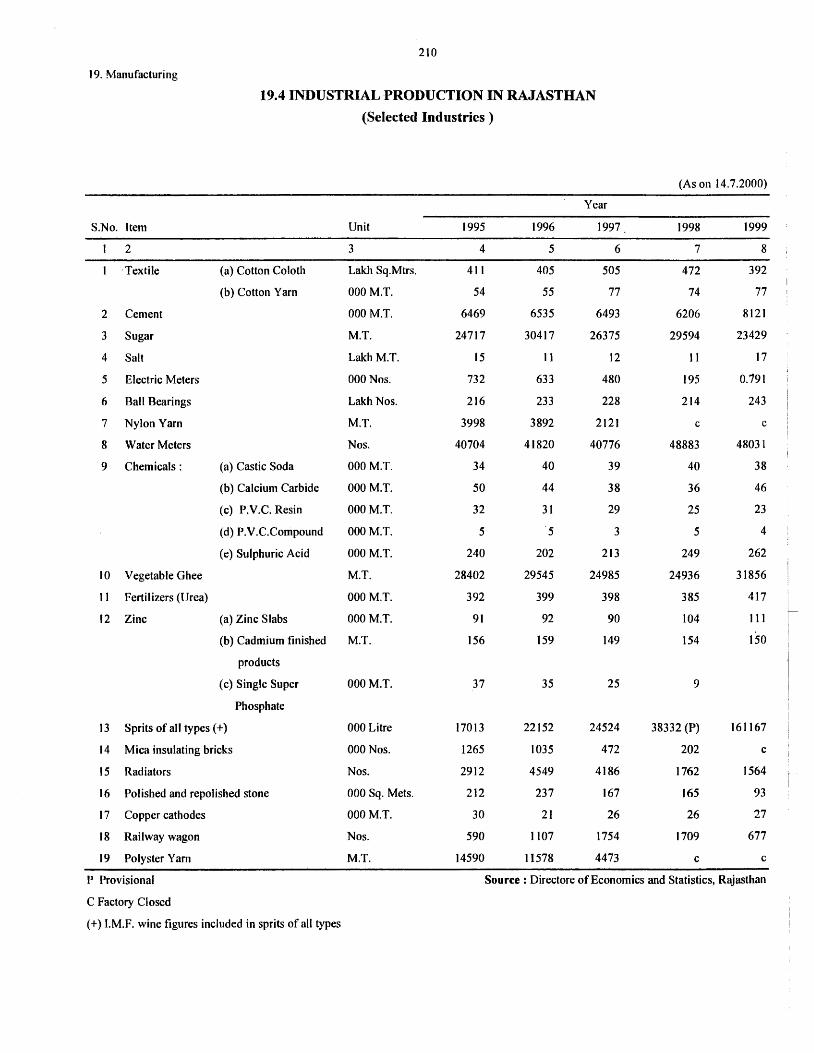
210
19. Manufacturing
S.No.
2
3
4
5
6
7
8
9
to
J l
12
J3
14
15
16
17
18
19
19.4 INDUSTRIAL PRODUCTION IN RAJASTHAN
(Selected Ind us tries )
Year
Item Unit 1995 1996 1997
2 3 4 5 6
·Textile (a) Cotton Coloth Lakh Sq.Mtrs. 411 405 505
(b) Cotton Yam OOOM.T. 54 55 77
Cement 000 M.T. 6469 6535 6493
Sugar M.T. 24717 30417 26375
Salt Lakh M.T. 15 11 12
Electric Meters OOONos. 732 633 480
Ball Bearings Lakh Nos. 216 233 228
Nylon Yarn M.T. 3998 3892 2121
Water Meters Nos. 40704 41820 40776
Chemicals: (a) Castic Soda 000 M.T. 34 40 39
(b) Calcium Carbide 000 M.T. 50 44 38
(c) P.V.C. Resin OOOM.T. 32 31 29
(d) P.V:C.Compound OOOM.T. 5 ·5 3
(e) Sulphuric Acid OOOM.T. 240 202 213
Vegetable Ghee M.T. 28402 29545 24985
Fertilizers (Urea) 000 M.T. 392 399 398
Zinc (a) Zinc Slabs OOOM.T. 91 92 90
(b) Cadmium finished M.T. 156 159 149
products
(c) Single Super OOOM.T. 37 35 25
Phosphate
Sprits of all types(+) 000 Litre 17013 22152 24524
Mica insulating bricks 000 Nos. 1265 1035 472
Radiators Nos. 2912 4549 4186
Polished and repolished stone 000 Sq. Mets. 212 237 167
Copper cathodes 000 M.T. 30 21 26
Railway wagon Nos. 590 I 107 1754
Polyster Yarn M.T. 14590 I 1578 4473
(As on 14.7.2000)
1998 1999
7 8
472 392
74 77
6206 8121
29594 23429
11 17
195 0.191
214 243
c c
48883 48031
40 38
36 46
25 23
5 4
249 262
24936 31856
385 417
104 111
154 150
9
38332 (P) 161167
202 c
1762 1564
165 93
26 27
1709 677
c c
P Provisional Source: Directore of Economics and Statistics, Rajasthan
C Factory Closed
(+) l.M.F. wine figures included in sprits of all types
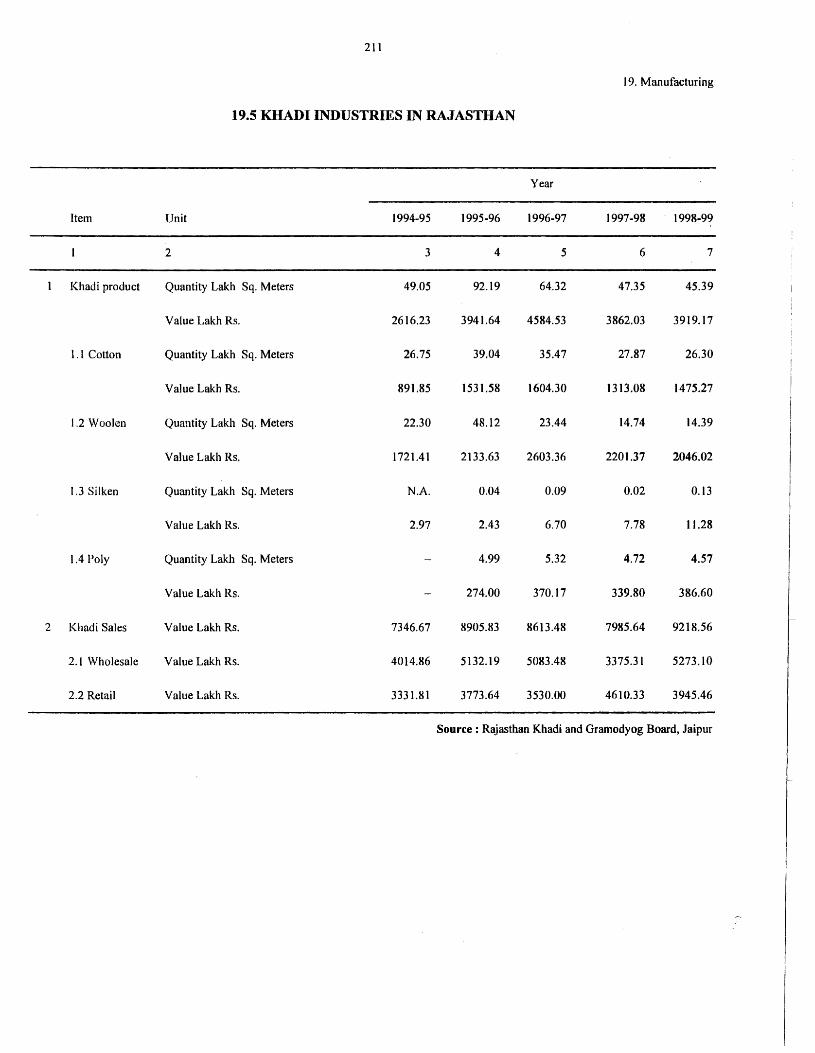
211
19. Manufacturing
19.5 KHADI INDUSTRIES IN RAJASTHAN
Year
Item Unit 1994-95 1995-96 1996-97 1997-98 1998-99
2 3 4 5 6 7
Khadi product Quantity La.kh Sq. Meters 49.05 92.19 64.32 47.35 45.39
Value Lakh Rs. 2616.23 3941.64 4584.53 3862.03 3919.17
1.1 Cotton Quantity Lakh Sq. Meters 26.75 39.04 35.47 27.87 26.30
Value Lakh Rs. 891.85 1531.58 1604.30 1313.08 1475.27
1.2 Woolen Quantity Lakh Sq. Meters 22.30 48.12 23.44 14.74 14.39
Value Lakh Rs. 1721.41 2133.63 2603.36 2201.37 2046.02
1.3 Silken Quantity Lakh Sq. Meters N.A. 0.04 0.09 0.02 0.13
Value Lakh Rs. 2.97 2.43 6.70 7.78 11.28
1.4 Poly Quantity Lakh Sq. Meters 4.99 5.32 4.72 4.57
Value Lakh Rs. 274.00 370.17 339.80 386.60
2 Khadi Sales Value Lakh Rs. 7346.67 8905.83 8613.48 7985.64 9218.56
2.1 Wholesale Value Lakh Rs. 4014.86 5132.19 5083.48 3375.31 5273. IO
2.2 Retail Value Lakh Rs. 3331.81 3773.64 3530.00 4610.33 3945.46
Source : R~jasthan Khadi and Gramodyog Board, Jaipur
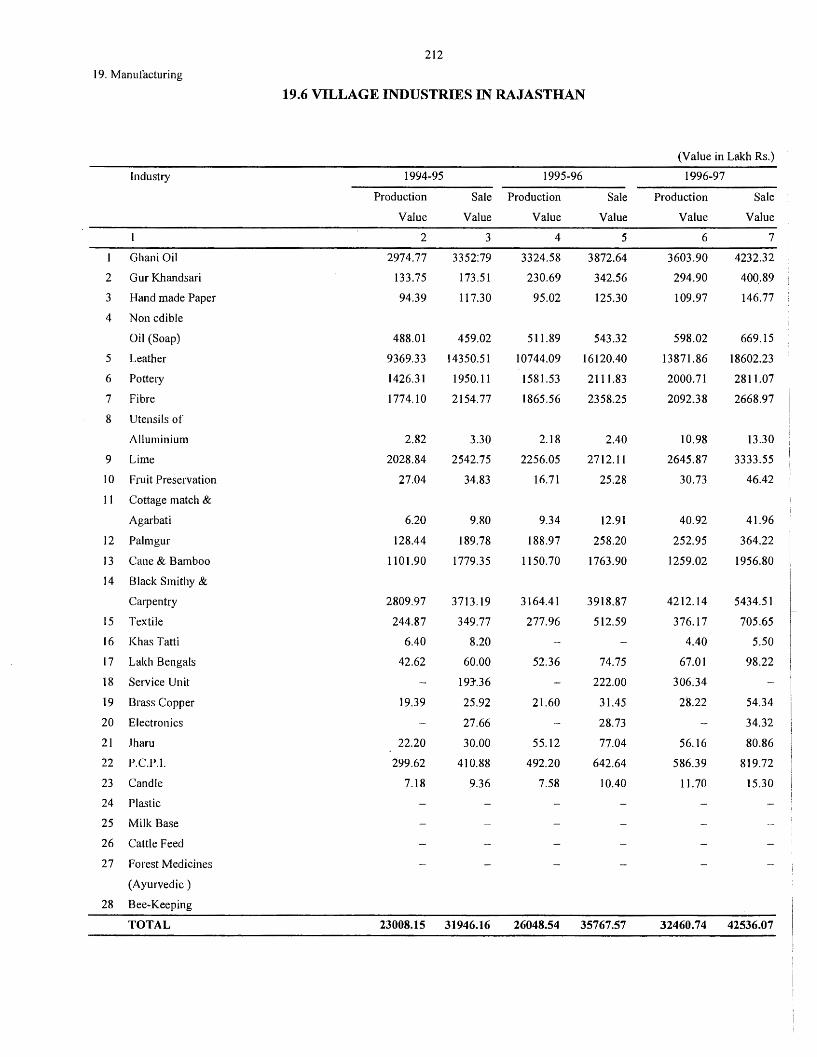
212
19. Manufacturing
19.6 VILLAGE INDUSTRIES IN RAJASTHAN
(Value in Lakh Rs.)
Industry 1994-95 1995-96 1996-97
Production Sale Production Sale Production Sale
Value Value Value Value Value Value
2 3 4 5 6 7
1 Ghani Oil 2974.77 3352:79 3324.58 3872.64 3603.90 4232.32
2 Gur Khandsari 133.75 173.51 230.69 342.56 294.90 40Q.89
3 Hand made Paper 94.39 117.30 95.02 125.30 109.97 146.77
4 Non edible
Oil (Soap) 488.01 459.02 511.89 543.32 598.02 669.15
5 Leather 9369.33 14350.51 10744.09 16120.40 13871.86 18602.23
6 Pottery 1426.31 1950.11 1581.53 2111.83 2000.71 2811.07
7 Fibre 1774.10 2154.77 1865.56 2358.25 2092.38 2668.97
8 Utensils of
Alluminium 2.82 3.30 2.18 2.40 10.98 13.30
9 Lime 2028.84 2542.75 2256.05 2712.11 2645.87 3333.55
10 Fruit Preservation 27.04 34.83 16.71 25.28 30.73 46.42
1 I Cottage match &
Agarbati 6.20 9.80 9.34 12.91 40.92 41.96
12 Palmgur 128.44 189.78 188.97 258.20 252.95 364.22
13 Cane & Bamboo 1101.90 1779.35 1150.70 1763.90 1259.02 1956.80
14 Black Smithy &
Carpentry 2809.97 3713.19 3164.41 3918.87 4212.14 5434.51
15 Textile 244.87 349.77 277.96 512.59 376.17 705;65
16 Khas Tatti 6.40 8.20 4.40 5.50
17 Laich Bengals 42.62 60.00 52.36 74.75 67.01 98.22
18 Service Unit 193'.36 222.00 306.34
19 Brass Copper 19.39 25.92 21.60 31.45 28.22 54.34
20 Electronics 27.66 28.73 34.32
21 .Jharu 22.20 30.00 55.12 77.04 56.16 80.86
22 P.C.P.l. 299.62 410.88 492.20 642.64 586.39 819.72
23 Candle 7.18 9.36 7.58 10.40 11.70 15.30
24 Plastic
25 Milk Base
26 Cattle Feed
27 Forest Medicines
(Ayurvedic)
28 Bee-Keeping
TOTAL 23008.15 31946.16 26048.54 35767.57 32460.74 42536.07
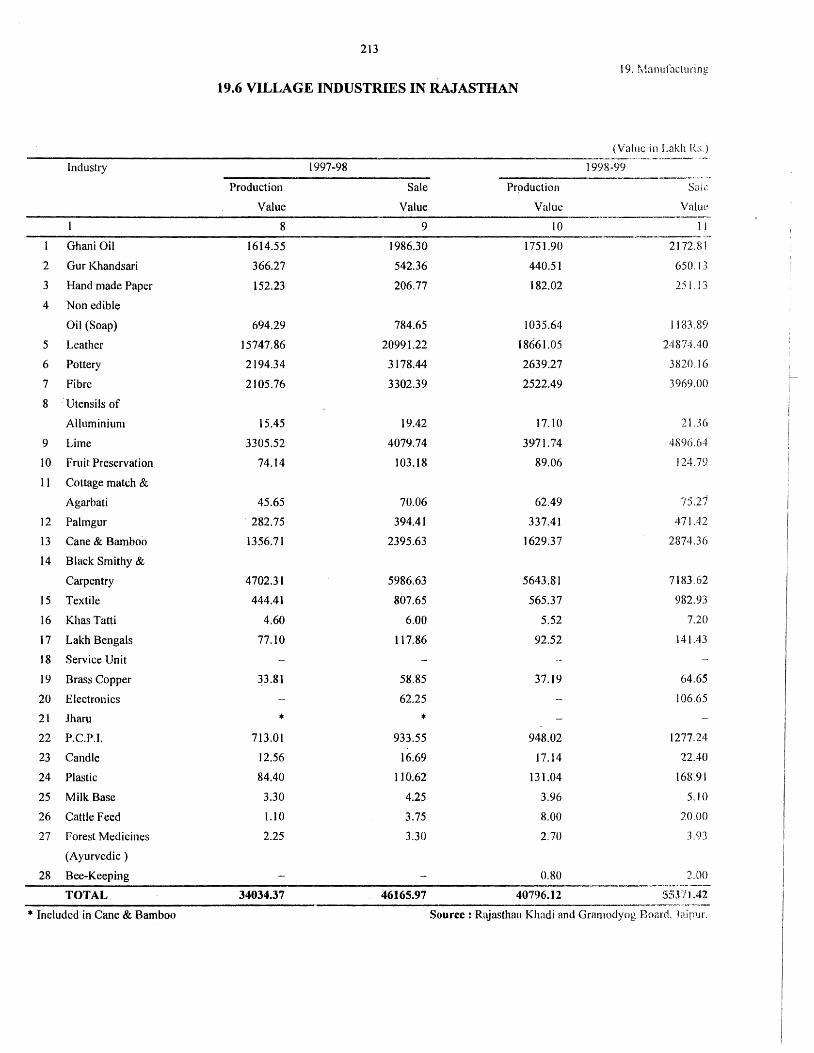
213
19. Manufacturing
19.6 VILLAGE INDUSTRIES IN RAJASTHAN
(Vnlue in Lnkh R:>.) .... ..__ .. .,,..~-.... _,,,_ ____ -,~_......."
Industry 1997-98 1998-99 -----~-~~-~·--.,,._,._ . .,...,_ .. ~ ....
Production Sale Production Sak
Value Value Value Value
8 9 IO l l
Ghani Oil 1614.55 1986.30 1751.90 2172.81
2 Gur Khandsari 366.27 542.36 440.51 650.13
3 Hand made Paper 152.23 206.77 182.02 25 l 13
4 Non edible
Oil (Soap) 694.29 784.65 1035.64 1183.89
5 Leather 15747.86 20991.22 18661.05 24874.40
6 Pottery 2194.34 3178.44 2639.27 3820.16
7 Fibre 2105.76 3302.39 2522.49 3969.00
8 Utensils of
Alluminium 15.45 19.42 17.10 21.36
9 Lime 3305.52 4079.74 3971.74 4896.64
10 Fruit Preservation 74.14 103.18 89.06 124.79
11 Cottage match &
Agarbati 45.65 70.06 62.49 75.21
12 Palmgur . 282.75 394.41 337.41 471.42
13 Cane & Bamboo 1356.71 2395.63 1629.37 2874.36
14 Black Smithy &
Carpentry 4702.31 5986.63 5643.81 7183.62
15 Textile 444.41 807.65 565.37 982.93
16 Khas Tatti 4.60 6.00 5.52 7.20
17 Lakh Bengals 77.10 117.86 92.52 141.43
18 Service Unit
19 Brass Copper 33.81 58.85 37.19 64.65
20 Electronics 62.25 106.65
21 Jharu * * 22 P.C.P.I. 713.01 933.55 948.02 1277.24
23 Candle 12.56 16.69 17.14 22.40
24 Plastic 84.40 110.62 131.04 168.91
25 Milk Base 3.30 4.25 3.96 5.10
26 Cattle Feed 1.10 3.75 8.00 20.00
27 Forest Medicines 2.25 3.30 2.70 3.93
(Ayurvedic )
28 Bee-Keeping 0.80 2.00 ~-..,----"'<"<10.,.._,_L."O'""'--
TOTAL 34034.37 46165.97 40796.12 S5J7I.42
* Included in Cane & Bamboo Source : Rajasthau Khadi and Gramodyog Boar<l, J<1ip1Jr.
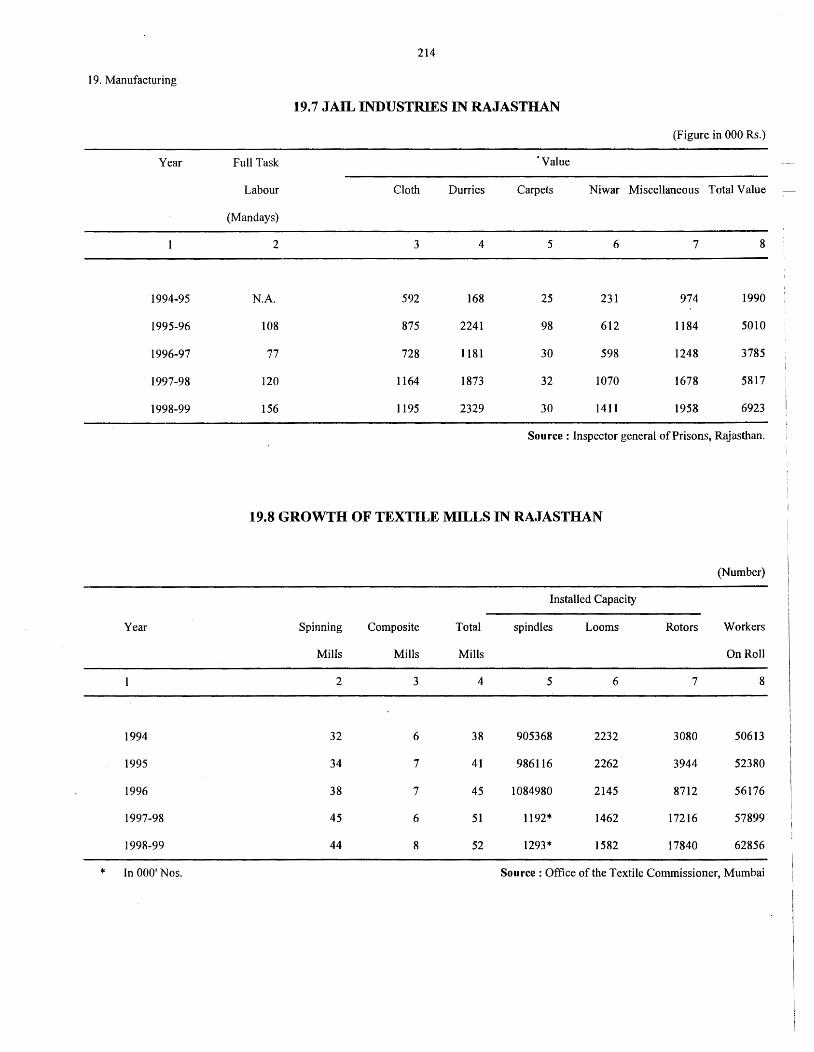
19. Manufacturing
Year
Year
1994-95
1995-96
1996-97
1997-98
1998-99
1994
1995
1996
1997-98
1998-99
* In 000' Nos.
Full Task
Labour
(Mandays)
2
N.A.
108
77
120
156
214
19.7 JAIL INDUSTRIES IN RAJASTHAN
Cloth
3
592
875
728
1164
1195
Durries
4
168
2241
1181
1873
2329
·value
Carpets
5
25
98
30
32
30
(Figure in 000 Rs.)
Niwar Miscellaneous Total Value
6
231
612
598
1070
1411
7
974
1184
1248
1678
1958
8
1990
5010
3785
5817
6923
Source: Inspector general of Prisons, Rajasthan.
19.8 GROWTH OF TEXTILE MILLS IN RAJASTHAN
Spinning
Mills
2
32
34
38
45
44
Composite
Mills
3
6
7
7
6
8
Total
Mills
4
38
41
45
51
52
Installed Capacity
spindles
5
905368
986116
1084980
1192*
1293*
Looms
6
2232
2262
2145
1462
1582
Rotors
7
3080
3944
8712
17216
17840
(Number)
Workers
On Roll
8
50613
52380
56176
57899
62856
Source: Office of the Textile Commissioner, Mumbai
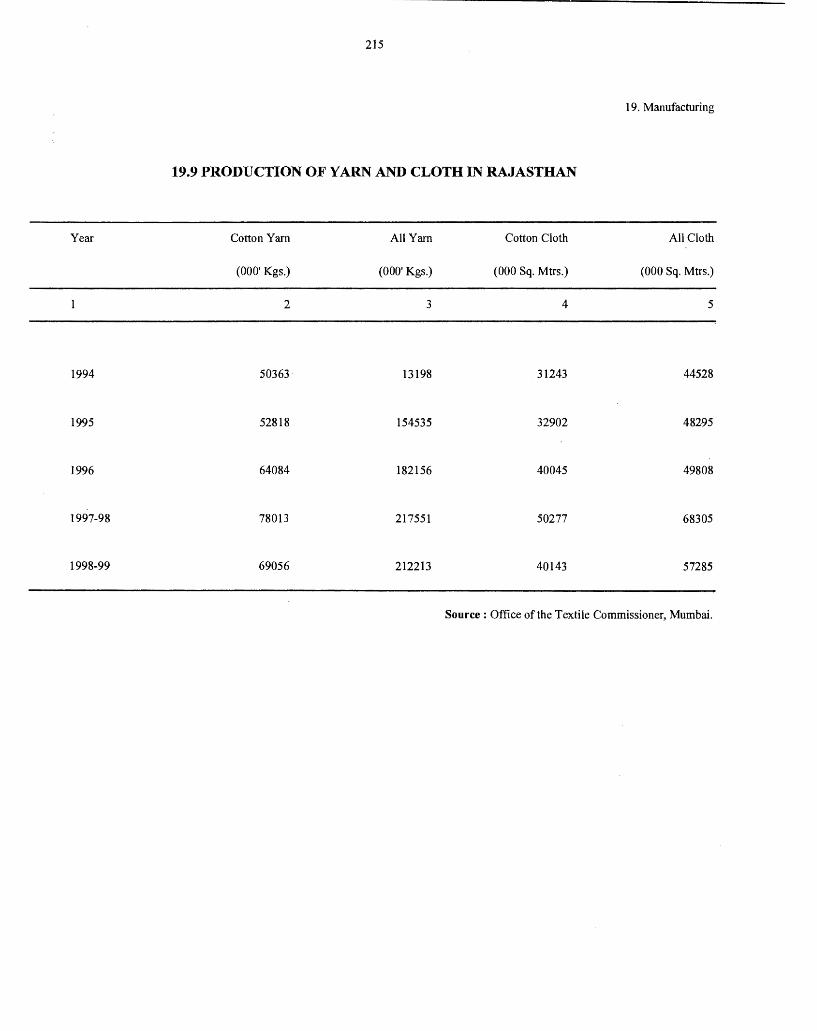
Year
1994
1995
1996
1997-98
1998-99
215
19. Manufacturing
19.9 PRODUCTION OF YARN AND CLOTH IN RAJASTHAN
Cotton Yarn
(000' Kgs.)
2
50363
52818
64084
78013
69056
All Yarn
(000' Kgs.)
3
13198
154535
182156
217551
212213
Cotton Cloth
(000 Sq. Mtrs.)
4
31243
32902
40045
50277
40143
All Cloth
(000 Sq. Mtrs.)
5
44528
482-95
49808
68305
57285
Source: Office of the Textile Commissioner, Mumbai.
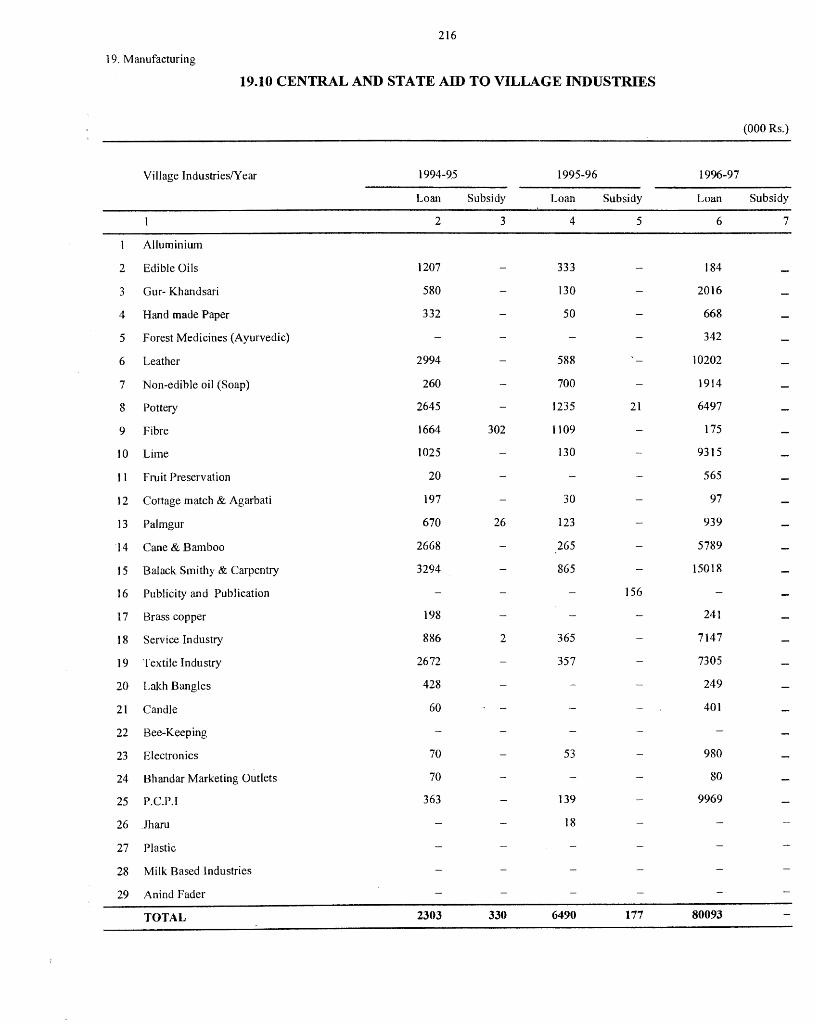
216
19. Manufacturing
19.10 CENTRAL AND STATE AID TO VILLAGE INDUSTRIES
(000 Rs.)
Village Industries/Year 1994-95 1995-96 19%-97
Loan Subsidy Loan Subsidy Loan Subsidy
2 3 4 5 6 7
Alluminium
2 Edible Oils 1207 333 184
3 Gur- Khandsari 580 130 2016
4 Hand made Paper 332 50 668
5 Forest Medicines (Ayurvedic) 342
6 Leather 2994 588 10202
7 Non-edible oil (Soap) 260 700 1914
8 Pottery 2645 1235 21 6497
9 Fibre 1664 302 1109 175
10 Lime 1025 130 9315
11 Fruit Preservation 20 565
12 Cottage match & Agarbati 197 30 97
13 Palmgur 670 26 123 939
14 Cane & Bamboo 2668 265 5789
15 Balack Smithy & Carpentry 3294 865 15018
16 Publicity and Publication 156
17 Brass copper 198 241
18 Service Industry 886 2 365 7147
19 Textile Industry 2672 357 7305
20 Lakh Bangles 428 249
21 Candle 60 401
22 Bee-Keeping
23 Electronics 70 53 980
24 Bhandar Marketing Outlets 70 80
25 P.C.P.1 363 139 9969
26 Jharu 18
27 Plastic
28 Milk Based Industries
29 Anind Fader
TOTAL 2303 330 6490 177
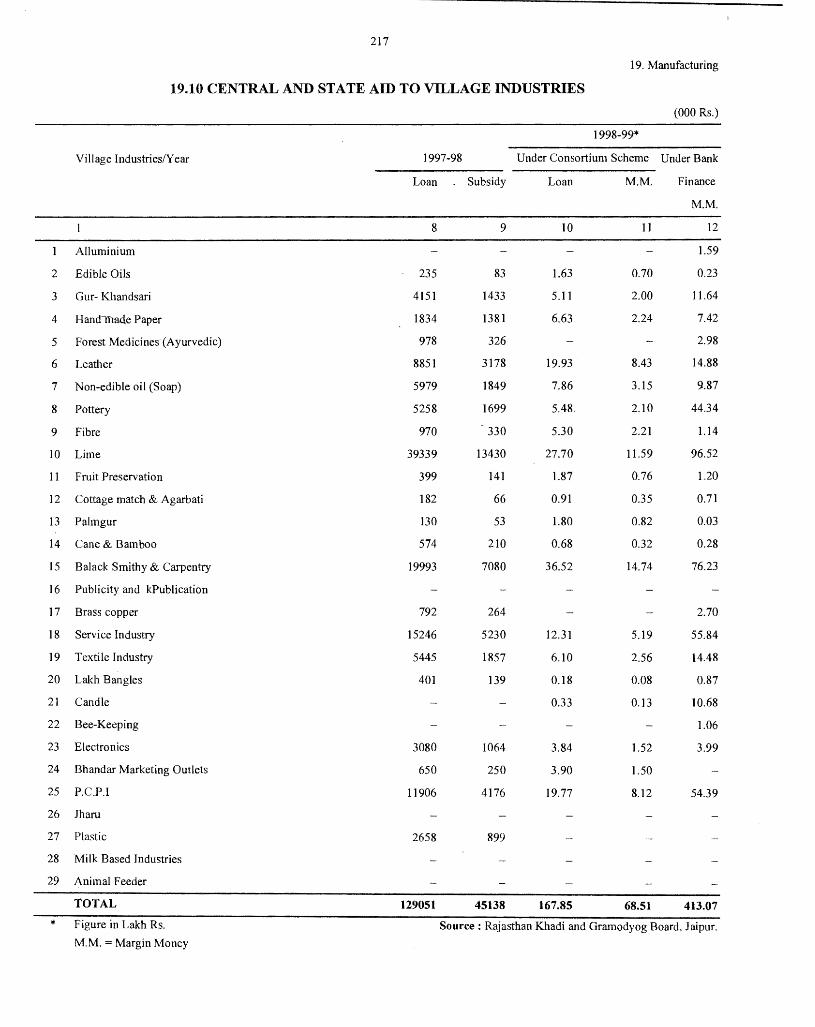
217
19. Manufacturing
19.10 CENTRAL AND STATE AID TO VILLAGE INDUSTRIES
(000 Rs.)
1998-99*
Village Industries/Year 1997-98 Under Consortium Scheme Under Bank
Loan Subsidy Loan M.M. Finance
M.M.
8 9 10 11 12
Alluminium 1.59
2 Edible Oils 235 83 1.63 0.70 0.23
3 Gur- Khandsari 4151 1433 5.11 2.00 11.64
4 Handmade Paper 1834 1381 6.63 2.24 7.42
5 Forest Medicines (Ayurvedic) 978 326 2.98
6 Leather 8851 3178 19.93 8.43 14.88
7 Non-edible oil (Soap) 5979 1849 7.86 3.15 9.87
8 Pottery 5258 1699 5.48. 2.10 44.34
9 Fibre 970 330 5.30 2.21 1.14
10 Lime 39339 13430 27.70 11.59 96.52
11 Fruit Preservation 399 141 1.87 0.76 1.20
12 Cottage match & Agarbati 182 66 0.91 0.35 0.71
13 Palmgur 130 53 1.80 0.82 0.03
14 Cane & Bamboo 574 210 0.68 0.32 0.28
15 Balack Smithy & Carpentry 19993 7080 36.52 14.74 76.23
16 Publicity and kPublication
17 Brass copper 792 264 2.70
18 Service Industry 15246 5230 12.31 5.19 55.84
19 Textile Industry 5445 1857 6.10 2.56 14.48
20 Lakh Bangles 401 139 0.18 0.08 0.87
21 Candle 0.33 0.13 10.68
22 Bee-Keeping 1.06
23 Electronics 3080 1064 3.84 1.52 3.99
24 Bhandar Marketing Outlets 650 250 3.90 1.50
25 P.C.P.I 11906 4176 19.77 8.12 54.39
26 Jharu
27 Plastic 2658 899
28 Milk Based Industries
29 Animal Feeder
TOTAL 129051 45138 167.85 68.51 413.07
* Figure in Lakh Rs. Source : Rajasthan Khadi and Grarnodyog Board, Jaipur.
M.M. Margin Money
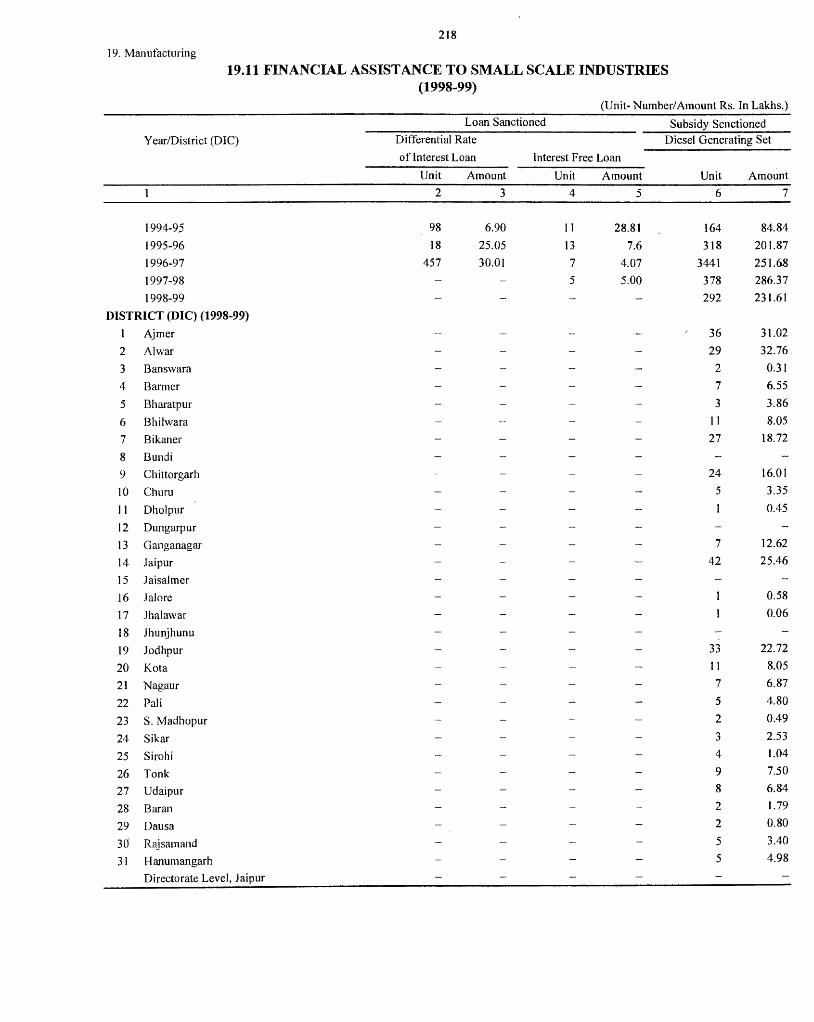
218
I 9. Manufacturing
19.11 FINANCIAL ASSISTANCE TO SMALL SCALE INDUSTRIES (1998-99)
Year/District (DIC)
1994-9.5
1995-96
1996-97
1997-98
1998-99
DISTRICT (DIC) (1998-99)
Ajmer
2 Al war
3 Banswara
4 Barmer
5 Bharatpur
6 Bhilwara
7 Bikaner
8 Bundi
9 Chittorgarh
IO Chum
11 Dholpur
12 Dungarpur
13 Ganganagar
14 Jaipur
15 Jaisalmer
16 Jal ore
17 Jhalawar
18 Jhu~jhunu
19 Jodhpur
20 Kota
21 Nagaur
22 Pali
23 S. Madhopur
24 Sikar
25 Sirohi
26 Tonk
27 Udaipur
28 Baran
29 Da.usa
30 Rajsamand
31 H anumangarh
Directorate Level, Jaipur
(Unit- Number/Amount Rs. In Lakhs.)
Loan Sanctioned Subsidy Senctioned Differential Rate Diesel Generating Set
of Interest Loan Interest Free Loan
Unit Amount Unit
2 3 4
98 6.90 I I
18 25.05 13 457 30.01 7
5
Amount
5
28.81
7.6
4.07
5.00
Unit Amount
6 7
164 84.84
318 201.87
3441 251.68
378 286.37
292 231.61
36 31.02
29 32.76
2 0.31
7 6.55
3 3.86
11 8.05
27 18.72
24 16.01
5 3.35
0.45
7 12.62
42 25.46
0.58
0.06
33 22.72
11 8.05
7 6.87
5 4.80
2 0.49
3 2.53
4 1.04
9 7.50
8 6.84
2 1.79
2 0.80
5 3.40
5 4.98
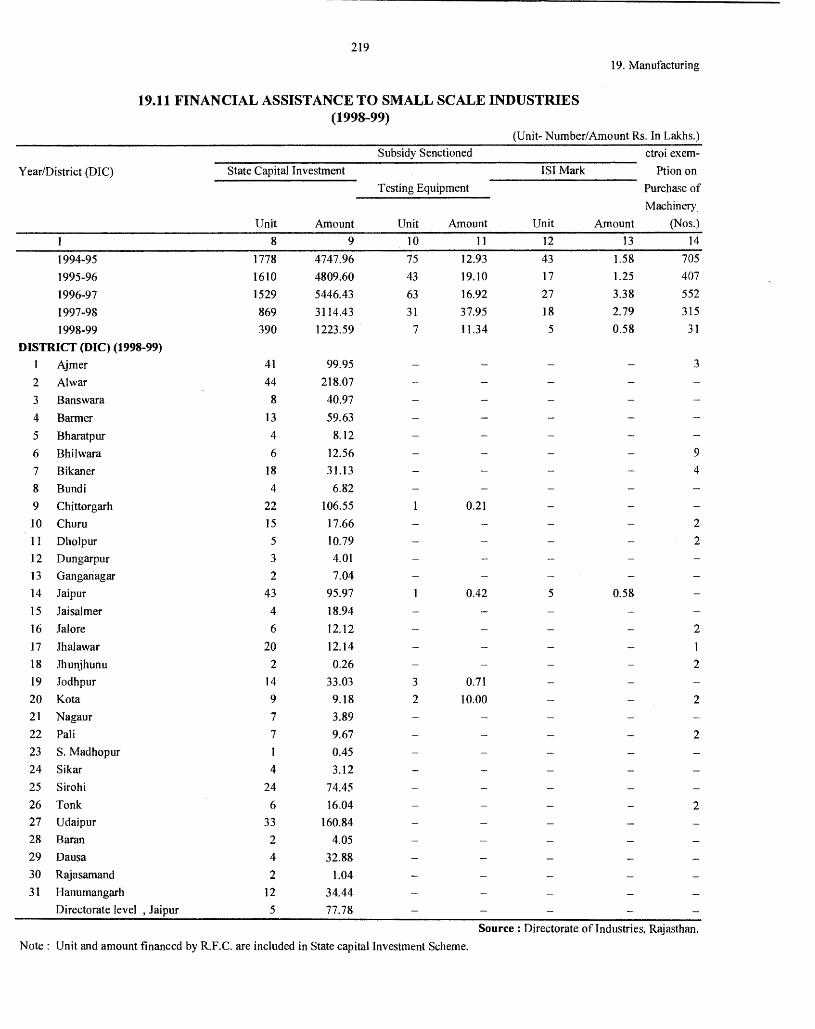
219
19. Manufacturing
19.11 FINANCIAL ASSISTANCE TO SMALL SCALE INDUSTRIES (1998-99)
(Unit- Number/Amount Rs. In Lakhs.)
Subsidy Senctioned ctroi exem-
Year/District (DIC) State Capital Investment ISi Mark Ption on
Testing Equipment Purchase of
Machinery_
Unit Amount Unit Amount Unit Amount (Nos.)
1 8 9 10 11 12 13 14
1994-95 1778 4747.96 75 12.93 43 1.58 705
1995-96 1610 4809.60 43 19.10 17 1.25 407
1996-97 1529 5446.43 63 16.92 27 3.38 552
1997-98 869 3114.43 31 37.95 18 2.79 315
1998-99 390 1223.59 7 I 1 .34 5 0.58 31
DISTRICT (DIC) (1998-99)
Aimer 41 99.95 3
2 Al war 44 218.07
3 Banswara 8 40.97
4 Barmer 13 59.63
5 Bharatpur 4 8.12
6 Bhilwara 6 12.56 9
7 Bikaner 18 31.13 4
8 Bundi 4 6.82
9 Chittorgarh 22 106.55 0.21
IO Churu 15 17.66 2
11 Dholpur 5 10.79 2
12 Dungarpur 3 4.01
13 Gangariagar 2 7.04
14 Jaipur 43 95.97 0.42 5 0.58
15 Jaisalmer 4 18.94
16 Jal ore 6 12. 12 2
17 Jhalawar 20 12. 14 1 18 Jhunjhunu 2 0.26 2
19 Jodhpur 14 33.03 3 0.71
20 Ko ta 9 9.18 2 10.00 2
21 Nagaur 7 3.89
22 Pali 7 9.67 2
23 S. Madhopur 0.45
24 Sikar 4 3.12
25 Sirohi 24 74.45
26 Tonk 6 16.04 2
27 Udaipur 33 160.84
28 Baran 2 4.05
29 Dausa 4 32.88
30 Rajasamand 2 l.04
31 Hanumangarh 12 34.44
Directorate level , Jaipur 5 77.78
Source : Directorate of Industries, Rajasthan.
Note: Unit and amount financed by R.F.C. are included in State capital Investment Scheme.
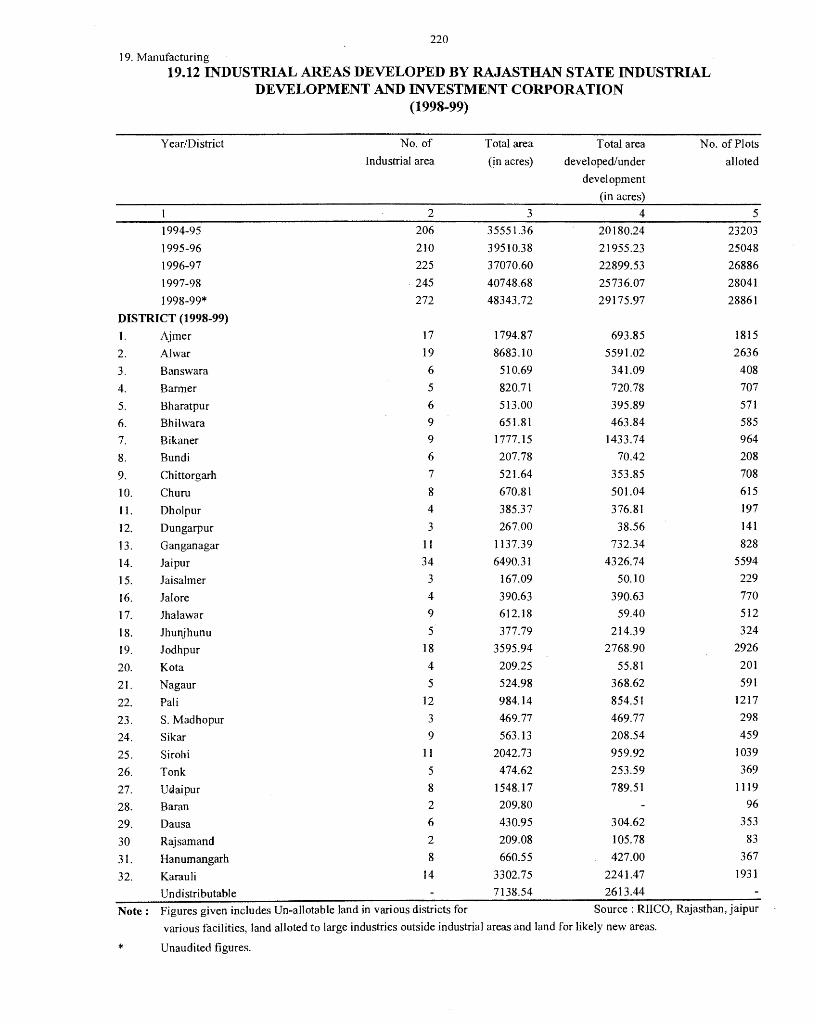
220
19. Manufacturing 19.12 INDUSTRIAL AREAS DEVELOPED BY RAJASTHAN STATE INDUSTRIAL
DEVELOPMENT AND INVESTMENT CORPORATION (1998-99)
Year/District No. of Total area Total area No. of Plots
Industrial area (in acres) developed/under a1Ioted
development
(in acres)
2 3 4 5
1994-95 206 35551.36 20180.24 23203
1995-96 210 39510.38 21955.23 25048
1996-97 225 37070.60 22899.53 26886
1997-98 245 40748.68 25736.07 28041
1998-99* 272 48343.72 29175.97 28861
DISTRICT (1998-99)
1. Ajmer 17 1794.87 693.85 1815
2. Al war 19 8683.10 5591.02 2636
3. Banswara 6 510.69 341.09 408
4. Barmer 5 820.71 720.78 707
5. Bharatpur 6 513.00 395.89 571
6. Bhilwara 9 651.81 463.84 585
7. Bikaner 9 1777.15 1433.74 964
8. Bundi 6 207.78 70.42 208
9. Chittorgarh 7 521.64 353.85 708
10. Churu 8 670.81 501.04 615
] I. Dholpur 4 385.37 376.81 197
12. Dungarpur 3 267.00 38.56 141
13. Ganganagar 11 1137.39 732.34 828
14. Jaipur 34 6490.31 4326.74 5594
15. Jaisalmer 3 167.09 50.10 229
16. Jal ore 4 390.63 390.63 770
17. Jhalawar 9 612.18 59.40 512
18. Jhunjhunu 5 377.79 214.39 324
19. Jodhpur 18 3595.94 2768.90 2926
20. Ko ta 4 209.25 55.81 201
21. Nagaur 5 524.98 368.62 591
22. Pali 12 984.14 854.51 1217
23. S. Madhopur 3 469.77 469.77 298
24. Sikar 9 563.13 208.54 459
25. Sirohi 11 2042.73 959.92 1039
26. Tonk 5 474.62 253.59 369
27. Ucfaipur 8 1548.17 789.51 1119
28. Baran 2 209.80 96
29. Dausa 6 430.95 304.62 353
30 Rajsamand 2 209.08 105.78 83
3 I. Hanumangarh 8 660.55 427.00 367
32. Karau Ii 14 3302.75 2241.47 1931
U ndistributable 7138.54 2613.44
Note: Figures given includes Un-allotable land in various districts for Source : RIICO, Rajasthan, jaipur
various facilities, land alloted to large industries outside industrial areas and land for likely new areas.
* Unaudited figures.
(20) ELECTRICITY AND POWER
The data on generation and.consumption of electricity relates to both private and public undertakings in the State and excludes Military, Factory and Railway power stations. Electricity generated covers the total power generation in the State through steam/gas and diesel. Electricity purchased covers both from non-electric utilies and hydel power from adjoining States. The Data is obtained from Rajasthan Rajya Widhyut Prasom Nigam Limited, Jaipur.
Table 20.6 relates to important physical achievements of Rajasthan energy development agency, Jaipur.
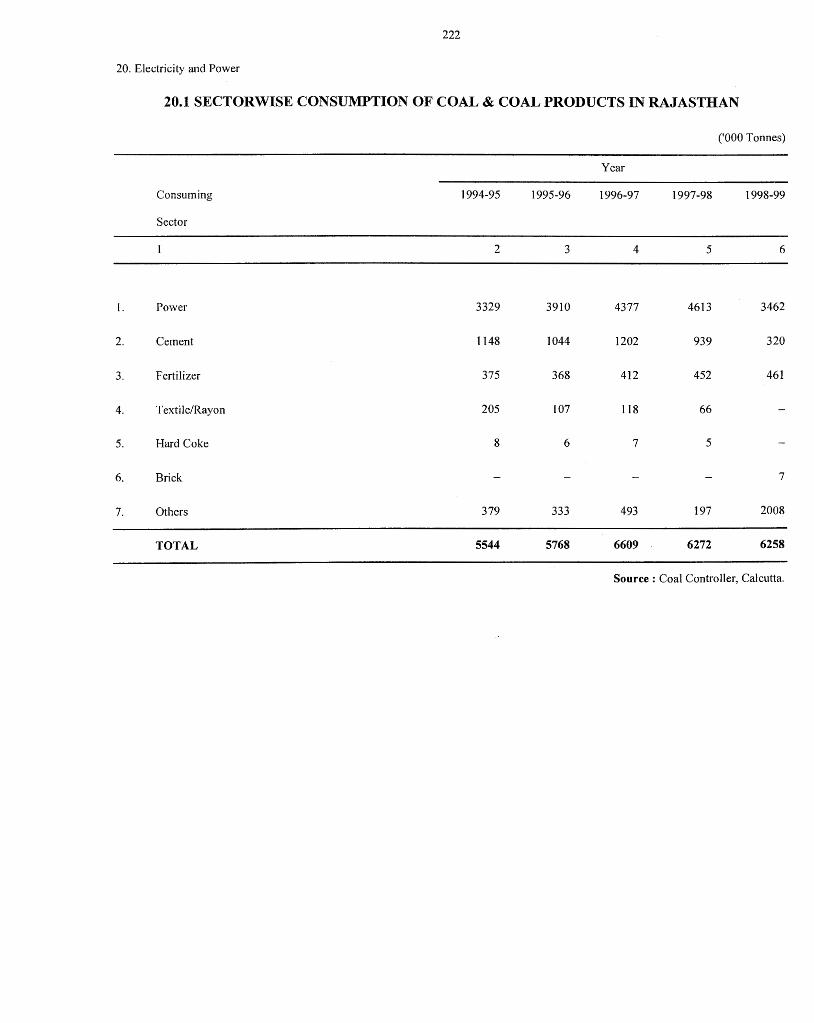
222
20. Electricity and Power
20.1 SECTORWISE CONSUMPTION OF COAL & COAL PRODUCTS IN RAJASTHAN
l.
2.
3.
4.
5.
6.
7.
Consuming
Sector
Power
Cement
Fertilizer
Textile/Rayon
Hard Coke
Brick
Others
TOTAL
1994-95 1995-96
2 3
3329 3910
1148 1044
375 368
205 107
8 6
379 333
5544 5768
('000 Tonnes)
Year
1996-97 1997-98 1998-99
4 5 6
4377 4613 3462
1202 939 320
412 452 461
118 66
7 5
7
493 197 2008
6609 6272 6258
Source: Coal Controller, Calcutta.
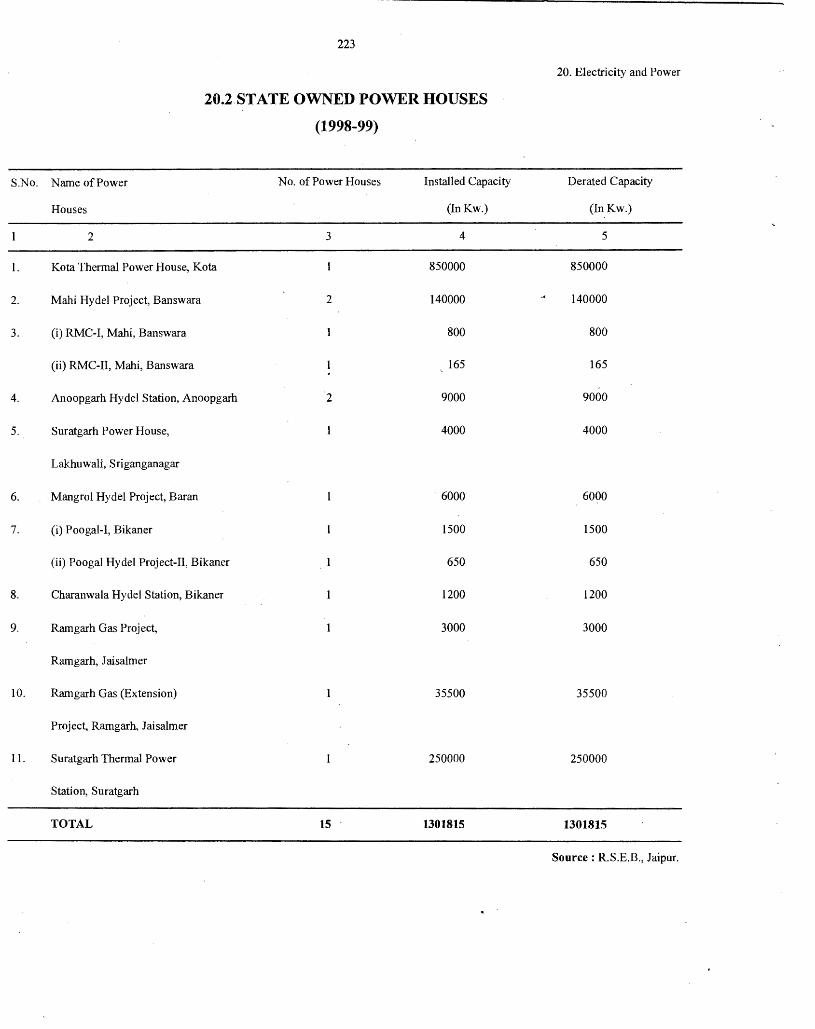
S.No.
1.
2.
3.
4.
5.
6.
7.
8.
9.
10.
11.
223
20.2STATE OWNED POWER HOUSES
(1998-99)
Name of Power No. of Power Houses Installed Capacity
Houses (In Kw.)
2 3 4
Kota Thermal Power House, Kota 850000
Mahi Hydel Project, Banswara 2 140000
(i) RMC-I, Mahi, Banswara 800
(ii) RMC-II, Mahi, Banswara 165
Anoopgarh Hydel Station, Anoopgarh 2 9000
Suratgarh Power House, 4000
Lakhuwali, Sriganganagar
Mangrol Hydel Project, Baran 6000
(i) Poogal-1, Bikaner 1500
(ii) Poogal Hydel Project-II, Bikaner 1 650
Charanwala Hydel Station, Bikaner 1200
Ramgarh Gas Project, 3000
Ramgarh, Jaisalmer
Ramgarh Gas (Extension) 35500
Project. Ramgarh, Jaisalmer
Suratgarh Thermal Power 250000
Station, Suratgarh
TOTAL 15 1301815
20. Electricity and Power
Derated Capacity
(In Kw.)
5
850000
140000
800
165
9000
4000
6000
1500
650
1200
3000
35500
250000
1301815
Source : R.S.E.B., Jaipur.
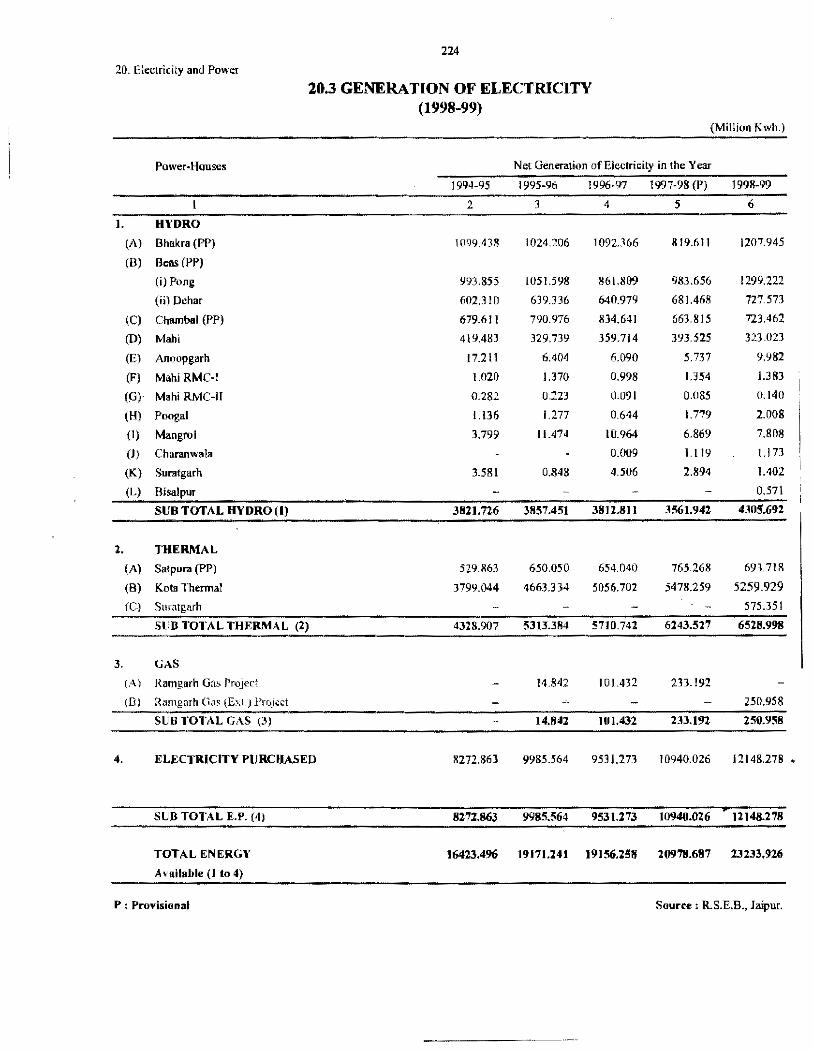
224
20. Electricity and Power
20.3 GENERATION OF ELECTRICITY
1.
(A)
(B)
(C)
(0)
(E)
(F)
(0)
(H)
(1)
(J)
(Kl
(L)
2.
(A)
(B)
fC)
3.
(A)
(Ill
4.
Power-Houses
HYDRO
Bhakra(PP)
Beas (PP)
(i) Pong
(ii) Dchar
Chambal (PP)
Mani
Anoopgarh
Mahi RMC-1
Mahi RMC-1!
Poogal
Mangrol
Charanwala
Suratgarh
Bisalpur
SUB TOTAL HYDRO (I)
THERMAL
Satpura (PP)
Kota Thermal
Suratgarh
st:B TOl'AL THERMAL (2)
GAS
Ramgarh Ga:i. Project
Rmngnrh Oas {E'\L) Project
SUB TOTAL GAS (3)
ELECTRICITY PURCHASED
SUB TOTAL E.P. (4)
TOTAL ENERGY
Available (1 to 4)
P : Provision;1f
(1998-99) (Million Kwh.)
Net Generation of Electricity in the Year
1994-95 1995-96 19%-97 1997-98 (P) 1998-99
2 3 4 5 6
\099.438 IQ24.206 1092366 819.611 1207.945
993.855 1()51.598 861.809 983.656 1299.222
602.3 !0 639.336 640.979 681.468 727.573
679.611 790.976 834.641 663.815 723.462
419.483 329.739 359.714 393.525 323.023
17.211 6.404 6.090 5.737 9.982
1.020 1.370 0.998 1.354 1.383
0.282 0.223 0.091 0.085 0.140
l.136 1.277 0.644 1.779 2.008
3.799 11.474 10964 6.869 7.808
0.009 l.l 19 l.l 73
3.581 0.848 4.506 2.894 1.402
0.571
3821.726 3857.451 3812.811 3561.942 4305.692
529.863 650.050 654.040 765268 693.718
3799.044 4663.334 5056.702 5478.259 5259.929
575.351
4328.907 5313.384 5710.742 6243.527 6528.998
14.842 101.432 233.192
250.958
14.842 101.432 233.192 250.958
8272.863 9985.564 9531.273 10940.026 12148.278 •
8271.863 9985.564 9531.273 10940.026 12148.278
16423.496 19171.241 19156.258 20978.687 23233.926
Source : R.S.E.B., Jaipur,
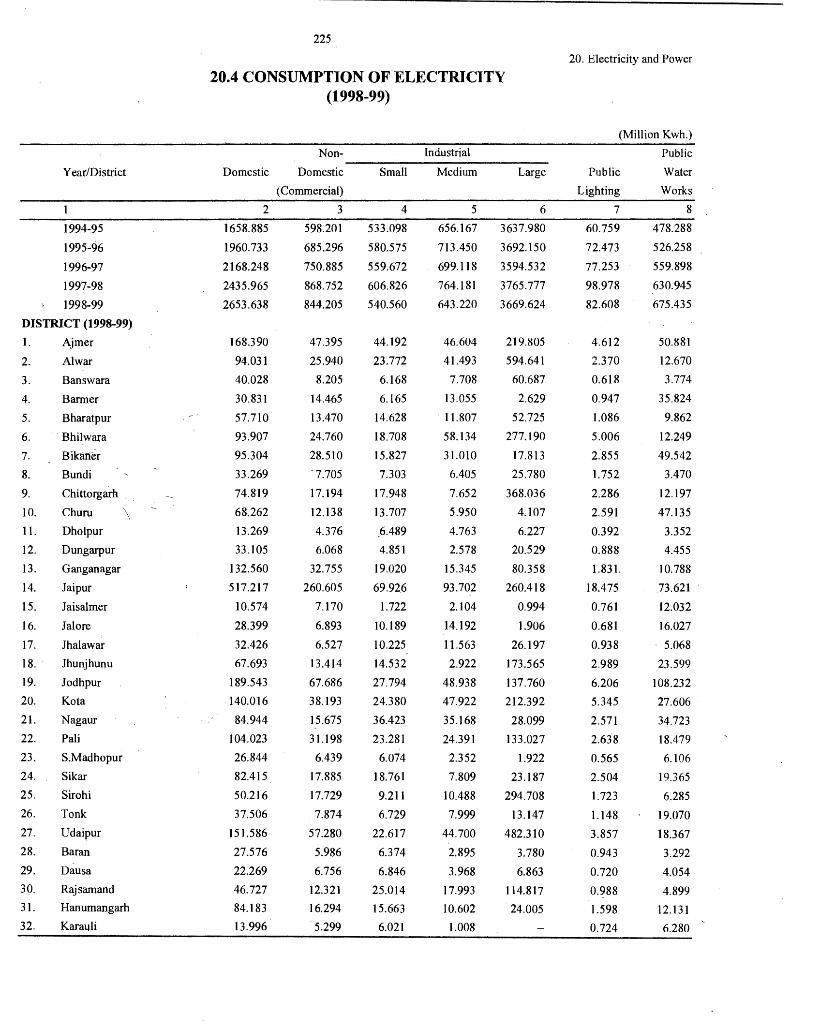
Year/District
1994-95
1995-96
1996-97
1997-98
1998-99
DISTRICT (1998-99)
1. Ajmer
2. Al war
3. Banswara
4. Barmer
5. Bharatpur
6. Bhilwara
7. Bikan~r
8. Bundi
9. Chittorgarh.
IO. Churu \
11. Dholpur
12. Dungarpur
13. Ganganagar
14. Jaipur
15. Jaisalmer
16. Jalore
17. Jhalawar
18. Jhunjhunu
19. Jodhpur
20. Ko ta
21.
22.
23.
24.
25.
26.
27.
28.
29.
30.
31.
32.
Nagaur
Pali
S.Madhopur
Sikar
Sirohi
Tonk
Udaipur
Baran
Dausa
Rajsamand
Hanumangarh
Karau Ii
225
20.4 CONSUMPTION OF ELECTRICITY (1998-99)
Non- Industrial ------------------------------------Domestic Domestic Small Medium Large
(Commercial)
2 3
1658.885 598.201
1960.733 685.296
2168.248 750.885
2435.965 868.752
2653.638 844.205
168.390
94.031
40.028
30.831
57.710
93.907
95.304
33.269
74.819
68.262
13.269
33.105
132.560
517.217
10.574
28.399
32.426
67.693
189.543 .
140.016
-84.944
104.023
26.844
82.415
50.216
37.506
151.586
27.576
22.269
46.727
84.183
13.996
47.395
25.940
8.205
14.465
13.470
24.760
28.510
-7.705
17.194
12.138
4.376
6.068
32.755
260.605
7.170
6.893
6.527
13.414
67.686
38.193
15.675
31.198
6.439
17.885
17.729
7.874
57.280
5.986
6.756
12.321
16.294
5.299
4
533.098
580.575
559.672
606.826
540.560
44.192
23.772
6.168
6.165
14.628
18.708
15.827
7.303
17.948
13.707
.6.489
4.851
19.020
69.926
1.722
10.189
10.225
14.532
27.794
24.380
36.423
23.281
6.074
18.761
9.211
6.729
22.617
6.374
6.846
25.014
15.663
6.021
5 6
656.167 3637.980
713.450 3692.150
699.118 3594.532
764.181 3765.777
643.220 3669.624
46.604
41.493
7.708
13.055
11.807
58.134
31.010
6.405
7.652
5.950
4.763
2.578
15.345
93.702
2.104
14.192
11.563
2.922
48.938
47.922
35.168
24.391
2.352
7.809
10.488
7.999
44.700
2.895
3.968
17.993
10.602
l.008
219.805
594.641
60.687
2.629
52.725
277.190
17.813
25.780
368.036
4.107
6.227
20.529
80.358
260.418
0.994
1.906
26.197
173.565
137.760
212.392
28.099
133.027
1.922
23.187
294.708
13.147
482.310
3.780
6.863
114.817
24.005
20. Electricity and Power
(Million Kwh.)
Public
Lighting
7
60.759
72.473
77.253
98.978
82.608
4.612
2.370
0.618
0.947
1.086
5.006
2.855
1.752
2.286
2.591
0.392
0.888
l.831.
18.475
0.761
0.681
0.938
2.989
6.206
5.345
2.571
2.638
0.565
2.504
1.723
1.148
3.857
0.943
0.720
0.988
1.598
0.724
Public
Water
Works
8
478.288
526.258
559.898
630.945
675.435
50.881
12.670
3.774
35.824
9.862
12.249
49.542
3.470
12.197
47.135
3.352
4.455
10.788
73.621
12.032
16.027
5.068
23.599
108.232
27.606
34.723
18.479
6.106
19.365
6.285
19.070
18.367
3.292
4.054
4.899
12.131
6.280
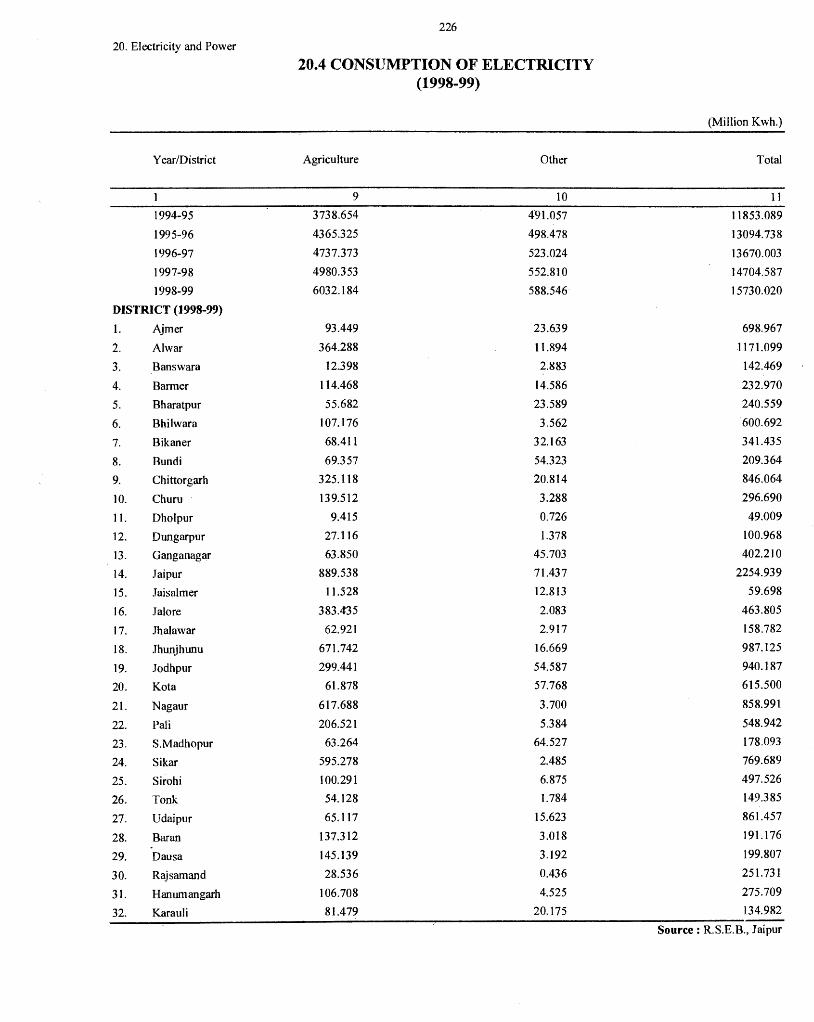
226
20. Electricity and Power
20.4 CONSUMPTION OF ELECTRICITY (1998-99)
(Million K wh.)
Year/District Agriculture Other Total
1 9 10 11
1994-95 3738.654 491.057 11853.089
1995-96 4365.325 498.478 13094.738
1996-97 4737.373 523.024 l3670.003
1997-98 4980.353 552.810 14704.587
1998-99 6032.184 588.546 15730.020
DISTRICT (1998-99)
1. Ajmer 93.449 23.639 698.967
2. Al war 364.288 11.894 1171.099
3. Banswara 12398 2.883 142.469
4. Barmer 114.468 14.586 232.970
5. Bharatpur 55.682 23.589 240.559
6. Bhilwara 107.176 3.562 600.692
7. Bikaner 68.411 32.163 341.435
8. Bundi 69.357 54.323 209.364
9. Chittorgarh 325.118 20.814 846.064
10. Chum 139.512 3.288 296.690
11. Dholpur 9.415 0.726 49.009
12. Dungarpur 27.116 1.378 100.968
13. Ganganagar 63.850 45.703 402.210
14. Jaipur 889.538 71.437 2254.939
15. .Taisalmer 11.528 12.813 59.698
16. .Tai ore 383.¢35 2.083 463.805
17. .Thalawar 62.921 2.917 158.782
18. Jhunjhunu 671.742 16.669 987.125
19. .Todhpur 299.441 54.587 940.187
20. Kota 61.878 57.768 615.500
21. Nagaur 617.688 3.700 858.991
22. Pali 206.521 5.384 548.942
23. S.Madhopur 63.264 64.527 178.093
24. Sikar 595.278 2.485 769.689
25. sifohi 100.291 6.875 497.526
26. Tonk 54.128 1.784 149.385
27. Udaipur 65. l 17 15.623 861.457
28. Baran 137.312 3.018 191.176
29. Dausa 145.139 3.192 199.807
30. Rajsamand 28.536 0.436 251.731
31. Hanumangarh 106.708 4.525 275.709
32. Karau Ii 81.479 20.175 134.982
Source: R.S.E.B., Jaipur
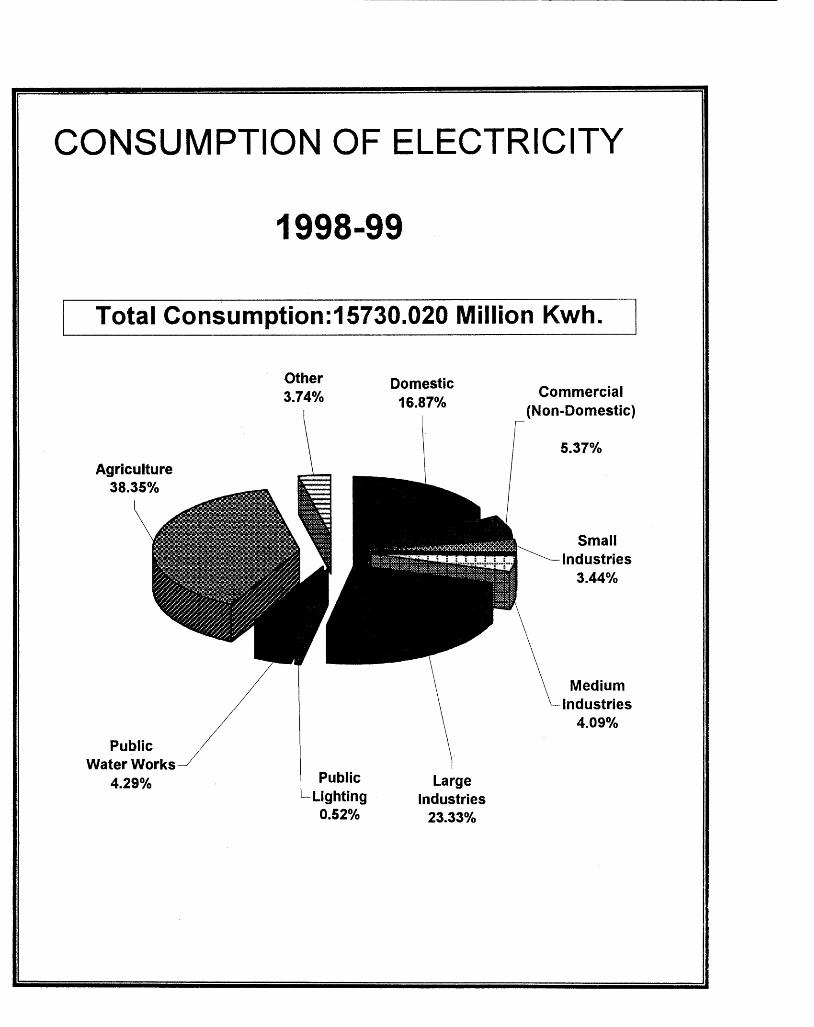
CONSUMPTION OF ELECTRICITY
1998-99
Total Consumption:15730.020 Million Kwh.
Agriculture 38.35%
Public Water Works
4.29%
-Other 3.74%
Public Lighting 0.52%
Domestic 16.87%
Large Industries
23.33%
Commercial (Non-Domestic)
r I 5.37%
Small Industries
3.44%
Medium Industries
4.09%
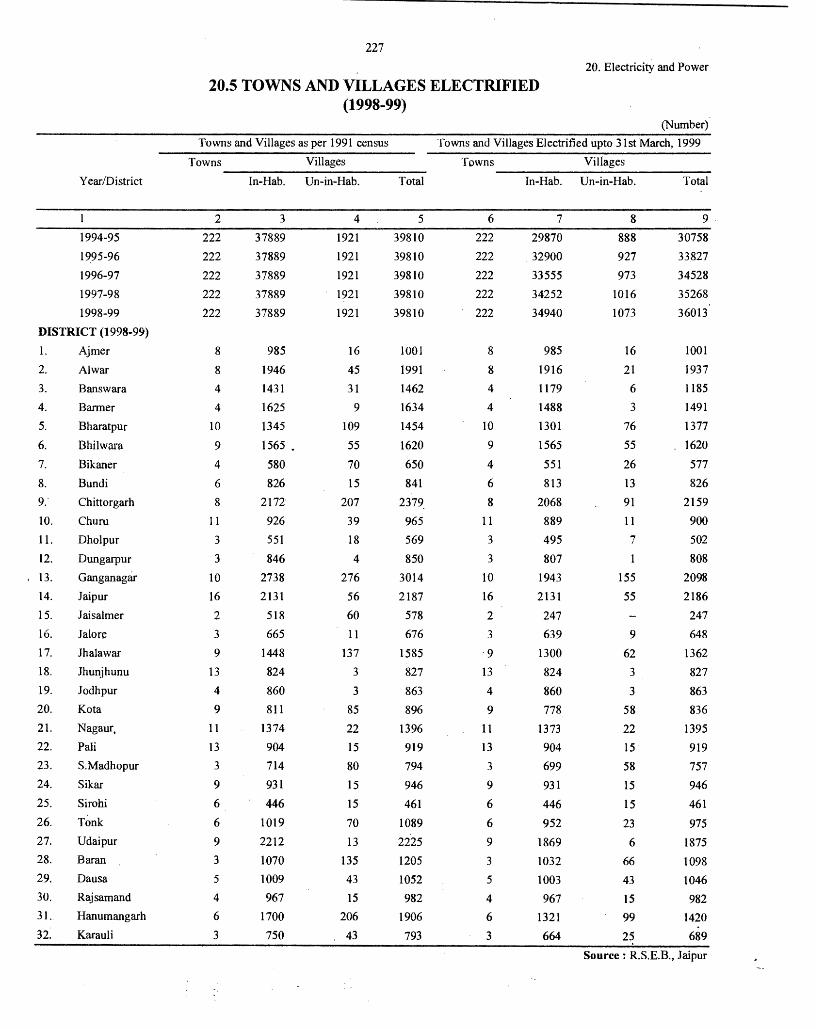
Year/District
1994-95
1995-96
1996-97
1997-98
1998-99
DISTRICT (1998-99)
1.
2.
3.
4.
5.
6.
7.
8.
9.·
10.
11.
12.
. 13.
14.
15.
16.
17.
18.
19.
20.
21.
22.
23.
24.
25.
26.
27.
28.
29.
30.
31.
32:
Ajmer
Al war
Banswara
Barmer
Bharatpur
Bhilwara
Bikaner
Bundi
Chittorgarh
Churn
Dholpur
Dungarpur
Ganganagar
Jaipur
Jaisalmer
Jal ore Jhalawar
Jhunjhunu
Jodhpur
Kota
Nagaur.
Pali
S.Madhopur
Sikar
Sirohi
Tonk
Udaipur
Baran
Dausa
Rajsamand
Hanumangarh
Karauli
227
20. Electricity and Power
20.5 TOWNS AND VILLAGES ELECTRIFIED (1998-99)
Towns and Villages as per 1991 census
Towns Villages
2
222
222
222
222
222
8
8
4
4
10
9
4
6 8
11
3
3
10
16
2
3
9
13
4
9
11
13
3
9
6
6
9
3
5
4
6
3
In-Hab. Un-in-Hab.
3
37889
37889
37889
37889
37889
985
1946
1431
1625
1345
1565 •
580
826
2172
926
551
846
2738
2131
518
665
1448
824
860
811
1374
904
714
931
446
1019
2212
1070
1009
967
1700
750
4
1921
1921
1921
1921
1921
16
45
31
9
109
55
70
15
207
39
18
4
276
56
60
11
137
3
3
85
22
15
80
15
15
70
13
135
43
15
206
43
Total
5
39810
39810
39810
39810
39810
1001
1991
1462
1634
1454
1620
650
841
2379.
965
569
850
3014
2187
578
676
1585
827
863
896
1396
919
794
946
461
1089
2225
1205
1052
982
1906
793
(Number)
Towns and Villages Electrified upto 31st March, 1999
Towns Villages
6
222
222
222
222
222
8
8
4
4
10
9
4
6
8
11
3
3
IO
16
2
3
·9
13
4
9
11
13
3
9
6
6
9
3
5
4
6
3
In-Hab. Un-in-Hab.
7
29870
32900
33555
34252
34940
985
1916
1179
1488
1301
1565
551
813
2068
889
495
807
1943
2131
247
639
1300
824
860
778
1373
904
699
931
446
952
1869
1032
1003
967
1321
664
8
888
927
973
1016
1073
16
21
6
3
76
55
26
13
91
11
7
1
155
55
9
62
3
3
58
22
15
58
15
15
23
6
66
43
15
99
25
Total
9.
30758
33827
34528
35268
36013
1001
1937
1185
1491
1377
1620
577
826
2159
900
502
808
2098
2186
247
648
1362
827
863
836
1395
919
757
946
461
975
1875
1098
1046
982
1420
689
Source : R.S.E.B., Jaipur
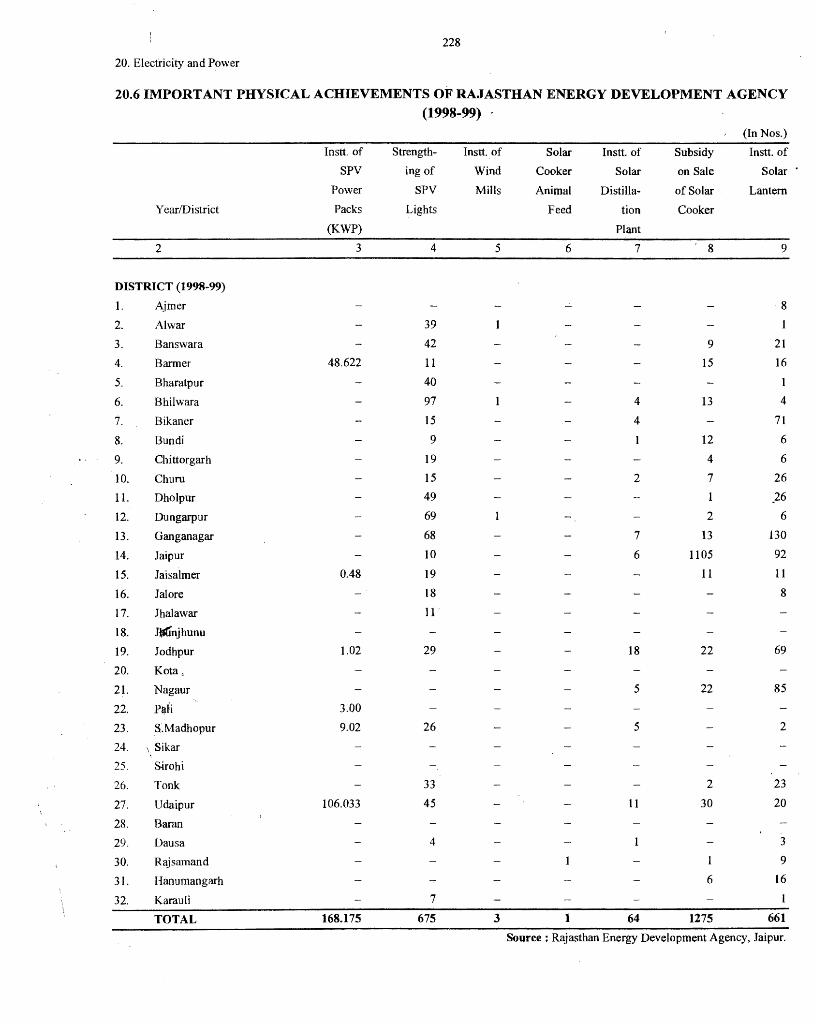
228
20. Electricity and Power
20.6 IMPORT ANT PHYSICAL ACHIEVEMENTS OF RAJASTHAN ENERGY DEVELOPMENT AGENCY (1998-99)
(In Nos.)
Instt of Strength- lnstt. of Solar Instt. of Subsidy Instt. of
SPV ingof Wind Cooker Solar on Sale Solar ·
Power SPV Mills Animal Distilla- of Solar Lantern
Year/District Packs Lights Feed ti on Cooker
(KWP) Plant
2 3 4 5 6 7 8 9
DISTRICT (1998-99)
1. Aimer 8
2. Al war 39
3. Banswara 42 9 21
4. Barmer 48.622 11 15 16
5. Bharatpur 40 l
6. Bhilwara 97 4 13 4
7. Bikaner 15 4 71
8. Bundi 9 12 6
9. Chittorgarh 19 4 6
IO. Chum 15 2 7 26
11. Dholpur 49 1 .26
12. Dungarpur 69 2 6
13. Ganganagar 68 7 13 130
14. Jaipur 10 6 1105 92
15. Jaisalmer 0.48 19 11 11
16. Jal ore 18 8
17. Jhalawar 11
18. Jt:finjhunu
19. Jodhpur l.02 29 18 22 69
20. Kota,
21. Nagaur 5 22 85
22. P~fi 3.00
23. KMadhopur 9.02 26 5 2
24. \ Sikar
25. Sirohi
26. Tonk 33 2 23
27. Udaipur 106.033 45 11 30 20
28. Baran
29. Dausa 4 3
30. Rajsamand 1 9
31. Hanumangarh 6 16
32. Karauli 7 1
TOTAL 168.175 675 3 1 64 1275 661
Source : Rajasthan Energy Development Agency, Jaipur.
(2l)TRADE
The trade statistics gives quantity (generally net weight i.e. exclusive of packing) of
certain commodities exported from the State of Rajasthan to other states and imported
from other states to Rajasthan. Data related to river and rail borne trade only and are
presented for the financial year (April to March). The figures are compiled by the
Director General of Commercial Intelligence Statistics, Ministry of Commerce and
Industry, Government of India, Calcutta and are published in the accounts relating to
the Inland (Rail and River borne) Trade oflndia.
These statistics are recorded on "Import basis" according to the Arrangement in
force, each of railway register such traffic-on-route to a destination on a different
railway station on the same or to a station on the system but located outside the trade
block. The imports into the station on the minor railway are recorded by the major
railway connecting them. The traffic carried partly by rail and partly by river, when
booked through and carried by steamers running in connection with railways, is to be
recorded generally by the railway administrative concerned.
Table 21.2 pertaining to Air-port wise inward and outward movement of cargo of
inland trade by air in Rnjnsthan.
-·--·~--------------
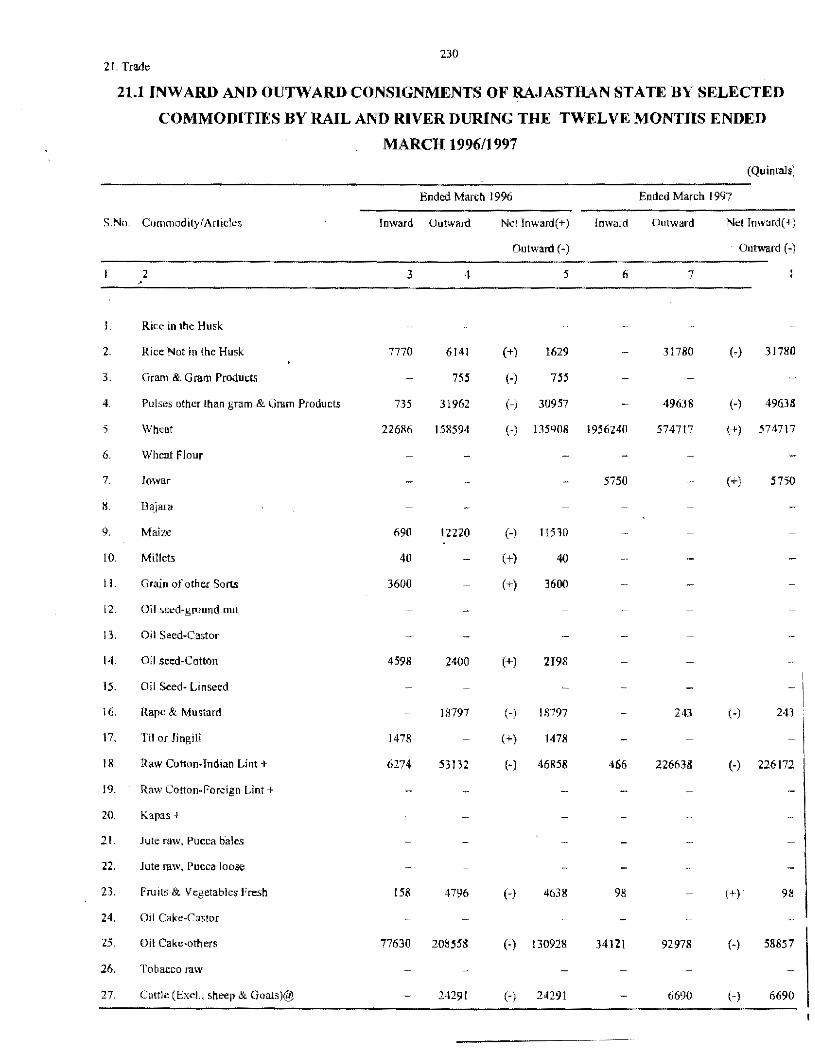
230 2L Trade
21.1 INWARD AND OU'l'WARD CONSIGNMENTS OF RAJASTHAN STATE BY SELECTED
COMMODITIES BY RAIL AND RIVER DURING THE TWELVE MONTHS ENDED
MARCH 1996/1997
(Quintals'.
Ended March 19% Ended March 1997
S.No. Comn1odity/Articles Jtt\Vard Outward Net Inward(+) Jn\vard Outward Net Inward(+)
Outward(-) Outward(-)
2 3 4 5 6 7 '
L Rice in the Husk
2. Rice Not in the Husk 7770 6141 (+) 1629 31780 H 31780
3. Gram & Gram Products 755 (-) 755
4. Pulses other than gram & Gram Products 735 31962 (-) 30957 49638 (-) 49638
5 \Vhcat 22686 158594 (-) 135908 1956240 574717 (+) 574717
6. Wheat Flour
7. Jo\var 5750 c~i 5750
8. Bajara
9. Maize 690 12220 (-) 1!530
10. Millets 40 H 40
11. Grain of other Sort.<; 3600 (-) 3600
12. Oil seed-ground nut
13. OH Seed-Castor
14. Oil seed-Cotton 4598 2400 (+) 2198 I
15. Oil Seed- Linseed -I 16. Rape & Mustard 18797 (-) 18797 243 (-) 243
17. Til or Jingili 1478 (+) 1478
18. Itaw Cotton~Indian Lint+ 6274 53132 (- J 46858 466 226638 (-) 226172
19. Ra\v Cotton"Foreign Lint+
20. Kapas+
21. Jute nl\V, Pucca bales
22. Jute ra\v, Pucca loose
23. Fruits & Vegetables Fresh 158 4796 (-) 4638 98 (+) 98
24. ()ii CakeMCastor
25. Oil Cake~others 77630 208558 (-) 130928 34121 92978 (-) 58857
26. Tobacco ra\v
27. Cuttle (Exel.. sheep & Goats)@ 24291 (-) 24291 6690 (-) 6690
·-·-··-
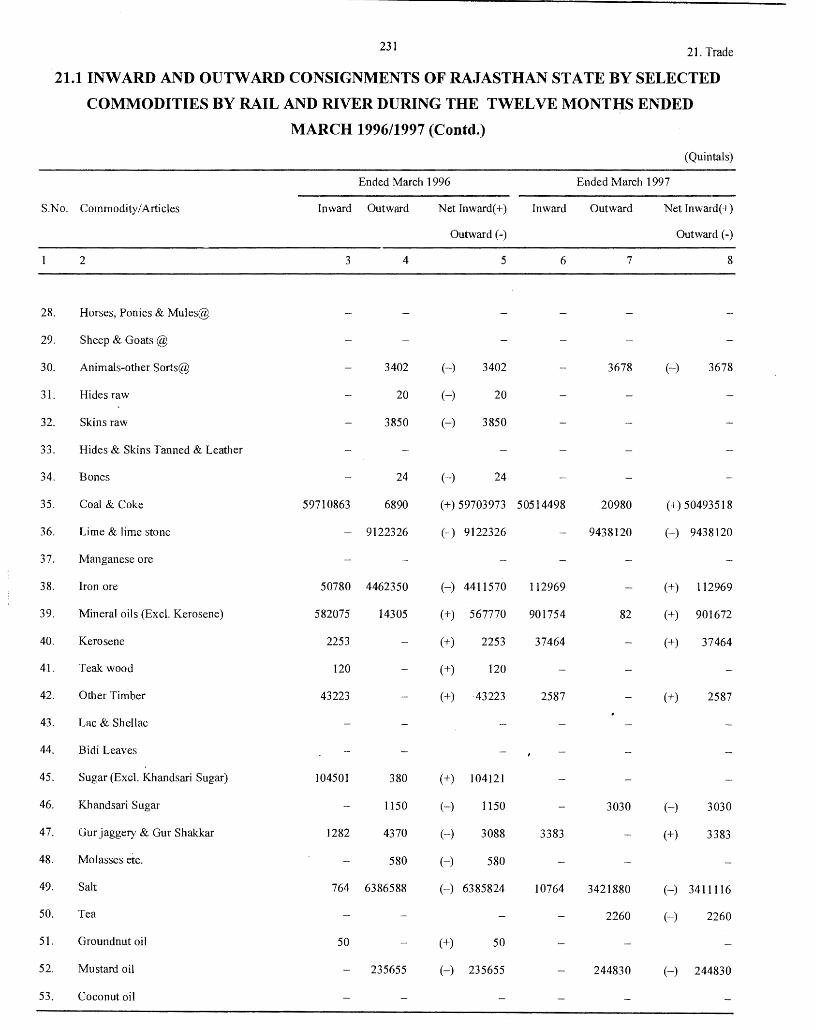
231 21. Trade
21.1 INWARD AND OUTWARD CONSIGNMENTS OF RAJASTHAN ST ATE BY SELECTED
COMMODITIES BY RAIL AND RIVER DURING THE TWELVE MONTHS ENDED
MARCH 1996/1997 (Contd.)
(Quintals)
Ended March 1996 Ended March 1997
S.No. Commodity/Articles Inward Outward Net Inward(+)
Outward(-)
Inward Outward Net Inward(+)
Outward(-)
2 3 4 5 6 7 8
28. Horses, Ponies & Mules@
29. Sheep & Goats @
30. Animals-other Sorts@ 3402 (-) 3402 3678 (-) 3678
31. Hides raw 20 (-) 20
32. Skins raw 3850 (-) 3850
33. Hides & Skins Tanned & Leather
34. Bones 24 (-) 24
35. Coal & Coke 59710863 6890 (+) 59703973 50514498 20980 (+) 50493518
36. Lime & lime stone - 9122326 (-) 9122326 9438120 (-) 9438120
37. Manganese ore
38. Iron ore 50780 4462350 (-) 4411570 112969 (+) 112969
39. Mineral oils (Exel. Kerosene) 582075 14305 (+) 567770 901754 82 (+) 901672
40. Kerosene 2253 (+) 2253 37464 (+) 37464
41. Teak wood 120 (+) 120
42. Other Timber 43223 (+) ·43223 2587 (+) 2587
43. Lac & Shellac
44. Bidi Leaves
45. Sugar (Exel. Khandsari Sugar) 104501 380 (+) 104121
46. Khandsari Sugar 1150 (-) 1150 3030 (-) 3030
47. Gur jaggery & Gur Shakkar 1282 4370 (-) 3088 3383 (+) 3383
48. Molasses etc. 580 (-) 580
49. Salt 764 6386588 (-) 6385824 10764 3421880 (-) 3411116
50. Tea 2260 (-) 2260
51. Groundnut oil 50 (+) 50
52. Mustard oil 235655 (-) 235655 244830 (-) 244830
53. Coconut oil
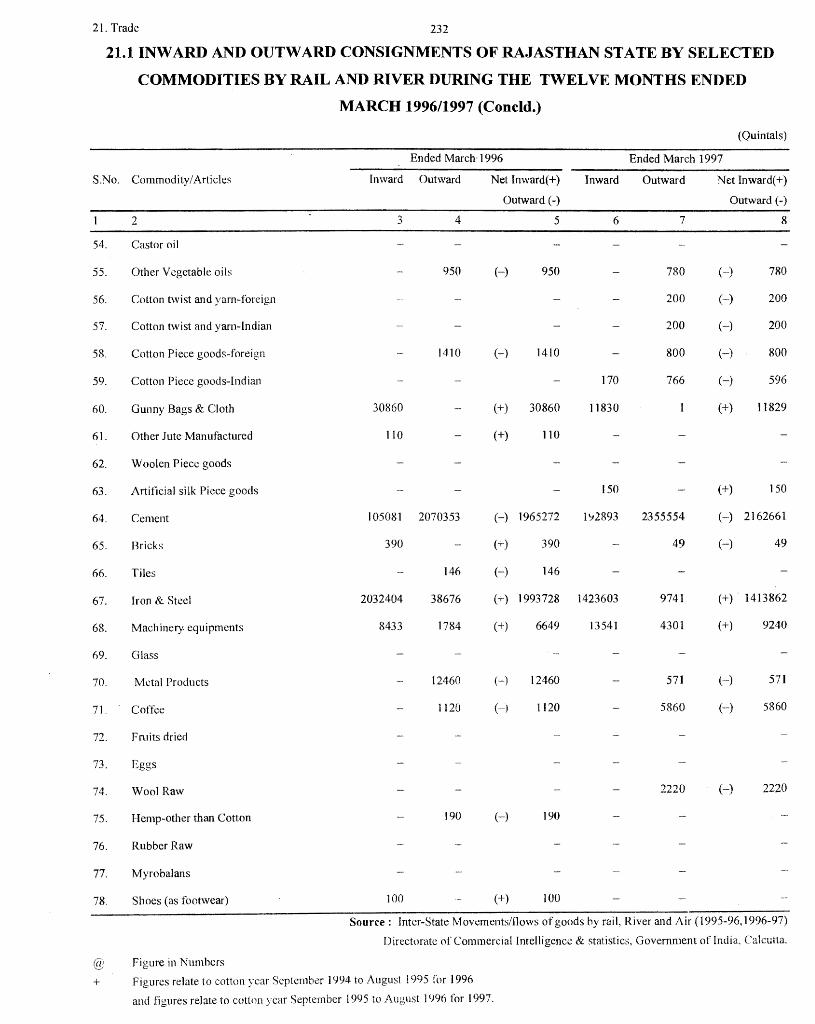
21. Trade 232
21.1 INWARD AND OUTWARD CONSIGNMENTS OF RAJASTHAN ST ATE BY SELECTED
COMMODITIES BY RAIL AND RIVER DURING THE TWELVE MONTHS ENDED
MARCH 1996/1997 (Concld.)
(Quintals)
Ended March· 1996 Ended March 1997
S.No. Commodity/ Articles Inward Outward Net Inward(+) Inward Outward Net Inward(+)
Outward(-) Outward(-)
2 3 4 5 6 7 8
54. Castor oil
55. Other Vegetable oils 950 (-) 950 780 (-) 780
56. Cotton twist and yarn-foreign 200 H 200
57. Cotton twist and yarn-Indian 200 (-) 200
58. Cotton Piece goods-foreign 1410 H 1410 800 H 800
59. Cotton Piece goods-Indian 170 766 (-) 596
60. Gunny Bags & Cloth 30860 (+) 30860 11830 (+) 11829
61. Other Jute Manufactured 110 (+) 110
62. Woolen Piece goods
63. Artificial silk Piece goods 150 (+) 150
64. Cement 105081 2070353 (-) 1965272 192893 2355554 (-) 2162661
65. Bricks 390 (+) 390 49 H 49
66. Tiles 146 (-) 146
67. Iron & Steel 2032404 38676 (+) 1993728 1423603 9741 (+). 1413862
68. Machinery. equipments 8433 1784 (+) 6649 13541 4301 (+) 9240
69. Glass
70. Metal Products 12460 H 12460 571 H 571
7L Coffee 1120 (-) 1120 5860 H 5860
72. Fmits dried
73. Eggs
74. Wool Raw 2220 H 2220
75. Hemp-other than Cotton 190 H 190
76. Rubber Raw
77. Myrobalans
78. Shoes (as footwear) 100 (+) 100
Source: Inter-State Movements/flows of goods by rail, River and Air (1995-96, 1996-97)
Directorate of Commercial Intelligence & statistics, Government of India, Calcutta.
@ Figure in Numbers
+ Figures relate to cotton year Septcmb.::r 1994 to August 1995 for 1996
and figures relate to cotton year September 1995 to 1996 for 1997.
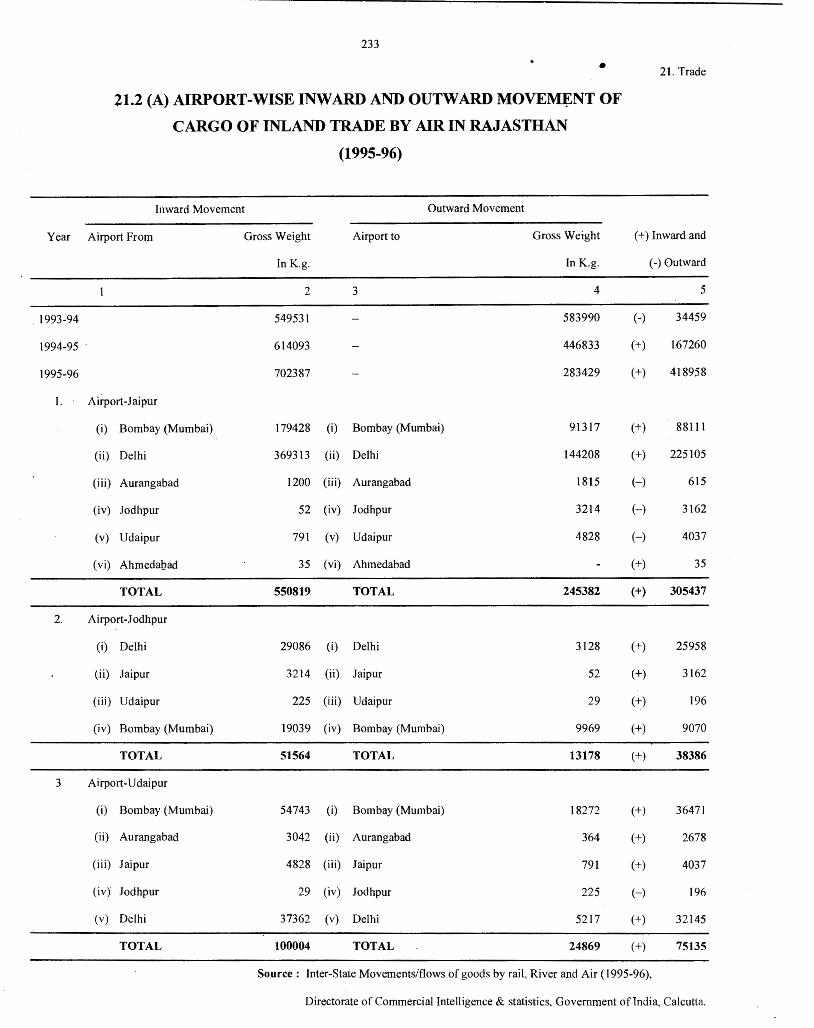
-Year
1993-94
1994-95 .
1995-96
I.
2.
3
233
•
21.2 (A) AIRPORT-WISE INWARD AND OUTWARD MOVEM~NT OF
CARGO OF INLAND TRADE BY AIR IN RAJASTHAN
(1995-96)
Inward Movement Outward Movement
Airport From Gross Weight Airport to Gross Weight
In Kg. In K.g.
2 3 4
549531 583990
614093 446833
702387 283429
Aifport-Jaipur
(i) Bombay (Mumbai) 179428 (i) Bombay (Mumbai) 91317
(ii) Delhi 369313 (ii) Delhi 144208
(iii) Aurangabad 1200 (iii) Aurangabad 1815
(iv) Jodhpur 52 (iv) Jodhpur 3214
(v) Udaipur 791 (v) Udaipur 4828
(vi) Ahmedabad 35 (vi) Ahmedabad
TOTAL 550819 TOTAL 245382
Airport-.Todhpur
(i) Delhi 29086 (i) Delhi 3128
(ii) Jaipur 3214 (ii) Jaipur 52
(iii) Udaipur 225 (iii) Udaipur 29
(iv) Bombay (Mumbai) 19039 (iv) Bombay (Mumbai) 9969
TOTAL 51564 TOTAL 13178
Airport-Udaipur
(i) Bombay (Mumbai) 54743 (i) Bombay (Mumbai) 18272
(ii) Aurangabad 3042 (ii) Aurangabad 364
(iii) Jaipur 4828 (iii) Jaipur 791
(iv) .Jodhpur 29 (iv) Jodhpur 225
(v) Delhi 37362 (v) Delhi 5217
TOTAL 100004 TOTAL 24869
21. Trade
( +) Inward and
(-)Outward
5
(-) 34459
(+) 167260
(+) 418958
(+) 88111
(+) 225105
(-) 615
(-) 3162
(-) 4037
(+) 35
(+) 305437
(+) 25958
(+) 3162
(+) 196
(+) 9070
(+) 38386
(+) 36471
(+) 2678
(+) 4037
(-) 196
(+) 32145
(+) 75135
Source : Inter-State Movements/flows of goods by rail, River and Air ( 1995-96),
Directorate of Commercial Intelligence & statistics, Government oflndia, Calcutta.
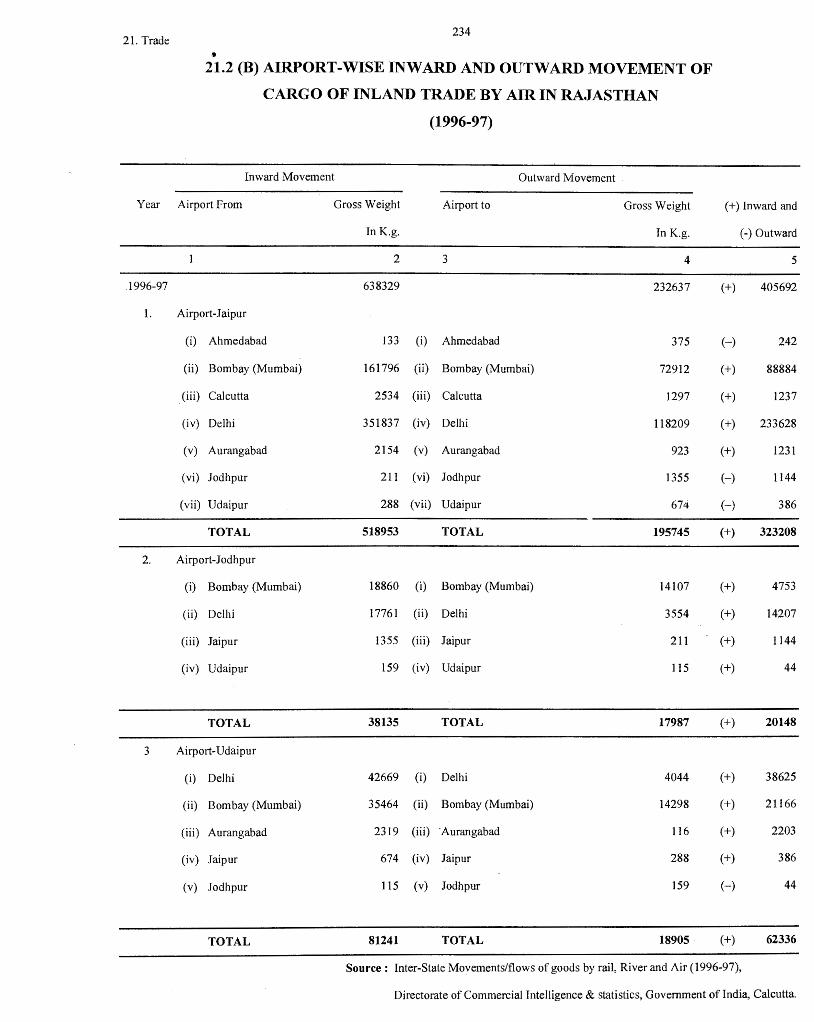
21. Trade
Year
1996-97
1.
2.
3
234
21.2 (B) AIRPORT-WISE INWARD AND OUTWARD MOVEMENT OF
CARGO OF INLAND TRADE BY AIR IN RAJASTHAN
(1996-97)
Inward Movement Outward Movement .
Airport From Gross Weight Airport to Gross Weight
In K.g. In K.g.
2 3 4
638329 232637
Airport-Jaipur
(i) Ahmedabad 133 (i) Ahmedabad 375
(ii) Bombay (Mumbai) 161796 (ii) Bombay (Mumbai) 72912
(iii) Calcutta 2534 (iii) Calcutta 1297
(iv) Delhi 351837 (iv) Delhi 118209
(v) Aurangabad 2154 (v) Aurangabad 923
(vi) Jodhpur 211 (vi) Jodhpur 1355
(vii) Udaipur 288 (vii) Udaipur 674
TOTAL 518953 TOTAL 195745
Airport-J odhpur
(i) Bombay (Mumbai) 18860 (i) Bombay (Mumbai) 14107
(ii) Delhi 17761 (ii) Delhi 3554
(iii) Jaipur 1355 (iii) Jaipur 211
(iv) Udaipur 159 (iv) Udaipur I 15
TOTAL 38135 TOTAL 17987
Airport-Udaipur
(i) Delhi 42669 (i) Delhi 4044
(ii) Bombay (Mumbai) 35464 (ii) Bombay (Mumbai) 14298
(iii) Aurangabad 2319 (iii) Aurangabad 116
(iv) Jaipur 674 (iv) Jaipur 288
(v) .Todhpur 115 (v) Jodhpur 159
TOTAL 81241 TOTAL 18905
( +) Inward and
(-)Outward
5
(+) 405692
(-) 242
(+) 88884
(+) 1237
(+) 233628
(+) 1231
(-) 1144
(-) 386
(+) 323208
(+) 4753
(+) 14207
(+) I 144
(+) 44
(+) 20148
(+) 38625
(+) 21166
(+) 2203
(+) 386
(-) 44
(+) 62336
Source: Inter-State Movements/flows of goods by rail, River and Air (1996-97),
Directorate of Commercial Intelligence & statistics, Government of India, Calcutta.
(22) TRANSPORT
ROADS - The data contained in the table relates to the roads maintained by
Public Works Department only and does not include road maintained by local bodies
and others. This However includes national highways, through they are under the
direct control of the C.P.W.D., Government oflndia.
TRANSPORT - Data on Motor vehicles and road accidents are collected directly
by the Directorate of Economics and Statistics, Rajasthan from the offices of the
Director of Transport and Superintendent of Police, C.l.D. Rajasthan Respectively.
The information on road transport routes nationalised has been given by the Rajasthan
State Road Transport Corporation.
RAILWAYS - Table No. 22.5 relates with zone-wise Railway gauge in Rajasthan
State. The Indian Railways are also classified by Gauges as Broad (1.676m.), Metre ,./ (l.OOOm.) and Narrow (0.762 m. & 0.610m.) according to the minimum distance
between two rails i.n metres mentioned in brackets.
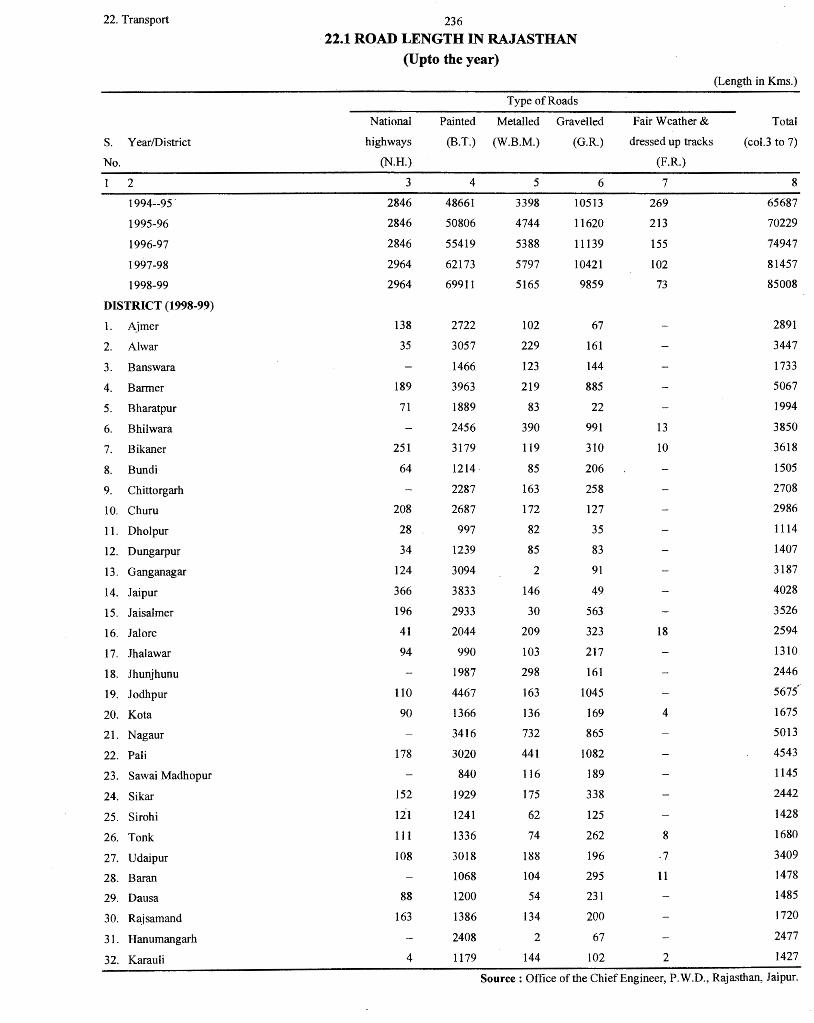
22. Transport
S. Year/District
No.
2
1994--95
1995-96
1996-97
1997-98
1998-99
DISTRICT (1998-99)
1. Ajmer
2. Alwar
3. Banswara
4. Barmer
5. Bharatpur
6. Bhilwara
7. Bikaner
8. Bundi
9. Chittorgarh
10. Churu
11. Dholpur
12. Dungarpur
13. Ganganagar
14. Jaipur
15. Jaisalmer
16. Jalore
17. Jhalawar
18. Jhunjhunu
19. Jodhpur
20. Kota
21. Nagaur
22. Pali
23. Sawai Madhopur
24. Sikar
25. Sirohi
26. Tonk
27. Udaipur
28. Baran
29. Dausa
30. Rajsamand
31. Hanumangarh
32. Karauli
236
22.1 ROAD LENGTH IN RAJASTHAN
(Upto the year)
National
highways
(N.H.)
3
2846
2846
2846
2964
2964
138
35
189
71
251
64
208
28
34
124
366
196
41
94
110
90
178
152
12°1
111
108
88
163
4
Painted
(B.T.)
4
48661
50806
55419
62173
69911
2722
3057
1466
3963
1889
2456
3179
1214
2287
2687
997
1239
3094
3833
2933
2044
990
1987
4467
1366
3416
3020
840
1929
1241
1336
3018
1068
1200
1386
2408
1179
Type of Roads
Metalled Gravelled
(W.B.M.) (G.R.)
5 6
3398 10513
4744 11620
5388 11139
5797 10421
5165 9859
102
229
123
219
83
390
119
85
163
172
82
85
2
146
30
209
103
298
163
136
732
441
116
175
62
74
188
104
54
134
2
144
67
161
144
885
22
991
310
206
258
127
35
83
91
49
563
323
217
161
1045
169
865
1082
189
338
125
262
196
295
231
200
67
102
Fair Weather &
dressed up tracks
(F.R.)
7
269
213
155
102
73
13
10
18
4
8
.7
11
2
(Length in Kms.)
Total
(col.3 to 7)
8
65687
70229
74947
81457
85008
2891
3447
1733
5067
1994
3850
3618
1505
2708
2986
1114
1407
3187
4028
3526
2594
1310
2446
5675"
1675
5013
4543
1145
2442
1428
1680
3409
1478
1485
1720
2477
1427
Source: Office of the Chief Engineer, P.W.D., Rajasthan, Jaipur.
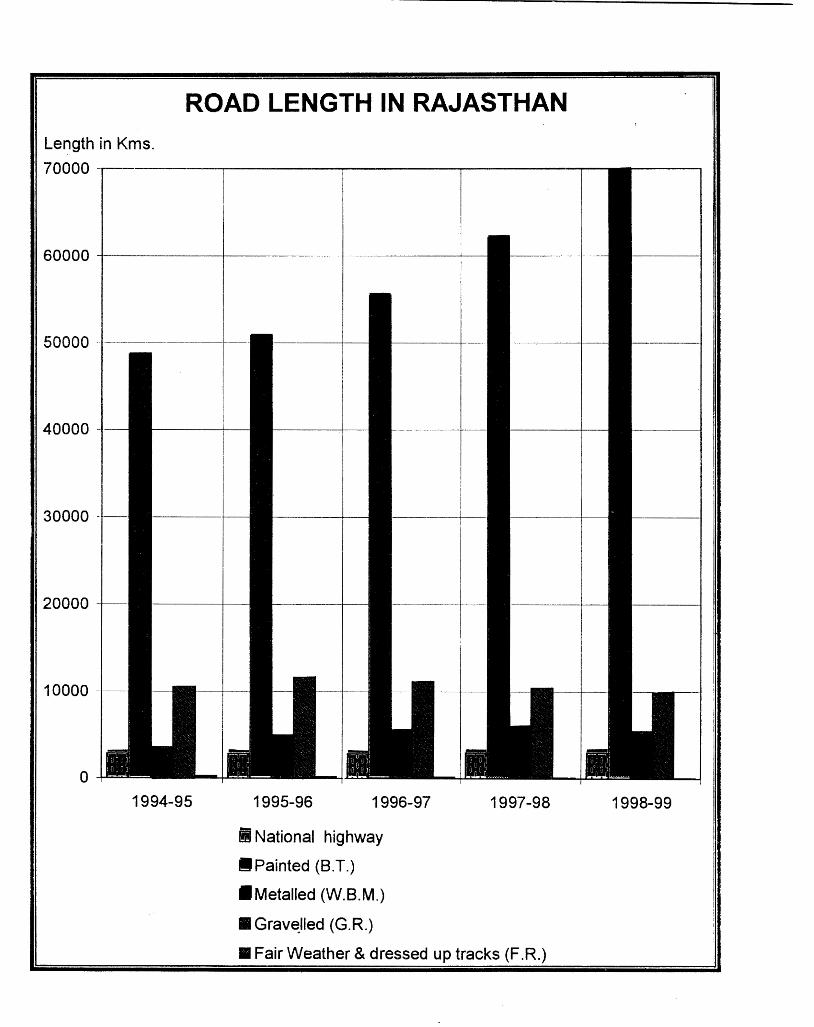
ROAD LENGTH IN RAJASTHAN
Length in Kms. 70000---~~~~..--~~~---..~~~~--.,.-~~~~~-
60000 -t-------l---------+------+--
I 50000 ____________ _L __
40000
30000 --
20000
10000 --
0
I
1994-95 1995-96 1996-97
fl National highway
II Painted (8.T.)
•Metalled (W.B.M.)
• Grav~lled (G.R.)
1997-98
•Fair Weather & dressed up tracks (F.R.)
1998-99
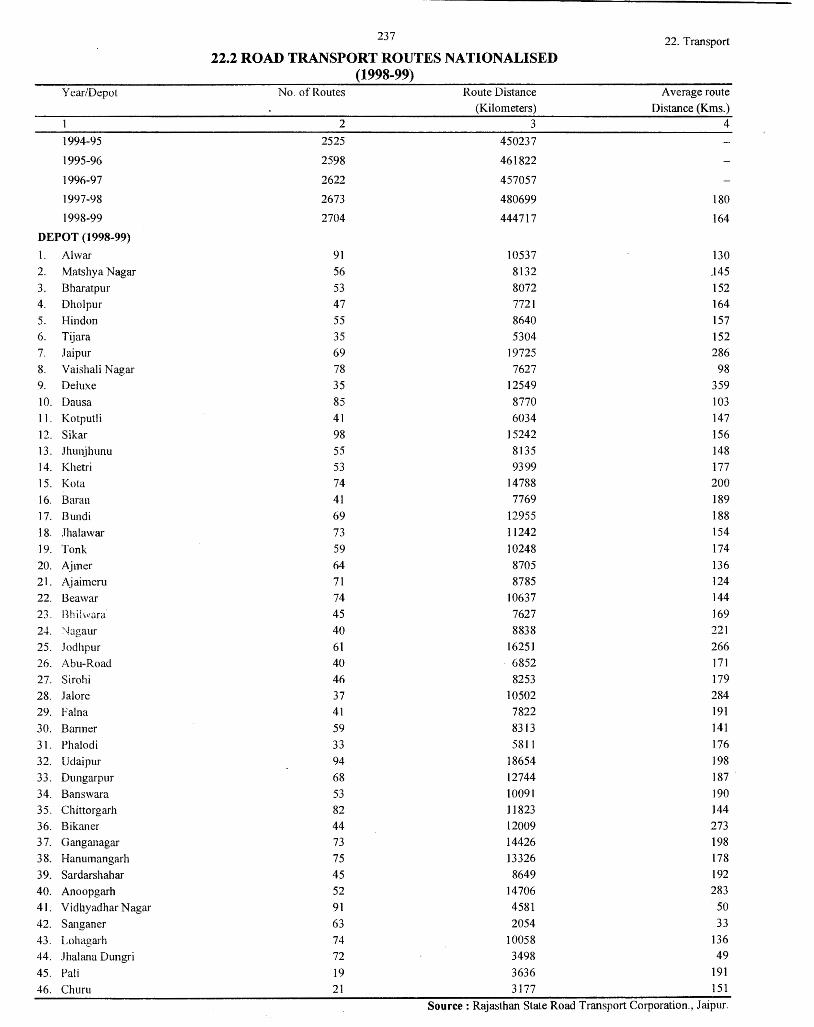
237 22. Transport
22.2 ROAD TRANSPORT ROUTES NATIONALISED (1998-99)
Year/Depot No. of Routes Route Distance Average route
(Kilometers) Distance (Kms.) 1 2 3 4
1994-95 2525 450237
1995-96 2598 461822
1996-97 2622 457057
1997-98 2673 480699 180
1998-99 2704 444717 164
DEPOT (1998-99)
l. Al war 91 10537 130
2. Matshya Nagar 56 8132 .145
3. Bharatpur 53 8072 152
4. Dholpur 47 7721 164
5. Hindon 55 8640 157
6. Tijara 35 5304 152
7. Jaipur 69 19725 286
8. Vaishali Nagar 78 7627 98
9. Deluxe 35 12549 359
IO. Dausa 85 8770 103
11. Kotputli 41 6034 147
12. Sikar 98 15242 156
13. Jhunjhunu 55 8135 148
14. Khetri 53 9399 177
15. Ko ta 74 14788 200
16. Baran 41 7769 189
17. Bundi 69 12955 188
18. Jhalawar 73 11242 154
19. Tonk 59 10248 174
20. Ajmer 64 8705 136
21. Ajaimeru 71 8785 124
22. l3eawar 74 10637 144
23. Bhiiwara 45 7627 169
24. ~'fagaur 40 8838 221
25. .Jodhpur 61 16251 266
26. Abu-Road 40 . 6852 171
27. Sirohi 46 8253 179
28. .Tai ore 37 10502 284
29. Faina 41 7822 191
30. Banner 59 8313 141
31. Phalodi 33 5811 176
32. Udaipur 94 18654 198
33. Dungarpur 68 12744 187 .
34. Banswara 53 10091 190
35. Chittorgarh 82 11823 144
36. Bikaner 44 12009 273
37. Ganganagar 73 14426 198
38. Hanumangarh 75 13326 178
39. Sardarshahar 45 8649 192
40. Anoopgarh 52 14706 283
41. Vidhyadhar Nagar 91 4581 50
42. Sanganer 63 2054 33
43. Lohagarh 74 10058 136
44. Jhalana Dungri 72 3498 49
45. Pali 19 3636 191
46. Chum 21 3177 151
Source : Rajasthan State Road Transport Corporation., Jaipur.
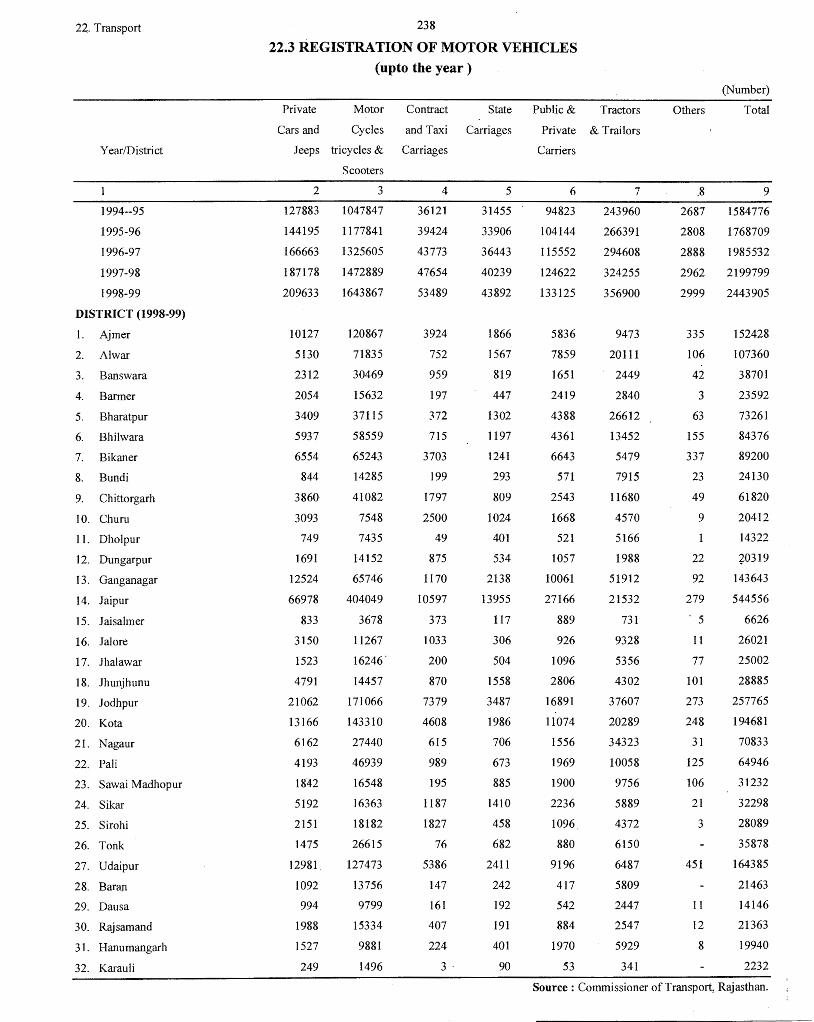
22. Transport
Year/District
1994--95
1995-96
1996-97
1997-98
1998-99
DISTRICT (1998-99)
1. Ajmer
2. Alwar
3. Banswara
4. Barmer
5. Bharatpur
6. Bhilwara
7. Bikaner
8. Bundi
9. Chittorgarh
IO. Churn
11. Dholpur
12. Dungarpur
13. Ganganagar
14. Jaipur
15. Jaisalm er
16. Jalore
17. Jhalawar
18. Jhunjhunu
19. Jodhpur
20. Kota
21. Nagaur
22. Pali
23. SawaiMadhopur
24. Sikar
25. Sirohi
26. Tonk
27. Udaipur
28. Baran
29. Dausa
30. Rajsamand
31. Hanumangarh
32. Karauli
238
22.3 REGISTRATION OF MOTOR VEIDCLES (upto the year)
Private
Cars and
Motor
Cycles
Contract State
and Taxi Carriages
Jeeps tricycles & Carriages
Scooters
2
127883
144195
166663
187178
209633
10127
5130
2312
2054
3409
5937
6554
844
3860
3093
749
1691
12524
66978
833
3150
1523
4791
21062
13166
6162
4193
1842
5192
2151
1475
12981.
1092
994
1988
1527
249
3
1047847
1177841
1325605
1472889
1643867
120867
71835
30469
15632
37115
58559
65243
14285
41082
7548
7435
14152
65746
404049
3678
11267
16246'
14457
171066
143310
27440
46939
16548
16363
18182
26615
127473
13756
9799
15334
9881
1496
4
36121
39424
43773
47654
53489
3924
752
959
197
372
715
3703
199
1797
2500
49
875
1170
10597
373
1033
200
870
7379
4608
615
989
195
1187
1827
76
5386
147
161
407
224
3-
5
31455
33906
36443
40239
43892
1866
1567
819
447
1302
1197
1241
293
809
1024
401
534
2138
13955
117
306
504
1558
3487
1986
706
673
885
1410
458
682
2411
242
192
191
401
90
Public & Tractors
Private & Traitors
Carriers
6
94823
104144
115552
124622
133125
5836
7859
1651
2419
4388
4361
6643
571
2543
1668
521
1057
10061
27166
889
926
1096
2806
16891
11074
1556
1969
1900
2236
1096
880
9196
417
542
884
1970
53
7
243960
266391
294608
324255
356900
9473
20111
2449
2840
26612
13452
5479
7915
11680
4570
5166
1988
51912
21532
731
9328
5356
4302
37607
20289
34323
10058
9756
5889
4372
6150
6487
5809
2447
2547
5929
341
(Number)
Others Total
.8 9
2687 1584776
2808 1768709
2888 1985532
2962 2199799
2999 2443905
335
106
42
3
63
155
337
23
49
9
22
92
279
' 5
11
77
101
273
248
31
125
106
21
3
451
11
12
8
152428
107360
38701
23592
73261
84376
89200
24130
61820
20412
14322
+0319
143643
544556
6626
26021
25002
28885
257765
194681
70833
64946
31232
32298
28089
35878
164385
21463
14146
21363
19940
2232
Source: Commissioner of Transport, Rajasthan.
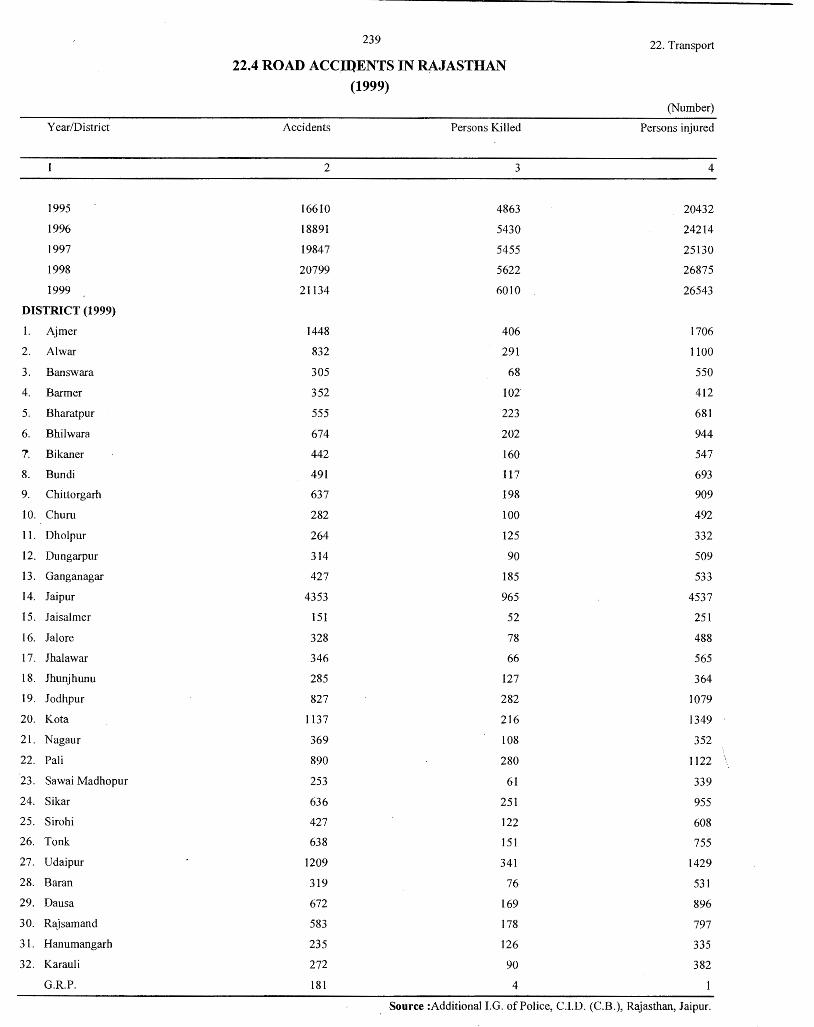
239 22. Transport
22.4 ROAD ACC.lQENTS IN RAJASTHAN
(1999)
(Number)
Year/District Accidents Persons Killed Persons injured
2 3 4
1995 16610 4863 20432
1996 18891 5430 24214
1997 19847 5455 25130
1998 20799 5622 26875
1999 21134 6010 26543
DISTRICT (1999)
1. Ajmer 1448 406 1706
2. Al war 832 291 1100
3. Banswara 305 68 550
4. Barmer 352 102 412
5. Bharatpur 555 223 681
6. Bhilwara 674 202 944
7. Bikaner 442 160 547
8. Bundi 491 117 693
9. Chittorgarh 637 198 909
10. Churn 282 100 492
11. Dholpur 264 125 332
12. Dungarpur 314 90 509
13. Ganganagar 427 185 533
14. Jaipur 4353 965 4537
15. Jaisalmer 151 52 251
16. Jal ore 328 78 488
17. Jhalawar 346 66 565
18. Jhunjhunu 285 127 364
19. Jodhpur 827 282 1079
20. Kota 1137 216 1349
21. Nagaur 369 108 352
22. Pali 890 280 1122
23. Sawai Madhopur 253 61 339
24. Sikar 636 251 955
25. Sirohi 427 122 608
26. Tonk 638 151 755
27. Udaipur 1209 341 1429
28. Baran 319 76 531
29. Dausa 672 169 896
30. Rajsamand 583 178 797
31. Hanumangarh 235 126 335
32. Karauli 272 90 382
G.R.P. 181 4
Source :Additional I.G. of Police, C.I.D. (C.B.), Rajasthan, Jaipur.
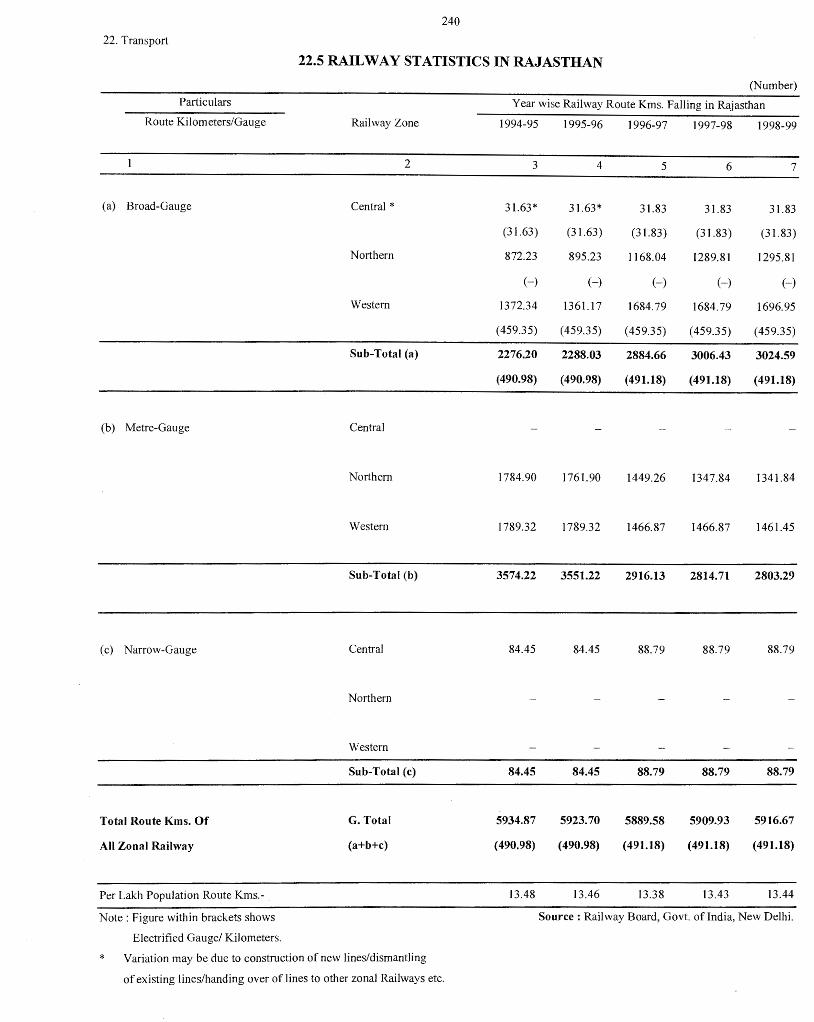
240
22. Transport
22.5 RAILWAY STATISTICS IN RAJASTHAN
(Number)
Particulars Year wise Railway Route Kms. Falling in Rajasthan
Route Kilometers/Gauge Railway Zone 1994-95 1995-96 1996-97 1997-98 1998-99
2 3 4 5 6 7
(a) Broad-Gauge Central* 31.63* 31.63* 31.83 31.83 31.83
(31.63) (31.63) (31.83) (31.83) (31.83)
Northern 872.23 895.23 1168.04 1289.81 1295.81
(-) (-) (-) (-) (-)
Western 1372.34 1361.17 1684.79 1684.79 1696.95
(459.35) (459.35) (459.35) (459.35) (459.35)
Sub-Total (a) 2276.20 2288.03 2884.66 3006.43 3024.59
(490.98) (490.98) (491.18) (491.18) (491.18)
(b) Metre-Gauge Central
Northern 1784.90 1761.90 1449.26 1347.84 1341.84
Western 1789.32 1789.32 1466.87 1466.87 1461.45
Sub-Total (b) 3574.22 3551.22 2916.13 2814.71 2803.29
(c) Narrow-Gauge Central 84.45 84.45 88.79 88.79 88.79
Northern
Western
Sub-Total (c) 84.45 84.45 88.79 88.79 88.79
Total Route Kms. Of G. Total 5934.87 5923.70 5889.58 5909.93 5916.67
All Zonal Railway (a+b+c) (490.98) (490.98) (491.18) (491.18) (491.18)
Per Lakh Population Route Kms.- 13.48 13.46 13.38 13.43 13.44
Note: Figure within brackets shows Source : Railway Board, Govt. of India, New Delhi.
Electrified Gauge/ Kilometers.
* Variation may be due to construction of new lines/dismantling
of existing lines/handing over of lines to other zonal Railways etc.
(23) MARKETING AND STORAGE
This section presents data relating to Fair-Price shops in urban and rural areas of
Rajasthan. This section also provides information regarding stock through Rajasthan
Ware Housing Corporation.
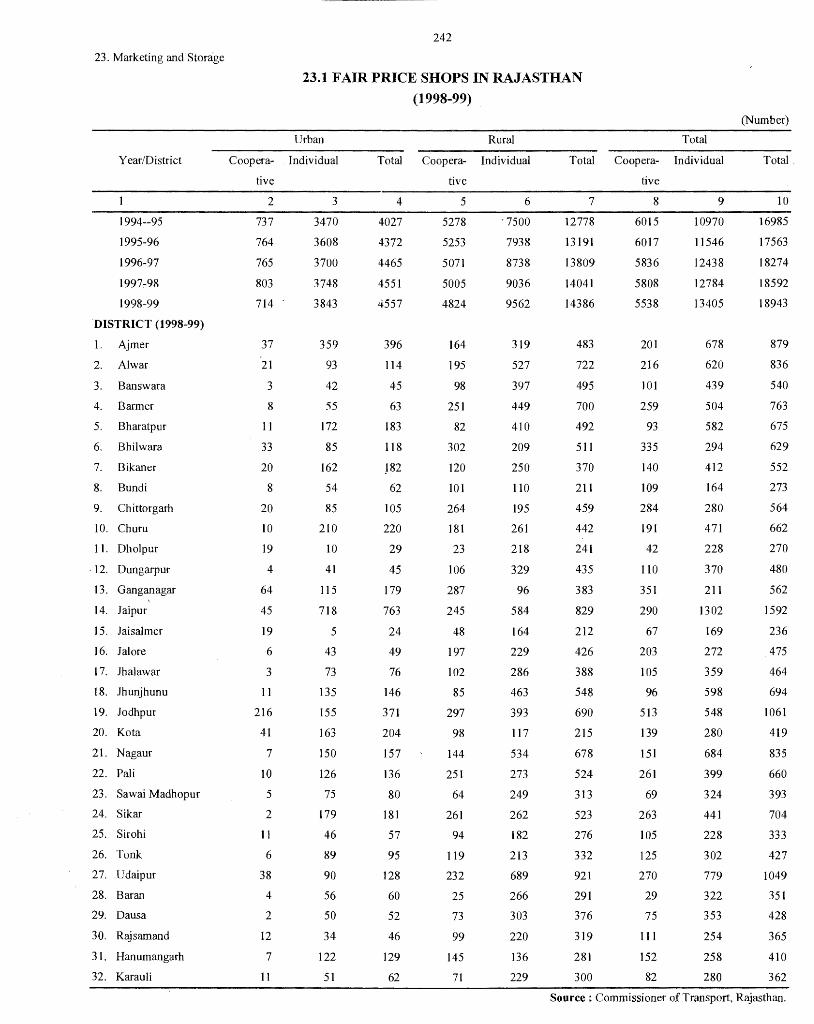
23. Marketing and Storage
Year/District
1994--95
1995-96
1996-97
1997:-98
1998-99
DISTRICT (1998-99)
I. Ajmer
2. Alwar
3. Banswara
4. Barmer
5. Bharatpur
6. Bhilwara
7. Bikaner
8. Bundi
9. Chittorgarh
10. Churn
11. Dholpur
· 12. Dungarpur
13. Ganganagar
14. Jaipur
15. Jaisalmer
16. Jalore
17. Jhalawar
18. .Jhunjhunu
19. Jodhpur
20. Kota
21. Nagaur
22. Pali
23. Sawail\1adhopur
24. Sikar
25. Sirohi
26. Tonk
27. Udaipur
28. Baran
29. Dausa
30. RS;jsarnand
3 1. Hanumangarh
32. Karauli
242
23.1 FAIR PRICE SHOPS IN RAJASTHAN
(1998-99)
Urban Rural Total
Coopera- Individual
tive
Total Coopera- Individual Total Coopera- Individual
2
737
764
765
803
714
37
21
3
8
11
33
20
8
20
10
19
4
64
45
19
6
3
11
216
41
7
IO
5
2
11
6
38
4
2
12
7
11
3
3470
3608
3700
3748
3843
359
93
42
55
172
85
162
54
85
210
IO
41
115
718
5
43
73
135
155
163
150
126
75
179
46
89
90
56
50
34
122
51
4
4027
4372
4465
4551
4557
396
114
45
63
183
118
J82
62
105
220
29
45
179
763
24
49
76
146
371
204
157
136
80
181
57
95
128
60
52
46
129
62
tive
5
5278
5253
5071
5005
4824
164
195
98
251
82
302
120
101
264
181
23
106
287
245
48
197
102
85
297
98
144
251
64
261
94
119
232
25
73
99
145
71
6
"7500
7938
8738
9036
9562
319
527
397
449
410
209
250
110
195
261
218
329
96
584
164
229
286
463
393
117
534
273
249
262
182
213
689
266
303
220
136
229
7
12778
13191
13809
14041
14386
483
722
495
700
492
511
370
211
459
442
241
435
383
829
212
426
388
548
690
215
678
524
313
523
276
332
921
291
376
319
281
300
tive
8
6015
6017
5836
5808
5538
201
216
J 01
259
93
335
140
109
284
191
42
110
351
290
67
203
105
96
513
139
151
261
69
263
105
125
270
29
75
111
152
82
9
10970
11546
12438
12784
13405
678
620
439
504
582
294
412
164
280
471
228
370
211
1302
169
272
359
598
548
280
684
399
324
441
228
302
779
322
353
254
258
280
(Number)
Total.
10
16985
17563
18274
18592
18943
879
836
540
763
675
629
552
273
564
662
270
480
562
1592
236
475
464
694
1061
419
835
660
393
704
333
427
1049
351
428
365
410
362
Source : Commissioner of Transport, Rajasthan.
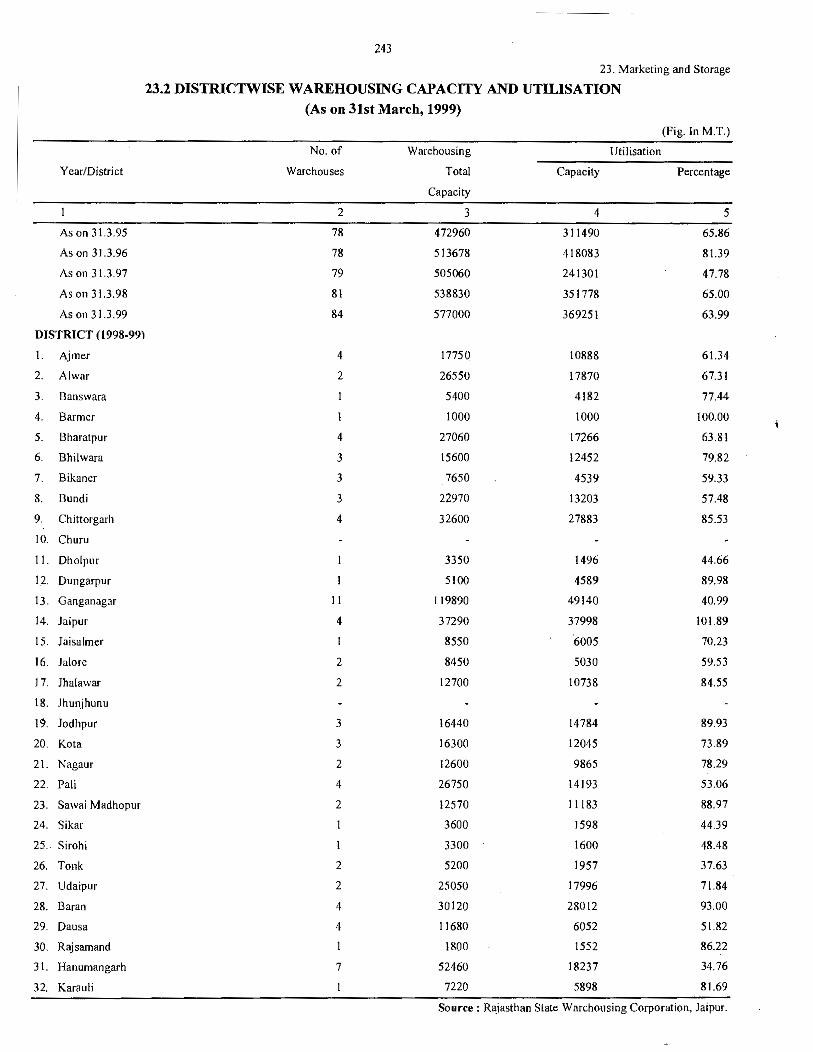
243
23. Marketing and Storage
23.2 DISTRICTWISE WAREHOUSING CAPACITY AND UTILISATION
(As on 31st March, 1999)
(Fig. In M.T.)
No. of Warehousing Utilisation
Year/District Warehouses Total Capacity Percentage
Capacity
2 3 4 5
As on 31.3.95 78 472960 311490 65.86
As on 31.3.96 78 513678 418083 81.39
As on 31.3.97 79 505060 241301 47.78
As on 31.3.98 81 538830 351778 65.00
As on 31.3.99 84 577000 369251 63.99
DISTRICT (1998-991
I. Ajmer 4 17750 10888 61.34
2. Al war 2 26550 17870 67.31
3. Bans\vara 5400 4182 77.44
4. Barmer 1000 1000 100.00
5. Bharatpur 4 27060 17266 63.81
6. Bhil\vara 3 15600 12452 79.82
7. Bikancr 3 7650 4539 59.33
8. Bundi 3 22970 13203 57.48
9. Chittorgarh 4 32600 27883 85.53
10. Churu
11. Dholpur 3350 1496 44.66
1_2. Dungarpur 5100 4589 89.98
13. Ganganagar 11 119890 49140 40.99
14. Jaipur 4 37290 37998 101.89
15. Jaisalmer 8550 6005 70.23
16. .Jalore 2 8450 5030 59.53
17. Jhala\var 2 12700 10738 84.55
18. Jhunjhunu
19. Jodhpur 3 16440 14784 89.93
20. Ko ta 3 16300 12045 73.89
21. Nagaur 2 12600 9865 78.29
22. Pali 4 26750 14193 53.06
23. Sa\vai Madhopur 2 12570 11183 88.97
24. Sikar 3600 1598 44.39
25. Sirohi 3300 1600 48.48
26. Tonk 2 5200 1957 37.63
27. Udaipur 2 25050 17996 71.84
28. Baran 4 30120 28012 93.00
29. Dausa 4 11680 6052 51.82
30. Rajsamand 1800 1552 86.22
31. Hanumangarh 7 52460 18237 34.76
32. Karau Ii 7220 5898 81.69
Source: Rajasthan State Warehousing Corporation, Jaipur.
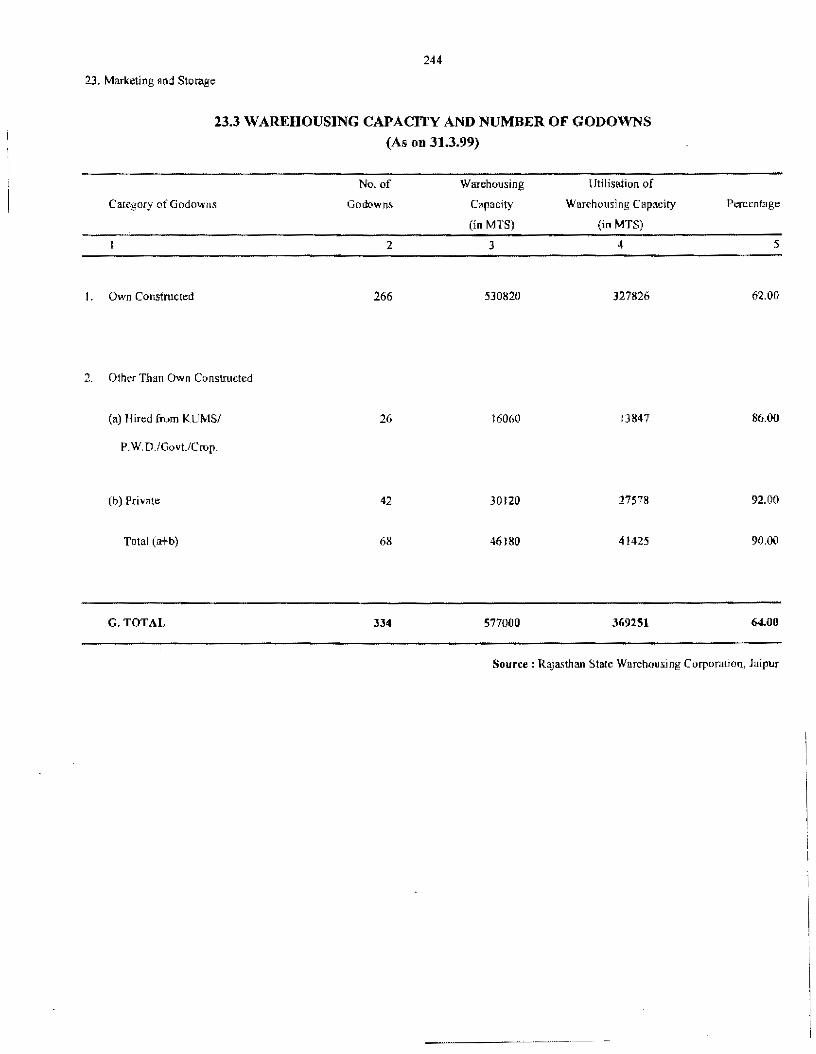
244
23, Marketing and Storage
23.3 WAREHOUSING CAP A CITY AND NUMBER OF GODOWNS
(As on 31.3.99)
No.of Warehousing lJtilisation of
Category of Godowns Godowns Capacity Warehousing Capacity
(in MTS) (in MTS)
2 3 4
l. Ov.'n Constructed 266 530820 327826
2. Other Than Q\vn Constructed
(a) Hired from KUMS/ 26 16060 13847
P.W.D)Govt/Crop.
(b) Private 42 30120 27578
Total (a~b) 68 46180 41425
G.TOTAL 334 577000 369251
Percentage
5
62.00
86.00
92.00
90.00
64.00
Source: Rajasthan State Warehousing Corporation, Jaipur
(24) COMMUNICATION
This section presents data relating to the different branches of the post and
Telegraph department and has been supplied by the post-master general, Post and
Telegraph, Rajasthan circle.
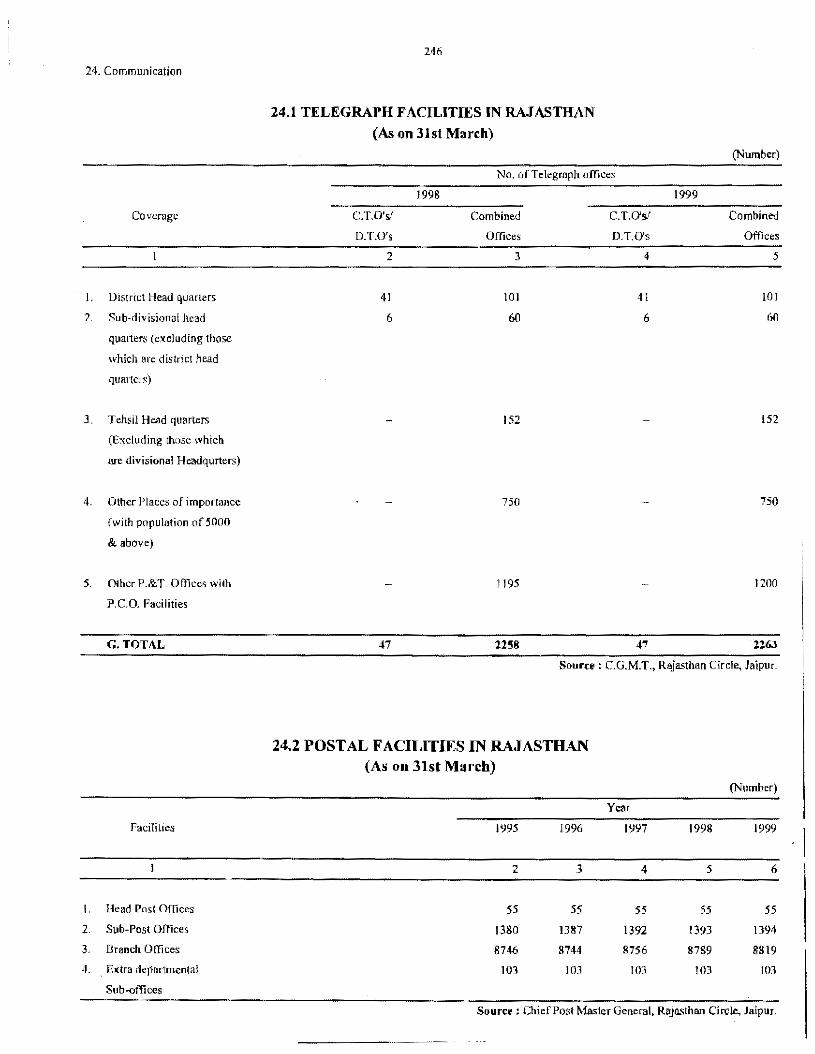
-
24. Communication
Coverage
!. District Head quarters
2. Sub-divisional head
quarters (excluding those
\vhich are district head
quarters)
3. Tehsil Head quarters
(Excluding those \Vhich
are divisional Headqurters)
4. Other Places of importance
(with population of5000
& above)
5. Other P.&T. Offices with
P.C.O. Facilities
G.TOTAL
Faciiilles
I. Head Post OfOces
2. Sub-Post Offices
3. Branch Offices
4. Extra departmental
Sub-offices
246
24.l TELEGRAPH FACILITIES IN RAJASTHAN (As on 31st March)
No. of Telegraph offices
C.T.O's/
D.T.O's
2
41
6
47
199&
Combined
Offices
3
IOI
60
152
750
1195
2258
C.T.O'sl
D.T.O's
4
41
6
47
1999
(Number)
Combined
Offices
5
IOI
60
152
750
1200
2263
Source : C.G.M:r., Rajasthan Circle, Jaipur.
24.2 POSTAL FACILITIES IN RAJASTHAN (As on 31st March)
(Number)
Year
1995 1996 1997 1998 1999
2 3 4 5 6
55 55 55 55 55
1380 1387 1392 1393 1394
8746 8744 8756 8789 8819
103 103 103 103 103
Source: Chief Post tviaster General, Raja..<;than Circle, Jaipur.
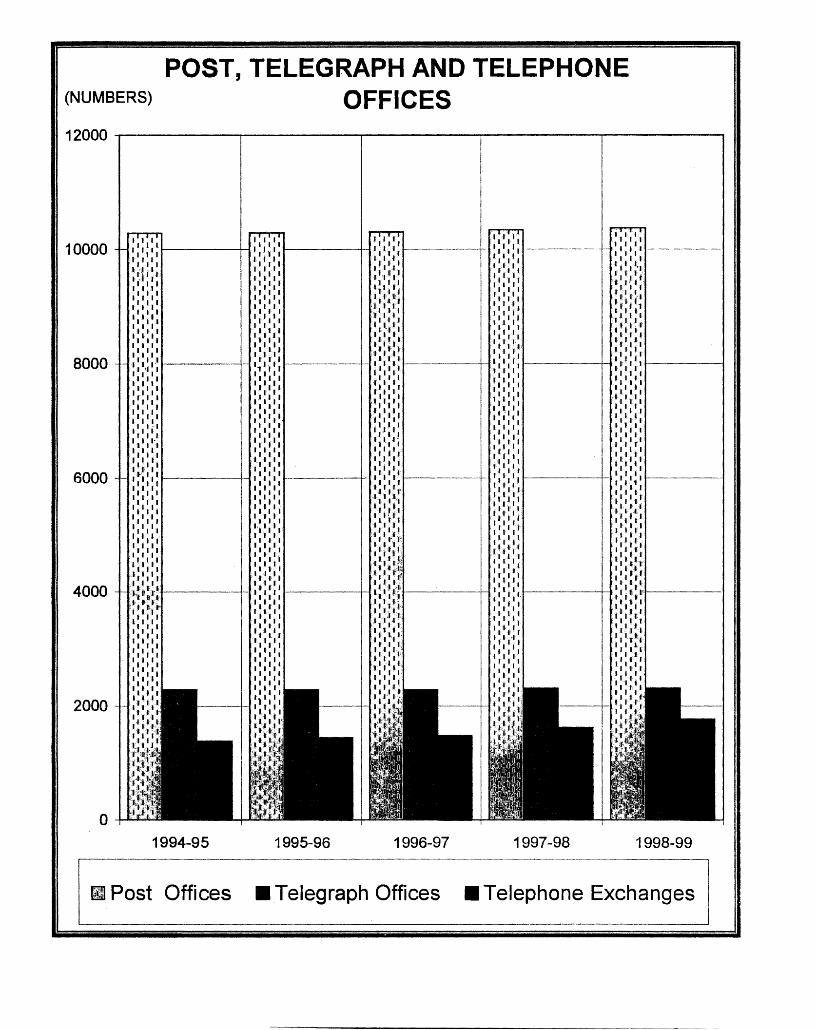
POST, TELEGRAPH AND TELEPHONE (NUMBERS) OFFICES 12000
: I: I: I :·:·:· •1•1•1 I' I' I
:•:1:1 10000 1:1:•:
I ·I I 111)11 1,11'1
'•' •' • •'•'•' •, f, •, 1, 1, f I I I l
~ ,:t j •·,, •'•'•' l'I ,I I fl 1'1. '•' 1 J,I 1'1'11 ,···· t 1' •1•1•1 ~J : .. ~(
:1· 11 ! I 11 1111 t 1, 1.1 111i11 11'1'1'
•'•'•' 1•1•11 It lt'tl 1,1,.1, i~i:(~' 1' 1' 1' 11
11
11 :1 1!'11'1
•,•,11,
I: I: I: ,1,1,1 .r•: 111 1 1
11
11
1 I~ 111 t
,•,•11 , • .·1,1 1r
111
1 1 l 1 I Jf 1,1,1,
1•1' J f , 111 l I 1,1,1, 111' It I
'• '•' J ,•,1,1 If I I 11 1t 1l 1',a; : l ! I; I '•'•'• • '•' • l :1f I 1'1 l f 111 '1
8000 •, •, •, 1'1.•1• I ti l'l ~ '·111•1
, 1!11. f
1,•,1•'1 ,11•1 • i 11 J, • } 111•1
.•,1,1
'•'•'• ,1,1,1 f 1, 1, 1 1,11•1 ,•,•11
1,1,1, 1
11
11
1 f: I: I: 1,•,•1 •'•'•' 'r'1'1 ,1'i'1' '1'111
,111,1 .1, 11•1 · 111 r 11 •:1:•:
'•'•'• 1•11,1 '•'•'• : t ! I! I 1•111'· I 1' 1' 1 1,1,1, t
11
11
1 .,.,1, l ! I: I: 11I1'1
'1'1'1 1•11,1 '11, 1,
'•'•'• •1•1•·, •.•,1·1
,11'1' '1'1''1
It' l 11 1,1,r, '•'•'1
I 1-.1 · .1111,1 ,•,•,• '•'•'• : I: I: I '1'1'1 1·1
11
11 1
1111
1 1 t1
11
t 6000 I f'l 11 l .1,1,1 I~ I: Ir I I 1 t11
,•,1,1 1,1,1, ,1,1,1 , •. '1' •,•,•, '•·'•''I' '1' 1' l 111 It f
1,•,•1 1111 11 '11 11l1 ', •, • 1 •' • 'r r
• .1, 1, •'•'•' 1 r 1 d1 •,l,,•, ',,• 1 •,.,t 11•1•1 ·:·:·: 1.1•1; ••. ·1, 1 j.
111•1• •,•,•, ••• ••• • 11 1 fJ I '•'•'• I·"•'•' 1: I I 1t1
11
1 '•'•'• '1'1'1 : 11 r .,'* i' It 1111 1,1,11 •11111 f t .'I 1t 1:t'f I: J ~ r! 1
11
11
1 1,1,11 11 i 1l 1: I a Ii I I l. t
'1' 1 '.1 '•'lflJ: '1'1'1 1t1t 1 I ·• 1 •:t t,';\
.J, 1,1 t ... •, •, ... 1,r('! :·:·:· : I: t~f 4000 ,IJ;I fl L : I: r: I '• t,, •,,, ,1,1,1 •' • t •' ;Jt.111 11 1rJi Ltl'I !{I If 111 fc t' 'fj. t"
:•,•rh· 1'1'1' 11
11.1'1:
1:•:•: , I :1 ! I: 1, • ,• 1
, 1, r, 1 I t. I. .,•,•,• '11,.1 .. 1 •,•,•. f Ill 1't t, •, •. ,., ... ·, •.•, 1 11J·ii 1r 't 11 J:tl
'•'•'• I: I: I~ If t l.J h : f: 1·: I
~ 1, • 1:1\t 1
11
11
1 1•,•,,•, If I t't I •1•111 •,•,11 ,•,•.•: f 1, 1, 1 ' 1 t1f 1 f
'•'•'• •,•,•. .,. ,1 ,. •••••• ; I: I! I '•'•'• 1,1,1, ,•,•,•. I Ii 1 1 1 •,•,•, 1,1,1, I! I :'I~ ,1,1,1 ·,•.,1,1 '1'1'1 '•'•'• ff I' If': •'•'•'
2000 .,., ... 11 11
11 1, •1 •;,~ 1111 1·.1: •• , • t~'
11·.1 JI t; I I f I f. • l ( .. :,,,. 1 1 1 t J 11 11 r I iit~i'.c' • .r,;t,1;: I~ It It: i:.,1t:1! f: !;tliJ}~ •'•·
:·: ··~;i I ' ,,-, ·1!J;
l,I t' JI
"'' i:I!
j;J~.;t.JiJ: 'J, i1''"i11r ,(fll' ::I'
0
1994-95 1995-96 1996-97 1997-98 1998-99
ml Post Offices •Telegraph Offices •Telephone Exchanges
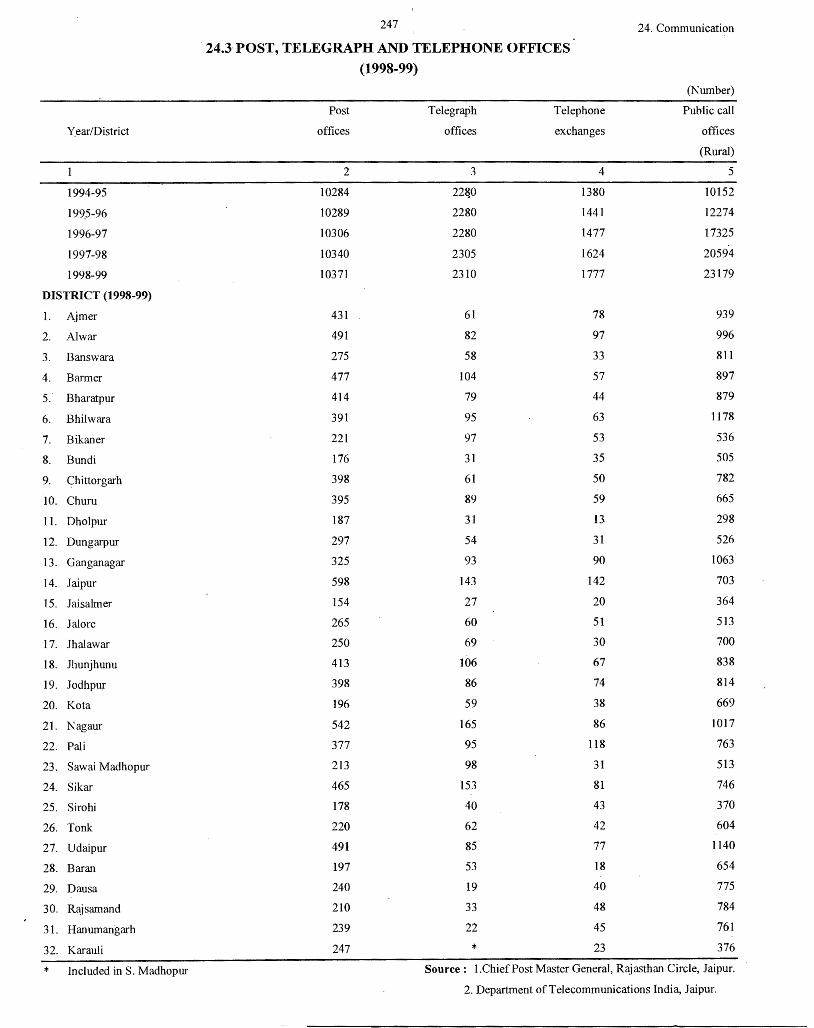
247 24. Communication
24.J POST, TELEGRAPH AND TELEPHONE OFFICES
(1998-99)
(Number)
Post Telegraph Telephone Public call
Year/District offices offices exchanges offices
(Rural)
2 3 4 5
1994-95 10284 22&0 1380 10152
199.5-96 10289 2280 1441 12274
1996-97 10306 2280 1477 17325
1997-98 10340 2305 1624 20594
1998-99 10371 2310 1777 23179
DISTRICT (1998-99)
1. Ajmer 431 61 78 939
2. Al war 491 82 97 996
3. Banswara 275 58 33 811
4. Barmer 477 104 57 897
5. Bharatpur 414 79 44 879
6. Bhilwara 391 95 63 1178
7. Bikaner 221 97 53 536
8. Bundi 176 31 35 505
9. Chittorgarh 398 61 50 782
10. Chum 395 89 59 665
11. Dholpur 187 31 13 298
12. Dungarpur 297 54 31 526
13. Ganganagar 325 93 90 1063
14. Jaipur 598 143 142 703
15. Jaisalmer 154 27 20 364
16. Jalore 265 60 51 513
17. Jhalawar 250 69 30 700
18. Jhunjhunu 413 106 67 838
19. Jodhpur 398 86 74 814
20. Ko ta 196 59 38 669
21. Nagaur 542 165 86 1017
22. Pali 377 95 118 763
23. Sawai Madhopur 213 98 31 513
24. Sikar 465 153 81 746
25. Sirohi 178 40 43 370
26. Tonk 220 62 42 604
27. Udaipur 491 85 77 1140
28. Baran 197 53 18 654
29. Dausa 240 19 40 775
30. Rajsamand 210 33 48 784
31. Hanumangarh 239 22 45 761
32. Karauli 247 * 23 376
* Included in S. Madhopur Source: I.Chief Post Master General, Rajasthan Circle, Jaipur.
2. Department of Telecommunications India, Jaipur.
(25) TOURISM
This section presents data on Tourists in Rajasthan \Vith break-~p of home TouristS'. 11d foreign Touri.~s. It also Presents data on tourist hotels and tourism facilities in Rajasthan.
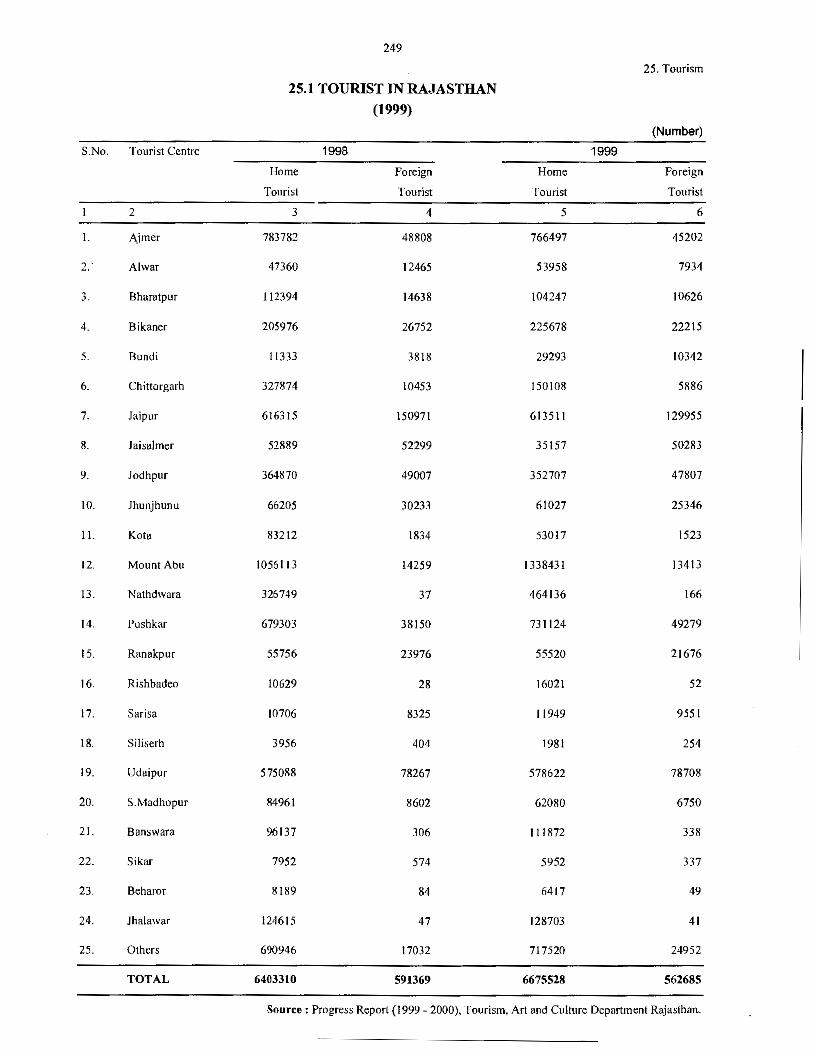
249
25. Tourism
25.1 TOURIST IN RA.TASTHAN
(1999)
(Number)
S.No. Tourist Centre 1998 1999
Home Foreign Home Foreign
Tourist Tourist Tourist Tourist
2 3 4 5 6
I. Aimer 783782 48808 766497 45202
2." Ahvar 47360 12465 53958 7934
3. Bharatpur 112394 14638 104247 !0626
4. Bikaner 205976 26752 225678 22215
5. Bundi 11333 3818 29293 !0342
6. Chittorgarh 327874 !0453 150!08 5886
7. Jaipur 616315 150971 613511 129955
8. Jaisalmer 52889 52299 35157 50283
9. Jodhpur 364870 49007 352707 47807
IO. Jhunjhunu 66205 30233 61027 25346
11. Ko ta 83212 1834 53017 1523
12. Mount Abu !056113 14259 1338431 13413
13. Nathd\vara 326749 37 464136 166
14. Pushkar 679303 38150 731124 49279
15. Ranakpur 55756 23976 55520 21676
16. Rishbadeo 10629 28 16021 52
17. Sarisa !0706 8325 11949 9551
18. Siliserh 3956 404 1981 254
19. Udaipur 575088 78267 578622 78708
20. S.Madhopur 84961 8602 62080 6750
21. Banswara 96137 306 111872 338
22. Sikar 7952 574 5952 337
23. Beharor 8189 84 6417 49
24. Jha\a\var 124615 47 128703 41
25. Others 690946 17032 717520 24952
TOTAL 6403310 591369 6675528 562685
Source: Progress Report {1999 - 2000), Tourism, Art and Culture Department Rajasthan,
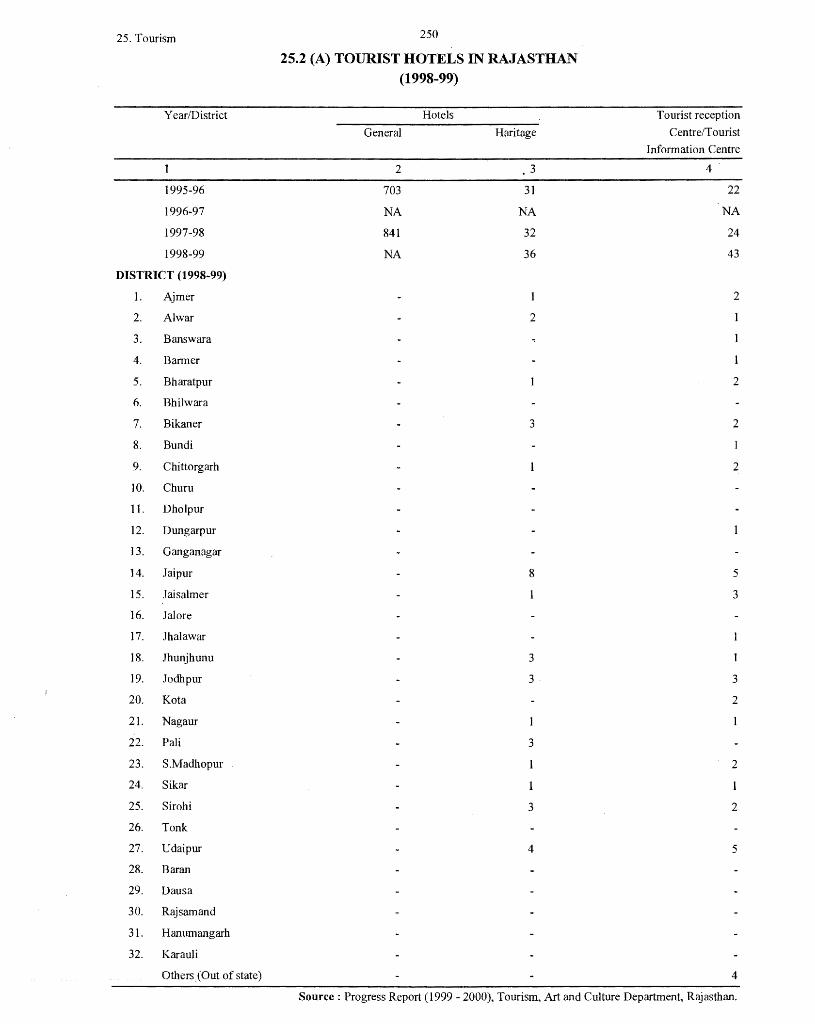
25. Tourism
Year/District
1995-96
1996-97
1997-98
1998-99
DISTRICT (1998-99)
1. Ajmer
2. Al war
3. Banswara
4. Barmer
5. Bharatpur
6. Bhilwara
7. Bikaner
8. Bundi
9. Chittorgarh
10. Chum
11. Dholpur
12. Dungarpur
13. Ganganagar
14. Jaipur
15. Jaisalmer
16. Jalore
17. Jhalawar
18. Jhuajhunu
19. Jodhpur
20. Kota
21. Nagaur
22. Pali
23. S.Madhopur
24. Sikar
25. Sirohi
26. Tonk
27. Udaipur
28. Baran
29. Daus a
30. Rajsamand
31. Hanumangarh
32. Karauli
Others (Out of state)
250
25.2 (A) TOURIST HOTELS IN RAJASTHAN (1998-99)
General
2
703
NA
841
NA
Hotels
Haritage
. 3
31
NA
32
36
2
3
8
3
3
3
3
4
Tourist reception
Centre/Tourist
Information Centre
4
22
NA
24
43
2
2
2
2
5
3
3
2
2
2
5
4
Source: Progress Report (1999 - 2000), Tourism, Art and Culture Department, Rajasthan.
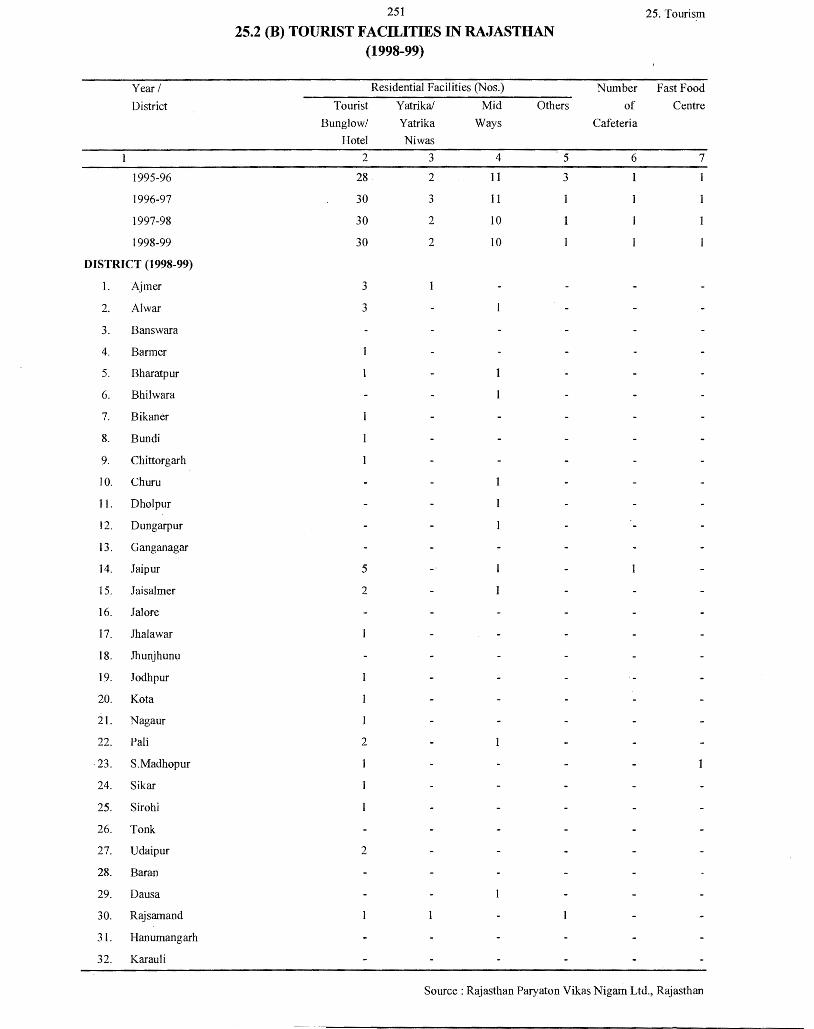
Year I
District
1995-96
1996-97
1997-98
1998-99
DISTRICT (1998-99)
1. Ajmer
2. Al war
3. Banswara
4. Barmer
5. Bharatpur
6. Bhilwara
7. Bikaner
8. Bundi
9. Chittorgarh
10. Chum
11. Dholpur
12. Dungarpur
13. Ganganagar
14. Jaipur
15. Jaisalmer
16. Jal ore
17. Jhalawar
18. Jhunjhunu
19. .Todhpur
20. Ko ta
21. Nagaur
22. Pali
·23. S.Madhopur
24. Sikar
25. Sirohi
26. Tonk
27. Udaipur
28. Baran
29. Dausa
30. Rajsamand
31. Hanumangarh
32. Karauli
251
25.2 (B) TOURIST FACILITIES IN RAJASTHAN (1998-99)
Residential Facilities (Nos.)
Tourist Yatrika/ Mid Others
Bunglow/
Hotel
2
28
30
30
30
3
3
5
2
2
2
Yatrika Ways
Ni was
3 4 5
2 11 3
3 11
2 10
2 10
25. Tourism
Number Fast Food
of Centre
Cafeteria
6 7
1
Source : Rajasthan Paryaton Vikas Nigam Ltd., Rajasthan
(26) LABOUR AND EMPLOYMENT
TRADE UNIONS - The data in table 26. l relates to trade unions registered and cancelled under the Indian Trade Unions Act, 1926. The statistics in table 26.1 relate to only those trade unions which have submitted returns.
INDUSTRJAL COMPLAINTS - Only the number of complaints, by causes, received in the office of the Labour Commissioner have been reported.
INDUSTRIAL DISPUTES - Industrial disputes relate to strikes and lock-outs resulting in stoppage of work involving ten or more workers in all sectors of employment including factories, transport/municipal services etc. Sympathetic stirkes and certain other types of stoppages which do not strictly come under the defination of industrial disputes as laid down in the industrial disputes Act, 1947, are not covered.
FACTORY ACCIDENTS - Only the accidents occuring in factories (enquired into) which result into either death or injury to a worker necesitating his absence from 'vork for 48 hours or more covered under this head.This information is collected under the Indian factories Act, 1948. The data has been compiled in the Directorate from the monthly reports on labour situation issued by the Labour Co1nmissioner, Rajasthan and its Annual Administrative Reports.
MANDAYS WORKED - Number of mandays lost during the month are obtained by adding together the number of workers who worked on each day of the month i.e the total presence of all the workers in the month.
MANDAYS LOST - Number of mandays worked during the month on account of absence is obtained by adding together the number of workers absent on each day- during the month. Mandays lost by absence due to strikes lock-outs or employer ordering lay-off are excluded.
MANDA YS SCHEDULED TO WORK - This is the total of mandays worked and lost.
ABSENTEEIS.M JN FACTORJES - It is the percentage of mandays lost of mandays scheduled to work and has been worked out as under :
Mandays lost ~~~~~~~~~~- x!OO
Total mandays worked+ lost
This data has been collected on annual basis with monthly and quarterly breakdowns in the Annual Survey of Industries by the Directorate of Economics and Statistics, Rajasthan.
EMPLOYMENT IN MINING - To supply such data to the Director of Mines and Geology, Rajasthan is a statutory obligation on the part of the lease but in case of certain minor minerals and specially building materials where rent-cum-royalty lease are granted, average number of persons employed per day are just estimated on the basis of royalty collected through royalty collection centres. In case of certain minerals where data for any particular year was not available this has been estimated on the basis of Production during the last year. The figures given in this table represent the daily labour employment-both aboveground and under-ground.
RAJASTHAN GOVERNMENT EMPLOYEES - The Directorate of Economics and Statistics, Rajasthan is conducting a regular census of Regular Rajasthan Government Employees on halfyearly basis. The first census was conduct for the employees on 31.12.56. The data are collected separately for gazetted and Non-gazetted staff under various pay ranges. The data in the prescribed form are supplied by the Drawing and Disbursing officers to the respective Head of the Departments and they in turn compile the data for their departments and pass to the ·Directorate of Economics and Statistics, Rajasthan for compilation at state level. Employment represents the actuals as on the data of census while the monthly emoluments are estimated by multiplying the total employees with the mid values of the respective pay ranges. District wise figures also shown is some tables.
EMPLOYMENT EXCHANGE - Statistics under this section shown the working of the employment exchanges in Rajasthan. The nature of work undertaken by the employment exchanges consists of registering people who are seeking employment and securing employment for them. The date is supplied regularly by the Directorate of Employment, Rajasthan.
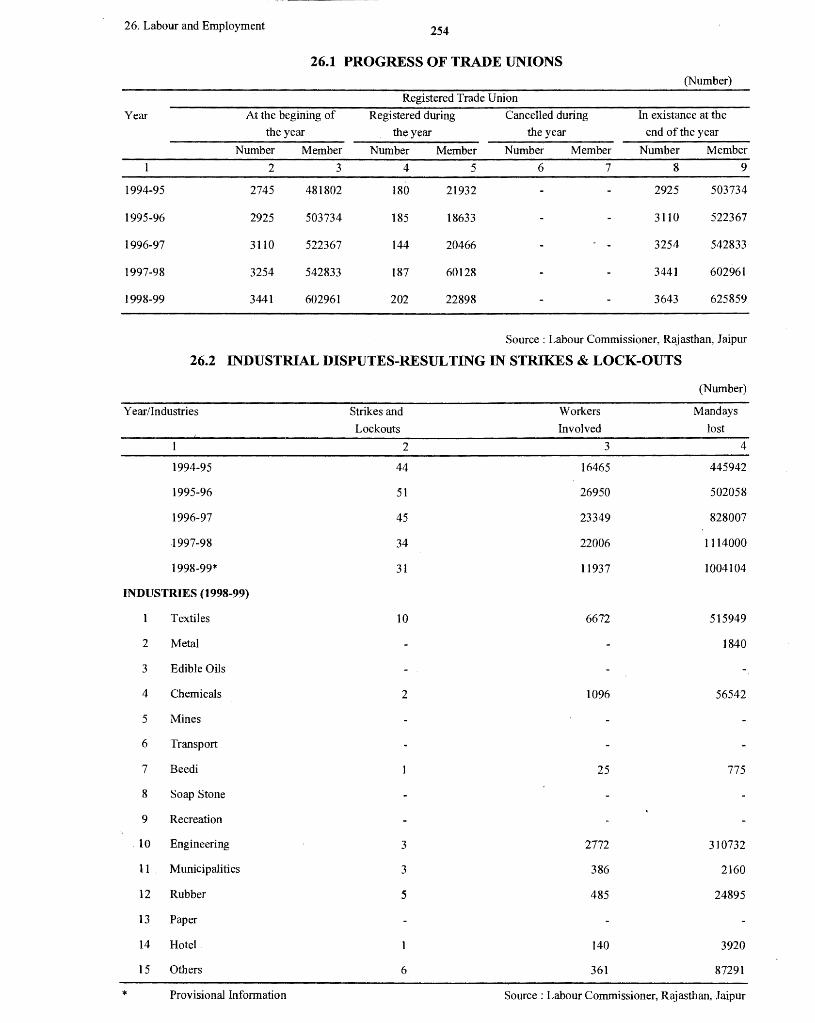
26. Labour and Employment 254
26.1 PROGRESS OF TRADE UNIONS (Number)
Registered Trade Unfon
Year At the begining of Registered during Cancelled during In existance at the
the year the year the year end of the year
Number Member Number Member Number Member Number Member
2 3 4 5 6 7 8 9
1994-95 2745 481802 180 21932 2925 503734
1995-96 2925 503734 185 18633 3110 522367
1996-97 3110 522367 144 20466 3254 542833
1997-98 3254 542833 187 60128 3441 602961
1998-99 3441 602961 202 22898 3643 625859
Source: Labour Commissioner, Rajasthan, Jaipur
26.2 INDUSTRIAL DISPUTES-RESULTING IN STRIKES & LOCK-OUTS
Year/Industries
1994-95
1995-96
1996-97
1997-98
1998-99*
INDUSTRIES (1998-99)
Textiles
2 Metal
3 Edible Oils
4 Chemicals
5 Mines
6 Transport
7 Beedi
8 Soap Stone
9 Recreation
10 Engineering
11 Municipalities
12 Rubber
13 Paper
14 Hotel
15 Others
* Provisional Information
Strikes and
Lockouts
2
44
51
45
34
31
10
2
3
3
5
6
Workers
Involved
3
16465
26950
23349
22006
11937
6672
1096
25
2772
386
485
140
361
(Number)
Mandays
lost
4
445942
502058
828007
1114000
1004104
515949
1840
56542
775
310732
2160
24895
3920
87291
Source: Labour Commissioner, Rajasthan, Jaipur
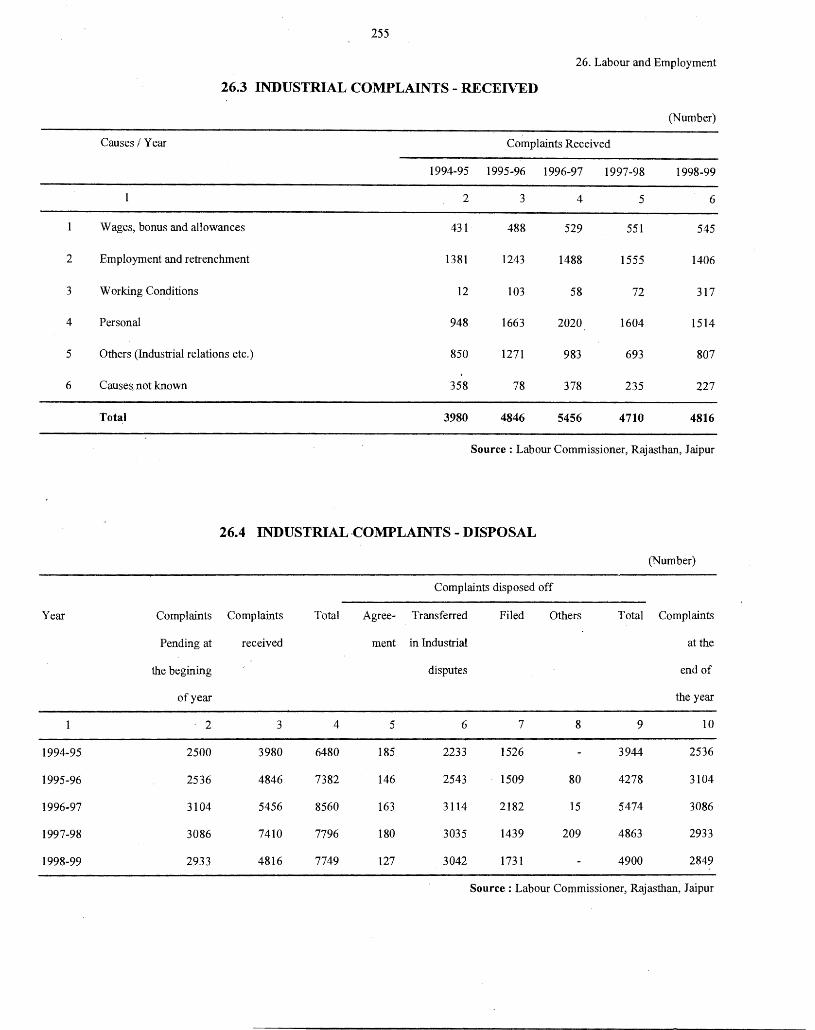
255
26. Labour and Employment
26.3 INDUSTRIAL COMPLAINTS - RECEIVED
(Number)
Causes I Year Complaints Received
1994-95 1995-96 1996-97 1997-98 1998-99
2 3 4 5 6
Wages, bonus and allowances 431 488 529 551 545
2 Employment and retrenchment 1381 1243 1488 1555 1406
3 Working Conditions 12 103 58 72 317
4 Personal 948 1663 2020 1604 1514
5 Others (Industrial relations etc.) 850 1271 983 693 807
6 Cause~ not known 358 78 378 235 227
Total 3980 4846 5456 4710 4816
Source: Labour Commissioner, Rajasthan, Jaipur
26.4 INDUSTRIAL -COMPLAINTS - DISPOSAL
(Number)
Complaints disposed off
Year Complaints Complaints Total Agree- Transferred Filed Others Total Complaints
Pending at received ment in Industrial at the
the begining disputes end of
of year the year
2 3 4 5 6 7 8 9 10
1994-95 2500 3980 6480 185 2233 1526 3944 2536
1995-96 2536 4846 7382 146 2543 1509 80 4278 3104
1996-97 3104 5456 8560 163 3114 2182 15 5474 3086
1997-98 3086 7410 7796 180 3035 1439 209 4863 2933
1998-99 2933 4816 7749 127 3042 1731 4900 2849
Source : Labour Commissioner, Rajasthan, Jaipur
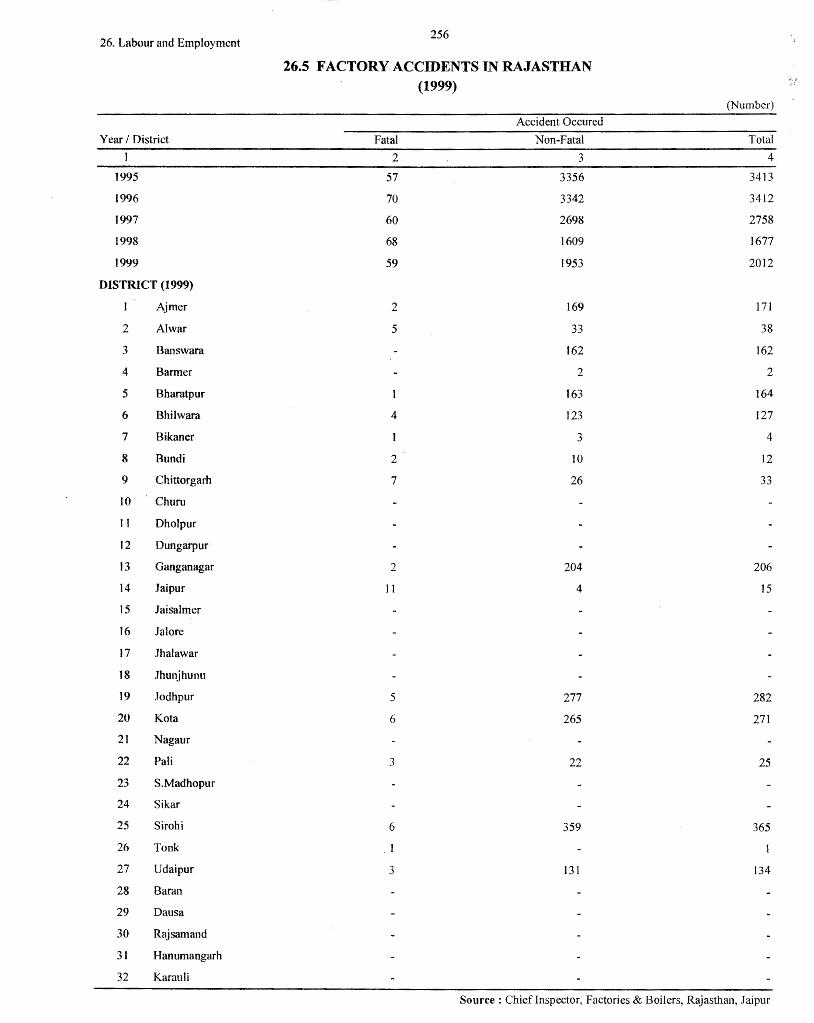
26. Labour and Employment 256
26.5 FACTORY ACCIDENTS IN RAJASTHAN (1999)
(Number)
Accident Occured
Year I District Fatal Non-Fatal Total
2 3 4
1995 57 3356 3413
1996 70 3342 3412
1997 60 2698 2758
1998 68 1609 1677
1999 59 1953 2012
DISTRICT (1999)
Ajmer 2 169 171
2 Al war 5 33 38
3 Banswara 162 162
4 Barmer 2 2
5 Bharatpur 163 164
6 Bhitwara 4 123 127
7 Bikaner 3 4
8 Bundi 2 IO 12
9 Chittorgarh 7 26 33
JO Churu
11 Dholpur
12 Dungarpur
13 Ganganagar 2 204 206
14 Jaipur 11 4 15
15 Jaisalmer
16 Jal ore
17 .Thal a war
18 .Thunjhunu
19 Jodhpur 5 277 282
20 Kota 6 265 271
21 Nagaur
22 Pali 3 22 25
23 S.Madhopur
24 Sikar
25 Sirohi 6 359 365
26 Tonk . I
27 Udaipur 3 131 134
28 Baran
29 Dausa
30 Rajsamand
31 Hanumangarh
32 Karau Ii
Source : Chief Inspector, Factories & Boilers, Rajasthan, Jaipur
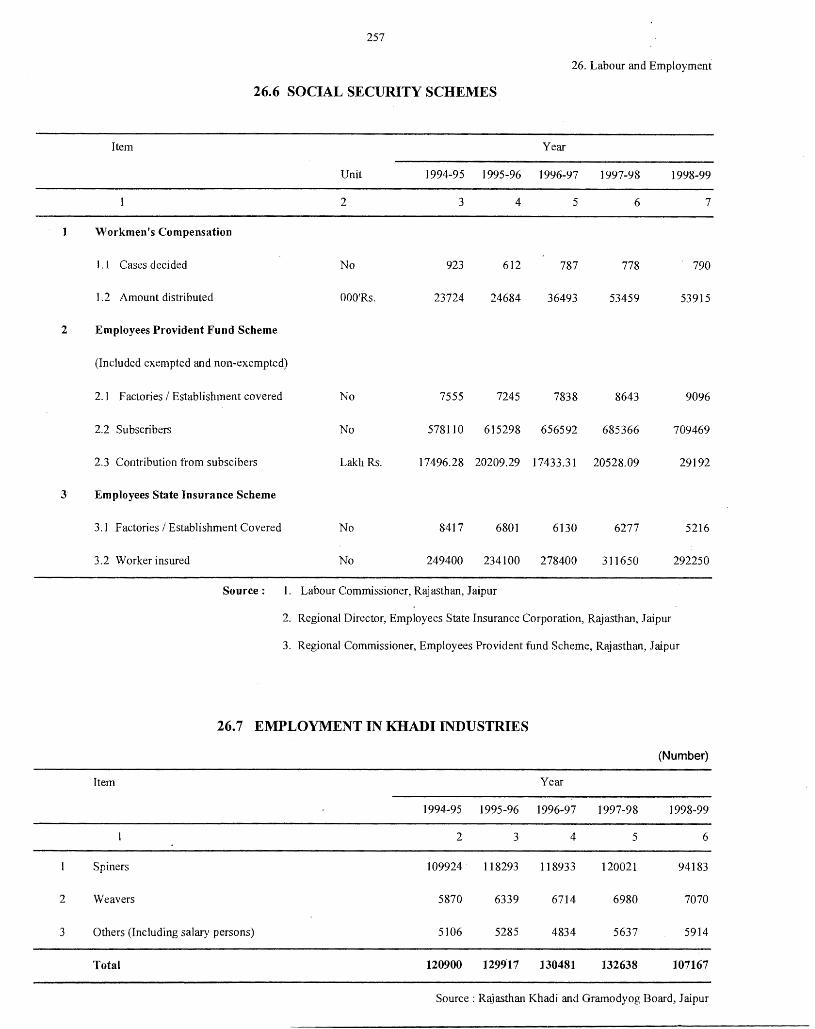
257
26. Labour and Employment
26.6 SOCIAL SECURITY SCHEMES
Item Year
Unit 1994-95 1995-96 1996-97 1997-98 1998-99
2 3 4 5 6 7
Workmen's Compensation
I.I Cases decided No 923 612 787 778 790
1.2 Amount distributed 0001Rs. 23724 24684 36493 53459 53915
2 Employees Provident Fund Scheme
(Included exempted and non-exempted)
2.1 Factories I Establishment covered No 7555 7245 7838 8643 9096
2.2 Subscribers No 578110 615298 656592 685366 709469
2.3 Contribution from subscibers Lakh Rs. 17496.28 20209.29 17433.31 20528.09 29192
3 Employees State Insurance Scheme
3.1 Factories I Establishment Covered No 8417 6801 6130 6277 5216
3.2 Worker insured No 249400 234100 278400 311650 292250
Source: I. Labour Commissioner, Rajasthan, Jaipur
2. Regional Director, Employees State Insurance Corporation, Rajasthan, Jaipur
3. Regional Commissioner, Employees Provident fund Scheme, Rajasthan, Jaipur
26.7 EMPLOYMENT IN KHADI INDUSTRIES
(Number)
Item Year
1994-95 1995-96 1996-97 1997-98 1998-99
2 3 4 5 6
Spiners 109924 118293 118933 120021 94183
2 Weavers 5870 6339 6714 6980 7070
3 Others (Including salary persons) 5106 5285 4834 5637 5914
Total 120900 129917 130481 132638 107167
Source : Rajasthan Khadi and Gramodyog Board, Jaipur
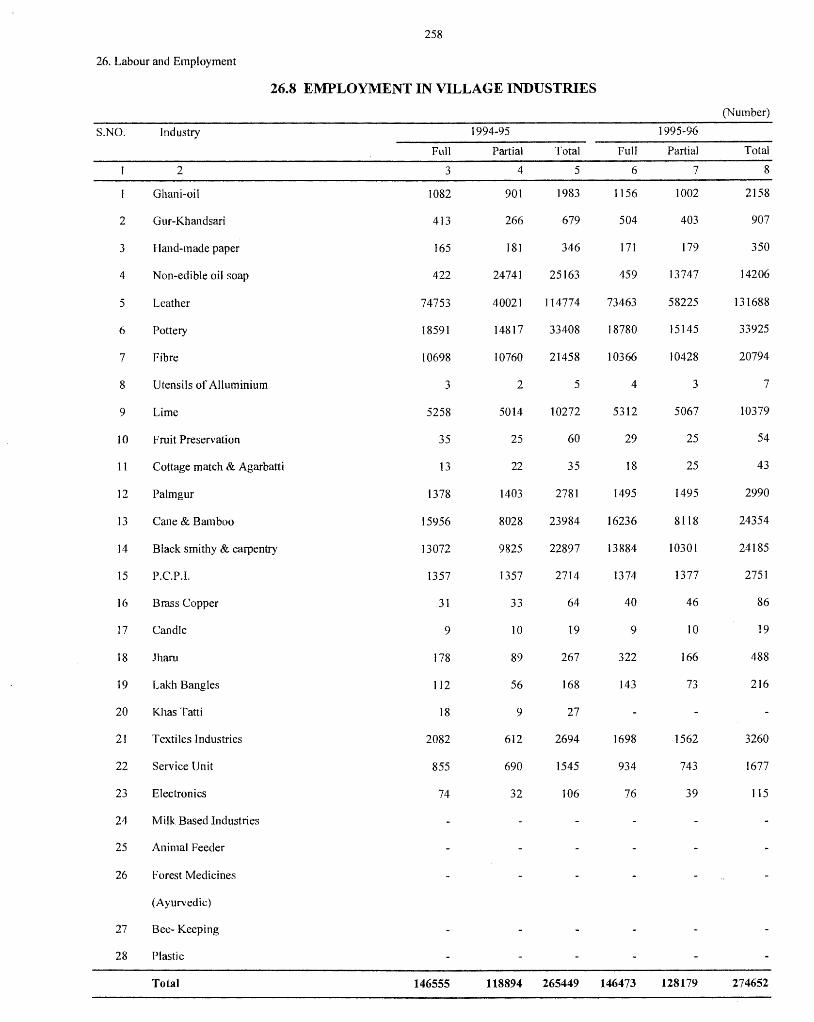
258
26. Labour and Employment
26.8 EMPLOYMENT IN VILLAGE INDUSTRIES
(Number)
S.NO. Industry 1994-95 1995-96
Full Partial Total Full Partial Total
2 3 4 5 6 7 8
Ghani-oil 1082 901 1983 1156 1002 2158
2 Gur-Khandsari 413 266 679 504 403 907
3 Hand-made paper 165 181 346 171 179 350
4 Non-edible oil soap 422 24741 25163 459 13747 14206
5 Leather 74753 40021 I 14774 73463 58225 131688
6 Pottery 18591 14817 33408 18780 15145 33925
7 Fibre 10698 10760 21458 10366 10428 20794
8 Utensils of Alluminium 3 2 5 4 3 7
9 Lime 5258 5014 10272 5312 5067 10379
10 Fruit Preservation 35 25 60 29 25 54
11 Cottage match & Agarbatti 13 22 35 18 25 43
12 Palmgur 1378 1403 2781 1495 1495 2990
13 Cane & Bamboo 15956 8028 23984 16236 8118 24354
14 Black smithy & carpentry 13072 9825 22897 13884 10301 24185
15 P.C.P.I. 1357 1357 2714 1374 1377 2751
16 Brass Copper 31 33 64 40 46 86
17 Candle 9 IO 19 9 10 19
18 Jharu 178 89 267 322 166 488
19 Lakh Bangles 112 56 168 143 73 216
20 Khas Tatti 18 9 27
21 Textiles Industries 2082 612 2694 1698 1562 3260
22 Service Unit 855 690 1545 934 743 1677
23 Electronics 74 32 106 76 39 115
24 Milk Based Industries
25 Animal Feeder
26 Forest Medicines
(Ayurvedic)
27 Bee- Keeping
28 Plastic
Total 146555 118894 265449 146473 128179 274652
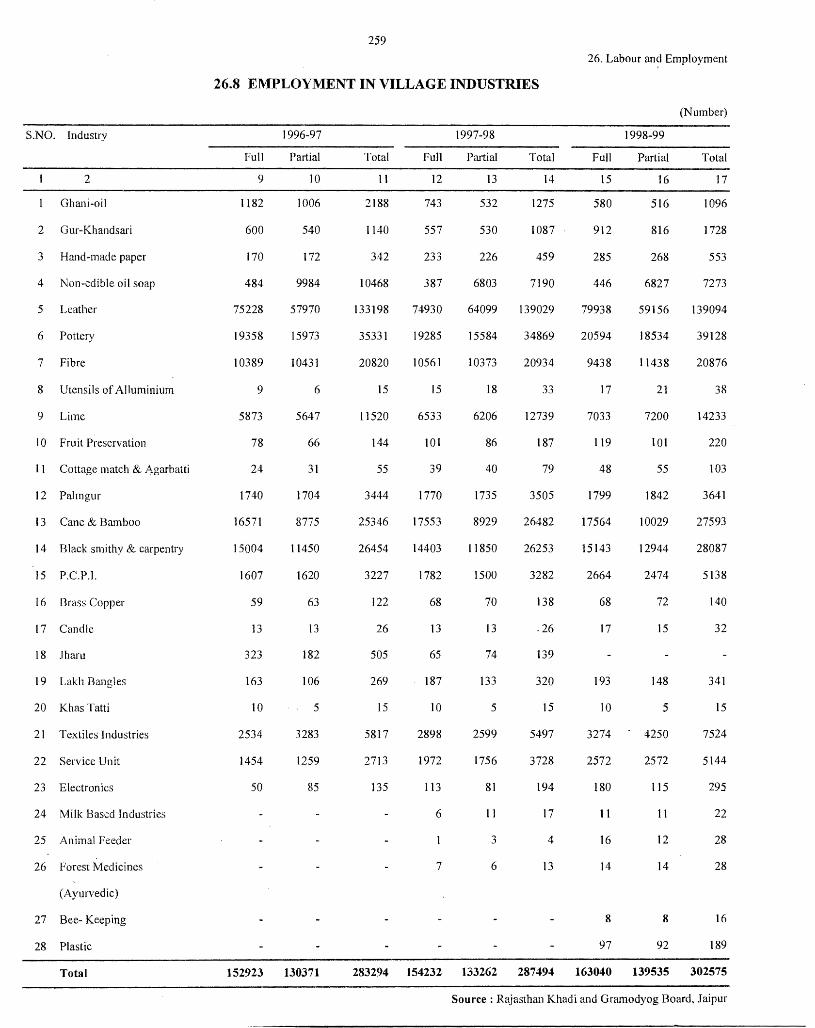
S.NO. Industry
2
Ghani-oil
2 Gur-Khandsari
3 Hand-made paper
4 Non-edible oil soap
5 Leather
6 Pottery
7 Fibre
8 Utensils of Alluminium
9 Lime
10 Fruit Preservation
11 Cottage match & Agarbatti
12 Palmgur
13 Cane & Bamboo
14 Black smithy & carpentry
15 P.C.P.I.
16 Brass Copper
17 Candle
18 Jharu
19 Lakh Bangles
20 Khas Tatti
21 Textiles Industries
22 Service Unit
23 Electronics
24 Milk Based Industries
25 Animal Feeder
26 Forest Medicines
(Ayurvedic)
27 Bee- Keeping
28 Plastic
Total
259
26. Labour an? Employment
26.8 EMPLOYMENT IN VILLAGE INDUSTRIES
Full
9
1182
600
170
484
75228
19358
10389
9
5873
78
24
1740
16571
15004
1607
59
13
323
163
10
2534
1454
50
1996-97
Partial
10
1006
540
172
9984
57970
15973
10431
6
5647
66
31
1704
8775
11450
1620
63
13
182
106
5
3283
1259
85
152923 130371
Total
11
2188
l 140
342
10468
133198
35331
20820
15
11520
144
55
3444
25346
26454
3227
122
26
505
269
15
5817
2713
135
Ful1
12
743
557
233
387
74930
19285
10561
15
6533
101
39
1770
17553
14403
1782
68
13
65
187
10
2898
1972
113
6
7
1997-98
Partial
13
532
530
226
6803
64099
15584
10373
18
6206
86
40
1735
8929
11850
1500
70
13
74
133
5
2599
1756
81
11
3
6
Total
14
1275
1087
459
7190
139029
34869
20934
33
12739
187
79
3505
26482
26253
3282
138
26
139
320
15
5497
3728
194
17
4
13
Full
15
580
912
285
446
79938
20594
9438
17
7033
I 19
48
1799
17564
15143
2664
68
17
193
10
3274
2572
180
11
16
14
8
97
1998-99
Partial
16
516
816
268
6827
59156
18534
11438
21
7200
l 01
55
1842
10029
12944
2474
72
15
148
5
4250
2572
115
11
12
14
8
92
(Number)
Total
17
1096
1728
553
7273
139094
39128
20876
38
14233
220
103
3641
27593
28087
5138
140
32
341
15
7524
5144
295
22
28
28
16
189
283294 154232 133262 287494 163040 139535 302575
Source : Rajasthan Khadi and Gramodyog Board, Jaipur
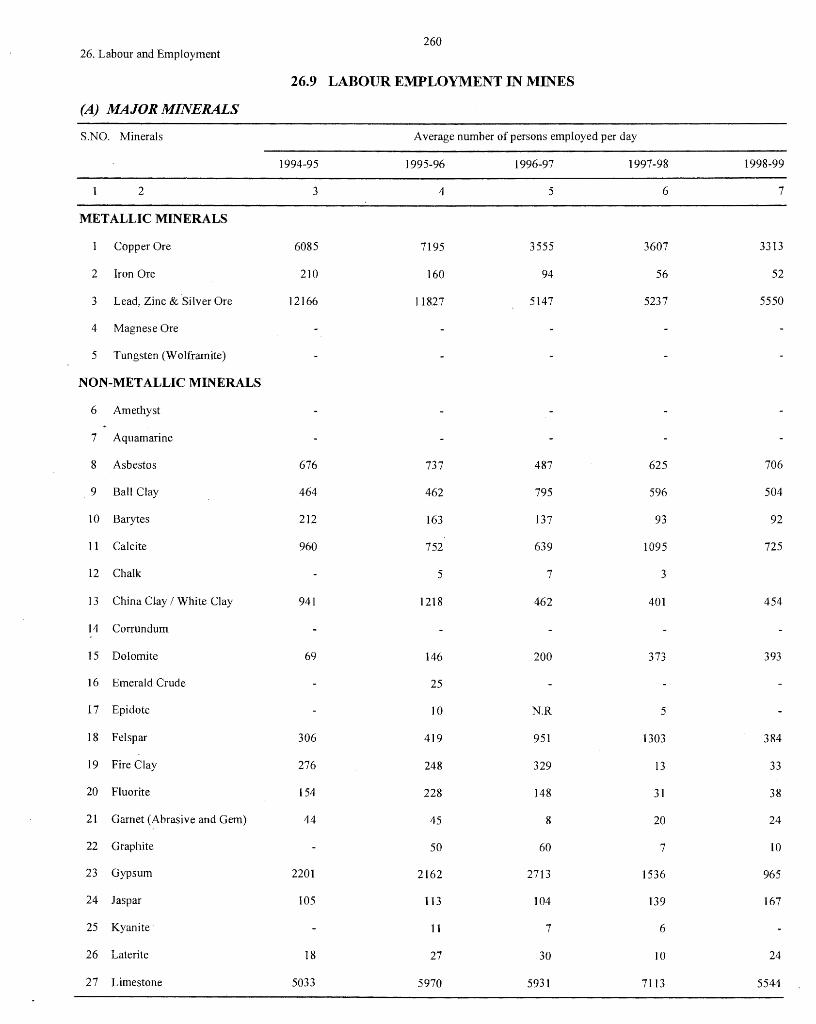
260 26. Labour and Employment
26.9 LABOUR KMPLOYMENT IN MINES
(A) MAJOR MINERALS
S.NO. Minerals Average number of persons employed per day
1994-95 1995-96 1996-97 1997-98 1998-99
2 3 4 5 6 7
METALLIC MINERALS
Copper Ore 6085 7195 3555 3607 3313
2 Iron Ore 210 160 94 56 52
3 Lead, Zinc & Silver Ore 12166 11827 5147 5237 5550
4 Magnese Ore
5 Tungsten (Wolframite)
NON-METALLIC MINERALS
6 Amethyst
7 Aquamarine
8 Asbestos 676 737 487 625 706
9 Ball Clay 464 462 795 596 504
10 Barytes 212 163 137 93 92
11 Calcite 960 752 639 1095 725
12 Chalk 5 7 3
13 China Clay I White Clay 941 1218 462 401 454
14 Corrundum
15 Dolomite 69 146 200 373 393
16 Emerald Crude 25
17 Epidote 10 N.R 5
18 Felspar 306 419 951 1303 384
19 Fire Clay 276 248 329 13 33
20 Fluorite 154 228 148 31 38
21 Garnet (Abrasive and Gem) 44 45 8 20 24
22 Graphite 50 60 7 10
23 Gypsum 2201 2162 2713 1536 965
24 Jaspar 105 113 104 139 167
25 Kyanite 11 7 6
26 Laterite 18 27 30 IO 24
27 Limestone 5033 5970 5931 7113 5544
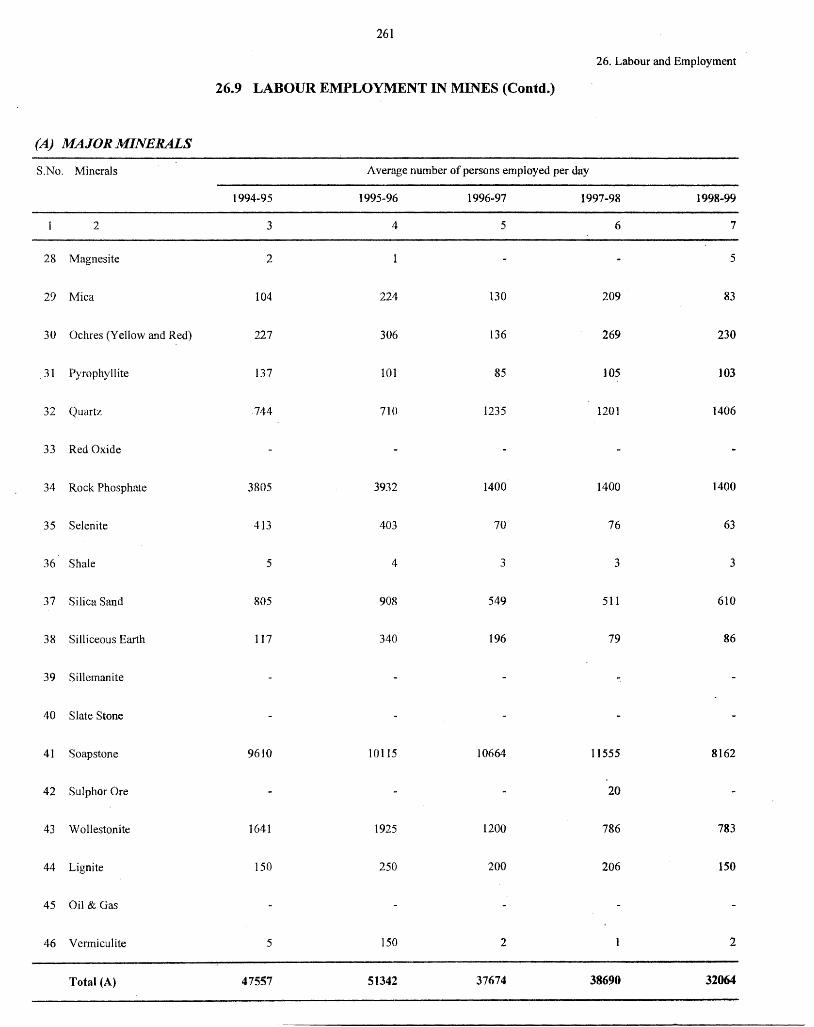
261
26. Labour and Employment
26.9 LABOUR EMPLOYMENT IN MINES (Contd.)
(A) MAJORMINERALS
S.No. Minerals Average number of persons employed per day
1994-95 1995-96 1996-97 1997-98 1998-99
2 3 4 5 6 7
28 Magnesite 2 5
29 Mica 104 224 130 209 83
30 Ochres (Yell ow and Red) 227 306 136 269 230
31 Pyrophyllite 137 101 85 105 103
32 Quartz 744 710 1235 1201 1406
33 Red Oxide
34 Rock Phosphate 3805 3932 1400 1400 1400
35 Selenite 413 403 70 76 63
36 Shale 5 4 3 3 3
37 Silica Sand 805 908 549 511 610
38 Silliceous Earth 117 340 196 79 86
39 Sillemanite
40 Slate Stone
41 Soapstone 9610 10115 10664 11555 8162
42 Sulphor Ore 20
43 Wollestonite 1641 1925 1200 786 783
44 Lignite 150 250 200 206 150
45 Oil &Gas
46 V crmiculite 5 150 2 2
Total (A) 47557 51342 37674 38690 32064
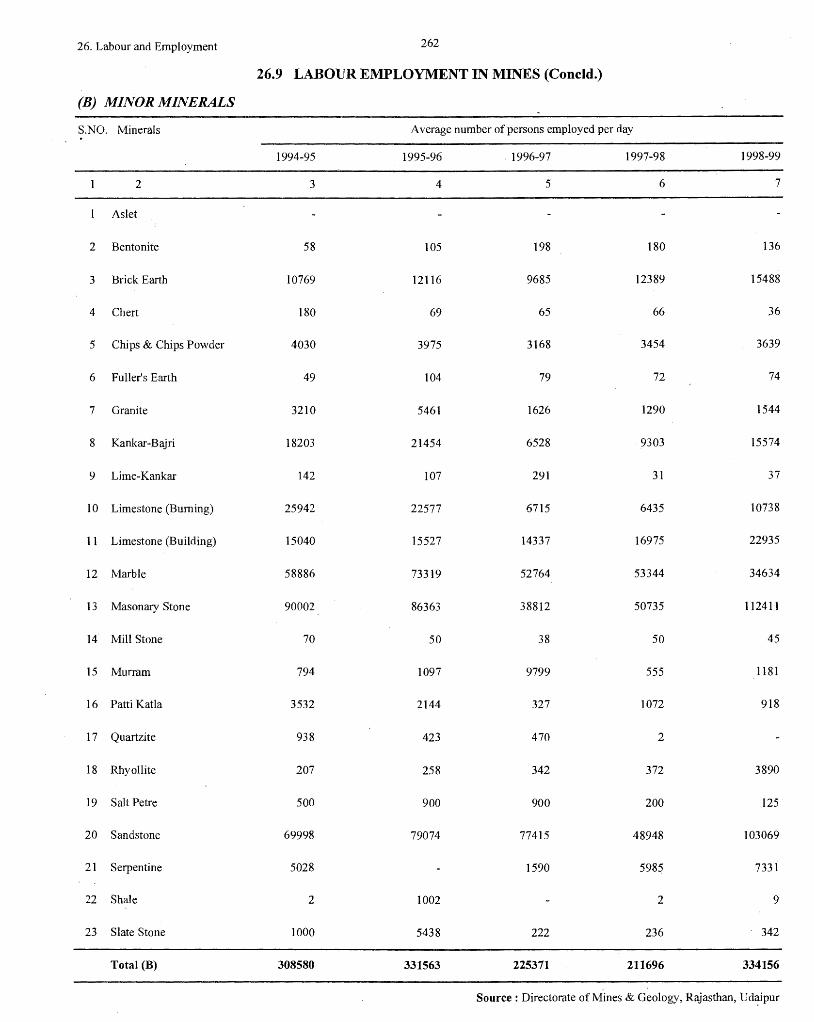
26. Labour and Employment 262
26.9 LABOUR EMPLOYMENT IN MINES (Concld.)
(B) MINOR MINERALS
S.NO . Minerals Average number of persons employed per day . 1994-95 1995-96 . 1996-97 1997-98 1998-99
2 3 4 5 6 7
As let
2 Bentonite 58 105 198 180 136
3 Brick Earth 10769 12116 9685 12389 15488
4 Chert 180 69 65 66 36
5 Chips & Chips Powder 4030 3975 3168 3454 3639
6 Fuller's Earth 49 104 79 72 74
7 Granite 3210 5461 1626 1290 1544
8 Kankar-Bajri 18203 21454 6528 9303 15574
9 Lime-Kankar 142 107 291 31 37
10 Limestone (Burning) 25942 22577 6715 6435 10738
11 Limestone (Building) 15040 15527 14337 16975 22935
12 Marble 58886 73319 52764 53344 34634
13 Masonary Stone 90002 86363 38812 50735 112411
14 Mill Stone 70 50 38 50 45
15 Murram 794 1097 9799 555 1181
16 Patti Katla 3532 2144 327 1072 918
17 Quartzite 938 423 470 2
18 Rhyollite 207 258 342 372 3890
19 Salt Petre 500 900 900 200 125
20 Sandstone 69998 79074 77415 48948 103069
21 Serpentine 5028 1590 5985 733 i
22 Shale 2 1002 2 9
23 Slate Stone 1000 5438 222 236 342
Total (B) 308580 331563 225371 211696 334156
Source: Directorate of Mines & Geology, Rajasthan, Ud~ipur
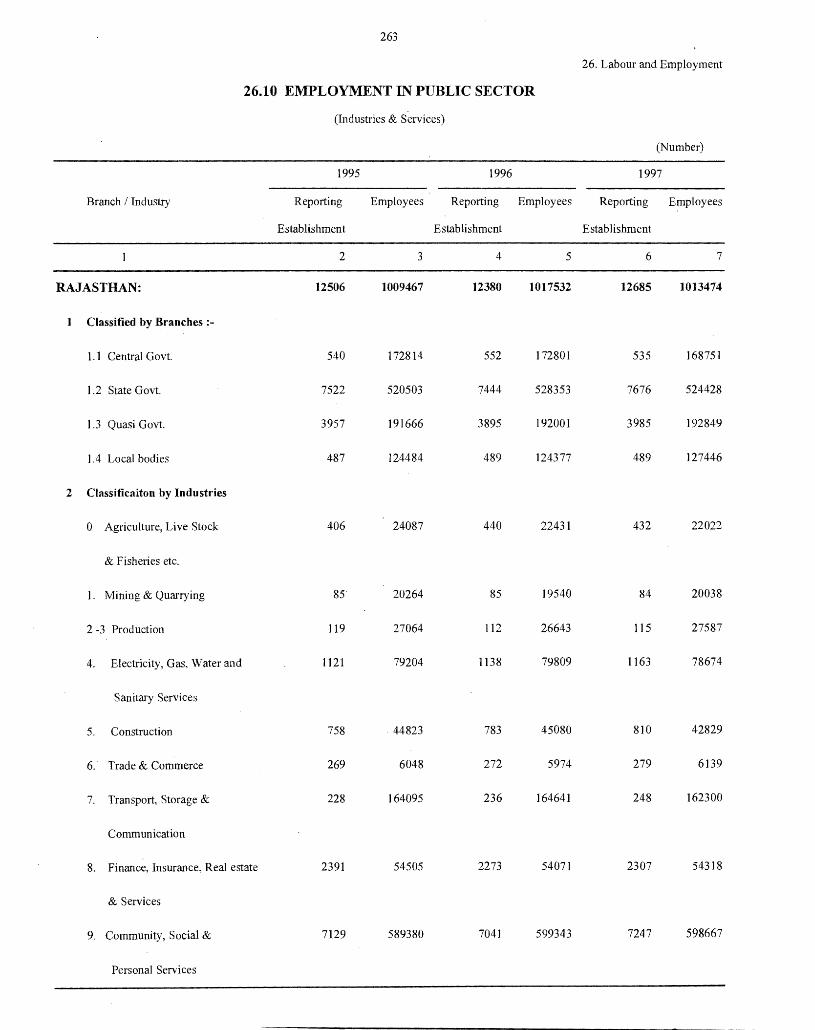
263
26. Labour and Employment
26.10 EMPLOYMENT IN PUBLIC SECTOR
(Industries & Services)
(Number)
1995 1996 1997
Branch I Industry Reporting Employees Reporting Employees Reporting Employees
Establishment Establishment Establishment
2 3 4 5 6 7
RAJASTHAN: 12506 1009467 12380 1017532 12685 1013474
1 Classified by Branches :-
1. 1 Central Govt. 540 172814 552 172801 535 168751
1.2 State Govt. 7522 520503 7444 528353 7676 524428
1.3 Quasi Govt. 3957 191666 3895 192001 3985 192849
1.4 Local bodies 487 124484 489 124377 489 127446
2 Classificaiton by Industries
0 Agriculture, Live Stock 406 24087 440 22431 432 22022
& Fisheries etc.
1. Mining & Quarrying 85 20264 85 19540 84 20038
2 -3 Production 119 27064 l 12 26643 115 27587
4. Electricity, Gas, Water and 1121 79204 1138 79809 1163 78674
Sanitary Services
5. Construction 758 44823 783 45080 810 42829
6. Trade & Commerce 269 6048 272 5974 279 6139
7. Transport, Storage & 228 164095 236 164641 248 162300
Communication
8. Finance, Insurance, Real estate 2391 54505 2273 54071 2307 54318
& Services
9. Community, Social & 7129 589380 7041 599343 7247 598667
Personal Services
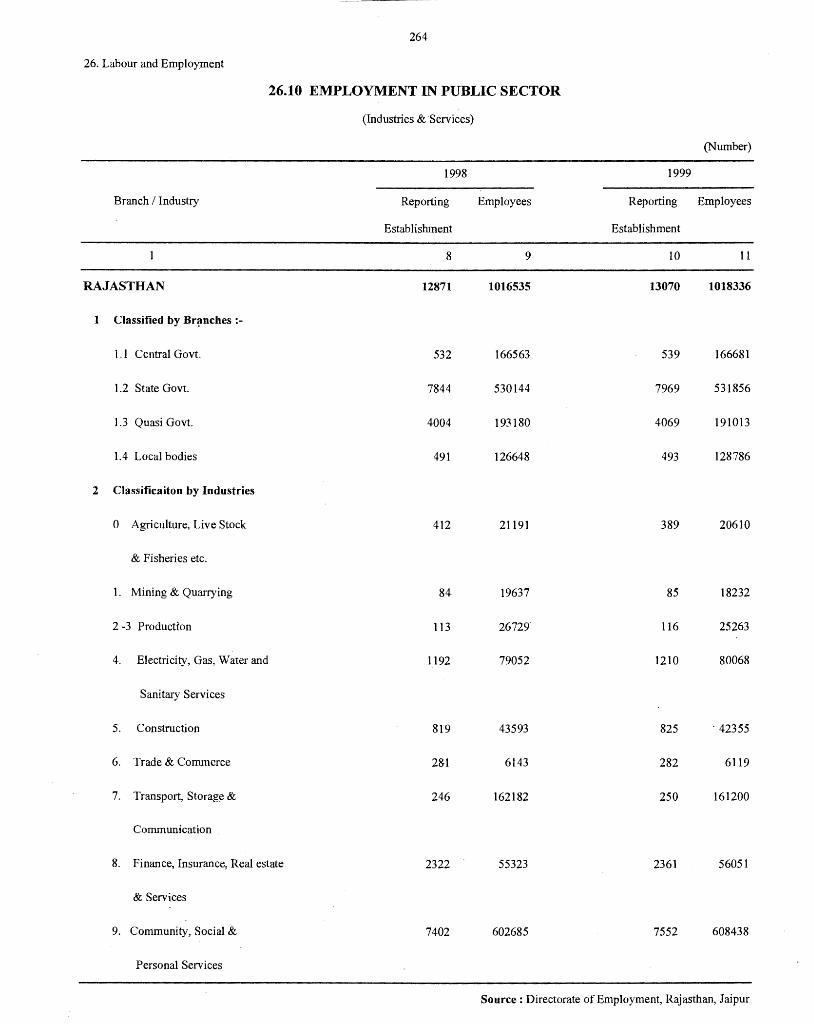
264
26. Labour and Employment
26.10 EMPLOYMENT IN PUBLIC SECTOR
(Industries & "Services)
(Number)
1998 1999
Branch I Industry Reporting Employees Reporting Employees
Establishment Establishment
8 9 10 11
RAJASTHAN 12871 1016535 13070 1018336
1 Classified by Br?nches :-
1. I Central Govt. 532 166563 539 166681
1.2 State Govt. 7844 530144 7969 531856
l .3 Quasi Govt. 4004 193180 4069 191013
1.4 Local bodies 491 126648 493 128786
2 Classificaiton by Industries
0 Agriculture, Live Stock 412 21191 389 20610
& Fisheries etc.
1. Mining & Quarrying 84 19637 85 18232
2 -3 Production 113 26729 116 25263
4. Electricity, Gas, Water and 1192 79052 1210 80068
Sanitary Services
5. Construction 819 43593 825 . 42355
6. Trade & Commerce 28-1 6143 282 6119
7. Transport, Storage & 246 162182 250 161200
Communication .
8. Finance, Insurance, Real estate 2322 55323 2361 56051
& Services
9. Community, Social & 7402 602685 7552 608438
Personal Services
Source : Directorate of Employment, Rajasthan, Jaipur
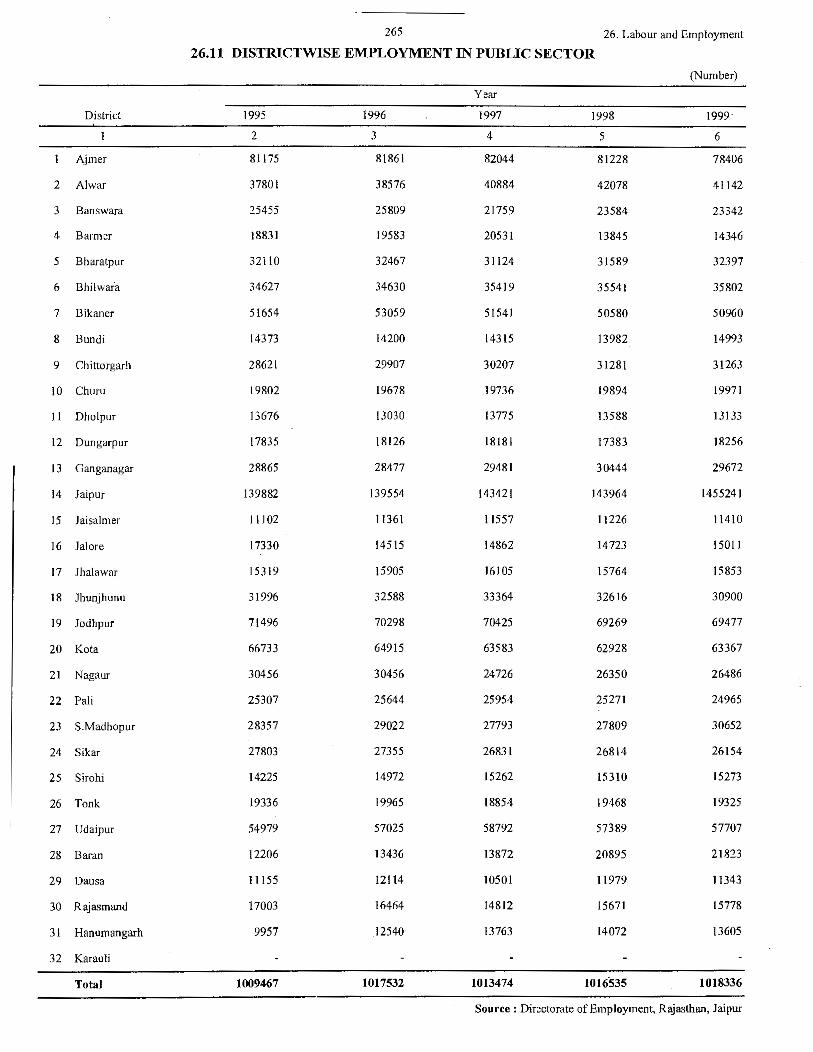
265 26. Labour and Employment
26.11 DISTRICTWISE EMPLOYMENT IN PUBLIC SECTOR
(Number)
Year
District 1995 1996 1997 1998 1999·
2 3 4 5 6
Ajn1er 81175 81861 82044 81228 78406
2 Al war 37801 38576 40884 42078 41142
3 Banswara 25455 25809 21759 23584 23342
4 Barn1er 18831 19583 20531 13845 14346
5 Bharatpur 32110 32467 31124 31589 32397
6 Bhilwaia 34627 34630 35419 35541 35802
7 Bikaner 51654 53059 51541 50580 50960
8 Bundi 14373 14200 14315 13982 14993
9 Chittorgarh 28621 29907 30207 31281 31263
10 Churu 19802 19678 19736 19894 19971
11 Dholpur 13676 13030 13775 13588 13133
12 Dungarpur 17835 18126 18181 17383 18256
13 Ganganagar 28865 28477 29481 30444 29672
14 Jaipur 139882 139554 143421 143964 1455241
15 Jaisaln1er 11102 11361 11557 11226 11410
16 Jal ore 17330 14515 14862 14723 15011
17 JhaJa,var 15319 15905 16105 15764 15853
18 Jhunjhunu 31996 32588 33364 32616 30900
19 Jodhpur 71496 70298 70425 69269 69477
20 Kot a 66733 64915 63583 62928 63367
21 Nagaur 30456 30456 24726 26350 26486
22 Pali 25307 25644 25954 25271 24965
23 S.Madhopur 28357 29022 27793 27809 30652
24 Sikar 27803 27355 26831 26814 26154
25 Sirohi 14225 14972 15262 15310 15273
26 Tonk 19336 19965 18854 19468 19325
27 Udaipur 54979 57025 58792 57389 57707
28 Baran 12206 13436 13872 20895 21823
29 Daus a 11155 12114 10501 11979 11343
30 Rajasmand 17003 16464 14812 15671 15778
31 Hanumangarh 9957 12540 13763 14072 13605
32 Karau1i
Total 1009467 1017532 1013474 1016535 1018336
Source : Directorate of EmpJoyment, Rajasthan, Jaipur
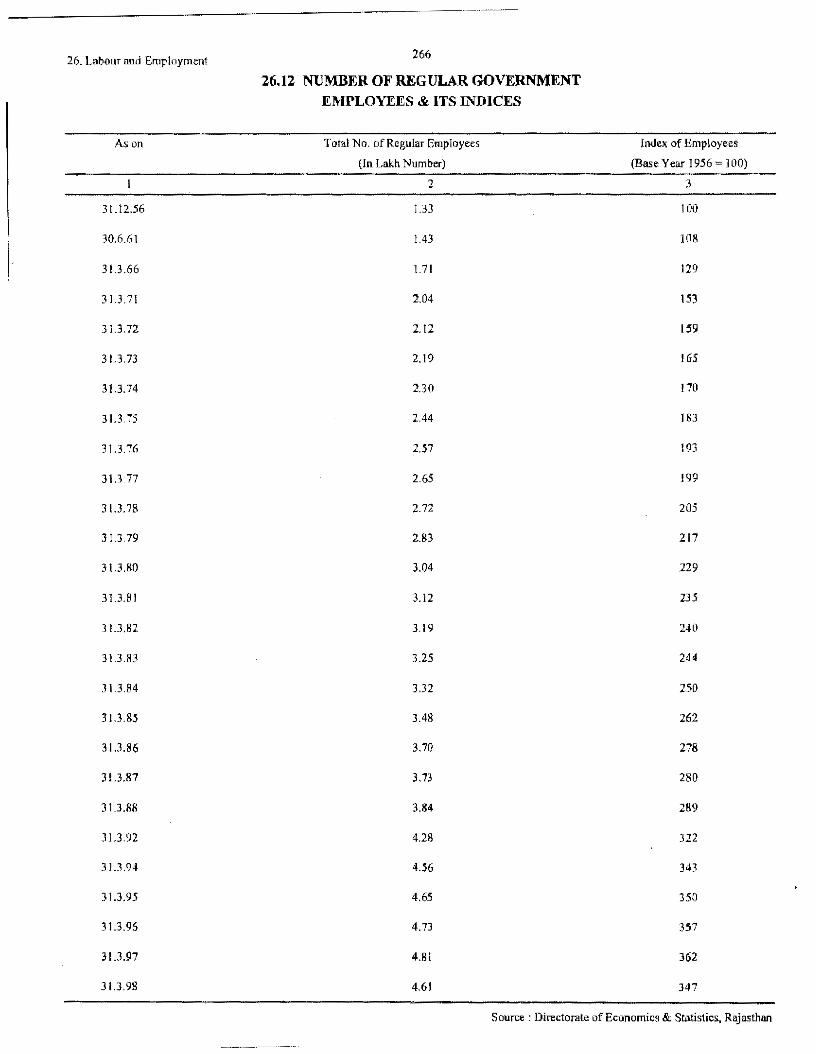
-----------------------·-~ ·-·-·-·--·-
26. Labour and Employmenl
As on
31.12.56
I J0.0.61
31.3.66
313.71
3 l.3.72
3 l.3.73
31.3.74
31.3 75
31.3.76
31.3 77
3 l.3. 78
3 l.3.79
31.3.80
31.3.81
31.3.82
31.3.83
31.3.84
3 l.3.85
31.3.86
31.3.87
31.3.88
31.3.92
31.3.94
31.3.95
31.3.96
31.3.97
31.3.98
266
26.12 NUMBER OF REGULAR GOVERNMENT EMPLOYEES & ITS INDICES
Total No. of Regular Employees
(Jn Lakh :>lumber}
2
1.33
1.43
171
2.04
2.12
2.19
2.30
2.44
2.57
2.65
2.72
2.83
3.04
3.12
3.19
3.25
3.32
3.48
3.70
3.73
3.84
4.28
4.56
4.65
4.73
4.81
4.61
Index of Employees
(Base Year 1956 ~JOO}
3
100
108
129
153
159
165
170
183
193
199
205
217
229
235
240
244
250
262
278
280
289
322
343
350
357
362
347
Source : Directorate of Economics & Statistics, Raja.<;than
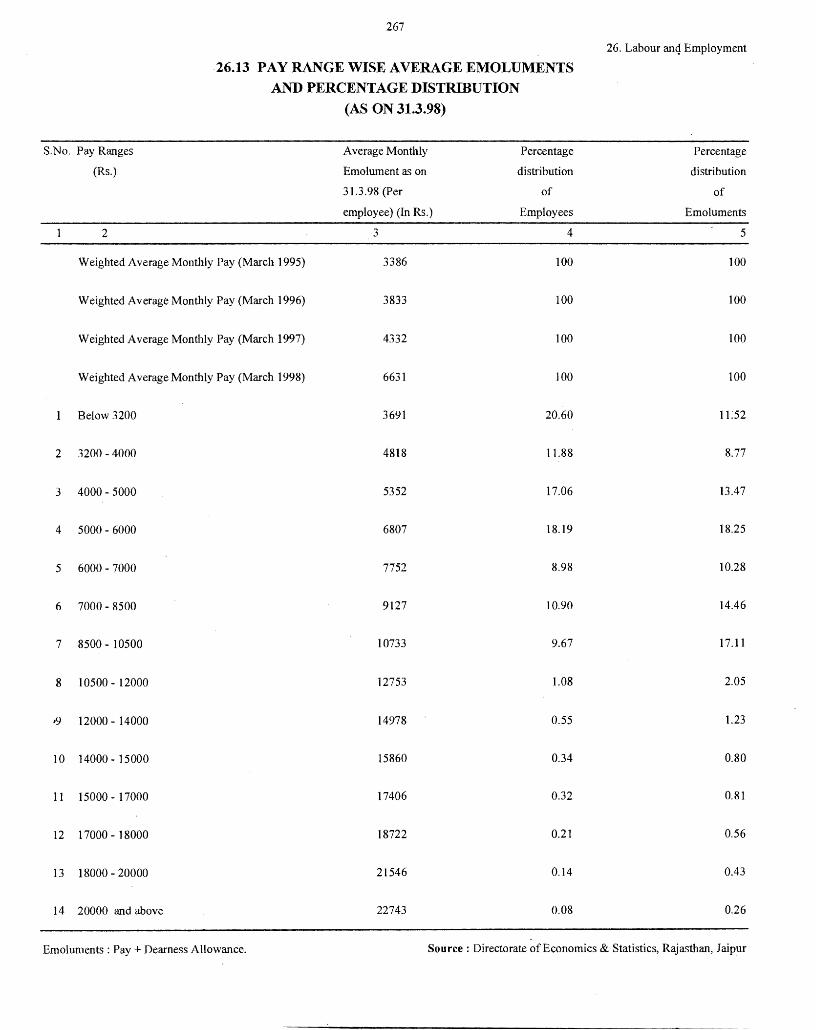
267
26.13 PAY RANGE WISE AVERAGE EMOLUMENTS AND PERCENTAGE DISTRIBUTION
S.No. Pay Ranges
(Rs.)
2
Weighted Average Monthly Pay (March 1995)
Weighted Average Monthly Pay (March 1996)
Weighted Average Monthly Pay (March 1997)
Weighted Average Monthly Pay (March 1998)
Below 3200
2 3200 -4000
3 4000- 5000
4 5000- 6000
5 6000 - 7000
6 7000- 8500
7 8500 - 10500
8 10500 - 12000
,9 12000 - 14000
10 14000- 15000
11 I 5000 - 17000
12 17000 - 18000
13 18000 - 20000
14 20000 and above
(AS ON 31.3.98)
Average Monthly Percentage
Emolument as on distribution
31.3.98 (Per of
employee) (In Rs.) Employees
3 4
3386 100
3833 100
4332 100
6631 100
3691 20.60
4818 11.88
5352 17.06
6807 18.19
7752 8.98
9127 10.90
10733 9.67
12753 1.08
14978 0.55
15860 0.34
17406 0.32
18722 0.21
21546 0.14
22743 0.08
26. Labour anq Employment
Percentage
distribution
of
Emoluments
5
100
100
100
100
l L52
8.77
13.47
18.25
10.28
14.46
17.11
2.05
1.23
0.80
0.81
0.56
0.43
0.26
Emoluments : Pay + Dearness Allowance. Source: Directorate of Economics & Statistics, Rajasthan, Jaipur
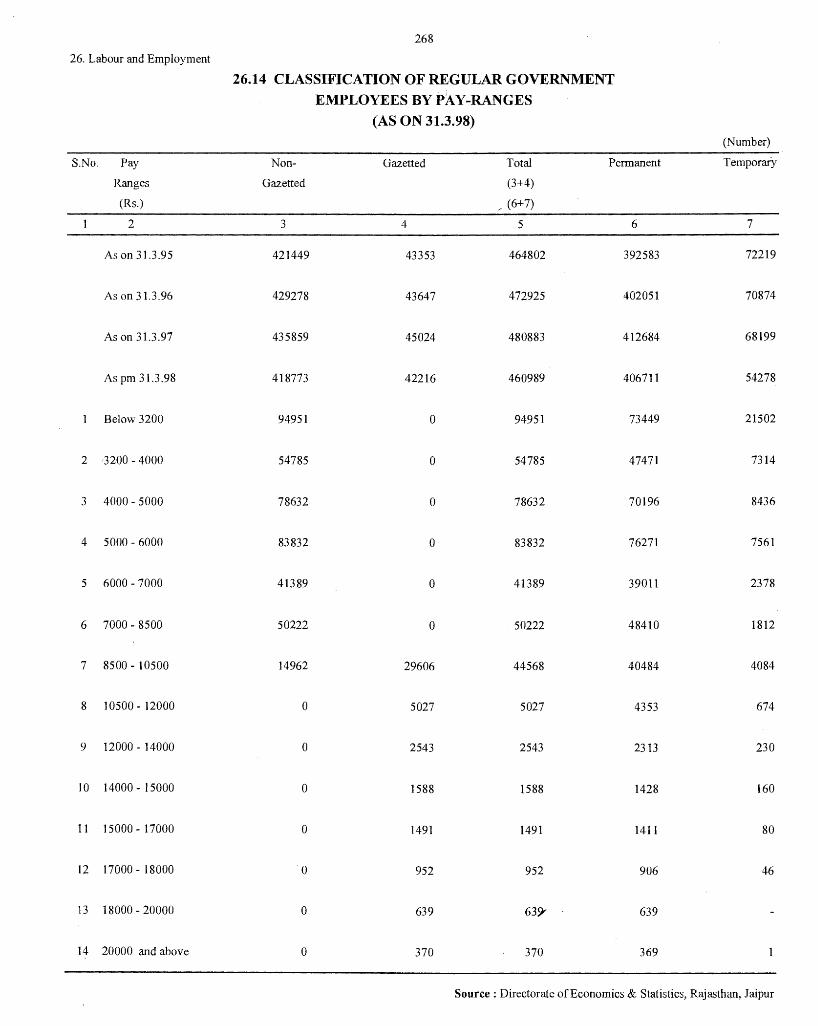
268
26. Labour and Employment
26.14 CLASSIFICATION OF REGULAR GOVERNMENT
EMPLOYEES BY PAY-RANGES
(AS ON 31.3.98) (Number)
S.No. Pay Non- Gazetted Total Permanent Temporary
Ranges Gazetted (3+4)
(Rs.) / (6+7)
2 3 4 5 6 7
As on 31.3.95 421449 43353 464802 392583 72219
As on 31.3.96 429278 43647 472925 402051 70874
As on 31.3.97 435859 45024 480883 412684 68199
As pm 31.3.98 418773 42216 460989 406711 54278
Below 3200 94951 0 94951 73449 21502
2 3200 - 4000 54785 0 54785 47471 7314
3 4000 - 5000 78632 0 78632 70196 8436
4 5000 - 6000 83832 0 83832 76271 7561
5 6000 - 7000 41389 0 41389 39011 2378
6 7000 - 8500 50222 0 50222 48410 1812
7 8500 - 10500 14962 29606 44568 40484 4084
8 10500 - 12000 0 5027 5027 4353 674
9 12000 - 14000 0 2543 2543 2313 230
10 14000 - 15000 0 1588 1588 1428 160
11 15000 - 17000 0 1491 1491 1411 80
12 17000 - 18000 0 952 952 906 46
13 18000 - 20000 0 639 639" 639
14 20000 and above 0 370 370 369
Source: Directorate of Economics & Statistics, Rajasthan, Jaipur
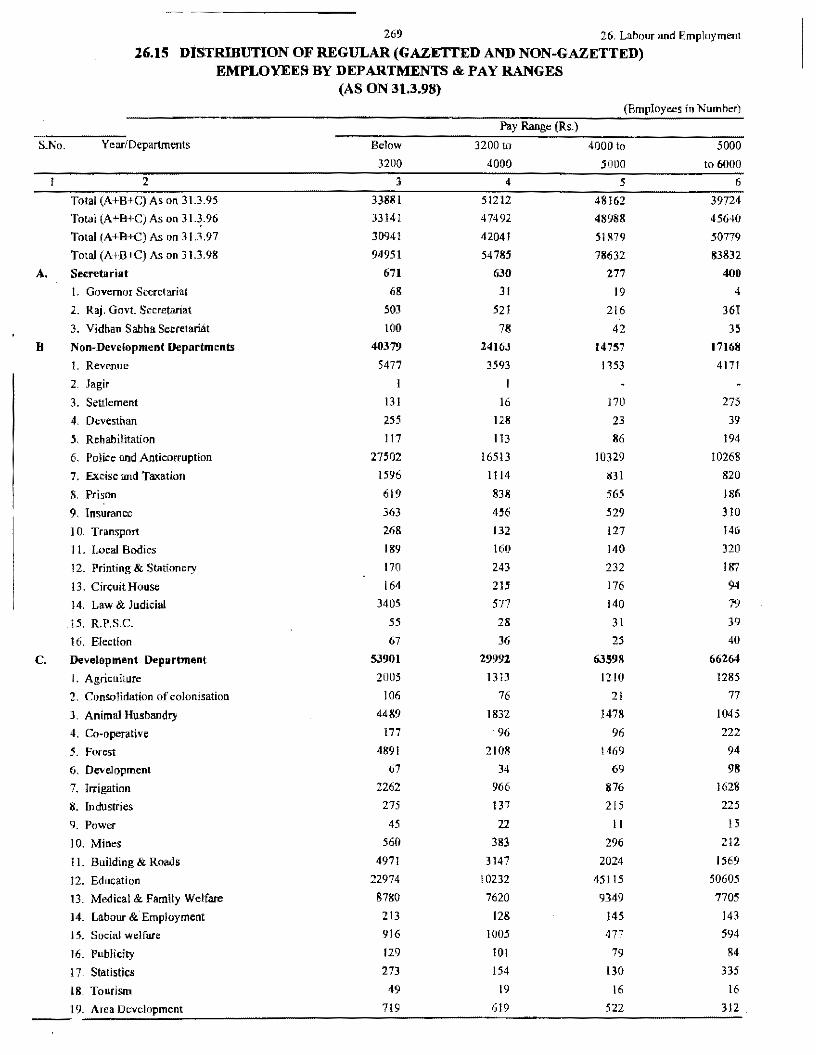
269 26. Labour and Employment
26.15 DISTRIBUTION OF REGULAR (GAZETTED AND NON-GAZETTED) EMPLOYEES BY DEPARTMENTS & PAY RANGES
(AS ON 31.3.98) (Employees in Number)
Pay Range (Rs.)
S.Ko. Year/Departments Below 3200 to 4000 to 5000
3200 4000 5000 to 6000
2 , 4 5 6
Total (A+B+C) As on 31.3.95 33881 51212 48162 39724
Total (A•B+C) As on 31.3.96 33141 47492 48988 45640
Total (A+B+c) As on 31.3.97 30941 42041 51879 50779
Total (At-B+C) As on 31.3.98 9495! 54785 78632 83832
A. s~~tariat 671 630 277 400
1. Governor Secretariat 68 3! 19 4
2. Raj. Govt Secretariat 503 521 216 361
3. Vidhan Sabha Secretariat 100 78 42 35 B Non-Development Departments 40379 24163 14757 17168
1. Revenue 5477 3593 1353 4171
2. Jagir
3. Settlement 131 16 170 275
4. Devesthan 255 128 23 39
5. Rehabilitation 117 l l 3 86 194
6. Police and Anticorruption 27502 16513 10329 10268
7. Excise and Taxation 1596 1114 831 820
8. Prison 619 838 565 186
9. Insurance 363 456 529 310
l 0. Transport 268 132 127 146
1 l. Local Bodies 189 160 140 320
l 2. Printing & Stationery 170 243 232 187
13. Cin;uitHouse 164 215 176 94
14. Law & Judicial 3405 577 140 79
. !5. R.P.S.C. 55 28 31 39
16. Election 67 36 25 40
c. Development Department 53901 29992 63598 66264
l. Agriculture 2005 1313 !210 1285
2, Consolidation of colonisation 106 76 21 77
3. Animal Husbandry 4489 !832 1478 1045
4. Co-operative 177 96 96 222
5. Forest 4891 2108 1469 94
6. Development 67 34 69 98
7. Irrigation 2262 966 876 1628
8. Industries 275 137 215 225
9. Power 45 22 11 15
10. Mines 560 383 296 212
11. Building & Roads 4971 3147 2024 1569
12. Education 22974 !0232 45115 50605
13. Medical & Family Welfure 8780 7620 9349 7705
14. Labour & Employment 213 128 145 143
J 5. Socia? welfare 916 1005 477 594
16. Publicity 129 !01 79 84
17. Statistics 273 154 130 335
18. Tourism 49 19 16 16
19. Area Development 719 619 522 3!2
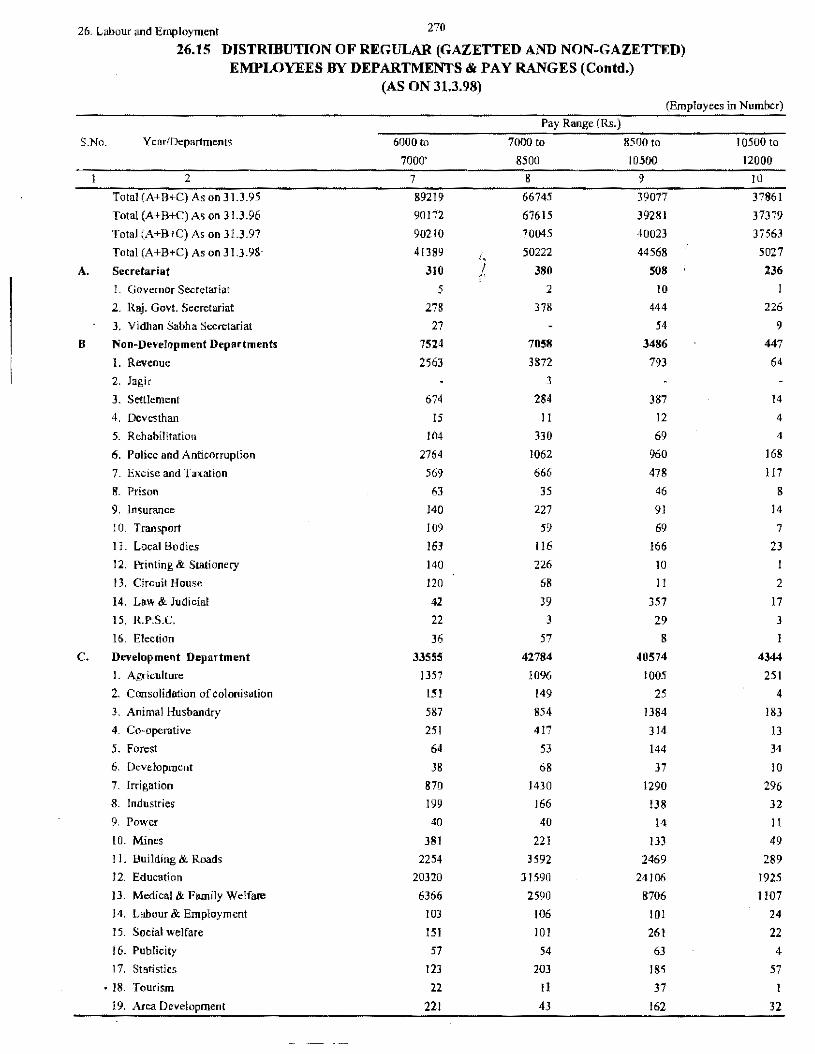
26. Labour and Employment 270
26.15 DISTRIBUTION OF REGULAR (GAZETTED AND NON-GAZETTED) EMPLOYEES BY DEPARTMENTS & PAY RANGES (Contd.)
(AS ON 31.3.98) (Empioyees in Number)
Pay Range (Rs.)
S.No. Y car/Departments 6000 to 7000 to 8500 to 10500 to
7000' 8500 10500 12000
2 7 8 9 IO
Total (A+B+C) As on 31.3.95 89219 66745 39077 37861
Total (A+B+C) As on 3 U.96 90172 67615 39281 37379
Total (A+B+C) As on 31.3.97 90210 70045 40023 37563
Total (A+B+C) As on 31.3.98· 41389
~; 50222 44568 5027
A. Secretariat 3!0 380 508 236
' l. Governor Secretariat 5 2 10
2. Riti· Govt Secretariat 278 378 444 226
3. Vidhan Sabha Secretariat 27 54 9
B Non~DeveJopment Departments 7524 7058 3486 447
1. Revenue 2563 3872 793 64
2. Jagir 3
3. Settlen1ent 674 284 387 14
4. Dcvesthan 15 l l 12 4
5. RehabiHtation 104 330 69 4
6. Police and J\.nticorruption 2764 1062 960 168
7. Excise and Taxation 569 666 478 I 17
8. Prison 63 35 46 8
9. Insurance 140 227 91 14
l 0. Transport !09 59 69 7
l l. Local Bodies 163 116 166 23
12. Printing & Stationery 140 226 JO
! J. Circuit House 120 68 l l 2
14. Law & Judicial 42 39 357 17
15. R.P.S.C. 22 J 29 3
16. Election 36 57 8
c. Development Department 33555 42784 40574 4344
l. Agriculture 1357 10% 1005 251
2. Consolidation of colonisation 151 149 25 4
3. Animal Husbandry 587 854 1384 183
4. Co~operative 251 417 314 13 5. Forest 64 53 144 34
6. Development 38 68 37 10
7. Irrigation 870 1430 1290 296
8. Industries 199 166 138 32
9. Power 40 40 14 ! I
to. Mines 381 221 133 49
11. Building & Roads 2254 3592 2469 289
12. Education 20320 31590 24106 1925
13. Medical & Family Welfare 6366 2590 8706 l 107
14. Labour & Employment !OJ 106 101 24
15. Social welfare 151 JO! 261 22
16. Publicity 57 54 63 4
17. Statistics 123 203 185 57
• 18. Tourism 22 II 37 I
19. Area Development 221 43 162 32
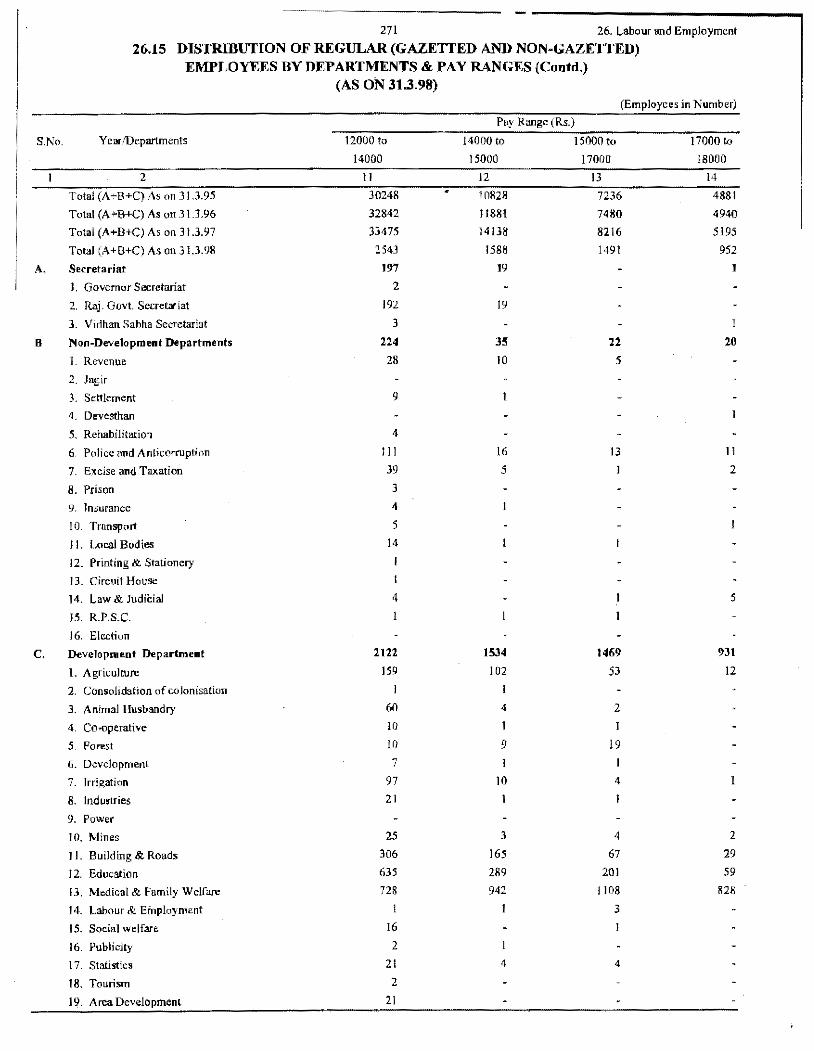
S.No.
A.
B
c.
--····------------271 26. Labour and Employment
26.15 DISTRIBUTION OF REGULAR (GAZETTED AND NON-GAZETTED) EMPJ,OYEES BY DEPARTMENTS & PAY RANGES (Contd.)
YcarfDepartments
2
Total (A.,.B+C) As on 31.3.95
Total (A +B+C) A• on 31.3.96
Total (A+B+C) As on 31.3.97
Total (A+B+C) As on 31.3.98
Secretariat
I, Governor Secretariat
2. Raj. Govt Secretariat
3. V 1dhan Sabha Secretariat
Non-Development Departments
1. Revenue
2. Jagir
3. Settlement
4. Devesthan
5. Rehabilitation
6. Police and Anticorruption
7. Excise and Taxation
8. Prison
9. lnsurance
I 0. Transport
11. Local Bodies
12. Printing & Stationery
J 3. Circuit House
14. Law & Judicial
15. R.P.S.C.
16. Election
Development Department
L Agriculture
2. Consolidation of colonisation
3. Animal Husbandry
4. Co..operative
5. Forest
6. Development
7. Irrigation
8. Industries
9. Power
JO. Mines
11. Building & Roads
I 2. Education
13. Medical & Family Welfare
14. Labour & Employment
15. Social \Velfare
16. Publicity
l 7. Statistics
18. Tourism
J 9, Area Development
(AS ON 31.3.98)
12000 to
14000
II
30248
32842
33475
2543
197
2
192
3
224
28
9
4
l 11
39
3
4
5
14
1
I
4
2122
159
I
60
10
10
7 97
21
25
306
635
728
16
2
21
2
21
(Employees in Number)
Pay Range (Rs.)
14000 to
15000
15000 to 17000 to
12
10828
11881
14138
1588
19
19
35
JO
16
5
1534
102
I
4
I
9
JO
I
3
165
289
942
I
4
17000
13
7236
7480
8216
1491
22
5
13
1469
53
2
I
19
4
4
67
201
I 108
3
4
18000
14
4881
4940
5195
952
I
20
11
2
5
931
12
2
29
59
828
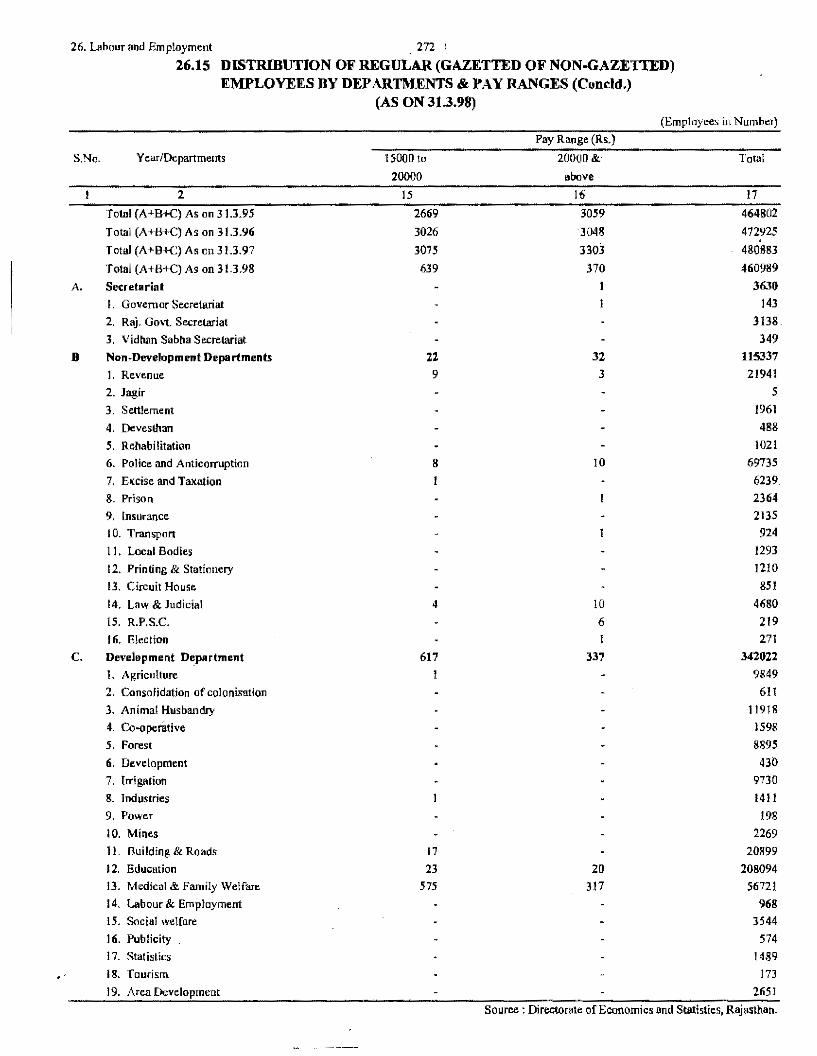
..
26. Labour and Employment 272 I
S.No.
A.
B
c.
26.15 DISTRIBUTION OF REGULAR (GAZETTED OF NON-GAZETIED) EMPLOYEES BY DEPARTMENTS & PAY RANGES (Concld.)
Year/Departments
2
Total (A+B+C) As on 3 J.3.95
Total (A+B+C) As on 31.3.96
Total (A+B+q As on 31.3.97
Total (A+B+C) As on 31.3.98
Secretariat t. Goven1or Secretariat 2. Raj. Govt. Secretariat 3. Vidhan Sabha Secretariat
Non-Development Departments
1. Revenue
2. Jngir
3, Settlement
4, Devesthan
5. Rehabilitation
6. Police and Anticorruption
7. Excise and Taxation
8. Prison 9, Insurance
10. Transport
11. Local Bodies
12. Printing & Stationery 13. Circuit House
14. Law & Judicial
15. R.P.S.C.
16. Election
Development D~partment I. Agriculture
2. Consofidation of colonisation
3. Animal Husbandry
4, Co.aper3tive
5. Forest 6. Development
7. Irrigation 8. Industries
9. Power
10. Mines
11. Building & Roads
12. Education
13. Medical & Family Welfare
14. Labour & Employment
15. Social welfare
16. Publicity
17. Statistics
18. Tourism
19. Aren Development
(AS ON 31.3.98)
15000 to
20000
15
2669
3026
3075
639
22 9
8
4
617
I
17
23
575
Pay Range (Rs.)
20000&
above
16
3059
3048
3303
370
32
3
IO
10 6
337
20
317
(Employees in Nu1nber)
Total
17
464802
472925 480883
460989
3630
143
3138.
349
115337
21941
5 1961
488
1021
69735
6239
2364
2135
924 1293 1210
851
4680
219 271
342022
9849
6!!
11918
1598
8895
430
9730
1411 198
2269 20899
208094 56721
968
3544 574
1489 173
2651
Source : Directorate of Economics and Statisties, Rajasthan.
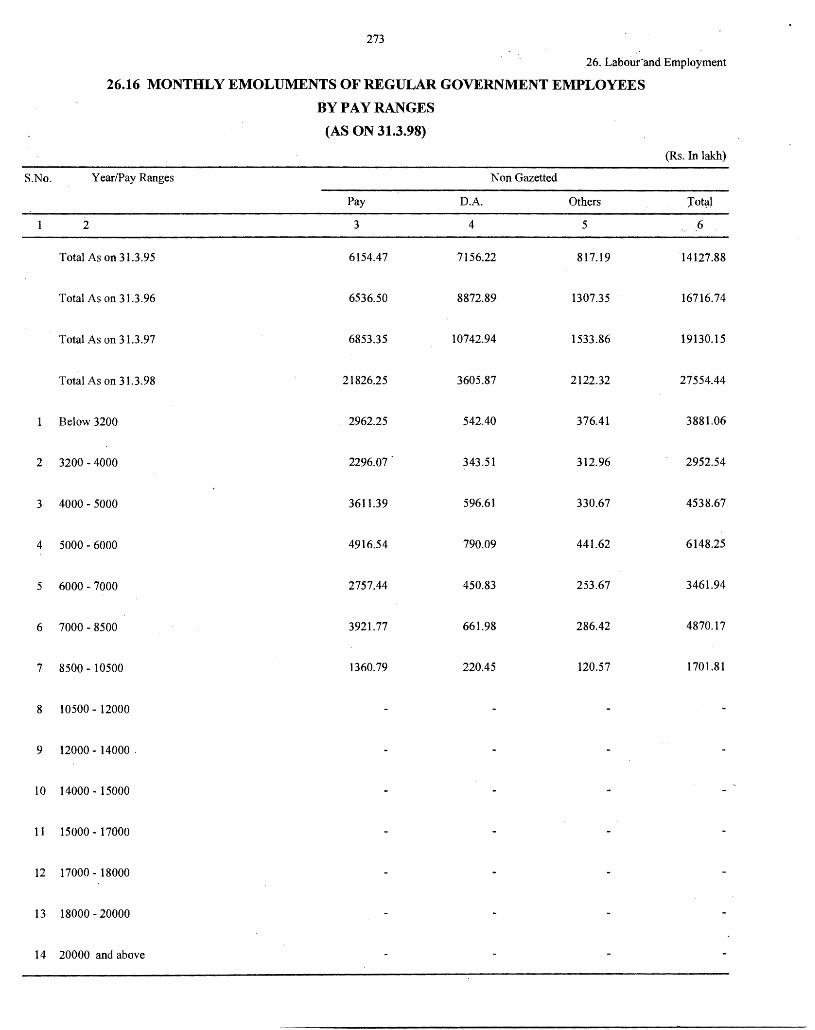
S.No.
2
3
4
5
6
7
8
9
IO
11
12
13
14
273
.26. Labm.ir·anct Employment
26.16 MONTHLY EMOLUMENTS OF REGULAR GOVERNMENT EMPLOYEES
BY PAY RANGES
(AS ON 31.3.98)
(Rs. In lakh)
Year/Pay Ranges Non Gazetted
Pay D.A. Others Tot~l
2 3 4 5 6
Total As on 31.3.95 6154.47 7156.22 817.19 14127.88
Total As on 31.3.96 6536.50 8872.89 1307.35 16716.74
Total As on 31.3.97 6853.35 10742.94 1533.86 19130.15
Total As on 31.3.98 21826.25 3605.87 2122.32 27554.44
Below 3200 2962.25 542.40 376.41 3881.06
3200 - 4000 2296.07 343.51 312.96 2952.54
4000- 5000 3611.39 596.61 330.67 4538.67
5000- 6000 4916.54 790.09 441.62 6148.25
6000 - 7000 2757.44 450.83 253.67 3461.94
7000 - 8500 3921.77 661.98 286.42 4870.17
8500 - 10500 1360.79 220.45 120.57 1701.81
10500 - 12000
12000 - 14000 .
14000 - 15000
15000 - 17000
17000 - 18000
18000 - 20000
20000 and above
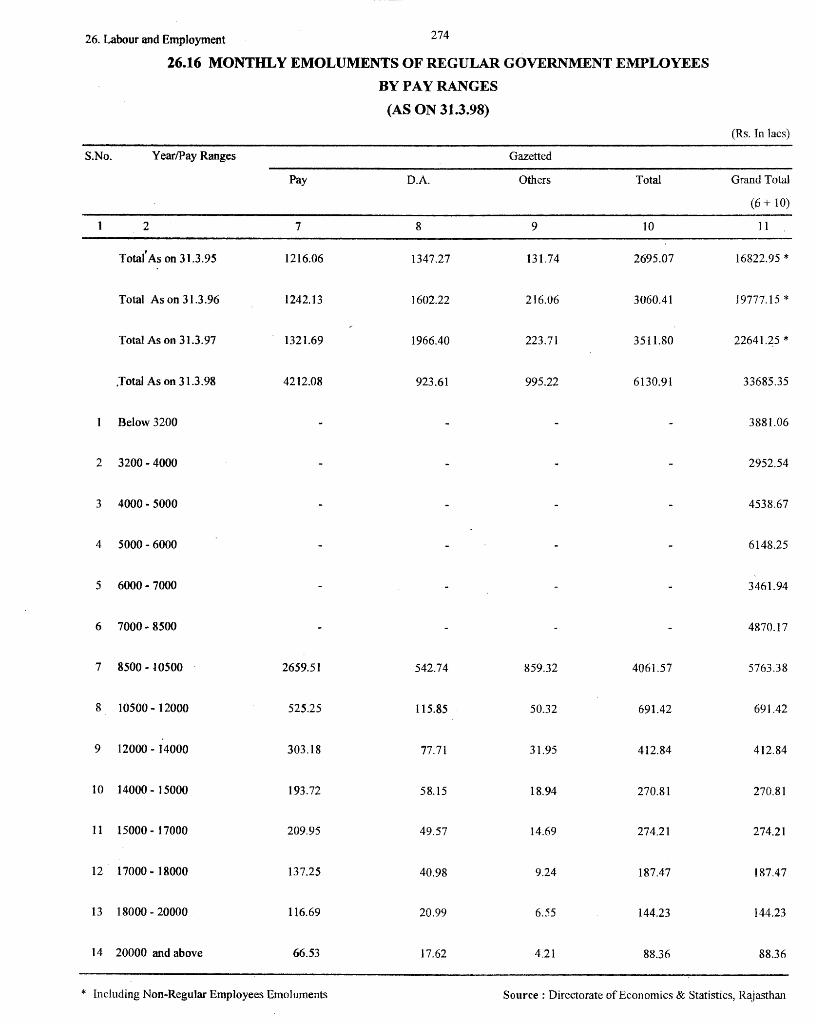
26. Labour and Employment 274
26.16 MONTHLY EMOLUMENTS OF REGULAR GOVERNMENT EMPLOYEES
BY PAY RANGES
(AS ON 31.3.98)
(Rs. In lacs)
S.No. Year/Pay Ranges Gazetted
Pay D.A. Others Total Grand Tota]
(6 + 10)
2 7 8 9 IO ] 1
Total' As on 31.3.95 1216.06 1347.27 131.74 2695.07 16822.95 *
Total As on 31.3.96 1242.13 1602.22 216.06 3060.41 19777.15 *
Total As on 31.3.97 1321.69 1966.40 223.71 3511.80 22641.25 *
.Total As on 31.3.98 4212.08 923.61 995.22 6130.91 33685.35
Below 3200 3881.06
2 3200-4000 2952.54
3 4000- 5000 4538.67
4 5000-6000 6148.25
5 6000- 7000 3461.94
6 7000- 8500 4870.17
7 8500- t0500 2659.51 542.74 859.32 4061.57 5763.38
8 10500 - 12000 525.25 115.85 50.32 691.42 691 .42
9 12000 - 14000 303.18 77.71 31.95 412.84 412.84
10 14000 - J 5000 193.72 58.15 18.94 270.81 270.81
11 15000 - 17000 209.95 49.57 14.69 274.21 274.21
12 l 7000 - 18000 137.25 40.98 9.24 187.47 187.47
13 18000 - 20000 116.69 20.99 6.55 144.23 144.23
14 20000 and above 66.53 17.62 4.21 88.36 88.36
* Including Non-Regular Employees Emoluments Source : Directorate of Economics & Statistics, Rajasthan
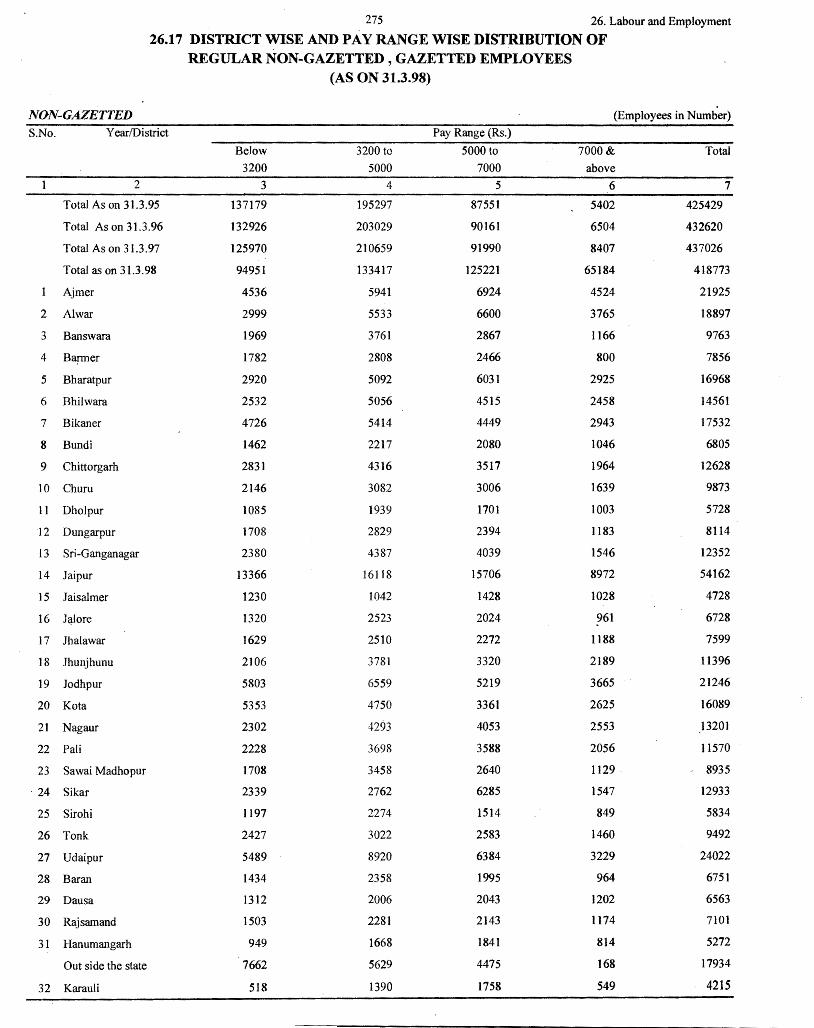
275 26. Labour and Employment
26.17 DISTRICT WISE AND PAY RANGE WISE DISTRIBUTION OF
NON-GAZETTED S.No. Year/District
2
Total As on 31.3.95
Total As on 31.3.96
Total As on 31.3.97
Total as on 31.3.98
Ajmer
2 Alwar
3 Banswara
4 Bap:ner
5 Bharatpur
6 Bhilwara
7 Bikaner
8 Bundi
9 Chittorgarh
10 Churu
11 Dholpur
12 Dungarpur
13 Sri-Ganganagar
14 Jaipur
15 Jaisalmer
16 JC!lore
17 Jhalawar
18 Jhunjhunu
19 Jodhpur
20 Kota
21 Nagaur
22 Pali
23 Sawai Madhopur
· 24 Sikar
25 Sirohi
26 Tonk
27 Udaipur
28 Baran
29 Dausa
30 Rajsamand
31 Hanumangarh
Out side the state
32 Karauli
REGULAR NON-GAZETTED , GAZETTED EMPLOYEES
Below 3200
3
137179
132926
125970
94951
4536
2999
1969
1782
2920
2532
4726
1462
2831
2146
1085
1708
2380
13366
1230
1320
1629
2106
5803
5353
2302
2228
1708
2339
1197
2427
5489
1434
1312
1503
949
7662
518
(AS ON 31.3.98)
3200 to 5000
4
195297
203029
210659
133417
5941
5533
3761
2808
5092
5056
5414
2217
4316
3082
1939
2829
4387
16118
1042
2523
2510
3781
6559
4750
4293
3698
3458
2762
2274
3022
8920
2358
2006
2281
1668
5629
1390
Pay Range (Rs.)
5000 to 7000
5
87551
90161
91990
125221
6924
6600
2867
2466
6031
4515
4449
2080
3517
3006
1701
2394
4039
15706
1428
2024
2272
3320
5219
3361
4053
3588
2640
6285
1514
2583
6384
1995
2043
2143
1841
4475
1758
(Employees in Number)
7000& above
6
5402
6504
8407
65184
4524
3765
1166
800
2925
2458
2943
1046
1964
1639
1003
1183
1546
8972
1028
961
1188
2189
3665
2625
2553
2056
1129
1547
849
1460
3229
964
1202
1174
814
168
549
Total
425429
432620
437026
7
418773
21925
18897
9763
7856
16968
14561
17532
6805
12628
9873
5728
8114
12352
54162
4728
6728
7599
11396
21246
16089
13201
11570
8935
12933
5834
9492
24022
6751
6563
7101
5272
17934
4215
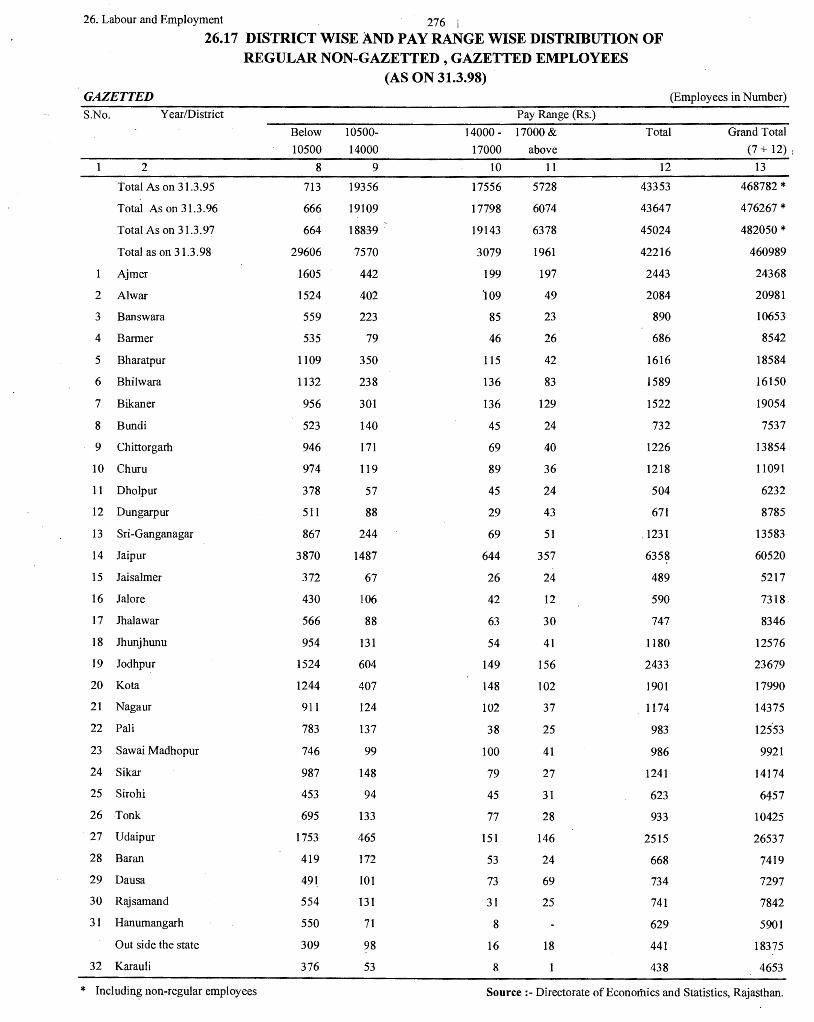
26. Labour and Employment ' 276 i
26.17 DISTRICT WISE AND PAY RANGE WISE DISTRIBUTION OF REGULAR NON-GAZETTED , GAZETTED EMPLOYEES
(AS ON 31.3.98) GAZETTED (Employees in Number) S.No. Year/District
2
Total As on 31.3.95
Total As on 31.3.96
Total As on 31.3.97
Total as on 31.3.98
Ajmer
2 Alwar
3 Banswara
4 Barmer
5 Bharatpur
6 Bhilwara
7 Bikaner
8 Bundi
9 Chittorgarh
10 Chum
11 Dholpur
12 Dungarpur
13 Sri-Ganganagar
14 Jaipur
15 Jaisalmer
16 Jalore
17 Jhalawar
18 Jhunjhunu
19 Jodhpur
20 Kota
21 Nagaur
22 Pali
23 Sawai Madhopur
24 Sikar
25 Sirohi
26 Tonk
27 Udaipur
28 Baran
29 Dausa
30 Rajsamand
31 Hanumangarh
Out side the state
32 Karauli
* Including non-regular employees
Below 10500
8
713
666
664
29606
1605
1524
559
535
1109
1132
956
523
946
974
378
511
867
3870
372
430
566
954
1524
1244
911
783
746
987
453
695
1753
419
491
554
550
309
376
10500-14000
9
19356
19109
18~9
7570
442
402
223
79
350
238
301
140
171
119
57
88
244
1487
67
106
88
131
604
407
124
137
99
148
94
133
465
172
101
131
71
98
53
Pay Range (Rs.)
14000 - 17000 &
17000 above 10 11
17556
17798
19143
3079
199
109
85
46
115
136
136
45
69
89
45
29
69
644
26
42
63
54
149
148
102
38
100
79
45
77
151
53
73
31
8
16
8
5728
6074
6378
1961
197
49
23
26
42
83
129
24
40
36
24
43
51
357
24
12
30
41
156
102
37
25
41
27
31
28
146
24
69
25
18
Total
12
43353
43647
45024
42216
2443
2084
890
686
1616
1589
1522
732
1226
1218
504
671
. 1231
6358
489
590
747
1180
2433
1901
1174
983
986
1241
623
933
2515
668
734
741
629
441
438
Grand Total (7+ 12) f
13
468782 * 476267 * 482050 *
460989
24368
20981
10653
8542
18584
16150
19054
7537
13854
11091
6232
8785
13583
60520
5217
7318.
8346
12576
23679
17990
14375
125.53
9921
14174
6457
10425
26537
7419
7297
7842
5901
18375
4653
Source :- Directorate of Economics and Statistics, Rajasthan.
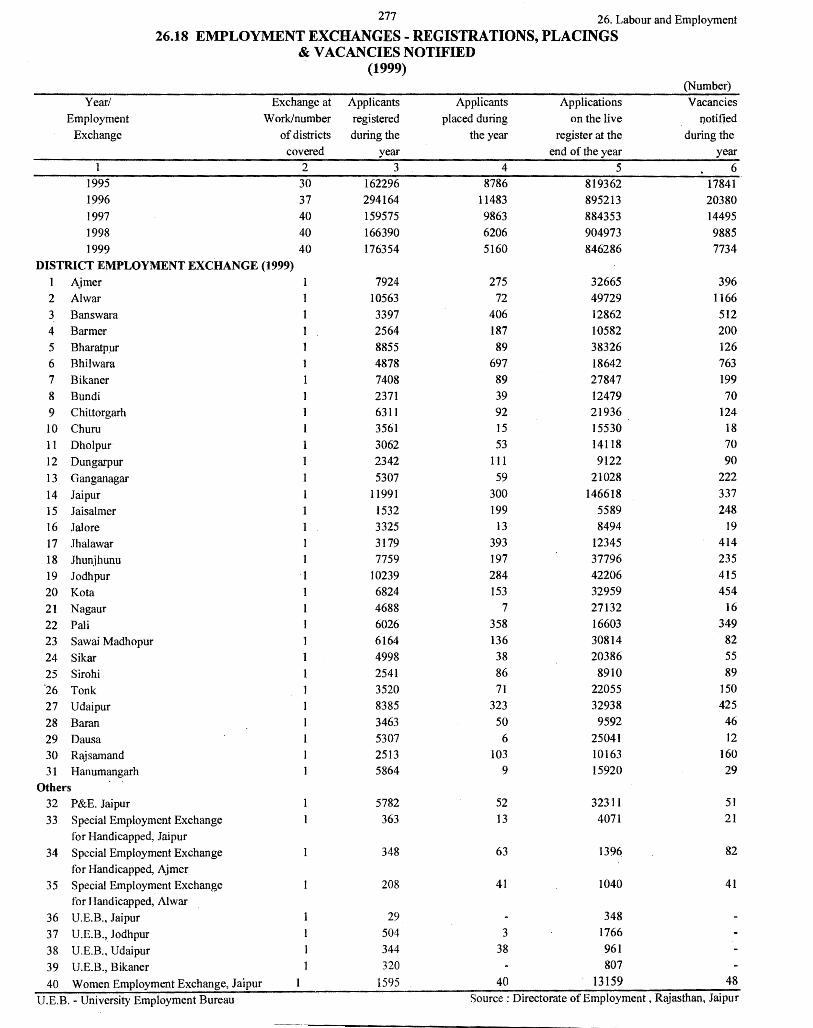
277 26. Labour and Employment
26.18 EMPLOYMENT EXCHANGES - REGISTRATIONS, PLACINGS & VACANCIES NOTIFIED
(1999) (Number)
Year/ Exchange at Applicants Applicants Applications Vacancies
Employment Work/number registered placed during on the live notified
Exchange of districts during the the year register at the during the
covered year end of the year year 1 2 3 4 5 6
1995 30 162296 8786 819362 17841 1996 37 294164 11483 895213 20380 1997 40 159575 9863 884353 14495 1998 40 166390 6206 904973 9885 1999 40 176354 5160 846286 7734
DISTRICT EMPLOYMENT EXCHANGE (1999) 1 Ajmer 7924 275 32665 396 2 Al war 10563 72 49729 1166 3 Banswara 3397 406 12862 512 4 Barmer 2564 187 10582 200 5 Bharatp.ur 8855 89 38326 126 6 Bhilwara 4878 697 18642 763 7 Bikaner 7408 89 27847 199 8 Bundi 2371 39 12479 70 9 Chittorgarh 6311 92 21936 124 10 Churu 3561 15 15530 18 11 Dholpur 3062 53 14118 70 12 Dungarpur 2342 111 9122 90 13 Ganganagar 5307 59 21028 222 14 Jaipur 11991 300 146618 337 15 Jaisalmer 1532 199 5589 248 16 Jal ore 3325 13 8494 19 17 Jhalawar 3179 393 12345 414 18 Jhunjhunu 7759 197 37796 235 19 Jodhpur 1 10239 284 42206 415 20 Ko ta 1 6824 153 32959 454 21 Nagaur 4688 7 27132 16 22 Pali 6026 358 16603 349 23 Sawai Madhopur 6164 136 30814 82 24 Sikar 4998 38 20386 55
25 Sirohi 2541 86 8910 89 -26 Tonk 3520 71 22055 150 27 Udaipur 8385 323 32938 425 28 Baran 3463 50 9592 46
29 Dausa 5307 6 25041 12 30 Rajsamand 2513 103 10163 160 31 Hanumangarh 5864 9 15920 29
Others 32 P&E. Jaipur 5782 52 32311 51 33 Special Employment Exchange 363 13 4071 21
for Handicapped, Jaipur
34 Special Employment Exchange 348 63 1396 82 for Handicapped, Ajmer
35 Special Employment Exchange 208 41 1040 41 for Handicapped, Alwar
36 U.E.B.. Jaipur 29 348
37 U.E.B." Jodhpur 504 3 1766
38 U.E.B., Udaipur 344 38 961
39 U.E.B., Bikaner 320 807
40 Women Employment Exchange, Jaipur 1595 40 13159 48
U.E.B. - University Employment Bureau Source: Directorate of Employment, Rajasthan, Jaipur
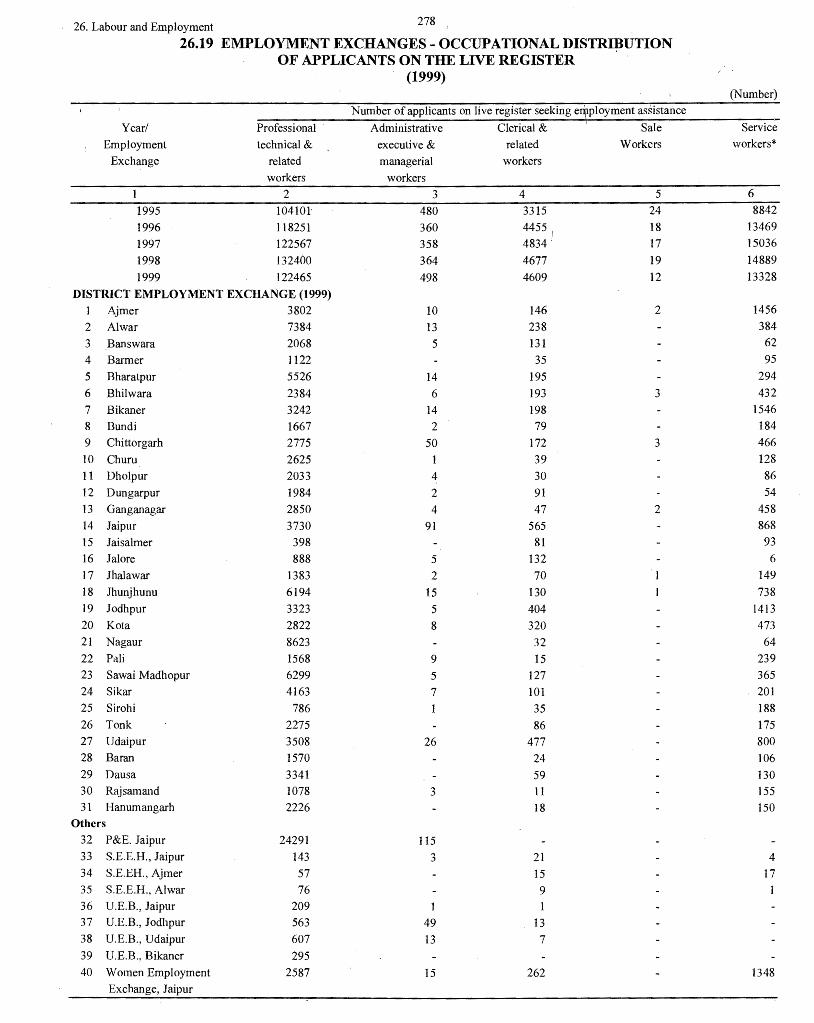
26. Labour and Employment 278
26.19 EMPLOYMENT EXCHANGES - OCCUPATIONAL DISTRIBUTION OF APPLICANTS ON THE LIVE REGISTER
(1999) (Number)
Year/ Professional
Number of applicants on live register seeking e~ployment assistance
Administrative Clerical & Sale Service
Employment technical & executive & related Workers workers*
Exchange related managerial workers
workers workers
2 3 4 5 6
1995 104101 480 3315 24 8842
1996 118251 360 4455 I 18 13469
1997 122567 358 4834; 17 15036
1998 132400 364 4677 19 14889
1999 122465 498 4609 12 13328
DISTRICT EMPLOYMENT EXCHANGE (1999) 1 Aimer 3802 10 146 2 1456
2 Al war 7384 13 238 384
3 Banswara 2068 5 131 62
4 Barmer 1122 35 95
5 Bharatpur 5526 14 195 294
6 Bhilwara 2384 6 193 3 432
7 Bikaner 3242 14 198 1546
8 Bundi 1667 2 79 184
9 Chittorgarh 2775 50 172 3 466
IO Chum 2625 39 128
11 Dholpur 2033 4 30 86
12 Dungarpur 1984 2 91 54
13 Ganganagar 2850 4 47 2 458
14 Jaipur 3730 91 565 868
15 Jaisalmer 398 81 93
16 Jal ore 888 5 132 6
17 Jhalawar 1383 2 70 149
18 Jhunjhunu 6194 15 130 738 19 Jodhpur 3323 5 404 1413 20 Kota 2822 8 320 473
21 Nagaur 8623 32 64
22 Pali 1568 9 15 239 23 Sawai Madhopur 6299 5 127 365 24 Sikar 4163 7 101 201
25 Sirohi 786 35 188 26 Tonk 2275 86 175 27 Udaipur 3508 26 477 800 28 Baran 1570 24 106 29 Dausa 3341 59 130 30 Rajsamand 1078 3 11 155 31 Hanumangarh 2226 18 150
Others
32 P&E. Jaipur 24291 115 33 S.E.E.H., Jaipur 143 3 21 4 34 S.E.EH., Ajmer 57 15 17 35 S.E.E.H., Alwar 76 9 36 U.E.B., Jaipur 209 I
37 U.E.B., Jodhpur 563 49 13 38 U.E.B., Udaipur 607 13 7 39 U.E.B., Bikaner 295 40 Women Employment 2587 15 262 1348
Exchange, Jaipur

279 26. Labour and Employment
26.19 EMPLOYMENT EXCHANGES - OCCUPATIONAL DISTRIBUTION OF APPLICANTS ON THE LIVE REGISTER
(1999) (Number)
Number of applicants on live register seeking employment assistance Year/ Farmers, Production & Workers Total
Employment Fishermen related workers not Exchange Hunters logers and transport classified
related workers* Equipment elsewhere Operators &
Labours 7 8 9 10
1995 3001 26630 673004 819362 -1996 1813 29057 727796 895213 1997 1051 28724 71766 884353 1998 1114 30066 721444 904973 1999 937 29917 674520 846286
DISTRICT EMPLOYMENT EXCHANGE (1999) 1 Ajmer 54 2207 24988 32665 2 Al war 14 1390 40306 49729 3· Banswara 53 384 10159 12862 4 Barmer 505 8825 10582 5 Bharatpur 75 1104 31118 38326 6 Bhilwara 54 1361 14209 18642 7 Bikaner 71 1257 21519 27847 8 Bundi 1 556 9990 12479 9 Chittorgarh 194 1904 16372 21936 10 Churu 3 449 12285 15530 11 Dholpur 411 11553 14118
·12 Dungarpur 73 568 6350 9122 13 Ganganagar 46 1020 16601 21028 14 Jaipur 23 2363 138978 146618 15 Jaisalmer 2 399 4616 5589 16 Jal ore 175 7288 8494 17 Jhalawar 567 10173 12345 18 Jhunjhunu 1234 29484 37796 19 Jodhpur 82 2122 34857 42206 20 Kota 8 1728 27600 32959 21 Nagaur 754 17659 27132 22 Pali 4 720 14048 16603 23 Sawai Madhopur 10 1120 22888 30814 24 Sikar 70 500 15344 . 20386 25 Sirohi 8 555 7337 8910 26 Tonk 6 513 19000 22055 27 Udaipur 68 1708 26351 32938 28 Baran 263 7629 9592 29 Dausa 695 20816 25041 30 Rajsamand 302 8614 10163 31 Hanumangarh 5 874 12647 15920
Others 32 P&E. Jaipur 10 7895 32311 33 S.E.E.H., Jaipur 42 3858 4071 34 S.E.EH., Ajmer 41 1265 1396 35 S.E.E.H., Alwar 21 933 1040 36 U.E.B., Jaipur 136 348 37 U.E.:i3., Jodhpur 31 1110 1766 38 U.E.B., Udaipur 334 961 39 U.E.B., Bikaner 512 807 40 Women Employment Exchange, Jaipur 74 8873 13159
S.E.E.H. - Special Employment Exchange of Handicapped Source: Directorate of Employment, Ra}1sthan, Jaipur
U.E.B. ·University Exmployment Bureau
* Corrected Figures from 1995 to 1998
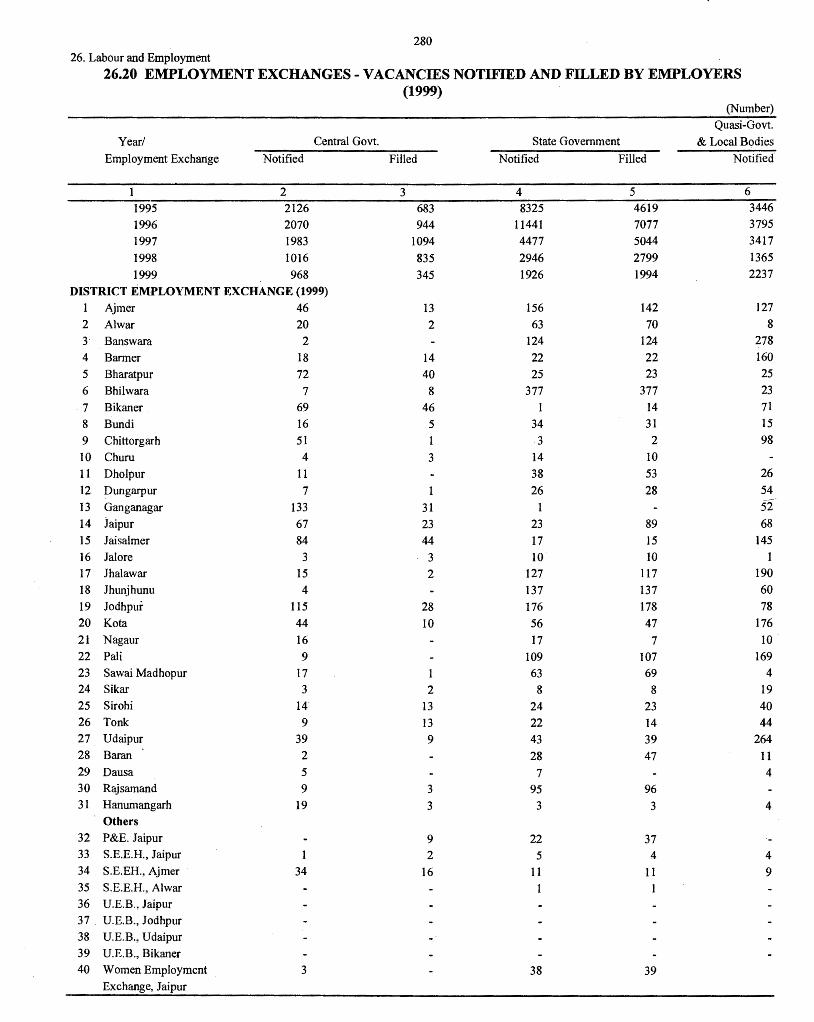
280
26. Labour and Employment
26.20 EMPLOYMENT EXCHANGES - VACANCIES NOTIFIED AND FILLED BY EMPLOYERS (1999)
(Number)
Quasi-Govt.
Year/ Central Govt. State Government & Local Bodies
Employment Exchange Notified Filled Notified Filled Notified
2 3 4 5 6
1995 2126 683 8325 4619 3446
1996 2070 944 11441 7077 3795
1997 1983 I094 4477 5044 3417
1998 IOI6 835 2946 2799 1365
1999 968 345 1926 1994 2237
DISTRICT EMPLOYMENT EXCHANGE (1999)
1 Ajmer 46 13 156 142 127
2 Al war 20 2 63 70 8
3 Banswara 2 124 124 278
4 Barmer I8 14 22 22 I60
5 Bharatpur 72 40 25 23 25
6 Bhilwara 7 8 377 377 23
7 Bikaner 69 46 14 7I
8 Bundi 16 5 34 3I 15
9 Chittorgarh 5I 1 3 2 98
IO Churu 4 3 I4 IO
I I Dholpur 11 38 53 26
I2 Dungarpur 7 26 28 54
13 Ganganagar I33 3I 52 I4 Jaipur 67 23 23 89 68
I5 Jaisalmer 84 44 17 15 145
16 Jalore 3 3 IO 10
I7 Jhalawar 15 2 I27 117 190
18 Jhunjhunu 4 137 137 60
19 Jodhpur 115 28 176 178 78
20 Ko ta 44 IO 56 47 I76
21 Nagaur 16 I7 7 IO
22 Pali 9 109 107 I69
23 Sawai Madhopur 17 I 63 69 4 24 Sikar 3 2 8 8 19 25 Sirohi 14· 13 24 23 40 26 Tonk 9 13 22 14 44 27 Udaipur 39 9 43 39 264 28 Baran 2 28 47 11 29 Dausa 5 7 4 30 Rajsamand 9 3 95 96 3I Hanumangarh 19 3 3 3 4
Others
32 P&E. Jaipur 9 22 37 33 S.E.E.H., Jaipur 2 5 4 4 34 S.E.EH., Ajmer 34 16 11 11 9 35 S.E.E.H., Alwar
36 U.E.B., Jaipur
37. U.E.B., Jodhpur
38 U.E.B., Udaipur
39 U.E.B., Bikaner 40 Women Employment 3 38 39
Exchange, Jaipur
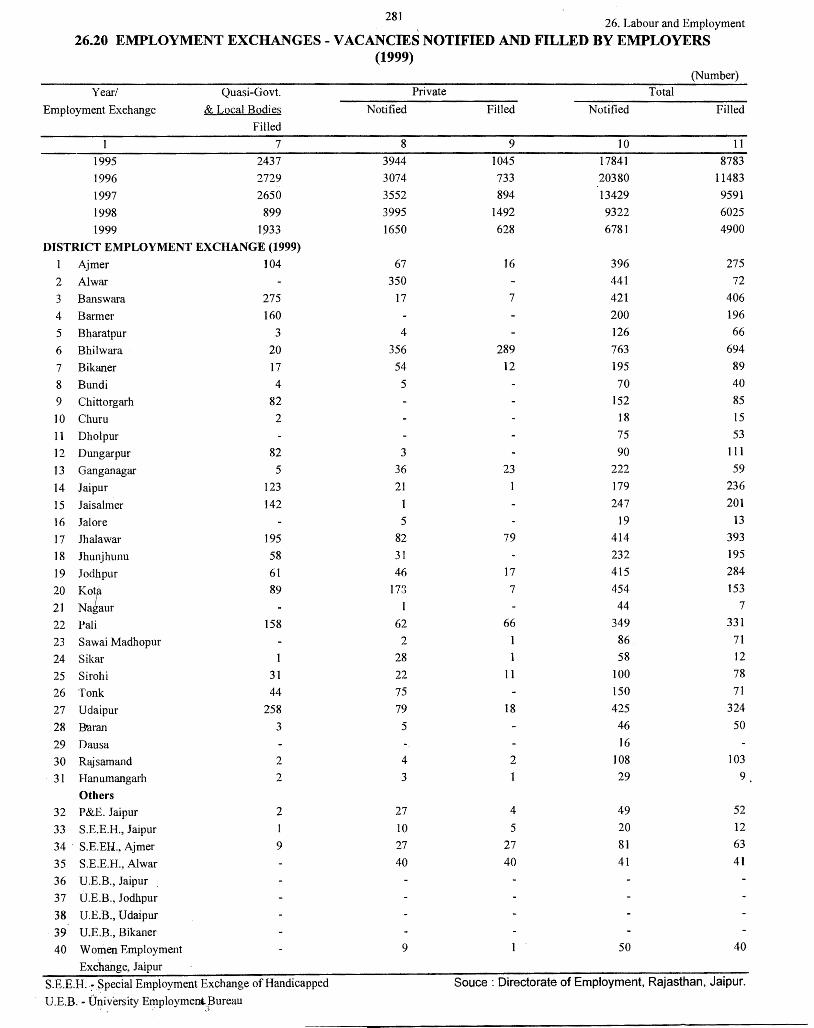
281 26. Labour and Employment
26.20 EMPLOYMENT EXCHANGES - VACANCIES NOTIFIED AND FILLED BY EMPLOYERS (1999)
(Number)
Year/ Quasi-Govt. Private Total
Employment Exchange & Local Bodies Notified Filled Notified Filled
Filled
7 8 9 10 11
1995 2437 3944 1045 17841 8783
1996 2729 3074 733 20380 11483
1997 2650 3552 894 13429 9591
1998 899 3995 1492 9322 6025
1999 1933 1650 628 6781 4900
DISTRICT EMPLOYMENT EXCHANGE (1999)
1 Ajmer 104 67 16 396 275
2 Al war 350 441 72
3 Banswara 275 17 7 421 406
4 Barmer 160 200 196
5 Bharatpur 3 4 126 66
6 Bhilwara 20 356 289 763 694
7 Bikaner 17 54 12 195 89
8 Bundi 4 5 70 40
9 Chittorgarh 82 152 85
10 Chum 2 18 15
11 Dholpur 75 53
12 Dungarpur 82 3 90 111
13 Ganganagar 5 36 23 222 59
14 Jaipur 123 21 1 179 236
15 Jaisalmer 142 1 247 201
16 Jal ore 5 19 13
17 Jhalawar 195 82 79 414 393
18 Jhunjhunu 58 31 232 195
19 Jodhpur 61 46 17 415 284
20 Kot
89 173 7 454 153
21 Na aur 44 7
22 Pali 158 62 66 349 331
23 Sawai Madhopur 2 86 71
24 Sikar 28 58 12
25 Sirohi 31 22 11 100 78
26 Tonk 44 75 150 71
27 Udaipur 258 79 18 425 324
28 B•aran 3 5 46 50
29 Dausa 16
30 Rajsamand 2 4 2 108 103
31 Hanumangarh 2 3 29 9
Others 32 P&E. Jaipur 2 27 4 49 52
33 S.E.E.H., Jaipur l IO 5 20 12
34. S.E.EH., Ajmer 9 27 27 81 63
35 S.E.E.H., Alwar 40 40 41 41
36 U.E.B., Jaipur
37 U.E.B., Jodhpur
38 U.E.B., Udaipur
39 U.E.B., Bikaner
40 Women Employment 9 50 40
Exchange, Jaipur
S.E.E.H. ; Special Employment Exchange of Handicapped Souce : Directorate of Employment, Rajasthan, Jaipur.
U.E.B. - University Employment)3ureau '. , ,;.
(27) BANKING
This section presents data on number of Banks, deposits and advances of Commerical Banks and bank groupwise and Districtwise distribution of deposits and advances of scheduled commercial Banks.
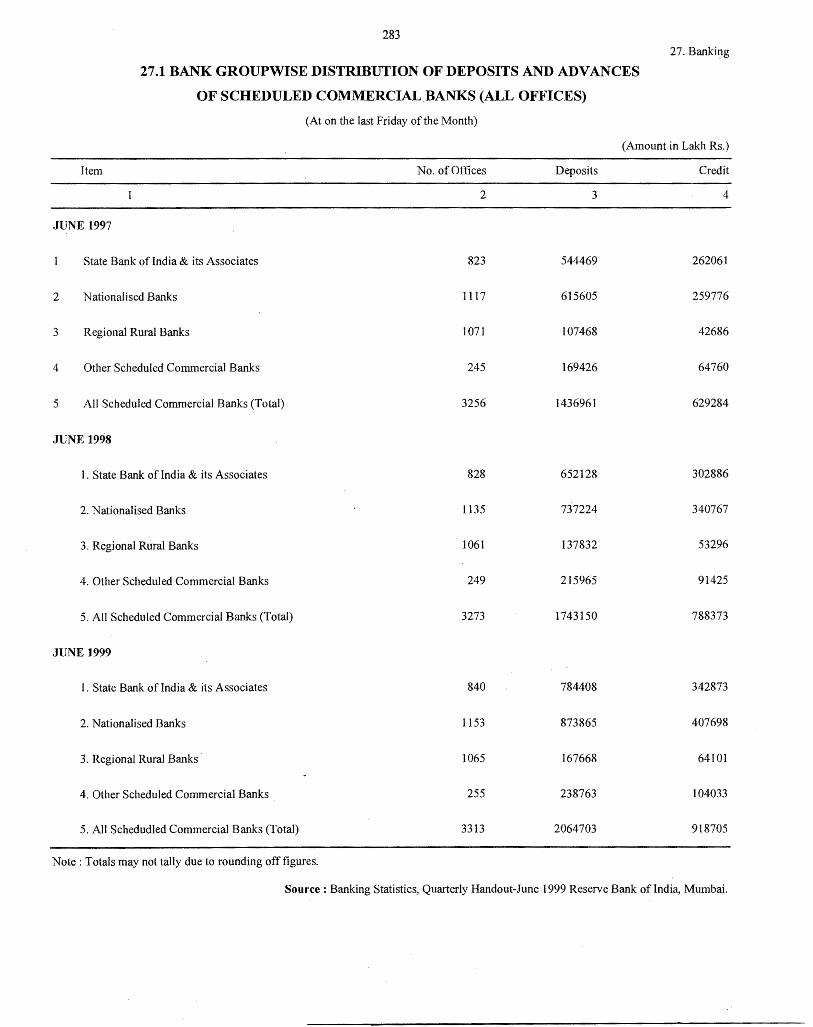
283
27.1 BANK GROUPWISE DISTRIBUTION OF DEPOSITS AND ADVANCES
OF SCHEDULED COMMERCIAL.BANKS (ALL OFFICES)
(At on the last Friday of the Month)
27. Bankii:tg
(Amount in Lakh Rs.)
Item No. of Offices Deposits Credit
2 3 4
JUNE 1997
State Bank of India & its Associates 823 544469 262061
2 Nationalised Banks 1117 615605 259776
3 Regional Rural Banks 1071 107468 42686
4 Other Scheduled Commercial Banks 245 169426 64760
5 All Scheduled Commercial Banks (Total) 3256 1436961 629284
JUNE 1998
I . State Bank of India & its Associates 828 652128 302886
2. Nationalised Banks 1135 737224 340767
3. Regional Rural Banks 1061 137832 53296
4. Other Scheduled Commercial Banks 249 215965 91425
5. All Scheduled Commercial Banks (Total) 3273 1743150 788373
JUNE 1999
1. State Bank of India & its Associates 840 784408 342873
2. Nationalised Banks 1153 873865 407698
3. Regional Rural Banks· 1065 167668 64101
4. Other Scheduled Commercial Banks 255 238763 104033
5. All Schedudled Commercial Banks (Total) 3313 2064703 918705
Note: Totals may not tally due to rounding off figures.
Source : Banking Statistics, Quarterly Handout-June 1999 Reserve Bank of India, Mumbai.
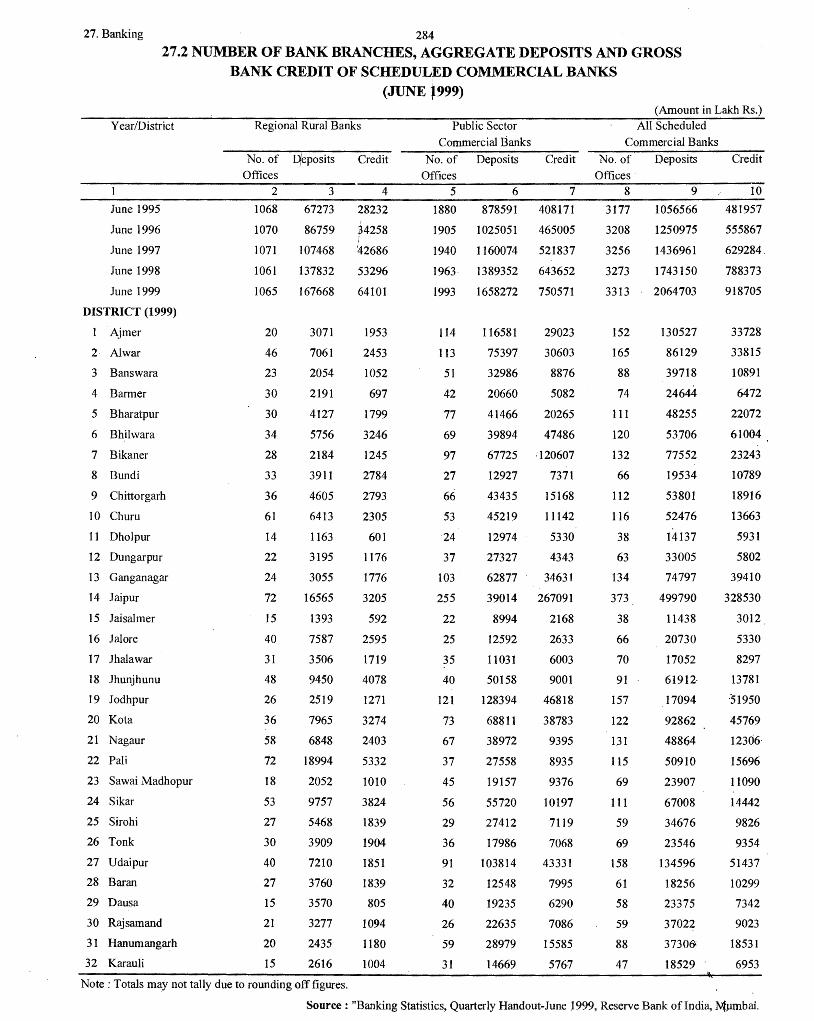
27. Banking 284
27.2 NUMBER OF BANK BRANCHES, AGGREGATE DEPOSITS AND GROSS BANK CREDIT OF SCHEDULED COMMERCIAL BANKS
(JUNE f999) (Amount in Lakh Rs.)
Year/District
June 1995
June 1996
June 1997
June 1998
June 1999
DISTRICT (1999)
Aimer
2 Alwar
3 Banswara
4 Barmer
5 Bharatpur
6 Bhilwara
7 Bikaner
8 Bundi
9 Chittorgarh
10 Churu
11 Dholpur
12 Dungarpur
13 Ganganagar
14 Jaipur
15 Jaisalmer
16 Jalore
17 Jhalawar
18 Jhunjhunu
19 Jodhpur
20 Kota
21 Nagaur
22 Pali
23 Sawai Madhopur
24 Sikar
25 Sirohi
26 Tonk
27 Udaipur
28 Baran
29 Dausa
30 Rajsamand
31 Hanumangarh
32 Karauli
Regional Rural Banks
No. of Offices
2
1068
1070
1071
1061
:qeposits
3
67273
86759
107468
137832
1065 167668
20
46
23
30
30
34
28
33
36
61
14
22
24
72
15
40
31
48
26
36
58
72
18
53
27
30
40
27
15
21
20
15
3071
7061
2054
2191
4127
5756
2184
3911
4605
6413
1163
3195
3055
16565
1393
7587
3506
9450
2519
7965
6848
18994
2052
9757
5468
3909
7210
3760
3570
3277
2435
2616
Credit
4
28232 /
34258
~2686 53296
64101
1953
2453
1052
697
1799
3246
1245
2784
2793
2305
601
1176
1776
3205
592
2595
1719
4078
1271
3274
2403
5332
1010
3824
1839
1904
1851
1839
805
1094
1180
1004
Note: Totals may not tally due to rounding off figures.
Public Sector Commercial Banks
No. of Deposits Offices
5 6
1880 878591
1905 1025051
1940 1160074
196). 1389352
Credit
7
408171
465005
521837
643652
1993 1658272 750571
114
113
51
42
77
69
97
27
66
53
24
37
103
255
22
25
35
40
121
73
67
37
45
56
29
36
91
32
40
26
59
31
116581
75397
32986
20660
41466
39894
67725
12927
43435
45219
12974
27327
62877
39014
8994
12592
l 1031
50158
128394
68811
38972
27558
19157
55720
27412
17986
103814
12548
19235
22635
28979
14669
29023
30603
8876
5082
20265
47486
120607
7371
15168
11142
5330
4343
34631
267091
2168
2633
6003
9001
46818
38783
9395
8935
9376
10197
7119
7068
43331
7995
6290
7086
15585
5767
All Scheduled Commercial Banks
No. of Deposits Offices·
8 9
3177 1056566
3208 1250975
3256 1436961
3273 1743150
3313
152
165
88
74
l II
120
132
66
112
116
38
63
134
373
38
66
70
91
157
122
131
115
69
111
59
69
158
61
58
59
88
47
2064703
130527
86129
39718
24644
48255
53.706
77552
19534
53801
52476
14137
33005
74797
499790
11438
20730
17052
61912·
17094
92862
48864
50910
23907
67008
34676
23546
134596
18256
23375
37022
37306'
18529
Credit
10
481957
555867
629284
788373
918705
33728
33815
10891
6472
22072
61004
23243
10789
18916
13663
5931
5802
39410
328530
3012.
5330
8297
13781
·51950
45769
1230fr
15696
11090
14442
9826
9354
51437
10299
7342
9023
18531
6953
Source: "Banking Statistics, Quarterly Handout-June 1999, Reserve Bank ofindia, Nfpmbai.
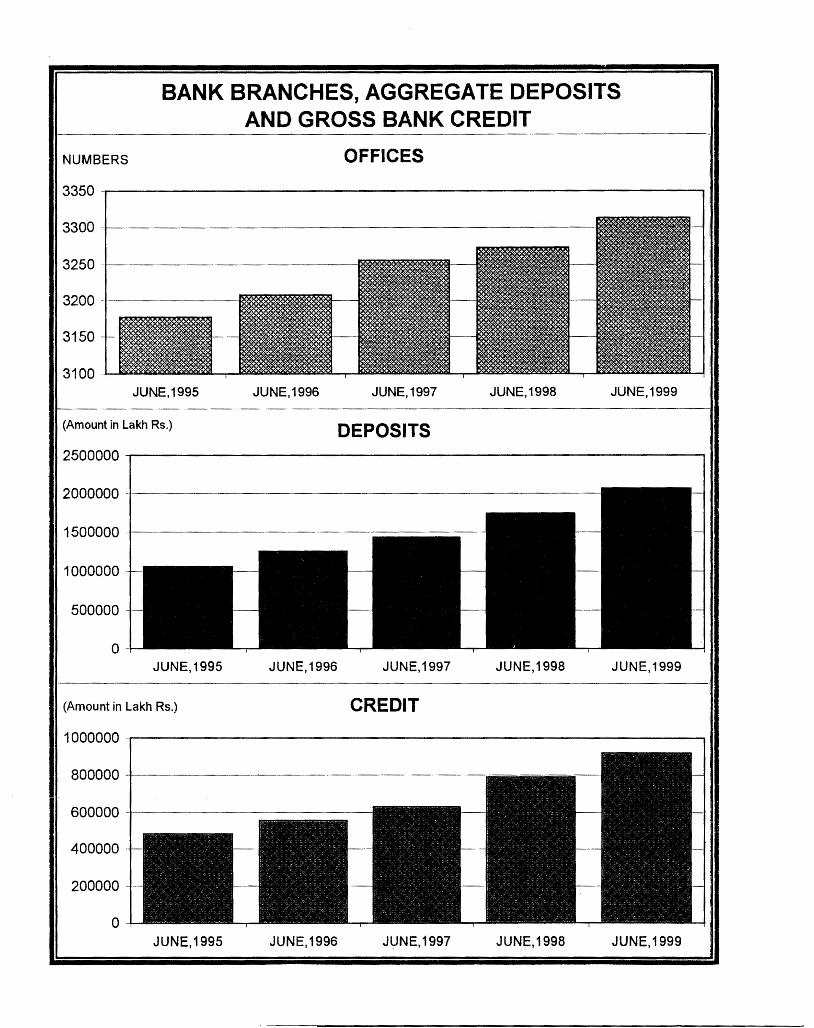
BANK BRANCHES, AGGREGATE DEPOSITS AND GROSS BANK CREDIT
NUMBERS OFFICES
3350
3300
3250
3200 -
3150 - -
3100 JUNE,1995 JUNE,1996 JUNE, 1997 JUNE,1998 JUNE,1999
(Amount in Lakh Rs.) DEPOSITS 2500000
2000000 -
1500000
1000000 --
500000 -
0 -JUNE,1995 JUNE, 1996 JUNE, 1997 JUNE,1998 JUNE, 1999
(Amount in Lakh Rs.) CREDIT
1000000
800000 -
600000
400000 --
200000
0 JUNE, 1995 JUNE, 1996 JUNE,1997 JUNE, 1998 JUNE,1999
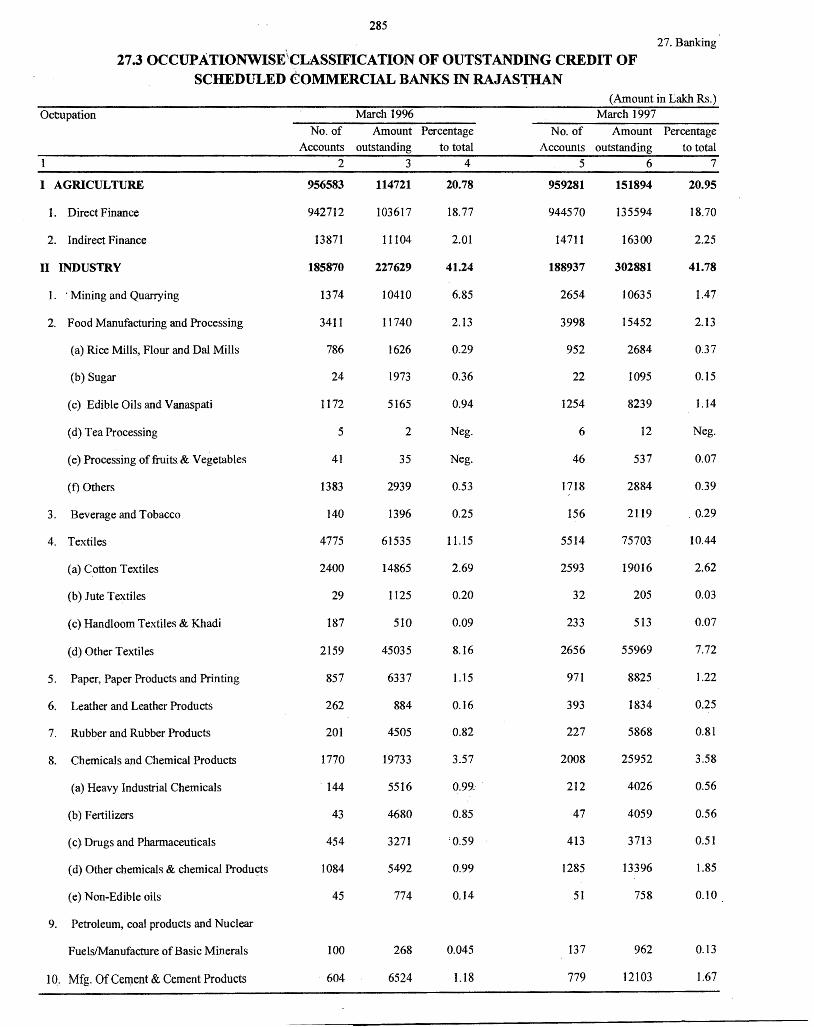
285 27. Banking
27.3 OCCUPATIONWISE\CLASSIFICATION OF OUTSTANDING CREDIT OF SCHEDULED €OMMERCIAL BANKS IN RAJASTHAN
(Amount in Lakh Rs.)
Octupation March 1996 March 1997 No. of Amount Percentage No. of Amount Percentage
Accounts outstanding to total Accounts outstanding to total
2 3 4 5 6 7
I AGRICULTURE 956583 114721 20.78 959281 151894 20.95
I. Direct Finance 942712 103617 18.77 944570 135594 18.70
2. Indirect Finance 13871 11104 2.01 14711 16300 2.25
II INDUSTRY 185870 227629 41.24 188937 302881 41.78
1. · Mining and Quarrying 1374 10410 6.85 2654 10635 1.47
2. Food Manufacturing and Processing 3411 11740 2.13 3998 15452 2.13
(a) Rice Mills, Flour and Dal Mills 786 1626 0.29 952 2684 0.37
(b) Sugar 24 1973 0.36 22 1095 0.15
(c) Edible Oils and Vanaspati 1172 5165 0.94 1254 8239 1.14
(d) Tea Processing 5 2 Neg. 6 12 Neg.
(e) Processing of fruits & Vegetables 41 35 Neg. 46 537 0.o7
(t) Others 1383 2939 0.53 1718 2884 0.39
3. Beverage and Tobacco 140 1396 0.25 156 2119 . 0.29
4. Textiles 4775 61535 11.15 5514 75703 10.44
(a) Cotton Textiles 2400 14865 2.69 2593 19016 2.62
(b) Jute Textiles 29 1125 0.20 32 205 0.03
(c) Handloom Textiles & Khadi 187 510 0.09 233 513 0.07
(d) Other Textiles 2159 45035 8.16 2656 55969 7.72
5. Paper, Paper Products and Printing 857 6337 l.15 971 8825 1.22
6. Leather and Leather Products 262 884 0.16 393 1834 0.25
7. Rubber and Rubber Products 201 4505 0.82 227 5868 0.81
8. Chemicals and Chemical Products 1770 19733 3.57 2008 25952 3.58
(a) Heavy Industrial Chemicals 144 5516 0.99.- 212 4026 0.56
(b) Fertilizers 43 4680 0.85 47 4059 0.56
( c). Drugs and Pharmaceuticals 454 3271 '0.59 413 3713 0.51
( d) Other chemicals & chemical Products 1084 5492 0.99 1285 13396 1.85
(e) Non-Edible oils 45 774 0.14 51 758 0.10
9. Petroleum, coal products and Nuclear
Fuels/Manufacture of Basic Minerals 100 268 0.045 137 962 0.13
10. Mfg. Of Cell).ent & Cement Products 604 6524 1.18 779 12103 1.67
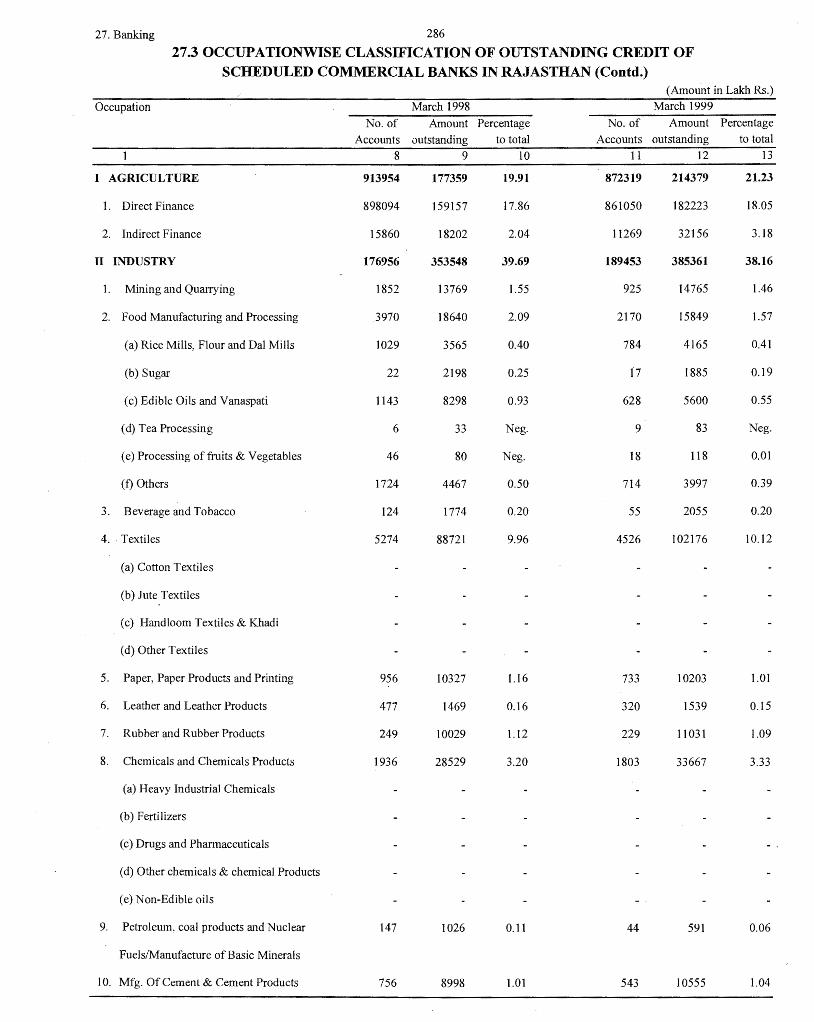
27. Banking 286
27.3 OCCUPATIONWISE CLASSIFICATION OF OUTSTANDING CREDIT OF SCHEDULED COMMERC1AL BANKS IN RAJASTHAN (Contd.)
(Amount in Lakh Rs.)
Occupation March 1998 March 1999
No. of Amount Percentage No. of Amount Percentage
Accounts outstanding to total Accounts outstanding to total
8 9 10 11 12 13
I AGRICULTURE 913954 177359 19.91 872319 214379 21.23
1. Direct Finance 898094 159157 17.86 861050 182223 18.05
2. Indirect Finance 15860 18202 2.04 11269 32156 3.18
II INDUSTRY 176956 353548 39.69 189453 385361 38.16
I. Mining and Quarrying 1852 13769 1.55 925 14765 1.46
2. Food Manufacturing and Processing 3970 18640 2.09 2170 15849 1.57
(a) Rice Mills, Flour and Dal Mills 1029 3565 0.40 784 4165 0.41
(b) Sugar 22 2198 0.25 f 7 1885 0.19
(c) Edible Oils and Vanaspati 1143 8298 0.93 628 5600 0.55
( d) Tea Processing 6 33 Neg. 9 83 Neg.
(e) Processing of fruits & Vegetables 46 80 Neg. 18 118 0.01
(f) Others 1724 4467 0.50 714 3997 0.39
3. Beverage and Tobacco 124 1774 0.20 55 2055 0.20
4. Textiles 5274 88721 9.96 4526 102176 10.12
(a) Cotton Textiles
(b) Jute Textiles
(c) Handloom Textiles & Khadi
(d) Other Textiles
5. Paper, Paper Products and Printing 956 10327 1.16 733 10203 1.01
6. Leather and Leather Products 477 1469 0.16 320 1539 0.15
7. Rubber and Rubber Products 249 10029 1.12 229 11031 1.09
8. Chemicals and Chemicals Products 1936 28529 3.20 1803 33667 3.33
(a) Heavy Industrial Chemicals
(b) Fertilizers
(c) Drugs and Pharmaceuticals
( d) Other chemicals & chemical Products
(e) Non-Edible oils
9. Petroleum, coal products and Nuclear 147 1026 0.11 44 591 0.06
Fuels/Manufacture of Basic Minerals
10. Mfg. Of Cement & Cement Products 756 8998 1.01 543 10555 1.04
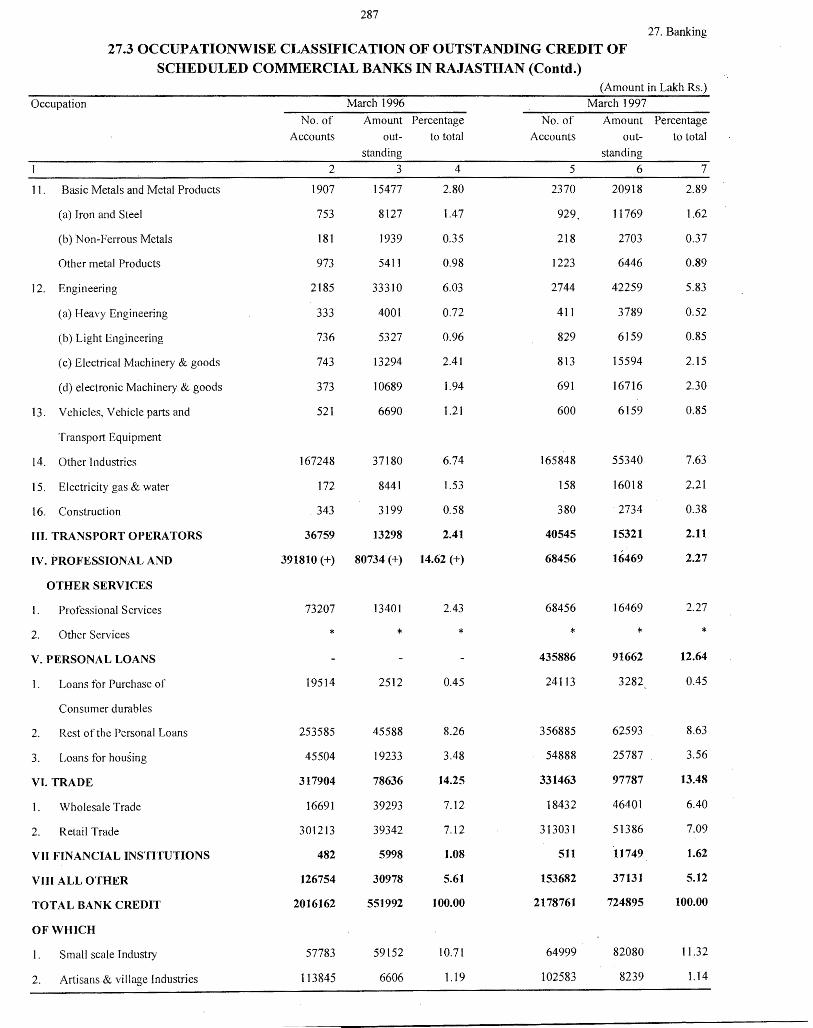
287
27. Banking
27.3 OCCUPATIONWISE CLASSIFICATION OF OUTSTANDING CREDIT OF SCHEDULED COMMERCIAL BANKS IN RAJASTHAN (Contd.)
(Amount in Lakh Rs.) Occupation March 1996 March 1997
No. of Amount Percentage No. of Amount Percentage Accounts out- to total Accounts out- to total
standing standing
2 3 4 5 6 7
11. Basic Metals and Metal Products 1907 15477 2.80 2370 20918 2.89
(a) Iron and Steel 753 8127 l.47 929. 11769 1.62
(b) Non-Ferrous Metals 181 1939 0.35 218 2703 0.37
Other metal Products 973 5411 0.98 1223 6446 0.89
12. Engineering 2185 33310 6.03 2744 42259 5.83
(a) Heavy Engineering 333 4001 0.72 411 3789 0.52
(b) Light Engineering 736 5327 0.96 829 6159 0.85
( c) Electrical Machinery & goods 743 13294 2.41 813 15594 2.15
( d) electronic Machinery & goods 373 10689 1.94 691 16716 2.30
13. V chicles, Vehicle parts and 521 6690 1.21 600 6159 0.85
Transport Equipment
14. Other Industries 167248 37180 6.74 165848 55340 7.63
15. Electricity gas & water 172 8441 1.53 158 16018 2.21
16. Construction '343 3199 0.58 380 2734 0.38
III. TRANSPORT OPERA TORS 36759 13298 2.41 40545 15321 2.11
IV. PROFESSIONAL AND 391810 (+) 80734 (+) 14.62 (+) 68456 16469 2.27
OTHER SERVICES
1. Professional Services 73207 13401 2.43 68456 16469 2.27
2. Other Services * * * * * * V. PERSONAL LOANS 435886 91662 12.64
1. Loans for Purchase of 19514 2512 0.45 24113 3282 0.45
Consumer durables
2. Rest of the Personal Loans 253585 45588 8.26 356885 62593 8.63
3. Loans for housing 45504 19233 3.48 54888 25787 3.56
VI. TRADE 317904 78636 14.25 331463 97787 13.48
1. Wholesale Trade 16691 39293 7.12 18432 46401 6.40
2. Retail Trade 301213 39342 7.12 313031 51386 7.09
VII FINANCIAL INSTITUTIONS 482 5998 1.08 511 11749 1.62
VIII A LL OTHER 126754 30978 5.61 153682 37131 5.12
TOT AL BANK CREDIT 2016162 551992 100.00 2178761 724895 100.00
OF WHICH
I. Small scale Industry 57783 59152 10.71 64999 82080 11.32
2. Artisans & village Industries 113845 6606 1.19 102583 8239 1.14
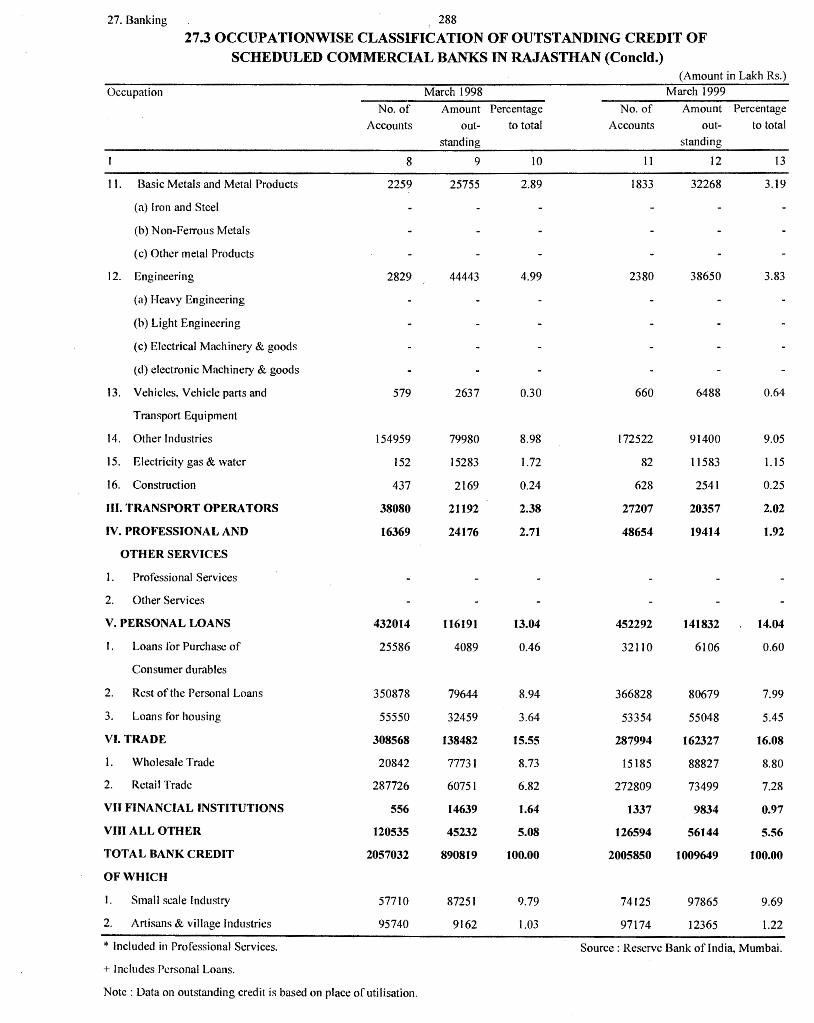
27. Banking 288
27.3 OCCUPATIONWISE CLASSIFICATION OF OUTSTANDING CREDIT OF SCHEDULED COMMERCIAL BANKS IN RAJASTHAN (Concld.)
(Amount in Lakh Rs.)
Occupation March 1998 March 1999
No. of Amount Percentage No. of Amount Percentage
Accounts out- to total Accounts out- to total
standing standing
8 9 IO 11 12 13
1 ). Basic Metals and Metal Products 2259 25755 2.89 1833 32268 3.19
(a) Tran and Steel
(b) Non-Ferrous Metals
( c) Other metal Products
12. Engineering 2829 44443 4.99 2380 38650 3.83
(a) Heavy Engineering
(b) Light Engineering
(c) Electrical Machinery & goods
(d) electronic Machinery & goods
13. Vehicles, Vehicle parts and 579 2637 0.30 660 6488 0.64
Transport Equipment
14. Other Industries 154959 79980 8.98 172522 91400 9.05
15. Electricity gas & water 152 15283 1.72 82 11583 1.15
16. Construction 437 2169 0.24 628 2541 0.25
III. TRANSPORT OPERA TORS 38080 21192 2.38 27207 20357 2.02
IV. PROFESSIONAL AND 16369 24176 2.71 48654 19414 1.92
OTHER SERVICES
1. Professional Services
2. Other Services
V. PERSONAL LOANS 432014 116191 13.04 452292 141832 14.04
I. Loans for Purchase of 25586 4089 0.46 32110 6106 0.60
Consumer durables
2. Rest of the Personal Loans 350878 79644 8.94 366828 80679 7.99
3. Loans for housing 55550 32459 3.64 53354 55048 5.45
VI. TRADE 308568 138482 15.55 287994 162327 16.08
1. Wholesale Trade 20842 77731 8.73 15185 88827 8.80
2. Retai I Trade 287726 60751 6.82 272809 73499 7.28
VII FINANCIAL INSTITUTIONS 556 14639 1.64 1337 9834 0.97
VIII ALL OTHER 120535 45232 5.08 126594 56144 5.56
TOTAL BANK CREDIT 2057032 890819 100.00 2005850 1009649 100.00
OF WHICH
I. Small scale Industry 57710 87251 9.79 74125 97865 9.69
2. Artisans & village Industries 95740 9162 1.03 97174 12365 I.22
* Included in Professional Services. Source: Reserve Bank of India, Mumbai.
+ Includes Personal Loans.
Note: Data on outstanding credit is based on place of utilisation.
(28) PUBLIC FINANCE
RECEIPT AND EXPENDITURE -
Receipt and expenditure of the State Government have been given in this para. The data used have been called out from the annual budget of the State Government. The figures represent actuals (A/C) for the past years and revised estimates (RE) for the current financial year. AH the figures relate to the concerned financial year. The table incorporated in this part have been classified on the basis of economically significant categories.
The tax revenue of the State has been classified into two m~jor heads Viz. State Tax Revenue and Share
in Central Taxes. Total tax revenue has been shown under Direct and Indirect taxes in a separate table. The
important sources of State Tax Revenue are Land Revenue, State Excise & Duties, Sales Tax, Tax on Motor
Vehicles and Stamps & Registration. Share in Central Taxes represents the share of the state in the divisible
pool of Income Tax, Union Excise Duties and Estate Duty on the basis of recommendations of Finance
Commission. The non-tax revenue, largely consists of interests, receipts, dividends and profits, general and
social services such as medical, health and family welfare, education, arts & culture, water supply &
sanitation, irrigation and forestry etc. The total revenue expenditure has been broadly classified into
development and Non-development expenditure. The development expenditure has been further classified
into expenditure on economic development and expenditure on social services. The non development
expenditure includes expendhure on general services which consist of expenditure on state organs, fiscal and administrative services, interest payments and grants-in-aid, etc.
The indices have been given in most of the tables under this part with the year 1993-94 as the base year to facilitate comparison of the financial transactions of the state government.
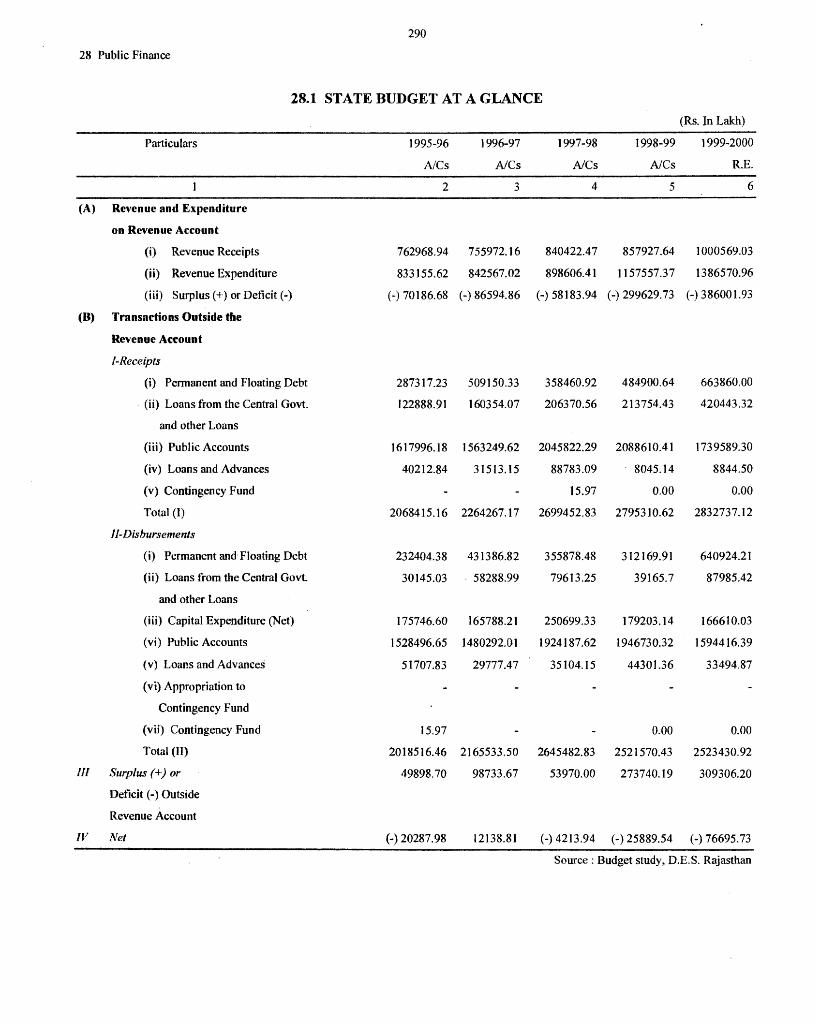
290
28 Public Finance
28.1 STATE BUDGET AT A GLANCE
(Rs. In Lakh)
Particulars 1995-96 1996-97 1997-98 1998-99 1999-2000
A/Cs A/Cs A/Cs A/Cs R.E.
2 3 4 5 6
(A) Revenue and Expenditure
on Revenue Account
(i) Revenue Receipts 762968.94 755972.16 840422.47 857927.64 1000569.03
(ii) Revenue Expenditure 833155.62 842567.02 898606.41 1157557.37 1386570.96
(iii) Surplus(+) or Deficit(-) (-) 70186.68 (-) 86594.86 (-) 58183.94 (-) 299629.73 (-) 386001.93
(B) Transactions Outside the
Revenue Account
I-Receipts
(i) Pennanent and Floating Debt 287317.23 509150.33 358460.92 484900.64 663860.00
(ii) Loans from the Central Govt. 122888.91 160354.07 206370.56 213754.43 420443.32
and other Loans
(iii) Public Accounts 1617996.18 1563249.62 2045822.29 2088610.41 1739589.30
(iv) Loans and Advances 40212.84 31513.15 88783.09 8045.14 8844.50
(v) Contingency Fund 15.97 0.00 0.00
Total (I) 2068415.16 2264267.17 2699452.83 2795310.62 2832737.12
JI-Disbursements
(i) Permanent and· Floating Debt 232404.38 431386.82 355878.48 312169.91 640924.21
(ii) Loans from the Central Govt. 30145.03 . 58288.99 79613.25 39165.7 87985.42
and other Loans
(iii) Capital Expenditure (Net) 175746.60 165788.21 250699.33 179203.14 166610.03
(vi) Public Accounts 1528496.65 1480292.01 1924187.62 1946730.32 1594416.39
( v) Loans and Advances 51707.83 29777.47 35104.15 44301.36 33494.87
(vi) Appropriation to
Contingency Fund
(vii) Contingency Fund 15.97 0.00 0.00
Total (II) 2018516.46 2165533.50 2645482.83 2521570.43 2523430.92
Ill Surplus(+) or 49898.70 98733.67 53970.00 273740.19 309306.20
Deficit(-) Outside
Revenue Account
IV Net (-) 20287.98 12138.81 (-) 4213.94 (-) 25889.54 (-) 76695. 73
Source: Budget study, D.E.S. Rajasthan
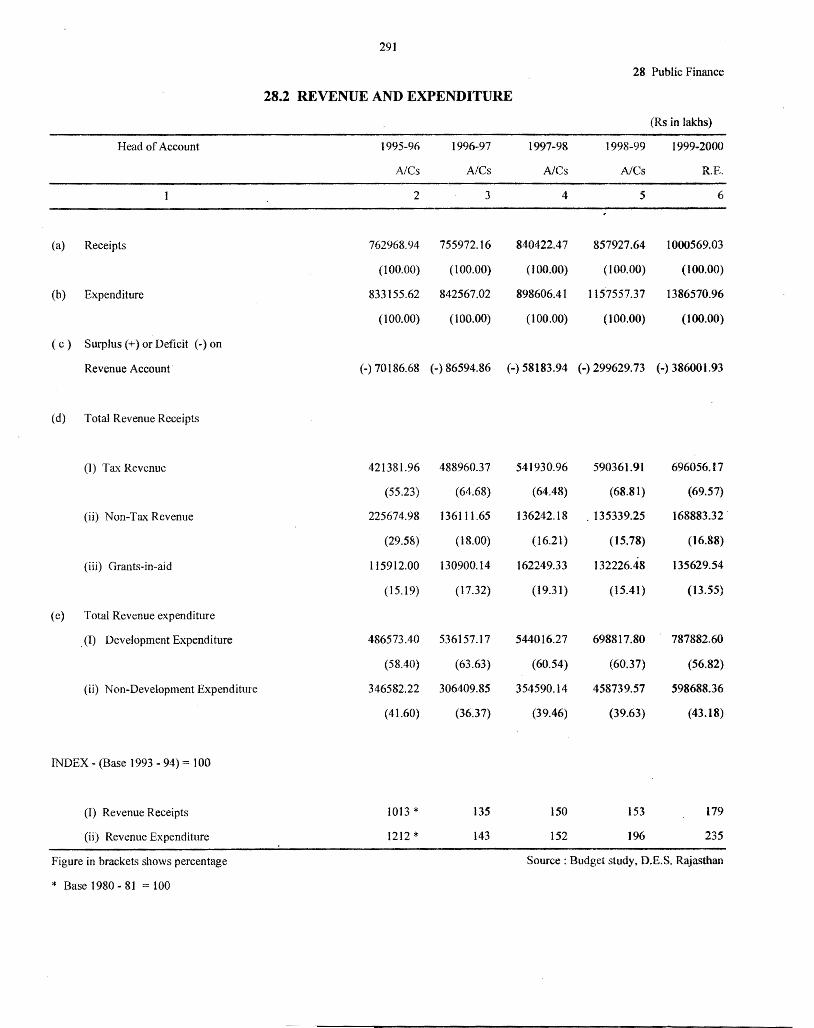
291
28 Public Finance
28.2 REVENUE AND EXPENDITURE
(Rs in lakhs)
Head of Account 1995-96 1996-97 1997-98 1998-99 1999-2000
A/Cs A/Cs A/Cs A/Cs R.E.
2 3 4 5 6
(a) Receipts 762968.94 755972.16 840422.47 857927.64 1000569.03
(100.00) (100.00) (100.00) (100.00) (100.00)
(b) Expenditure 833155.62 842567.02 898606.41 1157557.37 1386570.96
(100.00) (100.00) (100.00) (100.00) (100.00)
(c) Surplus ( +) or Deficit (-) on
Revenue Account (-) 70186.68 (-) 86594.86 (-) 58183.94 (-) 299629.73 (-) 386001.93
(d) Total Revenue Receipts
(1) Tax Revenue 421381.96 488960.37 541930.96 590361.91 696056.17
(55.23) (64.68) (64.48) (68.81) (69.57)
(ii) Non-Tax Revenue 225674.98 136111.65 136242.18 . 135339.25 168883.32
(29.58) (18.00) (16.21) (15.78) (16.88)
(iii) Grants-in-aid 115912.00 130900.14 162249.33 132226.48 135629.54
(15.19) (17.32) (19.31) (15.41) (13.55)
(c) Total Revenue expenditure
. (I) Development Expenditure 486573.40 536157.17 544016.27 698817.80 787882.60
(58.40) (63.63) (60.54) (60.37) (56.82)
(ii) Non-Development Expenditure 346582.22 306409.85 354590.14 458739.57 598688.36
(41.60) (36.37) (39.46) (39.63) (43.18)
INDEX - (Base 1993 - 94) = 100
(I) Revenue Receipts 1013 * 135 150 153 179
(ii) Revenue Expenditure 1212 * 143 152 196 235
Figure in brackets shows percentage Source: Budget study. D.E.S. Rajasthan
* Base 1980 - 81 = 100
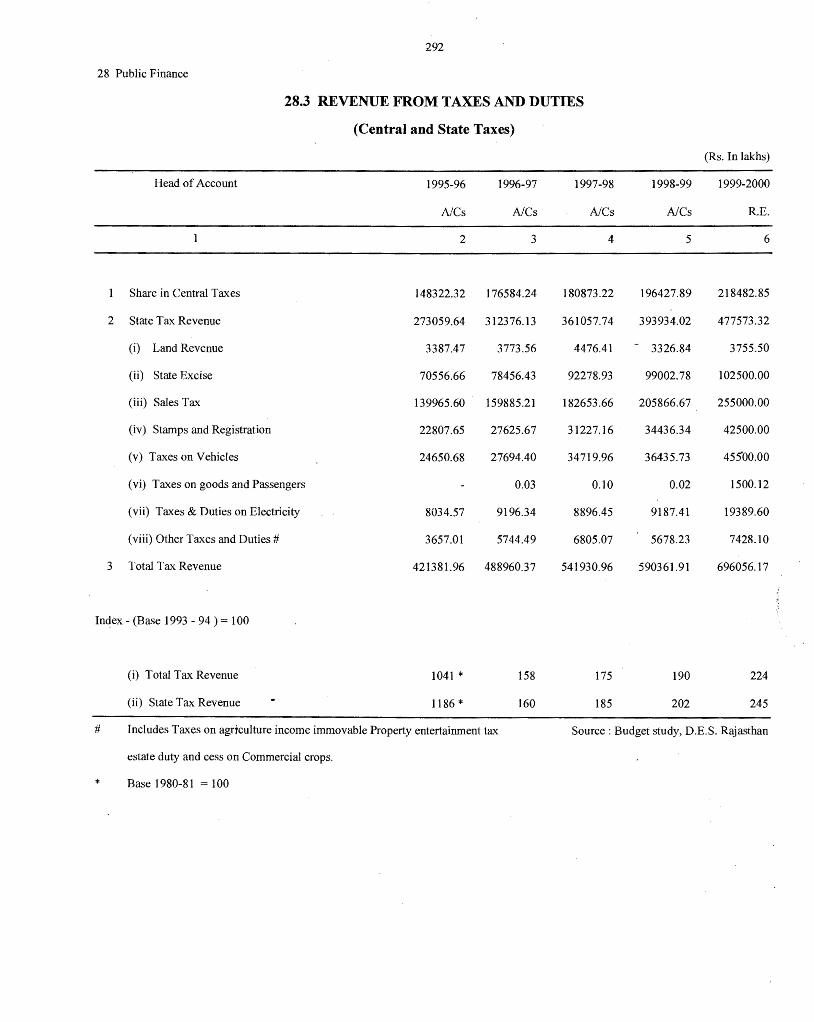
292
28 Public Finance
28.3 REVENUE FROM TAXES AND DUTIES
(Central and State Taxes)
Head of Account
Share in Central Taxes
2 State Tax Revenue
(i) Land Revenue
(ii) State Excise
(iii) Sales Tax
(iv) Stamps and Registration
(v) Taxes on Vehicles
(vi) Taxes on goods and Passengers
(vii) Taxes & Duties on Electricity
(viii) Other Taxes and Duties#
3 Total Tax Revenue
In~ex - (Base 1993 - 94 ) = 100
(i) Total Tax Revenue
(ii) State Tax Revenue
1995-96
A/Cs
2
148322.32
273059.64
3387.47
70556.66
139965.60
22807.65
24650.68
8034.57
3657.01
421381.96
1041 *
1186 *
1996-97
A/Cs
3
176584.24
312376.13
3773.56
78456.43
159885.21
27625.67
27694.40
0.03
9196.34
5744.49
488960.37
158
160
1997-98
A/Cs
4
180873.22
361057.74
4476.41
92278.93
182653.66
31227.16 .
34719.96
0.10
8896.45
6805.07
541930.96
175
185
1998-99
A/Cs
5
196427.89
393934.02
- 3326.84
99002.78
205866.67
34436.34
36435.73
0.02
9187.41
5678.23
590361.91
190
202
(Rs. In lakhs)
1999-2000
RE.
6
218482.85
477573.32
3755.50
102500.00
255000.00
42500.00
45SOO.OO
1500.12
19389.60
7428.10
696056.17
224
245
# Includes Taxes on agrrculture income immovable Property entertainment tax
estate duty and cess on Commercial crops.
Source : Budget study, D.E.S. Rajasthan
* Base 1980-81 = 100
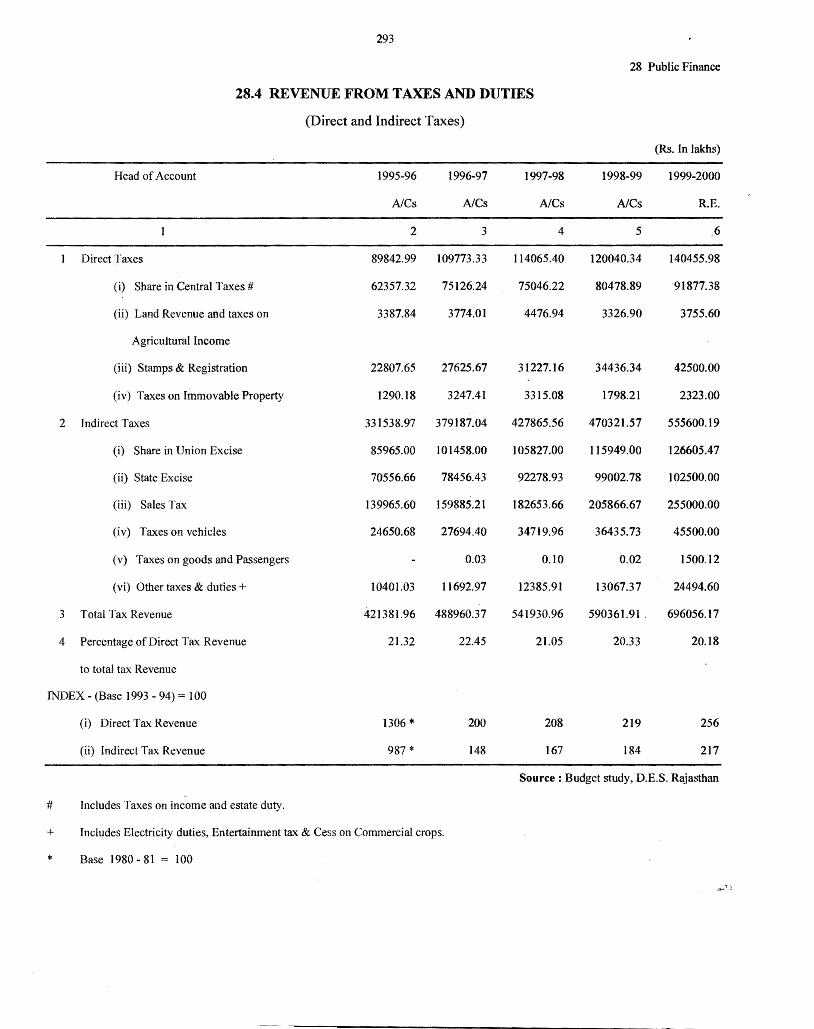
293
28 Public Finance
28.4 REVENUE FROM TAXES AND DUTIES
(Direct and Indirect Taxes)
(Rs. In lakhs)
Head of Account 1995-96 1996-97 1997-98 1998-99 1999-2000
A/Cs A/Cs A/Cs A/Cs R.E.
2 3 4 5 6
Direct Taxes 89842.99 109773.33 114065.40 120040.34 140455.98
(i) Share in Central Taxes# 62357.32 75126.24 75046.22 80478.89 91877.38
(ii) Land Revenue and taxes on 3387.84 3774.01 4476.94 3326.90 3755.60
Agricultural Income
(iii) Stamps & Registration 22807.65 27625.67 31227.16 34436.34 42500.00
(iv) Taxes on Immovable Property 1290.18 3247.41 3315.08 1798.21 2323.00
2 Indirect Taxes 331538.97 379187.04 427865.56 470321.57 555600.19
(i) Share in Union Excise 85965.00 101458.00 105827.00 115949.00 126605.47
(ii) State Excise 70556.66 78456.43 92278.93 99002.78 102500.00
(iii) Sales Tax 139965.60 159885.21 182653.66 205866.67 255000.00
(iv) Taxes on vehicles 24650.68 27694.40 34719.96 36435.73 45500.00
(v) Taxes on goods and Passengers 0.03 0.10 0.02 1500.12
(vi) Other taxes & duties+ 10401.03 11692.97 12385.91 13067.37 24494.60
3 Total Tax Revenue 421381.96 488960.37 541930.96 590361.91 ' 696056.17
4 Percentage of Direct Tax Revenue 21.32 22.45 21.05 20.33 20.18
to total tax Revenue
INDEX - (Base 1993 - 94) = l 00
(i) Direct Tax Revenue 1306 * 200 208 219 256
(ii) Indirect Tax Revenue 987 * 148 167 184 217
Source : Budget study, D.E.S. R~jasthan
# Includes Taxes on income and estate duty.
+ Includes Electricity duties, Entertainment tax & Cess on Commercial crops.
* Base 1980 - 81 = 100
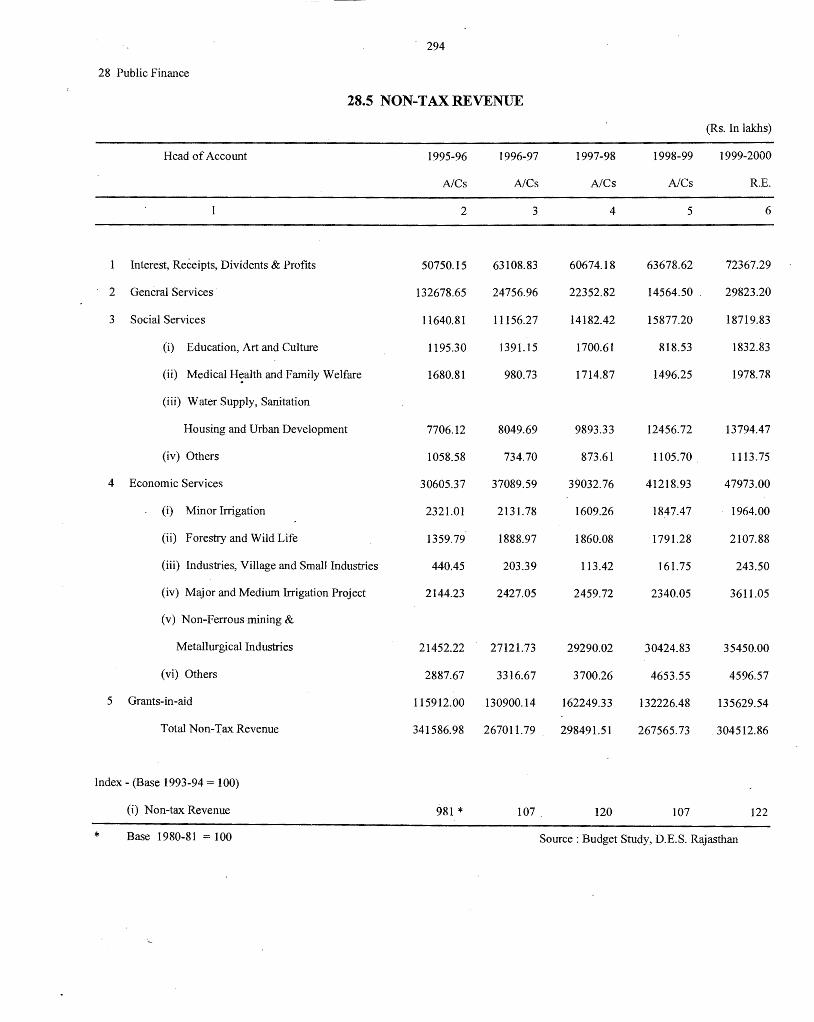
294
28 Public Finance
28.5 NON-TAXREVENUE
Head of Account
Interest, Receipts, Dividents & Profits
2 General Services
3 Social Services
(i) Education, Art and Culture
(ii) Medical H~alth and Family Welfare
(iii) Water Supply, Sanitation
Housing and Urban Development
(iv) Others
4 Economic Services
(i) Minor Irrigation
(ii) Forestry and Wild Life
(iii) Industries, Village and Small Industries
(iv) Major and Medium Irrigation Project
(v) Non-Ferrous mining &
Metallurgical Industries
(vi) Others
5 Grants-in-aid
Total Non-Tax Revenue
1995-96
NCs
2
50750.15
132678.65
11640.81
1I95.30
1680.81
7706.12
1058.58
30605.37
2321.01
1359.79
440.45
2144.23
21452.22
2887.67
115912.00
341586.98
1996-97
NCs
3
63108.83
24756.96
11156.27
139l.15
980.73
8049.69
734.70
37089.59
2131.78
1888.97
203.39
2427.05
27121.73
3316.67
130900.14
267011.79
1997-98
NCs
4
60674.18
22352.82
14182.42
1700.61
1714.87
9893.33
873.61
39032.76
1609.26
1860.08
113.42
2459.72
29290.02
3700.26
162249.33
298491.51
1998-99
NCs
5
63678.62
14564.50
15877.20
818.53
1496.25
12456.72
1105.70
41218.93
1847.47
1791.28
161.75
2340.05
30424.83
4653.55
132226.48
267565.73
(Rs. In lakhs)
1999-2000
RE.
6
72367.29
29823.20
18719.83
1832.83
1978.78
13794.47
1113.75
47973.00
1964.00
2107.88
243.50
3611.05
35450.00
4596.57
135629.54
304512.86
Index - (Base 1993-94 = 100)
(i) Non-tax Revenue 981 * 107 ' 120 107 122
* Base 1980-81 = 100 Source : Budget Study, D.E.S. Rajasthan
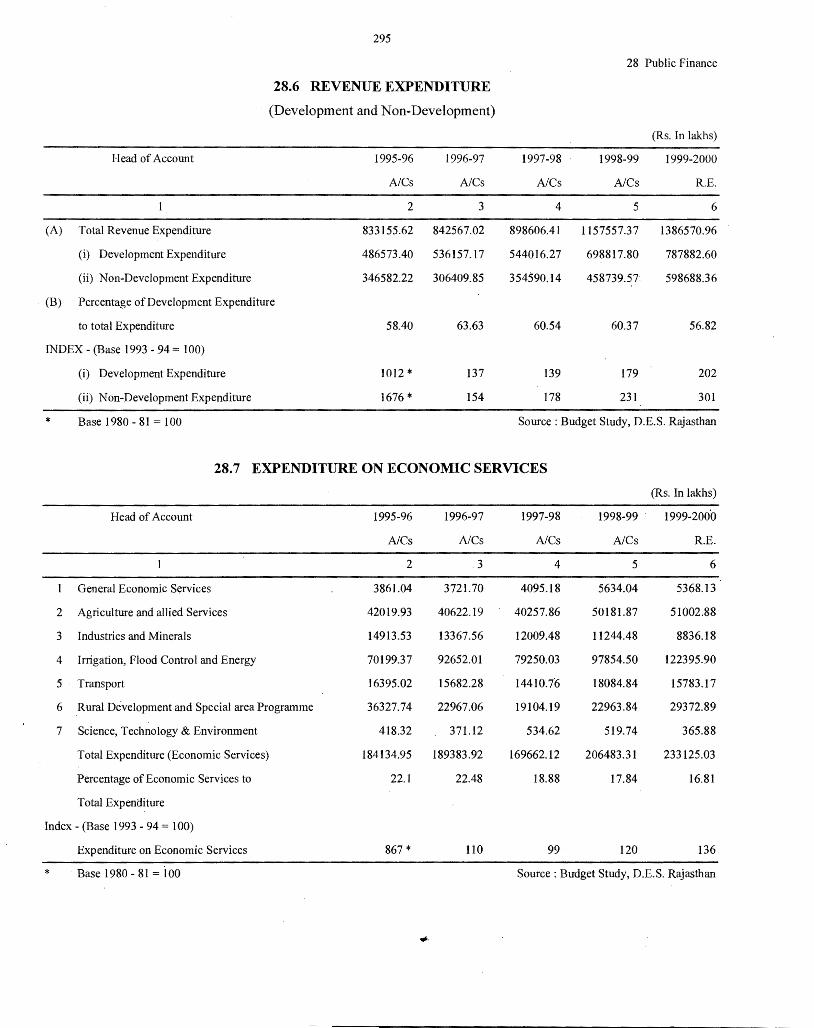
295
28.6 REVENUE EXPENDITURE
(Development and Non-Development)
Head of Account
(A) Total Revenue Expenditure
(i) Development Expenditure
(ii) Non-Development Expenditure
(B) Percentage of Development Expenditure
to total Expenditure
INDEX - (Base 1993 - 94 = 100)
(i) Development Expenditure
(ii) Non-Development Expenditure
* Base 1980 - 81 = 100
1995-96 1996-97
A/Cs A/Cs
2 3
833155.62 842567.02
486573.40 536157.17
346582.22 306409.85
58.40 63.63
1012 * 137
1676 * 154
28 Public Finance
(Rs. In lakhs)
1997-98 1998-99 1999-2000
A/Cs A/Cs RE.
4 5 6
898606.41 1157557.37 1386570.96
544016.27 698817.80 787882.60
354590.14 458739.57 598688.36
60.54 60.37 56.82
139 179 202
178 231 301
Source : Budget Study, D.E.S. Rajasthan
28.7 EXPENDITURE ON ECONOMIC SERVICES
(Rs. In lakhs)
Head of Account 1995-96 1996-97 1997-98 1998-99 - 1999-200'0
A/Cs A/Cs A/Cs A/Cs RE.
2 3 4 5 6
General Economic Services 3861.04 3721.70 4095.18 5634.04 5368.13
2 Agriculture and allied Services 42019.93 40622.19 40257.86 50181.87 51002.88
3 Industries and Minerals 14913.53 13367.56 12009.48 11244.48 8836.18
4 Irrigation, Flood Control and Energy 70199.37 92652.01 79250.03 97854.50 122395.90
5 Transport 16395.02 15682.28 14410.76 18084.84 15783.17
6 Rural Development and Special area Programme 36327.74 22967.06 19104.19 22963.84 29372.89
7 Science, Technology & Environment 418.32 371.12 534.62 519.74 365.88
Total Expenditure (Economic Services) 184134.95 189383.92 169662.12 206483.31 233125.03
Percentage of Economic Services to 22.1 22.48 18.88 17.84 16.81
Total Expenditure
Index - (Base 1993 - 94 = 100)
Expenditure on Economic Services 867 * 110 99 120 136
* - Base 1980- 81=100 Source: Budget Study, D.E.S. Rajasthan
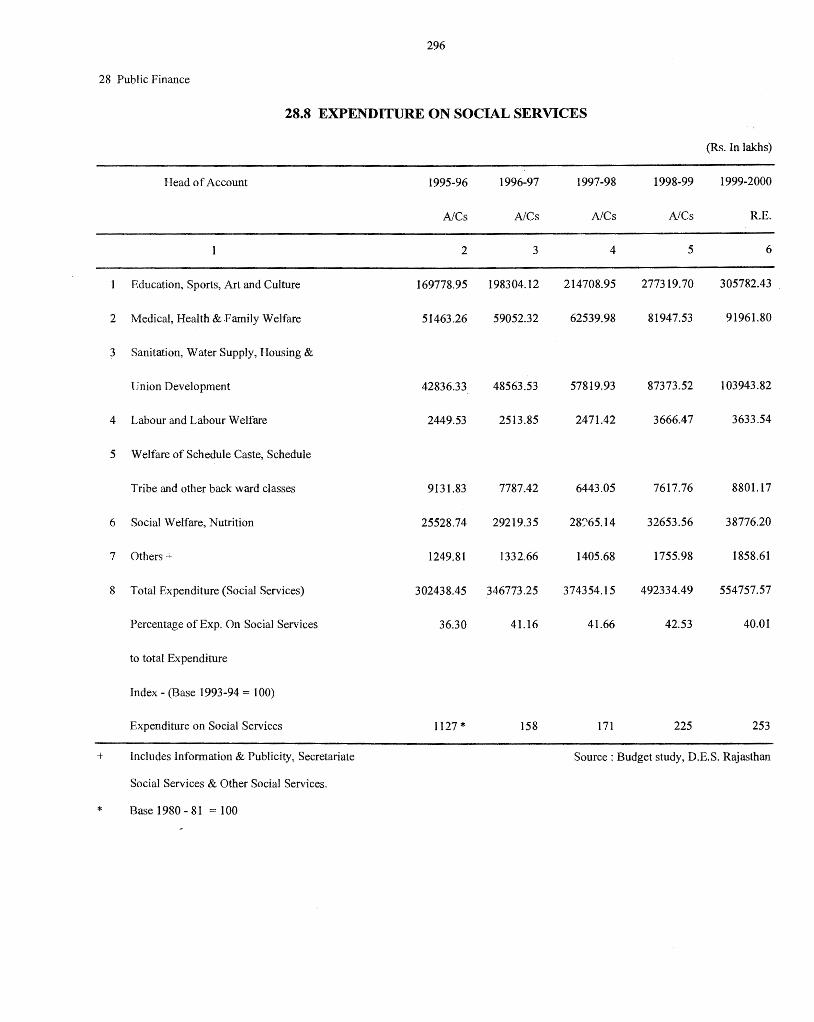
296
28 Public Finance
28.8 EXPENDITURE ON SOCIAL SERVICES
(Rs. In lakhs)
Head of Account 1995-96 1996-97 1997-98 1998-99 1999-2000
A/Cs A/Cs A/Cs A/Cs R.E.
2 3 4 5 6
Education, Sports, Art and Culture 169778.95 198304.12 214708.95 277319.70 305782.43
2 Medical, Health & .Family Welfare 51463.26 59052.32 62539.98 81947.53 91961.80
3 Sanitation, Water Supply, Housing &
Union Development 42836.33 48563.53 57819.93 87373.52 103943.82
4 Labour and Labour Welfare 2449.53 2513.85 2471.42 3666.47 3633.54
5 Welfare of Schedule Caste, Schedule
Tribe and other back ward classes 9131.83 7787.42 6443.05 7617.76 8801.17
6 Social Welfare, Nutrition 25528.74 29219.35 28'.:'65.14 32653.56 38776.20
7 Others+ 1249.81 1332.66 1405.68 1755.98 1858.61
8 Total Expenditure (Social Services) 302438.45 346773.25 374354.15 492334.49 554757.57
Percentage of Exp. On Social Services 36.30 41.16 41.66 42.53 40.01
to total Expenditure
Index - (Base 1993-94 = 100)
Expenditure on Social Services 1127 * 158 171 225 253
+ Includes Information & Publicity, Secretariate Source : Budget study, D.E.S. Rajasthan
Social Services & Other Social Services.
* Base 1980 - 81 = 100
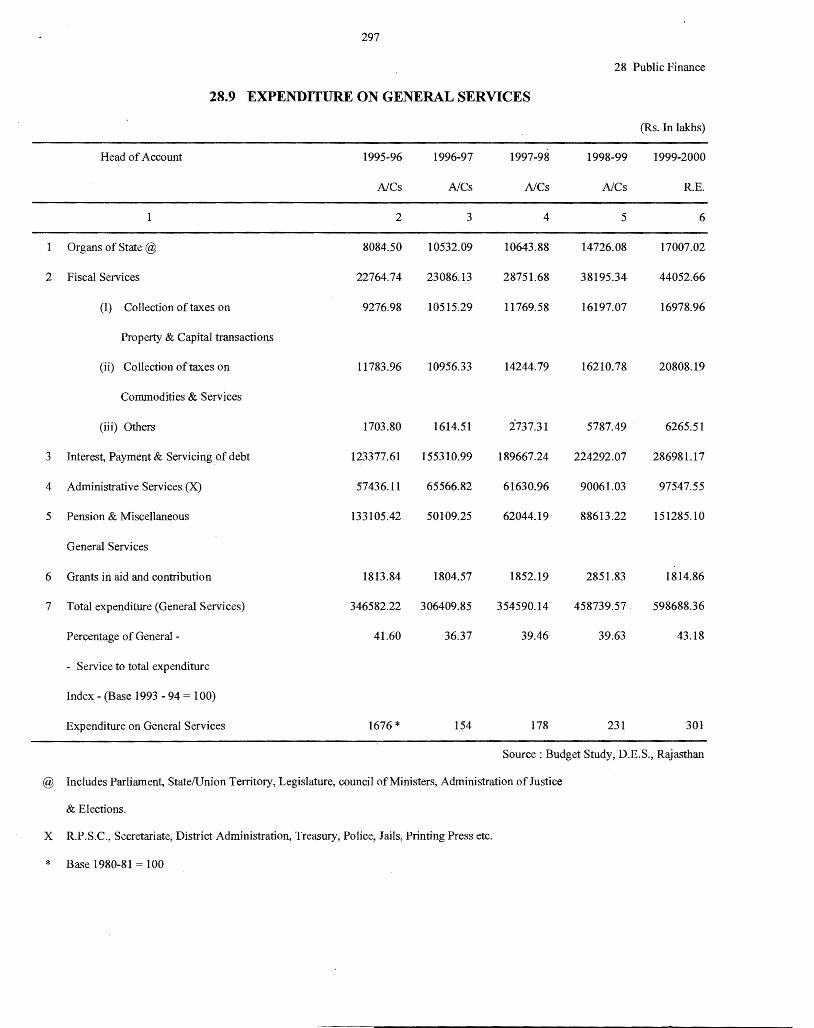
297
28 Public Finance
28.9 EXPENDITURE ON GENERAL SERVICES
(Rs. In lakhs)
Head of Account 1995-96 1996-97 1997-98 1998-99 1999-2000
A/Cs A/Cs A/Cs A/Cs R.E.
2 3 4 5 6
Organs of State @ 8084.50 10532.09 10643.88 14726.08 17007.02
2 Fiscal Services 22764.74 23086.13 28751.68 38195.34 44052.66
(I) Collection of taxes on 9276.98 10515.29 11769.58 16197.07 16978.96
Property & Capital transactions
(ii) Collection of taxes on 11783.96 10956.33 14244.79 16210.78 20808.19
Commodities & Services
(iii) Others 1703.80 1614.51 2737.31 5787.49 6265.51
3 Interest, Payment & Servicing of debt 123377.61 155310.99 189667.24 224292.07 286981.17
4 Administrative Services (X) 57436.11 65566.82 61630.96 90061.03 97547.55
5 Pension & Miscellaneous 133105.42 50109.25 62044.19 88613.22 151285.10
General Services
6 Grants in aid and contribution 1813.84 1804.57 1852.19 2851.83 1814.86
7 Total expenditure (General Services) 346582.22 306409.85 354590.14 458739.5_7 598688.36
Percentage of General - 41.60 36.37 39.46 39.63 43.18
- Service to total expenditure
Index - (Base 1993 - 94 = 100)
Expenditure on General Services 1676 * 154 178 231 301
Source: Budget Study, D.E.S., Rajasthan
@ Includes Parliament, State/Union Territory, Legislature, council of Ministers, Administration of Justice
& Elections.
x RP.S.C., Secretariate, District Administration, Treasury, Police, Jails, Printing Press etc.
* Base 1980-81 = 100
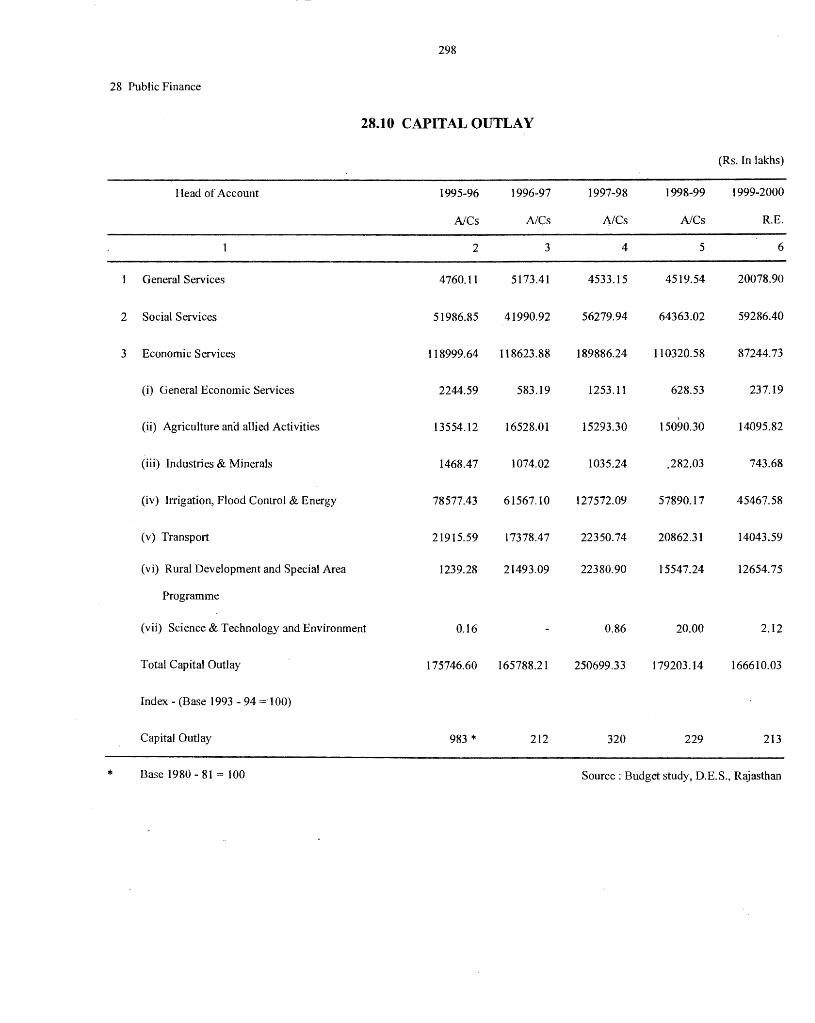
298
28 Public Finance
28.10 CAPITAL OUTLAY
(Rs. In lakhs)
Head of Account 1995-96 1996-97 1997-98 1998-99 1999-2000
A/Cs A/Cs A/Cs A/Cs RE.
2 3 4 5 6
General Services 4760.11 5173.41 4533.15 4519.54 20078.90
2 Social Services 51986.85 41990.92 56279.94 64363.02 59286.40
3 Economic Services 118999.64 I 18623.88 189886.24 110320.58 87244.73
(i) General Economic Services 2244.59 583.19 1253. l l 628.53 237.19
(ii) Agriculture ana allied Activities 13554.12 16528.01 15293.30 15090.30 14095.82
(iii) Industries & Minerals 1468.47 1074.02 1035.24 ,282.03 743.68
(iv) Irrigation, Flood Control & Energy 78577.43 61567.10 127572.09 57890.17 45467.58
(v) Transport 21915.59 17378.47 22350.74 20862.31 14043.59
(vi) Rural Development and Special Area 1239.28 21493.09 22380.90 15547.24 12654.75
Programme
(vii) Science & Technology and Environment 0.16 0.86 20.00 2.12
Total Capital Outlay 175746.60 165788.21 250699.33 179203.14 166610.03
Index - (Base 1993 - 94 ='100)
Capital Outlay 983 * 212 320 229 213
* Base 1980 - 81 = 100 Source: Budget study, D.E.S., Rajasthan
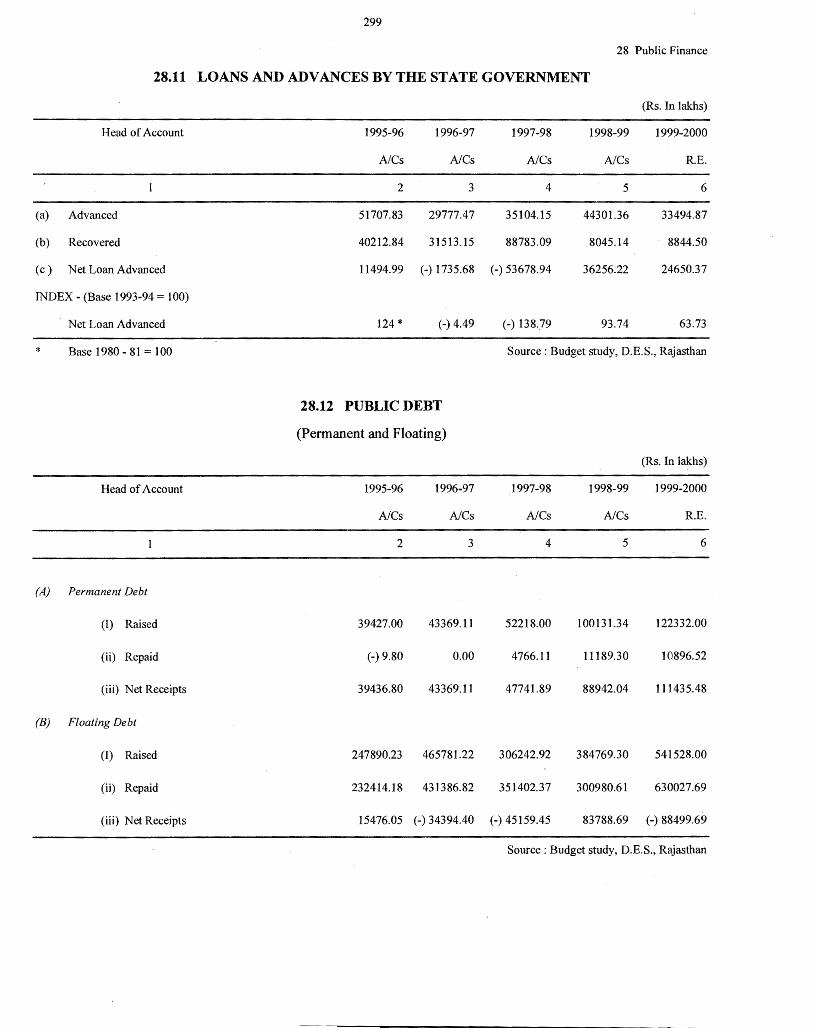
299
28 Public Finance
28.11 LOANS AND ADVANCES BY THE STATE GOVERNMENT
Head of Account
(a) Advanced
(b) Recovered
(c) Net Loan Advanced
INDEX - (Base 1993-94 = 100)
Net Loan Advanced
* Base 1980 - 81=100
Head of Account
(A) Permanent Debt
(l) Raised
(ii) Repaid
(iii) Net Receipts
(B) Floating Debt
(I) Raised
(ii) Repaid
(iii) Net Receipts
1995-96 ·1996-97
A/Cs A/Cs
2 3
51707.83 29777.47
40212.84 31513.15
11494.99 (-) 1735.68
124 * (-) 4.49
28.12 PUBLIC DEBT
(Permanent and Floating)
1995-96 1996-97
A/Cs A/Cs
2 3
39427.00 43369.11
(-)9.80 0.00
39436.80 43369.11
247890.23 465781.22
232414.18 431386.82
15476.05 (-) 34394.40
(Rs. In lakhs)
1997-98 1998-99 1999-2000
A/Cs A/Cs RE.
4 5 6
35104.15 44301.36 33494.87
88783.09 8045.14 8844.50
(-) 53678.94 36256.22 24650.37
(-) 138 .. 79 93.74 63.73
Source: Budget study, D.E.S., Rajasthan
(Rs. In lakhs)
1997-98 1998-99 1999-2000
A/Cs A/Cs RE.
4 5 6
52218.00 100131.34 122332.00
4766.11 11189.30 10896.52
47741.89 88942.04 111435.48
306242.92 384769.30 541528.00
351402.37 300980.61 630027.69
(-) 45159.45 83788.69 (-) 88499.69
Source: Budget study, D.E.S., Rajasthan
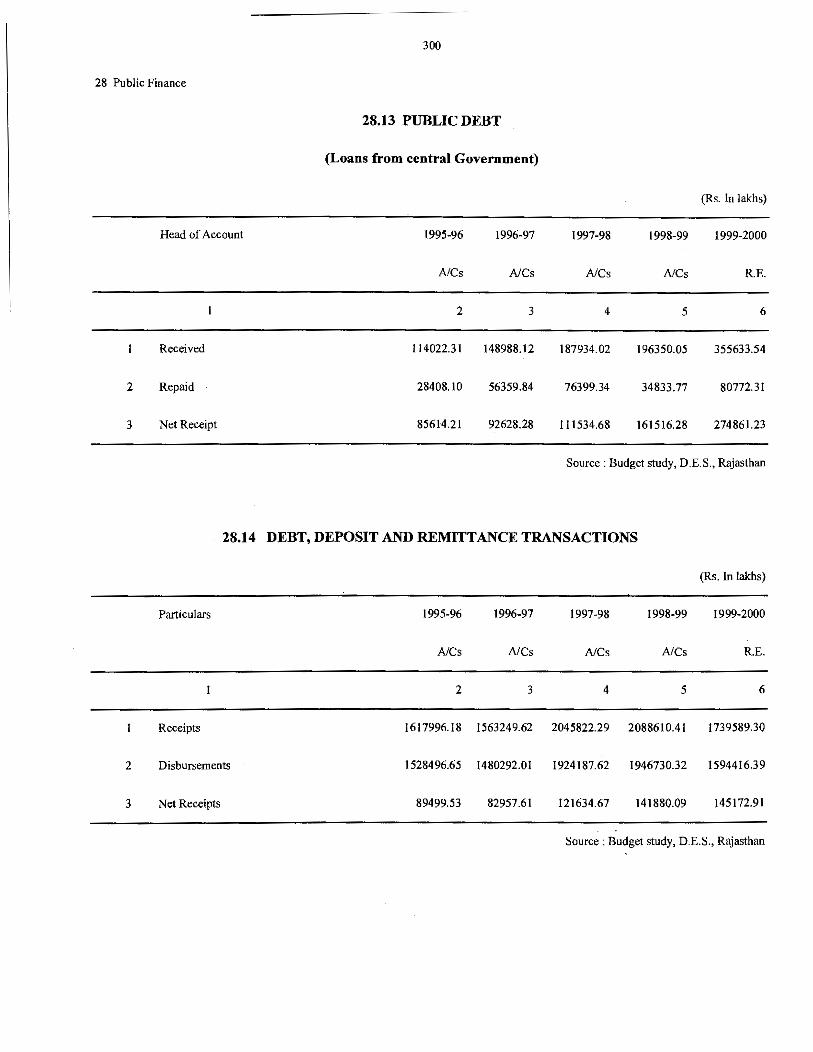
28 Public Finance
2
3
Head of Account
Received
Repaid
Net Receipt
300
28.13 PUBLIC DEBT
(Loans from central Government)
1995-96 1996-97
NCs NCs
2 3
114022.31 148988.12
28408.10
85614.21
56359.84
92628.28
1997-98
NCs
4
187934.02
76399.34
111534.68
1998-99
NCs
5
196350.05
34833.77
161516.28
(Rs. In lakhs)
1999-2000
R.E.
6
355633.54
80772.31
274861.23
Source: Budget study, D.E.S., Rajasthan
28.14 DEBT, DEPOSIT AND REMITTANCE TRANSACTIONS
(Rs. In lakhs)
Particulars 1995-96 1996-97 1997-98 1998-99 1999-2000
NCs NCs NCs NCs R.E.
2 3 4 5 6
Receipts 1617996.18 1563249.62 2045822.29 2088610.41 1739589.30
2 Disbursements 1528496.65 1480292.01 1924187.62 1946730.32 1594416.39
3 Net Receipts 89499.53 82957.61 121634.67 141880.09 145172.91
Source: Budget study, D.E.S., Rajasthan
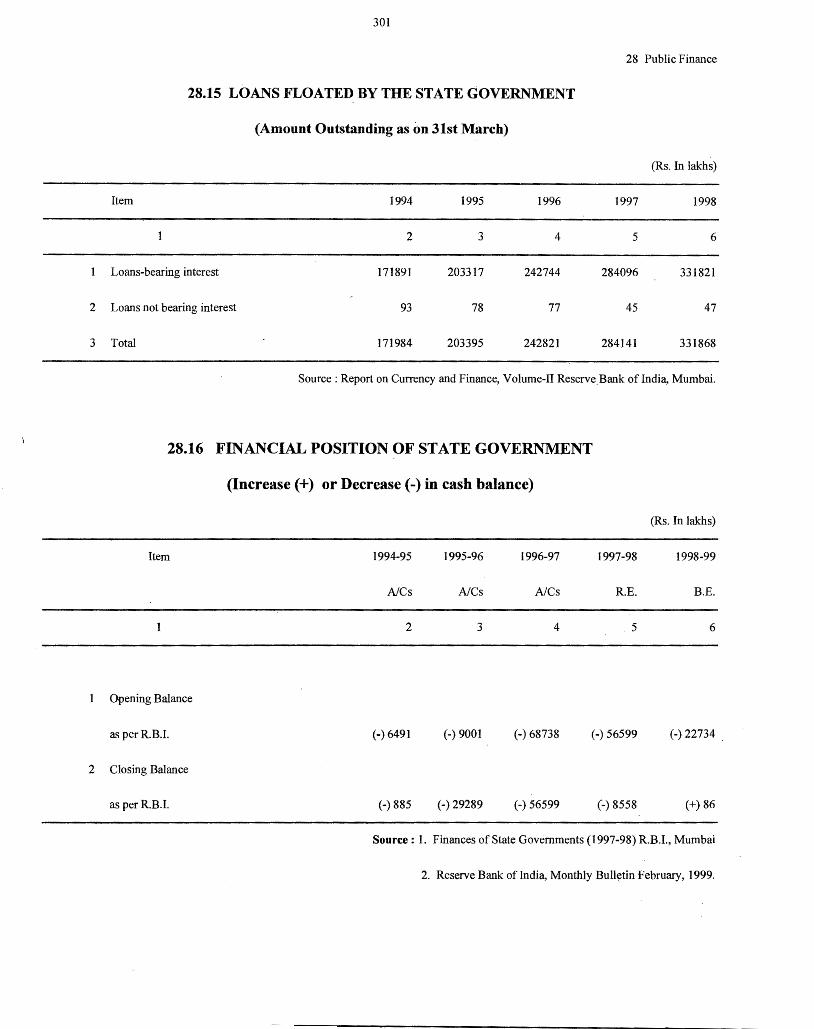
2
3
301
28 Public Finance
28.15 LOANS FLOATED BY THE STATE GOVERNMENT
(Amount Outstanding as on 31st March)
(Rs. In lakhs)
Item 1994 1995 1996 1997 1998
2 3 4 5 6
Loans-bearing interest 171891 203317 242744 284096 331821
Loans not bearing interest 93 78 77 45 47
Total 171984 203395 242821 284141 331868
Source: Report on Currency and Finance, Volume-II Reserve.Bank oflndia, Mumbai.
28.16 FINANCIAL POSITION OF STATE GOVERNMENT
(Increase(+) or Decrease(-) in cash balance)
Item 1994-95 1995-96 1996-97
A/Cs A/Cs A/Cs
2 3 4
Opening Balance
1997-98
R.E.
5
as per R.B.I. (-) 6491 (-) 9001 (-)68738 (-) 56599
(Rs. In lakhs)
1998-99
B.E.
6
(-) 22734 '
2 Closing Balance
as per R.B.I. (-) 885 (-) 29289 (-) 56599 (-) 8558 (+) 86
Source: 1. Finances of State Governments (1997-98) R.B.I., Mumbai
2. Reserve Bank of India, Monthly Bull~tin February, 1999.
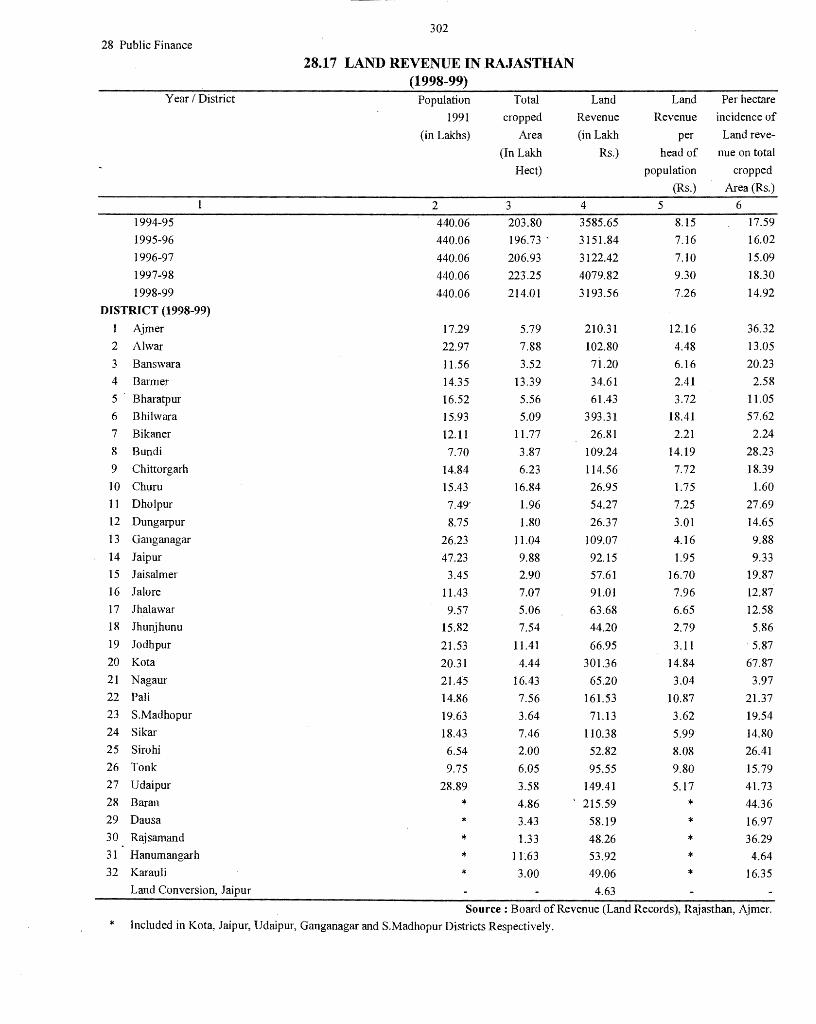
302
28 Public Finance
28.17 LAND REVENUE IN RAJASTHAN (1998-99)
Year I District Population Total Land Land Per hectare
1991 cropped Revenue Revenue incidence of
(in Lakhs) Area (in Lakh per Land reve-
(In Lakh Rs.) head of nue on total
Hect) population cropped
(Rs.) Area (Rs.)
2 3 4 5 6
1994-95 440.06 203.80 3585.65 8.15 17.59
1995-96 440.06 196.73 . 3151.84 7.16 16.02
1996-97 440.06 206.93 3122.42 7.10 15.09
1997-98 440.06 223.25 4079.82 9.30 18.30
1998-99 440.06 214.01 3193.56 7.26 14.92
DISTRICT (1998-99)
1 Ajmer 17.29 5.79 210.31 12.16 36.32
2 Al war 22.97 7.88 102.80 4.48 13.05
3 Banswara 11.56 3.52 7i.20 6.16 20.23
4 Barmer 14.35 13.39 34.61 2.41 2.58
5 Bharatpur 16.52 5.56 61.43 3.72 11.05
6 Bhilwara 15.93 5.09 393.31 18.41 57.62
7 Bikaner 12.11 11.77 26.81 2.21 2.24
8 Bundi 7.70 3.87 109.24 14.19 28.23
9 Chittorgarh 14.84 6.23 114.56 7.72 18.39
10 Churn 15.43 16.84 26.95 1.75 1.60
11 Dholpur 7.49• 1.96 54.27 7.25 27.69
12 Dungarpur 8.75 1.80 26.37 3.01 14.65
13 Ganganagar 26.23 11.04 109.07 4.16 9.88
14 Jaipur 47.23 9.88 92.15 1.95 9.33
15 Jaisalmer 3.45 2.90 57.61 16.70 19.87
16 Jalore 11.43 7.07 91.01 7.96 12.87
17 Jhalawar 9.57 5.06 63.68 6.65 12.58
18 Jhunjhunu 15.82 7.54 44.20 2.79 5.86
19 Jodhpur 21.53 11.41 66.95 3.11 5.87
20 Ko ta 20.31 4.44 301.36 14.84 67.87
21 Nagaur 21.45 16.43 65.20 3.04 3.97
22 Pali 14.86 7.56 161.53 10.87 21.37
23 S.Madhopur 19.63 3.64 71.13 3.62 19.54 24 Sikar 18.43 7.46 110.38 5.99 14.80
25 Sirohi 6.54 2.00 52.82 8.08 26.41
26 Tonk 9.75 6.05 95.55 9.80 15.79 27 Udaipur 28.89 3.58 149.41 5.17 41.73 28 Baran * 4.86 ' 215.59 * 44.36 29 Daus a * 3.43 58.19 * 16.97 30 R~jsamand * 1.33 48.26 * 36.29 31 Hanumangarh * 11 ~63 53.92 * 4.64 32 Karauli * 3.00 49.06 * 16.35
Land Conversion, Jaipur 4.63
Source: Board of Revenue (Land Records), Rajasthan, Ajmer.
* Included in Kota, Jaipur, Udaipur, Ganganagar and S.Madhopur Districts Respectively.
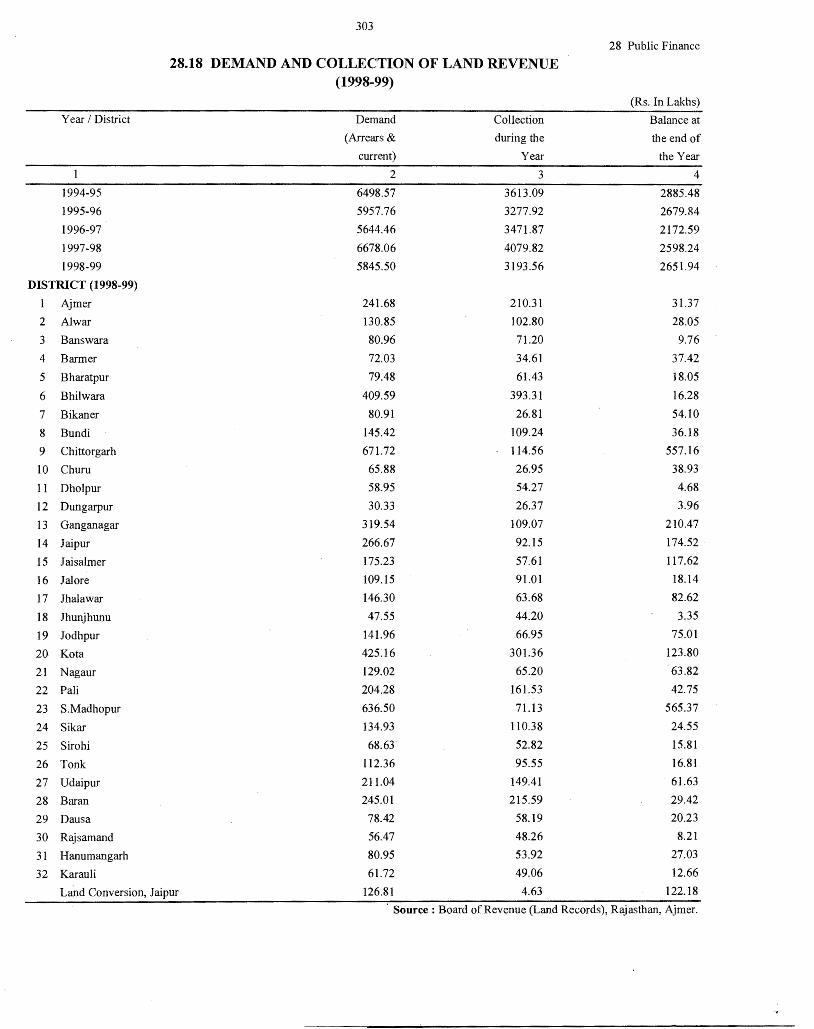
Year I District
1994-95
1995-96
1996-97
1997-98
1998-99
DISTRICT (1998-99)
Ajmer
2 Al war
3 Banswara
4 Barmer
5 Bharatpur
6 Bhilwara
7 Bikaner
8 Bundi
9 Chittorgarh
10 Chum
11 Dholpur
12 Dungarpur
13 Ganganagar
14 Jaipur
15 Jaisalmer
16 Jal ore
17 Jhalawar
18 Jhunjhunu
19 Jodhpur
20 Ko ta
21 Nagaur
22 Pali
23 S.Madhopur
24 Sikar
25 Sirohi
26 Tonk
27 Udaipur
28 Baran
29 Daus a
30 Rajsamand
31 Hanumangarh
32 Karauli
303
28.18 DEMAND AND COLLECTION OF LAND REVENUE (1998-99)
Demand Collection
(Arrears & during the
current) Year
2 3
6498.57 3613.09
5957.76 3277.92
5644.46 3471.87
6678.06 4079.82
5845.50 3193.56
241.68 210.31
130.85 102.80
80.96 71.20
72.03 34.61
79.48 61.43
409.59 393.31
80.91 26.81
145.42 109.24
671.72 114.56
65.88 26.95
58.95 54.27
30.33 26.37
319.54 109.07
266.67 92.15
175.23 57.61
109.15 91.01
146.30 63.68
47.55 44.20
141.96 66.95
425.16 301.36
129.02 65.20
204.28 161.53
636.50 71.13
134.93 110.38
68.63 52.82
112.36 95.55
211.04 149.41
245.01 215.59
78.42 58.19
56.47 48.26
80.95 53.92
61.72 49.06
28 Public Finance
(Rs. In Lakhs)
Balance at
the end of
the Year
4
2885.48
2679.84
2172.59
2598.24
2651.94
31.37
28.05
9.76
37.42
18.05
16.28
54.10
36.18
557.16
38.93
4.68
3.96
210.47
174.52
117.62
18.14
82.62
3.35
75.01
123.80
63.82
42.75
565.37
24.55
15.81
16.81
61.63
29.42
20.23
8.21
27.03
12.66
Land Conversion, Jaipur 126.81 4.63 122.18
Source: Board of Revenue (Land Records), Rajasthan, Ajmer.
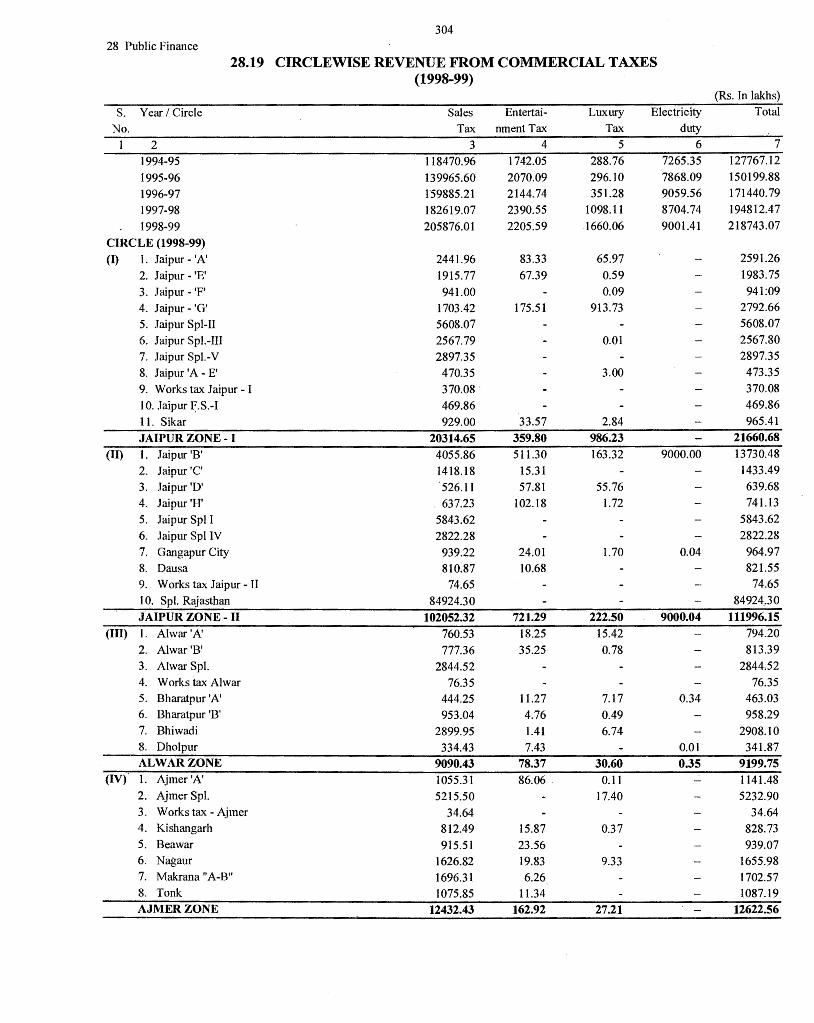
304 28 Public Finance
28.19 CIRCLEWISE REVENUE FROM COMMERCIAL TAXES (1998-99)
(Rs. In lakhs)
S. Year I Circle Sales Entertai- Luxury Electricity Total
No. Tax nment Tax Tax duty
l 2 3 4 5 6 7
1994-95 118470.96 1742.05 288.76 7265.35 127767.12
1995-96 139965.60 2070.09 296.10 7868.09 150199.88
1996-97 159885.21 2144.74 351.28 9059.56 171440. 79
1997-98 182619.07 2390.55 1098.11 8704.74 194812.47
1998-99 205876.01 2205.59 1660.06 9001.41 218743.07
CIRCLE (1998-99) (I) I. Jaipur - 'A' 2441.96 83.33 65.97 2591.26
2. Jaipur - 'E' 1915,77 67.39 0.59 1983.75
3. Jaipur - 'F' 941.00 0.09 941:09
4. Jaipur - 'G' 1703.42 175.51 913.73 2792.66
5. Jaipur Spl-II 5608.07 5608.07
6. Jaipur Spl.-III 2567.79 0.01 2567.80
7. Jaipur Spl.-V 2897.35 2897.35
8. Jaipur 'A - E' 470.35 3.00 473.35
9. Works tax Jaipur - I 370.08. 370.08
10. Jaipur F:.S.-I 469.86 469.86
11. Sikar 929.00 33.57 2.84 965.41
JAIPUR ZONE - I 20314.65 359.80 986.23 21660.68
(II) l. Jaipur 'B' 4055.86 511.30 163.32 9000.00 13730.48
2. Jaipur 'C' 1418.18 15.31 1433.49
3. Jaipur 'D' 526.I 1 57.81 55.76 639.68
4. Jaipur 'H' . 637.23 102.18 1.72 741.13
5. Jaipur Spl I 5843.62 5843.62
6. Jaipur Spl IV 2822.28 2822.28
7. Gangapur City 939.22 24.01 1.70 0.04 964.97 8. Dausa 810.87 10.68 821.55
9. Works tax Jaipur - II 74.65 74.65
10. Spl. Rajasthan 84924.30 84924 . .30
JAIPUR ZONE - II 102052.32 721.29 222.50 9000.04 111996.15 (III) 1. Alwar'A' 760.53 18.25 15.42 794.20
2. Alwar'B' 777.36 35.25 0.78 813.39 3. Alwar Spl. 2844.52 2844.52 4. Works tax Al war 76.35 76.35 5. Bharatpur 'A' 444.25 11.27 7.17 0.34 463.03 6. Bharatpur 'B' 953.04 4.76 0.49 958.29 7. Bhiwadi 2899.95 1.41 6.74 2908.10 8. Dholpur 334.43 7.43 0.01 341.87 ALWARZONE 9090.43 78.37 30.60 0.35 9199.75
(IV) 1. Ajmer'A' 1055.31 86.06 . 0.11 1141.48 2. Ajmer Spl. 5215.50 17.40 5232.90 3. Works tax - Ajmer 34.64 34.64 4. Kishangarh 812.49 15.87 0.37 828.73 5. Bea war 915.51 23.56 939.07 6. Nagaur 1626.82 19.83 9.33 1655.98 7. Makrana "A-B" 1696.31 6.26 1702.57 8. Tonk 1075.85 11.34 1087.19 AJMERZONE 12432.43 162.92 27.21 12622.56
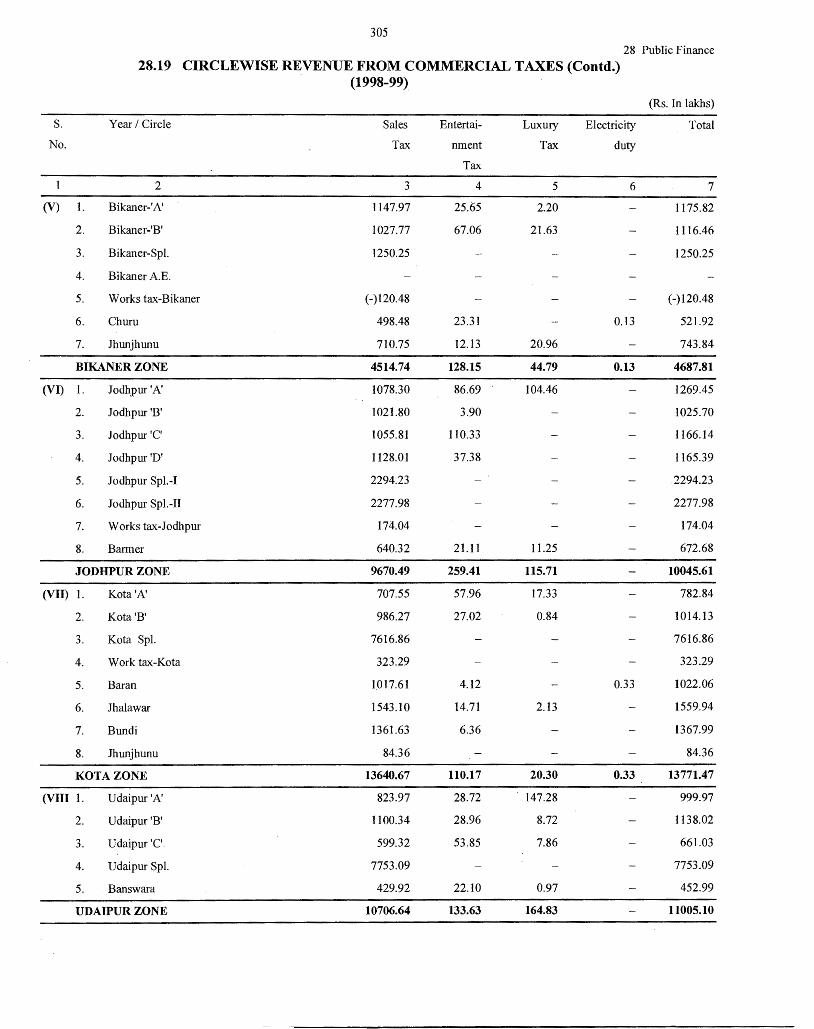
305 28 Public Finance
28.19 CIRCLEWISE REVENUE FROM COMMERCIAL TAXES (Contd.) (1998-99)
(Rs. In lakhs)
S. Year I Circle Sales Entertai- Luxury Electricity Total
No. Tax nment Tax duty
Tax
2 3 4 5 6 7
(V) 1. Bikaner-'A' 1147.97 25.65 2.20 1175.82
2. Bikaner-'B' 1027.77 67.06 21.63 1116.46
3. Bikaner-Spl. 1250.25 1250.25
4. Bikaner A.E.
5. \Vorkstax-Bikaner (-)120.48 (-)120.48
6. Chum 498.48 23.31 0.13 521.92
7. Jhunjhunu 710.75 12.13 20.96 743.84
BIKANER ZONE 4514.74 128.15 44.79 0.13 4687.81
(VI) 1. Jodhpur'A' 1078.30 86.69 104.46 1269.45
2. Jodhpur 'B' 1021.80 3.90 1025.70
3. Jodhpur 'C' 1055.81 110.33 1166.14
4. Jodhpur 'D' 1128.01 37.38 1165.39
5. Jodhpur Spl.-I 2294.23 2294.23
6. Jodhpur Spl.-II 2277.98 2277.98
7. \V orks tax-Jodhpur 174.04 174.04
8. Barmer 640.32 21.11 11.25 672.68
JODHPUR ZONE 9670.49 259.41 115.71 10045.61
(VII) 1. Kota 'A' 707.55 57.96 17.33 782.84
2. Kota 'B' 986.27 27.02 0.84 1014.13
3. Kota Spl. 7616.86 7616.86
4. \Vork tax-Kota 323.29 323.29
5. Baran 1017.61 4.12 0.33 1022.06
6. Jhalawar 1543.10 14.71 2.13 1559.94
7. Bundi 1361.63 6.36 1367.99
8. Jhunjhunu 84.36 84.36
KOTAZONE 13640.67 110.17 20.30 0.33 13771.47
(VIII 1. Udaipur'A' 823.97 28.72 147.28 999.97
2. Udaipur 'B' 1100.34 28.96 8.72 1138.02
3. Udaipur 'C' 599.32 53.85 7.86 661.03
4. Udaipur Spl. 7753.09 7753.09
5. Banswara 429.92 22.10 0.97 452.99
UDAIPUR ZONE 10706.64 133.63 164.83 11005.10
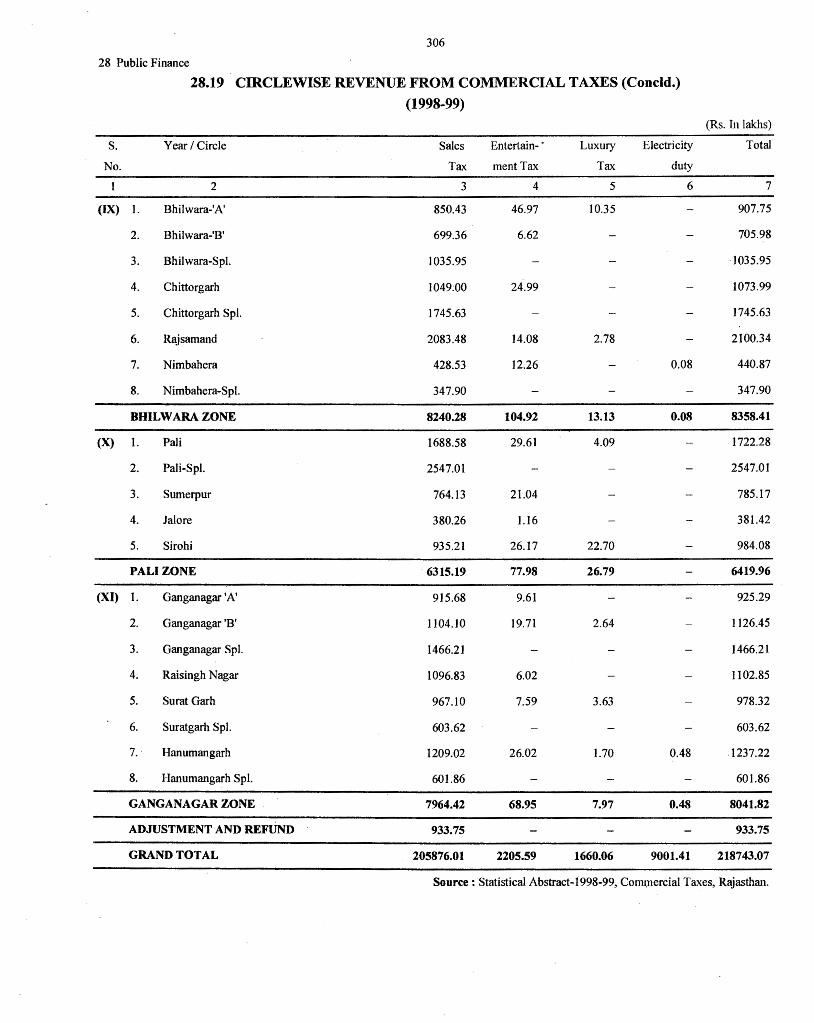
306
28 Public Finance
28.19 CIRCLEWISE REVENUE FROM COMMERCIAL TAXES (Concld.)
(1998-99) (Rs. In lakhs)
s. Year I Circle Sales Entertain- · Luxury Electricity Total
No. Tax mentTax Tax duty
2 3 4 5 6 7
(IX) I. Bhilwara-'A' 850.43 46.97 10.35 907.75
2. Bhilwara-'B' 699.36 6.62 705.98
3. Bhilwara-Spl. 1035.95 · 1035.95
4. Chittorgarh 1049;00 24.99 1073.99
5. Chittorgarh Spl. 1745.63 1745.63
6. Rajsamand 2083.48 14.08 2.78 2100.34
7. Nimbahera 428.53 12.26 0.08 440.87
8. Nimbahera-Spl. 347.90 347.90
BHILW ARA ZONE 8240.28 104.92 13.13 0.08 8358.41
(X) l. Pali 1688.58 29.61 4.09 1722.28
2. Pali-Spl. 2547.01 2547.01
3. Sumerpur 764.13 21.04 785.17
4. Jal ore 380.26 1.16 381.42
5. Sirohi 935.21 26.17 22.70 984.08
PALI ZONE . 6315.19 77.98 26.79 6419.96
(XI) I. Ganganagar 'A' 915.68 9.61 925.29
2. Ganganagar 'B' 1104.10 19.71 2.64 1126.45
3. Ganganagar Spl. 1466.21 1466.21
4. Raisingh Nagar 1096.83 6.02 1102.85
5. Surat Garh 967.10 7.59 3.63 978.32
6. Suratgarh Spl. 603.62 603.62
7. Hanumangarh 1209.02 26.02 1.70 0.48 .1237.22
8. Hanumangarh Spl. 601.86 601.86
GANGANAGAR ZONE . 7964.42 68.95 7.97 0.48 8041.82
ADJUSTMENT AND REFUND 933.75 933.75
GRAND TOTAL 205876.01 2205.59 1660.06 9001.41 218743.07
Source : ·statistical Abstract-1998-99, Commercial Taxes, Rajasthan.
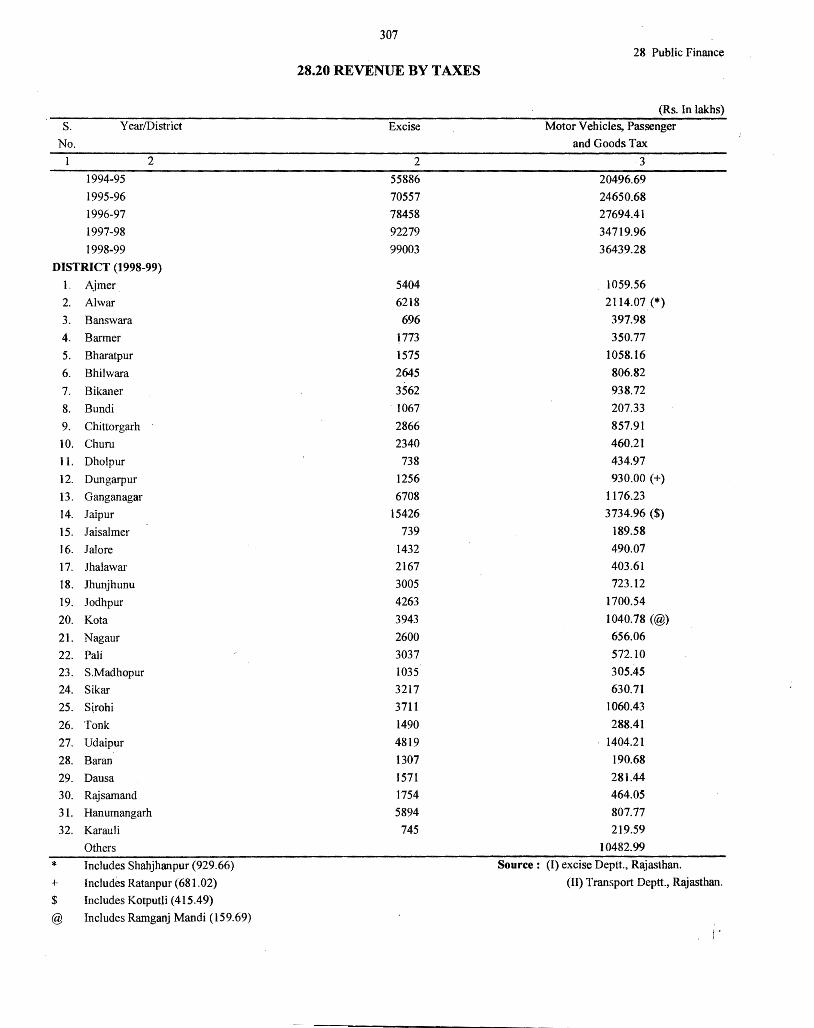
307 28 Public Finance
28.20 REVENUE BY TAXES
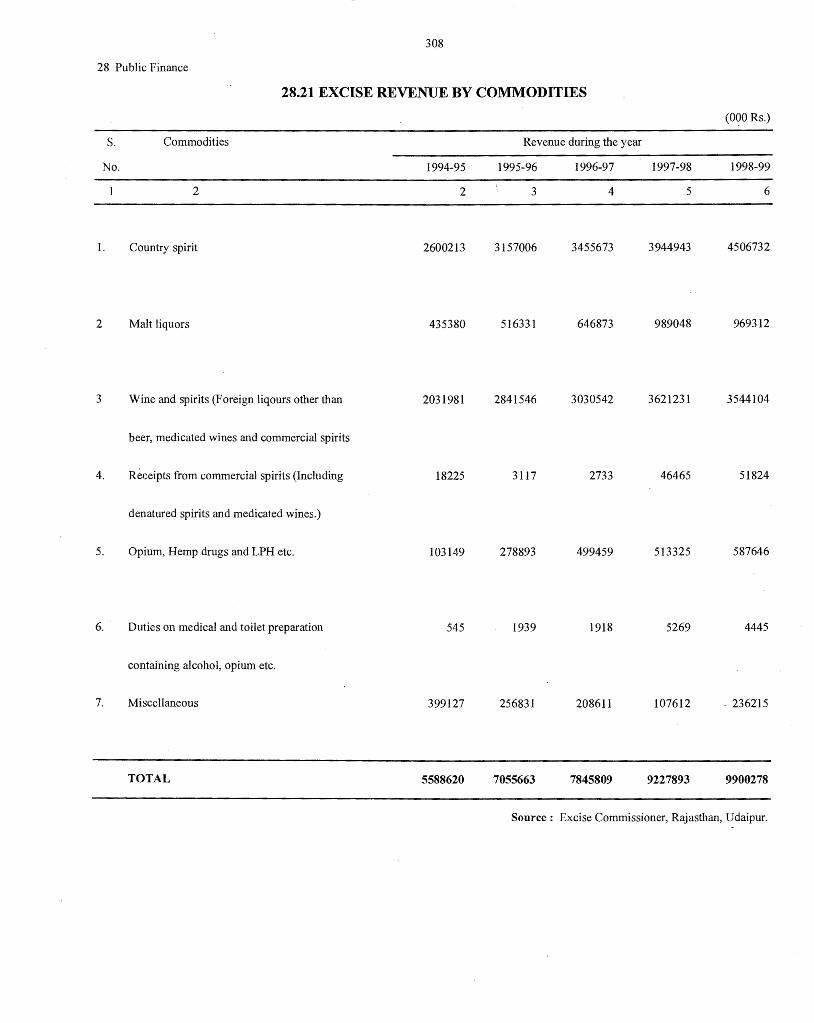
308
28 Public Finance
28.21 EXCISE REVENUE BY COMMODITIES
(O~O Rs.)
S. Commodities Revenue during the year
No. 1994-95 1995-96 1996-97 1997-98 1998-99
2 2 3 4 5 6
1. Country spirit 2600213 3157006 3455673 3944943 4506732
2 Malt liquors 435380 516331 646873 989048 969312
3 Wine and spirits (Foreign liqours other than 2031981 2841546 3030542 3621231 3544104
beer, medicated wines and commercial spirits
4. Receipts from commercial spirits (Including 18225 3117 2733 46465 51824
denatured spirits and medicated wines.)
5. Opium, Hemp drugs and LPH etc. 103149 278893 499459 513325 587646
6. · Duties on medical and toilet preparation 545 1939 1918 5269 4445
containing alcohol, opium etc.
7. Miscellaneous 399127 256831 208611 107612 . 236215
TOTAL 5588620 7055663 7845809 9227893 9900278
Source : Excise Commissioner, Rajasthan, Udaipur.
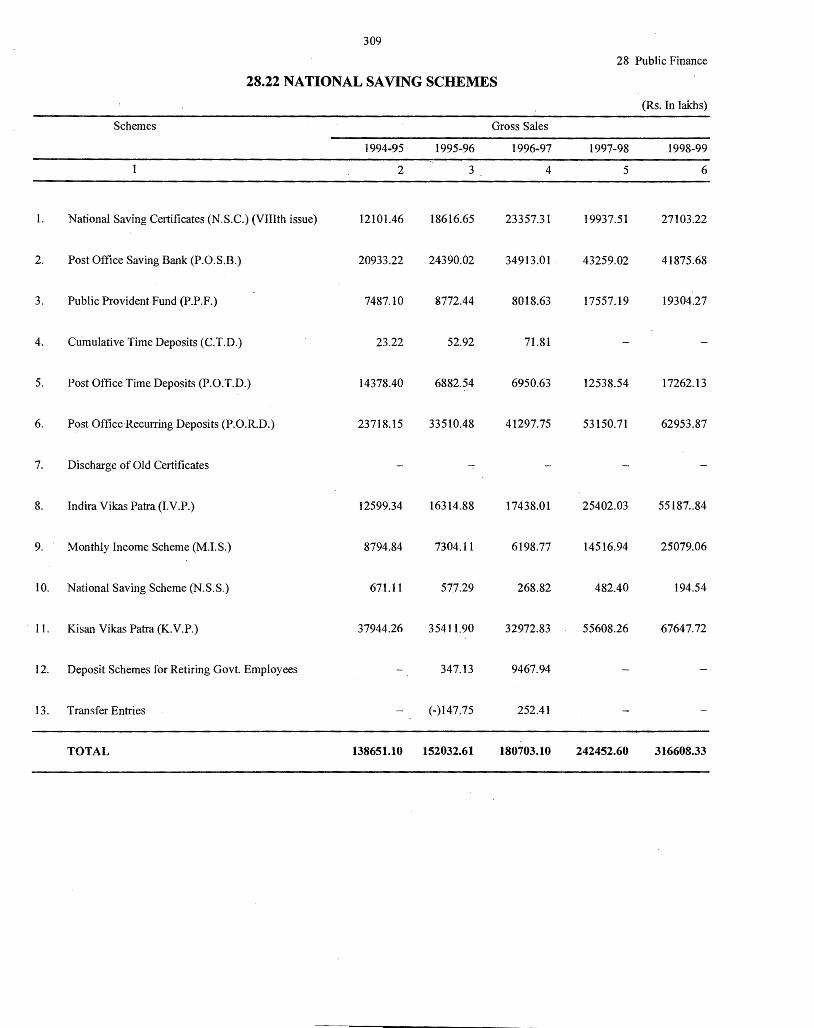
309
28 Public Finance
28.22 NATIONAL SAVING SCHEMES
(Rs. In lakhs)
Schemes Gross Sales
1994-95 1995-96 1996-97 1997-98 1998-99
2 3 4 5 6
1. National Saving Certificates (N.S.C.) (VIIIth issue) 12101.46 18616.65 23357.31 19937.51 27103.22
2. Post Office Saving Bank (P.O.S.B.) 20933.22 24390.02 34913.01 43259.02 41875.68
3. Public Provident Fund (P.P.F.) 7487.10 S772.44 8018.63 17557.19 19304.27
4. Cumulative Time Deposits (C.T.D.) 23.22 52.92 71.81
5. Post Office Time Deposits (P.O.T.D.) 14378.40 6882.54 6950.63 12538.54 17262.13
6. Post Office·Recurring Deposits (P.O.'R.D.) 23718.15 33510.48 41297.75 53150.71 62953.87
7. Discharge of Old Certificates
8. Indira Vikas Patra{I.V.P.) 12599.34 16314.88 17438.01 25402.03 55187 .. 84
9. Monthly Income Scheme (M.I.S.) 8794.84 7304.11 6198.77 14516.94 25079.06
10. National Saving Scheme (N.S.S.) 671.11 577.29 268.82 482.40 194.54
. 11. Kisan Vikas Patra (K.V.P.) 37944.26 35411.90 32972.83 55608.26 67647.72
12. Deposit Schemes for Retiring Govt. Employees 347.13 9467.94
13. Transfer Entries (-)147.75 252.41
TOTAL 138651.10 152032.61 180703.10 242452.60 316608.33
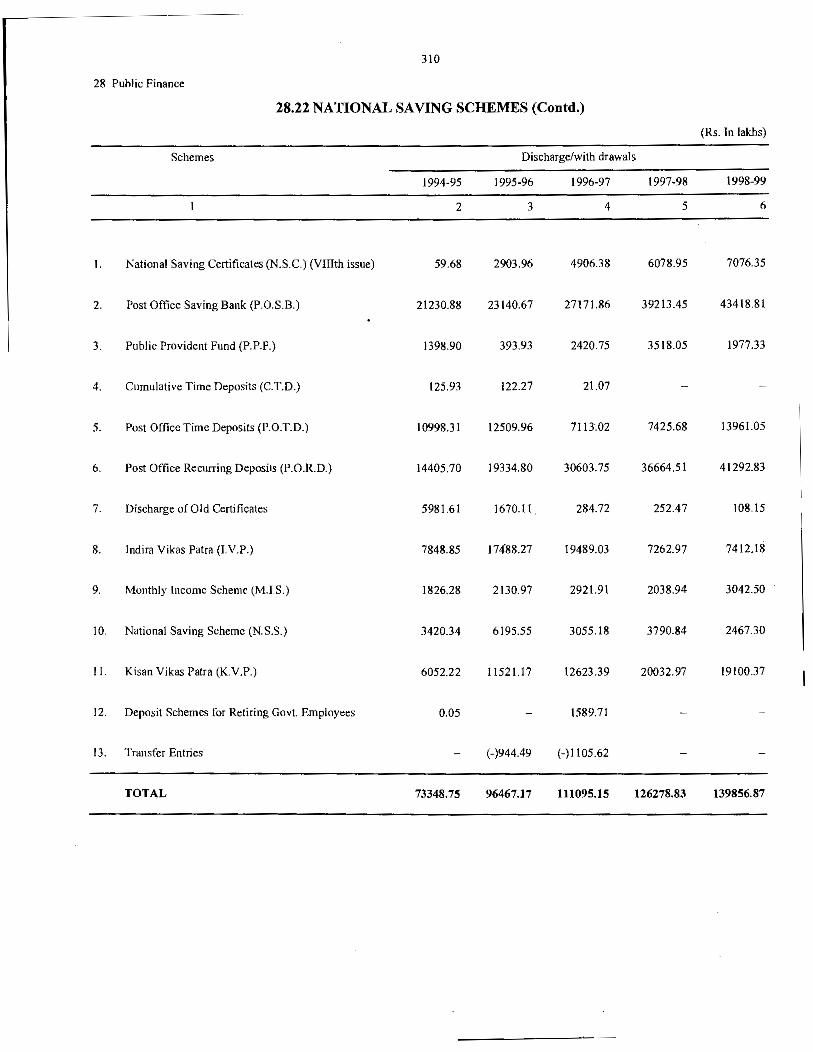
310
28 Public Finance
28.22 NATIONAL SAVING SCHEMES (Contd.)
(Rs. Jn lakhs)
Schemes Discharge/with drawals
1994-95 1995·96 1996-97 1997-98 1998-99
2 3 4 5 6
I. National Saving Certificates (N.S.C.) (Vlllth issue) 59.68 2903.96 4906.38 6078.95 7076.35
2. Post Office Saving Bank (P.0.S.B.) 21230.88 23140.67 27171.86 39213.45 43418.81
3. Public Provident Fund (P.P.F.) 1398.90 393.93 2420.75 3518.05 1977.33
4. Cumulative Time Deposits (C.T.D.) 125.93 122.27 21.07
5. Post Office Time Deposits (P.0.T.D.) 10998.31 12509.96 7113.02 7425.68 13961.05
6. Post Office Recurring Deposits (P.0.R.D.) 14405.70 19334.80 30603. 75 36664.51 41292.83
7. Discharge of Old Certificates 5981.61 1670.11 284.72 252.47 108.15
8. Indira Vikas Patra (1.\1.P.) 7848.85 17488.27 19489.03 7262.97 7412.18
9. Monthly Income Schen1e (M.l.S.) 1826.28 2130.97 2921.91 2038.94 3042.50
IO. National Saving Scheme (N.S.S.) 3420.34 6195.55 3055.18 3790.84 2467.30
11. Kisan Vikas Patra (K.V.P.) 6052.22 11521.17 12623.39 20032.97 19100.37
12. Deposit Schemes for Retiring Govt. Employees 0.05 1589.71
13. Transfer Entries (-)944.49 (-)1105.62
TOTAL 73348.75 96467.17 111095.15 126278.83 139856.87
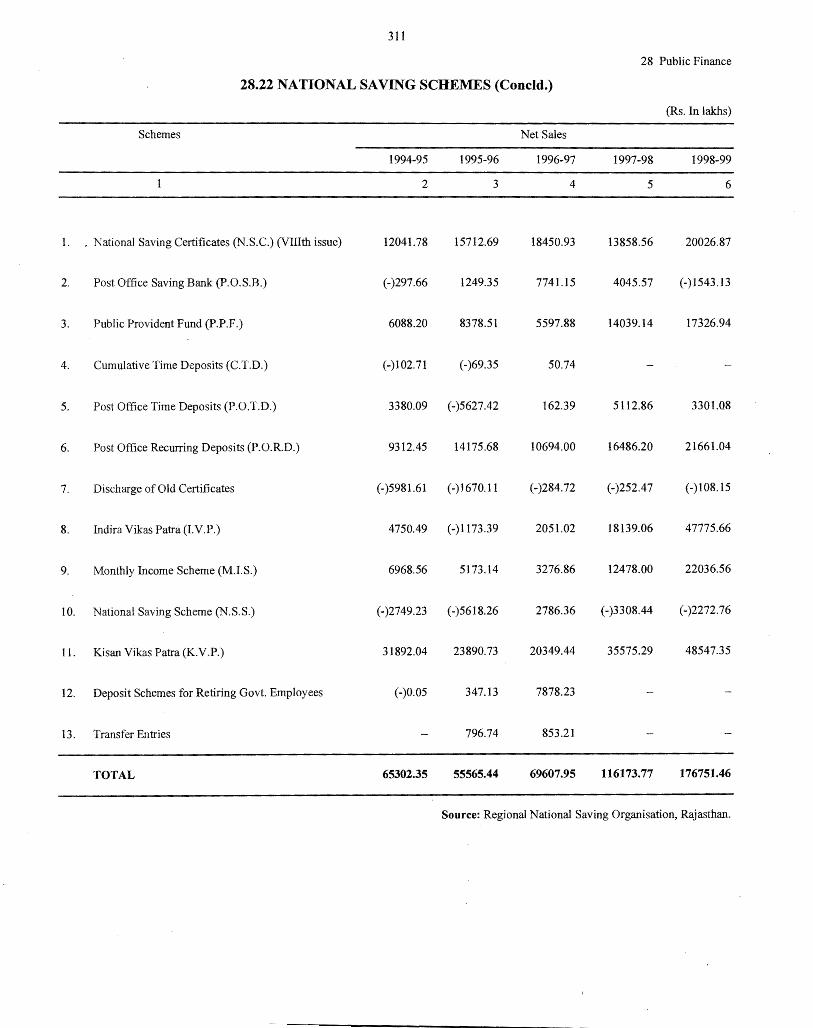
311
28 Public Finance
28.22 NATIONAL SAVING SCHEMES (Concld.)
(Rs. In lakhs)
Schemes Net Sales
1994-95 1995-96 1996-97 1997-98 1998-99
2 3 4 5 6
1. . National Saving Certificates (N.S.C.) (VIIIth issue) 12041.78 15712.69 18450.93 13858.56 20026.87
2. Post Office Saving Bank (P.O.S.B.) (-)297.66 1249.35 7741.15 4045.57 (-)1543.13
3. Public Provident Fund (P.P.F.) 6088.20 8378.51 5597.88 14039.14 17326.94
4. Cumulative Time Deposits (C.T.D.) (-)102.71 (-)69.35 50.74
5. Post Office Time Deposits (P.O.T.D.) 3380.09 (-)5627.42 162.39 5112.86 3301.08
6. Post Office Recurring Deposits (P.O.R.D.) 9312.45 14175.68 10694.00 16486.20 21661.04
7. Discharge of Old Certificates (-)5981.61 (-)J 670.11 (-)284.72 (-)252.47 (-)108.15
8. Indira Vikas Patra (I.V.P.) 4750.49 (-)1173.39 2051.02 18139.06 47775.66
9. Monthly Income Scheme (M.I.S.) 6968.56 5173.14 3276.86 12478.00 22036.56
10. National Saving Scheme (N.S.S.) (-)2749.23 (-)5618.26 2786.36 (-)3308.44 (-)2272.76
11. Kisan Vikas Patra (K.V.P.) 31892.04 23890.73 20349.44 35575.29 48547.35
12. Deposit Schemes for Retiring Govt. Employees (-)0.05 347.13 7878.23
13. Transfer Entries 796.74 853.21
TOTAL 65302.35 55565.44 69607.95 116173.77 176751.46
Source: Regional National Saving Organisation, Rajasthan.
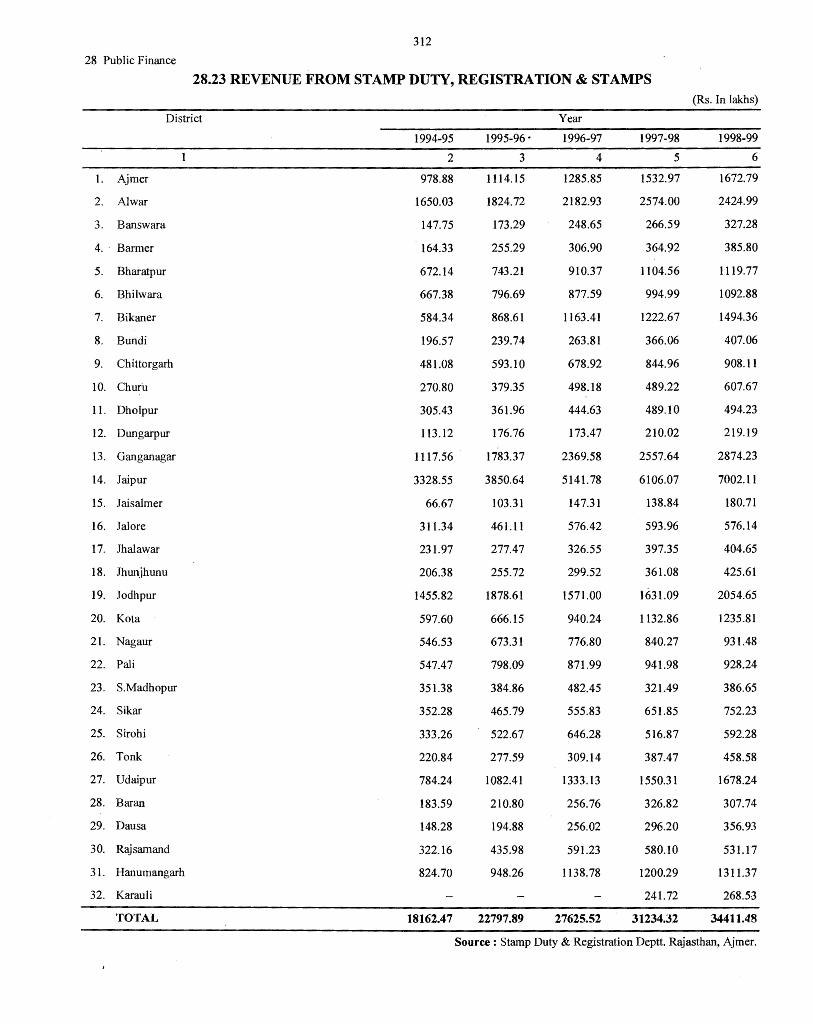
312
28 Public Finance
28.23 REVENUE FROM STAMP DUTY, REGISTRATION & STAMPS (Rs. In lakhs)
District Year
1994-95 1995-96. 1996-97 1997-98 1998-99
2 3 4 5 6
I. Ajrner 978.88 1114.15 1285.85 1532.97 1672.79
2. Al war 1650.03 1824.72 2182.93 2574.00 2424.99
3. Banswara 147.75 173.29 248.65 266.59 327.28
4. Barmer 164.33 255.29 306.90 364.92 385.80
5. Bharatpur 672.14 743.21 910.37 1104.56 1119.77
6. Bhilwara 667.38 796.69 877.59 994.99 1092.88
7. Bikaner 584.34 868.61 1163.41 1222.67 1494.36
8. Bundi 196.57 239.74 263.81 366.06 407.06
9. Chittorgarh 481.08 593.10 678.92 844.96 908.11
10. Churu 270.80 379.35 498.18 489.22 607.67
11. Dholpur 305.43 361.96 444.63 489.10 494.23
12. Dungarpur 113.12 176.76 173.47 210.02 219.19
13. Ganganagar 1117.56 1783.37 2369.58 2557.64 2874.23
14. Jaipur 3328.55 3850.64 5141. 78 6106.07 7002.11
15. Jaisalrner 66.67 103.31 147.31 138.84 180.71
16. Jalore 311.34 461.11 576.42 593.96 576.14
17. Jhalawar 231.97 277.47 326.55 397.35 404.65
18. Jhunjhunu 206.38 255.72 299.52 361.08 425.61
19. Jodhpur 1455.82 1878.61 1571.00 1631.09 2054.65
20. Kota 597.60 666.15 940.24 1132.86 1235.81
21. Nagaur 546.53 673.31 776.80 840.27 931.48
22. Pali 547.47 798.09 871.99 941.98 928.24
23. S.Madhopur 351.38 384.86 482.45 321.49 386.65
24. Sikar 352.28 465.79 555.83 651.85 752.23
25. Sirohi 333.26 522.67 646.28 516.87 592.28
26. Tonk 220.84 277.59 309.14 387.47 458.58
27. Udaipur 784.24 1082.41 1333.13 1550.31 1678.24
28. Baran 183.59 210.80 256.76 326.82 307.74
29. Dausa 148.28 194.88 256.02 296.20 356.93
30. Rajsamand 322.16 435.98 591.23 580.10 531.17
31. Hanurnangarh 824.70 948.26 1138.78 1200.29 1311.37
32. Karauli 241.72 26853
TOTAL 18162.47 22797.89 27625.52 31234.32 34411.48
Source : Stamp Duty & Registration Deptt. Rajasthan, Ajmer.
(29) PRICE AND INDICES
(A) WHOLE SALE PRICES (WPI)
(1)
(2)
(3)
(4)
(5)
It is a general purpose index to measure the variations in the whole sale price levels in the state with base
year 1952-53=100. It covers 59 commodities for which 98 quotations are collected from 22 centres in the
state on every Friday. These commodities have categorised into the following groups:
Food Articles
Industrial Raw Materials
Fuel, Power, Light and Lubricants
Manufacturing
General Index
The WPI are compiled and supplied by the Directorate of Economics and Statistics to the concerned
departments of the state, every month, who in turn-use 'them in framing various policies and chalkingout
programme for rationalisation of prices and supply system.
(B) CONSUMER PRICE INDEX (CPI)
The Labour Bureau Shimla has been compiling and publishing regularly the monthly Consumer Price
Index Number for Industrial Workers which is one of important economic indicators measuring inflationary
pressure in the country. The index measures the overall changes in the level of average retail price of a fixed
set of goods and services consumed by the target population. The base year of the current CPI for industrial
workers is 1982=100. The source of weights for this index is a family living survey, which included the 70
centres. At present, 3 centres namely Jaipur, Ajmer and Bhilwara are being continuing for Rajasthan State.
The weekly prices are collected from selected markets at Jaipur, Ajmer and Bhilwara centre and send to
Labour Bureau, Shimla. The prices are regularly supervised by Statistical Officers. On the basis of these
weekly prices, monthly Consumer Price Index are prepared for Industrial Workers. The Index Number are
compiled for following major groups:-
(1) Food
(2) Pan, Supari, Tobacco and Intoxicants
(3) Fuel and Light
(4) Housing
(5) Clothing, Bedding & FQotwear, and
( 6) Miscellaneous
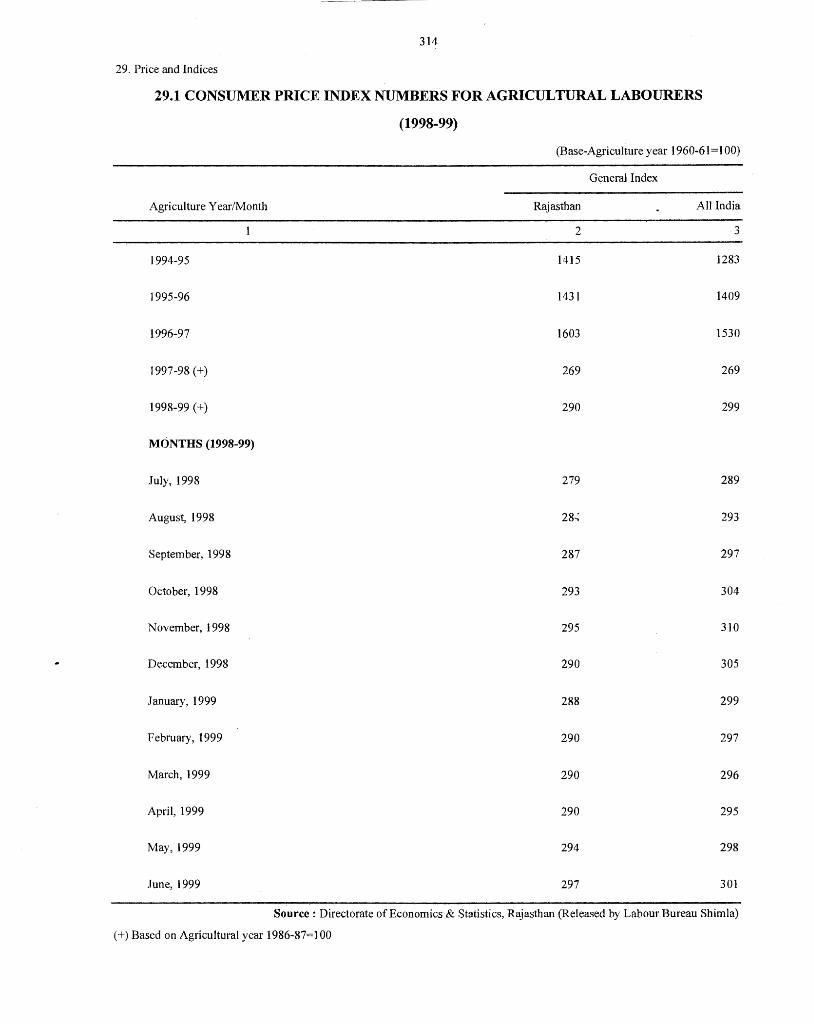
314
29. Price and Indices
29.1 CONSUMER PRICE INDEX NUMBERS FOR AGRICULTURAL LABOURERS
(1998-99)
(Base-Agriculture year 1960-61=100)
General Index
Agriculture Year/Month Rajasthan All India
2 3
1994-95 1415 1283
1995-96 1431 1409
1996-97 1603 1530
1997-98 (+) 269 269
1998-99 (+) 290 299
MONTHS (1998-99)
July, 1998 279 289
August, 1998 28~ 293
September, 1998 287 297
October, 1998 293 304
November, 1998 295 310
December, 1998 290 305
January, 1999 288 299
February, 1999 290 297
March, 1999 290 296
April, 1999 290 295
May, 1999 294 298
June, 1999 297 301
Source: Directorate of Economics & Statistics, Rajasthan (Released by Labour Bureau Shimla)
( +) Based on Agricultural year 1986-87= 100
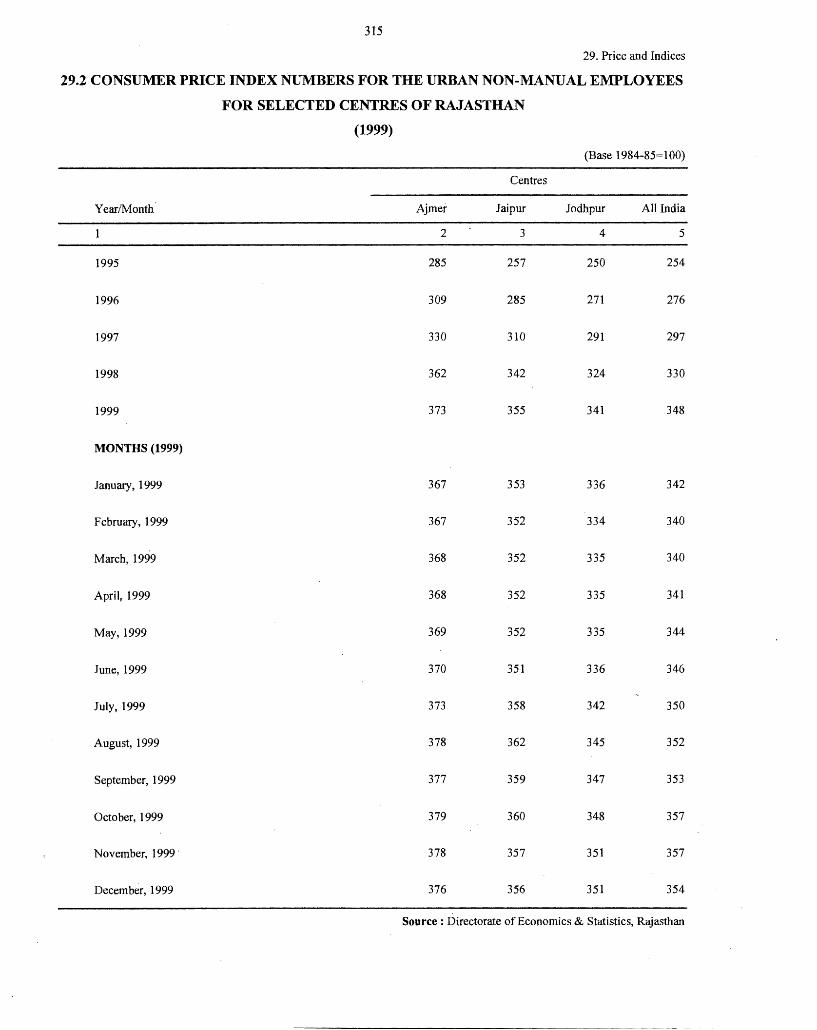
315
29. Price and Indices
29.2 CONSUMER PRICE INDEX NUMBERS FOR THE URBAN NON-MANUAL EMPLOYEES
FOR SELECTED CENTRES OF RAJASTHAN
(1999)
(Base 1984-85= 100)
Centres
Year/Month Ajmer Jaipur Jodhpur All India
2 3 4 5
1995 285 257 250 254
1996 309 285 271 276
1997 330 310 291 297
1998 362 342 324 330
1999 373 355 341 348
MONTHS (1999)
January, 1999 367 353 336 342
February, 1999 367 352 334 340
March, 1999 368 352 335 340
April, 1999 368 352 335 341
May, 1999 369 352 335 344
June, 1999 370 351 336 346
July, 1999 373 358 342 350
August, 1999 378 362 345 352
September, 1999 377 359 347 353
October, 1999 379 360 348 357
November, 1999 · 378 357 351 357
December, 1999 376 356 351 354
Source : Directorate of Economics & Statistics, Rajasthan
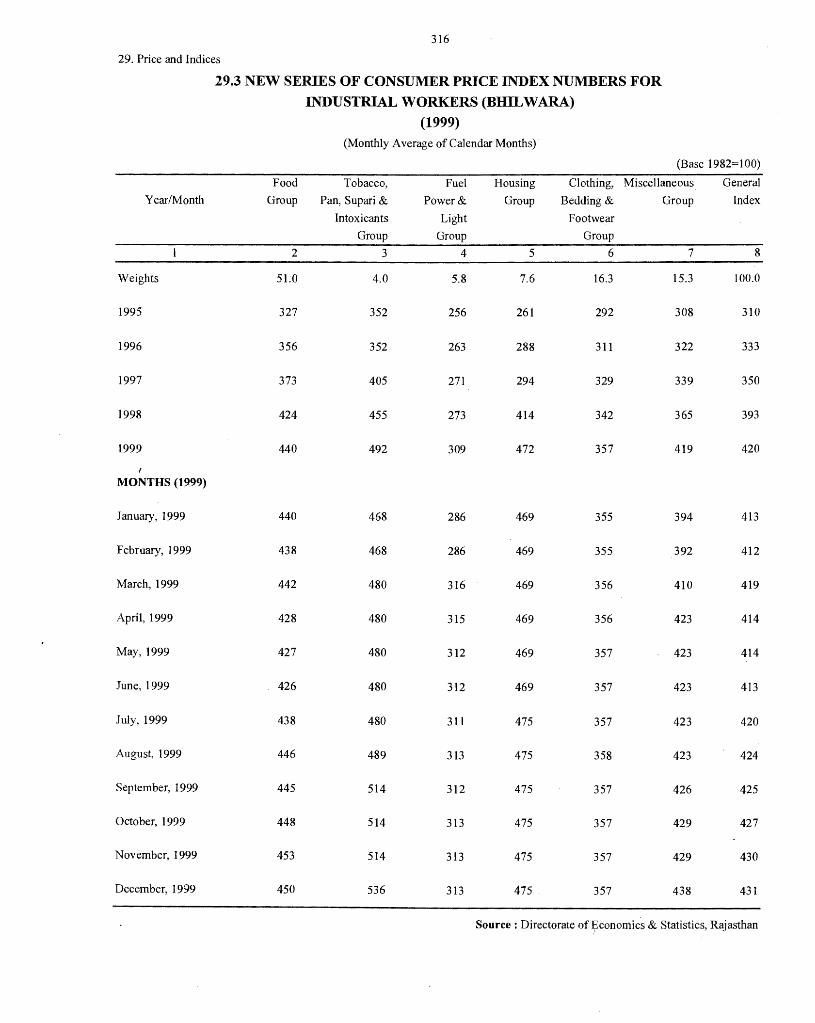
316
29. Price and Indices
29.3 NEW SERIES OF CONSUMER PRICE INDEX NUMBERS FOR
INDUSTRIAL WORKERS (BHILWARA)
(1999) (Monthly Average of Calendar Months)
(Base 1982= 100)
Food Tobacco, Fuel Housing Clothing, Miscellaneous General
Year/Month Group Pan, Supari & Power& Group Bedding & Group Index
Intoxicants Light Footwear
Group Group Group
2 3 4 5 6 7 8
Weights 5LO 4.0 5.8 7.6 16.3 15.3 100.0
1995 327 352 256 261 292 308 310
1996 356 352 263 288 311 322 333
1997 373 405 271 294 329 339 350
1998 424 455 273 414 342 365 393
1999 440 492 309 472 357 419 420
MONTHS (1999)
January, 1999 440 468 286 469 355 394 413
February, 1999 438 468 286 469 355 392 412
March, 1999 442 480 316 469 356 410 419
April, 1999 428 480 315 469 356 423 414
May, 1999 427 480 312 469 357 423 414
June, 1999 426 480 312 469 357 423 413
July, 1999 438 480 31 I 475 357 423 420
August, 1999 446 489 313 475 358 423 424
September, 1999 445 514 312 475 357 426 425
October, 1999 448 514 313 475 357 429 427
November, 1999 453 514 313 475 357 429 430
December, 1999 450 536 313 475 357 438 431
Source : Directorate of ~conomics & Statistics, R~jasthan
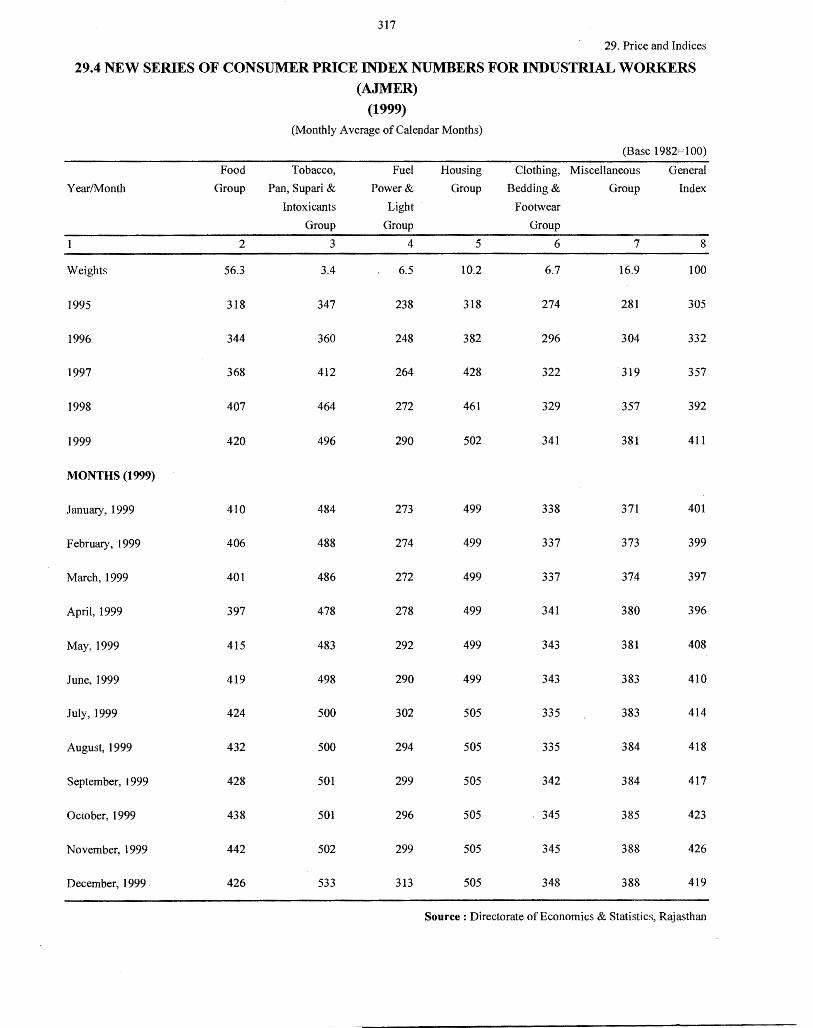
317
29. Price and Indices
29.4 NEW SERIES OF CONSUMER PRICE INDEX NUMBERS FOR INDUSTRIAL WORKERS
(AJMER)
(1999) (Monthly Average of Calendar Months)
(Base 1982=100)
Food Tobacco, Fuel Housing Clothing, Miscellaneous General
Year/Month Group Pan, Supari & Power& Group Bedding& Group Index
Intoxicants Light Footwear
Group Group Group
2 3 4 5 6 7 8
Weights 56.3 3.4 6.5 10.2 6.7 16.9 100
1995 318 347 238 318 274 281 305
1996 344 360 248 382 296 304 332
1997 368 412 264 428 322 319 357
1998 407 464 272 461 329 357 392
1999 420 496 290 502 341 381 411
MONTHS (1999)
January, 1999 410 484 273 499 338 371 401
February, I 999 406 488 274 499 337 373 399
March, 1999 401 486 272 499 337 374 397
April, 1999 397 478 278 499 341 380 396
May, 1999 415 483 292 499 343 381 408
June, 1999 419 498 290 499 343 383 410
July, 1999 424 500 302 505 335 383 414
August, 1999 432 500 294 505 335 384 418
September, 1999 428 501 299 505 342 384 417
Occober, 1999 438 501 296 505 345 385 423
November, 1999 442 502 299 505 345 388 426
December, 1999 426 533 313 505 348 388 419
Source: Directorate of Economics & Statistics, Rajasthan
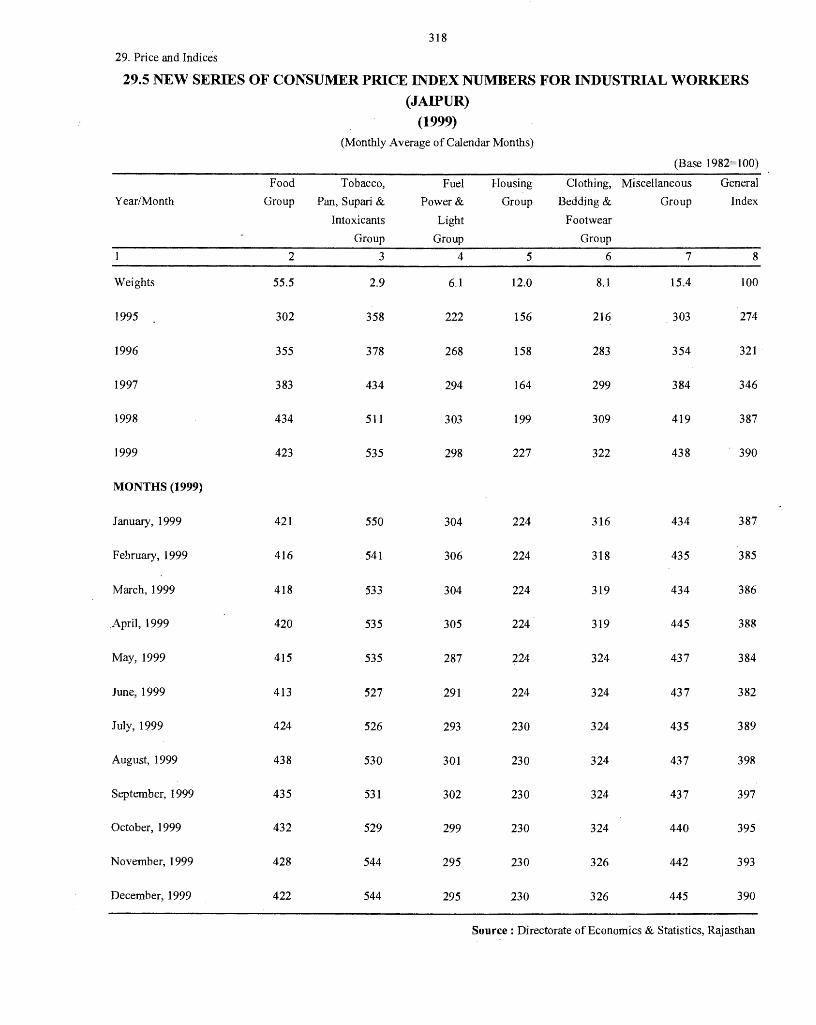
318
29. Price and Indices
29.5 NEW SERIES OF CONSUMER PRICE INDEX NUMBERS FOR INDUSTRIAL WORKERS
(JAIPUR)
(1999) (Monthly Average of Calendar Months)
(Base 1982=100)
Food Tobacco, Fuel Housing Clothing, Miscellaneous General
Year/Month Group Pan, Supari & Power& Group Bedding& Group Index
Intoxicants Light Footwear
Group Group Group
2 3 4 5 6 7 8
Weights 55.5 2.9 6.1 12.0 8.1 15.4 100
1995 302 358 222 156 216 303 274
1996 355 378 268 158 283 354 321
1997 383 434 294 164 299 384 346
1998 434 511 303 199 309 419 387
1999 423 535 298 227 322 438 390
MONTHS (1999)
January, 1999 421 550 304 224 316 434 387
February, 1999 416 541 306 224 318 435 385
March, 1999 418 533 304 224 319 434 386
.April, 1999 420 535 305 224 319 445 388
May, 1999 415 535 287 224 324 437 384
June, 1999 413 527 291 224 324 437 382
July, 1999 424 526 293 230 324 435 389
August, 1999 438 530 301 230 324 437 398
September, 1999 435 531 302 230 324 437 397
October, 1999 432 529 299 230 324 440 395
November, 1999 428 544 295 230 326 442 393
December, 1999 422 544 295 230 326 445 390
Source: Directorate of Economics & Statistics, Rajasthan
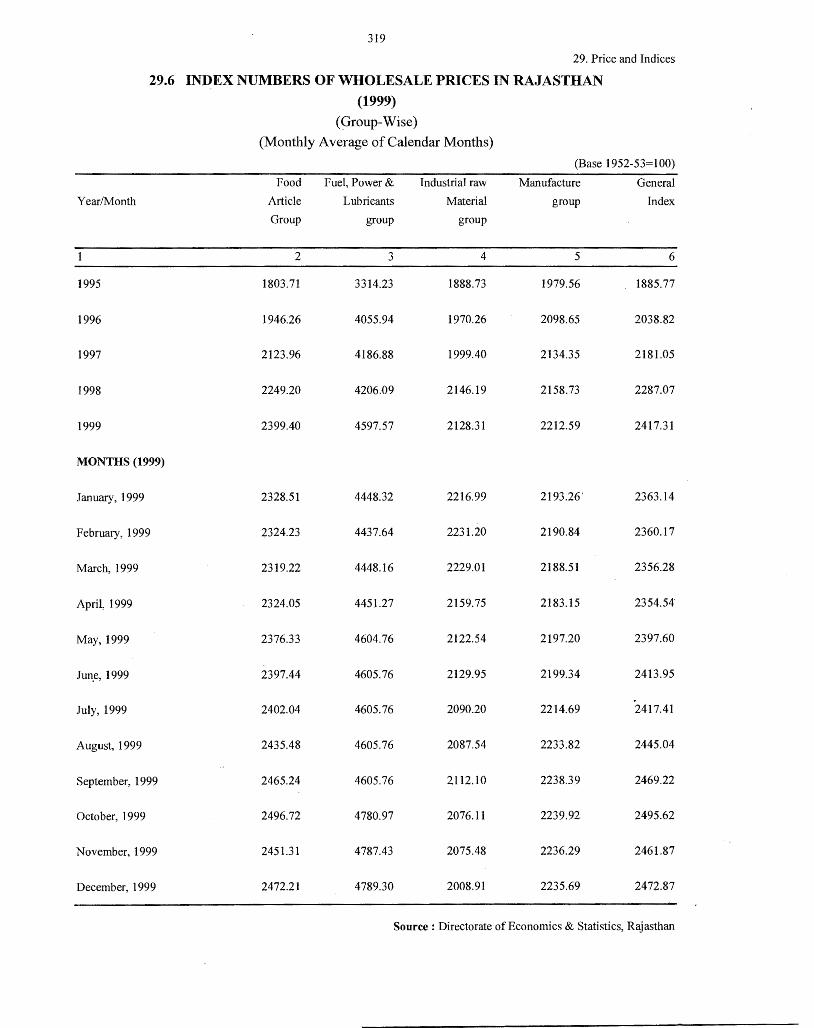
319
29. Price and Indices
29.6 INDEX NUMBERS OF WHOLESALE PRICES IN RAJASTHAN
(1999)
(Group-Wise)
(Monthly Average of Calendar Months)
(Base 1952-53=100)
Food Fuel, Power & Industrial raw Manufacture General
Year/Month Article Lubricants Material group Index
Group group group
2 3 4 5 6
1995 1803.71 3314.23 1888.73 1979.56 1885.77
1996 1946.26 4055.94 1970.26 2098.65 2038.82
1997 2123.96 4186.88 1999.40 2134.35 2181.05
1998 2249.20 4206.09 2146.19 2158.73 2287.07
1999 2399.40 4597.57 2128.31 2212.59 2417.31
MONTHS (1999)
January, 1999 2328.51 4448.32 2216.99 2193.26' 2363.14
February, 1999 2324.23 4437.64 2231.20 2190.84 2360.17
March, 1999 2319.22 4448.16 2229.01 2188.51 2356.28
April, 1999 2324.05 4451.27 2159.75 2183.15 2354.54.
May, 1999 2376.33 4604.76 2122.54 2197.20 2397.60
Jun.e, 1999 2397.44 4605.76 2129.95 2199.34 2413.95
July, 1999 2402.04 4605.76 2090.20 2214.69 2417.41
August, 1999 2435.48 4605.76 2087.54 2233.82 2445.04
September, 1999 2465.24 4605.76 2112.10 2238.39 2469.22
October, 1999 2496.72 4780.97 2076.11 2239.92 2495.62
November, 1999 2451.31 4787.43 2075.48 2236.29 2461.87
December, 1999 2472.21 4789.30 2008.91 2235.69 2472.87
Source : Directorate of Economics & Statistics, Rajasthan
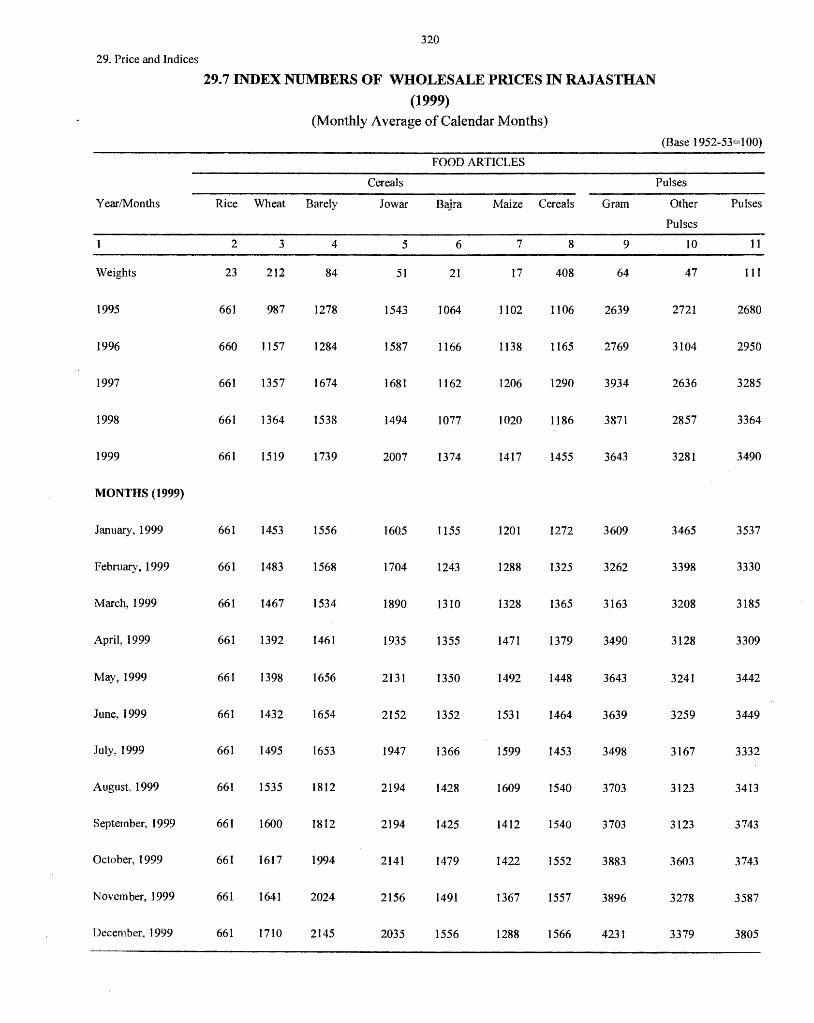
320
29. Price and Indices
29.7 INDEX NUMBERS OF WHOLESALE PRICES IN RAJASTHAN
(1999)
(Monthly Average of Calendar Months)
(Base 1952-53=100)
FOOD ARTICLES
Cereals Pulses
Year/Months Rice Wheat Barely Jo war B~jra Maize Cereals Gram Other Pulses
Pulses
2 3 4 5 6 7 8 9 IO JI
Weights 23 212 84 51 21 17 408 64 47 111
1995 661 987 1278 1543 1064 1102 1106 2639 2721 2680
1996 660 1157 1284 1587 1166 1138 1165 2769 3104 2950
1997 661 1357 1674 1681 1162 1206 1290 3934 2636 3285
1998 661 1364 1538 1494 1077 1020 1186 3871 2857 3364
1999 661 1519 1739 2007 1374 1417 1455 3643 3281 3490
MONTHS (1999)
January, 1999 661 1453 1556 160.5 1155 1201 1272 3609 3465 3537
February, 1 999 661 1483 1568 1704 1243 1288 1325 3262 3398 3330
March, 1999 661 1467 1534 1890 1310 1328 1365 3163 3208 3185
April, 1999 661 1392 1461 1935 1355 1471 1379 3490 3128 3309
May, 1999 661 1398 1656 2131 1350 1492 1448 3643 3241 3442
June, 1999 661 1432 1654 2152 1352 1531 1464 3639 3259 3449
July, 1999 661 1495 1653 1947 1366 1599 1453 3498 3167 3332
August, 1999 661 1535 1812 2194 1428 1609 1540 3703 3123 3413
September, 1999 661 1600 1812 2194 1425 1412 1540 3703 3123 3743
October, 1999 661 1617 1994 2141 1479 1422 1552 3883 3603 3743
November, 1999 661 1641 2024 2156 1491 1367 1557 3896 3278 3587
December, 1999 661 1710 2145 2035 1556 1288 1566 4231 3379 3805
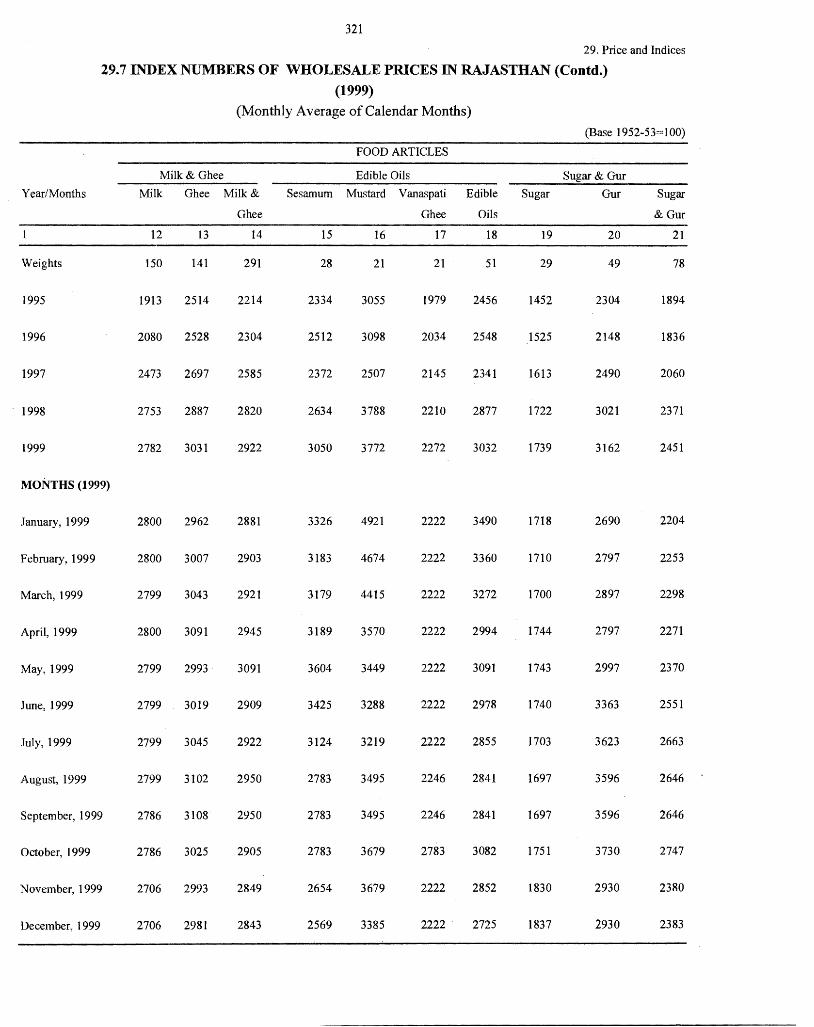
321
29. Price and Indices
29.7 INDEX NUMBERS OF WHOLESALE PRICES IN RAJASTHAN (Contd.)
(1999)
(Monthly Average of Calendar Months)
(Base 1952-53=100)
FOOD ARTICLES
Milk& Ghee Edible Oils Sugar& Gur Year/Months Milk Ghee Milk& Sesamum Mustard Vanaspati Edible Sugar Gur Sugar
Ghee Ghee Oils &Gur
12 13 14 15 16 17 18 19 20 21
Weights 150 141 291 28 21 21 51 29 49 78
1995 1913 2514 2214 2334 3055 1979 2456 1452 2304 1894
1996 2080 2528 2304 2512 3098 2034 2548 1525 2148 1836
1997 2473 2697 2585 2372 2507 2145 2341 1613 2490 2060
1998 2753 2887 2820 2634 3788 2210 2877 1722 3021 2371
1999 2782 3031 2922 3050 3772 2272 3032 1739 3162 2451
MONTHS (1999)
January, 1999 2800 2962 2881 3326 4921 2222 3490 1718 2690 2204
February, 1999 2800 3007 2903 3183 4674 2222 3360 1710 2797 2253
March, 1999 2799 3043 2921 3179 4415 2222 3272 1700 2897 2298
April, 1999 2800 3091 2945 3189 3570 2222 2994 1744 2797 2271
May, 1999 2799 2993 3091 3604 3449 2222 3091 1743 2997 2370
June, 1999 2799 3019 2909 3425 3288 2222 2978 1740 3363 2551
July, 1999 2799 3045 2922 3124 3219 2222 2855 1703 3623 2663
August, 1999 2799 3102 2950 2783 3495 2246 2841 1697 3596 2646
September, 1999 2786 3108 2950 2783 3495 2246 2841 1697 3596 2646
October, 1999 2786 3025 2905 2783 3679 2783 3082 1751 3730 2747
November, 1999 2706 2993 2849 2654 3679 2222 2852 1830 2930 2380
December, 1999 2706 2981 2843 2569 3385 2222 2725 1837 2930 2383
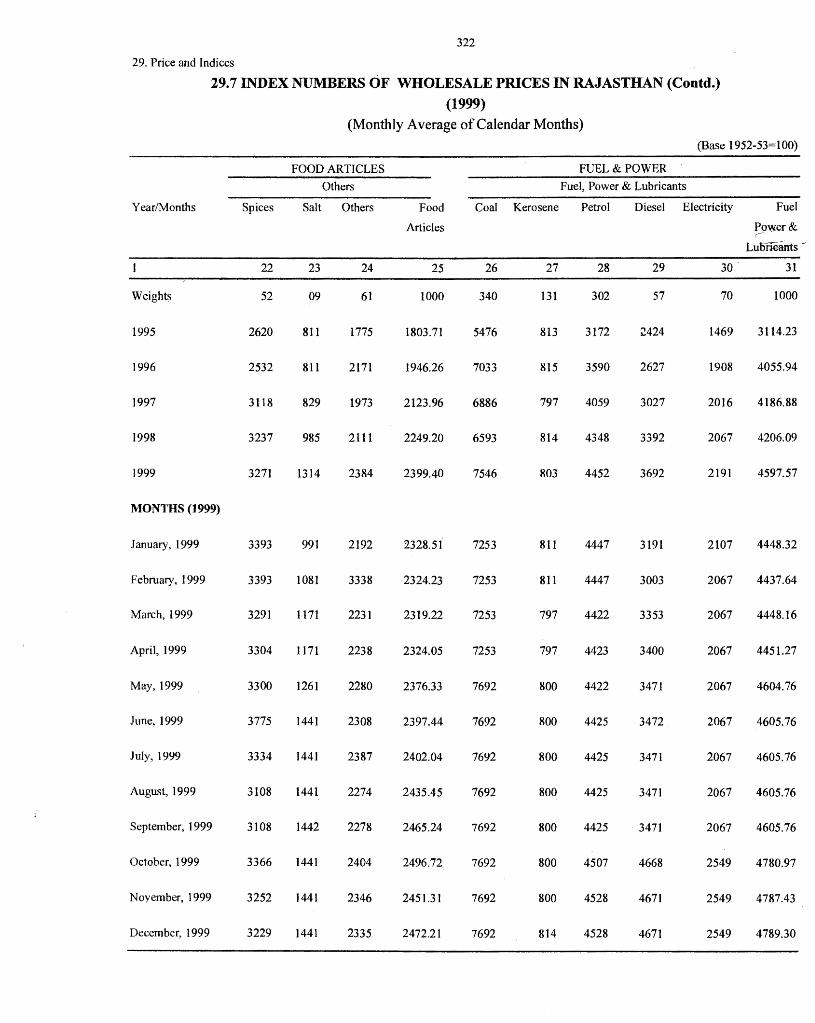
322
29. Price and Indices
29.7 INDEX NUMBERS OF WHOLESALE PRICES IN RAJASTHAN (Contd.)
(1999) (Monthly Average of Calendar Months)
(Base 1952~53=100)
FOOD ARTICLES FUEL&POWER
Others Fuel, Power & Lubricants
Year/Months Spices Salt Others Food Coal Kerosene Petrol Diesel Electricity Fuel
Articles ~ywer&
Lubneants -
22 23 24 25 26 27 28 29 30 31
Weights 52 09 61 1000 340 131 302 57 70 1000
1995 2620 811 1775 1803.71 5476 813 3172 ;!424 1469 3114.23
1996 2532 811 2171 1946.26 7033 815 3590 2627 1908 4055.94
1997 3118 829 1973 2123.96 6886 797 4059 3027 2016 4186.88
1998 3237 985 2111 2249.20 6593 814 4348 3392 2067 4206.09
1999 3271 1314 2384 2399.40 7546 803 4452 3692 2191 4597.57
MONTHS (1999)
January, 1999 3393 991 2192 2328.51 7253 811 4447 3191 2107 4448.32
February, 1999 3393 1081 3338 2324.23 7253 811 4447 3003 2067 4437.64
March, 1999 3291 ll71 2231 2319.22 7253 797 4422 3353 2067 4448.16
April, 1999 3304 1171 2238 2324.05 7253 797 4423 3400 2067 4451.27
May, 1999 3300 1261 2280 2376.33 7692 800 4422 3471 2067 4604.76
June, 1999 3775 1441 2308 2397.44 7692 800 4425 3472 2067 4605.76
July, 1999 3334 1441 2387 2402.04 7692 800 4425 3471 2067 4605.76
August, 1999 3108 1441 2274 2435.45 7692 800 4425 3471 2067 4605.76
September, 1999 3108 1442 2278 2465.24 7692 800 4425 3471 2067 4605.76
October, 1999 3366 1441 2404 2496.72 7692 800 4507 4668 2549 4780.97
November, 1999 3252 1441 2346 2451.31 7692 800 4528 4671 2549 4787.43
December, 1999 3229 1441 2335 2472.21 7692 814 4528 4671 2549 4789.30
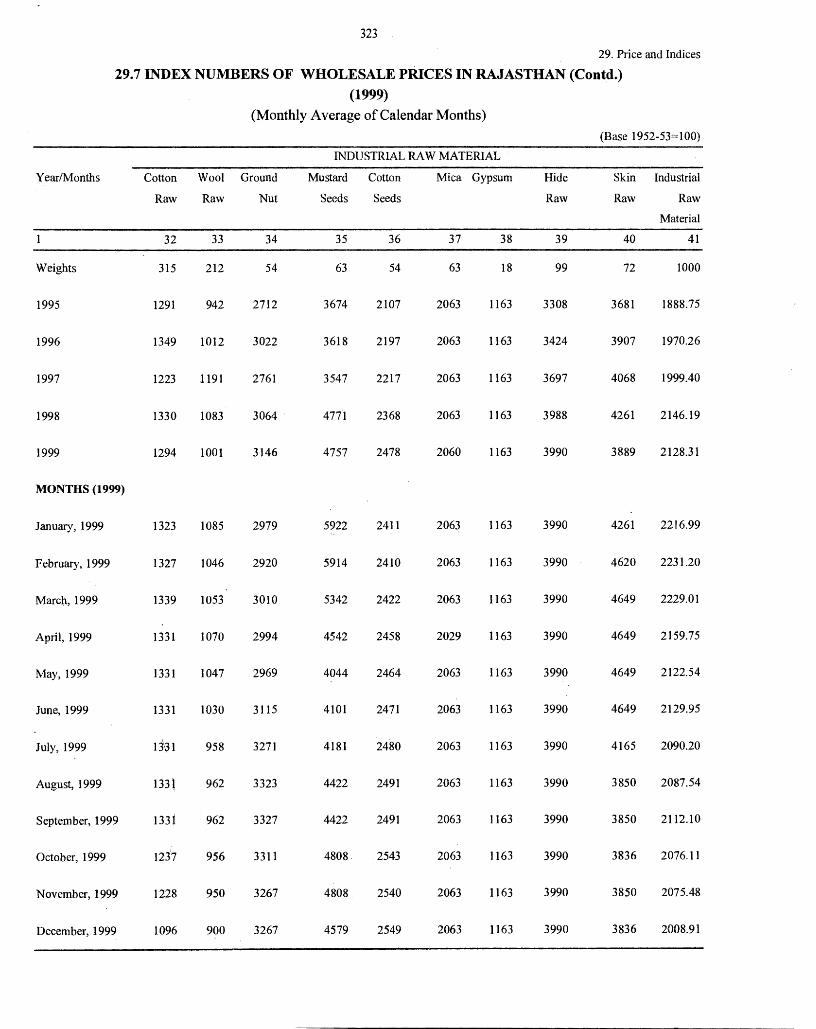
323
29. Price and Indices
29.7 INDEX NUMBERS OF WHOLESALE PRICES IN RAJASTHAN (Contd.) (1999)
(Monthly Average of Calendar Months)
(Base 1952·53= l 00)
INDUSTRIAL RAW MATERIAL
Year/Months Cotton Wool Ground Mustard Cotton Mica Gypsum Hide Skin Industrial
Raw Raw Nut Seeds Seeds Raw Raw Raw
Material
32 33 34 35 36 37 38 39 40 41
Weights 315 212 54 63 54 63 18 99 72 1000
1995 1291 942 2712 3674 2107 2063 1163 3308 3681 1888.75
1996 1349 1012 3022 3618 2197 2063 1163 3424 3907 1970.26
1997 1223 1191 2761 3547 2217 2063 1163 3697 4068 1999.40
1998 1330 1083 3064 4771 2368 2063 1163 3988 4261 2146.19
1999 1294 1001 3146 4757 2478 2060 1163 3990 3889 2128.31
MONTHS (1999)
January, 1999 1323 1085 2979 5922 2411 2063 1163 3990 4261 2216.99
February, 1999 1327 1046 2920 5914 2410 2063 1163 3990 4620 2231.20
March, 1999 1339 1053 3010 5342 2422 2063 1163 3990 4649 2229.01
April, 1999 1331 1070 2994 4542 2458 2029 1163 3990 4649 2159.75
May, 1999 1331 1047 2969 4044 2464 2063 1163 3990 4649 2122.54
June, 1999 1331 1030 3115 4101 2471 2063 1163 3990 4649 2129.95
July, 1999 1 :}31 958 3271 4181 2480 2063 1163 3990 4165 2090.20
August, 1999 133\ 962 3323 4422 2491 2063 1163 3990 3850 2087.54
September, 1999 1331 962 3327 4422 2491 2063 1163 3990 3850 2112.10
October, 1999 1237 956 3311 4808. , 2543 2063 1163 3990 3836 2076.11
November, 1999 1228 950 3267 4808 2540 2063 1163 3990 3850 2075.48
December, 1999 1096 900 3267 4579 2549 2063 1163 3990 3836 2008.91
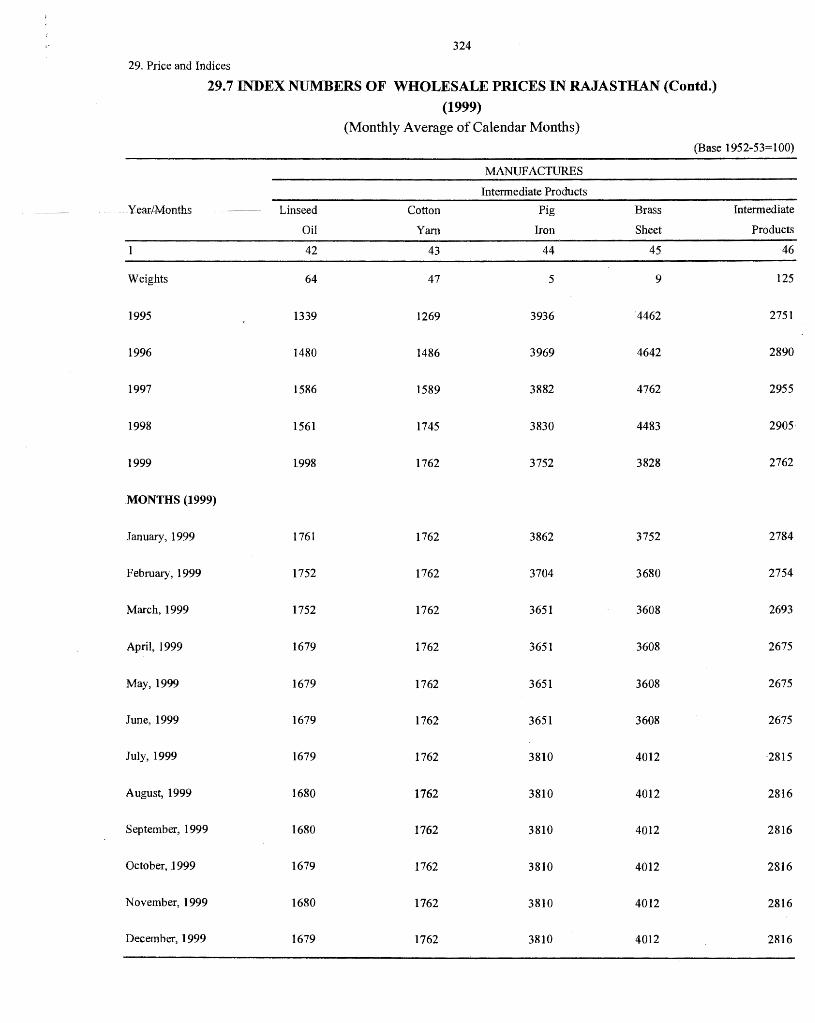
324
29. Price and Indices
29.7 INDEX NUMBERS OF WHOLESALE PRICES IN RAJASTHAN (Contd.)
(1999) (Monthly Average of Calendar Months)
(Base 1952-53=100)
MANUFACTURES
Intermediate Products
--YeartMonths Linseed Cotton Pig Brass Intermediate
Oil Yarn Iron Sheet Products
42 43 44 45 46
Weights 64 47 5 9 125
1995 1339 1269 3936 4462 2751
1996 1480 1486 3969 4642 2890
1997 1586 1589 3882 4762 2955
1998 1561 1745 3830 4483 2905·
1999 1998 1762 3752 3828 2762
MONTHS (1999)
January, 1999 1761 1762 3862 3752 2784
February, 1999 1752 1762 3704 3680 2754
March, 1999 1752 1762 3651 3608 2693
April, 1999 1679 1762 3651 3608 2675
May, 1999 1679 1762 3651 3608 2675
June, 1999 1679 1762 3651 3608 2675
July, 1999 1679 1762 3810 4012 -2815
August, 1999 1680 1762 3810 4012 2816
September, 1999 1680 1762 3810 4012 2816
October, 1999 1679 1762 3810 4012 2816
November, 1999 1680 1762 3810 4012 2816
December, 1999 1679 1762 3810 4012 2816
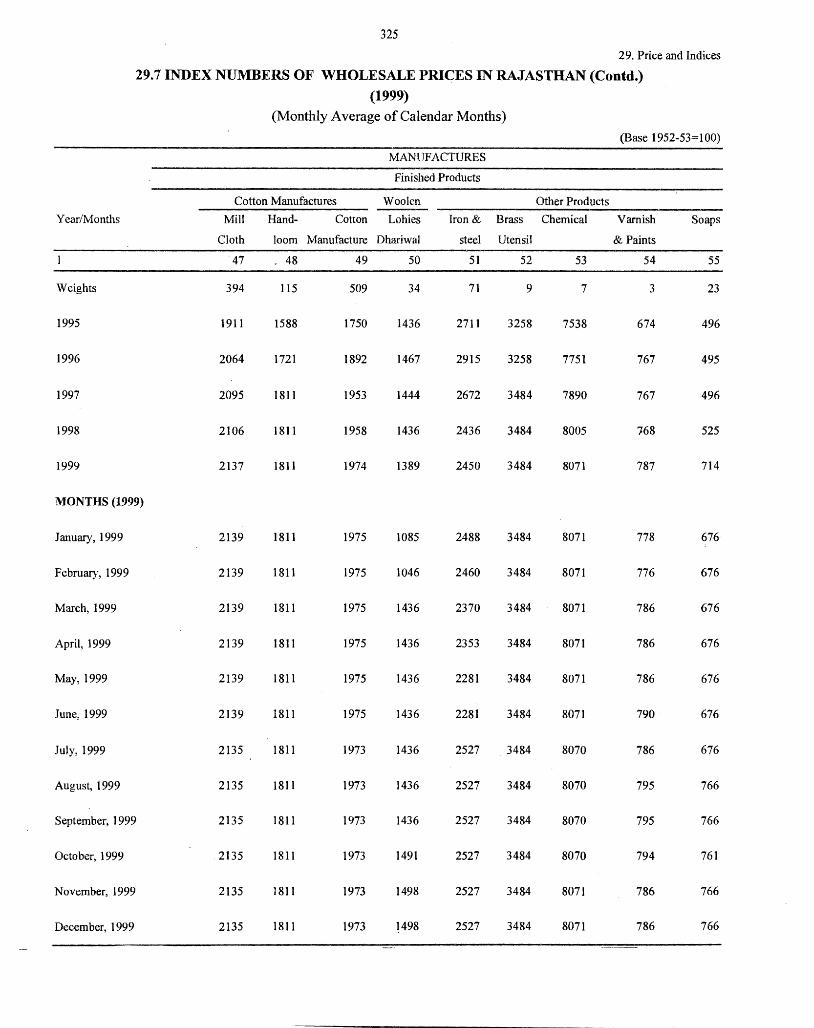
325
29. Price and Indices
29.7 INDEX NUMBERS OF WHOLESALE PRICES IN RAJASTHAN (Contd.) (1999)
(Monthly Average of Calendar Months)
(Base 1952-53=100)
MANUFACTURES
Finished Products
Cotton Manufactures Woolen Other Products
Year/Months Mill Hand- Cotton Lohies Iron & Brass Chemical Varnish Soaps
Cloth loom Manufacture Dhariwal steel Utensil & Paints
47 . 48 49 50 51 52 53 54 55
Weights 394 115 509 34 71 9 7 3 23
1995 1911 1588 1750 1436 2711 3258 7538 674 496
1996 2064 1721 1892 1467 2915 3258 7751 767 495
1997 2095 1811 1953 1444 2672 3484 7890 767 496
1998 2106 1811 1958 1436 2436 3484 8005 168 525
1999 2137 1811 1974 1389 2450 3484 8071 787 714
MONTHS (1999)
January, 1999 2139 1811 1975 1085 2488 3484 8071 778 676
February, 1999 2139 1811 1975 1046 2460 3484 8071 776 676
March, 1999 2139 1811 1975 1436 2370 3484 8071 786 676
April, 1999 2139 1811 1975 1436 2353 3484 8071 786 676
May, 1999 2139 1811 1975 1436 2281 3484 8071 786 676
June, 1999 2139 1811 1975 1436 2281 3484 8071 790 676
July, 1999 2135 1811 1973 1436 2527 3484 8070 786 676
August, 1999 2135 1811 1973 1436 2527 3484 8070 795 766
September, 1999 2135 1811 1973 1436 2527 3484 8070 795 766
October, 1999 2135 1811 1973 1491 2527 3484 8070 794 761
November, 1999 2135 1811 1973 1498 2527 3484 8071 786 766
December, 1999 2135 1811 1973 l498 2527 3484 8071 786 766
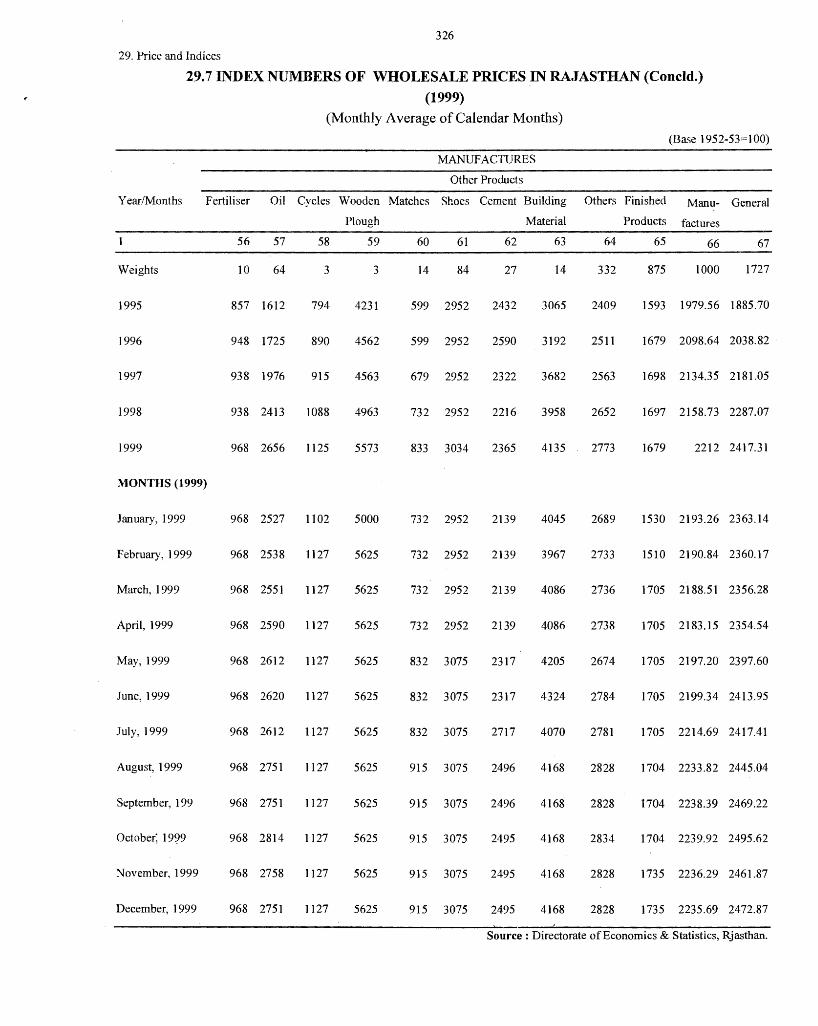
326
29. Price and Indices
29.7 INDEX NUMBERS OF WHOLESALE PRICES IN RAJASTHAN (Concld.)
(1999)
(Monthly Average of Calendar Months)
(Base 1952-53=100)
MANUFACTURES
Other Products
Year/Months Fertiliser Oil Cycles Wooden Matches Shoes Cement Building Others Finished Manu- General
Plough Material Products factures
56 57 58 59 60 61 62 63 64 65 66 67
Weights 10 64 3 3 14 84 27 14 332 875 1000 1727
1995 857 1612 794 4231 599 2952 2432 3065 2409 1593 1979.56 1885.70
1996 948 1725 890 4562 599 2952 2590 3192 2511 1679 2098.64 2038.82
1997 938 1976 915 4563 679 2952 2322 3682 2563 1698 2134.35 2181.05
1998 938 2413 1088 4963 732 2952 2216 3958 2652 1697 2158.73 2287.07
1999 968 2656 1125 5573 833 3034 2365 4135 2773 1679 2212 2417.31
MONTHS (1999)
January, 1999 968 2527 1102 5000 732 2952 2139 4045 2689 1530 2193.26 2363.14
February, 1999 968 2538 1127 5625 732 2952 2139 3967 2733 1510 2190.84 2360.17
March, 1999 968 2551 1127 5625 732 2952 2139 4086 2736 1705 2188.51 2356.28
April, 1999 968 2590 1127 5625 73 2 2952 2139 4086 2738 1705 2183.15 2354.54
May, 1999 968 2612 1127 5625 832 3075 2317 4205 2674 1705 2197.20 2397.60
June, 1999 968 2620 1127 5625 832 3075 2317 4324 2784 1705 2199.34 2413.95
July, 1999 968 2612 1127 5625 832 3075 2717 4070 2781 1705 2214.69 2417.41
August, 1999 968 2751 1127 5625 915 3075 2496 4168 2828 1704 2233.82 2445.04
September, 199 968 2751 1127 5625 915 3075 2496 4168 2828 1704 2238.39 2469.22
October; 1999 968 2814 1127 5625 915 3075 2495 4168 2834 1704 2239.92 2495.62
November, 1999 968 2758 1127 5625 915 3075 2495 4168 2828 1735 2236.29 2461.87
December, 1999 968 2751 1127 5625 915 3075 2495 4168 2828 1735 2235.69 2472.87
Source: Directorate of Economics & Statistics, Rjasthan.
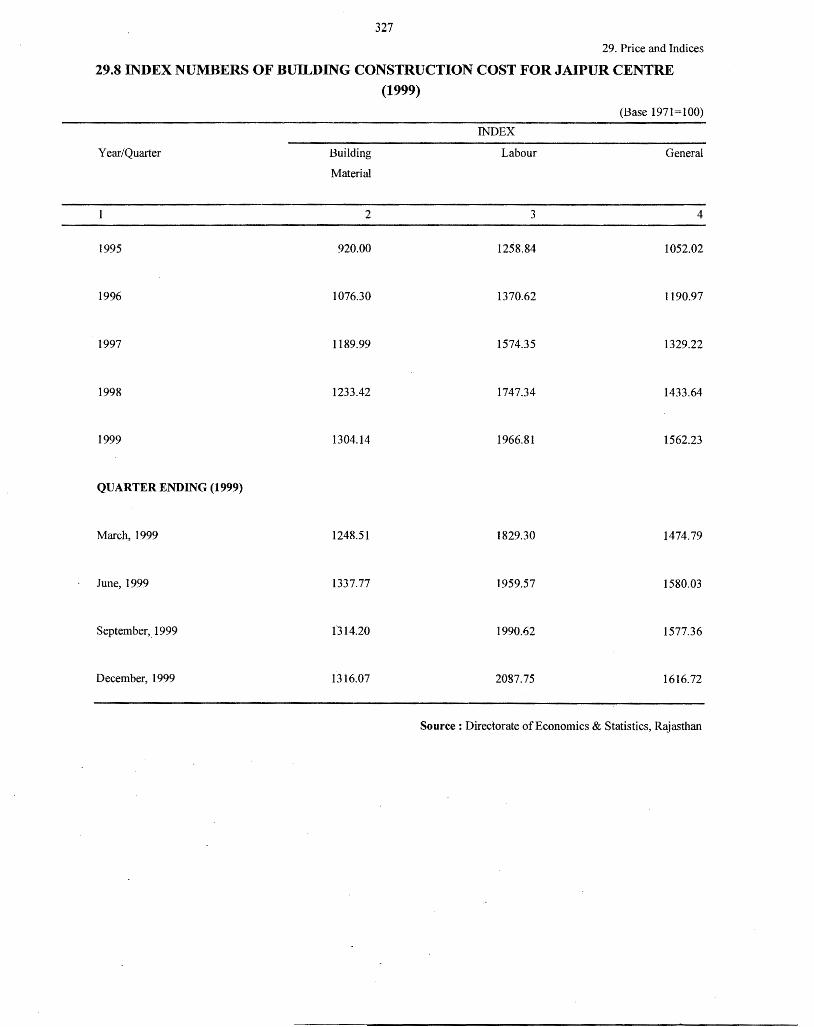
327
29. Price and Indices
29.8 INDEX NUMBERS OF BUILDING CONSTRUCTION COST FOR JAIPUR CENTRE
(1999)
Year/Quarter
1995
1996
1997
1998
1999
QUARTER ENDING (1999)
March, 1999
June, 1999
September,_ 1999
December, 1999
Building
Material
2
920.00
1076.30
1189.99
1233.42
1304.14
1248.51
1337.77
f314.20
1316.07
(Base 1971=100)
INDEX
Labour General
3 4
1258.84 1052.02
1370.62 1190.97
1574.35 1329.22
1747.34 1433.64
1966.81 1562.23
1829.30 1474.79
1959.57 1580.03
1990.62 1577.36
2087.75 1616.72
Source: Directorate of Economics & Statistics, Rajasthan
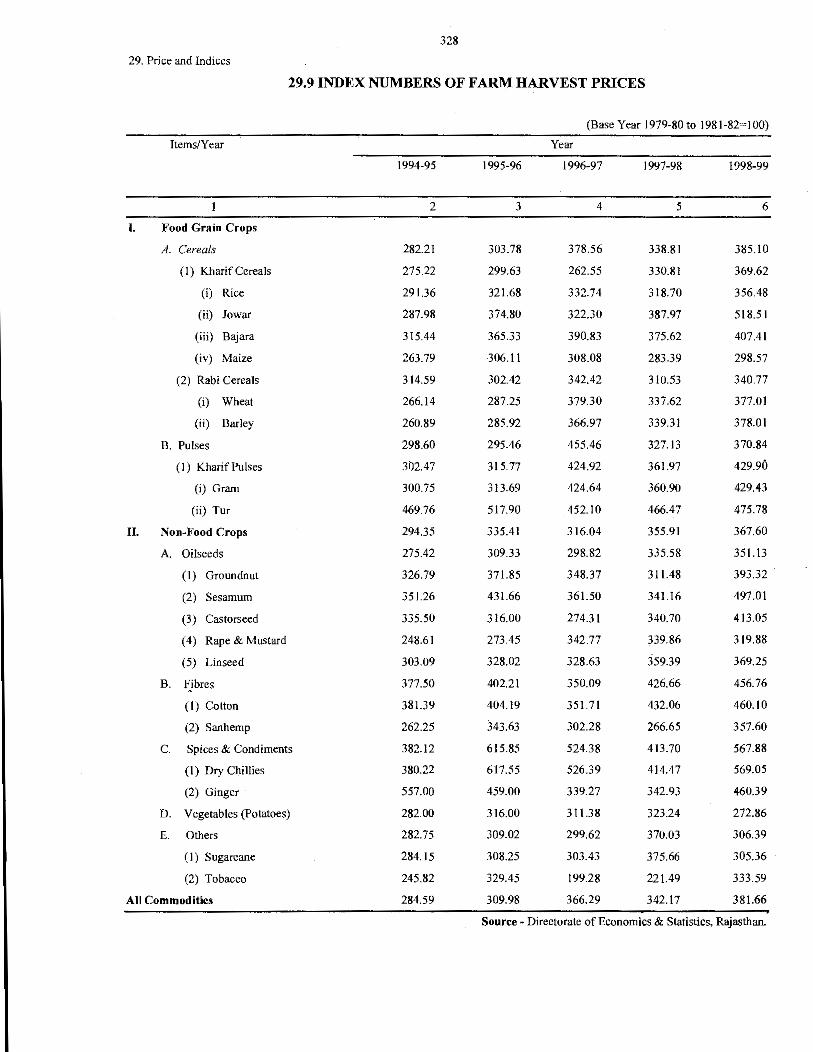
328
29. Price and Indices
29.9 INDEX NUMBERS OF FARM HARVEST PRICES
(Base Year 1979-80 to 1981-82~100)
Items/Year Year
1994-95 1995-96 1996-97 1997-98 1998-99
2 3 4 5 6
I. Food Grain Crops
A. Cereals 282.21 303.78 378.56 338.81 385.10
(I) Kharif Cereals 275.22 299.63 262.55 330.81 369.62
(i) Rice 291.36 321.68 332.74 318.70 356.48
(ii) Jowar 287.98 374.80 322.30 387.97 518.51
(iii) Bajara 315.44 365.33 390.83 375.62 407.41
(iv) Maize 263.79 306.11 308.08 283.39 298.57
(2) Rabi Cereals 314.59 302.42 342.42 310.53 340.77
(i) Wheat 266.14 287.25 379.30 337.62 377.01
(ii) Barley 260.89 285.92 366.97 339.31 378.01
B. Pulses 298.60 295.46 455.46 327.13 370.84
(I) Kharif Pulses 302.47 315.77 424.92 361.97 429.90
(i) Gram 300.75 313.69 424.64 360.90 429.43
(ii) Tur 469.76 517.90 452.10 466.47 475.78
II. Non-Food Crops 294.35 335.41 316.04 355.91 367.60
A. Oilseeds 275.42 309.33 298.82 335.58 351.13
(1) Groundnut 326.79 371.85 348.37 311.48 393.32
(2) Sesamum 351.26 431.66 361.50 341.16 497.01
(3) Castorseed 335.50 316.00 274.31 340.70 413.05
(4) Rape & Mustard 248.61 273.45 342.77 339.86 319.88
(5) Linseed 303.09 328.02 328.63 359.39 369.25
B. FJbres 377.50 402.21 350.09 426.66 456. 76
(1) Cotton 381.39 404.19 351.71 432.06 460.10
(2) Sanhemp 262.25 343.63 302.28 266.65 357.60
c. Spices & Condiments 382.12 615.85 524.38 413.70 567.88
(1) Dry Chillies 380.22 617.55 526.39 414.47 569.05
(2) Ginger 557.00 459.00 339.27 342.93 460.39
D. Vegetables (Potatoes) 282.00 316.00 311.38 323.24 272.86
E. Others 282.75 309.02 299.62 370.03 306.39
(I) Sugareane 284.15 308.25 303.43 375.66 305.36
(2) Tobacco 245.82 329.45 199.28 221.49 333.59
A11 Commodities 284.59 309.98 366.29 342.17 381.66
Source~ Directorate of Economics & Statistics, Rajasthan.
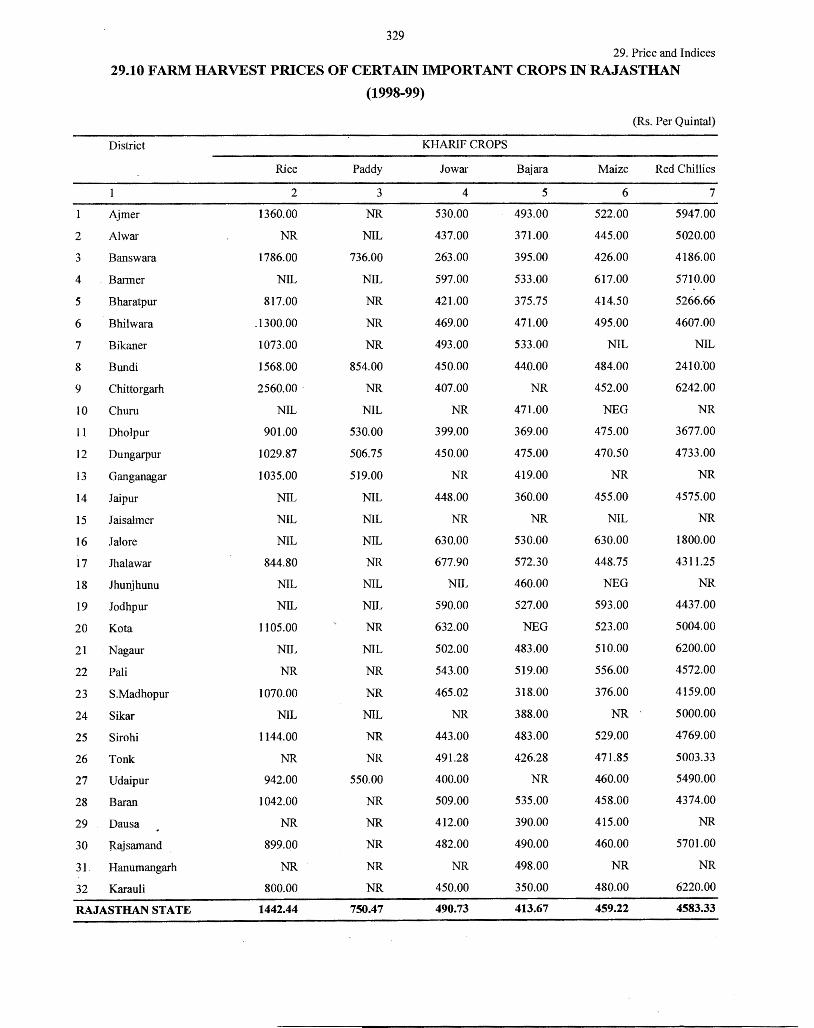
329 29. Price and Indices
29.10 FARM HARVEST PRICES OF CERTAIN IMPORTANT CROPS IN RAJASTHAN
District
Aimer
2 Al war
3 Banswara
4 Barmer
5 Bharatpur
6 Bhilwara
7 Bikaner
8 Bundi
9 Chittorgarh
10 Chum
11 Dholpur
12 Dungarpur
13 Ganganagar
14 Jaipur
15 Jaisalmer
16 Jalore
17 Jhalawar
18 Jhunjhunu
19 Jodhpur
20 Kota
21 Nagaur
"22 Pali
23 S.Madhopur
24 Sikar
25 Sirohi
26 Tonk
27 Udaipur
28 Baran
29 Dausa
30 Rajsamand
31. Hanumangarh
32 Karauli
RAJASTHAN STATE
Rice
2
1360.00
NR
1786.00
NIL
817.00
.1300.00
1073.00
1568.00
2560.00 .
NIL
901.00
1029.87
1035.00
NIL
NIL
NIL
844.80
NIL
NIL
1105.00
NIL
NR
1070.00
NIL
1144.00
NR
942.00
1042.00
NR
899.00
NR
800.00
1442.44
(1998-99)
Paddy
3
NR
NIL
736.00
NIL
NR
NR
NR
854.00
NR
NIL
530.00
506.75
519.00
NIL
NIL
NIL
NR
NIL
NIL
NR
NIL
NR
NR
NIL
NR
NR
550.00
NR
NR
NR
NR
NR
750.47
KHARIF CROPS
Jo war
4
530.00
437.00
263.00
597.00
421.00
469.00
493.00
450.00
407.00
NR
399.00
450.00
NR
448.00
NR
630.00
677.90
NIL
590.00
632.00
502.00
543.00
465.02
NR
443.00
491.28
400.00
509.00
412.00
482.00
NR
450.00
490.73
Bajara
5
493.00
371.00
395.00
533.00
375.75
471.00
533.00
44.0.00
NR
471.00
369.00
475.00
419.00
360.00
NR
530.00
572.30
460.00
527.00
NEG
483.00
519.00
318.00
388.00
483.00
426.28
NR
535.00
390.00
490.00
498.00
350.00
413.67
Maize
6
522.00
445.00
426.00
617.00
414.50
495.00
NIL
484.00
452.00
NEG
475.00
470.50
NR
455.00
NIL
630.00
448.75
NEG
593.00
523.00
510.00
556.00
376.00
NR
529.00
471.85
460.00
458.00
415.00
460.00
NR
480.00
459.22
(Rs. Per Quintal)
Red Chillies
7
5947.00
5020.00
4186.00
5710.00
5266.66
4607.00
NIL
2410:00
6242.00
NR
3677.00
4733.00
NR
4575.00
NR
1800.00
4311.25
NR
4437.00
5004.00
6200.00
4572.00
4159.00
5000.00
4769.00
5003.33
5490.00
4374.00
NR
5701.00
NR
6220.00
4583.33
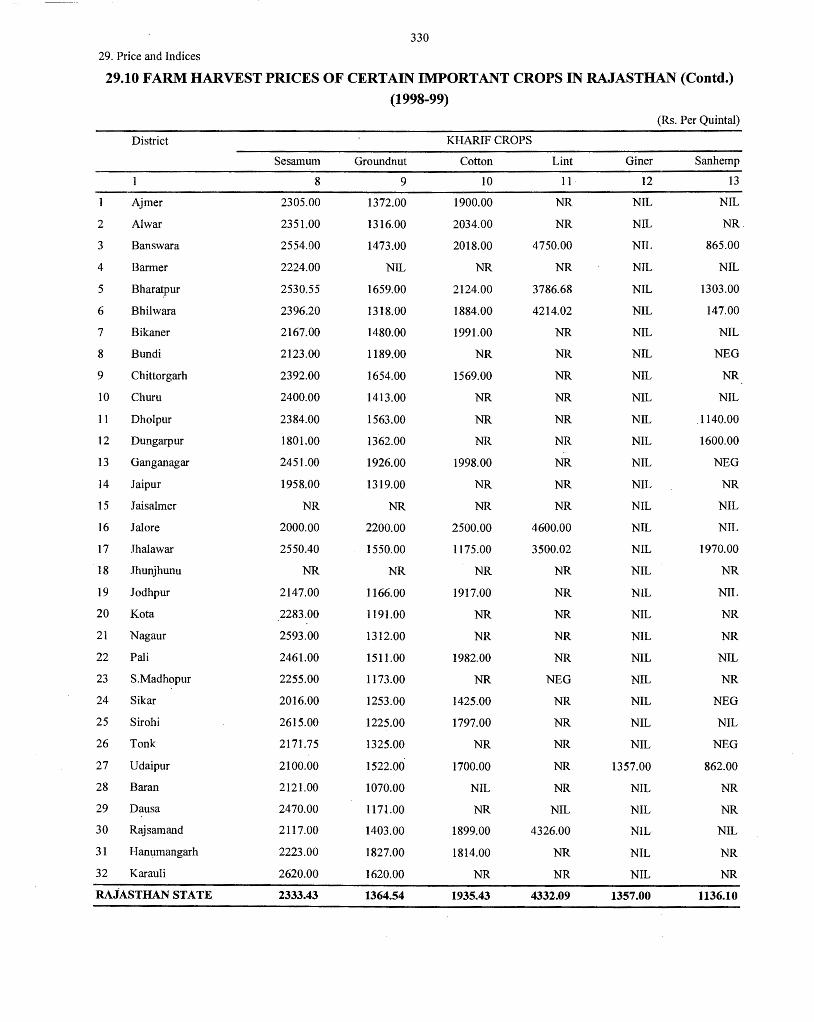
330
29. Price and Indices
29.10 FARM HARVEST PRICES OF CERTAIN IMPORTANT CROPS IN RAJASTHAN (Contd.)
(1998-99)
District
Ajmer
2 Al war
3 Banswara
4 Barmer
5 Bharatpur
6 Bhilwara
7 Bikaner
8 Bundi
9 Chittorgarh
10 Chum
11 Dholpur
12 Dungarpur
13 Ganganagar
14 Jaipur
15 J aisalmer
16 Jalore
17 Jhalawar
18 Jhunjhunu
19 Jodhpur
20 Kota
21 Nagaur
22 Pali
23 S.Madhopur
24 Sikar
25 Sirohi
26 Tonk
27 Udaipur
28 Baran
29 Dausa
30 Rajsamand
31 Hanumangarh
32 Karauli
RAJASTHAN STATE.
Sesamum
8
2305.00
2351.00
2554.00
2224.00
2530.55
2396.20
2167.00
2123.00
2392.00
2400.00
2384.00
1801.00
2451.00
1958.00
NR
2000.00
2550.40
NR
2147.00
2283.00
2593.00
2461.00
2255.00
2016.00
2615.00
2171.75
2100.00
2121.00
2470.00
2117.00
2223.00
2620.00
2333.43
Groundnut
9
1372.00
1316.00
1473.00
NIL
1659.00
1318.00
1480.00
1189.00
1654.00
1413.00
1563.00
1362.00
1926.00
1319.00
NR
2200.00
1550.00
NR
1166.00
1191.00
1312.00
1511.00
1173.00
1253.00
1225.00
1325.00
1522.00
1070.00
1171.00
1403.00
1827.00
1620.00
1364.54
KHARIF CROPS
Cotton
10
1900.00
2034.00
2018.00
NR
2124.00
1884.00
1991.00
NR
1569.00
NR
NR
NR
1998.00
NR
NR
2500.00
1175.00
NR
1917.00
NR
NR
1982.00
NR
1425.00
1797.00
NR
1700.00
NIL
NR
1899.00
1814.00
NR
1935.43
Lint
11
NR
NR
4750.00
NR
3786.68
4214.02
NR
NR
NR
NR
NR
NR
NR
NR
NR
4600.00
3500.02
NR
NR
NR
NR
NR
NEG
NR
NR
NR
NR
NR
NIL
4326.00
NR
NR
4332.09
Giner
12
NIL
NIL
NIL
NIL
NIL
NIL
NIL
NIL
NIL
NIL
NIL
NIL
NIL
NIL
NIL
NIL
NIL
NIL
NIL
NIL
NIL
NIL
NIL
NIL
NIL
NIL
1357.00
NIL
NIL
NIL
NIL
NIL
1357.00
(Rs. Per Quintal)
Sanhemp
13
NIL
NR.
865.00
NIL
1303.00
147.00
NIL
NEG
NR
NIL
1140.00
1600.00
NEG
NR
NIL
NIL
1970.00
NR
NIL
NR
NR
NIL
NR
NEG
NIL
NEG
862.00
NR
NR
NIL
NR
NR
1136.10
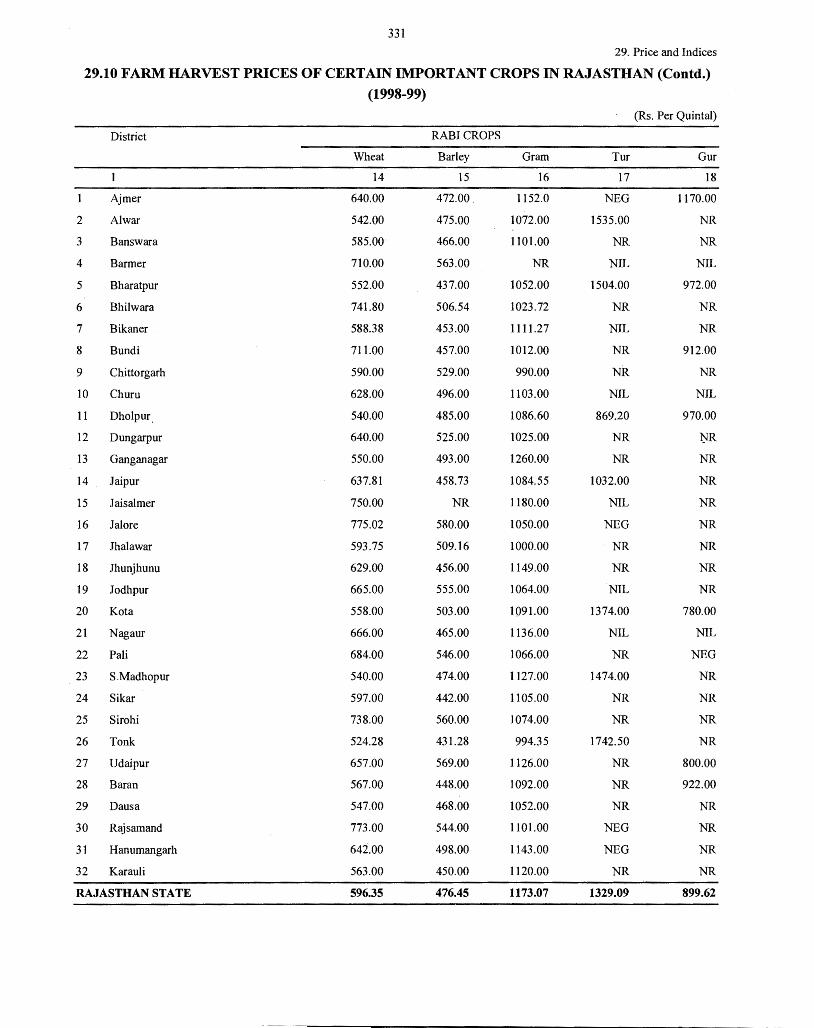
331
29. Price and Indices
29.10 FARM HARVEST PRICES OF CERTAIN IMPORTANT CROPS IN RAJASTHAN (Contd.)
(1998-99)
(Rs. Per Quintal)
District RABI CROPS
Wheat Barley Gram Tur Gur
14 15 16 17 18
Ajmer 640.00 472.00. 1152.0 NEG 1170.00
2 Al war 542.00 475.00 1072.00 1535.00 NR
3 Banswara 585.00 466.00 1101.00 NR NR
4 Barmer 710.00 563.00 NR NIL NIL
5 Bharatpur 552.00 437.00 1052.00 1504.00 972.00
6 Bhilwara 741.80 506.54 1023.72 NR NR
7 Bikaner 588.38 453.00 1111.27 NIL NR
8 Bundi 711.00 457.00 1012.00 NR 912.00
9 Chittorgarh 590.00 529.00 990.00 N'.R NR
10 Churn 628.00 496.00 1103.00 NIL NIL
11 Dholpur. 540.00 485.00 1086.60 869.20 970.00
12 Dungarpur 640.00 525.00 1025.00 NR ~R
13 Ganganagar 550.00 493.00 1260.00 NR NR
14 Jaipur 637.81 458.73 1084.55 1032.00 NR
15 Jaisalmer 750.00 NR 1180.00 NIL NR
16 Jal ore 775.02 580.00 1050.00 NEG NR
17 Jhalawar 593.75 509.16 1000.00 NR NR
18 Jhunjhunu 629.00 456.00 1149.00 NR NR
19 Jodhpur 665.00 555.00 1064.00 NIL NR
20 Kota 558.00 503.00 1091.00 1374.00 780.00
21 Nagaur 666.00 465.00 1136.00 NIL NIL
22 Pali 684.00 546.00 1066.00 NR NEG
23 S.Madhopur 540.00 474.00 1127.00 1474.00 NR
24 Sikar 597.00 442.00 1105.00 NR NR
25 Sirohi 738.00 560.00 1074.00 NR NR
26 Tonk 524.28 431.28 994.35 1742.50 NR
27 Udaipur 657.00 569.00 1126.00 NR 800.00
28 Baran 567.00 448.00 1092.00 NR 922.00
29 Daus a 547.00 468.00 1052.00 NR NR
30 Rajsamand 773.00 544.00 1101.00 NEG NR
31 Hanumangarh 642.00 498.00 1143.00 NEG NR
32 Karauli 563.00 450.00 1120.00 NR NR
RAJASTHAN STATE 596.35 4.76.45 1173.07 1329.09 899.62
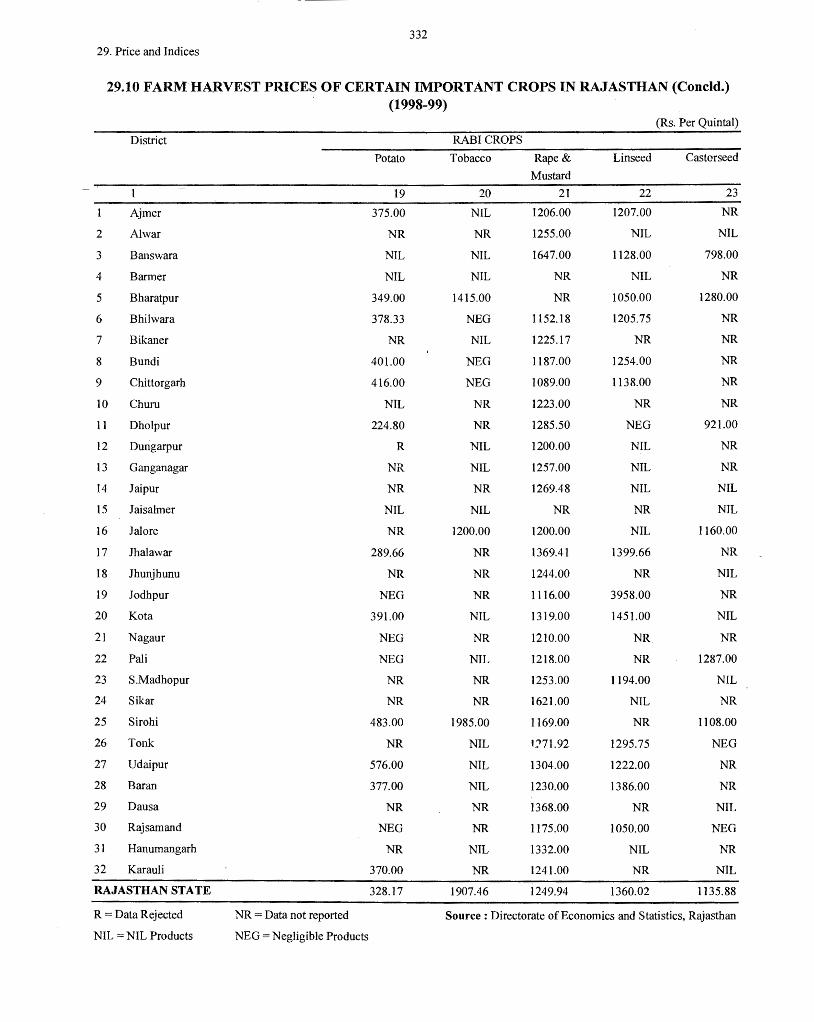
332
29. Price and Indices
29.10 FARMHARVEST PRICES OF CERTAIN IMPORTANT CROPS IN RA.JASTHAN (Concld.) (1998-99)
(Rs. Per Quintal)
District RABI CROPS
Potato Tobacco Rape& Linseed Castorseed
Mustard
19 20 21 22 23
Ajmer 375.00 NIL 1206.00 1207.00 NR
2 Al war NR NR 1255.00 NIL NIL
3 Banswara NIL NIL 1647.00 l 128.00 798.00
4 Barmer NIL NIL NR NIL NR
5 Bharatpur 349.00 1415.00 NR 1050.00 1280.00
6 Bhilwara 378.33 NEG Il52. l 8 1205.75 NR
7 Bikaner NR NIL 1225. l 7 NR NR
8 Bundi 401.00 NEG l 187.00 1254.00 NR
9 Chittorgarh 416.00 NEG 1089.00 1138.00 NR
IO Churn NIL NR 1223.00 NR NR
l l Dholpur 224.80 NR 1285.50 NEG 921.00
12 Dungarpur R NIL 1200.00 NIL NR
13 Ganganagar NR NIL 1257.00 NIL NR
14 Jaipur NR NR 1269.48 NIL NIL
15 Jaisalmer NIL NIL NR NR NIL
16 Jal ore NR 1200.00 1200.00 NIL 1160.00
17 Jhalawar 289.66 NR 1369.41 1399.66 NR
18 Jhunjhunu NR NR 1244.00 NR NIL
19 Jodhpur NEG NR 1116.00 3958.00 NR
20 Ko ta 391.00 NIL 1319.00 1451.00 NIL
21 Nagaur NEG NR 1210.00 NR NR
22 Pali NEG NIL 1218.00 NR 1287.00
23 S.Madhopur NR NR 1253.00 1194.00 NIL
24 Sikar NR NR 1621.00 NIL NR
25 Sirohi 483.00 1985.00 1169.00 NR l l 08.00
26 Tonk NR NIL 1.771.92 1295.75 NEG
27 Udaipur 576.00 NIL 1304.00 1222.00 NR
28 Baran 377.00 NIL 1230.00 1386.00 NR
29 Dausa NR NR 1368.00 NR NIL
30 Rajsamand NEG NR 1175.00 1050.00 NEG
31 Hanumangarh NR NIL 1332.00 NIL NR
32 Karauli 370.00 NR 1241.00 NR NIL
RAJASTHAN STATE 328.17 1907.46 1249.94 1360.02 l 135.88
R = Data Rejected NR = Data not reported Source : Directorate of Economics and Statistics, Rajasthan
NIL =NIL Products NEG= Negligible Products
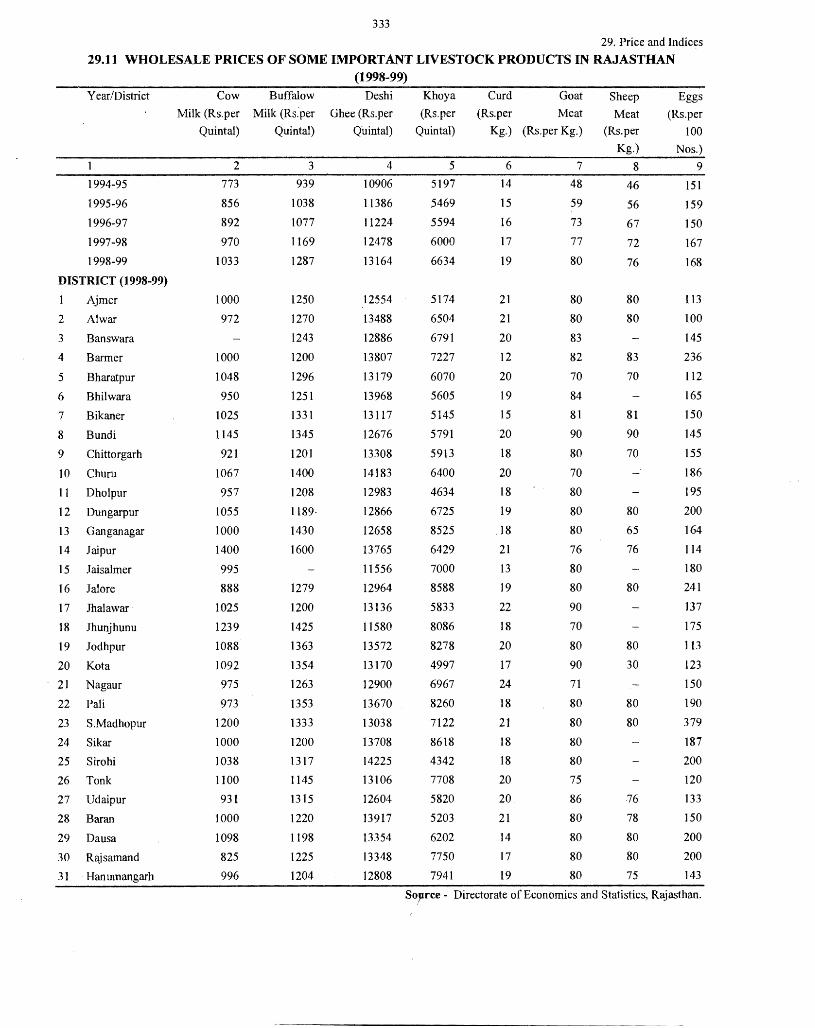
333
29. Price and Indices
29.11 WHOLESALE PRICES OF SOME IMPORTANT LIVESTOCK PRODUCTS IN RAJASTHAN (1998-99)
Year/District
1994-95
1995-96
1996-97
1997-98
1998-99
DISTRICT (1998-99)
1 Aimer
2 Al war
3 Banswara
4 Barmer
5 Bharatpur
6 Bhilwara
7 Bikaner
8 Bundi
9 Chittorgarh
10 Churu
11 Dholpur
12 Dungarpur
13 Ganganagar
14 Jaipur
15 Jaisalmer
16 Jalore
17 Jhalawar
18 Jhunjhunu
19 Jodhpur
20 Kota
21 Nagaur
22 Pali
23 S.Madhopur
24 Sikar
25 Sirohi
26 Tonk
27 Udaipur
28 Baran
29 Dausa
30 Rajsamand
31 Hanumangarh
Cow Buffalow
Milk (Rs. per Milk (Rs: per
Quintal)
2 773
856
892
970
1033
1000
972
1000
1048
950
1025
1145
921
1067
957
1055
1000
1400
995
888
1025
1239
1088
1092
975
973
1200
1000
1038
1100
931
1000
1098
825
996
Quintal)
3
939
1038
1077
1169
1287
1250
1270
1243
1200
1296
1251
1331
1345
1201
1400
1208
1189·
1430
1600
1279
1200
1425
1363
1354
1263
1353
1333
1200
1317
1145
1315
1220
1198
1225
1204
Deshi
Ghee (Rs.per
Quintal)
4
10906
11386
11224
12478
13164
12554
13488
12886
13807
13179
13968
13117
12676
13308
14183
12983
12866
12658
13765
11556
12964
13136
11580
13572
13170
12900
13670
13038
13708
14225
13106
12604
13917
13354
13348
12808
Kho ya
(Rs.per
Quintal)
5
5197
5469
5594
6000
6634
5174
6504
6791
7227
6070
5605
5145
5791
5913
6400
4634
6725
8525
6429
7000
8588
5833
8086
8278
4997
6967
8260
7122
8618
4342
7708
5820
5203
6202
7750
7941
Curd Goat
(Rs.per Meat
Kg.) (Rs.per Kg.)
6 7 14 48
15 59
16 73
17 77
19 80
21
21
20
12
20
19
15
20
18
20
18
19
.18
21
13
19
22
18
20
17
24
18
21
18
18
20
20
21
14
17
19
80
80
83
82
70
84
81
90
80
70
80
80
80
76
80
80
90
70
80
90
71
80
80
80
80
75
86
80
80
80
80
Sheep
Meat
(Rs.per
Kg.)
8
46
56
67
72
76
80
80
83
70
81
90
70
80
65
76
80
80
30
80
80
76
78
80
80
75
Eggs
(Rs.per
100 Nos.)
9
151
159
150
167
168
113
100
145
236
112
165
150
145
155
186
195
200
164
114
180
241
137
175
I 13
123
150
190
379
187
200
120
133
150
200
200
143
So_prce - Directorate of Economics and Statistics, Rl:l:iasthan.
(30) FIVE YEAR PLAN
The data for the Annual Plan 1998-99 has been collected from the planning Department,
Government of Rajasthan. The expenditure reported in tables is only that spent against state plan
ceiling. The figures of expenditure presented here are for the year 1998-99 respectively.
Revised allotment for the year 1998-99 is Rs. 406400.00 Lakhs and proposed allotment for
the year 1999-2000 is Rs. 385514.33 lakhs were earmarked for the execution of various
development schemes respectively.
The development sector wise details of allotment and expenditure for the said years are
given in table 30.1 while the Physical targets and Achievements for the year 1998-99 are given
in table 30.2.
Districtwise plan outlay and Expenditure for the year 1998-99 are given in table 30.3.
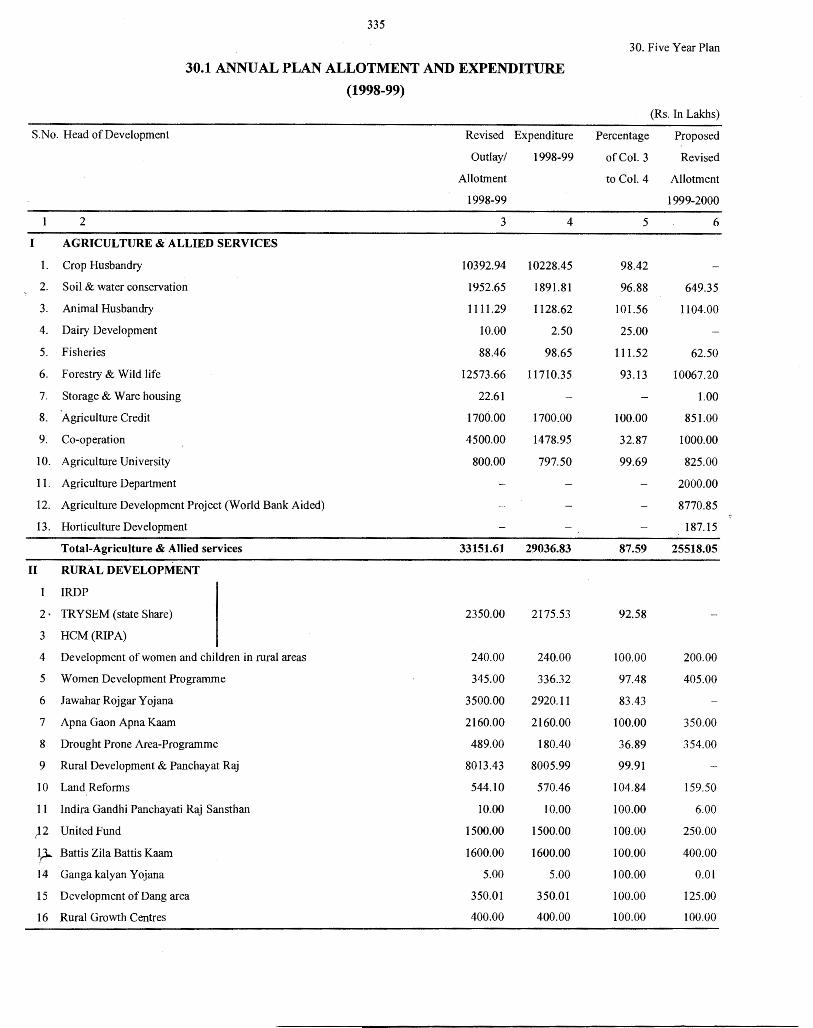
335
30. Five Year Plan
30.1 ANNUAL PLAN ALLOTMENT AND EXPENDITURE
(1998-99)
(Rs. In Lakhs)
S.No. Head of Development Revised Expenditure Percentage Proposed
Outlay/ 1998-99 of Col. 3 Revised
Allotment to Col. 4 Allotment
1998-99 1999-2000
2 3 4 5 6
I AGRICULTURE & ALLIED SERVICES
1. Crop Husbandry 10392.94 10228.45 98.42
2. Soil & water conservation 1952.65 1891.81 96.88 649.35
3. Animal Husbandry 1111.29 1128.62 101.56 1104.00
4. Dairy Development 10.00 2.50 25.00
5. Fisheries 88.46 98.65 111.52 62.50
6. Forestry & Wild life 12573.66 11710.35 93.13 10067.20
7. Storage & Ware housing 22.61 1.00
8. Agriculture Credit 1700.00 1700.00 100.00 851.00
9. Co-operation 4500.00 1478.95 32.87 1000.00
10. Agriculture University 800.00 797.50 99.69 825.00
11. Agriculture Department 2000.00
12. Agriculture Development Project (World Bank Aided) 8770.85
13. Horticulture Development 187.15
Total-Agriculture & Allied services 33151.61 29036.83 87.59 25518.05
II RURAL DEVELOPMENT
IRDP
2· TRYSEM (state Share) 2350.00 2175.53 92.58
3 HCM (RIPA)
4 Development of women and children in rural areas 240.00 240.00 100.00 200.00
5 Women Development Programme 345.00 336.32 97.48 405.00
6 Jawahar Rojgar Y ojana 3500.00 2920.11 83.43
7 Apna Gaon Apna Kaam 2160.00 2160.00 100.00 350.00
8 Drought Prone Area-Programme 489.00 180.40 36.89 354.00
9 Rural Development & Panchayat Raj 8013.43 8005.99 99.91
10 Land Reforms 544.10 570.46 104.84 159.50
11 Indira Gandhi Panchayati Raj Sansthan 10.00 10.00 100.00 6.00
p United Fund 1500.00 1500.00 100.00 250.00
p .. Battis Zila Battis Kaam 1600.00 1600.00 100.00 400.00
14 Ganga kalyan Y ojana 5.00 5.00 100.00 0.01
15 Development of Dang area 350.01 350.01 100.00 125.00
16 Rural Growth Centres 400.00 400.00 100.00 100.00
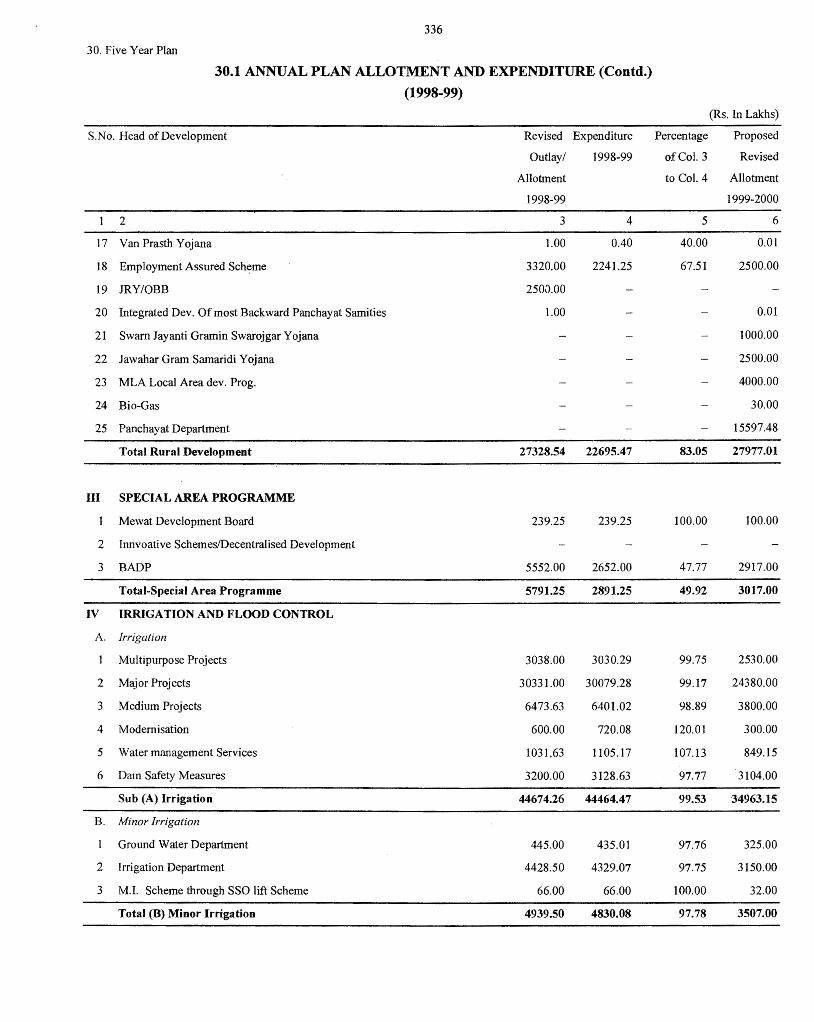
336
30. Five Year Plan
30.1 ANNUAL PLAN ALLOTMENT AND EXPENDITURE (Contd.)
(1998-99)
(Rs. In Lakhs)
S.No. Head of Development Revised Expenditure Percentage Proposed
Outlay/ 1998-99 of Col. 3 Revised
Allotment to Col. 4 Allotment
1998-99 1999-2000
2 3 4 5 6
17 Van Prasth Yojana 1.00 0.40 40.00 0.01
18 Employment Assured Sch~me 3320.00 2241.25 67.51 2500.00
19 .TRY/OBB 250J.OO
20 Integrated Dev. Of most Backward Panchayat Samities 1.00 0.01
21 Swarn Jayanti Gramin Swarojgar Y ojana 1000.00
22 Jawahar Gram Samaridi Yojana 2500.00
23 MLA Local Area dev. Prog. 4000.00
24 Bio-Gas 30.00
25 Panchayat Department 15597.48
Total Rural Development 27328.54 22695.47 83.05 27977.01
Ill SPECIAL AREA PROGRAMME
Mewat Development Board 239.25 239.25 100.00 100.00
2 Innvoative Schemes/Decentralised Development
3 BADP 5552.00 2652.00 47.77 2917.00
Total-Special Area Programme 5791.25 2891.25 49.92 3017.00
IV IRRIGATION AND FLOOD CONTROL
A. Irrigation
Multipurpose Projects 3038.00 3030.29 99.75 2530.00
2 Major Projects 30331.00 30079.28 99.17 24380.00
3 Medium Projects 6473.63 6401.02 98.89 3800.00
4 Modernisation 600.00 720.08 120.01 300.00
5 Water management Services 1031.63 1105.17 107.13 849.15
6 Dam Safety Measures 3200.00 3128.63 97.77 3104.00
Sub (A) Irrigation 44674.26 44464.47 99.53 •34963.15
B. Minor Irrigation
Ground Water Department 445.00 435.01 97.76 325.00
2 Irrigation Department 4428.50 4329.07 97.75 3150.00
3 MJ. Scheme through SSO lift Scheme 66.00 66.00 100.00 32.00
Total (B) Minor Irrigation 4939.50 4830.08 97.78 3507.00
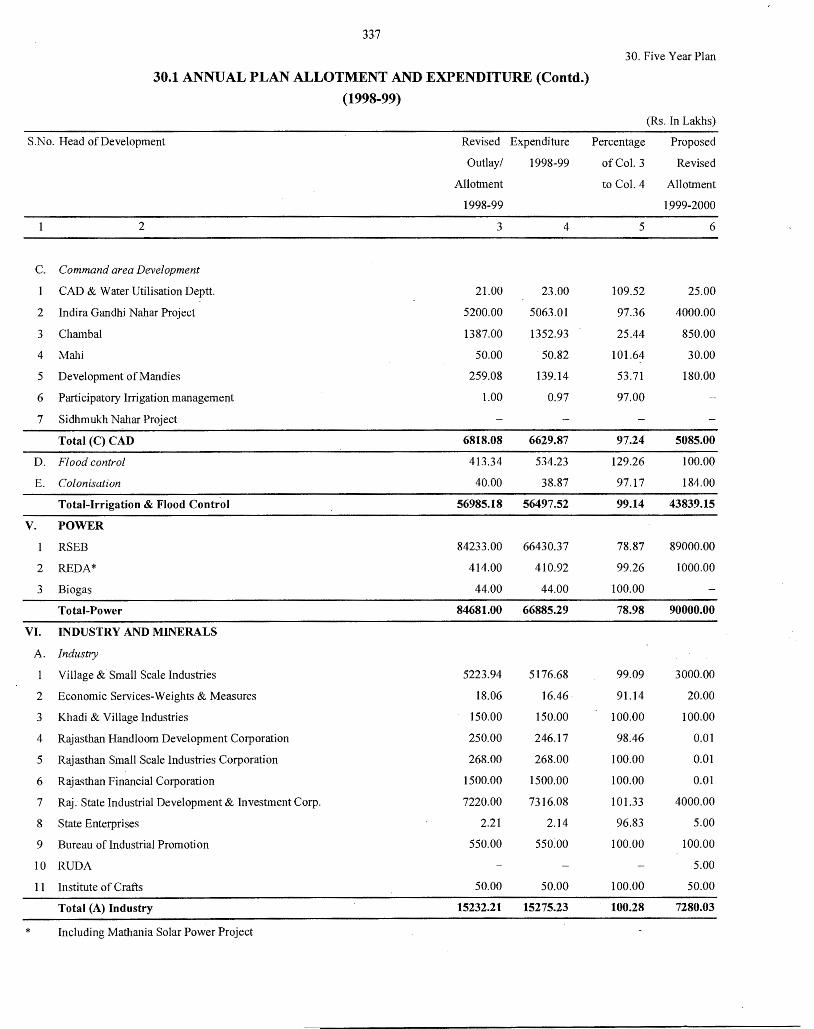
337
30. Five Year Plan
30.1 ANNUAL PLAN ALLOTMENT AND EXPENDITURE (Contd.)
(1998-99)
(Rs. In Lakhs)
S.No. Head of Development Revised Expenditure Percentage Proposed
Outlay/ 1998-99 of Col. 3 Revised
Allotment to Col. 4 Allotment
1998-99 1.999-2000
2 3 4 5 6
C. Command area Development
CAD & Water Utilisation Deptt. 21.00 23.00 109.52 25.00
2 Indira Gandhi Nahar Project 5200.00 5063.01 97.36 4000.00
3 Chambal 1387.00 1352.93 25.44 850.00
4 Mahi 50.00 50.82 101.64 30.00
5 Development ofMandies 259.08 139.14 53.71 180.00
6 Participatory Irrigation management 1.00 0.97 97.00
7 Sidhmukh Nahar Project
Total (C) CAD 6818.08 6629.87 97.24 5085.00
D. Flood control 413.34 534.23 129.26 100.00
E. Colonisation 40.00 38.87 97.17 184.00
Total-Irrigation & Flood Control 56985.18 56497.52 99.14 43839.15
v. POWER
RSEB 84233.00 66430.37 78.87 89000.00
2 REDA* 414.00 410.92 99.26 1000.00
3 Biogas 44.00 44.00 100.00
Total-Power 84681.00 66885.29 78.98 90000.00
VI. INDUSTRY AND MINERALS
A. Jndust1y
Village & Small Scale Industries 5223.94 5176.68 99.09 3000.00
2 Economic Services-Weights & Measures 18.06 16.46 91.14 20.00
3 Khadi & Village Industries 150.00 150.00 100.00 100.00
4 Rajasthan Handloom Development Corporation 250.00 246.17 98.46 0.01
5 Rajasthan Small Scale Industries Corporation 268.00 268.00 100.00 0.01
6 Rajasthan Financial Corporation 1500.00 1500.00 100.00 0.01
7 Raj. State Industrial Development & Investment Corp. 7220.00 7316.08 101.33 4000.00
8 State Enterprises 2.21 2.14 96.83 5.00
9 Bureau of Industrial Promotion 550.00 550.00 100.00 100.00
10 RUDA 5.00
11 Institute of Crafts 50.00 50.00 100.00 50.00
Total (A) Industry 15232.21 15275.23 100.28 7280.03
* Including Mathania Solar Power Project
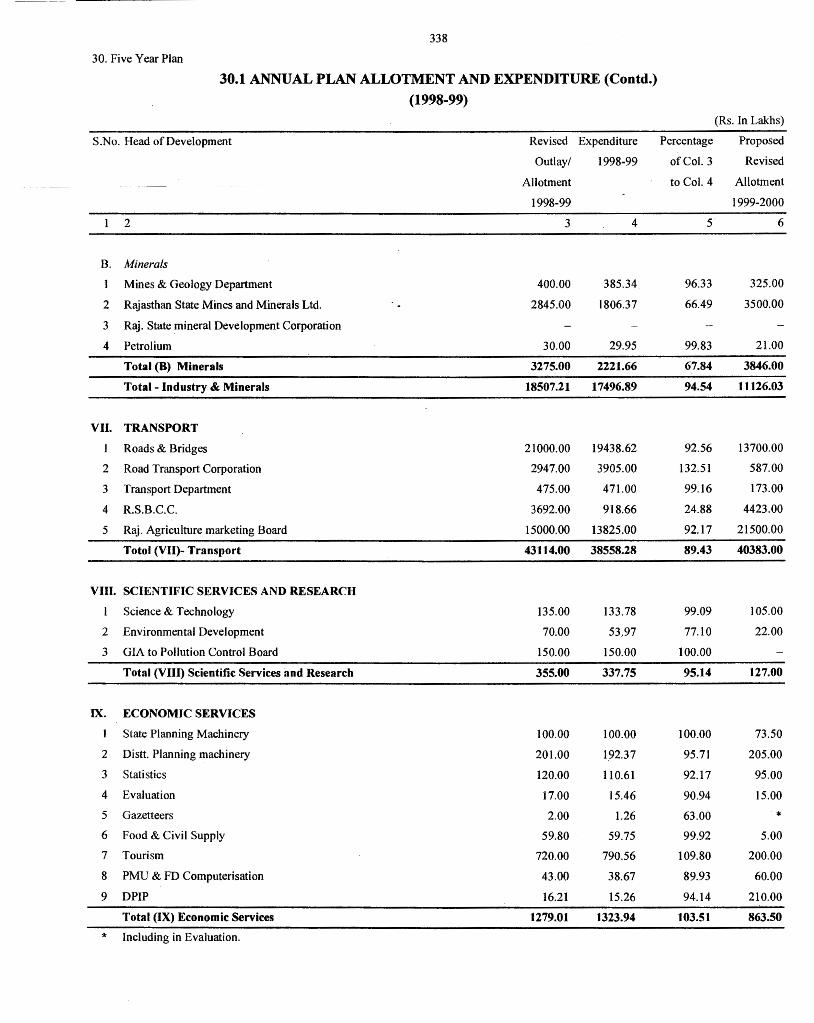
338
30. Five Year Plan
30.1 ANNUAL PLAN ALLOTMENT AND EXPENDITURE (Contd.)
(1998-99) (Rs. In Lakhs)
S.No. Head of Development Revised Expenditure Percentage Proposed
Outlay/ 1998-99 of Col. 3 Revised
Allotment to Col. 4 Allotment
1998-99 1999-2000
2 3 4 5 6
B. Minerals
1 Mines & Geology Department 400.00 385.34 96.33 325.00
2 Rajasthan State Mines and Minerals Ltd. 2845.00 1806.37 66.49 3500.00
3 Raj. State mineral Development Corporation
4 Petrolium 30.00 29.95 99.83 21.00
Total (B) Minerals 3275.00 2221.66 67.84 3846.00
Total - Industry & Minerals 18507.21 17496.89 94.54 11126.03
VII. TRANSPORT
Roads & Bridges 21000.00 19438.62 92.56 13700.00
2 Road Transport Corporation 2947.00 3905.00 132.51 587.00
3 Transport Department 475.00 471.00 99.16 173.00
4 R.S.B.C.C. 3692.00 918.66 24.88 4423.00
5 Raj. Agriculture marketing Board 15000.00 13825.00 92.17 21500.00
Totol (VII)- Transport 43114.00 38558.28 89.43 40383.00
VIII. SCIENTIFIC SERVICES AND RESEARCH
l Science & Technology 135.00 133.78 99.09 105.00
2 Environmental Development 70.00 53.97 77.10 22.00
3 GIA to Pollution Control Board 150.00 150.00 100.00
Total (VIII) Scientific Services and Research 355.00 337.75 95.14 127.00
IX. ECONOMIC SERVICES
State Planning Machinery 100.00 100.00 100.00 73.50
2 Distt. Planning machinery 201.00 1_92.37 95.71 205.00
3 Statistics 120.00 110.61 92.17 95.00
4 Evaluation 17.00 15.46 90.94 15.00
5 Gazetteers 2.00 1.26 63.00 * 6 Food & Civil Supply 59.80 59.75 99.92 5.00
7 Tourism 720.00 790.56 109.80 200.00
8 PMU & FD Computerisation 43.00 38.67 89.93 60.00
9 DPIP 16.21 15.26 94.14 210.00
Total (IX) Economic Services 1279.01 1323.94 103.51 863.50
* Including in Evaluation.
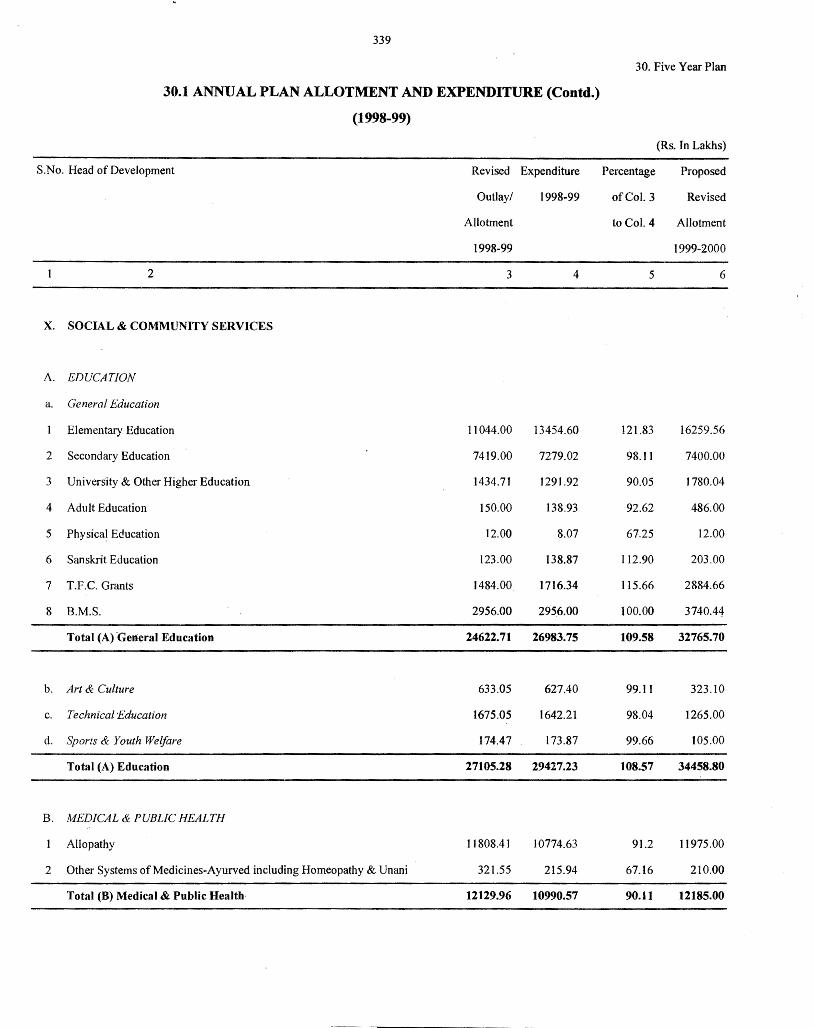
339
30.1 ANNUAL PLAN ALLOTMENT AND EXPENDITURE (Contd.)
(1998-99)
S.No. Head of Development Revised Expenditure
Outlay/ 1998-99
Allotment
1998-99
2 3 4
X. SOCIAL & COMMUNITY SERVICES
A. EDUCATION
a. General Education
Elementary Education 11044.00 13454.60
2 Secondary Education 7419.00 7279.02
3 University & Other Higher Education 1434.71 1291.92
4 Adult Education 150.00 138.93
5 Physical Education 12.00 8.07
6 Sanskrit Education 123.00 138.87
7 T.F.C. Grants 1484.00 1716.34
8 B.M.S. 2956.00 2956.00
Total (A) -General Education 24622.71 26983.75
b. Art & Culture 633.05 627.40
c. Technical Education 1675.05 1642.21
d. Sports & Youth Welfare 174.47 173.87
Total (A) Education 27105.28 29427.23
B. MEDICAL & PUBLIC HEALTH
Allopathy 11808.41 10774.63
2 Other Systems ofMedicines-Ayurved including Homeopathy & Unani 321.55 215.94
Total (B) Medical & Public Health· 12129.96 10990.57
30. Five Year Plan
(Rs. In Lakhs)
Percentage Proposed
of Col. 3 Revised
to Col. 4 Allotment
1999-2000
5 6
121.83 16259.56
98.11 7400.00
90.05 1780.04
92.62 486.00
67.25 12.00
112.90 203.00
115.66 2884.66
100.00 3740.44
109.58 32765.70
99.11 323.10
98.04 1265.00
99.66 105.00
108.57 34458.80
91.2 11975.00
67.16 210.00
90.11 12185.00
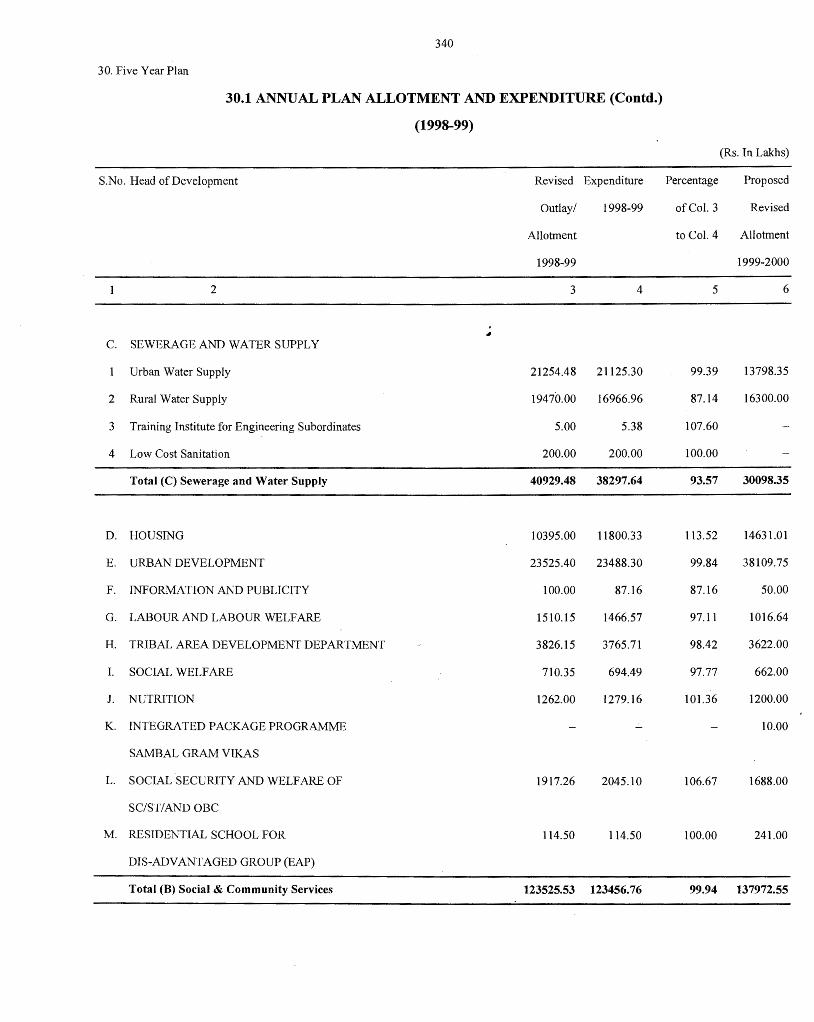
30. Five Year Plan
340
30.1 ANNUAL PLAN ALLOTMENT AND EXPENDITURE (Contd.)
(1998-99)
S.No. Head of Development Revised Expenditure Percentage
Outlay/ 1998-99 of Col. 3
Allotment to Col. 4
1998-99
2 3 4 5
~
c. SEWERAGE AND WATER SUPPLY
Urban Water Supply 21254.48 21125.30 99.39
2 Rural Water Supply 19470.00 16966.96 87.14
3 Training Institute for Engineering Subordinates 5.00 5.38 107.60
4 Low Cost Sanitation 200.00 200.00 100.00
Total (C) Sewerage and Water Supply 40929.48 38297.64 93.57
D. HOUSING 10395.00 11800.33 113.52
E. URBAN DEVELOPMENT 23525.40 23488.30 99.84
F. INFORMATION AND PUBLICITY 100.00 87.16 87.16
G. LABOUR AND LABOUR WELFARE 1510.15 1466.57 97.11
H. TRIBAL AREA DEVELOPMENT DEPARTMENT 3826.15 3765.71 98.42
I. SOCIAL WELFARE 710.35 694.49 97.77
J. NUTRITION 1262.00 1279.16 101.36
K. INTEGRATED PACKAGE PROGRAMME
SAMBAL GRAM VIKAS
L. SOCIAL SECURITY AND WELP ARE OF 1917.26 2045.10 106.67
SC/ST/AND OBC
M. RESIDENTIAL SCHOOL FOR 114.50 114.50 100.00
DIS-ADV ANT AGED GROUP (EAP)
Total (B) Social & Community Services 123525.53 123456.76 99.94
(Rs. In Lakhs)
Proposed
Revised
Allotment
1999-2000
6
13798.35
16300.00
30098.35
14631.01
38109.75
50.00
1016.64
3622.00
662.00
1200.00
10.00
1688.00
241.00
137972.55
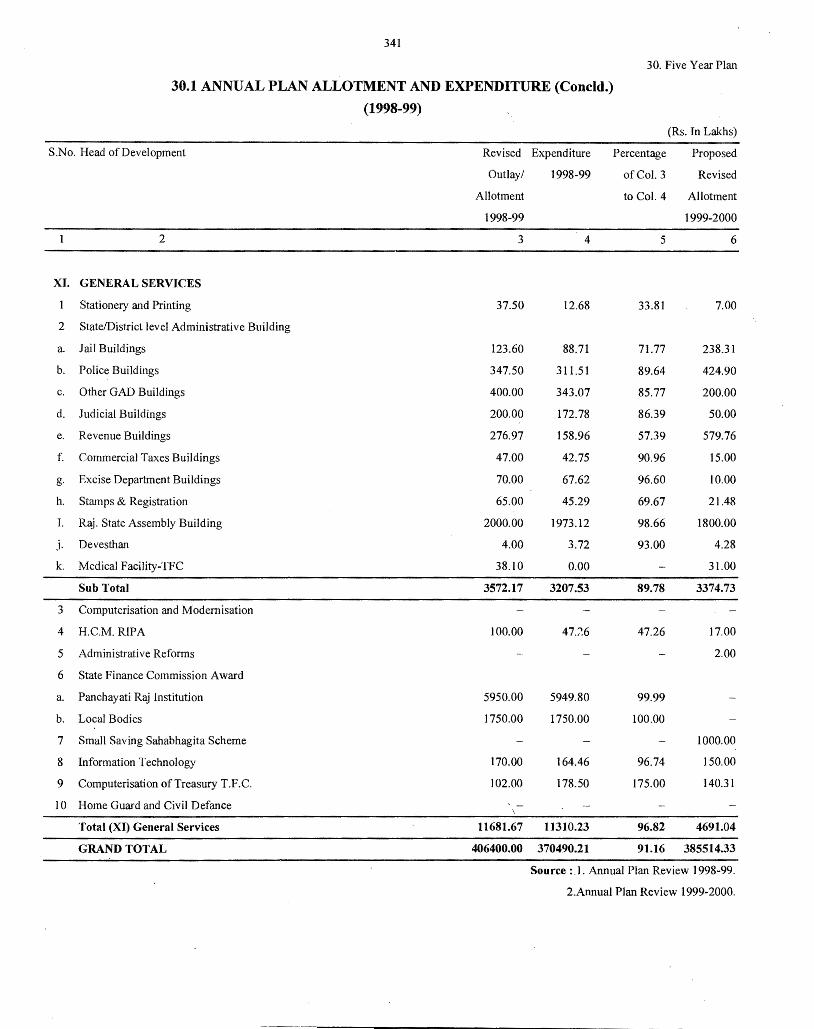
341
30. Five Year Plan
30.1 ANNUAL PLAN ALLOTMENT AND EXPENDITURE (Concld.)
(1998-99)
(Rs. In Lakhs)
S.No. Head of Development Revised Expenditure Percentage Proposed
Outlay/ 1998-99 of Col. 3 Revised
Allotment to Col. 4 Allotment
1998-99 1999-2000
2 3 4 5 6
XI. GENERAL SERVICES
Stationery and Printing 37.50 12.68 33.81 7.00
2 State/District level Administrative Building
a. Jail Buildings 123.60 88.71 71.77 238.31
b. Police Buildings 347.50 311.51 89.64 424.90
c. Other GAD Buildings 400.00 343.07 85.77 200.00
d. Judicial Buildings 200.00 172.78 86.39 50.00
e. Revenue Buildings 276.97 158.96 57.39 579.76
f. Commercial Taxes Buildings 47.00 42.75 90.96 15.00
g. Excise Department Buildings 70.00 67.62 96.60 10.00
h. Stamps & Registration 65.00 45.29 69.67 21.48
I. Raj. State Assembly Building 2000.00 1973.12 98.66 1800.00
j. Devesthan 4.00 3.72 93.00 4.28
k. Medical Facility-TFC 38.10 0.00 31.00
Sub Total 3572.17 3207.53 89.78 3374.73
3 Computerisation and Modernisation
4 H.C.M. RIPA 100.00 47.7.6 47.26 17.00
5 Administrative Reforms 2.00
6 State Finance Commission Award
a. Panchayati Raj Institution 5950.00 5949.80 99.99
b. Local Bodies 1750.00 1750.00 100.00
7 Small Saving Sahabhagita Scheme 1000.00
8 Information Technology 170.00 164.46 96.74 150.00
9 Computerisation of Treasury T.F.C. 102.00 178.50 175.00 140.31
10 Home Guard and Civil Defance
Total (XI) General Services 11681.67 11310.23 96.82 4691.04
GRAND TOTAL 406400.00 370490.21 91.16 385514.33
Source :.1. Annual Plan Review 1998-99.
2.Annual Plan Review 1999-2000.
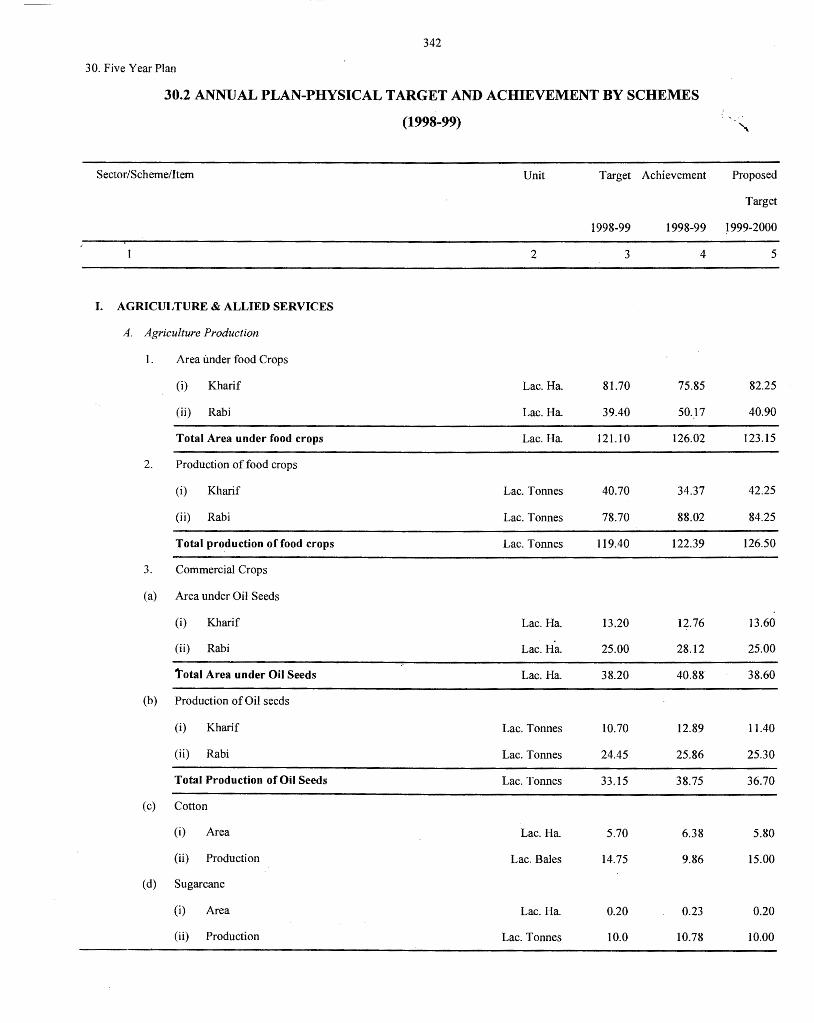
342
30. Five Year Plan
30.2 ANNUAL PLAN-PHYSICAL TARGET AND ACHIEVEMENT BY SCHEMES
(1998-99)
Sector/Scheme/Item Unit Target Achievement Proposed
Target
1998-99 1998-99 ~999-2000
2 3 4 5
I. AGRICULTURE & ALLIED SERVICES
A. Agriculture Production
I. Area under food Crops
(i) Kharif Lac. Ha. 81.70 75.85 82.25
(ii) Rabi Lac. Ha. 39.40 50._17 40.90
Total Area under food crops Lac. Ha. 121.l 0 126.02 123.15
2. Production of food crops
(i) Kharif Lac. Tonnes 40.70 34.37 42.25
(ii) Rabi Lac. Tonnes 78.70 88.02 84.25
Total production of food crops Lac. Tonnes 119.40 122.39 126.50
3. Commercial Crops
(a) Area under Oil Seeds
(i) Kharif Lac. Ha. 13.20 12.76 13.60
(ii) Rabi Lac. Ha. 25.00 28.12 25.00
total Area under Oil Seeds Lac. Ha. 38.20 40.88 38.60
(b) Production of Oil seeds
(i) Kharif Lac. Tonnes 10.70 12.89 I 1 .40
(ii) Rabi Lac. Tonnes 24.45 25.86 25.30
Total Production of Oil Seeds Lac. Tonnes 33.15 38.75 36.70
(c) Cotton
(i) Area Lac. Ha. 5.70 6.38 5.80
(ii) Production Lac. Bales 14.75 9.86 15.00
(d) Sugarcane
(i) Area Lac. Ha. 0.20 0.23 0.20
(ii) Production Lac. Tonnes 10.0 10.78 10.00
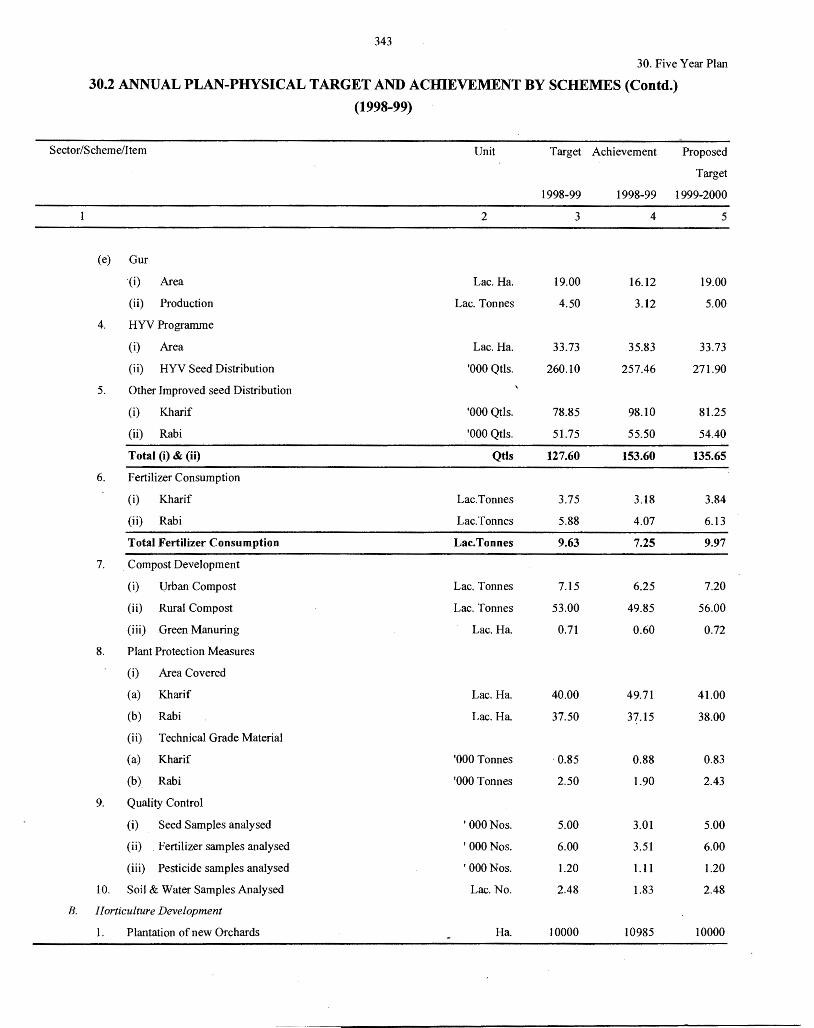
343
30. Five Year Plan
30.2 ANNUAL PLAN-PHYSICAL TARGET AND ACIDEVEMENT BY SCHEMES (Contd.)
(1998-99)
Sector/Scheme/Item Unit Target Achievement Proposed
Target
1998-99 1998-99 1999-2000
2 3 4 5
(e) Gur
·(i) Area Lac. Ha. 19.00 16.12 19.00
(ii) Production Lac. Tonnes 4.50 3.12 5.00
4. HYV Programme
(i) Area Lac. Ha. 33.73 35.83 33.73
(ii) HYV Seed Distribution '000 Qtls. 260.10 257.46 271.90
5. Other Improved seed Distribution
(i) Kharif '000 Qtls. 78.85 98.10 81.25
(ii) Rabi '000 Qtls. 51.75 55.50 54.40
Total (i) & (ii) Qtls 127.60 153.60 135.65
6. Fertilizer Consumption
(i) Kharif Lac.Tonnes 3.75 3.18 3.84
(ii) Rabi Lac.Tonnes 5.88 4.07 6.13
Total Fertilizer Consumption Lac.Tonnes 9.63 7.25 9.97
7. Compost Development
(i) Urban Compost Lac. Tonnes 7.15 6.25 7.20
(ii) Rural Compost Lac. Tonnes 53.00 49.85 56.00
(iii) Green Manuring Lac. Ha. 0.71 0.60 0.72
8. Plant Protection Measures
(i) Area Covered
(a) Kharif Lac. Ha. 40.00 49.71 41.00
(b) Rabi Lac. Ha. 37.50 37.15 38.00
(ii) Technical Grade Material
(a) Kharif '000 Tonnes . 0.85 0.88 0.83
(b) Rabi '000 Tonnes 2.50 1.90 2.43
9. Quality Control
(i) Seed Samples analysed 'OOONos. 5.00 3.01 5.00
(ii) Fertilizer samples analysed 'OOONos. 6.00 3.51 6.00
(iii) Pesticide samples analysed 'OOONos. 1.20 1.11 1.20
10. Soil & Water Samples Analysed Lac. No. 2.48 1.83 2.48
B. Horticulture Development
1. Plantation of new Orchards Ha. 10000 10985 10000
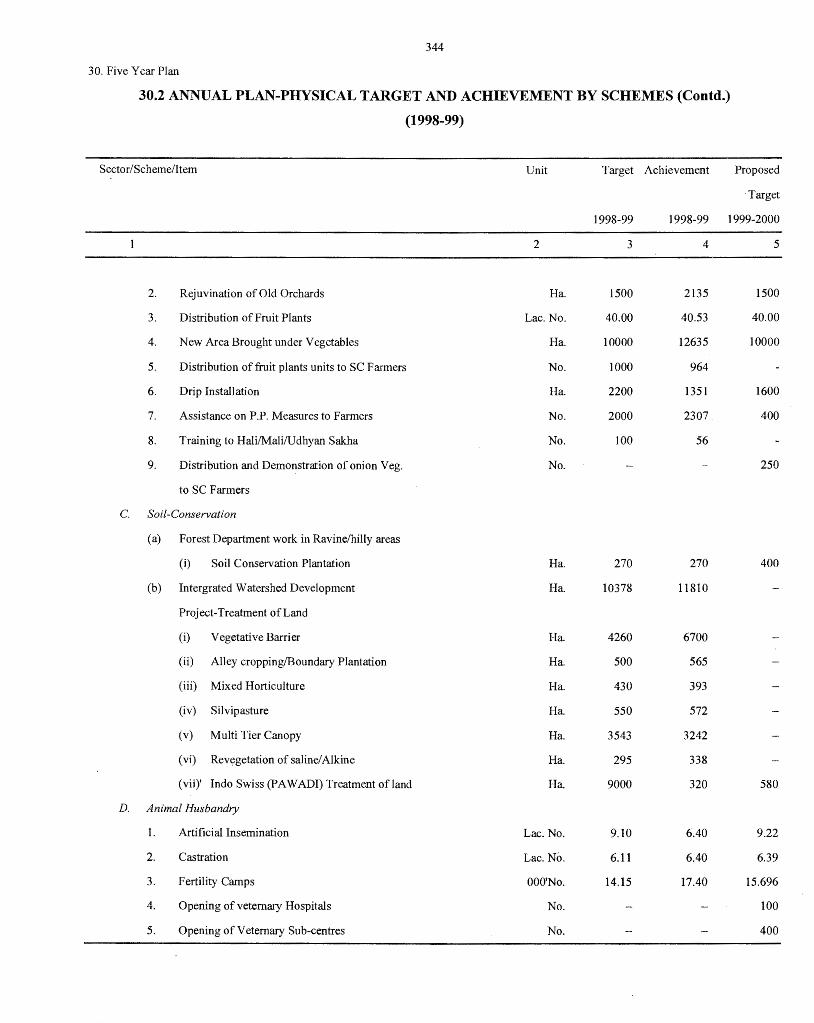
344
30. Five Year Plan
30.2 ANNUAL PLAN-PHYSICAL TARGET AND ACHIEVEMENT BY SCHEMES (Contd.)
(1998-99)
Sector/Scheme/Item Unit Target Achievement Proposed
·Target
1998-99 1998-99 1999-2000
2. Rejuvination of Old Orchards
3. Distribution of Fruit Plants
4. New Area Brought under Vegetables
5. Distribution of fruit plants units to SC Farmers
6. Drip Installation
7. Assistance on P.P. Measures to Farmers
8. Training to Hali/Mali/Udhyan Sakha
9. Distribution and Demonstration of onion Veg.
to SC Farmers
C. Soil-Conservation
(a) Forest Department work in Ravine/hilly areas
(i) Soil Conservation Plantation
(b) Intergrated Watershed Development
Project-Treatment of Land
(i) Vegetative Barrier
(ii) Alley cropping/Boundary Plantation
(iii) Mixed Horticulture
(iv) Silvipasture
(v) Multi Tier Canopy
(vi) Revegetation of saline/ Alkine
(vii)' Indo Swiss (PAWADI) Treatment of land
D. Animal Husbandry
1.
2.
3.
4.
5.
Artificial Insemination
Castration
Fertility Camps
Opening of veternary Hospitals
Opening of V eternary Sub-centres
2
Ha.
Lac. No.
Ha.
No.
Ha.
No.
No.
No.
Ha.
Ha.
Ha.
Ha.
Ha.
Ha.
Ha.
Ha.
Ha.
Lac. No.
Lac. No.
OOO'No.
No.
No.
3
1500
40.00
10000
1000
2200
2000
100
270
10378
4260
500
430
550
3543
295
9000
9.10
6.11
14.15
4
2135
40.53
12635
964
1351
2307
56
270
11810
6700
565
393
572
3242
338
320
6.40
6.40
17.40
5
1500
40.00
10000
1600
400
250
400
580
9.22
6.39
15.696
100
400
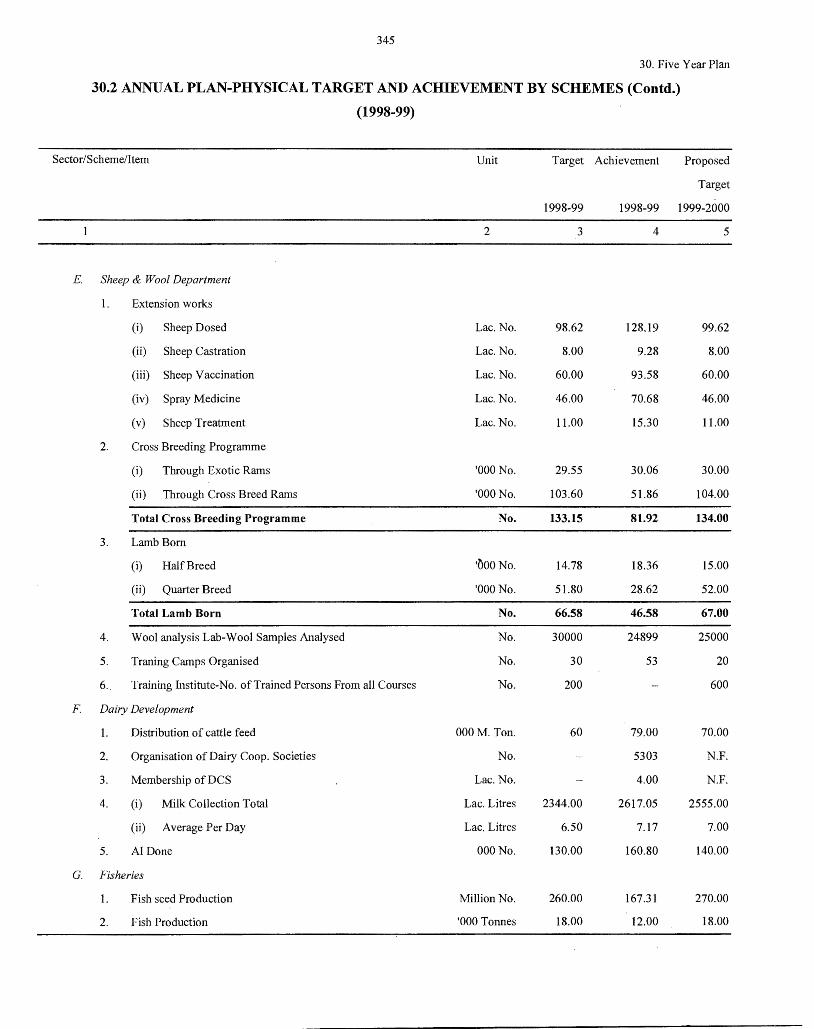
345
30. Five Year Plan
30.2 ANNUAL PLAN-PHYSICAL TARGET AND ACHIEVEMENT BY SCHEMES (Contd.)
(1998-99)
Sector/Scheme/Item Unit Target Achievement Proposed
Target
1998-99 1998-99 1999-2000
2 3 4 5
E. Sheep & Wool Department
I. Extension works
(i) Sheep Dosed Lac. No. 98.62 128.19 99.62
(ii) Sheep Castration Lac. No. 8.00 9.28 8.00
(iii) Sheep Vaccination Lac. No. 60.00 93.58 60.00
(iv) Spray Medicine Lac. No. 46.00 70.68 46.00
(v) Sheep Treatment Lac. No. 11.00 15.30 11.00
2. Cross Breeding Programme
(i) Through Exotic Rams '000 No. 29.55 30.06 30.00
(ii) Through Cross Breed Rams '000 No. 103.60 51.86 104.00
Total Cross Breeding Programme No. 133.15 81.92 134.00
3. Lamb Born
(i) Half Breed ·~oo No. 14.78 18.36 15.00
(ii) Quarter Breed '000 No. 51.80 28.62 52.00
Total Lamb Born No. 66.58 46.58 67.00
4. Wool analysis Lab-Wool Samples Analysed No. 30000 24899 25000
5. Traning Camps Organised No. 30 53 20
6 .. Training Institute-No. of Trained Persons From all Courses No. 200 600
F. Dairy Development
I. Distribution of cattle feed 000 M. Ton. 60 79.00 70.00
2. Organisation of Dairy Coop. Societies No. 5303 N.F.
3. Membership of DCS Lac. No. 4.00 N.F.
4. (i) Milk Collection Total Lac. Litres 2344.00 2617.05 2555.00
(ii) Average Per Day Lac. Litres 6.50 7.17 7.00
5. AI Done 000 No. 130.00 160.80 140.00
G. Fisheries
I. Fish seed Production Million No. 260.00 167.31 270.00
2. Fish Production '000 Tonnes 18.00 12.00 18.00
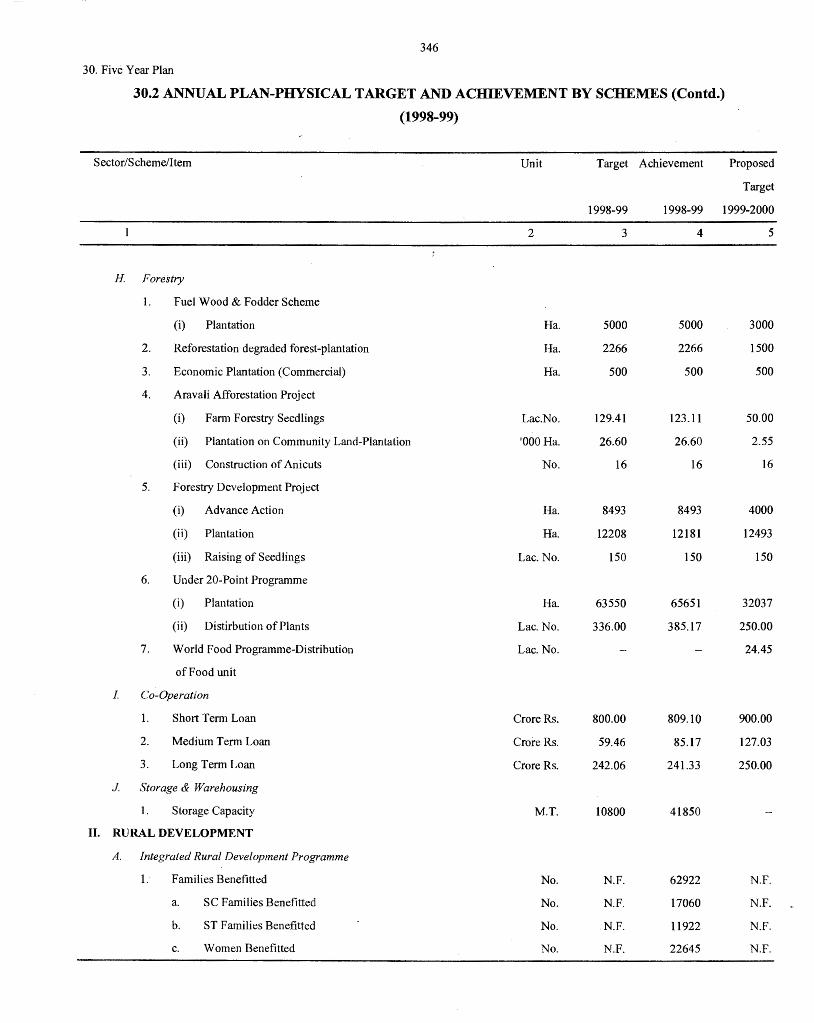
346
30. Five Year Plan
30.2 ANNUAL PLAN-PHYSICAL TARGET AND ACHIEVEMENT BY SCHEMES (Contd.)
(1998-99)
Sector/Scheme/Item Unit Target Achievement Proposed
Target
1998-99 1998-99 1999-2000
2 3 4 5
H Forestry
1. Fuel Wood & Fodder Scheme
(i) Plantation Ha. 5000 5000 3000
2. Reforestation degraded forest-plantation Ha. 2266 2266 1500
3. Economic Plantation (Commercial) Ha. 500 500 500
4. Aravali Afforestation Project
(i) Farm Forestry Seedlings Lac.No. 129.41 123.11 50.00
(ii) Plantation on Community Land-Plantation '000 Ha. 26.60 26.60 2.55
(iii) Construction of Anicuts No. 16 16 16
5. Forestry Development Project
(i) Advance Action Ha. 8493 8493 4000
(ii) Plantation Ha. 12208 12181 12493
(iii) Raising of Seedlings Lac. No. 150 150 150
6. Under 20-Point Programme
(i) Plantation Ha. 63550 65651 32037
(ii) Distirbution of Plants Lac. No. 336.00 385.17 250.00
7. World Food Programme-Distribution Lac. No. 24.45
of Food unit
I. Co-Operation
1. Short Term Loan Crore Rs. 800.00 809.10 900.00
2. Medium Term Loan Crore Rs. 59.46 85.17 127.03
3. Long Term Loan Crore Rs. 242.06 241.33 250.00
J Storage & Warehousing
1. Storage Capacity M.T. 10800 41850
II. RURAL DEVELOPMENT
A. Integrated Rural Development Programme
1. Families Benefitted No. N.F. 62922 N.F.
a. SC Families Benefitted No. N.F. 17060 N.F.
b. ST Families Benefitted No. N.F. l 1922 N.F.
c. Women Benefitted No. N.F. 22645 N.F.
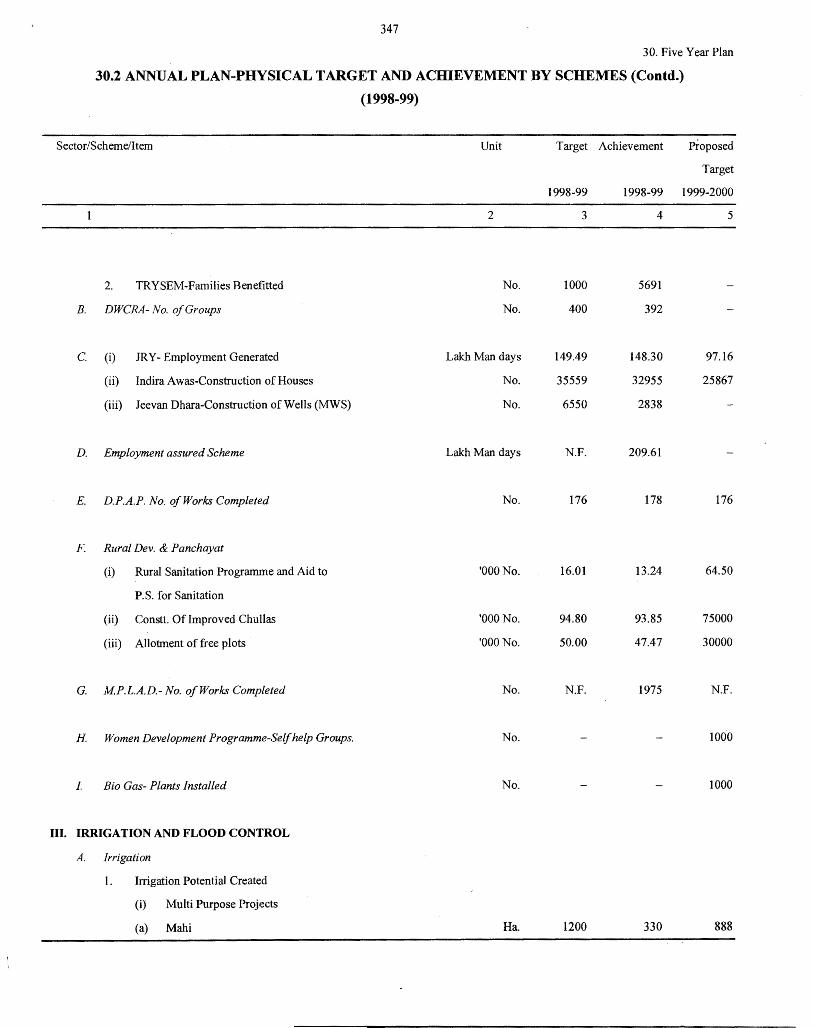
347
30. Five Year Plan
30.2 ANNUAL PLAN-PHYSICAL TARGET AND ACHIEVEMENT BY SCHEMES (Contd.)
(1998-99)
Sector/Scheme/Item Unit Target Achievement Proposed
Target
1998-99 1998-99 1999-2000
2 3 4 5
2. TRYSEM-Families Benefitted No. 1000 5691
B. DWCRA- No. of Groups No. 400 392
c. (i) JRY- Employment Generated Lakh Man days 149.49 148.30 97.16
(ii) Indira Awas-Construction of Houses No. 35559 32955 25867
(iii) Jeevan Dhara-Construction of Wells (MWS) No. 6550 2838
D. Employment assured Scheme Lakh Man days N.F. 209.61
E. D.P.A.P. No. of Works Completed No. 176 178 176
F. Rural Dev. & Panchayat
(i) Rural Sanitation Programme and Aid to 'OOONo. 16.01 13.24 64.50
P.S. for Sanitation
(ii) Constt. Of Improved Chullas 'OOONo. 94.80 93.85 75000
(iii) Allotment of free plots 'OOONo. 50.00 47.47 30000
G. MP.L.A.D.-No. of Works Completed No. N.F. 1975 N.F.
H. Women Development Programme-Self help Groups. No. 1000
I. Bio Gas- Plants Installed No. 1000
Ill. IRRIGATION AND FLOOD CONTROL
A. Irrigation
1. Irrigation Potential Created
(i) Multi Purpose Projects
(a) Mahi Ha 1200 330 888
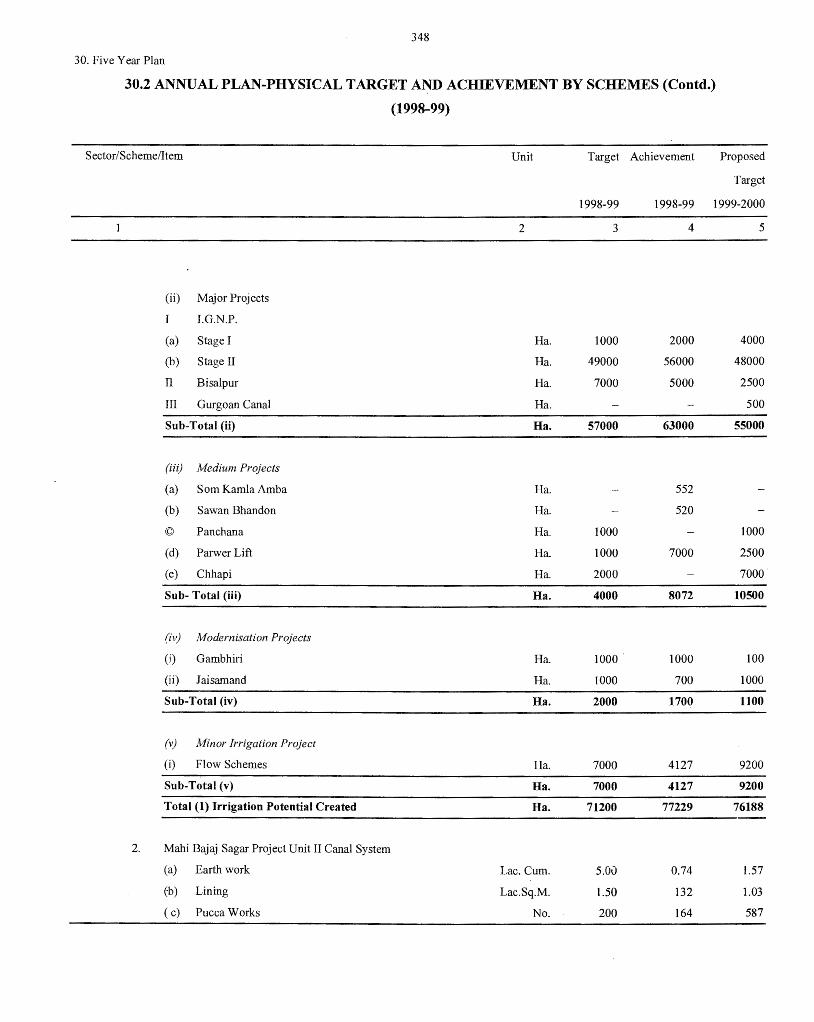
348
30. Five Year Plan
30.2 ANNUAL PLAN-PHYSICAL TARGET AND ACHIEVEMENT BY SCHEMES (Contd.)
(1998-99)
Sector/Scheme/Item Unit Target Achievement Proposed
Target
1998-99 1998-99 1999-2000
2 3 4 5
(ii) Major Projects
I.G.N.P.
(a) Stage I Ha. 1000 2000 4000
(b) Stage II Ha. 49000 56000 48000
II Bisalpur Ha. 7000 5000 2500
III Gurgoan Canal Ha. 500
Sub-Total (ii) Ha. 57000 63000 55000
(iii) Medium Projects
(a) Som Karnla Aruba Ha. 552
(b) Sawan Bhandon Ha. 520
© Panchana Ha. 1000 1000
(d) ParwerLift Ha. 1000 7000 2500
(e) Chhapi Ha. 2000 7000
Sub- Total (iii) Ha. 4000 8072 10500
(iv) Modernisation Projects
(i) Garnbhiri Ha. 1000 1000 100
(ii) Jaisarnand Ha. 1000 700 1000
Sub-Total (iv) Ha. 2000 1700 1100
(v) Minor Irrigation Project
(i) Flow Schemes Ha. 7000 4127 9200
Sub-Total (v) Ha. 7000 4127 9200
Total (1) Irrigation Potential Created Ha. 71200 77229 76188
2. Mahi Bajaj Sagar Project Unit II Canal System
(a) Earth work Lac. Cum. 5.00 0.74 1.57
(b) Lining Lac.Sq.M. 1.50 132 1.03
( c) Pucca Works No. 200 164 587
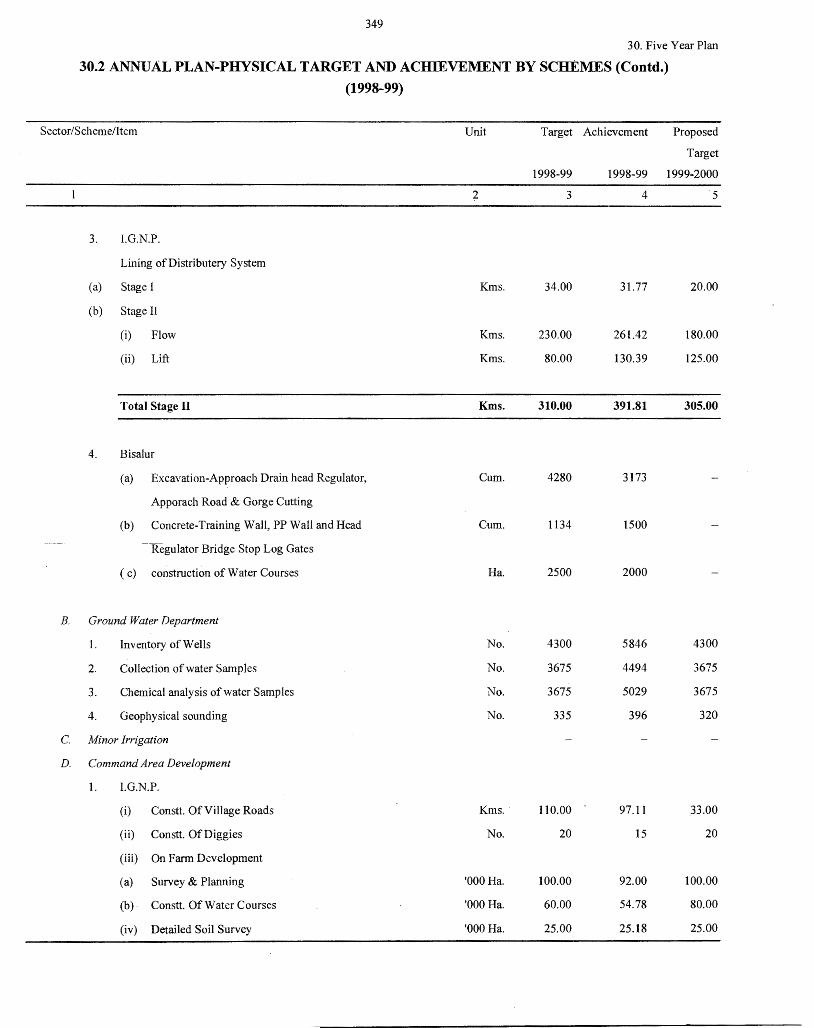
349
30. Five Year Plan
30.2 ANNUAL PLAN-PHYSICAL TARGET AND ACHIEVEMENT BY SCHEMES (Contd.)
(1998-99)
Sector/Scheme/Item Unit Target Achievement Proposed
Target
B.
c. D.
3. I.G.N.P.
Lining of Distributery System
(a) Stage I
(b) Stage II
(i) Flow
(ii) Lift
Total Stage II
4. Bisalur
(a) Excavation-Approach Drain head Regulator,
Apporach Road & Gorge Cutting
(b) Concrete-Training Wall, PP Wall and Head
-Regulator Bridge Stop Log Gates
( c) construction of Water Courses
Ground Water Department
1. Inventory of Wells
2. Collection of water Samples
3. Chemical analysis of water Samples
4. Geophysical sounding
Minor Irrigation
Command Area Development
I. I.G.N.P.
(i) Constt. Of Village Roads
(ii) Constt. Of Diggies
(iii) On Farm Development
(a) Survey & Planning
(b) Constt. Of Wat er Courses
(iv) Detailed Soil Survey
2
Kms.
Kms.
Kms.
Kms.
Cum.
Cum.
Ha.
No.
No.
No.
No.
Kms.
No.
'000 Ha.
'000 Ha.
'000 Ha.
1998-99
3
34.00
230.00
80.00
310.00
4280
1134
2500
4300
3675
3675
335
110.00
20
100.00
60.00
25.00
1998-99 1999-2000
4
31.77
261.42
130.39
391.81
3173
1500
2000
5846
4494
5029
396
97.11
15
92.00
54.78
25.18
5
20.00
180.00
125.00
305.00
4300
3675
3675
320
33.00
20
100.00
80.00
25.00
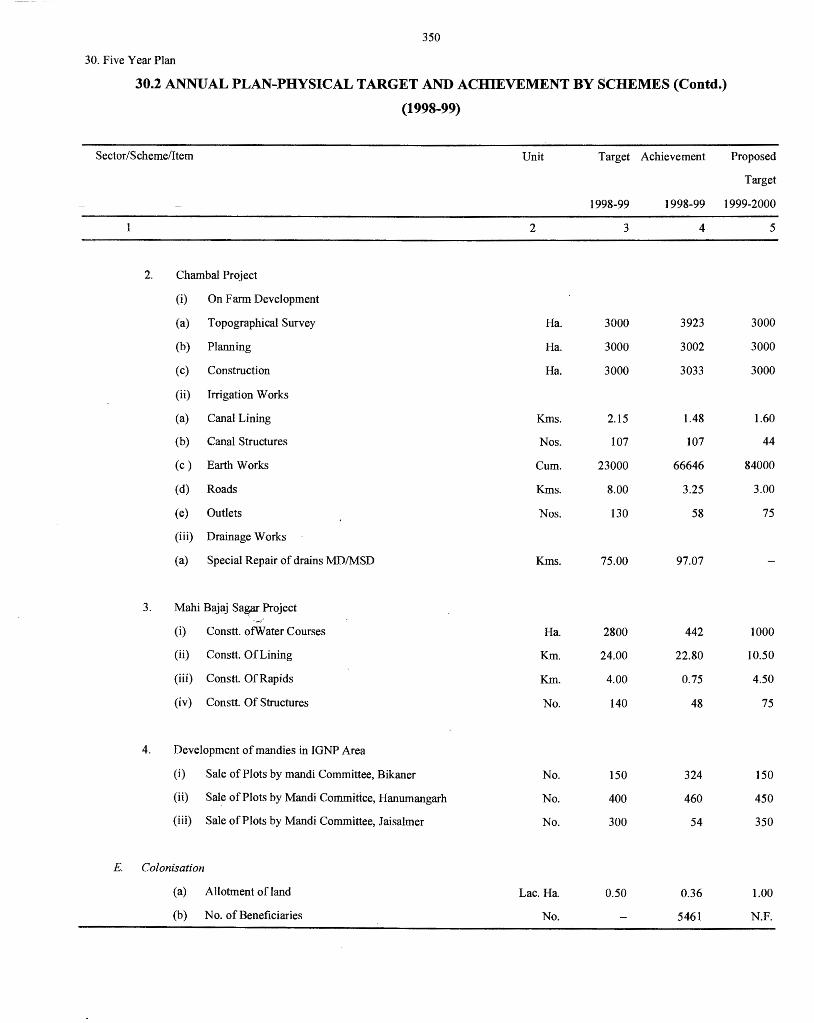
350
30. Five Year Plan
30.2 ANNUAL PLAN-PHYSICAL TARGET AND ACHIEVEMENT BY SCHEMES (Contd.)
(1998-99)
Sector/Scheme/Item Unit Target Achievement Proposed
Target
1998-99 1998-99 1999-2000
2 3 4 5
2. Chambal Project
(i) On Farm Development
(a) Topographical Survey Ha. 3000 3923 3000
(b) Planning Ha. 3000 3002 3000
(c) Construction Ha. 3000 3033 3000
(ii) Irrigation Works
(a) Canal Lining Kms. 2.15 1.48 1.60
(b) Canal Structures Nos. 107 107 44
(c) Earth Works Cum. 23000 66646 84000
(d) Roads Kms. 8.00 3.25 3.00
(e) Outlets Nos. 130 58 75
(iii) Drainage Works
(a) Special Repair of drains MD/MSD Kms. 75.00 97.07
3. Mahi Bajaj Sagar Project
(i) Constt. otwater Courses Ha. 2800 442 1000
(ii) Constt. Of Lining Km. 24.00 22.80 10.50
(iii) Constt. Of Rapids Km. 4.00 0.75 4.50
(iv) Constt. Of Structures No. 140 48 75
4. Development of man dies in IGNP Area
(i) Sale of Plots by mandi Committee, Bikaner No. 150 324 150
(ii) Sale of Plots by Mandi Committee, Hanumangarh No. 400 460 450
(iii) Sale of Plots by Mandi Committee, Jaisalmer No. 300 54 350
E. Colonisation
(a) Allotment of land Lac. Ha. 0.50 0.36 1.00
(b) No. of Beneficiaries No. 5461 N.F.
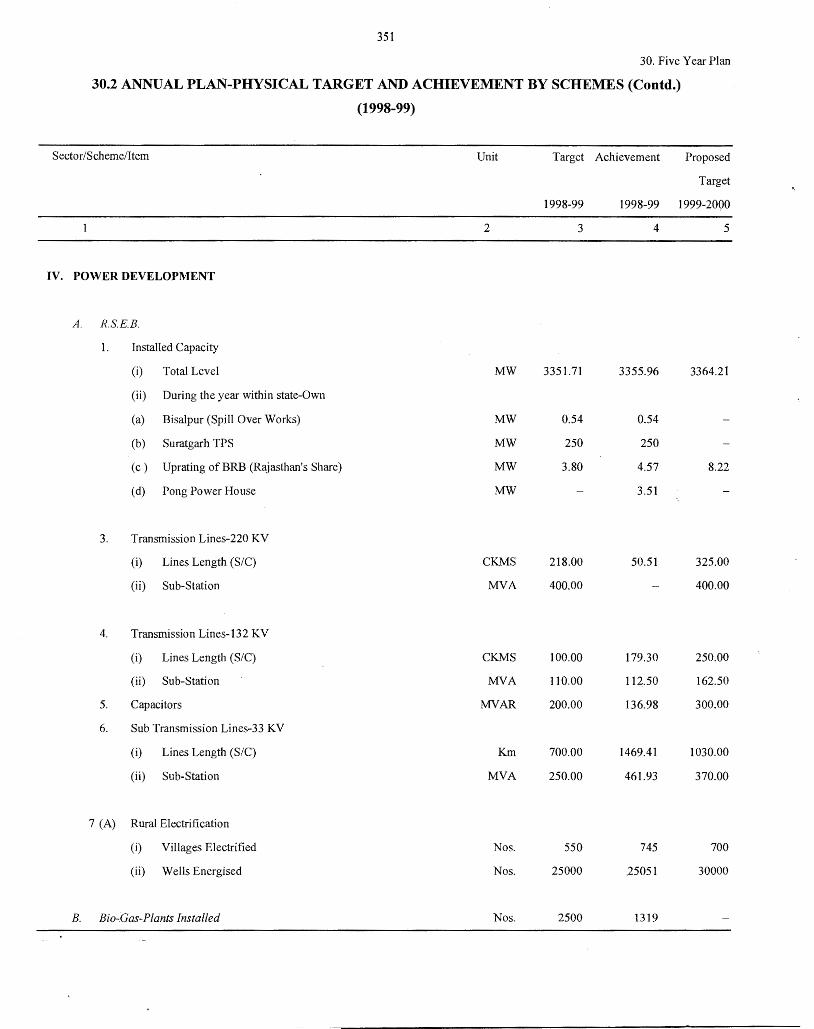
351
30. Five Year Plan
30.2 ANNUAL PLAN-PHYSICAL TARGET AND ACHIEVEMENT BY SCHEMES (Contd.)
(1998-99)
Sector/Scheme/Item Unit Target Achievement Proposed
Target
1998-99 1998-99 1999-2000
2 3 4 5
IV. POWER DEVELOPMENT
A. R.S.E.B.
1. Installed Capacity
(i) Total Level MW 3351.71 3355.96 3364.21
(ii) During the year within state-Own
(a) Bisalpur (Spill Over Works) MW 0.54 0.54
(b) Suratgarh TPS MW 250 250
(c) Uprating of BRB (Rajasthan's Share) MW 3.80 4.57 8.22
(d) Pong Power House MW 3.51
3. Transmission Lines-220 KV
(i) Lines Length (S/C) CKMS 218.00 50.51 325.00
(ii) Sub-Station MVA 400.00 400.00
4. Transmission Lines-132 KV
(i) Lines Length (S/C) CKMS 100.00 179.30 250.00
(ii) Sub-Station MVA 110.00 112.50 162.50
5. Capacitors MVAR 200.00 136.98 300.00
6. Sub Transmission Lines-33 KV
(i) Lines Length (S/C) Km 700.00 1469.41 1030.00
(ii) Sub-Station MVA 250.00 461.93 370.00
7 (A) Rural Electrification
(i) Villages Electrified Nos. 550 745 700
(ii) Wells Energised Nos. 25000 25051 30000
B. Bio-Das-Plants Installed Nos. 2500 1319
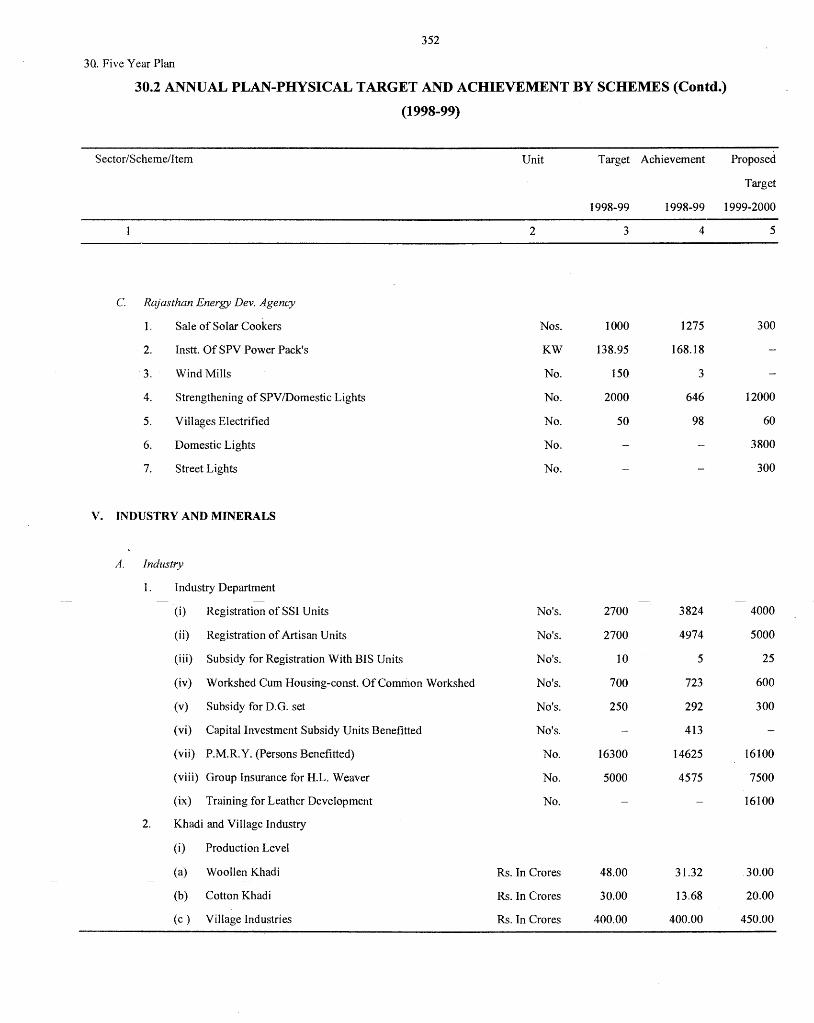
352
3Q. Five Year Plan
30.2 ANNUAL PLAN-PHYSICAL TARGET AND ACHIEVEMENT BY SCHEMES (Contd.)
(1998-99)
Sector/Scheme/Item Unit Target Achievement Proposed
Target
1998-99 1998-99 1999-2000
2 3 4 5
c. Rajasthan Energy Dev. Agency
1. Sale of Solar Cookers Nos. 1000 1275 300
2. Instt. Of SPV Power Pack's KW 138.95 168.18
3. Wind Mills No. 150 3
4. Strengthening of SPV /Domestic Lights No. 2000 646 12000
5. Villa~es Electrified No. 50 98 60
6. Domestic Lights No. 3800
7. Street Lights No. 300
v. INDUSTRY AND MINERALS
A. IndustJy
1. Industry Department
(i) Registration of SSI Units No's. 2700 3824 4000
(ii) Registration of Artisan Units No's. 2700 4974 5000
(iii) Subsidy for Registration With BIS Units No's. 10 5 25
(iv) Workshed Cum Housing-const. Of Common Workshed No's. 700 723 600
(v) Subsidy for D.G. set No's. 250 292 300
(vi) Capital Investment Subsidy Units Benefitted No's. 413
(vii) P.M.R.Y. (Persons Benefitted) No. 16300 14625 16100
(viii) Group Insurance for H.L. Weaver No. 5000 4575 7500
(ix) Training for Leather Development No. 16100
2. Khadi and Village Industry
(i) Production Level
(a) Woollen Khadi Rs. In Crores 48.00 31.32 30.00
(b) Cotton Khadi Rs. In Crores 30.00 13.68 20.00
(c) Village Industries Rs. In Crores 400.00 400.00 450.00
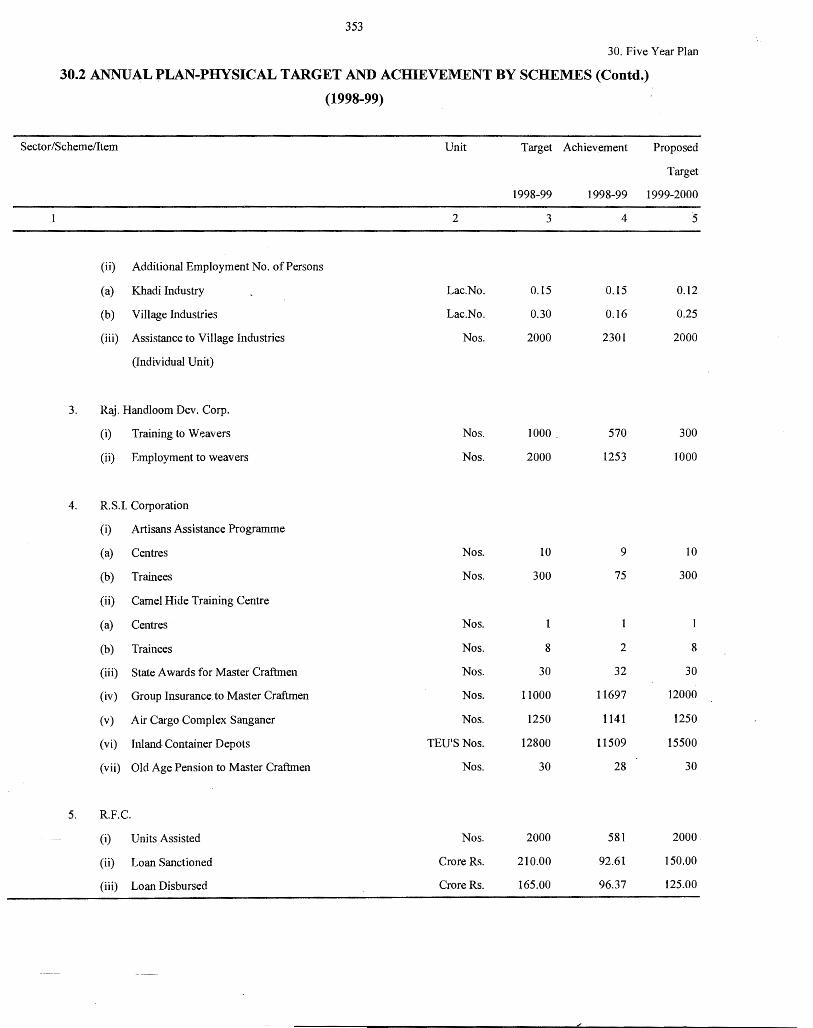
353
30. Five Year Plan
30.2 ANNUAL PLAN-PHYSICAL TARGET AND ACHIEVEMENT BY SCHEMES (Contd.)
(1998-99)
Sector /Scheme/Item Unit Target Achievement Proposed
Target
1998-99 1998-99 1999-2000
2 3 4 5
(ii) Additional Employment No. of Persons
(a) Khadi Industry Lac.No. 0.15 0.15 0.12
(b) Village Industries Lac.No. 0.30 0.16 0.25
(iii) Assistance to Village Industries Nos. 2000 2301 2000
(Individual Unit)
3. Raj. Handloom Dev. Corp.
(i) Training to W~avers Nos. 1000, 570 300
(ii) Employment to weavers Nos. 2000 1253 1000
4. R.S.I. Corporation
(i) Artisans Assistance Programme
(a) Centres Nos. 10 9 10
(b) Trainees Nos. 300 75 300
(ii) Camel Hide Training Centre
(a) Centres Nos.
(b) Trainees Nos. 8 2 8
(iii) State Awards for Master Craftmen Nos. 30 32 30
(iv) Group Insurance. to Master Craftmen Nos. 11000 11697 12000
(v) Air Cargo Complex Sanganer Nos. 1250 1141 1250
(vi) Inland Container Depots TEU'S Nos. 12800 11509 15500
(vii) Old Age Pension to Master Craftmen Nos. 30 28 30
5. R.F.C.
(i) Units-Assisted Nos. 2000 581 2000
(ii) Loan Sanctioned Crore Rs. 210.00 92.61 150.00
(iii) Loan Disbursed Crore Rs. 165.00 96.37 125.00
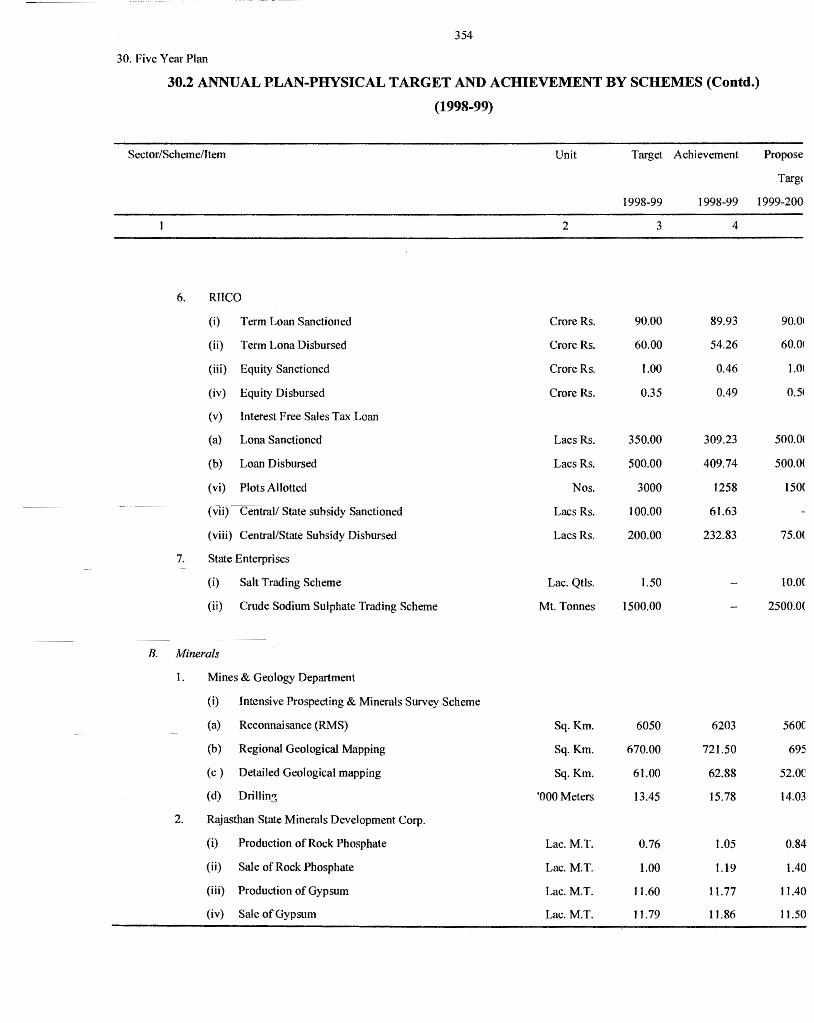
354
30. Five Year Plan
30.2 ANNUAL PLAN-PHYSICAL TARGET AND ACHIEVEMENT BY SCHEMES (Contd.)
(1998-99)
Sector/Scheme/I tern
6.
7.
RIICO
(i) Term Loan Sanctioned
(ii) Term Lona Disbursed
(iii) Equity Sanctioned
(iv) Equity Disbursed
(v) Interest Free Sales Tax Loan
(a) Lona Sanctioned
(b) Loan Disbursed
(vi) Plots Allotted
( v1i) Central/ State subsidy Sanctioned
(viii) Central/State Subsidy Disbursed
State Enterprises
(i) Salt Trading Scheme
(ii) Crude Sodium Sulphate Trading Scheme
B. Minerals
I. Mines & Geology Department
2.
(i) Intensive Prospecting & Minerals Survey Scheme
(a) Reconnaisance (RMS)
(b) Regional Geological Mapping
( c ) Detailed Geological mapping
(d) Drillin3
Rajasthan State Minerals Development Corp.
(i) Production of Rock Phosphate
(ii) Sale of Rock Phosphate
(iii) Production of Gypsum
(iv) Sale of Gypsum
Unit
2
Crore Rs.
Crore Rs.
Crore Rs.
Crore Rs.
Lacs Rs.
Lacs Rs.
Nos.
Lacs Rs.
Lacs Rs.
Lac. Qtls.
Mt. Tonnes
Sq.Km.
Sq.Km.
Sq.Km.
'000 Meters
Lac. M.T.
Lac. M.T.
Lac. M.T.
Lac. M.T.
Target Achievement
1998-99
3
90.00
60.00
1.00
0.35
350.00
500.00
3000
100.00
200.00
1.50
1500.00
6050
670.00
61.00
13.45
0.76
1.00
11.60
11.79
1998-99
4
89.93
54.26
0.46
0.49
309.23
409.74
1258
61.63
232.83
6203
721.50
62.88
15.78
1.05
1.19
11.77
11.86
Propose
Targ(
1999-200
90.0~
60.0t
i.rn
0.51
500.0(
500.0(
150(
75.0(
10.0(
2500.0(
560(
695
52.0C
14.03
0.84
1.40
ll.40
11.50
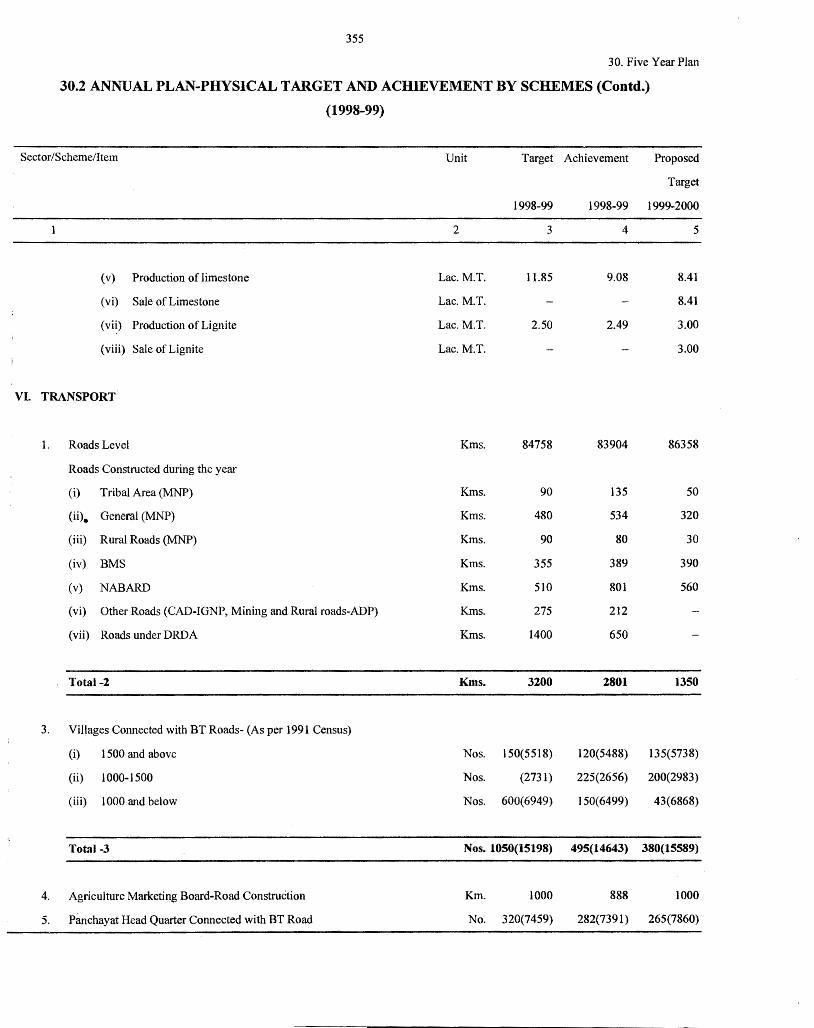
355
30. Five Year Plan
30.2 ANNUAL PLAN-PHYSICAL TARGET AND ACHIEVEMENT BY SCHEMES (Contd.)
(1998-99)
Sector/Scheme/Item Unit Target Achievement Proposed
Target
1998-99 1998-99 1999~2000
2 3 4 5
(v) Production of limestone Lac. M.T. 11.85 9.08 8.41
(vi) Sale of Limestone Lac. M.T. 8.41
(vi9 Production of Lignite Lac. M.T. 2.50 2.49 3.00
(viii) Sale of Lignite Lac. M.T. 3.00
VI. TRANSPORT
I. Roads Level Kms. 84758 83904 86358
Roads Constructed during the year
(i) Tribal Area (MNP) Kms. 90 135 50
(ii). General (MNP) Kms. 480 534 320
(iii) Rural Roads (MNP) Kms. 90 80 30
(iv) BMS Kms. 355 389 390
(v) NABARD Kms. 510 801 560
(vi) Other Roads (CAD-IGNP, Mining and Rural roads-ADP) Kms. 275 212
(vii) Roads under DRDA Kms. 1400 650
Total-2 Kms. 3200 2801 1350
3. Villages Connected with BT Roads- (As per 1991 Census)
(i) 1500 and above Nos. 150(5518) 120(5488) 135(5738)
(ii) 1000-1500 Nos. (2731) 225(2656) 200(2983)
(iii) 1000 and below Nos. 600(6949) 150(6499) 43(6868)
Total -3 Nos. 1050(15198) 495(14643) 380(15589)
4. Agriculture Marketing Board-Road Construction Km. 1000 888 1000
5. Panchayat Head Quarter Connected with BT Road No. 320(7459) 282(7391) 265(7860)
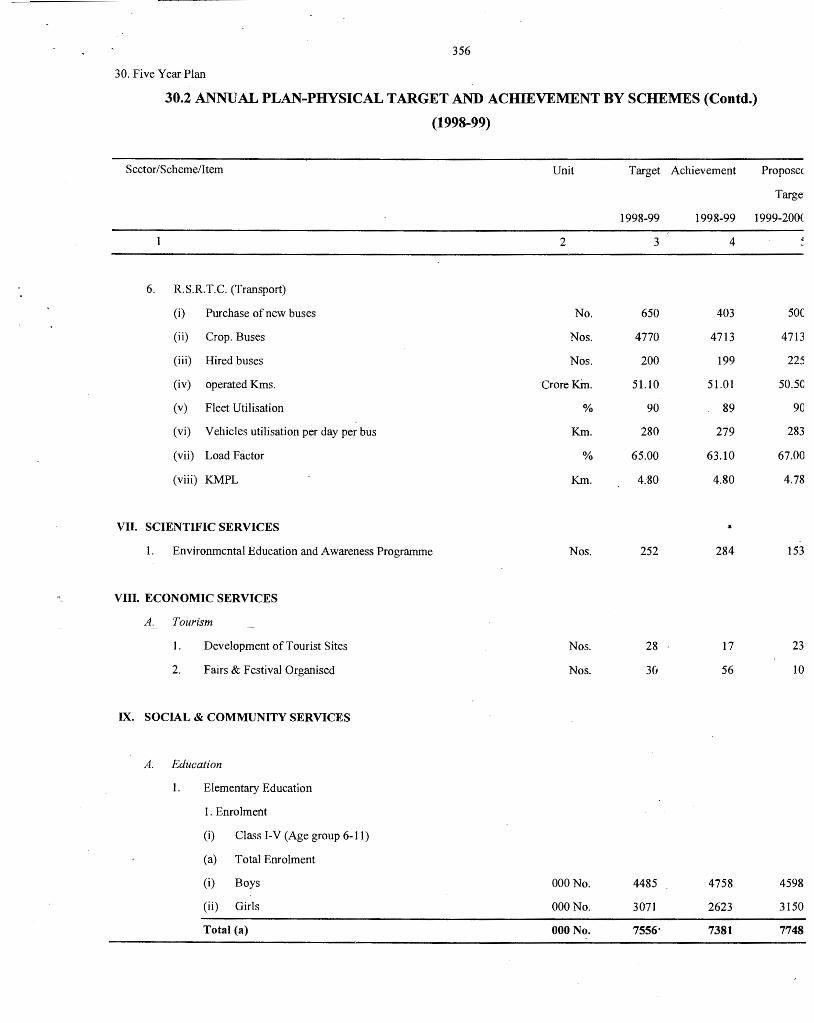
356
30. Five Year Plan
30.2 ANNUAL PLAN-PHYSICAL TARGET AND ACHIEVEMENT BY SCHEMES (Contd.)
(1998-99)
Sector/Scheme/Item
6. R.S.R.T.C. (Transport)
(i) Purchase of new buses
(ii) Crop. Buses
(iii) Hired buses
(iv) operated Kms.
(v) Fleet Utilisation
(vi) Vehicles utilisation per day per bus
(vii) Load Factor
(viii) KMPL
VII. SCIENTIFIC SERVICES
1. Environmental Education and Awareness Programme
VIII. ECONOMIC SERVICES
A. Tourism
1.
2.
Development of Tourist Sites
Fairs & Festival Organised
IX. SOCIAL & COMMUNITY SERVICES
A. Education
1. Elementary Education
1. Enrolment
(i) Class 1-V (Age group 6-11)
(a) Total Enrolment
(i) Boys
(ii) Girls
Total (a)
Unit
2
No.
Nos.
Nos.
Crore Kin.
%
Km.
%
Km.
Nos.
Nos.
Nos.
OOONo.
OOONo.
000 No.
Target Achievement Proposec
Targe
1998-99 1999-200( 1998-99
3
650
4770
200
51.10
90
280
65.00
4.80
252
28
30
4485
3071
7556•
4
403
4713
199
51.01
89
279
63.10
4.80
284
17
56
4758
2623
7381
50(
4713
225
50.5C
90
283
67.00
4.78
153
23
10
4598
3150
7748
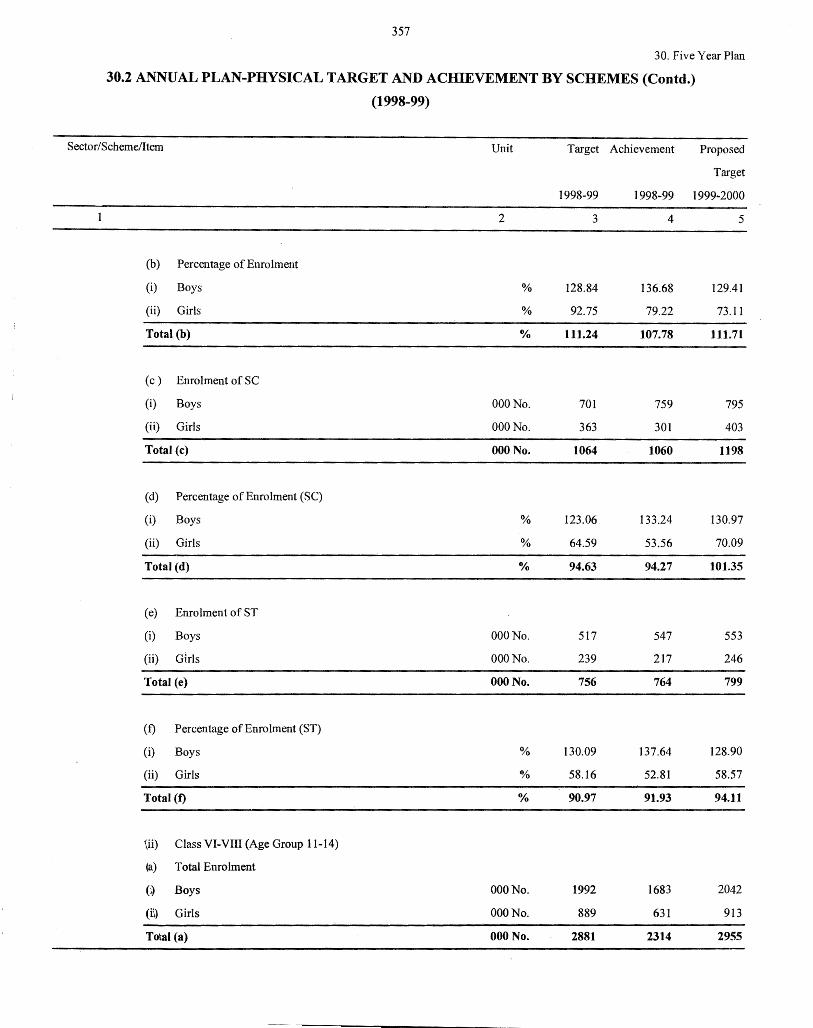
357
30. Five Year Plan
30.2 ANNUAL PLAN-PHYSICAL TARGET AND ACHIEVEMENT BY SCHEMES (Contd.)
(1998-99)
Sector/Scheme/Item Unit Target Achievement Proposed
Target
1998-99 1998-99 1999-2000
2 3 4 5
(b) Percentage of Enrolment
(i) Boys % 128.84 136.68 129.41
(ii) Girls % 92.75 79.22 73.11
Total (b) % 111.24 107.78 111.71
(c) Enrolment of SC
(i) Boys OOONo. 701 759 795
(ii) Girls OOONo. 363 301 403
Total (c) OOONo. 1064 1060 1198
(d) Percentage of Enrolment (SC)
(i) Boys % 123.06 133.24 130.97
(ii) Girls % 64.59 53.56 70.09
Total (d) % 94.63 94.27 101.35
(e) Enrolment of ST
(i) Boys OOONo. 517 547 553
(ii) Girls OOONo. 239 217 246
Total (e) 000 No. 756 764 799
(f) Percentage of Enrolment (ST)
(i) Boys % 130.09 137.64 128.90
(ii) Girls % 58.16 52.81 58.57
Total (t) % 90.97 91.93 94.11
\ii) Class VI-VIII (Age Group 11-14)
(a) Total Enrolment
(1) Boys OOONo. 1992 1683 2042
(i\) Girls OOONo. 889 631 913
Total (a) OOONo. 2881 2314 2955
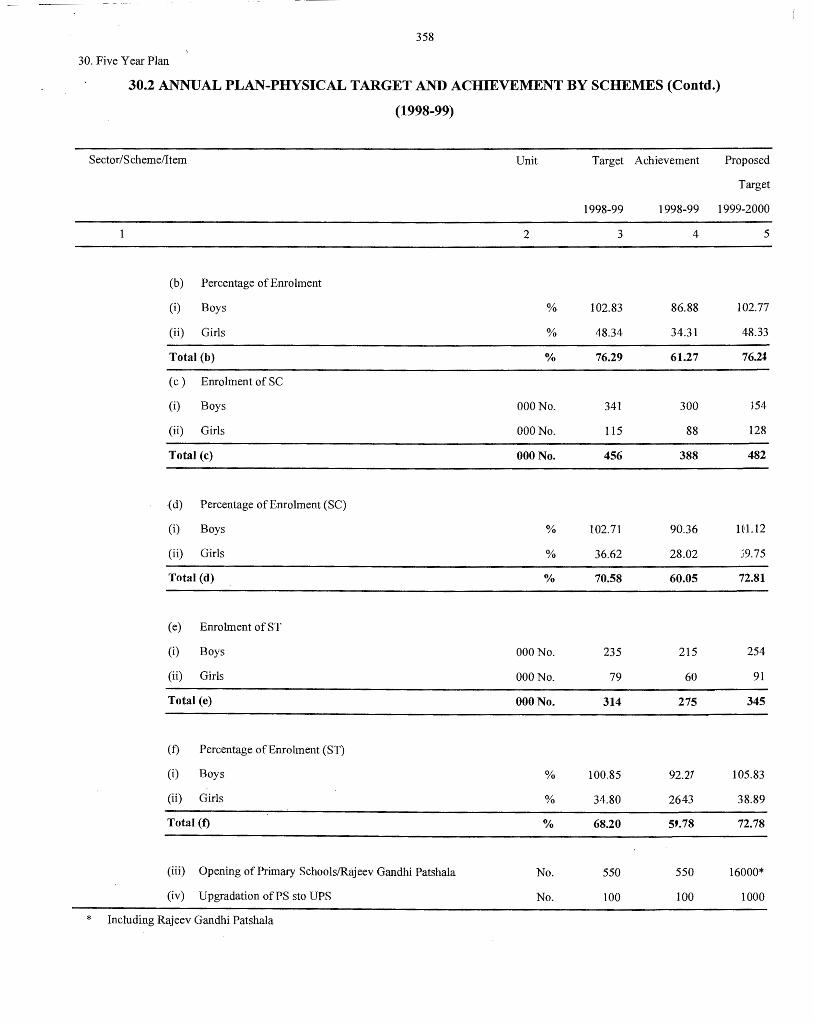
358
30. Five Year Plan
30.2 ANNUAL PLAN-PHYSICAL TARGET AND ACHIEVEMENT BY SCHEMES (Contd.)
(1998-99)
Sector/Scheme/Item Unit Target Achievement Proposed
Target
1998-99 1998-99 1999-2000
*
(b) Percentage of Enrolment
(i) Boys
(ii) Girls
Total (b)
( c ) Enrolment of SC
(i) Boys
(ii) Girls
Total (c)
-(d) Percentage of Enrolment (SC)
(i) Boys
(ii) Girls
Total (d)
( e) Enrolment of ST
(i) Boys
(ii) Girls
Total (e)
(f) Percentage of Enrolment (ST)
(i) Boys
(ii) Girls
Total (t)
(iii) Opening of Primary Schools/Rajeev Gandhi Patshala
(iv) Upgradation of PS sto UPS
Including Rajeev Gandhi Patshala
2
%
%
%
OOONo.
OOONo.
000 No.
%
%
O/o
000 No.
OOONo.
000 No.
%
%
O/o
No.
No.
3
102.83
48.34
76.29
341
115
456
102.71
36.62
70.58
235
79
314
100.85
34.80
68.20
550
100
4
86.88
34.31
61.27
300
88
388
90.36
28.02
60.05
215
60
275
92.27
2643
550
100
5
102.77
48.33
76.2.t
J54
128
482
Hl.12
)9.75
72.81
254
91
345
105.83
38.89
72.78
16000*
1000
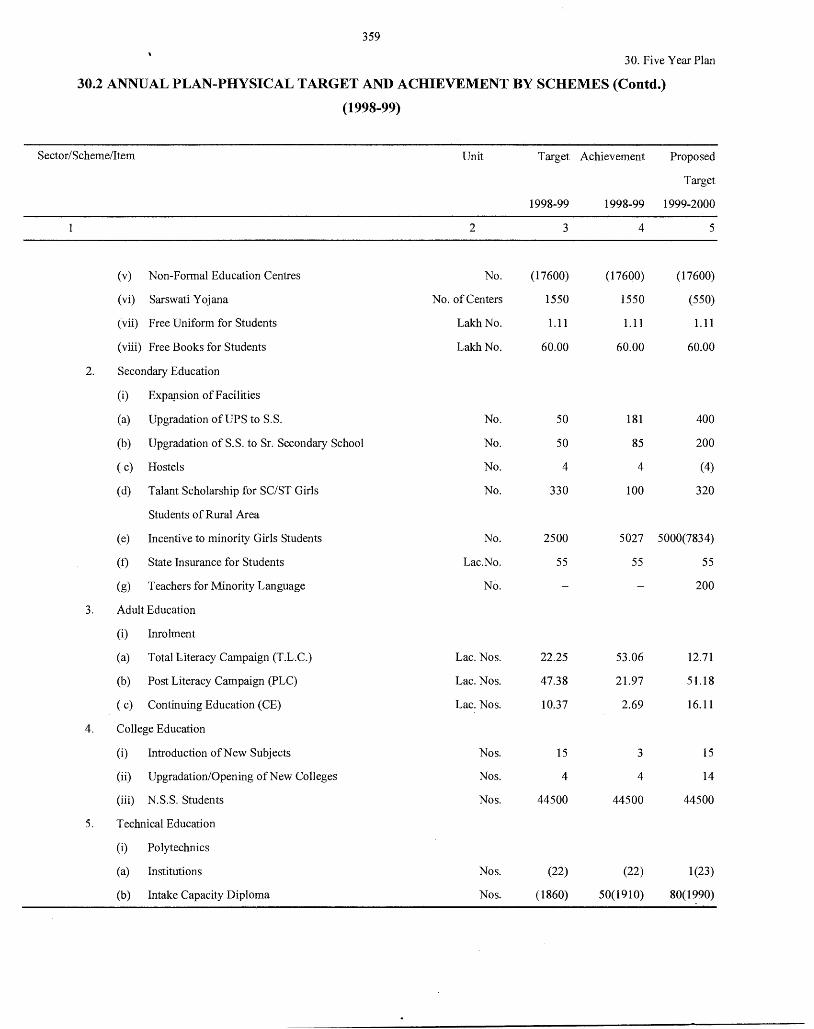
359
30. Five Year Plan
30.2 ANNUAL PLAN-PHYSICAL TARGET AND ACHIEVEMENT BY SCHEMES (Contd.)
(1998-99)
Sector/Scheme/Item Unit Target Achievement Proposed
Target
1998-99 1998-99 1999-2000
2 3 4 5
(v) Non-Formal Education Centres No. (17600) (17600) (17600)
(vi) Sarswati Yojana No. of Centers 1550 1550 (550)
(vii) Free Uniform for Students Lakh No. 1.11 1.11 1.11
(viii) Free Books for Students Lakh No. 60.00 60.00 60.00
2. Secondary Education
(i) Expaµsion of Facilities
(a) Upgradation of UPS to S.S. No. 50 181 400
(b) Upgradation of S.S. to Sr. Secondary School No. 50 85 200
( c) Hostels No. 4 4 (4)
(d) Talant Scholarship for SC/ST Girls No. 330 100 320
Students of Rural Area
(e) Incentive to minority Girls Students No. 2500 5027 5000(7834)
(f) State Insurance for Students Lac.No. 55 55 55
(g) Teachers for Minority Language No. 200
3. Adult Education
(i) Inrolment
(a) Total Literacy Campaign (T.L.C.) Lac. Nos. 22.25 53.06 12.71
(b) Post Literacy Campaign (PLC) Lac. Nos. 47.38 21.97 51.18
( c) Continuing Education (CE) Lac. Nos. 10.37 2.69 16.11
4. College Education
(i) Introduction ofNew Subjects Nos. 15 3 15
(ii) Upgradation/Opening of New Colleges Nos. 4 4 14
(iii) N.S.S. Students Nos. 44500 44500 44500
5. Technical Education
(i) Polytechnics
(a) Institutions Nos. (22) (22) 1(23)
(b) Intake Capacity Diploma Nos. (1860) 50(1910) 80(1990)
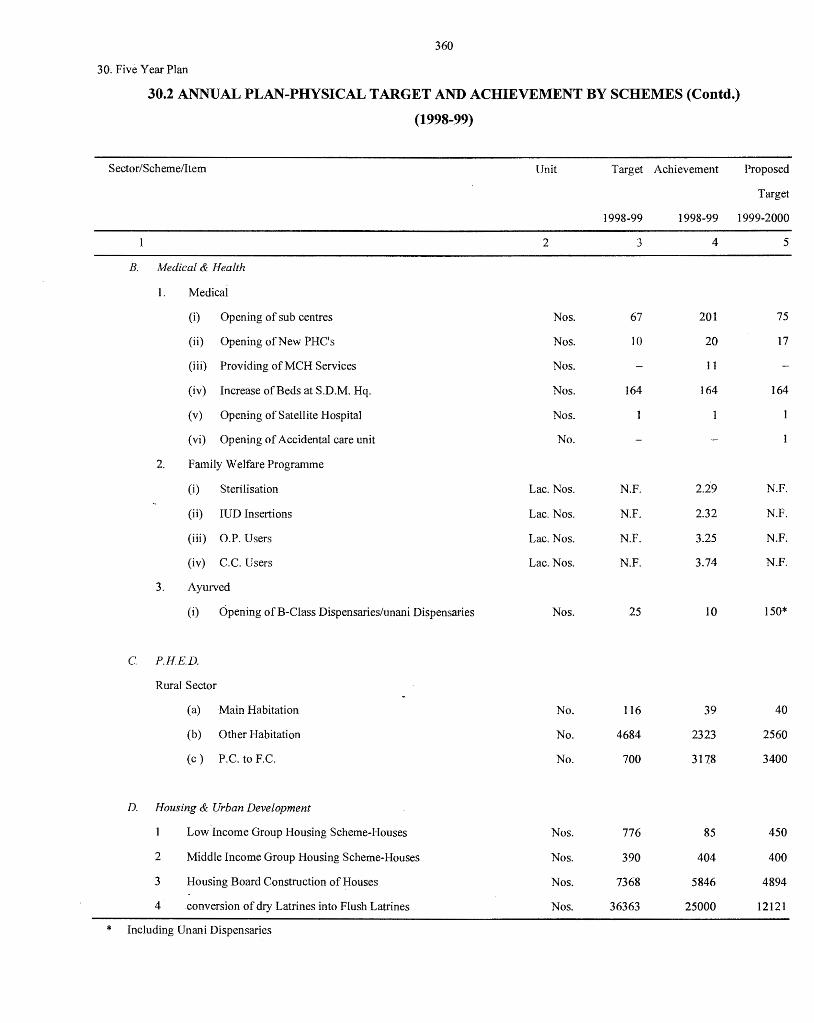
360
30. Five Year Plan
30.2 ANNUAL PLAN-PHYSICAL TARGET AND ACHIEVEMENT BY SCHEMES (Contd.)
(1998-99)
Sector/Scheme/Item Unit Target Achievement Proposed
Target
1998-99 1998-99 1999-2000
2 3 4 5
B. Medical & Health
1. Medical
(i) Opening of sub centres Nos. 67 201 75
(ii) Opening of New PH C's Nos. 10 20 17
(iii) Providing of MCH Services Nos. 11
(iv) Increase of Beds at S.D.M. Hq. Nos. 164 164 164
(v) Opening of Satellite Hospital ·Nos.
(vi) Opening of Accidental care unit No.
2. Family Welfare Programme
(i) Sterilisation Lac. Nos. N.F. 2.29 N.F.
(ii) IUD Insertions Lac. Nos. N.F. 2.32 N.F.
(iii) O.P. Users Lac. Nos. N.F. 3.25 N.F.
(iv) C.C. Users Lac. Nos. N.F. 3.74 N.F.
3. Ayurved
(i) Opening of B-Class Dispensaries/unani Dispensaries Nos. 25 10 150*
c. P.HE.D.
Rural Sector
(a) Main Habitation No. 116 39 40
(b) Other Habitation No. 4684 2323 2560
(c) P.C. to F.C. No. 700 317.8 3400
D. Housing & Urban Development
Low Income Group Housing Scheme-Houses Nos. 776 85 450
2 Middle Income Group Housing Scheme-Houses Nos. 390 404 400
3 Housing Board Construction of Houses Nos. 7368 5846 4894
4 conversion of dry Latrines into Flush Latrines Nos. 36363 25000 12121
* Including Unani Dispensaries
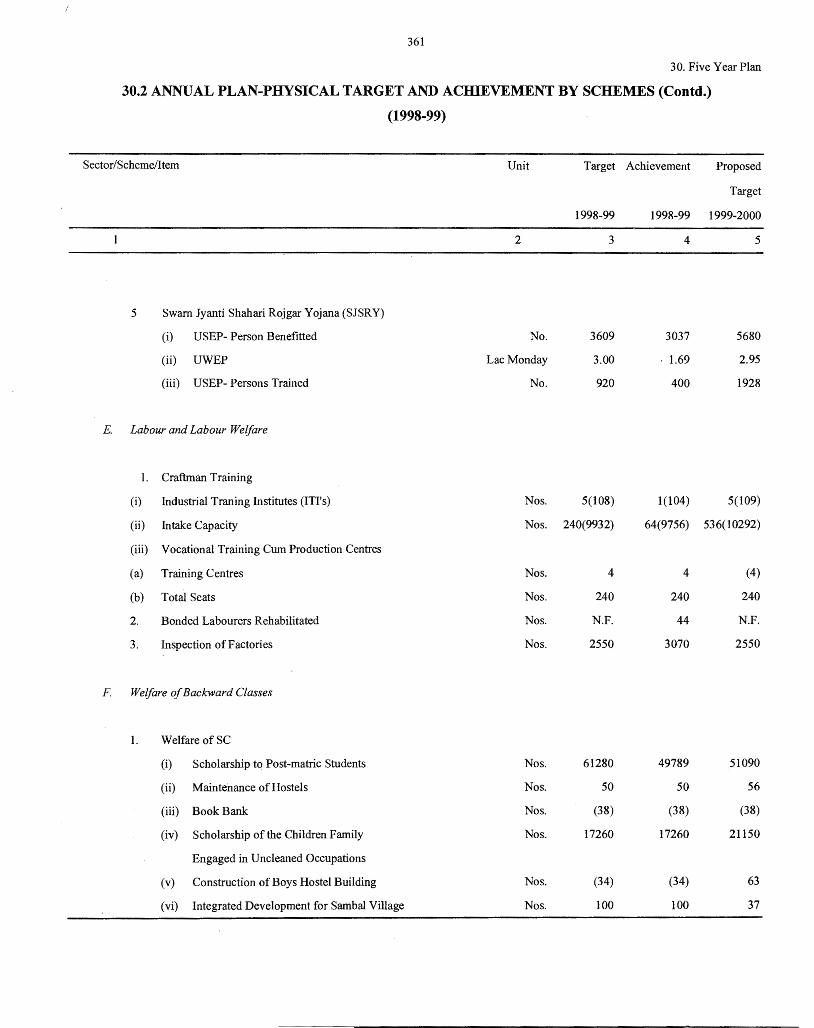
361
30. Five Year Plan
30.2 ANNUAL PLAN-PHYSICAL TARGET AND ACHIEVEMENT BY SCHEMES (Contd.)
(1998-99)
Sector/Scheme/Item Unit Target Achievement Proposed
Target
1998-99 1998-99 1999-2000
2 3 4 5
5 Swam Jyanti Shahari R~jgar Yojana (SJSRY)
(i) USEP- Person Benefitted No. 3609 3037 5680
(ii) UWEP Lac Monday 3.00 1.69 2.95
(iii) USEP- Persons Trained No. 920 400 1928
E. Labour and Labour Welfare
I. Craftman Training
(i) Industrial Traning Institutes (ITI's) Nos. 5(108) 1(104) 5(109)
(ii) Intake Capacity Nos. 240(9932) 64(9756) 536(10292)
(iii) Vocational Training Cum Production Centres
(a) Training Centres Nos. 4 4 (4)
(b) Total Seats Nos. 240 240 240
2. Bonded Labourers Rehabilitated Nos. N.F. 44 N.F.
3. Inspection of Factories Nos. 2550 3070 2550
F. Welfare of Backward Classes
1. Welfare of SC
(i) Scholarship to Post-matric Students Nos. 61280 49789 51090
(ii) Maintenance of Hostels Nos. 50 50 56
(iii) Book Bank Nos. (38) (38) (38)
(iv) Scholarship of the Children Family Nos. 17260 17260 21150
Engaged in Uncleaned Occupations
(v) Construction of Boys Hostel Building Nos. (34) (34) 63
(vi) Integrated Development for Sambal Village Nos. 100 100 37
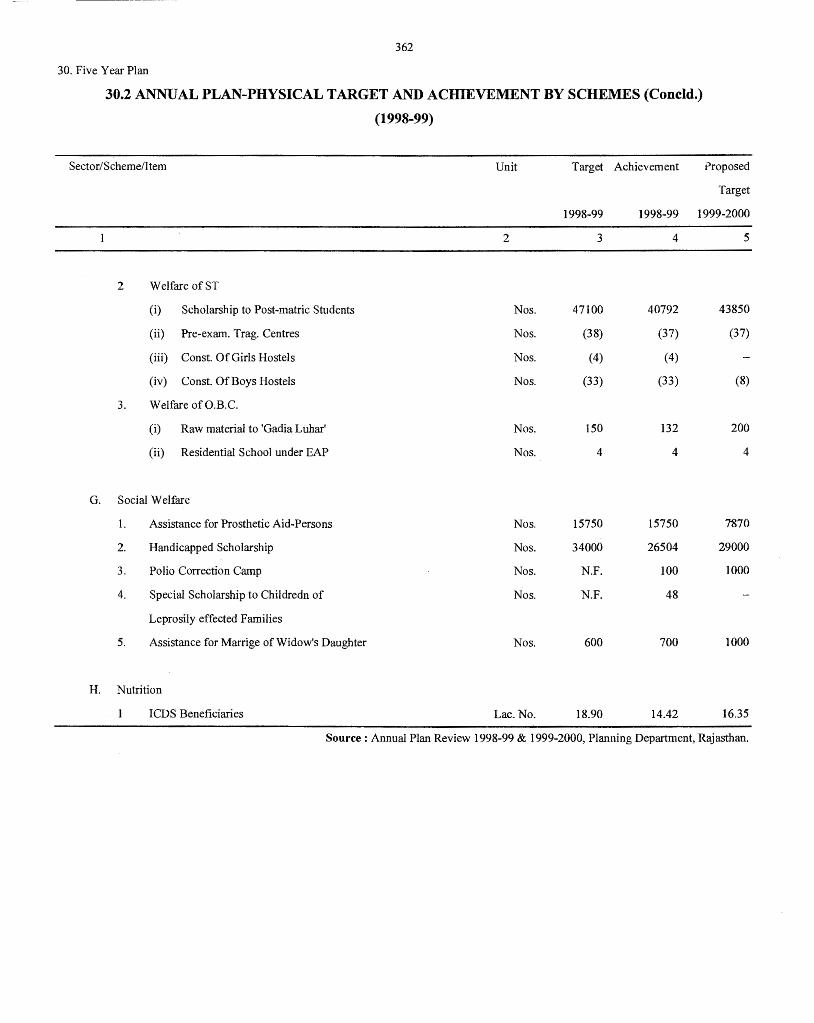
362
30. Five Year Plan
30.2 ANNUAL PLAN-PHYSICAL TARGET AND ACHIEVEMENT BY SCHEMES (Concld.)
(1998-99)
Sector/Scheme/Item Unit Target Achievement Proposed
Target
1998-99 1998-99 1999-2000
2 3 4 5
2 Welfare of ST
(i) Scholarship to Post-matric Students Nos. 47100 40792 43850
(ii) Pre-exam. Trag. Centres Nos. (38) (37) (37)
(iii) Const. Of Girls Hostels Nos. (4) (4)
(iv) Const. Of Boys Hostels Nos. (33) (33) (8)
3. Welfare of O.B.C.
(i) Raw material to 'Gadia LUhar' Nos. 150 132 200
(ii) Residential School under EAP Nos. 4 4 4
G. Social Welfare
1. Assistance for Prosthetic Aid-Persons Nos. 15750 15750 1870
2. Handicapped Scholarship Nos. 34000 26504 29000
3. Polio Correction Camp Nos. N.F. 100 1000
4. Special Scholarship to Childredn of Nos. N.F. 48
Leprosily effected Families
5. Assistance for Marrige of Widow's Daughter Nos. 600 700 1000
H. Nutrition
ICDS Beneficiaries Lac. No. 18.90 14.42 16.35
Source: Annual Plan Review 1998-99 & 1999-2000, Planning Department, Rajasthan.
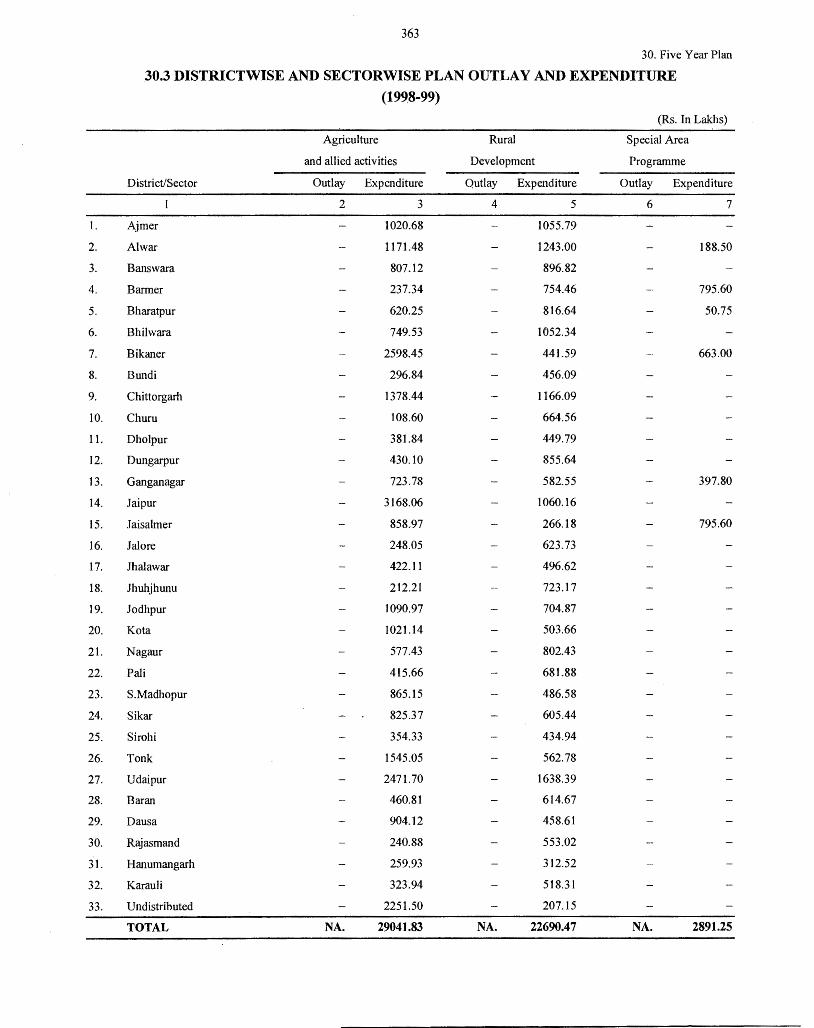
363
30. Five Year Plan
30.3 DISTRICTWISE AND SECTORWISE PLAN OUTLAY AND EXPENDITURE
(199,8-99)
(Rs. In Lakhs)
Agriculture Rural Special Area
and allied activities Development Programme
District/Sector Outlay Expenditure Outlay Expenditure Outlay Expenditure
2 3 4 5 6 7
1. Aimer 1020.68 1055.79
2. Al war 1171.48 1243.00 188.50
3. Banswara 807.12 896.82
4. Barmer 237.34 754.46 795.60
5. Bharatpur 620.25 816.64 50.75
6. Bhilwara 749.53 1652.34
7. Bikaner 2598.45 441.59 663.00
8. Bundi 296.84 456.09
9. Chittorgarh 1378.44 1166.09
10. Chum 108.60 664.56
11. Dholpur 381.84 449.79
12. Dungarpur 430.10 855.64
13. Ganganagar 723.78 582.55 397.80
14. Jaipur 3168.06 1060.16
15. Jaisalmer 858.97 266.18 795.60
16. Jalore 248.05 623.73
17. Jhalawar 422.11 496.62
18. Jhuhjhunu 212.21 723.17
19. Jodhpur 1090.97 704.87
20. Kota 1021.14 503.66
21. Nagaur 577.43 802.43
22. Pali 415.66 681.88
23. S.Madhopur 865.15 486.58
24. Sikar 825.37 605.44
25. Sirohi 354.33 434.94
26. Tonk 1545.05 562.78
27. Udaipur 2471.70 1638.39
28. Baran 460.81 614.67
29. Dausa 904.12 458.61
30. Rajasmand 240.88 553.02
31. Hanumangarh 259.93 312.52
32. Karauli 323.94 518.31
33. Undistributed 2251.50 207.15
TOTAL NA. 29041.83 NA. 22690.47 NA. 2891.25
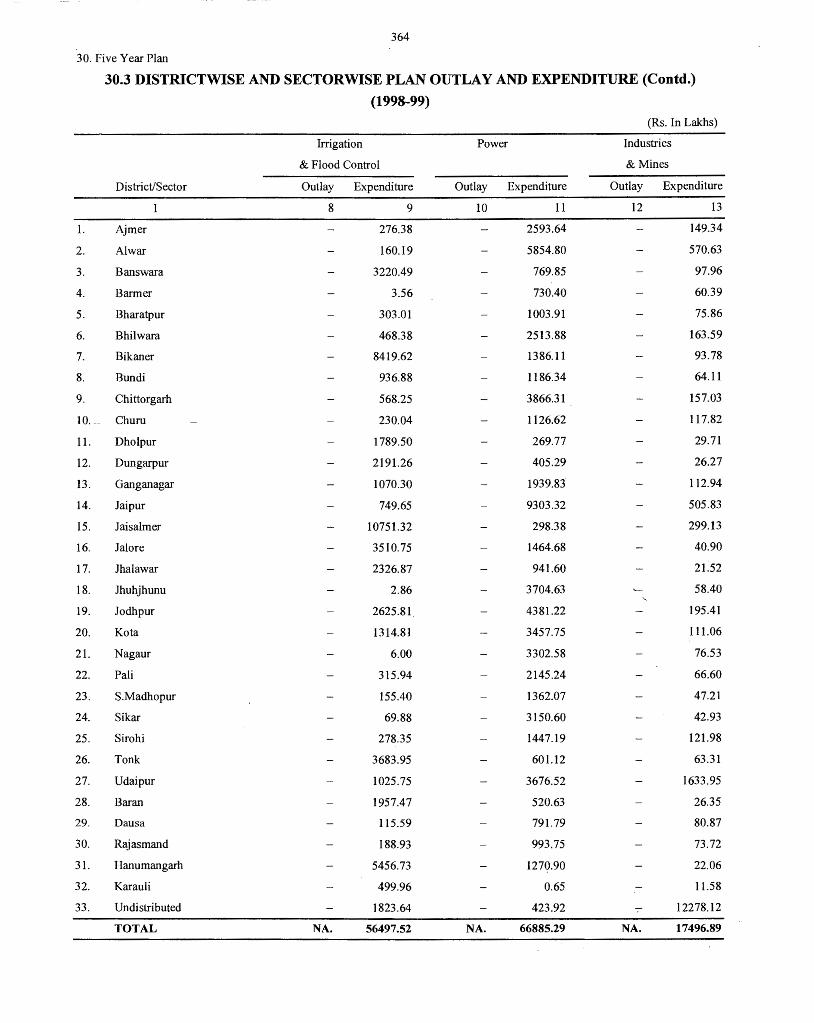
364
30. Five Year Plan
30.3 DISTRICTWISE AND SECTORWISE PLAN OUTLAY AND EXPENDITURE (Contd.)
(1998-99)
(Rs. In Lakhs)
Irrigation Power Industries
& Flood Control &Mines
District/Sector Outlay Expenditure Outlay Expenditure Outlay Expenditure
8 9 10 11 12 13
I. Ajmer 276.38 2593.64 149.34
2. Al war 160.19 5854.80 570.63
3. Banswara 3220.49 769.85 97.96
4. Barmer 3.56 730.40 60.39
5. Bharatpur 303.01 1003.91 75.86
6. Bhilwara 468.38 2513.88 163.59
7. Bikaner 8419.62 1386.11 93.78
8. Bundi 936.88 1186.34 64.11
9. Chittorgarh 568.25 3866.31 157.03
10. -- Churu 230.04 1126.62 117.82
11. Dholpur 1789.50 269.77 29.71
12. Dungarpur 2191.26 405.29 26.27
13. Ganganagar 1070.30 1939.83 112.94
14. Jaipur 749.65 9303.32 505.83
15. Jaisalmer 10751.32 298.38 299.13
16. Jalore 3510.75 1464.68 40.90
17. Jhalawar 2326.87 941.60 21.52
18. Jhuhjhunu 2.86 3704.63 58.40
19. Jodhpur 2625.81 4381.22 195.41
20. Ko ta 1314.81 3457.75 111.06
21. Nagaur 6.00 3302.58 76.53
22. Pali 315.94 2145.24 66.60
23. S.Madhopur 155.40 1362.07 47.21
24. Sikar 69.88 3150.60 42.93
25. Sirohi 278.35 1447.19 121.98
26. Tonk 3683.95 601.12 63.31
27. Udaipur 1025.75 3676.52 1633.95
28. Baran 1957.47 520.63 26.35
29. Dausa 115.59 791.79 80.87
30. Rajasmand 188.93 993.75 73.72
31. Hanumangarh 5456.73 1270.90 22.06
32. Karauli 499.96 0.65 11.58
33. Undistributed 1823.64 423.92 -:- 12278.12
TOTAL NA. 56497.52 NA. 66885.29 NA. 17496.89
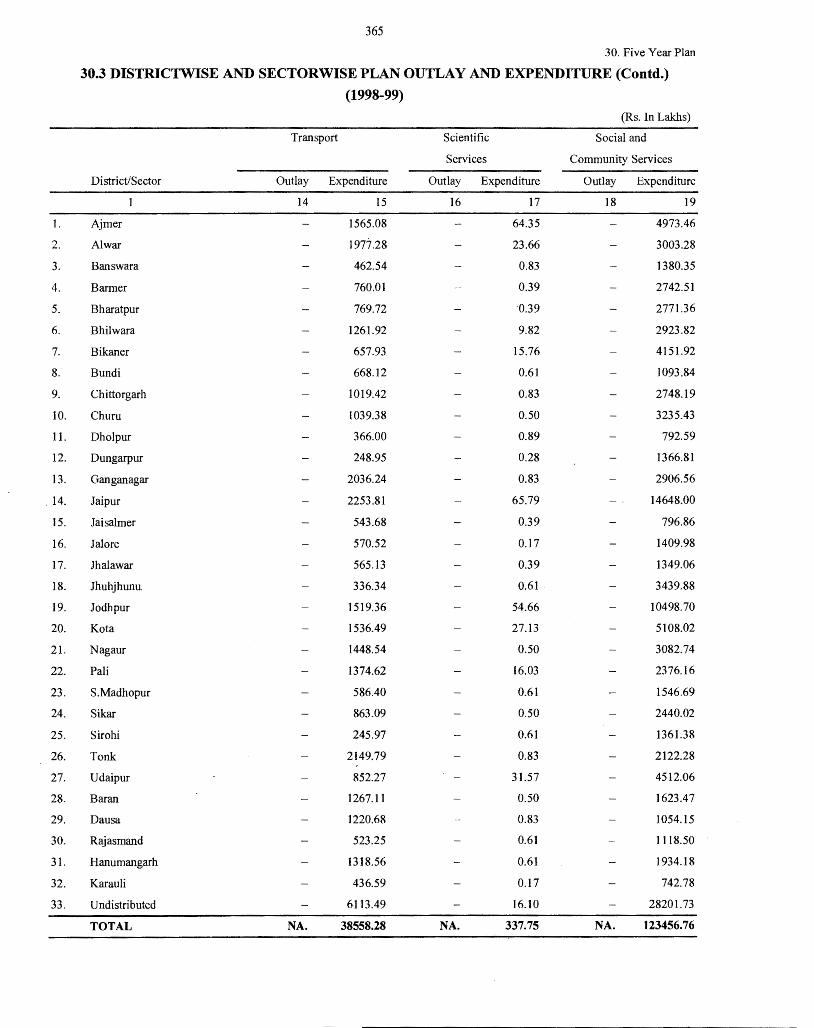
365
30. Five Year Plan
30.3 DISTRICTWISE AND SECTORWISE PLAN OUTLAY AND EXPENDITURE (Contd.)
(1998-99)
(Rs. In Lakhs)
Transport Scientific Social and
Services Community Services
District/Sector Outlay Expenditure Outlay Expenditure Outlay Expenditure
14 15 16 17 18 19
1. Ajmer 1565.08 64.35 4973.46
2. Al war 1977.28 23.66 3003.28
3. Banswara 462.54 0.83 1380.35
4. Barmer 760.01 0.39 2742.51
5. Bharatpur 769.72 0.39 2771.36
6. Bhilwara 1261.92 9.82 2923.82
7. Bikaner 657.93 15.76 4151.92
8. Bundi 668.12 0.61 1093.84
9. Chittorgarh 1019.42 0.83 2748.19
10. Chum 1039.38 0.50 3235.43
11. Dholpur 366.00 0.89 792.59
12. Dungarpur 248.95 0.28 1366.81
13. Ganganagar 2036.24 0.83 2906.56
' 14. Jaipur 2253.81 65.79 14648.00
15. Jaisalmer 543.68 0.39 796.86
16. Jalore 570.52 0.17 1409.98
17. Jhalawar 565.13 0.39 1349.06
18. Jhuhjhunu. 336.34 0.61 3439.88
19. Jodhpur 1519.36 54.66 10498.70
20. Ko ta 1536.49 27.13 5108.02
21. Nagaur 1448.54 0.50 3082.74
22. Pali 1374.62 16.03 2376.16
23. S.Madhopur 586.40 0.61 1546.69
24. Sikar 863.09 0.50 2440.02
25. Sirohi 245.97 0.61 1361.38
26. Tonk 2149.79 0.83 2122.28
27. Udaipur 852.27 31.57 4512.06
28. Baran 1267.11 0.50 1623.47
29. Dausa 1220.68 0.83 1054.15
30. Rajasmand 523.25 0.61 1118.50
31. Hanumangarh 1318.56 0.61 1934.18
32. Karauli 436.59 0.17 742.78
33. Undistributed 6113.49 16.10 28201.73
TOTAL NA. 38558.28 NA. 337.75 NA. 123456.76
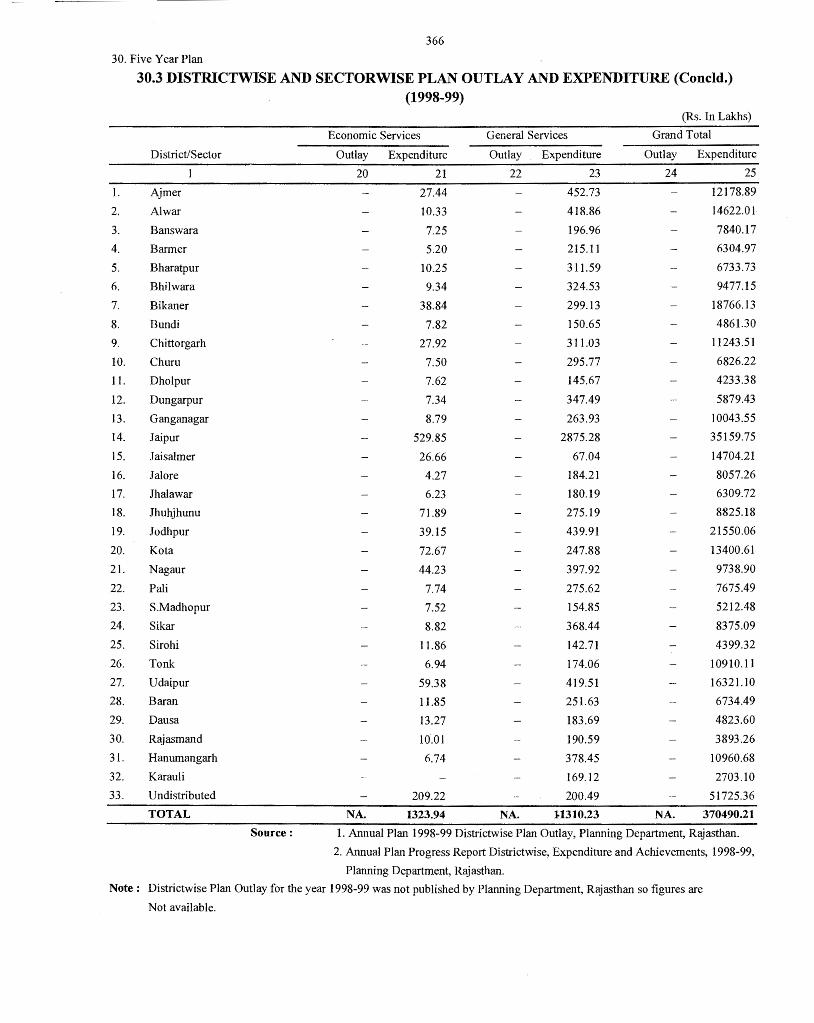
366
30. Five Year Plan
30.3 DISTRICTWISE AND SECTORWISE PLAN OUTLAY AND EXPENDITURE (Concld.) (1998-99)
(Rs. In Lakhs)
Economic Services General Services Grand Total
District/Sector Outlay Expenditure Outlay Expenditure Outlay Expenditure
20 21 22 23 24 25
1. Ajmer 27.44 452.73 12178.89
2. Al war 10.33 418.86 14622.0l
3. Banswara 7.25 196.96 7840.17
4. Barmer 5.20 215. ll 6304.97
5. Bharatpur 10.25 311.59 6733.73
6. Bhilwara 9.34 324.53 9477.15
7. Bikaner 38.84 299.13 18766.13
8. Bundi 7.82 150.65 4861.30
9. Chittorgarh 27.92 311.03 11243.51
10. Chum 7.50 295.77 6826.22
11. Dholpur 7.62 145.67 4233.38
12. Dungarpur 7.34 347.49 5879.43
13. Ganganagar 8.79 263.93 10043.55
14. Jaipur 529.85 2875.28 35159.75
15. Jaisalmer 26.66 67.04 14704.21
16. Jal ore 4.27 184.21 8057.26
17. Jhalawar 6.23 180.19 6309.72
18. Jhuhjhunu 71.89 275.19 8825.18
19. Jodhpur 39.15 439.91 21550.06
20. Ko ta 72.67 247.88 13400.61
21. Nagaur 44.23 397.92 9738.90
22. Pali 7.74 275.62 7675.49
23. S.Madhopur 7.52 154.85 5212.48
24. Sikar 8.82 368.44 8375.09
25. Sirohi 11.86 142.71 4399.32
26. Tonk 6.94 174.06 10910.11
27. Udaipur 59.38 419.51 16321.10
28. Baran 11.85 251.63 6734.49
29. Dausa 13.27 183.69 4823.60
30. Rajasmand 10.01 190.59 3893.26
31. Hanumangarh 6.74 378.45 10960.68
32. Karau Ii 169.12 2703.10
33. Undistributed 209.22 200.49 51725.36
TOTAL NA. 1323.94 NA. 1-1310.23 NA. 370490.21
Source: 1. Annual Plan 1998-99 Districtwise Plan Outlay, Planning Department, Rajasthan.
2. Annual Plan Progress Report Districtwise, Expenditure and Achievements, 1998-99,
Planning Department, Rajasthan.
Note: Districtwise Plan Outlay for the year 1998-99 was not published by Planning Department, Rajasthan so figures are
Not available.
(31) JOINT- STOCK COMPANIES
The Joint stock companies statistics are collected under the companies act, 1956 by Department of company affairs, government of India, New Delhi. Statistics are given for numbers and Authorised capital of companies by limited shares only.
At the time ofregisteration of new companies it is only the authorised capital that emerges.
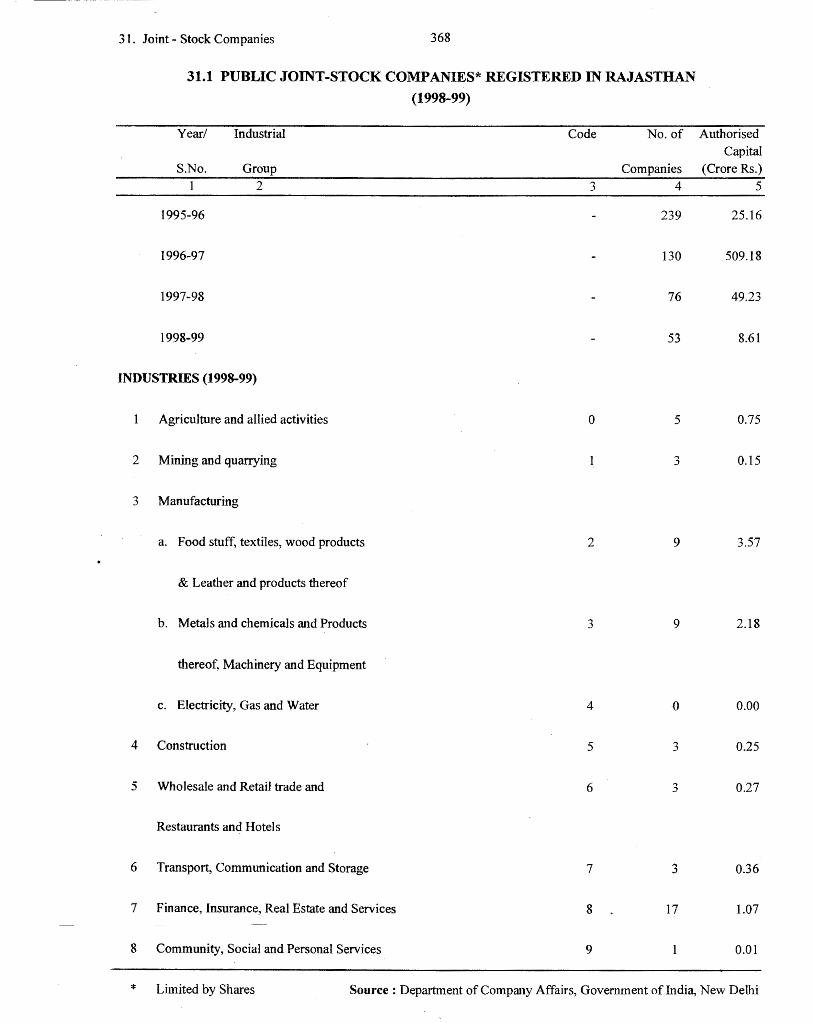
31. Joint - Stock Companies 368
31.1 PUBLIC JOINT-STOCK COMPANIES* REGISTERED IN RAJASTHAN
(1998-99)
Year/ Industrial Code No. of Authorised
Capital S.No. Group Companies (Crore Rs.)
1 2 3 4 5
1995-96 239 25.16
1996-97 130 509.18
1997-98 76 49.23
1998-99 53 8.61
INDUSTRIES (1998-99)
Agriculture and allied activities 0 5 0.75
2 Mining and quarrying 3 0.15
3 Manufacturing
a. Food stuff, textiles, wood products 2 9 3.57
& Leather and products thereof
b. Metals and chemicals and Products 3 9 2.18
thereof, Machinery and Equipment
c. Electricity, Gas and Water 4 0 0.00
4 Construction 5 3 0.25
5 Wholesale and Retail trade and 6 3 0.27
Restaurants and Hotels
6 Transport, Communication and Storage 7 3 0.36
7 Finance, Insurance, Real Estate and Services 8 17 1.07
8 Community, Social and Personal Services 9 0.01
* Limited by Shares Source : Department of Company Affairs, Government of India, New Delhi
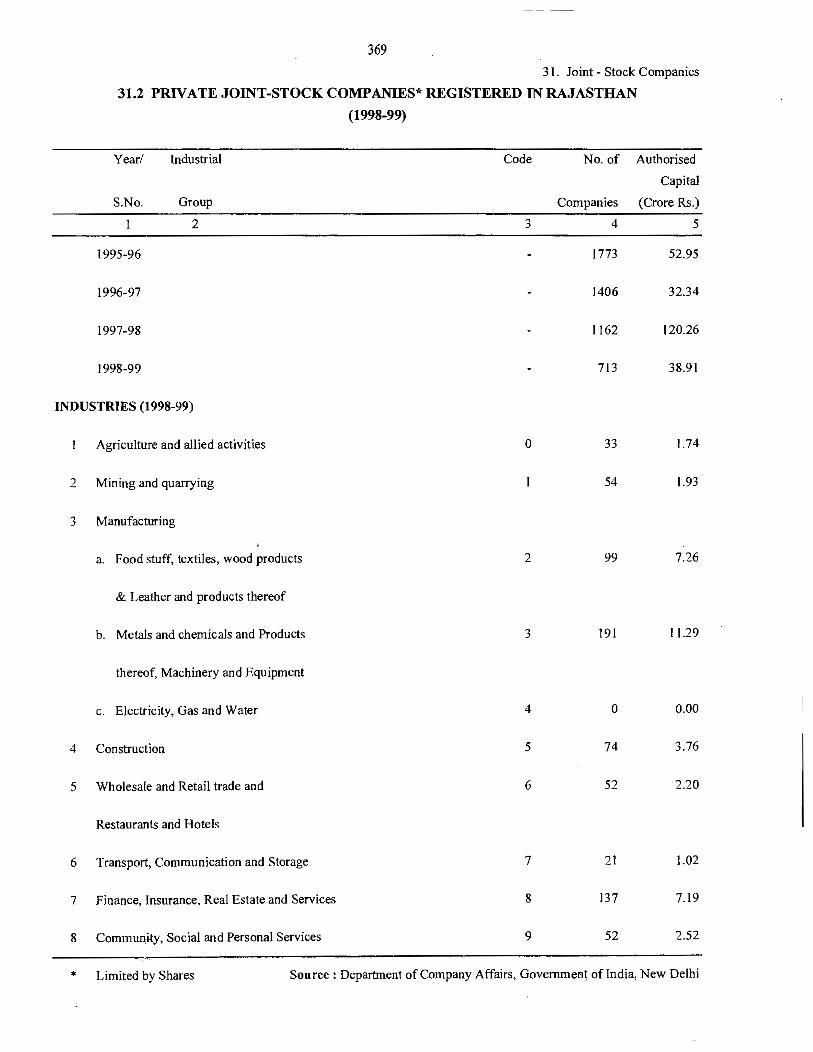
369
31. Joint - Stock Companies
31.2 PRIVATE JOINT-STOCK COMPANIES* REGISTERED IN RAJASTHAN
(1998-99)
Year/ Industrial Code No. of Authorised
Capital
S.No. Group Companies (Crore Rs.)
2 3 4 5
1995-96 1773 52.95
1996-97 1406 32.34
1997-98 1162 120.26
1998-99 713 38.91
INDUSTRIES (1998-99)
Agriculture and allied activities 0 33 1.74
2 Mining and quarrying 54 1.93
3 Manufacturing
a. Food stuff, textiles, wood products 2 99 7.26
& Leather and products thereof
b. Metals and chemicals and Products 3 191 11.29
thereof, Machinery and Equipment
c. Electricity, Gas and Water 4 0 0.00
4 Construction 5 74 3.76
5 Wholesale and Retail trade and 6 52 2.20
Restaurants and HoteJs
6 Transport, Communication and Storage 7 21 1.02
7 Finance, Insurance, Real Estate and Services 8 137 7.19
8 Community, Social and Personal Services 9 52 2.52
* Limited by Shares Source: Department of Company Affairs, GovemmeHt of India, New Delhi
(32) PUBLIC UNDERTAKINGS
This section Presents, data on loans sanctioned and Disbursed by Rajasthan Financial
Corporation by Industrial Classification as well as by Districts.
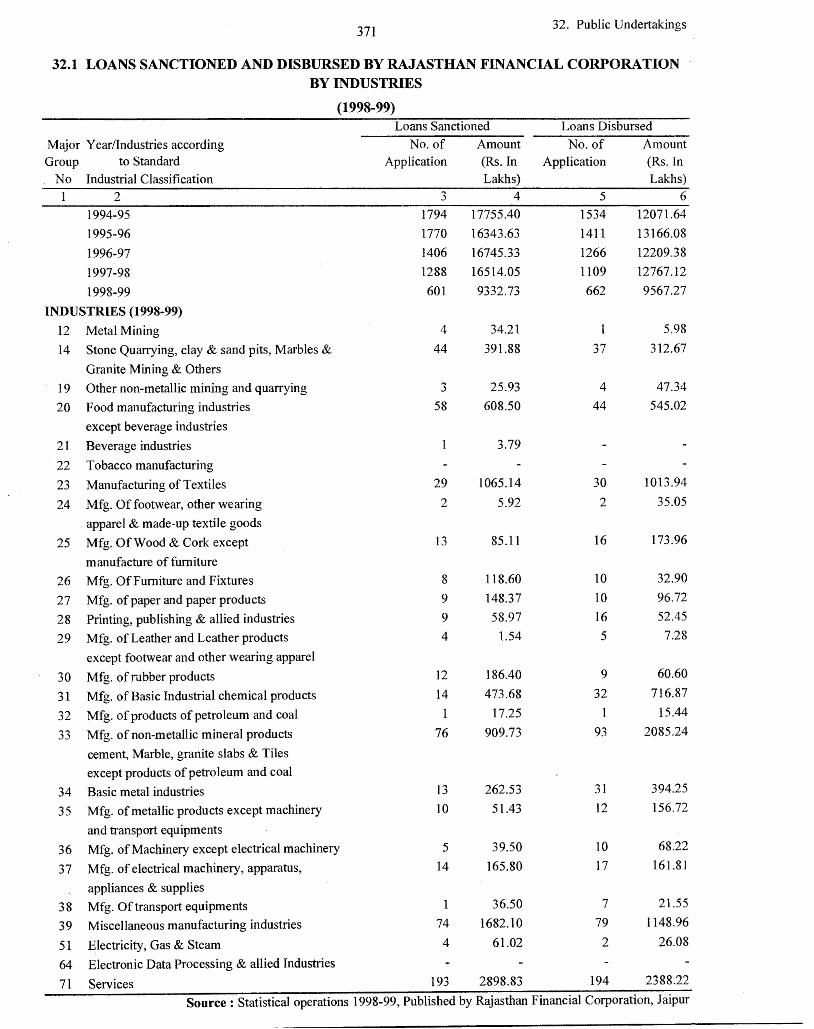
371 32. Public Undertakings
32.1 LOANS SANCTIONED AND DISBURSED BY RAJASTHAN FINANCIAL CORPORATION BY INDUSTRIES
(1998-99) Loans Sanctioned Loans Disbursed
Major Year/Industries according No. of Amount No. of Amount
Group to Standard Application (Rs. In Application (Rs. In
No Industrial Classification Lakhs) Lakhs)
1 2 3 4 5 6
1994-95 1794 17755.40 1534 12071.64
1995-96 1770 16343.63 1411 13166.08
1996-97 1406 16745.33 1266 12209.38
1997-98 1288 16514.05 1109 12767.12
1998-99 601 9332.73 662 9567.27
INDUSTRIES (1998-99)
12 Metal Mining 4 34.21 5.98
14 Stone Quarrying, clay & sand pits, Marbles & 44 391.88 37 312.67
Granite Mining & Others
19 Other non-metallic mining and quarrying 3 25.93 4 47.34
20 Food manufacturing industries 58 608.50 44 545.02
except beverage industries
21 Beverage industries 3.79
22 Tobacco manufacturing
23 Manufacturing of Textiles 29 1065.14 30 1013.94
24 Mfg. Of footwear, other wearing 2 5.92 2 35.05
apparel & made-up textile goods
25 Mfg. Of Wood & Cork except 13 85.11 16 173.96
manufacture of furniture
26 Mfg. Of Furniture and Fixtures 8 118.60 10 32.90
27 Mfg. of paper and paper products 9 148.37 10 96.72
28 Printing, publishing & allied industries 9 58.97 16 52.45
29 Mfg. of Leather and Leather products 4 1.54 5 7.28
except footwear and other wearing apparel
30 Mfg. of rubber products 12 186.40 9 60.60
31 Mfg. of Basic Industrial chemical products 14 473.68 32 716.87
32 Mfg. of products of petroleum and coal 1 17.25 l 15.44
33 Mfg. of non-metallic mineral products 76 909.73 93 2085.24
cement, Marble, granite slabs & Tiles
except products of petroleum and coal
34 Basic metal industries 13 262.53 31 394.25
35 Mfg. of metallic products except machinery 10 51.43 12 156.72
and transport equipments
36 Mfg. of Machinery except electrical machinery 5 39.50 10 68.22
37 Mfg. of electrical machinery, apparatus, 14 165.80 17 161.81
appliances & supplies
38 Mfg. Of transport equipments 36.50 7 21.55
39 Miscellaneous manufacturing industries 74 1682.10 79 1148.96
51 Electricity, Gas & Steam 4 61.02 2 26.08
64 Electronic Data Processing & allied Industries
71 Services 193 2898.83 194 2388.22
Source : Statistical operations 1998-99, Published by Rajasthan Financial Corporation, Jaipur
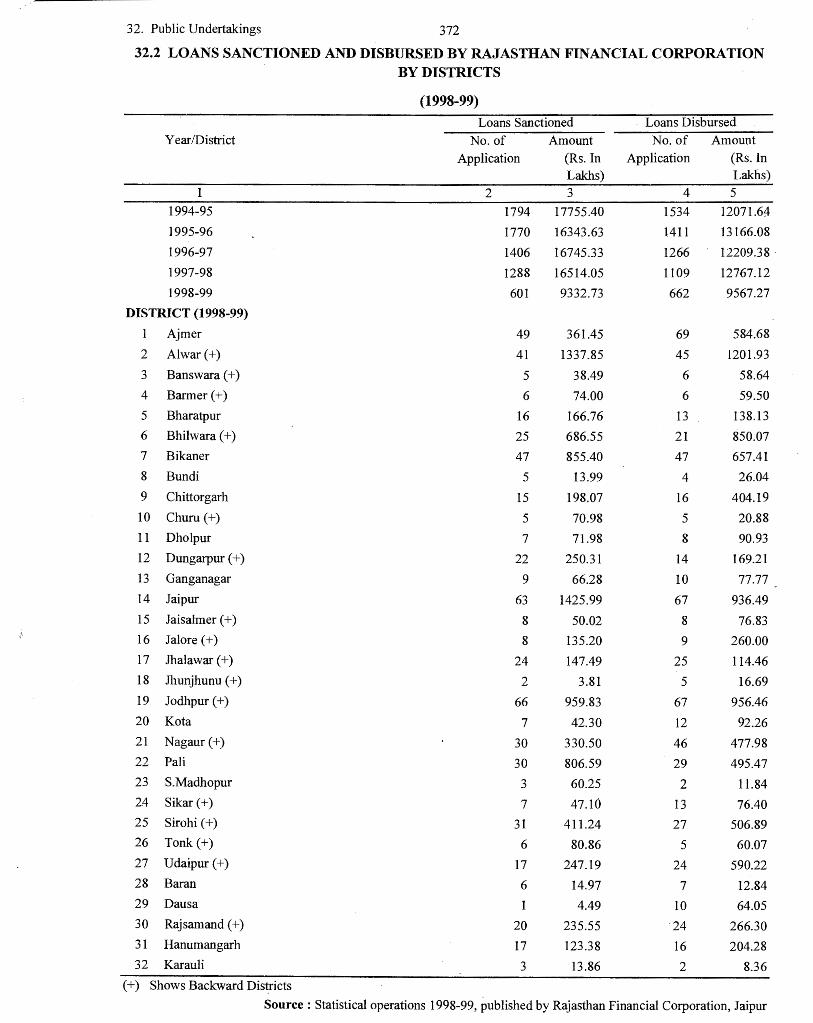
32. Public Undertakings 372
32.2 LOANS SANCTIONED AND DISBURSED BY RAJASTHAN FINANCIAL CORPORATION BY DISTRICTS
(1998-99)
Loans Sanctioned . Loans Disbursed
Year/District No. of Amount No. of Amount
Application (Rs. In Application (Rs. In
Lakhs) Lakhs)
1 2 3 4 5
1994-95 1794 17755.40 1534 12071.64
1995-96 1770 16343.63 1411 13166.08
1996-97 1406 16745.33 1266 12209.38 .
1997-98 1288 16514.05 1109 12767.12
1998-99 601 9332.73 662 9567.27
DISTRICT (1998-99)
Ajmer 49 361.45 69 584.68
2 Alwar (+) 41 1337.85 45 1201.93
3 Banswara ( +) 5 38.49 6 58.64
4 Barmer(+) 6 74.00 6 59.50
5 Bharatpur 16 166.76 13 138.13
6 Bhilwara ( +) 25 686.55 21 850.07
7 Bikaner 47 855.40 47 657.41
8 Bundi 5 13.99 4 26.04
9 Chittorgarh 15 198.07 16 404.19
10 Churn(+) 5 70.98 5 20.88
11 Dholpur 7 71.98 8 90.93
12 Dungarpur ( +) 22 250.31 14 169.21
13 Ganganagar 9 66.28 10 77.77
14 Jaipur 63 1425.99 67 936.49
15 Jaisalmer ( +) 8 50.02 8 76.83
16 Jalore (+) 8 135.20 9 260.00
17 Jhalawar ( +) 24 147.49 25 114.46
18 nrnnjhunu ( +) 2 3.81 5 16.69
19 Jodhpur (+) 66 959.83 67 956.46
20 Ko ta 7 42.30 12 92.26
21 Nagaur (+) 30 330.50 46 477.98
22 Pali 30 806.59 29 495.47
23 S.Madhopur 3 60.25 2 11.84
24 Sikar (+) 7 47.10 13 76.40
25 Sirohi (+) 31 411.24 27 506.89
26 Tonk(+) 6 80.86 5 60.07
27 Udaipur (+) 17 247.19 24 590.22
28 Baran 6 14.97 7 12.84
29 Daus a I 4.49 10 64.05
30 Rajsamand (+) 20 235.55 24 266.30
31 Hanumangarh 17 123.38 16 204.28
32 Karauli 3 13.86 2 8.36
(+) Shows Backward Districts
Source : Statistical operations 1998-99, published by Rajasthan Financial Corporation, Jaipur
(33) PUBLIC ADMINISTRATION & ELECTORAL STATISTICS
This section deals with the information pertaining to the constitution and administration of
local bodies viz. Municipalities and Village Panchayats.
The data on income and expenditure of Municipalities have been obtained from the Directorate
of Local Bodies Rajasthan, Jaipur.
There are 25 Parliamentary seats in Rajasthan in the 13th general election held in 1999. Ten
members are sent to Rajya Sabha as elected by representatives of the Vidhan Sabha of the state.
First table incorporated in this chapter contains information on total electorate in each Parliamentary constituency and votes secured by the various parties contesting the general elections held in 1999, Second table contains the constituency-wise names of elected members, party to
which he belongs and the percentage of votes secured by the member. The third table contains
party-wise names of the members of Raj ya Sabha from the State ofRajasthan.
The 7th general panchayat elections have been conducted by state election commission in Jan/Feb.,
2000. Reservation of constituencies and number of elected members are presented in from of
statistical tables.
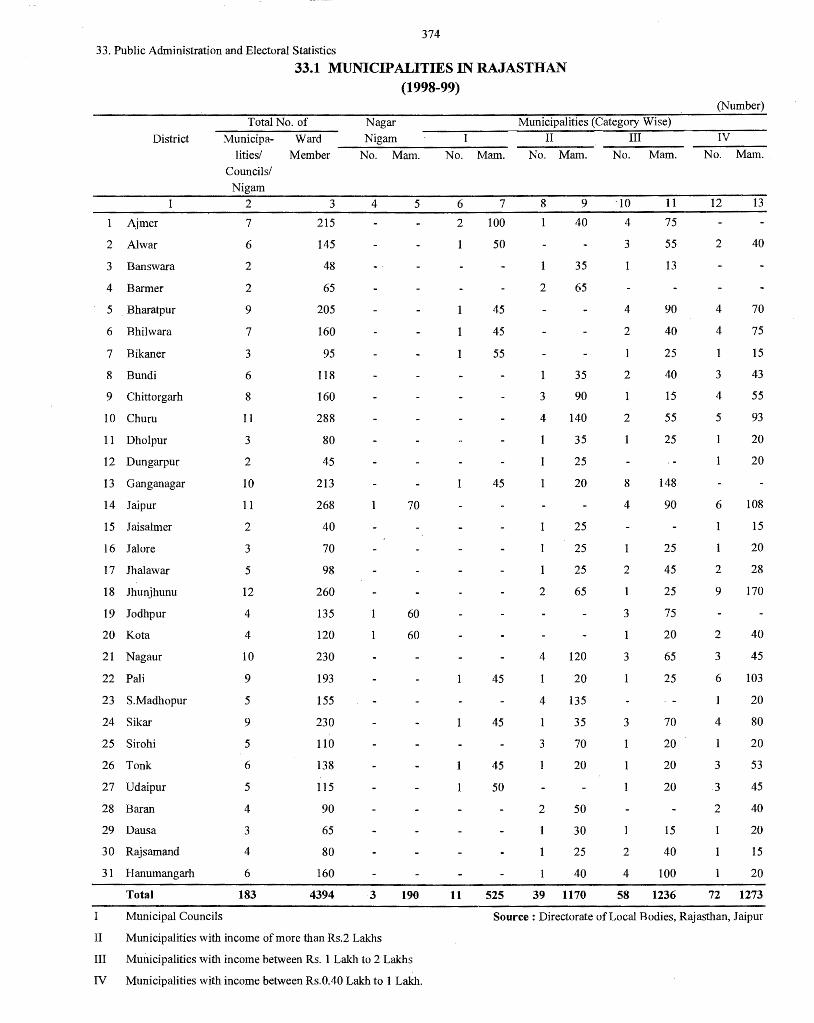
374
33. Public Administration and Electoral Statistics
District
Ajmer
2 Alwar
3 Banswara
4 Barmer
5 Bharatpur
6 Bhilwara
7 Bikaner
8 Bundi
9 Chittorgarh
10 Churu
11 Dholpur
12 Dungarpur
13 Ganganagar
14 Jaipur
15 J aisalmer
16 Jalore
17 Jhalawar
18 Jhunjhunu
19 Jodhpur
20 Kota
21 Nagaur
22 Pali
23 S.Madhopur
24 Sikar
25 Sirohi
26 Tonk
27 Udaipur
28 Baran
29 Dausa
30 Rajsamand
3 I Hanumangarh
Total
33.1 MUNICIPALITIES IN RA.JASTHAN (1998-99)
Total No. of
Municipa- Ward
Ii ties/ Member
Councils/
Nigam
2
7
6
2
2
9
7
3
6
8
11
3
2
10
11
2
3
5
12
4
4
10
9
5
9
5
6
5
4
3
4
6
183
3
215
145
48
65
205
160
95
118
160
288
80
45
213
268
40
70
98
260
135
120
230
193
155
230
110
138
115
90
65
80
160
4394
Nagar
Nigam
No. Mam.
4
3
5
70
60
60
190
No.
6
2
11
Mam.
7
100
50
45
45
55
45
45
45
45
50
525
Municipalities (Category Wise)
II III
No. Mam.
8
2
3
4
2
4
4
3
2
9
40
35
65
35
90
140
35
25
20
25
25
25
65
120
20
135
35
70
20
50
30
25
40
39 1170
No. Mam.
·10
4
3
4
2
2
2
8
4
2
3
3
3
2
4
58
11
75
55
13
90
40
25
40
15
55
25
148
90
25
45
25
75
20
65
25
70
20
20
20
15
40
100
1236
(Number)
IV
No. Mam.
12
2
4
4
3
4
5
6
2
9
2
3
6
4
3
3
2
13
40
70
75
15
43
55
93
20
20
108
15
20
28
170
40
45
103
20
80
20
53
45
40
20
15
20
72 1273
Municipal Councils Source: Directorate of Local Bodies, Rajasthan, Jaipur
II Municipalities with income of more than Rs.2 Lakhs
III Municipalities with income between Rs. 1 Lakh to 2 Lakhs
IV Municipalities with income between Rs.0.40 Lakh to 1 Lakh.
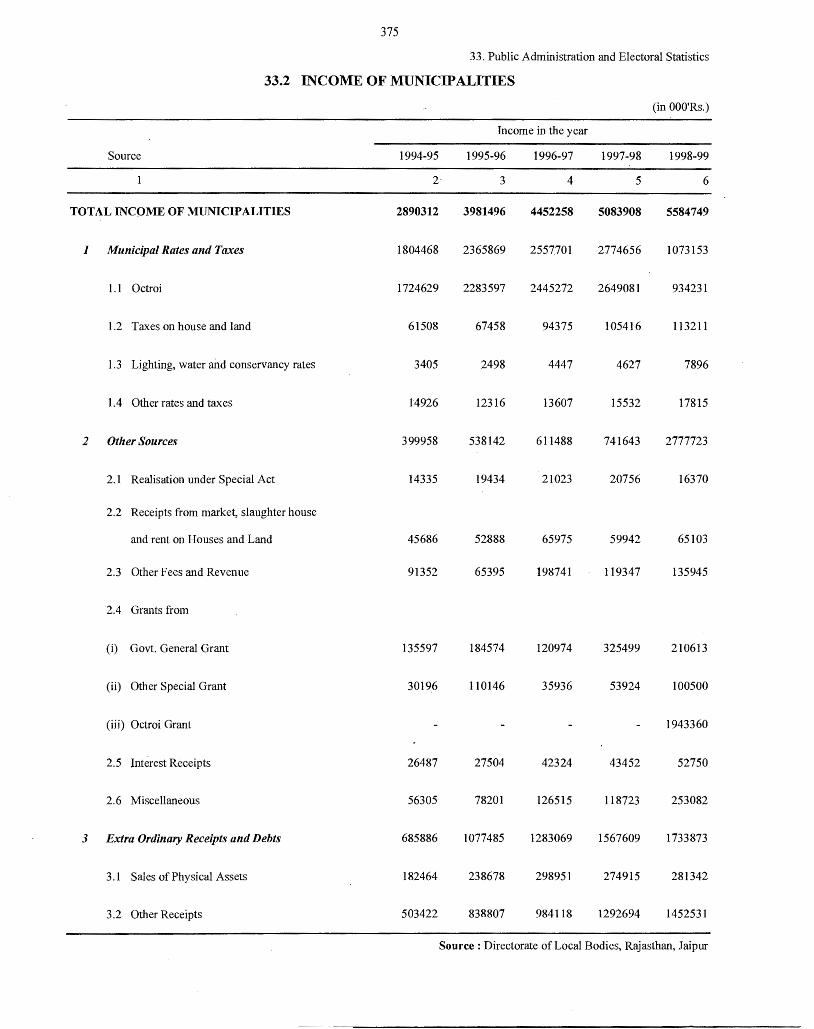
375
33. Public Administration and Electoral Statistics
33.2 INCOME OF MUNICIPALITIES
(in OOO'Rs.)
Income in the year
Source 1994-95 1995-96 1996-97 1997-98 1998-99
2· 3 4 5 6
TOTAL INCOME OF MUNICIPALITIES 2890312 3981496 4452258 5083908 5584749
I Municipal Rates and Taxes 1804468 2365869 2557701 2774656 1073153
1.1 Octroi 1724629 2283597 2445272 2649081 934231
1.2 Taxes on house and land 61508 67458 94375 105416 113211
1.3 Lighting, water and conservancy rates 3405 2498 4447 4627 7896
1.4 Other rates and taxes 14926 12316 13607 15532 17815
2 Other Sources 399958 538142 611488 741643 2777723
2.1 Realisation under Special Act 14335 19434 21023 20756 16370
2.2 Receipts from market, slaughter house
and rent on Houses and Land 45686 52888 65975 59942 65103
2.3 Other Fees and Revenue 91352 65395 198741 119347 135945
2.4 Grants from
(i) Govt General Grant 135597 184574 120974 325499 210613
(ii) Other Special Grant 30196 110146 35936 53924 100500
(iii) Octroi Grant 1943360
2.5 Interest Receipts 26487 27504 42324 43452 52750
2.6 Miscellaneous 56305 78201 126515 118723 253082
3 Extra Ordinary Receipts and Debts 685886 1077485 1283069 1567609 1733873
3.1 Sales of Physical Assets 182464 238678 298951 274915 281342
3.2 Other Receipts 503422 838807 984118 1292694 1452531
Source : Directorate of Local Bodies, Rajasthan, Jaipur
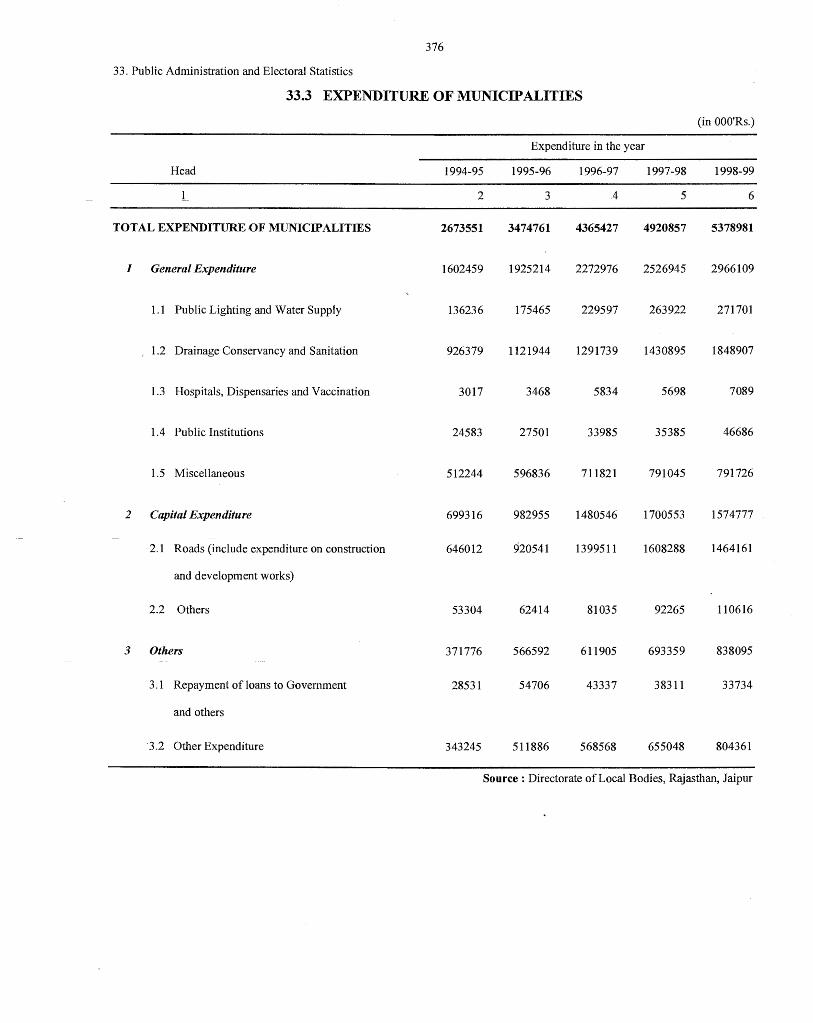
376
33. Public Administration and Electoral Statistics
33.3 EXPENDITURE OF MUNICIPALITIES
(in OOO'Rs.)
Expenditure in the year
Head 1994-95 1995-96 1996-97 1997-98 1998-99
L 2 3 .4 5 6
TOTAL EXPENDITURE -OF MUNICIPALITIES 2673551 3474761 4365427 4920857 5378981
I General Expenditure 1602459 1925214 2272976 2526945 2966109
1.1 Public Lighting and Water Supply 136236 175465 229597 263922 271701
, 1.2 Drainage Conservancy and Sanitation 926379 1121944 1291739 1430895 1848907
1.3 Hospitals, Dispensaries and Vaccination 3017 3468 5834 5698 7089
1.4 Public Institutions 24583 27501 33985 35385 46686
1. 5 Miscellaneous 512244 596836 711821 791045 791726
2 Capital Expenditure 699316 982955 1480546 1700553 1574777
2.1 Roads (include expenditure on construction 646012 920541 1399511 1608288 1464161
and development works)
2.2 Others 53304 62414 81035 92265 110616
3 Others 371776 566592 611905 693359 838095
3.1 Repayment of loans to Government 28531 54706 43337 38311 33734
and others
3.2 Other Expenditure 343245 511886 568568 655048 804361
Source: Directorate of Local Bodies, Rajasthan, Jaipur
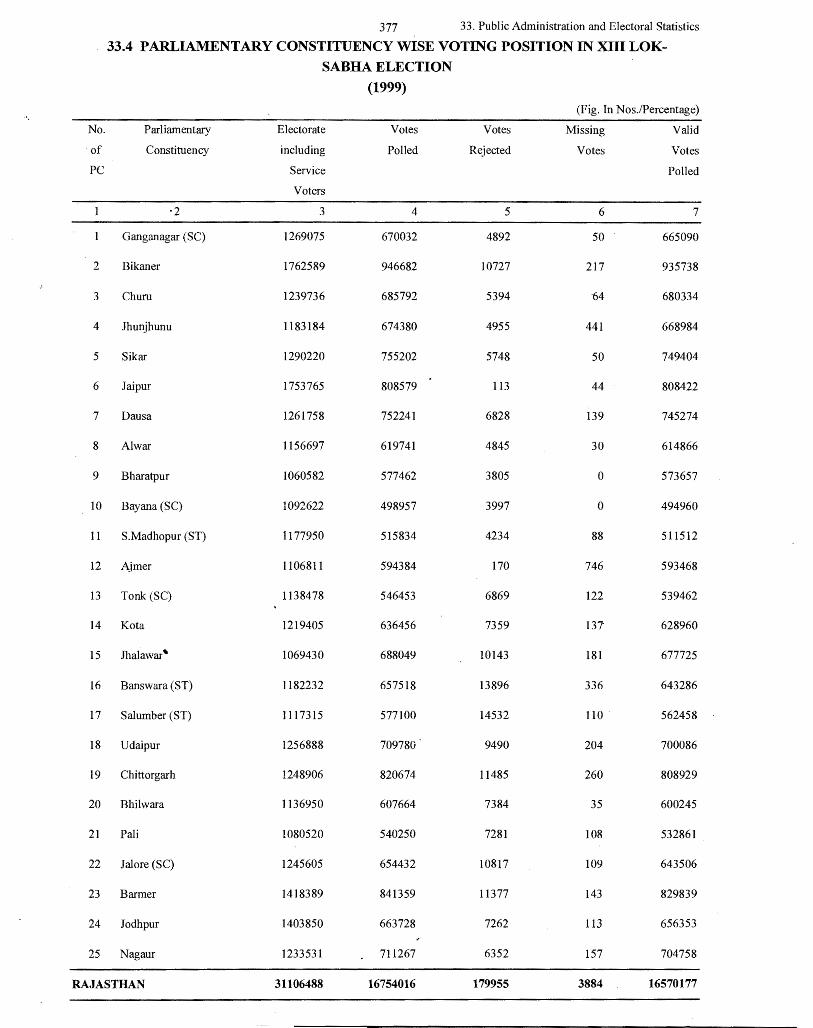
377 33. Public Administration and Electoral Statistics
33.4 PARLIAMENTARY CONSTITUENCY WISE VOTING POSITION IN XIII LOK-
SABHA ELECTION
(1999)
" (Fig. In Nos./Percentage)
No. Parliamentary Electorate Votes Votes Missing Valid
of Constituency including Polled Rejected Votes Votes
PC Service Polled
Voters
·2 3 4 5 6 7
Ganganagar (SC) 1269075 670032 4892 50 665090
2 Bikaner 1762589 946682 10727 217 935738
3 Chum 1239736 685792 5394 '64 680334
4 Jhunjhunu 1183184 674380 4955 441 668984
5 Sikar 1290220 755202 5748 50 749404
6 Jaipur 1753765 808579 113 44 808422
7 Dausa 1261758 752241 6828 139 745274
8 Al war 1156697 619741 4845 30 614866
9 Bharatpur 1060582 577462 3805 0 573657
10 Bayana (SC) 1092622 498957 3997 0 494960
11 S.Madhopur (ST) 1177950 515834 4234 88 511512
12 Ajmer 1106811 594384 170 746 593468
13 Tonk (SC) 1138478 546453 6869 122 539462
14 Ko ta 1219405 636456 7359 137 628960
15 Jhalawar' 1069430 688049 10143 181 677725
16 Banswara (ST) 1182232 657518 13896 336 643286
17 Salumber (ST) 1117315 577100 14532 110 562458
18 Udaipur 1256888 709780 9490 204 700086
19 Chittorgarh 1248906 820674 11485 260 808929
20 Bhilwara 1136950 607664 7384 35 600245
21 Pali 1080520 540250 7281 108 532861
22 Jalore (SC) 1245605 654432 10817 109 643506
23 Barmer 1418389 841359 11377 143 829839
24 Jodhpur 1403850 663728 7262 113 656353
25 Nagaur 1233531 711267 6352 157 704758
RAJAS THAN 31106488 16754016 179955 3884 16570177
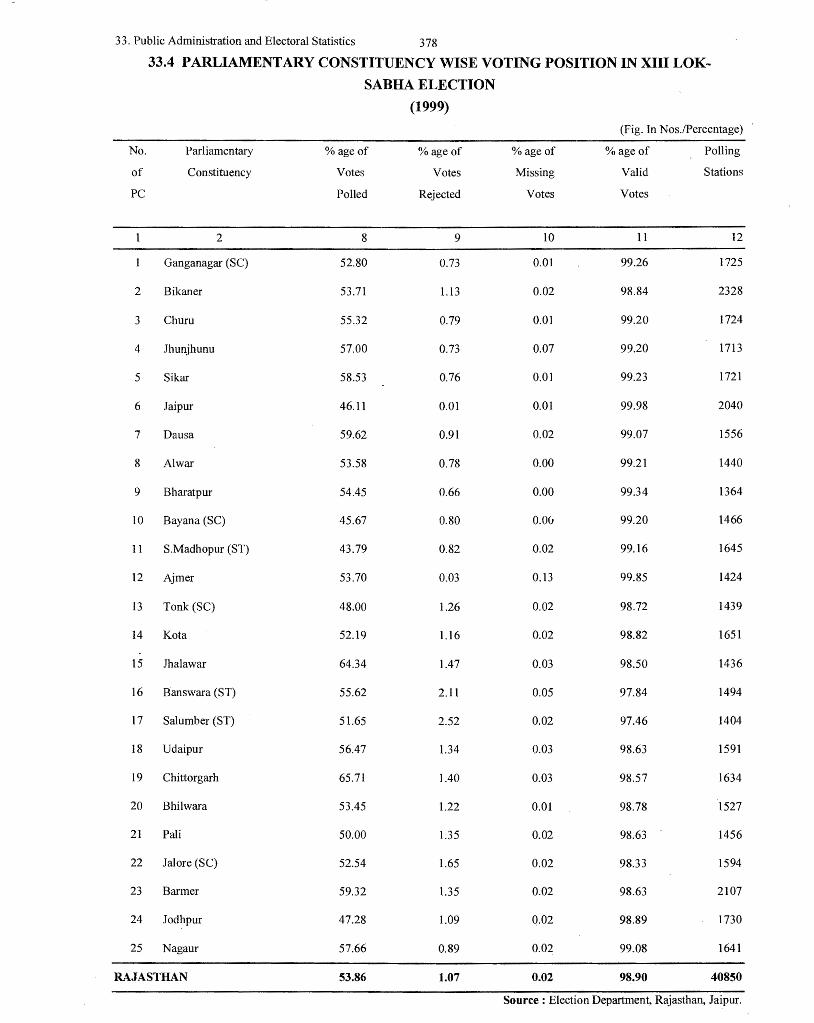
3 3. Public Administration and Electoral Statistics 378
33.4 PARLIAMENTARY CONSTITUENCY WISE VOTING POSITION IN XIII LOK ...
SABHA ELECTION
(1999)
(Fig. In Nos./Percentage)
No. Parliamentary % age of % age of %ageof %ageof Polling
of Constituency Votes Votes Missing Valid Stations
PC Polled Rejected Votes Votes
2 8 9 10 11 12
Ganganagar (SC) 52.80 0.73 0.01 99.26 1725
2 Bikaner 53.71 1.13 0.02 98.84 2328
3 Chum 55.32 0.79 0.01 99.20 1724
4 Jhunjhunu 57.00 0.73 0.07 99.20 1713
5 Sikar 58.53 0.76 0.01 99.23 1721
6 Jaipur 46.11 0.01 0.01 99.98 2040
7 Dausa 59.62 0.91 0.02 99.07 1556
8 Al war 53.58 0.78 0.00 99.21 1440
9 Bharatpur 54.45 0.66 0.00 99.34 1364
10 Bayana (SC) 45.67 0.80 0.00 99.20 1466
11 S.Madhopur (ST) 43.79 0.82 0.02 99.16 1645
12 Ajmer 53.70 0.03 0.13 99.85 1424
13 Tonk (SC) 48.00 1.26 0.02 98.72 1439
14 Ko ta 52.19 1.16 0.02 98.82 1651
15 Jhalawar 64.34 1.47 0.03 98.50 1436
16 Banswara (ST) 55.62 2.11 0.05 97.84 1494
17 Salumber (ST) 51.65 2.52 0.02 97.46 1404
18 Udaipur 56.47 1.34 O.Q3 98.63 1591
19 Chittorgarh 65.71 1.40 O.Q3 98.57 1634
20 Bhilwara 53.45 1.22 O.Ql 98.78 1527
21 Pali 50.00 1.35 0.02 98.63 1456
22 Jalore (SC) 52.54 1.65 0.02 98.33 1594
23 Barmer 59.32 1.35 0.02 98.63 2107
24 Jodhpur 47.28 1.09 0.02 98.89 1730
25 Nagaur 57.66 0.89 0.02 99.08 1641
RAJASTHAN 53.86 1.07 0.02 98.90 40850
Source : Election Department, Rajasthan, Jaipur.
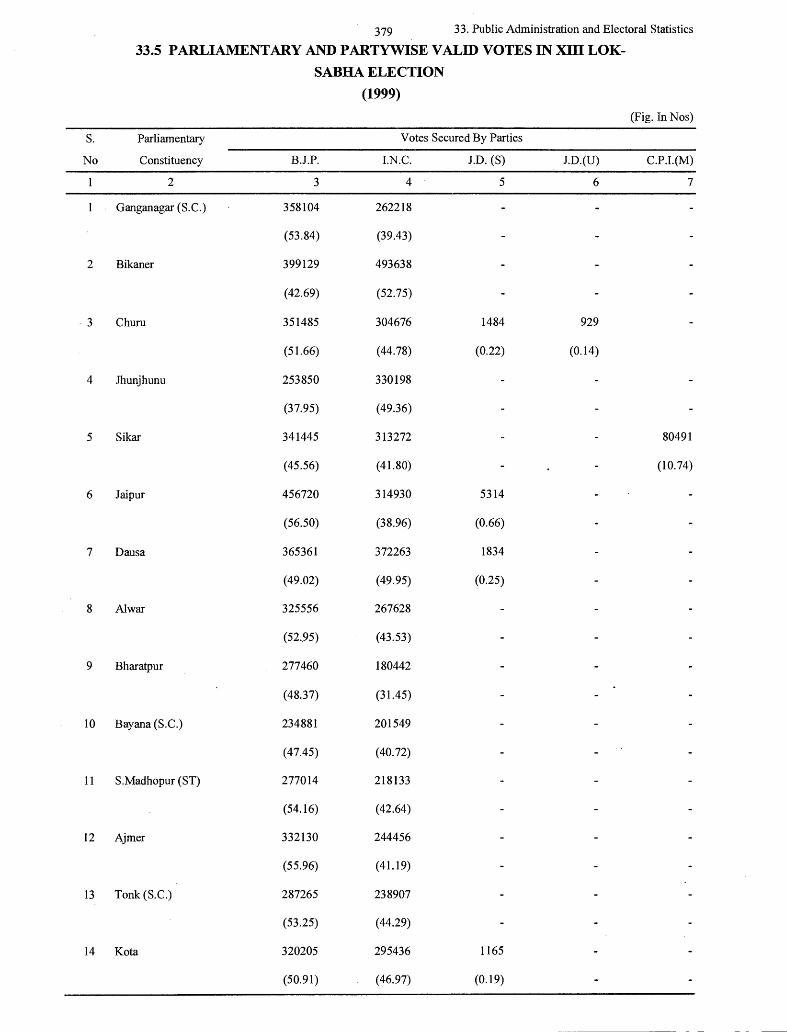
379 33. Public Administration and Electoral Statistics
33.5 PARLIAMENT ARY AND P ARTYWISE VALID VOTES IN XIII LOK-
SABHA ELECTION
(1999)
(Fig. In Nos)
S. Parliamentary Votes Secured By Parties
No Constituency B.J.P. I.N.C. J.D. (S) J.D.(U) C.P.I.(M)
2 3 4 5 6 7
Ganganagar (S.C.) 358104 262218
(53.84) (39.43)
2 Bikaner 399129 493638
(42.69) (52.75)
3 Chum 351485 304676 1484 929
(51.66) (44.78) (0.22) (0.14)
4 Jhunjhunu 253850 330198
(37.95) (49.36)
5 Sikar 341445 313272 80491
(45.56) (41.80) (10.74)
6 Jaipur 456720 314930 5314
(56.50) (38.96) (0.66)
7 Dausa 365361 372263 1834
(49.02) (49.95) (0.25)
8 Al war 325556 267628
(52 . .95) (43.53)
9 Bharatpur 277460 180442
(48.37) (31.45)
10 Bayana (S.C.) 234881 201549
(47.45) (40.72)
11 S.Madhopur (ST) 277014 218133
(54.16) (42.64)
12 Ajmer 332130 244456
(55.96) (41.19)
13 Tonk(S.C.) 287265 238907
(53.25) (44.29)
14 Kota 320205 295436 1165
(50.91) (46.97) (0.19)
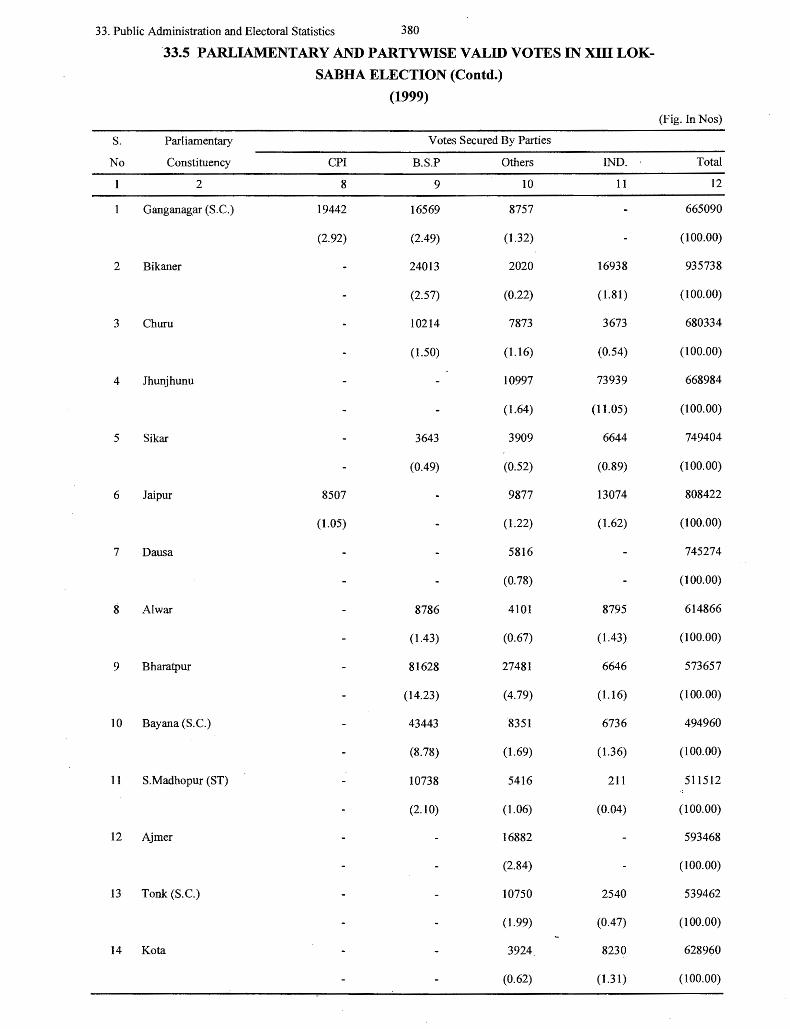
33. Public Administration and Electoral Statistics 380
·33_5 PARLIAMENTARY AND P ARTYWISE VALID VOTES IN XIII LOK-
SABHA ELECTION (Contd.)
(1.999) (Fig. In Nos)
s. Parliamentary Votes Secured By Parties
No Constituency CPI B.S.P Others IND. Total
2 8 9 IO 11 12
Ganganagar (S.C.) 19442 16569 8757 665090
(2.92) (2.49) (1.32) (100.00)
2 Bikan~r 24013 2020 16938 935738
(2.57) (0.22) (1.81) (100.00)
3 Churn 10214 7873 3673 680334
(l.50) (1.16) (0.54) (100.00)
4 Jhunjhunu 10997 73939 668984
(1.64) (11.05) (100.00)
5 Sikar 3643 3909 6644 749404
(0.49) (0.52) (0.89) (100.00)
6 Jaipur 8507 9877 13074 808422
(1.05) (1.22) (1.62) (100.00)
7 Dausa 5816 745274
(0.78) (100.00)
8 Al war 8786 4101 8795 614866
(1.43) (0.67) (1.43) (100.00)
9 Bharatpur 81628 27481 6646 573657
(14.23) (4.79) (1.16) (100.00)
10 Bayana (S.C.) 43443 8351 6736 494960
(8.78) (1.69) ( 1.36) (100.00)
11 S.Madhopur (ST) 10738 5416 211 511512
(2.10) (1.06) (0.04) (100.00)
12 Ajmer 16882 593468
(2.84) (100.00)
13 Tonk (S.c.) 10750 2540 539462
(1.99) (0.47) (100.00)
14 Kota 3924 8230 628960
(0.62) (1.31) (100.00)
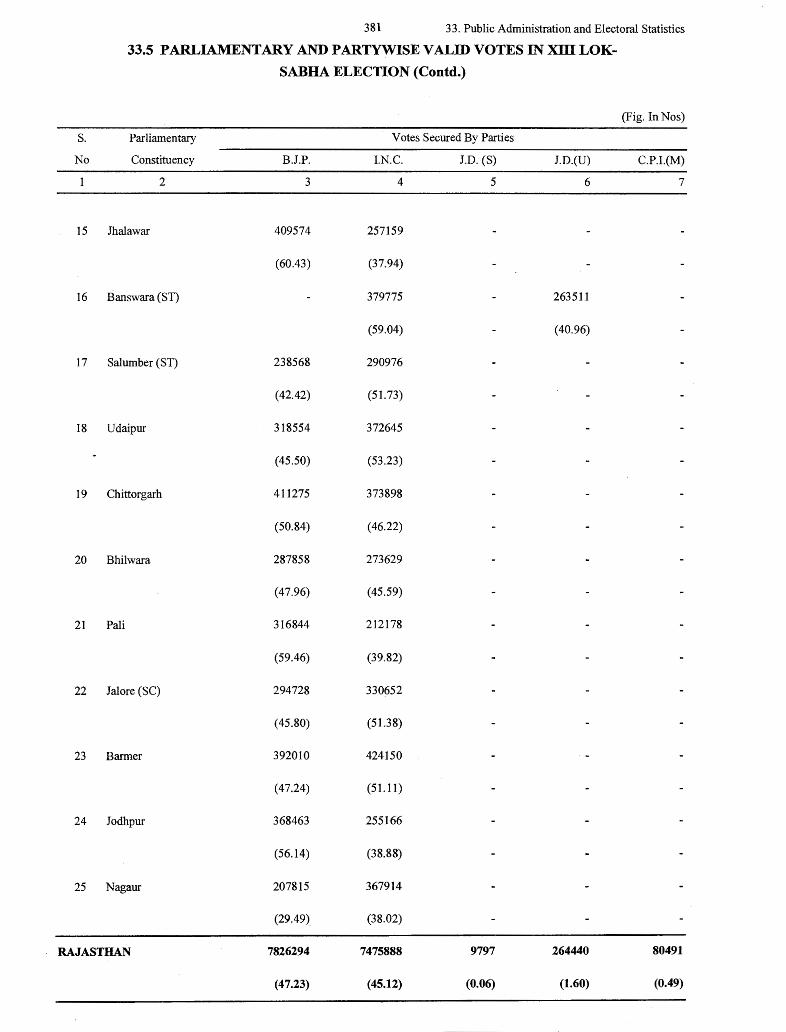
381 33. Public Administration and Electoral Statistics
33.5 PARLIAMENTARY AND PARTYWISE VALID VOTES IN XIII LOK-
SABHA ELECTION (Contd.)
(Fig. In Nos)
S. Parliamentary Votes Secured By Parties
No Constituency B.J.P. l.N.C. J.D. (S) J.D.(U) C.P.L(M)
2 3 4 5 6 7
15 Jhalawar 409574 257159
(60.43) (37.94)
16 Banswara (ST) 379775 263511
(59.04) (40.96)
17 Salumber (ST) 238568 290976
(42.42) (51.73)
18 Udaipur 318554 372645
(45.50) (53.23)
19 Chittorgarh 411275 373898
(50.84) (46.22)
20 Bhilwara 287858 273629
(47.96) (45.59)
21 Pali 316844 212178
(59.46) (39.82)
22 Jalore (SC) 294728 330652
(45.80) (51.38)
23 Barmer 392010 424150
(47.24) (51.11)
24 Jodhpur 368463 255166
(56.14) (38.88)
25 Nagaur 207815 367914
(29.49) (38.02)
RAJAS THAN 7826294 7475888 9797 264440 80491
(47.23) (45.12) (0.06) (1.60) (0.49)
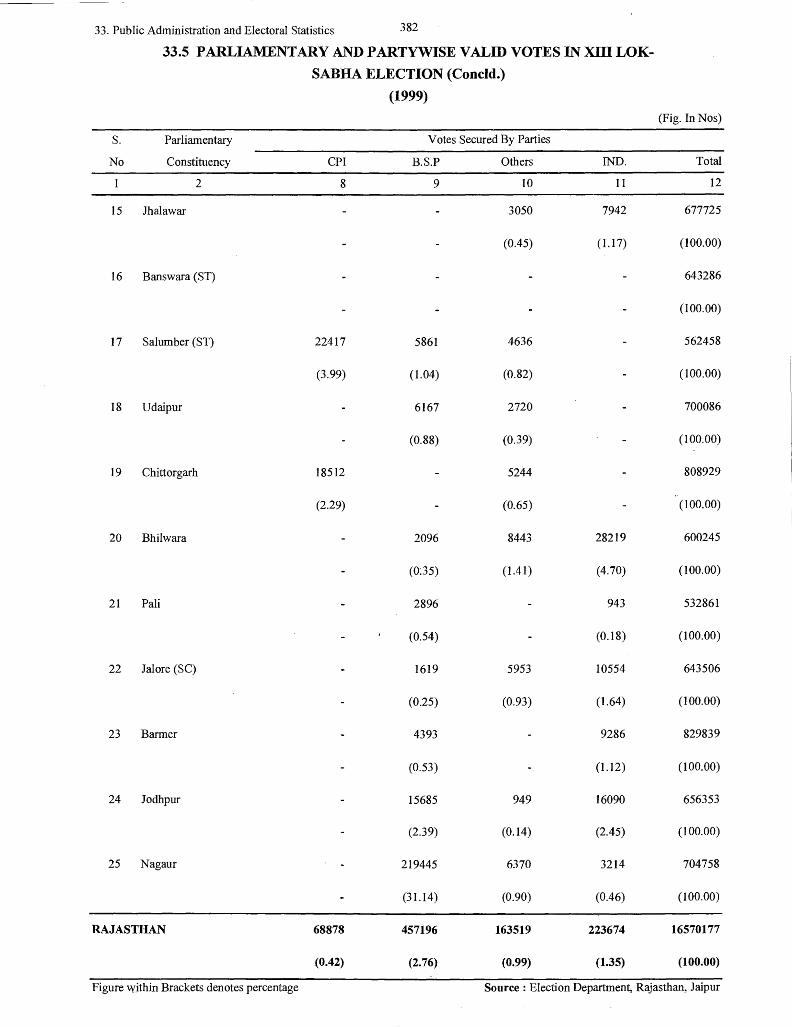
33. Public Administration and Electoral Statistics 382
33.5 PARLIAMENTARY AND P ARTYWISE VALID VOTES IN XIII LOK-
SABHA ELECTION (Concld.)
(1999)
(Fig. In Nos)
S. Parliamentary Votes Secured By Parties
No Constituency CPI B.S.P Others IND. Total
2 8 9 IO 11 12
15 Jhalawar 3050 7942 677725
(0.45) (l.17) (100.00)
16 Banswara (ST) 643286
(100.00)
17 Salumber (ST) 22417 5861 4636 562458
(3.99) (1.04) (0.82) (100.00)
18 Udaipur 6167 2720 700086
(0.88) (0.39) (100.00)
19 Chittorgarh 18512 5244 808929
(2.29) (0.65) (100.00)
20 Bhilwara 2096 8443 28219 600245
(0:35) (1.41) (4.70) (100.00)
21 Pali 2896 943 532861
(0.54) (0.18) (100.00)
22 Jalore (SC) 1619 5953 10554 643506
(0.25) (0.93) (1.64) (100.00)
23 Barmer 4393 9286 829839
(0.53) (1.12) (100.00)
24 Jodhpur 15685 949 16090 656353
(2.39) (0.14) (2.45) (100.00)
25 Nagaur 219445 6370 3214 704758
(31.14) (0.90) (0.46) (100.00)
RAJAS THAN 68878 457i96 163519 223674 16570177
(0.42) (2.76) (0.99) (1.35) (100.00)
Figure within Brackets denotes percentage Source : Election Department, Rajasthan, Jaipur
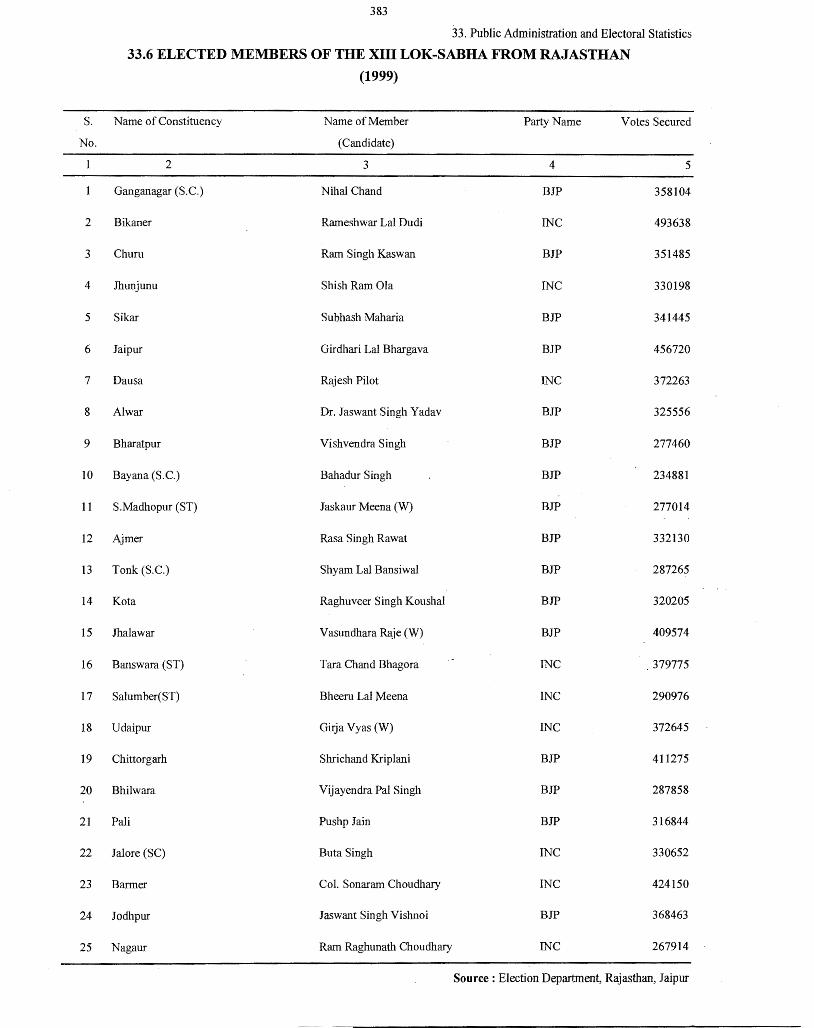
383
33. Public Administration and Electoral Statistics
33.6 ELECTED MEMBERS OF THE XIII LOK-SABHA FROM RAJASTHAN
(1999)
S. Name of Constituency Name of Member Party Name Votes Secured
No. (Candidate)
2 3 4 5
Ganganagar (S.C.) Nihal Chand BJP 358104
2 Bikaner Rameshwar Lal Dudi INC 493638
3 Chum Ram Singh Kaswan BJP 351485
4 Jhunjunu Shish Ram Ola INC 330198
5 Sikar Subhash Maharia BJP 341445
6 Jaipur Girdhari Lal Bhargava BJP 456720
7 Dausa Rajesh Pilot INC 372263
8 Al war Dr. Jaswant Singh Yadav BJP 325556
9 Bharatpur Vishvendra Singh BJP 277460
IO Bayana (S.c.) Bahadur Singh BJP 234881
11 S.Madhopur (ST) Jaskaur Meena (W) BJP 277014
12 Ajmer Rasa Singh Rawat BJP 332130
13 Tonk (S.C.) Shyam Lal Bansiwal BJP 287265
14 Ko ta Raghuveer Singh Koushal BJP 320205
15 Jhalawar Vasundhara Raje (W) BJP 409574
16 Banswara (ST) Tara Chand Bhagora INC 379775
17 Salumber(ST) Bheeru Lal Meena INC 290976
18 Udaipur Girja Vyas (W) INC 372645
19 Chittorgarh Shrichand Kriplani BJP 411275
20 Bhilwara Vijayendra Pal Singh BJP 287858
21 Pali Pushp Jain BJP 316844
22 Jalore (SC) Buta Singh INC 330652
23 Barmer Col. Sonaram Choudhary INC 424150
24 Jodhpur Jaswant Singh Vishnoi BJP 368463
25 Nagaur Ram Raghunath Choudhary INC 267914
Source : Election Department, Rajasthan, Jaipur
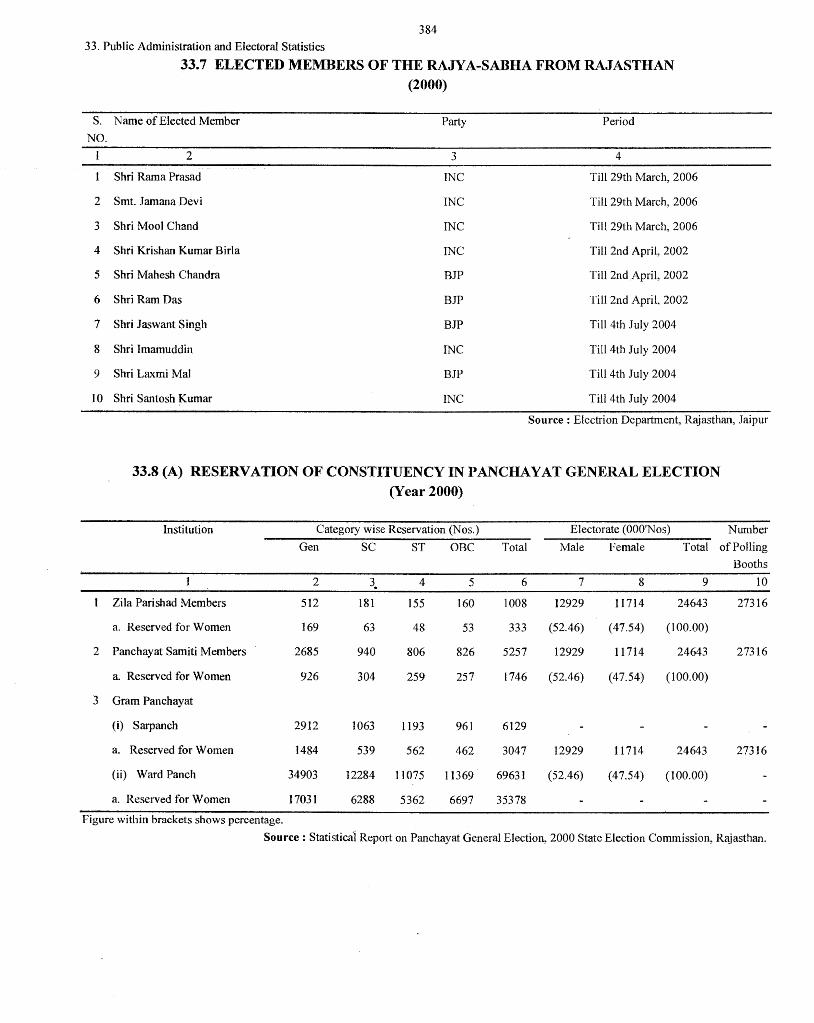
384
33. Public Administration and Electoral Statistics
S.
NO.
I
2
3
4
5
6
7
8
9
IO
2
3
33.7 ELECTED MEMBERS OF THE RAJYA-SABHA FROM RAJASTHAN (2000)
Name of Elected Member Party Period
2 3 4
Shri Rama Prasad INC Till 29th March, 2006
Smt. Jamana Devi INC Till 29th March, 2006
Shri Mool Chand INC Till 29th March, 2006
Shri Krishan Kumar Birla INC Till 2nd April, 2002
Shri Mahesh Chandra BJP Till 2nd April, 2002
Shri Ram Das BJP Till 2nd April, 2002
Shri Jaswant Singh BJP Till 4th July 2004
Shri Imamuddin INC Till 4th July 2004
Shri Laxmi Mal BJP Till 4th July 2004
Shri Santosh Kumar INC Till 4th July 2004
Source : Electrion Department, Rajasthan, Jaipur
33.8 (A) RESERVATION OF CONSTITUENCY IN PANCHAYAT GENERAL ELECTION (Year 2000)
Institution Category wise Reservation (Nos.) Electorate (OOO'Nos) Number
Gen SC ST OBC Total Male Female Total of Polling
Booths
2 3. 4 5 6 7 8 9 10
Zila Parishad Members 512 181 155 160 1008 12929 11714 24643 27316
a. Reserved for Women 169 63 48 53 333 (52.46) (47.54) (100.00)
Panchayat Samiti Members 2685 940 806 826 5257 12929 11714 24643 27316
a. Reserved for Women 926 304 259 257 1746 (52.46) (47.54) (100.00)
Gram Panchayat
( i) Sarpanch 2912 1063 1193 961 6129
a. Reserved for Women 1484 539 562 462 3047 12929 11714 24643 27316
(ii) Ward Panch 34903 12284 11075 11369 69631 (52.46) (47.54) (100.00)
a. Reserved for Women 17031 6288 5362 6697 35378
Figure within brackets shows percentage.
Source : Statistical Report on Panchayat General Election, 2000 State Election Commission, Rajasthan.
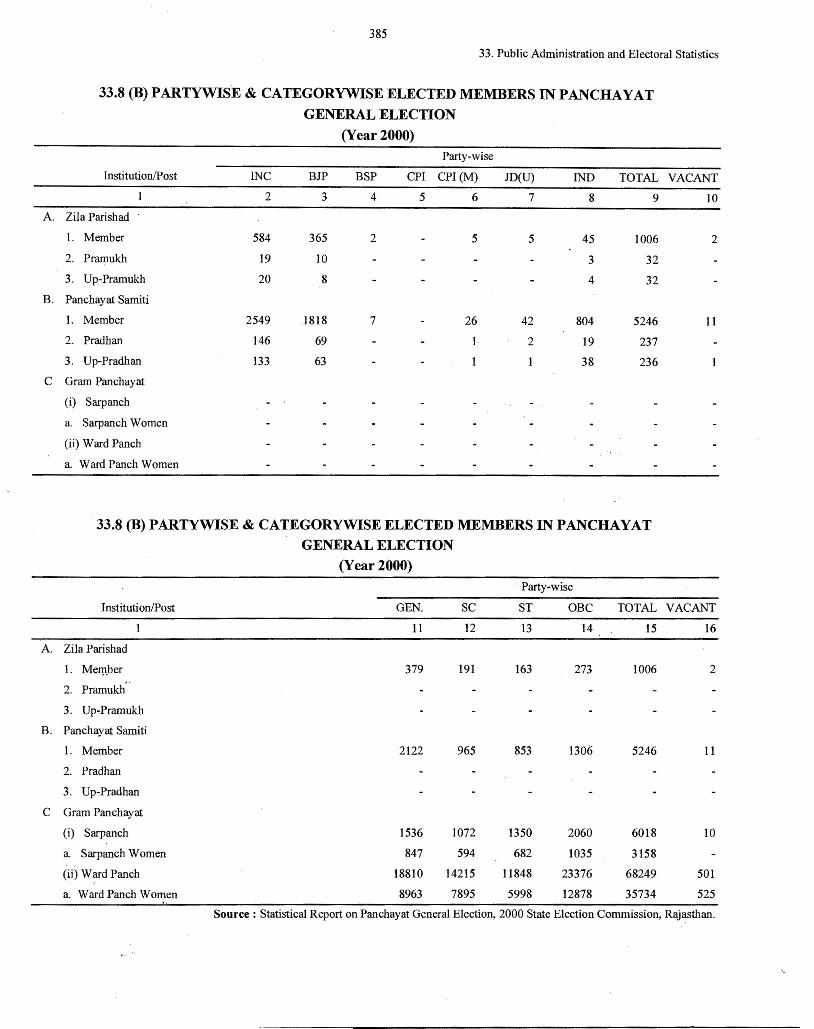
385
33. Public Administration and Electoral Statistics
33.8 (B) PARTYWISE & CATEGORYWISE ELECTED MEMBERS IN PANCHAYAT
GENERAL ELECTION
(Year 2000) Party-wise
Institution/Post INC BJP BSP CPI CPI (M) JD(U) IND TOTAL VACANT
2 3 4 5 6 7 8 9 10
A. Zila Parishad
1. Member 584 365 2 5 5 45 1006 2
2. Pramukh 19 IO 3 32
3. Up-Pramukh 20 8 4 32
B. Panchayat Samiti
1. Member 2549 .1818 7 26 42 804 5246 11
2. Pradhan 146 69 l · 2 19 237
3. Up-Pradhan 133 63 38 236
c Gram Panchayat
(i) Sarpanch
a. Sarpanch Women
(ii) Ward Panch
a. Ward Panch Women
33.8 (B) PARTYWISE & CATEGORYWISE ELECTED MEMBERS IN PANCHAYAT
GENERAL ELECTION
(Year 2000)
Party-wise
Institution/Post GEN. SC ST OBC TOTAL VACANT
11 12 13 14 15 16
A. Zila Parishad
1. Mem,ber 379 191 163 273 1006 2
2. Pramukh,,
3. Up-Pramukh
B. Panchayat Samiti
1. Member 2122 965 853 1306 5246 11
2. Pradhan
3. Up-Pradhan
c Gram Panchayat
( i) Sarpanch 1536 1072 1350 2060 6018 10
a. Sarpanch Women 847 594 682 1035 3158
(ii) Ward Panch 18810 14215 11848 23376 68249 501
a. Ward Pan ch Women 8963 7895 5998 12878 35734 525
Source : Statistical Report on Panchayat General Election, 2000 State Election Commission, Rajasthan .
.. ..
(34) ECONOMIC CENSUS
I. Introduction :-
For making concerted effort in developing infrastructure for sound and reliable data basis
particularly for the un-organised sectors of non-agricultural economy, a scheme on Economic
Census and surveys was launched by central statistical organisation, Government of India, in the
year 1976. Under this scheme the first Economic Census was conducted in 1977. The Second and
Third Economic Census was conducted during 1980 and 1990 alongwith houselisting operations of
population census 1981 and 1991 respectively. To get reliable and timely data, the· Fourth
Economic Census was conducted in June 98 independently instead of linking in with houselisting
operation of next population census. In this census information regarding location of enterprises,
description of activity, nature of operation, type of ownership, social group of owner, power/fuel
used, the total number of persons and hired persons usually working in the agricultural (excluding
crop production and plantation) and non agricultural activity were collected. The reference date for
collecting required information of fourth Economic census was 1st May, 1998.
The Economic Census (EC) in the official count of all entrepreneurial units located in the geographical boundaries of the state, involved in any economic activities of either agricultural
(Excluding crop production and plantation) or non agricultural sectors of the Economy, engaged in production and/or distribution of goods and/or services not for the sole purpos~ of own consumption.
II. Definitions :
(I) Enterprises : An enterprise is definea as undertaking engaged in production and/or
distribution of goods and/or services, which is not for the sole purpose of own consumption.
(ii) Agriculture enterprise : For. the purpose of Economic census 1998, the agriculture enterprise is defined as the enterprise engaged in raising of live stock, Agriculture services, Hunting, Trapping and Game propagation, Forestry & logging and Fisheries. The enterprise engaged in activity pertaining to agriculture production (Crop production) and plantation are not covered under the Economic census.
(iii) Non-Agriculture enterprise : The non-agriculture enterprise is defined as the enterprise
engaged in the activities other than agricultural activities.
(iv) Workers: The workers in an enterprise may consist of members of the household or hired
workers or both.
(v) Activity of the enterprise : The activity of the enterprise may be carried out at one or
more than one distinct location. The activity of the enterprise may also be carried out only for a
part of the year but on a fairly regular basis Le. it is in operation for the major part of season/year.
(vi) Ownership of an enterprise: An enterprise may be owned or operated by a single person or a single household or by several households jointly (on a partnership basis) or by an institutional body or by Government.
III. Industrial classification of Enterprises :-
All the enterprises are classified according to "revised national industrial classification 1987"
on the basis of description of activity recorded at the time of canvassing of enterprise list. All the
enterprise are classified in following sectors of economy :-
(I) Agriculture (Excluding crop production and plantation).
(ii) Mining and Quarrying.
(iii) Electricity, Gas and Water supply.
(iv) Construction
(vi) Whole sale trade. (vii) Retail trade (viii) Restaurants and Hotels
(ix) Transport
(x) Storage & Ware Housing (xi) Communications (xii) Financial, insurance, real estate & business services. (xiii) Community, Social & Personal Services.
IV. Field Functionaries
Teachers of Primary School, Patwaries, Village level workers (Gram Savak), employees of
Municipal Council/Boards were deployed as enumerators. Enumerators visited house to house/door
to door and contracted to every household/enterprise in their allotted area for collecting their required information of Fourth Economic census. Naib Tehsildars, Block Development Officers,
School lecturers, principal, Headmasters, Dy. Education Officers were appointed as supervisor to
check 2-3 Enumerators work on an average.
Tehsildars and Commissioner/Executive Officers were entrusted the work as charge officer of
their respective Tehsil or Municipal council/Board. Charge officers were fully responsible for
appointment of Enumerators/Supervisors, training to them, timely completion of field work,
Supervision, Monitoring, Quick tabulation and collection of record from them etc.
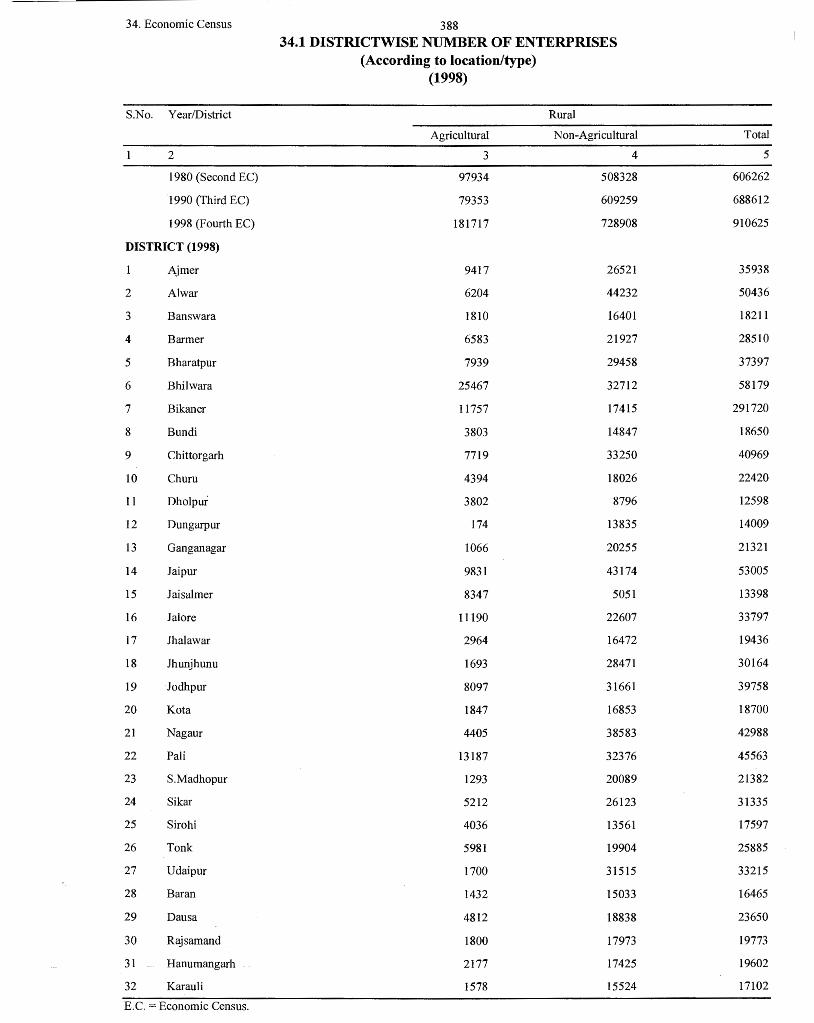
34. Economic Census 388 34.1 DISTRICTWISE NUMBER OF ENTERPRISES
(According to location/type) (1998)
S.No. Year/District Rural
Agricultural Non-Agricultural Total
2 3 4 5
1980 (Second EC) 97934 508328 606262
1990 (Third EC) 79353 609259 688612
1998 (Fourth EC) 181717 728908 910625
DISTRICT (1998)
Ajmer 9417 26521 35938
2 Alwar 6204 44232 50436
3 Banswara 1810 16401 18211
4 Barmer 6583 21927 28510
5 Bharatpur 7939 29458 37397
6 Bhilwara 25467 32712 58179
7 Bikaner 11757 17415 291720
8 Bundi 3803 14847 18650
9 Chittorgarh 7719 33250 40969
10 Chum 4394 18026 22420
11 Dholpur 3802 8796 12598
12 Dungarpur 174 13835 14009
13 Ganganagar 1066 20255 21321
14 Jaipur 9831 43174 53005
15 Jaisalmer 8347 5051 13398
16 Jal ore 11190 22607 33797
17 Jhalawar 2964 16472 19436
18 Jhunjhunu 1693 28471 30164
19 Jodhpur 8097 31661 39758
20 Ko ta 1847 16853 18700
21 Nagaur 4405 38583 42988
22 Pali 13187 32376 45563
23 S.Madhopur 1293 20089 21382
24 Sikar 5212 26123 31335
25 Sirohi 4036 13561 17597
26 Tonk 5981 19904 25885
27 Udaipur 1700 31515 33215
28 Baran 1432 15033 16465
29 Dausa 4812 18838 23650
30 Rajsamand 1800 17973 19773
31 Hanumangarh 2177 17425 19602
32 Karau Ii 1578 15524 17102
E.C. =Economic Census.
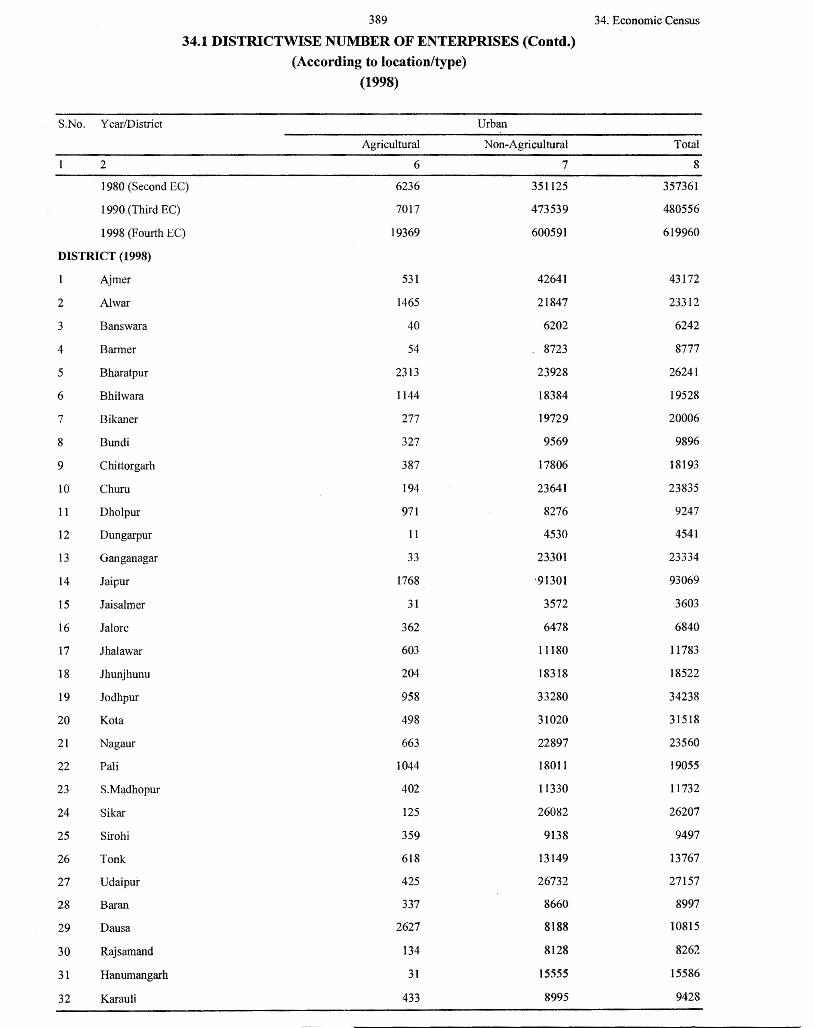
389 34. Economic Census
34.1 DISTRICTWISE NUMBER OF ENTERPRISES (Contd.)
(According to location/type)
(1998)
S.No. Year/District Urban
Agricultural Non-Agricultural Total
2 6 7 8
1980 (Second EC) 6236 351125 357361
1 990 (Third EC) 7017 473539 480556
1998 (Fourth EC) 19369 600591 619960
DISTRICT (1998)
Aimer 531 42641 43172
2 Al war 1465 21847 23312
3 Banswara 40 ·6202 6242
4 Barmer 54 8723 8777
5 Bharatpur 2313 23928 26241
6 Bhilwara 1144 18384 19528
7 Bikaner 277 19729 20006
8 Bundi 327 9569 9896
9 Chittorgarh 387 17806 18193
10 Chum 194 23641 23835
11 Dholpur 971 8276 9247
12 Dungarpur 11 4530 4541
13 Ganganagar 33 23301 23334
14 Jaipur 1768 ·91301 93069
15 Jaisalmer 31 3572 3603
16 Jal ore 362 6478 6840
17 Jhalawar 603 11180 11783
18 Jhunjhunu 204 18318 18522
19 Jodhpur 958 33280 34238
20 Ko ta 498 31020 31518
21 Nagaur 663 22897 23560
22 Pali 1044 18011 19055
23 S.Madhopur 402 11330 11732
24 Sikar 125 26082 26207
25 Sirohi 359 9138 9497
26 Tonk 618 13149 13767
27 Udaipur 425 26732 27157
28 Baran 337 8660 8997
29 Dausa 2627 8188 10815
30 Rajsamand 134 8128 8262
31 Hanumangarh 31 15555 15586
32 Karauli 433 8995 9428
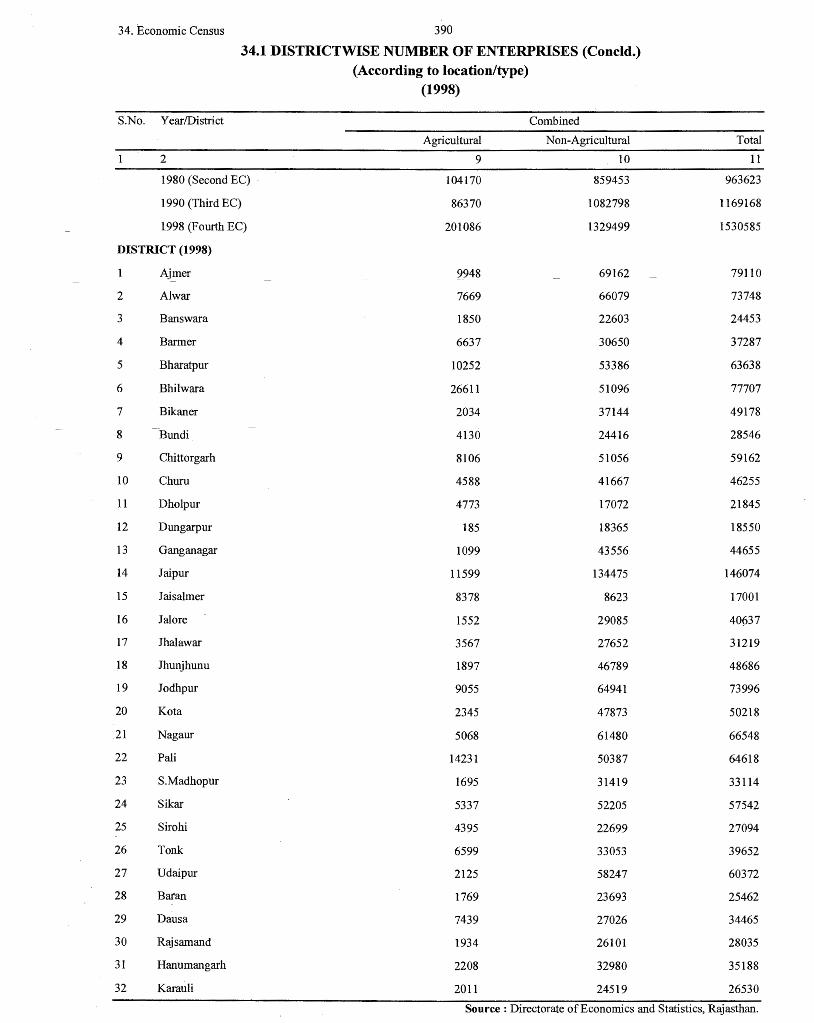
34. Economic Census 390
34.1 DISTRICTWISE NUMBER OF ENTERPRISES (Concld.) (According to location/type)
(1998)
S.No. Year/District Combined
Agricultural Non-Agricultural Total
2 9 10 11
1980 (Second EC) · 104170 859453 963623
1990 (Third EC) 86370 1082798 1169168
1998 (Fourth EC) - 201086 1329499 1530585
DISTRICT (1998)
Ajmer 9948 69162 79UO
2 Al war 7669 66079 73748
3 Banswara 1850 22603 24453
4 Barmer 6637 30650 37287
5 Bharatpur 10252 53386 63638
6 Bhilwara 26611 51096 77707
7 Bikaner 2034 37144 49178
8 Bundi 4130 24416 28546
9 Chittorgarh 8106 51056 59162
10 Churn 4588 41667 46255
11 Dholpur 4773 17072 21845
12 Dungarpur 185 18365 18550
13 Ganganagar 1099 43556 44655
14 Jaipur 11599 134475 146074
15 Jaisalmer 8378 8623 17001
16 Jalore 1552 29085 40637
17 Jhalawar 3567 27652 31219
18 Jhunjhunu 1897 46789 48686
19 Jodhpur 9055 64941 73996
20 Ko ta 2345 47873 50218
21 Nagaur 5068 61480 66548
22 Pali 14231 50387 64618
23 S.Madhopur 1695 31419 33114
24 Sikar 5337 52205 57542
25 Sirohi 4395 22699 27094
26 Tonk 6599 33053 39652
27 Udaipur 2125 58247 60372
28 Baran 1769 23693 25462
29 Dausa 7439 27026 34465
30 Rajsamand 1934 26101 28035
31 Hanumangarh 2208 32980 35188
32 Karauli 2011 24519 26530
Source : Directorate of Economics and Statistics, Rajasthan.
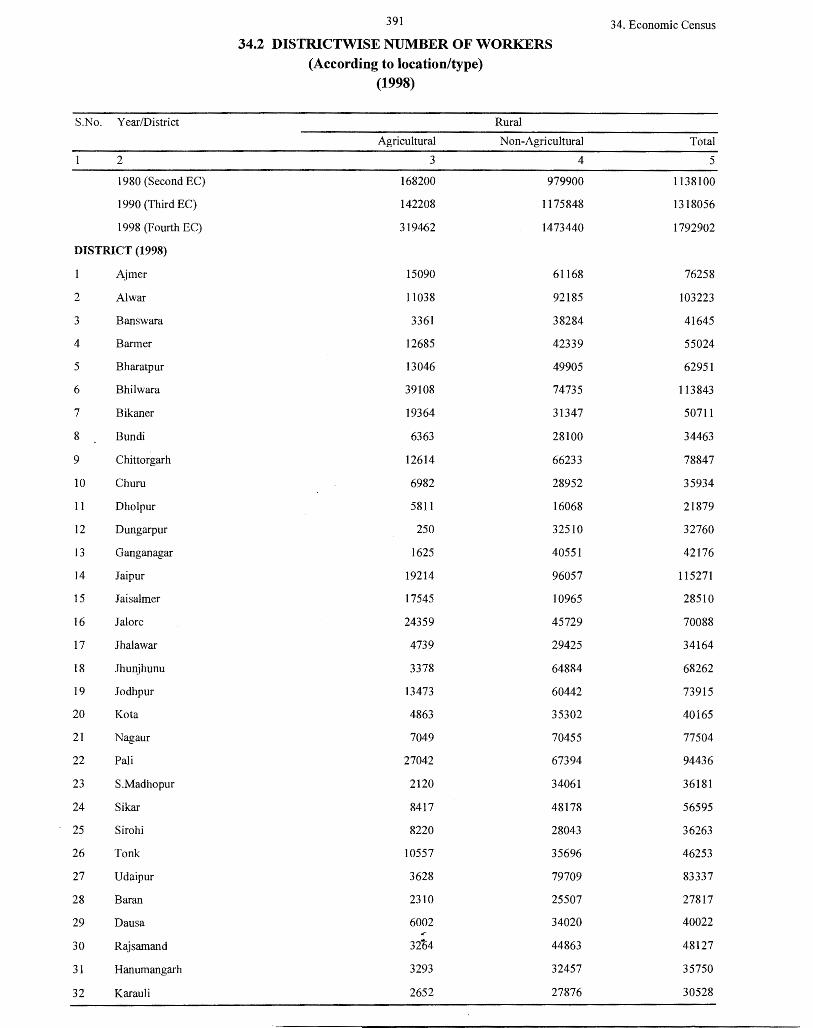
391 34. Economic Census
34.2 DISTRICTWISE NUMBER OF WORKERS (According to location/type)
(1998)
S.No. Year/District Rural
Agricultural Non-Agricultural Total
2 3 4 5
1980 (Second EC) 168200 979900 1138100
1990 (Third EC) 142208 1175848 1318056
1998 (Fourth EC) 319462 1473440 1792902
DISTRICT (1998)
Aimer 15090 61168 76258
2 Al war 11038 92185 103223
3 Banswara 3361 38284 41645
4 Barmer 12685 42339 55024
5 Bharatpur 13046 49905 62951
6 Bhilwara 39108 74735 113843
7 Bikaner 19364 31347 50711
8 Bundi 6363 28100 34463
9 Chittorgarh 12614 66233 78847
10 Chum 6982 28952 35934
11 Dholpur 5811 16068 21879
12 Dungarpur 250 32510 32760
13 Ganganagar 1625 40551 42176
14 Jaipur 19214 96057 115271
15 Jaisalmer 17545 10965 28510
16 Jal ore 24359 45729 70088
17 Jhalawar 4739 29425 34164
18 .Thunjhunu 3378 64884 68262
19 Jodhpur 13473 60442 73915
20 Ko ta 4863 35302 40165
21 Nagaur 7049 70455 77504
22 Pali 27042 67394 94436
23 S.Madhopur 2120 34061 36181
24 Sikar 8417 48178 56595
25 Sirohi 8220 28043 36263
26 Tonk 10557 35696 46253
27 Udaipur 3628 79709 83337
28 Baran 2310 25507 27817
29 Dausa 6002 34020 40022 <
30 Rajsamand 32b4 44863 48127
31 Hanumangarh 3293 32457 35750
32 Karauli 2652 27876 30528
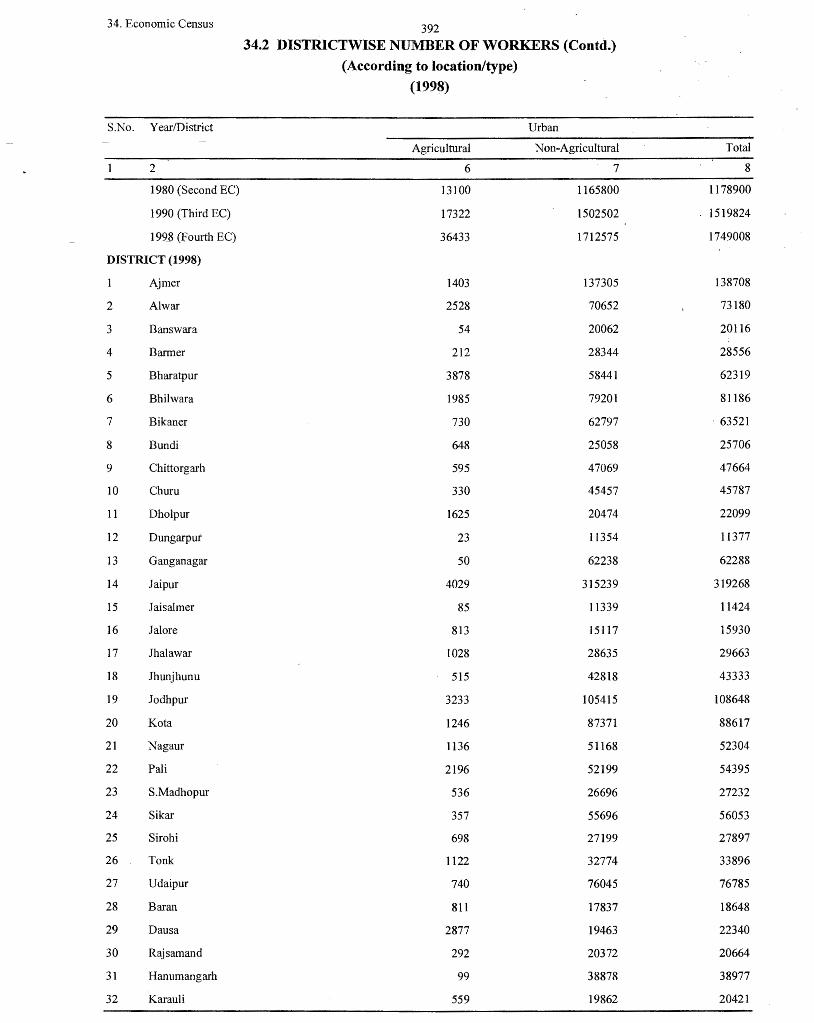
34. Economic Census 392 34.2 DISTRICTWISE NUMBER OF WORKERS (Contd.)
(According to location/type)
(1998)
S.No. Year/District Urban
Agricultural Non-Agricultural Total
2 6 7 8
1980 (Second EC) 13100 1165800 1178900
1990 (Third EC) 17322 1502502 1519824
199_B (Fourth EC) 36433 1712575 1749008
DISTRICT (1998)
Ajmer 1403 137305 138708
2 Al war 2528 70652 73180
3 Banswara 54 20062 20116
4 Barmer 212 28344 28556
5 Bharatpur 3878 58441 62319
6 Bhilwara 1985 79201 81186
7 Bikaner 730 62797 , 63521
8 Bundi 648 25058 25706
9 Chittorgarh 595 47069 47664
10 Chum 330 45457 45787
11 Dholpur 1625 20474 22099
12 Dungarput 23 11354 11377
13 Ganganagar 50 62238 62288
14 Jaipur 4029 315239 319268
15 Jaisalmer 85 11339 11424
16 Jal ore 813 15117 15930
17 Jhalawar 1028 28635 29663
18 Jhunjhunu 515 42818 43333
19 Jodhpur 3233 105415 108648
20 Ko ta 1246 87371 88617
21 Nagaur 1136 51168 52304
22 Pali 2196 52199 54395
23 S.Madhopur 536 26696 27232
24 Sikar 357 55696 56053
25 Sirohi 698 27199 27897
26 Tonk 1122 32774 33896
27 Udaipur 740 76045 76785
28 Baran 811 17837 18648
29 Dausa 2877 19463 22340
30 Rajsamand 292 20372 20664
31 Hanumangarh 99 38878 38977
32 Karauli 559 19862 20421
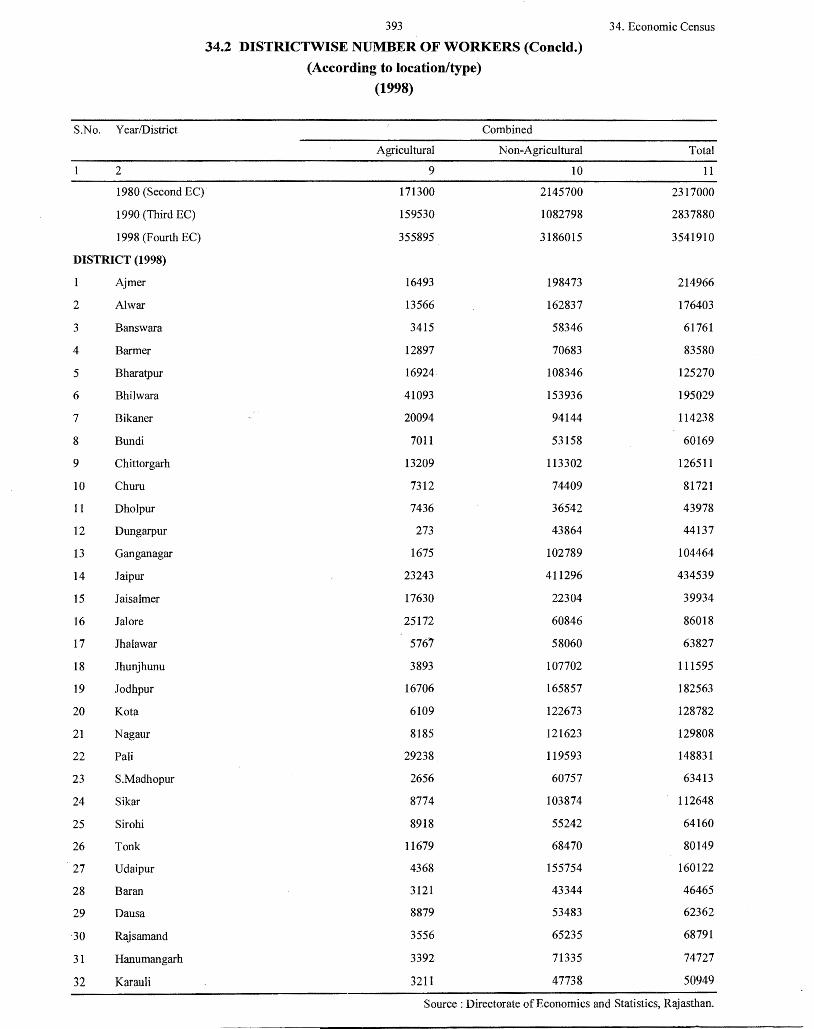
393 34. Economic Census
34.2 DISTRICTWISE NUMBER OF WORKERS (Concld.)
(According to location/type)
(1998)
S.No. Year/District Combined
Agricultural Non-Agricultural Total
2 9 10 11
1980 (Second EC)· 171300 2145700 2317000
1990 (Third EC) 159530 1082798 2837880
1998 (Fourth EC) 355895 3186015 3541910
DISTRICT (1998)
Ajmer 16493 198473 214966
2 Al war 13566 162837 176403
3 Banswara 3415 58346 61761
4 Barmer 12897 70683 83580
5 Bharatpur 16924. 108346 125270
6 Bhilwara 41093 153936 195029
7 Bikaner 20094 94144 114238
8 Bundi 7011 53158 60169
9 Chittorgarh 13209 113302 126511
10 Chum 7312 74409 81721
11 Dholpur 7436 36542 43978
12 Dungarpur 273 43864 44137
13 Ganganagar 1675 102789 104464
14 Jaipur 23243 411296 434539
15 Jaisalmer 17630 22304 39934
16 Jal ore 25172 60846 86018
17 Jhalawar 5767 58060 63827
18 Jhunjhunu 3893 107702 111595
19 .Todhpur 16706 165857 182563
20 Ko ta 6109 122673 128782
21 Nagaur 8185 121623 129808
22 Pali 29238 119593 148831
23 S.Madhopur 2656 60757 63413
24 Sikar 8774 103874 112648
25 Sirohi 8918 55242 64160
26 Tonk 11679 68470 80149
27 Udaipur 4368 155754 160122
28 Baran 3121 43344 46465
29 Dausa 8879 53483 62362
30 Rajsamand 3556 65235 68791
31 Hanumangarh 3392 71335 74727
32 Karauli 3211 47738 50949
Source: Directorate of Economics and Statistics, Rajasthan.
(35) RURAL DEVELOPMENT
Rural Development is a base for round economy. Some sectors of Rural Development like
Panchayat Raj, Rural Drinking water, village roads and Progress of Rural Schemes like, Integrated rural Development Programme (I.R.D.P.), Bio-gas and Twenty-point programme etc. have been
incorporated in tables.
Table 35.1 - This table shows districtwise number of panchayat Samities, Gram Panchayats, and
villages. It also shows districtwise area, Rural population and population of S.C. & S.T.
Table 35.2 - This table shows districtwise and schemewise drinking water facilities.
Table No. 35.3 This table shows districtwise villages connected with different type ofroads.
Table 35.4 - This table shows financial and physical districtwise progress of I.R.D.P.
Table 35.5 This table shows districtwise progress of Bio-gas in Rajasthan.
Table 35.6 - This table shows target and achievement of twenty point programme in Rajasthan.
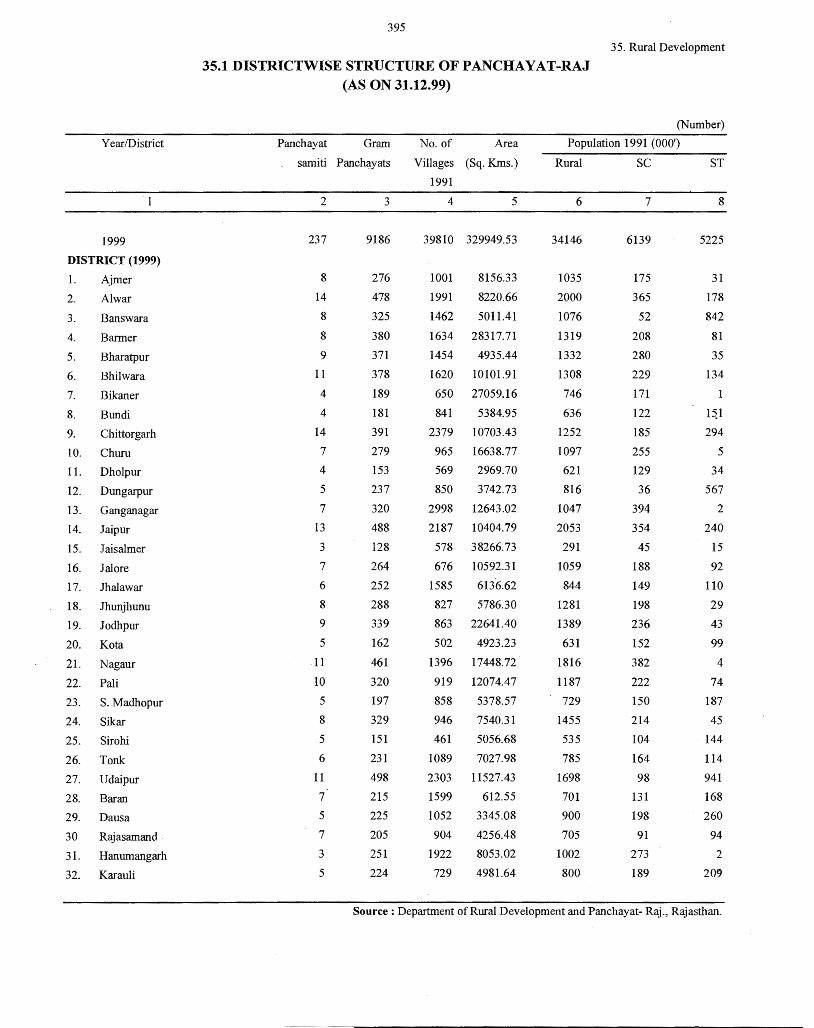
395
35. Rural Development
35.1 DISTRICTWISE STRUCTURE OF PANCHAYAT-RAJ (AS ON 31.12.99)
(Number)
Year/District Panchayat Gram No. of Area Population 1991 (000')
samiti Panch~yats Villages (Sq. Kms.) Rural SC ST
1991
2 3 4 5 6 7 8
1999 237 9186 39810 329949.53 34146 6139 5225
DISTRICT (1999)
1. Aimer 8 276 1001 8156.33 1035 175 31
2. Al war 14 478 1991 8220.66 2000 365 178
3. Banswara 8 325 1462 5011.41 1076 52 842
4. Barmer 8 380 1634 28317.71 1319 208 81
5. Bharatpur 9 371 1454 4935.44 1332 280 35
6. Bhilwara 11 378 1620 10101.91 1308 229 134
7. Bikaner 4 189 650 27059.16 746 171 1
8. Bundi 4 181 841 5384.95 636 122 l~l
9. Chittorgarh 14 391 2379 10703.43 1252 185 294
10. Chum 7 279 965 16638.77 1097 255 5
11. Dholpur 4 153 569 2969.70 621 129 34
12. Dungarpur 5 237 850 3742.73 816 36 567
13. Ganganagar 7 320 2998 12643.02 1047 394 2
14. Jaipur 13 488 2187 10404.79 2053 354 240
15. Jaisalmer 3 128 578 38266.73 291 45 15
16. Jalore 7 264 676 10592.31 1059 188 92
17. .Thal a war 6 252 1585 613.6.62 844 149 110
18. Jhunjhunu 8 288 827 5786.30 1281 198 29
19. Jodhpur 9 339 863 22641.40 1389 236 43
20. Kata 5 162 502 4923.23 631 152 99
21. Nagaur 11 461 1396 17448.72 1816 382 4
22. Pali 10 320 919 12074.47 1187 222 74
23. S. Madhopur 5 197 858 5378.57 729 150 187
24. Sikar 8 329 946 7540.31 1455 214 45
25. Sirohi 5 151 461 5056.68 535 104 144
26. Tonk 6 231 1089 7027.98 785 164 114
27. Udaipur 11 498 2303 11527.43 1698 98 941
28. Baran 7 215 1599 612.55 701 131 168
29. Daus a 5 225 1052 3345.08 900 198 260
30 Rajasamand 7 205 904 4256.48 705 91 94
31. Hanumangarh 3 251 1922 8053.02 1002 273 2
32. Karau Ii 5 224 729 4981.64 800 189 209
Source: Department of Rural Development and Panchayat- Raj., Rajasthan.
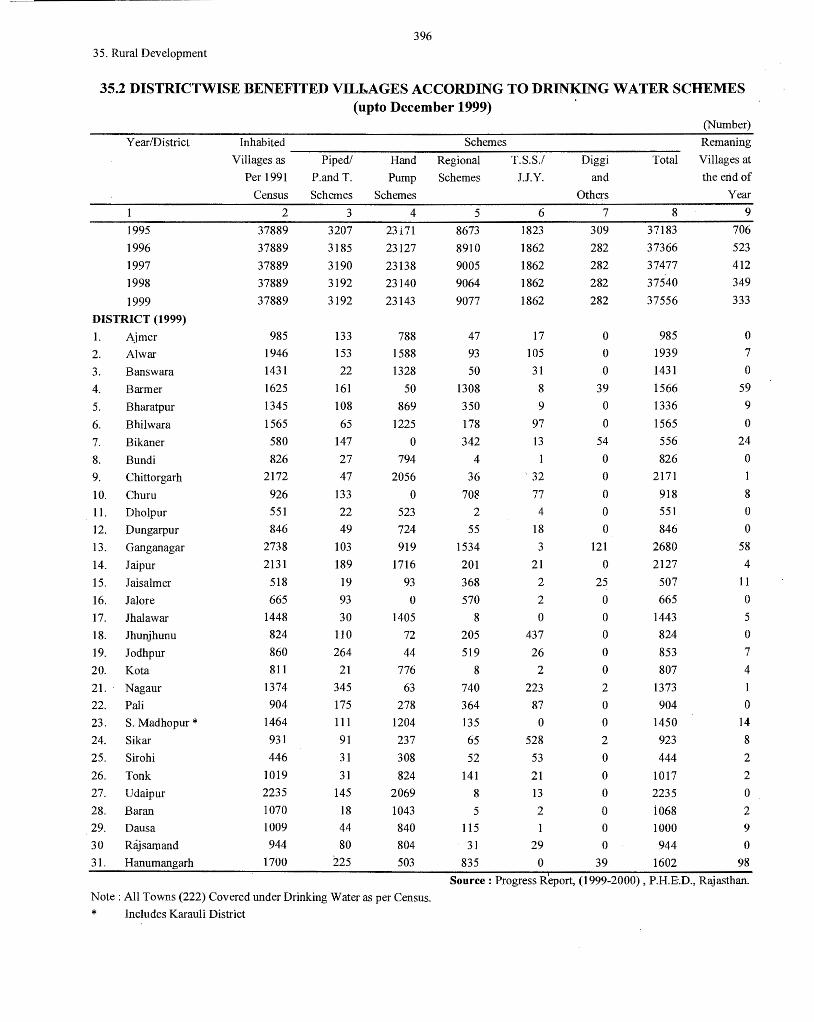
396 35. Rural Development
35.2 DISTRICTWISE BENEFITED VILiiwAGES ACCORDING TO DRINKING WATER SCHEMES (upto December 1999)
Year/District
1995 1996 1997 1998
1999 DISTRICT (1999)
I. Ajmer 2. Al war 3. Banswara 4. Barmer 5. Bharatpur 6. Bhilwara 7. Bikaner 8. Bundi 9. Chittorgarh 10. Churn 11. Dholpur 12. Dungarpur 13. Ganganagar 14. Jaipur 15. Jaisalmer 16. Jalore 17. Jhalawar 18. Jhunjhunu 19. .Todhpur 20. Kota 21. Nagaur 22. Pali 23. S. Madhopur * 24. Sikar 25. Sirohi 26. Tonk 27. Udaipur 28. Baran 29. Dausa 3 O Raj samand 31. Hanumangarh
(Number) Inhabited Schemes
~~~~~~~~~~~~~~~~~~~~~~~~-
Remaning Total Villages at
the ertd of Year
V ilia g es as Piped/ Hand Regional T.S.S./ Per 1991 P.and T. Pump Schemes J.J.Y.
Census Schemes Schemes 2
37889 37889 37889 37889 37889
985 1946 1431 1625 1345 1565 580 826
2172
926
551 846
2738 2131
518 665
1448 824 860 811
1374 904
1464 931 446
1019 2235 1070 1009 944
1700
3
3207 3185 3190 3192 3192
133 153 22
161 108 65
147 27 47
133 22 49
103 189
19 93 30
110
264 21
345 175 111
91 31 31
145 18 44 80
225
4 23171 23127 23138 23140 23143
788 1588 1328
50 869
1225 0
794 2056
0
523 724 919
1716 93 0
1405 72
44 776
63 278
1204 237 308 824
2069 1043 840 804 503
5
8673 8910 9005 9064 9077
47 93 50
1308 350 178 342
4
36 708
2
55
1534 201 368 570
8
205 519
8
740 364 135 65 52
141 8
5
115 31
835
6
1823 1862 1862 1862 1862
17 105 31
8
9
97 13 1
'32
77 4
18 3
21 2
2
0
437 26 2
223 87
0
528 53
21 13 2
1
29 0
Diggi and
Others 7
309 282 282 282 282
0
0
0
39 0
0
54 0
0
0
0
0
121 0
25 0
0
0
0
0
2
0
0
2
0
0
0
0
0
0
39
8
37183 37366 37477 37540 37556
985 1939 1431 1566 1336 1565 556 826
2171 918 551 846
2680 2127
507 665
1443 824 853 807
1373 904
1450 923 444
1017 2235 1068 1000 944
1602
9
706 523 412 349 333
0
7
0
59 9
0
24 0
1
8
0
0
58 4
11
0
5
0
7
4
1
0
14 8
2
2 0
2
9
0
98 Source : Progress Report, (1999-2000) , P.H.E.D., Rajasthan.
Note: All Towns (222) Covered under Drinking Water as per Census. * Includes Karauli District
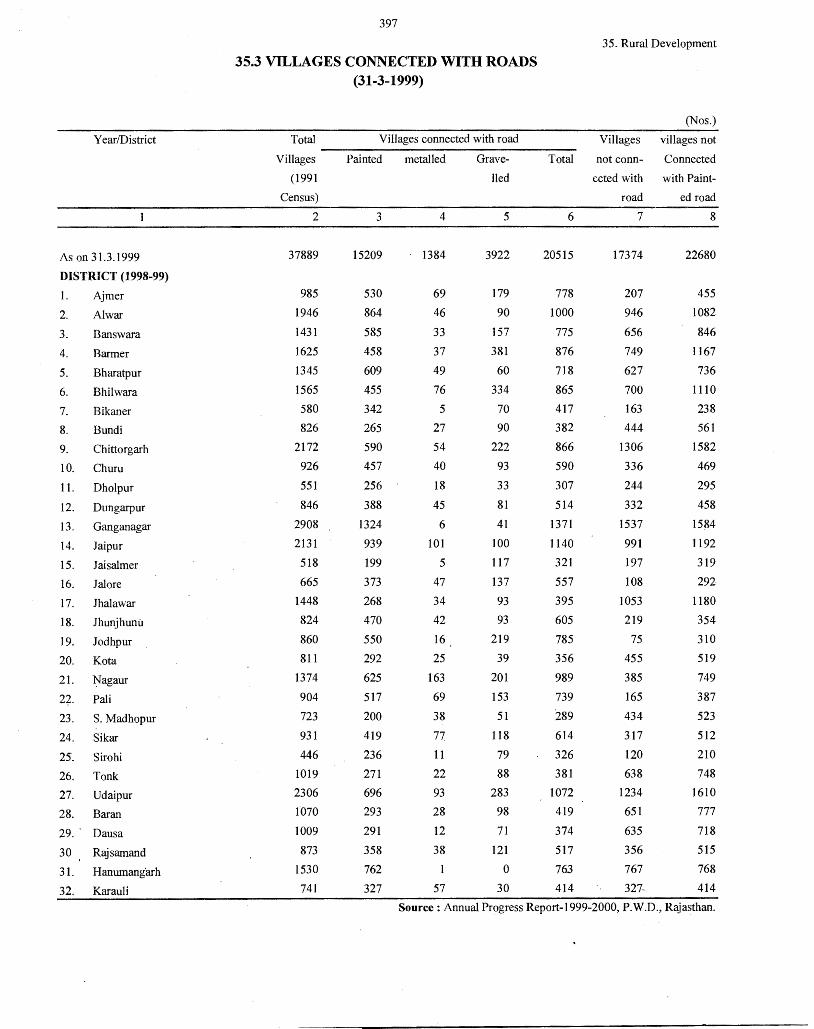
Year/District
As on 31.3.1999
DISTRICT (1998-99)
1. Ajmer
2. Al war
3. Banswara
4. Barmer
5. Bharatpur
6. Bhilwara
7. Bikaner
8. Bundi
9. Chittorgarh
10. Chum
11. Dholpur
12. Dungarpur
13. Ganganagar
14. Jaipur
15. Jaisalmer
16. Jalore
1 7. .Thalawar
18. .Thunjhunu
19. Jodhpur
20. Kota
21. ~agaur
n. Pali
23. S. Madhopur
24. Sikar
25. Sirohi
26. Tonk
27. Udaipur
28. Baran
29. · Dausa
30 Rajsamand
31. Hanumangarh
32. Karauli
397
35.3 VILLAGES CONNECTED WITH ROADS (31-3-1999)
Total Villages connected with road
35. Rural Development
(Nos.)
Villages villages not ~~~~~~~~~~~~~~~~
Villages Painted metalled Grave-
( 1991 lied
Census)
2
37889
985
1946
1431
1625
1345
1565
580
826
2172
926
551
846
2908
2131
518
665
1448
824
860
811
1374
904
723
931
446
1019
2306
1070
1009
873
1530
741
3
15209
530
864
585
458
609
455
342
265
590
457
256
388
1324
939
199
373
268
470
550
292
625
517
200
419
236
271
696
293
291
358
762
327
4
1384
69
46
33
37
49
76
5
27
54
40
18
45
6
101
5
47
34
42
16
25
163
69
38
77 11
22
93
28
12
38
57
5
3922
179
90
157
381
60
334
70
90
222
93
33
81
41
100
117
137
93
93
219
39
201
153
51
118
79
88
283
98
71
121
0
30
Total not conn- Connected
ccted with with Paint-
road ed road
6 7 8
20515
778
1000
775
876
718
865
417
382
866
590
307
514
1371
1140
321
557
395
605
785
356
989
739
'289
614
326
381
1072
419
374
517
763
414
17374
207
946
656
749
627
700
163
444
1306
336
244
332
1537
991
197
108
1053
219
75
455
385
165
434
317
120
638
1234
651
635
356
767
327-
22680
455
1082
846
1167
736
1110
238
561
1582
469
295
458
1584
1192
319
292
1180
354
310
519
749
387
523
512
210
748
1610
777
718
515
768
414
Source: Annual Progress Report-1999-2000, P.W.D., Rajasthan.
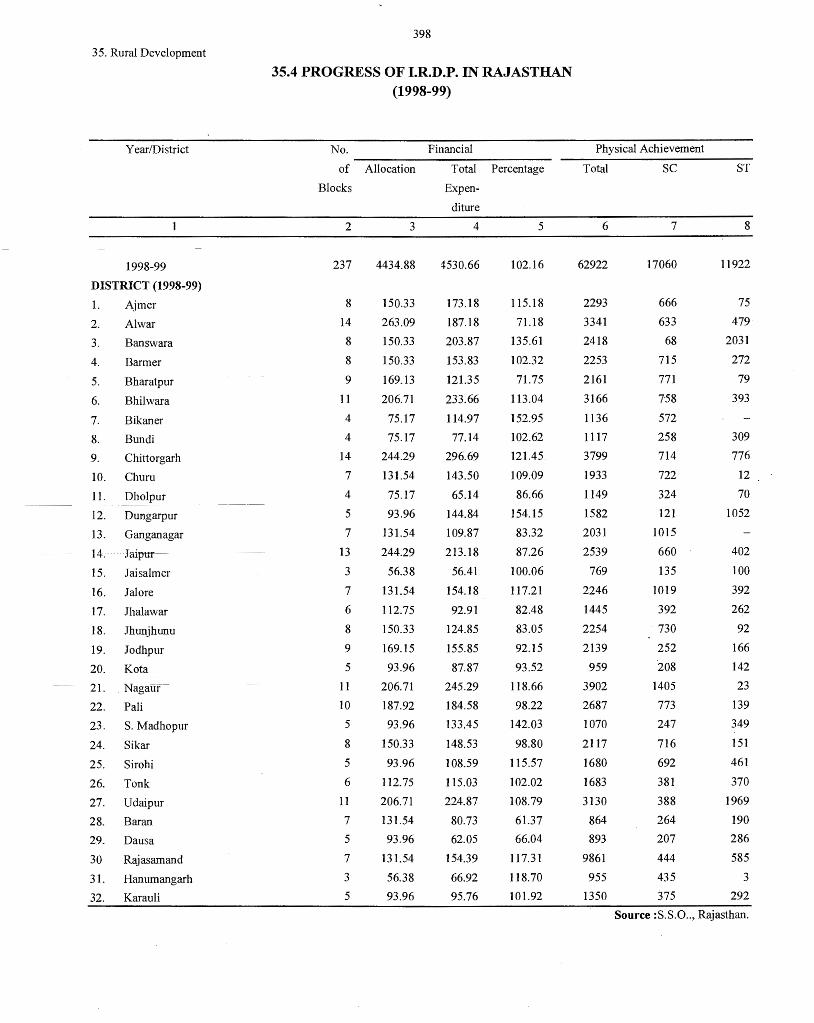
35. Rural Development
Year/District
1998-99
DISTRICT (1998-99)
1. Aimer
2. Al war
3. Banswara
4. Barmer
5. Bharatpur
6. Bhilwara
7. Bikaner
8. Bundi
9. Chittorgarh
10. Chum
11. Dholpur
12. Dungarpur
13. Ganganagar
14. Jaiptti-
15. Jaisalmer
16. Jalore
17. Jhalawar
18. Jhunjhunu
19. Jodhpur
20. Kota
21. Nagaur
22. Pali
23. S. Madhopur
24. Sikar
25. Sirohi
26. Tonk
27. Udaipur
28. Baran
29. Dausa
30 Rajasamand
3 1. Hanumangarh
32. Karauli
398
35.4 PROGRESS OF I.R.D.P. IN RA.JASTHAN (1998-99)
No. Financial
of Allocation Total Percentage
Blocks Expen-
2
237
8
14
8
8
9
11
4
4
14
7
4
5
7
13
3
7
6
8
9
5
11
10
5
8
5
6
11
7
5
7
3
5
3
4434.88
150.33
263.09
150.33
150.33
169.13
206.71
75.17
75.17
244.29
131.54
75.17
93.96
131.54
244.29
56.38
131.54
112.75
150.33
169.15
93.96
206.71
187.92
93.96
150.33
93.96
112.75
206.71
131.54
93.96
131.54
56.38
93.96
diture
4
4530.66
173.18
187.18
403.87
153.83
121.35
233.66
114.97
77.14
296.69
143.50
65.14
144.84
109.87
213.18
56.41
154.18
92.91
124.85
155.85
87.87
245.29
184.58
133.45
148~53
108.59
115.03
224.87
80.73
62.05
154.39
66.92
95.76
5
102.16
115.18
71.18
135.61
102.32
71.75
113.04
152.95
102.62
121.45
109.09
86.66
154.15
83.32
87.26
100.06
117.21
82.48
83.05
92.15
93.52
118.66
98.22
142.03
98.80
115.57
102.02
108.79
61.37
66.04
117.31
118.70
101.92
Physical Achievement
Total SC
6
62922
2293
3341
2418
2253
2161
3166
1136
1117
3799
1933
1149
1582
2031
2539
769
2246
1445
2254
2139
959
3902
2687
1070
2117
1680
1683
3130
864
893
9861
955
1350
7
17060
666
633
68
715
771
758
572
258
714
722
324
121
1015
660
135
1019
392
730
252
208
1405
773
247
716
692
381
388
264
207
444
435
375
ST
8
11922
75
479
2031
272
79
393
309
776
12
70
1052
402
100
392
262
92
166
142
23
139
349
151
461
370
1969
190
286
585
3
292
Source :S.S.O .. , Rajasthan.
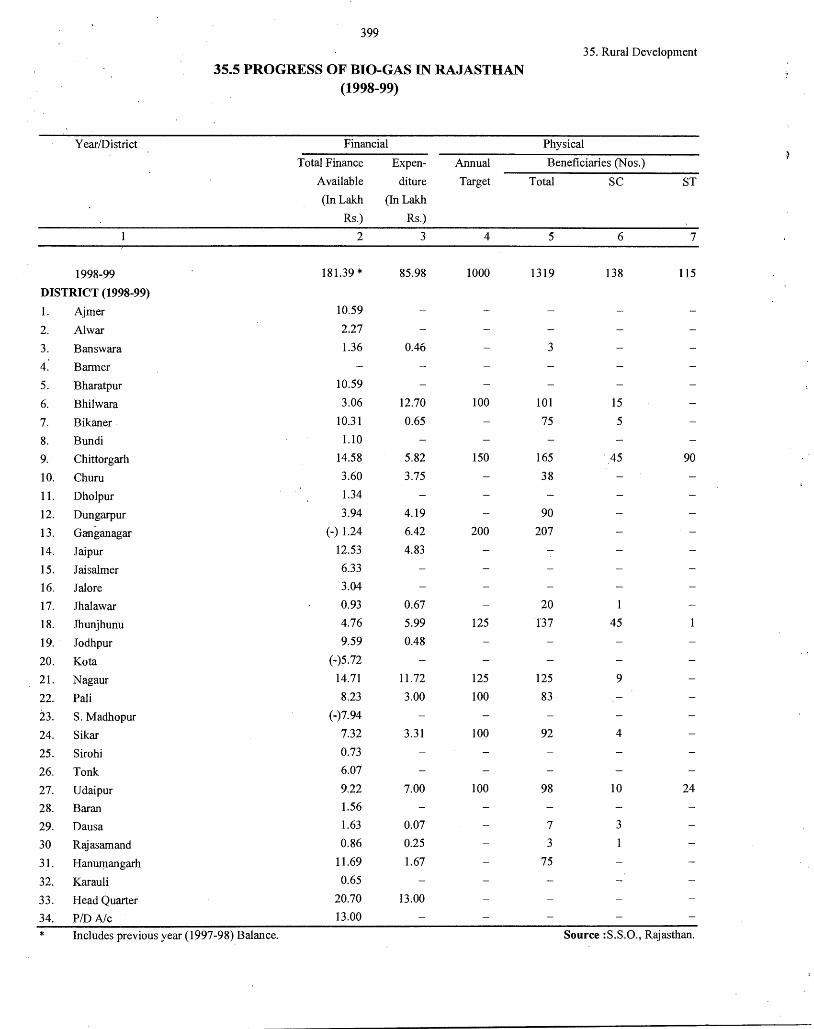
Year/District
1998-99
DISTRICT (1998-99)
1. Ajmer
2. Al war
3. Banswara
4.' Barmer
5. Bharatpur
6. Bhilwara
7. Bikaner
8. Bundi
9. Chittorgarh
10. Chum
11. Dholpur
12. Dungarpur
13. Ganganagar
14. Jaipur
15. Jaisalmer
16. Jal ore
17. Jhalawar
18. Jhunjhunu
19. Jodhpur
20. Ko ta
21. Nagaur
22. Pali
23. S.Madhopur
24. Sikar
25. Sirohi
26. Tonk
27. Udaipur
28. Baran
29. Dausa
30 Rajasamand
31. Hanurµangarh
32. Karau Ii
33. Head Quarter
34. PIDNc
399
35.5 PROGRESS OF BIO-GAS IN RAJASTHAN (1998-99)
Financial
Total Finance Expen- Annual
Available diture Target
(In Lakh (In Lakh
Rs.) Rs.)
2 3 4
181.39 * 85.98 1000
10.59
2.27
1.36 0.46
10.59
3.06 12.70 100
10.31 0.65
1.10
14.58 5.82 150
3.60 3.75
1.34
3.94 4.19
(-) 1.24 6.42 200
12.53 4.83
6.33
3.04
0.93 0.67
4.76 5.99 125
9.59 0.48
(-)5.72
14.71 11.72 125
8.23 3.00 100
(-)7.94
7.32 3.31 100
0.73
6.07
9.22 7.00 100
1.56
1.63 0.07
0.86 0.25
11.69 1.67
0.65
20.70 13.00
13.00
* Includes previous year (1997-98) Balance.
35. Rural Development
Physical
Beneficiaries (Nos.)
Total SC ST
5 6 7
1319 138 115
3
101 15
75 5
165 45 90
38
90
207
20
B7 45
125 9
83
92 4
98 10 24
7 3
3
75
Source :S.S.O., Rajasthan.
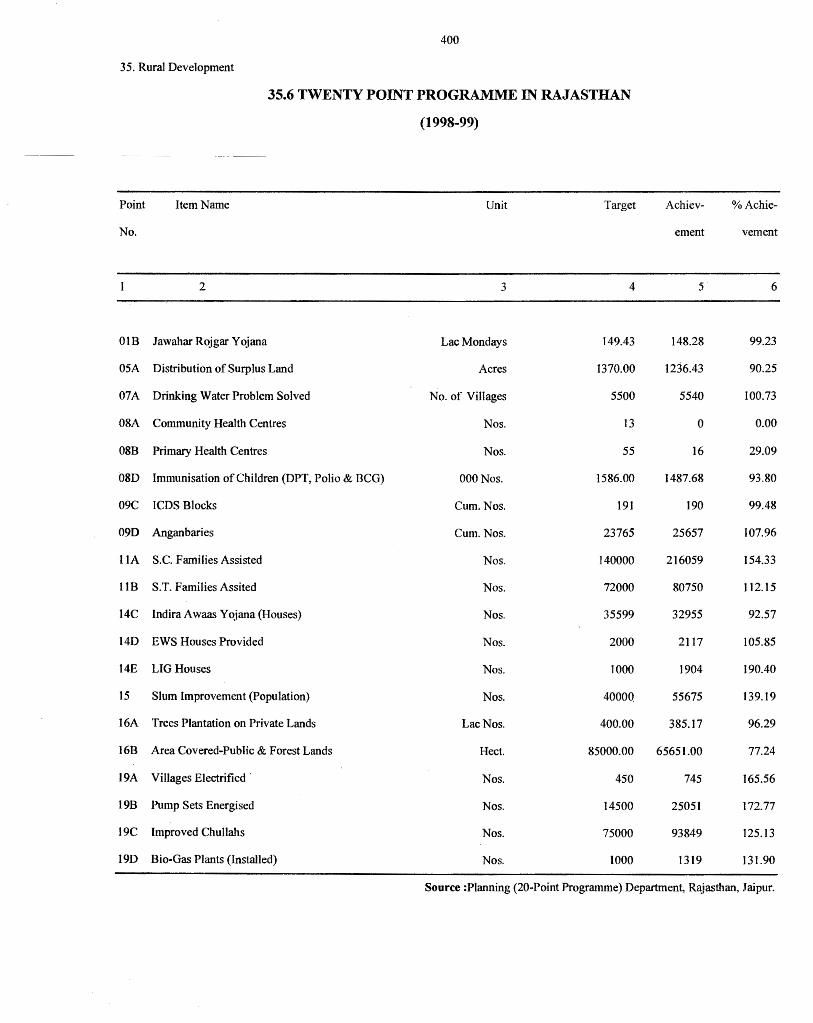
400
35. Rural Development
Point
No.
OlB
05A
07A
08A
08B
08D
09C
09D
llA
llB
14C
14D
14E
15
16A
16B
19A
19B
19C
19D
35.6 TWENTY POINT PROGRAMME IN RAJASTHAN
(1998-99)
Item Name Unit Target
2 3 4
Jawahar Rojgar Y ojana Lac Mondays 149.43
Distribution of Surplus Land Acres 1370.00
Drinking Water Problem Solved No. of Villages 5500
Community Health Centres Nos. 13
Primary Health Centres Nos. 55
Immunisation of Children (DPT, Polio & BCG) OOONos. 1586.00
ICDS Blocks Cum. Nos. 191
Anganbaries Cum. Nos. 23765
S.C. Families Assisted Nos. 140000
S.T. Families Assited Nos. 72000
Indira Awaas Yojana (Houses) Nos. 35599
EWS Houses Provided Nos. 2000
LIG Houses Nos. 1000
Slum Improvement (Population) Nos. 40000.
Trees Plantation on Private Lands Lac Nos. 400.00
Area Covered-Public & Forest Lands Hect. 85000.00
Villages Electrified · Nos. 450
Pump Sets Energised Nos. 14500
Improved Chullahs Nos. 75000
Bio-Gas Plants (Installed) Nos. 1000
Achiev
ement
5
148.28
1236.43
5540
0
16
1487.68
190
25657
216059
80750
32955
2117
1904
55675
385.17
65651.00
745
25051
93849
1319
%Achie-
vement
6
99.23
90.25
100.73
0.00
29.09
93.80
99.48
107.96
154.33
112.15
92.57
105.85
190.40
139.19
96.29
77.24
165.56
172.77
125.13
131.90
Source :Planning (20-Point Programme) Department, Rajasthan, Jaipur.
(36) MISCELLANEOUS
This section presents data on certain important items which have not been included under any particular section. The data has been compiled from various regular returns obtained from
concerned Departments and public bodies.
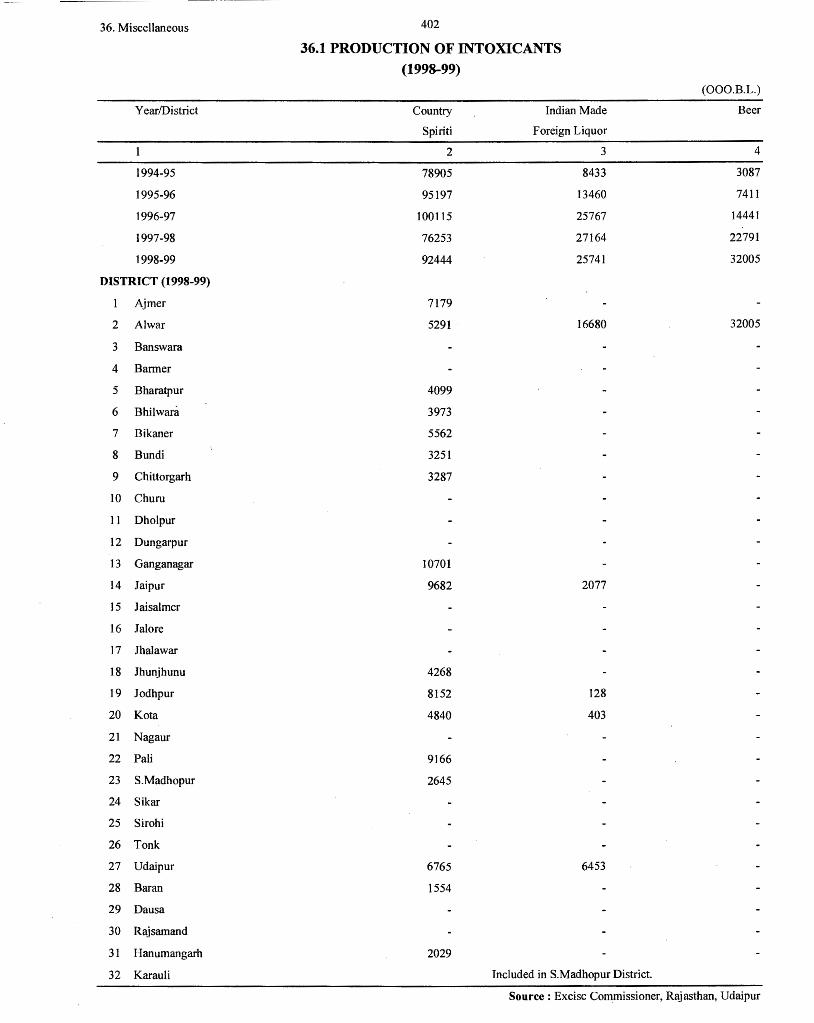
36. Miscellaneous
Year/District
1994-95
1995-96
1996-97
1997-98
1998-99
DISTRICT (1998-99)
Ajmer
2 Al war
3 Banswara
4 Barmer
5 Bharatpur
6 Bhilwara
7 Bikaner
8 Bundi
9 Chittorgarh
IO Churn
11 Dholpur
12 Dungarpur
13 Ganganagar
14 Jaipur
15 Jaisalmer
16 Jal ore
17 Jhalawar
18 Jhunjhunu
19 Jodhpur
20 Kota
21 Nagaur
22 Pali
23 S.Madhopur
24 Sikar
25 Sirohi
26 Tonk
27 Udaipur
28 Baran
29 Dausa
30 Rajsamand
31 Hanumangarh
32 Karau Ii
402
36.1 PRODUCTION OF INTOXICANTS
(1998-99)
Country
Spiriti
2
78905
95197
100115
76253
92444
7179
5291
4099
3973
5562
3251
3287
10701
9682
4268
8152
4840
9166
2645
6765
1554
2029
Indian Made
Foreign Liquor
3
8433
13460
25767
27164
25741
16680
2077
128
403
6453
Included in S.Madhopur District.
(000.B.L.)
Beer
4
3087
7411
14441
22791
32005
32005
Source: Excise Commissioner, Rajasthan, Udaipur
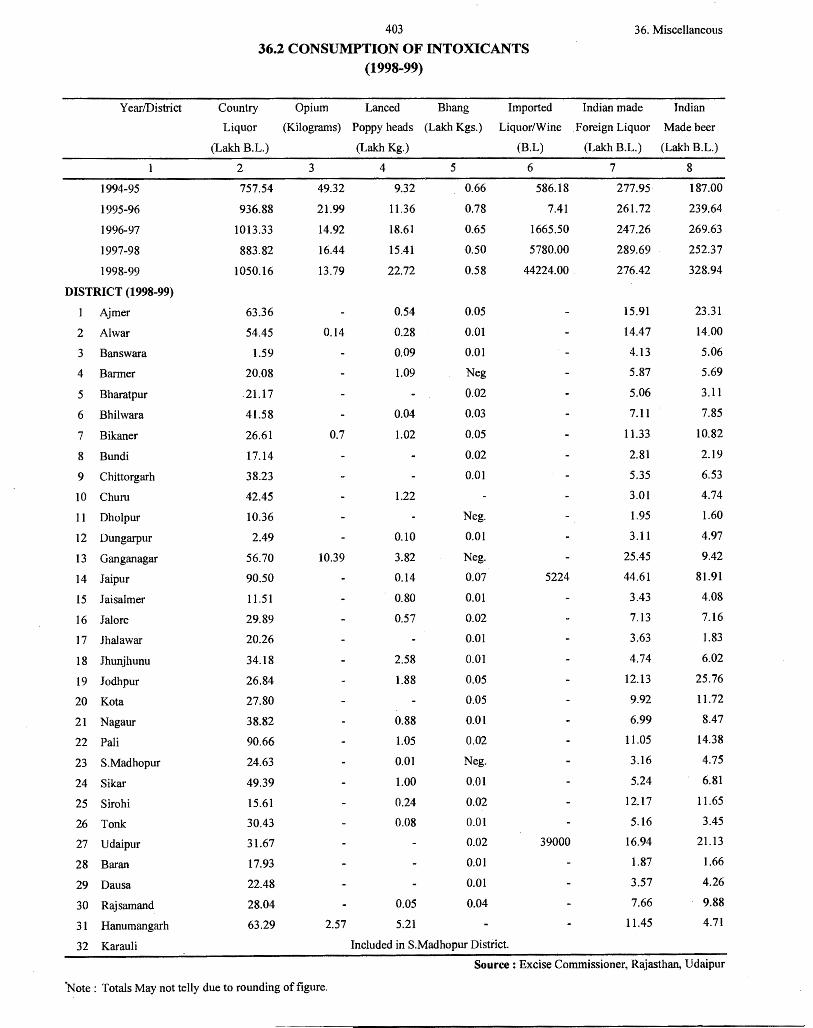
403 36. Miscellaneous
36.2 CONSUMPTION OF INTOXICANTS (1998-99)
Year/District Country Opium Lanced Bhang Imported Indian made Indian
Liquor (Kilograms) Poppy heads (Lakh Kgs.) Liquor/Wine Foreign Liquor Made beer
(Lakh B.L.) (Lakh Kg.) (B.L) (Lakh B.L.) (Lakh B.L.)
2 3 4 5 6 7 8
1994-95 757.54 49.32 9.32 0.66 586.18 277.95 187.00
1995-96 936.88 21.99 11.36 0.78 7.41 261.72 239.64
1996-97 1013.33 14.92 18.61 0.65 1665.50 247.26 269.63
1997-98 883.82 16.44 15.41 0.50 5780.00 289.69 252.37
1998-99 1050.16 13.79 22.72 0.58 44224.00 276.42 328.94
DISTRICT (1998-99)
1 Aimer 63.36 0.54 0.05 15.91 23.31
2 Al war 54.45 0.14 0.28 O.ot 14.47 14.00
3 Banswara 1.59 0.09 O.ot 4.13 5.06
4 Barmer 20.08 1.09 Neg 5.87 5.69
5 Bharatpur .21.17 0.02 5.06 3.11
6 Bhilwara 41.58 0.04 O.o3 7.11 7.85
7 Bikaner 26.61 0.7 1.02 0.05 11.33 10.82
8 Bundi 17.14 0.02 2.81 2.19
9 Chittorgarh 38.23 O.ot 5.35 6.53
10 Churu 42.45 1.22 3.01 4.74
11 Dholpur 10.36 Neg. 1.95 1.60
12 Dungarpur 2.49 0.10 0.01 3.11 4.97
13 Ganganagar 56.70 10.39 3.82 Neg. 25.45 9.42
14 Jaipur 90.50 0.14 0.o7 5224 44.61 81.91
15 Jaisalmer 11.51 0.80 O.ot 3.43 4.08
16 Jal ore 29.89 0.57 0.02 7.13 7.16
17 Jhalawar 20.26 O.ot 3.63 1.83
18 Jhunjhunu 34.18 2.58 0.01 4.74 6.02
19 Jodhpur 26.84 1.88 0.05 12.13 25.76
20 Ko ta 27.80 0.05 9.92 11.72
21 Nagaur 38.82 0.88 0.01 6.99 8.47
22 Pali 90.66 1.05 0.02 11.05 14.38
23 S.Madhopur 24.63 O.ot Neg. 3.16 4.75
24 Sikar 49.39 1.00 0.01 5.24 6.81
25 Sirohi 15.61 0.24 0.02 12.17 11.65
26 Tonk 30.43 0.08 0.01 5.16 3.45
27 Udaipur 31.67 0.02 39000 16.94 21.13
28 Baran 17.93 0.01 1.87 1.66
29 Dausa 22.48 O.ot 3.57 4.26
30 Rajsamand 28.04 0.05 0.04 7.66 9.88
31 Hanumangarh 63.29 2.57 5.21 11.45 4.71
32 Karauli Included in S.Madhopur District.
Source: Excise Commissioner, Rajasthan, Udaipur
·Note: Totals May not telly due to rounding of figure.
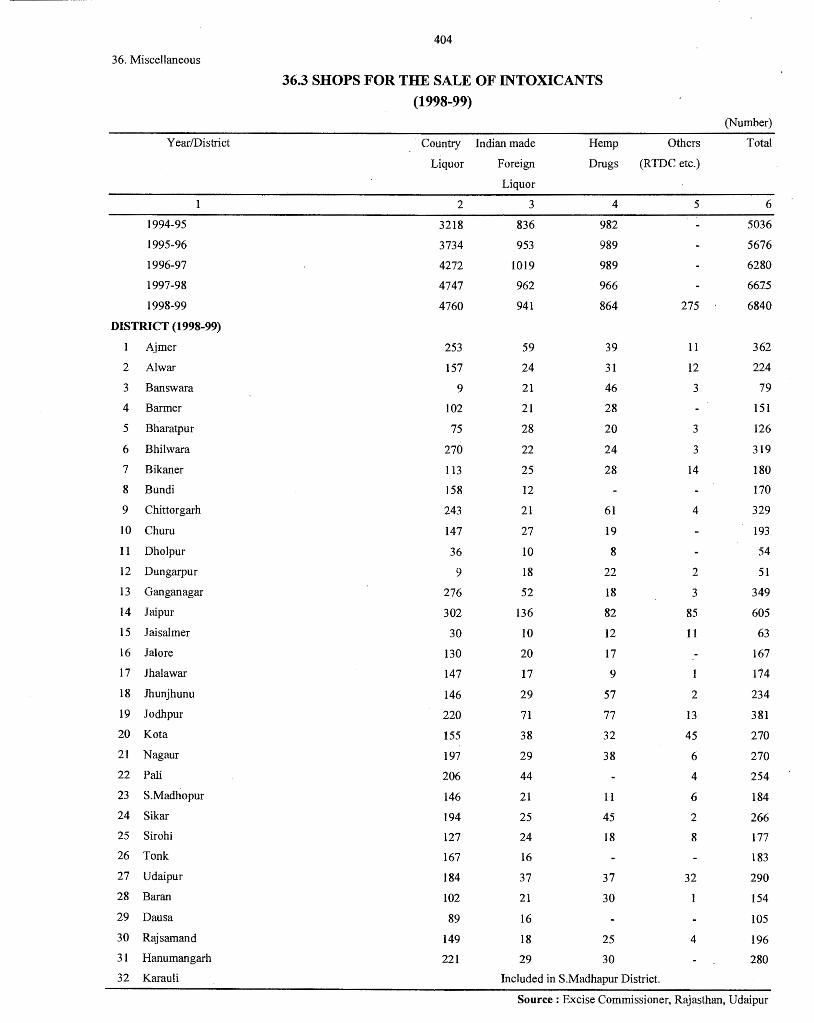
404
36. Miscellaneous
36.3 SHOPS FOR THE SALE OF INTOXICANTS
(1998-99)
(Number)
Year/District Country Indian made Hemp Others Total
Liquor Foreign Drugs (RTDC etc.)
Liquor
2 3 4 5 6
1994-95 3218 836 982 5036
1995-96 3734 953 989 5676
1996-97 4272 1019 989 6280
1997-98 4747 962 966 6615
1998-99 4760 941 864 275 6840
DISTRICT (1998-99)
Ajmer 253 59 39 11 362
2 Al war 157 24 31 12 224
3 Banswara 9 21 46 3 79
4 Barmer 102 21 28 151
5 Bharatpur 75 28 20 3 126
6 Bhilwara 270 22 24 3 319
7 Bikaner 113 25 28 14 180
8 Bundi 158 12 170
9 Chittorgarh 243 21 61 4 329
10 Churu 147 27 19 193
11 Dholpur 36 10 8 54
12 Dungarpur 9 18 22 2 51
13 Ganganagar 276 52 18 3 349
14 Jaipur 302 136 82 85 605
15 .Taisalmer 30 10 12 11 63
16 Jal ore 130 20 17 167
17 Jhalawar 147 17 9 174
18 Jhunjhunu 146 29 57 2 234
19 Jodhpur 220 71 77 13 381
20 Kot a 155 38 32 45 270
21 Nagaur 197 29 38 6 270
22 Pali 206 44 4 254
23 S.Madhopur 146 21 11 6 184
24 Sikar 194 25 45 2 266
25 Sirohi 127 24 18 8 177
26 Tonk 167 16 183
27 Udaipur 184 37 37 32 290
28 Baran 102 21 30 1 154
29 Dausa 89 16 105
30 Rajsamand 149 18 25 4 196
31 Hanumangarh 221 29 30 280
32 Karau Ii Included in S.Madhapur District.
Source: Excise Commissioner, Rajasthan, Udaipur
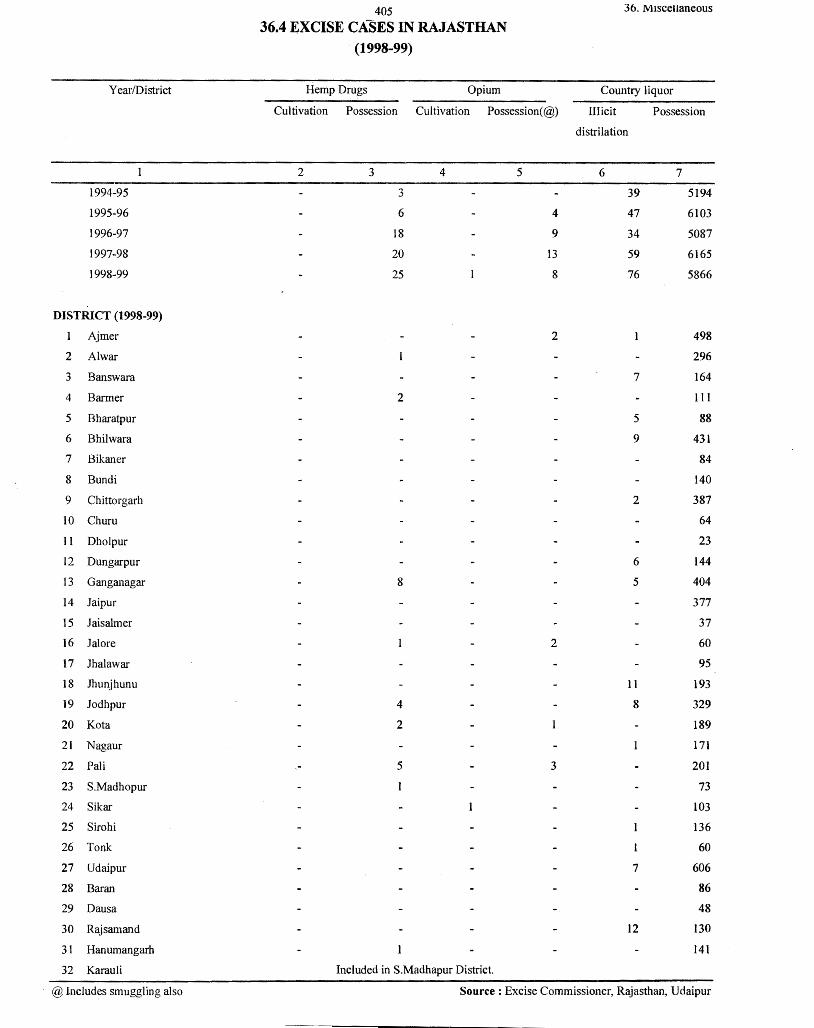
405 36. Miscellaneous
36.4 EXCISE CASES IN RAJASTHAN (1998-99)
Year/District Hemp Drugs Opium Country liquor
Cultivation Possession Cultivation Possession(@) IIIicit Possession
distrilation
2 3 4 5 6 7
1994-95 3 39 5194
1995-96 6 4 47 6103
1996-97 18 9 34 5087
1997-98 20 13 59 6165
1998-99 25 8 76 5866
DISTRICT (1998-99)
Ajmer 2 498
2 Al war 296
3 Banswara 7 164
4 Barmer 2 111
5 Bharatpur 5 88
6 Bhilwara 9 431
7 Bikaner 84
8 Bundi 140
9 Chittorgarh 2 387
10 Chum 64
11 Dholpur 23
12 Dungarpur 6 144
13 Ganganagar 8 5 404
14 Jaipur 377
15 Jaisalmer 37
16 Jalore 2 60
17 Jhalawar 95
18 Jhunjhunu 11 193
19 Jodhpur 4 8 329
20 Ko ta 2 189
21 Nagaur 171
22 Pali 5 3 201
23 S.Madhopur 73
24 Sikar 103
25 Sirohi 136
26 Tonk 60
27 Udaipur 7 606
28 Baran 86
29 Dausa 48
30 Rajsamand 12 130
31 Hanumangarh 141
32 Karauli Included in S.Madhapur District.
@ Includes smuggling also Source: Excise Commissioner, Rajasthan, Udaipur
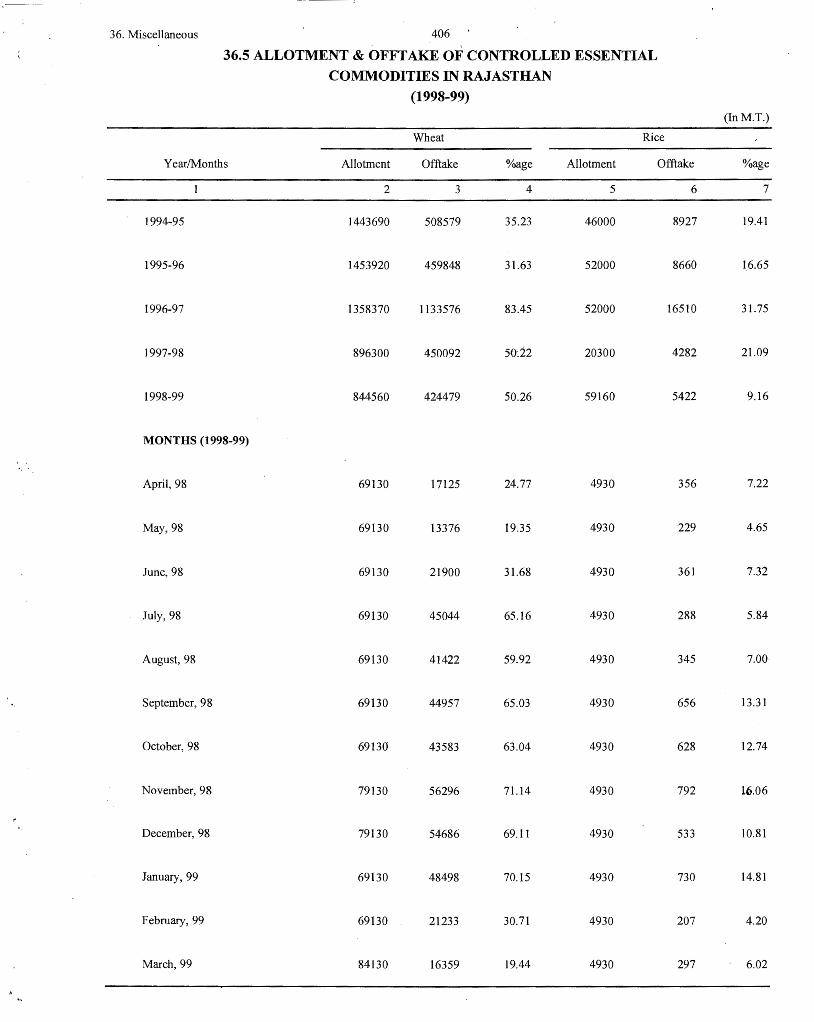
36. Miscellaneous 406
36.5 ALLOTMENT & OFFTAKE OF CONTROLLED ESSENTIAL
COMMODITIES IN RAJASTHAN
(1998-99)
(In M.T.)
Wheat Rice
Year/Months Allotment Offtake %age Allotment Offtake %age
2 3 4 5 6 7
1994-95 1443690 508579 35.23 46000 8927 19.41
1995-96 1453920 459848 31.63 52000 8660 16.65
1996-97 1358370 1133576 83.45 52000 16510 31.75
1997-98 896300 450092 5-fr.22 20300 4282 21.09
1998-99 844560 424479 50.26 59160 5422 9.16
MONTHS (1998-99)
April, 98 69130 17125 24.77 4930 356 7.22
May, 98 69130 13376 19.35 4930 229 4.65
June, 98 69130 21900 31.68 4930 361 7.32
July, 98 69130 45044 65.16 4930 288 5.84
August, 98 69130 41422 59.92 4930 345 7.00-
September, 98 69130 44957 65.03 4930 656 13.31
October, 98 69130 43583 63.04 4930 628 12.74
November, 98 79130 56296 71.14 4930 792 Ui.06
December, 98 79130 54686 69.11 4930 533 10.81
January, 99 69130 48498 70.15 4930 730 14.81
February, 99 69130 21233 30.71 4930 207 4.20
March, 99 84130 16359 19.44 4930 297 6.02
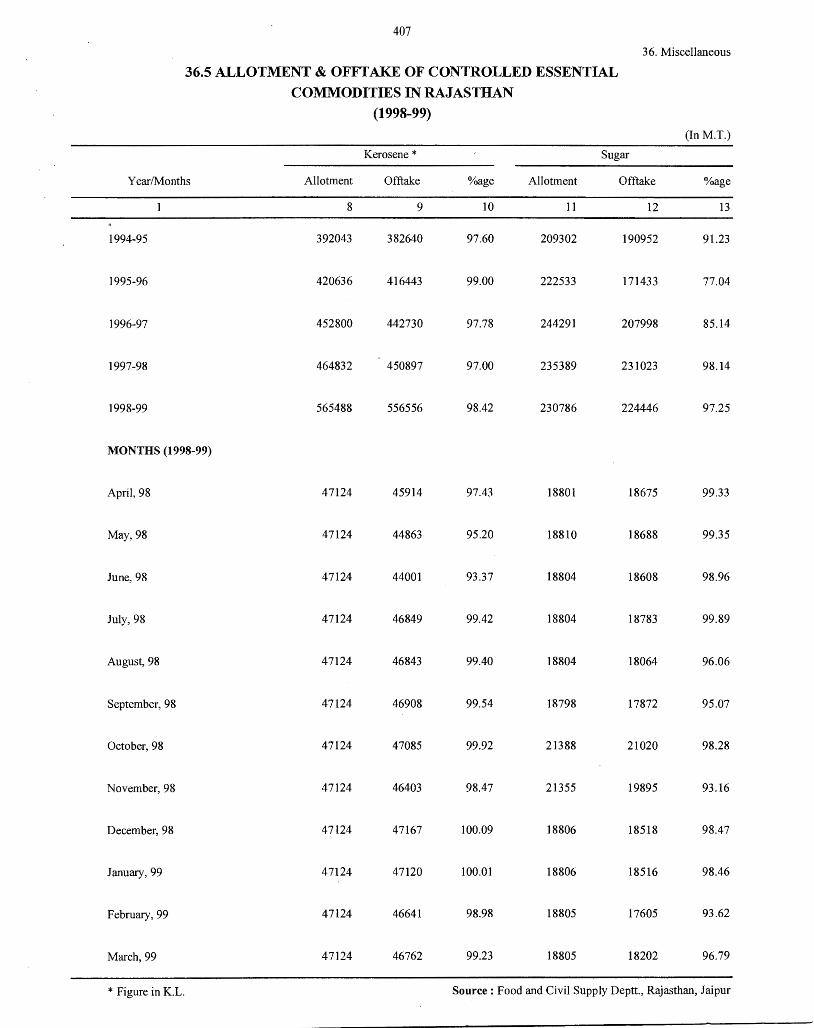
407
36. Miscellaneous
36.5 ALLOTMENT & OFFTAKE OF CONTROLLED ESSENTIAL
COMMODITIES IN RAJASTHAN
(1998-99)
(In M.T.)
Kerosene* Sugar
Year/Months Allotment Offtake %age Allotment Offtake %age
8 9 IO 11 12 13
1994-95 392043 382640 97.60 209302 190952 91.23
1995-96 420636 416443 99.00 222533 171433 77.04
1996-97 452800 442730 97.78 244291 207998 85.14
1997-98 464832 450897 97.00 235389 231023 98.14
1998-99 565488 556556 98.42 230786 224446 97.25
MONTHS (1998-99)
April, 98 47124 45914 97.43 18801 18675 99.33
May, 98 47124 44863 95.20 18810 18688 99.35
June, 98 47124 44001 93.37 18804 18608 98.96
July, 98 47124 46849 99.42 18804 18783 99.89
August, 98 47124 46843 99.40 18804 18064 96.06
September, 98 47124 46908 99.54 18798 17872 95.07
October, 98 47124 47085 99.92 21388 21020 98.28
November, 98 47124 46403 98.47 21355 19895 93.16
December, 98 47124 47167 100.09 18806 18518 98.47
January, 99 47124 47120 100.01 18806 18516 98.46
February, 99 47124 46641 98.98 18805 17605 93.62
March, 99 47124 46762 99.23 18805 18202 96.79
* Figure in K.L. Source : Food and Civil Supply Deptt., Rajasthan, Jaipur
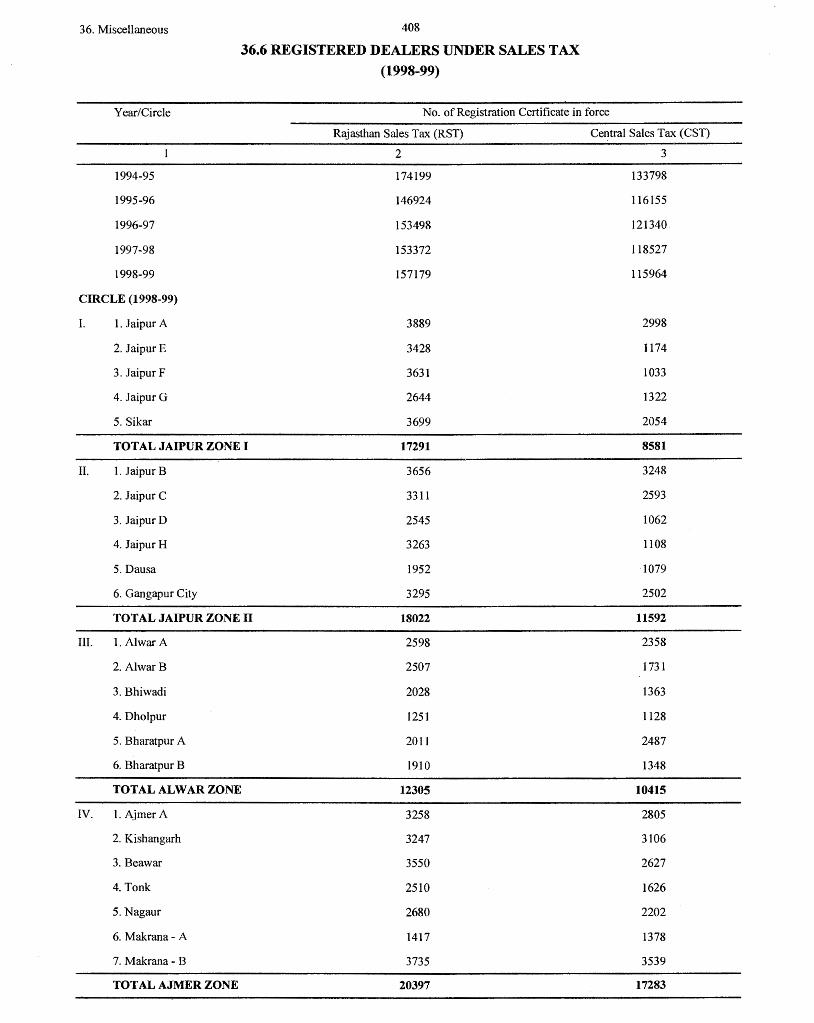
36. Miscellaneous 408
36.6 REGISTERED DEALERS UNDER SALES TAX
(1998-99)
Year/Circle No. of Registration Certificate in force
1994-95
1995-96
1996-97
1997-98
1998-99
CIRCLE (1998-99)
I. 1. Jaipur A
2. Jaipur E
3. Jaipur F
4. JaipurG
5. Sikar
TOTAL JAIPUR ZONE I
II. 1. Jaipur B
2. Jaipur C
3. JaipurD
4. Jaipur H
5. Dausa
6. Gangapur City
TOTAL JAIPUR ZONE II
III. 1. Alwar A
2. AlwarB
3. Bhiwadi
4. Dholpur
5. Bharatpur A
6. Bharatpur B
TOTALALWARZONE
IV. 1. Ajmer A
2. Kishangarh
3. Beawar
4. Tonk
5. Nagaur
6. Makrana - A
7. Makrana - B
TOT AL AJMER ZONE
Rajasthan Sales Tax (RST) Central Sales Tax (CST)
2 3
174199 133798
146924 116155
153498 121340
153372 118527
157179 115964
3889 2998
3428 1174
3631 1033
2644 1322
3699 2054
17291 8581
3656 3248
3311 2593
2545 1062
3263 ll08
1952 1079
3295 2502
18022 11592
2598 2358
2507 1731
2028 1363
1251 1128
2011 2487
1910 1348
12305 10415
3258 2805
3247 3106
3550 2627
2510 1626
2680 2202
1417 1378
3735 3539
20397 17283
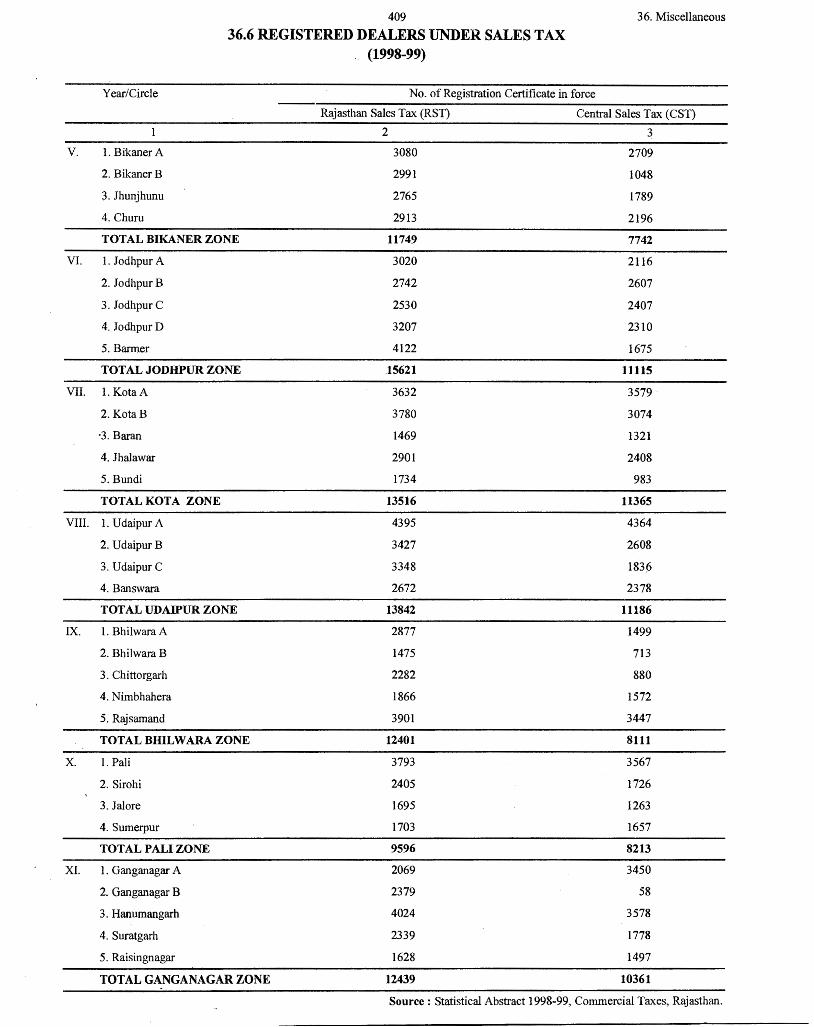
v.
VI.
VII.
VIII.
IX.
X.
XI.
409 36. Miscellaneous
36.6 REGISTERED DEALERS UNDER SALES TAX (1998-99)
Year/Circle No. of Registration Certificate in force
Rajasthan Sales Tax (RST) Central Sales Tax (CST)
2 3
1. Bikaner A 3080 2709
2. BikanerB 2991 1048
3. Jhunjhunu 2765 1789
4. Churn 2913 2196
TOTAL BIKANER ZONE 11749 7742
1. Jodhpur A 3020 2116
2. JodhpurB 2742 2607
3. Jodhpur C 2530 2407
4. JodhpurD 3207 2310
5. Barmer 4122 1675
TOTALJODHPURZONE .15621 11115
1. KotaA 3632 3579
2. KotaB 3780 3074
·3. Baran 1469 1321
4. Jhalawar 2901 2408
5. Bundi 1734 983
TOTALKOTA ZONE 13516 11365
1. Udaipur A 4395 4364
2. UdaipurB 3427 2608
3. Udaipur C 3348 183()
4. Banswara 2672 2378
TOTAL UDAIPURZONE 13842 11186
1. Bhilwara A 2877 1499
2. Bhilwara B 1475 713
3. Chittorgarh 2282 880
4. Nimbhahera 1866 1572
5. Rajsamand 3901 3447
TOTAL BHILWARA ZONE 12401 8111
1. Pali 3793 3567
2. Sirohi 2405 1726
3. Jalore 1695 1263
4. Sumerpur 1703 1657
TOTAL PALI ZONE 9596 8213
1. Ganganagar A 2069 3450
2. Ganganagar B 2379 58
3. Hanumangarh 4024 3578
4. Suratgarh 2339 1778
5. Raisingnagar 1628 1497
TOTAL GANGANAGAR ZONE 12439 10361
Source : Statistical Abstract 1998-99, Commercial Taxes, Rajasthan.
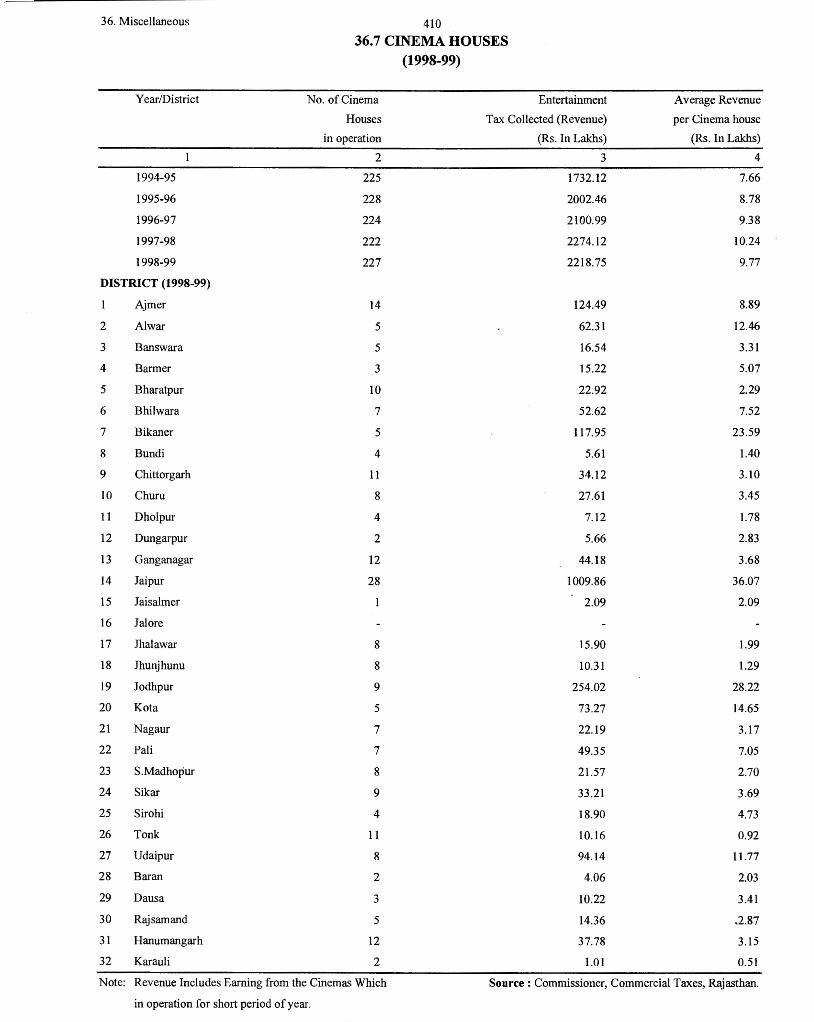
36. Miscellaneous 410
36.7 CINEMA HOUSES (1998-99)
Year/District No. of Cinema Entertainment Average Revenue
Houses Tax Collected (Revenue) per Cinema house
in operation (Rs. In Lakhs) (Rs. In Lakhs)
2 3 4
1994-95 225 1732.12 7.66
1995-96 228 2002.46 8.78
1996-97 224 2100.99 9.38
1997-98 222 2274.12 10.24
1998-99 227 2218.75 9.77
DISTRICT (1998-99)
Ajmer 14 124.49 8.89
2 Al war 5 62.31 12.46
3 Banswara 5 16.54 3.31
4 Barmer 3 15.22 5.07
5 Bharatpur 10 22.92 2.29
6 Bhilwara 7 52.62 7.52
7 Bikaner 5 117.95 23.59
8 Bundi 4 5.61 1.40
9 Chittorgarh 11 34.12 3.10
10 Churn 8 27.61 3.45
11 Dholpur 4 7.12 1.78
12 Dungarpur 2 5.66 2.83
13 Ganganagar 12 44.18 3.68
14 Jaipur 28 1009.86 36.07
15 Jaisalmer 2.09 2.09
16 Jal ore
17 Jhalawar 8 15.90 1.99
18 Jhunjhunu 8 10.31 1.29
19 Jodhpur 9 254.02 28.22
20 Kota 5 73.27 14.65
21 Nagaur 7 22.19 3.17
22 Pali 7 49.35 7.05
23 S.Madhopur 8 21.57 2.70
24 Sikar 9 33.21 3.69
25 Sirohi 4 18.90 4.73
26 Tonk 11 10.16 0.92
27 Udaipur 8 94.14 11.77
28 Baran 2 4.06 2.03
29 Dausa 3 10.22 3.41
30 Rajsamand 5 14.36 .2.87
31 Hanumangarh 12 37.78 3.15
32 Karauli 2 1.01 0.51
Note: Revenue Includes Earning from the Cinemas Which Source: Commissioner, Commercial Taxes, Rajasthan.
in operation for short period of year.
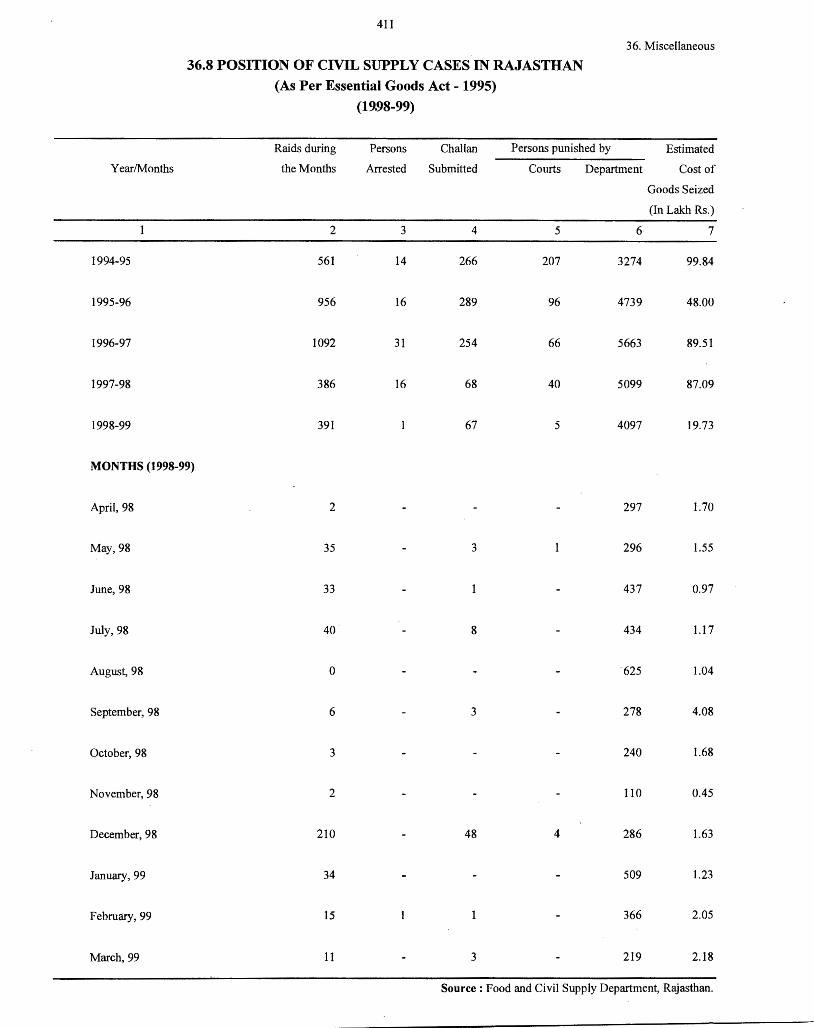
411
36. Miscellaneous
36.8 POSITION OF CIVIL SUPPLY CASES IN RAJASTHAN
(As Per Essential Goods Act-1995)
(19.98-99)
Raids during Persons Chall an Persons punished by Estimated
Year/Months the Months Arrested Submitted Courts Department Cost of
Goods Seized
(In Lakh Rs.)
2 3 4 5 6 7
1994-95 561 14 266 207 3274 99.84
1995-96 956 16 289 96 4739 48.00
1996-97 1092 31 254 66 5663 89.51
1997-98 386 16 68 40 5099 87.09
1998-99 391 67 5 4097 19.73
MONTHS (1998-99)
April, 98 2 297 1.70
May,98 35 3 296 1.55
June, 98 33 437 0.97
July, 98 40 8 434 1.17
August, 98 0 "625 1.04
September, 98 6 3 278 4.08
October, 98 3 240 1.68
November, 98 2 110 0.45
December, 98 210 48 4 286 1.63
January, 99 34 509 1.23
February, 99 15 366 2.05
March, 99 11 3 219 2.18
Source : Food and Civil Supply Department, Rajasthan.
ANNEXURE
Statewise Population Tables Shown in this section, which includes Area and Total population with br~ak up of rural, Urban and Scheduled caste & Scheduled Tribe population
· Table-3 shows statewise Density, sex ratio and growth rate of population.
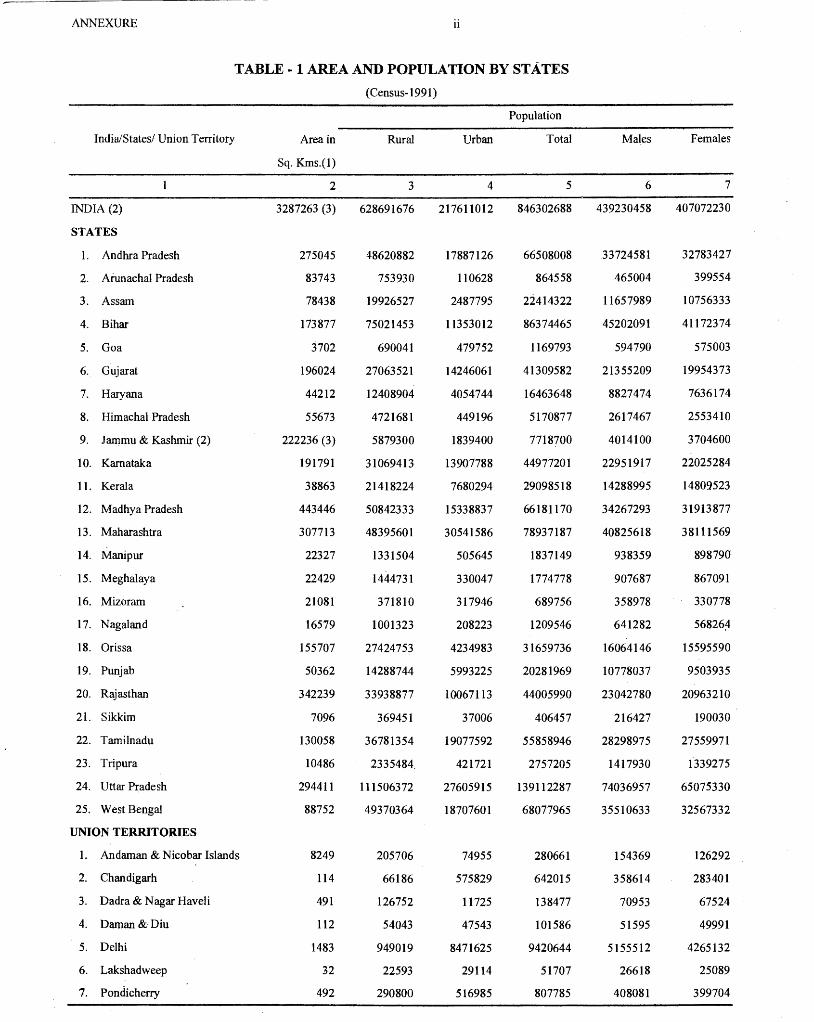
ANNEXURE ii
TABLE -1 AREA AND POPULATION BY STATES
( Census-1991)
India/States/ Union Territory
INDIA (2)
STATES
1. Andhra Pradesh
2. Aiunachal Pradesh
3. Assam
4. Bihar
5. Goa
6. Gujarat
7. Haryana
8. Himachal Pradesh
9. Jammu & Kashmir (2)
10. Karnatak:a
11. Kerala
12. Madhya Pradesh
13. Maharashtra
14. Manipur
15. Meghalaya
16. Mizoram
17. Nagaland
18. Orissa
19. Punjab
20. Rajasthan
21. Sikkim
22. Tamilnadu
23. Tripura
24. Uttar Pradesh
25. West Bengal
UNION TERRITORIES
l. Andaman & Nicobar Islands
2. Chandigarh
3. Dadra & Nagar Haveli
4. Daman & Diu
5. Delhi
6. Lakshadweep
7. Pondicherry
Area in Rural
Sq. Kms.(1)
2 3
3287263(3) 628691676
275045
83743
78438
173877
3702
196024
44212
55673
222236 (3)
191791
38863
443446
307713
22327
22429
21081
16579
155707
50362
342239
7096
130058
10486
294411
88752
8249 .
114
491
112
1483
32
492
48620882
753930
19926527
75021453
690041
27063521
12408904
4721681
5879300
31069413
21418224
50842333
48395601
1331504
1444731
371810
1001323
27424753
14288744
33938877
369451
36781354
2335484.
111506372
49370364
205706
66186
126752
54043
949019
22593
290800
Urban
4
217611012
17887126
110628
2487795
11353012
479752
14246061
4054744
449196
1839400
13907788
7680294
15338837
30541586
505645
330047
317946
208223
4234983
5993225
10067113
37006
19077592
421721
27605915
18707601
74955
575829
11725
47543
8471625
29114
516985
Population
Total
5
846302688
66508008
864558
22414322
86374465
1169793
41309582
16463648
5170877
7718700
44977201
29098518
66181170
78937187
1837149
1774778
689756
1209546
31659736
20281969
44005990
406457
55858946
2757205
139112287
68077965
280661
642015
138477
101586
9420644
51707
807785
Males
6
439230458
.33724581
465004
11657989
45202091
594790
21355209
8827474
2617467
4014100
22951917
14288995
34267293
40825618
938359
907687
358978
641282
16064146
10778037
23042780
216427
28298975
1417930
74036957
35510633
154369
358614
70953
51595
5155512
26618
408081
Females
7
407072230
32783427
399554
10756333
41172374
575003
19954373
7636174
2553410
3704600
22025284
14809523
31913877
38111569
898790
867091
330778
56826:-f
15595590
9503935
20963210
190030
27559971
1339275
65075330
32567332
126292
283401
67524
49991
4265132
25089
399704
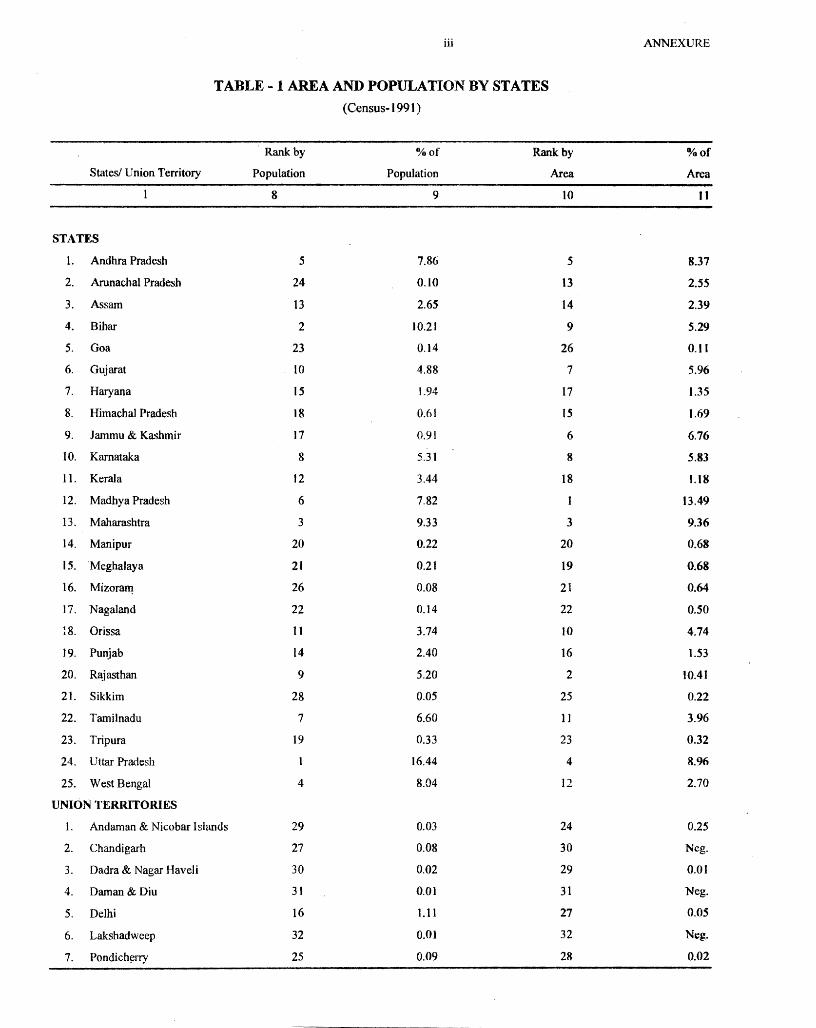
iii ANNEX URE
TABLE -1 AREA AND POPULATION BY STATES
( Census-1991 )
Rank by %of Rank by %of
States/ Union Territory Population Population Area Arca
8 9 10 11
STATES
1. Andhra Pradesh 5 7.86 5 8.37
2. Arunachal Pradesh 24 0.10 13 2.55
3. Assam 13 2.65 14 2.39
4. Bihar 2 10.21 9 S.29
5. Goa 23 0.14 26 0.11
6. Gujarat IO 4.88 7 5.96
7. Haryana 15 1.94 17 1.35
8. Himachal Pradesh 18 0.61 15 t.69
9. Jammu & Kashmir 17 0.91 6 6.76
IO. Karnataka 8 5.31 8 5.83
11. Kerala 12 3.44 18 1.18
12. Madhya Pradesh 6 7.82 I 13.49
13. Maharashtra 3 9.33 3 9.36
14. Manipur 20 0.22 20 0.68
15. Meghalaya 21 0.21 19 0.68
16. MizoraJ11 26 0.08 21 0.64
17. Nagaland 22 0.14 22 0.50
18. Orissa 11 3.74 10 4.74
19. Punjab 14 2.40 16 1.53
20. Rajasthan 9 5.20 2 10.41
21. Sikkim 28 0.05 25 0.22
22. Tamilnadu 7 6.60 11 3.96
23. Tripura 19 0.33 23 0.32
24. Uttar Pradesh 16.44 4 8.96
25. West Bengal 4 8.04 12 2.70
UNION TERRITORIES
1. Andaman & Nicobar lslands 29 0.03 24 0.25
2. Chandigarh 27 0.08 30 Neg.
3. Dadra & Nagar Haveli 30 0.02 29 0.01
4. Daman&Diu 31 0.oI 31 Neg.
5. Delhi 16 Lil 27 0.05
6. Lakshadweep 32 o.oi 32 Neg.
7. Pondich~rry 25 0.09 28 0.02
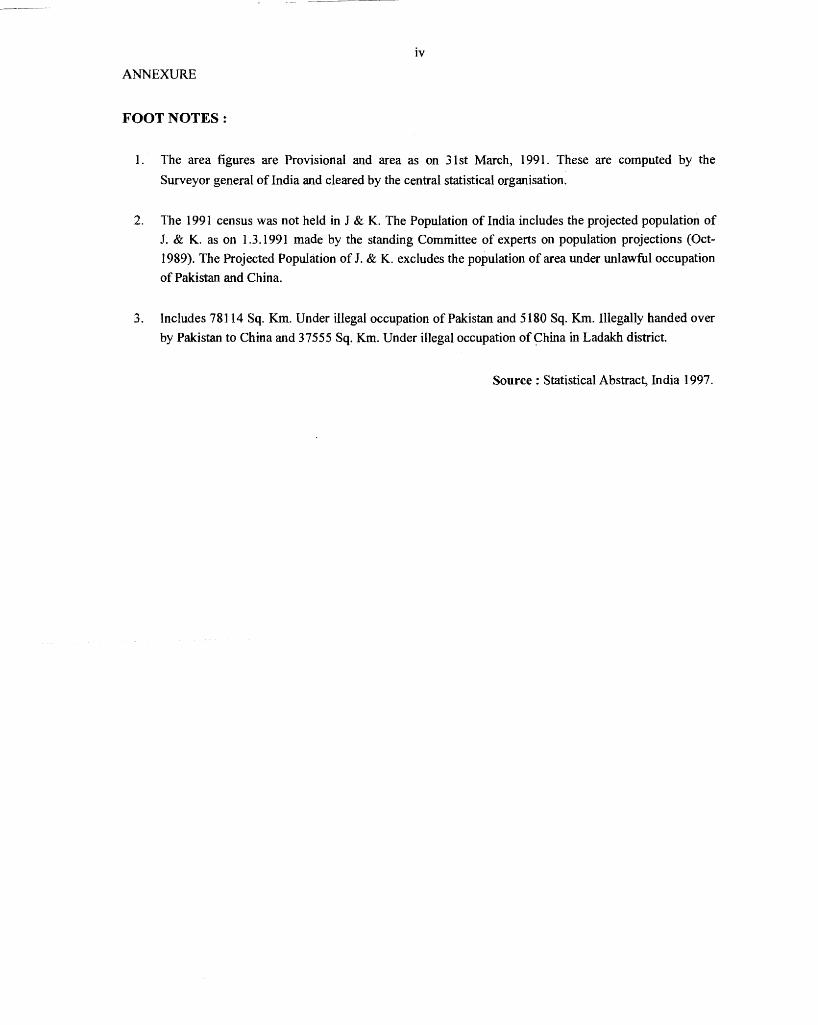
iv
ANNEXURE
FOOTNOTES:
1. The area figures are Provisional and area as on 31st March, 1991. These are computed by the
Surveyor general of India and cleared by the central statistical organisation.
2. The 1991 census was not held in J & K. The Population of India includes the projected population of
J. & K. as on 1.3.1991 made by the standing Committee of experts on population projections (Oct-
1989). The Projected Population of J. & K. excludes the population of area under unlawful occupation
of Pakistan and China.
3. Includes 78114 Sq. Km. Under illegal occupation of Pakistan and 5180 Sq. Km. Illegally handed over
by Pakistan to China and 37555 Sq. Km. Under illegal occupation of ~hina in Ladakh district.
Source : Statistical Abstract, India 1997.
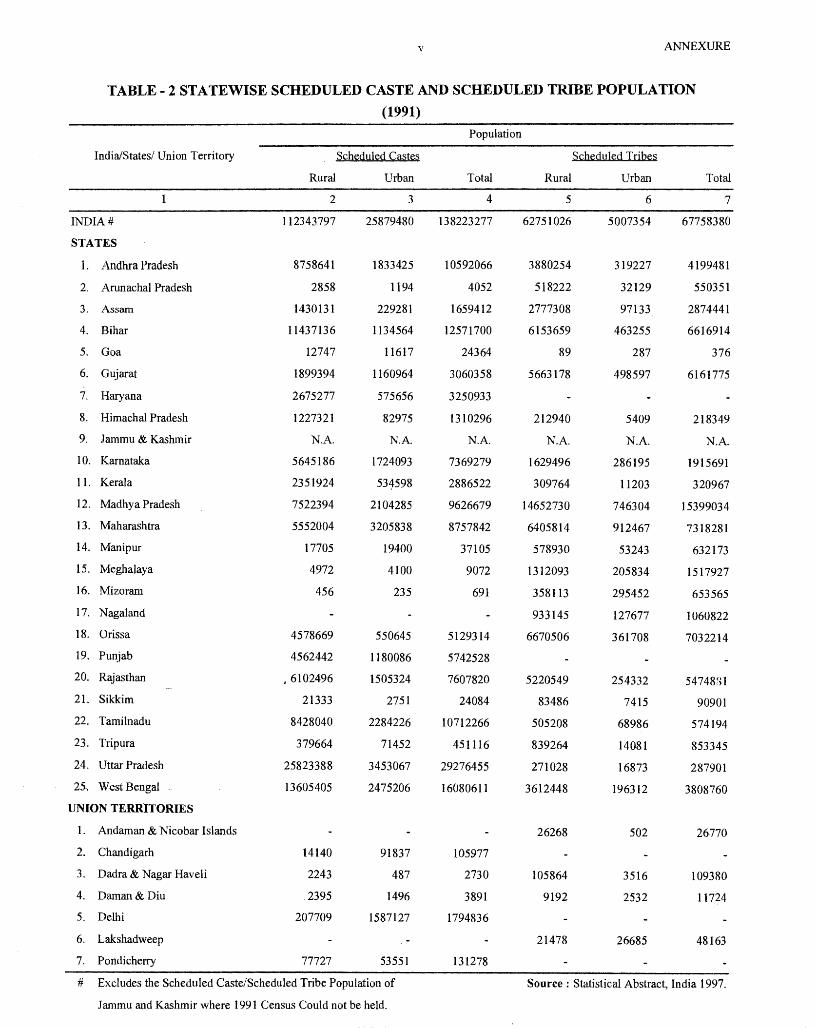
v ANNEX URE
TABLE- 2 STATEWISE SCHEDULED CASTE AND SCHEDULED TRIBE POPULATION
(1991)
India/States/ Union Territory
INDIA#
STATES
I. Andhra Pradesh
2. Arunachal Pradesh
3. Assam
4. Bihar
5. Goa
6. Gujarat
7. Haryana
8. Himachal Pradesh
9. Jammu & Kashmir
10. Karnataka
11. Kerala
12. Madhya Pradesh
13. Maharashtra
14. Manipur
15. Meghalaya
16. Mizoram
17. Nagaland
18. Orissa
19. Punjab
20. Rajasthan
21. Sikkim
22. Tamilnadu
23. Tripura
24. Uttar Pradesh
25-. West Bengal
UNION TERRITORIES
1. Andaman & Nicobar Islands
2. Chandigarh
3. Dadra & Nagar Haveli
4. Daman& Diu
5. Delhi
6. Lakshadweep
Rural
2
112343797
8758641
2858
1430131
11437136
12747
1899394
2675277
1227321
N.A.
5645186
2351924
7522394
5552004
17705
4972
456
4578669
4562442
• 6102496
21333
8428040
379664
25823388
13605405
14140
2243
2395
207709
Scheduled Castes
Urban
3
25879480
1833425
1194
229281
1134564
11617
1160964
575656
82975
N.A.
1724093
531598
2104285
3205838
19400
4100
235
550645
1180086
1505324
2751
2284226
71452
3453067
2475206
91837
487
1496
1587127
. -7. Pondicherry 77727 53551
# Excludes the Scheduled Caste/Scheduled Tribe Population of
Jammu and Kashmir where 1991 Census Could not be held.
Population
Total
4
138223277
10592066
4052
1659412
12571700
24364
3060358
3250933
1310296
N.A.
7369279
2886522
9626679
8757842
37105
9072
691
5129314
5742528
7607820
24084
10712266
451116
29276455
16080611
105977
2730
3891
1794836
131278
Rural
5
62751026
3880254
518222
2777308
6153659
89
5663178
212940
N.A.
1629496
309764
14652730
6405814
578930
1312093
358113
933145
6670506
5220549
83486
505208
839264
271028
3612448
26268
105864
9192
21478
Scheduled Tribes
Urban
6
5007354
319227
32129
97133,
463255
287
498597
5409
N.A.
286195
11203
746304
912467
53243
205834
295452
127677
361708
254332
7415
68986
14081
16873
196312
502
3516
2532
26685
Total
7
67758380
4199481
550351
2874441
6616914
376
6161775
218349
N.A.
1915691
320967
15399034
7318281
632173
1517927
653565
1060822
7032214
5474881
90901
574194
853345
287901
3808760
26770
109380
11724
48163
Source: Statistical Abstract, India 1997.
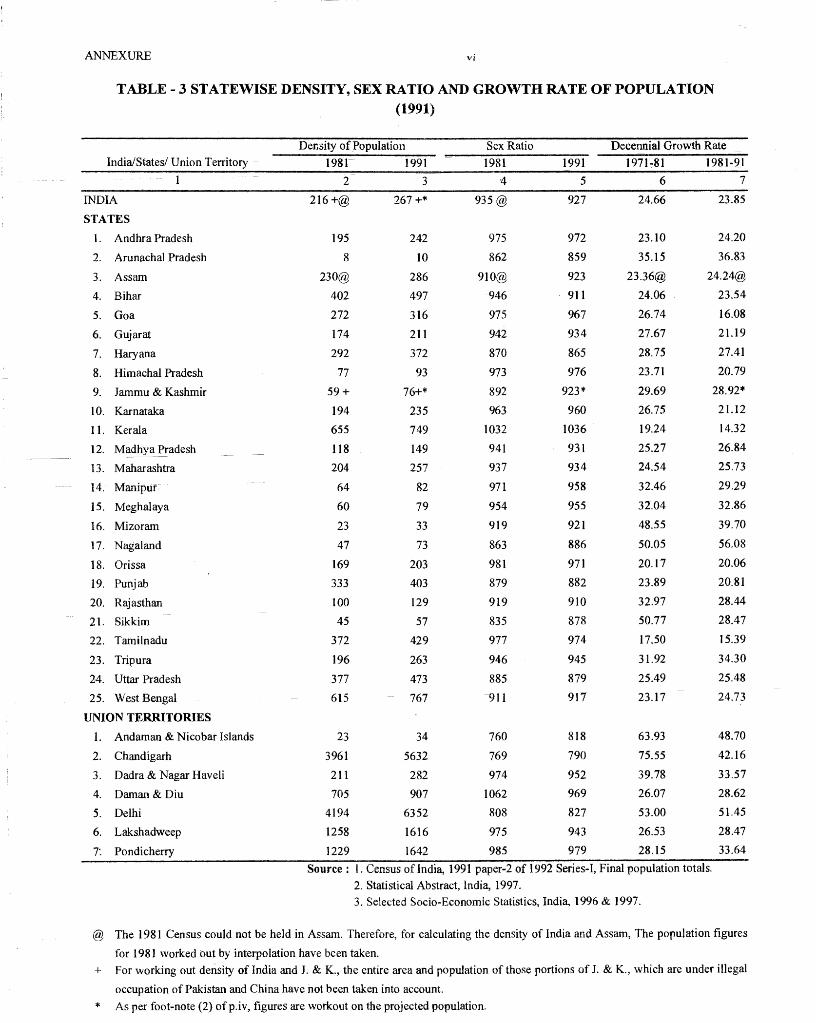
ANNEX URE vi
TABLE - 3 STATEWISE DENSITY, SEX RATIO AND GROWTH RATE OF POPULATION (1991)
Density of Population Sex Ratio Decennial Growth Rate
India/States/ Union Territory t98r 1991 1981 1991 1971-:81 1981-91
1 2 3 4 5 6 7
INDIA 216+@ 267+* 935@ 927 24.66 23.85
STATES
l. Andhra Pradesh 195 242 975 972 23.10 24.20
2. Arunachal Pradesh 8 10 862 859 35.15 36.83
3. Assam 230@ 286 910@ 923 23.36@ 24.24@
4. Bihar 402 497 946 911 24.06 23.54
5. Goa 272 316 975 967 26.74 16.08
6. Gujarat 174 211 942 934 27.67 21.19
7. Haryana 292 372 870 865 28.75 27.41
&._ Himachal Pradesh 77 93 973 976 23.71 20.79
9. Jammu & Kashmir 59+ 76+* 892 923* 29.69 28.92*
10. Karnataka 194 235 963 960 26.75 2l.12
11. Kerala 655 749 1032 1036 19.24 14.32
12. Ma_dhy~"!!adesh 118 149 941 931 25.27 26.84
13. Maharashtra 204 257 937 934 24.54 25.73
14. Manipur 64 82 971 958 32.46 29.29
15. Meghalaya 60 79 954 955 32.04 32.86
16. Mizoram 23 33 919 921 48.55 39.70
17. Nagaland 47 73 863 886 50.05 56.08
18. Orissa 169 203 981 971 20.17 20.06
19. Pu11jab 333 403 879 882 23.89 20.81
20. Rajasthan 100 129 919 910 32.97 28.44
21. Sikkim 45 57 835 878 50.77 28.47
22. Tamilnadu 372 429 977 974 17.50 15.39
23. Tripura 196 263 946 945 31.92 34.30
24. Uttar Pradesh 377 473 885 879 25.49 25.48
25. West Bengal 615 767 -911 917 23.17 24.73
UNION TERRITORIES
1. Andaman & Nicobar Islands 23 34 760 818 63.93 48.70
2. Chandigarh 3961 5632 769 790 75.55 42.16
3. Dadra & Nagar Haveli 211 282 974 952 39.78 33.57
4. Daman&Diu 705 907 1062 969 26.07 28.62
5. Delhi 4194 6352 808 827 53.00 5L45
6. Lakshadweep 1258 1616 975 943 26.53 28.47
7: Pondicherry 1229 1642 985 979 28.15 33.64
Source: I. Census oflndia, 1991 paper-2of1992 Series-I, Final population totals.
2. Statistical Abstract, India, 1997.
3. Selected Socio-Economic Statistics, India, 1996 & 1997.
@ The 1981.Census could not be held in Assam. Therefore, for calculating the density of India and Assam, The population figures
for 1981 worked out by interpolation have been taken.
+ For working out density of India and J. & K., the entire area and population of those portions of J. & K., which are under illegal
occupation of Pakistan and China have not been taken into account.
* As per foot-note (2) of p.iv, figures are workout on the projected population.
Related Documents


