Statista Mobility Market Outlook Product & Methodology March 2020

Welcome message from author
This document is posted to help you gain knowledge. Please leave a comment to let me know what you think about it! Share it to your friends and learn new things together.
Transcript

Statista Mobility Market Outlook Product & Methodology
March 2020

2
What is the Statista Mobility Market Outlook?
The Statista Mobility Market Outlook is a tool that provides key market indicators, independent forecasts, and detailed market insights for the most relevant mobility markets. Mobility market data is often available in inconsistent forms, scopes, and segmentations, which makes it impossible to get reliable comparisons between two or more data sets. Our goal is to simplify your research and planning by providing all the necessary data for 4 mobility markets for up to 150 countries with a clearly defined market scope.
The Statista Mobility Market Outlook is built on resources from the Statista platform as well as on in-house market research and the experience of our analysts. We evaluate the status quo of the markets, monitor trends, and create an independent forecast regarding market developments of global mobility solutions.
The tool provides data on financial and operating figures (revenue, unit sales, pricing, or comparable KPIs) and user-related figures (number of users, user penetration, average revenue per user (ARPU)) – on the platform and in multiple download formats.
The data for each market is updated at least twice a year, and our analysts create Outlook Reports for all markets and segments, giving an extensive overview of the current state of the market and its latest trends.
About the Statista Mobility Market Outlook (1/2)
Source: Statista Mobility Market Outlook 2020
The Statista Mobility Market Outlook provides data on 4 mobility markets for up to 150 countries
Vehicle Sales Mobility Services Travel & TourismMotorcycle Sales

Statista Global Consumer Survey
The Statista Global Consumer Survey is a worldwide online survey exclusively carried out in 46 countries among more than 400,000 consumers in 2019. The mobility part of the survey exactly matches the market scopes of the Statista Mobility Market Outlook and thus provides first-hand information on consumer habits, brand recognition, technology adoption, and user penetration in each market.
3
The data of the Statista Mobility Market Outlook is composed of countless pieces of information. Our analysts build on Statista’s primary research, relevant market data taken from independent databases, various market and macroeconomic indicators, historical developments, current trends, reported performance indicators from key market players, and interviews with market experts conducted by Statista. Continuous market monitoring allows us to take into consideration relevant changes along the value chain of the mobility industry.
The market estimates for our 46 core countries – the world’s largest economies, such as the United States, China, and Germany – are derived from bottom-up market modeling based on data from a broad range of industry-specific and national sources, the Statista Global Consumer Survey, and our industry knowledge. Demographic user data on digital markets in core countries has been taken from the Statista Global Consumer Survey.
For the 104 non-core countries, we apply algorithmic data analysis, based on macroeconomic indicators and market drivers. Normalized indicators allow realistic assumptions and comparisons (per-capita spending, penetration rates, etc.), even for countries with low data availability.
About the Statista Mobility Market Outlook (2/2)
Source: Statista Mobility Market Outlook 2020
The key to our data is independent market modeling and primary research

4
Statista Mobility Market Outlook coverage2
Country coverage (1/2)
Core countries1
1: Core country: a country for which an in-depth analysis is carried out 2: The Motorcycles market currently covers 29 countriesSource: Statista Mobility Market Outlook 2020
The Mobility Market Outlook provides market data for 150 countries and in-depth analyses of core countries
Europe Turkey Asia
Austria United Kingdom China
Belgium India
Czechia Americas Indonesia
Denmark Argentina Japan
Finland Brazil Pakistan
France Canada Saudi Arabia
Germany Chile South Korea
Greece Colombia Thailand
Ireland Dominican Rep. Vietnam
Italy Mexico
Lithuania Peru Australia & Oceania
Netherlands United States Australia
Norway New Zealand
Poland Africa
Portugal Kenya
Russia Morocco
Serbia Nigeria
Spain South Africa
Sweden
Switzerland
Core country Non-core country Not covered
5
Europe
Southern EuropeAlbaniaBosnia and Herzeg.CroatiaCyprusGreeceItalyNorth MacedoniaMaltaMontenegroPortugalSerbiaSloveniaSpainTurkey
Eastern EuropeArmeniaAzerbaijanBelarusBulgariaGeorgiaMoldovaRomaniaRussiaUkraine
Central & Western EuropeAustriaBelgiumCzechiaFranceGermanyHungaryIrelandLuxembourgNetherlandsPolandSlovakiaSwitzerlandUnited Kingdom
Northern EuropeDenmarkEstoniaFinlandIcelandLatviaLithuaniaNorwaySweden
Americas
South AmericaArgentinaBoliviaBrazilChileColombiaEcuadorGuyanaParaguayPeruSurinameUruguay
Central AmericaBelizeCosta RicaEl SalvadorGuatemalaHondurasNicaraguaPanama
North AmericaCanadaMexicoUnited States
CaribbeanCubaDominican RepublicHaitiJamaica
Asia
South AsiaBangladeshBhutanIndiaNepalPakistanSri Lanka
West AsiaBahrainIranIraqIsraelJordanKuwaitLebanonOmanQatarSaudi ArabiaUnited Arab Emirates
Southeast AsiaBrunei DarussalamCambodiaIndonesiaLaosMalaysiaMyanmarPhilippinesSingaporeThailandTimor-LesteVietnam
East AsiaChinaHong KongJapanMongoliaSouth Korea
Central AsiaKazakhstanKyrgyzstanTajikistanTurkmenistanUzbekistan
Australia & OceaniaAustraliaFijiNew ZealandPapua New Guinea
Africa
North AfricaAlgeriaEgyptMoroccoSudanTunisia
Central AfricaAngolaCameroonChadEquatorial GuineaGabonRepublic of the Congo
West AfricaBeninBurkina FasoGambiaGhana
GuineaIvory CoastNigerNigeriaSenegalSierra LeoneTogo
Southern AfricaBotswanaLesothoMauritiusNamibiaSouth Africa
East AfricaBurundiEthiopiaKenyaMadagascarMalawiMozambiqueRwandaSeychellesTanzaniaUgandaZambiaZimbabwe
Country coverage (2/2)
Source: Statista Mobility Market Outlook 2020
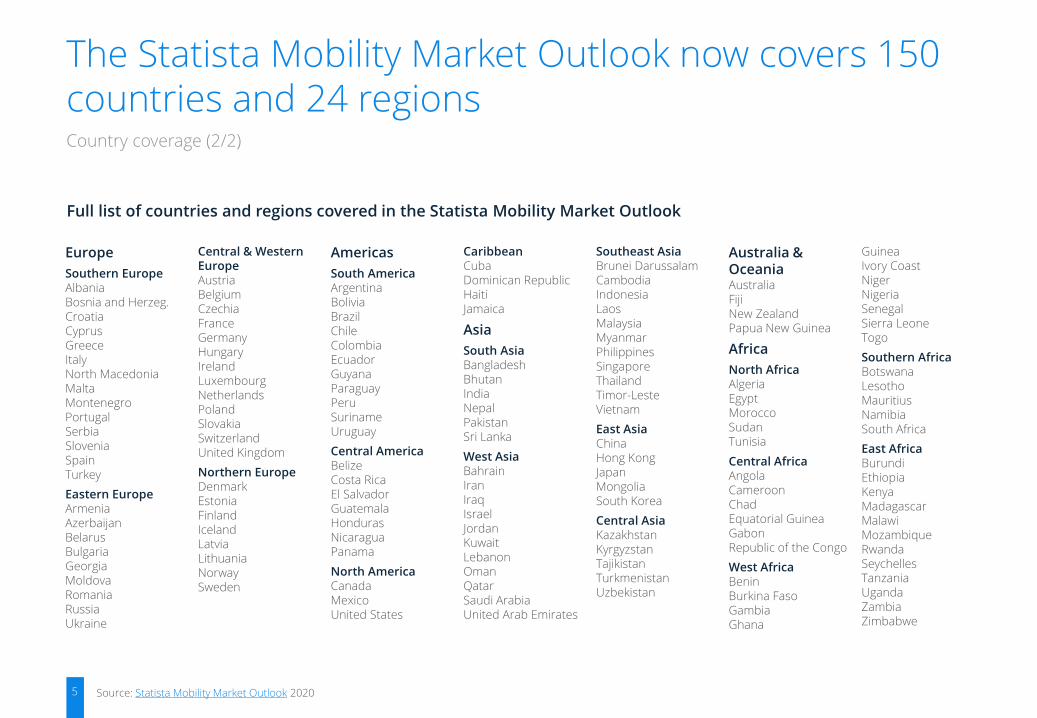
The Statista Mobility Market Outlook now covers 150 countries and 24 regions
Full list of countries and regions covered in the Statista Mobility Market Outlook

MARKETSIZING
6
Mobility Services Travel & Tourism

Source: Statista Mobility Market Outlook 20207
Detailed analysis of the status quo in selected core countries
We obtain the data from the Statista Mobility Market Outlook for our 46 core economies, such as the United States, China, and Germany, through an in-depth analysis of each market. To evaluate the markets, we use the latest data from various country-specific sources and industry associations, survey results from our primary research (e.g., the Statista Global Consumer Survey), third-party studies and reports, as well as our industry knowledge. Because of the considerable amount of information that is incorporated in the Statista Mobility Market Outlook and all the interpretation and analysis involved in the process, a detailed representation of the data sources for each data point is not possible.
Market sizes are determined using a bottom-up approach based on an individual logic for each market segment. Demand-side factors, such as the number of users, are linked to performance factors, such as user penetration or average customer turnover. This data is calculated from market-specific input, such as product prices, purchase/usage frequency, and customer churn rates.
Demographic user data originates from the Statista Global Consumer Survey, whose market definitions and scopes completely match those of the Statista Mobility Market Outlook. We use the data to calculate the user penetration for each of the markets and to provide the split between male/female users with low/medium/high income levels for the different age groups. This gives us insights into the user behavior of 30 different demographic sets.
Market sizing: travel and mobility services (1/4)
Underlying data
Market research
▪ Consumer profiling – the Statista Global Consumer Survey
▪ Exclusive representative ad hoc surveys in selected countries on specific current topics
Key player analysis & monitoring
▪ Company profiles and key performance indicators
▪ Product and price monitoring
▪ News and trends
Macroeconomic indicators
▪ Country-specific statistical offices and census data
▪ International organizations and associations
Studies & third-party data
▪ Market analyses and analyst opinions
▪ Annual reports and industry analyses
▪ Academic studies
We use a bottom-up approach for our market sizing

Sources and benchmark:
8
Market sizing : travel and mobility services (2/4)
Note: For countries in which no surveys were conducted or which have missing values, we have calculated user and ARPU figures with a driver-based projection methodSource: Statista Mobility Market Outlook 2020
The Online Mobility Services market as an example of a bottom-up approach
Online Mobility Services market
National statistics, third-party studies, expert interviews
Validation through third-party studies
National statistics, primary research, third-party studies, expert interviews
Statista Global Consumer Survey
National statistics
National statistics
Online usersShare of people
buying bus tickets online
Share of people
renting cars online
Share of people booking
flights online
Population
x x x
Internet penetration
x
Share of people using online ride-hailing apps
Share of people
buying train tickets online
x x
Online GMV
Online share of purchases
Online share of purchases
Online share of purchases
Online share of purchases
Online share of purchases
x x xx x
Bus tickets GMV
Train tickets GMV
Rental cars GMV
Ride hailing GMV
FlightsGMV
9
Market sizing : travel and mobility services (3/4)
Sources and benchmark:
Note: For countries in which no surveys were conducted or which have missing values, we have calculated user and ARPU figures with a driver-based projection methodSource: Statista Mobility Market Outlook 2020
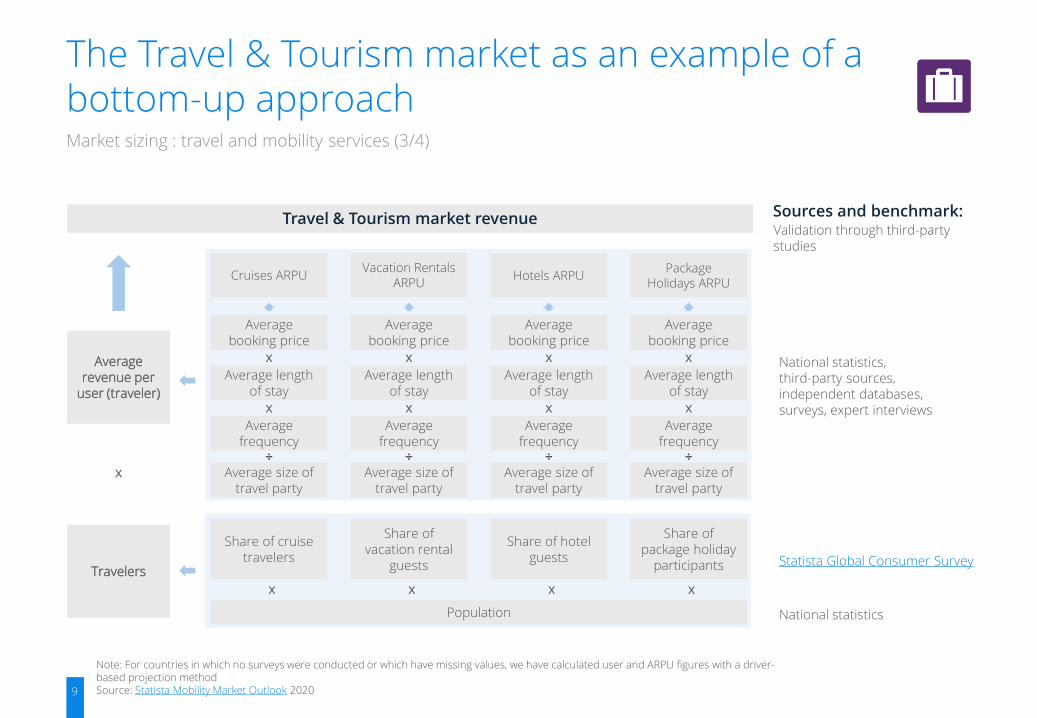
The Travel & Tourism market as an example of a bottom-up approach
Travel & Tourism market revenue
National statistics, third-party sources, independent databases, surveys, expert interviews
Validation through third-party studies
Statista Global Consumer Survey
National statisticsPopulation
x
Share of vacation rental
guests
x
Package Holidays ARPU
Travelers
Average revenue per
user (traveler)
xx
Vacation Rentals ARPU
Hotels ARPU
Share of cruise travelers
Average booking price
Average length of stay
Average frequency
Average size of travel party
Cruises ARPU
Share of hotel guests
Share of package holiday
participants
x
x
÷x
Average booking price
Average length of stay
Average frequency
Average size of travel party
x
x
÷
Average booking price
Average length of stay
Average frequency
Average size of travel party
x
x
÷
Average booking price
Average length of stay
Average frequency
Average size of travel party
x
x
÷

Non-core country market sizing exemplified by1 the Hungarian Ride Hailing market in 2018
Step 1: Choose reference core country2
Step 2: Compare key market indicators3
PopulationInternet penetrationConsumer spending per capitaConsumer spending on transportationPrice level index – transportation
Step 3: Apply an algorithm to estimate market KPIs, using data from the core country as base and the country’s key market indicators as drivers
Result:
Ride Hailing ARPURide Hailing user penetration
10
Driver-based transfer of market data to non-core countries
The market data for non-core countries is generated using algorithmic models. To compensate for the lack of available data and to evaluate a country’s potential, we use the performance ratios of core countries with a similar infrastructure and similar development conditions as benchmark values. Then we apply an algorithm-based calculation to create market KPI estimations, using the country’s key market indicators as drivers.
Over 100 driver data sets for 150 countries have been collected from a variety of sources, including the International Monetary Fund (IMF), the International Organization of Motor Vehicle Manufacturers (OICA), the World Bank, and many others. The data sets either include a forecast from the source or are forecast by Statista using trend analysis and prediction techniques based on historical data from 2000 to 2018. The drivers are categorized and assigned to the markets so that the top three correlating drivers can then be selected for each market segment.
The chosen drivers do not only have the best mathematical fit, but they must also have an actual influence on the performance of the markets. If specific drivers are not available for one country, they can be replaced with a set of backup economic development drivers of more general nature.
Market sizing : travel and mobility services (4/4)
1: Simplified illustration 2: Several core countries are used to get the final result 3: Further key market indicators were used in the final algorithmSource: Statista Mobility Market Outlook 2020
We estimate the potential of non-core countries with the help of macroeconomic and infrastructural drivers
(core country)
Poland
Poland(benchmark)
37.9m73.2%US$8,496US$1,06090.9
US$1667.5%
Hungary(non-core country)
Hungary(KPI estimated)
9.7m74.5%US$7,912US$1,031107.2
US$1476.5%

MARKETSIZING
11
Vehicle Sales Motorcycle Sales
12
Market sizing : passenger cars and motorcycles
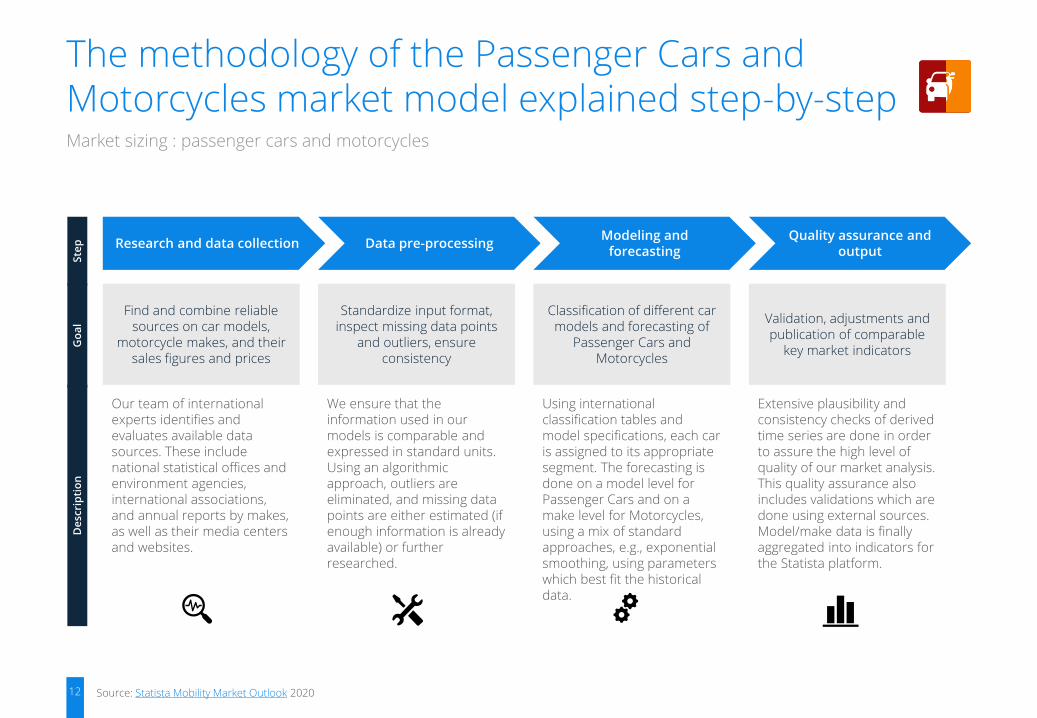
The methodology of the Passenger Cars and Motorcycles market model explained step-by-step
Research and data collection
Our team of international experts identifies and evaluates available data sources. These include national statistical offices and environment agencies, international associations, and annual reports by makes, as well as their media centers and websites.
Find and combine reliable sources on car models,
motorcycle makes, and their sales figures and prices
Data pre-processing
We ensure that the information used in our models is comparable and expressed in standard units. Using an algorithmic approach, outliers are eliminated, and missing data points are either estimated (if enough information is already available) or further researched.
Standardize input format, inspect missing data points
and outliers, ensure consistency
Modeling and forecasting
Using international classification tables and model specifications, each car is assigned to its appropriate segment. The forecasting is done on a model level for Passenger Cars and on a make level for Motorcycles, using a mix of standard approaches, e.g., exponential smoothing, using parameters which best fit the historical data.
Classification of different car models and forecasting of
Passenger Cars and Motorcycles
Quality assurance and output
Extensive plausibility and consistency checks of derived time series are done in order to assure the high level of quality of our market analysis. This quality assurance also includes validations which are done using external sources.Model/make data is finally aggregated into indicators for the Statista platform.
Validation, adjustments and publication of comparable
key market indicators
Ste
pD
esc
rip
tio
nG
oa
l
Source: Statista Mobility Market Outlook 2020

FORECASTS
13
The Bass model is suitable for making predictions for all products despite possible differences in product characteristics and complexity –the curve can shift in time and its steepness might differ, but its shape is always similar.
Once the status quo has been established, we assess the recent market growth and the macroeconomic environment of the country in question and its region. Then we move on to trend scouting, looking out for business-critical developments in the industries that provide the basis for the future growth of the markets.
A market growth forecast is generated with the help of our tool, which combines historical market data with predictions regarding the development of key market drivers by creating an S-curve function. The S-curve constitutes a special case of the logistic function and is well suited to forecast new mobility markets due to the non-linear growth of technology adoption.
The result is an algorithm-backed forecast based on relevant market drivers (e.g., internet penetration, consumption spending, infrastructure development, share of urban population, etc.) and the lifecycle of technology adoption in the given market. We validate our data through collaboration with other Statista teams, third-party forecasts, regional comparisons, and the analysis of development cycles in different markets.
14
Forecasting (1/5)
Source: Statista Mobility Market Outlook 2020
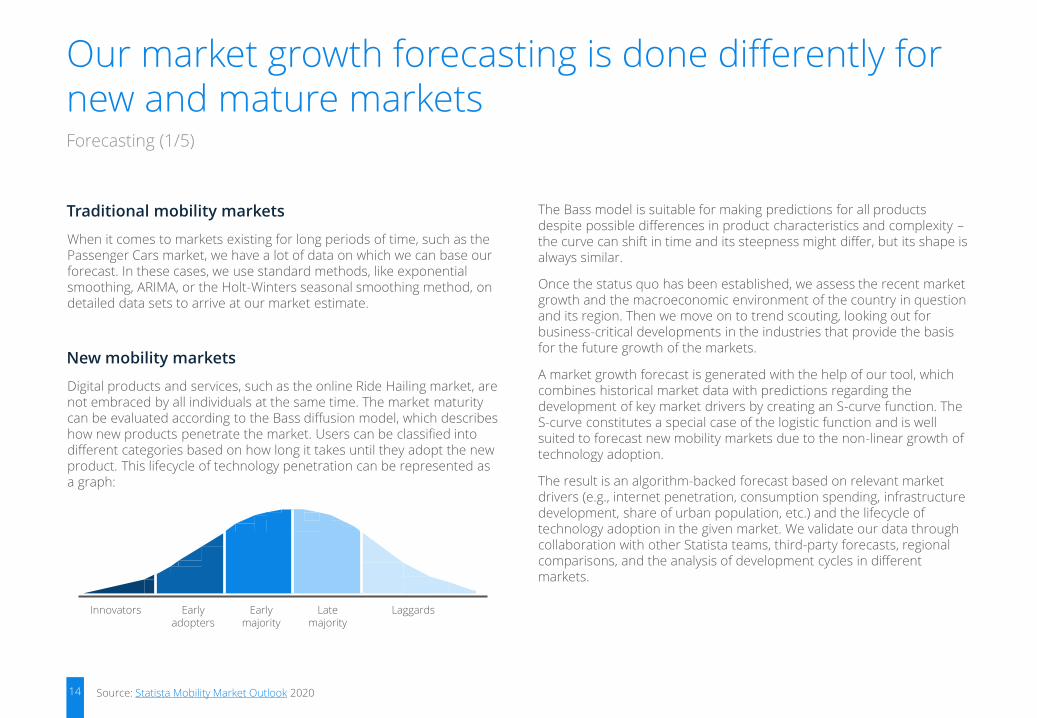
Our market growth forecasting is done differently for new and mature markets
Traditional mobility markets
When it comes to markets existing for long periods of time, such as the Passenger Cars market, we have a lot of data on which we can base our forecast. In these cases, we use standard methods, like exponential smoothing, ARIMA, or the Holt-Winters seasonal smoothing method, on detailed data sets to arrive at our market estimate.
New mobility markets
Digital products and services, such as the online Ride Hailing market, are not embraced by all individuals at the same time. The market maturity can be evaluated according to the Bass diffusion model, which describes how new products penetrate the market. Users can be classified into different categories based on how long it takes until they adopt the new product. This lifecycle of technology penetration can be represented as a graph:
Innovators LaggardsLatemajority
Earlymajority
Earlyadopters

15
Parameters that determine the projected market development
▪ h: Forecast horizon – number of years to be forecast
▪ α: Level reactivity – reactivity of the model towards changes in the level
▪ β: Trend reactivity – reactivity of the model towards changes in the trend
Forecasting (2/5)
Source: Statista Mobility Market Outlook 2020
Exponential trend smoothing
0
5
10
15
20
25
0 2 4 6 8 10 12 14 16
𝑦 ̂ (α = 0.3, β = 0.3) 𝑦 ̂ (α = 0.9, β = 0.3) 𝑦 ̂ (α = 0.9, β = 0.9) 𝑦 ̂ (α = 0.3, β = 0.9) y (target)
𝑦, 𝑦 ̂
ො𝑦𝑡+ℎ = ℎ ො𝑎1,𝑡 + ො𝑎0,𝑡
ො𝑎0,𝑡 = 𝛼𝑦𝑡 + 1 − 𝛼 ො𝑦𝑡 = 𝛼𝑦𝑡 + 1 − 𝛼 ො𝑎0,𝑡 + ො𝑎1,1
ො𝑎1,𝑡 = 𝛽 ො𝑎0,𝑡 − ො𝑎0,𝑡−1 + 1 − 𝛽 ො𝑎1,𝑡−1
Time in years
16
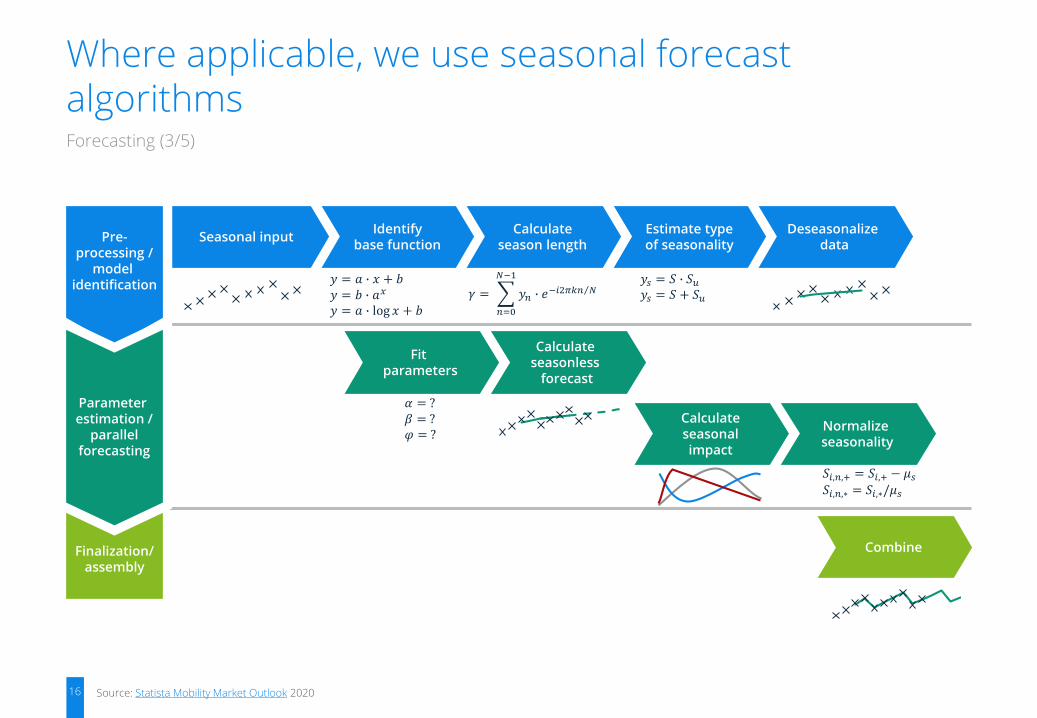
Forecasting (3/5)
Source: Statista Mobility Market Outlook 2020
Where applicable, we use seasonal forecast algorithms
Seasonal inputIdentify
base functionEstimate typeof seasonality
Calculateseason length
Deseasonalize data
𝑦 = 𝑎 ∙ 𝑥 + 𝑏𝑦 = 𝑏 ∙ 𝑎𝑥
𝑦 = 𝑎 ∙ log 𝑥 + 𝑏
𝛾 =
𝑛=0
𝑁−1
𝑦𝑛 ∙ 𝑒− Τ𝑖2𝜋𝑘𝑛 𝑁𝑦𝑠 = 𝑆 ∙ 𝑆𝑢
𝑦𝑠 = 𝑆 + 𝑆𝑢
Calculateseasonalimpact
Calculate seasonless
forecast
Normalize seasonality
Fit parameters
𝛼 = ?𝛽 = ?𝜑 = ?
𝑆𝑖,𝑛,+ = 𝑆𝑖,+ − 𝜇𝑠
𝑆𝑖,𝑛,∗ = 𝑆𝑖,∗/𝜇𝑠
CombineFinalization/assembly
Pre-processing /
model identification
Parameter estimation /
parallelforecasting

17
Innovation diffusion curve 2018
Forecasting (4/5)
Source: Statista Mobility Market Outlook 2020
The application of the Bass innovation diffusion model exemplified by Ride Hailing market growth
Innovators Early adopters Early majority Late majority Laggards
14.0%
28.5%
17.9%
9.6%
17.8%
3.9%
5.7%
50.0% 84.0% 100.0%2.5% 16.0%
30.9%
The diffusion of innovations graph shows successive groups of consumers adopting ride hailing (the graph above shows the penetration rate of selected countries). In general, innovations are not adopted by all individuals at the same time. Instead, they tend to adopt them successively, and it is possible to classify customers into different adopter categories based on how long it takes them to adopt the innovation. Diffusion is considered to be the rate and volume at which innovations spread among their users. An adoption rate of 100% is theoretically possible but not realistic. Thus, the high online share in Singapore can be considered close to saturation. Given the already high diffusion rates, the Ride Hailing market is likely to grow slower in the next few years.
Diffusion(accumulated users)
User penetration in %

18
Parameters that determine the projected market development
▪ A: Base level – starting point of market development / known threshold
▪ G: Jumping height – remaining potential until maximum market
penetration
Forecasting (5/5)
▪ T: Symmetry – progression of market diffusion
▪ k: Steepness – development speed / intensity of growth
▪ M: Inflection point – point of transition to incipient market saturation
1: Depending on the market for which the forecast is made, a market maturity metric might be user penetration, revenue, saturation, etc.Source: Statista Mobility Market Outlook 2020
The S-curve function and its parameters
0
1
2
3
0 2 4 6 8 10 12 14 16
A: Base level
G: Jumping height
T: Symmetry
M: Inflection point
k: Steepness
y = A +G
1 + T ∙ e−k∙ x−M 1/T
Time in years
Ma
rke
t m
atu
rity
me
tric
1

APPENDIX
19
This appendix contains answers to frequently
asked questions about the general methodology

20
What macroeconomic data was used to model the forecast?
You can find the key market indicators used for the forecasting at the bottom of the market and/or segment page.
What currency rates were used to convert the values in local currency into US$?
The Statista Mobility Market Outlook uses the constant average currency rate. It can be found on the top right of each segment’s page.
Has the monetary data been adjusted for inflation?
The forecasts in the Statista Mobility Market Outlook are in real value (adjusted for inflation).
Are the markets broken down by brands/companies?
The Passenger Cars market is broken down by car makes. The market shares for other markets will be added in 2020. For an idea on user shares, you can refer to the Statista Global Consumer Survey for all markets of the Statista Mobility Market Outlook.
Frequently asked questions (1/3)
How often do you update the information?
We update the data in our Market Outlooks at least twice a year. The updates are scattered throughout the year. Thus, one market might be updated in January and July, while others are updated later. If something major happens that influences our estimations or if we find inconsistencies, we will update the information immediately.
Is data on different years comparable?
Yes, that is the main feature of our Market Outlooks: comparability across markets, countries, and years. If we change market definitions to adapt to the ever-changing business models in the mobility world, we adapt the whole market estimate & forecasts so that all revenue data corresponds again to the new definition and is comparable across years.
Is it possible to get historical data for years prior to the data published in the tool?
When it comes to new mobility markets, historical data for these years is rare, and we would have to estimate it. These markets are still emerging and are influenced by many unpredictable factors, which, in the past, were hard to capture and therefore not easy to measure.
For more traditional mobility markets, like vehicle sales, we include data starting from 2013. The availability of earlier years differs depending on the location. Therefore, we do not include these years in order to ensure a consistent regional aggregation.
Source: Statista Mobility Market Outlook 2020
FAQ: Statista Mobility Market Outlook
21
The figures now differ significantly from those of the previous year. Why has the data changed?
Approaches, assumptions, input data, and scope are improved from update to update. Therefore, data from previous updates might not necessarily be comparable with current data. In addition to that, our own primary research is expanding, and we are replacing third-party data sources with data from the Statista Global Consumer Survey, which can lead to a one-time significant change in data.
The data in the downloadable files and/or in the report differs from the data shown on the platform. Which is correct?
The data on the platform is always updated first. In the reports and in downloadable files, the new data might be available a little later due to limited IT capacity and time lags.
Can we download the information as an Excel/PPT file?
The data in our Market Outlooks can be downloaded as an Excel or PDF file. Our reports are available for download as a PDF file only.
Frequently asked questions (2/3)
Can I get the raw data or the original file where you modeled the market?
We do not offer our working files for download.
How can I ascertain how reliable the data is? Do you have an indicator on how precise these forecasts are?
There is little data we can compare our forecasts to as no statistical office monitors new mobility markets such as ride hailing, and most sources differ in methodology. But we certainly compare our estimates with those from other companies, and, in some cases, company reportsand press releases serve as a good indicator.
Who do I contact in case of feedback or questions regarding the content of the Mobility Market Outlook?
For all content support requests, please contact our customer support. The request will be immediately forwarded to the responsible market analyst, who can give you relevant feedback.
Source: Statista Mobility Market Outlook 2020
FAQ: Statista Mobility Market Outlook

22
Definitions
What is the methodology of the Travel & Tourism market?
In the last two decades, travel booking has been increasingly made online. For this reason, we use the Global Consumer Survey, which is conducted online, as a main source of our research. Furthermore, we rely on market data from independent databases and third-party sources, analyses of various key market and macroeconomic indicators, historical developments, current trends, and reported performance indicators from key market players.
Our analysts have developed a bottom-up modeling approach for the Travel & Tourism market based on the number of individual travelers, the average frequency of traveling per year, average prices, the average size of travel parties, and the average length of trips. This approach has been implemented for our 46 core countries – the world‘s largesteconomies, such as the United States, China, and Germany. For the 104 non-core countries, we apply algorithmic data analysis, based on macroeconomic indicators and market drivers. Normalized indicators allow realistic assumptions and comparisons (per-capita spending, penetration rates, etc.), even for countries with low data availability.
Frequently asked questions (3/3)
What is the definition of the Travel & Tourism market?
The Travel & Tourism market contains package holidays, hotel stays, private vacation rentals, and cruises. Well-known providers of package holidays are online travel agencies (OTAs) such as Expedia and Opodoand tour operators such as TUI. Specialized providers of hotels and private accommodation booked online are, for example, Hotels.com, Booking.com, and Airbnb. The booking volume includes all travel bookings made by users from the selected region, regardless of the place of departure and destination.
What does revenue in the Travel & Tourism market refer to?
All monetary figures refer to the gross spending on cruises, vacation rentals, hotels, and package holiday bookings via online and offline channels. In general, we use the following formula for calculating the revenue: (average revenue per user) * (user)
What do users in the Travel & Tourism market refer to?
Users represent all travelers. Paying and non-paying travelers are both included in the calculations.
How is the online/offline share of the market calculated?
We use the Global Consumer Survey as a base for calculating the share of online and offline bookings since the survey contains separate questions about booking travel products online and purchasing travel products in general, without mentioning the specific sales channel.
Source: Statista Mobility Market Outlook 2020
FAQ: Statista Mobility Market Outlook – Travel & Tourism

PASSENGER CARS & MOTORCYCLES
23

24
What information is available?
The Passenger Cars market offers data on vehicle sales, prices, and revenues for each country / car-class/car-make2 combination. As we provide information on a brand level, country coverage is limited to the major markets. Please see the footnote for more information.
Are all car makes included?
We provide a full market coverage. Some manufacturers might not operate in every country and, therefore, might not be available for selection. Small manufacturers, selling under a hundred cars per year, are not selectable but are included on an aggregate level.
How does the classification work?
Information on each car model sold is collected and processed. Our classification is based on model properties (e.g., mass, dimensions, etc.) and international classifications – the combination of these two factors leads to a comprehensive hierarchical ordering of sales information. Please see the following pages for more information.
Methodology of the Passenger Cars and Motorcycles market model (1/5)
How are prices computed?
The price and revenue box are based on the volume-weighted average prices (VWAP) of the base car models. This approach takes into accountthe manufacturer’s suggested retail price (MSRP) including taxes for each vehicle in the basic configuration. The average price in the segment and/or for a make is then scaled by volume sales in the following way:
VWAP =σ(base model price ∗ volume sales)
σ volume sales
Revenue in each segment and of each make is then calculated by multiplying volume-weighted average price by vehicle sales.
We use the VWAP model as it provides a comparable value for the economic performance of each manufacturer across all markets from a consumer-centric point of view.
Why does the price timeline sometimes stop?
If a car make stops operating in a market or segment, price data will not be displayed. For example, Mitsubishi i-MiEV was discontinued in the U.S. in 2017. As this was the make’s only mini car, the price timeline stops in 2017.
1: Sports and Luxury Cars are excluded from China while United States includes sales of Pickup Trucks and Full-Size Vans 2: Car class and make data is currently only available for 29 countries Source: Statista Mobility Market Outlook 2020
FAQ: Statista Mobility Market Outlook – Passenger Cars1
25
What does the “Connected Cars Share” box show?
The “Connected Cars Share” box depicts the share of connected passenger cars sold in a country by class and make. We provide a full market coverage for the U.S.: Some manufacturers might not operate in every country and, therefore, might not be available for selection.
How are Connected Cars defined?
We consider a car to be connected if it is equipped with hardware which either enables internet connection or enables the addition of devices which connect the car to the internet.
How are the connected shares calculated?
We collect and analyze car features data for each model variant. Specific car features, which indicate connectedness (e.g., remote starting, Bluetooth access, etc.) were isolated from the data set and combined into connectivity groups. Based on the relevance of these groups, car sales overall and their prices, a connectivity share is calculated and assigned to each car model.
The forecasting of the connected share was done on a model level using a mix of standard approaches.
Methodology of the Passenger Cars and Motorcycles market model (2/5)
What does the “Fuel/Drive Type Share” box show?
The “Fuel/Drive Type Share” box shows the distribution of the energy types used to power vehicles. These include:
• Diesel
• Petrol
• Hybrid (Diesel-Electric, Petrol-Electric)
• Electric
• Alternative (E85, LPG, Natural Gas, Biomethane, etc.)
This data is presented only for selected countries.
Source: Statista Mobility Market Outlook 2020
FAQ: Statista Mobility Market Outlook – “Connected Cars Share” and “Fuel/Drive Type Share” boxes

26
Methodology of the Passenger Cars and Motorcycles market model (3/5)
Source: Statista Mobility Market Outlook 2020
Comparable international classification is used forthe segmentation of the Passenger Cars market
Statista segment
U.S. car segmentEuropean car segment
Chinese car segment
Alternative name Example models
Mini Cars Minicompact Cars A - Mini Cars Category A City Cars, Microcars Fiat 500, Hyundai i10, Peugeot 107
Small Cars Subcompact Cars B - Small Cars Category A Light Cars, Superminis Citroën C3, Ford Fiesta, Volkswagen Polo
Medium Cars Compact Cars C - Medium Cars Category B Small Family Cars BMW 1 Series, SEAT León, Volkswagen Golf
Large Cars Mid-Size Cars D - Large Cars Category BLarge Family Cars, Compact Executive Cars, Entry-Level Luxury Cars, Intermediate Cars
Honda Accord, Peugeot 407, ŠKODA Superb
Executive Cars Large Cars E - Executive Cars Category B Full-Size Cars, Mid-Size Luxury Cars Audi A6, Jaguar XF, Mercedes-Benz E-Class
Luxury Cars Luxury Cars F - Luxury Cars Category BFull-Size Luxury Cars, High-End Luxury Cars, Oberklasse
Audi A8, Jaguar XJ, Mercedes-Benz S-Class
Sports Cars Sports Cars S - Sports Coupes Category B Two-SeatersAston Martin DB9, Jaguar XK, Mercedes-Benz CLK
Minivans MPV, Minivan M - Multi-Purpose Cars Multi-Purpose VehiclesMPV, Multi-Purpose Cars, People Carrier
Citroën C3 Picasso, Mazda 5, Toyota Verso
Small SUVs Small SUVs J - Sport Utility Cars Sport Utility Vehicles Mini SUVs, Compact SUVs, Mini 4x4 Daihatsu Terios, Kia Sorento, Peugeot 4007
Large SUVs Large SUVs J - Sport Utility Cars Sport Utility VehiclesMid-Size SUVs, Full-Size SUVs, Large 4x4
BMW X5, Land Rover Discovery, Volvo XC90
Pickup Trucks Pickup Trucks - - Pick-Ups Chevrolet Silverado, Ford F-Series, Honda Ridgeline, Nissan Frontier
Full-Size Vans Cargo/Passenger Vans M - Multi-Purpose Cars Multi-Purpose Vehicles Minibuses, People MoversChevrolet Express, Ford Transit, Ford E-series, Mercedes-Benz Sprinter
27
What information is available?
The Motorcycles market offers data on motorcycle sales, prices, and revenues for each country. As we provide information on a brand level, country coverage is limited to the major markets. Please see the following pages for more information.
Are all motorcycle makes included?
We provide a full market coverage. Some manufacturers might not operate in every country and, therefore, might not be available. Small manufacturers are included on an aggregate level. We currently display the revenue and sales market shares of top motorcycle brands on a country level.
Methodology of the Passenger Cars and Motorcycles market model (4/5)
How are prices computed?
The price and revenue box are based on the volume-weighted average prices (VWAP) of the base motorcycle models. This approach takes into account the manufacturer’s suggested retail price (MSRP) including taxes for each motorcycle in the basic configuration. The average price for a make is then scaled by volume sales in the following way:
VWAP =σ(base price ∗ volume sales)
σ volume sales
Revenue of each make is then calculated by multiplying volume-weighted average price by motorcycle sales.
We use the VWAP as it provides a comparable value for the economic performance of each manufacturer across all markets from a consumer-centric point of view.
Source: Statista Mobility Market Outlook 2020
FAQ: Statista Mobility Market Outlook –Motorcycles
Asia North AmericaEurope
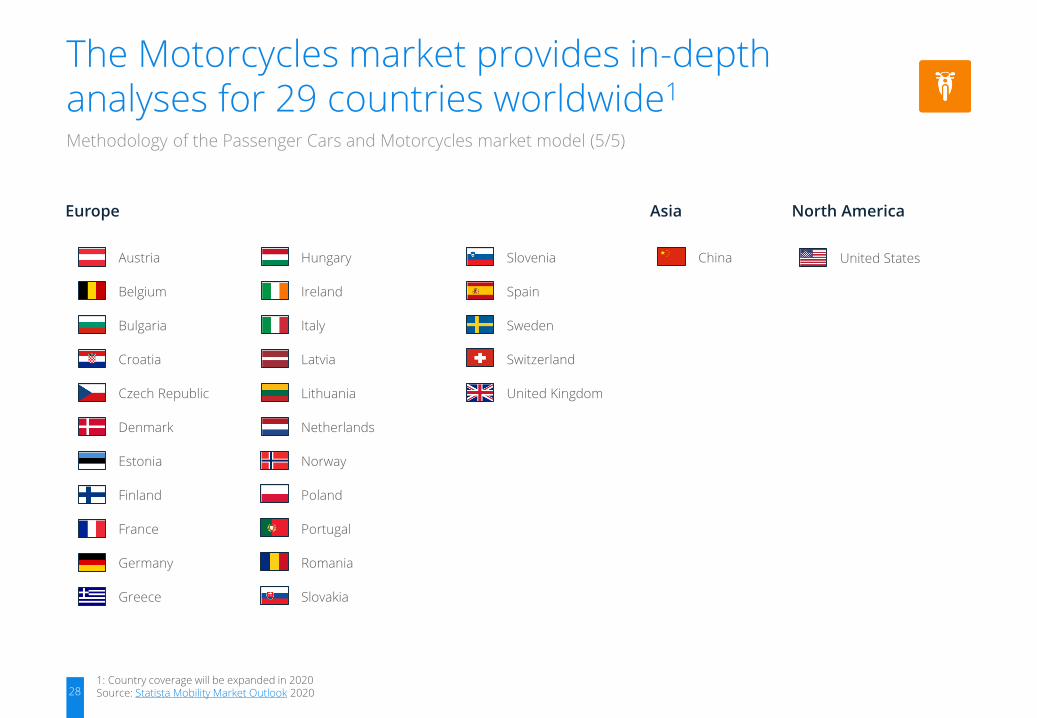
Methodology of the Passenger Cars and Motorcycles market model (5/5)
The Motorcycles market provides in-depth analyses for 29 countries worldwide1
28
ChinaSlovenia
Spain
Sweden
Switzerland
United Kingdom
Hungary
Ireland
Italy
Latvia
Lithuania
Netherlands
Norway
Poland
Portugal
Romania
Slovakia
Austria
Belgium
Bulgaria
Croatia
Czech Republic
Denmark
Estonia
Finland
France
Germany
Greece
United States
1: Country coverage will be expanded in 2020Source: Statista Mobility Market Outlook 2020

UNITED STATES +1 212 419 5770
Esther Shaulova [email protected]
LATIN AMERICA +1 212 419 5773
Andrea Romero [email protected]
EUROPE +44 203 709 9960
Lodovica Biagi [email protected]
GERMANY +49 40 28 48 41 0
Jens Weitemeyer [email protected]
ASIA +91 804 901 6428
Ziyan Zhang [email protected]
29
Get in touch with us - We are happy to help
Related Documents