Lehrstuhl für Elektrische Energiespeichertechnik (Prof. Jossen) TUM Department of Electrical and Computer Engineering Technical University of Munich Stationary Lithium-Ion Battery Energy Storage Systems A Multi-Purpose Technology Marcus Müller Vollständiger Abdruck der von der Fakultät für Elektrotechnik und Informationstechnik der Technischen Universität München zur Erlangung des akademischen Grades eines Doktor-Ingenieurs (Dr.-Ing.) genehmigten Dissertation. Vorsitzender: Prof. Dr.-Ing. Rolf Witzmann Prüfer der Dissertation: 1. Prof. Dr.-Ing. Andreas Jossen 2. Prof. Dr. Isabell M. Welpe Die Dissertation wurde am 27.09.2017 bei der Technischen Universität München eingereicht und durch die Fakultät für Elektrotechnik und Informationstechnik am 22.01.2018 angenommen.

Welcome message from author
This document is posted to help you gain knowledge. Please leave a comment to let me know what you think about it! Share it to your friends and learn new things together.
Transcript
Lehrstuhl für Elektrische Energiespeichertechnik (Prof. Jossen)
TUM Department of Electrical and Computer Engineering
Technical University of Munich
Stationary Lithium-Ion Battery Energy Storage Systems
A Multi-Purpose Technology
Marcus Müller
Vollständiger Abdruck der von der Fakultät für Elektrotechnik und Informationstechnik der
Technischen Universität München zur Erlangung des akademischen Grades eines
Doktor-Ingenieurs (Dr.-Ing.)
genehmigten Dissertation.
Vorsitzender: Prof. Dr.-Ing. Rolf Witzmann
Prüfer der Dissertation: 1. Prof. Dr.-Ing. Andreas Jossen
2. Prof. Dr. Isabell M. Welpe
Die Dissertation wurde am 27.09.2017 bei der Technischen Universität München eingereicht
und durch die Fakultät für Elektrotechnik und Informationstechnik am 22.01.2018
angenommen.

Executive Summary
As a result of the acceleration of the energy transition toward 100 % renewables worldwide,
the existing structures in electricity networks are drastically changing, and there are entirely
new demands on both, network- and system stability. Flexibility through storage is one of the
most promising technology developments to counter the emerging problems. Due to the
sharp fall in prices and outstanding technical characteristics, lithium-ion battery energy
storage systems promise to be a cost-effective option for providing the needed flexibility.
Installations of stationary battery energy storage systems are mostly operated exclusively in
a single application. As of today, the majority of applications for battery storage in Germany
consist of systems increasing a single-family households’ self-consumption and systems
which are designed to solely serve network purposes (for instance, to participate in the
market for primary control reserve). However, the results of this thesis indicate that the
stacking of applications on a single system adds additional income streams making these
systems economically advantageous over single systems with individual applications.
The central problems for the implementation of such multi-purpose systems are i) the
regulatory frameworks for the classification and legal treatment in electricity networks and ii)
the technological handling to enable simultaneous participation in multiple markets.
To overcome these problems, this thesis gives an overview of lithium-ion stationary battery
storage systems, their characteristics, applications, and an outlook on promising
combinations of applications in the form of case studies.
A technical framework introduces an approach for the design, implementation, and operation
of a multi-purpose battery energy storage system. Finally, under the current (2017)
regulatory framework in Germany, three business models for such systems are discussed.
The technological and logical implementation of multi-purpose concepts seems to be
practical. Considering the characteristics of different applications as well as resulting load
profiles and operating conditions, a large number of applications can be combined in a
technical and economically meaningful way with one another.
The legal handling of such systems can only be seen under current regulatory context and
appears to be much more complex. In particular, the legal and regulatory definition of battery
storage systems in electrical networks is the greatest obstacle throughout many markets.
Multi-purpose battery energy storage systems can help answer many of the current as well
as emerging problems in electricity networks. However, the interplay of larger fleets of multi-
purpose battery storage systems in networks and very large system setups have yet to be
investigated. In particular, it is recommended to work on new standards for the operation and
definition of multi-purpose battery storage systems in electricity networks.
Kurzfassung
Durch die Beschleunigung der Energiewende auf 100% erneuerbare Energien weltweit
verändern sich die bestehenden Strukturen in den Stromnetzen drastisch, und es gibt völlig
neue Anforderungen an die Netzwerk- und Systemstabilität. Flexibilität durch Speicherung
von elektrischer Energie ist eine der vielversprechendsten technologischen Entwicklungen,
um den aufkommenden Problemen entgegenzuwirken. Aufgrund des starken Preisverfalls
und der herausragenden technischen Eigenschaften versprechen Lithium-Ionen-Batterie-
Energiespeichersysteme eine kostengünstige Möglichkeit, die benötigte Flexibilität
bereitzustellen.
Installationen von stationären Batteriespeichersystemen werden meist ausschließlich in
einer einzigen Anwendung betrieben. Die Mehrheit der Anwendungen für die
Batteriespeicher in Deutschland genutzt werden besteht aus Systemen, welche den
Eigenverbrauch von Einfamilienhäuser erhöhen und Systemen die ausschließlich für
Netzwerkzwecke eingesetzt werden sind (z.B. die Teilnahme am
Priämarregelleistungsmarket) . Die Ergebnisse dieser Arbeit zeigen jedoch, dass das
Stapeln von Anwendungen auf einem einzigen System zusätzliche Einkommensströme
hinzufügt, die diese Systeme gegenüber einzelnen Systeme mit individuellen
Anwendungen wirtschaftlich vorteilhaft machen.
Die zentralen Probleme bei der Umsetzung solcher Mehrzweck-Systeme sind i) die
regulatorischen Rahmenbedingungen für die Einstufung und rechtliche Behandlung in
Elektrizitätsnetzen und ii) die technologische Abwicklung, um die gleichzeitige Teilnahme
an mehreren Märkten zu ermöglichen.
Um diese Probleme zu überwinden, gibt diese Arbeit einen Überblick über Lithium-Ionen-
stationäre Batteriespeichersysteme, deren Eigenschaften, Anwendungen und einen
Ausblick auf vielversprechende Kombinationen von Anwendungen in Form von Fallstudien.
Ein technischer Rahmen stellt einen Ansatz für die Konzeption, Implementierung und den
Betrieb eines Mehrzweck-Batteriespeichersystems vor. Schließlich werden beispielhaft
unter dem derzeitigen Regulierungsrahmen (2017) in Deutschland drei Geschäftsmodelle
für solche Systeme diskutiert.
Die technologische und logische Umsetzung von Mehrzweckkonzepten scheint praktisch
zu sein. Unter Berücksichtigung der Eigenschaften unterschiedlicher Anwendungen sowie
daraus resultierender Lastprofile und Betriebsbedingungen können eine Vielzahl von
Applikationen technisch und wirtschaftlich sinnvoll miteinander kombiniert werden.
Die rechtliche Handhabung solcher Systeme ist nur unter dem aktuellen regulatorischen
Kontext zu sehen und scheint viel komplexer zu sein. Insbesondere die rechtliche und
regulatorische Definition von Batteriespeichersystemen in elektrischen Netzen ist das
größte Hindernis in vielen Märkten.
Mehrzweck Batterie-Energiespeichersysteme können dazu beitragen, viele der aktuellen
sowie aufkommende Probleme in Stromnetzen zu lösen. Allerdings ist das Zusammenspiel
von größeren Flotten von Mehrzweck-Batteriespeichern in Netzwerken und sehr großen
Systemen noch zu untersuchen. Insbesondere wird empfohlen, an neuen Standards für
den Betrieb und die Definition von Mehrzweck-Batteriespeichern in Stromnetzen zu
arbeiten.
List of Publications
Selection of Conference Contributions
M. Müller, A. Jossen, Energy Storage as a Key Enabler of a New Electrification Wave. A Battery Storage Perspective, 1st Transatlantic Perspectives on Energy Storage: Technology, Policy and Finance, Massachusetts Institute of Technology, Cambridge, October 2016 (Oral Presentation).
M. Müller, C. N. Truong, M. Schimpe, M. Naumann, H. C. Hesse, Fragmented Local Community Battery Storage Systems, Kraftwerk Batterie, Münster, April 2016 (Oral Presentation).
M. Müller, A. Jossen, Eigenheim, Mehrfamilienhaus, Ortsnetz - Energiewende lokal?, VDE Arbeitskreis Energietechnik, Munich, April 2016 (Oral Presentation).
M. Müller, A. Jossen, Shared Economy Approaches for Stationary Battery Storage Systems, Energy Storage Europe, Düsseldorf, March 2016 (Oral Presentation).
M. Müller, A. Jossen, Fragmentierte Ortsnetzspeicher - Kombination von Anwendungen zur ökonomischen Optimierung von Batteriespeichern in Ortsnetzen, 3. Konferenz Zukünftige Stromnetze für Erneuerbare Energien, Berlin, January 2016, (Poster & Oral Presentation).
M. Müller, A. Jossen, Batterie Großspeicher - Netzintegration, Business-Cases und Zukunftsperspektiven, 3. Kongress PV-Speichersysteme, Salzburg, November 2015 (Oral Presentation).
M. Müller, A. Jossen, EEBatt - Distributed stationary battery storage systems for the efficient use of renewable energies and support of grid stability, Batterieforum Deutschland, Berlin, January 2015 (Poster Presentation).
S. Rohr, M. Kerler, S. Burow, M. Müller, M. Lienkamp, A. Jossen, Risk Analysis of Lithium-Ion Energy Storage Systems in Grid Applications – a Norm-Based Approach, Battery Safety Conference, Washington, November 2014 (Poster Presentation).
Selection of Presentations
M. Müller, H. Gasteiger, A. Jossen, Energie lokal erzeugen, speichern und nutzen! Projekt EEBatt, Bavarian Parliament, Munich, February 2016 (Oral Presentation).
M. Müller, A. Jossen, 2nd Life - Vehicle to Grid - Speicherschwärme. Zukünftige Geschäftsmodelle, Stationäre Energiespeicher in regionalen Netzen, Regensburg, February 2016 (Oral Presentation).
M. Müller, A. Jossen, Einführung in stationäre Energiespeichertechnik, Stationäre Energiespeicher in regionalen Netzen, Regensburg, February 2016 (Oral Presentation).
M. Müller, A. Jossen, Regel- und Betriebsstrategien von Energiespeichern in Netzen - Teil III - Der Ortsnetzspeicher. Stationäre Energiespeicher in regionalen Netzen, Regensburg, February 2016 (Oral Presentation).
M. Müller, A. Jossen, Shared Economy Ansätze für BESS Business Modelle, BVES AG 1 Politik und Kommunikation, Berlin, January 2016 (Oral Presentation).
Peer-Reviewed Scientific Reports / Books (Co-Author)
VDE ETG, Batteriespeicher in der Nieder- und Mittelspannungsebene. Anwendungen und Wirtschaftlichkeit sowie Auswirkungen auf die elektrischen Netze, VDE e.V., Frankfurt am Main, May 2015 (Chapter).
J. Böttcher, P. Nagel, et. al, Batteriespeicher – Rechtliche, Technische und Wirtschaftliche Rahmenbedingungen, De Gruyter, Oldenbourg, January 2017 (Chapter).
Peer-Reviewed Journal Contributions (Co-Author)
C. N. Truong, M. Naumann, K. Ch. Ralph, M. Müller, A. Jossen, H. C. Hesse, Economics of Residential PV Battery Systems in Germany: The Case of Tesla’s Powerwall, Batteries 2 (2016) 14-31. *
A. Zeh, M. Müller, H. C. Hesse, A. Jossen, R. Witzmann, Operating a Multitasking Stationary Battery Storage System for Providing Secondary Control Reserve on LV Level, Proceedings of International ETG Congress 147 (2015) 483-491.
A. Becker, H. Loges, S. Kippelt, A. Gitis, D. Echternacht, M. Müller, et al., Electricity Storage Systems in Medium- and LV Networks, Proceedings of International ETG Congress 147 (2015) 151-159.
J. Stich, M. Müller, H. C. Hesse, A. Jossen, T. Hamacher, Sustainable Power Supply Options for Large Islands – A case study for Belitung Island, IGST ASIA (2016) accepted. *
Journal Contributions and Seminars
M. Müller, Speicher 2020 - Produkte für viele Zwecke, SolarThemen 458 2016 (Interview).
M. Müller, Technische Universität Munich, Projekt EEBatt - Lokaler Speicher für erneuerbare Energien. Energy Neighbor geht in Betrieb, Munich 2015 (Lead).
M. Müller, Stationäre Energiespeicher in regionalen Netzen, OTTI Seminar, Regensburg, February 2015 (Seminar Leader).
M. Müller, Stationäre Energiespeicher in regionalen Netzen, OTTI Seminar, Regensburg, February 2016 (Seminar Leader).
Peer-Reviewed Journal Contributions (Lead Author)
M. Müller, L. Viernstein, C. N. Truong, A. Eiting, H. C. Hesse, R. Witzmann, A. Jossen, Evaluation of Grid-Level Adaptability for Stationary Battery Energy Storage System Applications in Europe, J. Energy Storage 8 (2016). *
M. Müller, A. Zeh, M. Naumann, H. C. Hesse, A. Jossen, R. Witzmann, Fundamentals of Using Battery Energy Storage Systems to Provide Primary Control Reserves in Germany, Batteries 2 (2016) S. 29. *
M. Müller, A. Zeh, S. Rohr, S. F. Schuster, C. Campestrini, H. C. Hesse et al.: Evaluation of the Aging Behaviour of Stationary Lithium-Ion Battery Storage Systems for Different PV-Driven Applications in Low Voltage Grids. 31st European PV Solar Energy Conference and Exhibition (2015), 3084-3090. *
* Self-produced sections of publications are partially contained in this doctoral thesis without any further reference in the running text (figures are continuously referenced).
Table of Contents
1 Introduction ......................................................................................................................... 1
1.1 Motivation .................................................................................................................... 1
1.2 Multi-purpose Technology and the “Energy Neighbor” Prototype System ................... 2
1.3 Structure of this Work .................................................................................................. 4
2 Basics of Stationary Battery Storage Systems .................................................................... 6
2.1 A General View of Electrical Energy Storage Systems ................................................ 6
2.2 Technical Framework for BESSs ............................................................................... 11
2.2.1 Lithium-Ion Cell Types ........................................................................................ 16
2.2.2 System Safety .................................................................................................... 22
2.3 Legal Framework for BESSs ..................................................................................... 25
2.3.1 Transmission System Operators in Europe ........................................................ 27
2.3.2 Distribution System Operators ............................................................................ 28
2.3.3 Energy Supply Companies ................................................................................. 28
2.3.4 Solar Power Plant Operator ................................................................................ 29
2.3.5 Power Customers ............................................................................................... 29
2.3.6 Municipality ......................................................................................................... 29
3 Application Concepts and Stakeholder Analysis ............................................................... 31
3.1 Black Start Capacity .................................................................................................. 33
3.2 Energy Market Participation ....................................................................................... 33
3.3 Grid Quality ................................................................................................................ 34
3.4 Island Operation ........................................................................................................ 37
3.5 Residential Home Storage ......................................................................................... 37
3.6 Secondary Control Reserve ....................................................................................... 41
3.7 Tertiary Control Reserve ............................................................................................ 43
3.8 Peak and Load-Shaving Services .............................................................................. 44
3.9 Primary Control Reserve ........................................................................................... 45
3.10 Uninterruptable Power Supply ................................................................................... 47
4 Experimental and Case Studies ........................................................................................ 48
4.1 Excursus: Monitoring Innovation in Battery Storage Systems Technology ................ 49
4.2 Excursus: The Simulation Environment – SimSES ................................................... 56
4.3 Case Study: Grid-Level Adaptability for Stationary BESSs ........................................ 60
4.4 Case Study: Residential Home Storage .................................................................... 68
4.5 Case Study: Apartment Buildings and Multi-Family Houses ...................................... 71
4.6 Case Study: Primary Control Reserve ....................................................................... 77
4.7 Case Study: Island Operation .................................................................................... 78
4.8 Conclusion ................................................................................................................. 82
5 Multipurpose BESSs: Technical Aspects and Simulation Model ....................................... 84
5.1 Basic Concepts for the MPT BESS ........................................................................... 85
5.2 Simulation Model for MP-BESSs ............................................................................... 87
5.2.1 Simulation without MP-BESS BR ....................................................................... 89
5.2.2 Case distinction for high tariff operation ............................................................. 93
5.2.3 Case distinction for low tariff operation ............................................................... 96
5.3 Multiple Use of BESSs ............................................................................................... 99
5.3.1 On the multiple uses of BESSs .......................................................................... 99
5.3.2 On the operation of a multi-tasking BESS ........................................................ 101
5.4 Influence of APM Stacking on Aging ........................................................................ 105
5.5 Optimization Approaches for MP-BESSs ................................................................. 113
5.5.1 Optimizing application mode and power flow allocation of single BR ............... 113
5.6 Economics of MP-BESSs ........................................................................................ 118
5.7 Conclusion ............................................................................................................... 121
6 Multipurpose BESSs: Legal Aspects and Business Models ............................................ 124
6.1 Business Models ...................................................................................................... 125
6.1.1 Community Battery Storage ............................................................................. 125
6.1.2 Lease Model ..................................................................................................... 126
6.1.3 Electricity Tariff Model ....................................................................................... 127
6.2 Evaluation of the Proposed Business Models ......................................................... 128
6.3 Conclusion ............................................................................................................... 131
7 Conclusions and Future Work ......................................................................................... 133
7.1 Concluding Summary .............................................................................................. 133
7.2 The Future of Electricity Markets ............................................................................. 135
List of Abbreviations ............................................................................................................... 137
List of Symbols ....................................................................................................................... 140
List of References ................................................................................................................... 141
List of Appendices .................................................................................................................. 158

1
1 Introduction
First, the issues examined in this thesis are placed in context. Then, a comprehensive review of
prior and recent knowledge regarding stationary battery storage systems is provided to
emphasize the central theme, which is the current situation in the energy market and technology
and the present challenges for improving and adoption stationary battery energy storage
technology. From this information, the hypothesis of this thesis is derived, and the research
procedures are presented.
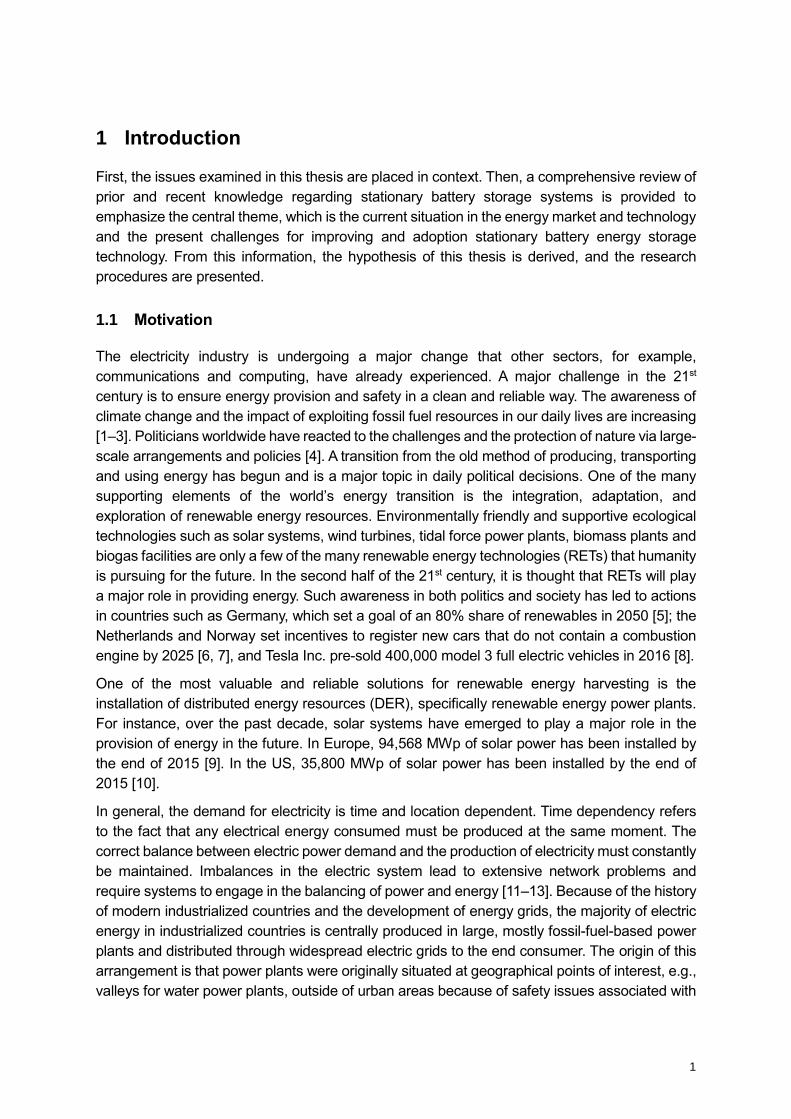
1.1 Motivation
The electricity industry is undergoing a major change that other sectors, for example,
communications and computing, have already experienced. A major challenge in the 21st
century is to ensure energy provision and safety in a clean and reliable way. The awareness of
climate change and the impact of exploiting fossil fuel resources in our daily lives are increasing
[1–3]. Politicians worldwide have reacted to the challenges and the protection of nature via large-
scale arrangements and policies [4]. A transition from the old method of producing, transporting
and using energy has begun and is a major topic in daily political decisions. One of the many
supporting elements of the world’s energy transition is the integration, adaptation, and
exploration of renewable energy resources. Environmentally friendly and supportive ecological
technologies such as solar systems, wind turbines, tidal force power plants, biomass plants and
biogas facilities are only a few of the many renewable energy technologies (RETs) that humanity
is pursuing for the future. In the second half of the 21st century, it is thought that RETs will play
a major role in providing energy. Such awareness in both politics and society has led to actions
in countries such as Germany, which set a goal of an 80% share of renewables in 2050 [5]; the
Netherlands and Norway set incentives to register new cars that do not contain a combustion
engine by 2025 [6, 7], and Tesla Inc. pre-sold 400,000 model 3 full electric vehicles in 2016 [8].
One of the most valuable and reliable solutions for renewable energy harvesting is the
installation of distributed energy resources (DER), specifically renewable energy power plants.
For instance, over the past decade, solar systems have emerged to play a major role in the
provision of energy in the future. In Europe, 94,568 MWp of solar power has been installed by
the end of 2015 [9]. In the US, 35,800 MWp of solar power has been installed by the end of
2015 [10].
In general, the demand for electricity is time and location dependent. Time dependency refers
to the fact that any electrical energy consumed must be produced at the same moment. The
correct balance between electric power demand and the production of electricity must constantly
be maintained. Imbalances in the electric system lead to extensive network problems and
require systems to engage in the balancing of power and energy [11–13]. Because of the history
of modern industrialized countries and the development of energy grids, the majority of electric
energy in industrialized countries is centrally produced in large, mostly fossil-fuel-based power
plants and distributed through widespread electric grids to the end consumer. The origin of this
arrangement is that power plants were originally situated at geographical points of interest, e.g.,
valleys for water power plants, outside of urban areas because of safety issues associated with
Introduction
2
large coal-fired or nuclear power plants or for colocation with rivers for plants requiring cooling
water. A secure electricity grid depends on a constant balance of generation and demand and a
well-maintained and constantly functioning electricity grid. In the case of an error in a power line,
the underlying grid structure is in danger of congestion and, in the worst case, a blackout [14].
The key challenge for stable and green future energy production, transport, and utilization is the
interaction of new technologies. Energy production and consumption are no longer time-
coupled. Solar insolation and wind power as energy sources are not always available for
consumption because of the seasonal differences, which disturb the equilibrium between energy
need and demand in different seasons. Possible solutions to this problem include energy-
efficiency projects, demand-side management, energy storage and the transition from electric
energy to other physical storage. Electrical energy storage systems (EESs) are seen as a
promising technology to solve one part of the overall challenge, the integration of renewable
energy producers. One technology currently available (as of 11/2016) to overcome this hurdle
is lithium-ion battery (LIB) technology. With the increase in available products in the consumer
markets, e.g., smartphones, wearables, and electric vehicles, LIB research has increased
significantly over the past decade.
However, LIB research at all levels of expertise, i.e., cell-level, module-level, and system-level
research, along with legal, jurisdiction, and economics investigations, must be accelerated
further with a focus on market-oriented solutions to make LIB technology available worldwide.
This thesis presents LIB technology as a key EES in the near future. Stationary LIB technology,
in particular, is considered a major component for a greener future. In the next sub-chapter, a
short introduction on the definitions for single-, multi-, and general-purpose technologies is
given, and the objectives and hypothesis of this thesis are derived from these definitions.
1.2 Multi-purpose Technology and the “Energy Neighbor” Prototype System
The following material will briefly introduce the idea of a multi-purpose technology, and the basis
for this thesis, the outcome of a scientific project [15], namely, the prototype battery energy
storage system (BESS) called the “Energy Neighbor.”
In general, the literature differentiates technologies according to their general use or a number
of applications. So-called single-purpose technologies (SPTs), e.g., a coffee machine, are
intended for a single application and serve a single specific need. General-purpose technologies
(GPTs), e.g., a personal computer or microprocessor, operate freely and can be used for
numerous applications [16] without specific knowledge of the theoretical potential of the
technology beforehand. General-purpose technology concepts were first mentioned by Gilles,
Williamson and David [17–19], but they were distinctively identified by Bresnahan and
Trajtenberg [20] as “[..] characterized by the potential for pervasive use in a wide range of sectors
and by their technological dynamism [..]” [16] added to the definition, describing GPT “[..] as a
technology that initially has much scope for improvement and eventually comes to be widely
used, to have many uses, and to have many spillover effects [..]”. Describing GPTs and SPTs
leads to a definition for multi-purpose technology (MPTs). [21] analyzed several technologies,
e.g., lasers and X-rays, fitting the definition of GPT but lacking key indicators [22] clearly
identifying them as GPTs. [21] addressed this gap and extended the definition of [23] MPTs as
follows:
Introduction
3
A multi-purpose technology [..] is a technology that has several distinct, economically
relevant applications primarily focused on one or a few sectors, yet lacks the
technological complementarities of general-purpose technologies. [21]
Further definitions must include applications, which serve as the major identification aspects for
MPTs. In the given definition, the applications must be characterized by specific sources of
economic value and must address a specific customer group. In other words, the characteristics
of MPTs include different sources of value creation and use by various customer groups. Such
technology can be inserted into entirely different value-creating environments and serve
completely different customers, value drivers, and competing technologies. In this thesis, BESS
devices are defined as MPTs; and neither their full market potential nor the customer value
creation potential has previously been estimated (as of 10/2016).
In the following work, a mixture of technology statements describing BESS devices as MPTs,
i.e., multi-purpose BESSs (MP-BESSs), descriptions of system design and boundaries, and
economic evaluations are presented. Additionally, this work proposes business models for the
proposed MP-BESS system architecture and discusses each model with regard to the legal and
regulatory framework in Germany as of 10/2016.
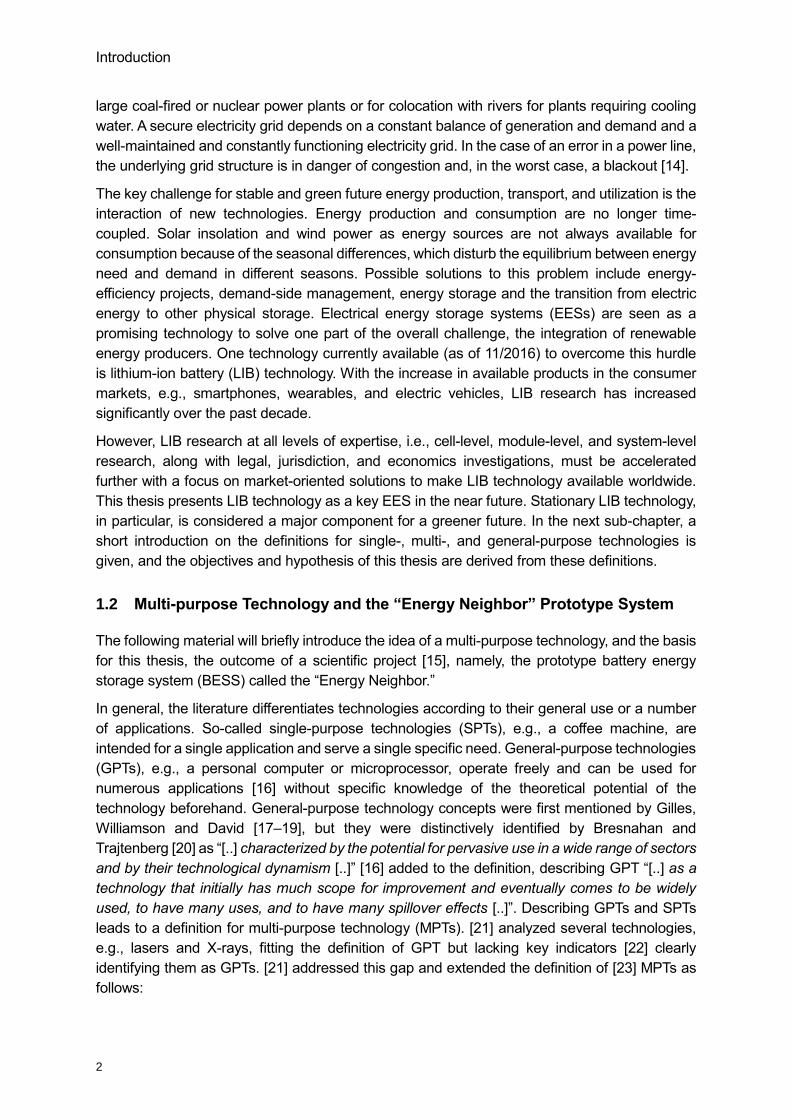
Figure 1 – 3D rendering of the Prototype Community BESS, the Energy Neighbor (graphics by Christian
Huber).
Under the auspices of the research project EEBatt [15], a prototype MP-BESS called the
“Energy Neighbor,” [24] (Figure 1) was created at the Technical University of Munich [25] and is
currently in use. The author, who acted as the manager of the project during its four-year
duration, worked closely with the scientific members to achieve the project’s goals. The Energy
Neighbor is an MP-BESS based on LIB technology. Its technical data are given in Table 2. This
device will serve as a reference system as the MP-BESS technology is discussed throughout
this thesis.
After an introduction to SPTs, MPTs, GPTs, and the demonstrator system, the Energy Neighbor,
the main issues of this work are summarized, the objectives and goals are given, and the thesis
procedure is presented.
Introduction
4
1.3 Structure of this Work
Currently, the presence of several technological, legal and economic hurdles impedes large
scale installation of BESSs. The main topic and first core issue of this thesis is the investigation
of the technical and legal functionality of LIB BESSs, which originates from the missing
economic value of LIB BESSs in many cases [26] as of today (10/2016). First, the legal
framework conditions, based on the assessment of Germany as a leader in the worldwide
energy transition, prevent BESSs from broader implementation and free participation in the
existing energy markets in Europe. Non-discriminating and open regulations and frameworks,
however, are necessary for a larger rollout of BESSs in grids. Henceforth, the stakeholders and
applications for operating a BESS are analyzed and explained. The second core issue is finding
a proper legal framework for the operation and technical architecture of such systems to
increase the economic value. Therefore, BESS devices are defined as MPTs, and a concise
framework, i.e., a simulation model and business cases for such systems, is provided. Both of
the core issues are examined in detail, and solution suggestions are given for each topic.
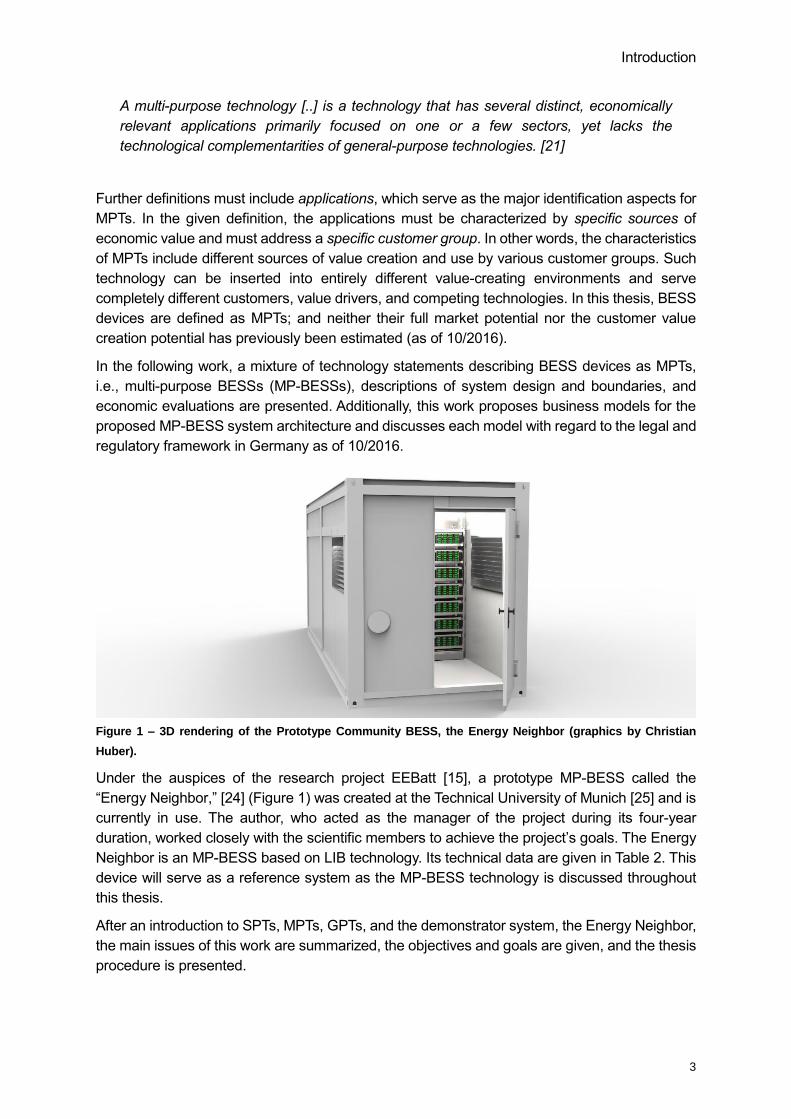
The scheme in Figure 2 provides a better understanding of the chapter interconnections and
progress clarification.
This thesis, “Stationary Lithium-Ion Battery Energy Storage Systems: A Multi-Purpose
Technology,” focuses on stationary LIB BESSs and explaining their general structure and
function as stationary electricity storage (SES), laying out the possibilities for integration in
different voltage grid levels, describing the associated applications and proposing a novel
approach for operating LIB BESSs as MPT carriers with the potential for reducing cost and new
business models. In Chapter 1, the context of this thesis and a short introduction to the
nomenclature critical for understanding the matter are given. In Chapter 2, the basics of BESS
technology and specific background information required for this work are explained.
Figure 2 – Quick overview of the fundamental topics, solution approaches, and relating chapters.
Subchapter 2.3 expressly provides a comprehensive view of the legal framework for BESSs in
Germany as of 10/2016; relevant parts of this thesis were written under the same circumstances
Core Issues:
Missing Economic Value and Legal Framework
Legal FrameworkChapter 2.3
Experimental and Case StudiesChapter 4
Multi-Purpose BESSChapter 5
Business ModelsChapter 6
ApplicationsChapter 3
BasicsChapter 2.1 / 2.2

Introduction
5
and distinct legal entities. For the general nomenclature in this work, Chapter 3 defines the most
common applications for BESSs and lists the subchapters that investigate the applications. The
information given is used for a detailed description of MP-BESSs and their functionality. The first
core chapter, Chapter 4, presents two excursuses, the results from six case studies that were
investigated during the experimental work of this thesis and conclusions regarding the state of
BESSs in the context of the core issues of this work. The two following core chapters, Chapters
5 and 6, provide information on the configuration of the simulations performed, key ideas, and
theories for the proposed matter and present the business models to legally operate the
suggested MP-BESS in Germany. In the concluding Chapter 7, the core issues and results of
this thesis are reviewed and summarized, and a comprehensive outlook on energy markets
worldwide and in Germany and perspectives on the future for BESSs as MPTs are given.
6
2 Basics of Stationary Battery Storage Systems
This chapter provides an overview of the technical configuration of a stationary BESS and its
related subsystems, states the basic considerations regarding the safe operation of BESSs in
stationary applications and explains why this work focuses on LIB technology. Reasons are
specifically provided for choosing the LFP/C (lithium iron phosphate) LIB cell chemistry for both
the Energy Neighbor and the MP-BESS simulation. When approaching a technology such as
LIB BESSs, the specific technical configuration is quite necessary; e.g., the coupling of a BESS,
whether it is DC-coupled or AC-coupled, influences the economic value of the BESS because
of a change in round-trip efficiencies, operation modes or other considerations. Thus, the
fundamental technical arrangement of a BESS is explained, and insights are given on the
specifications and their importance for further investigations. The basic concepts of BESS safety,
as explained in the following subchapters, are introduced, and the most relevant methods and
regulations for safe operation are given as further background information. Additionally, the
fundamental legal framework in Germany covering BESSs/SESs, in general, is introduced and
the respective stakeholders analyzed. This topic will be revisited in Chapter 6 when business
models for MP-BESSs are presented.
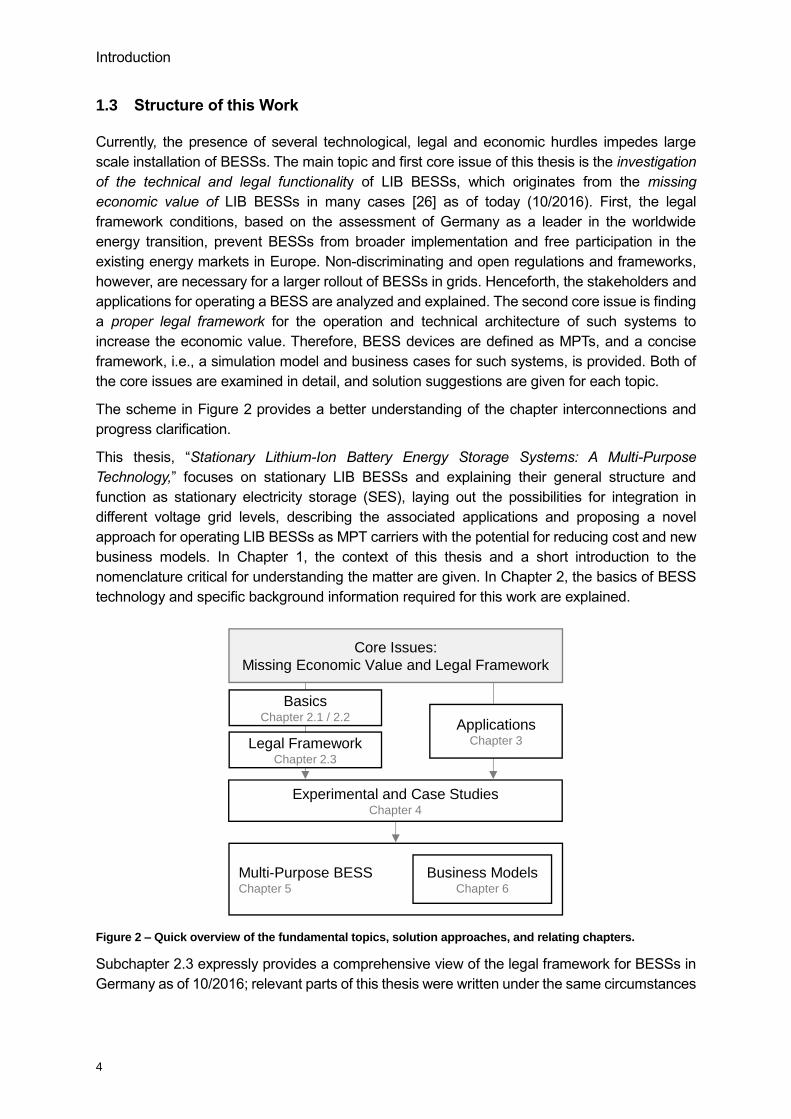
Figure 3 – Progress of work in Chapter 3.
2.1 A General View of Electrical Energy Storage Systems
EESs provide flexibility for decoupling fluctuating energy production and consumption over time
and are a key component in the worldwide reduction of carbon emissions. EES technologies
have the ability to cope with modern electric grids and are driven by development goals
regarding smart infrastructure and smart grids to achieve carbon emission reduction targets.
Historically, EESs served customers by reducing electricity costs, improving the reliability of the
power supply in critical systems and fostering enhanced power quality, frequency regulation
power and voltage quality in grids. In the near future, the role of EESs will shift from these
Core Issues:
Missing Economic Value and Legal Framework
Legal FrameworkChapter 2.3
Experimental and Case StudiesChapter 4
Multi-Purpose BESSChapter 5
Business ModelsChapter 6
ApplicationsChapter 3
BasicsChapter 2.1 / 2.2
Basics of Stationary Battery Storage Systems
7
common techniques to new business models, applications and inter-industrial functions, e.g.,
the coupling of the heat and power sectors. Emerging markets in on-grid or off-grid areas are
expected to present major problems in the near future. The quality of life is rapidly improving
worldwide, and these advancements are increasing the demand for electricity in all sectors in
all countries. EESs are expected to lead to a significant improvement in grid reliability and allow
for a second electrification wave around the globe. Modern EES technologies can be used to
assist the integration of RETs into existing grids and the implementation of such systems in
areas where electric grids do not exist. Many industrial countries have adopted EES
technologies to avoid expensive grid construction. The requirement for uninterrupted, elastic
power and energy supply and long distances between consumption and generation directly lead
to greater EES needs in the future [27].
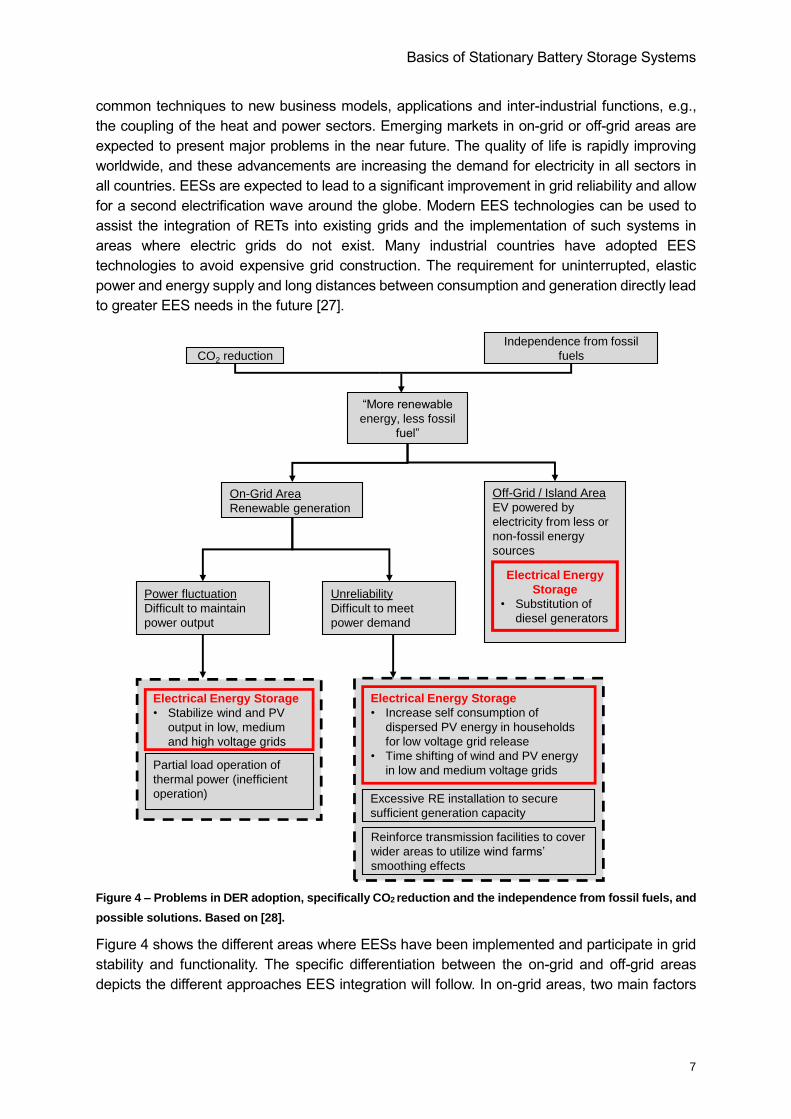
Figure 4 – Problems in DER adoption, specifically CO2 reduction and the independence from fossil fuels, and
possible solutions. Based on [28].
Figure 4 shows the different areas where EESs have been implemented and participate in grid
stability and functionality. The specific differentiation between the on-grid and off-grid areas
depicts the different approaches EES integration will follow. In on-grid areas, two main factors
CO2 reduction
Independence from fossil
fuels
“More renewable
energy, less fossil
fuel”
On-Grid Area
Renewable generation
Off-Grid / Island Area
EV powered by
electricity from less or
non-fossil energy
sources
Electrical Energy
Storage
• Substitution of
diesel generators
Unreliability
Difficult to meet
power demand
Electrical Energy Storage
• Stabilize wind and PV
output in low, medium
and high voltage grids
Electrical Energy Storage
• Increase self consumption of
dispersed PV energy in households
for low voltage grid release
• Time shifting of wind and PV energy
in low and medium voltage grids
Excessive RE installation to secure
sufficient generation capacity
Reinforce transmission facilities to cover
wider areas to utilize wind farms’
smoothing effects
Power fluctuation
Difficult to maintain
power output
Partial load operation of
thermal power (inefficient
operation)
Basics of Stationary Battery Storage Systems
8
drive EES integration. First, EESs serve to moderate the output fluctuations of RETs in grids in
addition to overtaking the frequency regulation, which is conventionally provided by managing
the output of thermal generators to provide control power and allow them to run with a higher
efficiency. Second, because RET production is unpredictable and a favorable output time per
day is not controllable, RET installations may have overcapacity, which leads to even higher
output fluctuations. These fluctuations may be managed in the future by fleets of EESs in new
self-regulating markets or by stakeholders who share a common need for constant power output.
In off-grid scenarios, the main driver for RET installation is the substitution of diesel generators.
For a complete change from fossil fuels to 100% RETs, island structures with strict
electromobility concepts and SESs are the most promising technologies.
EESs can provide time shifting, power quality, efficient use of the existing grid, island grids and
emergency power. Additionally, electric vehicles and mobile applications are expected to create
a reasonably high demand for EESs in the future. The suitability of an EES technology for one
of the aforementioned roles, which will be differentiated and explained in more detail in Chapter
3, is determined by the number of cycles and operating time. The number of cycles determines
how often an EES must be charged and discharged completely to serve a specific purpose and
the operation time defines how often these cycles occur in a given time period. In the following
material, each EES technology mentioned in Figure 5 is put into perspective, and their features
and a brief description of their functionality and advantages and disadvantages of specific
technologies are provided.
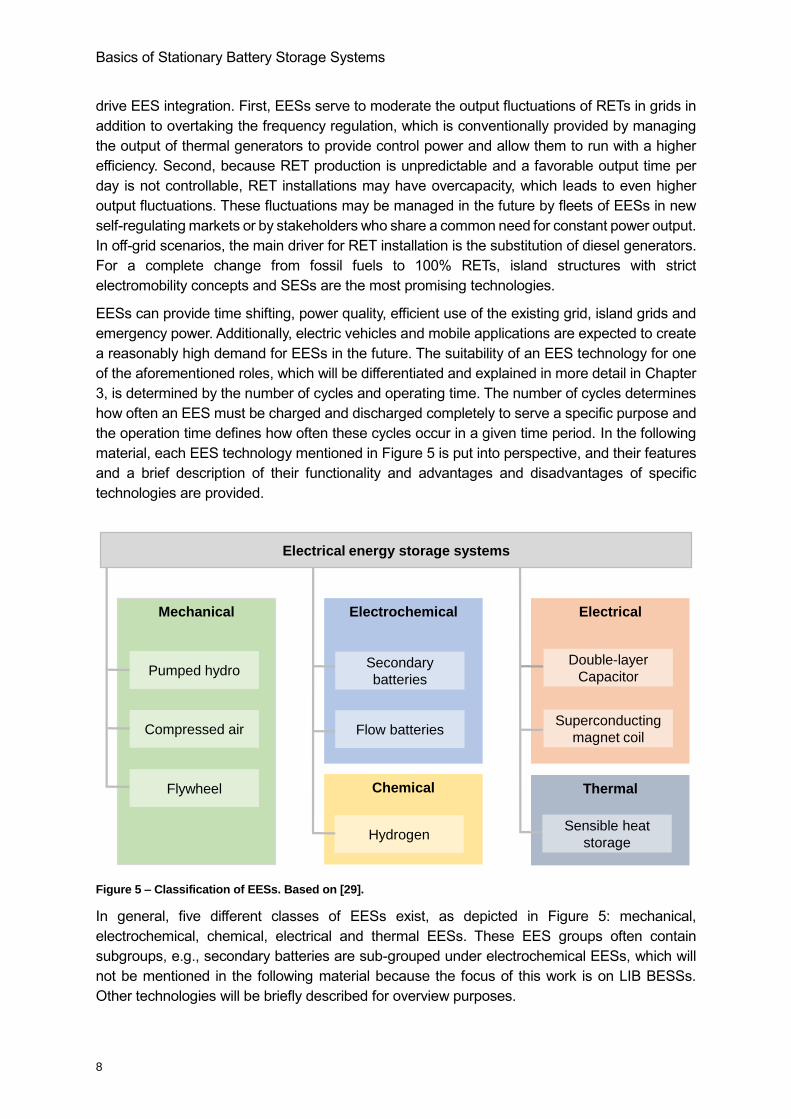
Figure 5 – Classification of EESs. Based on [29].
In general, five different classes of EESs exist, as depicted in Figure 5: mechanical,
electrochemical, chemical, electrical and thermal EESs. These EES groups often contain
subgroups, e.g., secondary batteries are sub-grouped under electrochemical EESs, which will
not be mentioned in the following material because the focus of this work is on LIB BESSs.
Other technologies will be briefly described for overview purposes.
Electrical energy storage systems
Mechanical
Pumped hydro
Compressed air
Flywheel
Electrochemical Electrical
Flow batteries
Secondary
batteries
Superconducting
magnet coil
Double-layer
Capacitor
Chemical
Hydrogen
Thermal
Sensible heat
storage
Basics of Stationary Battery Storage Systems
9
Pumped hydro storage (PHS) stores more than four-fifths of the world’s renewable electricity
[30]. Because of its associated challenges in terms of development, PHS is not commonly used
as residential storage. In general, PHS relies on water reservoirs: one upper reservoir (UR) and
one lower reservoir (LR). Electricity is stored by pumping water from the LR into the UR and is
retrieved by allowing the water to flow back. Modern turbines achieve efficiencies of 70% to 85%
[27]. The advantages of this technology are the easy mechanical and technical development,
the possible use of local technical knowledge and the high turnaround efficiency1 [29, 32].
Compressed air energy storage (CAES) stores electricity in the form of compressed air in tanks
or caverns under high pressure. Energy is retrieved by allowing the compressed air to flow out
of the cavern or tank and decompress while driving a turbine for energy generation. The
efficiency of CAES ranges from 40% to 60% depending on the specific setup of a unit. In cases
in which the heat of compression is recovered, the efficiency can be as high as 70% [29, 33].
Chemical energy storage in the form of e.g. hydrogen as an energy carrier is an existing
technology. Electricity is stored by generating hydrogen via water electrolysis and saving the
hydrogen in tanks or caverns. Energy is retrieved by powering any machine that can use
hydrogen as a fuel or by directly injecting hydrogen into a fuel cell, where it can react with oxygen
to generate electricity and water. A disadvantage of such systems is their efficiency of
approximately 32% [34] to 66% [35] for a full energy cycle. [31]
Double-layer capacitors (DLCs) are in general similar to traditional capacitors. DLCs consist of
two serial connected interphases electrolyte/electrolyte, resulting in large electrostatic capacity
at a limited voltage (below 3V) energy is stored in the form of charge accumulation on both
electrode sides [36]. Energy is retrieved by releasing the electric charges from the electrodes
through external loads. DLCs provide only small amounts of energy, but they can provide high
power peaks for short time periods.
Superconducting magnetic coil energy storage (SMES) stores electric energy in a magnetic field
produced by superconducting windings in the magnetic coil. Because SMES requires cryostatic
conditions to ensure that the windings are superconducting, large-scale implementation of the
technology and experiments has not taken place. [37]
Thermal storage is not explained in detail because of its novelty and mostly one-way function
for storing electric energy, i.e., this technology is expected to be used more for sector coupling
in the future and differentiated use of electrical energy rather than storage.
During the experimental work for this thesis, the literature and research were used to evaluate
the aforementioned EES technologies and determine their typical applications or application
modes (APMs). Table 1 provides an overview of APMs in relation to the EESs introduced in
Figure 5 and their qualitative ability to serve a specific APM.
The APMs mentioned in Table 1 provide the basis for a better understanding of chapter
interconnection and progress clarification.
1 “Cycle efficiency, also named the round-trip efficiency, is the ratio of the whole system electricity output to the
electricity input.” [31]
Basics of Stationary Battery Storage Systems
10
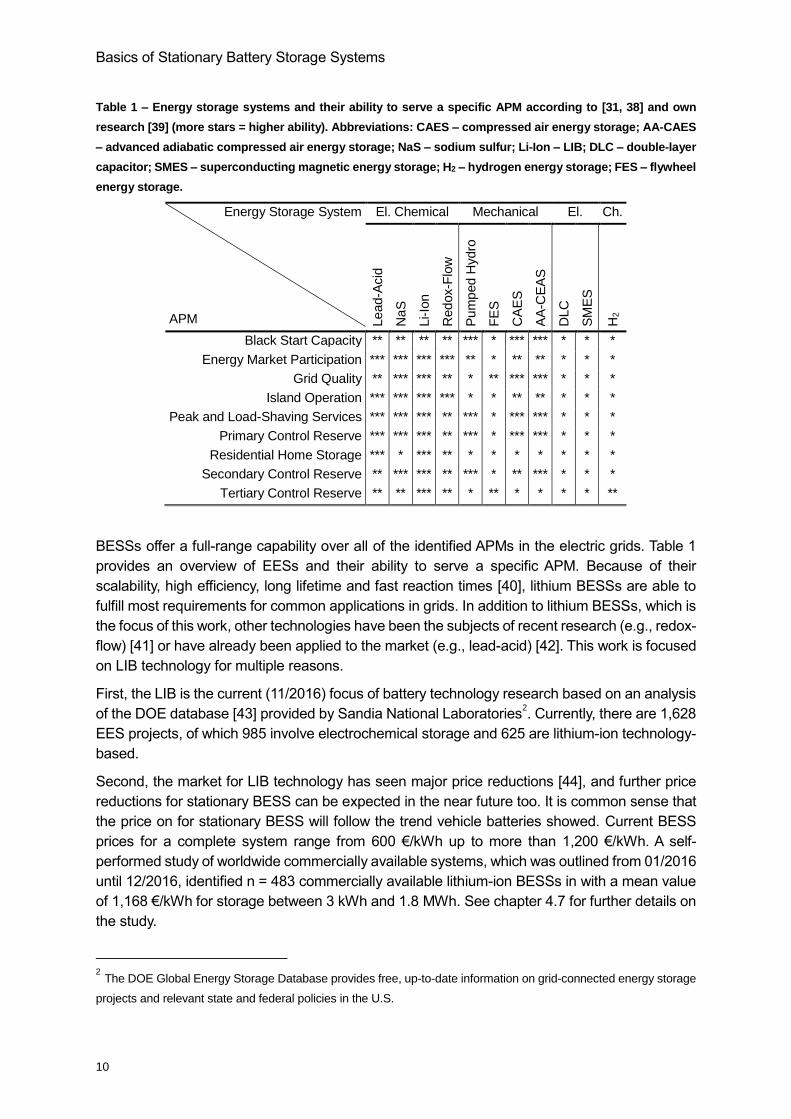
Table 1 – Energy storage systems and their ability to serve a specific APM according to [31, 38] and own
research [39] (more stars = higher ability). Abbreviations: CAES – compressed air energy storage; AA-CAES
– advanced adiabatic compressed air energy storage; NaS – sodium sulfur; Li-Ion – LIB; DLC – double-layer
capacitor; SMES – superconducting magnetic energy storage; H2 – hydrogen energy storage; FES – flywheel
energy storage.
Energy Storage System
APM
El. Chemical Mechanical El. Ch.
Lead-A
cid
NaS
Li-Io
n
Redox-F
low
Pum
ped H
ydro
FE
S
CA
ES
AA
-CE
AS
DLC
SM
ES
H2
Black Start Capacity ** ** ** ** *** * *** *** * * *
Energy Market Participation *** *** *** *** ** * ** ** * * *
Grid Quality ** *** *** ** * ** *** *** * * *
Island Operation *** *** *** *** * * ** ** * * *
Peak and Load-Shaving Services *** *** *** ** *** * *** *** * * *
Primary Control Reserve *** *** *** ** *** * *** *** * * *
Residential Home Storage *** * *** ** * * * * * * *
Secondary Control Reserve ** *** *** ** *** * ** *** * * *
Tertiary Control Reserve ** ** *** ** * ** * * * * **
BESSs offer a full-range capability over all of the identified APMs in the electric grids. Table 1
provides an overview of EESs and their ability to serve a specific APM. Because of their
scalability, high efficiency, long lifetime and fast reaction times [40], lithium BESSs are able to
fulfill most requirements for common applications in grids. In addition to lithium BESSs, which is
the focus of this work, other technologies have been the subjects of recent research (e.g., redox-
flow) [41] or have already been applied to the market (e.g., lead-acid) [42]. This work is focused
on LIB technology for multiple reasons.
First, the LIB is the current (11/2016) focus of battery technology research based on an analysis
of the DOE database [43] provided by Sandia National Laboratories2. Currently, there are 1,628
EES projects, of which 985 involve electrochemical storage and 625 are lithium-ion technology-
based.
Second, the market for LIB technology has seen major price reductions [44], and further price
reductions for stationary BESS can be expected in the near future too. It is common sense that
the price on for stationary BESS will follow the trend vehicle batteries showed. Current BESS
prices for a complete system range from 600 €/kWh up to more than 1,200 €/kWh. A self-
performed study of worldwide commercially available systems, which was outlined from 01/2016
until 12/2016, identified n = 483 commercially available lithium-ion BESSs in with a mean value
of 1,168 €/kWh for storage between 3 kWh and 1.8 MWh. See chapter 4.7 for further details on
the study.
2 The DOE Global Energy Storage Database provides free, up-to-date information on grid-connected energy storage
projects and relevant state and federal policies in the U.S.
Basics of Stationary Battery Storage Systems
11
Third, because of the previously mentioned research focus, a significant amount of scientific
work can be expected along with an increase in patents and commercial systems. Research on
lithium-ion-cell technologies and the chemistries of the presented systems has increased by
more than a factor of 16 from 1990 to 2014 [45]. In addition to their broad capability for serving
many APMs with high efficiencies relative to other technologies, lithium-ion systems are a
favorable system technology in terms of geographical requirements. Unlike pumped hydro
storage systems or compressed air EESs, lithium-ion systems are independent of geographical
constraints and easily scalable.
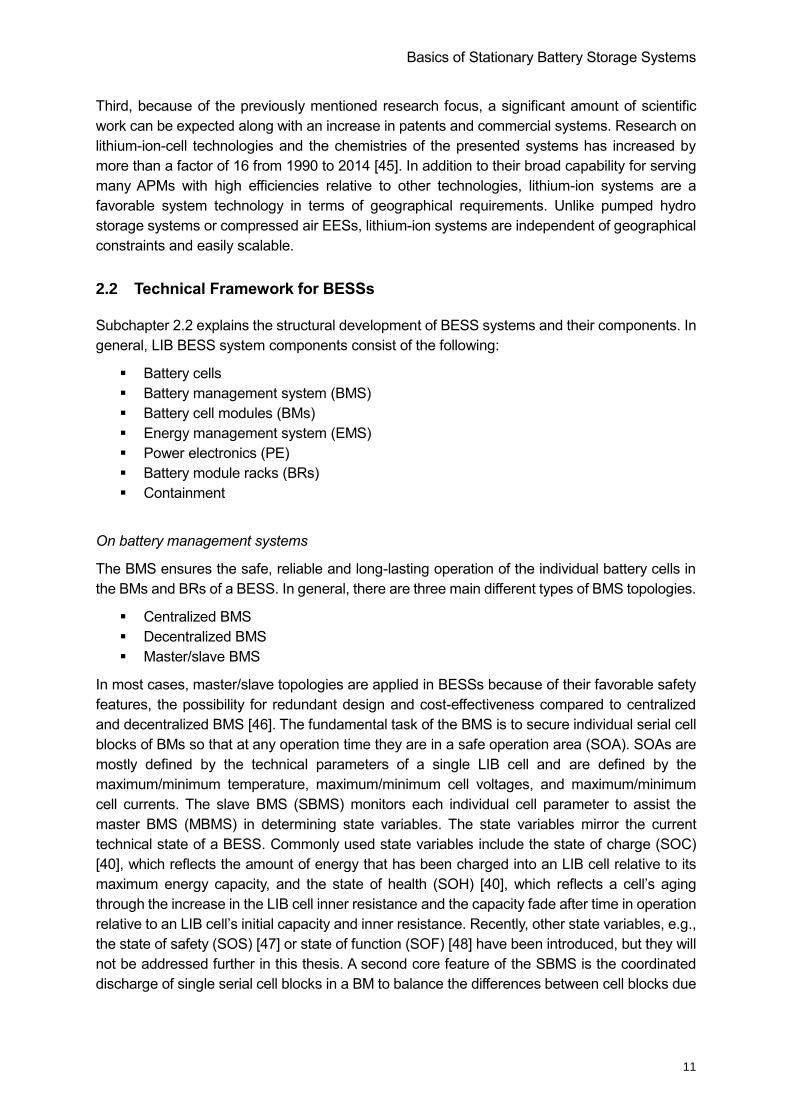
2.2 Technical Framework for BESSs
Subchapter 2.2 explains the structural development of BESS systems and their components. In
general, LIB BESS system components consist of the following:
Battery cells
Battery management system (BMS)
Battery cell modules (BMs)
Energy management system (EMS)
Power electronics (PE)
Battery module racks (BRs)
Containment
On battery management systems
The BMS ensures the safe, reliable and long-lasting operation of the individual battery cells in
the BMs and BRs of a BESS. In general, there are three main different types of BMS topologies.
Centralized BMS
Decentralized BMS
Master/slave BMS
In most cases, master/slave topologies are applied in BESSs because of their favorable safety
features, the possibility for redundant design and cost-effectiveness compared to centralized
and decentralized BMS [46]. The fundamental task of the BMS is to secure individual serial cell
blocks of BMs so that at any operation time they are in a safe operation area (SOA). SOAs are
mostly defined by the technical parameters of a single LIB cell and are defined by the
maximum/minimum temperature, maximum/minimum cell voltages, and maximum/minimum
cell currents. The slave BMS (SBMS) monitors each individual cell parameter to assist the
master BMS (MBMS) in determining state variables. The state variables mirror the current
technical state of a BESS. Commonly used state variables include the state of charge (SOC)
[40], which reflects the amount of energy that has been charged into an LIB cell relative to its
maximum energy capacity, and the state of health (SOH) [40], which reflects a cell’s aging
through the increase in the LIB cell inner resistance and the capacity fade after time in operation
relative to an LIB cell’s initial capacity and inner resistance. Recently, other state variables, e.g.,
the state of safety (SOS) [47] or state of function (SOF) [48] have been introduced, but they will
not be addressed further in this thesis. A second core feature of the SBMS is the coordinated
discharge of single serial cell blocks in a BM to balance the differences between cell blocks due
Basics of Stationary Battery Storage Systems
12
to manufacturing inaccuracies or temperature imbalances inside a BM, which can both lead to
different chargeable capacities per charge/discharge cycle. The BMS communicates mainly via
the BUS system, but there are new developments toward wireless BMSs [49]. Typically, SBMSs
are measuring devices, and a MBMS consists of appropriate controlling interfaces, e.g., high-
voltage relays or insulation monitors, logging and communication infrastructure. Beside subunit
redundancy, MBMS functionality is implemented by doubling software-code and hardware
structures to achieve reliability on a single MBMS.
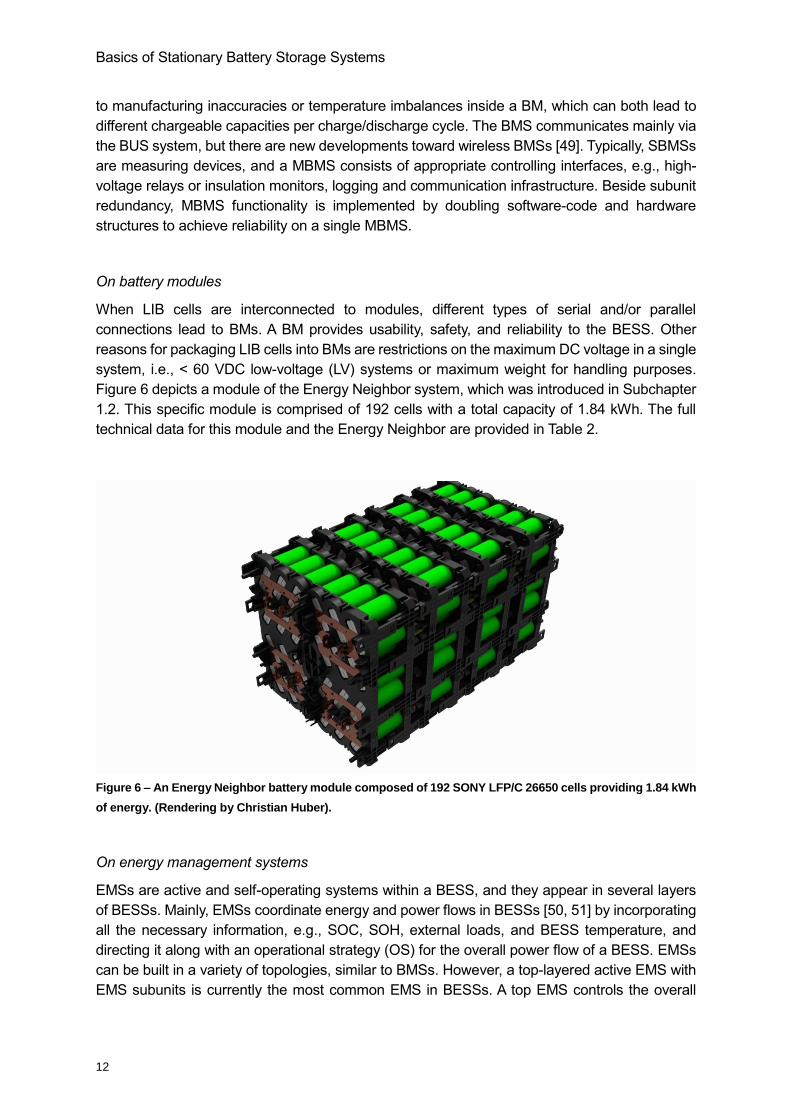
On battery modules
When LIB cells are interconnected to modules, different types of serial and/or parallel
connections lead to BMs. A BM provides usability, safety, and reliability to the BESS. Other
reasons for packaging LIB cells into BMs are restrictions on the maximum DC voltage in a single
system, i.e., < 60 VDC low-voltage (LV) systems or maximum weight for handling purposes.
Figure 6 depicts a module of the Energy Neighbor system, which was introduced in Subchapter
1.2. This specific module is comprised of 192 cells with a total capacity of 1.84 kWh. The full
technical data for this module and the Energy Neighbor are provided in Table 2.
Figure 6 – An Energy Neighbor battery module composed of 192 SONY LFP/C 26650 cells providing 1.84 kWh
of energy. (Rendering by Christian Huber).
On energy management systems
EMSs are active and self-operating systems within a BESS, and they appear in several layers
of BESSs. Mainly, EMSs coordinate energy and power flows in BESSs [50, 51] by incorporating
all the necessary information, e.g., SOC, SOH, external loads, and BESS temperature, and
directing it along with an operational strategy (OS) for the overall power flow of a BESS. EMSs
can be built in a variety of topologies, similar to BMSs. However, a top-layered active EMS with
EMS subunits is currently the most common EMS in BESSs. A top EMS controls the overall
Basics of Stationary Battery Storage Systems
13
BESS power flow constantly through communication with sub-EMS systems to coordinate the
internal state variables, which are derived from the MBMS, measured by the SMBS.
On power electronics and BESS efficiencies
PE for LIB BESS are of interest because of efficiency problems. A LIB cell, specifically the cell
used in this work, an LFP/C cell, reaches different voltages during charging and discharging.
For instance, a SONY26650FTC cell ranges from 2.0 V in cut-off voltage to 3.6 V maximum
charging voltage. Thus, a module composed of the aforementioned 192 LIB cells arranged in a
16s12p order will show a cut-off voltage of 32 V and a charging end voltage of 57.6 V.
Furthermore, the Energy Neighbor’s battery module racks consist of 13 modules, which results
in a cut-off voltage of 416 V and a charging end voltage of 748.8 V. The full technical data are
available in Table 2.
𝑈𝑠𝑡𝑎𝑐𝑘,𝑚𝑎𝑥 = 𝑈𝑐𝑒𝑙𝑙,𝑚𝑎𝑥 ∗ 𝑛𝑐𝑒𝑙𝑙𝑠,𝑚𝑜𝑑𝑢𝑙𝑒 ∗ 𝑛𝑚𝑜𝑑𝑢𝑙𝑒.𝑟𝑎𝑐𝑘
𝑈𝑠𝑡𝑎𝑐𝑘,𝑚𝑎𝑥 = 3.6 𝑉 ∗ 16 ∗ 13 = 748.8 𝑉 (1)
𝑈𝑠𝑡𝑎𝑐𝑘,𝑚𝑖𝑛 = 𝑈𝑐𝑒𝑙𝑙,𝑚𝑖𝑛 ∗ 𝑛𝑐𝑒𝑙𝑙𝑠,𝑚𝑜𝑑𝑢𝑙𝑒 ∗ 𝑛𝑚𝑜𝑑𝑢𝑙𝑒.𝑟𝑎𝑐𝑘
𝑈𝑠𝑡𝑎𝑐𝑘,𝑚𝑖𝑛 = 2.0 𝑉 ∗ 16 ∗ 13 = 416 𝑉 (2)
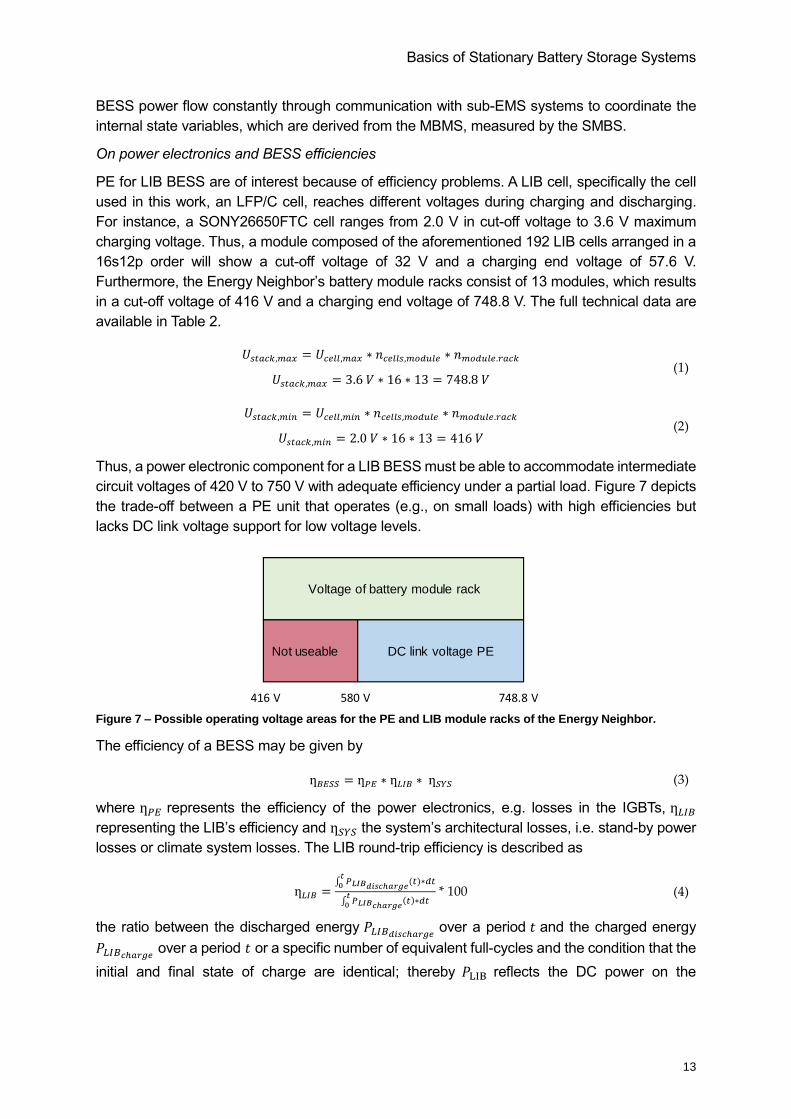
Thus, a power electronic component for a LIB BESS must be able to accommodate intermediate
circuit voltages of 420 V to 750 V with adequate efficiency under a partial load. Figure 7 depicts
the trade-off between a PE unit that operates (e.g., on small loads) with high efficiencies but
lacks DC link voltage support for low voltage levels.
Figure 7 – Possible operating voltage areas for the PE and LIB module racks of the Energy Neighbor.
The efficiency of a BESS may be given by
ƞ𝐵𝐸𝑆𝑆 = ƞ𝑃𝐸 ∗ ƞ𝐿𝐼𝐵 ∗ ƞ𝑆𝑌𝑆 (3)
where ƞ𝑃𝐸 represents the efficiency of the power electronics, e.g. losses in the IGBTs, ƞ𝐿𝐼𝐵
representing the LIB’s efficiency and ƞ𝑆𝑌𝑆 the system’s architectural losses, i.e. stand-by power
losses or climate system losses. The LIB round-trip efficiency is described as
ƞ𝐿𝐼𝐵 =∫ 𝑃𝐿𝐼𝐵𝑑𝑖𝑠𝑐ℎ𝑎𝑟𝑔𝑒(𝑡)𝑡0 ∗𝑑𝑡
∫ 𝑃𝐿𝐼𝐵𝑐ℎ𝑎𝑟𝑔𝑒𝑡0
(𝑡)∗𝑑𝑡 * 100 (4)
the ratio between the discharged energy 𝑃𝐿𝐼𝐵𝑑𝑖𝑠𝑐ℎ𝑎𝑟𝑔𝑒 over a period 𝑡 and the charged energy
𝑃𝐿𝐼𝐵𝑐ℎ𝑎𝑟𝑔𝑒 over a period 𝑡 or a specific number of equivalent full-cycles and the condition that the
initial and final state of charge are identical; thereby 𝑃LIB reflects the DC power on the
Not useable DC link voltage PE
Voltage of battery module rack
416 V 580 V 748.8 V
Basics of Stationary Battery Storage Systems
14
connection of the batteries. Any LIB internal units, e.g. a BMS or EMS component, may lower
this ratio. The PE’s efficiency is given by
ƞ𝑃𝐸𝑐ℎ𝑎𝑟𝑔𝑒 = ∫ 𝑃𝐿𝐼𝐵𝑐ℎ𝑎𝑟𝑔𝑒
(𝑡)𝑑𝑡𝑡0
∫ 𝑃𝐵𝐸𝑆𝑆𝑐ℎ𝑎𝑟𝑔𝑒(𝑡)𝑑𝑡
𝑡0
and ƞ𝑃𝐸𝑑𝑖𝑠𝑐ℎ𝑎𝑟𝑔𝑒 = ∫ 𝑃𝐵𝐸𝑆𝑆𝑑𝑖𝑠𝑐ℎ𝑎𝑟𝑔𝑒
(𝑡)𝑑𝑡𝑡0
∫ 𝑃𝐿𝐼𝐵𝑑𝑖𝑠𝑐ℎ𝑎𝑟𝑔𝑒(𝑡)𝑑𝑡
𝑡0
(5)
as the ratio between total energy charged into the LIB 𝑃𝐿𝐼𝐵𝑐ℎ𝑎𝑟𝑔𝑒 and the total energy consumed
by the BESS 𝑃𝐵𝐸𝑆𝑆𝑐ℎ𝑎𝑟𝑔𝑒 over a period 𝑡 ; equal for discharge scenario; thereby 𝑃𝐵𝐸𝑆𝑆𝑐ℎ𝑎𝑟𝑔𝑒
reflects the AC power on the connection of the batteries PE units. Hence, the round-trip
efficiency of a PE unit in a BESS follows
ƞ𝑃𝐸 = ƞ𝑃𝐸𝑐ℎ𝑎𝑟𝑔𝑒 ∗ ƞ𝑃𝐸𝑑𝑖𝑠𝑐ℎ𝑎𝑟𝑔𝑒 (6)
Similar the BESS efficiency ƞ𝑆𝑌𝑆 is given by additional consumers in the BESS; these may not
be a part of either the LIB, accordingly, embodied BMS and EMS systems, or the PE units.
Hence, ƞ𝑆𝑌𝑆 describes stand-by losses, losses for automated climate control inside the system,
losses for safety equipment as well as servers or other communication technology
ƞ𝑆𝑌𝑆𝑐ℎ𝑎𝑟𝑔𝑒 =∫ 𝑃𝐵𝐸𝑆𝑆𝑐ℎ𝑎𝑟𝑔𝑒(𝑡)𝑑𝑡𝑡0
∫ 𝑃𝐺𝑅𝐼𝐷𝑐ℎ𝑎𝑟𝑔𝑒(𝑡)𝑑𝑡
𝑡0
and ƞ𝑆𝑌𝑆𝑑𝑖𝑠𝑐ℎ𝑎𝑟𝑔𝑒 =∫ 𝑃𝐺𝑅𝐼𝐷𝑑𝑖𝑠𝑐ℎ𝑎𝑟𝑔𝑒(𝑡)𝑑𝑡𝑡0
∫ 𝑃𝐵𝐸𝑆𝑆𝑑𝑖𝑠𝑐ℎ𝑎𝑟𝑔𝑒(𝑡)𝑑𝑡𝑡0
ƞ𝑆𝑌𝑆 = ƞ𝑆𝑌𝑆𝑐ℎ𝑎𝑟𝑔𝑒 ∗ ƞ𝑆𝑌𝑆𝑑𝑖𝑠𝑐ℎ𝑎𝑟𝑔𝑒
(7)
thereby 𝑃𝐺𝑅𝐼𝐷𝑐ℎ𝑎𝑟𝑔𝑒 reflects the AC power on the connection of the whole BESS to the grid.
Typical data are as follows
ƞ𝐵𝐸𝑆𝑆 = 96% ∗ 98% ∗ 90% = 84,67% (8)
Hence, the overall two-way efficiency of an exemplary LIB BESS is about 85%. PE units are
important components of LIB BESSs in regards to the overall system efficiency and their general
configuration, as well as other power consuming system components. The existing differences
between the battery and DC link voltage of PE units must be included when choosing a LIB cell,
designing modules and assigning system voltage levels. In Subchapter 5.5, a possibility to
increase the overall efficiency when dealing with an MP-BESS is presented.
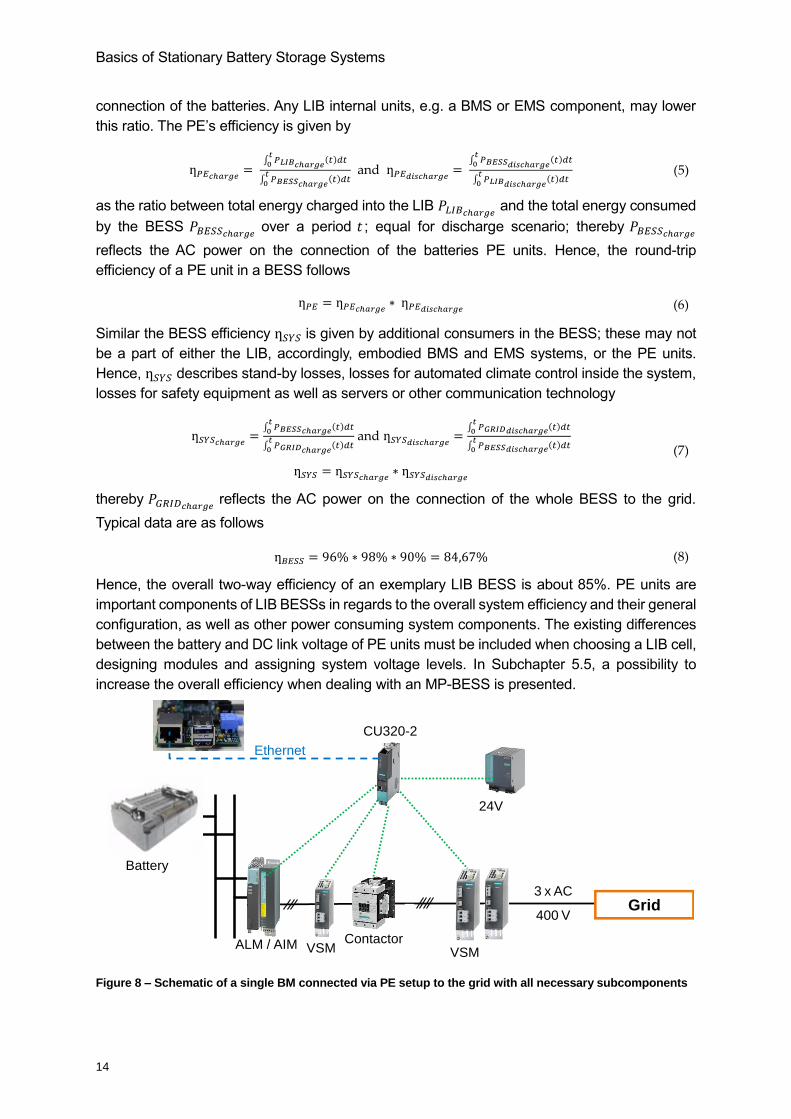
Figure 8 – Schematic of a single BM connected via PE setup to the grid with all necessary subcomponents
Grid
VSM
Battery
VSM
3 x AC
400 V
24V-Strom-
versorgung
ALM / AIM
CU320-2
VARTA Controller
Ethernet
(z. B. http)
Battery
24V-Strom-
versorgun
CU320-2
VARTA Controller
Ethernet
(z. B. http)
Contactor
Contactor
Basics of Stationary Battery Storage Systems
15
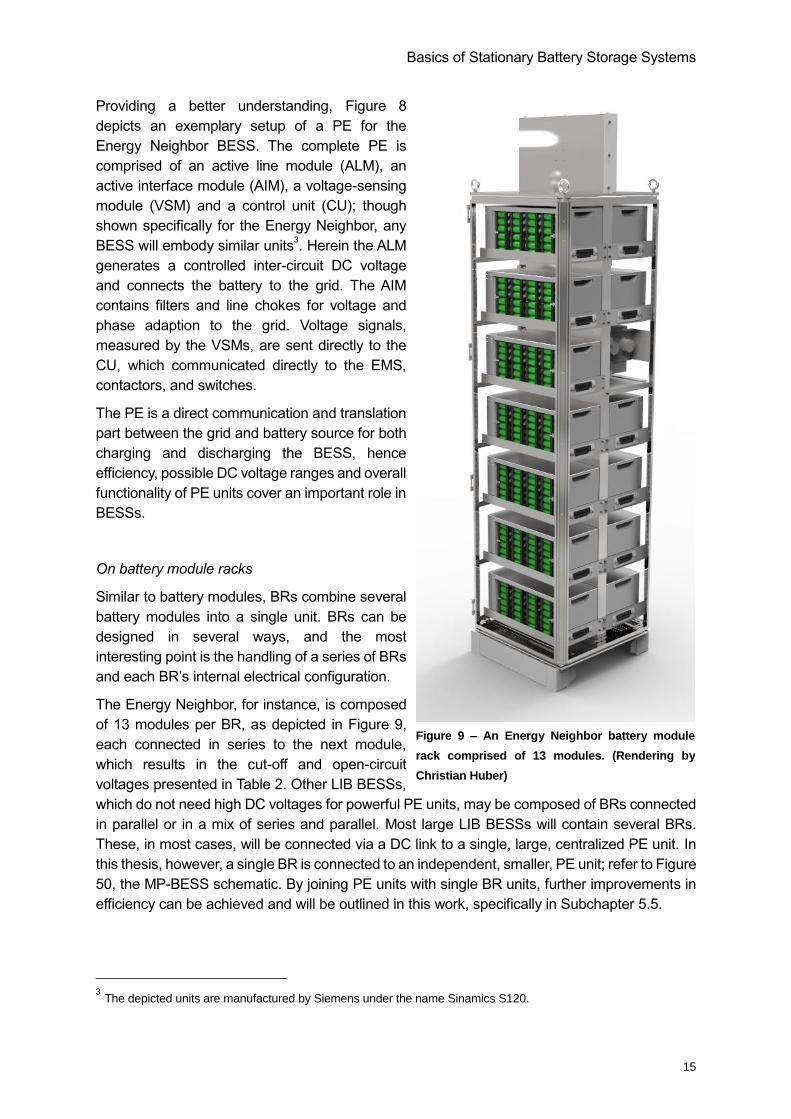
Providing a better understanding, Figure 8
depicts an exemplary setup of a PE for the
Energy Neighbor BESS. The complete PE is
comprised of an active line module (ALM), an
active interface module (AIM), a voltage-sensing
module (VSM) and a control unit (CU); though
shown specifically for the Energy Neighbor, any
BESS will embody similar units3. Herein the ALM
generates a controlled inter-circuit DC voltage
and connects the battery to the grid. The AIM
contains filters and line chokes for voltage and
phase adaption to the grid. Voltage signals,
measured by the VSMs, are sent directly to the
CU, which communicated directly to the EMS,
contactors, and switches.
The PE is a direct communication and translation
part between the grid and battery source for both
charging and discharging the BESS, hence
efficiency, possible DC voltage ranges and overall
functionality of PE units cover an important role in
BESSs.
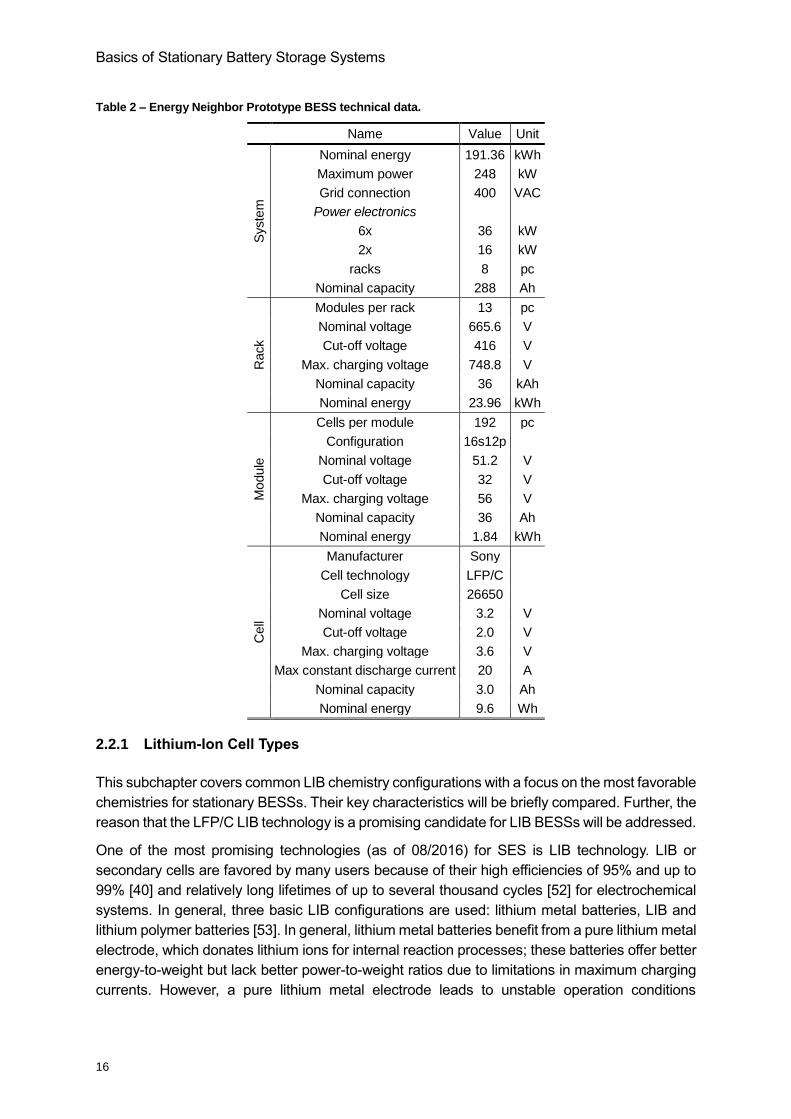
On battery module racks
Similar to battery modules, BRs combine several
battery modules into a single unit. BRs can be
designed in several ways, and the most
interesting point is the handling of a series of BRs
and each BR’s internal electrical configuration.
The Energy Neighbor, for instance, is composed
of 13 modules per BR, as depicted in Figure 9,
each connected in series to the next module,
which results in the cut-off and open-circuit
voltages presented in Table 2. Other LIB BESSs,
which do not need high DC voltages for powerful PE units, may be composed of BRs connected
in parallel or in a mix of series and parallel. Most large LIB BESSs will contain several BRs.
These, in most cases, will be connected via a DC link to a single, large, centralized PE unit. In
this thesis, however, a single BR is connected to an independent, smaller, PE unit; refer to Figure
50, the MP-BESS schematic. By joining PE units with single BR units, further improvements in
efficiency can be achieved and will be outlined in this work, specifically in Subchapter 5.5.
3 The depicted units are manufactured by Siemens under the name Sinamics S120.
Figure 9 – An Energy Neighbor battery module
rack comprised of 13 modules. (Rendering by
Christian Huber)
Basics of Stationary Battery Storage Systems
16
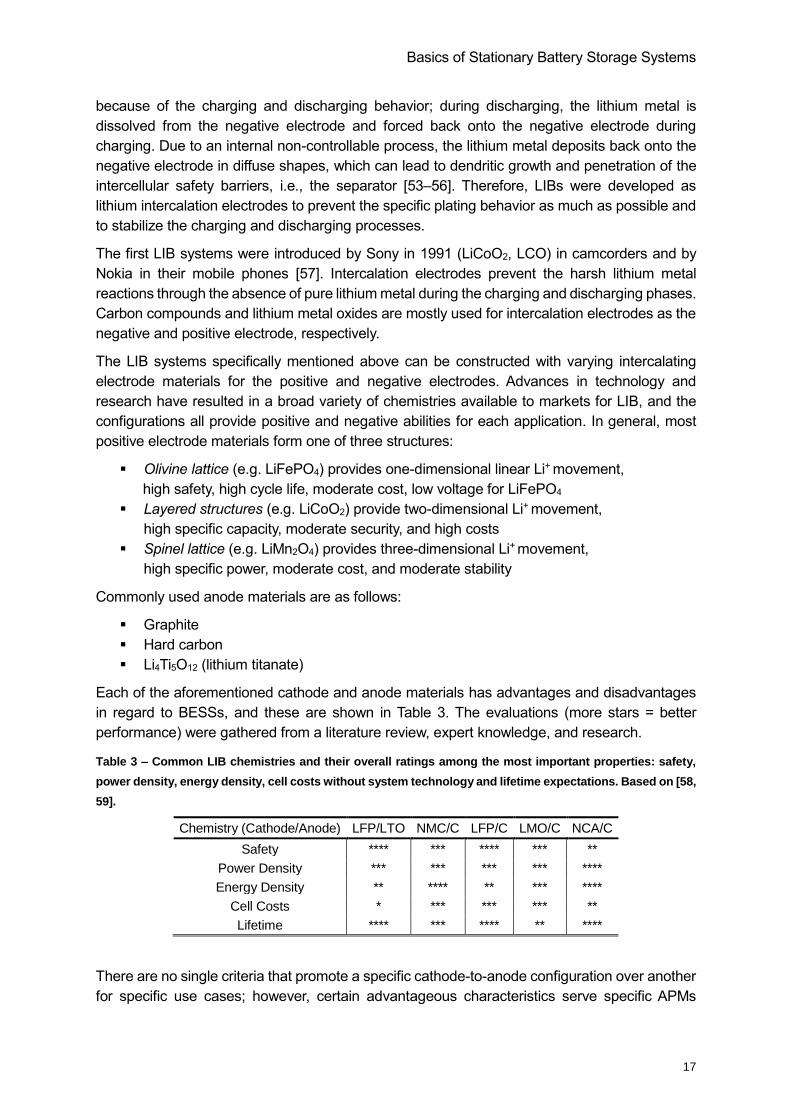
Table 2 – Energy Neighbor Prototype BESS technical data.
Name Value Unit
Syste
m
Nominal energy 191.36 kWh
Maximum power 248 kW
Grid connection 400 VAC
Power electronics
6x 36 kW
2x 16 kW
racks 8 pc
Nominal capacity 288 Ah
Rack
Modules per rack 13 pc
Nominal voltage 665.6 V
Cut-off voltage 416 V
Max. charging voltage 748.8 V
Nominal capacity 36 kAh
Nominal energy 23.96 kWh
Module
Cells per module 192 pc
Configuration 16s12p
Nominal voltage 51.2 V
Cut-off voltage 32 V
Max. charging voltage 56 V
Nominal capacity 36 Ah
Nominal energy 1.84 kWh
Cell
Manufacturer Sony
Cell technology LFP/C
Cell size 26650
Nominal voltage 3.2 V
Cut-off voltage 2.0 V
Max. charging voltage 3.6 V
Max constant discharge current 20 A
Nominal capacity 3.0 Ah
Nominal energy 9.6 Wh
2.2.1 Lithium-Ion Cell Types
This subchapter covers common LIB chemistry configurations with a focus on the most favorable
chemistries for stationary BESSs. Their key characteristics will be briefly compared. Further, the
reason that the LFP/C LIB technology is a promising candidate for LIB BESSs will be addressed.
One of the most promising technologies (as of 08/2016) for SES is LIB technology. LIB or
secondary cells are favored by many users because of their high efficiencies of 95% and up to
99% [40] and relatively long lifetimes of up to several thousand cycles [52] for electrochemical
systems. In general, three basic LIB configurations are used: lithium metal batteries, LIB and
lithium polymer batteries [53]. In general, lithium metal batteries benefit from a pure lithium metal
electrode, which donates lithium ions for internal reaction processes; these batteries offer better
energy-to-weight but lack better power-to-weight ratios due to limitations in maximum charging
currents. However, a pure lithium metal electrode leads to unstable operation conditions
Basics of Stationary Battery Storage Systems
17
because of the charging and discharging behavior; during discharging, the lithium metal is
dissolved from the negative electrode and forced back onto the negative electrode during
charging. Due to an internal non-controllable process, the lithium metal deposits back onto the
negative electrode in diffuse shapes, which can lead to dendritic growth and penetration of the
intercellular safety barriers, i.e., the separator [53–56]. Therefore, LIBs were developed as
lithium intercalation electrodes to prevent the specific plating behavior as much as possible and
to stabilize the charging and discharging processes.
The first LIB systems were introduced by Sony in 1991 (LiCoO2, LCO) in camcorders and by
Nokia in their mobile phones [57]. Intercalation electrodes prevent the harsh lithium metal
reactions through the absence of pure lithium metal during the charging and discharging phases.
Carbon compounds and lithium metal oxides are mostly used for intercalation electrodes as the
negative and positive electrode, respectively.
The LIB systems specifically mentioned above can be constructed with varying intercalating
electrode materials for the positive and negative electrodes. Advances in technology and
research have resulted in a broad variety of chemistries available to markets for LIB, and the
configurations all provide positive and negative abilities for each application. In general, most
positive electrode materials form one of three structures:
Olivine lattice (e.g. LiFePO4) provides one-dimensional linear Li+ movement,
high safety, high cycle life, moderate cost, low voltage for LiFePO4
Layered structures (e.g. LiCoO2) provide two-dimensional Li+ movement,
high specific capacity, moderate security, and high costs
Spinel lattice (e.g. LiMn2O4) provides three-dimensional Li+ movement,
high specific power, moderate cost, and moderate stability
Commonly used anode materials are as follows:
Graphite
Hard carbon
Li4Ti5O12 (lithium titanate)
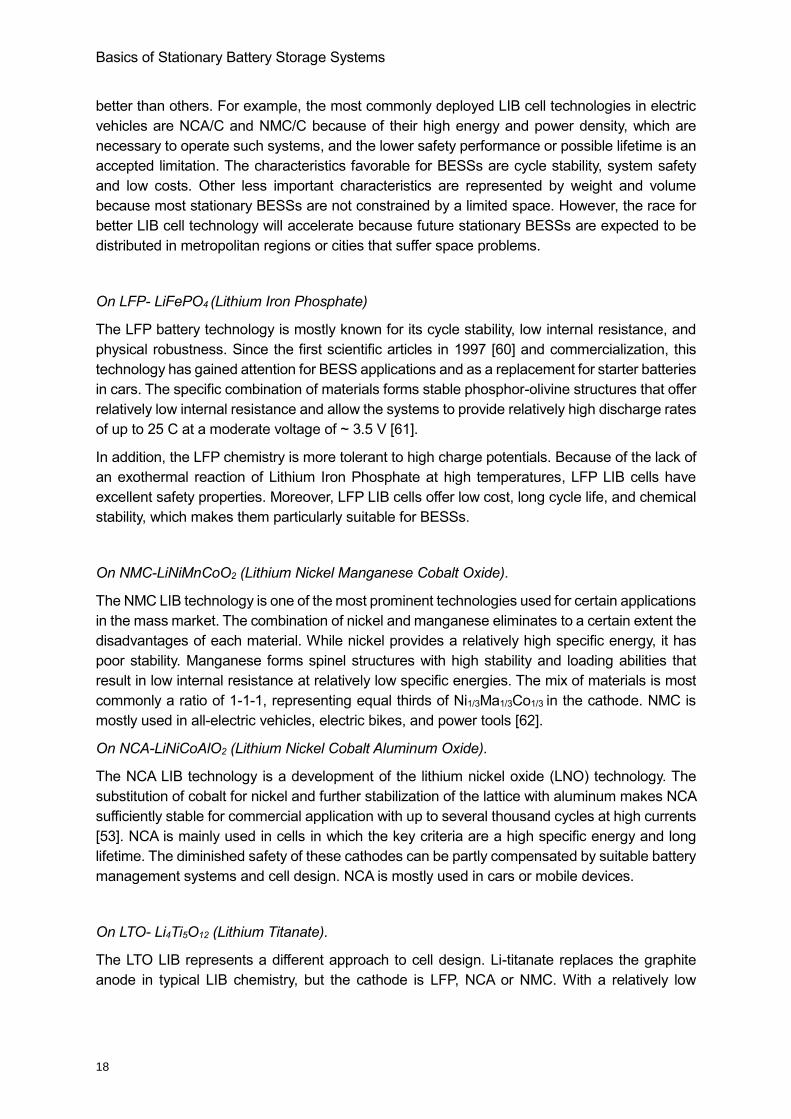
Each of the aforementioned cathode and anode materials has advantages and disadvantages
in regard to BESSs, and these are shown in Table 3. The evaluations (more stars = better
performance) were gathered from a literature review, expert knowledge, and research.
Table 3 – Common LIB chemistries and their overall ratings among the most important properties: safety,
power density, energy density, cell costs without system technology and lifetime expectations. Based on [58,
59].
Chemistry (Cathode/Anode) LFP/LTO NMC/C LFP/C LMO/C NCA/C
Safety **** *** **** *** **
Power Density *** *** *** *** ****
Energy Density ** **** ** *** ****
Cell Costs * *** *** *** **
Lifetime **** *** **** ** ****
There are no single criteria that promote a specific cathode-to-anode configuration over another
for specific use cases; however, certain advantageous characteristics serve specific APMs
Basics of Stationary Battery Storage Systems
18
better than others. For example, the most commonly deployed LIB cell technologies in electric
vehicles are NCA/C and NMC/C because of their high energy and power density, which are
necessary to operate such systems, and the lower safety performance or possible lifetime is an
accepted limitation. The characteristics favorable for BESSs are cycle stability, system safety
and low costs. Other less important characteristics are represented by weight and volume
because most stationary BESSs are not constrained by a limited space. However, the race for
better LIB cell technology will accelerate because future stationary BESSs are expected to be
distributed in metropolitan regions or cities that suffer space problems.
On LFP- LiFePO4 (Lithium Iron Phosphate)
The LFP battery technology is mostly known for its cycle stability, low internal resistance, and
physical robustness. Since the first scientific articles in 1997 [60] and commercialization, this
technology has gained attention for BESS applications and as a replacement for starter batteries
in cars. The specific combination of materials forms stable phosphor-olivine structures that offer
relatively low internal resistance and allow the systems to provide relatively high discharge rates
of up to 25 C at a moderate voltage of ~ 3.5 V [61].
In addition, the LFP chemistry is more tolerant to high charge potentials. Because of the lack of
an exothermal reaction of Lithium Iron Phosphate at high temperatures, LFP LIB cells have
excellent safety properties. Moreover, LFP LIB cells offer low cost, long cycle life, and chemical
stability, which makes them particularly suitable for BESSs.
On NMC-LiNiMnCoO2 (Lithium Nickel Manganese Cobalt Oxide).
The NMC LIB technology is one of the most prominent technologies used for certain applications
in the mass market. The combination of nickel and manganese eliminates to a certain extent the
disadvantages of each material. While nickel provides a relatively high specific energy, it has
poor stability. Manganese forms spinel structures with high stability and loading abilities that
result in low internal resistance at relatively low specific energies. The mix of materials is most
commonly a ratio of 1-1-1, representing equal thirds of Ni1/3Ma1/3Co1/3 in the cathode. NMC is
mostly used in all-electric vehicles, electric bikes, and power tools [62].
On NCA-LiNiCoAlO2 (Lithium Nickel Cobalt Aluminum Oxide).
The NCA LIB technology is a development of the lithium nickel oxide (LNO) technology. The
substitution of cobalt for nickel and further stabilization of the lattice with aluminum makes NCA
sufficiently stable for commercial application with up to several thousand cycles at high currents
[53]. NCA is mainly used in cells in which the key criteria are a high specific energy and long
lifetime. The diminished safety of these cathodes can be partly compensated by suitable battery
management systems and cell design. NCA is mostly used in cars or mobile devices.
On LTO- Li4Ti5O12 (Lithium Titanate).
The LTO LIB represents a different approach to cell design. Li-titanate replaces the graphite
anode in typical LIB chemistry, but the cathode is LFP, NCA or NMC. With a relatively low
Basics of Stationary Battery Storage Systems
19
nominal cell voltage of ~ 2.4 V, the LTO chemistry lacks a high specific energy but is able to
charge and discharge at relatively high rates [53]. The technology also provides long cycle
lifetimes and excellent safety behavior. LTO LIB are typically operated in electric powertrains or
solar-powered street lighting [63].
On the SONY LFP 26650 cell.
As mentioned above the LFP LIB technology promises to provide great benefits over other
technologies for the case of LIB BESS. In several experiments, performed by the project partner
VARTA, the EEBatt Project concluded, that the Sony US26650FTC1 is an ideal cell for LIB BESS
in stationary applications. The chosen cell combines high safety features and behavior,
reasonable pricing and extended calendric and cyclic lifetime expectations. The following shows
data from calendar aging, cycle aging, nail penetration and overcharge experiments of the Sony
US26650FTC1 performed by members of the EEBatt research project.
Among the most commonly used LIB technologies, lithium iron phosphate (LiFePO4 or LFP)
chemistry is favorable for use in stationary BESSs, as it combines a long lifetime with high cycle
stability and high safety standards with moderate costs. Adding, due to its comparably low
voltage at even high SOCs LFP LIB cells do not operate in aging critical conditions. Thus, this
work, as well as the setup of the Energy Neighbor prototype, focuses on the LFP technology for
simulation and lifetime estimation, except in Subchapter 5.4, in which a NMC technology is
investigated.
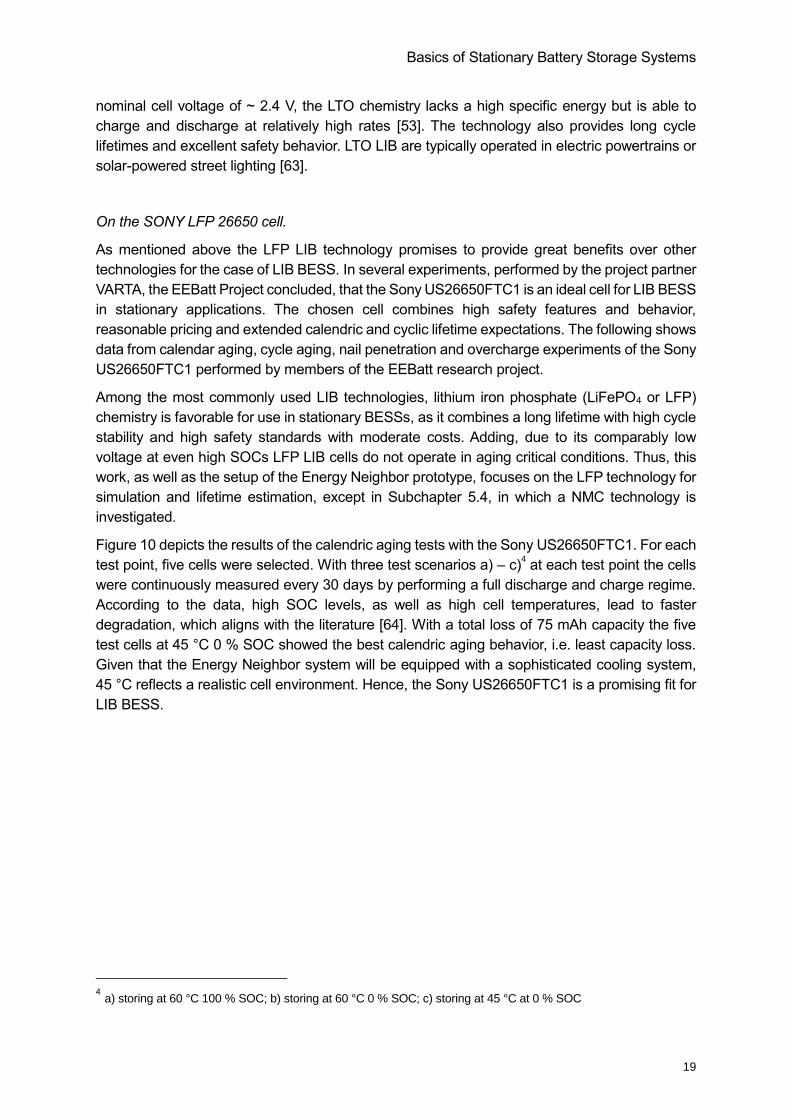
Figure 10 depicts the results of the calendric aging tests with the Sony US26650FTC1. For each
test point, five cells were selected. With three test scenarios a) – c)4 at each test point the cells
were continuously measured every 30 days by performing a full discharge and charge regime.
According to the data, high SOC levels, as well as high cell temperatures, lead to faster
degradation, which aligns with the literature [64]. With a total loss of 75 mAh capacity the five
test cells at 45 °C 0 % SOC showed the best calendric aging behavior, i.e. least capacity loss.
Given that the Energy Neighbor system will be equipped with a sophisticated cooling system,
45 °C reflects a realistic cell environment. Hence, the Sony US26650FTC1 is a promising fit for
LIB BESS.
4 a) storing at 60 °C 100 % SOC; b) storing at 60 °C 0 % SOC; c) storing at 45 °C at 0 % SOC
Basics of Stationary Battery Storage Systems
20
Figure 10 – Capacity fade of Sony 26650 LFP/C LIB cells under laboratory conditions derived from quintuple
measurement points by calendric aging experiments with test regimes (in the legend) and accordingly 80%
and 70% EOL marks.
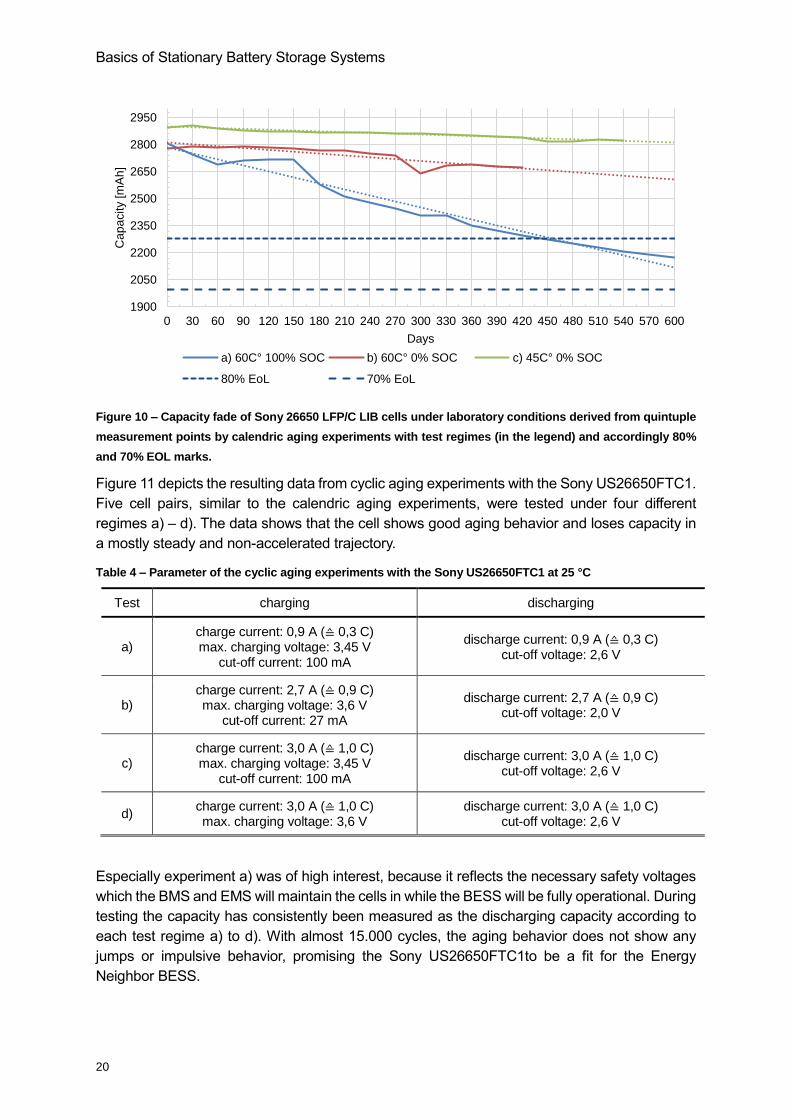
Figure 11 depicts the resulting data from cyclic aging experiments with the Sony US26650FTC1.
Five cell pairs, similar to the calendric aging experiments, were tested under four different
regimes a) – d). The data shows that the cell shows good aging behavior and loses capacity in
a mostly steady and non-accelerated trajectory.
Table 4 – Parameter of the cyclic aging experiments with the Sony US26650FTC1 at 25 °C
Test charging discharging
a) charge current: 0,9 A (≙ 0,3 C) max. charging voltage: 3,45 V
cut-off current: 100 mA
discharge current: 0,9 A (≙ 0,3 C) cut-off voltage: 2,6 V
b) charge current: 2,7 A (≙ 0,9 C) max. charging voltage: 3,6 V
cut-off current: 27 mA
discharge current: 2,7 A (≙ 0,9 C) cut-off voltage: 2,0 V
c) charge current: 3,0 A (≙ 1,0 C) max. charging voltage: 3,45 V
cut-off current: 100 mA
discharge current: 3,0 A (≙ 1,0 C) cut-off voltage: 2,6 V
d) charge current: 3,0 A (≙ 1,0 C) max. charging voltage: 3,6 V
discharge current: 3,0 A (≙ 1,0 C) cut-off voltage: 2,6 V
Especially experiment a) was of high interest, because it reflects the necessary safety voltages
which the BMS and EMS will maintain the cells in while the BESS will be fully operational. During
testing the capacity has consistently been measured as the discharging capacity according to
each test regime a) to d). With almost 15.000 cycles, the aging behavior does not show any
jumps or impulsive behavior, promising the Sony US26650FTC1to be a fit for the Energy
Neighbor BESS.
1900
2050
2200
2350
2500
2650
2800
2950
0 30 60 90 120 150 180 210 240 270 300 330 360 390 420 450 480 510 540 570 600
Ca
pa
city [m
Ah
]
Days
a) 60C° 100% SOC b) 60C° 0% SOC c) 45C° 0% SOC
80% EoL 70% EoL
Basics of Stationary Battery Storage Systems
21
Figure 11 – Capacity fade of Sony 26650 LFP/C LIB cells under laboratory conditions derived from quintuple
measurement points by cycle aging experiments with states regimes (in the legend) and accordingly 80%
and 70% EOL marks. Peaks in test data occurred due to the necessity to restart the experiments after each
500 cycles.
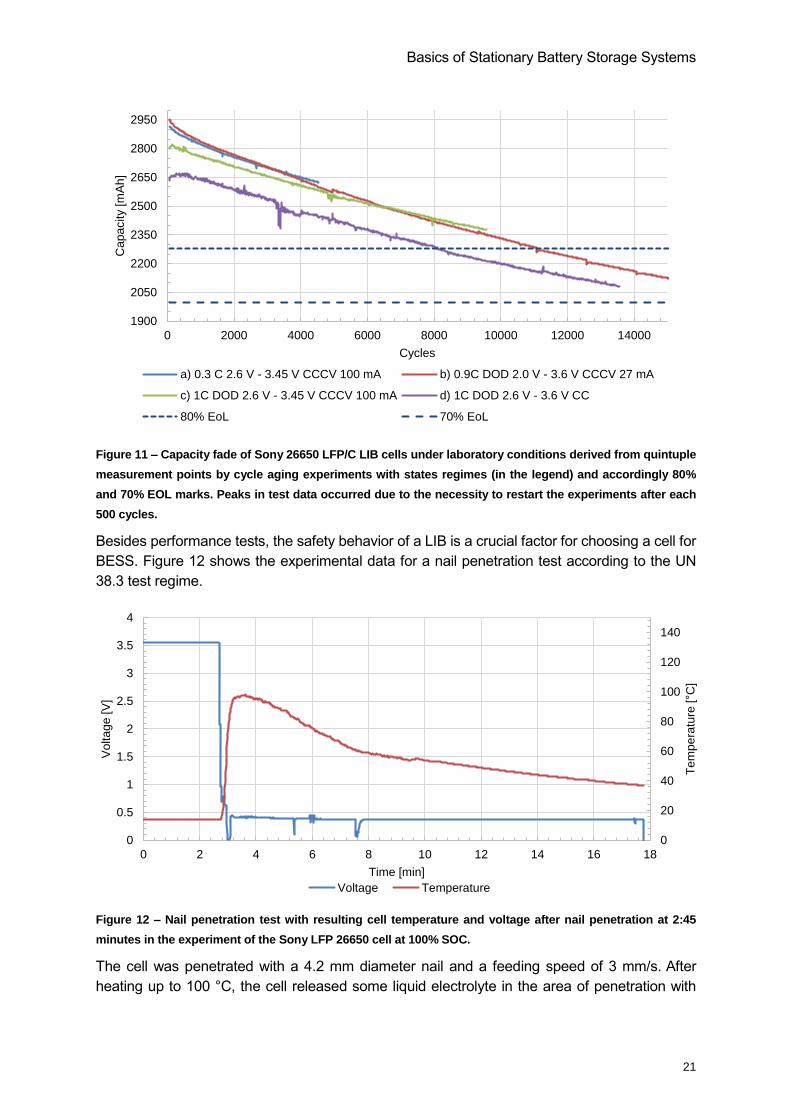
Besides performance tests, the safety behavior of a LIB is a crucial factor for choosing a cell for
BESS. Figure 12 shows the experimental data for a nail penetration test according to the UN
38.3 test regime.
Figure 12 – Nail penetration test with resulting cell temperature and voltage after nail penetration at 2:45
minutes in the experiment of the Sony LFP 26650 cell at 100% SOC.
The cell was penetrated with a 4.2 mm diameter nail and a feeding speed of 3 mm/s. After
heating up to 100 °C, the cell released some liquid electrolyte in the area of penetration with
1900
2050
2200
2350
2500
2650
2800
2950
0 2000 4000 6000 8000 10000 12000 14000
Ca
pa
city [m
Ah
]
Cycles
a) 0.3 C 2.6 V - 3.45 V CCCV 100 mA b) 0.9C DOD 2.0 V - 3.6 V CCCV 27 mA
c) 1C DOD 2.6 V - 3.45 V CCCV 100 mA d) 1C DOD 2.6 V - 3.6 V CC
80% EoL 70% EoL
0
20
40
60
80
100
120
140
0
0.5
1
1.5
2
2.5
3
3.5
4
0 2 4 6 8 10 12 14 16 18
Te
mp
era
ture
[°C
]
Vo
lta
ge
[V
]
Time [min]
Voltage Temperature
Basics of Stationary Battery Storage Systems
22
small bubbles under the emission of small gas threads. No flames were observed. Hence, the
cell fulfills the EUCAR Hazard level 4 criteria according to nail testing [65].
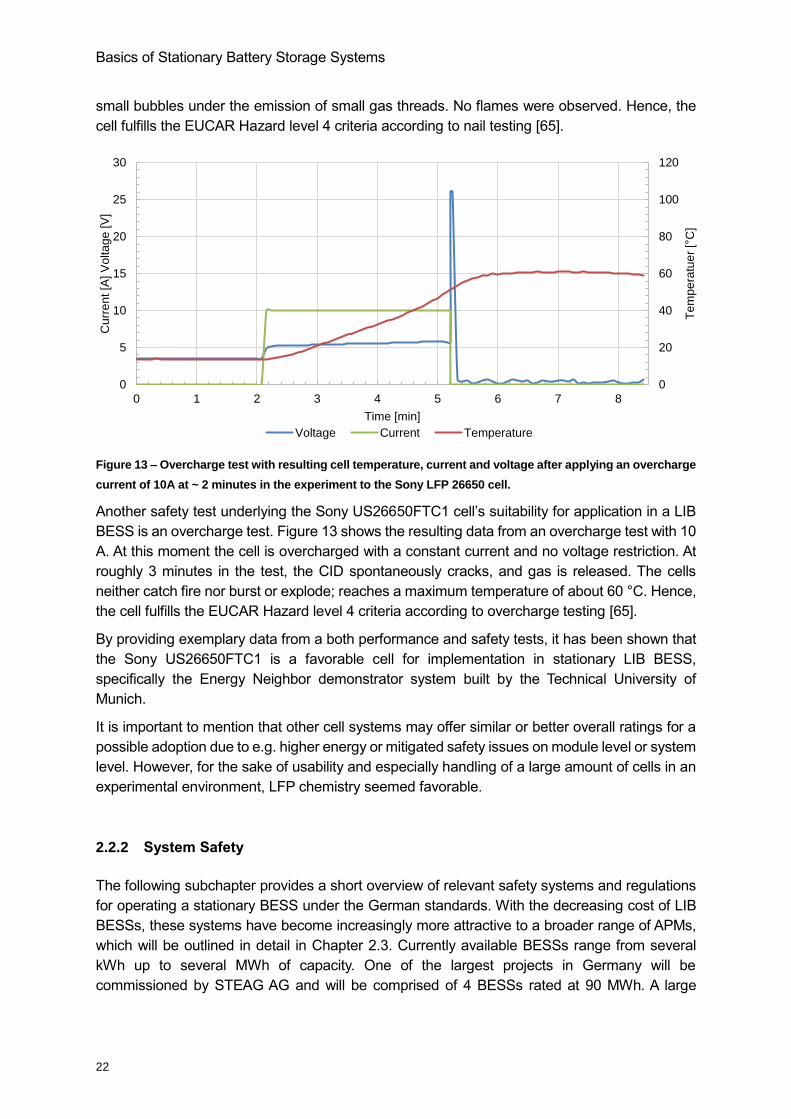
Figure 13 – Overcharge test with resulting cell temperature, current and voltage after applying an overcharge
current of 10A at ~ 2 minutes in the experiment to the Sony LFP 26650 cell.
Another safety test underlying the Sony US26650FTC1 cell’s suitability for application in a LIB
BESS is an overcharge test. Figure 13 shows the resulting data from an overcharge test with 10
A. At this moment the cell is overcharged with a constant current and no voltage restriction. At
roughly 3 minutes in the test, the CID spontaneously cracks, and gas is released. The cells
neither catch fire nor burst or explode; reaches a maximum temperature of about 60 °C. Hence,
the cell fulfills the EUCAR Hazard level 4 criteria according to overcharge testing [65].
By providing exemplary data from a both performance and safety tests, it has been shown that
the Sony US26650FTC1 is a favorable cell for implementation in stationary LIB BESS,
specifically the Energy Neighbor demonstrator system built by the Technical University of
Munich.
It is important to mention that other cell systems may offer similar or better overall ratings for a
possible adoption due to e.g. higher energy or mitigated safety issues on module level or system
level. However, for the sake of usability and especially handling of a large amount of cells in an
experimental environment, LFP chemistry seemed favorable.
2.2.2 System Safety
The following subchapter provides a short overview of relevant safety systems and regulations
for operating a stationary BESS under the German standards. With the decreasing cost of LIB
BESSs, these systems have become increasingly more attractive to a broader range of APMs,
which will be outlined in detail in Chapter 2.3. Currently available BESSs range from several
kWh up to several MWh of capacity. One of the largest projects in Germany will be
commissioned by STEAG AG and will be comprised of 4 BESSs rated at 90 MWh. A large
0
20
40
60
80
100
120
0
5
10
15
20
25
30
0 1 2 3 4 5 6 7 8
Te
mp
era
tue
r [°
C]
Cu
rre
nt [A
] V
olta
ge
[V
]
Time [min]
Voltage Current Temperature
Basics of Stationary Battery Storage Systems
23
number of similar pilot projects worldwide emphasize the necessity for minimized risks. Currently
(as of 08/2016), long-term studies are lacking on the safety of such systems operated under real
conditions. To ensure system security and safety, it is essential to be aware of relevant legislative
and normative requirements as well as safety operating technologies and subsystems in
BESSs. Currently, there are no standards for the safe constructions, commission, operation,
decommission and recycling of stationary BESS; however, a series of norming institutes are
working closely with industry and policy makers to fill this gap.
Legislative regulations in the European Union require any technical system that is being sold
into public markets to comply with all conformity regulations according to the CE mark. Under
the CE mark, the following regulations are relevant for stationary BESSs:
Machine Guideline (2006/42/EG)
Even if stationary BESSs are not a machine in the sense of 2006/42/EG, the failure of safety
systems inside a BESS can lead to significant dangers for persons working with these systems.
The demand of 2006/42/EG requiring “a component which serves to fulfill a safety function or
the failure and/or malfunction of the safety of persons at risk” should be ensured in a stationary
BESS.
EMC Guideline (2004/108/EG)
To ensure the correct operation of a stationary BESS, the electromagnetic compatibility
guidelines cover any issues relating to disturbances between components of a BESS from both
external and internal sources as well as emitting disturbance to the outside of the BESS.
Specifically, PE, communication busses, EMSs and BMSs require audits by recognized and
certified institutes.
LV Guideline (2006/95/EG)
The LV guideline 2006/95/EG is mandatory for any electric system connected to AC between
50 VAC and 1,000 VAC. Because many BESSs are in this range, this guideline should be
applied. The guideline “ensures that electrical equipment may be placed on the market only if
they are prepared so, that they ensure, under a proper installation and maintenance as well as
an intended use, the safety of people and animals, and - according to the given community -
status of safety technology and do not jeopardize the preservation of material assets.” [66].
RoHS-Guideline (2011/65/EU)
The guideline for the Restriction of (the use of certain) Hazardous Substances represents an
important guideline to protect animals, humans, and the environment from dangerous materials.
It is mandatory in the European Union that all systems follow this guideline; thus, a BESS is
equally affected.
Product Safety Directive (2001/95/EG)
The product safety directive ensures that technical systems that are sold on the market are only
allowed to be sold when they do not risk the safety of persons and assets. It is mandatory in the
European Union that any system follows this guideline; thus, a BESS is equally affected.
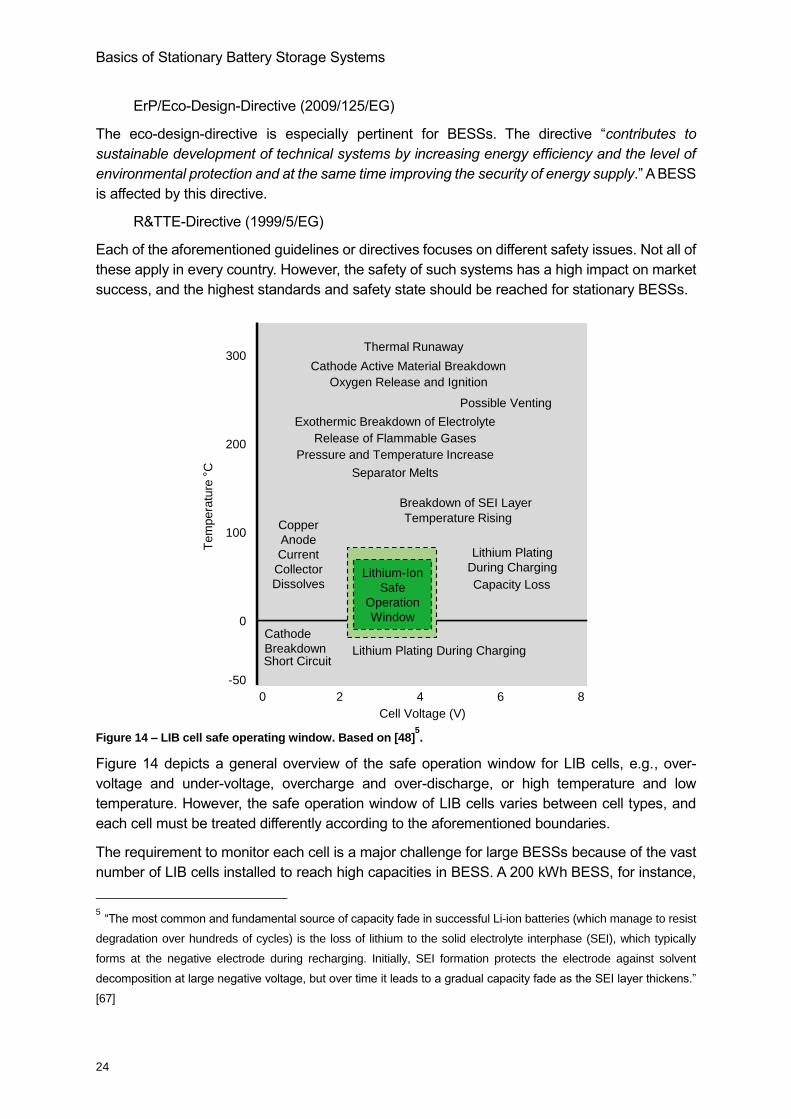
Basics of Stationary Battery Storage Systems
24
ErP/Eco-Design-Directive (2009/125/EG)
The eco-design-directive is especially pertinent for BESSs. The directive “contributes to
sustainable development of technical systems by increasing energy efficiency and the level of
environmental protection and at the same time improving the security of energy supply.” A BESS
is affected by this directive.
R&TTE-Directive (1999/5/EG)
Each of the aforementioned guidelines or directives focuses on different safety issues. Not all of
these apply in every country. However, the safety of such systems has a high impact on market
success, and the highest standards and safety state should be reached for stationary BESSs.
Figure 14 – LIB cell safe operating window. Based on [48]
5.
Figure 14 depicts a general overview of the safe operation window for LIB cells, e.g., over-
voltage and under-voltage, overcharge and over-discharge, or high temperature and low
temperature. However, the safe operation window of LIB cells varies between cell types, and
each cell must be treated differently according to the aforementioned boundaries.
The requirement to monitor each cell is a major challenge for large BESSs because of the vast
number of LIB cells installed to reach high capacities in BESS. A 200 kWh BESS, for instance,
5 “The most common and fundamental source of capacity fade in successful Li-ion batteries (which manage to resist
degradation over hundreds of cycles) is the loss of lithium to the solid electrolyte interphase (SEI), which typically
forms at the negative electrode during recharging. Initially, SEI formation protects the electrode against solvent
decomposition at large negative voltage, but over time it leads to a gradual capacity fade as the SEI layer thickens.”
[67]
0 2 4 6 8
Te
mp
era
ture
°C
Thermal Runaway
Possible Venting
Pressure and Temperature Increase
Separator Melts
Temperature Rising
Capacity Loss
Lithium Plating During Charging
Lithium Plating
During Charging
Breakdown of SEI Layer
Release of Flammable Gases
Exothermic Breakdown of Electrolyte
Cathode Active Material Breakdown
Oxygen Release and Ignition
Short Circuit
Cathode
Breakdown
Copper
Anode
Current
Collector
Dissolves
Cell Voltage (V)
300
200
100
0
-50
Lithium-Ion
Safe
Operation
Window
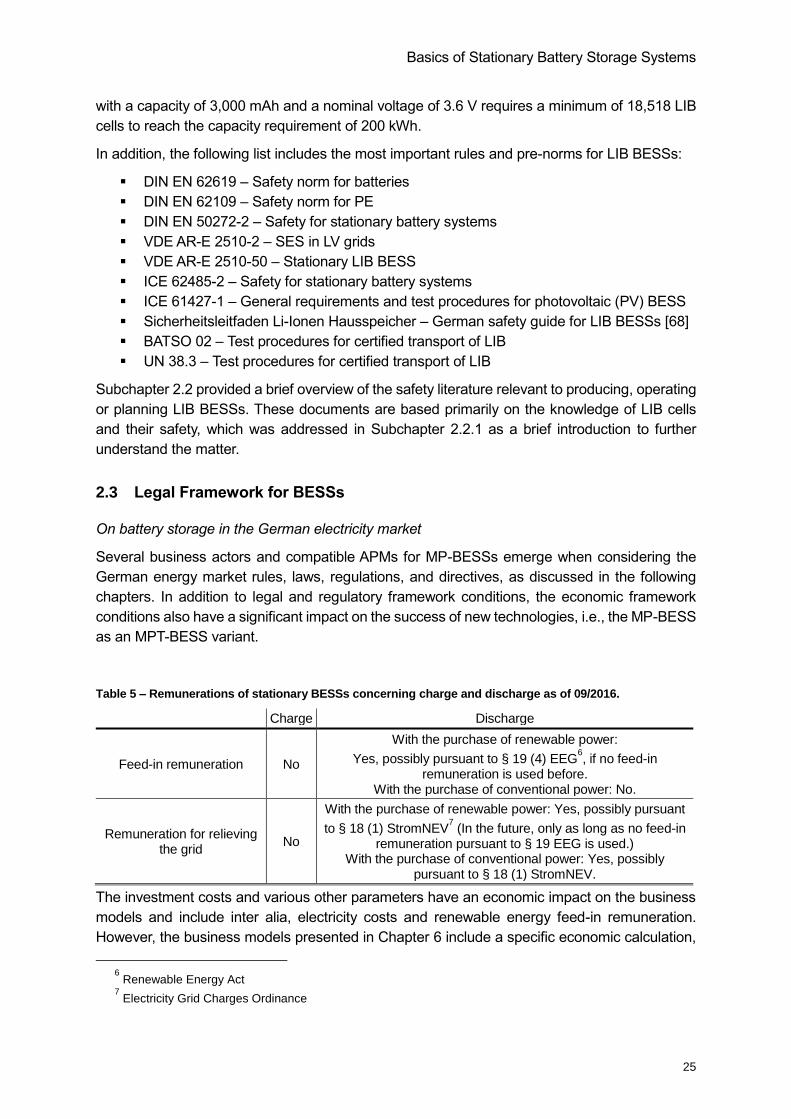
Basics of Stationary Battery Storage Systems
25
with a capacity of 3,000 mAh and a nominal voltage of 3.6 V requires a minimum of 18,518 LIB
cells to reach the capacity requirement of 200 kWh.
In addition, the following list includes the most important rules and pre-norms for LIB BESSs:
DIN EN 62619 – Safety norm for batteries
DIN EN 62109 – Safety norm for PE
DIN EN 50272-2 – Safety for stationary battery systems
VDE AR-E 2510-2 – SES in LV grids
VDE AR-E 2510-50 – Stationary LIB BESS
ICE 62485-2 – Safety for stationary battery systems
ICE 61427-1 – General requirements and test procedures for photovoltaic (PV) BESS
Sicherheitsleitfaden Li-Ionen Hausspeicher – German safety guide for LIB BESSs [68]
BATSO 02 – Test procedures for certified transport of LIB
UN 38.3 – Test procedures for certified transport of LIB
Subchapter 2.2 provided a brief overview of the safety literature relevant to producing, operating
or planning LIB BESSs. These documents are based primarily on the knowledge of LIB cells
and their safety, which was addressed in Subchapter 2.2.1 as a brief introduction to further
understand the matter.
2.3 Legal Framework for BESSs
On battery storage in the German electricity market
Several business actors and compatible APMs for MP-BESSs emerge when considering the
German energy market rules, laws, regulations, and directives, as discussed in the following
chapters. In addition to legal and regulatory framework conditions, the economic framework
conditions also have a significant impact on the success of new technologies, i.e., the MP-BESS
as an MPT-BESS variant.
Table 5 – Remunerations of stationary BESSs concerning charge and discharge as of 09/2016.
Charge Discharge
Feed-in remuneration No
With the purchase of renewable power:
Yes, possibly pursuant to § 19 (4) EEG6, if no feed-in
remuneration is used before. With the purchase of conventional power: No.
Remuneration for relieving the grid
No
With the purchase of renewable power: Yes, possibly pursuant
to § 18 (1) StromNEV7 (In the future, only as long as no feed-in
remuneration pursuant to § 19 EEG is used.) With the purchase of conventional power: Yes, possibly
pursuant to § 18 (1) StromNEV.
The investment costs and various other parameters have an economic impact on the business
models and include inter alia, electricity costs and renewable energy feed-in remuneration.
However, the business models presented in Chapter 6 include a specific economic calculation,
6 Renewable Energy Act
7 Electricity Grid Charges Ordinance
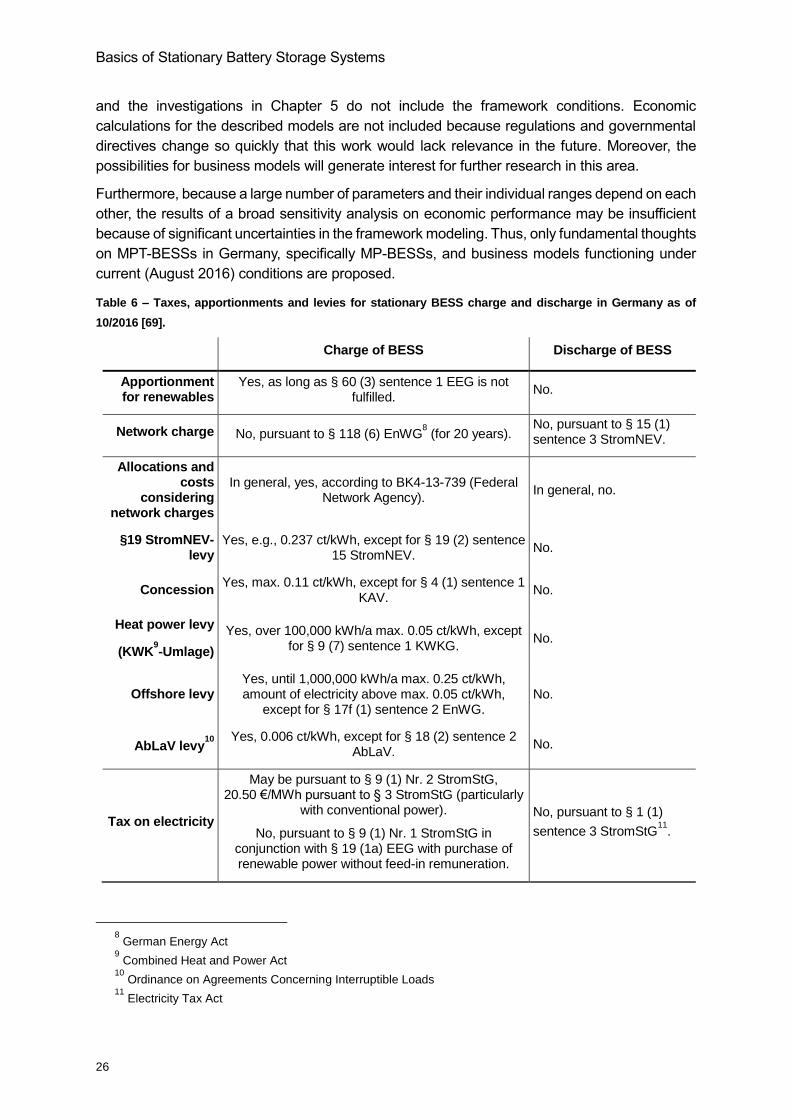
Basics of Stationary Battery Storage Systems
26
and the investigations in Chapter 5 do not include the framework conditions. Economic
calculations for the described models are not included because regulations and governmental
directives change so quickly that this work would lack relevance in the future. Moreover, the
possibilities for business models will generate interest for further research in this area.
Furthermore, because a large number of parameters and their individual ranges depend on each
other, the results of a broad sensitivity analysis on economic performance may be insufficient
because of significant uncertainties in the framework modeling. Thus, only fundamental thoughts
on MPT-BESSs in Germany, specifically MP-BESSs, and business models functioning under
current (August 2016) conditions are proposed.
Table 6 – Taxes, apportionments and levies for stationary BESS charge and discharge in Germany as of
10/2016 [69].
Charge of BESS Discharge of BESS
Apportionment for renewables
Yes, as long as § 60 (3) sentence 1 EEG is not fulfilled.
No.
Network charge No, pursuant to § 118 (6) EnWG8 (for 20 years).
No, pursuant to § 15 (1) sentence 3 StromNEV.
Allocations and costs
considering network charges
In general, yes, according to BK4-13-739 (Federal Network Agency).
In general, no.
§19 StromNEV-levy
Yes, e.g., 0.237 ct/kWh, except for § 19 (2) sentence 15 StromNEV.
No.
Concession Yes, max. 0.11 ct/kWh, except for § 4 (1) sentence 1
KAV. No.
Heat power levy
(KWK9-Umlage)
Yes, over 100,000 kWh/a max. 0.05 ct/kWh, except for § 9 (7) sentence 1 KWKG.
No.
Offshore levy Yes, until 1,000,000 kWh/a max. 0.25 ct/kWh, amount of electricity above max. 0.05 ct/kWh,
except for § 17f (1) sentence 2 EnWG. No.
AbLaV levy10
Yes, 0.006 ct/kWh, except for § 18 (2) sentence 2
AbLaV. No.
Tax on electricity
May be pursuant to § 9 (1) Nr. 2 StromStG, 20.50 €/MWh pursuant to § 3 StromStG (particularly
with conventional power).
No, pursuant to § 9 (1) Nr. 1 StromStG in conjunction with § 19 (1a) EEG with purchase of renewable power without feed-in remuneration.
No, pursuant to § 1 (1)
sentence 3 StromStG11
.
8 German Energy Act
9 Combined Heat and Power Act
10 Ordinance on Agreements Concerning Interruptible Loads
11 Electricity Tax Act
Basics of Stationary Battery Storage Systems
27
Furthermore, this subchapter provides a brief overview of the primary stakeholders for BESSs,
specifically MP-BESSs, in Germany. In addition to their interdependence on the storage system,
suitable APMs and their benefits for each stakeholder are introduced. However, a statutory
definition of BESSs does not exist in Germany [70, 71], and the draft of the Renewable Energy
Sources Act 2017 does not contain further information on this topic [72]. A patchwork of several
laws, regulations, and directives constitute the legal point of view for BESSs in Germany, in
particular, regulations for charging and discharging. Table 6 and Table 5 provide a brief overview
of stationary BESSs in Germany and their remuneration and taxation when they are technically
integrated into the network [69, 73].
On stakeholders in the electricity market
The distribution of electricity requires several grids at different voltage levels. Firms operate
these grids via reinforcement, maintenance, and expansion. These companies are commonly
known as grid operators. As mentioned before, grid operators in Germany are split up into
transmission system operators (TSO) and regional or local distribution system operators (DSO)
under the German Federal Network Agency (BNetzA) or the European Network of Transmission
System Operators for Electricity (ENTSO-E). These can be compared to regional transmission
organizations (RTOs12
) and independent system operators (ISOs13
) under the Federal Energy
Regulatory Commission (FERC) or the North American Electric Reliability Corporation (NERC)
in the U.S. Their objective is to provide an affordable, sustainable and reliable supply of
electricity and integrate renewable energies, as per § 1 of the German Energy Act, EnWG.
(“Energiewirtschaftsgesetz”) [74].
There is a natural monopoly on electricity grids because of the high fixed cost, CAPEX, for
setting up grids and the comparably low operating expenses, OPEX. If there were multiple
vendors, each would have to bear the fixed costs of its grid, which would result in an increase
in the average total cost. Monopolies are caused by the increasing returns vs. the falling average
total cost. The awarding of concession contracts results from a natural monopoly in which grids
are tendered every 20 years per § 46 of the German Energy Act [74, 75]. In this context, grid
operators are given the right to use the public domain to provide end users with electricity and
can lay and operate power lines, transformers, and other grid assets.
2.3.1 Transmission System Operators in Europe
Since 2009, the European Network of Transmission System Operators for Electricity (ENTSO-
E) and NERC in the U.S. have dealt with the network codes, security, and reliability of the grids
and with coordination and information [74, 76–78]. Previously, other associations represented
the TSO in most of the countries in continental Europe.
The Union for the Coordination of Production and Transmission of Electricity (UCPTE) was
active from 1951 until 1999 when it became the Union for the Coordination of the Transmission
of Electricity (UCTE) and finally the ENTSO-E. The fundamental rules for the four German TSOs
(50Hertz, Amprion, TenneT TSO and TransnetBW) are in TransmissionCode 2007 [79], and the
12
A regional transmission organization in the U.S. is an electric power transmission system operator (TSO) which coordinates, controls and monitors a multi-state electric grid. 13
An independent system operator is similarly an organization formed at the recommendation of the Federal Energy Regulatory Commission (FERC).
Basics of Stationary Battery Storage Systems
28
ENTSO-E is currently developing general rules for the overall grid territory in Europe. After the
Agency for the Cooperation of Energy Regulations (ACER) gives the “Framework Guidelines on
Electricity Grid Connections” to the TSOs, the TSOs will develop the network codes [80].
However, the ACER and the European Commission will have the chance to reject the network
codes according to Articles 6 and 8 of Regulation (EC) No 714/2009 and Directive No
2009/72/EC [78, 81].
Nonetheless, the TSOs are responsible for the optimal and secure operation, maintenance and,
if necessary, expansion of their grids in their respective areas. Therefore, several rules for TSOs
already apply cross-border. In this context, TSOs provide ancillary services such as frequency
control, voltage control, restoration of supply systems and operation management [79]. Control
power is necessary to maintain the balance between electricity generation and consumption in
real time. Control power is also an important part of meeting the TSO obligations, which turns
out to be a suitable APM for MP-BESSs and BESSs.
2.3.2 Distribution System Operators
Problems occur partly in German grids at lower voltage levels (20 kVAC down to 400 VAC)
because of the massive expansion of PV systems in Germany, which has resulted in a change
in the load flow at various times of the year and overloading of transformer stations and lines.
Neither the transformers nor the lines were designed for these situations [82]. Therefore, DSOs
must extend, reinforce and/or renew existing installations in these cases. Using BESSs, power
input peaks can be reduced to achieve a delay or even a waiver of the extension. According to
[83], BESSs could be an alternative to an upgrade investment. This suggestion leads to the APM
of “relieving the grid,” and the DSOs profit from BESSs.
2.3.3 Energy Supply Companies
Energy Supply Companies (ESCs) generate and sell power, but they do not possess the grids
because of legal provisions concerning unbundling, as per §§ 6 et seq. of the German Energy
Act [74] and Art. 2 No. 21 Directive 2009/72/EC [81]. In this context, the German Energy Act
contains rules for accounting, informational, organizational and legal unbundling with the aim of
strengthening the competition [74]. At ESCs, a so-called balancing group manager is
responsible for regulating the supply and demand for electricity in 15-minute intervals for each
balancing area in his respective fields of interest according to the § 4 (2) regulation on electricity
feed-in to and consumption from electricity supply grids – Stromnetzzugangsverordnung14
(StromNZV). To fulfill this task, ESCs depend on load and generation forecasts. Therefore,
participating in the wholesale of electricity is indispensable because of the lack of perfect
forecast models. German ESCs use spot and forward markets for the European Power
Exchange (EPEX) and European Energy Exchange (EEX) for electricity exchange [84]. Long-
term futures markets are used for planning and hedging, and short-term day ahead or intraday
markets help balance electricity when there are forecast errors. In addition to reducing the high
purchase prices in the spot market using spare power from the BESS, arbitrage between times
of high and low electricity costs is possible for an APM using the available capacity of the BESS.
14
Electricity Grid Access Ordinance
Basics of Stationary Battery Storage Systems
29
2.3.4 Solar Power Plant Operator
In general, even small solar energy plant operators are regarded as ESCs (§ 117a of the German
Energy Act 85), but they have different interests for using a BESS. Temporary storage of surplus
PV energy to decrease their cost of electricity is their main concern. According to the grid parity
for solar energy, it is possible to generate the necessary margins for refinancing the BESS [69,
86–89] instead of using grid energy. Grid parity occurs when an alternative power source can
generate power at a levelized cost of energy (LCOE)15
that is less than or equal to the price of
purchasing power from the electricity grid, which was the case for private households with PV
systems smaller than 30 kW in Germany in 2011. The average retail price of electricity was
higher than the feed-in remuneration. Nevertheless, several studies and papers [26, 83, 91, 92]
show that the exclusive use of this specific APM with a BESS is not profitable under the current
framework conditions in Germany. For example, neither small home storage systems nor large
BESSs have a positive return on invest (ROI) from storing surplus PV energy because of the
low utilization ratio at night and during the winter [92]. In addition to the economy, several other
facts are also crucial. According to [93], ideological reasons, such as the contribution to the
energy transition, influence investment decisions on BESSs. According to [93], 34,000 BESSs
are currently installed in Germany and are working as residential storage systems.
2.3.5 Power Customers
End users, particularly power customers, usually show interest in BESSs only if there is a
reduction in their electricity price. A positive ROI from participating in the BESS in any way is
desirable. In concrete terms, this means the either property or possession of the BESS or an
electricity tariff attached to the BESS that results in lower prices for the end users is of interest
to this group. This group of stakeholders is divided into two subgroups based on their power
consumption. Households in Germany do not have to pay a special power price in addition to
the energy price, but a special rate is compulsory for an annual consumption of at least 100,000
kWh [94]. Thus, large power customers have additional interest in peak shaving or peak shifting.
Because of the legal and regulatory framework conditions, the location of the BESS must be on
the company site, which is not compatible with most APMs. Therefore, reducing the energy price
is the subject of this work.
2.3.6 Municipality
Municipalities benefit from BESSs through concession and commercial taxes, but they can also
act as power customers. The latter is not given a separate mention, but it is included in the
previous chapter. At nearly 44 billion Euros, in 2014 the commercial tax is the largest source of
income for German municipalities [95] (p. 267). Under the German Trade Tax Act
(“Gewerbesteuergesetz”), the level of tax depends on trade earnings, the local rate of
assessment and legal forms [95–97] and can vary between different regions. The municipality
itself is authorized to charge a duty for the right to use the public domain to provide end users
with electricity and for laying and operating power lines, transformers, and other grid capacities.
[74, 98]. The taxes and duties differ among themselves in terms of location, but there is a
15
“The Levelized Cost of Energy(LCOE) is defined as the total lifetime cost of an investment divided by the cumulated generated energy by this investment.” [90]

Basics of Stationary Battery Storage Systems
30
consensus that the operation of BESSs represents an economic advantage for each
municipality.
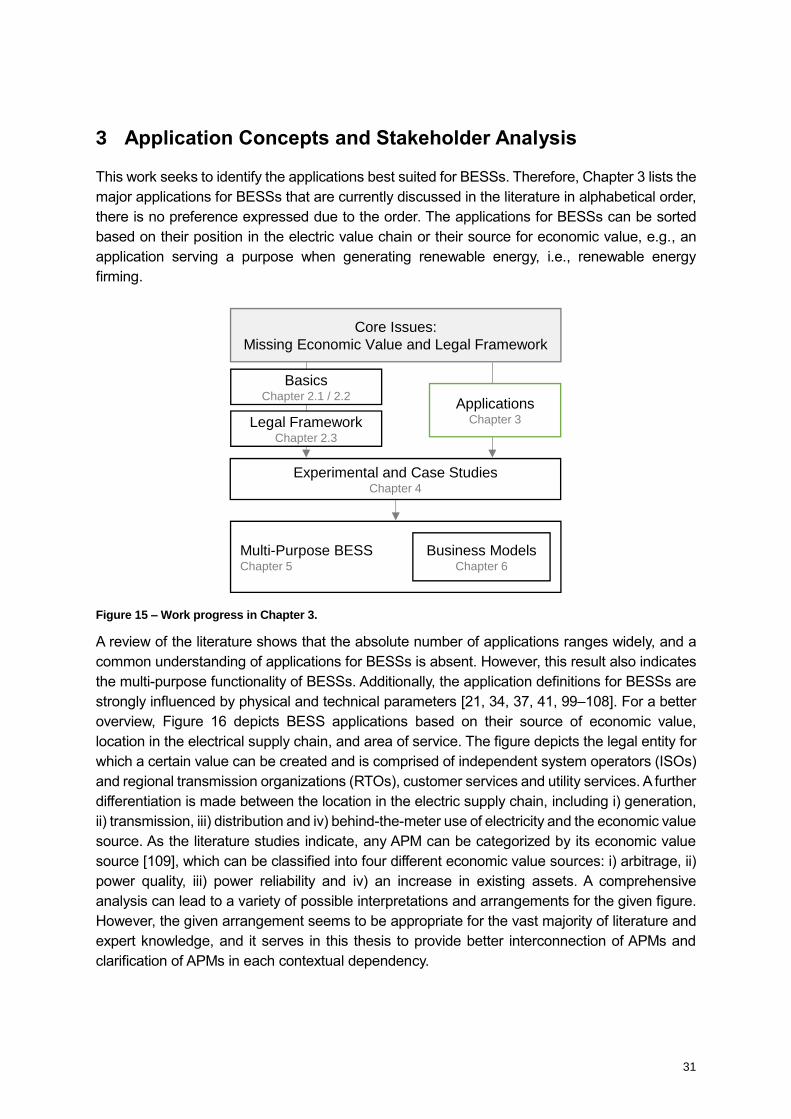
31
3 Application Concepts and Stakeholder Analysis
This work seeks to identify the applications best suited for BESSs. Therefore, Chapter 3 lists the
major applications for BESSs that are currently discussed in the literature in alphabetical order,
there is no preference expressed due to the order. The applications for BESSs can be sorted
based on their position in the electric value chain or their source for economic value, e.g., an
application serving a purpose when generating renewable energy, i.e., renewable energy
firming.
Figure 15 – Work progress in Chapter 3.
A review of the literature shows that the absolute number of applications ranges widely, and a
common understanding of applications for BESSs is absent. However, this result also indicates
the multi-purpose functionality of BESSs. Additionally, the application definitions for BESSs are
strongly influenced by physical and technical parameters [21, 34, 37, 41, 99–108]. For a better
overview, Figure 16 depicts BESS applications based on their source of economic value,
location in the electrical supply chain, and area of service. The figure depicts the legal entity for
which a certain value can be created and is comprised of independent system operators (ISOs)
and regional transmission organizations (RTOs), customer services and utility services. A further
differentiation is made between the location in the electric supply chain, including i) generation,
ii) transmission, iii) distribution and iv) behind-the-meter use of electricity and the economic value
source. As the literature studies indicate, any APM can be categorized by its economic value
source [109], which can be classified into four different economic value sources: i) arbitrage, ii)
power quality, iii) power reliability and iv) an increase in existing assets. A comprehensive
analysis can lead to a variety of possible interpretations and arrangements for the given figure.
However, the given arrangement seems to be appropriate for the vast majority of literature and
expert knowledge, and it serves in this thesis to provide better interconnection of APMs and
clarification of APMs in each contextual dependency.
Core Issues:
Missing Economic Value and Legal Framework
Legal FrameworkChapter 2.3
Experimental and Case StudiesChapter 4
Multi-Purpose BESSChapter 5
Business ModelsChapter 6
ApplicationsChapter 3
BasicsChapter 2.1 / 2.2
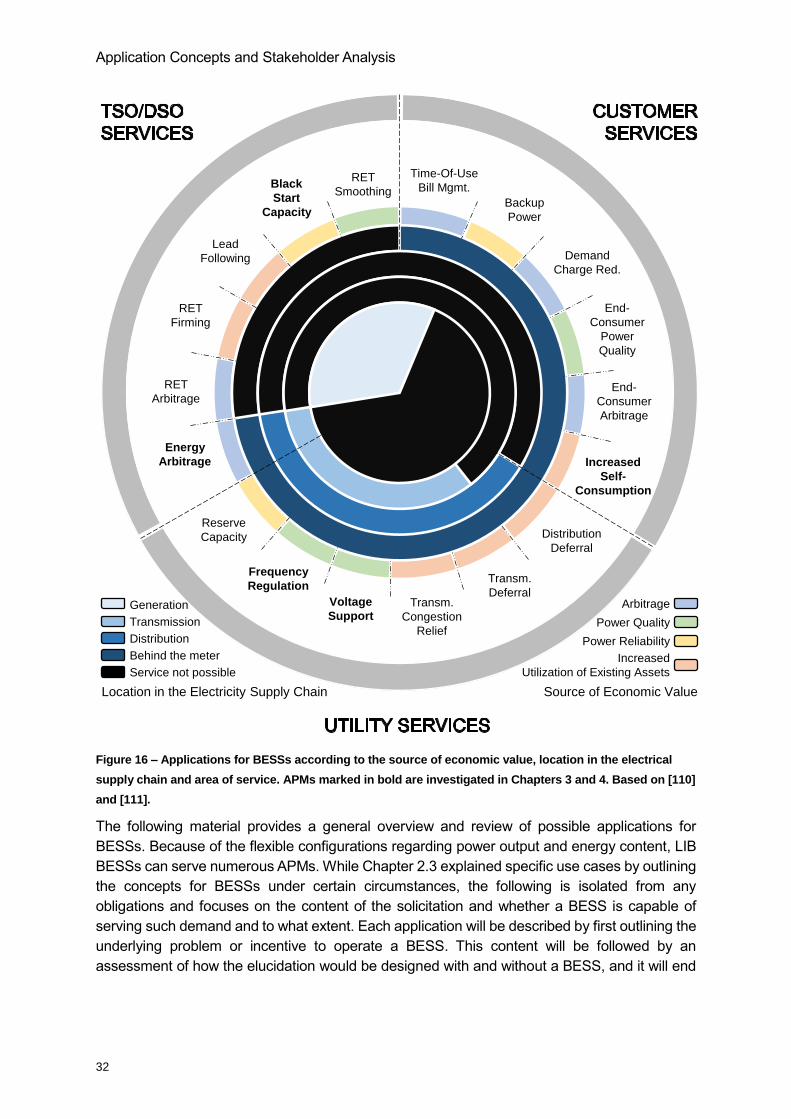
Application Concepts and Stakeholder Analysis
32
Figure 16 – Applications for BESSs according to the source of economic value, location in the electrical
supply chain and area of service. APMs marked in bold are investigated in Chapters 3 and 4. Based on [110]
and [111].
The following material provides a general overview and review of possible applications for
BESSs. Because of the flexible configurations regarding power output and energy content, LIB
BESSs can serve numerous APMs. While Chapter 2.3 explained specific use cases by outlining
the concepts for BESSs under certain circumstances, the following is isolated from any
obligations and focuses on the content of the solicitation and whether a BESS is capable of
serving such demand and to what extent. Each application will be described by first outlining the
underlying problem or incentive to operate a BESS. This content will be followed by an
assessment of how the elucidation would be designed with and without a BESS, and it will end
RET
Firming
Lead
Following
Black
Start
Capacity
RET
Smoothing
RET
Arbitrage
Energy
Arbitrage
Reserve
Capacity
Frequency
Regulation
Voltage
SupportTransm.
Congestion
Relief
Transm.
Deferral
Distribution
Deferral
Increased
Self-
Consumption
End-
Consumer
Arbitrage
End-
Consumer
Power
Quality
Demand
Charge Red.
Backup
Power
Time-Of-Use
Bill Mgmt.
Source of Economic Value
Power Quality
Power Reliability
Arbitrage
Increased
Utilization of Existing Assets
Location in the Electricity Supply Chain
Generation
Transmission
Distribution
Behind the meter
Service not possible
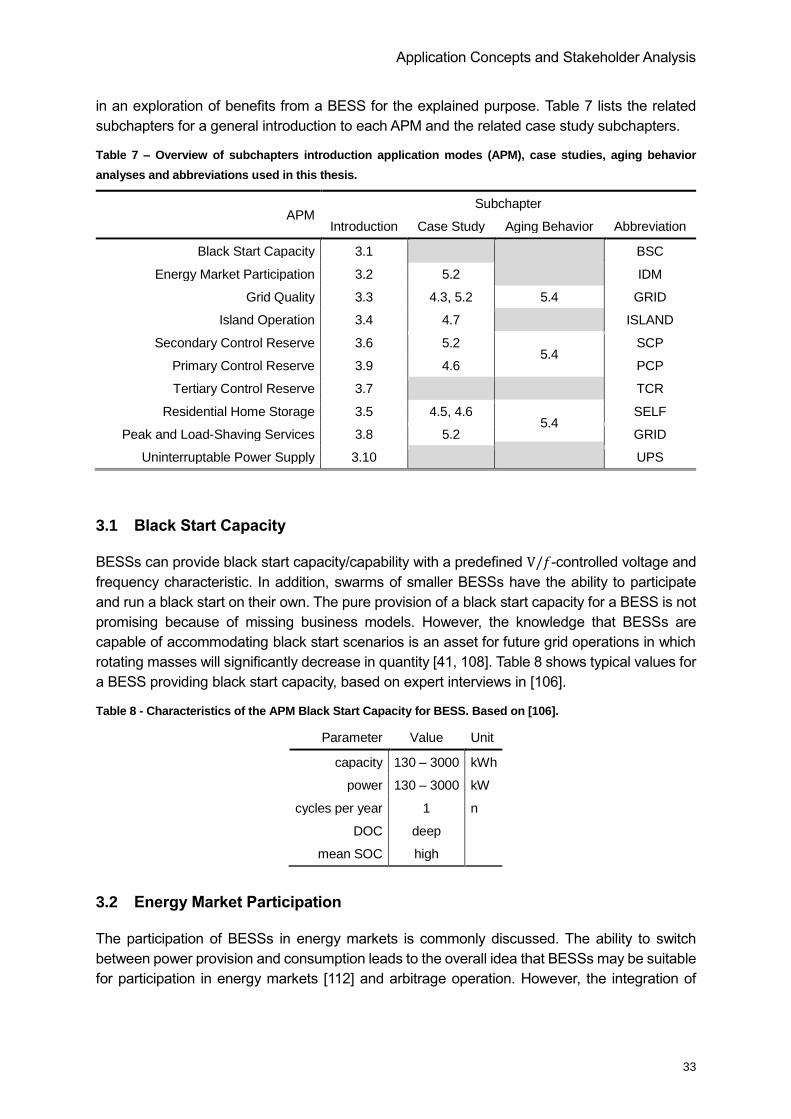
Application Concepts and Stakeholder Analysis
33
in an exploration of benefits from a BESS for the explained purpose. Table 7 lists the related
subchapters for a general introduction to each APM and the related case study subchapters.
Table 7 – Overview of subchapters introduction application modes (APM), case studies, aging behavior
analyses and abbreviations used in this thesis.
APM Subchapter
Introduction Case Study Aging Behavior Abbreviation
Black Start Capacity 3.1 BSC
Energy Market Participation 3.2 5.2 IDM
Grid Quality 3.3 4.3, 5.2 5.4 GRID
Island Operation 3.4 4.7 ISLAND
Secondary Control Reserve 3.6 5.2 5.4
SCP
Primary Control Reserve 3.9 4.6 PCP
Tertiary Control Reserve 3.7 TCR
Residential Home Storage 3.5 4.5, 4.6 5.4
SELF
Peak and Load-Shaving Services 3.8 5.2 GRID
Uninterruptable Power Supply 3.10 UPS
3.1 Black Start Capacity
BESSs can provide black start capacity/capability with a predefined V/𝑓-controlled voltage and
frequency characteristic. In addition, swarms of smaller BESSs have the ability to participate
and run a black start on their own. The pure provision of a black start capacity for a BESS is not
promising because of missing business models. However, the knowledge that BESSs are
capable of accommodating black start scenarios is an asset for future grid operations in which
rotating masses will significantly decrease in quantity [41, 108]. Table 8 shows typical values for
a BESS providing black start capacity, based on expert interviews in [106].
Table 8 - Characteristics of the APM Black Start Capacity for BESS. Based on [106].
Parameter Value Unit
capacity 130 – 3000 kWh
power 130 – 3000 kW
cycles per year 1 n
DOC deep
mean SOC high
3.2 Energy Market Participation
The participation of BESSs in energy markets is commonly discussed. The ability to switch
between power provision and consumption leads to the overall idea that BESSs may be suitable
for participation in energy markets [112] and arbitrage operation. However, the integration of
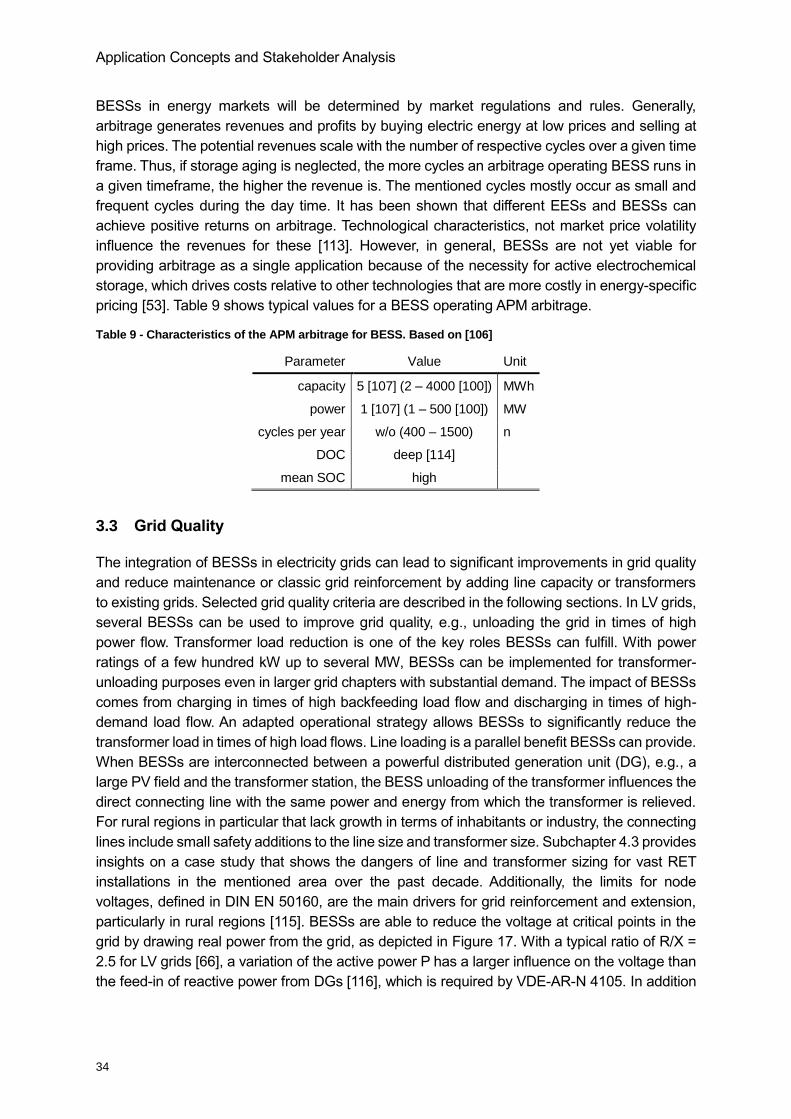
Application Concepts and Stakeholder Analysis
34
BESSs in energy markets will be determined by market regulations and rules. Generally,
arbitrage generates revenues and profits by buying electric energy at low prices and selling at
high prices. The potential revenues scale with the number of respective cycles over a given time
frame. Thus, if storage aging is neglected, the more cycles an arbitrage operating BESS runs in
a given timeframe, the higher the revenue is. The mentioned cycles mostly occur as small and
frequent cycles during the day time. It has been shown that different EESs and BESSs can
achieve positive returns on arbitrage. Technological characteristics, not market price volatility
influence the revenues for these [113]. However, in general, BESSs are not yet viable for
providing arbitrage as a single application because of the necessity for active electrochemical
storage, which drives costs relative to other technologies that are more costly in energy-specific
pricing [53]. Table 9 shows typical values for a BESS operating APM arbitrage.
Table 9 - Characteristics of the APM arbitrage for BESS. Based on [106]
Parameter Value Unit
capacity 5 [107] (2 – 4000 [100]) MWh
power 1 [107] (1 – 500 [100]) MW
cycles per year w/o (400 – 1500) n
DOC deep [114]
mean SOC high
3.3 Grid Quality
The integration of BESSs in electricity grids can lead to significant improvements in grid quality
and reduce maintenance or classic grid reinforcement by adding line capacity or transformers
to existing grids. Selected grid quality criteria are described in the following sections. In LV grids,
several BESSs can be used to improve grid quality, e.g., unloading the grid in times of high
power flow. Transformer load reduction is one of the key roles BESSs can fulfill. With power
ratings of a few hundred kW up to several MW, BESSs can be implemented for transformer-
unloading purposes even in larger grid chapters with substantial demand. The impact of BESSs
comes from charging in times of high backfeeding load flow and discharging in times of high-
demand load flow. An adapted operational strategy allows BESSs to significantly reduce the
transformer load in times of high load flows. Line loading is a parallel benefit BESSs can provide.
When BESSs are interconnected between a powerful distributed generation unit (DG), e.g., a
large PV field and the transformer station, the BESS unloading of the transformer influences the
direct connecting line with the same power and energy from which the transformer is relieved.
For rural regions in particular that lack growth in terms of inhabitants or industry, the connecting
lines include small safety additions to the line size and transformer size. Subchapter 4.3 provides
insights on a case study that shows the dangers of line and transformer sizing for vast RET
installations in the mentioned area over the past decade. Additionally, the limits for node
voltages, defined in DIN EN 50160, are the main drivers for grid reinforcement and extension,
particularly in rural regions [115]. BESSs are able to reduce the voltage at critical points in the
grid by drawing real power from the grid, as depicted in Figure 17. With a typical ratio of R/X =
2.5 for LV grids [66], a variation of the active power P has a larger influence on the voltage than
the feed-in of reactive power from DGs [116], which is required by VDE-AR-N 4105. In addition
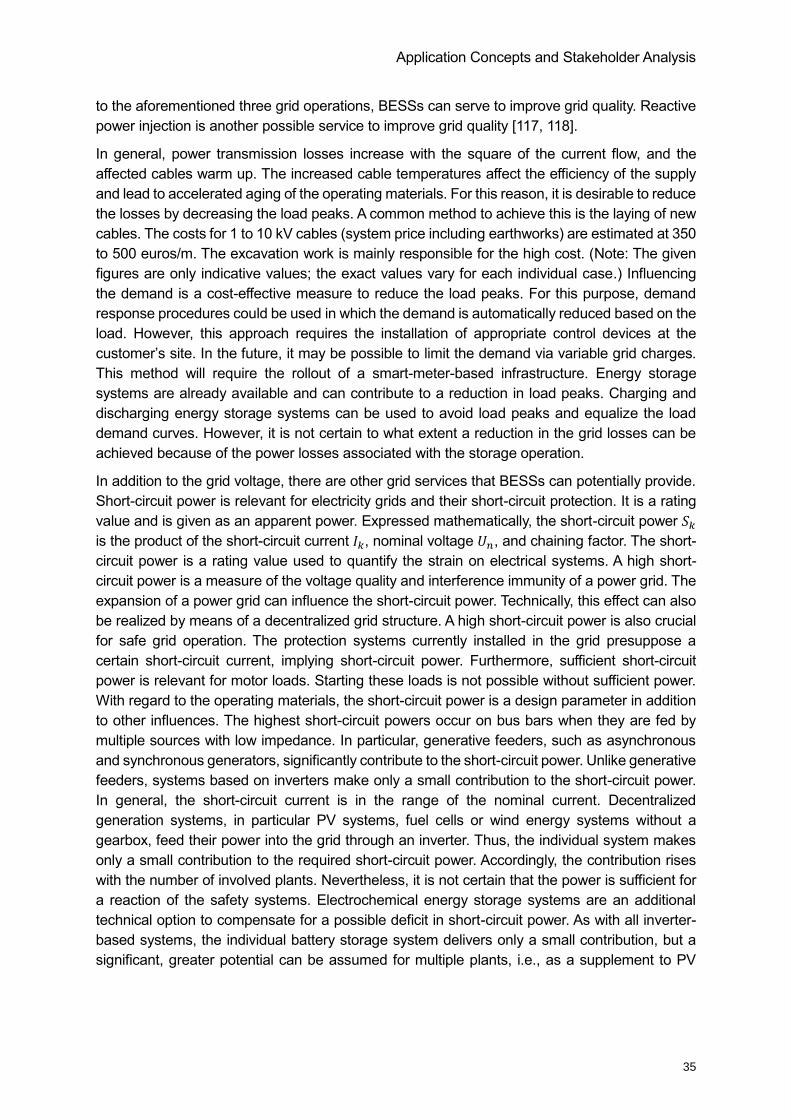
Application Concepts and Stakeholder Analysis
35
to the aforementioned three grid operations, BESSs can serve to improve grid quality. Reactive
power injection is another possible service to improve grid quality [117, 118].
In general, power transmission losses increase with the square of the current flow, and the
affected cables warm up. The increased cable temperatures affect the efficiency of the supply
and lead to accelerated aging of the operating materials. For this reason, it is desirable to reduce
the losses by decreasing the load peaks. A common method to achieve this is the laying of new
cables. The costs for 1 to 10 kV cables (system price including earthworks) are estimated at 350
to 500 euros/m. The excavation work is mainly responsible for the high cost. (Note: The given
figures are only indicative values; the exact values vary for each individual case.) Influencing
the demand is a cost-effective measure to reduce the load peaks. For this purpose, demand
response procedures could be used in which the demand is automatically reduced based on the
load. However, this approach requires the installation of appropriate control devices at the
customer’s site. In the future, it may be possible to limit the demand via variable grid charges.
This method will require the rollout of a smart-meter-based infrastructure. Energy storage
systems are already available and can contribute to a reduction in load peaks. Charging and
discharging energy storage systems can be used to avoid load peaks and equalize the load
demand curves. However, it is not certain to what extent a reduction in the grid losses can be
achieved because of the power losses associated with the storage operation.
In addition to the grid voltage, there are other grid services that BESSs can potentially provide.
Short-circuit power is relevant for electricity grids and their short-circuit protection. It is a rating
value and is given as an apparent power. Expressed mathematically, the short-circuit power 𝑆𝑘
is the product of the short-circuit current 𝐼𝑘, nominal voltage 𝑈𝑛, and chaining factor. The short-
circuit power is a rating value used to quantify the strain on electrical systems. A high short-
circuit power is a measure of the voltage quality and interference immunity of a power grid. The
expansion of a power grid can influence the short-circuit power. Technically, this effect can also
be realized by means of a decentralized grid structure. A high short-circuit power is also crucial
for safe grid operation. The protection systems currently installed in the grid presuppose a
certain short-circuit current, implying short-circuit power. Furthermore, sufficient short-circuit
power is relevant for motor loads. Starting these loads is not possible without sufficient power.
With regard to the operating materials, the short-circuit power is a design parameter in addition
to other influences. The highest short-circuit powers occur on bus bars when they are fed by
multiple sources with low impedance. In particular, generative feeders, such as asynchronous
and synchronous generators, significantly contribute to the short-circuit power. Unlike generative
feeders, systems based on inverters make only a small contribution to the short-circuit power.
In general, the short-circuit current is in the range of the nominal current. Decentralized
generation systems, in particular PV systems, fuel cells or wind energy systems without a
gearbox, feed their power into the grid through an inverter. Thus, the individual system makes
only a small contribution to the required short-circuit power. Accordingly, the contribution rises
with the number of involved plants. Nevertheless, it is not certain that the power is sufficient for
a reaction of the safety systems. Electrochemical energy storage systems are an additional
technical option to compensate for a possible deficit in short-circuit power. As with all inverter-
based systems, the individual battery storage system delivers only a small contribution, but a
significant, greater potential can be assumed for multiple plants, i.e., as a supplement to PV
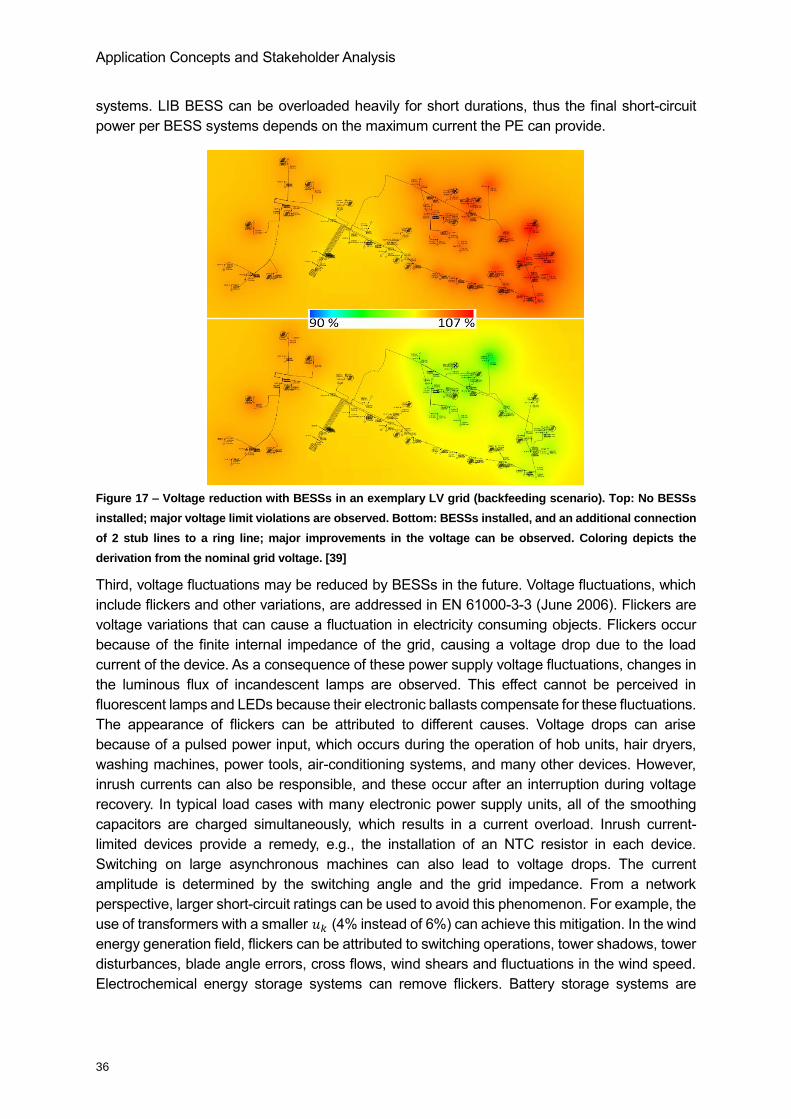
Application Concepts and Stakeholder Analysis
36
systems. LIB BESS can be overloaded heavily for short durations, thus the final short-circuit
power per BESS systems depends on the maximum current the PE can provide.
Figure 17 – Voltage reduction with BESSs in an exemplary LV grid (backfeeding scenario). Top: No BESSs
installed; major voltage limit violations are observed. Bottom: BESSs installed, and an additional connection
of 2 stub lines to a ring line; major improvements in the voltage can be observed. Coloring depicts the
derivation from the nominal grid voltage. [39]
Third, voltage fluctuations may be reduced by BESSs in the future. Voltage fluctuations, which
include flickers and other variations, are addressed in EN 61000-3-3 (June 2006). Flickers are
voltage variations that can cause a fluctuation in electricity consuming objects. Flickers occur
because of the finite internal impedance of the grid, causing a voltage drop due to the load
current of the device. As a consequence of these power supply voltage fluctuations, changes in
the luminous flux of incandescent lamps are observed. This effect cannot be perceived in
fluorescent lamps and LEDs because their electronic ballasts compensate for these fluctuations.
The appearance of flickers can be attributed to different causes. Voltage drops can arise
because of a pulsed power input, which occurs during the operation of hob units, hair dryers,
washing machines, power tools, air-conditioning systems, and many other devices. However,
inrush currents can also be responsible, and these occur after an interruption during voltage
recovery. In typical load cases with many electronic power supply units, all of the smoothing
capacitors are charged simultaneously, which results in a current overload. Inrush current-
limited devices provide a remedy, e.g., the installation of an NTC resistor in each device.
Switching on large asynchronous machines can also lead to voltage drops. The current
amplitude is determined by the switching angle and the grid impedance. From a network
perspective, larger short-circuit ratings can be used to avoid this phenomenon. For example, the
use of transformers with a smaller 𝑢𝑘 (4% instead of 6%) can achieve this mitigation. In the wind
energy generation field, flickers can be attributed to switching operations, tower shadows, tower
disturbances, blade angle errors, cross flows, wind shears and fluctuations in the wind speed.
Electrochemical energy storage systems can remove flickers. Battery storage systems are
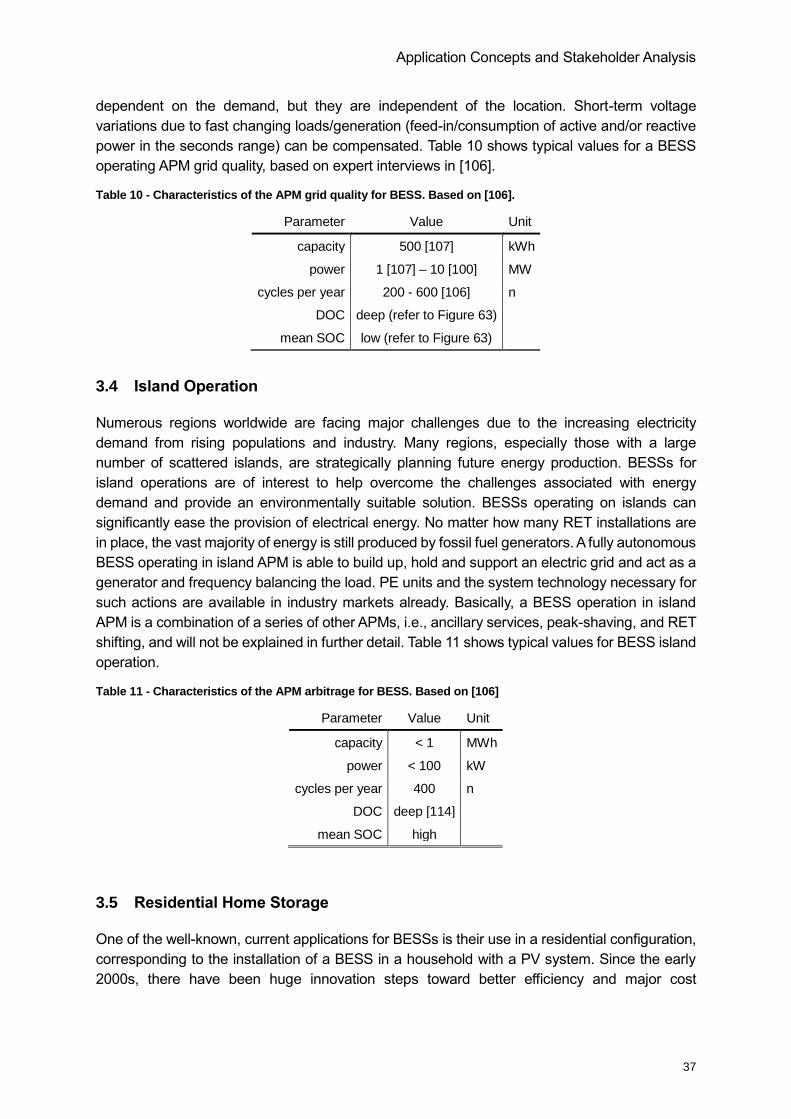
Application Concepts and Stakeholder Analysis
37
dependent on the demand, but they are independent of the location. Short-term voltage
variations due to fast changing loads/generation (feed-in/consumption of active and/or reactive
power in the seconds range) can be compensated. Table 10 shows typical values for a BESS
operating APM grid quality, based on expert interviews in [106].
Table 10 - Characteristics of the APM grid quality for BESS. Based on [106].
Parameter Value Unit
capacity 500 [107] kWh
power 1 [107] – 10 [100] MW
cycles per year 200 - 600 [106] n
DOC deep (refer to Figure 63)
mean SOC low (refer to Figure 63)
3.4 Island Operation
Numerous regions worldwide are facing major challenges due to the increasing electricity
demand from rising populations and industry. Many regions, especially those with a large
number of scattered islands, are strategically planning future energy production. BESSs for
island operations are of interest to help overcome the challenges associated with energy
demand and provide an environmentally suitable solution. BESSs operating on islands can
significantly ease the provision of electrical energy. No matter how many RET installations are
in place, the vast majority of energy is still produced by fossil fuel generators. A fully autonomous
BESS operating in island APM is able to build up, hold and support an electric grid and act as a
generator and frequency balancing the load. PE units and the system technology necessary for
such actions are available in industry markets already. Basically, a BESS operation in island
APM is a combination of a series of other APMs, i.e., ancillary services, peak-shaving, and RET
shifting, and will not be explained in further detail. Table 11 shows typical values for BESS island
operation.
Table 11 - Characteristics of the APM arbitrage for BESS. Based on [106]
Parameter Value Unit
capacity < 1 MWh
power < 100 kW
cycles per year 400 n
DOC deep [114]
mean SOC high
3.5 Residential Home Storage
One of the well-known, current applications for BESSs is their use in a residential configuration,
corresponding to the installation of a BESS in a household with a PV system. Since the early
2000s, there have been huge innovation steps toward better efficiency and major cost
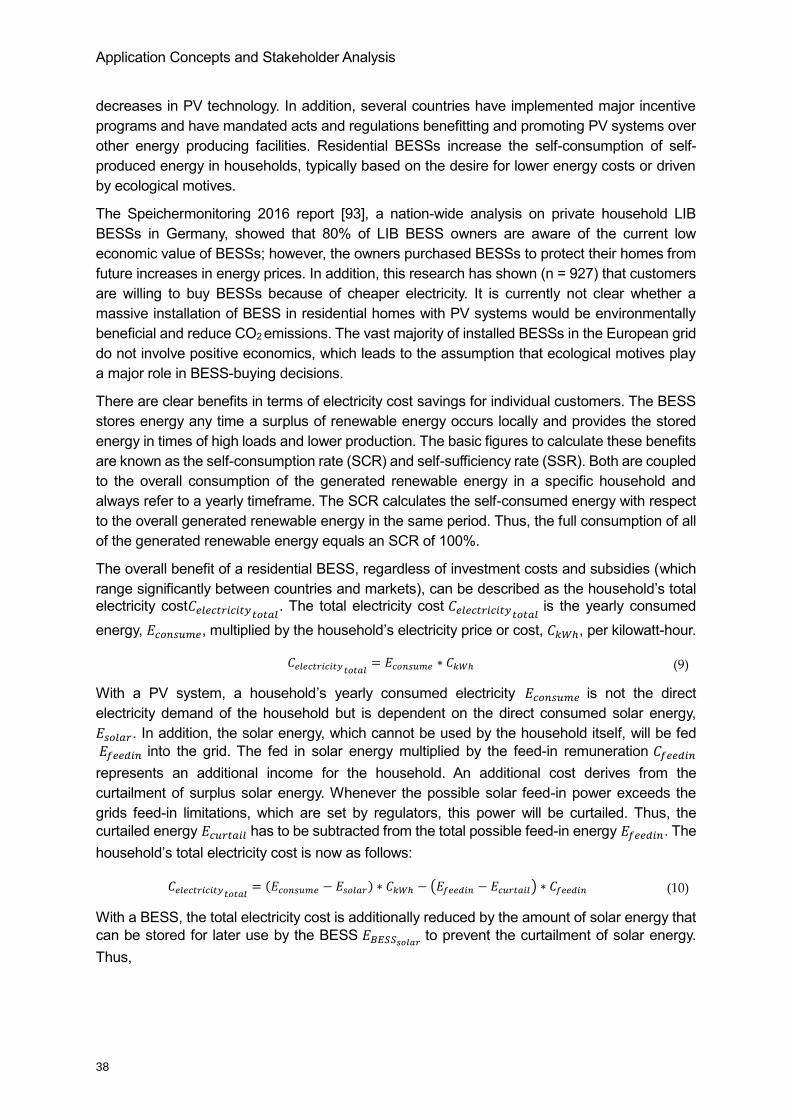
Application Concepts and Stakeholder Analysis
38
decreases in PV technology. In addition, several countries have implemented major incentive
programs and have mandated acts and regulations benefitting and promoting PV systems over
other energy producing facilities. Residential BESSs increase the self-consumption of self-
produced energy in households, typically based on the desire for lower energy costs or driven
by ecological motives.
The Speichermonitoring 2016 report [93], a nation-wide analysis on private household LIB
BESSs in Germany, showed that 80% of LIB BESS owners are aware of the current low
economic value of BESSs; however, the owners purchased BESSs to protect their homes from
future increases in energy prices. In addition, this research has shown (n = 927) that customers
are willing to buy BESSs because of cheaper electricity. It is currently not clear whether a
massive installation of BESS in residential homes with PV systems would be environmentally
beneficial and reduce CO2 emissions. The vast majority of installed BESSs in the European grid
do not involve positive economics, which leads to the assumption that ecological motives play
a major role in BESS-buying decisions.
There are clear benefits in terms of electricity cost savings for individual customers. The BESS
stores energy any time a surplus of renewable energy occurs locally and provides the stored
energy in times of high loads and lower production. The basic figures to calculate these benefits
are known as the self-consumption rate (SCR) and self-sufficiency rate (SSR). Both are coupled
to the overall consumption of the generated renewable energy in a specific household and
always refer to a yearly timeframe. The SCR calculates the self-consumed energy with respect
to the overall generated renewable energy in the same period. Thus, the full consumption of all
of the generated renewable energy equals an SCR of 100%.
The overall benefit of a residential BESS, regardless of investment costs and subsidies (which
range significantly between countries and markets), can be described as the household’s total electricity cost𝐶𝑒𝑙𝑒𝑐𝑡𝑟𝑖𝑐𝑖𝑡𝑦𝑡𝑜𝑡𝑎𝑙 . The total electricity cost 𝐶𝑒𝑙𝑒𝑐𝑡𝑟𝑖𝑐𝑖𝑡𝑦𝑡𝑜𝑡𝑎𝑙 is the yearly consumed
energy, 𝐸𝑐𝑜𝑛𝑠𝑢𝑚𝑒, multiplied by the household’s electricity price or cost, 𝐶𝑘𝑊ℎ, per kilowatt-hour.
𝐶𝑒𝑙𝑒𝑐𝑡𝑟𝑖𝑐𝑖𝑡𝑦𝑡𝑜𝑡𝑎𝑙 = 𝐸𝑐𝑜𝑛𝑠𝑢𝑚𝑒 ∗ 𝐶𝑘𝑊ℎ (9)
With a PV system, a household’s yearly consumed electricity 𝐸𝑐𝑜𝑛𝑠𝑢𝑚𝑒 is not the direct
electricity demand of the household but is dependent on the direct consumed solar energy,
𝐸𝑠𝑜𝑙𝑎𝑟. In addition, the solar energy, which cannot be used by the household itself, will be fed
𝐸𝑓𝑒𝑒𝑑𝑖𝑛 into the grid. The fed in solar energy multiplied by the feed-in remuneration 𝐶𝑓𝑒𝑒𝑑𝑖𝑛
represents an additional income for the household. An additional cost derives from the
curtailment of surplus solar energy. Whenever the possible solar feed-in power exceeds the
grids feed-in limitations, which are set by regulators, this power will be curtailed. Thus, the
curtailed energy 𝐸𝑐𝑢𝑟𝑡𝑎𝑖𝑙 has to be subtracted from the total possible feed-in energy 𝐸𝑓𝑒𝑒𝑑𝑖𝑛. The
household’s total electricity cost is now as follows:
𝐶𝑒𝑙𝑒𝑐𝑡𝑟𝑖𝑐𝑖𝑡𝑦𝑡𝑜𝑡𝑎𝑙 =(𝐸𝑐𝑜𝑛𝑠𝑢𝑚𝑒 − 𝐸𝑠𝑜𝑙𝑎𝑟) ∗ 𝐶𝑘𝑊ℎ − (𝐸𝑓𝑒𝑒𝑑𝑖𝑛 − 𝐸𝑐𝑢𝑟𝑡𝑎𝑖𝑙) ∗ 𝐶𝑓𝑒𝑒𝑑𝑖𝑛 (10)
With a BESS, the total electricity cost is additionally reduced by the amount of solar energy that
can be stored for later use by the BESS 𝐸𝐵𝐸𝑆𝑆𝑠𝑜𝑙𝑎𝑟 to prevent the curtailment of solar energy.
Thus,
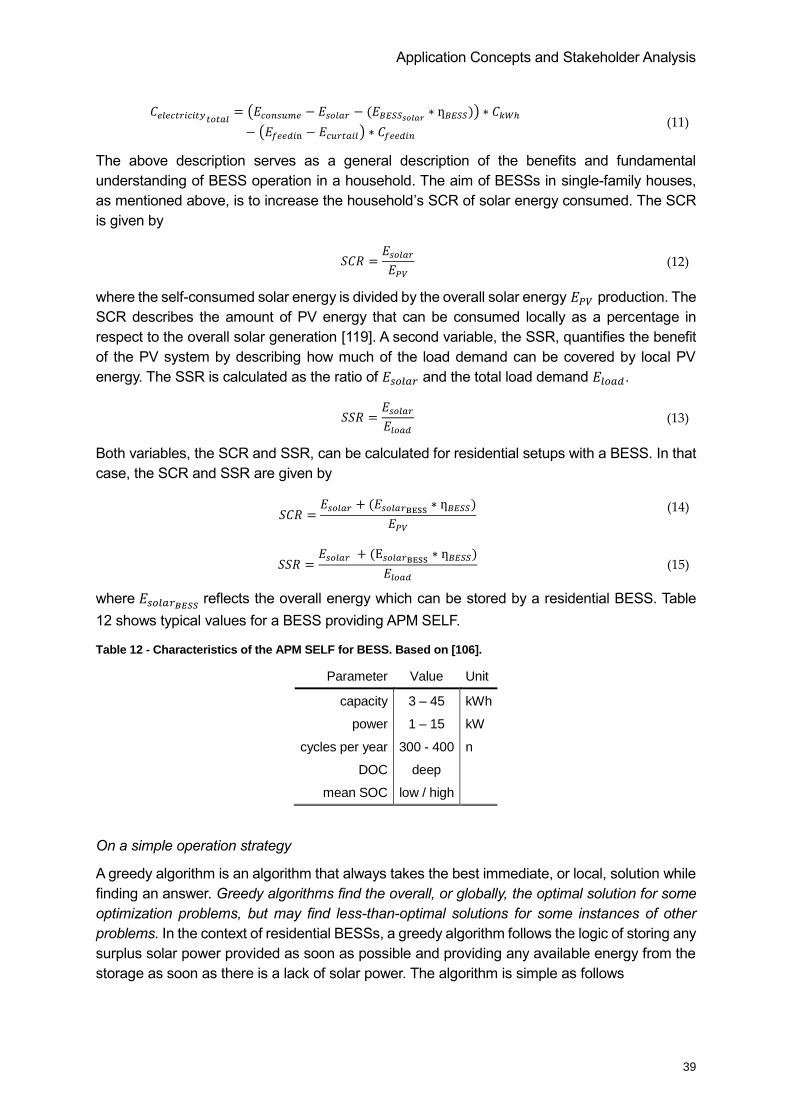
Application Concepts and Stakeholder Analysis
39
𝐶𝑒𝑙𝑒𝑐𝑡𝑟𝑖𝑐𝑖𝑡𝑦𝑡𝑜𝑡𝑎𝑙 = (𝐸𝑐𝑜𝑛𝑠𝑢𝑚𝑒 − 𝐸𝑠𝑜𝑙𝑎𝑟 − (𝐸𝐵𝐸𝑆𝑆𝑠𝑜𝑙𝑎𝑟 ∗ ƞ𝐵𝐸𝑆𝑆)) ∗ 𝐶𝑘𝑊ℎ
− (𝐸𝑓𝑒𝑒𝑑𝑖n − 𝐸𝑐𝑢𝑟𝑡𝑎𝑖𝑙) ∗ 𝐶𝑓𝑒𝑒𝑑𝑖𝑛 (11)
The above description serves as a general description of the benefits and fundamental
understanding of BESS operation in a household. The aim of BESSs in single-family houses,
as mentioned above, is to increase the household’s SCR of solar energy consumed. The SCR
is given by
𝑆𝐶𝑅 =𝐸𝑠𝑜𝑙𝑎𝑟𝐸𝑃𝑉
(12)
where the self-consumed solar energy is divided by the overall solar energy 𝐸𝑃𝑉 production. The
SCR describes the amount of PV energy that can be consumed locally as a percentage in
respect to the overall solar generation [119]. A second variable, the SSR, quantifies the benefit
of the PV system by describing how much of the load demand can be covered by local PV
energy. The SSR is calculated as the ratio of 𝐸𝑠𝑜𝑙𝑎𝑟 and the total load demand 𝐸𝑙𝑜𝑎𝑑.
𝑆𝑆𝑅 =𝐸𝑠𝑜𝑙𝑎𝑟𝐸𝑙𝑜𝑎𝑑
(13)
Both variables, the SCR and SSR, can be calculated for residential setups with a BESS. In that
case, the SCR and SSR are given by
𝑆𝐶𝑅 =𝐸𝑠𝑜𝑙𝑎𝑟 + (𝐸𝑠𝑜𝑙𝑎𝑟BESS ∗ ƞ𝐵𝐸𝑆𝑆)
𝐸𝑃𝑉
(14)
𝑆𝑆𝑅 =𝐸𝑠𝑜𝑙𝑎𝑟 + (E𝑠𝑜𝑙𝑎𝑟BESS ∗ ƞ𝐵𝐸𝑆𝑆)
𝐸𝑙𝑜𝑎𝑑 (15)
where 𝐸𝑠𝑜𝑙𝑎𝑟𝐵𝐸𝑆𝑆 reflects the overall energy which can be stored by a residential BESS. Table
12 shows typical values for a BESS providing APM SELF.
Table 12 - Characteristics of the APM SELF for BESS. Based on [106].
Parameter Value Unit
capacity 3 – 45 kWh
power 1 – 15 kW
cycles per year 300 - 400 n
DOC deep
mean SOC low / high
On a simple operation strategy
A greedy algorithm is an algorithm that always takes the best immediate, or local, solution while
finding an answer. Greedy algorithms find the overall, or globally, the optimal solution for some
optimization problems, but may find less-than-optimal solutions for some instances of other
problems. In the context of residential BESSs, a greedy algorithm follows the logic of storing any
surplus solar power provided as soon as possible and providing any available energy from the
storage as soon as there is a lack of solar power. The algorithm is simple as follows
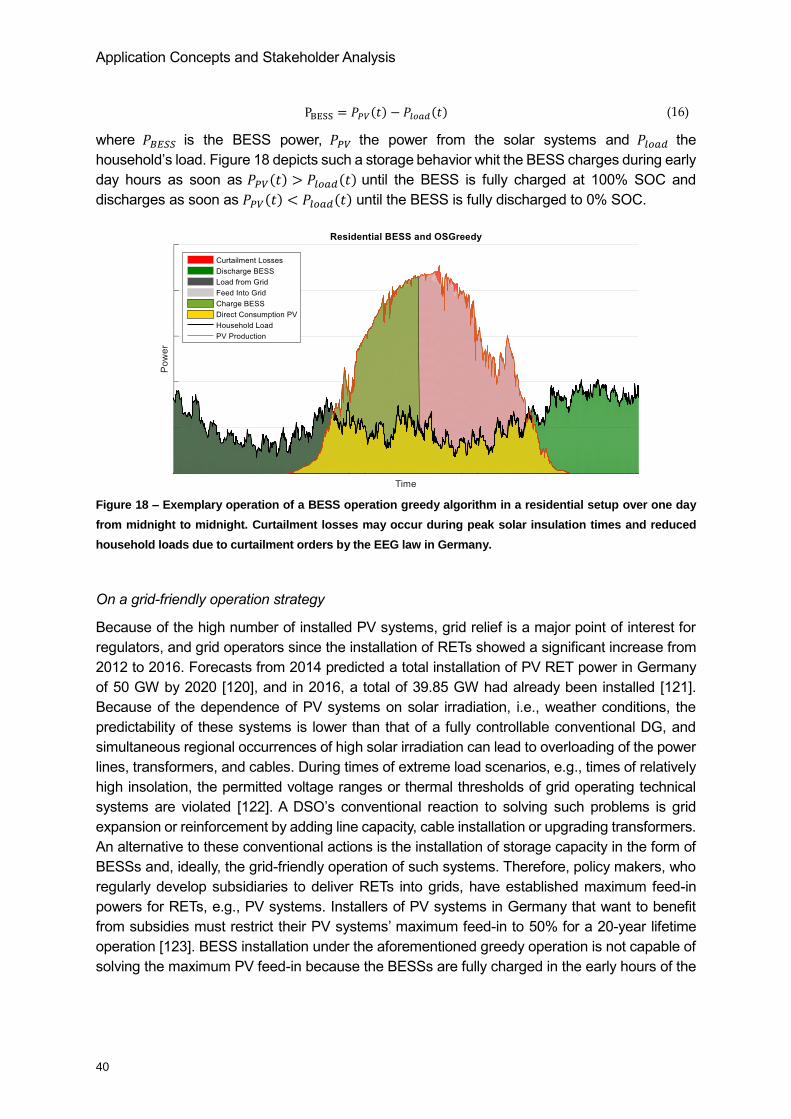
Application Concepts and Stakeholder Analysis
40
PBESS = 𝑃𝑃𝑉(𝑡) − 𝑃𝑙𝑜𝑎𝑑(𝑡) (16)
where 𝑃𝐵𝐸𝑆𝑆 is the BESS power, 𝑃𝑃𝑉 the power from the solar systems and 𝑃𝑙𝑜𝑎𝑑 the
household’s load. Figure 18 depicts such a storage behavior whit the BESS charges during early
day hours as soon as 𝑃𝑃𝑉(𝑡) > 𝑃𝑙𝑜𝑎𝑑(𝑡) until the BESS is fully charged at 100% SOC and
discharges as soon as 𝑃𝑃𝑉(𝑡) < 𝑃𝑙𝑜𝑎𝑑(𝑡) until the BESS is fully discharged to 0% SOC.
Figure 18 – Exemplary operation of a BESS operation greedy algorithm in a residential setup over one day
from midnight to midnight. Curtailment losses may occur during peak solar insulation times and reduced
household loads due to curtailment orders by the EEG law in Germany.
On a grid-friendly operation strategy
Because of the high number of installed PV systems, grid relief is a major point of interest for
regulators, and grid operators since the installation of RETs showed a significant increase from
2012 to 2016. Forecasts from 2014 predicted a total installation of PV RET power in Germany
of 50 GW by 2020 [120], and in 2016, a total of 39.85 GW had already been installed [121].
Because of the dependence of PV systems on solar irradiation, i.e., weather conditions, the
predictability of these systems is lower than that of a fully controllable conventional DG, and
simultaneous regional occurrences of high solar irradiation can lead to overloading of the power
lines, transformers, and cables. During times of extreme load scenarios, e.g., times of relatively
high insolation, the permitted voltage ranges or thermal thresholds of grid operating technical
systems are violated [122]. A DSO’s conventional reaction to solving such problems is grid
expansion or reinforcement by adding line capacity, cable installation or upgrading transformers.
An alternative to these conventional actions is the installation of storage capacity in the form of
BESSs and, ideally, the grid-friendly operation of such systems. Therefore, policy makers, who
regularly develop subsidiaries to deliver RETs into grids, have established maximum feed-in
powers for RETs, e.g., PV systems. Installers of PV systems in Germany that want to benefit
from subsidies must restrict their PV systems’ maximum feed-in to 50% for a 20-year lifetime
operation [123]. BESS installation under the aforementioned greedy operation is not capable of
solving the maximum PV feed-in because the BESSs are fully charged in the early hours of the
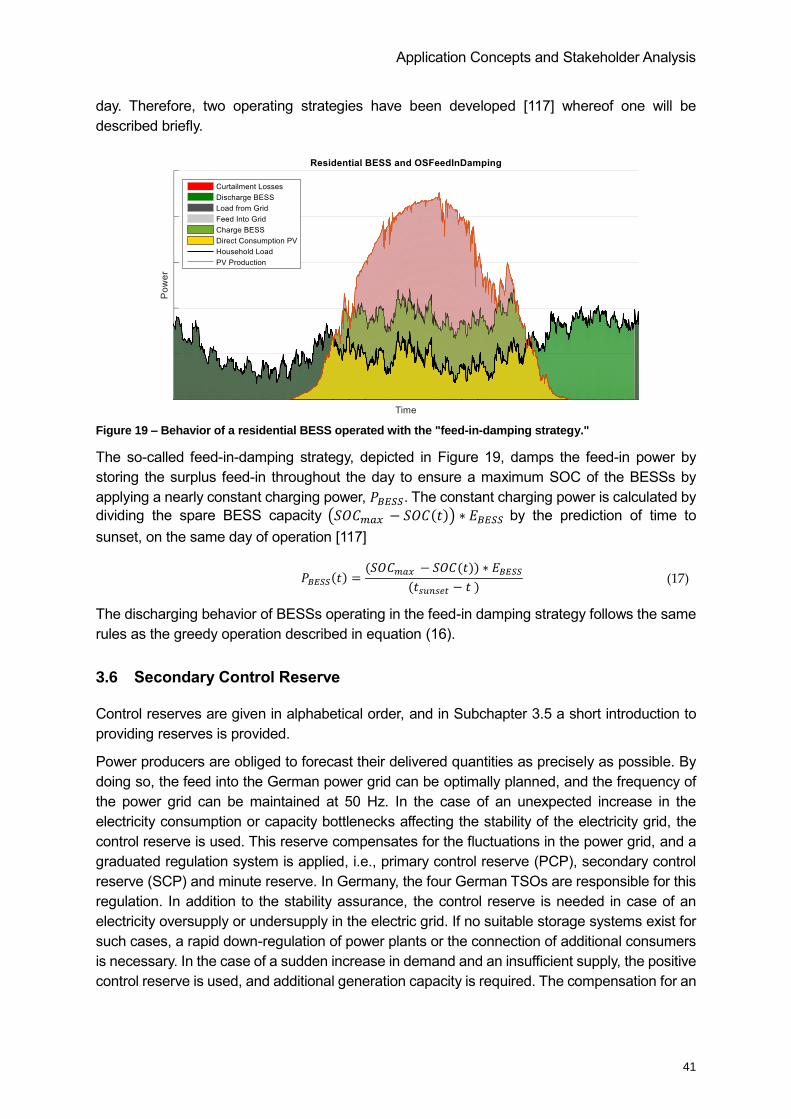
Application Concepts and Stakeholder Analysis
41
day. Therefore, two operating strategies have been developed [117] whereof one will be
described briefly.
Figure 19 – Behavior of a residential BESS operated with the "feed-in-damping strategy."
The so-called feed-in-damping strategy, depicted in Figure 19, damps the feed-in power by
storing the surplus feed-in throughout the day to ensure a maximum SOC of the BESSs by
applying a nearly constant charging power, 𝑃𝐵𝐸𝑆𝑆. The constant charging power is calculated by
dividing the spare BESS capacity (𝑆𝑂𝐶𝑚𝑎𝑥 − 𝑆𝑂𝐶(𝑡)) ∗ 𝐸𝐵𝐸𝑆𝑆 by the prediction of time to
sunset, on the same day of operation [117]
𝑃𝐵𝐸𝑆𝑆(𝑡) =(𝑆𝑂𝐶𝑚𝑎𝑥 − 𝑆𝑂𝐶(𝑡)) ∗ 𝐸𝐵𝐸𝑆𝑆
(𝑡𝑠𝑢𝑛𝑠𝑒𝑡 − 𝑡 ) (17)
The discharging behavior of BESSs operating in the feed-in damping strategy follows the same
rules as the greedy operation described in equation (16).
3.6 Secondary Control Reserve
Control reserves are given in alphabetical order, and in Subchapter 3.5 a short introduction to
providing reserves is provided.
Power producers are obliged to forecast their delivered quantities as precisely as possible. By
doing so, the feed into the German power grid can be optimally planned, and the frequency of
the power grid can be maintained at 50 Hz. In the case of an unexpected increase in the
electricity consumption or capacity bottlenecks affecting the stability of the electricity grid, the
control reserve is used. This reserve compensates for the fluctuations in the power grid, and a
graduated regulation system is applied, i.e., primary control reserve (PCP), secondary control
reserve (SCP) and minute reserve. In Germany, the four German TSOs are responsible for this
regulation. In addition to the stability assurance, the control reserve is needed in case of an
electricity oversupply or undersupply in the electric grid. If no suitable storage systems exist for
such cases, a rapid down-regulation of power plants or the connection of additional consumers
is necessary. In the case of a sudden increase in demand and an insufficient supply, the positive
control reserve is used, and additional generation capacity is required. The compensation for an
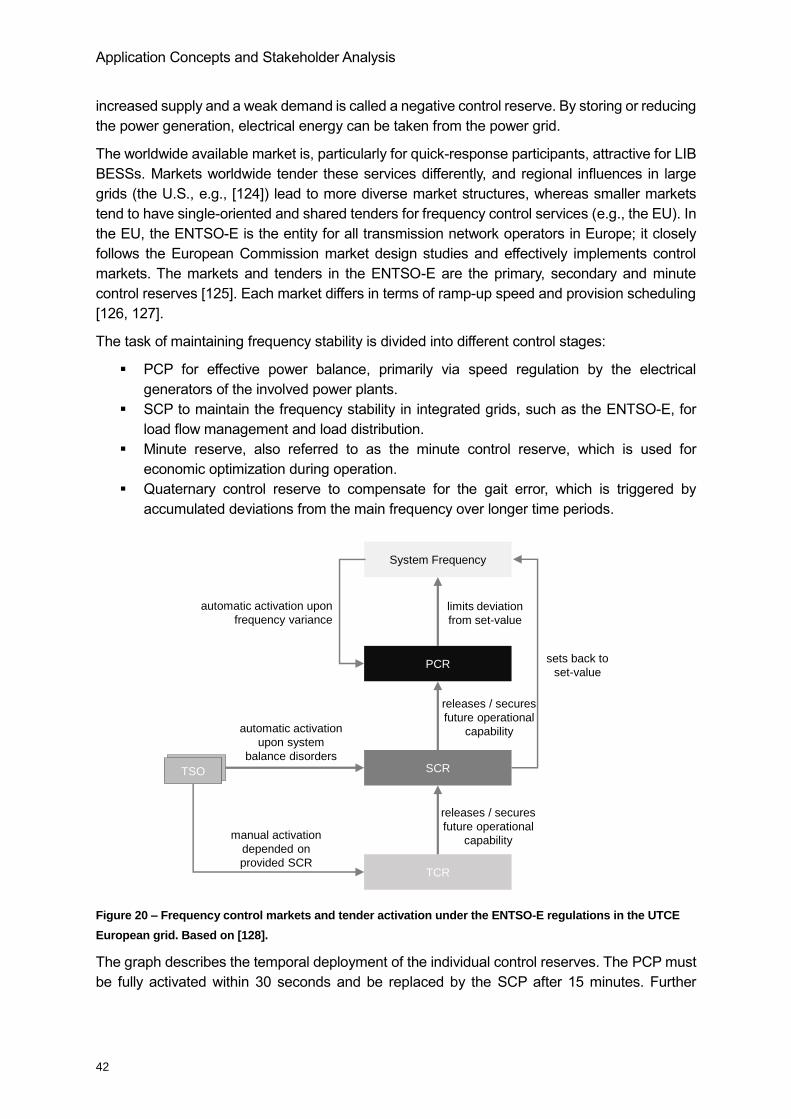
Application Concepts and Stakeholder Analysis
42
increased supply and a weak demand is called a negative control reserve. By storing or reducing
the power generation, electrical energy can be taken from the power grid.
The worldwide available market is, particularly for quick-response participants, attractive for LIB
BESSs. Markets worldwide tender these services differently, and regional influences in large
grids (the U.S., e.g., [124]) lead to more diverse market structures, whereas smaller markets
tend to have single-oriented and shared tenders for frequency control services (e.g., the EU). In
the EU, the ENTSO-E is the entity for all transmission network operators in Europe; it closely
follows the European Commission market design studies and effectively implements control
markets. The markets and tenders in the ENTSO-E are the primary, secondary and minute
control reserves [125]. Each market differs in terms of ramp-up speed and provision scheduling
[126, 127].
The task of maintaining frequency stability is divided into different control stages:
PCP for effective power balance, primarily via speed regulation by the electrical
generators of the involved power plants.
SCP to maintain the frequency stability in integrated grids, such as the ENTSO-E, for
load flow management and load distribution.
Minute reserve, also referred to as the minute control reserve, which is used for
economic optimization during operation.
Quaternary control reserve to compensate for the gait error, which is triggered by
accumulated deviations from the main frequency over longer time periods.
Figure 20 – Frequency control markets and tender activation under the ENTSO-E regulations in the UTCE
European grid. Based on [128].
The graph describes the temporal deployment of the individual control reserves. The PCP must
be fully activated within 30 seconds and be replaced by the SCP after 15 minutes. Further
System Frequency
PCR
SCR
TCR
ÜNBTSO
automatic activation upon
frequency variancelimits deviation
from set-value
sets back to
set-value
releases / secures
future operational
capabilityautomatic activation
upon system
balance disorders
manual activation
depended on
provided SCR
releases / secures
future operational
capability
Application Concepts and Stakeholder Analysis
43
support is subsequently provided by the minute control reserve, which is also called the minute
reserve. After approximately 60 minutes, a balanced load/current account balance should exist.
Similar to PCP, the provision of secondary control reserve/power (SCP) has an interesting
application for several markets worldwide; the SCP power and energy support the grid and the
physical balance between the energy consumption and production. Most markets differentiate
between PCP and SCP based on regional necessities. While PCP is provided independently of
the affected grid area grid-wide, SCP is only activated in the affected area. This strategy includes
the provision to connect the grid areas where SCP has been activated directly. SCP is mostly
justified by large amounts of renewable energies and imbalances in the grid. In Europe, SCP is
needed to balance high feed-in energies from wind farms. The amount of necessary SCP is
based on a comparison between the planned electricity consumption and production per grid
control area, and the actual power flows between the grid control areas. Depending on the
planned timetable for a grid control area and the real interexchange power between these and
the overall grid frequency, the needed power for SCP is estimated in an automated process by
the TSOs. Thus, the activation of SCP is automated, as is the activation of the systems providing
SCP. Similar to PCP, SCP has activation times and other requirements for prequalification. SCP
is offered in four different tenders: positive, negative, high tariff (HT) and low tariff (LT). The HT
period is from Monday to Friday between 8 AM and 8 PM, and the low tariff period is valid on
any holiday, weekend days and Monday to Friday between 8 PM and 8 AM. The prequalification
requirements must be proven to the TSO in the area the SCP providing system falls. In Germany,
for example, the minimum power requirement is 5 MW, which can also be offered by virtual
connecting smaller entities. SCP, in contrast to PCP, differentiates between positive and
negative control power in two different timeslots. Therefore, SCP is offered as four different
products. In general, BESSs are able to provide SCP; however, correct proof of work and layout
of the BESS topology must be designed accordingly [129]. Table 11 shows typical values for
BESS providing secondary control reserve, based on expert interviews, market design rules
[129, 130] and [106].
Table 13 - Characteristics of the APM SCP for BESS. Based on [106].
Parameter Value Unit
capacity 12 - 200 kWh
power 50 - 800 kW
cycles per year 400 n
DOC flat (refer to Figure 64)
mean SOC low / high (refer to Figure 64)
3.7 Tertiary Control Reserve
In addition to the PCP and SCP, the minute reserve (MCP), also called the minute control
reserve, is used to compensate for fluctuations in the German electricity grid. It is activated after
a lead time of 15 minutes. The MCR supports the electricity grid when the frequency drops
significantly below 50 Hz or rises above 50 Hz. MCR is classified as either "positive"
(compensation of power deficits) and "negative" (compensation of power surpluses) MCR.
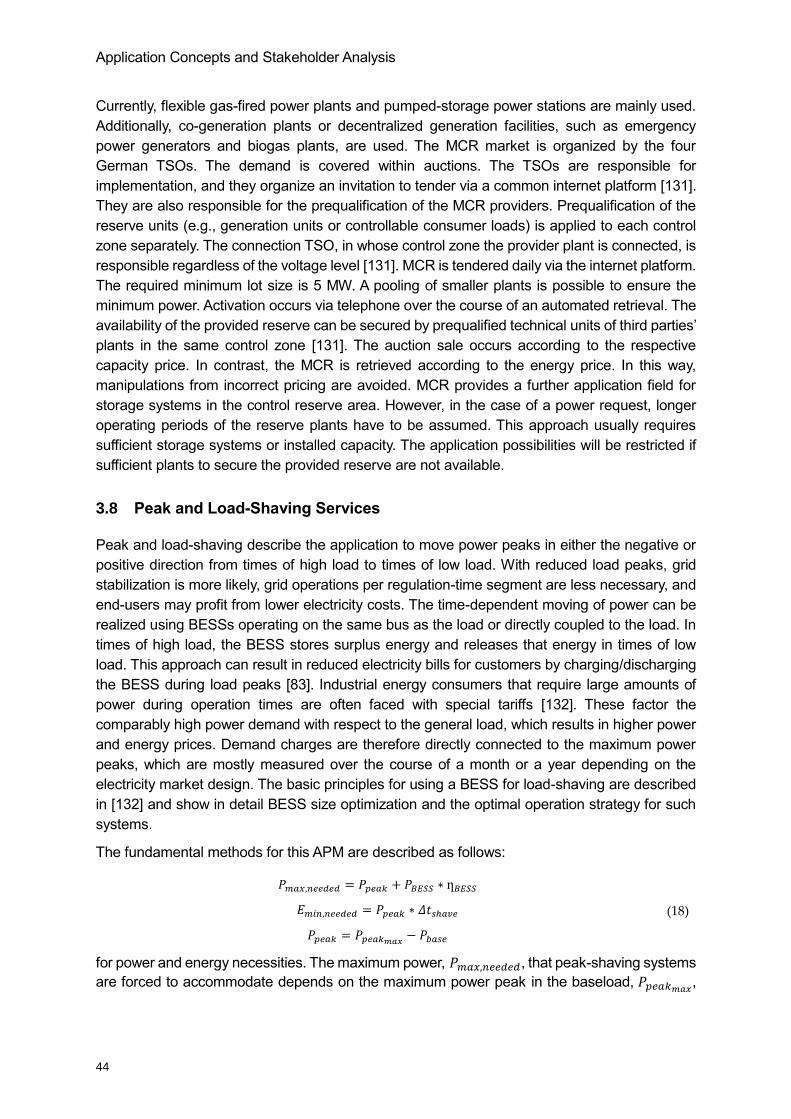
Application Concepts and Stakeholder Analysis
44
Currently, flexible gas-fired power plants and pumped-storage power stations are mainly used.
Additionally, co-generation plants or decentralized generation facilities, such as emergency
power generators and biogas plants, are used. The MCR market is organized by the four
German TSOs. The demand is covered within auctions. The TSOs are responsible for
implementation, and they organize an invitation to tender via a common internet platform [131].
They are also responsible for the prequalification of the MCR providers. Prequalification of the
reserve units (e.g., generation units or controllable consumer loads) is applied to each control
zone separately. The connection TSO, in whose control zone the provider plant is connected, is
responsible regardless of the voltage level [131]. MCR is tendered daily via the internet platform.
The required minimum lot size is 5 MW. A pooling of smaller plants is possible to ensure the
minimum power. Activation occurs via telephone over the course of an automated retrieval. The
availability of the provided reserve can be secured by prequalified technical units of third parties’
plants in the same control zone [131]. The auction sale occurs according to the respective
capacity price. In contrast, the MCR is retrieved according to the energy price. In this way,
manipulations from incorrect pricing are avoided. MCR provides a further application field for
storage systems in the control reserve area. However, in the case of a power request, longer
operating periods of the reserve plants have to be assumed. This approach usually requires
sufficient storage systems or installed capacity. The application possibilities will be restricted if
sufficient plants to secure the provided reserve are not available.
3.8 Peak and Load-Shaving Services
Peak and load-shaving describe the application to move power peaks in either the negative or
positive direction from times of high load to times of low load. With reduced load peaks, grid
stabilization is more likely, grid operations per regulation-time segment are less necessary, and
end-users may profit from lower electricity costs. The time-dependent moving of power can be
realized using BESSs operating on the same bus as the load or directly coupled to the load. In
times of high load, the BESS stores surplus energy and releases that energy in times of low
load. This approach can result in reduced electricity bills for customers by charging/discharging
the BESS during load peaks [83]. Industrial energy consumers that require large amounts of
power during operation times are often faced with special tariffs [132]. These factor the
comparably high power demand with respect to the general load, which results in higher power
and energy prices. Demand charges are therefore directly connected to the maximum power
peaks, which are mostly measured over the course of a month or a year depending on the
electricity market design. The basic principles for using a BESS for load-shaving are described
in [132] and show in detail BESS size optimization and the optimal operation strategy for such
systems.
The fundamental methods for this APM are described as follows:
𝑃𝑚𝑎𝑥,𝑛𝑒𝑒𝑑𝑒𝑑 = 𝑃𝑝𝑒𝑎𝑘 + 𝑃𝐵𝐸𝑆𝑆 ∗ ƞ𝐵𝐸𝑆𝑆
𝐸𝑚𝑖𝑛,𝑛𝑒𝑒𝑑𝑒𝑑 = 𝑃𝑝𝑒𝑎𝑘 ∗ 𝛥𝑡𝑠ℎ𝑎𝑣𝑒
𝑃𝑝𝑒𝑎𝑘 = 𝑃𝑝𝑒𝑎𝑘𝑚𝑎𝑥 − 𝑃𝑏𝑎𝑠𝑒
(18)
for power and energy necessities. The maximum power, 𝑃𝑚𝑎𝑥,𝑛𝑒𝑒𝑑𝑒𝑑, that peak-shaving systems
are forced to accommodate depends on the maximum power peak in the baseload, 𝑃𝑝𝑒𝑎𝑘𝑚𝑎𝑥,
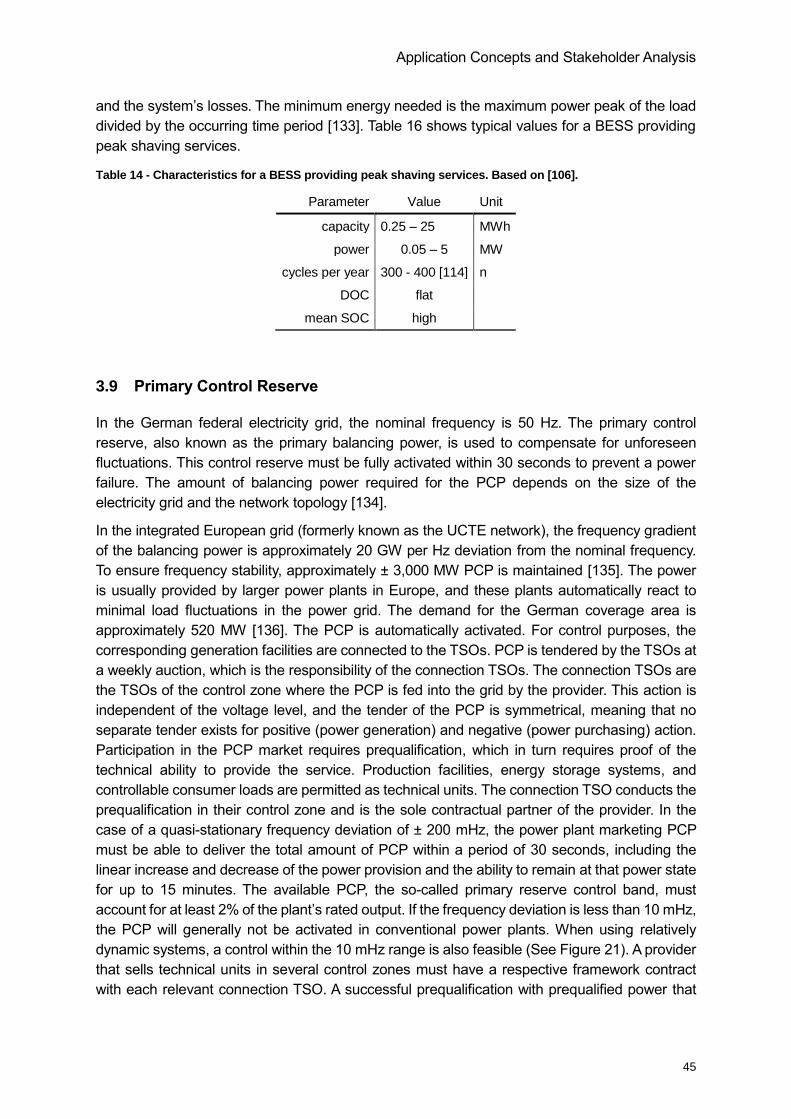
Application Concepts and Stakeholder Analysis
45
and the system’s losses. The minimum energy needed is the maximum power peak of the load
divided by the occurring time period [133]. Table 16 shows typical values for a BESS providing
peak shaving services.
Table 14 - Characteristics for a BESS providing peak shaving services. Based on [106].
Parameter Value Unit
capacity 0.25 – 25 MWh
power 0.05 – 5 MW
cycles per year 300 - 400 [114] n
DOC flat
mean SOC high
3.9 Primary Control Reserve
In the German federal electricity grid, the nominal frequency is 50 Hz. The primary control
reserve, also known as the primary balancing power, is used to compensate for unforeseen
fluctuations. This control reserve must be fully activated within 30 seconds to prevent a power
failure. The amount of balancing power required for the PCP depends on the size of the
electricity grid and the network topology [134].
In the integrated European grid (formerly known as the UCTE network), the frequency gradient
of the balancing power is approximately 20 GW per Hz deviation from the nominal frequency.
To ensure frequency stability, approximately ± 3,000 MW PCP is maintained [135]. The power
is usually provided by larger power plants in Europe, and these plants automatically react to
minimal load fluctuations in the power grid. The demand for the German coverage area is
approximately 520 MW [136]. The PCP is automatically activated. For control purposes, the
corresponding generation facilities are connected to the TSOs. PCP is tendered by the TSOs at
a weekly auction, which is the responsibility of the connection TSOs. The connection TSOs are
the TSOs of the control zone where the PCP is fed into the grid by the provider. This action is
independent of the voltage level, and the tender of the PCP is symmetrical, meaning that no
separate tender exists for positive (power generation) and negative (power purchasing) action.
Participation in the PCP market requires prequalification, which in turn requires proof of the
technical ability to provide the service. Production facilities, energy storage systems, and
controllable consumer loads are permitted as technical units. The connection TSO conducts the
prequalification in their control zone and is the sole contractual partner of the provider. In the
case of a quasi-stationary frequency deviation of ± 200 mHz, the power plant marketing PCP
must be able to deliver the total amount of PCP within a period of 30 seconds, including the
linear increase and decrease of the power provision and the ability to remain at that power state
for up to 15 minutes. The available PCP, the so-called primary reserve control band, must
account for at least 2% of the plant’s rated output. If the frequency deviation is less than 10 mHz,
the PCP will generally not be activated in conventional power plants. When using relatively
dynamic systems, a control within the 10 mHz range is also feasible (See Figure 21). A provider
that sells technical units in several control zones must have a respective framework contract
with each relevant connection TSO. A successful prequalification with prequalified power that
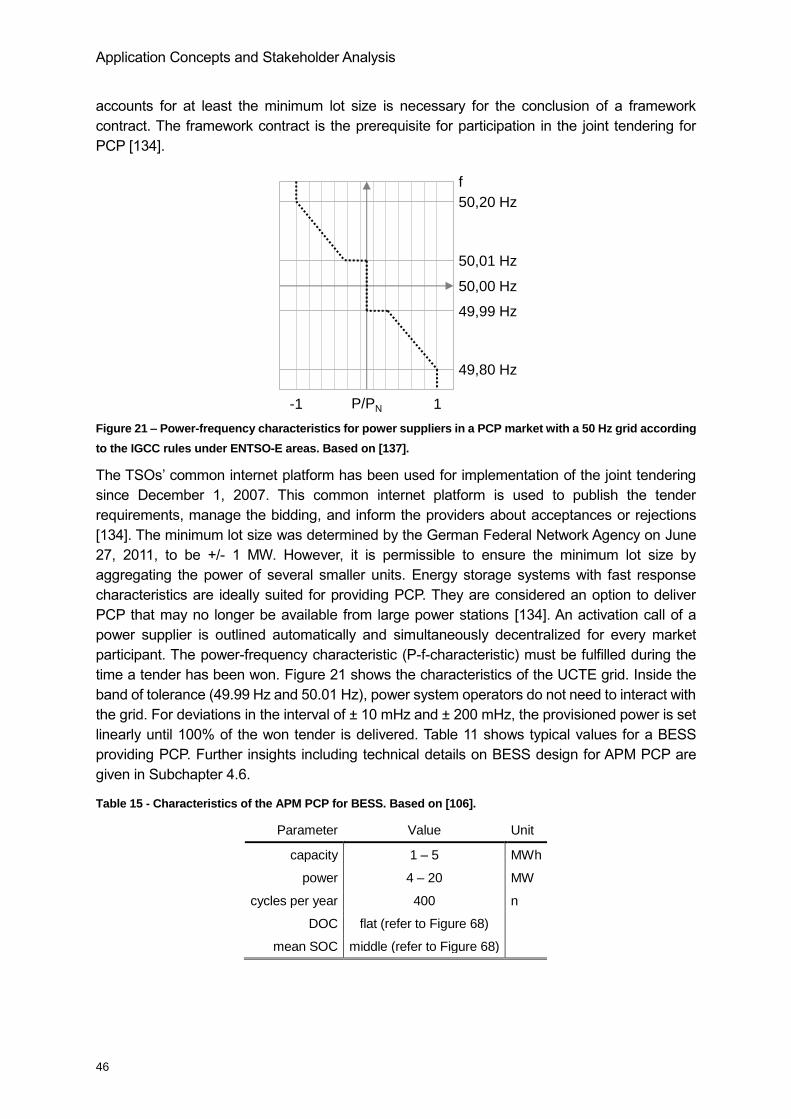
Application Concepts and Stakeholder Analysis
46
accounts for at least the minimum lot size is necessary for the conclusion of a framework
contract. The framework contract is the prerequisite for participation in the joint tendering for
PCP [134].
Figure 21 – Power-frequency characteristics for power suppliers in a PCP market with a 50 Hz grid according
to the IGCC rules under ENTSO-E areas. Based on [137].
The TSOs’ common internet platform has been used for implementation of the joint tendering
since December 1, 2007. This common internet platform is used to publish the tender
requirements, manage the bidding, and inform the providers about acceptances or rejections
[134]. The minimum lot size was determined by the German Federal Network Agency on June
27, 2011, to be +/- 1 MW. However, it is permissible to ensure the minimum lot size by
aggregating the power of several smaller units. Energy storage systems with fast response
characteristics are ideally suited for providing PCP. They are considered an option to deliver
PCP that may no longer be available from large power stations [134]. An activation call of a
power supplier is outlined automatically and simultaneously decentralized for every market
participant. The power-frequency characteristic (P-f-characteristic) must be fulfilled during the
time a tender has been won. Figure 21 shows the characteristics of the UCTE grid. Inside the
band of tolerance (49.99 Hz and 50.01 Hz), power system operators do not need to interact with
the grid. For deviations in the interval of ± 10 mHz and ± 200 mHz, the provisioned power is set
linearly until 100% of the won tender is delivered. Table 11 shows typical values for a BESS
providing PCP. Further insights including technical details on BESS design for APM PCP are
given in Subchapter 4.6.
Table 15 - Characteristics of the APM PCP for BESS. Based on [106].
Parameter Value Unit
capacity 1 – 5 MWh
power 4 – 20 MW
cycles per year 400 n
DOC flat (refer to Figure 68)
mean SOC middle (refer to Figure 68)
f
P/PN
50,20 Hz
50,01 Hz
49,99 Hz
49,80 Hz
1-1
50,00 Hz
Application Concepts and Stakeholder Analysis
47
3.10 Uninterruptable Power Supply
Using BESSs for uninterrupted power supplies (UPS) is a common application. A BESS serving
as a UPS is connected to crucial grid nodes, small island grids, or off-grid systems to either
buffer frequency flickers and disturbances or to provide emergency power for blackouts of
several minutes to a few hours [138, 139]. Because of the current nature of the UPS system,
lead-acid batteries are the primary market participant. The worldwide markets differ significantly
concerning UPS systems. The European electricity grid and the UCTE area show downtimes or
grid failure times of less than an hour per year. When translated into BESS behavior, such a
system shows the highest SOCs during its lifetime with a few flat cycles per year. Therefore,
they are equipped and outlined by relatively cheap lead-acid BESS systems [138, 139]. Table
16 shows typical values for a BESS providing UPS. Capacity and power data based on a
benchmark system by the company MTU Onsite Energy GmbH [106].
Table 16 - Characteristics of the APM UPS for BESS. Based on [106].
Parameter Value Unit
capacity 0.05 – 1.65 MWh
power 0.05 – 1.65 MW
cycles per year 2 [114] n
DOC flat
mean SOC high
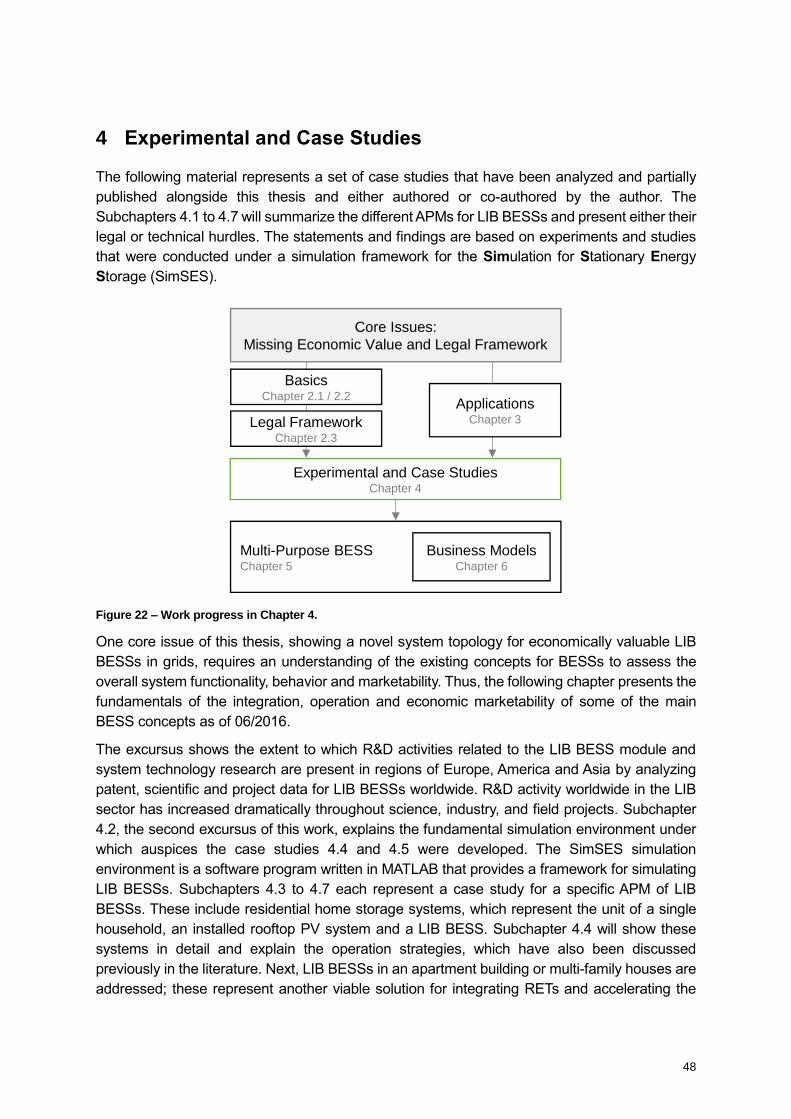
48
4 Experimental and Case Studies
The following material represents a set of case studies that have been analyzed and partially
published alongside this thesis and either authored or co-authored by the author. The
Subchapters 4.1 to 4.7 will summarize the different APMs for LIB BESSs and present either their
legal or technical hurdles. The statements and findings are based on experiments and studies
that were conducted under a simulation framework for the Simulation for Stationary Energy
Storage (SimSES).
Figure 22 – Work progress in Chapter 4.
One core issue of this thesis, showing a novel system topology for economically valuable LIB
BESSs in grids, requires an understanding of the existing concepts for BESSs to assess the
overall system functionality, behavior and marketability. Thus, the following chapter presents the
fundamentals of the integration, operation and economic marketability of some of the main
BESS concepts as of 06/2016.
The excursus shows the extent to which R&D activities related to the LIB BESS module and
system technology research are present in regions of Europe, America and Asia by analyzing
patent, scientific and project data for LIB BESSs worldwide. R&D activity worldwide in the LIB
sector has increased dramatically throughout science, industry, and field projects. Subchapter
4.2, the second excursus of this work, explains the fundamental simulation environment under
which auspices the case studies 4.4 and 4.5 were developed. The SimSES simulation
environment is a software program written in MATLAB that provides a framework for simulating
LIB BESSs. Subchapters 4.3 to 4.7 each represent a case study for a specific APM of LIB
BESSs. These include residential home storage systems, which represent the unit of a single
household, an installed rooftop PV system and a LIB BESS. Subchapter 4.4 will show these
systems in detail and explain the operation strategies, which have also been discussed
previously in the literature. Next, LIB BESSs in an apartment building or multi-family houses are
addressed; these represent another viable solution for integrating RETs and accelerating the
Core Issues:
Missing Economic Value and Legal Framework
Legal FrameworkChapter 2.3
Experimental and Case StudiesChapter 4
Multi-Purpose BESSChapter 5
Business ModelsChapter 6
ApplicationsChapter 3
BasicsChapter 2.1 / 2.2
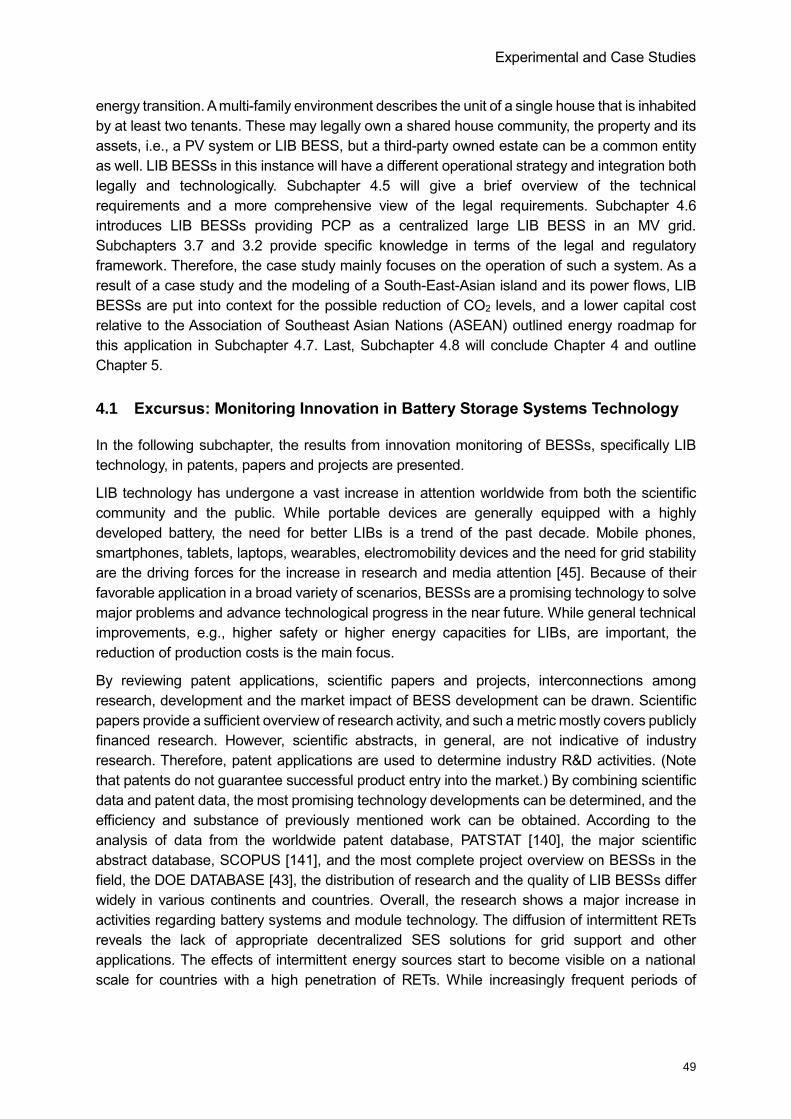
Experimental and Case Studies
49
energy transition. A multi-family environment describes the unit of a single house that is inhabited
by at least two tenants. These may legally own a shared house community, the property and its
assets, i.e., a PV system or LIB BESS, but a third-party owned estate can be a common entity
as well. LIB BESSs in this instance will have a different operational strategy and integration both
legally and technologically. Subchapter 4.5 will give a brief overview of the technical
requirements and a more comprehensive view of the legal requirements. Subchapter 4.6
introduces LIB BESSs providing PCP as a centralized large LIB BESS in an MV grid.
Subchapters 3.7 and 3.2 provide specific knowledge in terms of the legal and regulatory
framework. Therefore, the case study mainly focuses on the operation of such a system. As a
result of a case study and the modeling of a South-East-Asian island and its power flows, LIB
BESSs are put into context for the possible reduction of CO2 levels, and a lower capital cost
relative to the Association of Southeast Asian Nations (ASEAN) outlined energy roadmap for
this application in Subchapter 4.7. Last, Subchapter 4.8 will conclude Chapter 4 and outline
Chapter 5.
4.1 Excursus: Monitoring Innovation in Battery Storage Systems Technology
In the following subchapter, the results from innovation monitoring of BESSs, specifically LIB
technology, in patents, papers and projects are presented.
LIB technology has undergone a vast increase in attention worldwide from both the scientific
community and the public. While portable devices are generally equipped with a highly
developed battery, the need for better LIBs is a trend of the past decade. Mobile phones,
smartphones, tablets, laptops, wearables, electromobility devices and the need for grid stability
are the driving forces for the increase in research and media attention [45]. Because of their
favorable application in a broad variety of scenarios, BESSs are a promising technology to solve
major problems and advance technological progress in the near future. While general technical
improvements, e.g., higher safety or higher energy capacities for LIBs, are important, the
reduction of production costs is the main focus.
By reviewing patent applications, scientific papers and projects, interconnections among
research, development and the market impact of BESS development can be drawn. Scientific
papers provide a sufficient overview of research activity, and such a metric mostly covers publicly
financed research. However, scientific abstracts, in general, are not indicative of industry
research. Therefore, patent applications are used to determine industry R&D activities. (Note
that patents do not guarantee successful product entry into the market.) By combining scientific
data and patent data, the most promising technology developments can be determined, and the
efficiency and substance of previously mentioned work can be obtained. According to the
analysis of data from the worldwide patent database, PATSTAT [140], the major scientific
abstract database, SCOPUS [141], and the most complete project overview on BESSs in the
field, the DOE DATABASE [43], the distribution of research and the quality of LIB BESSs differ
widely in various continents and countries. Overall, the research shows a major increase in
activities regarding battery systems and module technology. The diffusion of intermittent RETs
reveals the lack of appropriate decentralized SES solutions for grid support and other
applications. The effects of intermittent energy sources start to become visible on a national
scale for countries with a high penetration of RETs. While increasingly frequent periods of
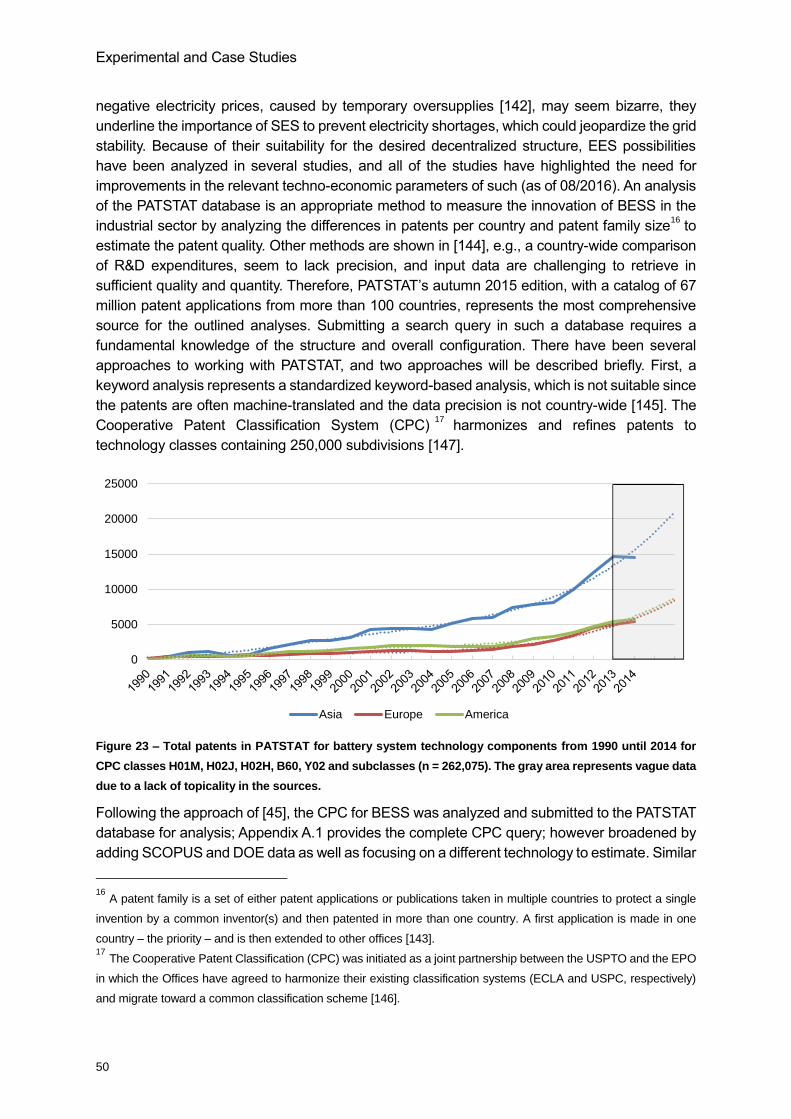
Experimental and Case Studies
50
negative electricity prices, caused by temporary oversupplies [142], may seem bizarre, they
underline the importance of SES to prevent electricity shortages, which could jeopardize the grid
stability. Because of their suitability for the desired decentralized structure, EES possibilities
have been analyzed in several studies, and all of the studies have highlighted the need for
improvements in the relevant techno-economic parameters of such (as of 08/2016). An analysis
of the PATSTAT database is an appropriate method to measure the innovation of BESS in the
industrial sector by analyzing the differences in patents per country and patent family size16
to
estimate the patent quality. Other methods are shown in [144], e.g., a country-wide comparison
of R&D expenditures, seem to lack precision, and input data are challenging to retrieve in
sufficient quality and quantity. Therefore, PATSTAT’s autumn 2015 edition, with a catalog of 67
million patent applications from more than 100 countries, represents the most comprehensive
source for the outlined analyses. Submitting a search query in such a database requires a
fundamental knowledge of the structure and overall configuration. There have been several
approaches to working with PATSTAT, and two approaches will be described briefly. First, a
keyword analysis represents a standardized keyword-based analysis, which is not suitable since
the patents are often machine-translated and the data precision is not country-wide [145]. The
Cooperative Patent Classification System (CPC)17
harmonizes and refines patents to
technology classes containing 250,000 subdivisions [147].
Figure 23 – Total patents in PATSTAT for battery system technology components from 1990 until 2014 for
CPC classes H01M, H02J, H02H, B60, Y02 and subclasses (n = 262,075). The gray area represents vague data
due to a lack of topicality in the sources.
Following the approach of [45], the CPC for BESS was analyzed and submitted to the PATSTAT
database for analysis; Appendix A.1 provides the complete CPC query; however broadened by
adding SCOPUS and DOE data as well as focusing on a different technology to estimate. Similar
16
A patent family is a set of either patent applications or publications taken in multiple countries to protect a single
invention by a common inventor(s) and then patented in more than one country. A first application is made in one
country – the priority – and is then extended to other offices [143]. 17
The Cooperative Patent Classification (CPC) was initiated as a joint partnership between the USPTO and the EPO
in which the Offices have agreed to harmonize their existing classification systems (ECLA and USPC, respectively)
and migrate toward a common classification scheme [146].
0
5000
10000
15000
20000
25000
Asia Europe America
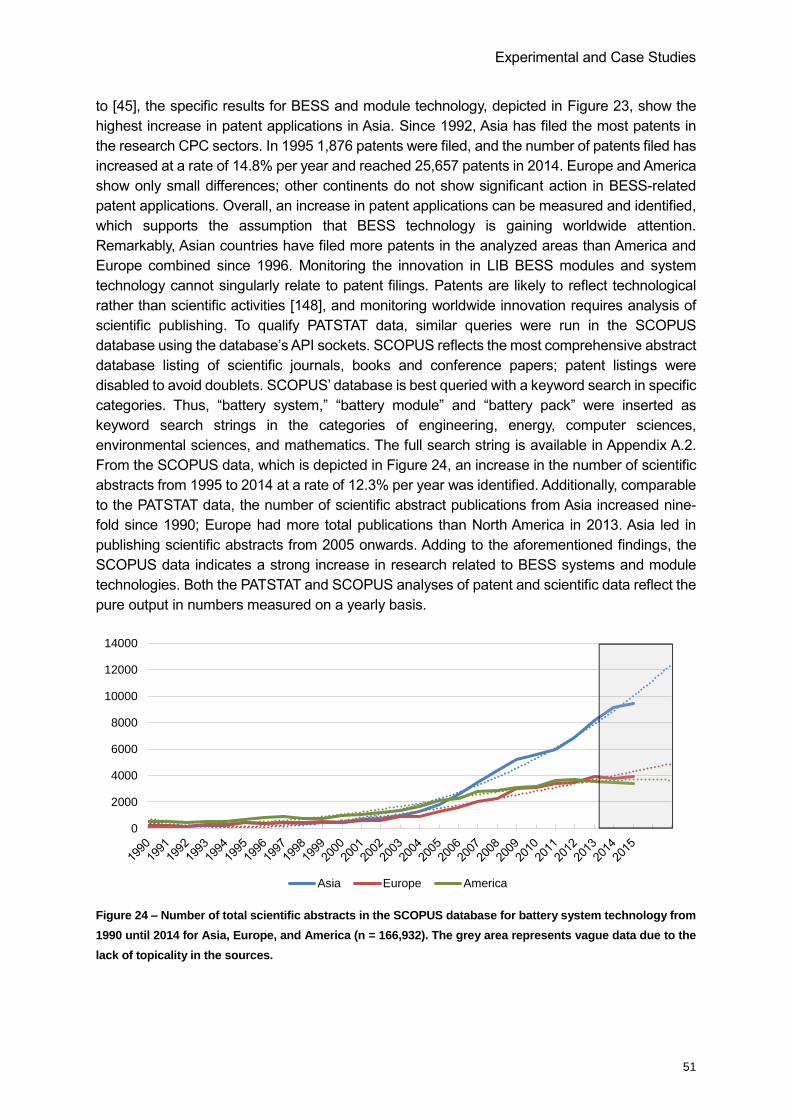
Experimental and Case Studies
51
to [45], the specific results for BESS and module technology, depicted in Figure 23, show the
highest increase in patent applications in Asia. Since 1992, Asia has filed the most patents in
the research CPC sectors. In 1995 1,876 patents were filed, and the number of patents filed has
increased at a rate of 14.8% per year and reached 25,657 patents in 2014. Europe and America
show only small differences; other continents do not show significant action in BESS-related
patent applications. Overall, an increase in patent applications can be measured and identified,
which supports the assumption that BESS technology is gaining worldwide attention.
Remarkably, Asian countries have filed more patents in the analyzed areas than America and
Europe combined since 1996. Monitoring the innovation in LIB BESS modules and system
technology cannot singularly relate to patent filings. Patents are likely to reflect technological
rather than scientific activities [148], and monitoring worldwide innovation requires analysis of
scientific publishing. To qualify PATSTAT data, similar queries were run in the SCOPUS
database using the database’s API sockets. SCOPUS reflects the most comprehensive abstract
database listing of scientific journals, books and conference papers; patent listings were
disabled to avoid doublets. SCOPUS’ database is best queried with a keyword search in specific
categories. Thus, “battery system,” “battery module” and “battery pack” were inserted as
keyword search strings in the categories of engineering, energy, computer sciences,
environmental sciences, and mathematics. The full search string is available in Appendix A.2.
From the SCOPUS data, which is depicted in Figure 24, an increase in the number of scientific
abstracts from 1995 to 2014 at a rate of 12.3% per year was identified. Additionally, comparable
to the PATSTAT data, the number of scientific abstract publications from Asia increased nine-
fold since 1990; Europe had more total publications than North America in 2013. Asia led in
publishing scientific abstracts from 2005 onwards. Adding to the aforementioned findings, the
SCOPUS data indicates a strong increase in research related to BESS systems and module
technologies. Both the PATSTAT and SCOPUS analyses of patent and scientific data reflect the
pure output in numbers measured on a yearly basis.
Figure 24 – Number of total scientific abstracts in the SCOPUS database for battery system technology from
1990 until 2014 for Asia, Europe, and America (n = 166,932). The grey area represents vague data due to the
lack of topicality in the sources.
0
2000
4000
6000
8000
10000
12000
14000
Asia Europe America
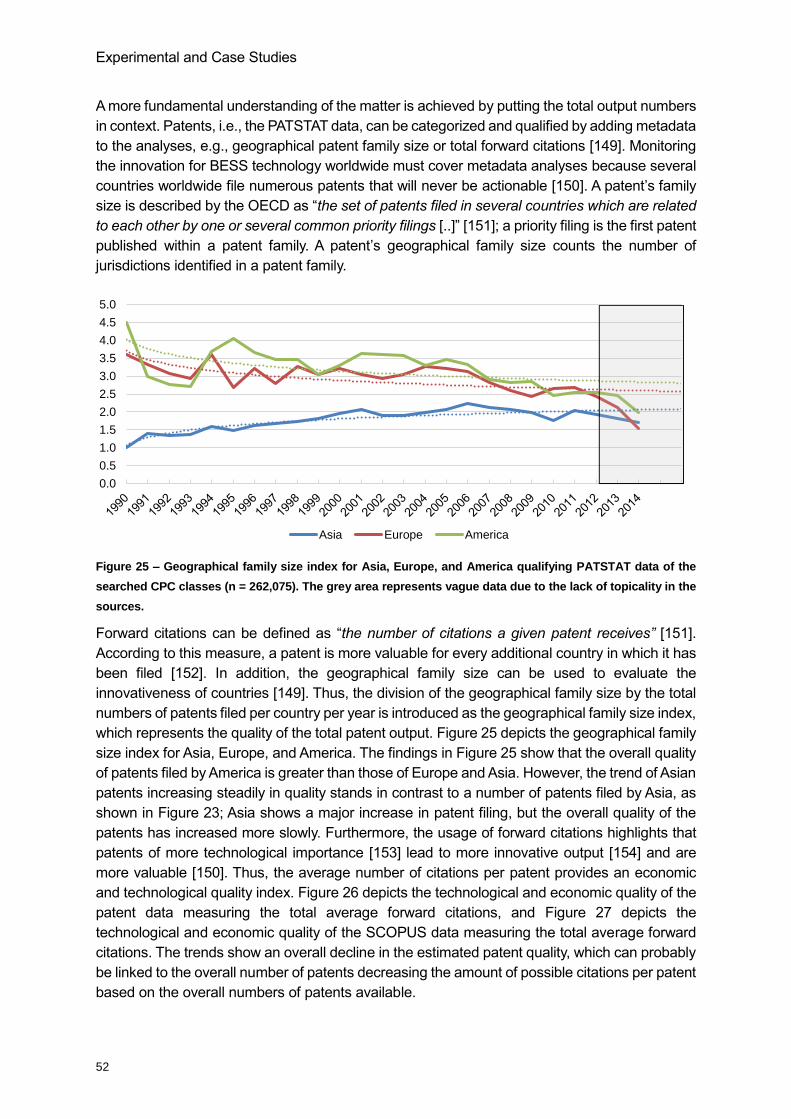
Experimental and Case Studies
52
A more fundamental understanding of the matter is achieved by putting the total output numbers
in context. Patents, i.e., the PATSTAT data, can be categorized and qualified by adding metadata
to the analyses, e.g., geographical patent family size or total forward citations [149]. Monitoring
the innovation for BESS technology worldwide must cover metadata analyses because several
countries worldwide file numerous patents that will never be actionable [150]. A patent’s family
size is described by the OECD as “the set of patents filed in several countries which are related
to each other by one or several common priority filings [..]” [151]; a priority filing is the first patent
published within a patent family. A patent’s geographical family size counts the number of
jurisdictions identified in a patent family.
Figure 25 – Geographical family size index for Asia, Europe, and America qualifying PATSTAT data of the
searched CPC classes (n = 262,075). The grey area represents vague data due to the lack of topicality in the
sources.
Forward citations can be defined as “the number of citations a given patent receives” [151].
According to this measure, a patent is more valuable for every additional country in which it has
been filed [152]. In addition, the geographical family size can be used to evaluate the
innovativeness of countries [149]. Thus, the division of the geographical family size by the total
numbers of patents filed per country per year is introduced as the geographical family size index,
which represents the quality of the total patent output. Figure 25 depicts the geographical family
size index for Asia, Europe, and America. The findings in Figure 25 show that the overall quality
of patents filed by America is greater than those of Europe and Asia. However, the trend of Asian
patents increasing steadily in quality stands in contrast to a number of patents filed by Asia, as
shown in Figure 23; Asia shows a major increase in patent filing, but the overall quality of the
patents has increased more slowly. Furthermore, the usage of forward citations highlights that
patents of more technological importance [153] lead to more innovative output [154] and are
more valuable [150]. Thus, the average number of citations per patent provides an economic
and technological quality index. Figure 26 depicts the technological and economic quality of the
patent data measuring the total average forward citations, and Figure 27 depicts the
technological and economic quality of the SCOPUS data measuring the total average forward
citations. The trends show an overall decline in the estimated patent quality, which can probably
be linked to the overall number of patents decreasing the amount of possible citations per patent
based on the overall numbers of patents available.
0.0
0.5
1.0
1.5
2.0
2.5
3.0
3.5
4.0
4.5
5.0
Asia Europe America
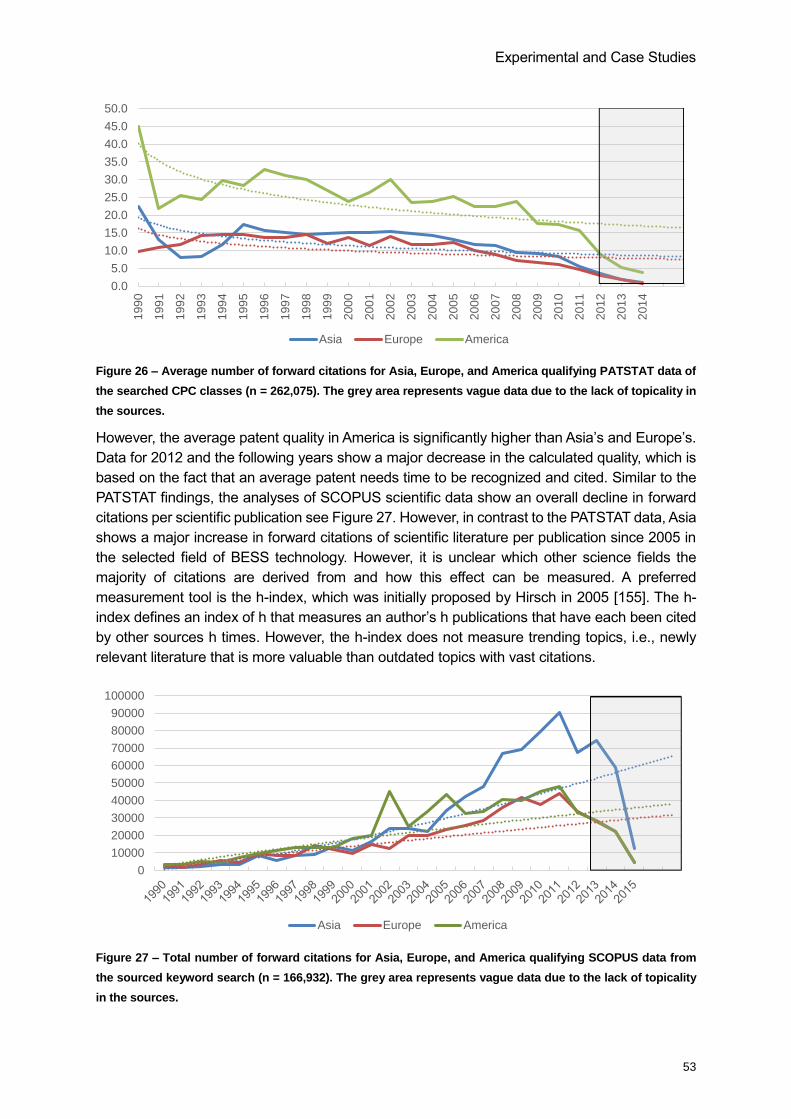
Experimental and Case Studies
53
Figure 26 – Average number of forward citations for Asia, Europe, and America qualifying PATSTAT data of
the searched CPC classes (n = 262,075). The grey area represents vague data due to the lack of topicality in
the sources.
However, the average patent quality in America is significantly higher than Asia’s and Europe’s.
Data for 2012 and the following years show a major decrease in the calculated quality, which is
based on the fact that an average patent needs time to be recognized and cited. Similar to the
PATSTAT findings, the analyses of SCOPUS scientific data show an overall decline in forward
citations per scientific publication see Figure 27. However, in contrast to the PATSTAT data, Asia
shows a major increase in forward citations of scientific literature per publication since 2005 in
the selected field of BESS technology. However, it is unclear which other science fields the
majority of citations are derived from and how this effect can be measured. A preferred
measurement tool is the h-index, which was initially proposed by Hirsch in 2005 [155]. The h-
index defines an index of h that measures an author’s h publications that have each been cited
by other sources h times. However, the h-index does not measure trending topics, i.e., newly
relevant literature that is more valuable than outdated topics with vast citations.
Figure 27 – Total number of forward citations for Asia, Europe, and America qualifying SCOPUS data from
the sourced keyword search (n = 166,932). The grey area represents vague data due to the lack of topicality
in the sources.
0.0
5.0
10.0
15.0
20.0
25.0
30.0
35.0
40.0
45.0
50.0
199
0
199
1
199
2
199
3
199
4
199
5
199
6
199
7
199
8
199
9
200
0
200
1
200
2
200
3
200
4
200
5
200
6
200
7
200
8
200
9
201
0
201
1
201
2
201
3
201
4
Asia Europe America
0
10000
20000
30000
40000
50000
60000
70000
80000
90000
100000
Asia Europe America
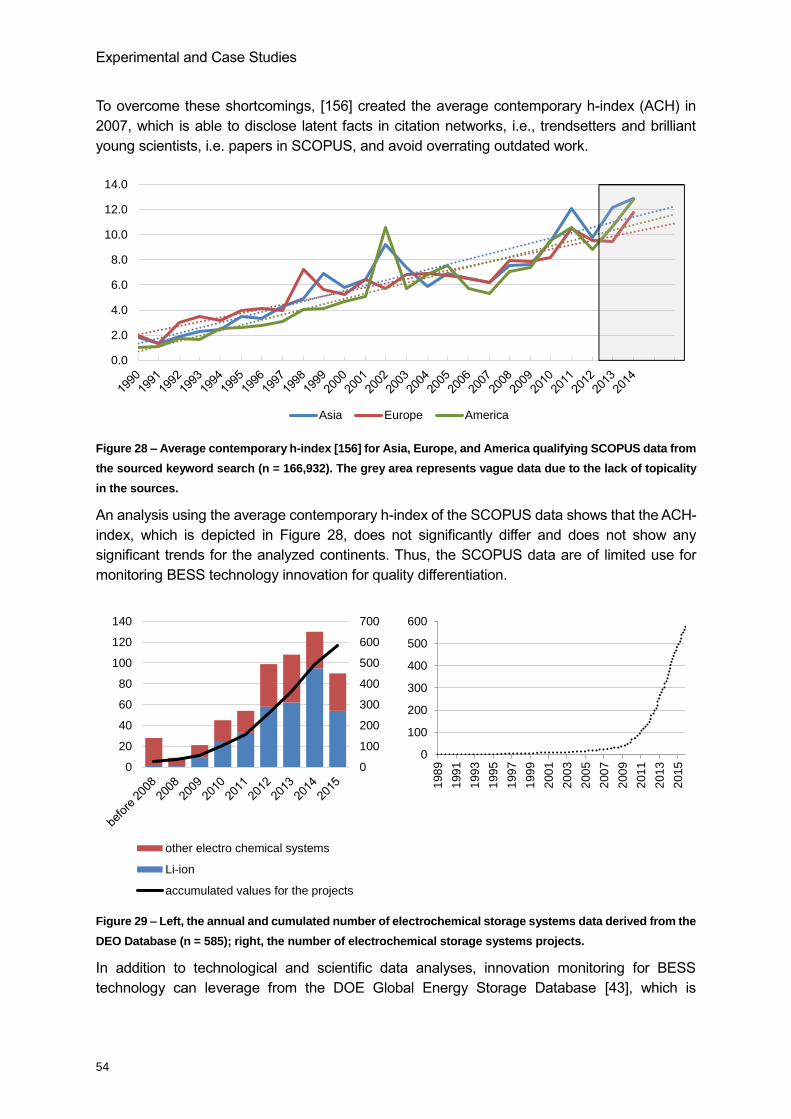
Experimental and Case Studies
54
To overcome these shortcomings, [156] created the average contemporary h-index (ACH) in
2007, which is able to disclose latent facts in citation networks, i.e., trendsetters and brilliant
young scientists, i.e. papers in SCOPUS, and avoid overrating outdated work.
Figure 28 – Average contemporary h-index [156] for Asia, Europe, and America qualifying SCOPUS data from
the sourced keyword search (n = 166,932). The grey area represents vague data due to the lack of topicality
in the sources.
An analysis using the average contemporary h-index of the SCOPUS data shows that the ACH-
index, which is depicted in Figure 28, does not significantly differ and does not show any
significant trends for the analyzed continents. Thus, the SCOPUS data are of limited use for
monitoring BESS technology innovation for quality differentiation.
Figure 29 – Left, the annual and cumulated number of electrochemical storage systems data derived from the
DEO Database (n = 585); right, the number of electrochemical storage systems projects.
In addition to technological and scientific data analyses, innovation monitoring for BESS
technology can leverage from the DOE Global Energy Storage Database [43], which is
0.0
2.0
4.0
6.0
8.0
10.0
12.0
14.0
Asia Europe America
0
100
200
300
400
500
600
700
0
20
40
60
80
100
120
140
other electro chemical systems
Li-ion
accumulated values for the projects
0
100
200
300
400
500
600
198
9
199
1
199
3
199
5
199
7
199
9
200
1
200
3
200
5
200
7
200
9
201
1
201
3
201
5
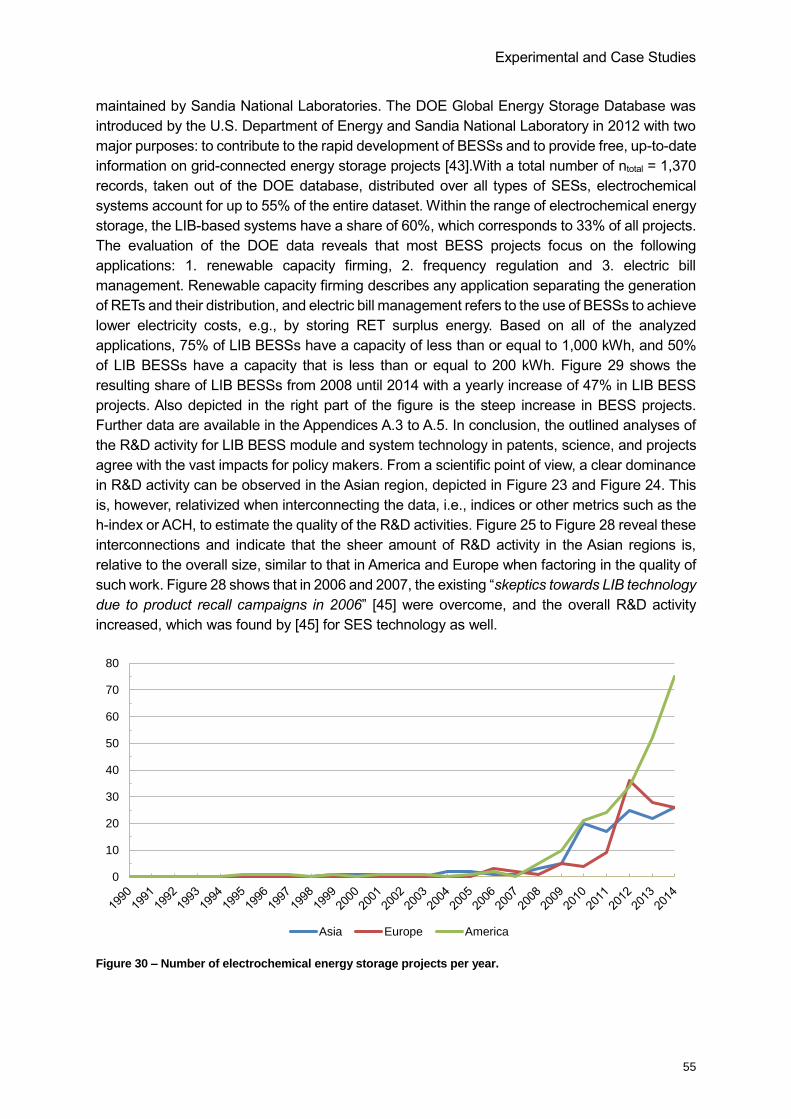
Experimental and Case Studies
55
maintained by Sandia National Laboratories. The DOE Global Energy Storage Database was
introduced by the U.S. Department of Energy and Sandia National Laboratory in 2012 with two
major purposes: to contribute to the rapid development of BESSs and to provide free, up-to-date
information on grid-connected energy storage projects [43].With a total number of ntotal = 1,370
records, taken out of the DOE database, distributed over all types of SESs, electrochemical
systems account for up to 55% of the entire dataset. Within the range of electrochemical energy
storage, the LIB-based systems have a share of 60%, which corresponds to 33% of all projects.
The evaluation of the DOE data reveals that most BESS projects focus on the following
applications: 1. renewable capacity firming, 2. frequency regulation and 3. electric bill
management. Renewable capacity firming describes any application separating the generation
of RETs and their distribution, and electric bill management refers to the use of BESSs to achieve
lower electricity costs, e.g., by storing RET surplus energy. Based on all of the analyzed
applications, 75% of LIB BESSs have a capacity of less than or equal to 1,000 kWh, and 50%
of LIB BESSs have a capacity that is less than or equal to 200 kWh. Figure 29 shows the
resulting share of LIB BESSs from 2008 until 2014 with a yearly increase of 47% in LIB BESS
projects. Also depicted in the right part of the figure is the steep increase in BESS projects.
Further data are available in the Appendices A.3 to A.5. In conclusion, the outlined analyses of
the R&D activity for LIB BESS module and system technology in patents, science, and projects
agree with the vast impacts for policy makers. From a scientific point of view, a clear dominance
in R&D activity can be observed in the Asian region, depicted in Figure 23 and Figure 24. This
is, however, relativized when interconnecting the data, i.e., indices or other metrics such as the
h-index or ACH, to estimate the quality of the R&D activities. Figure 25 to Figure 28 reveal these
interconnections and indicate that the sheer amount of R&D activity in the Asian regions is,
relative to the overall size, similar to that in America and Europe when factoring in the quality of
such work. Figure 28 shows that in 2006 and 2007, the existing “skeptics towards LIB technology
due to product recall campaigns in 2006” [45] were overcome, and the overall R&D activity
increased, which was found by [45] for SES technology as well.
Figure 30 – Number of electrochemical energy storage projects per year.
0
10
20
30
40
50
60
70
80
Asia Europe America
Experimental and Case Studies
56
While patent and scientific based data show similar tendencies for both, the overall quantity and
quality for all analyzed areas and the overall project implementations worldwide indicate a
different view. While America, Europe, and Asia started large LIB BESS project installations
simultaneously beginning in 2010, the continent of America, especially the U.S., almost doubled
their LIB BESS projects by late 2014, refer to Figure 30. Recent roll-outs of LIB BESSs under
competitive market processes, i.e. Tesla’s win of a 20 MW / 80 MWh LIB BESS request for
proposal as of 09/2016 [157], brought in context with the aforementioned resulting timeframes
of increased activity in research, papers and projects, from SCOPUS, PATSTAT and DOE data,
leads to the assumption that it takes a continent, or country, between three to six years from
R&D in science and industry to implement demonstrator systems and another four to eight years
to move from demonstration projects to economic, i.e. self-sustained business cases. This
timing can be especially important for further analyses regarding the specific timelines for R&D
funding, legal and regulatory action, and market building competitiveness for LIB systems,
empowering these to win open requests for proposal tenders and other markets.
4.2 Excursus: The Simulation Environment – SimSES
The software SimSES allows for a detailed techno-economic simulation and evaluation of SESs
with a current, main focus on LIB BESSs. Various application scenarios of SESs, such as self-
consumption maximization in households with PV systems, grid-supporting operation via peak
load reduction, provision of control reserve, arbitrage trading on the electricity market, or even
the combination of different applications, can be simulated. The simulation scenarios and the
technical components of the SES can be flexibly selected. The abstract energy storage model
of the modular and object-oriented software is one of the most important components, which
allows for the variation of different storage technologies. Furthermore, stress detection facilitates
the estimation of the degradation of the energy storage device. For this purpose, various aging
models can be used. However, detailed models are specifically developed for BESSs based on
aging experiments. To optimize the use of the EES in various applications, a large number of
operating strategies are implemented. In addition to the technical analysis for the calculation of
relevant key figures, an economic evaluation allows for an economic investigation of the
simulation results. The simulation tool SimSES has already been used in various publications
for the analysis of the application of "PV home energy storage" [26, 158] as well as "primary
control reserve" [137] and is currently being further developed. The medium-term objective is to
make the software available for further non-commercial use and development to the public. The
software is developed in MATLAB and Simulink in conjunction with vast amounts of experimental
data from LIB cell and LIB module testing. The founding developers are researchers from the
Institute for Electrical Energy Storage at the Technical University of Munich; who presented the
simulation framework in several contributions to the scientific community [159–162]. Figure 31
depicts a general overview of the SimSES software and its available modules for BESS
simulation. As of 12/2016 the SimSES tool is comprised of the following modules and models
the operation strategies and applications module
the electric model
the thermal model
the battery voltage-resistance model
the aging model
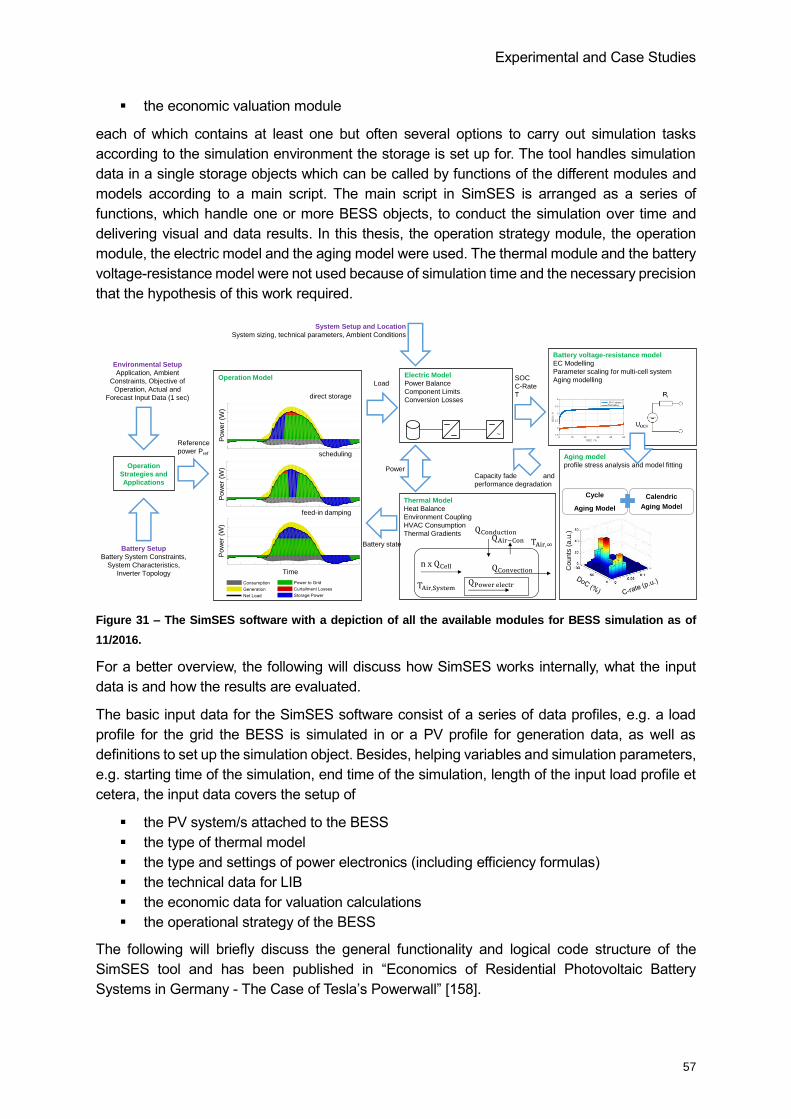
Experimental and Case Studies
57
the economic valuation module
each of which contains at least one but often several options to carry out simulation tasks
according to the simulation environment the storage is set up for. The tool handles simulation
data in a single storage objects which can be called by functions of the different modules and
models according to a main script. The main script in SimSES is arranged as a series of
functions, which handle one or more BESS objects, to conduct the simulation over time and
delivering visual and data results. In this thesis, the operation strategy module, the operation
module, the electric model and the aging model were used. The thermal module and the battery
voltage-resistance model were not used because of simulation time and the necessary precision
that the hypothesis of this work required.
Figure 31 – The SimSES software with a depiction of all the available modules for BESS simulation as of
11/2016.
For a better overview, the following will discuss how SimSES works internally, what the input
data is and how the results are evaluated.
The basic input data for the SimSES software consist of a series of data profiles, e.g. a load
profile for the grid the BESS is simulated in or a PV profile for generation data, as well as
definitions to set up the simulation object. Besides, helping variables and simulation parameters,
e.g. starting time of the simulation, end time of the simulation, length of the input load profile et
cetera, the input data covers the setup of
the PV system/s attached to the BESS
the type of thermal model
the type and settings of power electronics (including efficiency formulas)
the technical data for LIB
the economic data for valuation calculations
the operational strategy of the BESS
The following will briefly discuss the general functionality and logical code structure of the
SimSES tool and has been published in “Economics of Residential Photovoltaic Battery
Systems in Germany - The Case of Tesla’s Powerwall” [158].
Reference
power Pref
Time
Pow
er
(W)
Pow
er
(W)
Pow
er
(W)
direct storage
scheduling
feed-in damping
Operation Model
System Setup and Location
System sizing, technical parameters, Ambient Conditions
Electric Model
Power Balance
Component Limits
Conversion Losses
~
n n n
,S
,
n n
SOC
C-Rate
T
Capacity fade and
performance degradation
Battery state
Load
Counts
(a.u
.)
Battery voltage-resistance model
EC Modelling
Parameter scaling for multi-cell system
Aging modelling
Thermal Model
Heat Balance
Environment Coupling
HVAC Consumption
Thermal Gradients
Environmental Setup
Application, Ambient
Constraints, Objective of
Operation, Actual and
Forecast Input Data (1 sec)
Aging model
profile stress analysis and model fitting
Calendric
Aging Model
Cycle
Aging Model
PowerOperation
Strategies and
Applications
Battery Setup
Battery System Constraints,
System Characteristics,
Inverter Topology
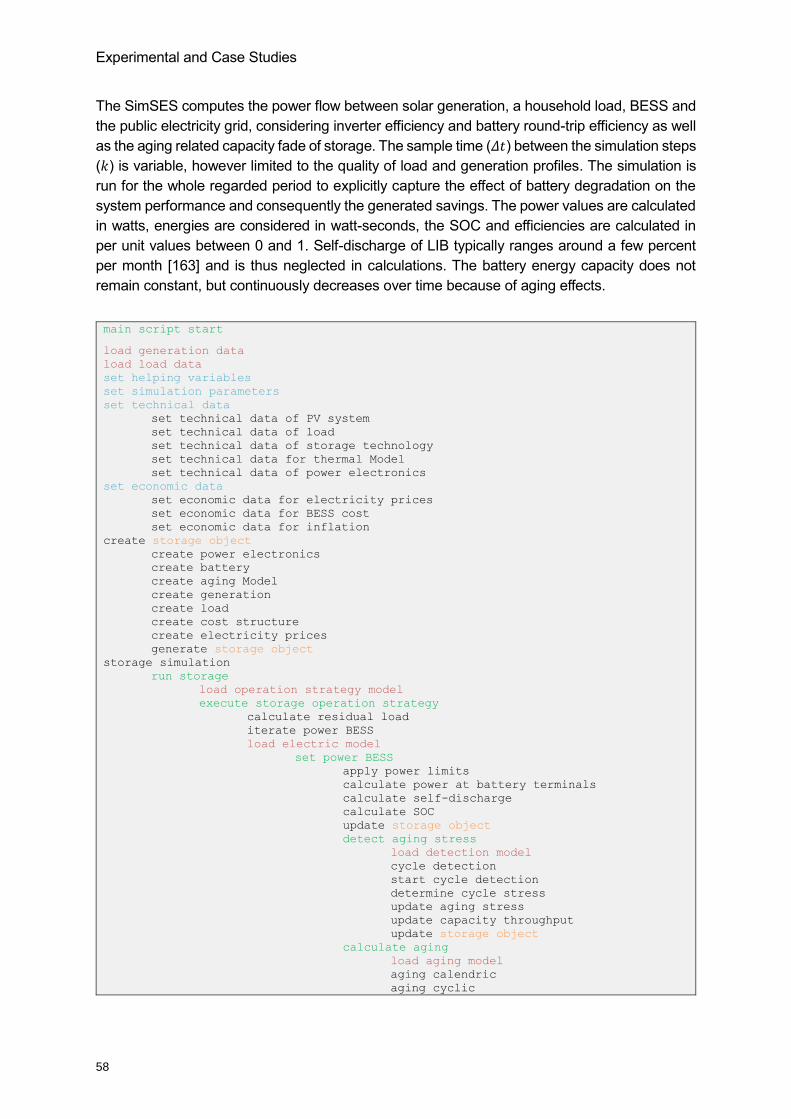
Experimental and Case Studies
58
The SimSES computes the power flow between solar generation, a household load, BESS and
the public electricity grid, considering inverter efficiency and battery round-trip efficiency as well
as the aging related capacity fade of storage. The sample time (𝛥𝑡) between the simulation steps
(𝑘) is variable, however limited to the quality of load and generation profiles. The simulation is
run for the whole regarded period to explicitly capture the effect of battery degradation on the
system performance and consequently the generated savings. The power values are calculated
in watts, energies are considered in watt-seconds, the SOC and efficiencies are calculated in
per unit values between 0 and 1. Self-discharge of LIB typically ranges around a few percent
per month [163] and is thus neglected in calculations. The battery energy capacity does not
remain constant, but continuously decreases over time because of aging effects.
main script start
load generation data
load load data
set helping variables
set simulation parameters
set technical data
set technical data of PV system
set technical data of load
set technical data of storage technology
set technical data for thermal Model
set technical data of power electronics
set economic data
set economic data for electricity prices
set economic data for BESS cost
set economic data for inflation
create storage object
create power electronics
create battery
create aging Model
create generation
create load
create cost structure
create electricity prices
generate storage object
storage simulation
run storage
load operation strategy model
execute storage operation strategy
calculate residual load
iterate power BESS
load electric model
set power BESS
apply power limits
calculate power at battery terminals
calculate self-discharge
calculate SOC
update storage object
detect aging stress
load detection model
cycle detection
start cycle detection
determine cycle stress
update aging stress
update capacity throughput
update storage object
calculate aging
load aging model
aging calendric
aging cyclic
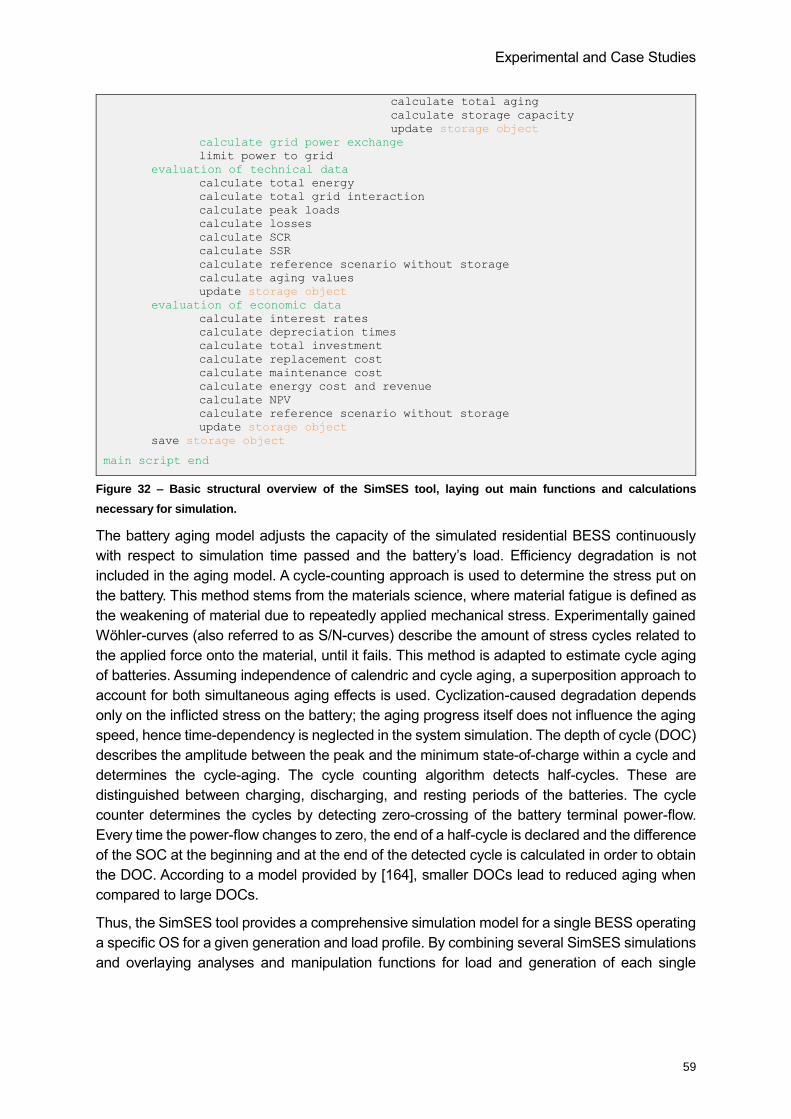
Experimental and Case Studies
59
calculate total aging
calculate storage capacity
update storage object
calculate grid power exchange
limit power to grid
evaluation of technical data
calculate total energy
calculate total grid interaction
calculate peak loads
calculate losses
calculate SCR
calculate SSR
calculate reference scenario without storage
calculate aging values
update storage object
evaluation of economic data
calculate interest rates
calculate depreciation times
calculate total investment
calculate replacement cost
calculate maintenance cost
calculate energy cost and revenue
calculate NPV
calculate reference scenario without storage
update storage object
save storage object
main script end
Figure 32 – Basic structural overview of the SimSES tool, laying out main functions and calculations
necessary for simulation.
The battery aging model adjusts the capacity of the simulated residential BESS continuously
with respect to simulation time passed and the battery’s load. Efficiency degradation is not
included in the aging model. A cycle-counting approach is used to determine the stress put on
the battery. This method stems from the materials science, where material fatigue is defined as
the weakening of material due to repeatedly applied mechanical stress. Experimentally gained
Wöhler-curves (also referred to as S/N-curves) describe the amount of stress cycles related to
the applied force onto the material, until it fails. This method is adapted to estimate cycle aging
of batteries. Assuming independence of calendric and cycle aging, a superposition approach to
account for both simultaneous aging effects is used. Cyclization-caused degradation depends
only on the inflicted stress on the battery; the aging progress itself does not influence the aging
speed, hence time-dependency is neglected in the system simulation. The depth of cycle (DOC)
describes the amplitude between the peak and the minimum state-of-charge within a cycle and
determines the cycle-aging. The cycle counting algorithm detects half-cycles. These are
distinguished between charging, discharging, and resting periods of the batteries. The cycle
counter determines the cycles by detecting zero-crossing of the battery terminal power-flow.
Every time the power-flow changes to zero, the end of a half-cycle is declared and the difference
of the SOC at the beginning and at the end of the detected cycle is calculated in order to obtain
the DOC. According to a model provided by [164], smaller DOCs lead to reduced aging when
compared to large DOCs.
Thus, the SimSES tool provides a comprehensive simulation model for a single BESS operating
a specific OS for a given generation and load profile. By combining several SimSES simulations
and overlaying analyses and manipulation functions for load and generation of each single
Experimental and Case Studies
60
simulation, multi-purpose BESS can be simulated. Refer to subchapter 5.2 for a full description
of an MP-BESS simulation setup based on SimSES.
4.3 Case Study: Grid-Level Adaptability for Stationary BESSs
Regarding the aim of economic implementation of BESSs, understanding and predictability of
the usability of BESSs are prerequisites to assess the overall system technologies, costs and
economic benefit. Thus, the ability of assessing the adaptability of BESSs in a certain grid level
is directly linked to the decision to invest. The fundamentals of grid-level adaptability required
for such challenging predictions are presented in Chapter 4.1 and are published as the
“Evaluation of Grid-Level Adaptability for Stationary Battery Energy Storage System Applications
in Europe” [39].
Fundamentally, BESS implementation is dependent on the readiness, i.e., the economic value,
of a certain APM for a specific grid level. For a BESS, the highest economic value is expected
in the grid level in which its adaptability, e.g., suitable regulatory framework or working business
case, is the highest. In addition, MP-BESSs, which will be further described in Chapter 5, have
yet to be analyzed for possible grid implementation according to the APM necessary voltage
level, since these systems serve grid overlapping.
The vast majority of BESS implementation theories and investigations focus on a single grid
level, whereas the interaction of such systems between grid voltage levels has been widely
neglected [165]. Whereas the necessity for SES in future grids seems unavoidable,
policymakers, projectors and operators of BESSs focused only recently (as of 08/2016) on
stacking of APMs to increase BESSs’ economic value.
Complications and challenges in transmission and distribution grids originate mostly from the
sum of challenges in lower voltage grids. BESSs are a major factor in addressing these
challenges at their origin and influence grid stability and quality in a positive way. The
superimposed effects from several LV-implemented BESSs on higher grid levels and their
multiplicative positive effects on upper grid levels are described in this chapter. Figure 33 depicts
the effects of Europe’s energy transition toward a low-carbon future over time. The electricity is
produced hierarchically and fed into the XHV or HV level before it is transported to lower voltage
levels to be transformed into MV and LV levels to be consumed locally. The European electricity
grid is divided into four different voltage levels: XHV, HV, MV and LV with a maximum of 380 kV,
110/220 kV, 10/20 kV, and 400 V, respectively.
The shift has already occurred from a typical unidirectional load system, in which power and
energy flow mainly from large, central power plants and are transported from extra-high voltage
(XHV) levels into lower grid levels and finally to the end consumers, to a bi-directional grid with
load flow over all voltage levels. In several grid areas in Europe, peak load flows in backfeeding
scenarios have already reached medium-voltage (MV) and even high-voltage (HV) grid levels.
These areas face shifting in load flow due to massive installations of RETs. Whenever local
RETs feed-in more energy and power than the demand, backfeeding occurs. It has been
observed in several areas in Bavaria, Germany that massive RET installations in LV grids lead
to backfeeding into MV and HV areas. Two effects categorize this as a problem. First, the large
backfeeding energy and power have to be consumed somewhere else in the grid. If this is not
possible, grid operators will activate control structures, i.e., demand-side management, and
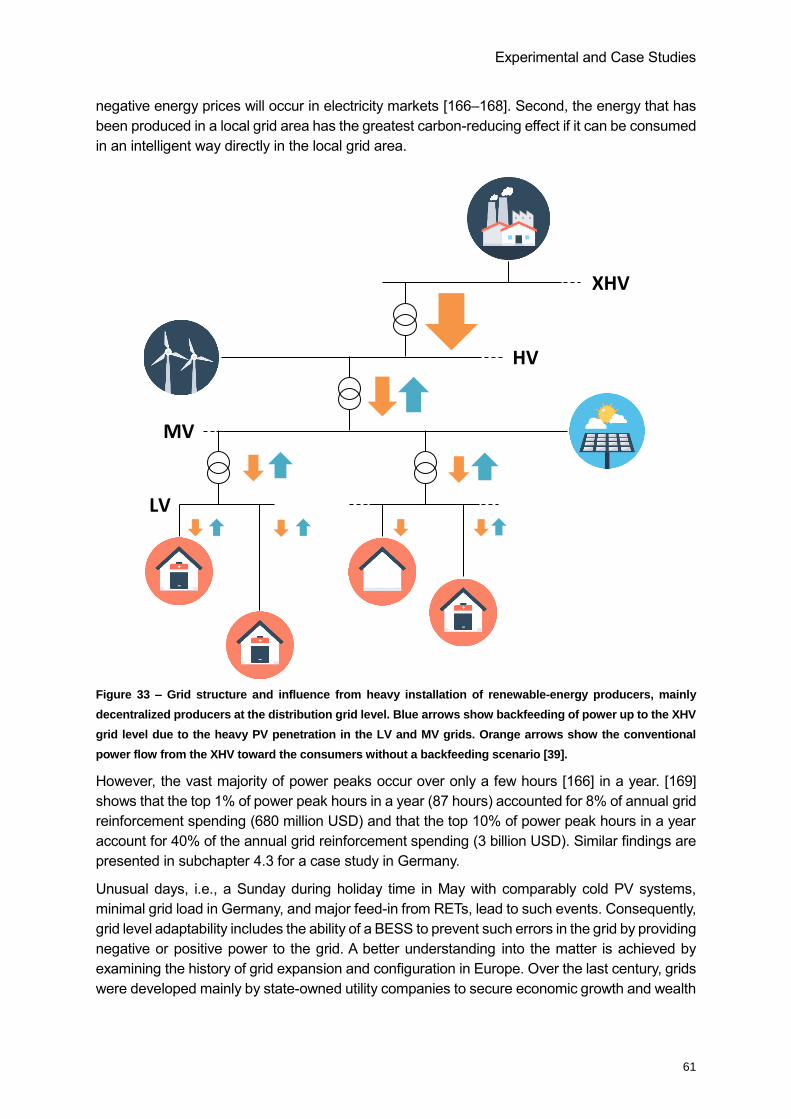
Experimental and Case Studies
61
negative energy prices will occur in electricity markets [166–168]. Second, the energy that has
been produced in a local grid area has the greatest carbon-reducing effect if it can be consumed
in an intelligent way directly in the local grid area.
Figure 33 – Grid structure and influence from heavy installation of renewable-energy producers, mainly
decentralized producers at the distribution grid level. Blue arrows show backfeeding of power up to the XHV
grid level due to the heavy PV penetration in the LV and MV grids. Orange arrows show the conventional
power flow from the XHV toward the consumers without a backfeeding scenario [39].
However, the vast majority of power peaks occur over only a few hours [166] in a year. [169]
shows that the top 1% of power peak hours in a year (87 hours) accounted for 8% of annual grid
reinforcement spending (680 million USD) and that the top 10% of power peak hours in a year
account for 40% of the annual grid reinforcement spending (3 billion USD). Similar findings are
presented in subchapter 4.3 for a case study in Germany.
Unusual days, i.e., a Sunday during holiday time in May with comparably cold PV systems,
minimal grid load in Germany, and major feed-in from RETs, lead to such events. Consequently,
grid level adaptability includes the ability of a BESS to prevent such errors in the grid by providing
negative or positive power to the grid. A better understanding into the matter is achieved by
examining the history of grid expansion and configuration in Europe. Over the last century, grids
were developed mainly by state-owned utility companies to secure economic growth and wealth
XHV
HV
MV
LV
Experimental and Case Studies
62
for the people. Several voltage levels with different purposes exist between the production of
energy and the consumption of energy, and the choice of grid level connections needs to
consider transmission losses and the ease-of-handling; longer transmission distances require
higher voltage levels because losses along the line are proportionally smaller for higher voltage
levels. However, this approach leads to an increased insulation requirement, which is
accompanied by handling issues and a cost increase. Distribution grids in local areas are
different from transmission grids and do not require long distances between points of interest;
thus, they consist mainly of LV grid levels.
The XHV grid level in Europe serves as a transmission grid over long distances within and
between national grids. It operates at a voltage of 380/220 kV, and connected electricity plants
are rated at up to several 1,000 MVA. At this level, the grid is required to be operable even after
one component, such as a transformer or a circuit, fails (i.e., the n-1 criterion). The HV level in
Europe has a rated voltage of 110/60 kV and serves the trans-regional transmission of electricity.
Typical electricity plants in this grid level yield powers of several MVA up to several 100 MVA.
The n-1 criterion is also in effect at this level. Only a small share of the HV grid is built using
cable (9.5%), and the remaining majority of the grid consists of overhead lines. The regional
distribution of electricity is performed with MV grids, and typical consumers yield larger power
loads of more than 100 kVA. The voltage level ranges from 3 kV to 30 kV. Most lines at this level
are installed as cable (78.8% in Germany). Small scale prosumers (prosumer: a consumer who
becomes involved with generating, using and providing electricity for their own needs) are
connected to the power system in LV grids. This scale involves private and commercial
customers using less than 100 kVA. Cable installation is dominant at this grid level, with a share
of 89% in Germany. The n-1 criterion is frequently not in place, and the additional investment
cost to ensure the enhanced reliability is not justified for small grid sizes with only minor impacts
of power outages.
Currently, an increasing share of RETs results in an increasing number of grid errors and quality
problems. Transmission congestion, balancing needs, voltage limit violations and overload
scenarios of network operating resources are some of the challenges induced by RETs. It has
been shown in [39] the extent to which BESSs adapt in the different grid levels in Europe. Table
17 shows the technical grid level readiness for different BESSs regarding the influence on other
grid levels when inserted in a specific grid level with a certain APM. Because (as of 2016) most
load peaks, mainly for a backfeeding scenario, occur in LV and MV grids, a BESS serving APM
GRID, see Subchapter 3.4, is best situated near the error sources in the same grid level.
Possible unloading of an MV/LV transformer is technically only possible within the LV level
because of grid overloading in the LV level. Large-scale RET implementation in LV grid areas
often leads to an overloading of the local grid because of highly fluctuating energy production
without any reliance on the local grid load during the same time. Thus, an LV grid will start
feeding energy back whenever the produced energy exceeds consumption, leading to grid and
transformer overload in the worst cases. A BESS situated in the same LV grid can be charged
during times of high backfeeding power and discharged during times of low or no backfeeding
power to unload the local grid and transformer. A BESS situated in the superimposed MV grid
cannot fulfill this task. With regard to APM SELF, see Subchapter 3.1, BESSs are rather unusual
for implementation if the grid levels exceed LV since most consumers interested in SELF are
situated in LV grids; in Germany, the renewable energy acts progressively subsidy BESSs in
Experimental and Case Studies
63
these areas. It was shown in [39] that the LV level promises the most functionality for assessing
the possibilities of BESSs.
Table 17 – Evaluation of technical grid level readiness for providing a certain APM with BESSs under the
constraints of BESS sizing and costs [39]. The more stars the higher is a BESS’s APM in a certain grid level.
Gray field show either technology or economic unviable cases.
Level APM
XHV HV MV LV Source
GRID * ** *** [117, 118]
SELF *** [158, 170–173]
PEAK-S * ** *** [132, 133]
UPS * ** *** [138, 139]
PCP *** *** *** ***
[126, 127] SCR * *** *** ***
TCR ** *** ***
ISLAND ** *** *** [174–177]
IDM *** *** *** *** [113]
BSC ** *** *** *** [41, 108]
On the grid of the DSO KWH Netz
The KWH Netz GmbH is a distribution grid operator (DSO) situated 45 minutes east of Munich,
Germany, and it has been one of the most valuable partners in creating this thesis, which is
supported with data from their grid. The KWH Netz GmbH operates, plans and expands the
electricity distribution grid for 21 municipalities with 550 transformer stations and over 15,000
grid connections and a single circular MV grid that is connected via MV/HV transformer stations
to higher grid levels. The KWH Netz GmbH’s service area covers 314.4 km².
The following data and analysis pertain to the complete service area of a DSO in East Bavaria.
For data gathering, KWH Netz GmbH worked closely with the EEBatt project and provided deep
insights and data for scientific investigations in this thesis.
With over 48.46 MW of RETs, the KWH Grid area shows significant installations of RETs,
depicted in Figure 34, in the last decade. Out of the 48.46 MW, 36.9 MW of non-adjustable
generation originates from PV systems installed in LV and MV grids [178]. The share of wind
power in this specific region is relatively small and contributes negligibly to the outlined
hypotheses and calculations. The total RETs mounted in KWH’s LV grid account for over 32.06
MW [178] in power, which leads to major feed-in management actions by KWH Netz GmbH to
ensure grid stability, particularly in the summer. Currently, the foremost LV and MV biogas RETs
are operated automatically and can be directly controlled by KWH Netz GmbH for grid stability
purposes from a central control station. The bottlenecks for grids under these circumstances are
line distances and transformer capability, representing all the transformers that are in
overloading status over a longer time period because of vast amounts of backfeeding power,
overloading the thermal overcapacity with which transformers are equipped. Considering that
60% of RETs in the KWH’s grid are installed in the LV grid, it is apparent that a decentralized
solution approach to solve the upcoming problems should be preferred to alleviate grid
bottlenecks. The bottlenecks, foremost situated in the LV grids because of the lower oversizing
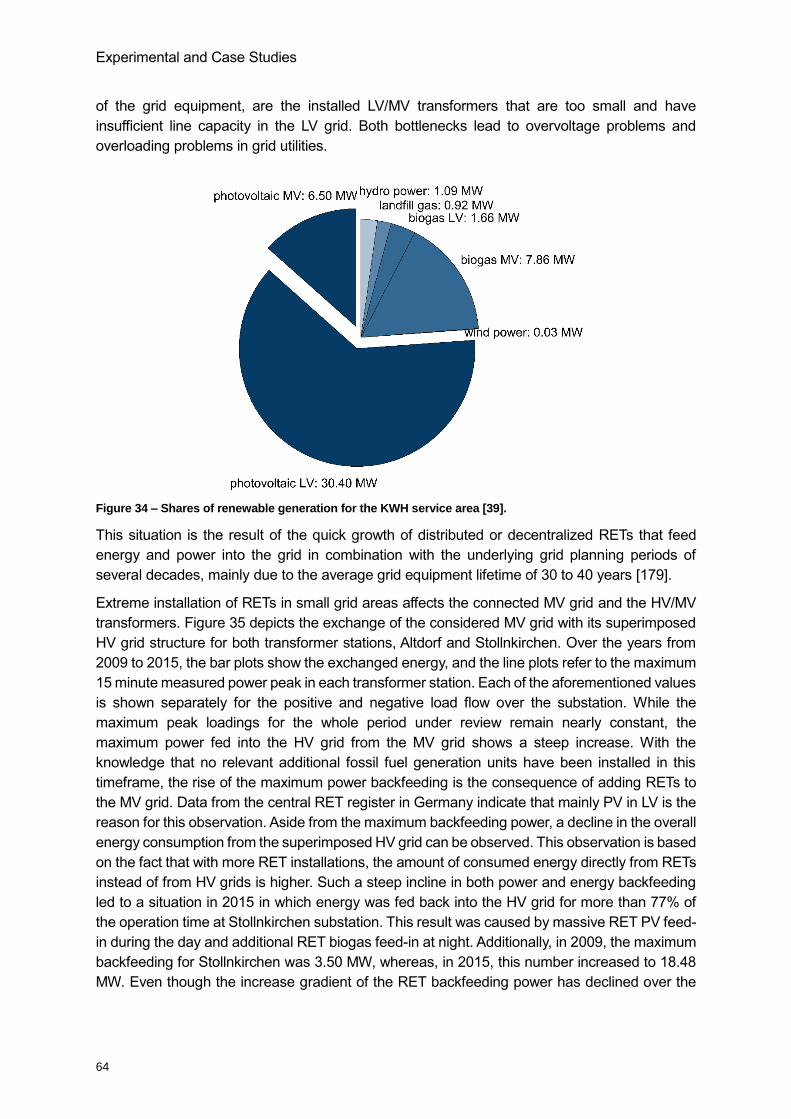
Experimental and Case Studies
64
of the grid equipment, are the installed LV/MV transformers that are too small and have
insufficient line capacity in the LV grid. Both bottlenecks lead to overvoltage problems and
overloading problems in grid utilities.
Figure 34 – Shares of renewable generation for the KWH service area [39].
This situation is the result of the quick growth of distributed or decentralized RETs that feed
energy and power into the grid in combination with the underlying grid planning periods of
several decades, mainly due to the average grid equipment lifetime of 30 to 40 years [179].
Extreme installation of RETs in small grid areas affects the connected MV grid and the HV/MV
transformers. Figure 35 depicts the exchange of the considered MV grid with its superimposed
HV grid structure for both transformer stations, Altdorf and Stollnkirchen. Over the years from
2009 to 2015, the bar plots show the exchanged energy, and the line plots refer to the maximum
15 minute measured power peak in each transformer station. Each of the aforementioned values
is shown separately for the positive and negative load flow over the substation. While the
maximum peak loadings for the whole period under review remain nearly constant, the
maximum power fed into the HV grid from the MV grid shows a steep increase. With the
knowledge that no relevant additional fossil fuel generation units have been installed in this
timeframe, the rise of the maximum power backfeeding is the consequence of adding RETs to
the MV grid. Data from the central RET register in Germany indicate that mainly PV in LV is the
reason for this observation. Aside from the maximum backfeeding power, a decline in the overall
energy consumption from the superimposed HV grid can be observed. This observation is based
on the fact that with more RET installations, the amount of consumed energy directly from RETs
instead of from HV grids is higher. Such a steep incline in both power and energy backfeeding
led to a situation in 2015 in which energy was fed back into the HV grid for more than 77% of
the operation time at Stollnkirchen substation. This result was caused by massive RET PV feed-
in during the day and additional RET biogas feed-in at night. Additionally, in 2009, the maximum
backfeeding for Stollnkirchen was 3.50 MW, whereas, in 2015, this number increased to 18.48
MW. Even though the increase gradient of the RET backfeeding power has declined over the
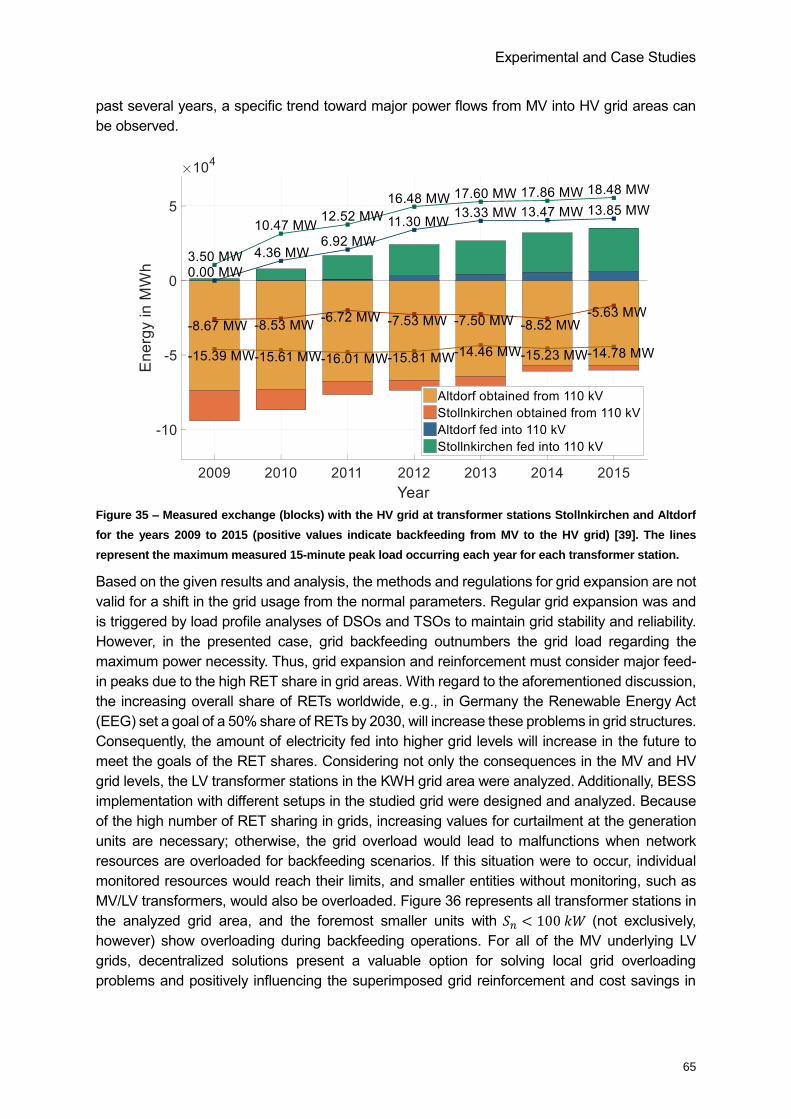
Experimental and Case Studies
65
past several years, a specific trend toward major power flows from MV into HV grid areas can
be observed.
Figure 35 – Measured exchange (blocks) with the HV grid at transformer stations Stollnkirchen and Altdorf
for the years 2009 to 2015 (positive values indicate backfeeding from MV to the HV grid) [39]. The lines
represent the maximum measured 15-minute peak load occurring each year for each transformer station.
Based on the given results and analysis, the methods and regulations for grid expansion are not
valid for a shift in the grid usage from the normal parameters. Regular grid expansion was and
is triggered by load profile analyses of DSOs and TSOs to maintain grid stability and reliability.
However, in the presented case, grid backfeeding outnumbers the grid load regarding the
maximum power necessity. Thus, grid expansion and reinforcement must consider major feed-
in peaks due to the high RET share in grid areas. With regard to the aforementioned discussion,
the increasing overall share of RETs worldwide, e.g., in Germany the Renewable Energy Act
(EEG) set a goal of a 50% share of RETs by 2030, will increase these problems in grid structures.
Consequently, the amount of electricity fed into higher grid levels will increase in the future to
meet the goals of the RET shares. Considering not only the consequences in the MV and HV
grid levels, the LV transformer stations in the KWH grid area were analyzed. Additionally, BESS
implementation with different setups in the studied grid were designed and analyzed. Because
of the high number of RET sharing in grids, increasing values for curtailment at the generation
units are necessary; otherwise, the grid overload would lead to malfunctions when network
resources are overloaded for backfeeding scenarios. If this situation were to occur, individual
monitored resources would reach their limits, and smaller entities without monitoring, such as
MV/LV transformers, would also be overloaded. Figure 36 represents all transformer stations in
the analyzed grid area, and the foremost smaller units with 𝑆𝑛 < 100 𝑘𝑊 (not exclusively,
however) show overloading during backfeeding operations. For all of the MV underlying LV
grids, decentralized solutions present a valuable option for solving local grid overloading
problems and positively influencing the superimposed grid reinforcement and cost savings in
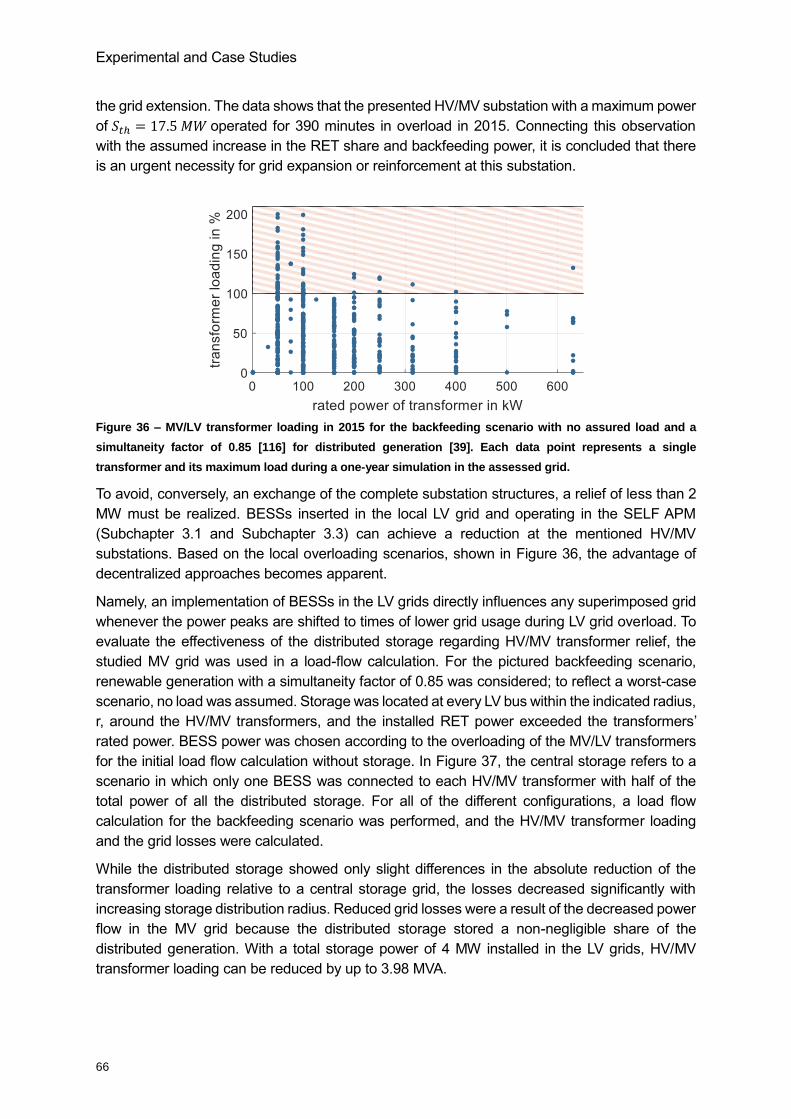
Experimental and Case Studies
66
the grid extension. The data shows that the presented HV/MV substation with a maximum power
of 𝑆𝑡ℎ = 17.5 𝑀𝑊 operated for 390 minutes in overload in 2015. Connecting this observation
with the assumed increase in the RET share and backfeeding power, it is concluded that there
is an urgent necessity for grid expansion or reinforcement at this substation.
Figure 36 – MV/LV transformer loading in 2015 for the backfeeding scenario with no assured load and a
simultaneity factor of 0.85 [116] for distributed generation [39]. Each data point represents a single
transformer and its maximum load during a one-year simulation in the assessed grid.
To avoid, conversely, an exchange of the complete substation structures, a relief of less than 2
MW must be realized. BESSs inserted in the local LV grid and operating in the SELF APM
(Subchapter 3.1 and Subchapter 3.3) can achieve a reduction at the mentioned HV/MV
substations. Based on the local overloading scenarios, shown in Figure 36, the advantage of
decentralized approaches becomes apparent.
Namely, an implementation of BESSs in the LV grids directly influences any superimposed grid
whenever the power peaks are shifted to times of lower grid usage during LV grid overload. To
evaluate the effectiveness of the distributed storage regarding HV/MV transformer relief, the
studied MV grid was used in a load-flow calculation. For the pictured backfeeding scenario,
renewable generation with a simultaneity factor of 0.85 was considered; to reflect a worst-case
scenario, no load was assumed. Storage was located at every LV bus within the indicated radius,
r, around the HV/MV transformers, and the installed RET power exceeded the transformers’
rated power. BESS power was chosen according to the overloading of the MV/LV transformers
for the initial load flow calculation without storage. In Figure 37, the central storage refers to a
scenario in which only one BESS was connected to each HV/MV transformer with half of the
total power of all the distributed storage. For all of the different configurations, a load flow
calculation for the backfeeding scenario was performed, and the HV/MV transformer loading
and the grid losses were calculated.
While the distributed storage showed only slight differences in the absolute reduction of the
transformer loading relative to a central storage grid, the losses decreased significantly with
increasing storage distribution radius. Reduced grid losses were a result of the decreased power
flow in the MV grid because the distributed storage stored a non-negligible share of the
distributed generation. With a total storage power of 4 MW installed in the LV grids, HV/MV
transformer loading can be reduced by up to 3.98 MVA.
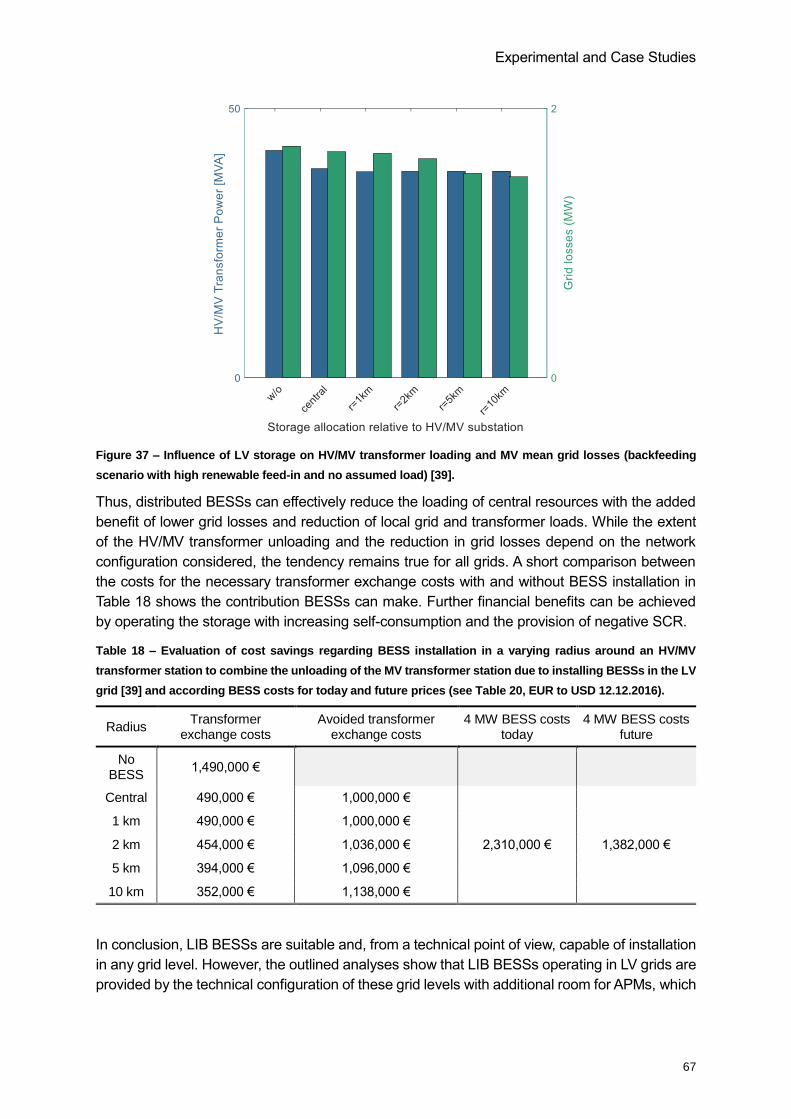
Experimental and Case Studies
67
Figure 37 – Influence of LV storage on HV/MV transformer loading and MV mean grid losses (backfeeding
scenario with high renewable feed-in and no assumed load) [39].
Thus, distributed BESSs can effectively reduce the loading of central resources with the added
benefit of lower grid losses and reduction of local grid and transformer loads. While the extent
of the HV/MV transformer unloading and the reduction in grid losses depend on the network
configuration considered, the tendency remains true for all grids. A short comparison between
the costs for the necessary transformer exchange costs with and without BESS installation in
Table 18 shows the contribution BESSs can make. Further financial benefits can be achieved
by operating the storage with increasing self-consumption and the provision of negative SCR.
Table 18 – Evaluation of cost savings regarding BESS installation in a varying radius around an HV/MV
transformer station to combine the unloading of the MV transformer station due to installing BESSs in the LV
grid [39] and according BESS costs for today and future prices (see Table 20, EUR to USD 12.12.2016).
Radius Transformer
exchange costs Avoided transformer
exchange costs 4 MW BESS costs
today 4 MW BESS costs
future
No BESS
1,490,000 €
Central 490,000 € 1,000,000 €
2,310,000 € 1,382,000 €
1 km 490,000 € 1,000,000 €
2 km 454,000 € 1,036,000 €
5 km 394,000 € 1,096,000 €
10 km 352,000 € 1,138,000 €
In conclusion, LIB BESSs are suitable and, from a technical point of view, capable of installation
in any grid level. However, the outlined analyses show that LIB BESSs operating in LV grids are
provided by the technical configuration of these grid levels with additional room for APMs, which
Experimental and Case Studies
68
are not present in the MV, HV or XHV grids. Although the majority of BESS APMs are not
economically viable under all circumstances, the addition of APMs onto a system seems to be
an appropriate method for increasing the economic value of BESSs, which is one of the core
issues of this work.
4.4 Case Study: Residential Home Storage
BESSs in the context of a single family home, i.e., residential BESSs, increase the connected
households’ SCR to minimize electricity cost, as shown in Subchapter 3.1. Currently, BESSs in
this context store surplus energy generated from a local PV system, which is under legal unity
with the house owner, and provide energy in times of low or no solar irradiation to compensate
the load. In the future, a variety of use-cases for residential BESSs will occur; rising shares of
electricity generation by local entities, such as private or shared PV systems or wind farms, will
lead to further destabilization of the grid. However, the integration of residential BESSs in
modern grids is currently mostly driven by benefits to individuals. Residential BESSs are built in
houses that have PV systems installed and are mostly economically driven.
For end consumers, BESSs are most meaningful when they are economically beneficial and
reduce a house owner’s electricity bill; the net present value (NPV) of such an investment is at
least positive for a given time period of operation. From a legal perspective, the integration of
residential BESSs is uncomplicated. Many countries have enrolled in programs supporting the
installation of residential BESSs because of the side effects that residential BESSs offer grid
operators and regulators.
By simply changing the charging algorithm from strategy A, which is supposed to be greedy from
the house owner’s perspective, for example a strategy B can provide the identical benefit to
homeowners and grid operators. Additionally, residential BESSs may have a positive influence
on electricity grids. The motivation for DSOs arises from grid voltage stability, the maximum
installable PV capacity and grid relief leading to reduced grid reinforcement demand.
On the Tesla Powerwall v1.0
The following material serves to give a brief overview of the results of the co-authored publication
“Economics of residential PV-battery systems in Germany” [158] based on Tesla’s Powerwall
residential home storage system to better understand BESS operation in residential
environments.
A proprietary power flow simulation model was implemented to assess the technical and
economic outcome of a residential PV system running with BESSs [26]. A series of different
configurations of household loads and PV systems was examined; the overall assessment took
households from 1,000 kWh to 10,000 kWh into account with installed PV systems of 1 kWp to
10 kWp. The utilized load profile consisted of 15-minute values over an average of 100
households in Germany over the course of one year [180]; furthermore, the generation profile
was measured with a sample time of one minute on a PV system in Munich, Germany in 2009
[158].
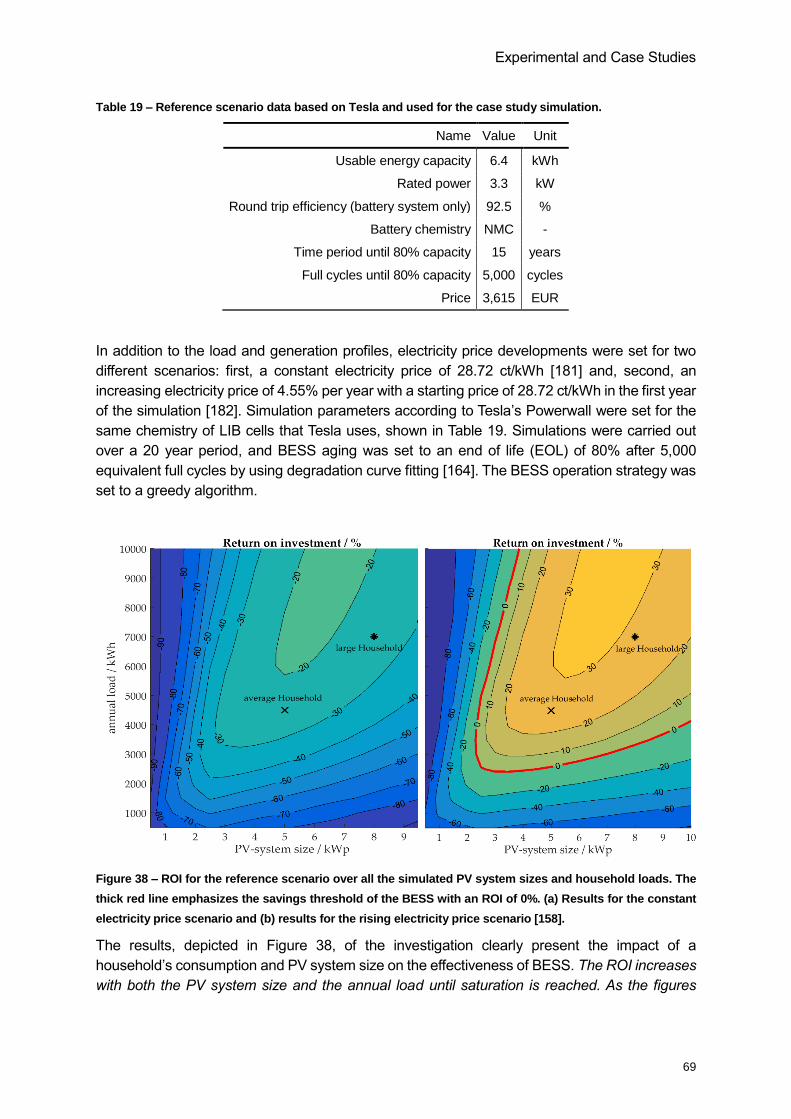
Experimental and Case Studies
69
Table 19 – Reference scenario data based on Tesla and used for the case study simulation.
Name Value Unit
Usable energy capacity 6.4 kWh
Rated power 3.3 kW
Round trip efficiency (battery system only) 92.5 %
Battery chemistry NMC -
Time period until 80% capacity 15 years
Full cycles until 80% capacity 5,000 cycles
Price 3,615 EUR
In addition to the load and generation profiles, electricity price developments were set for two
different scenarios: first, a constant electricity price of 28.72 ct/kWh [181] and, second, an
increasing electricity price of 4.55% per year with a starting price of 28.72 ct/kWh in the first year
of the simulation [182]. Simulation parameters according to Tesla’s Powerwall were set for the
same chemistry of LIB cells that Tesla uses, shown in Table 19. Simulations were carried out
over a 20 year period, and BESS aging was set to an end of life (EOL) of 80% after 5,000
equivalent full cycles by using degradation curve fitting [164]. The BESS operation strategy was
set to a greedy algorithm.
Figure 38 – ROI for the reference scenario over all the simulated PV system sizes and household loads. The
thick red line emphasizes the savings threshold of the BESS with an ROI of 0%. (a) Results for the constant
electricity price scenario and (b) results for the rising electricity price scenario [158].
The results, depicted in Figure 38, of the investigation clearly present the impact of a
household’s consumption and PV system size on the effectiveness of BESS. The ROI increases
with both the PV system size and the annual load until saturation is reached. As the figures
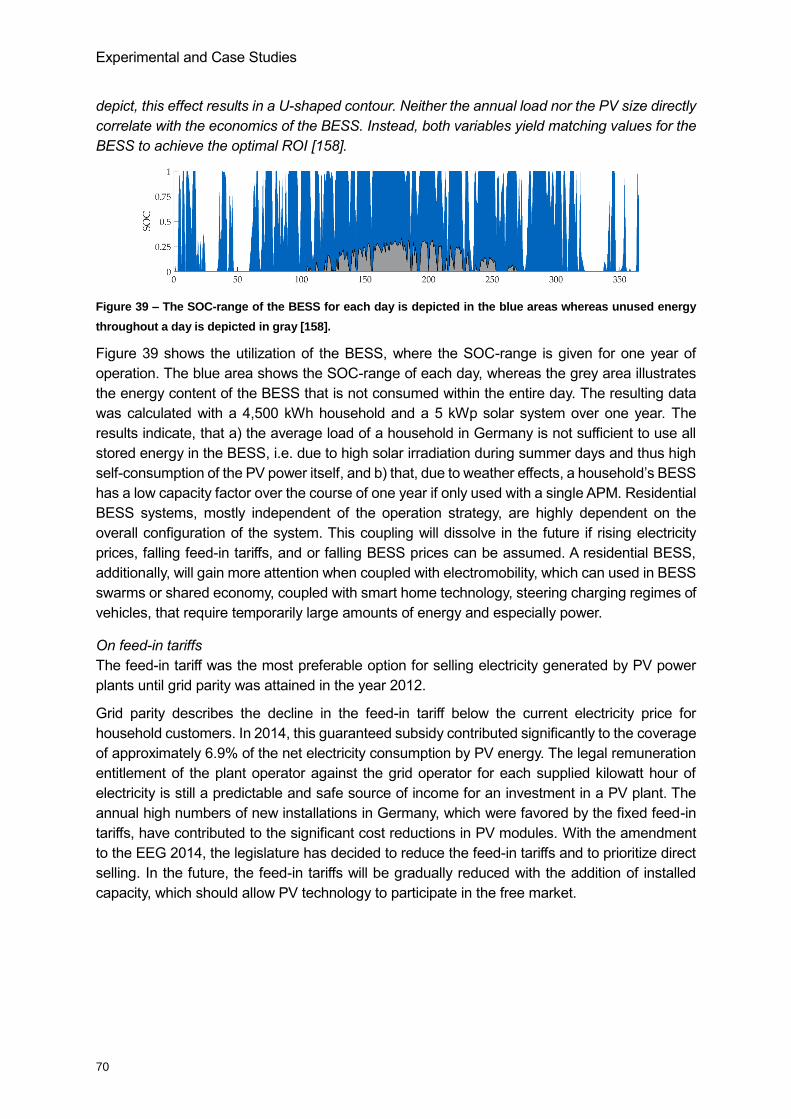
Experimental and Case Studies
70
depict, this effect results in a U-shaped contour. Neither the annual load nor the PV size directly
correlate with the economics of the BESS. Instead, both variables yield matching values for the
BESS to achieve the optimal ROI [158].
Figure 39 – The SOC-range of the BESS for each day is depicted in the blue areas whereas unused energy
throughout a day is depicted in gray [158].
Figure 39 shows the utilization of the BESS, where the SOC-range is given for one year of
operation. The blue area shows the SOC-range of each day, whereas the grey area illustrates
the energy content of the BESS that is not consumed within the entire day. The resulting data
was calculated with a 4,500 kWh household and a 5 kWp solar system over one year. The
results indicate, that a) the average load of a household in Germany is not sufficient to use all
stored energy in the BESS, i.e. due to high solar irradiation during summer days and thus high
self-consumption of the PV power itself, and b) that, due to weather effects, a household’s BESS
has a low capacity factor over the course of one year if only used with a single APM. Residential
BESS systems, mostly independent of the operation strategy, are highly dependent on the
overall configuration of the system. This coupling will dissolve in the future if rising electricity
prices, falling feed-in tariffs, and or falling BESS prices can be assumed. A residential BESS,
additionally, will gain more attention when coupled with electromobility, which can used in BESS
swarms or shared economy, coupled with smart home technology, steering charging regimes of
vehicles, that require temporarily large amounts of energy and especially power.
On feed-in tariffs
The feed-in tariff was the most preferable option for selling electricity generated by PV power
plants until grid parity was attained in the year 2012.
Grid parity describes the decline in the feed-in tariff below the current electricity price for
household customers. In 2014, this guaranteed subsidy contributed significantly to the coverage
of approximately 6.9% of the net electricity consumption by PV energy. The legal remuneration
entitlement of the plant operator against the grid operator for each supplied kilowatt hour of
electricity is still a predictable and safe source of income for an investment in a PV plant. The
annual high numbers of new installations in Germany, which were favored by the fixed feed-in
tariffs, have contributed to the significant cost reductions in PV modules. With the amendment
to the EEG 2014, the legislature has decided to reduce the feed-in tariffs and to prioritize direct
selling. In the future, the feed-in tariffs will be gradually reduced with the addition of installed
capacity, which should allow PV technology to participate in the free market.
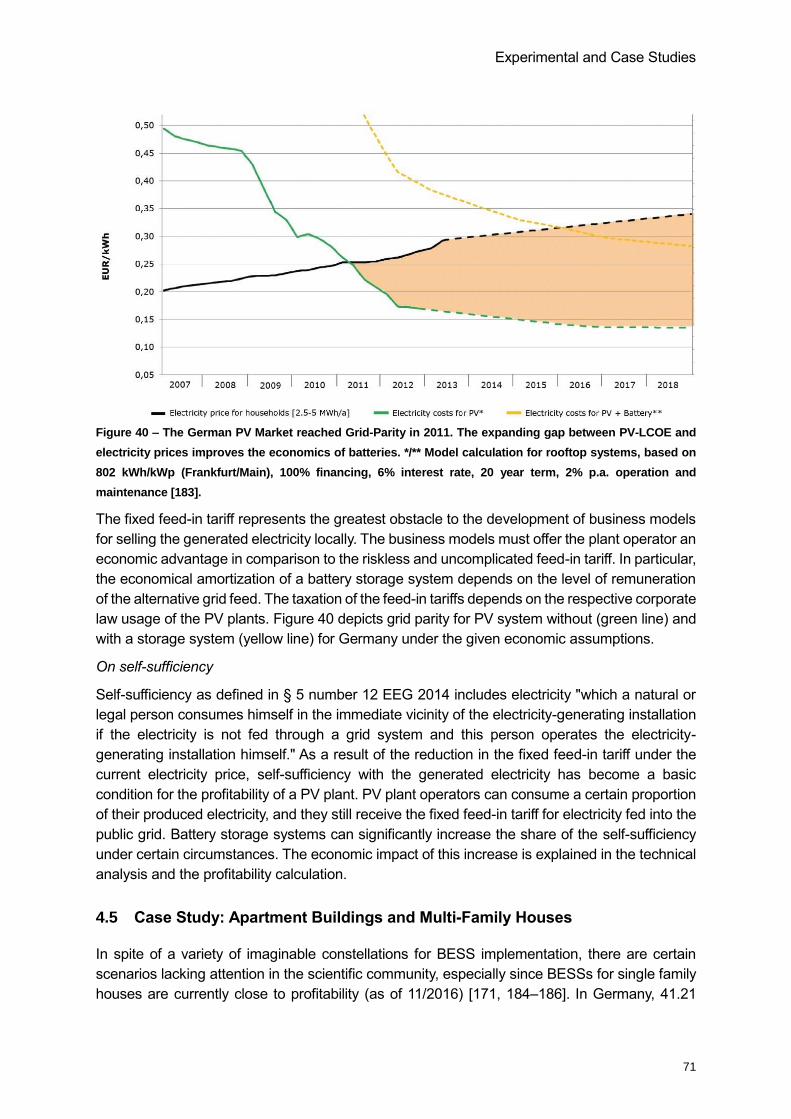
Experimental and Case Studies
71
Figure 40 – The German PV Market reached Grid-Parity in 2011. The expanding gap between PV-LCOE and
electricity prices improves the economics of batteries. */** Model calculation for rooftop systems, based on
802 kWh/kWp (Frankfurt/Main), 100% financing, 6% interest rate, 20 year term, 2% p.a. operation and
maintenance [183].
The fixed feed-in tariff represents the greatest obstacle to the development of business models
for selling the generated electricity locally. The business models must offer the plant operator an
economic advantage in comparison to the riskless and uncomplicated feed-in tariff. In particular,
the economical amortization of a battery storage system depends on the level of remuneration
of the alternative grid feed. The taxation of the feed-in tariffs depends on the respective corporate
law usage of the PV plants. Figure 40 depicts grid parity for PV system without (green line) and
with a storage system (yellow line) for Germany under the given economic assumptions.
On self-sufficiency
Self-sufficiency as defined in § 5 number 12 EEG 2014 includes electricity "which a natural or
legal person consumes himself in the immediate vicinity of the electricity-generating installation
if the electricity is not fed through a grid system and this person operates the electricity-
generating installation himself." As a result of the reduction in the fixed feed-in tariff under the
current electricity price, self-sufficiency with the generated electricity has become a basic
condition for the profitability of a PV plant. PV plant operators can consume a certain proportion
of their produced electricity, and they still receive the fixed feed-in tariff for electricity fed into the
public grid. Battery storage systems can significantly increase the share of the self-sufficiency
under certain circumstances. The economic impact of this increase is explained in the technical
analysis and the profitability calculation.
4.5 Case Study: Apartment Buildings and Multi-Family Houses
In spite of a variety of imaginable constellations for BESS implementation, there are certain
scenarios lacking attention in the scientific community, especially since BESSs for single family
houses are currently close to profitability (as of 11/2016) [171, 184–186]. In Germany, 41.21
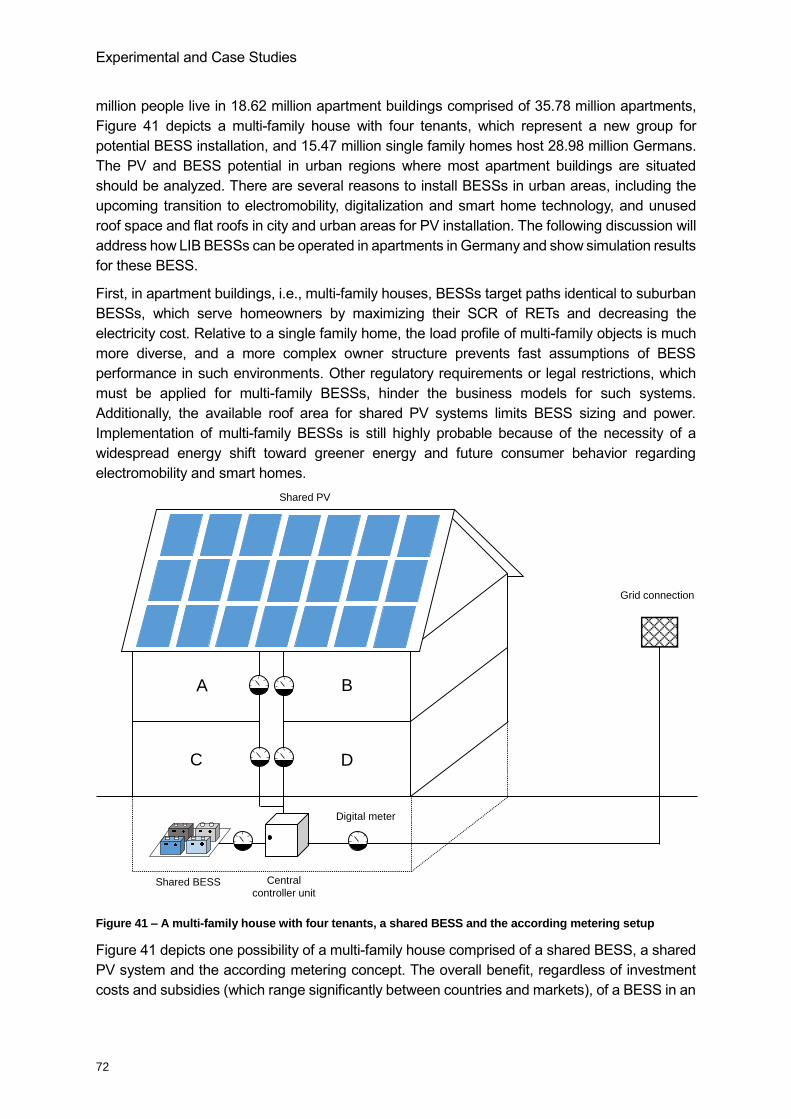
Experimental and Case Studies
72
million people live in 18.62 million apartment buildings comprised of 35.78 million apartments,
Figure 41 depicts a multi-family house with four tenants, which represent a new group for
potential BESS installation, and 15.47 million single family homes host 28.98 million Germans.
The PV and BESS potential in urban regions where most apartment buildings are situated
should be analyzed. There are several reasons to install BESSs in urban areas, including the
upcoming transition to electromobility, digitalization and smart home technology, and unused
roof space and flat roofs in city and urban areas for PV installation. The following discussion will
address how LIB BESSs can be operated in apartments in Germany and show simulation results
for these BESS.
First, in apartment buildings, i.e., multi-family houses, BESSs target paths identical to suburban
BESSs, which serve homeowners by maximizing their SCR of RETs and decreasing the
electricity cost. Relative to a single family home, the load profile of multi-family objects is much
more diverse, and a more complex owner structure prevents fast assumptions of BESS
performance in such environments. Other regulatory requirements or legal restrictions, which
must be applied for multi-family BESSs, hinder the business models for such systems.
Additionally, the available roof area for shared PV systems limits BESS sizing and power.
Implementation of multi-family BESSs is still highly probable because of the necessity of a
widespread energy shift toward greener energy and future consumer behavior regarding
electromobility and smart homes.
AA
Grid connection
C D
B
Digital meter
Central
controller unit
Shared PV
Shared BESS
Figure 41 – A multi-family house with four tenants, a shared BESS and the according metering setup
Figure 41 depicts one possibility of a multi-family house comprised of a shared BESS, a shared
PV system and the according metering concept. The overall benefit, regardless of investment
costs and subsidies (which range significantly between countries and markets), of a BESS in an
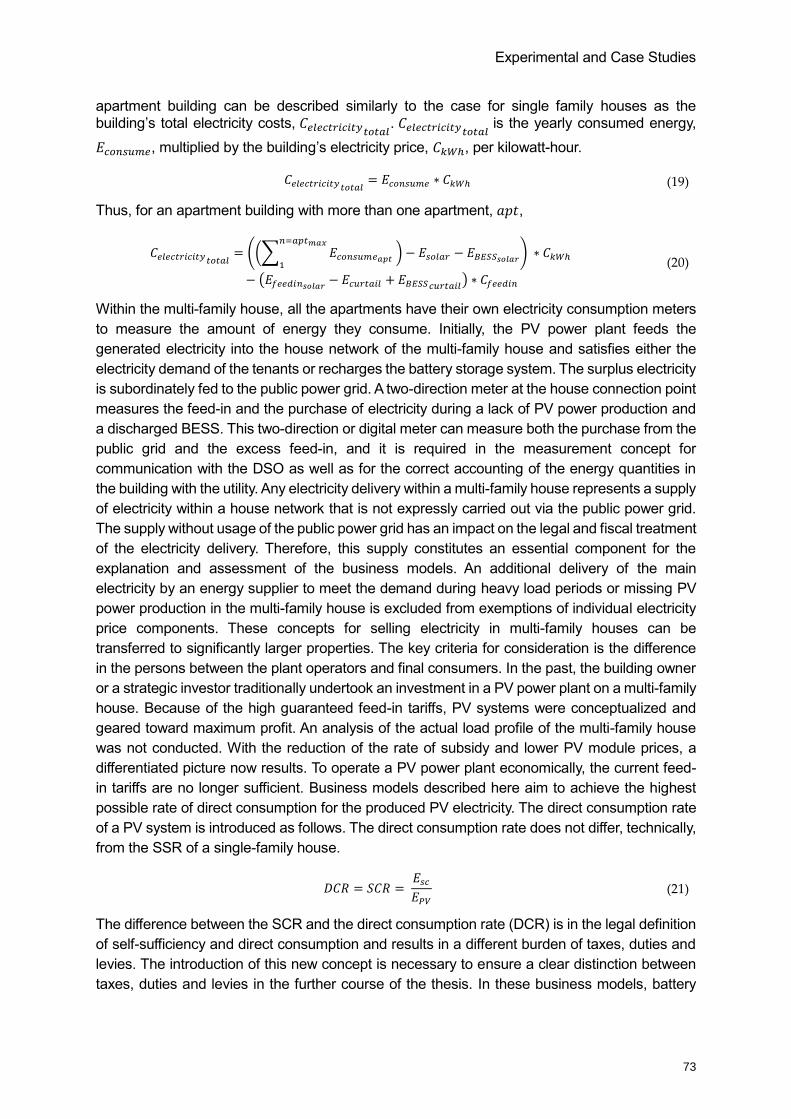
Experimental and Case Studies
73
apartment building can be described similarly to the case for single family houses as the building’s total electricity costs, 𝐶𝑒𝑙𝑒𝑐𝑡𝑟𝑖𝑐𝑖𝑡𝑦𝑡𝑜𝑡𝑎𝑙
. 𝐶𝑒𝑙𝑒𝑐𝑡𝑟𝑖𝑐𝑖𝑡𝑦𝑡𝑜𝑡𝑎𝑙 is the yearly consumed energy,
𝐸𝑐𝑜𝑛𝑠𝑢𝑚𝑒, multiplied by the building’s electricity price, 𝐶𝑘𝑊ℎ, per kilowatt-hour.
𝐶𝑒𝑙𝑒𝑐𝑡𝑟𝑖𝑐𝑖𝑡𝑦𝑡𝑜𝑡𝑎𝑙 = 𝐸𝑐𝑜𝑛𝑠𝑢𝑚𝑒 ∗ 𝐶𝑘𝑊ℎ (19)
Thus, for an apartment building with more than one apartment, 𝑎𝑝𝑡,
𝐶𝑒𝑙𝑒𝑐𝑡𝑟𝑖𝑐𝑖𝑡𝑦𝑡𝑜𝑡𝑎𝑙 = ((∑ 𝐸𝑐𝑜𝑛𝑠𝑢𝑚𝑒𝑎𝑝𝑡
𝑛=𝑎𝑝𝑡𝑚𝑎𝑥
1 ) − 𝐸𝑠𝑜𝑙𝑎𝑟 − 𝐸𝐵𝐸𝑆𝑆𝑠𝑜𝑙𝑎𝑟) ∗ 𝐶𝑘𝑊ℎ
− (𝐸𝑓𝑒𝑒𝑑𝑖𝑛𝑠𝑜𝑙𝑎𝑟 − 𝐸𝑐𝑢𝑟𝑡𝑎𝑖𝑙 + 𝐸𝐵𝐸𝑆𝑆𝑐𝑢𝑟𝑡𝑎𝑖𝑙) ∗ 𝐶𝑓𝑒𝑒𝑑𝑖𝑛
(20)
Within the multi-family house, all the apartments have their own electricity consumption meters
to measure the amount of energy they consume. Initially, the PV power plant feeds the
generated electricity into the house network of the multi-family house and satisfies either the
electricity demand of the tenants or recharges the battery storage system. The surplus electricity
is subordinately fed to the public power grid. A two-direction meter at the house connection point
measures the feed-in and the purchase of electricity during a lack of PV power production and
a discharged BESS. This two-direction or digital meter can measure both the purchase from the
public grid and the excess feed-in, and it is required in the measurement concept for
communication with the DSO as well as for the correct accounting of the energy quantities in
the building with the utility. Any electricity delivery within a multi-family house represents a supply
of electricity within a house network that is not expressly carried out via the public power grid.
The supply without usage of the public power grid has an impact on the legal and fiscal treatment
of the electricity delivery. Therefore, this supply constitutes an essential component for the
explanation and assessment of the business models. An additional delivery of the main
electricity by an energy supplier to meet the demand during heavy load periods or missing PV
power production in the multi-family house is excluded from exemptions of individual electricity
price components. These concepts for selling electricity in multi-family houses can be
transferred to significantly larger properties. The key criteria for consideration is the difference
in the persons between the plant operators and final consumers. In the past, the building owner
or a strategic investor traditionally undertook an investment in a PV power plant on a multi-family
house. Because of the high guaranteed feed-in tariffs, PV systems were conceptualized and
geared toward maximum profit. An analysis of the actual load profile of the multi-family house
was not conducted. With the reduction of the rate of subsidy and lower PV module prices, a
differentiated picture now results. To operate a PV power plant economically, the current feed-
in tariffs are no longer sufficient. Business models described here aim to achieve the highest
possible rate of direct consumption for the produced PV electricity. The direct consumption rate
of a PV system is introduced as follows. The direct consumption rate does not differ, technically,
from the SSR of a single-family house.
𝐷𝐶𝑅 = 𝑆𝐶𝑅 = 𝐸𝑠𝑐𝐸𝑃𝑉
(21)
The difference between the SCR and the direct consumption rate (DCR) is in the legal definition
of self-sufficiency and direct consumption and results in a different burden of taxes, duties and
levies. The introduction of this new concept is necessary to ensure a clear distinction between
taxes, duties and levies in the further course of the thesis. In these business models, battery
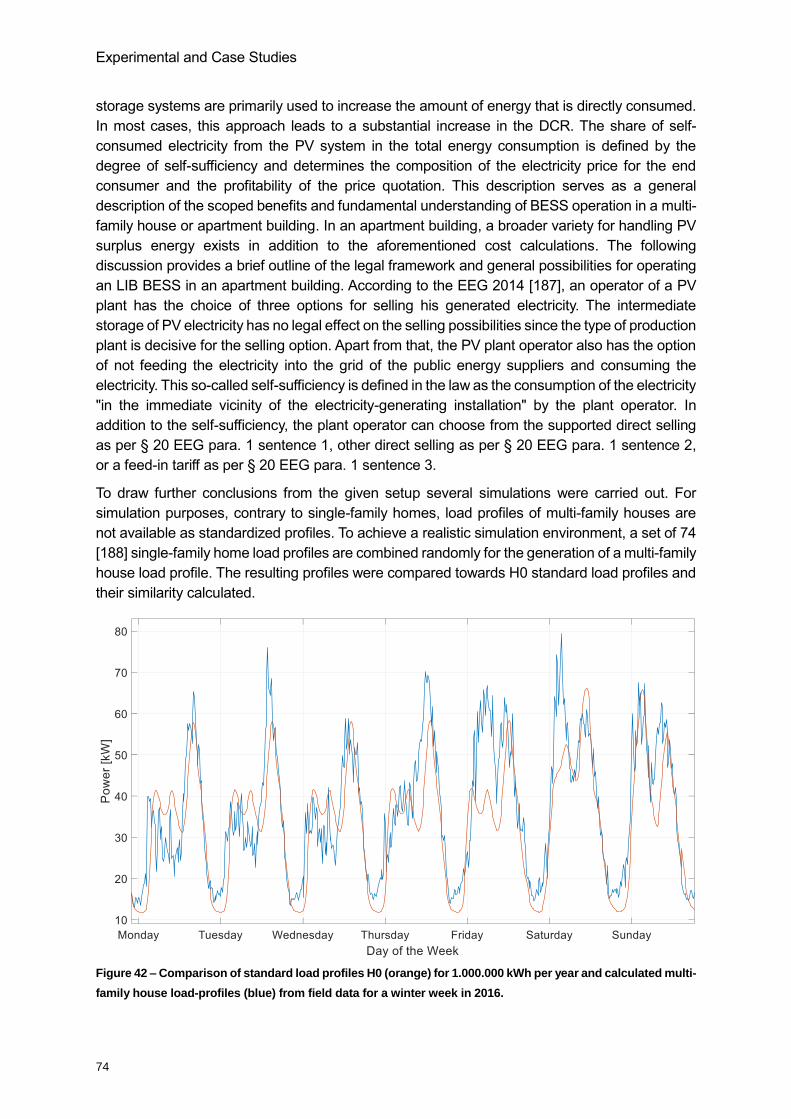
Experimental and Case Studies
74
storage systems are primarily used to increase the amount of energy that is directly consumed.
In most cases, this approach leads to a substantial increase in the DCR. The share of self-
consumed electricity from the PV system in the total energy consumption is defined by the
degree of self-sufficiency and determines the composition of the electricity price for the end
consumer and the profitability of the price quotation. This description serves as a general
description of the scoped benefits and fundamental understanding of BESS operation in a multi-
family house or apartment building. In an apartment building, a broader variety for handling PV
surplus energy exists in addition to the aforementioned cost calculations. The following
discussion provides a brief outline of the legal framework and general possibilities for operating
an LIB BESS in an apartment building. According to the EEG 2014 [187], an operator of a PV
plant has the choice of three options for selling his generated electricity. The intermediate
storage of PV electricity has no legal effect on the selling possibilities since the type of production
plant is decisive for the selling option. Apart from that, the PV plant operator also has the option
of not feeding the electricity into the grid of the public energy suppliers and consuming the
electricity. This so-called self-sufficiency is defined in the law as the consumption of the electricity
"in the immediate vicinity of the electricity-generating installation" by the plant operator. In
addition to the self-sufficiency, the plant operator can choose from the supported direct selling
as per § 20 EEG para. 1 sentence 1, other direct selling as per § 20 EEG para. 1 sentence 2,
or a feed-in tariff as per § 20 EEG para. 1 sentence 3.
To draw further conclusions from the given setup several simulations were carried out. For
simulation purposes, contrary to single-family homes, load profiles of multi-family houses are
not available as standardized profiles. To achieve a realistic simulation environment, a set of 74
[188] single-family home load profiles are combined randomly for the generation of a multi-family
house load profile. The resulting profiles were compared towards H0 standard load profiles and
their similarity calculated.
Figure 42 – Comparison of standard load profiles H0 (orange) for 1.000.000 kWh per year and calculated multi-
family house load-profiles (blue) from field data for a winter week in 2016.
Experimental and Case Studies
75
Figure 42 shows a standard load profile H0 (orange) and the synthesized load profiles for a
multi-family house (blue). While general differences can be observed, the resulting data shows
a sufficient quality for further simulations, with higher resolution than the H0 profiles.
Figure 43 – Resulting degrees of certainty for a number of household profiles, combined to a single multi-
family house profile set and resulting similarity coefficient, compared to a standardized load profile H0.
Figure 43 shows the resulting coefficients of determination for an increasing number of
households which profiles were added onto each other to generate a multi-family environment.
Each boxplot thereby represents a set of 100 different combinations of the given 74 single
household profiles which were randomly chosen for the generation of a multi-family profile. The
data indicates, that the generation of a multi-family house load profile achieves a mean
coefficient of determination of about 0.33 for a combination of four single-family household
profiles over one hundred simulation runs. Hence, to increase reliability of results for final
simulations, a load profile consisting of 30 households, averaging at a coefficient of
determination of about 0.55, was used.
The simulations were carried out similar to a single-family BESS with the simple greedy
algorithm; see Subchapter 3.5. Figure 44 shows the resulting DCR for a varying number of
household ranging between 1 and 70; the PV-systems peak power ranges from 5 to 200 kWp;
and the storage size between 0 and 200 kWh of capacity. The results indicate that the technical
and economic evaluation of a multi-family house shows similar results to these of single-family
houses. Given the similarities and load profiles for the calculation, see Figure 42, these results
confirm aforementioned analyses. In general, it can be observed that a fixed number of
households will show higher DCR for smaller PV systems and larger BESS sizes. Accordingly,
a fixed PV-size shows higher DCR for more households and larger BESS sizes. Accordingly, a
fixed BESS size shows higher DCR for more households and smaller PV systems. Generally
speaking a multi-family house shows no significant differences compared to a single-family
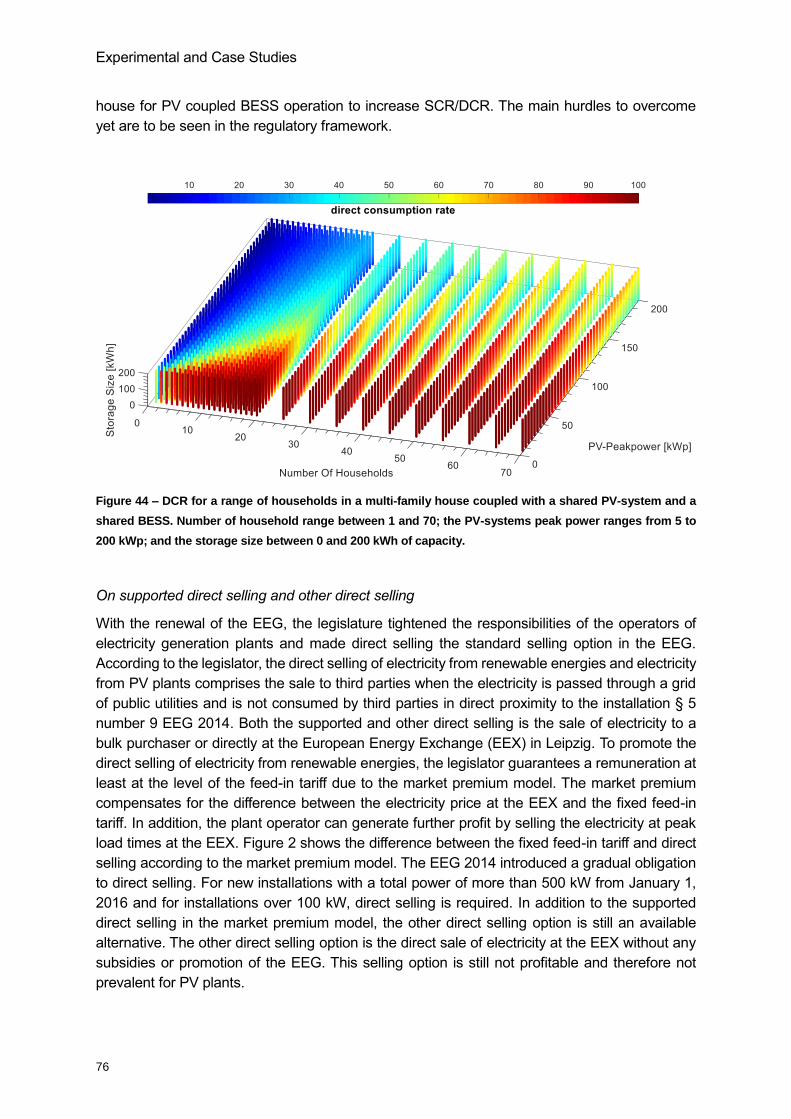
Experimental and Case Studies
76
house for PV coupled BESS operation to increase SCR/DCR. The main hurdles to overcome
yet are to be seen in the regulatory framework.
Figure 44 – DCR for a range of households in a multi-family house coupled with a shared PV-system and a
shared BESS. Number of household range between 1 and 70; the PV-systems peak power ranges from 5 to
200 kWp; and the storage size between 0 and 200 kWh of capacity.
On supported direct selling and other direct selling
With the renewal of the EEG, the legislature tightened the responsibilities of the operators of
electricity generation plants and made direct selling the standard selling option in the EEG.
According to the legislator, the direct selling of electricity from renewable energies and electricity
from PV plants comprises the sale to third parties when the electricity is passed through a grid
of public utilities and is not consumed by third parties in direct proximity to the installation § 5
number 9 EEG 2014. Both the supported and other direct selling is the sale of electricity to a
bulk purchaser or directly at the European Energy Exchange (EEX) in Leipzig. To promote the
direct selling of electricity from renewable energies, the legislator guarantees a remuneration at
least at the level of the feed-in tariff due to the market premium model. The market premium
compensates for the difference between the electricity price at the EEX and the fixed feed-in
tariff. In addition, the plant operator can generate further profit by selling the electricity at peak
load times at the EEX. Figure 2 shows the difference between the fixed feed-in tariff and direct
selling according to the market premium model. The EEG 2014 introduced a gradual obligation
to direct selling. For new installations with a total power of more than 500 kW from January 1,
2016 and for installations over 100 kW, direct selling is required. In addition to the supported
direct selling in the market premium model, the other direct selling option is still an available
alternative. The other direct selling option is the direct sale of electricity at the EEX without any
subsidies or promotion of the EEG. This selling option is still not profitable and therefore not
prevalent for PV plants.
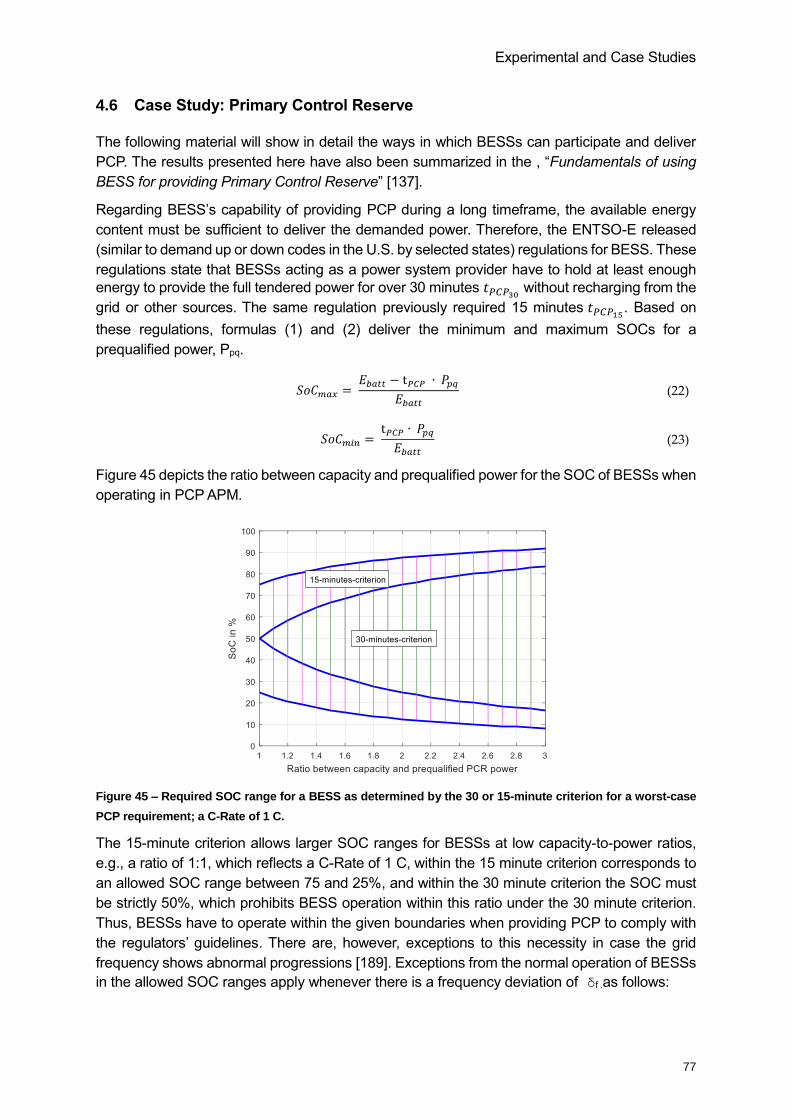
Experimental and Case Studies
77
4.6 Case Study: Primary Control Reserve
The following material will show in detail the ways in which BESSs can participate and deliver
PCP. The results presented here have also been summarized in the , “Fundamentals of using
BESS for providing Primary Control Reserve” [137].
Regarding BESS’s capability of providing PCP during a long timeframe, the available energy
content must be sufficient to deliver the demanded power. Therefore, the ENTSO-E released
(similar to demand up or down codes in the U.S. by selected states) regulations for BESS. These
regulations state that BESSs acting as a power system provider have to hold at least enough
energy to provide the full tendered power for over 30 minutes 𝑡𝑃𝐶𝑃30 without recharging from the
grid or other sources. The same regulation previously required 15 minutes 𝑡𝑃𝐶𝑃15. Based on
these regulations, formulas (1) and (2) deliver the minimum and maximum SOCs for a
prequalified power, Ppq.
𝑆𝑜𝐶𝑚𝑎𝑥 = 𝐸𝑏𝑎𝑡𝑡 − t𝑃𝐶𝑃 ∙ 𝑃𝑝𝑞
𝐸𝑏𝑎𝑡𝑡 (22)
𝑆𝑜𝐶𝑚𝑖𝑛 = t𝑃𝐶𝑃 ∙ 𝑃𝑝𝑞
𝐸𝑏𝑎𝑡𝑡 (23)
Figure 45 depicts the ratio between capacity and prequalified power for the SOC of BESSs when
operating in PCP APM.
Figure 45 – Required SOC range for a BESS as determined by the 30 or 15-minute criterion for a worst-case
PCP requirement; a C-Rate of 1 C.
The 15-minute criterion allows larger SOC ranges for BESSs at low capacity-to-power ratios,
e.g., a ratio of 1:1, which reflects a C-Rate of 1 C, within the 15 minute criterion corresponds to
an allowed SOC range between 75 and 25%, and within the 30 minute criterion the SOC must
be strictly 50%, which prohibits BESS operation within this ratio under the 30 minute criterion.
Thus, BESSs have to operate within the given boundaries when providing PCP to comply with
the regulators’ guidelines. There are, however, exceptions to this necessity in case the grid
frequency shows abnormal progressions [189]. Exceptions from the normal operation of BESSs
in the allowed SOC ranges apply whenever there is a frequency deviation of δf .as follows:
Experimental and Case Studies
78
• δf > ±50 mHz for more than 15 minutes applies
• δf > ±100 mHz for more than 5 minutes applies
• δf > ±200 mHz applies
If any one of the above criterions is fulfilled, the operators of BESSs providing PCP are given a
two-hour time frame to restore a permitted SOC according to Figure 45. This is specifically for
the analysis of historic frequencies necessary to achieve maximum utilization of BESSs
providing PCP.
In order to keep the battery SoC within the permitted range, several degrees of freedom
(DoFs), as defined in, are granted by the German TSOs. The DoFs presume that the
operators of PCP plants deviate slightly from the supply characteristic given in Figure
21; they are described in more detail below. The control power demand as indicated by
the P-f characteristic can be increased up to 20% at any time in order to modify the SoC.
The control power demand as indicated by the P-f characteristic can also be provided
within the tolerated deviation range of ±10 mHz if the SoC needs to be adjusted. The
control power demand as indicated by the P-f characteristic must be provided within 30
seconds or less. As appropriate for the current SoC, this minimum gradient can be used
in order to slow down the charging or discharging process of the battery. The most
important way to reach the desired state of charge is by trading energy on the electricity
market. By selling or buying energy on the European Energy Exchange (EPEX), the SoC
can be decreased or increased as required. This can be performed simultaneously with
providing the PCP power. [190]
As an application of the mentioned degrees of freedom, following the power-frequency
characteristic, BESSs are fully able to provide PCP under the mentioned conditions.
4.7 Case Study: Island Operation
Subchapter 4.7 gives a brief overview of a case study, “Sustainable power supply options for
large islands – a case study for Belitung Island” [191] co-authored by the author, that examines
the island of Belitung, Indonesia to gain a better understanding of BESS operation in island
grids. The operation of a BESS on an island can be evaluated from two different perspectives.
First, from an environmental perspective, i.e., decreasing carbon emissions on islands by
reducing fossil fuel demand, and second, from a technological perspective, i.e., developing
future reliable grids with the assistance of storage technology. The power demand of islands,
specifically in highly populated areas such as Southeast Asia, is expected to increase rapidly
over the next several decades. In many areas where such an increase is projected, e.g., the
island of Belitung, Indonesia, large fossil power plants are planned to accommodate the
upcoming demand. It is therefore appropriate analyze the impact of BESSs on the reduction of
carbon emissions in such an environment, and a simulation model was developed to identify
possible cost-effective integrations of BESSs on large islands. A mixed binary integer linear
programming model fits power generation technologies and storage technologies with hourly
resolution to serve the electricity demand at demand points. Electricity may be transported from
one demand point to another via transmission lines. At each demand point, any demand must
be covered hourly by either generation, storage or import from surrounding demand points.
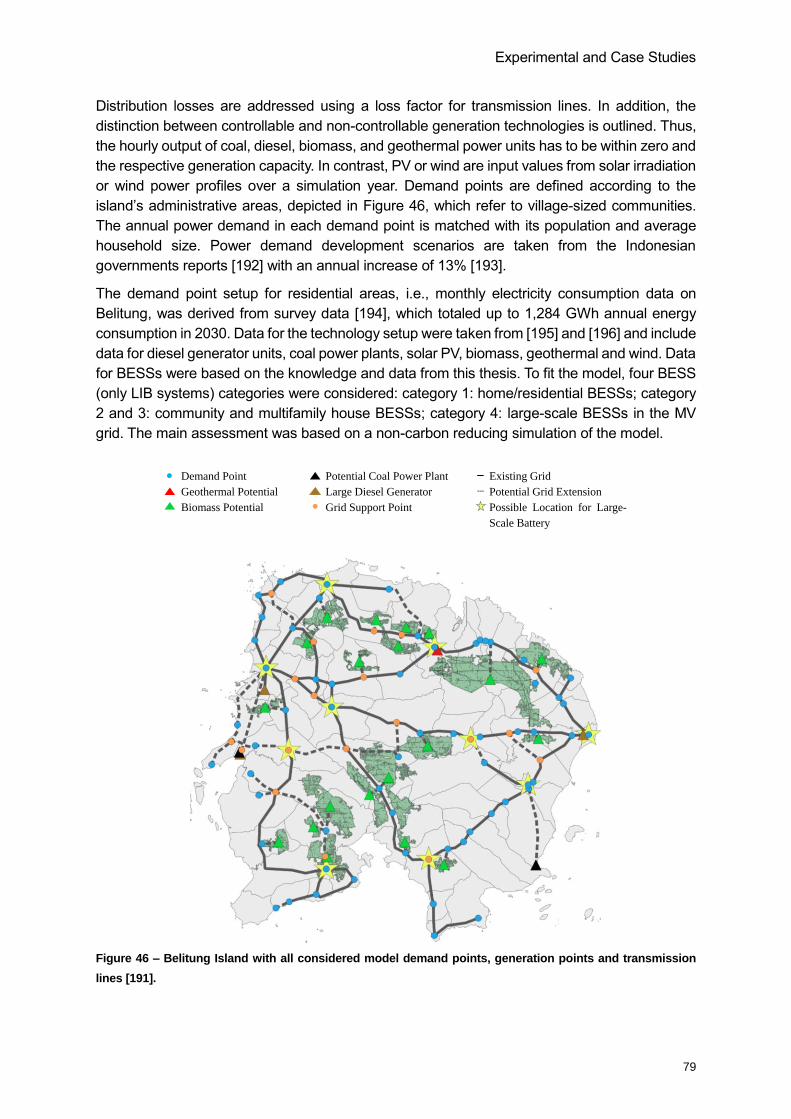
Experimental and Case Studies
79
Distribution losses are addressed using a loss factor for transmission lines. In addition, the
distinction between controllable and non-controllable generation technologies is outlined. Thus,
the hourly output of coal, diesel, biomass, and geothermal power units has to be within zero and
the respective generation capacity. In contrast, PV or wind are input values from solar irradiation
or wind power profiles over a simulation year. Demand points are defined according to the
island’s administrative areas, depicted in Figure 46, which refer to village-sized communities.
The annual power demand in each demand point is matched with its population and average
household size. Power demand development scenarios are taken from the Indonesian
governments reports [192] with an annual increase of 13% [193].
The demand point setup for residential areas, i.e., monthly electricity consumption data on
Belitung, was derived from survey data [194], which totaled up to 1,284 GWh annual energy
consumption in 2030. Data for the technology setup were taken from [195] and [196] and include
data for diesel generator units, coal power plants, solar PV, biomass, geothermal and wind. Data
for BESSs were based on the knowledge and data from this thesis. To fit the model, four BESS
(only LIB systems) categories were considered: category 1: home/residential BESSs; category
2 and 3: community and multifamily house BESSs; category 4: large-scale BESSs in the MV
grid. The main assessment was based on a non-carbon reducing simulation of the model.
Figure 46 – Belitung Island with all considered model demand points, generation points and transmission
lines [191].
Demand Point Potential Coal Power Plant Existing Grid
Geothermal Potential Large Diesel Generator Potential Grid Extension
Biomass Potential Grid Support Point Possible Location for Large-
Scale Battery
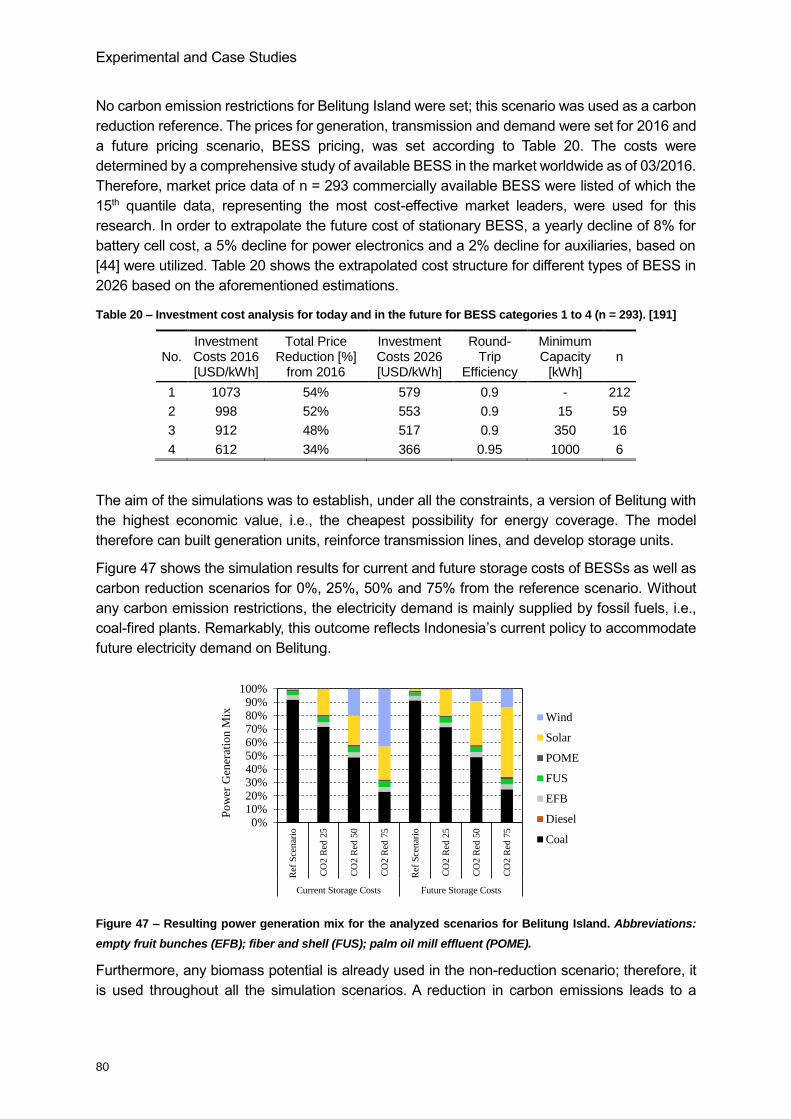
Experimental and Case Studies
80
No carbon emission restrictions for Belitung Island were set; this scenario was used as a carbon
reduction reference. The prices for generation, transmission and demand were set for 2016 and
a future pricing scenario, BESS pricing, was set according to Table 20. The costs were
determined by a comprehensive study of available BESS in the market worldwide as of 03/2016.
Therefore, market price data of n = 293 commercially available BESS were listed of which the
15th quantile data, representing the most cost-effective market leaders, were used for this
research. In order to extrapolate the future cost of stationary BESS, a yearly decline of 8% for
battery cell cost, a 5% decline for power electronics and a 2% decline for auxiliaries, based on
[44] were utilized. Table 20 shows the extrapolated cost structure for different types of BESS in
2026 based on the aforementioned estimations.
Table 20 – Investment cost analysis for today and in the future for BESS categories 1 to 4 (n = 293). [191]
No. Investment Costs 2016 [USD/kWh]
Total Price Reduction [%]
from 2016
Investment Costs 2026 [USD/kWh]
Round-Trip
Efficiency
Minimum Capacity
[kWh] n
1 1073 54% 579 0.9 - 212
2 998 52% 553 0.9 15 59
3 912 48% 517 0.9 350 16
4 612 34% 366 0.95 1000 6
The aim of the simulations was to establish, under all the constraints, a version of Belitung with
the highest economic value, i.e., the cheapest possibility for energy coverage. The model
therefore can built generation units, reinforce transmission lines, and develop storage units.
Figure 47 shows the simulation results for current and future storage costs of BESSs as well as
carbon reduction scenarios for 0%, 25%, 50% and 75% from the reference scenario. Without
any carbon emission restrictions, the electricity demand is mainly supplied by fossil fuels, i.e.,
coal-fired plants. Remarkably, this outcome reflects Indonesia’s current policy to accommodate
future electricity demand on Belitung.
Figure 47 – Resulting power generation mix for the analyzed scenarios for Belitung Island. Abbreviations:
empty fruit bunches (EFB); fiber and shell (FUS); palm oil mill effluent (POME).
Furthermore, any biomass potential is already used in the non-reduction scenario; therefore, it
is used throughout all the simulation scenarios. A reduction in carbon emissions leads to a
0%10%20%30%40%50%60%70%80%90%
100%
Ref
Sce
nar
io
CO
2 R
ed 2
5
CO
2 R
ed 5
0
CO
2 R
ed 7
5
Ref
Sce
nar
io
CO
2 R
ed 2
5
CO
2 R
ed 5
0
CO
2 R
ed 7
5
Current Storage Costs Future Storage Costs
Po
wer
Gen
erat
ion M
ix
Wind
Solar
POME
FUS
EFB
Diesel
Coal
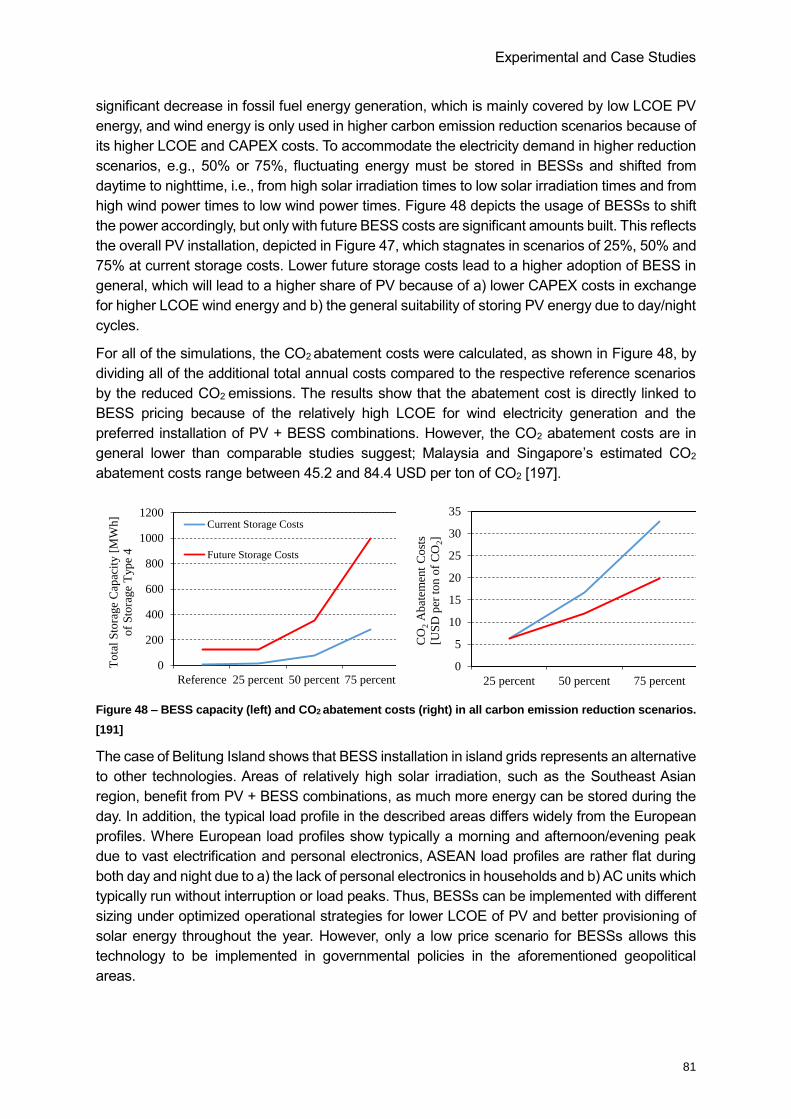
Experimental and Case Studies
81
significant decrease in fossil fuel energy generation, which is mainly covered by low LCOE PV
energy, and wind energy is only used in higher carbon emission reduction scenarios because of
its higher LCOE and CAPEX costs. To accommodate the electricity demand in higher reduction
scenarios, e.g., 50% or 75%, fluctuating energy must be stored in BESSs and shifted from
daytime to nighttime, i.e., from high solar irradiation times to low solar irradiation times and from
high wind power times to low wind power times. Figure 48 depicts the usage of BESSs to shift
the power accordingly, but only with future BESS costs are significant amounts built. This reflects
the overall PV installation, depicted in Figure 47, which stagnates in scenarios of 25%, 50% and
75% at current storage costs. Lower future storage costs lead to a higher adoption of BESS in
general, which will lead to a higher share of PV because of a) lower CAPEX costs in exchange
for higher LCOE wind energy and b) the general suitability of storing PV energy due to day/night
cycles.
For all of the simulations, the CO2 abatement costs were calculated, as shown in Figure 48, by
dividing all of the additional total annual costs compared to the respective reference scenarios
by the reduced CO2 emissions. The results show that the abatement cost is directly linked to
BESS pricing because of the relatively high LCOE for wind electricity generation and the
preferred installation of PV + BESS combinations. However, the CO2 abatement costs are in
general lower than comparable studies suggest; Malaysia and Singapore’s estimated CO2
abatement costs range between 45.2 and 84.4 USD per ton of CO2 [197].
Figure 48 – BESS capacity (left) and CO2 abatement costs (right) in all carbon emission reduction scenarios.
[191]
The case of Belitung Island shows that BESS installation in island grids represents an alternative
to other technologies. Areas of relatively high solar irradiation, such as the Southeast Asian
region, benefit from PV + BESS combinations, as much more energy can be stored during the
day. In addition, the typical load profile in the described areas differs widely from the European
profiles. Where European load profiles show typically a morning and afternoon/evening peak
due to vast electrification and personal electronics, ASEAN load profiles are rather flat during
both day and night due to a) the lack of personal electronics in households and b) AC units which
typically run without interruption or load peaks. Thus, BESSs can be implemented with different
sizing under optimized operational strategies for lower LCOE of PV and better provisioning of
solar energy throughout the year. However, only a low price scenario for BESSs allows this
technology to be implemented in governmental policies in the aforementioned geopolitical
areas.
0
200
400
600
800
1000
1200
Reference 25 percent 50 percent 75 percent
To
tal
Sto
rage
Cap
acit
y [
MW
h]
of
Sto
rage
Typ
e 4
Current Storage Costs
Future Storage Costs
0
5
10
15
20
25
30
35
25 percent 50 percent 75 percent
CO
2A
bat
emen
t C
ost
s
[US
D p
er t
on o
f C
O2]
Reduction of CO2 emissions based on reference scenario
Current Storage Costs
Future Storage Costs
0
5
10
15
20
25
30
35
25 percent 50 percent 75 percent
CO
2A
bat
emen
t C
ost
s
[US
D p
er t
on o
f C
O2]
Reduction of CO2 emissions based on reference scenario
Current Storage Costs
Future Storage Costs
Experimental and Case Studies
82
4.8 Conclusion
Within the scope of this chapter, two excursuses and five case studies were analyzed and
provided information to yield a broad understanding of LIB BESSs in different markets and
varying APMs. Chapter 4.1 provides an overview of the economic value of APMs for BESSs
when such systems are implemented in different grid levels (LV/MV/HV). BESS technology, first
and foremost the LIB technology, is highly adaptable for any grid level; however, the overall
potential for the greatest positive influence on the grid and a systems’ economic value is better
in certain grid levels than others. Because of a nearly unbounded ratio choice between power
and energy, BESSs are suitable for a flexible design to serve any APM in any grid level. (See
Subchapter 2.1 for more information on BESS design and system architecture.) A comparison
between BESSs installed in different grid levels reveals that many of these systems can operate,
in theory, within positive economic values. However, until now, there has not been a wide range
analysis of MP-BESS to increase the economic value or positive effects on grids by
systematically stacking APMs and increasing the utilization of BESS, which would result in a
lower CAPEX.
In general, the integration of BESSs in LV grids allows the operators of such systems to provide
nearly any APM that has been identified, see Subchapter 2.3. A BESS in an LV grid can provide
frequency regulation services for grid stability, increase the SCR for a community, thus saving
electricity expenses, and provide local UPS functionality, among other favorable results. The
results show that LV grids are of interest because LV BESSs can serve any APM that an MV or
HV BESS serves, whereas an MV BESS cannot serve certain LV APMs. Substituting a large
central MV BESS, e.g., a 5 MWh and 5 MW central BESS, with smaller entities, e.g., 10x 500
kWh and 500 kW decentral BESSs in an LV grid level, allows operators of these to offer APMs
in the LV grid in addition to the MV grid level and extend to MV and HV grid APMs. Drawbacks
are higher installation, maintenance costs and higher coordination effort between a fleet of
decentral BESS.
The results from analyzing BESS behavior when operating as residential home storage assume
that BESSs for single family homes will become economically viable over a broader range
without subsidies in the near future. However, this expectation seems to depend largely on
electricity prices and regulations; thus, it should not be used for economic market predictions in
the future.
BESSs operating in multi-family homes were analyzed and examined from a legal point of view.
BESSs in a multi-family home environment can only be operated in a meaningful way by
establishing a consistent smart-metering concept. Thereby, such concepts need to ensure that
any legal circumstances given by laws and regulations, e.g., tenant freedom to choose their
electricity provider, remain valid. However, apart from legal concerns for such concepts, BESSs
in multi-family environments lack economic value mostly because of the low ratio of PV system
size and load. In general, either subsidies or decreasing prices for BESSs will lead to the broader
adaptation of BESSs in such environments.
Regarding operating a BESS for ancillary services, i.e., PCP in the outlined case study, the 30
minute and 15-minute requirements for prequalification have been investigated in detail.
Generally, if the boundaries that have been set by the German TSOs for PCP hold true, BESSs
can provide PCP with high quality. BESS operation with APM PCP yields positive income and,

Experimental and Case Studies
83
for Germany, several large systems have been and will be built. However, market limitations in
size and flexibility may lead to a decrease in revenue and ultimately to a recession in this market
when BESSs have fully supplanted other technologies in the future.
The appearance of increasing CO2 reduction in potential energy production on islands leads to
higher costs for systems powered with BESS assistance. This effect, as of the current prices, is
fundamentally based on the pricing of such systems. However, it is unclear whether BESSs yield
the most economic and technically feasible results for reducing CO2 emissions in scattered
island areas worldwide because of the economic differences between continents, regions and
countries. It can be seen, however, that a RES – BESS combination will yield positive revenue
streams after a few years of operation. Especially high fossil fuel costs could lead to investments
into RES – BESS instead of diesel generators; the main challenge remains the large
investments which is needed upfront for the implementation of a large RES fleet coupled with
BESS.
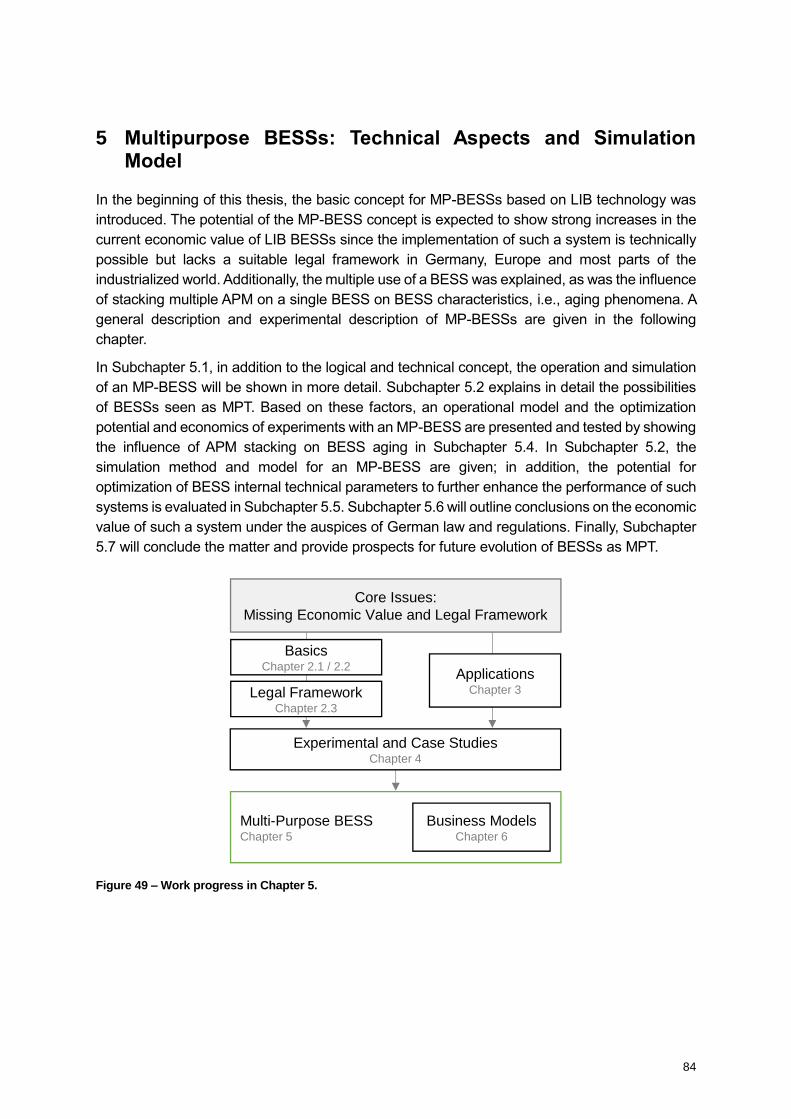
84
5 Multipurpose BESSs: Technical Aspects and Simulation Model
In the beginning of this thesis, the basic concept for MP-BESSs based on LIB technology was
introduced. The potential of the MP-BESS concept is expected to show strong increases in the
current economic value of LIB BESSs since the implementation of such a system is technically
possible but lacks a suitable legal framework in Germany, Europe and most parts of the
industrialized world. Additionally, the multiple use of a BESS was explained, as was the influence
of stacking multiple APM on a single BESS on BESS characteristics, i.e., aging phenomena. A
general description and experimental description of MP-BESSs are given in the following
chapter.
In Subchapter 5.1, in addition to the logical and technical concept, the operation and simulation
of an MP-BESS will be shown in more detail. Subchapter 5.2 explains in detail the possibilities
of BESSs seen as MPT. Based on these factors, an operational model and the optimization
potential and economics of experiments with an MP-BESS are presented and tested by showing
the influence of APM stacking on BESS aging in Subchapter 5.4. In Subchapter 5.2, the
simulation method and model for an MP-BESS are given; in addition, the potential for
optimization of BESS internal technical parameters to further enhance the performance of such
systems is evaluated in Subchapter 5.5. Subchapter 5.6 will outline conclusions on the economic
value of such a system under the auspices of German law and regulations. Finally, Subchapter
5.7 will conclude the matter and provide prospects for future evolution of BESSs as MPT.
Figure 49 – Work progress in Chapter 5.
Core Issues:
Missing Economic Value and Legal Framework
Legal FrameworkChapter 2.3
Experimental and Case StudiesChapter 4
Multi-Purpose BESSChapter 5
Business ModelsChapter 6
ApplicationsChapter 3
BasicsChapter 2.1 / 2.2
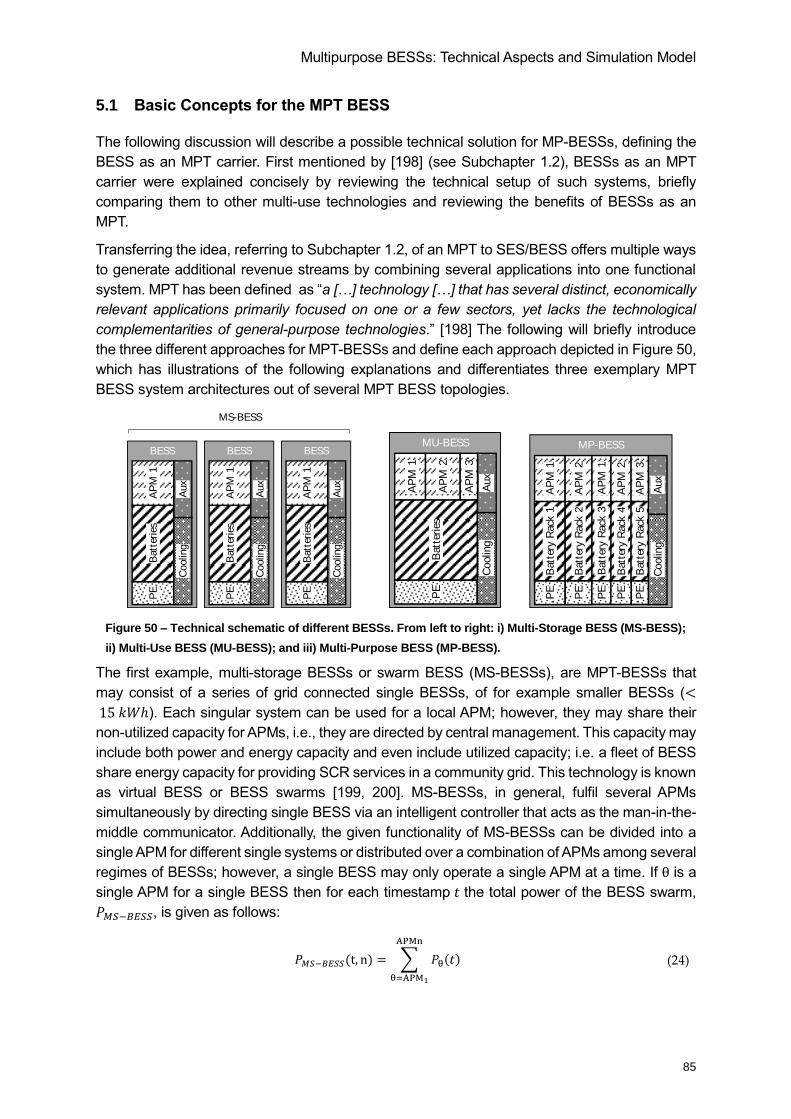
Multipurpose BESSs: Technical Aspects and Simulation Model
85
5.1 Basic Concepts for the MPT BESS
The following discussion will describe a possible technical solution for MP-BESSs, defining the
BESS as an MPT carrier. First mentioned by [198] (see Subchapter 1.2), BESSs as an MPT
carrier were explained concisely by reviewing the technical setup of such systems, briefly
comparing them to other multi-use technologies and reviewing the benefits of BESSs as an
MPT.
Transferring the idea, referring to Subchapter 1.2, of an MPT to SES/BESS offers multiple ways
to generate additional revenue streams by combining several applications into one functional
system. MPT has been defined as “a […] technology […] that has several distinct, economically
relevant applications primarily focused on one or a few sectors, yet lacks the technological
complementarities of general-purpose technologies.” [198] The following will briefly introduce
the three different approaches for MPT-BESSs and define each approach depicted in Figure 50,
which has illustrations of the following explanations and differentiates three exemplary MPT
BESS system architectures out of several MPT BESS topologies.
The first example, multi-storage BESSs or swarm BESS (MS-BESSs), are MPT-BESSs that
may consist of a series of grid connected single BESSs, of for example smaller BESSs (<
15 𝑘𝑊ℎ). Each singular system can be used for a local APM; however, they may share their
non-utilized capacity for APMs, i.e., they are directed by central management. This capacity may
include both power and energy capacity and even include utilized capacity; i.e. a fleet of BESS
share energy capacity for providing SCR services in a community grid. This technology is known
as virtual BESS or BESS swarms [199, 200]. MS-BESSs, in general, fulfil several APMs
simultaneously by directing single BESS via an intelligent controller that acts as the man-in-the-
middle communicator. Additionally, the given functionality of MS-BESSs can be divided into a
single APM for different single systems or distributed over a combination of APMs among several
regimes of BESSs; however, a single BESS may only operate a single APM at a time. If θ is a
single APM for a single BESS then for each timestamp 𝑡 the total power of the BESS swarm,
𝑃𝑀𝑆 𝐵𝐸𝑆𝑆, is given as follows:
𝑃𝑀𝑆 𝐵𝐸𝑆𝑆(t, ) = ∑ 𝑃θ(𝑡)
Mn
θ= M1
(24)
Figure 50 – Technical schematic of different BESSs. From left to right: i) Multi-Storage BESS (MS-BESS);
ii) Multi-Use BESS (MU-BESS); and iii) Multi-Purpose BESS (MP-BESS).
BESS
Batt
erie
sA
PM
1P
E
Coolin
gA
ux
BESS
Batt
erie
sA
PM
1P
E
Coolin
gA
ux
BESS
Batt
erie
sA
PM
1P
E
Coolin
gA
ux
MS-BESS
MU-BESSB
att
erie
s
AP
M 1
PE
Coolin
gA
ux
AP
M 2
AP
M 3
MP-BESS
Bat
tery
Rac
k 1
AP
M 1
PE
Coolin
gA
ux
AP
M 2
Batt
ery
Rack
2P
E
PE
PE
PE
AP
M 1
Bat
tery
Rac
k 3
AP
M 2
Batt
ery
Rack
4
AP
M 3
Batt
ery
Rack
5
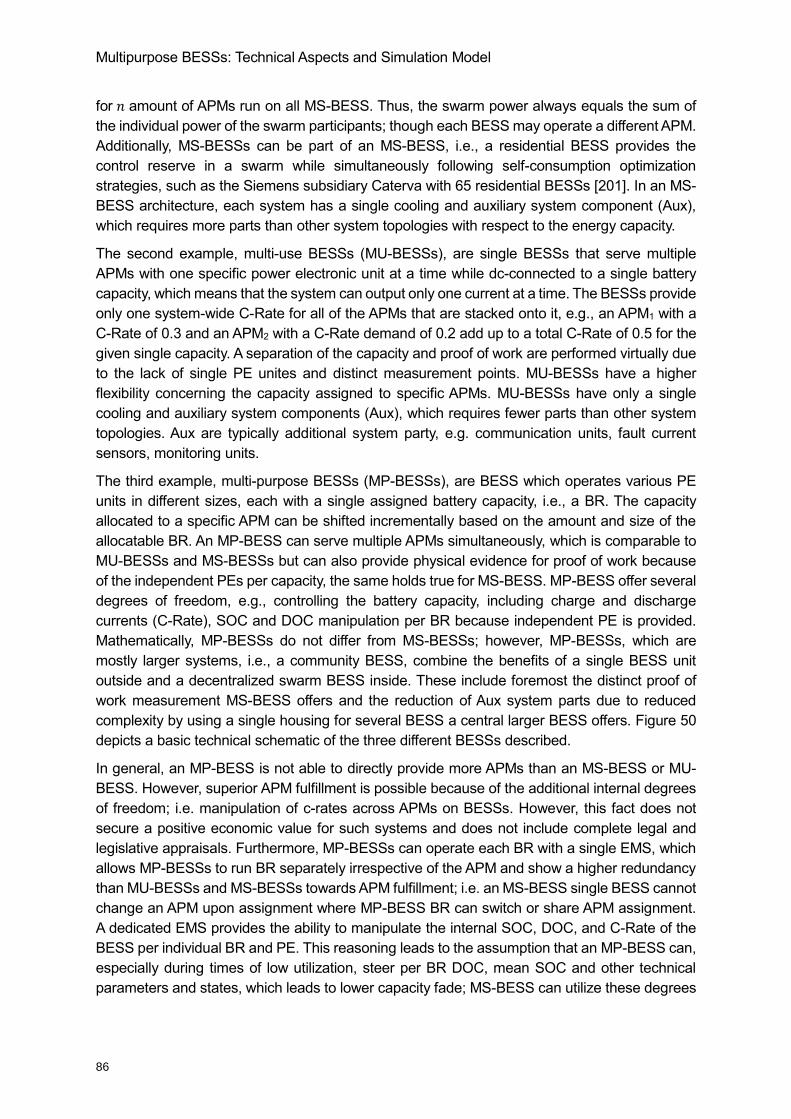
Multipurpose BESSs: Technical Aspects and Simulation Model
86
for 𝑛 amount of APMs run on all MS-BESS. Thus, the swarm power always equals the sum of
the individual power of the swarm participants; though each BESS may operate a different APM.
Additionally, MS-BESSs can be part of an MS-BESS, i.e., a residential BESS provides the
control reserve in a swarm while simultaneously following self-consumption optimization
strategies, such as the Siemens subsidiary Caterva with 65 residential BESSs [201]. In an MS-
BESS architecture, each system has a single cooling and auxiliary system component (Aux),
which requires more parts than other system topologies with respect to the energy capacity.
The second example, multi-use BESSs (MU-BESSs), are single BESSs that serve multiple
APMs with one specific power electronic unit at a time while dc-connected to a single battery
capacity, which means that the system can output only one current at a time. The BESSs provide
only one system-wide C-Rate for all of the APMs that are stacked onto it, e.g., an APM1 with a
C-Rate of 0.3 and an APM2 with a C-Rate demand of 0.2 add up to a total C-Rate of 0.5 for the
given single capacity. A separation of the capacity and proof of work are performed virtually due
to the lack of single PE unites and distinct measurement points. MU-BESSs have a higher
flexibility concerning the capacity assigned to specific APMs. MU-BESSs have only a single
cooling and auxiliary system components (Aux), which requires fewer parts than other system
topologies. Aux are typically additional system party, e.g. communication units, fault current
sensors, monitoring units.
The third example, multi-purpose BESSs (MP-BESSs), are BESS which operates various PE
units in different sizes, each with a single assigned battery capacity, i.e., a BR. The capacity
allocated to a specific APM can be shifted incrementally based on the amount and size of the
allocatable BR. An MP-BESS can serve multiple APMs simultaneously, which is comparable to
MU-BESSs and MS-BESSs but can also provide physical evidence for proof of work because
of the independent PEs per capacity, the same holds true for MS-BESS. MP-BESS offer several
degrees of freedom, e.g., controlling the battery capacity, including charge and discharge
currents (C-Rate), SOC and DOC manipulation per BR because independent PE is provided.
Mathematically, MP-BESSs do not differ from MS-BESSs; however, MP-BESSs, which are
mostly larger systems, i.e., a community BESS, combine the benefits of a single BESS unit
outside and a decentralized swarm BESS inside. These include foremost the distinct proof of
work measurement MS-BESS offers and the reduction of Aux system parts due to reduced
complexity by using a single housing for several BESS a central larger BESS offers. Figure 50
depicts a basic technical schematic of the three different BESSs described.
In general, an MP-BESS is not able to directly provide more APMs than an MS-BESS or MU-
BESS. However, superior APM fulfillment is possible because of the additional internal degrees
of freedom; i.e. manipulation of c-rates across APMs on BESSs. However, this fact does not
secure a positive economic value for such systems and does not include complete legal and
legislative appraisals. Furthermore, MP-BESSs can operate each BR with a single EMS, which
allows MP-BESSs to run BR separately irrespective of the APM and show a higher redundancy
than MU-BESSs and MS-BESSs towards APM fulfillment; i.e. an MS-BESS single BESS cannot
change an APM upon assignment where MP-BESS BR can switch or share APM assignment.
A dedicated EMS provides the ability to manipulate the internal SOC, DOC, and C-Rate of the
BESS per individual BR and PE. This reasoning leads to the assumption that an MP-BESS can,
especially during times of low utilization, steer per BR DOC, mean SOC and other technical
parameters and states, which leads to lower capacity fade; MS-BESS can utilize these degrees
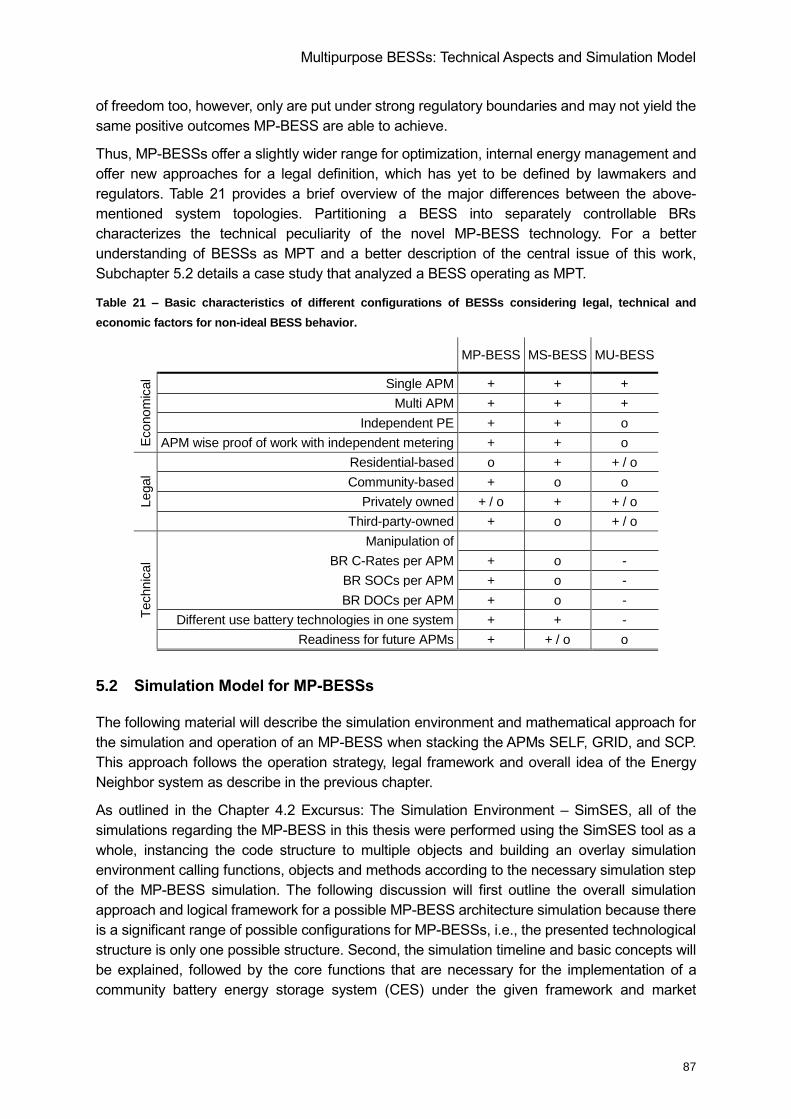
Multipurpose BESSs: Technical Aspects and Simulation Model
87
of freedom too, however, only are put under strong regulatory boundaries and may not yield the
same positive outcomes MP-BESS are able to achieve.
Thus, MP-BESSs offer a slightly wider range for optimization, internal energy management and
offer new approaches for a legal definition, which has yet to be defined by lawmakers and
regulators. Table 21 provides a brief overview of the major differences between the above-
mentioned system topologies. Partitioning a BESS into separately controllable BRs
characterizes the technical peculiarity of the novel MP-BESS technology. For a better
understanding of BESSs as MPT and a better description of the central issue of this work,
Subchapter 5.2 details a case study that analyzed a BESS operating as MPT.
Table 21 – Basic characteristics of different configurations of BESSs considering legal, technical and
economic factors for non-ideal BESS behavior.
MP-BESS MS-BESS MU-BESS
Econom
ical Single APM + + +
Multi APM + + +
Independent PE + + o
APM wise proof of work with independent metering + + o
Legal
Residential-based o + + / o
Community-based + o o
Privately owned + / o + + / o
Third-party-owned + o + / o
Technic
al
Manipulation of
BR C-Rates per APM + o -
BR SOCs per APM + o -
BR DOCs per APM + o -
Different use battery technologies in one system + + -
Readiness for future APMs + + / o o
5.2 Simulation Model for MP-BESSs
The following material will describe the simulation environment and mathematical approach for
the simulation and operation of an MP-BESS when stacking the APMs SELF, GRID, and SCP.
This approach follows the operation strategy, legal framework and overall idea of the Energy
Neighbor system as describe in the previous chapter.
As outlined in the Chapter 4.2 Excursus: The Simulation Environment – SimSES, all of the
simulations regarding the MP-BESS in this thesis were performed using the SimSES tool as a
whole, instancing the code structure to multiple objects and building an overlay simulation
environment calling functions, objects and methods according to the necessary simulation step
of the MP-BESS simulation. The following discussion will first outline the overall simulation
approach and logical framework for a possible MP-BESS architecture simulation because there
is a significant range of possible configurations for MP-BESSs, i.e., the presented technological
structure is only one possible structure. Second, the simulation timeline and basic concepts will
be explained, followed by the core functions that are necessary for the implementation of a
community battery energy storage system (CES) under the given framework and market
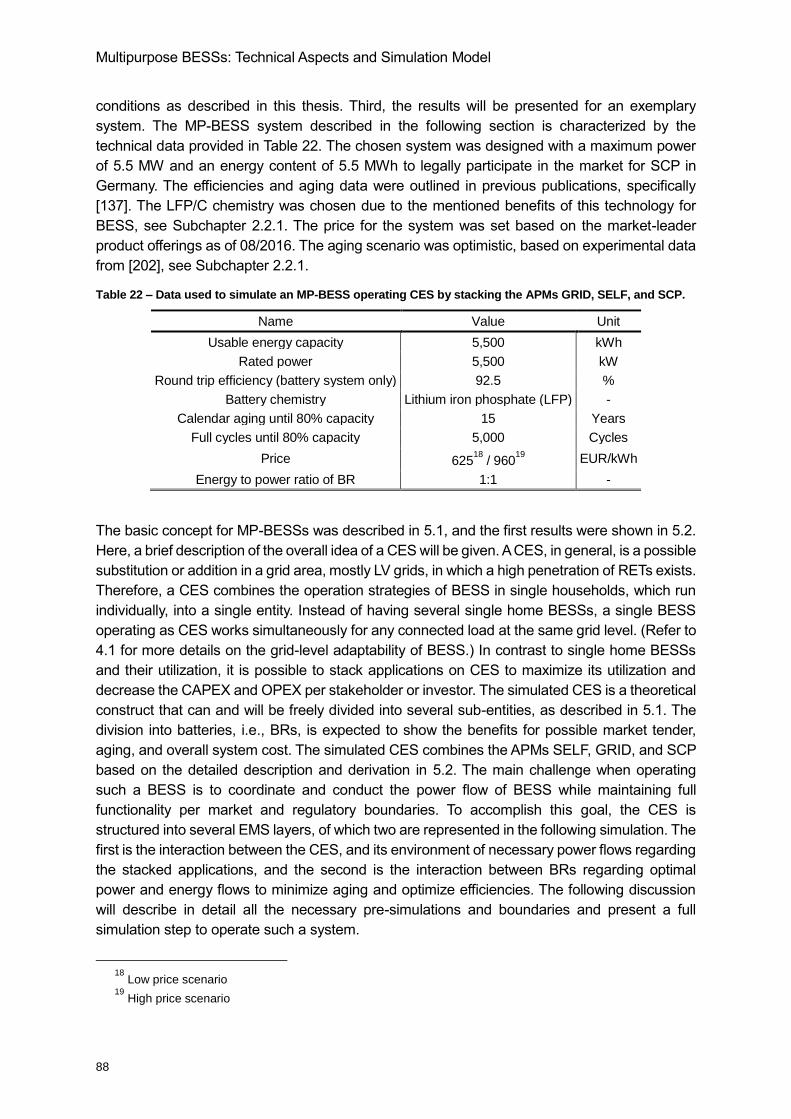
Multipurpose BESSs: Technical Aspects and Simulation Model
88
conditions as described in this thesis. Third, the results will be presented for an exemplary
system. The MP-BESS system described in the following section is characterized by the
technical data provided in Table 22. The chosen system was designed with a maximum power
of 5.5 MW and an energy content of 5.5 MWh to legally participate in the market for SCP in
Germany. The efficiencies and aging data were outlined in previous publications, specifically
[137]. The LFP/C chemistry was chosen due to the mentioned benefits of this technology for
BESS, see Subchapter 2.2.1. The price for the system was set based on the market-leader
product offerings as of 08/2016. The aging scenario was optimistic, based on experimental data
from [202], see Subchapter 2.2.1.
Table 22 – Data used to simulate an MP-BESS operating CES by stacking the APMs GRID, SELF, and SCP.
Name Value Unit
Usable energy capacity 5,500 kWh
Rated power 5,500 kW
Round trip efficiency (battery system only) 92.5 %
Battery chemistry Lithium iron phosphate (LFP) -
Calendar aging until 80% capacity 15 Years
Full cycles until 80% capacity 5,000 Cycles
Price 62518
/ 96019
EUR/kWh
Energy to power ratio of BR 1:1 -
The basic concept for MP-BESSs was described in 5.1, and the first results were shown in 5.2.
Here, a brief description of the overall idea of a CES will be given. A CES, in general, is a possible
substitution or addition in a grid area, mostly LV grids, in which a high penetration of RETs exists.
Therefore, a CES combines the operation strategies of BESS in single households, which run
individually, into a single entity. Instead of having several single home BESSs, a single BESS
operating as CES works simultaneously for any connected load at the same grid level. (Refer to
4.1 for more details on the grid-level adaptability of BESS.) In contrast to single home BESSs
and their utilization, it is possible to stack applications on CES to maximize its utilization and
decrease the CAPEX and OPEX per stakeholder or investor. The simulated CES is a theoretical
construct that can and will be freely divided into several sub-entities, as described in 5.1. The
division into batteries, i.e., BRs, is expected to show the benefits for possible market tender,
aging, and overall system cost. The simulated CES combines the APMs SELF, GRID, and SCP
based on the detailed description and derivation in 5.2. The main challenge when operating
such a BESS is to coordinate and conduct the power flow of BESS while maintaining full
functionality per market and regulatory boundaries. To accomplish this goal, the CES is
structured into several EMS layers, of which two are represented in the following simulation. The
first is the interaction between the CES, and its environment of necessary power flows regarding
the stacked applications, and the second is the interaction between BRs regarding optimal
power and energy flows to minimize aging and optimize efficiencies. The following discussion
will describe in detail all the necessary pre-simulations and boundaries and present a full
simulation step to operate such a system.
18
Low price scenario 19
High price scenario
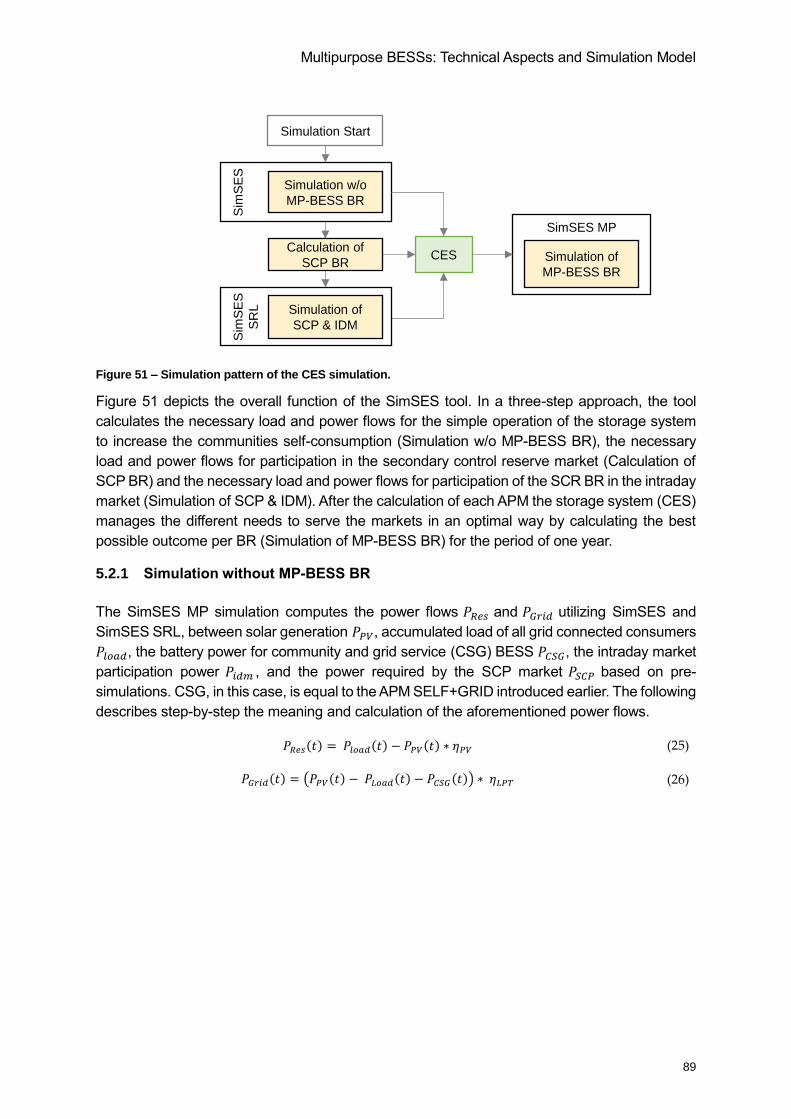
Multipurpose BESSs: Technical Aspects and Simulation Model
89
Figure 51 – Simulation pattern of the CES simulation.
Figure 51 depicts the overall function of the SimSES tool. In a three-step approach, the tool
calculates the necessary load and power flows for the simple operation of the storage system
to increase the communities self-consumption (Simulation w/o MP-BESS BR), the necessary
load and power flows for participation in the secondary control reserve market (Calculation of
SCP BR) and the necessary load and power flows for participation of the SCR BR in the intraday
market (Simulation of SCP & IDM). After the calculation of each APM the storage system (CES)
manages the different needs to serve the markets in an optimal way by calculating the best
possible outcome per BR (Simulation of MP-BESS BR) for the period of one year.
5.2.1 Simulation without MP-BESS BR
The SimSES MP simulation computes the power flows 𝑃𝑅𝑒𝑠 and 𝑃𝐺𝑟𝑖𝑑 utilizing SimSES and
SimSES SRL, between solar generation 𝑃𝑃𝑉, accumulated load of all grid connected consumers
𝑃𝑙𝑜𝑎𝑑, the battery power for community and grid service (CSG) BESS 𝑃𝐶𝑆𝐺, the intraday market
participation power 𝑃𝑖𝑑𝑚 , and the power required by the SCP market 𝑃𝑆𝐶𝑃 based on pre-
simulations. CSG, in this case, is equal to the APM SELF+GRID introduced earlier. The following
describes step-by-step the meaning and calculation of the aforementioned power flows.
𝑃𝑅𝑒𝑠(𝑡) = 𝑃𝑙𝑜𝑎𝑑(𝑡) − 𝑃𝑃𝑉(𝑡) ∗ 𝜂𝑃𝑉 (25)
𝑃𝐺𝑟𝑖𝑑(𝑡) = (𝑃𝑃𝑉(𝑡) − 𝑃𝐿𝑜𝑎𝑑(𝑡) − 𝑃𝐶𝑆𝐺(𝑡)) ∗ 𝜂𝐿𝑃𝑇 (26)
SimSES MPS
imS
ES
SR
L
Sim
SE
SCalculation of
SCP BRCES
Simulation of
SCP & IDM
Simulation of
MP-BESS BR
Simulation w/o
MP-BESS BR
Simulation Start
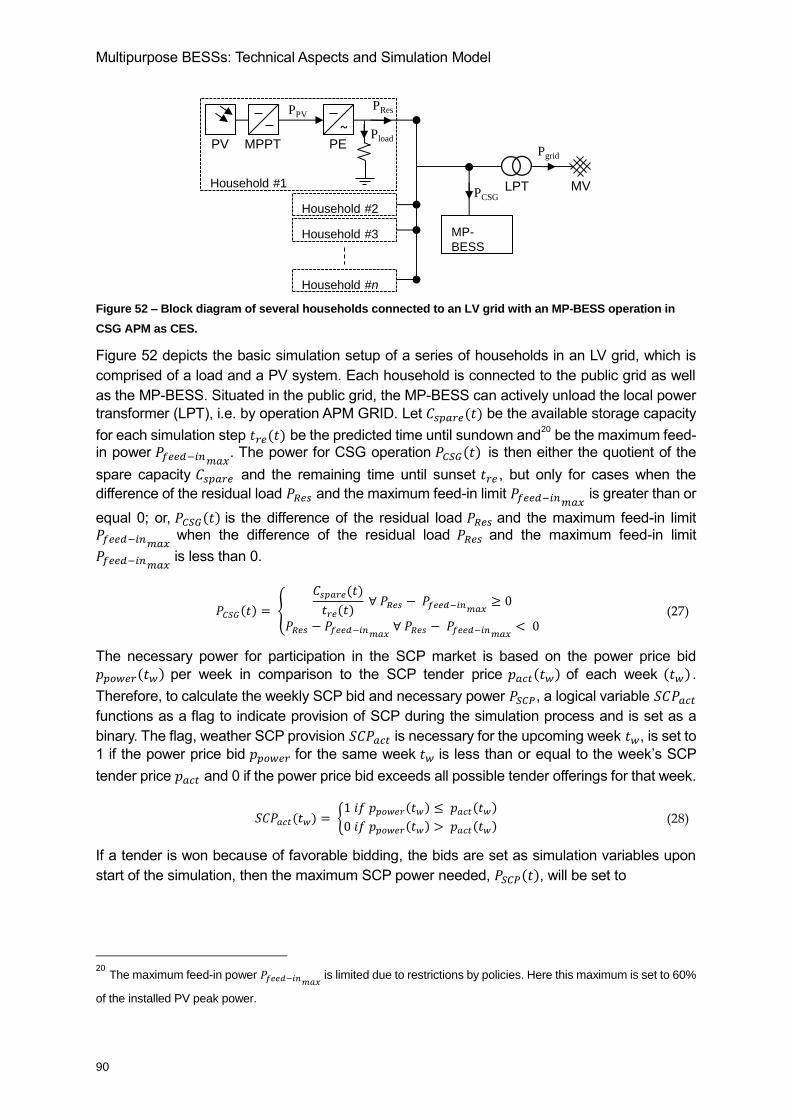
Multipurpose BESSs: Technical Aspects and Simulation Model
90
Figure 52 – Block diagram of several households connected to an LV grid with an MP-BESS operation in
CSG APM as CES.
Figure 52 depicts the basic simulation setup of a series of households in an LV grid, which is
comprised of a load and a PV system. Each household is connected to the public grid as well
as the MP-BESS. Situated in the public grid, the MP-BESS can actively unload the local power
transformer (LPT), i.e. by operation APM GRID. Let 𝐶𝑠𝑝𝑎𝑟𝑒(𝑡) be the available storage capacity
for each simulation step 𝑡𝑟𝑒(𝑡) be the predicted time until sundown and20
be the maximum feed-in power 𝑃𝑓𝑒𝑒𝑑 𝑖𝑛𝑚𝑎𝑥
. The power for CSG operation 𝑃𝐶𝑆𝐺(𝑡) is then either the quotient of the
spare capacity 𝐶𝑠𝑝𝑎𝑟𝑒 and the remaining time until sunset 𝑡𝑟𝑒 , but only for cases when the
difference of the residual load 𝑃𝑅𝑒𝑠 and the maximum feed-in limit 𝑃𝑓𝑒𝑒𝑑 𝑖𝑛𝑚𝑎𝑥 is greater than or
equal 0; or, 𝑃𝐶𝑆𝐺(𝑡) is the difference of the residual load 𝑃𝑅𝑒𝑠 and the maximum feed-in limit 𝑃𝑓𝑒𝑒𝑑 𝑖𝑛𝑚𝑎𝑥
when the difference of the residual load 𝑃𝑅𝑒𝑠 and the maximum feed-in limit
𝑃𝑓𝑒𝑒𝑑 𝑖𝑛𝑚𝑎𝑥 is less than 0.
𝑃𝐶𝑆𝐺(𝑡) = {
𝐶𝑠𝑝𝑎𝑟𝑒(𝑡)
𝑡𝑟𝑒(𝑡) ∀ 𝑃𝑅𝑒𝑠 − 𝑃𝑓𝑒𝑒𝑑 𝑖𝑛𝑚𝑎𝑥
≥ 0
𝑃𝑅𝑒𝑠 − 𝑃𝑓𝑒𝑒𝑑 𝑖𝑛𝑚𝑎𝑥 ∀ 𝑃𝑅𝑒𝑠 − 𝑃𝑓𝑒𝑒𝑑 𝑖𝑛𝑚𝑎𝑥
< 0 (27)
The necessary power for participation in the SCP market is based on the power price bid
𝑝𝑝𝑜𝑤𝑒𝑟(𝑡𝑤) per week in comparison to the SCP tender price 𝑝𝑎𝑐𝑡(𝑡𝑤) of each week (𝑡𝑤) .
Therefore, to calculate the weekly SCP bid and necessary power 𝑃𝑆𝐶𝑃, a logical variable 𝑆𝐶𝑃𝑎𝑐𝑡
functions as a flag to indicate provision of SCP during the simulation process and is set as a
binary. The flag, weather SCP provision 𝑆𝐶𝑃𝑎𝑐𝑡 is necessary for the upcoming week 𝑡𝑤, is set to
1 if the power price bid 𝑝𝑝𝑜𝑤𝑒𝑟 for the same week 𝑡𝑤 is less than or equal to the week’s SCP
tender price 𝑝𝑎𝑐𝑡 and 0 if the power price bid exceeds all possible tender offerings for that week.
𝑆𝐶𝑃𝑎𝑐𝑡(𝑡𝑤) = {1 𝑖𝑓 𝑝𝑝𝑜𝑤𝑒𝑟(𝑡𝑤) ≤ 𝑝𝑎𝑐𝑡(𝑡𝑤)
0 𝑖𝑓 𝑝𝑝𝑜𝑤𝑒𝑟(𝑡𝑤) > 𝑝𝑎𝑐𝑡(𝑡𝑤) (28)
If a tender is won because of favorable bidding, the bids are set as simulation variables upon
start of the simulation, then the maximum SCP power needed, 𝑃𝑆𝐶𝑃(𝑡), will be set to
20
The maximum feed-in power 𝑃𝑓𝑒𝑒𝑑 𝑖𝑛𝑚𝑎𝑥 is limited due to restrictions by policies. Here this maximum is set to 60%
of the installed PV peak power.
MP-
BESS
Household #1
~
Household #2
Household #3
Household #n
PV MPPT PE
LPT MV
Pload
PPV
Pgrid
PCSG
PRes
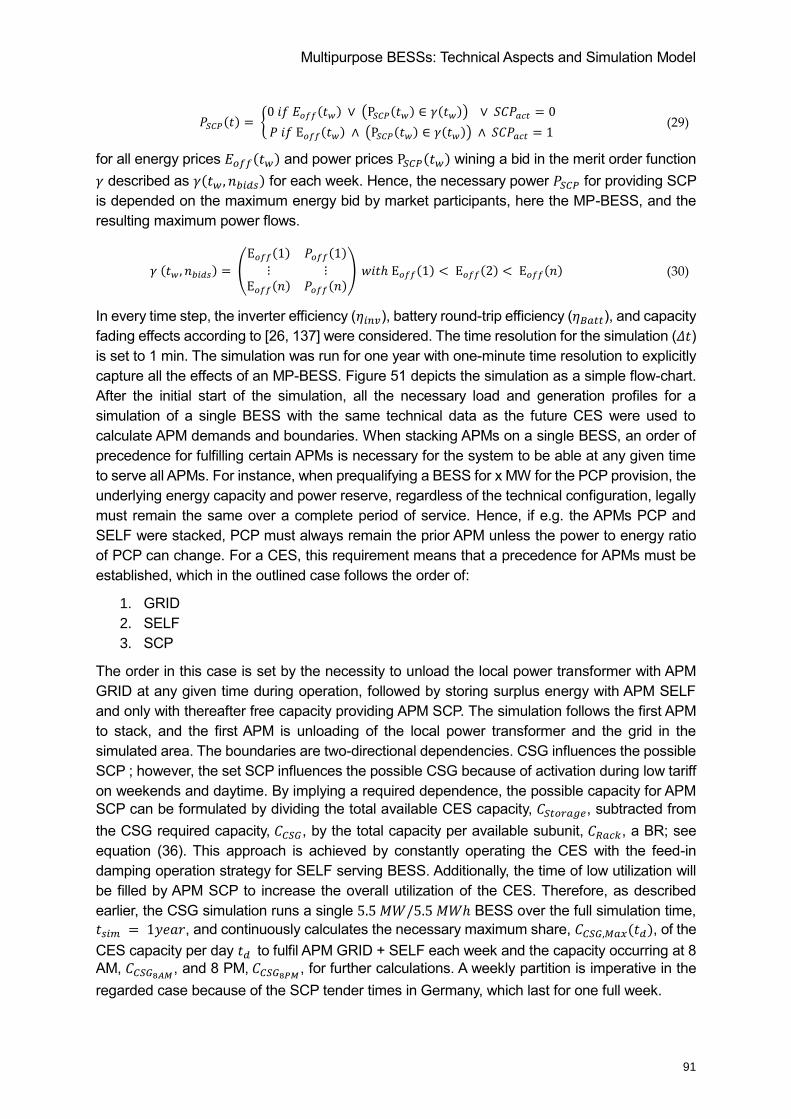
Multipurpose BESSs: Technical Aspects and Simulation Model
91
𝑃𝑆𝐶𝑃(𝑡) = {0 𝑖𝑓 𝐸𝑜𝑓𝑓(𝑡𝑤) ∨ (P𝑆𝐶𝑃(𝑡𝑤) ∈ 𝛾(𝑡𝑤)) ∨ 𝑆𝐶𝑃𝑎𝑐𝑡 = 0
𝑃 𝑖𝑓 E𝑜𝑓𝑓(𝑡𝑤) ∧ (P𝑆𝐶𝑃(𝑡𝑤) ∈ 𝛾(𝑡𝑤)) ∧ 𝑆𝐶𝑃𝑎𝑐𝑡 = 1 (29)
for all energy prices 𝐸𝑜𝑓𝑓(𝑡𝑤) and power prices P𝑆𝐶𝑃(𝑡𝑤) wining a bid in the merit order function
𝛾 described as 𝛾(𝑡𝑤 , 𝑛𝑏𝑖𝑑𝑠) for each week. Hence, the necessary power 𝑃𝑆𝐶𝑃 for providing SCP
is depended on the maximum energy bid by market participants, here the MP-BESS, and the
resulting maximum power flows.
𝛾 (𝑡𝑤 , 𝑛𝑏𝑖𝑑𝑠) = (
E𝑜𝑓𝑓(1) 𝑃𝑜𝑓𝑓(1)
⋮ ⋮E𝑜𝑓𝑓(𝑛) 𝑃𝑜𝑓𝑓(𝑛)
) 𝑤𝑖𝑡ℎ E𝑜𝑓𝑓(1) < E𝑜𝑓𝑓(2) < E𝑜𝑓𝑓(𝑛) (30)
In every time step, the inverter efficiency (𝜂𝑖𝑛𝑣), battery round-trip efficiency (𝜂𝐵𝑎𝑡𝑡), and capacity
fading effects according to [26, 137] were considered. The time resolution for the simulation (𝛥𝑡)
is set to 1 min. The simulation was run for one year with one-minute time resolution to explicitly
capture all the effects of an MP-BESS. Figure 51 depicts the simulation as a simple flow-chart.
After the initial start of the simulation, all the necessary load and generation profiles for a
simulation of a single BESS with the same technical data as the future CES were used to
calculate APM demands and boundaries. When stacking APMs on a single BESS, an order of
precedence for fulfilling certain APMs is necessary for the system to be able at any given time
to serve all APMs. For instance, when prequalifying a BESS for x MW for the PCP provision, the
underlying energy capacity and power reserve, regardless of the technical configuration, legally
must remain the same over a complete period of service. Hence, if e.g. the APMs PCP and
SELF were stacked, PCP must always remain the prior APM unless the power to energy ratio
of PCP can change. For a CES, this requirement means that a precedence for APMs must be
established, which in the outlined case follows the order of:
1. GRID
2. SELF
3. SCP
The order in this case is set by the necessity to unload the local power transformer with APM
GRID at any given time during operation, followed by storing surplus energy with APM SELF
and only with thereafter free capacity providing APM SCP. The simulation follows the first APM
to stack, and the first APM is unloading of the local power transformer and the grid in the
simulated area. The boundaries are two-directional dependencies. CSG influences the possible
SCP ; however, the set SCP influences the possible CSG because of activation during low tariff
on weekends and daytime. By implying a required dependence, the possible capacity for APM
SCP can be formulated by dividing the total available CES capacity, 𝐶𝑆𝑡𝑜𝑟𝑎𝑔𝑒, subtracted from
the CSG required capacity, 𝐶𝐶𝑆𝐺, by the total capacity per available subunit, 𝐶𝑅𝑎𝑐𝑘, a BR; see
equation (36). This approach is achieved by constantly operating the CES with the feed-in
damping operation strategy for SELF serving BESS. Additionally, the time of low utilization will
be filled by APM SCP to increase the overall utilization of the CES. Therefore, as described
earlier, the CSG simulation runs a single 5.5 𝑀𝑊/5.5 𝑀𝑊ℎ BESS over the full simulation time,
𝑡𝑠𝑖𝑚 = 1𝑦𝑒𝑎𝑟, and continuously calculates the necessary maximum share, 𝐶𝐶𝑆𝐺,𝑀𝑎𝑥(𝑡𝑑), of the
CES capacity per day 𝑡𝑑 to fulfil APM GRID + SELF each week and the capacity occurring at 8
AM, 𝐶𝐶𝑆𝐺8𝐴𝑀, and 8 PM, 𝐶𝐶𝑆𝐺8𝑃𝑀 , for further calculations. A weekly partition is imperative in the
regarded case because of the SCP tender times in Germany, which last for one full week.
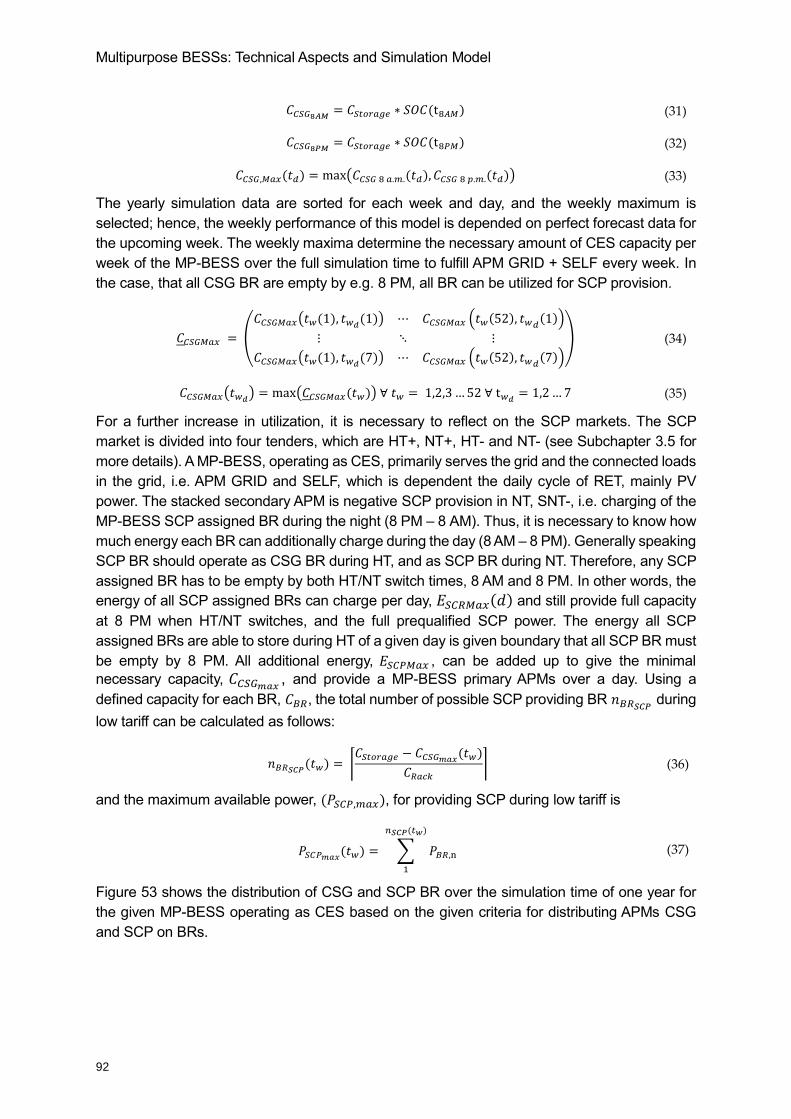
Multipurpose BESSs: Technical Aspects and Simulation Model
92
𝐶𝐶𝑆𝐺8𝐴𝑀 = 𝐶𝑆𝑡𝑜𝑟𝑎𝑔𝑒 ∗ 𝑆𝑂𝐶(t8𝐴𝑀) (31)
𝐶𝐶𝑆𝐺8𝑃𝑀 = 𝐶𝑆𝑡𝑜𝑟𝑎𝑔𝑒 ∗ 𝑆𝑂𝐶(t8𝑃𝑀) (32)
𝐶𝐶𝑆𝐺,𝑀𝑎𝑥(𝑡𝑑) = ma (𝐶𝐶𝑆𝐺 8 𝑎.𝑚.(𝑡𝑑), 𝐶𝐶𝑆𝐺 8 𝑝.𝑚.(𝑡𝑑)) (33)
The yearly simulation data are sorted for each week and day, and the weekly maximum is
selected; hence, the weekly performance of this model is depended on perfect forecast data for
the upcoming week. The weekly maxima determine the necessary amount of CES capacity per
week of the MP-BESS over the full simulation time to fulfill APM GRID + SELF every week. In
the case, that all CSG BR are empty by e.g. 8 PM, all BR can be utilized for SCP provision.
𝐶𝐶𝑆𝐺𝑀𝑎𝑥 = (
𝐶𝐶𝑆𝐺𝑀𝑎𝑥(𝑡𝑤(1), 𝑡𝑤𝑑(1)) ⋯ 𝐶𝐶𝑆𝐺𝑀𝑎𝑥 (𝑡𝑤(52), 𝑡𝑤𝑑(1))
⋮ ⋱ ⋮
𝐶𝐶𝑆𝐺𝑀𝑎𝑥(𝑡𝑤(1), 𝑡𝑤𝑑(7)) ⋯ 𝐶𝐶𝑆𝐺𝑀𝑎𝑥 (𝑡𝑤(52), 𝑡𝑤𝑑(7))
) (34)
𝐶𝐶𝑆𝐺𝑀𝑎𝑥(𝑡𝑤𝑑) = ma (𝐶𝐶𝑆𝐺𝑀𝑎𝑥(𝑡𝑤)) ∀ 𝑡𝑤 = 1,2,3…52 ∀ t𝑤𝑑 = 1,2…7 (35)
For a further increase in utilization, it is necessary to reflect on the SCP markets. The SCP
market is divided into four tenders, which are HT+, NT+, HT- and NT- (see Subchapter 3.5 for
more details). A MP-BESS, operating as CES, primarily serves the grid and the connected loads
in the grid, i.e. APM GRID and SELF, which is dependent the daily cycle of RET, mainly PV
power. The stacked secondary APM is negative SCP provision in NT, SNT-, i.e. charging of the
MP-BESS SCP assigned BR during the night (8 PM – 8 AM). Thus, it is necessary to know how
much energy each BR can additionally charge during the day (8 AM – 8 PM). Generally speaking
SCP BR should operate as CSG BR during HT, and as SCP BR during NT. Therefore, any SCP
assigned BR has to be empty by both HT/NT switch times, 8 AM and 8 PM. In other words, the
energy of all SCP assigned BRs can charge per day, 𝐸𝑆𝐶𝑅𝑀𝑎𝑥(𝑑) and still provide full capacity
at 8 PM when HT/NT switches, and the full prequalified SCP power. The energy all SCP
assigned BRs are able to store during HT of a given day is given boundary that all SCP BR must
be empty by 8 PM. All additional energy, 𝐸𝑆𝐶𝑃𝑀𝑎𝑥 , can be added up to give the minimal
necessary capacity, 𝐶𝐶𝑆𝐺𝑚𝑎𝑥 , and provide a MP-BESS primary APMs over a day. Using a
defined capacity for each BR, 𝐶𝐵𝑅, the total number of possible SCP providing BR 𝑛𝐵𝑅𝑆𝐶𝑃 during
low tariff can be calculated as follows:
𝑛𝐵𝑅𝑆𝐶𝑃(𝑡𝑤) = ⌈𝐶𝑆𝑡𝑜𝑟𝑎𝑔𝑒 − 𝐶𝐶𝑆𝐺𝑚𝑎𝑥(𝑡𝑤)
𝐶𝑅𝑎𝑐𝑘⌉ (36)
and the maximum available power, (𝑃𝑆𝐶𝑃,𝑚𝑎𝑥), for providing SCP during low tariff is
𝑃𝑆𝐶𝑃𝑚𝑎𝑥(𝑡𝑤) = ∑ 𝑃𝐵𝑅,n
𝑛𝑆𝐶𝑃(𝑡𝑤)
1
(37)
Figure 53 shows the distribution of CSG and SCP BR over the simulation time of one year for
the given MP-BESS operating as CES based on the given criteria for distributing APMs CSG
and SCP on BRs.
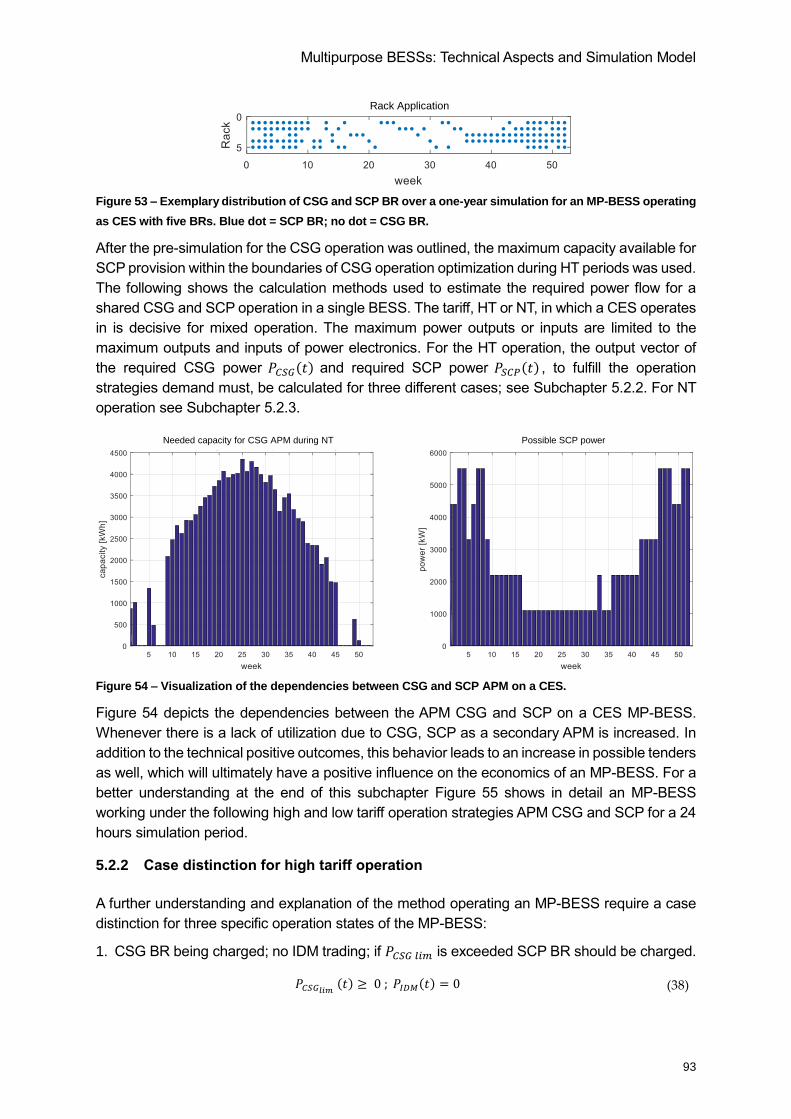
Multipurpose BESSs: Technical Aspects and Simulation Model
93
Figure 53 – Exemplary distribution of CSG and SCP BR over a one-year simulation for an MP-BESS operating
as CES with five BRs. Blue dot = SCP BR; no dot = CSG BR.
After the pre-simulation for the CSG operation was outlined, the maximum capacity available for
SCP provision within the boundaries of CSG operation optimization during HT periods was used.
The following shows the calculation methods used to estimate the required power flow for a
shared CSG and SCP operation in a single BESS. The tariff, HT or NT, in which a CES operates
in is decisive for mixed operation. The maximum power outputs or inputs are limited to the
maximum outputs and inputs of power electronics. For the HT operation, the output vector of
the required CSG power 𝑃𝐶𝑆𝐺(𝑡) and required SCP power 𝑃𝑆𝐶𝑃(𝑡) , to fulfill the operation
strategies demand must, be calculated for three different cases; see Subchapter 5.2.2. For NT
operation see Subchapter 5.2.3.
Figure 54 – Visualization of the dependencies between CSG and SCP APM on a CES.
Figure 54 depicts the dependencies between the APM CSG and SCP on a CES MP-BESS.
Whenever there is a lack of utilization due to CSG, SCP as a secondary APM is increased. In
addition to the technical positive outcomes, this behavior leads to an increase in possible tenders
as well, which will ultimately have a positive influence on the economics of an MP-BESS. For a
better understanding at the end of this subchapter Figure 55 shows in detail an MP-BESS
working under the following high and low tariff operation strategies APM CSG and SCP for a 24
hours simulation period.
5.2.2 Case distinction for high tariff operation
A further understanding and explanation of the method operating an MP-BESS require a case
distinction for three specific operation states of the MP-BESS:
1. CSG BR being charged; no IDM trading; if 𝑃𝐶𝑆𝐺 𝑙𝑖𝑚 is exceeded SCP BR should be charged.
𝑃𝐶𝑆𝐺𝑙𝑖𝑚 (𝑡) ≥ 0 ; 𝑃𝐼𝐷𝑀(𝑡) = 0 (38)
Rack Application
Possible SCP powerNeeded capacity for CSG APM during NT
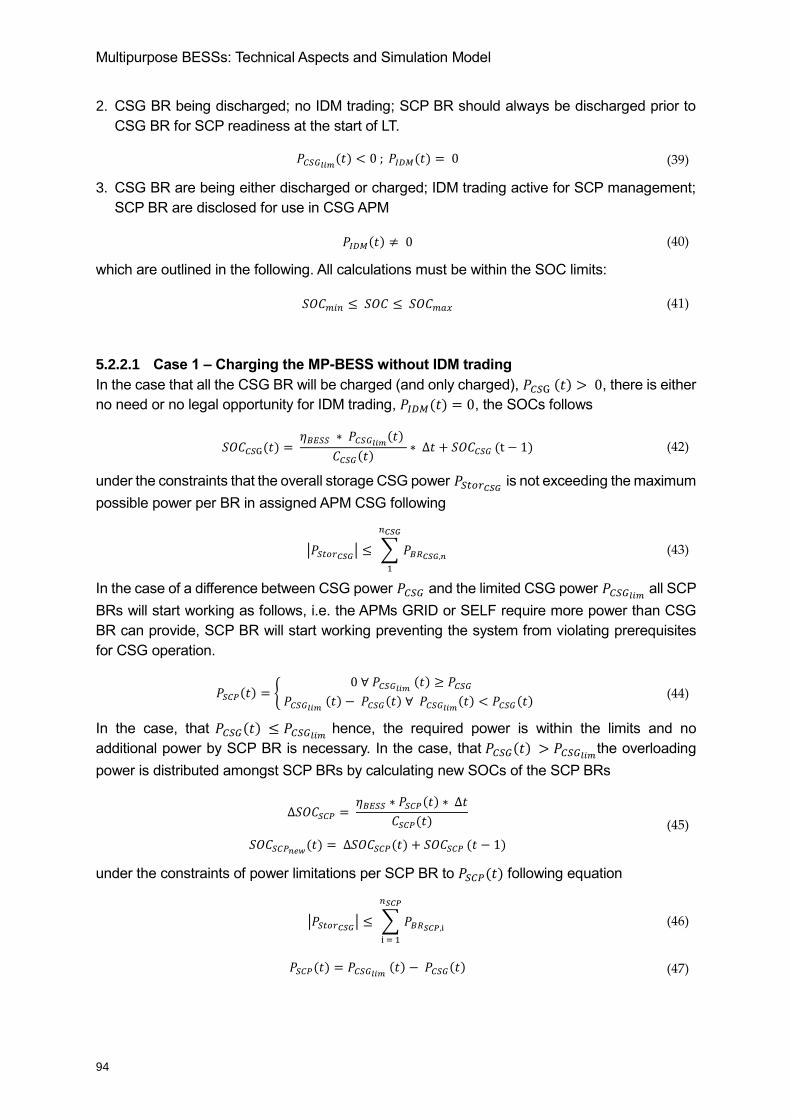
Multipurpose BESSs: Technical Aspects and Simulation Model
94
2. CSG BR being discharged; no IDM trading; SCP BR should always be discharged prior to
CSG BR for SCP readiness at the start of LT.
𝑃𝐶𝑆𝐺𝑙𝑖𝑚(𝑡) < 0 ; 𝑃𝐼𝐷𝑀(𝑡) = 0 (39)
3. CSG BR are being either discharged or charged; IDM trading active for SCP management;
SCP BR are disclosed for use in CSG APM
𝑃𝐼𝐷𝑀(𝑡) ≠ 0 (40)
which are outlined in the following. All calculations must be within the SOC limits:
𝑆𝑂𝐶𝑚𝑖𝑛 ≤ 𝑆𝑂𝐶 ≤ 𝑆𝑂𝐶𝑚𝑎𝑥 (41)
5.2.2.1 Case 1 – Charging the MP-BESS without IDM trading
In the case that all the CSG BR will be charged (and only charged), 𝑃𝐶𝑆G (𝑡) > 0, there is either
no need or no legal opportunity for IDM trading, 𝑃𝐼𝐷𝑀(𝑡) = 0, the SOCs follows
𝑆𝑂𝐶𝐶𝑆G(𝑡) = 𝜂𝐵𝐸𝑆𝑆 ∗ 𝑃𝐶𝑆𝐺𝑙𝑖𝑚(𝑡)
𝐶𝐶𝑆𝐺(𝑡)∗ ∆𝑡 + 𝑆𝑂𝐶𝐶𝑆𝐺 (t − 1) (42)
under the constraints that the overall storage CSG power 𝑃𝑆𝑡𝑜𝑟𝐶𝑆𝐺 is not exceeding the maximum
possible power per BR in assigned APM CSG following
|𝑃𝑆𝑡𝑜𝑟𝐶𝑆𝐺| ≤ ∑ 𝑃𝐵𝑅𝐶𝑆𝐺,𝑛
𝑛𝐶𝑆𝐺
1
(43)
In the case of a difference between CSG power 𝑃𝐶𝑆𝐺 and the limited CSG power 𝑃𝐶𝑆𝐺𝑙𝑖𝑚 all SCP
BRs will start working as follows, i.e. the APMs GRID or SELF require more power than CSG
BR can provide, SCP BR will start working preventing the system from violating prerequisites
for CSG operation.
𝑃𝑆𝐶𝑃(𝑡) = { 0 ∀ 𝑃𝐶𝑆𝐺𝑙𝑖𝑚 (𝑡) ≥ 𝑃𝐶𝑆𝐺
𝑃𝐶𝑆𝐺𝑙𝑖𝑚 (𝑡) − 𝑃𝐶𝑆𝐺(𝑡) ∀ 𝑃𝐶𝑆𝐺𝑙𝑖𝑚(𝑡) < 𝑃𝐶𝑆𝐺(𝑡) (44)
In the case, that 𝑃𝐶𝑆𝐺(𝑡) ≤ 𝑃𝐶𝑆𝐺𝑙𝑖𝑚 hence, the required power is within the limits and no
additional power by SCP BR is necessary. In the case, that 𝑃𝐶𝑆𝐺(𝑡) > 𝑃𝐶𝑆𝐺𝑙𝑖𝑚the overloading
power is distributed amongst SCP BRs by calculating new SOCs of the SCP BRs
∆𝑆𝑂𝐶𝑆𝐶𝑃 = 𝜂𝐵𝐸𝑆𝑆 ∗ 𝑃𝑆𝐶𝑃(𝑡) ∗ ∆𝑡
𝐶𝑆𝐶𝑃(𝑡)
𝑆𝑂𝐶𝑆𝐶𝑃𝑛𝑒𝑤(𝑡) = ∆𝑆𝑂𝐶𝑆𝐶𝑃(𝑡) + 𝑆𝑂𝐶𝑆𝐶𝑃 (𝑡 − 1)
(45)
under the constraints of power limitations per SCP BR to 𝑃𝑆𝐶𝑃(𝑡) following equation
|𝑃𝑆𝑡𝑜𝑟𝐶𝑆𝐺| ≤ ∑ 𝑃𝐵𝑅𝑆𝐶𝑃,i
𝑛𝑆𝐶𝑃
= 1
(46)
𝑃𝑆𝐶𝑃(𝑡) = 𝑃𝐶𝑆𝐺𝑙𝑖𝑚 (𝑡) − 𝑃𝐶𝑆𝐺(𝑡) (47)
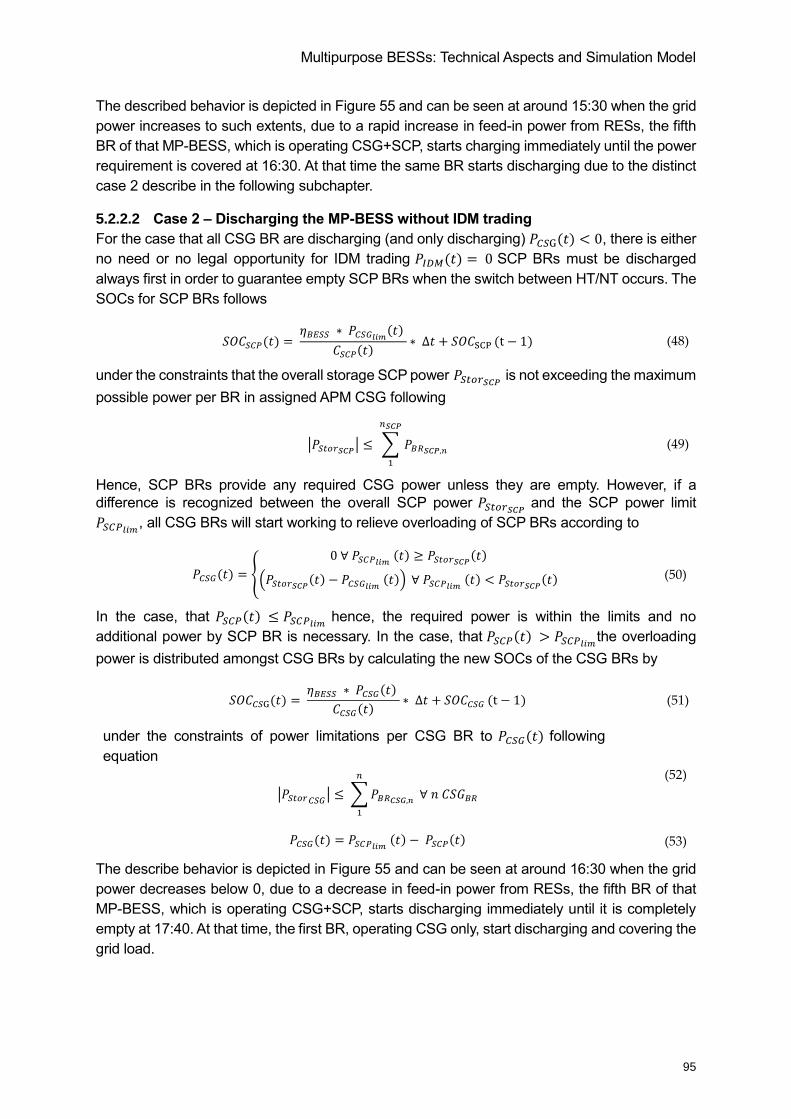
Multipurpose BESSs: Technical Aspects and Simulation Model
95
The described behavior is depicted in Figure 55 and can be seen at around 15:30 when the grid
power increases to such extents, due to a rapid increase in feed-in power from RESs, the fifth
BR of that MP-BESS, which is operating CSG+SCP, starts charging immediately until the power
requirement is covered at 16:30. At that time the same BR starts discharging due to the distinct
case 2 describe in the following subchapter.
5.2.2.2 Case 2 – Discharging the MP-BESS without IDM trading
For the case that all CSG BR are discharging (and only discharging) 𝑃𝐶𝑆G(𝑡) < 0, there is either
no need or no legal opportunity for IDM trading 𝑃𝐼𝐷𝑀(𝑡) = 0 SCP BRs must be discharged
always first in order to guarantee empty SCP BRs when the switch between HT/NT occurs. The
SOCs for SCP BRs follows
𝑆𝑂𝐶𝑆𝐶𝑃(𝑡) = 𝜂𝐵𝐸𝑆𝑆 ∗ 𝑃𝐶𝑆𝐺𝑙𝑖𝑚(𝑡)
𝐶𝑆𝐶𝑃(𝑡)∗ ∆𝑡 + 𝑆𝑂𝐶S (t − 1) (48)
under the constraints that the overall storage SCP power 𝑃𝑆𝑡𝑜𝑟𝑆𝐶𝑃 is not exceeding the maximum
possible power per BR in assigned APM CSG following
|𝑃𝑆𝑡𝑜𝑟𝑆𝐶𝑃| ≤ ∑ 𝑃𝐵𝑅𝑆𝐶𝑃,𝑛
𝑛𝑆𝐶𝑃
1
(49)
Hence, SCP BRs provide any required CSG power unless they are empty. However, if a
difference is recognized between the overall SCP power 𝑃𝑆𝑡𝑜𝑟𝑆𝐶𝑃 and the SCP power limit
𝑃𝑆𝐶𝑃𝑙𝑖𝑚, all CSG BRs will start working to relieve overloading of SCP BRs according to
𝑃𝐶𝑆𝐺(𝑡) = {
0 ∀ 𝑃𝑆𝐶𝑃𝑙𝑖𝑚 (𝑡) ≥ 𝑃𝑆𝑡𝑜𝑟𝑆𝐶𝑃(𝑡)
(𝑃𝑆𝑡𝑜𝑟𝑆𝐶𝑃(𝑡) − 𝑃𝐶𝑆𝐺𝑙𝑖𝑚 (𝑡)) ∀ 𝑃𝑆𝐶𝑃𝑙𝑖𝑚 (𝑡) < 𝑃𝑆𝑡𝑜𝑟𝑆𝐶𝑃(𝑡)
(50)
In the case, that 𝑃𝑆𝐶𝑃(𝑡) ≤ 𝑃𝑆𝐶𝑃𝑙𝑖𝑚 hence, the required power is within the limits and no
additional power by SCP BR is necessary. In the case, that 𝑃𝑆𝐶𝑃(𝑡) > 𝑃𝑆𝐶𝑃𝑙𝑖𝑚the overloading
power is distributed amongst CSG BRs by calculating the new SOCs of the CSG BRs by
𝑆𝑂𝐶𝐶𝑆G(𝑡) = 𝜂𝐵𝐸𝑆𝑆 ∗ 𝑃𝐶𝑆𝐺(𝑡)
𝐶𝐶𝑆𝐺(𝑡)∗ ∆𝑡 + 𝑆𝑂𝐶𝐶𝑆𝐺 (t − 1) (51)
under the constraints of power limitations per CSG BR to 𝑃𝐶𝑆𝐺(𝑡) following
equation
|𝑃𝑆𝑡𝑜𝑟𝐶𝑆𝐺| ≤ ∑𝑃𝐵𝑅𝐶𝑆𝐺,𝑛
𝑛
1
∀ 𝑛 𝐶𝑆𝐺𝐵𝑅
(52)
𝑃𝐶𝑆𝐺(𝑡) = 𝑃𝑆𝐶𝑃𝑙𝑖𝑚 (𝑡) − 𝑃𝑆𝐶𝑃(𝑡) (53)
The describe behavior is depicted in Figure 55 and can be seen at around 16:30 when the grid
power decreases below 0, due to a decrease in feed-in power from RESs, the fifth BR of that
MP-BESS, which is operating CSG+SCP, starts discharging immediately until it is completely
empty at 17:40. At that time, the first BR, operating CSG only, start discharging and covering the
grid load.
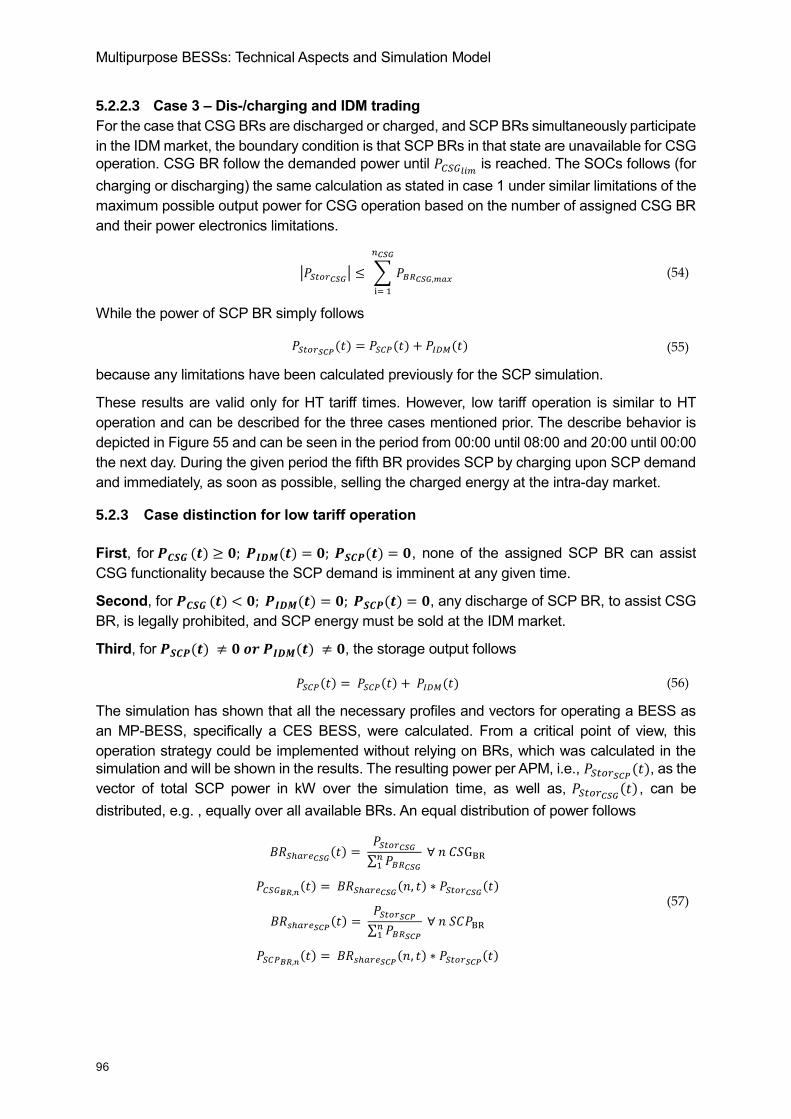
Multipurpose BESSs: Technical Aspects and Simulation Model
96
5.2.2.3 Case 3 – Dis-/charging and IDM trading
For the case that CSG BRs are discharged or charged, and SCP BRs simultaneously participate
in the IDM market, the boundary condition is that SCP BRs in that state are unavailable for CSG
operation. CSG BR follow the demanded power until 𝑃𝐶𝑆𝐺𝑙𝑖𝑚 is reached. The SOCs follows (for
charging or discharging) the same calculation as stated in case 1 under similar limitations of the
maximum possible output power for CSG operation based on the number of assigned CSG BR
and their power electronics limitations.
|𝑃𝑆𝑡𝑜𝑟𝐶𝑆𝐺| ≤ ∑ 𝑃𝐵𝑅𝐶𝑆𝐺,𝑚𝑎𝑥
𝑛𝐶𝑆𝐺
= 1
(54)
While the power of SCP BR simply follows
𝑃𝑆𝑡𝑜𝑟𝑆𝐶𝑃(𝑡) = 𝑃𝑆𝐶𝑃(𝑡) + 𝑃𝐼𝐷𝑀(𝑡) (55)
because any limitations have been calculated previously for the SCP simulation.
These results are valid only for HT tariff times. However, low tariff operation is similar to HT
operation and can be described for the three cases mentioned prior. The describe behavior is
depicted in Figure 55 and can be seen in the period from 00:00 until 08:00 and 20:00 until 00:00
the next day. During the given period the fifth BR provides SCP by charging upon SCP demand
and immediately, as soon as possible, selling the charged energy at the intra-day market.
5.2.3 Case distinction for low tariff operation
First, for 𝑷𝑪𝑺𝑮 (𝒕) ≥ 𝟎; 𝑷𝑰𝑫𝑴(𝒕) = 𝟎; 𝑷𝑺𝑪𝑷(𝒕) = 𝟎 , none of the assigned SCP BR can assist
CSG functionality because the SCP demand is imminent at any given time.
Second, for 𝑷𝑪𝑺𝑮 (𝒕) < 𝟎; 𝑷𝑰𝑫𝑴(𝒕) = 𝟎; 𝑷𝑺𝑪𝑷(𝒕) = 𝟎, any discharge of SCP BR, to assist CSG
BR, is legally prohibited, and SCP energy must be sold at the IDM market.
Third, for 𝑷𝑺𝑪𝑷(𝒕) ≠ 𝟎 𝒐𝒓 𝑷𝑰𝑫𝑴(𝒕) ≠ 𝟎, the storage output follows
𝑃𝑆𝐶𝑃(𝑡) = 𝑃𝑆𝐶𝑃(𝑡) + 𝑃𝐼𝐷𝑀(𝑡) (56)
The simulation has shown that all the necessary profiles and vectors for operating a BESS as
an MP-BESS, specifically a CES BESS, were calculated. From a critical point of view, this
operation strategy could be implemented without relying on BRs, which was calculated in the
simulation and will be shown in the results. The resulting power per APM, i.e., 𝑃𝑆𝑡𝑜𝑟𝑆𝐶𝑃(𝑡), as the
vector of total SCP power in kW over the simulation time, as well as, 𝑃𝑆𝑡𝑜𝑟𝐶𝑆𝐺(𝑡) , can be
distributed, e.g. , equally over all available BRs. An equal distribution of power follows
𝐵𝑅𝑆ℎ𝑎𝑟𝑒𝐶𝑆𝐺(𝑡) = 𝑃𝑆𝑡𝑜𝑟𝐶𝑆𝐺∑ 𝑃𝐵𝑅𝐶𝑆𝐺𝑛1
∀ 𝑛 𝐶𝑆GBR
𝑃𝐶𝑆𝐺𝐵𝑅,𝑛(𝑡) = 𝐵𝑅𝑆ℎ𝑎𝑟𝑒𝐶𝑆𝐺(𝑛, 𝑡) ∗ 𝑃𝑆𝑡𝑜𝑟𝐶𝑆𝐺(𝑡)
𝐵𝑅𝑠ℎ𝑎𝑟𝑒𝑆𝐶𝑃(𝑡) = 𝑃𝑆𝑡𝑜𝑟𝑆𝐶𝑃∑ 𝑃𝐵𝑅𝑆𝐶𝑃𝑛1
∀ 𝑛 𝑆𝐶𝑃BR
𝑃𝑆𝐶𝑃𝐵𝑅,𝑛(𝑡) = 𝐵𝑅𝑠ℎ𝑎𝑟𝑒𝑆𝐶𝑃(𝑛, 𝑡) ∗ 𝑃𝑆𝑡𝑜𝑟𝑆𝐶𝑃(𝑡)
(57)

Multipurpose BESSs: Technical Aspects and Simulation Model
97
Concluding the MP-BESS simulation, the SimSES core is utilized to simulate each BR per the
APM and any preset technical data.21
The SimSES core will update the respective BR object
and handle all technical data for each simulation step. However, the above approach distributes
the overall power equally over all available BRs, which leads to PE operation at low efficiencies
and a lower BESS economic value. Subchapter 5.5 will introduce some optimization
approaches. In addition to power selecting BRs, BRs can switch their respective APM on a
weekly basis to optimize the functionality of the CES.
21
For future work, the CES tool can freely access BRs of different sizes, power electronics, and aging mechanisms,
among other parameters.
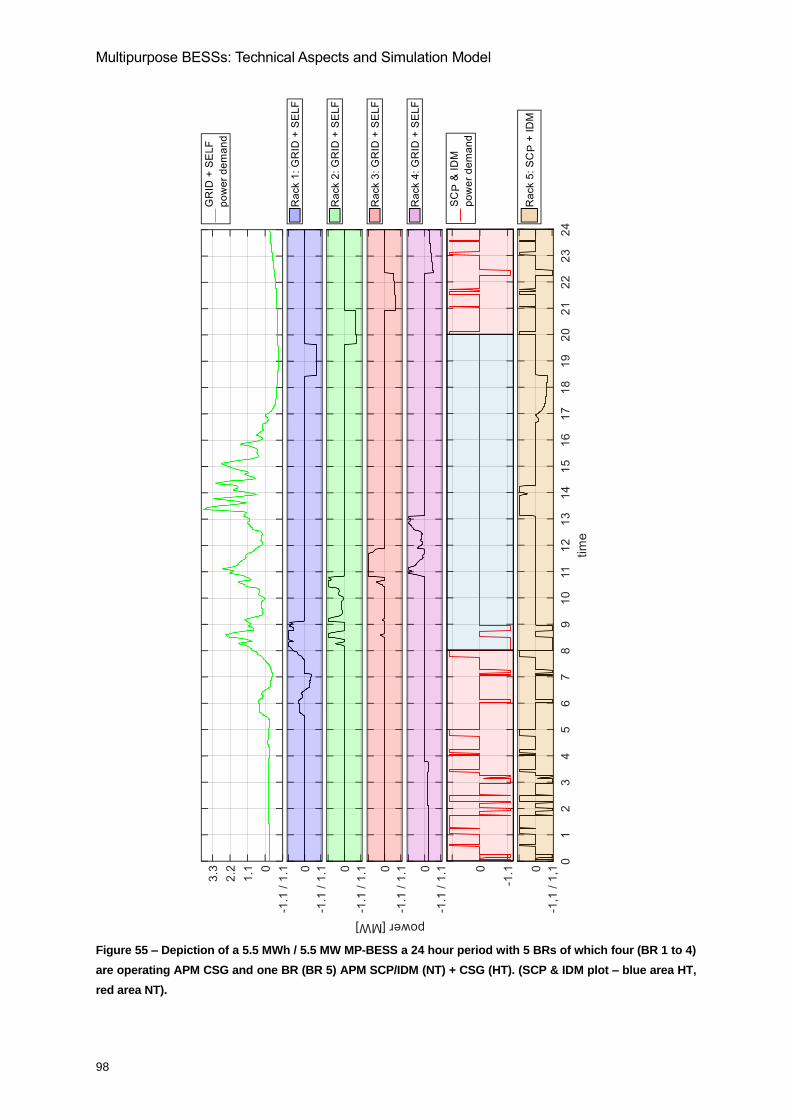
Multipurpose BESSs: Technical Aspects and Simulation Model
98
Figure 55 – Depiction of a 5.5 MWh / 5.5 MW MP-BESS a 24 hour period with 5 BRs of which four (BR 1 to 4)
are operating APM CSG and one BR (BR 5) APM SCP/IDM (NT) + CSG (HT). (SCP & IDM plot – blue area HT,
red area NT).
P
P
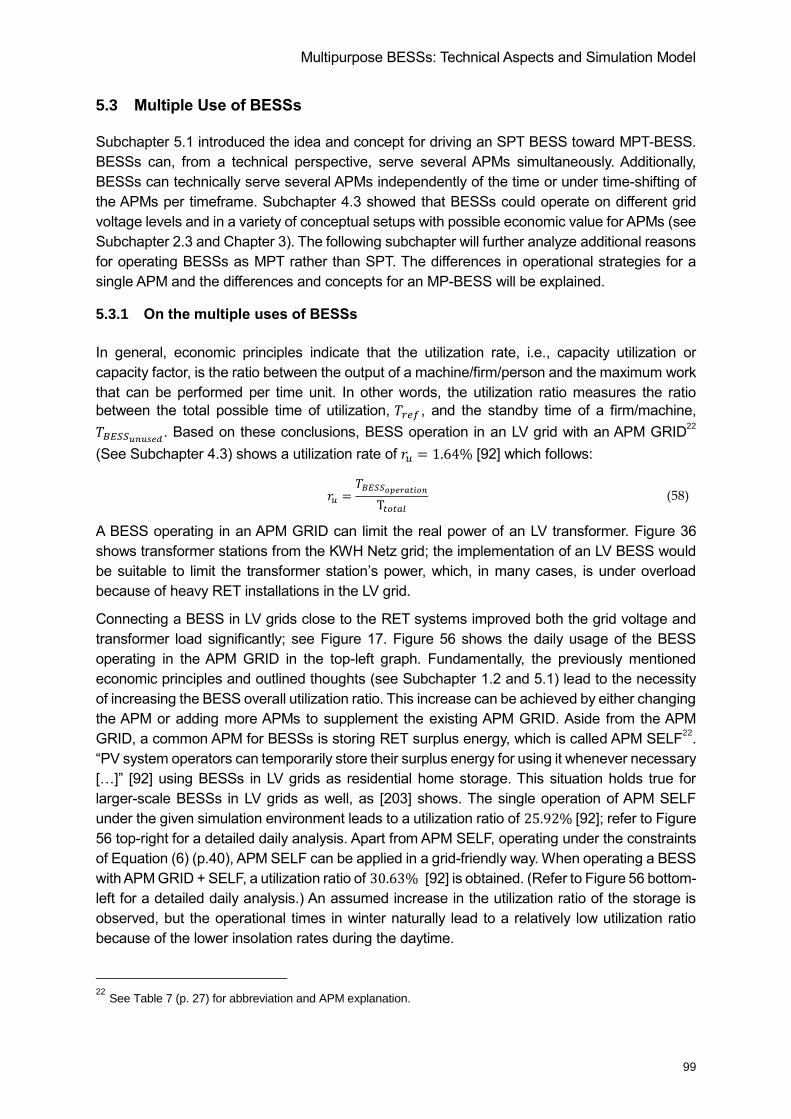
Multipurpose BESSs: Technical Aspects and Simulation Model
99
5.3 Multiple Use of BESSs
Subchapter 5.1 introduced the idea and concept for driving an SPT BESS toward MPT-BESS.
BESSs can, from a technical perspective, serve several APMs simultaneously. Additionally,
BESSs can technically serve several APMs independently of the time or under time-shifting of
the APMs per timeframe. Subchapter 4.3 showed that BESSs could operate on different grid
voltage levels and in a variety of conceptual setups with possible economic value for APMs (see
Subchapter 2.3 and Chapter 3). The following subchapter will further analyze additional reasons
for operating BESSs as MPT rather than SPT. The differences in operational strategies for a
single APM and the differences and concepts for an MP-BESS will be explained.
5.3.1 On the multiple uses of BESSs
In general, economic principles indicate that the utilization rate, i.e., capacity utilization or
capacity factor, is the ratio between the output of a machine/firm/person and the maximum work
that can be performed per time unit. In other words, the utilization ratio measures the ratio
between the total possible time of utilization, 𝑇𝑟𝑒𝑓 , and the standby time of a firm/machine,
𝑇𝐵𝐸𝑆𝑆𝑢𝑛𝑢𝑠𝑒𝑑. Based on these conclusions, BESS operation in an LV grid with an APM GRID22
(See Subchapter 4.3) shows a utilization rate of 𝑟𝑢 = 1.64% [92] which follows:
𝑟𝑢 =𝑇𝐵𝐸𝑆𝑆𝑜𝑝𝑒𝑟𝑎𝑡𝑖𝑜𝑛 𝑡𝑜𝑡𝑎𝑙
(58)
A BESS operating in an APM GRID can limit the real power of an LV transformer. Figure 36
shows transformer stations from the KWH Netz grid; the implementation of an LV BESS would
be suitable to limit the transformer station’s power, which, in many cases, is under overload
because of heavy RET installations in the LV grid.
Connecting a BESS in LV grids close to the RET systems improved both the grid voltage and
transformer load significantly; see Figure 17. Figure 56 shows the daily usage of the BESS
operating in the APM GRID in the top-left graph. Fundamentally, the previously mentioned
economic principles and outlined thoughts (see Subchapter 1.2 and 5.1) lead to the necessity
of increasing the BESS overall utilization ratio. This increase can be achieved by either changing
the APM or adding more APMs to supplement the existing APM GRID. Aside from the APM
GRID, a common APM for BESSs is storing RET surplus energy, which is called APM SELF22
.
“PV system operators can temporarily store their surplus energy for using it whenever necessary
[…]” [92] using BESSs in LV grids as residential home storage. This situation holds true for
larger-scale BESSs in LV grids as well, as [203] shows. The single operation of APM SELF
under the given simulation environment leads to a utilization ratio of 25.92% [92]; refer to Figure
56 top-right for a detailed daily analysis. Apart from APM SELF, operating under the constraints
of Equation (6) (p.40), APM SELF can be applied in a grid-friendly way. When operating a BESS
with APM GRID + SELF, a utilization ratio of 30.63% [92] is obtained. (Refer to Figure 56 bottom-
left for a detailed daily analysis.) An assumed increase in the utilization ratio of the storage is
observed, but the operational times in winter naturally lead to a relatively low utilization ratio
because of the lower insolation rates during the daytime.
22
See Table 7 (p. 27) for abbreviation and APM explanation.
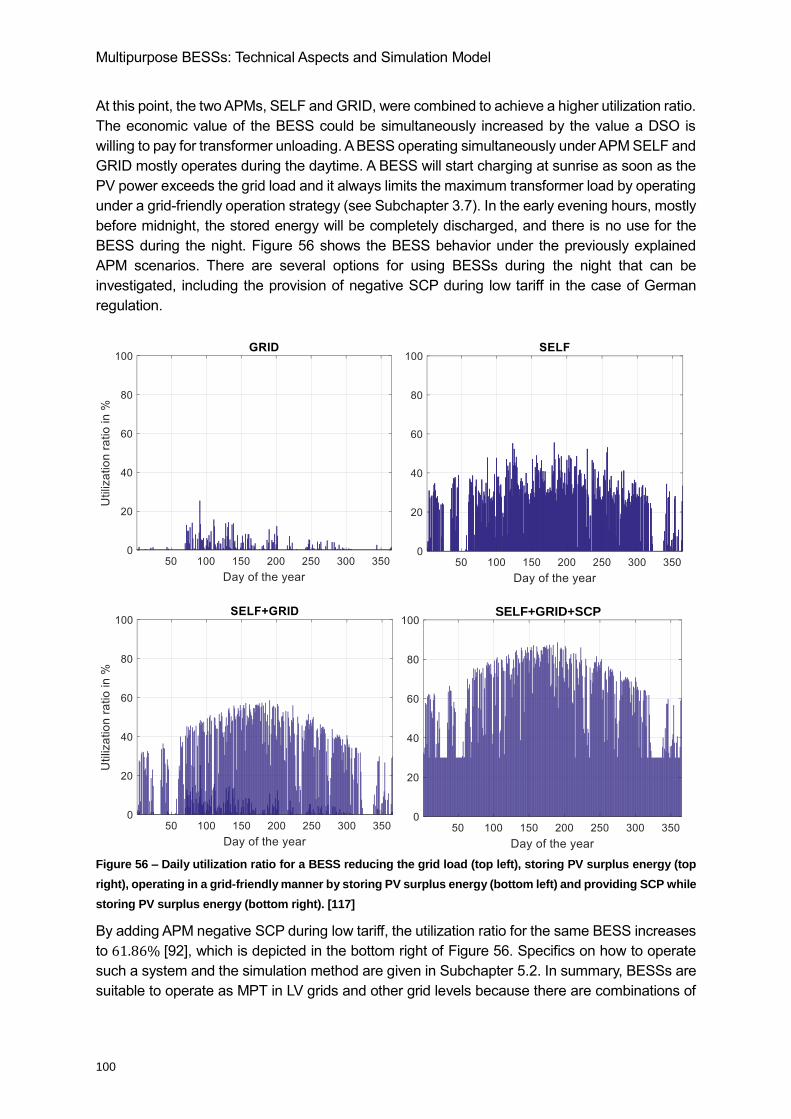
Multipurpose BESSs: Technical Aspects and Simulation Model
100
At this point, the two APMs, SELF and GRID, were combined to achieve a higher utilization ratio.
The economic value of the BESS could be simultaneously increased by the value a DSO is
willing to pay for transformer unloading. A BESS operating simultaneously under APM SELF and
GRID mostly operates during the daytime. A BESS will start charging at sunrise as soon as the
PV power exceeds the grid load and it always limits the maximum transformer load by operating
under a grid-friendly operation strategy (see Subchapter 3.7). In the early evening hours, mostly
before midnight, the stored energy will be completely discharged, and there is no use for the
BESS during the night. Figure 56 shows the BESS behavior under the previously explained
APM scenarios. There are several options for using BESSs during the night that can be
investigated, including the provision of negative SCP during low tariff in the case of German
regulation.
Figure 56 – Daily utilization ratio for a BESS reducing the grid load (top left), storing PV surplus energy (top
right), operating in a grid-friendly manner by storing PV surplus energy (bottom left) and providing SCP while
storing PV surplus energy (bottom right). [117]
By adding APM negative SCP during low tariff, the utilization ratio for the same BESS increases
to 61.86% [92], which is depicted in the bottom right of Figure 56. Specifics on how to operate
such a system and the simulation method are given in Subchapter 5.2. In summary, BESSs are
suitable to operate as MPT in LV grids and other grid levels because there are combinations of
SELF+GRID+SCP
Multipurpose BESSs: Technical Aspects and Simulation Model
101
APMs that do not exceed BESS physical boundaries. In spite of the variety of imaginable
methods for the operation of an MP-BESS, there are certain criteria that must be fulfilled and
processed to develop a fundamental method for the multi-tasking operation of BESSs. The
following section introduces an operational concept and guidelines for the operation of an MP-
BESS in LV grids under the assumption that the aforementioned three APMs are run
simultaneously (SELF, GRID, and negative SCP during low tariff).
5.3.2 On the operation of a multi-tasking BESS
The concept of storage fragmentation, i.e., splitting up a BESS into several independent BRs to
operate individual PE, was mentioned briefly in Subchapter 2.2. The necessary technical
functionality MP-BESSs required for running multiple APMs will be introduced along with the
simple control algorithm steering the system. The following results have been published in the
co-authored publication, “Operating a Multitasking Stationary Battery Storage System for
Providing Secondary Control Reserve on Low-Voltage Level” [92]. As Subchapter 2.2 explained,
the general concepts for allowing BESSs to work as MPT (see Subchapter 1.2 for MPT and SPT
explanations) and conceptual ideas for operating an MP-BESS in an LV grid are derived in the
following section. The operation of a BESS from single APMs toward stacked APMs as MP-
BESSs will be described for an LV MP-BESS.
The Energy Neighbor (EN), an MP-BESS prototype that was built under the auspices of the
EEBatt project at TUM, consists of eight BRs with a total capacity of 𝐶𝑚𝑎𝑥𝐸𝑁 = 191.36 𝑘𝑊ℎ and
a total power of 𝑃𝑚𝑎𝑥𝐸𝑁 = 248 𝑘𝑊. The full technical data in Table 2 and further explanations of
the technical components in Subchapter 2.2 are available. The EN operates eight BRs, each
with an independent PE unit 𝑃𝐵𝑅𝑛 and capacity 𝐶𝐵𝑅𝑛, in the 400 VAC LV grid.
Figure 57 – Accumulated load profile of the grid area under investigation [92].
The following results were simulated by targeting a small LV grid referring to the EEBatt projects’
EN (see Subchapter 1.2 for further information on the prototype system). “The operated grid
consists of three branches with several short leavings, all connected to a transformer with a
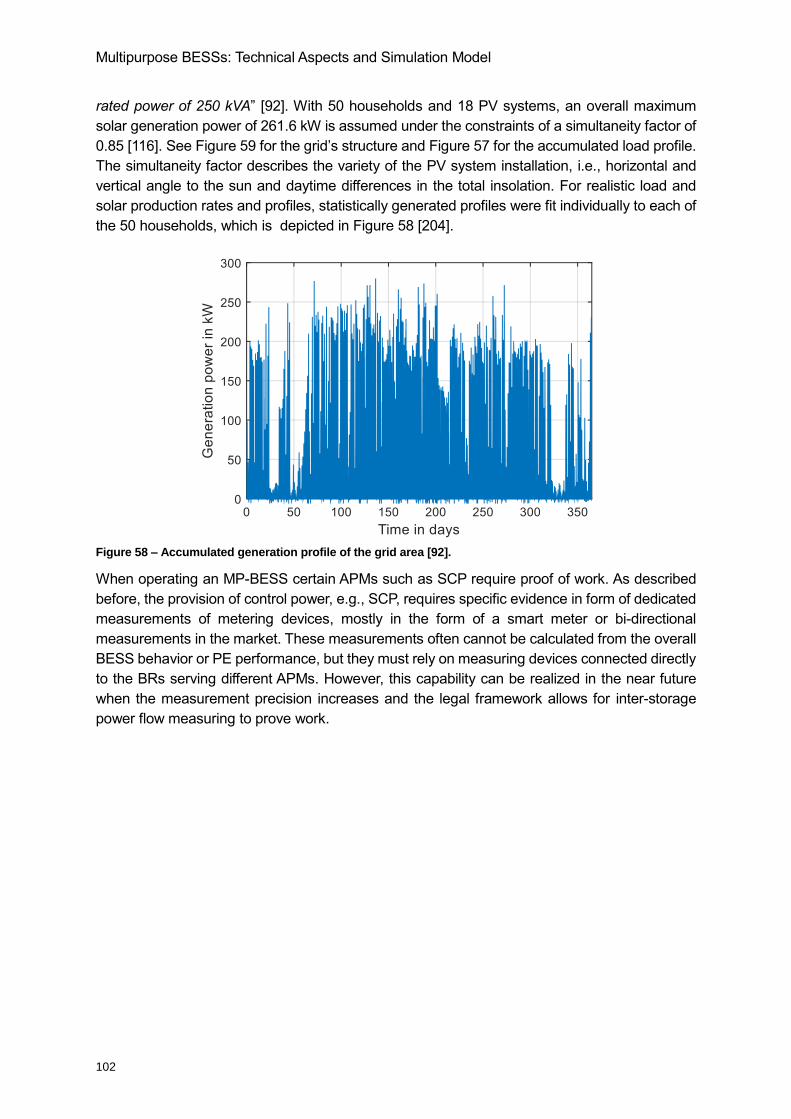
Multipurpose BESSs: Technical Aspects and Simulation Model
102
rated power of 250 kVA” [92]. With 50 households and 18 PV systems, an overall maximum
solar generation power of 261.6 kW is assumed under the constraints of a simultaneity factor of
0.85 [116]. See Figure 59 for the grid’s structure and Figure 57 for the accumulated load profile.
The simultaneity factor describes the variety of the PV system installation, i.e., horizontal and
vertical angle to the sun and daytime differences in the total insolation. For realistic load and
solar production rates and profiles, statistically generated profiles were fit individually to each of
the 50 households, which is depicted in Figure 58 [204].
Figure 58 – Accumulated generation profile of the grid area [92].
When operating an MP-BESS certain APMs such as SCP require proof of work. As described
before, the provision of control power, e.g., SCP, requires specific evidence in form of dedicated
measurements of metering devices, mostly in the form of a smart meter or bi-directional
measurements in the market. These measurements often cannot be calculated from the overall
BESS behavior or PE performance, but they must rely on measuring devices connected directly
to the BRs serving different APMs. However, this capability can be realized in the near future
when the measurement precision increases and the legal framework allows for inter-storage
power flow measuring to prove work.
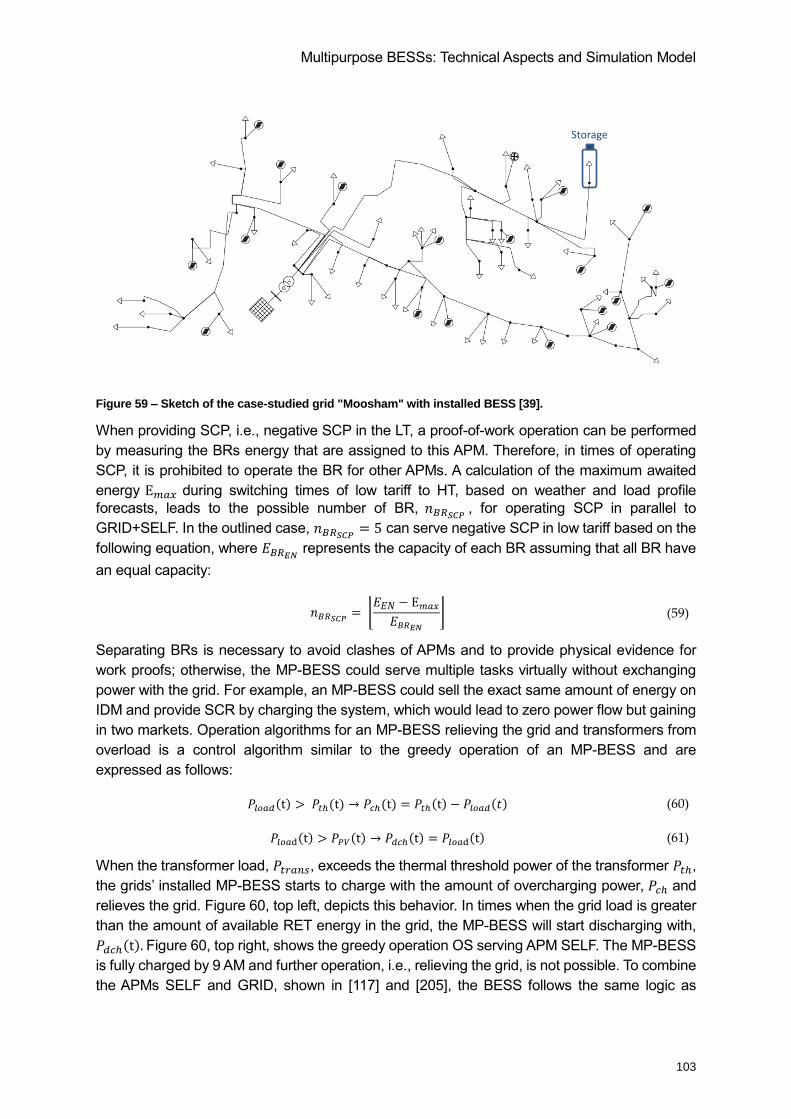
Multipurpose BESSs: Technical Aspects and Simulation Model
103
Figure 59 – Sketch of the case-studied grid "Moosham" with installed BESS [39].
When providing SCP, i.e., negative SCP in the LT, a proof-of-work operation can be performed
by measuring the BRs energy that are assigned to this APM. Therefore, in times of operating
SCP, it is prohibited to operate the BR for other APMs. A calculation of the maximum awaited
energy E𝑚𝑎𝑥 during switching times of low tariff to HT, based on weather and load profile
forecasts, leads to the possible number of BR, 𝑛𝐵𝑅𝑆𝐶𝑃 , for operating SCP in parallel to
GRID+SELF. In the outlined case, 𝑛𝐵𝑅𝑆𝐶𝑃 = 5 can serve negative SCP in low tariff based on the
following equation, where 𝐸𝐵𝑅𝐸𝑁 represents the capacity of each BR assuming that all BR have
an equal capacity:
𝑛𝐵𝑅𝑆𝐶𝑃 = ⌊𝐸𝐸𝑁 − E𝑚𝑎𝑥𝐸𝐵𝑅𝐸𝑁
⌋ (59)
Separating BRs is necessary to avoid clashes of APMs and to provide physical evidence for
work proofs; otherwise, the MP-BESS could serve multiple tasks virtually without exchanging
power with the grid. For example, an MP-BESS could sell the exact same amount of energy on
IDM and provide SCR by charging the system, which would lead to zero power flow but gaining
in two markets. Operation algorithms for an MP-BESS relieving the grid and transformers from
overload is a control algorithm similar to the greedy operation of an MP-BESS and are
expressed as follows:
𝑃𝑙𝑜𝑎𝑑(t) > 𝑃𝑡ℎ(t) → 𝑃𝑐ℎ(t) = 𝑃𝑡ℎ(t) − 𝑃𝑙𝑜𝑎𝑑(𝑡) (60)
𝑃𝑙𝑜𝑎 (t) > 𝑃𝑃𝑉(t) → 𝑃𝑑𝑐ℎ(t) = 𝑃𝑙𝑜𝑎 (t) (61)
When the transformer load, 𝑃𝑡𝑟𝑎𝑛𝑠, exceeds the thermal threshold power of the transformer 𝑃𝑡ℎ,
the grids’ installed MP-BESS starts to charge with the amount of overcharging power, 𝑃𝑐ℎ and
relieves the grid. Figure 60, top left, depicts this behavior. In times when the grid load is greater
than the amount of available RET energy in the grid, the MP-BESS will start discharging with,
𝑃𝑑𝑐ℎ(t). Figure 60, top right, shows the greedy operation OS serving APM SELF. The MP-BESS
is fully charged by 9 AM and further operation, i.e., relieving the grid, is not possible. To combine
the APMs SELF and GRID, shown in [117] and [205], the BESS follows the same logic as
Storage
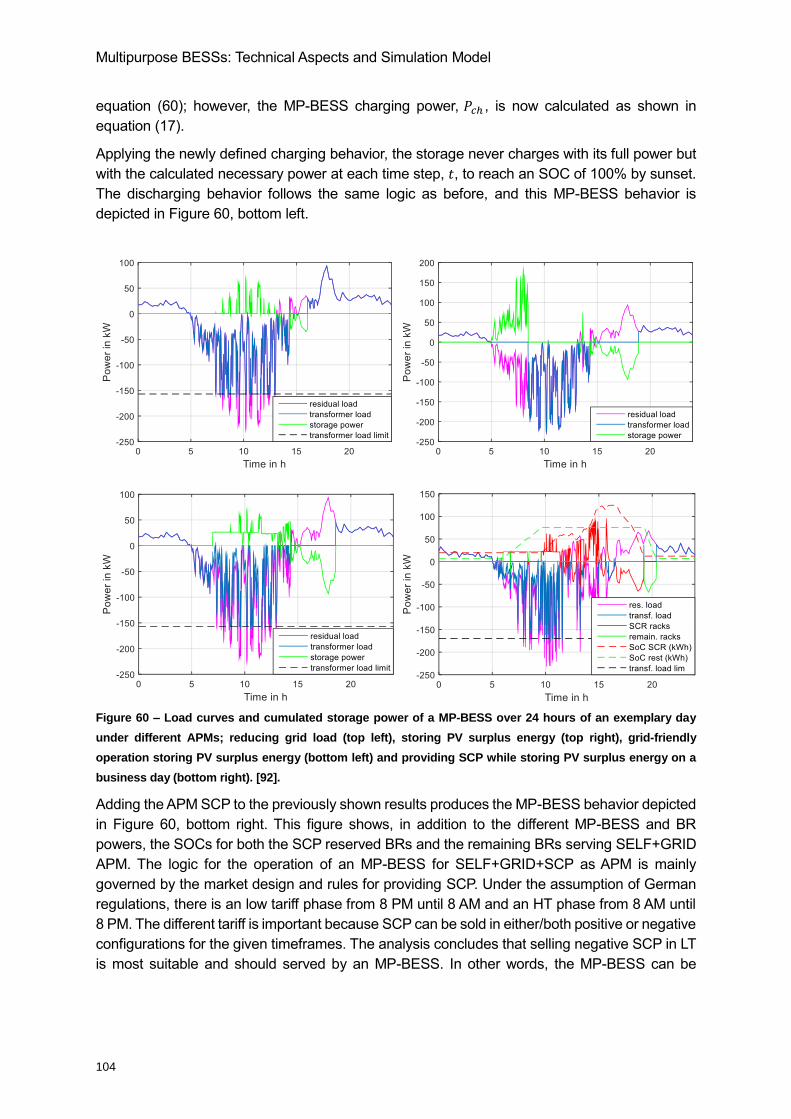
Multipurpose BESSs: Technical Aspects and Simulation Model
104
equation (60); however, the MP-BESS charging power, 𝑃𝑐ℎ , is now calculated as shown in
equation (17).
Applying the newly defined charging behavior, the storage never charges with its full power but
with the calculated necessary power at each time step, 𝑡, to reach an SOC of 100% by sunset.
The discharging behavior follows the same logic as before, and this MP-BESS behavior is
depicted in Figure 60, bottom left.
Figure 60 – Load curves and cumulated storage power of a MP-BESS over 24 hours of an exemplary day
under different APMs; reducing grid load (top left), storing PV surplus energy (top right), grid-friendly
operation storing PV surplus energy (bottom left) and providing SCP while storing PV surplus energy on a
business day (bottom right). [92].
Adding the APM SCP to the previously shown results produces the MP-BESS behavior depicted
in Figure 60, bottom right. This figure shows, in addition to the different MP-BESS and BR
powers, the SOCs for both the SCP reserved BRs and the remaining BRs serving SELF+GRID
APM. The logic for the operation of an MP-BESS for SELF+GRID+SCP as APM is mainly
governed by the market design and rules for providing SCP. Under the assumption of German
regulations, there is an low tariff phase from 8 PM until 8 AM and an HT phase from 8 AM until
8 PM. The different tariff is important because SCP can be sold in either/both positive or negative
configurations for the given timeframes. The analysis concludes that selling negative SCP in LT
is most suitable and should served by an MP-BESS. In other words, the MP-BESS can be
Multipurpose BESSs: Technical Aspects and Simulation Model
105
charged when grid operators trigger negative SCP signals during low tariff with additional power
because the APMs SELF + GRID operate exclusively during the daytime.
This behavior leads to charging the MP-BESS during the night and on weekend days, which
equal the low tariff period. In reference to Figure 60, the BESS starts to relieve the grid according
to APM GRID + SELF and stores RET power during the overload/threshold times of the
transformer station. At 10 AM, the BESS SOC for non-SCP BR reaches 100% (75 kWh), which
results in a conflict of operation for the APM grid. While APM SELF would at this point not require
further charging, the SCP reserved BRs are activated to take over and ensure the continuation
of the MP-BESS main function. In contrast, the discharging behavior aims at discharging SCP
reserved BRs first to provide negative SCP after 8 PM in the low tariff period. In other words,
SCPs must be fully discharged by 8 PM23
; if the grid load is not sufficient to discharge all SCP
BR and the surplus energy is sold at the latest possible IDM tender. Therefore, at 1 PM and 4
PM, the SOC of SCP BR declines because SCP BR serves any grid load directly. The remaining
BRs remain at 100% SOC until 7 PM when all the SCP BR have been discharged and start
discharging then by serving grid load. The BESS is now able to provide negative SCP during
the low tariff period.
In summary, the operation of an MP-BESS relies widely on the technical setup of the storage
system itself, regulations according to proof of work for APMs and the logic of stacking APMs.
“Operating a multitasking storage for reducing the grid load, storing PV surplus energy and
providing secondary control reserve on LV level can distinctly increase the utilization ratio of the
system compared to a single-tasking application. Especially the provision of negative SCP […]
is feasible for the usage of inactive storage capacity. Nevertheless, the maximum amount of
SCP power to be provided strongly depends on the existent grid infrastructure and given targets
for reducing the grid load and has to be individually determined for every grid.” [92] This short
outline serves to provide a basic understanding for stacked APMs on an MP-BESS. A detailed
analysis of MP-BESS behavior, the algorithms providing the features for controlling MP-BESSs
serving three APMs, and the fundamentals of APM stacking were provided in Chapter 4.8.
5.4 Influence of APM Stacking on Aging
Aging of LIB cells is the leading cause of a limited lifetime for BESSs and electric vehicle
batteries. The following results on the influence of APM stacking on the aging of an MP-BESS
were published as “Evaluation of the Aging Behaviour of Stationary LIB Storage Systems for
Different PV-Driven Applications in Low Voltage Grids” [206].
In general, battery degradation causes can be separated into calendar aging and cycle aging
[52, 207–209]. Aging degradations are changes inside the LIB cell, e.g., increased SEI layer
growth, caused by varying stress factors. Calendar aging considers the stress factors of BESS
within a specific SOC and temperature over time. Cycle aging takes the charging and
discharging processes into account [207, 208]. In the literature, numerous studies show the
impact of stress factors, such as the current, ∆SOC, SOC and temperature to cell capacity, and
impedance parameters, such as the internal resistance [52, 210–212]. In [213], the impact of
23
The results in Figure 60 show that (bottom-right) SCP BR still maintain around 10% SOC after 8PM. This is caused by a hard programmed discharge of 10% SOC to asses aging effects.
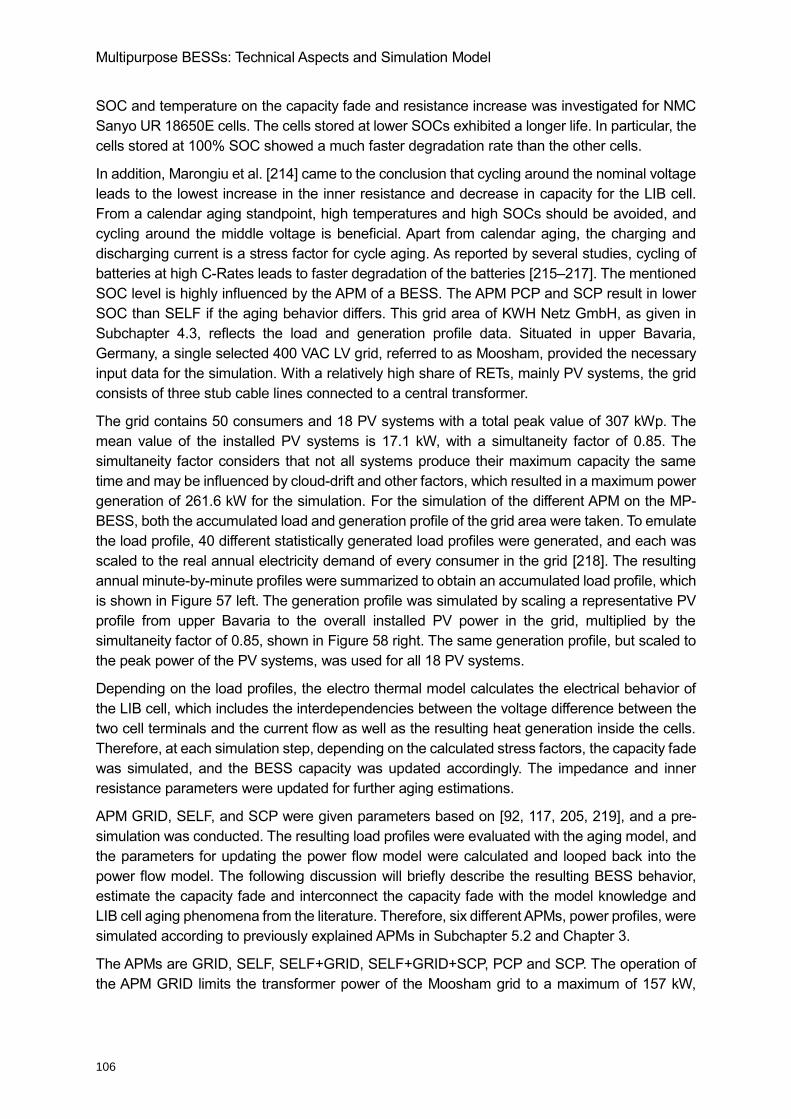
Multipurpose BESSs: Technical Aspects and Simulation Model
106
SOC and temperature on the capacity fade and resistance increase was investigated for NMC
Sanyo UR 18650E cells. The cells stored at lower SOCs exhibited a longer life. In particular, the
cells stored at 100% SOC showed a much faster degradation rate than the other cells.
In addition, Marongiu et al. [214] came to the conclusion that cycling around the nominal voltage
leads to the lowest increase in the inner resistance and decrease in capacity for the LIB cell.
From a calendar aging standpoint, high temperatures and high SOCs should be avoided, and
cycling around the middle voltage is beneficial. Apart from calendar aging, the charging and
discharging current is a stress factor for cycle aging. As reported by several studies, cycling of
batteries at high C-Rates leads to faster degradation of the batteries [215–217]. The mentioned
SOC level is highly influenced by the APM of a BESS. The APM PCP and SCP result in lower
SOC than SELF if the aging behavior differs. This grid area of KWH Netz GmbH, as given in
Subchapter 4.3, reflects the load and generation profile data. Situated in upper Bavaria,
Germany, a single selected 400 VAC LV grid, referred to as Moosham, provided the necessary
input data for the simulation. With a relatively high share of RETs, mainly PV systems, the grid
consists of three stub cable lines connected to a central transformer.
The grid contains 50 consumers and 18 PV systems with a total peak value of 307 kWp. The
mean value of the installed PV systems is 17.1 kW, with a simultaneity factor of 0.85. The
simultaneity factor considers that not all systems produce their maximum capacity the same
time and may be influenced by cloud-drift and other factors, which resulted in a maximum power
generation of 261.6 kW for the simulation. For the simulation of the different APM on the MP-
BESS, both the accumulated load and generation profile of the grid area were taken. To emulate
the load profile, 40 different statistically generated load profiles were generated, and each was
scaled to the real annual electricity demand of every consumer in the grid [218]. The resulting
annual minute-by-minute profiles were summarized to obtain an accumulated load profile, which
is shown in Figure 57 left. The generation profile was simulated by scaling a representative PV
profile from upper Bavaria to the overall installed PV power in the grid, multiplied by the
simultaneity factor of 0.85, shown in Figure 58 right. The same generation profile, but scaled to
the peak power of the PV systems, was used for all 18 PV systems.
Depending on the load profiles, the electro thermal model calculates the electrical behavior of
the LIB cell, which includes the interdependencies between the voltage difference between the
two cell terminals and the current flow as well as the resulting heat generation inside the cells.
Therefore, at each simulation step, depending on the calculated stress factors, the capacity fade
was simulated, and the BESS capacity was updated accordingly. The impedance and inner
resistance parameters were updated for further aging estimations.
APM GRID, SELF, and SCP were given parameters based on [92, 117, 205, 219], and a pre-
simulation was conducted. The resulting load profiles were evaluated with the aging model, and
the parameters for updating the power flow model were calculated and looped back into the
power flow model. The following discussion will briefly describe the resulting BESS behavior,
estimate the capacity fade and interconnect the capacity fade with the model knowledge and
LIB cell aging phenomena from the literature. Therefore, six different APMs, power profiles, were
simulated according to previously explained APMs in Subchapter 5.2 and Chapter 3.
The APMs are GRID, SELF, SELF+GRID, SELF+GRID+SCP, PCP and SCP. The operation of
the APM GRID limits the transformer power of the Moosham grid to a maximum of 157 kW,
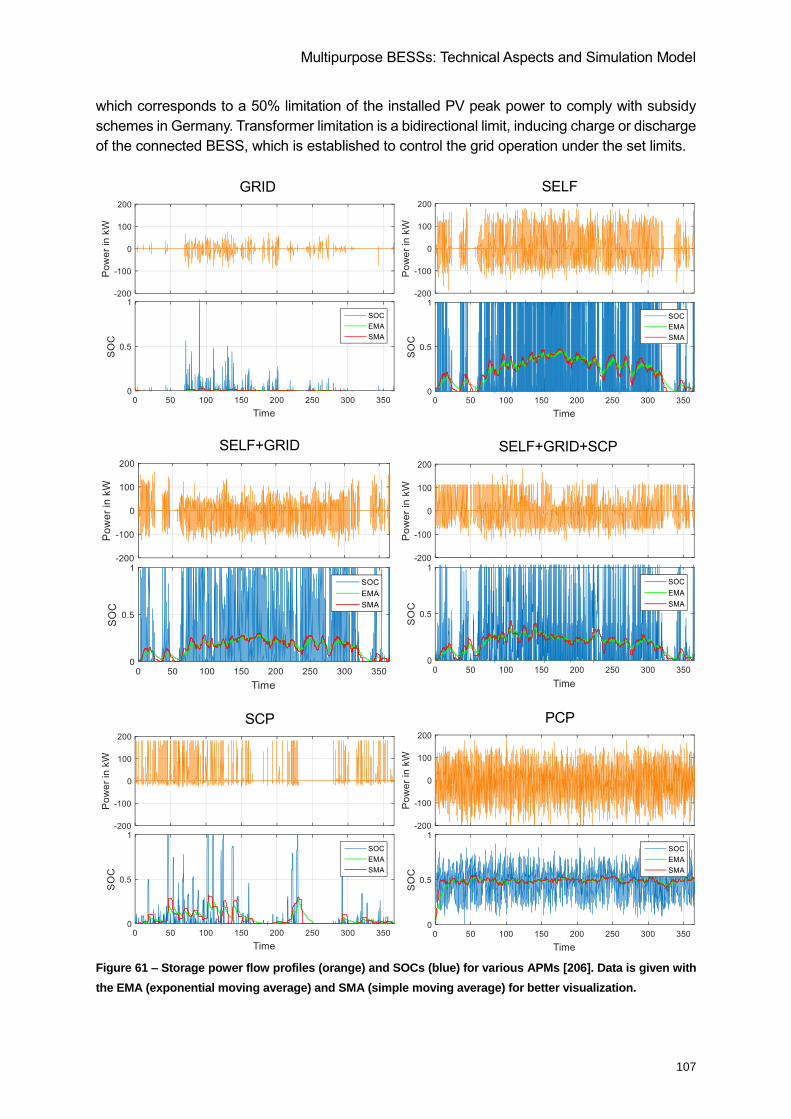
Multipurpose BESSs: Technical Aspects and Simulation Model
107
which corresponds to a 50% limitation of the installed PV peak power to comply with subsidy
schemes in Germany. Transformer limitation is a bidirectional limit, inducing charge or discharge
of the connected BESS, which is established to control the grid operation under the set limits.
GRID
SELF
SELF+GRID
SELF+GRID+SCP
SCP
PCP
Figure 61 – Storage power flow profiles (orange) and SOCs (blue) for various APMs [206]. Data is given with
the EMA (exponential moving average) and SMA (simple moving average) for better visualization.
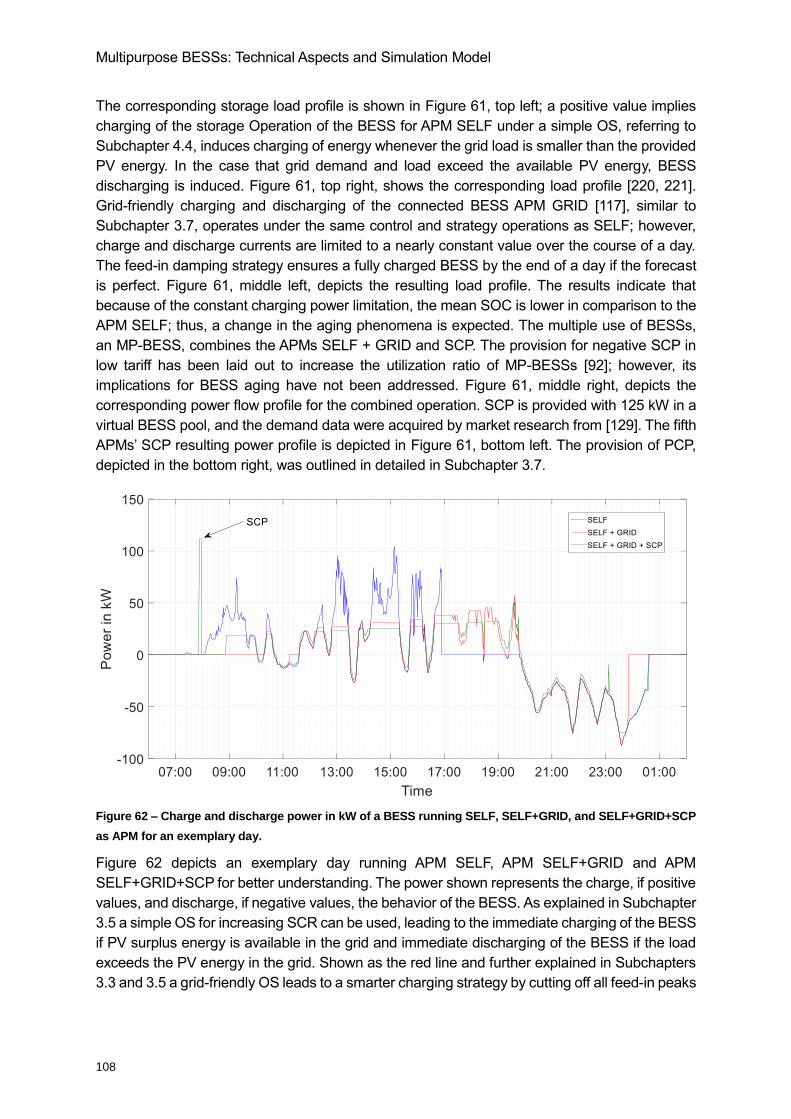
Multipurpose BESSs: Technical Aspects and Simulation Model
108
The corresponding storage load profile is shown in Figure 61, top left; a positive value implies
charging of the storage Operation of the BESS for APM SELF under a simple OS, referring to
Subchapter 4.4, induces charging of energy whenever the grid load is smaller than the provided
PV energy. In the case that grid demand and load exceed the available PV energy, BESS
discharging is induced. Figure 61, top right, shows the corresponding load profile [220, 221].
Grid-friendly charging and discharging of the connected BESS APM GRID [117], similar to
Subchapter 3.7, operates under the same control and strategy operations as SELF; however,
charge and discharge currents are limited to a nearly constant value over the course of a day.
The feed-in damping strategy ensures a fully charged BESS by the end of a day if the forecast
is perfect. Figure 61, middle left, depicts the resulting load profile. The results indicate that
because of the constant charging power limitation, the mean SOC is lower in comparison to the
APM SELF; thus, a change in the aging phenomena is expected. The multiple use of BESSs,
an MP-BESS, combines the APMs SELF + GRID and SCP. The provision for negative SCP in
low tariff has been laid out to increase the utilization ratio of MP-BESSs [92]; however, its
implications for BESS aging have not been addressed. Figure 61, middle right, depicts the
corresponding power flow profile for the combined operation. SCP is provided with 125 kW in a
virtual BESS pool, and the demand data were acquired by market research from [129]. The fifth
APMs’ SCP resulting power profile is depicted in Figure 61, bottom left. The provision of PCP,
depicted in the bottom right, was outlined in detailed in Subchapter 3.7.
Figure 62 – Charge and discharge power in kW of a BESS running SELF, SELF+GRID, and SELF+GRID+SCP
as APM for an exemplary day.
Figure 62 depicts an exemplary day running APM SELF, APM SELF+GRID and APM
SELF+GRID+SCP for better understanding. The power shown represents the charge, if positive
values, and discharge, if negative values, the behavior of the BESS. As explained in Subchapter
3.5 a simple OS for increasing SCR can be used, leading to the immediate charging of the BESS
if PV surplus energy is available in the grid and immediate discharging of the BESS if the load
exceeds the PV energy in the grid. Shown as the red line and further explained in Subchapters
3.3 and 3.5 a grid-friendly OS leads to a smarter charging strategy by cutting off all feed-in peaks
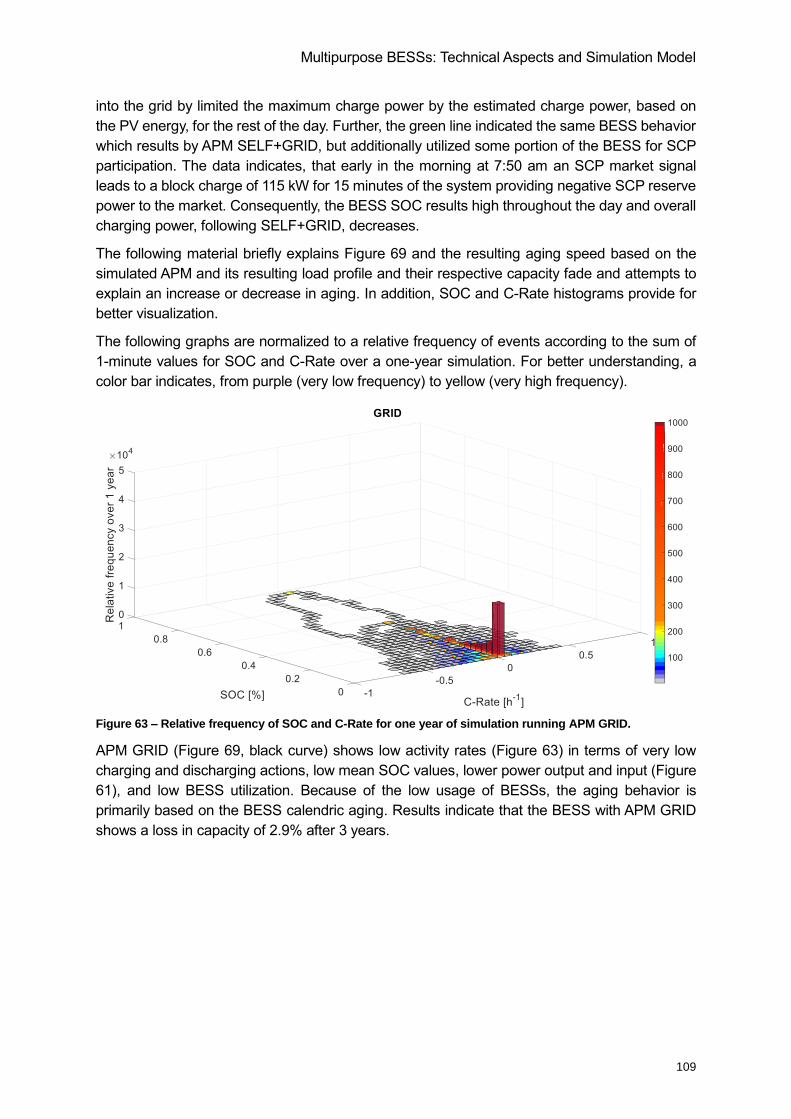
Multipurpose BESSs: Technical Aspects and Simulation Model
109
into the grid by limited the maximum charge power by the estimated charge power, based on
the PV energy, for the rest of the day. Further, the green line indicated the same BESS behavior
which results by APM SELF+GRID, but additionally utilized some portion of the BESS for SCP
participation. The data indicates, that early in the morning at 7:50 am an SCP market signal
leads to a block charge of 115 kW for 15 minutes of the system providing negative SCP reserve
power to the market. Consequently, the BESS SOC results high throughout the day and overall
charging power, following SELF+GRID, decreases.
The following material briefly explains Figure 69 and the resulting aging speed based on the
simulated APM and its resulting load profile and their respective capacity fade and attempts to
explain an increase or decrease in aging. In addition, SOC and C-Rate histograms provide for
better visualization.
The following graphs are normalized to a relative frequency of events according to the sum of
1-minute values for SOC and C-Rate over a one-year simulation. For better understanding, a
color bar indicates, from purple (very low frequency) to yellow (very high frequency).
Figure 63 – Relative frequency of SOC and C-Rate for one year of simulation running APM GRID.
APM GRID (Figure 69, black curve) shows low activity rates (Figure 63) in terms of very low
charging and discharging actions, low mean SOC values, lower power output and input (Figure
61), and low BESS utilization. Because of the low usage of BESSs, the aging behavior is
primarily based on the BESS calendric aging. Results indicate that the BESS with APM GRID
shows a loss in capacity of 2.9% after 3 years.
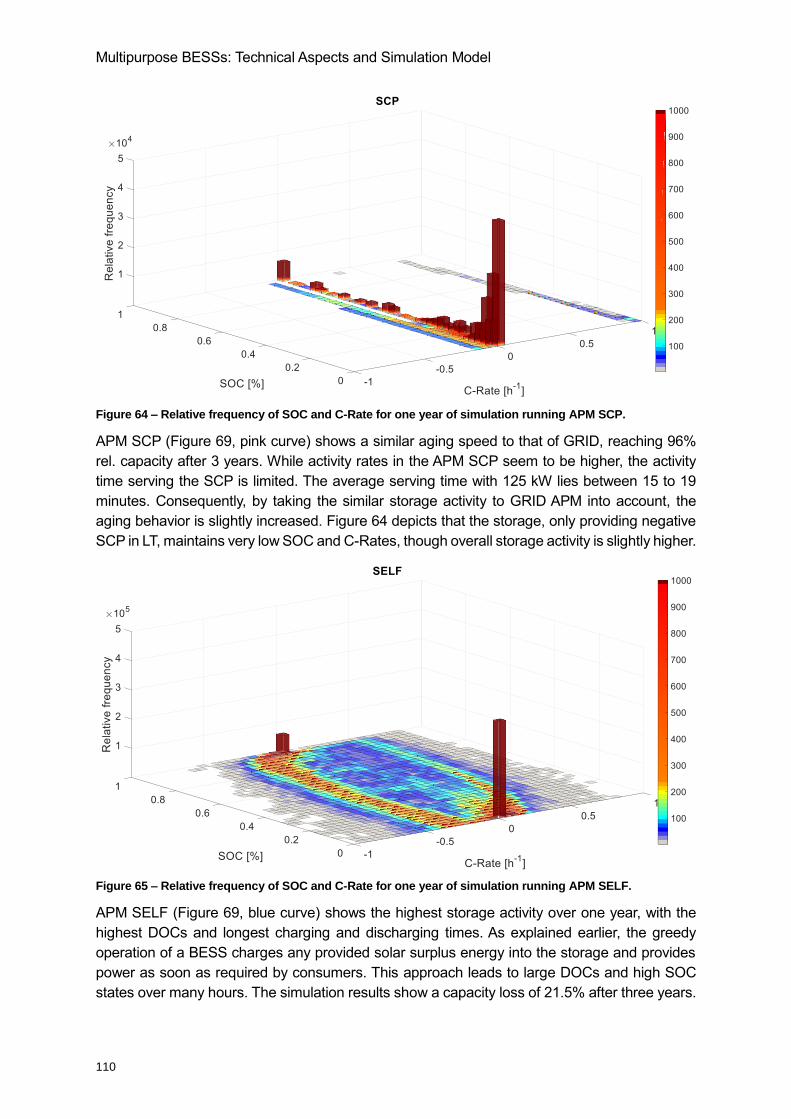
Multipurpose BESSs: Technical Aspects and Simulation Model
110
Figure 64 – Relative frequency of SOC and C-Rate for one year of simulation running APM SCP.
APM SCP (Figure 69, pink curve) shows a similar aging speed to that of GRID, reaching 96%
rel. capacity after 3 years. While activity rates in the APM SCP seem to be higher, the activity
time serving the SCP is limited. The average serving time with 125 kW lies between 15 to 19
minutes. Consequently, by taking the similar storage activity to GRID APM into account, the
aging behavior is slightly increased. Figure 64 depicts that the storage, only providing negative
SCP in LT, maintains very low SOC and C-Rates, though overall storage activity is slightly higher.
Figure 65 – Relative frequency of SOC and C-Rate for one year of simulation running APM SELF.
APM SELF (Figure 69, blue curve) shows the highest storage activity over one year, with the
highest DOCs and longest charging and discharging times. As explained earlier, the greedy
operation of a BESS charges any provided solar surplus energy into the storage and provides
power as soon as required by consumers. This approach leads to large DOCs and high SOC
states over many hours. The simulation results show a capacity loss of 21.5% after three years.
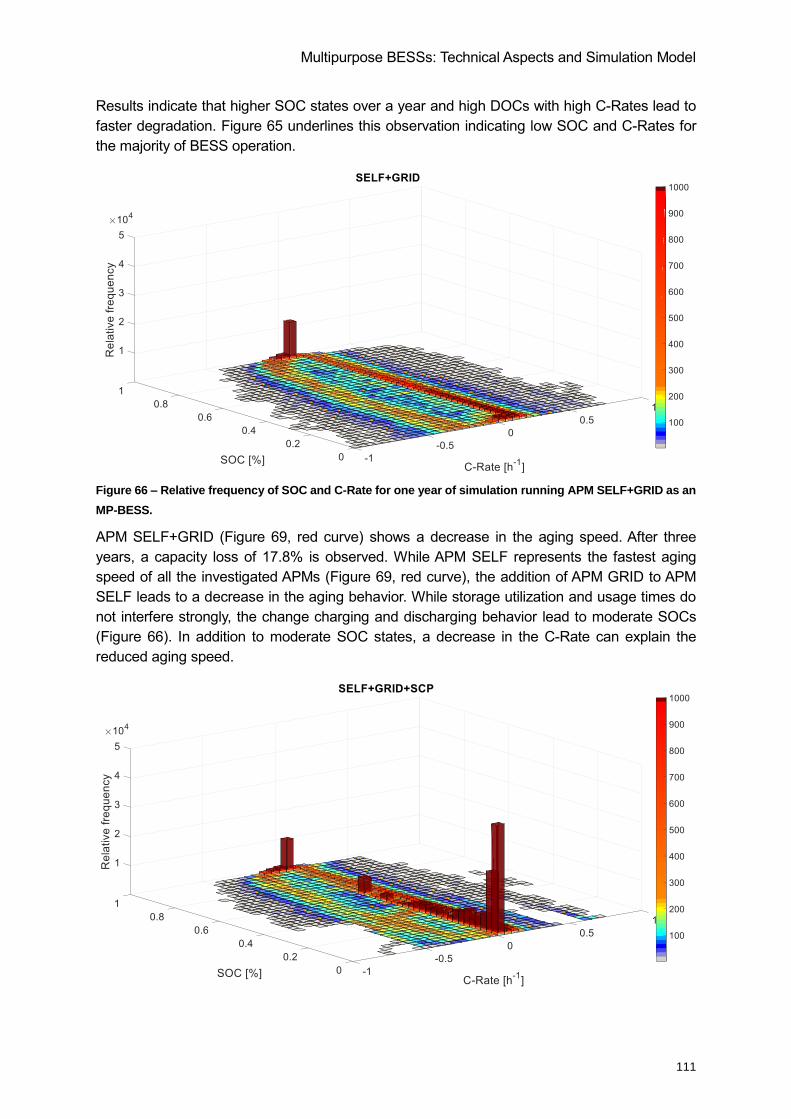
Multipurpose BESSs: Technical Aspects and Simulation Model
111
Results indicate that higher SOC states over a year and high DOCs with high C-Rates lead to
faster degradation. Figure 65 underlines this observation indicating low SOC and C-Rates for
the majority of BESS operation.
Figure 66 – Relative frequency of SOC and C-Rate for one year of simulation running APM SELF+GRID as an
MP-BESS.
APM SELF+GRID (Figure 69, red curve) shows a decrease in the aging speed. After three
years, a capacity loss of 17.8% is observed. While APM SELF represents the fastest aging
speed of all the investigated APMs (Figure 69, red curve), the addition of APM GRID to APM
SELF leads to a decrease in the aging behavior. While storage utilization and usage times do
not interfere strongly, the change charging and discharging behavior lead to moderate SOCs
(Figure 66). In addition to moderate SOC states, a decrease in the C-Rate can explain the
reduced aging speed.
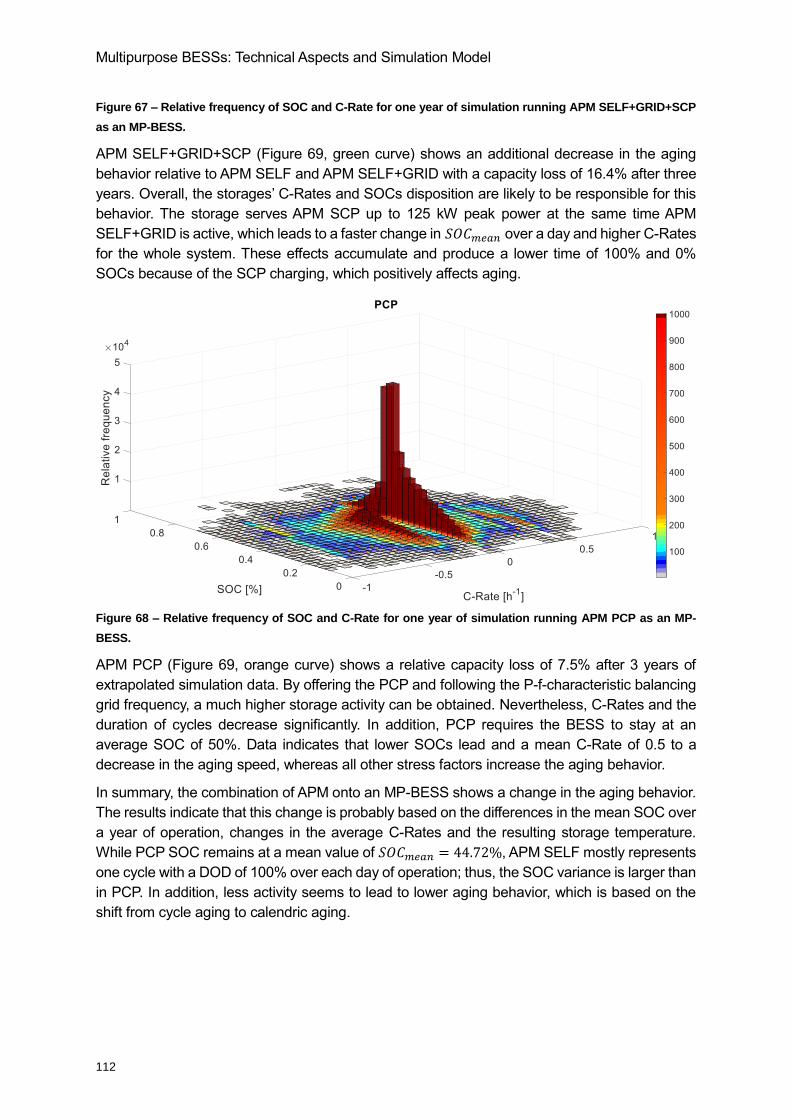
Multipurpose BESSs: Technical Aspects and Simulation Model
112
Figure 67 – Relative frequency of SOC and C-Rate for one year of simulation running APM SELF+GRID+SCP
as an MP-BESS.
APM SELF+GRID+SCP (Figure 69, green curve) shows an additional decrease in the aging
behavior relative to APM SELF and APM SELF+GRID with a capacity loss of 16.4% after three
years. Overall, the storages’ C-Rates and SOCs disposition are likely to be responsible for this
behavior. The storage serves APM SCP up to 125 kW peak power at the same time APM
SELF+GRID is active, which leads to a faster change in 𝑆𝑂𝐶𝑚𝑒𝑎𝑛 over a day and higher C-Rates
for the whole system. These effects accumulate and produce a lower time of 100% and 0%
SOCs because of the SCP charging, which positively affects aging.
Figure 68 – Relative frequency of SOC and C-Rate for one year of simulation running APM PCP as an MP-
BESS.
APM PCP (Figure 69, orange curve) shows a relative capacity loss of 7.5% after 3 years of
extrapolated simulation data. By offering the PCP and following the P-f-characteristic balancing
grid frequency, a much higher storage activity can be obtained. Nevertheless, C-Rates and the
duration of cycles decrease significantly. In addition, PCP requires the BESS to stay at an
average SOC of 50%. Data indicates that lower SOCs lead and a mean C-Rate of 0.5 to a
decrease in the aging speed, whereas all other stress factors increase the aging behavior.
In summary, the combination of APM onto an MP-BESS shows a change in the aging behavior.
The results indicate that this change is probably based on the differences in the mean SOC over
a year of operation, changes in the average C-Rates and the resulting storage temperature.
While PCP SOC remains at a mean value of 𝑆𝑂𝐶𝑚𝑒𝑎𝑛 = 44.72%, APM SELF mostly represents
one cycle with a DOD of 100% over each day of operation; thus, the SOC variance is larger than
in PCP. In addition, less activity seems to lead to lower aging behavior, which is based on the
shift from cycle aging to calendric aging.
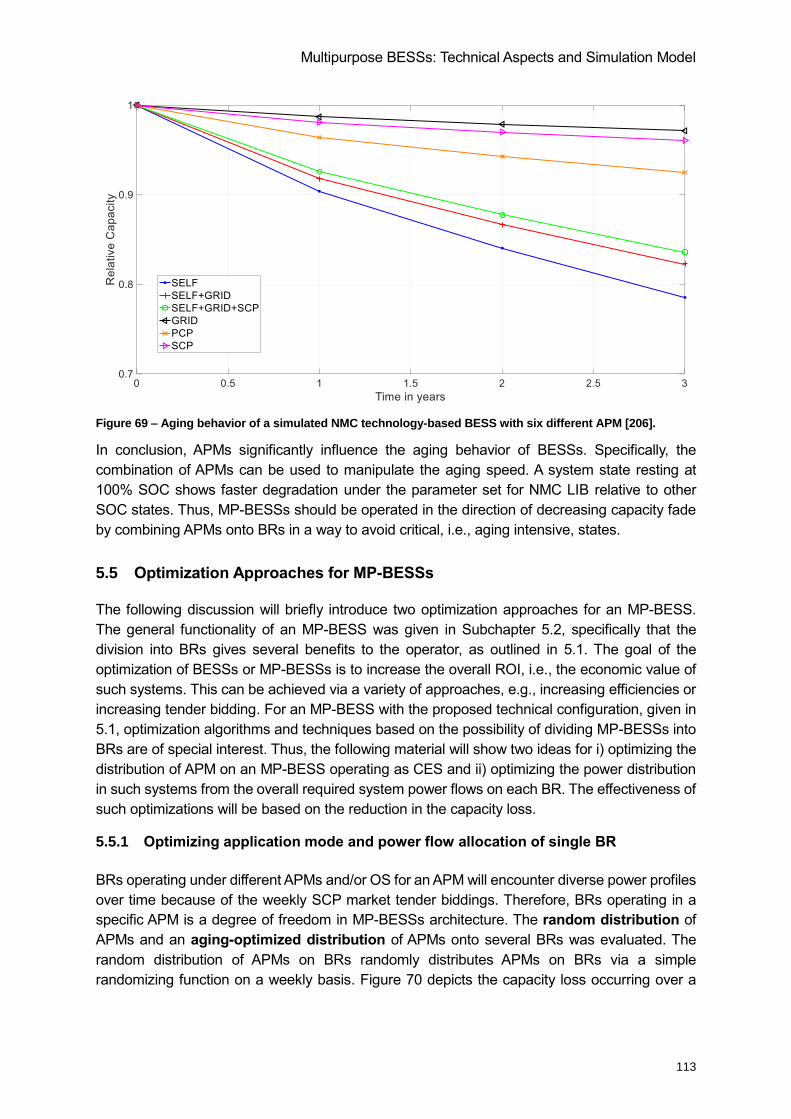
Multipurpose BESSs: Technical Aspects and Simulation Model
113
Figure 69 – Aging behavior of a simulated NMC technology-based BESS with six different APM [206].
In conclusion, APMs significantly influence the aging behavior of BESSs. Specifically, the
combination of APMs can be used to manipulate the aging speed. A system state resting at
100% SOC shows faster degradation under the parameter set for NMC LIB relative to other
SOC states. Thus, MP-BESSs should be operated in the direction of decreasing capacity fade
by combining APMs onto BRs in a way to avoid critical, i.e., aging intensive, states.
5.5 Optimization Approaches for MP-BESSs
The following discussion will briefly introduce two optimization approaches for an MP-BESS.
The general functionality of an MP-BESS was given in Subchapter 5.2, specifically that the
division into BRs gives several benefits to the operator, as outlined in 5.1. The goal of the
optimization of BESSs or MP-BESSs is to increase the overall ROI, i.e., the economic value of
such systems. This can be achieved via a variety of approaches, e.g., increasing efficiencies or
increasing tender bidding. For an MP-BESS with the proposed technical configuration, given in
5.1, optimization algorithms and techniques based on the possibility of dividing MP-BESSs into
BRs are of special interest. Thus, the following material will show two ideas for i) optimizing the
distribution of APM on an MP-BESS operating as CES and ii) optimizing the power distribution
in such systems from the overall required system power flows on each BR. The effectiveness of
such optimizations will be based on the reduction in the capacity loss.
5.5.1 Optimizing application mode and power flow allocation of single BR
BRs operating under different APMs and/or OS for an APM will encounter diverse power profiles
over time because of the weekly SCP market tender biddings. Therefore, BRs operating in a
specific APM is a degree of freedom in MP-BESSs architecture. The random distribution of
APMs and an aging-optimized distribution of APMs onto several BRs was evaluated. The
random distribution of APMs on BRs randomly distributes APMs on BRs via a simple
randomizing function on a weekly basis. Figure 70 depicts the capacity loss occurring over a
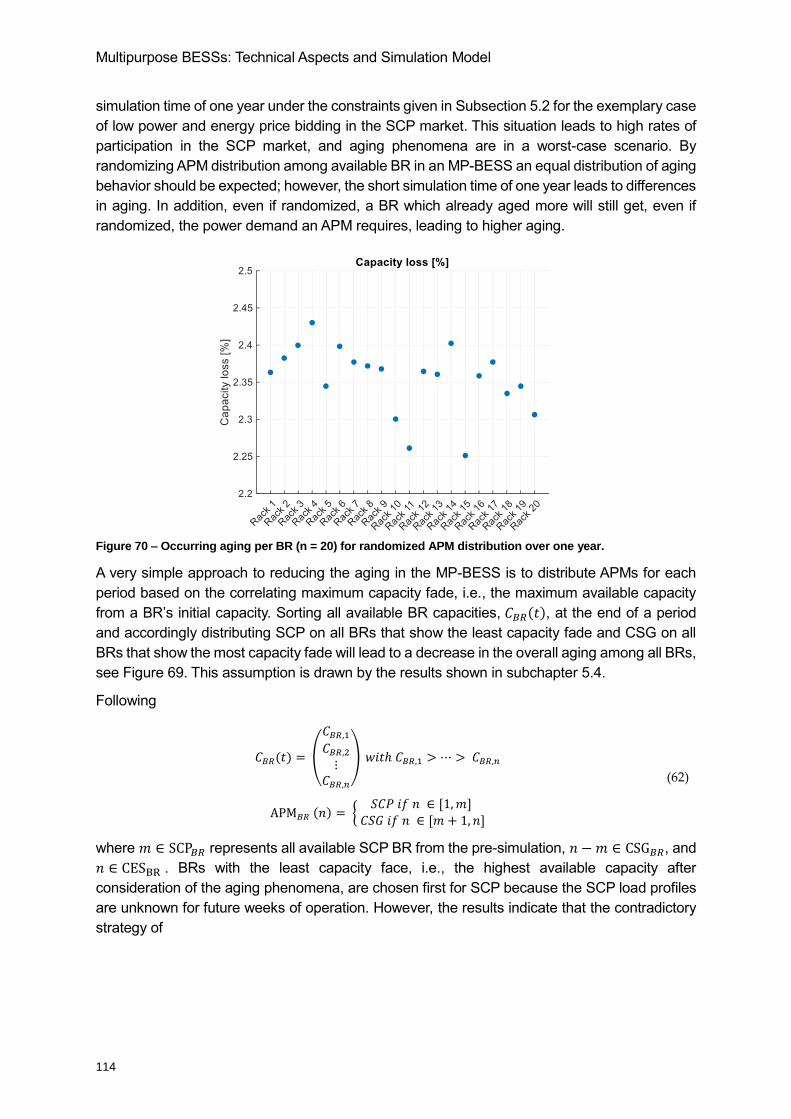
Multipurpose BESSs: Technical Aspects and Simulation Model
114
simulation time of one year under the constraints given in Subsection 5.2 for the exemplary case
of low power and energy price bidding in the SCP market. This situation leads to high rates of
participation in the SCP market, and aging phenomena are in a worst-case scenario. By
randomizing APM distribution among available BR in an MP-BESS an equal distribution of aging
behavior should be expected; however, the short simulation time of one year leads to differences
in aging. In addition, even if randomized, a BR which already aged more will still get, even if
randomized, the power demand an APM requires, leading to higher aging.
Figure 70 – Occurring aging per BR (n = 20) for randomized APM distribution over one year.
A very simple approach to reducing the aging in the MP-BESS is to distribute APMs for each
period based on the correlating maximum capacity fade, i.e., the maximum available capacity
from a BR’s initial capacity. Sorting all available BR capacities, 𝐶𝐵𝑅(𝑡), at the end of a period
and accordingly distributing SCP on all BRs that show the least capacity fade and CSG on all
BRs that show the most capacity fade will lead to a decrease in the overall aging among all BRs,
see Figure 69. This assumption is drawn by the results shown in subchapter 5.4.
Following
𝐶𝐵𝑅(𝑡) = (
𝐶𝐵𝑅,1𝐶𝐵𝑅,2⋮𝐶𝐵𝑅,𝑛
) 𝑤𝑖𝑡ℎ 𝐶𝐵𝑅,1 > ⋯ > 𝐶𝐵𝑅,𝑛
APM𝐵𝑅 (𝑛) = {𝑆𝐶𝑃 𝑖𝑓 𝑛 ∈ [1,𝑚]
𝐶𝑆𝐺 𝑖𝑓 𝑛 ∈ [𝑚 + 1, 𝑛]
(62)
where 𝑚 ∈ SCP𝐵𝑅 represents all available SCP BR from the pre-simulation, 𝑛 −𝑚 ∈ CSG𝐵𝑅, and
𝑛 ∈ CESBR . BRs with the least capacity face, i.e., the highest available capacity after
consideration of the aging phenomena, are chosen first for SCP because the SCP load profiles
are unknown for future weeks of operation. However, the results indicate that the contradictory
strategy of
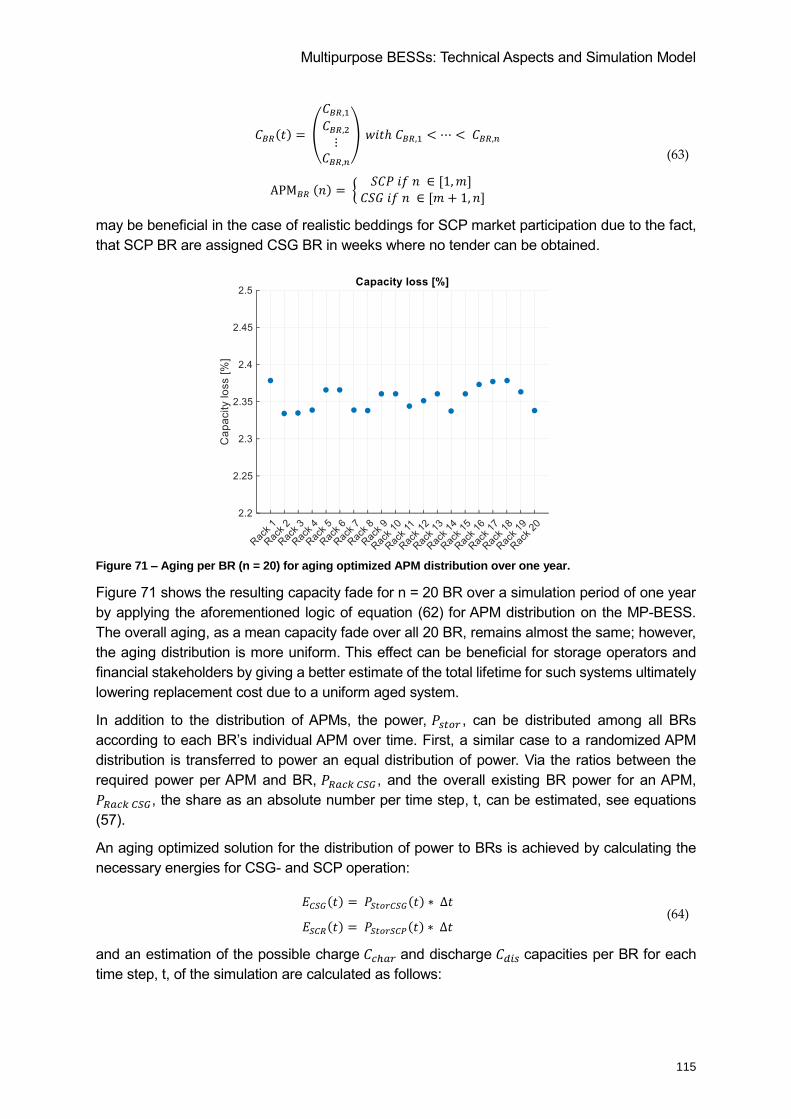
Multipurpose BESSs: Technical Aspects and Simulation Model
115
𝐶𝐵𝑅(𝑡) = (
𝐶𝐵𝑅,1𝐶𝐵𝑅,2⋮𝐶𝐵𝑅,𝑛
) 𝑤𝑖𝑡ℎ 𝐶𝐵𝑅,1 < ⋯ < 𝐶𝐵𝑅,𝑛
APM𝐵𝑅 (𝑛) = {𝑆𝐶𝑃 𝑖𝑓 𝑛 ∈ [1,𝑚]
𝐶𝑆𝐺 𝑖𝑓 𝑛 ∈ [𝑚 + 1, 𝑛]
(63)
may be beneficial in the case of realistic beddings for SCP market participation due to the fact,
that SCP BR are assigned CSG BR in weeks where no tender can be obtained.
Figure 71 – Aging per BR (n = 20) for aging optimized APM distribution over one year.
Figure 71 shows the resulting capacity fade for n = 20 BR over a simulation period of one year
by applying the aforementioned logic of equation (62) for APM distribution on the MP-BESS.
The overall aging, as a mean capacity fade over all 20 BR, remains almost the same; however,
the aging distribution is more uniform. This effect can be beneficial for storage operators and
financial stakeholders by giving a better estimate of the total lifetime for such systems ultimately
lowering replacement cost due to a uniform aged system.
In addition to the distribution of APMs, the power, 𝑃𝑠𝑡𝑜𝑟 , can be distributed among all BRs
according to each BR’s individual APM over time. First, a similar case to a randomized APM
distribution is transferred to power an equal distribution of power. Via the ratios between the
required power per APM and BR, 𝑃𝑅𝑎𝑐𝑘 𝐶𝑆𝐺 , and the overall existing BR power for an APM,
𝑃𝑅𝑎𝑐𝑘 𝐶𝑆𝐺, the share as an absolute number per time step, t, can be estimated, see equations
(57).
An aging optimized solution for the distribution of power to BRs is achieved by calculating the
necessary energies for CSG- and SCP operation:
𝐸𝐶𝑆𝐺(𝑡) = 𝑃𝑆𝑡𝑜𝑟𝐶𝑆𝐺(𝑡) ∗ ∆𝑡
𝐸𝑆𝐶𝑅(𝑡) = 𝑃𝑆𝑡𝑜𝑟𝑆𝐶𝑃(𝑡) ∗ ∆𝑡 (64)
and an estimation of the possible charge 𝐶𝑐ℎ𝑎𝑟 and discharge 𝐶𝑑𝑖𝑠 capacities per BR for each
time step, t, of the simulation are calculated as follows:
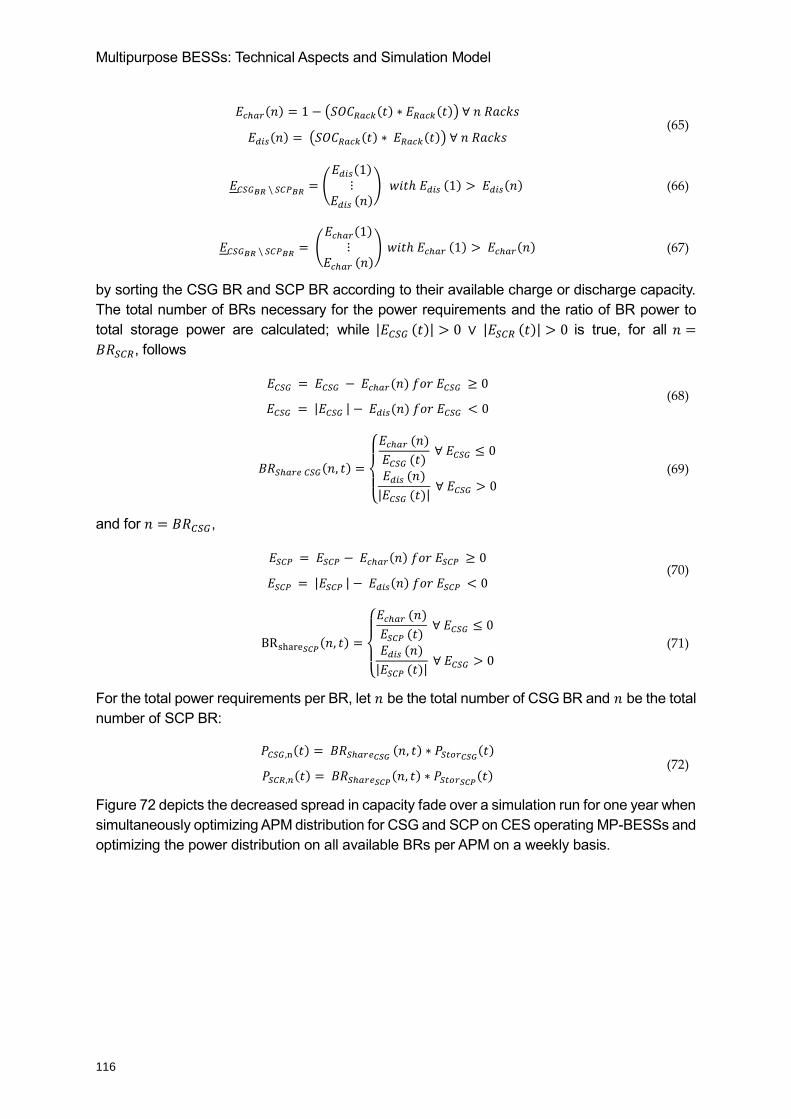
Multipurpose BESSs: Technical Aspects and Simulation Model
116
𝐸𝑐ℎ𝑎𝑟(𝑛) = 1 − (𝑆𝑂𝐶𝑅𝑎𝑐𝑘(𝑡) ∗ 𝐸𝑅𝑎𝑐𝑘(𝑡)) ∀ 𝑛 𝑅𝑎𝑐𝑘𝑠
𝐸𝑑𝑖𝑠(𝑛) = (𝑆𝑂𝐶𝑅𝑎𝑐𝑘(𝑡) ∗ 𝐸𝑅𝑎𝑐𝑘(𝑡)) ∀ 𝑛 𝑅𝑎𝑐𝑘𝑠 (65)
𝐸𝐶𝑆𝐺𝐵𝑅 \ 𝑆𝐶𝑃𝐵𝑅 = (𝐸𝑑𝑖𝑠(1)⋮
𝐸𝑑𝑖𝑠 (𝑛)) 𝑤𝑖𝑡ℎ 𝐸𝑑𝑖𝑠 (1) > 𝐸𝑑𝑖𝑠(𝑛) (66)
𝐸𝐶𝑆𝐺𝐵𝑅 \ 𝑆𝐶𝑃𝐵𝑅 = (𝐸𝑐ℎ𝑎𝑟(1)⋮
𝐸𝑐ℎ𝑎𝑟 (𝑛)) 𝑤𝑖𝑡ℎ 𝐸𝑐ℎ𝑎𝑟 (1) > 𝐸𝑐ℎ𝑎𝑟(𝑛) (67)
by sorting the CSG BR and SCP BR according to their available charge or discharge capacity.
The total number of BRs necessary for the power requirements and the ratio of BR power to
total storage power are calculated; while |𝐸𝐶𝑆𝐺 (𝑡)| > 0 ∨ |𝐸𝑆𝐶𝑅 (𝑡)| > 0 is true, for all 𝑛 =
𝐵𝑅𝑆𝐶𝑅, follows
𝐸𝐶𝑆𝐺 = 𝐸𝐶𝑆𝐺 − 𝐸𝑐ℎ𝑎𝑟(𝑛) 𝑓𝑜𝑟 𝐸𝐶𝑆𝐺 ≥ 0
𝐸𝐶𝑆𝐺 = |𝐸𝐶𝑆𝐺 | − 𝐸𝑑𝑖𝑠(𝑛) 𝑓𝑜𝑟 𝐸𝐶𝑆𝐺 < 0 (68)
𝐵𝑅𝑆ℎ𝑎𝑟𝑒 𝐶𝑆𝐺(𝑛, 𝑡) =
{
𝐸𝑐ℎ𝑎𝑟 (𝑛)
𝐸𝐶𝑆𝐺 (𝑡) ∀ 𝐸𝐶𝑆𝐺 ≤ 0
𝐸𝑑𝑖𝑠 (𝑛)
|𝐸𝐶𝑆𝐺 (𝑡)| ∀ 𝐸𝐶𝑆𝐺 > 0
(69)
and for 𝑛 = 𝐵𝑅𝐶𝑆𝐺,
𝐸𝑆𝐶𝑃 = 𝐸𝑆𝐶𝑃 − 𝐸𝑐ℎ𝑎𝑟(𝑛) 𝑓𝑜𝑟 𝐸𝑆𝐶𝑃 ≥ 0
𝐸𝑆𝐶𝑃 = |𝐸𝑆𝐶𝑃 | − 𝐸𝑑𝑖𝑠(𝑛) 𝑓𝑜𝑟 𝐸𝑆𝐶𝑃 < 0 (70)
BR ha 𝑆𝐶𝑃(𝑛, 𝑡) =
{
𝐸𝑐ℎ𝑎𝑟 (𝑛)
𝐸𝑆𝐶𝑃 (𝑡) ∀ 𝐸𝐶𝑆𝐺 ≤ 0
𝐸𝑑𝑖𝑠 (𝑛)
|𝐸𝑆𝐶𝑃 (𝑡)| ∀ 𝐸𝐶𝑆𝐺 > 0
(71)
For the total power requirements per BR, let 𝑛 be the total number of CSG BR and 𝑛 be the total
number of SCP BR:
𝑃𝐶𝑆𝐺,n(𝑡) = 𝐵𝑅𝑆ℎ𝑎𝑟𝑒𝐶𝑆𝐺 (𝑛, 𝑡) ∗ 𝑃𝑆𝑡𝑜𝑟𝐶𝑆𝐺(𝑡)
𝑃𝑆𝐶𝑅,𝑛(𝑡) = 𝐵𝑅𝑆ℎ𝑎𝑟𝑒𝑆𝐶𝑃(𝑛, 𝑡) ∗ 𝑃𝑆𝑡𝑜𝑟𝑆𝐶𝑃(𝑡) (72)
Figure 72 depicts the decreased spread in capacity fade over a simulation run for one year when
simultaneously optimizing APM distribution for CSG and SCP on CES operating MP-BESSs and
optimizing the power distribution on all available BRs per APM on a weekly basis.
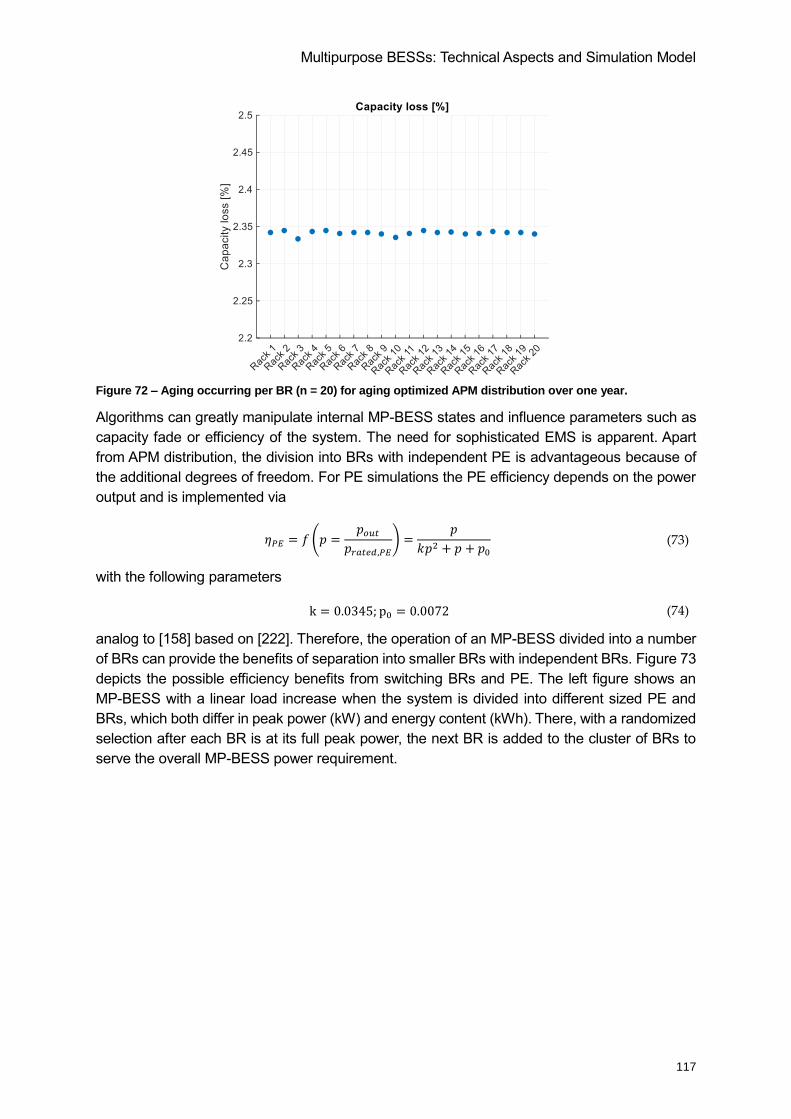
Multipurpose BESSs: Technical Aspects and Simulation Model
117
Figure 72 – Aging occurring per BR (n = 20) for aging optimized APM distribution over one year.
Algorithms can greatly manipulate internal MP-BESS states and influence parameters such as
capacity fade or efficiency of the system. The need for sophisticated EMS is apparent. Apart
from APM distribution, the division into BRs with independent PE is advantageous because of
the additional degrees of freedom. For PE simulations the PE efficiency depends on the power
output and is implemented via
𝜂𝑃𝐸 = 𝑓 (𝑝 =𝑝𝑜𝑢𝑡𝑝𝑟𝑎𝑡𝑒𝑑,𝑃𝐸
) =𝑝
𝑘𝑝2 + 𝑝 + 𝑝0 (73)
with the following parameters
k = 0.0345; p0 = 0.0072 (74)
analog to [158] based on [222]. Therefore, the operation of an MP-BESS divided into a number
of BRs can provide the benefits of separation into smaller BRs with independent BRs. Figure 73
depicts the possible efficiency benefits from switching BRs and PE. The left figure shows an
MP-BESS with a linear load increase when the system is divided into different sized PE and
BRs, which both differ in peak power (kW) and energy content (kWh). There, with a randomized
selection after each BR is at its full peak power, the next BR is added to the cluster of BRs to
serve the overall MP-BESS power requirement.
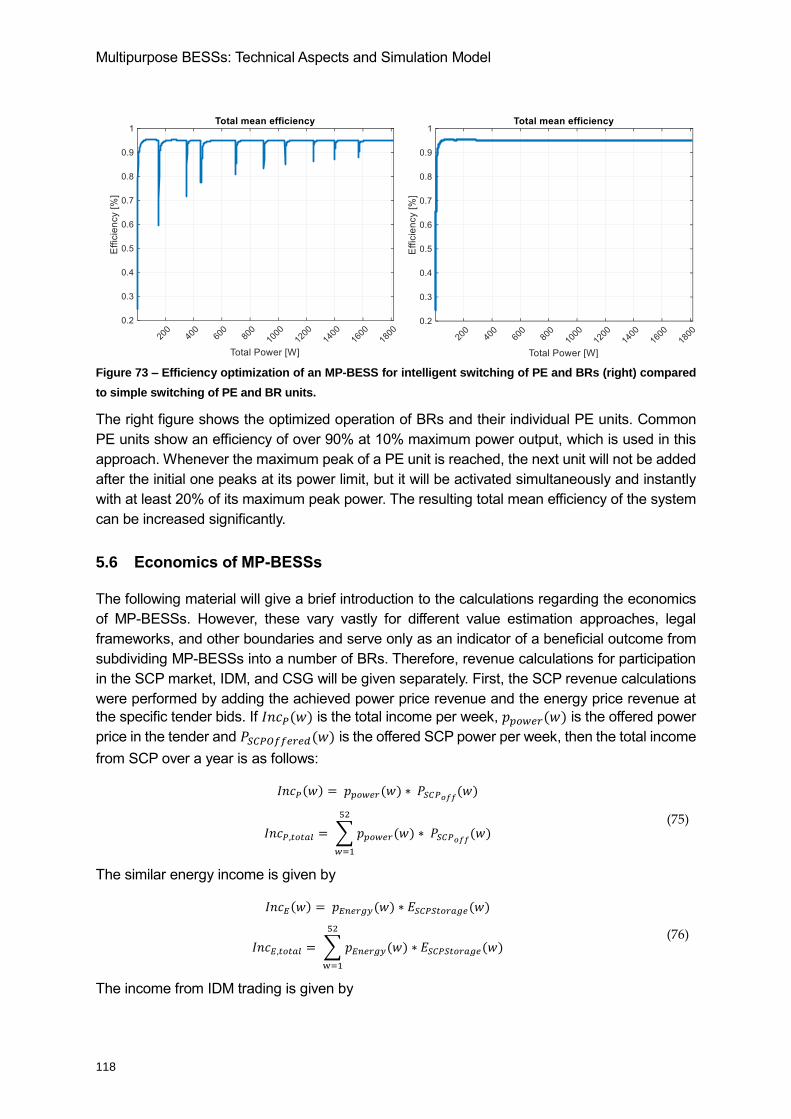
Multipurpose BESSs: Technical Aspects and Simulation Model
118
Figure 73 – Efficiency optimization of an MP-BESS for intelligent switching of PE and BRs (right) compared
to simple switching of PE and BR units.
The right figure shows the optimized operation of BRs and their individual PE units. Common
PE units show an efficiency of over 90% at 10% maximum power output, which is used in this
approach. Whenever the maximum peak of a PE unit is reached, the next unit will not be added
after the initial one peaks at its power limit, but it will be activated simultaneously and instantly
with at least 20% of its maximum peak power. The resulting total mean efficiency of the system
can be increased significantly.
5.6 Economics of MP-BESSs
The following material will give a brief introduction to the calculations regarding the economics
of MP-BESSs. However, these vary vastly for different value estimation approaches, legal
frameworks, and other boundaries and serve only as an indicator of a beneficial outcome from
subdividing MP-BESSs into a number of BRs. Therefore, revenue calculations for participation
in the SCP market, IDM, and CSG will be given separately. First, the SCP revenue calculations
were performed by adding the achieved power price revenue and the energy price revenue at
the specific tender bids. If 𝐼𝑛𝑐𝑃(𝑤) is the total income per week, 𝑝𝑝𝑜𝑤𝑒𝑟(𝑤) is the offered power
price in the tender and 𝑃𝑆𝐶𝑃𝑂𝑓𝑓𝑒𝑟𝑒𝑑(𝑤) is the offered SCP power per week, then the total income
from SCP over a year is as follows:
𝐼𝑛𝑐𝑃(𝑤) = 𝑝𝑝𝑜𝑤𝑒𝑟(𝑤) ∗ 𝑃𝑆𝐶𝑃𝑜𝑓𝑓(𝑤)
𝐼𝑛𝑐𝑃,𝑡𝑜𝑡𝑎𝑙 = ∑ 𝑝𝑝𝑜𝑤𝑒𝑟(𝑤) ∗ 𝑃𝑆𝐶𝑃𝑜𝑓𝑓(𝑤)
52
𝑤=1
(75)
The similar energy income is given by
𝐼𝑛𝑐𝐸(𝑤) = 𝑝𝐸𝑛𝑒𝑟𝑔𝑦(𝑤) ∗ 𝐸𝑆𝐶𝑃𝑆𝑡𝑜𝑟𝑎𝑔𝑒(𝑤)
𝐼𝑛𝑐𝐸,𝑡𝑜𝑡𝑎𝑙 = ∑ 𝑝𝐸𝑛𝑒𝑟𝑔𝑦(𝑤) ∗ 𝐸𝑆𝐶𝑃𝑆𝑡𝑜𝑟𝑎𝑔𝑒(𝑤)
52
=1
(76)
The income from IDM trading is given by
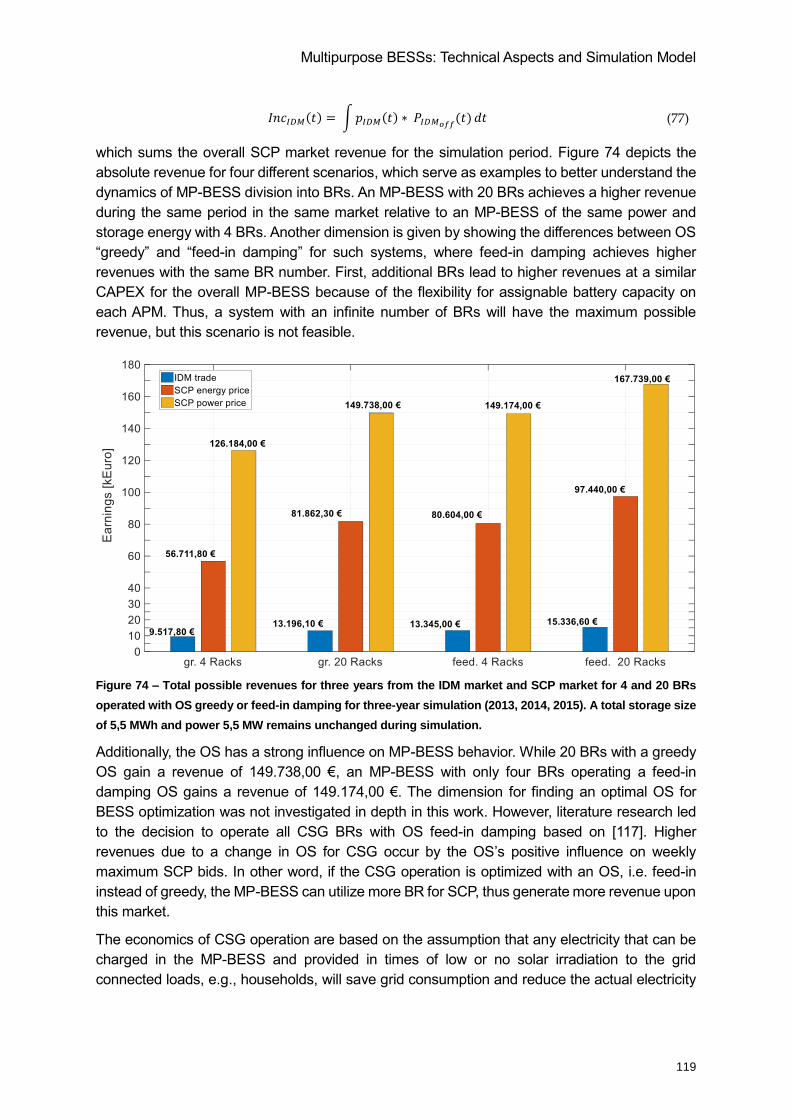
Multipurpose BESSs: Technical Aspects and Simulation Model
119
𝐼𝑛𝑐𝐼𝐷𝑀(𝑡) = ∫𝑝𝐼𝐷𝑀(𝑡) ∗ 𝑃𝐼𝐷𝑀𝑜𝑓𝑓(𝑡) 𝑑𝑡 (77)
which sums the overall SCP market revenue for the simulation period. Figure 74 depicts the
absolute revenue for four different scenarios, which serve as examples to better understand the
dynamics of MP-BESS division into BRs. An MP-BESS with 20 BRs achieves a higher revenue
during the same period in the same market relative to an MP-BESS of the same power and
storage energy with 4 BRs. Another dimension is given by showing the differences between OS
“greedy” and “feed-in damping” for such systems, where feed-in damping achieves higher
revenues with the same BR number. First, additional BRs lead to higher revenues at a similar
CAPEX for the overall MP-BESS because of the flexibility for assignable battery capacity on
each APM. Thus, a system with an infinite number of BRs will have the maximum possible
revenue, but this scenario is not feasible.
Figure 74 – Total possible revenues for three years from the IDM market and SCP market for 4 and 20 BRs
operated with OS greedy or feed-in damping for three-year simulation (2013, 2014, 2015). A total storage size
of 5,5 MWh and power 5,5 MW remains unchanged during simulation.
Additionally, the OS has a strong influence on MP-BESS behavior. While 20 BRs with a greedy
OS gain a revenue of 149.738,00 €, an MP-BESS with only four BRs operating a feed-in
damping OS gains a revenue of 149.174,00 €. The dimension for finding an optimal OS for
BESS optimization was not investigated in depth in this work. However, literature research led
to the decision to operate all CSG BRs with OS feed-in damping based on [117]. Higher
revenues due to a change in OS for CSG occur by the OS’s positive influence on weekly
maximum SCP bids. In other word, if the CSG operation is optimized with an OS, i.e. feed-in
instead of greedy, the MP-BESS can utilize more BR for SCP, thus generate more revenue upon
this market.
The economics of CSG operation are based on the assumption that any electricity that can be
charged in the MP-BESS and provided in times of low or no solar irradiation to the grid
connected loads, e.g., households, will save grid consumption and reduce the actual electricity
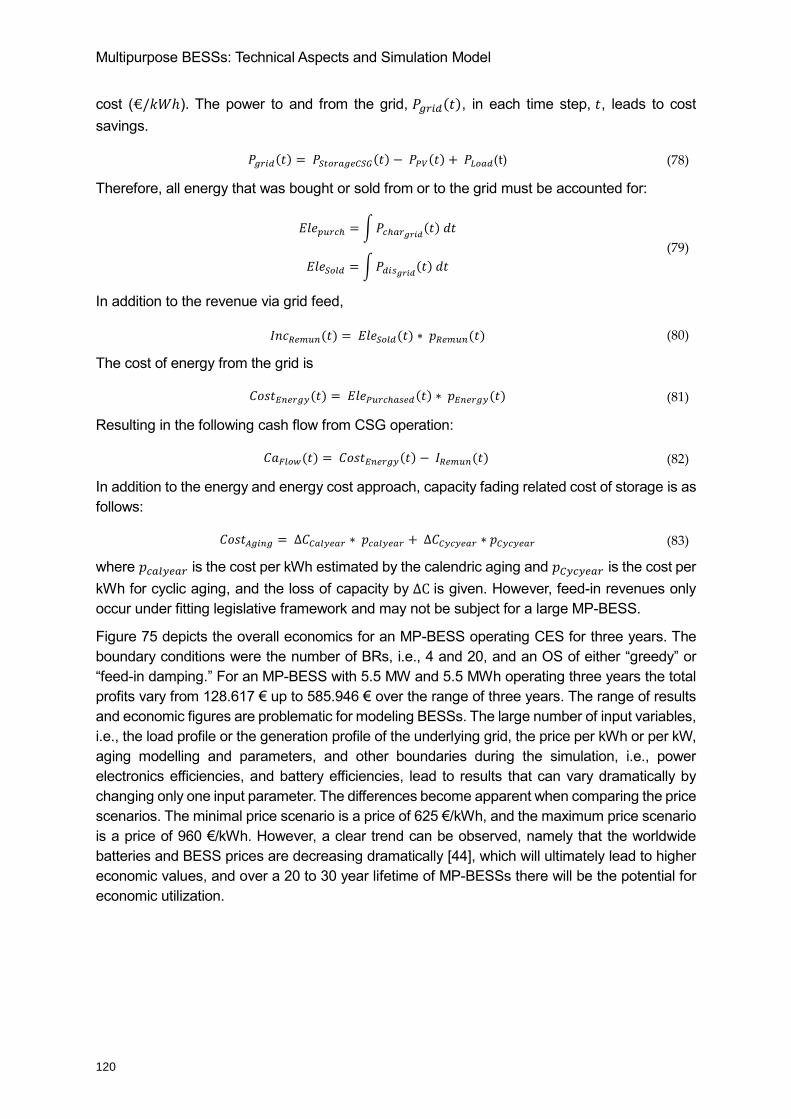
Multipurpose BESSs: Technical Aspects and Simulation Model
120
cost (€/𝑘𝑊ℎ ). The power to and from the grid, 𝑃𝑔𝑟𝑖𝑑(𝑡) , in each time step, 𝑡 , leads to cost
savings.
𝑃𝑔𝑟𝑖𝑑(𝑡) = 𝑃𝑆𝑡𝑜𝑟𝑎𝑔𝑒𝐶𝑆𝐺(𝑡) − 𝑃𝑃𝑉(𝑡) + 𝑃𝐿𝑜𝑎𝑑(t) (78)
Therefore, all energy that was bought or sold from or to the grid must be accounted for:
𝐸𝑙𝑒𝑝𝑢𝑟𝑐ℎ = ∫𝑃𝑐ℎ𝑎𝑟𝑔𝑟𝑖𝑑(𝑡) 𝑑𝑡
𝐸𝑙𝑒𝑆𝑜𝑙𝑑 = ∫𝑃𝑑𝑖𝑠𝑔𝑟𝑖𝑑(𝑡) 𝑑𝑡
(79)
In addition to the revenue via grid feed,
𝐼𝑛𝑐𝑅𝑒𝑚𝑢𝑛(𝑡) = 𝐸𝑙𝑒𝑆𝑜𝑙𝑑(𝑡) ∗ 𝑝𝑅𝑒𝑚𝑢𝑛(𝑡) (80)
The cost of energy from the grid is
𝐶𝑜𝑠𝑡𝐸𝑛𝑒𝑟𝑔𝑦(𝑡) = 𝐸𝑙𝑒𝑃𝑢𝑟𝑐ℎ𝑎𝑠𝑒𝑑(𝑡) ∗ 𝑝𝐸𝑛𝑒𝑟𝑔𝑦(𝑡) (81)
Resulting in the following cash flow from CSG operation:
𝐶𝑎𝐹𝑙𝑜𝑤(𝑡) = 𝐶𝑜𝑠𝑡𝐸𝑛𝑒𝑟𝑔𝑦(𝑡) − 𝐼𝑅𝑒𝑚𝑢𝑛(𝑡) (82)
In addition to the energy and energy cost approach, capacity fading related cost of storage is as
follows:
𝐶𝑜𝑠𝑡𝐴𝑔𝑖𝑛𝑔 = ∆𝐶𝐶𝑎𝑙𝑦𝑒𝑎𝑟 ∗ 𝑝𝑐𝑎𝑙𝑦𝑒𝑎𝑟 + ∆𝐶𝐶𝑦𝑐𝑦𝑒𝑎𝑟 ∗ 𝑝𝐶𝑦𝑐𝑦𝑒𝑎𝑟 (83)
where 𝑝𝑐𝑎𝑙𝑦𝑒𝑎𝑟 is the cost per kWh estimated by the calendric aging and 𝑝𝐶𝑦𝑐𝑦𝑒𝑎𝑟 is the cost per
kWh for cyclic aging, and the loss of capacity by ∆C is given. However, feed-in revenues only
occur under fitting legislative framework and may not be subject for a large MP-BESS.
Figure 75 depicts the overall economics for an MP-BESS operating CES for three years. The
boundary conditions were the number of BRs, i.e., 4 and 20, and an OS of either “greedy” or
“feed-in damping.” For an MP-BESS with 5.5 MW and 5.5 MWh operating three years the total
profits vary from 128.617 € up to 585.946 € over the range of three years. The range of results
and economic figures are problematic for modeling BESSs. The large number of input variables,
i.e., the load profile or the generation profile of the underlying grid, the price per kWh or per kW,
aging modelling and parameters, and other boundaries during the simulation, i.e., power
electronics efficiencies, and battery efficiencies, lead to results that can vary dramatically by
changing only one input parameter. The differences become apparent when comparing the price
scenarios. The minimal price scenario is a price of 625 €/kWh, and the maximum price scenario
is a price of 960 €/kWh. However, a clear trend can be observed, namely that the worldwide
batteries and BESS prices are decreasing dramatically [44], which will ultimately lead to higher
economic values, and over a 20 to 30 year lifetime of MP-BESSs there will be the potential for
economic utilization.
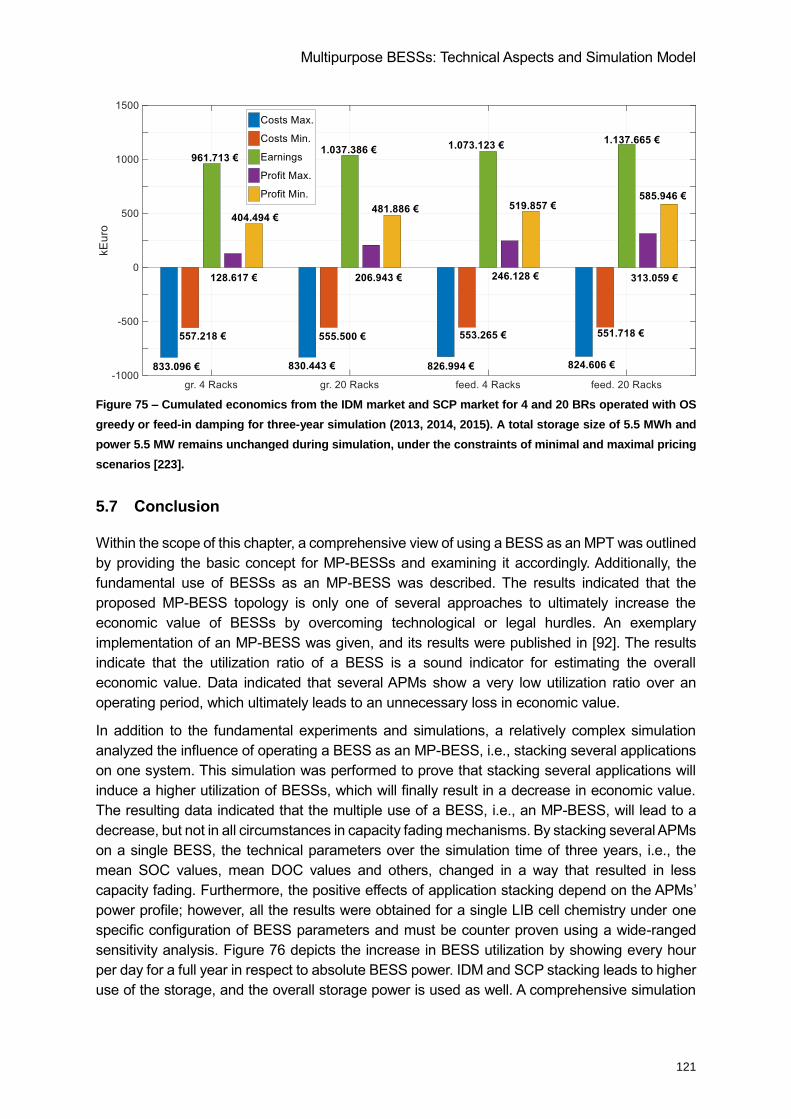
Multipurpose BESSs: Technical Aspects and Simulation Model
121
Figure 75 – Cumulated economics from the IDM market and SCP market for 4 and 20 BRs operated with OS
greedy or feed-in damping for three-year simulation (2013, 2014, 2015). A total storage size of 5.5 MWh and
power 5.5 MW remains unchanged during simulation, under the constraints of minimal and maximal pricing
scenarios [223].
5.7 Conclusion
Within the scope of this chapter, a comprehensive view of using a BESS as an MPT was outlined
by providing the basic concept for MP-BESSs and examining it accordingly. Additionally, the
fundamental use of BESSs as an MP-BESS was described. The results indicated that the
proposed MP-BESS topology is only one of several approaches to ultimately increase the
economic value of BESSs by overcoming technological or legal hurdles. An exemplary
implementation of an MP-BESS was given, and its results were published in [92]. The results
indicate that the utilization ratio of a BESS is a sound indicator for estimating the overall
economic value. Data indicated that several APMs show a very low utilization ratio over an
operating period, which ultimately leads to an unnecessary loss in economic value.
In addition to the fundamental experiments and simulations, a relatively complex simulation
analyzed the influence of operating a BESS as an MP-BESS, i.e., stacking several applications
on one system. This simulation was performed to prove that stacking several applications will
induce a higher utilization of BESSs, which will finally result in a decrease in economic value.
The resulting data indicated that the multiple use of a BESS, i.e., an MP-BESS, will lead to a
decrease, but not in all circumstances in capacity fading mechanisms. By stacking several APMs
on a single BESS, the technical parameters over the simulation time of three years, i.e., the
mean SOC values, mean DOC values and others, changed in a way that resulted in less
capacity fading. Furthermore, the positive effects of application stacking depend on the APMs’
power profile; however, all the results were obtained for a single LIB cell chemistry under one
specific configuration of BESS parameters and must be counter proven using a wide-ranged
sensitivity analysis. Figure 76 depicts the increase in BESS utilization by showing every hour
per day for a full year in respect to absolute BESS power. IDM and SCP stacking leads to higher
use of the storage, and the overall storage power is used as well. A comprehensive simulation
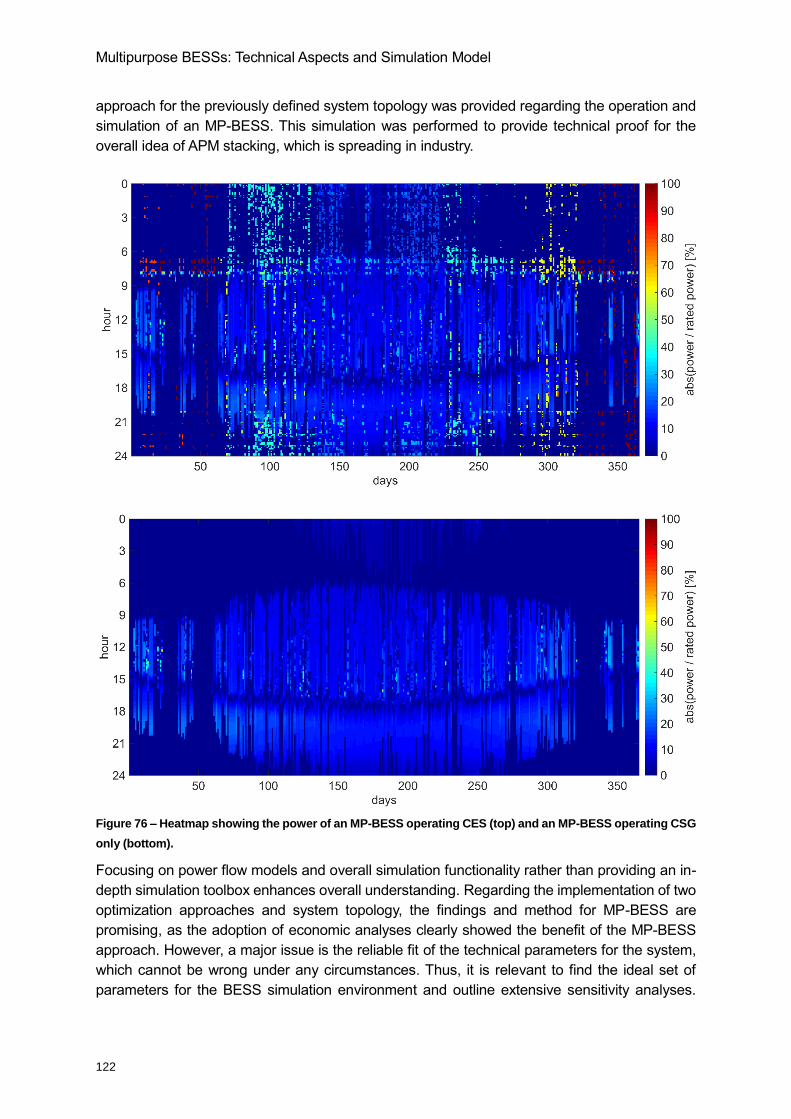
Multipurpose BESSs: Technical Aspects and Simulation Model
122
approach for the previously defined system topology was provided regarding the operation and
simulation of an MP-BESS. This simulation was performed to provide technical proof for the
overall idea of APM stacking, which is spreading in industry.
Figure 76 – Heatmap showing the power of an MP-BESS operating CES (top) and an MP-BESS operating CSG
only (bottom).
Focusing on power flow models and overall simulation functionality rather than providing an in-
depth simulation toolbox enhances overall understanding. Regarding the implementation of two
optimization approaches and system topology, the findings and method for MP-BESS are
promising, as the adoption of economic analyses clearly showed the benefit of the MP-BESS
approach. However, a major issue is the reliable fit of the technical parameters for the system,
which cannot be wrong under any circumstances. Thus, it is relevant to find the ideal set of
parameters for the BESS simulation environment and outline extensive sensitivity analyses.

Multipurpose BESSs: Technical Aspects and Simulation Model
123
Furthermore, regarding the effect of total system cost, low values are regarded as too optimistic
for economic valuation. (The overall system ROI is largely dependent on CAPEX cost.) Finally,
if the special characteristics of MP-BESS are considered with regard to an adequate parameter
and input profiles, MP-BESSs might be economically beneficial over existing BESS
architectures and approaches for the current operation of BESSs because of the increase in
economic value.
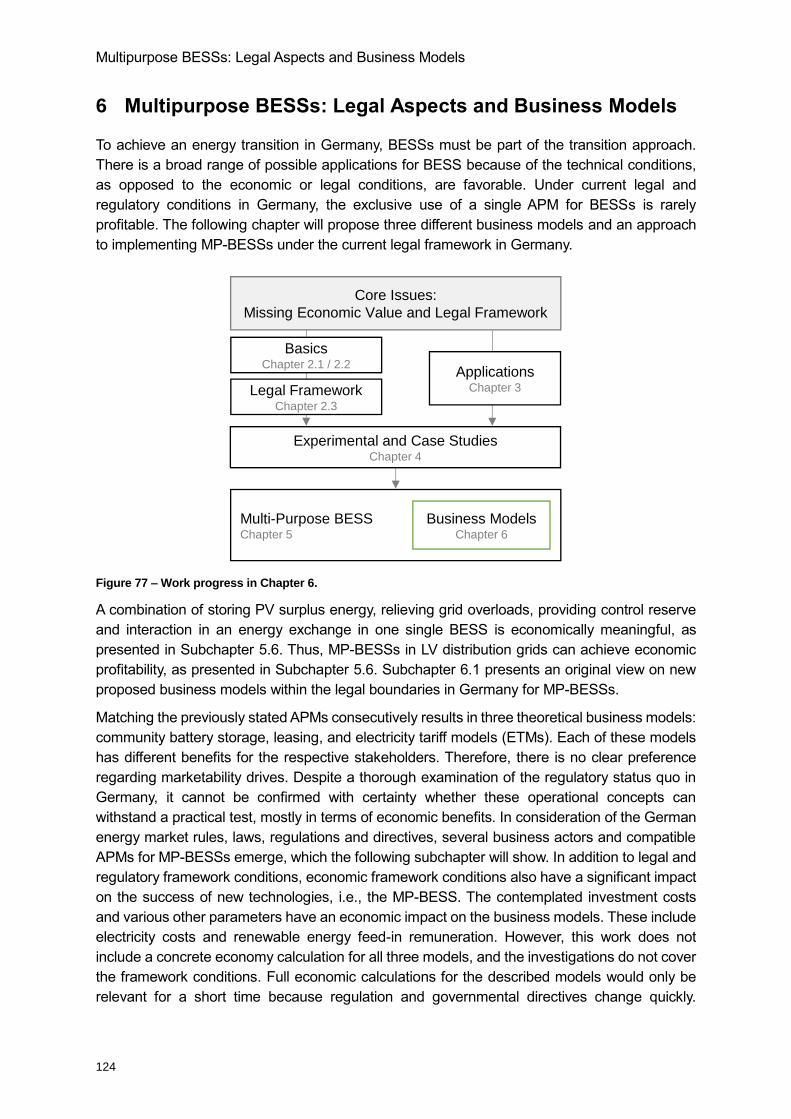
Multipurpose BESSs: Legal Aspects and Business Models
124
6 Multipurpose BESSs: Legal Aspects and Business Models
To achieve an energy transition in Germany, BESSs must be part of the transition approach.
There is a broad range of possible applications for BESS because of the technical conditions,
as opposed to the economic or legal conditions, are favorable. Under current legal and
regulatory conditions in Germany, the exclusive use of a single APM for BESSs is rarely
profitable. The following chapter will propose three different business models and an approach
to implementing MP-BESSs under the current legal framework in Germany.
Figure 77 – Work progress in Chapter 6.
A combination of storing PV surplus energy, relieving grid overloads, providing control reserve
and interaction in an energy exchange in one single BESS is economically meaningful, as
presented in Subchapter 5.6. Thus, MP-BESSs in LV distribution grids can achieve economic
profitability, as presented in Subchapter 5.6. Subchapter 6.1 presents an original view on new
proposed business models within the legal boundaries in Germany for MP-BESSs.
Matching the previously stated APMs consecutively results in three theoretical business models:
community battery storage, leasing, and electricity tariff models (ETMs). Each of these models
has different benefits for the respective stakeholders. Therefore, there is no clear preference
regarding marketability drives. Despite a thorough examination of the regulatory status quo in
Germany, it cannot be confirmed with certainty whether these operational concepts can
withstand a practical test, mostly in terms of economic benefits. In consideration of the German
energy market rules, laws, regulations and directives, several business actors and compatible
APMs for MP-BESSs emerge, which the following subchapter will show. In addition to legal and
regulatory framework conditions, economic framework conditions also have a significant impact
on the success of new technologies, i.e., the MP-BESS. The contemplated investment costs
and various other parameters have an economic impact on the business models. These include
electricity costs and renewable energy feed-in remuneration. However, this work does not
include a concrete economy calculation for all three models, and the investigations do not cover
the framework conditions. Full economic calculations for the described models would only be
relevant for a short time because regulation and governmental directives change quickly.
Core Issues:
Missing Economic Value and Legal Framework
Legal FrameworkChapter 2.3
Experimental and Case StudiesChapter 4
Multi-Purpose BESSChapter 5
Business ModelsChapter 6
ApplicationsChapter 3
BasicsChapter 2.1 / 2.2
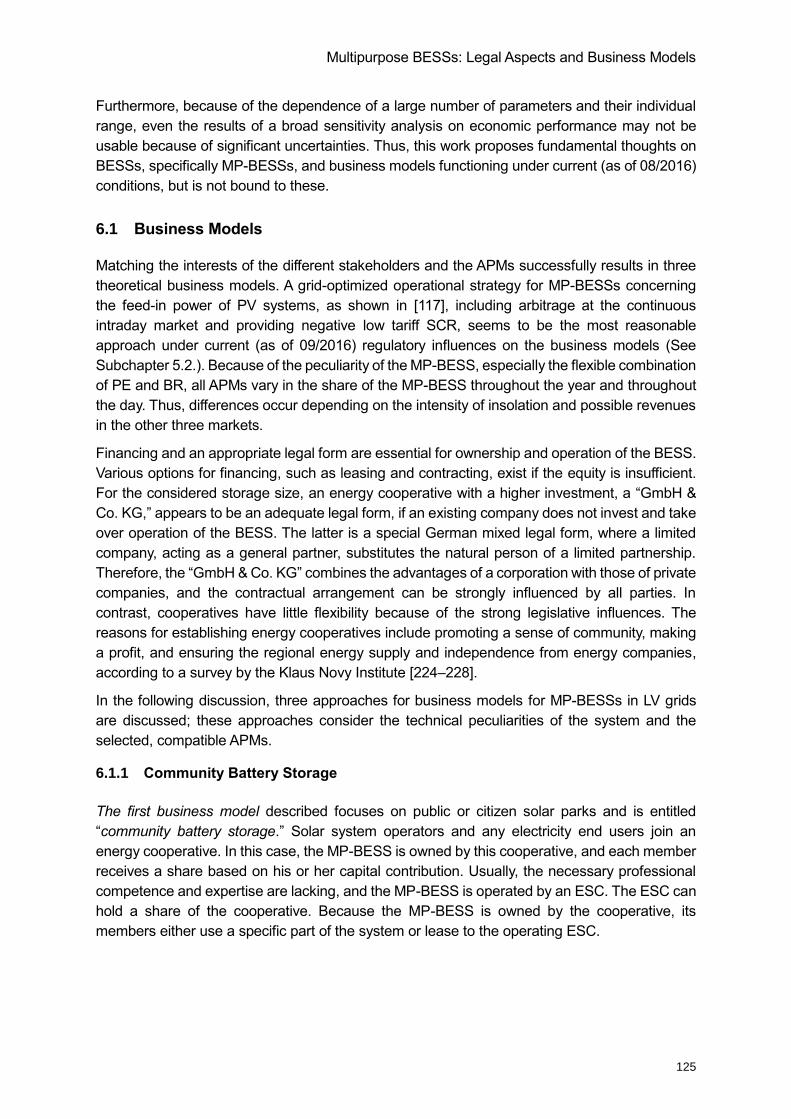
Multipurpose BESSs: Legal Aspects and Business Models
125
Furthermore, because of the dependence of a large number of parameters and their individual
range, even the results of a broad sensitivity analysis on economic performance may not be
usable because of significant uncertainties. Thus, this work proposes fundamental thoughts on
BESSs, specifically MP-BESSs, and business models functioning under current (as of 08/2016)
conditions, but is not bound to these.
6.1 Business Models
Matching the interests of the different stakeholders and the APMs successfully results in three
theoretical business models. A grid-optimized operational strategy for MP-BESSs concerning
the feed-in power of PV systems, as shown in [117], including arbitrage at the continuous
intraday market and providing negative low tariff SCR, seems to be the most reasonable
approach under current (as of 09/2016) regulatory influences on the business models (See
Subchapter 5.2.). Because of the peculiarity of the MP-BESS, especially the flexible combination
of PE and BR, all APMs vary in the share of the MP-BESS throughout the year and throughout
the day. Thus, differences occur depending on the intensity of insolation and possible revenues
in the other three markets.
Financing and an appropriate legal form are essential for ownership and operation of the BESS.
Various options for financing, such as leasing and contracting, exist if the equity is insufficient.
For the considered storage size, an energy cooperative with a higher investment, a “GmbH &
Co. KG,” appears to be an adequate legal form, if an existing company does not invest and take
over operation of the BESS. The latter is a special German mixed legal form, where a limited
company, acting as a general partner, substitutes the natural person of a limited partnership.
Therefore, the “GmbH & Co. KG” combines the advantages of a corporation with those of private
companies, and the contractual arrangement can be strongly influenced by all parties. In
contrast, cooperatives have little flexibility because of the strong legislative influences. The
reasons for establishing energy cooperatives include promoting a sense of community, making
a profit, and ensuring the regional energy supply and independence from energy companies,
according to a survey by the Klaus Novy Institute [224–228].
In the following discussion, three approaches for business models for MP-BESSs in LV grids
are discussed; these approaches consider the technical peculiarities of the system and the
selected, compatible APMs.
6.1.1 Community Battery Storage
The first business model described focuses on public or citizen solar parks and is entitled
“community battery storage.” Solar system operators and any electricity end users join an
energy cooperative. In this case, the MP-BESS is owned by this cooperative, and each member
receives a share based on his or her capital contribution. Usually, the necessary professional
competence and expertise are lacking, and the MP-BESS is operated by an ESC. The ESC can
hold a share of the cooperative. Because the MP-BESS is owned by the cooperative, its
members either use a specific part of the system or lease to the operating ESC.
Multipurpose BESSs: Legal Aspects and Business Models
126
Figure 78 shows the flows of cash (dashed line), goods (dotted line) and services (solid line) in
this model. An ESC generates revenues for the cooperative (2, 4, and 6) via interactions in the
energy exchange (Arbitrage) (1), relieving grid overloads (3) and providing negative low tariff
SCP (5). The cooperative remunerates (8) these three services, including the operation (7). The
revenues from the three services are passed on to the cooperative, which leads to an ROI for
its members. The possibility of profit sharing exists as an incentive for the cooperative to achieve
an increased overall efficiency. The ESC keeps a part of the earned revenues because it
provides the services. Furthermore, PV system operators (PVOs) use the MP-BESS for
temporary storage of PV surplus energy per their share. While the solar power (9) is primarily
used for the cooperative’s own consumption, the excess is sold. The ESC remunerates (10) the
final surplus and uses it depending on their portfolio. Any member of the cooperative can lease
an individual share or a part of it (especially during low insolation, e.g., in the winter) to the ESC
(11) to gain revenue (12). The latter is the only possibility for end users without a PV system to
achieve additional benefits from the cooperative in addition to the cash flow from the services
provided by the ESC. Therefore, the ROI is much higher when a member of the cooperative is
also a PVO because of the cost savings from an increasing SCP.
6.1.2 Lease Model
The second business model is termed the “lease model,” and leaseholders have the right to use
the leased capacity and power. Thus, the contract addresses not just assets but also their use.
A lease model is a form of financing similar to operate-leasing (e.g., renting an apartment) and
finance-leasing (e.g., leasing a car). Further information is provided in [226, 229] and the
German Civil Code (“Bürgerliches Gesetzbuch”), especially §§ 535 – 546, 581- 597 and 835 et
seq.
The flows of cash, goods, and services in the lease model are depicted in Figure 79, in which
the type of line corresponds to the previous model. With this business model, one ESC combines
the property and operation of the MP-BESS, and their services obey the model above (1, 3, and
5), except that the cash flows are not redirected to a cooperative and stay in the ESC (2, 4, and
6).
Figure 78 – Community battery storage: Flows of cash, goods and services.
ESC DSO
EPEX
TSO
MP BESS
Energy-cooperative
End Users
PVO
1 Arbitrage
2 Revenue
3 Grid Relief
4 Revenue
5 Reserve Control
6 Revenue
7 Services
8 Revenue
Owner Operator
11 Lease
12 Revenue
9 Solar Energy
10 Revenue
9 Solar Energy
10 Revenue
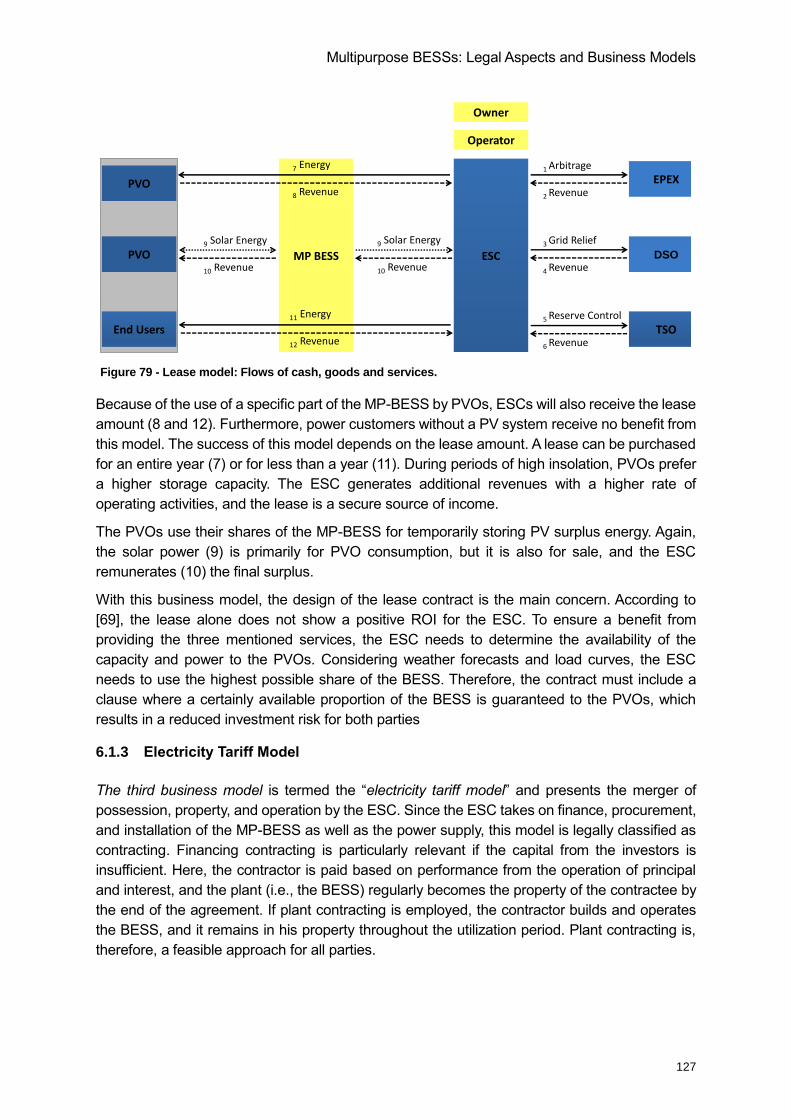
Multipurpose BESSs: Legal Aspects and Business Models
127
Because of the use of a specific part of the MP-BESS by PVOs, ESCs will also receive the lease
amount (8 and 12). Furthermore, power customers without a PV system receive no benefit from
this model. The success of this model depends on the lease amount. A lease can be purchased
for an entire year (7) or for less than a year (11). During periods of high insolation, PVOs prefer
a higher storage capacity. The ESC generates additional revenues with a higher rate of
operating activities, and the lease is a secure source of income.
The PVOs use their shares of the MP-BESS for temporarily storing PV surplus energy. Again,
the solar power (9) is primarily for PVO consumption, but it is also for sale, and the ESC
remunerates (10) the final surplus.
With this business model, the design of the lease contract is the main concern. According to
[69], the lease alone does not show a positive ROI for the ESC. To ensure a benefit from
providing the three mentioned services, the ESC needs to determine the availability of the
capacity and power to the PVOs. Considering weather forecasts and load curves, the ESC
needs to use the highest possible share of the BESS. Therefore, the contract must include a
clause where a certainly available proportion of the BESS is guaranteed to the PVOs, which
results in a reduced investment risk for both parties
6.1.3 Electricity Tariff Model
The third business model is termed the “electricity tariff model” and presents the merger of
possession, property, and operation by the ESC. Since the ESC takes on finance, procurement,
and installation of the MP-BESS as well as the power supply, this model is legally classified as
contracting. Financing contracting is particularly relevant if the capital from the investors is
insufficient. Here, the contractor is paid based on performance from the operation of principal
and interest, and the plant (i.e., the BESS) regularly becomes the property of the contractee by
the end of the agreement. If plant contracting is employed, the contractor builds and operates
the BESS, and it remains in his property throughout the utilization period. Plant contracting is,
therefore, a feasible approach for all parties.
Figure 79 - Lease model: Flows of cash, goods and services.
ESC DSO
EPEX
TSO
MP BESSPVO
1 Arbitrage
2 Revenue
3 Grid Relief
4 Revenue
5 Reserve Control
6 Revenue
7 Energy
8 Revenue
Owner
Operator
11 Energy
12 Revenue
9 Solar Energy
10 Revenue
9 Solar Energy
10 Revenue
End Users
PVO
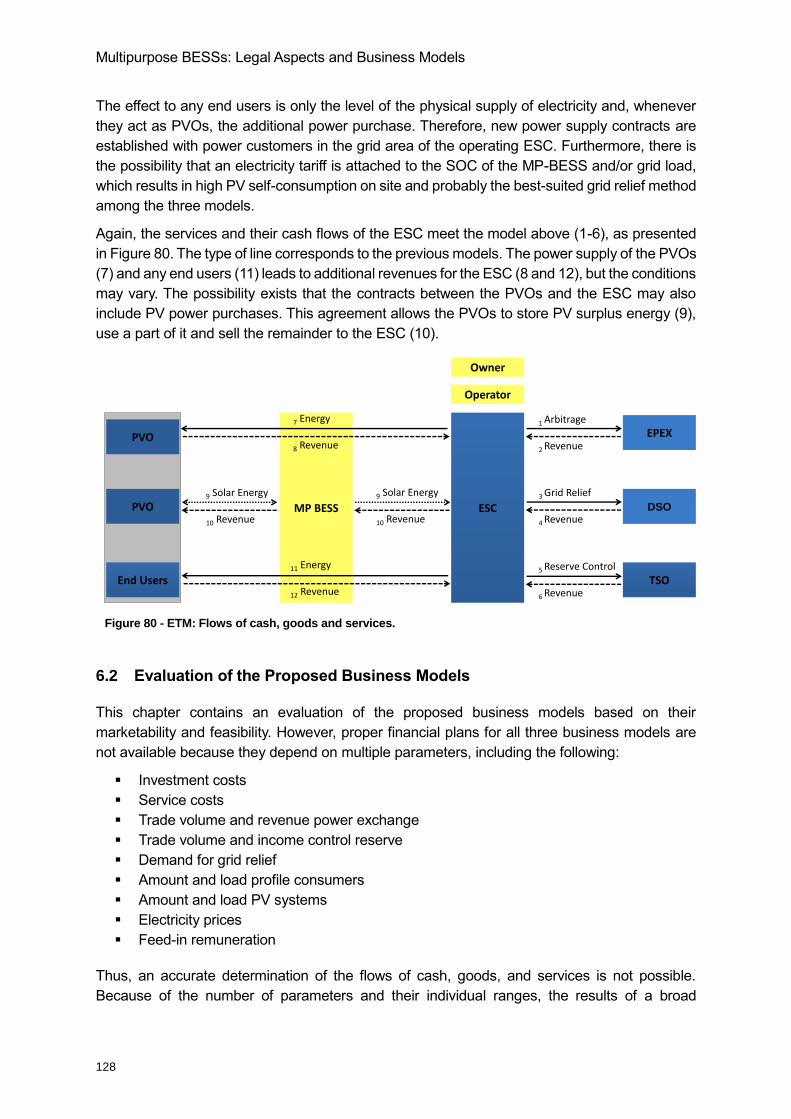
Multipurpose BESSs: Legal Aspects and Business Models
128
The effect to any end users is only the level of the physical supply of electricity and, whenever
they act as PVOs, the additional power purchase. Therefore, new power supply contracts are
established with power customers in the grid area of the operating ESC. Furthermore, there is
the possibility that an electricity tariff is attached to the SOC of the MP-BESS and/or grid load,
which results in high PV self-consumption on site and probably the best-suited grid relief method
among the three models.
Again, the services and their cash flows of the ESC meet the model above (1-6), as presented
in Figure 80. The type of line corresponds to the previous models. The power supply of the PVOs
(7) and any end users (11) leads to additional revenues for the ESC (8 and 12), but the conditions
may vary. The possibility exists that the contracts between the PVOs and the ESC may also
include PV power purchases. This agreement allows the PVOs to store PV surplus energy (9),
use a part of it and sell the remainder to the ESC (10).
6.2 Evaluation of the Proposed Business Models
This chapter contains an evaluation of the proposed business models based on their
marketability and feasibility. However, proper financial plans for all three business models are
not available because they depend on multiple parameters, including the following:
Investment costs
Service costs
Trade volume and revenue power exchange
Trade volume and income control reserve
Demand for grid relief
Amount and load profile consumers
Amount and load PV systems
Electricity prices
Feed-in remuneration
Thus, an accurate determination of the flows of cash, goods, and services is not possible.
Because of the number of parameters and their individual ranges, the results of a broad
Figure 80 - ETM: Flows of cash, goods and services.
ESC DSO
EPEX
TSO
MP BESSPVO
1 Arbitrage
2 Revenue
3 Grid Relief
4 Revenue
5 Reserve Control
6 Revenue
7 Energy
8 Revenue
Owner
Operator
11 Energy
12 Revenue
9 Solar Energy
10 Revenue
9 Solar Energy
10 Revenue
End Users
PVO
Multipurpose BESSs: Legal Aspects and Business Models
129
sensitivity analysis may be unsatisfying. Nevertheless, the differences in the total revenues
between the models are only marginal. The choice of one model depends on whether the priority
is a benefit to the ESC or the customer, regarding business management or terms of the national
economy. With the community battery storage business model, the cooperative takes the
investment, and the ESC provides the services and acts as the operator. This model seems to
be the most economical for residents who hold shares of the MP-BESS. Despite the
dependence of the mentioned parameters and the investment risk, the highest ROI is possible
for participating residents in the immediate grid area. The will to invest and the affordability are
important. However, investment in renewables is popular with population masses in general as
several studies have shown [230, 231]. Since the commencement of the Renewable Energy
Sources Act in 2000, the total investment amount in renewable energy plants in Germany has
been more than 200 billion euros [230], and the amount was the same worldwide for the year
2015 [231]. The motivations to finance and invest in renewable sources are similar to the
reasons for investing in BESS [232]. The crucial motivations behind investment in BESS are to
hedge against rising electricity prices and to contribute to the energy transition [233]. Residents
want to invest as long as they can afford a share of the cooperative, i.e., the MP-BESS.
Furthermore, this model is well suited for ESCs because of the modest risk with a chance for
high revenue. The profit sharing concerning the services provides a strong incentive for the ESC.
The lease model excludes power costumers without a PV system, but it seems to be beneficial
for PVOs and ESCs. In this case, the ESC bears the investment risk. Even if there is insufficient
interest in leasing, the cash flow from the operating activities (arbitrage, grid relief, and control
reserve) alone should lead to a positive ROI. Nevertheless, the success of leasing will depend
on the commissioning time of the solar power plants and individual electricity costs in a broad
sense. Therefore, the contribution margin from the differences in electricity costs and feed-in
remuneration is important. The net present value of leasing an MP-BESS must be, at least,
equivalent to one of the home storage systems to be of interest to PVOs.
The ETM could provide the best contribution to the energy transition in Germany because of the
power customers, ESCs, and DSOs benefit, which makes this model the most grid-friendly type
of BESS operation. Irrespective of unbundling provisions, this model could lead to a win-win
situation for ESCs and DSOs in vertically integrated companies covering both fields. Additionally,
this model is the most customer-friendly regarding effort and knowledge. Nevertheless, the
success of this business model depends on power customer acceptance and will to change the
ESC. With approximately 40 million households [234] and an ESC changing rate of
approximately 9% in this consumer group [235], there is significant theoretical potential in
Germany to acquire customers for an electricity tariff attached to the BESS. Furthermore, the
topic of renewable energies is beneficial for electricity purchases because of the increasing
demand and willingness to pay for ecologically certified power [232]. Since the stated MP-
BESSs show network coupling without any direct connection to the respective PV system, as
opposed to home storage systems, the final consumer must pay the full apportionment for
renewables (“EEG-Umlage”) and several other taxes and duties [73]. The allocations and costs
considering the network charges are notable. Therefore, the ROI of self-consumption decreases
with the contemplated BESS. Nevertheless, the possibility of individual network charges exists
under § 19 German Electricity Network Fee Regulation Ordinance (StromNEV). With a demand
of 10 GWh over a period of at least 7,000 hours per year [236], the fee is significantly lower and
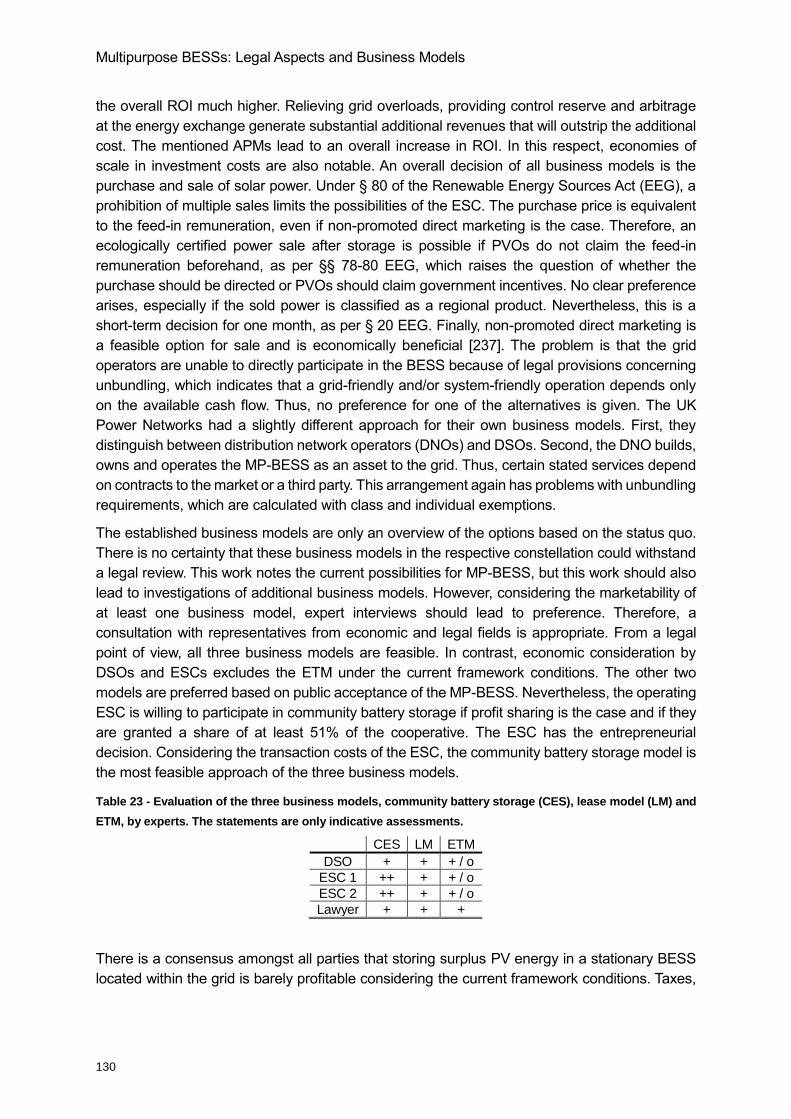
Multipurpose BESSs: Legal Aspects and Business Models
130
the overall ROI much higher. Relieving grid overloads, providing control reserve and arbitrage
at the energy exchange generate substantial additional revenues that will outstrip the additional
cost. The mentioned APMs lead to an overall increase in ROI. In this respect, economies of
scale in investment costs are also notable. An overall decision of all business models is the
purchase and sale of solar power. Under § 80 of the Renewable Energy Sources Act (EEG), a
prohibition of multiple sales limits the possibilities of the ESC. The purchase price is equivalent
to the feed-in remuneration, even if non-promoted direct marketing is the case. Therefore, an
ecologically certified power sale after storage is possible if PVOs do not claim the feed-in
remuneration beforehand, as per §§ 78-80 EEG, which raises the question of whether the
purchase should be directed or PVOs should claim government incentives. No clear preference
arises, especially if the sold power is classified as a regional product. Nevertheless, this is a
short-term decision for one month, as per § 20 EEG. Finally, non-promoted direct marketing is
a feasible option for sale and is economically beneficial [237]. The problem is that the grid
operators are unable to directly participate in the BESS because of legal provisions concerning
unbundling, which indicates that a grid-friendly and/or system-friendly operation depends only
on the available cash flow. Thus, no preference for one of the alternatives is given. The UK
Power Networks had a slightly different approach for their own business models. First, they
distinguish between distribution network operators (DNOs) and DSOs. Second, the DNO builds,
owns and operates the MP-BESS as an asset to the grid. Thus, certain stated services depend
on contracts to the market or a third party. This arrangement again has problems with unbundling
requirements, which are calculated with class and individual exemptions.
The established business models are only an overview of the options based on the status quo.
There is no certainty that these business models in the respective constellation could withstand
a legal review. This work notes the current possibilities for MP-BESS, but this work should also
lead to investigations of additional business models. However, considering the marketability of
at least one business model, expert interviews should lead to preference. Therefore, a
consultation with representatives from economic and legal fields is appropriate. From a legal
point of view, all three business models are feasible. In contrast, economic consideration by
DSOs and ESCs excludes the ETM under the current framework conditions. The other two
models are preferred based on public acceptance of the MP-BESS. Nevertheless, the operating
ESC is willing to participate in community battery storage if profit sharing is the case and if they
are granted a share of at least 51% of the cooperative. The ESC has the entrepreneurial
decision. Considering the transaction costs of the ESC, the community battery storage model is
the most feasible approach of the three business models.
Table 23 - Evaluation of the three business models, community battery storage (CES), lease model (LM) and
ETM, by experts. The statements are only indicative assessments.
CES LM ETM
DSO + + + / o
ESC 1 ++ + + / o
ESC 2 ++ + + / o
Lawyer + + +
There is a consensus amongst all parties that storing surplus PV energy in a stationary BESS
located within the grid is barely profitable considering the current framework conditions. Taxes,
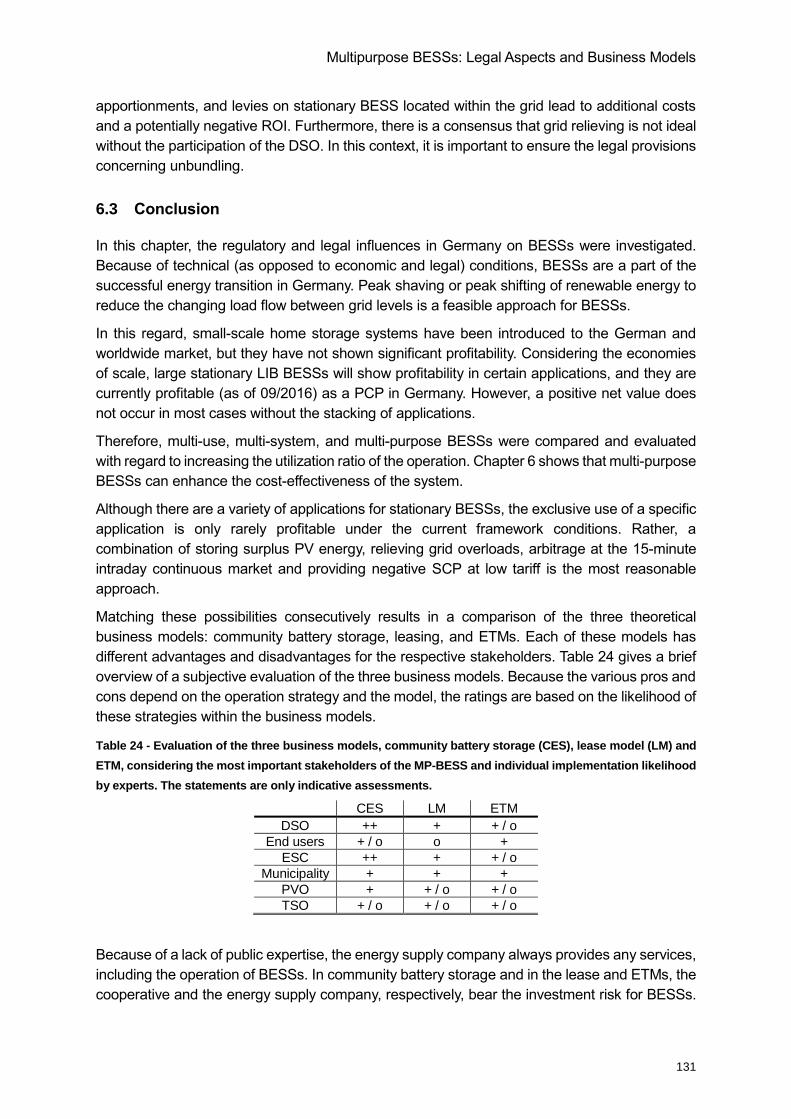
Multipurpose BESSs: Legal Aspects and Business Models
131
apportionments, and levies on stationary BESS located within the grid lead to additional costs
and a potentially negative ROI. Furthermore, there is a consensus that grid relieving is not ideal
without the participation of the DSO. In this context, it is important to ensure the legal provisions
concerning unbundling.
6.3 Conclusion
In this chapter, the regulatory and legal influences in Germany on BESSs were investigated.
Because of technical (as opposed to economic and legal) conditions, BESSs are a part of the
successful energy transition in Germany. Peak shaving or peak shifting of renewable energy to
reduce the changing load flow between grid levels is a feasible approach for BESSs.
In this regard, small-scale home storage systems have been introduced to the German and
worldwide market, but they have not shown significant profitability. Considering the economies
of scale, large stationary LIB BESSs will show profitability in certain applications, and they are
currently profitable (as of 09/2016) as a PCP in Germany. However, a positive net value does
not occur in most cases without the stacking of applications.
Therefore, multi-use, multi-system, and multi-purpose BESSs were compared and evaluated
with regard to increasing the utilization ratio of the operation. Chapter 6 shows that multi-purpose
BESSs can enhance the cost-effectiveness of the system.
Although there are a variety of applications for stationary BESSs, the exclusive use of a specific
application is only rarely profitable under the current framework conditions. Rather, a
combination of storing surplus PV energy, relieving grid overloads, arbitrage at the 15-minute
intraday continuous market and providing negative SCP at low tariff is the most reasonable
approach.
Matching these possibilities consecutively results in a comparison of the three theoretical
business models: community battery storage, leasing, and ETMs. Each of these models has
different advantages and disadvantages for the respective stakeholders. Table 24 gives a brief
overview of a subjective evaluation of the three business models. Because the various pros and
cons depend on the operation strategy and the model, the ratings are based on the likelihood of
these strategies within the business models.
Table 24 - Evaluation of the three business models, community battery storage (CES), lease model (LM) and
ETM, considering the most important stakeholders of the MP-BESS and individual implementation likelihood
by experts. The statements are only indicative assessments.
CES LM ETM
DSO ++ + + / o
End users + / o o +
ESC ++ + + / o
Municipality + + +
PVO + + / o + / o
TSO + / o + / o + / o
Because of a lack of public expertise, the energy supply company always provides any services,
including the operation of BESSs. In community battery storage and in the lease and ETMs, the
cooperative and the energy supply company, respectively, bear the investment risk for BESSs.
Multipurpose BESSs: Legal Aspects and Business Models
132
Therefore, different operational strategies appear, and TSOs, DSOs, and municipalities have no
direct influence. A grid-friendly and/or system-friendly operation depends on the available cash
flows in the respective markets. For the municipality, the concession and commercial tax amount
are the same irrespective of the model.
The community battery storage offers an opportunity for a high investment return for PV system
operators, any members of the cooperative and the energy supply company as a service
provider. PV system operators and end users generate revenue by leasing parts of the BESS to
the energy supply company and by redirection of the service cash flows. Additionally, cost
savings occur via an increasing SCP of the PV system operators. Finally, the cooperative
remunerates the service provider (energy supply company). The overall efficiency may increase
with profit sharing of these services.
The lease model excludes end users from participating in BESS in any way. The energy supply
company combines property and operation, and PV system operators can lease parts of BESS.
Depending on the feed-in remuneration and individual power price, cost savings occur by
increasing the SCP of the PV system operators. The energy supply company generates a return
on their investment by keeping the service cash flows and the lease income.
The ETM presents the merger of possession, property, and operation of the energy supply
company. Therefore, this model is legally classified as contracting. The energy supply company
generates an ROI by keeping the service cash flows and the sale of electricity. Any customers
of the energy supply company located in the grid area of the BESS have the option to choose a
special electricity tariff attached to the MP-BESS. Reduced electricity costs will occur regardless
of the operation of a solar power plant. If the tariff is connected to the SOC of the MP-BESS
and/or grid load, an additional benefit for the grid and the system results.
Despite a thorough examination of the regulatory status quo and a comparison of the three
models, no clear preference was derived regarding marketability. Nevertheless, the stated and
further business models are expected to be economically feasible shortly because BESS
investment prices and feed-in remuneration are decreasing as electricity prices increase.
Therefore, this work notes some of the current possibilities for MP-BESSs, including the stated
APM in LV grids, but further business models should be investigated. In addition, it should be
emphasized that research and openly communicated business model evaluations are lacking in
the field of MP-BESSs. Multiple use, multipurpose operation, or stacking of applications is
performed to develop a temporarily working business case, gain customers and neglect the
necessity for regulatory and jurisdictional assessments of the matter. Politicians, regulators and
market participants are urged to review BESSs as an MPT.
133
7 Conclusions and Future Work
To conclude the thesis, “Stationary Lithium-Ion Battery Energy Storage Systems: A Multi-
Purpose Technology,” the main findings are summarized, and the major findings and results are
given. Additionally, in Subchapter 7.2, a brief outlook is provided.
7.1 Concluding Summary
In Chapter 1, the fundamental core issues that were investigated in this thesis were placed in a
broader context, and the core issues are the energy transition worldwide and interpreting LIB
BESSs as an MPT carrier. In the literature, BESSs are typically considered a single purpose
technology with a specific application in a specific environment, but in recent literature, a shift
toward a multi-purpose technology interpretation of BESS is identified.
The basis of BESSs technology was presented in Chapter 2. Aside from the definition of different
SES technologies, which consider the overall characteristics, battery technology, i.e., LIB was
introduced in detail, and all the necessary steps from a single component to the installation of a
complete system were given. As a part of this introduction, the system safety of respective
BESSs was put into perspective, and the legal framework was identified as a crucial point for
successful economic BESS operation and installation. A stakeholder analysis for Germany
showed which participants play a role in planning, building, operating and decommissioning
BESSs.
The hypothesis, defining BESSs as an MPT carrier, which was further discussed in the thesis,
was examined in Chapter 3 by providing a comprehensive review of possible applications for
BESS. The focus was laid on the APMs most discussed in the literature and industry. These
APMs, which are all single tasking, range from small residential storage up to several MWh
storages in island grids or providing ancillary services.
The main part of the thesis, “Stationary Lithium-Ion Battery Energy Storage Systems: A Multi-
Purpose Technology,” (Chapters 4, 5, and 6) was structured around two core issues. To establish
an investigation of the technical and legal functionality of BESS and their suitability for becoming
an MPT carrier to overcome missing economic value, the first part covered in detail excursuses
and case studies and provided a broader and more fundamental understanding of BESSs
operating in different APMs. The technical functionality of BESSs as an MPT carrier, i.e., MP-
BESSs, was discussed and presented. Further, the second core issue discussed business
models for the previous findings to accumulate ideas for a proper legal framework to operate an
MP-BESS. As the respective chapters all ended with a conclusion, the results are given in the
short form.
On the core issue of missing economic value Solution approach: Multi-Purpose Use
LIB BESSs currently lack economic positive figures for nearly any APM (as of 11/2016). This
statement holds true for Germany, most of the EU, and large parts of the world because of
their high CAPEX burden in economic business cases.
Conclusions and Future Work
134
However, a dramatic decrease in cost for LIB BESSs has been observed. This decrease will
influence the aforementioned dramatically in the near future, and LIB BESSs will play a
major role in modern grid evolution and the second electrification wave worldwide.
The OPEX of LIB BESSs include materials, services and other costs to guarantee full
operation and are burdened with the high capacity fade of LIB technology, which adds to the
vast OPEX cost that must be included in business cases. The cost makes LIB BESSs even
less attractive.
LIB BESSs operating under a single APM, which accounts for the vast majority of LIB BESSs
installed in the grid worldwide, yield low capacity factors, or utilization ratios, because of low
daily usage and intensity of use.
Therefore, LIB BESSs, operating as an MPT carrier, as proposed by this thesis, i.e., MP-
BESSs, show increasing capacity factors and increasing revenue possibilities. The simple
addition of secondary, minute or quaternary APMs on BESSs add significant economic
value, and the CAPEX remain similar.
LIB BESS aging by adding APMs seems to decrease for the investigated LIB chemistry.
These results must be proven in the future using additional LIB chemistry simulations;
however, the conclusion holds true for NMC and LFP LIB.
On the core issue of a proper legal framework Solution Approach: Opening of regulations
LIB BESSs operate under severe legal restrictions, which limits their theoretical economic
value dramatically. This statement holds true for Germany, several European states, and
most states worldwide.
LIB BESSs defined as an MPT carrier offer an intensive tool for a multitude of stakeholders
in any electricity business area, end consumers, grid operators, supply companies, power
customers, transmission grid operators, municipalities and additional groups.
LIB BESSs under the legal framework of a community battery storage are the most
promising candidates for future implementation and large roll-out of LIB systems when legal
framework and regulations are adopted accordingly.
LIB BESSs under the legal framework of a lease model must figure in severe restrictions for
unbundling electricity services in many areas, hindering future implementation.
LIB BESSs under the legal framework of the ETM have been viewed by experts as an
attractive model; however, such operation would induce similar regulatory changes as the
lease model.
To support the profitability of LIB BESSs and make the technology accessible to anyone, BESSs
have to be explained and viewed as MPT technology, not only by knowledge carriers, i.e.,
scientists or industry experts, but also by the broad community of politicians, municipalities,
legislators, regulators, international and national panels and the public.
Recommendations for Action
Finally, with regard to the hypothesis of this work, that LIB BESSs have yet to be defined as
MPT carriers, the “investigation of the technical and legal functionality” toward the “missing
economic value,” LIB BESSs are regarded as suitable for a series of future tasks in the energy
transition worldwide; they are able to operate in nearly any task regarding the storage of electric
energy without constraints. In contrast, legal and regulatory framework issues (which are
present because of the number of stakeholders) constrain the economic realization of LIB BESS.
Conclusions and Future Work
135
Here, the key is to communicate LIB BESS capabilities, educate technology novices about LIB
behavior and the underlying technology, invest in research on new LIB chemistry technologies
and build new legal entities and definitions to create certainty for rising markets and a shift in the
worldwide use of energy. Further, with high priority, the legal and regulatory definitions of
electricity storage in grids, especially LIB BESS, have to overcome their current hurdles and
accelerate much faster as it is seen today. Most technical problems and issues have been
overcome, LIB prices are decreasing, and consumers are more aware of the ecological and
economic feasibility of LIB BESS. A suitable solution with high benefits to the general public, due
to its multi-purpose functionality, set LIB BESS up to be a key in the solution of energy problems
worldwide.
7.2 The Future of Electricity Markets
On the trends in the electricity market in Germany
The reduction of BESS investment prices and feed-in remuneration, as well as the increase in
electricity prices, are conducive to the economical use of BESSs. Recent changes in the legal
and regulatory framework conditions in Germany will facilitate market access for several APMs
[238, 239]. The expansion of RETs results in temporarily fluctuating electricity production and a
changing load flow between the grid levels. Thus, storing PV surplus energy and relieving grid
overloads will play an increasingly important role in Germany in the near future to alleviate the
imbalance between the north and south and between metropolitan and rural areas. In the
context of changing legal and regulatory framework conditions, the Federal Ministry of
Economics and Technology introduced the “electricity market 2.0” with a White Paper and the
electricity market law [239]. Legal and regulatory uncertainties will be gradually reduced. The
subject of storage systems will find its way into various laws. However, a statutory definition has
failed to materialize. Certain changes favor the flexibility and ancillary services of BESSs. The
shortening of tender submission periods and standby duration at the control reserve market are
notable. According to [238], the Federal Ministry of Economics and Technology has considered
trimming down the product time-slice of SCP to one hour or even 15 minutes instead of the HT
and low tariff periods used currently (as of 11/2016). Furthermore, the tender period of SCP
could change from weekly to daily. Both would be major steps toward profitable uses for BESSs
and a solution to the divergent interests of APMs. On the other side, changing regulations
regarding the battery SOC providing PCP could result in a preference for PCP over SCP.
According to [137], the required SOC range for a BESS changed if it is based on the 15-minute
criterion instead of the 30-minute criterion, particularly at a low ratio between the capacity and
prequalified PCP power. With a proportion of 1.0 and the former criterion, the SOC must be
50%. When providing the energy reserve for 15 minutes, the range is approximately 25 to 75%.
From 2021 on, there will be a fundamental change in the business models as the remuneration
for existing renewable energy installations ends, and dramatic amounts of PV system power
enter the German electricity markets. Therefore, particularly for existing PV systems, an
alternative marketing for electricity production must be established. In this context, storage
operators have the option to acquire PV surplus energy at a favorable price. Because of this fact
and the further expansion of renewables, wholesale electricity market prices are decreasing.
The principal characteristics of this market include the merit order effect and higher volatility in
prices. In summary, all of these facts suggest economic operation of the MP-BESS with the
Conclusions and Future Work
136
specified APMs. Storing PV surplus energy, relieving grid overloads, providing control reserve
and arbitrage at the 15 and 30-minute intraday continuous market are more attractive for BESSs,
and the decreasing trend in investment costs should also be considered. In general, there is a
need for a clear definition of storage and the reduction of complex levy and taxation structures
in current legislation toward simpler and more adaptable ones.
On the trends in the electricity markets worldwide
Because of the similarity of the basic electricity market architecture around the world, the
business models presented in this thesis could be of interest in countries other than Germany
[240, 241]. Although the wholesale electricity market in Europe is similar to the one in the U.S.,
differences exist, such as ancillary services. Whereas the definition by the Union for the
Coordination of the Transmission of Electricity (UCTE) includes three types of control reserves
(namely, the primary, secondary and minute control reserve), the United States Federal Energy
Regulatory Commission (FERC) considers a further subdivision (i.e., regulation, spinning, non-
spinning, replacement and supplemental reserve). Therefore, different APMs appear to be
useful. These specifications in the U.S. market are conducive to the economical operation of
BESSs. In Europe in the UCTE, all stated business models can be implemented one by one
because of the similarity of the markets. Particularly in countries with a high share of renewables
and fluctuating electricity production or changing load flow between the grid levels, MP-BESSs
are a feasible approach. However, the U.S., specifically the states of CA, MA, NYC, and TX,
recently passed major renewable energy bills to realize the potential for electricity storage. The
State of Charge Study by the Massachusetts Energy Initiative [169] outlined the incredible
hurdles electric energy storage must currently overcome and noted that all other commodities
of modern society, i.e., food, water, gasoline, oil and natural gas, are commonly stored goods.
The study concludes that 1,766 MW of advanced electricity storage (resources that can dispatch
energy in seconds, provide energy from 15 minutes to over 10 hours and range from small home
systems to utility-scale systems in the bulk power grid) in the years 2017 to 2020 would yield an
increase in the state’s gross state product of 2.2 billion USD and an additional 250 million USD
in grid savings. It can be expected that countries worldwide will reach a common level of
understanding for the use of electricity storage and increase activities to form new markets and
secure economic wealth and a greener future.
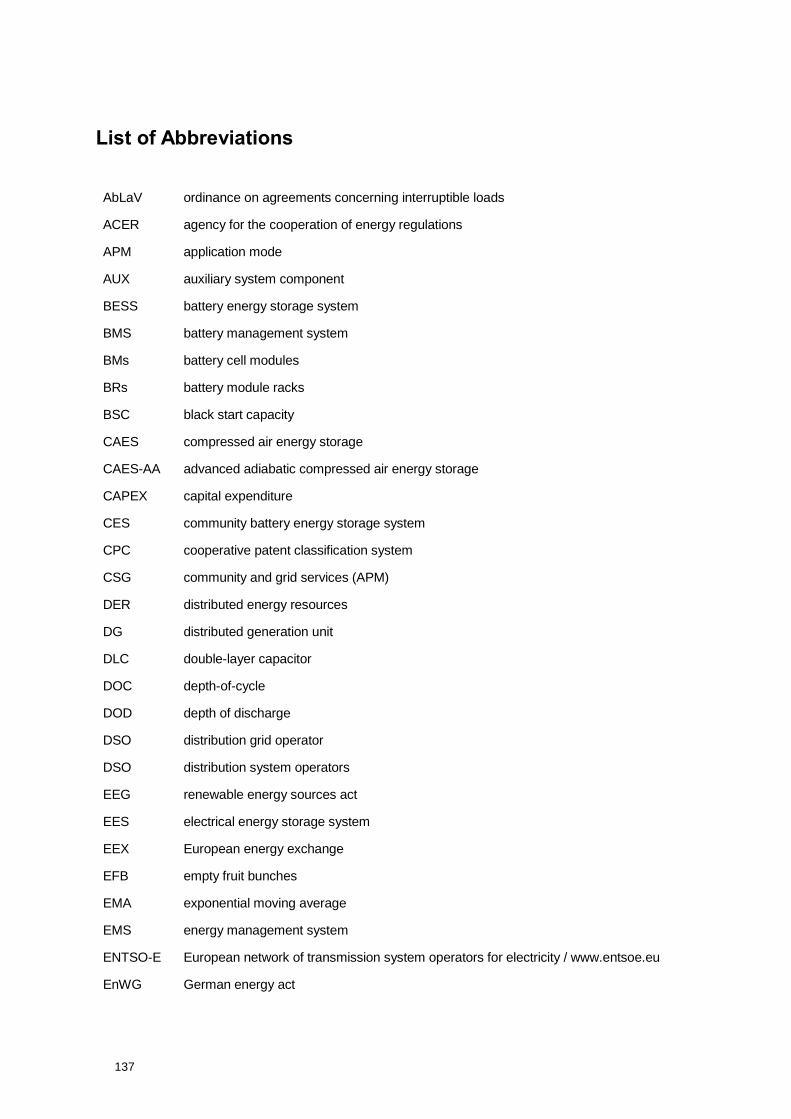
137
List of Abbreviations
AbLaV ordinance on agreements concerning interruptible loads
ACER agency for the cooperation of energy regulations
APM application mode
AUX auxiliary system component
BESS battery energy storage system
BMS battery management system
BMs battery cell modules
BRs battery module racks
BSC black start capacity
CAES compressed air energy storage
CAES-AA advanced adiabatic compressed air energy storage
CAPEX capital expenditure
CES community battery energy storage system
CPC cooperative patent classification system
CSG community and grid services (APM)
DER distributed energy resources
DG distributed generation unit
DLC double-layer capacitor
DOC depth-of-cycle
DOD depth of discharge
DSO distribution grid operator
DSO distribution system operators
EEG renewable energy sources act
EES electrical energy storage system
EEX European energy exchange
EFB empty fruit bunches
EMA exponential moving average
EMS energy management system
ENTSO-E European network of transmission system operators for electricity / www.entsoe.eu
EnWG German energy act
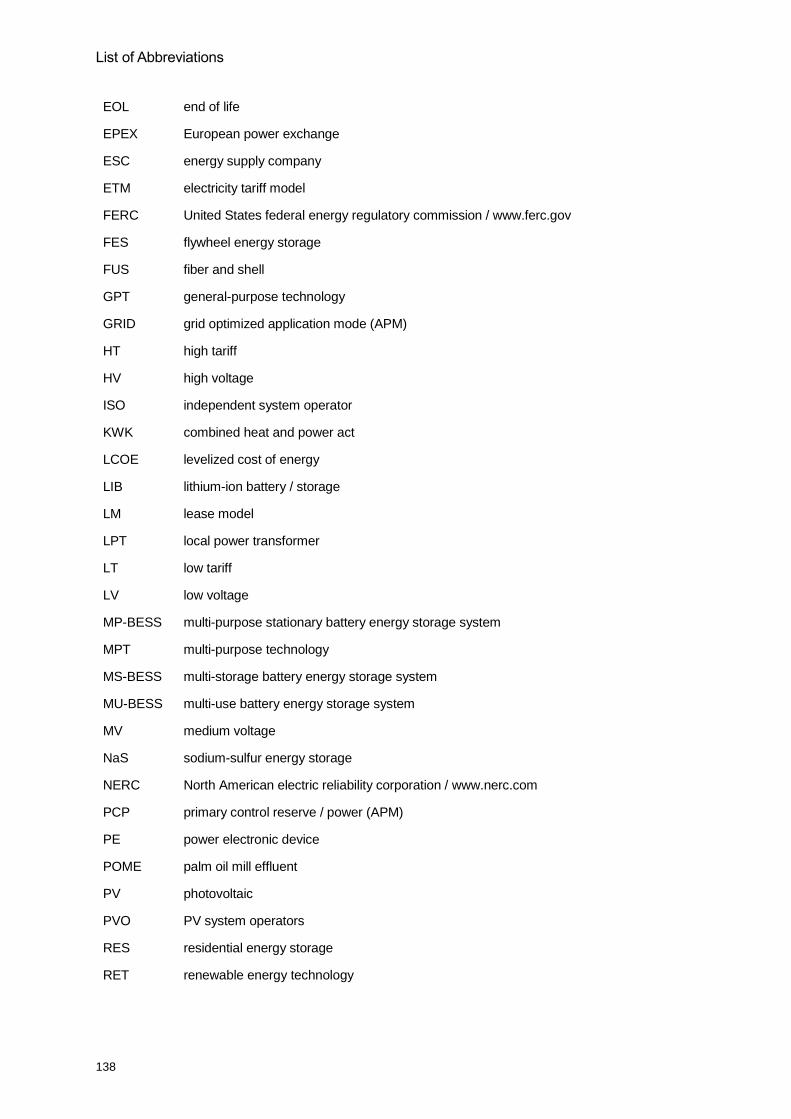
List of Abbreviations
138
EOL end of life
EPEX European power exchange
ESC energy supply company
ETM electricity tariff model
FERC United States federal energy regulatory commission / www.ferc.gov
FES flywheel energy storage
FUS fiber and shell
GPT general-purpose technology
GRID grid optimized application mode (APM)
HT high tariff
HV high voltage
ISO independent system operator
KWK combined heat and power act
LCOE levelized cost of energy
LIB lithium-ion battery / storage
LM lease model
LPT local power transformer
LT low tariff
LV low voltage
MP-BESS multi-purpose stationary battery energy storage system
MPT multi-purpose technology
MS-BESS multi-storage battery energy storage system
MU-BESS multi-use battery energy storage system
MV medium voltage
NaS sodium-sulfur energy storage
NERC North American electric reliability corporation / www.nerc.com
PCP primary control reserve / power (APM)
PE power electronic device
POME palm oil mill effluent
PV photovoltaic
PVO PV system operators
RES residential energy storage
RET renewable energy technology
List of Abbreviations
139
ROI return on investment
RTO regional transmission organization
SCP secondary control reserve / power (APM)
SCR self-consumption rate
SEI solid electrolyte interface
SELF storing surplus PV energy (APM)
SMA simple moving average
SMES superconducting magnetic energy storage
SOA safe operation area
SOC state of charge
SOF state of function
SOR state of reliability
SOS state of safety
SPT single-purpose technology
SSR self-sufficiency rate
StromNEV electricity grid charges ordinance
StromNZV electricity grid access ordinance
StromStG electricity tax act
TCR minute control reserve / power (APM)
TSO transmission system operator
UCPTE Union for the Coordination of Production and Transmission of Electricity
UCTE Union for the Coordination of the Transmission of Electricity
XHV extra-high voltage
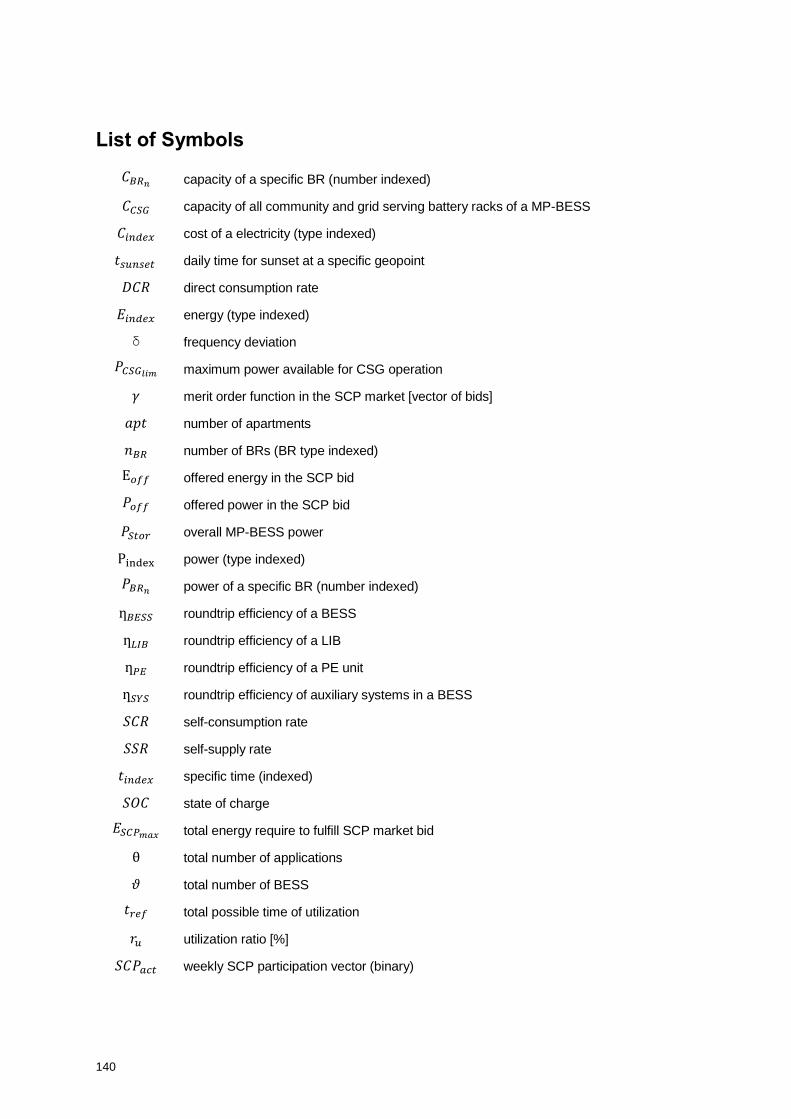
140
List of Symbols
𝐶𝐵𝑅𝑛 capacity of a specific BR (number indexed)
𝐶𝐶𝑆𝐺 capacity of all community and grid serving battery racks of a MP-BESS
𝐶𝑖𝑛𝑑𝑒𝑥 cost of a electricity (type indexed)
𝑡𝑠𝑢𝑛𝑠𝑒𝑡 daily time for sunset at a specific geopoint
𝐷𝐶𝑅 direct consumption rate
𝐸𝑖𝑛𝑑𝑒𝑥 energy (type indexed)
δ frequency deviation
𝑃𝐶𝑆𝐺𝑙𝑖𝑚 maximum power available for CSG operation
𝛾 merit order function in the SCP market [vector of bids]
𝑎𝑝𝑡 number of apartments
𝑛𝐵𝑅 number of BRs (BR type indexed)
E𝑜𝑓𝑓 offered energy in the SCP bid
𝑃𝑜𝑓𝑓 offered power in the SCP bid
𝑃𝑆𝑡𝑜𝑟 overall MP-BESS power
P n x power (type indexed)
𝑃𝐵𝑅𝑛 power of a specific BR (number indexed)
ƞ𝐵𝐸𝑆𝑆 roundtrip efficiency of a BESS
ƞ𝐿𝐼𝐵 roundtrip efficiency of a LIB
ƞ𝑃𝐸 roundtrip efficiency of a PE unit
ƞ𝑆𝑌𝑆 roundtrip efficiency of auxiliary systems in a BESS
𝑆𝐶𝑅 self-consumption rate
𝑆𝑆𝑅 self-supply rate
𝑡𝑖𝑛𝑑𝑒𝑥 specific time (indexed)
𝑆𝑂𝐶 state of charge
𝐸𝑆𝐶𝑃𝑚𝑎𝑥 total energy require to fulfill SCP market bid
θ total number of applications
𝜗 total number of BESS
𝑡𝑟𝑒𝑓 total possible time of utilization
𝑟𝑢 utilization ratio [%]
𝑆𝐶𝑃𝑎𝑐𝑡 weekly SCP participation vector (binary)
141
List of References
[1] Meehl, G.A.; Stocker, T.F.; Collins, W.D.; Friedlingstein, P.; Gaye, A.T.; Gregory, J.M.;
Kitoh, A.; Knutti, R.; Murphy, J.M.; Noda, A.: Global climate projections, In: Climate
change 3495, pp. 747–845, 2007
[2] The World Bank: Climate Change Knowledge Portal,
URL: http://data.worldbank.org/topic/climate-change, log-date: 2016-11-18
[3] Stern, N.H.; Peters, S.; Bakhshi, V.; Bowen, A.; Cameron, C.; Catovsky, S.; Di Crane;
Cruickshank, S.; Dietz, S.; Edmonson, N.: Stern Review: The economics of climate
change, Cambridge University Press Cambridge, 2006
[4] COMM/CLIMA/0002: Paris Agreement - European Commission,
URL: https://ec.europa.eu/clima/policies/international/negotiations/paris/index_en.htm,
log-date: 2016-11-07
[5] BMWI: Erneuerbare Energien in Zahlen – Anteile erneuerbarer Energien am
Endenergieverbrauch in Deutschland,
URL: http://www.umweltbundesamt.de/themen/klima-energie/erneuerbare-
energien/erneuerbare-energien-in-zahlen, log-date: 2015-03-30
[6] Jernbaneverket og Statens vegvesen: The Norwegian National Transport Plan,
URL: http://www.ntp.dep.no/, log-date: 2016-10-27
[7] Pieters, J.: Article in Press – MPS want only zero emissions cars sold on Dutch market
by 2025, URL: http://nltimes.nl/2016/03/30/mps-want-only-zero-emissions-cars-sold-on-
dutch-market-by-2025/, log-date: 2016-10-27
[8] Lambert, F.: Tesla Model 3 Reservations, URL: https://electrek.co/2016/05/18/tesla-
model-3-reservations-cancellations-duplicates/, log-date: 2016-11-04
[9] Eurobserv'er: Photovoltaic Barometer, URL: http://www.eurobserv-er.org/photovoltaic-
barometer-2016/, log-date: 2016-10-27
[10] gtmresearch: U.S. Solar Market Insight. 20, Online, 2016
[11] Andersson, G.; Donalek, P.; Farmer, R.; Hatziargyriou, N.; Kamwa, I.; Kundur, P.;
Martins, N.; Paserba, J.; Pourbeik, P.; Sanchez-Gasca, J.; Schulz, R.; Stankovic, A.;
Taylor, C.; Vittal, V.: Causes of the 2003 Major Grid Blackouts in North America and
Europe, and Recommended Means to Improve System Dynamic Performance, In: IEEE
Transactions on Power Systems 20 (4), pp. 1922–1928, 2005
[12] Pourbeik, P.; Kundur, P.S.; Taylor, C.W.: The anatomy of a power grid blackout, In: IEEE
Power and Energy Magazine 4 (5), pp. 22–29, 2006
[13] Yin, Y.-h.; Guo, J.-b.; Zhao, J.-j.; BU, G.-q.: Preliminary analysis of large scale blackout
in interconnected North America power grid on August 14 and lessons to be drawn [J],
URL: https://www3.epa.gov/region1/npdes/merrimackstation/pdfs/ar/AR-1165.pdf, log-
date: 2016-12-26
List of References
142
[14] Union for the co-ordination of transmission of electricity: System Disturbance on 4
November 2006,
URL: https://www.entsoe.eu/fileadmin/user_upload/_library/publications/ce/otherreports/
Final-Report-20070130.pdf, log-date: 2016-10-27
[15] Müller, M.; Battenberg, A.: EEBatt - Interdisziplinäre Energiespeicherforschung,
URL: http://www.eebatt.tum.de/startseite/, log-date: 2016-03-17
[16] Lipsey, R.G.; Bekar, C.; Carlaw, K.: General purpose technologies and economic growth.
315, MIT Press, Cambridge, Mass, 1998
[17] Griliches, Z.: Hybrid Corn – An Exploration in the Economics of Technological Change,
In: Econometrica 25 (4), p. 501–501, 1957
[18] Williamson, O.E.: Credible commitments: Using hostages to support exchange, In: The
American Economic Review 73 (4), pp. 519–540, 1983
[19] David, P.A.: The dynamo and the computer: an historical perspective on the modern
productivity paradox, In: The American Economic Review 80 (2), pp. 355–361, 1990
[20] Bresnahan, T.; Trajtenberg, M.: General Purpose Technologies "Engines of Growth?", In:
Journal of econometrics 65 (1), pp. 83–108, 1992
[21] Battke, B.; Schmidt, T.S.: Cost-efficient demand-pull policies for multi-purpose
technologies – The case of stationary electricity storage – The Case of Stationary
Electricity Storage, In: Applied Energy 155, pp. 334–348, 2015
[22] Dolata, U.: Technological innovations and sectoral change, In: Research Policy 38 (6),
pp. 1066–1076, 2009
[23] Wicklein, R.C.: Designing for appropriate technology in developing countries, In:
Technology in Society 20 (3), pp. 371–375, 1998
[24] Technische Universität München: Energy Neighbor – Research Project TUM,
URL: www.energyneighbor.de, log-date: 2016-03-08
[25] Technische Universität München: EEBatt - Interdisziplinäre Energiespeicherforschung,
URL: http://www.eebatt.tum.de/startseite/, log-date: 2016-12-18
[26] Naumann, M.; Karl, R.C.; Truong, C.N.; Jossen, A.; Hesse, H.C.: Lithium-ion Battery
Cost Analysis in PV-household Application, In: Energy Procedia 73, pp. 37–47, 2015
[27] International Electrotechnical Commission: White Paper: Electrical Energy Storage. 78,
1st edition, IEC, Switzerland, 2011
[28] TEPCO: Challenges of TEPCO – The TEPCO Group's Environmental Initiatives,
URL: http://www.tepco.co.jp/en/challenge/csr/initiatives/index-e.html, log-date: 2016-11-
07
[29] Kedzierski, M.A.; Payne, W.V.; Skye, H.M.: Potential Research Areas in Residential
Energy Storage for NIST’s Engineering Laboratory – Potential Research Areas in
Residential Energy Storage for NIST’s Engineering Laboratory. 34, National Institute of
Standards and Technology, 2014
List of References
143
[30] International Renewable Energy Agency (IRENA): Renewable Energy Cost Analysis:
Hydropower (3), 2012
[31] Luo, X.; Wang, J.; Dooner, M.; Clarke, J.: Overview of current development in electrical
energy storage technologies and the application potential in power system operation, In:
Applied Energy 137, pp. 511–536, 2015
[32] Islam, S.M.: Increasing Wind Energy Penetration Level by Using Pumped Hydro Storage
in Island Micro-Grid System, In: International Journal of Energy and Environmental
Engineering 3 (1), p. 9–9, 2012
[33] Havel, T.F.: Adsorption-Enhanced Compressed Air Energy Storage,
URL: http://www.nsti.org/publications/Nanotech/2011/pdf/655.pdf, log-date: 2016-07-29
[34] Barton, J.P.; Infield, D.G.: Energy Storage and Its Use With Intermittent Renewable
Energy, In: IEEE Transactions on Energy Conversion 19 (2), pp. 441–448, 2004
[35] Schaber, C.; Mazza, P.; Hammerschlag, R.: Utility-Scale Storage of Renewable Energy,
In: The Electricity Journal 17 (6), pp. 21–29, 2004
[36] Béguin, F.; Raymundo-Piñero, E.; Frackowiak, E.: Electrical Double-Layer Capacitors
and Pseudocapacitors, In: Gogotsi, Y.; Presser, V. (eds.): Carbon Nanomaterials,
Second Edition, CRC Press, 2013
[37] Chen, H.; Cong, T.N.; Yang, W.; Tan, C.; Li, Y.; Ding, Y.: Progress in electrical energy
storage system – A critical review, In: Progress in Natural Science 19 (3), pp. 291–312,
2009
[38] Fuchs, G.; Lunz, B.; Leuthold, M.; Sauer, D.U.: Technology Overview on Electricity
Storage – Overview on the potential and on the deployment perspectives of electricity
storage technologies. 66, Berlin, 2012
[39] Müller, M.; Viernstein, L.; Truong, C.N.; Eiting, A.; Hesse, H.C.; Witzmann, R.; Jossen,
A.: Evaluation of grid-level adaptability for stationary battery energy storage system
applications in Europe, In: Journal of Energy Storage 9, pp. 1–11, 2017
[40] Jossen, A.; Weydanz, W.: Moderne Akkumulatoren richtig einsetzen. X, 284 S., 1st
edition, Reichardt Verlag, Neusäß, 2006
[41] Dong, D.; Wang, P.; Qin, W.; Han, X.: Investigation of a microgrid with vanadium redox
flow battery storages as a black start source for power system restoration, In:
Conference onIndustrial Electronics and Applications (ICIEA) 9, pp. 140–145, 2014
[42] Rand, D.A.J.; Moseley, P.T.; Garche, J.: Valve-regulated Lead–Acid Batteries. 606,
Elsevier, 2004
[43] Sandia National Laboratories: DOE Global Energy Storage Database,
URL: http://www.energystorageexchange.org/, log-date: 2016-11-07
[44] Nykvist, B.; Nilsson, M.: Rapidly falling costs of battery packs for electric vehicles, In:
Nature Climate Change 5 (4), pp. 329–332, 2015
List of References
144
[45] Mueller, S.C.; Sandner, P.G.; Welpe, I.M.: Monitoring innovation in electrochemical
energy storage technologies – A patent-based approach, In: Applied Energy 137, pp.
537–544, 2015
[46] Engelmann, J.; Brand, M.; Müller, M.; Kießling, S.: Grundlagen von
Batteriemanagementsystemen und deren funktionelle und strukturelle Evaluierung,
Forschungsarbeit, Technische Universität München, München, 2014
[47] Cabrera-Castillo, E.; Niedermeier, F.; Jossen, A.: Calculation of the state of safety (SOS)
for lithium ion batteries, In: Journal of Power Sources 324, pp. 509–520, 2016
[48] Lu, L.; Han, X.; Li, J.; Hua, J.; Ouyang, M.: A review on the key issues for lithium-ion
battery management in electric vehicles, In: Journal of Power Sources 226, pp. 272–
288, 2013
[49] Lee, M.; Lee, J.; Lee, I.; Lee, J.; Chon, A.: Wireless battery management system: 2013
World Electric Vehicle Symposium and Exhibition (EVS27)
[50] Marzband, M.; Azarinejadian, F.; Savaghebi, M.; Guerrero, J.M.: An Optimal Energy
Management System for Islanded Microgrids Based on Multiperiod Artificial Bee Colony
Combined With Markov Chain, In: IEEE Systems Journal, pp. 1–11, 2015
[51] Reihani, E.; Sepasi, S.; Roose, L.R.; Matsuura, M.: Energy management at the
distribution grid using a Battery Energy Storage System (BESS), In: International Journal
of Electrical Power & Energy Systems 77, pp. 337–344, 2016
[52] Schuster, S.F.; Bach, T.; Fleder, E.; Müller, J.; Brand, M.; Sextl, G.; Jossen, A.: Nonlinear
aging characteristics of lithium-ion cells under different operational conditions, In: Journal
of Energy Storage 1, pp. 44–53, 2015
[53] Garche, J.; Moseley, P.T.; Adelmann, P. (eds.): Electrochemical energy storage for
renewable sources and grid balancing, Elsevier, Amsterdam, Netherlands, 2015
[54] Daniel, C.; Besenhard, J.O.: Handbook of Battery Materials. 2027, 2nd edition, Wiley,
Weinheim, 2012
[55] Balbuena, P.B.; Wang, Y.: Lithium-ion batteries – Solid-electrolyte interphase. 407,
[Repr.], Imperial College Press, London, 2007
[56] Patil, A.; Patil, V.; Wook Shin, D.; Choi, J.-W.; Paik, D.-S.; Yoon, S.-J.: Issue and
challenges facing rechargeable thin film lithium batteries, In: Materials Research Bulletin
43 (8-9), pp. 1913–1942, 2008
[57] Väyrynen, A.; Salminen, J.: Lithium ion battery production, In: The Journal of Chemical
Thermodynamics 46, pp. 80–85, 2012
[58] Dinger, A.; Ripley, M.; Mosquet, X.; Russo, M.; Rabl, M.; Rizoulis, D.; Sticher, G.:
White Paper: Batteries for Electric Cars: Challenges, Opportunities, and the Outlook to
2020, URL: https://www.bcg.com/documents/file36615.pdf, log-date: 2016-04-13
[59] Riegel, B.: Anforderungen an Batterien für den stationären Einsatz, In: Korthauer, R.
(ed.): Handbuch Lithium-Ionen-Batterien, Springer Berlin Heidelberg, 2013
List of References
145
[60] Padhi, A.K.: Phospho-olivines as Positive-Electrode Materials for Rechargeable Lithium
Batteries, In: Journal of The Electrochemical Society 144 (4), p. 1188–1188, 1997
[61] Terauchi, M.: Sony's Lithium ion battery using olivine-type LFP cathode. 8, Battery
University, 2011
[62] Scrosati, B.; Garche, J.: Lithium batteries – Status, prospects and future, In: Journal of
Power Sources 195 (9), pp. 2419–2430, 2010
[63] Buchmann, I.: Lithium Titanate (Li4Ti5O12) – Batteryuniversity,
URL: http://batteryuniversity.com/learn/article/types_of_lithium_ion, log-date: 2016-08-09
[64] Miyaki, Y.; Hayashi, K.; Makino, T.; Yoshida, K.; Terauchi, M.; Endo, T.; Fukushima, Y.: A
Common Capacity Loss Trend – LiFePO4 Cell's Cycle and Calendar Aging: Honolulu
PRiME, Hawaii, 2012
[65] Doughty, D.H.; Crafts, C.C.: FreedomCAR :electrical energy storage system abuse test
manual for electric and hybrid electric vehicle applications. 47, 2006
[66] Kerber, G.: Report: Empfehlung zur Richtlinie zum Anschluss von Erzeugungsanlagen
an das Niederspannungsnetz, 2009
[67] Pinson, M.B.; Bazant, M.Z.: Theory of SEI Formation in Rechargeable Batteries –
Capacity Fade, Accelerated Aging and Lifetime Prediction, In: Journal of The
Electrochemical Society 160 (2), A243-A250, 2012
[68] BSW, BVES, DGS, StoREgio, ZVEH: Sicherheitsleitfaden Li-Ionen Hausspeicher,
URL: https://www.solarwirtschaft.de/fileadmin/media/pdf/Sicherheitsleitfaden_Li-
Ionen_Hausspeicher.pdf, log-date: 2016-11-07
[69] Vetter-Gindele, J.: Geschäftsmodelle für stationäre fragmentierte Batteriespeicher,
Master Thesis, Technische Universität München, München, 2016
[70] Brahms, F.: Stromspeicher im EEG 2014, In: ER EnergieRecht 2014 (6), pp. 220–224,
2014
[71] Riewe, J.; Meyer, J.H.: Stromspeicherdefinition im EnWG - Ein Werkzeugkasten aus
rechtswissenschaftlicher Sicht, In: EWeRK 2015 (3), pp. 138–144, 2015
[72] Bundesregierung Deutschland: Entwurf eines Gesetzes zur Einführung von
Ausschreibungen für Strom aus erneuerbaren Energien und zu weiteren Änderungen
des Rechts der erneuerbaren Energien – EEG 2016,
URL: https://www.bmwi.de/BMWi/Redaktion/PDF/G/gesetzentwurf-ausschreibungen-
erneuerbare-energien-aenderungen-eeg-
2016,property=pdf,bereich=bmwi2012,sprache=de,rwb=true.pdf, log-date: 2016-07-13
[73] Brahms, F.; Maslaton, M.: Der Regierungsentwurf des Erneuerbaren-Energien-Gesetzes
2014 – Verfassungsrechtliche Bedenken gegen die EEG-Umlage auf die
Eigenstromversorgung, In: NVwZ 2014 (12), pp. 760–764, 2014
[74] Energiewirtschaftsgesetz – EnWG, 2005
[75] Richter, C.; Brahms, F.: Rekommunalisierung von Strom- und Gasnetzen, In: KommJur
2014 (1), pp. 6–13, 2014
List of References
146
[76] ENTSO-E: Who Is ENTSO-E?, URL: https://www.entsoe.eu/about-entso-
e/Pages/default.aspx, log-date: 2016-06-16
[77] Regulation (EC) No 713/2009 of the European Parliament and of the Council of 13 July
2009 establishing an Agency for the Cooperation of Energy Regulators – Regulation
(EC) No 713/2009, 2009
[78] Regulation (EC) No 714/2009 of the European Parliament and of the Council of 13 July
2009 on conditions for access to the network for cross-border exchanges in electricity
and repealing Regulation (EC) No 1228/2003 – Regulation (EC) No 714/2009, 2009
[79] Berndt, H.; Hermann, M.; Kreye, H.D.; Reinisch, R.; Scherer, U.; Vanzetta, J.: Report:
TransmissionCode 2007 – Network and System Rules of the German Transmission
System Operators, Online, 2007
[80] Brahms, F.: Der ENTSO-E Netzkodex für alle Netznutzer, In: ER EnergieRecht 2014 (2),
pp. 61–66, 2014
[81] Directive No 2009/72/EC of the European Parliament and of the Council of 13 July 2009
concerning common rules for the internal market in electricity and repealing Directive
2003/54/EC – Directive No 2009/72/EC, 2009
[82] Appen, J. von; Braun, M.; Stetz, T.; Diwold, K.; Geibel, D.: Time in the Sun – The
Challenge of High PV Penetration in the German Electric Grid, In: IEEE Power and
Energy Magazine 11 (2), pp. 55–64, 2013
[83] Oudalov, A.; Chartouni, D.; Ohler, C.; Linhofer, G.: Value Analysis of Battery Energy
Storage Applications in Power Systems: 2006 IEEE PES Power Systems Conference
and Exposition, 2006 – PSCE '06 ; Oct. 29 2006 - Nov. 1 2006, [Sheraton Atlanta,
Atlanta, Georgia, USA], IEEE Service Center, Piscataway, NJ, 2006
[84] Wrede, V.v.: Die Transparenz im börslichen Stromgroßhandel am Beispiel der European
Energy Exchange, Zugl.: Köln, Univ., Diss., 2011. 180, 1. Aufl., Nomos, Baden-Baden,
2012
[85] Do, D.V.; Forgez, C.; El Kadri Benkara, K.; Friedrich, G.: Impedance Observer for a Li-
Ion Battery Using Kalman Filter, In: IEEE Transactions on Vehicular Technology 58 (8),
pp. 3930–3937, 2009
[86] BDEW: Erneuerbare Energien und das EEG: Zahlen, Fakten, Grafiken (2015) –
Anlagen, installierte Leistung, Stromerzeugung, EEG-Auszahlungen, Marktintegration
der Erneuerbaren Energien und regionale Verteilung der EEG-induzierten
Zahlungsströme, Berlin, 11. Mai 2015,
URL: https://www.bdew.de/internet.nsf/id/20150511-o-energie-info-erneuerbare-
energien-und-das-eeg-zahlen-fakten-grafiken-2015-de/$file/Energie-
Info_Erneuerbare_Energien_und_das_EEG_2015_11.05.2015_final.pdf, log-date: 2016-
12-26
[87] Quaschning, V.: Vergütung für Strom aus Photovoltaikanlagen nach dem Erneuerbare-
Energien-Gesetz (EEG), URL: http://www.volker-quaschning.de/datserv/EEG-
PV/index.php, log-date: 2016-06-16
List of References
147
[88] Gesetz für den Vorrang erneuerbarer Energien – EEG, 2009
[89] Gesetz für den Vorrang erneuerbarer Energien – EEG, 2012
[90] Pawel, I.: The Cost of Storage – How to Calculate the Levelized Cost of Stored Energy
(LCOE) and Applications to Renewable Energy Generation, In: Energy Procedia 46, pp.
68–77, 2014
[91] Megel, O.; Mathieu, J.L.; Andersson, G.: Maximizing the potential of energy storage to
provide fast frequency control, In: 4th IEEE/PES innovative smart grid technologies
Europe (ISGT Europe), pp. 1–5, 2013
[92] Zeh, A.; Müller, M.; Jossen, A.; Hesse, H.; Witzmann, R.: Operating a Multitasking
Stationary Battery Storage System for Providing Secondary Control Reserve on Low-
Voltage Level, In: Proceedings of International ETG Congress 2015; Die Energiewende -
Blueprints for the new energy age, pp. 1–8, 2015
[93] Kairies, K.-P.; Haberschusz, D.; van Ouwerkerk, J.; Strebel, J.; Wessels, O.; Magnor, D.;
Badeda, J.; Sauer, D.U.: Wissenschaftliches Mess- und Evaluierungsprogramm
Solarstromspeicher – Jahresbericht 2016,
URL: http://www.speichermonitoring.de/fileadmin/user_upload/Speichermonitoring_Jahr
esbericht_2016_Kairies_web.pdf, log-date: 2016-06-16
[94] RAP: Netzentgelte in Deutschland: Herausforderungen und Handlungsoptionen – Studie
im Auftrag von Agora Energiewende, The Regulatory Assistance Project, 2014
[95] Statistisches Bundesamt: Statistisches Jahrbuch – Deutschland und Internationales.
693, Wiesbaden, 2015
[96] Gewerbesteuergesetz – GewStG, 2016
[97] Statistisches Bundesamt: Hebesätze der Realsteuern – Ausgabe 2014 -
Gemeinschaftsveröffentlichung,
URL: https://www.destatis.de/DE/Publikationen/Thematisch/FinanzenSteuern/Steuern/R
ealsteuer/HebesaetzeRealsteuern.html, log-date: 2016-06-16
[98] Verordnung über Konzessionsabgaben für Strom und Gas
(Konzessionsabgabenverordnung) – KAV, 1992
[99] EPRI, D.: Electricity Energy Storage Technology Options – A White Paper Primer on
Applications, Costs and Benefits,
URL: http://www.epri.com/abstracts/Pages/ProductAbstract.aspx?ProductId=000000000
001020676, log-date: 2016-12-26
[100] Eyer, J.; Corey, G.: Energy storage for the electricity grid: Benefits and market potential
assessment guide – A Study for the DOE Energy Storage Systems Program, In: Sandia
National Laboratories 20 (10), p. 5–5, 2010
[101] Hedegaard, K.; Meibom, P.: Wind power impacts and electricity storage–A time scale
perspective, In: Renewable Energy 37 (1), pp. 318–324, 2012
[102] Lemaire, E.; Martin, N.; Nørgård, P.; Jong, E. de; Graaf, R. de; Groenewegen, J.;
Kolentini, E.; Tselepis, S.: European white book on grid-connected storage, 2011
List of References
148
[103] Manz, D.; Keller, J.; Miller, N.: Value propositions for utility-scale energy storage, In:
Power Systems Conference and Exposition (PSCE), pp. 1–10, 2011
[104] Mariyappan, J.; Black, M.; Strbac, G.; Hemmi, K.: Pushing a Least Cost Integration of
Green Electricity into the European Grid–Cost and Technical Opportunities for Electricity
Storage Technologies, In: Chineham, United Kingdom: IT Power, 2004
[105] van der Linden, S.: Bulk energy storage potential in the USA, current developments and
future prospects, In: Energy 31 (15), pp. 3446–3457, 2006
[106] Wassiliadis, N.: Identifikation und Bewertung von Second Life Anwendungen für
Fahrzeug-Traktionsbatterien, Master Thesis, Technische Universität München, München,
2014
[107] Narula, C.K.; Martinez, R.; Onar, O.; Starke, M.R.; Andrews, G.: Economic Analysis of
Deploying Used Batteries in Power Systems – Report. 122, Online, 2011
[108] Noce, C.; Riva, S.; Sapienza, G.; Brenna, M.: Electrical energy storage in Smart Grid:
Black-start study using a real-time digital simulator, In: IEEE International Symposium on
Power Electronics for Distributed Generation Systems (PEDG) 3, pp. 216–220, 2012
[109] Battke, B.; Schmidt, T.S.; Grosspietsch, D.; Hoffmann, V.H.: A review and probabilistic
model of lifecycle costs of stationary batteries in multiple applications, In: Renewable
and Sustainable Energy Reviews 25, pp. 240–250, 2013
[110] Fitzgerald, G.; Morris, J.; Mandel, J.: The Economics of Battery Energy Storage – How
multi-use, customer-sited batteries deliver the most services and value to customers and
the grid, URL: http://www.rmi.org/Content/Files/RMI-
TheEconomicsOfBatteryEnergyStorage-FullReport-FINAL.pdf, log-date: 2016-03-08
[111] Malhotra, A.; Battke, B.; Beuse, M.; Stephan, A.; Schmidt, T.: Use cases for stationary
battery technologies – A review of the literature and existing projects, In: Renewable and
Sustainable Energy Reviews 56, pp. 705–721, 2016
[112] Bradbury, K.; Pratson, L.; Patiño-Echeverri, D.: Economic viability of energy storage
systems based on price arbitrage potential in real-time U.S. electricity markets, In:
Applied Energy 114, pp. 512–519, 2014
[113] Andresen, G.B.; Rodriguez, R.A.; Becker, S.; Greiner, M.: The potential for arbitrage of
wind and solar surplus power in Denmark, In: Energy 76, pp. 49–58, 2014
[114] Cready, E.; Lippert, J.; Pihl, J.; Weinstock, I.; Symons, P.; Jungst, R.G.: Technical and
Economic Feasibility of Applying Used EV Batteries in Stationary Applications – A Study
for the DOE Energy Storage Systems Program. 130, 2003
[115] E-Bridge; IAEW; OFFIS: Moderne Verteilernetze für Deutschland – Verteilernetzstudie,
URL: http://www.bmwi.de/BMWi/Redaktion/PDF/Publikationen/Studien/verteilernetzstudi
e,property=pdf,bereich=bmwi2012,sprache=de,rwb=true.pdf, log-date: 2016-12-26
[116] Pardatscher, R.: Planungskriterien und Spannungsqualität in Mittel- und
Niederspannungsnetzen mit hoher Photovoltaik-Einspeisung, Techn. Univ., Diss.
München, 2015. 138, Verlag Dr. Hut, München, 2015
List of References
149
[117] Zeh, A.; Witzmann, R.: Operational Strategies for Battery Storage Systems in Low-
voltage Distribution Grids to Limit the Feed-in Power of Roof-mounted Solar Power
Systems, In: Energy Procedia 46, pp. 114–123, 2014
[118] Castillo, A.; Gayme, D.F.: Grid-scale energy storage applications in renewable energy
integration – A survey, In: Energy Conversion and Management 87, pp. 885–894, 2014
[119] Merei, G.; Moshövel, J.; Magnor, D.; Sauer, D.U.: Optimization of self-consumption and
techno-economic analysis of PV-battery systems in commercial applications, In: Applied
Energy 168, pp. 171–178, 2016
[120] Dena: dena-Netzstudie II – Integration erneuerbarer Energien in die deutsche
Stromversorgung im Zeitraum 2015 – 2020 mit Ausblick 2025. 620, Berlin, 2010
[121] Wirth, H.: Aktuelle Fakten zur Photovoltaik in Deutschland, URL: www.pv-fakten.de, log-
date: 2016-03-17
[122] Lödl, M.; Witzmann, R.; Metzger, M.: Vergleich von Energiespeichern und
Netzverstärkungsmaßnahmen in Niederspannungs-Verteilnetzen bei hoher dezentraler
Einspeisung, In: VDE-Kongress 2010 E-Mobility, 2012
[123] Kreditanstalt für Wiederaufbau - KfW: KfW-Programm Erneuerbare Energien – Speicher
(275), Frankfurt am Main, 2015
[124] Bayer, B.: Demand Response - sind die USA ein Vorbild für Deutschland? Eine Analyse
der Integration von Demand Response in die US-amerikanischen Kapazitäts- und
Regelleistungsmärkte – Eine Analyse der Integration von Demand Response in die US-
amerikanischen Kapazitäts- und Regelleistungsmärkte, In: IASS Working Paper, 2014
[125] Deutsche Übertragungsnetzbetreiber: Anforderungen an die Speicherkapazität bei
Batterien für die Primärregelleistung,
URL: https://www.regelleistung.net/ext/download/anforderungBatterien, log-date: 2016-
12-26
[126] Koj, J.C.; Stenzel, P.; Schreiber, A.; Hennings, W.; Zapp, P.; Wrede, G.; Hahndorf, I.: Life
Cycle Assessment of Primary Control Provision by Battery Storage Systems and Fossil
Power Plants, In: Energy Procedia 73, pp. 69–78, 2015
[127] Stenzel, P.; Koj, J.C.; Schreiber, A.; Hennings, W.; Zapp, P.: Primary control provided by
large-scale battery energy storage systems or fossil power plants in Germany and
related environmental impacts, In: Journal of Energy Storage 8 (In Press, Corrected
Proof), pp. 300–310, 2016
[128] Consentec GmbH: Description of load-frequency control concept and market for control
reserves, Study commissioned by the German TSOs,
URL: https://www.regelleistung.net/ext/download/marktbeschreibungEn, log-date: 2016-
12-26
[129] Regelleistung.net: Gemeinsame Ausschreibung Sekundärregelleistung,
URL: https://www.regelleistung.net/ext/static/srl, log-date: 2016-11-10
List of References
150
[130] Goebel, C.; Hesse, H.; Schimpe, M.; Jossen, A.; Jacobsen, H.-A.: Model-based Dispatch
Strategies for Lithium-Ion Battery Energy Storage applied to Pay-as-Bid Markets for
Secondary Reserve, In: IEEE Transactions on Power Systems, p. 1–1, 2016
[131] Regelleistung.net: Gemeinsame Ausschreibung Minutenreserveleistung,
URL: https://www.regelleistung.net/ext/static/mrl, log-date: 2016-11-10
[132] Oudalov, A.; Cherkaoui, R.; Beguin, A.: Sizing and Optimal Operation of Battery Energy
Storage System for Peak Shaving Application, In: IEEE (ed.): 2007 IEEE Power Tech
[133] Leadbetter, J.; Swan, L.G.: Selection of battery technology to support grid-integrated
renewable electricity, In: Journal of Power Sources 216, pp. 376–386, 2012
[134] Regelleistung.net: Gemeinsame Ausschreibung Primärregelleistung,
URL: https://www.regelleistung.net/ext/static/prl, log-date: 2016-11-10
[135] UTCE: Load-Frequency Control and Performance. 33, Online, 2009
[136] Consentec GmbH: Description of load-frequency control concept and market for control
reserves – Study commissioned by the German TSOs,
URL: https://www.google.com/url?sa=t&rct=j&q=&esrc=s&source=web&cd=1&cad=rja&u
act=8&ved=0ahUKEwiF8q71s5XRAhUB0SYKHUgyBJQQFggfMAA&url=https%3A%2F
%2Fwww.regelleistung.net%2Fext%2Fdownload%2FmarktbeschreibungEn&usg=AFQj
CNEgJb5rdXINHTe8HSUm5zuZzY7l5w&sig2=7qj9ItqzBapJZp_1XJxAuQ, log-date:
2016-12-26
[137] Zeh, A.; Müller, M.; Naumann, M.; Hesse, H.; Jossen, A.; Witzmann, R.: Fundamentals
of Using Battery Energy Storage Systems to Provide Primary Control Reserves in
Germany, In: Batteries 2 (3), p. 29–29, 2016
[138] Jawaid, H.; Ehsan, N.; Mirza, E.; Bhatti, M.W.: Solar powered UPS, In: Procedia
Technology 1, pp. 217–224, 2012
[139] Aamir, M.; Ahmed Kalwar, K.; Mekhilef, S.: Review – Uninterruptible Power Supply
(UPS) system, In: Renewable and Sustainable Energy Reviews 58, pp. 1395–1410,
2016
[140] Office, E.P.: PATSTAT, URL: https://www.epo.org/searching-for-
patents/business/patstat.html#tab1, log-date: 2016-08-09
[141] Elsevier: Scopus - Document search, URL: https://www.scopus.com/, log-date: 2016-08-
09
[142] Agora Energiewende: Negative Strompreise: Ursachen und Wirkung – Eine Analyse der
aktuellen Entwicklungen und ein Vorschlag für ein Flexibilitätsgesetz 2014, 2014
[143] Office, E.P.: Patent families, URL: http://www.epo.org/searching-for-patents/helpful-
resources/first-time-here/patent-families.html, log-date: 2016-11-08
[144] Kleinknecht, A.; van Montfort, K.; Brouwer, E.: The non-trivial choice between innovation
indicators, In: Economics of Innovation and new technology 11 (2), pp. 109–121, 2002
List of References
151
[145] Montecchi, T.; Russo, D.; Liu, Y.: Searching in Cooperative Patent Classification:
Comparison between keyword and concept-based search, In: Advanced Engineering
Informatics 27 (3), pp. 335–345, 2013
[146] European Patent Office: Cooperative Patent Classification – Background,
URL: http://www.cooperativepatentclassification.org/about.html, log-date: 2016-11-08
[147] Office of the Chief Communications Officer: USPTO and EPO Announce Launch of
Cooperative Patent Classification System, URL: http://www.uspto.gov/about-us/news-
updates/uspto-and-epo-announce-launch-cooperative-patent-classification-system, log-
date: 2016-08-09
[148] Archibugi, D.: Patenting as an indicator of technological innovation – A review, In:
Science and Public Policy 19 (6), pp. 357–368, 1992
[149] Lanjouw, J.O.; Pakes, A.; Putnam, J.: How to count patents and value intellectual
property: The uses of patent renewal and application data, In: The Journal of Industrial
Economics 46 (4), pp. 405–432, 1998
[150] Harhoff, D.; Scherer, F.M.; Vopel, K.: Citations, family size, opposition and the value of
patent rights, In: Research Policy 32 (8), pp. 1343–1363, 2003
[151] OECD: Measuring Patent Quality – Indicators of Technological and Economic Value,
URL: https://www.oecd.org/officialdocuments/publicdisplaydocumentpdf/?cote=DSTI/DO
C(2013)3&docLanguage=En, log-date: 2016-08-09
[152] Putnam, J.D.: The Value of International Patent Rights. 142, USA, 1996
[153] Albert, M.B.; Avery, D.; Narin, F.; McAllister, P.: Direct validation of citation counts as
indicators of industrially important patents, In: Research Policy 20 (3), pp. 251–259,
1991
[154] Carpenter, M.P.; Narin, F.; Woolf, P.: Citation rates to technologically important patents,
In: World Patent Information 3 (4), pp. 160–163, 1981
[155] Hirsch, J.E.: An index to quantify an individual's scientific research output, In:
Proceedings of the National Academy of Sciences of the United States of America 102
(46), pp. 16569–16572, 2005
[156] Sidiropoulos, A.; Katsaros, D.; Manolopoulos, Y.: Generalized Hirsch h-index for
disclosing latent facts in citation networks, In: Scientometrics 72 (2), pp. 253–280, 2007
[157] Guess, M.: SoCal utility will buy 80MWh of battery storage from Tesla after methane
leak, URL: http://arstechnica.com/business/2016/09/socal-utility-will-buy-80mwh-of-
battery-storage-from-tesla-after-methane-leak/, log-date: 2016-11-08
[158] Truong, C.; Naumann, M.; Karl, R.; Müller, M.; Jossen, A.; Hesse, H.: Economics of
Residential Photovoltaic Battery Systems in Germany – The Case of Tesla’s Powerwall,
In: Batteries 2 (2), p. 14–14, 2016
[159] Hesse, H.C.; Naumann, M.; Müller, M.; Truong, N.; Schimpe, M.; Jossen, A.: A Holistic
Battery Storage Simulation Tool for Use Case Specific Cost Analysis, 1st edition,
München, 2016
List of References
152
[160] Marcus Müller: Energy Storage as a Key Enabler of a New Electrification Wave – A
Battery Storage Perspective, Cambridge, MA, 2016
[161] Marcus Müller: A German Perspective on Lithium-Ion Battery Technology, State College,
PA, USA, 2016
[162] Maik Naumann: SimSES: Software zur techno-ökonomischen Simulation stationärer
Energiespeicher, Berlin, 2017
[163] Schmidt, J.P.; Weber, A.; Ivers-Tiffée, E.: A novel and fast method of characterizing the
self-discharge behavior of lithium-ion cells using a pulse-measurement technique, In:
Journal of Power Sources 274, pp. 1231–1238, 2015
[164] Rosenkranz, C.A.; Köhler, U.: Modern Battery Systems for Plug-In Hybrid Electric
Vehicles – Presentation, 23rd International Hybrid and Fuel Cell Electric Vehicle
Symposium and Exhibition (EVS-23), 2007
[165] Fürstenwerth, D.; Waldmann, L.: Stromspeicher in der Energiewende – Untersuchung
zum Bedarf an neuen Stromspeichern in Deutschland für den Erzeugungsausgleich,
Systemdienstleistungen und im Verteilnetz, log-date: 1/24/2015
[166] California ISO: Q1 2016 Report on Market Issues and Performance. 54, 2016
[167] Agora Energiewende: Negative Electricity Prices: Causes and Effects – An analysis of
recent developments and a proposal for a flexibility law. 14, Berlin, 2014
[168] Turner, M.; Sinclair, D.: Negative pricing in the GB wholesale electricity market. 70, 6th
edition, 2015
[169] Massachusetts Energy Storage Initiative: State of Charge. 271, 1st edition, Online, 2016
[170] Castillo-Cagigal, M.; Caamaño-Martín, E.; Matallanas, E.; Masa-Bote, D.; Gutiérrez, A.;
Monasterio-Huelin, F.; Jiménez-Leube, J.: PV self-consumption optimization with storage
and Active DSM for the residential sector, In: Solar Energy 85 (9), pp. 2338–2348, 2011
[171] Hoppmann, J.; Volland, J.; Schmidt, T.S.; Hoffmann, V.H.: The economic viability of
battery storage for residential solar photovoltaic systems – A review and a simulation
model, In: Renewable and Sustainable Energy Reviews 39, pp. 1101–1118, 2014
[172] Leadbetter, J.; Swan, L.: Battery storage system for residential electricity peak demand
shaving, In: Energy and Buildings 55, pp. 685–692, 2012
[173] Weniger, J.; Tjaden, T.; Quaschning, V.: Sizing of Residential PV Battery Systems, In:
Energy Procedia 46, pp. 78–87, 2014
[174] Blechinger, P.; Seguin, R.; Cader, C.; Bertheau, P.; Breyer, C.: Assessment of the Global
Potential for Renewable Energy Storage Systems on Small Islands, In: Energy Procedia
46, pp. 294–300, 2014
[175] Cha, S.T.; Wu, Q.; Zhao, H.; Wang, C.: Frequency Control for Island Operation of
Bornholm Power System, In: Energy Procedia 61, pp. 1389–1393, 2014
[176] Franzen, E.; Strauch, N.; Triebel, C.: Switching off the Generator – the Stable Operation
of Sustainable Island Grids in the MW Range Using Renewable Energy and Energy
Storage, URL: http://www.credp.org/Data/YounicosRES_EN.pdf, log-date: 2016-12-26
List of References
153
[177] Vasconcelos, H.; Moreira, C.; Madureira, A.; Lopes, J.P.; Miranda, V.: Advanced Control
Solutions for Operating Isolated Power Systems – Examining the Portuguese islands, In:
IEEE Electrification Magazine 3 (1), pp. 25–35, 2015
[178] Netztransparenz: EEG-Anlagenstammdaten Gesamtdeutschland zur Jahresabrechnung
2014, URL: https://www.netztransparenz.de/de/Anlagenstammdaten.htm, log-date:
2016-01-20
[179] Transformers Committee of the IEEE Power Engineering Society: IEEE Guide for the
Evaluation and Reconditioning of Liquid Immersed Power Transformers. 1 online
resource, IEEE, Piscataway, NJ, USA, 2006
[180] Bundesverband der Energie- und Wasserwirtschaft e.V.: Standardlastprofile Strom,
URL: https://www.bdew.de/internet.nsf/id/de_standartlastprofile, log-date: 2016-08-04
[181] Bundesverband der Energie- und Wasserwirtschaft e.V.: BDEW-Strompreisanalyse Juni
2014 – Haushalte und Industrie, URL: https://www.bdew.de/internet.nsf/id/20140702-pi-
steuern-und-abgaben-am-strompreis-steigen-weiter-
de/$file/140702%20BDEW%20Strompreisanalyse%202014%20Chartsatz.pdf, log-date:
2016-12-13
[182] Philipps, S.; Warmuth, W.: Photovoltaics Report 2015,
URL: https://www.ise.fraunhofer.de/de/downloads/pdf-files/aktuelles/photovoltaics-report-
in-englischer-sprache.pdf, log-date: 2016-08-04
[183] Thomas, G.: Energiewende in Germany: from generation to integration. 21, Online, 2014
[184] Parkinson, G.: How far away is grid parity for residential battery storage?,
URL: http://reneweconomy.com.au/2014/how-far-away-is-grid-parity-for-residential-
battery-storage-62637, log-date: 2016-12-10
[185] Greentech Media: How Long Until Residential Battery Storage Reaches Grid Parity in
Germany?, URL: http://www.greentechmedia.com/articles/read/how-far-away-is-grid-
parity-for-residential-battery-storage, log-date: 2014-08-26
[186] Weniger, J.; Bergner, J.; Tjaden, T.; Quaschning, V.: Economics of Residential PV
Battery Systems in the Self-Consumption Age, 7 pages / 29th European Photovoltaic
Solar Energy Conference and Exhibition; 3871-3877, 2014
[187] Erneuerbare-Energien-Gesetz – EEG, 2014
[188] Tjaden, T.; Bergner, J.; Weniger, J.; Quaschning, V.: Repräsentative elektrische
Lastprofile für Wohngebäude in Deutschland auf 1-sekündiger Datenbasis,
URL: https://pvspeicher.htw-berlin.de/veroeffentlichungen/daten/, log-date: 2017-03-17
[189] Mauch, W.; Mezger, T.; Staudacher, T.: Anforderungen an elektrische Energiespeicher:
Elektrische Energiespeicher – Schlüsseltechnologie für energieeffiziente Anwendungen ;
Tagung, Fulda, 25. und 26. März 2009, VDI-Verl., Düsseldorf, 2009
[190] German Transmission System Operators: Eckpunkte und Freiheitsgrade bei Erbringung
von Primärregelleistung,
URL: https://www.regelleistung.net/ext/download/eckpunktePRL, log-date: 2016-08-03
List of References
154
[191] Stich, J.; Hamacher, T.; Muller, M.; Hesse, H.C.; Jossen, A.: Sustainable power supply
options for large islands — A case study for Belitung Island – A case study for Belitung
Island, In: Innovative Smart Grid Technologies - Asia (ISGT-Asia), pp. 371–377, 2016
[192] Indonesian Government: Sensus Penduduk 2010 - Indonesia,
URL: http://sp2010.bps.go.id/, log-date: 2016-08-16
[193] Menteri Energi Dan Sumber Daya Mineral: Rencana umum Ketenagalistrikan Nasional,
URL: http://www.djk.esdm.go.id/pdf/Draft%20RUKN/Draft%20RUKN%202015%20-
%202034.pdf, log-date: 2016-12-26
[194] Rokhidah, R.; Sukedi, S.: Survei Sosial Ekonomi Nasional 2013 Kor Gabungan,
URL: http://microdata.bps.go.id/mikrodata/index.php/catalog/220, log-date: 2016-12-26
[195] EIA: Assumptions to the Annual Energy Outlook 2014. 197, Washington, D.C.
[196] Tidball, R.; Bluestein, J.; Rodriguez, N.; Knoke, S.: Cost and Performance Assumptions
for Modeling Electricity Generation Technologies, In: NREL Report SR-6A20-48595 1,
pp. 37–41, 2010
[197] Stich, J.; Mannhart, M.; Zipperle, T.; Massier, T.; Huber, M.; Hamacher, T.: Modelling a
Low-Carbon Power System for Indonesia, Malaysia and Singapore, In: 33rd
IEW International Energy Workshop 33, 2014
[198] Battke, B.M.: Multi-purpose technologies, lock-in and efficiency – Policy implications
from the case of stationary electricity storage, Zürich, ETH-Zürich, 2014
[199] Brehler, M.; Söllch, M.: Erste Primärregelleistung durch privat genutze Schwarm-
Stromspeicher – - Erfolgreiche Präqualifikation im Rahmen des Pilotprojekts SWARM -
Beitrag zur Stabilisierung des Stromnetzes, Gemeinsame Presseinformation der N-
ERGIE Aktiengesellschaft und der Caterva GmbH, Nürnberg/Pullach, 2015
[200] Pudjianto, D.; Ramsay, C.; Strbac, G.: Virtual power plant and system integration of
distributed energy resources, In: IET Renewable Power Generation 1 (1), p. 10–10,
2007
[201] Le Baron, D.: New residential business models – From self-consumption to swarm grid
services. 35, München, 2015
[202] Klampt, W.: Report: Sicherheits- und Performancetests Zelle – Project EEBatt. 104,
München, 2013
[203] Thomann, R.: Strombank, Kongress Energie- und Energiespeichertechnologien. 12,
Stuttgart, 2014
[204] Esslinger, P.: Entwicklung und Verfikation eines stochastischen Verbraucherlastmodells
für Haushalte. 21, Graz, 2012
[205] Zeh, A.; Rau, M.; Witzmann, R.: Comparison of decentralised and centralised grid-
compatible battery storage systems in distribution grids with high PV penetration, In:
Progress in Photovoltaics: Research and Applications 24 (4), pp. 496–506, 2016
[206] Müller, M.; Zeh, A.; Rohr, S.; Schuster, S.F.; Campestrini, C.; Hesse, H.; Witzmann, R.;
Lienkamp, M.; Jossen, A.: Evaluation of the Aging Behaviour of Stationary Lithium-Ion
List of References
155
Battery Storage Systems for Different Photovoltaic-Driven Applications in low Voltage
Grids, 7 pages / 31st European Photovoltaic Solar Energy Conference and Exhibition;
3084-3090, 2015
[207] Wohlfahrt-Mehrens, M.; Vogler, C.; Garche, J.: Aging mechanisms of lithium cathode
materials, In: Journal of Power Sources 127 (1-2), pp. 58–64, 2004
[208] Keil, P.; Schuster, S.F.; Wilhelm, J.; Travi, J.; Hauser, A.; Karl, R.C.; Jossen, A.: Calendar
Aging of Lithium-Ion Batteries, In: Journal of The Electrochemical Society 163 (9),
A1872-A1880, 2016
[209] Keil, P.; Jossen, A.: Calendar Aging of NCA Lithium-Ion Batteries Investigated by
Differential Voltage Analysis and Coulomb Tracking, In: Journal of The Electrochemical
Society 164 (1), A6066-A6074, 2016
[210] Jossen, A.; Weydanz, W.: Moderne Akkumulatoren richtig einsetzen – 36 Tabellen. X,
284 S., 1. Aufl., Ubooks, Neusäß, 2006
[211] Fleckenstein, M.; Bohlen, O.; Bäker, B.: Aging Effect of Temperature Gradients in Li-ion
Cells, In: World Electric Vehicle Journal 5 (1), pp. 322–333, 2012
[212] Ecker, M.; Gerschler, J.B.; Vogel, J.; Käbitz, S.; Hust, F.; Dechent, P.; Sauer, D.U.:
Development of a lifetime prediction model for lithium-ion batteries based on extended
accelerated aging test data, In: Journal of Power Sources 215, pp. 248–257, 2012
[213] Ecker, M.; Nieto, N.; Käbitz, S.; Schmalstieg, J.; Blanke, H.; Warnecke, A.; Sauer, D.U.:
Calendar and cycle life study of Li(NiMnCo)O2-based 18650 lithium-ion batteries, In:
Journal of Power Sources 248, pp. 839–851, 2014
[214] Marongiu, A.; Roscher, M.; Sauer, D.U.: Influence of the vehicle-to-grid strategy on the
aging behavior of lithium battery electric vehicles, In: Applied Energy 137, pp. 899–912,
2015
[215] Herb, F.: Alterungsmechanismen in Lithium-Ionen-Batterien und PEM-Brennstoffzellen
und deren Einfluss auf die Eigenschaften von daraus bestehenden Hybrid-Systemen,
dissertation, Universität Ulm, Ulm, 2010
[216] Broussely, M.; Biensan, P.; Bonhomme, F.; Blanchard, P.; Herreyre, S.; Nechev, K.;
Staniewicz, R.J.: Main aging mechanisms in Li ion batteries, In: Journal of Power
Sources 146 (1-2), pp. 90–96, 2005
[217] Omar, N.; Monem, M.A.; Firouz, Y.; Salminen, J.; Smekens, J.; Hegazy, O.; Gaulous, H.;
Mulder, G.; van den Bossche, P.; Coosemans, T.; van Mierlo, J.: Lithium iron phosphate
based battery – Assessment of the aging parameters and development of cycle life
model, In: Applied Energy 113, pp. 1575–1585, 2014
[218] E.ON Mitte AG: Standardlastprofile 2012, Kassel, 2014
[219] Zeh, A.; Witzmann, R.: Combined operation of a battery storage system on distribution
grid level – impact on the grid and economic benefit, Lyon, 2015
[220] Lödl, M.; Kerber, G.; Witzmann, R.; Hoffmann, C.; Metzger, M.: Abschätzung des
Photovoltaik-Potentials auf Dachflächen in Deutschland, Graz, 2010
List of References
156
[221] Lödl, M.; Witzmann, R.; Metzger, M.: Operation strategies of energy storages with
forecast methods in low-voltage grids with a high degree of decentralized generation, In:
Electrical Power and Energy Conference, pp. 52–56, 2011
[222] Notton, G.; Lazarov, V.; Stoyanov, L.: Optimal sizing of a grid-connected PV system for
various PV module technologies and inclinations, inverter efficiency characteristics and
locations, In: Renewable Energy 35 (2), pp. 541–554, 2010
[223] Hödel, P.: Simulation und Optimierung eines multifunktionalen stationären Li-Ionen
Batteriespeichers, Master Thesis, Technische Universität München, München, 2016
[224] Klemisch, H.: Genossenschaften in der Energiewirtschaft - Entwicklungen und
Potenziale – Fachgespräch Friedrich Ebert Stiftung "Neue genossenschaftliche
Betätigungsfelder" am 22.05.2012,
URL: http://www.fes.de/wiso/pdf/mittelstand/2012/220512/Klemisch.pdf, log-date: 2016-
06-16
[225] Staab, J.: Erneuerbare Energien in Kommunen: Energiegenossenschaften gründen,
Springer Fachmedien, Wiesbaden, 2013
[226] Zantow, R.; Dinauer, J.: Finanzwirtschaft des Unternehmens – Die Grundlagen des
modernen Finanzmanagements, 3., aktualisierte Aufl., Pearson Studium, München,
2011
[227] Flieger, B.: Energiegenossenschaften – Eine klimaverantwortliche, bürgernahe
Energiewirtschaft ist möglich
[228] Schröder, C.; Walk, H.: Genossenschaften und Klimaschutz, Springer Fachmedien
Wiesbaden, Wiesbaden, 2014
[229] Staab, J.: Die 7 häufigsten Insolvenzgründe erkennen und vermeiden – Wie KMU
nachhaltig erfolgreich bleiben, Springer Gabler, Wiesbaden Germany, 2015
[230] BMWI: Investitionen in Erneuerbarer Energien in Deutschland in den Jahren 2000 bis
2014 (in Milliarden Euro),
URL: http://de.statista.com/statistik/daten/studie/171896/umfrage/investitionen-in-
anlagen-zur-nutzung-von-strom-aus-erneuerbaren-energien/, log-date: 2016-06-16
[231] Bloomberg New Energy Finance: Entwicklung der weltweiten Investitionen in
Erneuerbare Energien in den Jahren 2004 bis 2015 (in Milliarden US-Dollar) – Global
Trends in Renewable Energy Investment 2016 - Key Findings,
URL: http://de.statista.com/statistik/daten/studie/180528/umfrage/entwicklung-der-
investitionen-in-erneuerbare-energien-weltwei/, log-date: 2016-06-16
[232] Friege, C.; Herbes, C. (eds.): Marketing Erneuerbarer Energien – Grundlagen,
Geschäftsmodelle, Fallbeispiele, Springer Gabler, Wiesbaden, 2015
[233] Kairies, K.-P.; Haberschusz, D.; Magnor, D.; Leuthold, M.; Badeda, J.; Sauer, D.U.:
Wissenschaftliches Mess- und Evaluierungsprogramm Solarstromspeicher –
Jahresbericht 2015,
URL: http://www.speichermonitoring.de/fileadmin/user_upload/Speichermonitoring_Jahr
esbericht_2015_web.pdf, log-date: 2016-06-16
List of References
157
[234] Statistisches Bundesamt: Bevölkerung und Erwerbstätigkeit – Haushalte und Familien,
Ergebnisse des Mikrozensus 2014,
URL: https://www.destatis.de/DE/Publikationen/Thematisch/Bevoelkerung/HaushalteMik
rozensus/HaushalteFamilien2010300147004.pdf?__blob=publicationFile, log-date:
2016-06-16
[235] BNetzA: Monitoringbericht 2015, Stand: 10.November 2015,
URL: https://www.bundesnetzagentur.de/SharedDocs/Downloads/DE/Allgemeines/Bund
esnetzagentur/Publikationen/Berichte/2015/Monitoringbericht_2015_BA.pdf?__blob=pub
licationFile&v=3, log-date: 2016-06-16
[236] Stromnetzentgeltverordnung – StromNEV, 2005
[237] Gesetz für den Ausbau erneuerbarer Energien – EEG 2014, 2014
[238] BMWI: Entwurf eines Gesetzes zur Weiterentwicklung des Strommarktes
(Strommarktgesetz) – Gesetzentwurf der Bundesregierung,
URL: http://www.bmwi.de/BMWi/Redaktion/PDF/E/entwurf-eines-gesetzes-zur-
weiterentwicklung-des-
strommarktes,property=pdf,bereich=bmwi2012,sprache=de,rwb=true.pdf, log-date:
2016-06-16
[239] BMWI: Ein Strommarkt für die Energiewende – Ergebnispapier des Bundesministeriums
für Wirtschaft und Energie (Weißbuch),
URL: http://www.bmwi.de/BMWi/Redaktion/PDF/Publikationen/weissbuch,property=pdf,b
ereich=bmwi2012,sprache=de,rwb=true.pdf, log-date: 2016-06-16
[240] Wilson, R.: Architecture of Power Markets, In: Econometrica Vol. 70, No. 4 (July,2002),
pp. 1299–1340, 2002
[241] Wang, Q.; Zhang, C.; Ding, Y.; Xydis, G.; Wang, J.; Østergaard, J.: Review of real-time
electricity markets for integrating Distributed Energy Resources and Demand Response,
In: Applied Energy 138, pp. 695–706, 2015
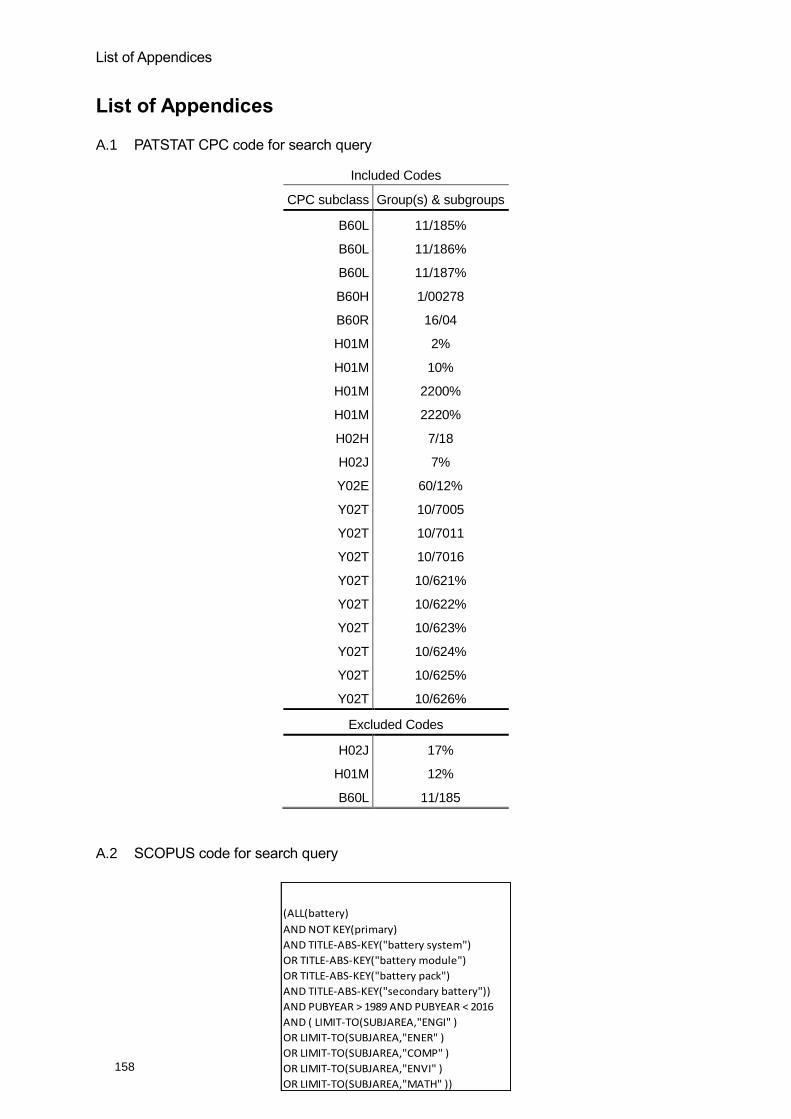
List of Appendices
158
List of Appendices
A.1 PATSTAT CPC code for search query
Included Codes
CPC subclass Group(s) & subgroups
B60L 11/185%
B60L 11/186%
B60L 11/187%
B60H 1/00278
B60R 16/04
H01M 2%
H01M 10%
H01M 2200%
H01M 2220%
H02H 7/18
H02J 7%
Y02E 60/12%
Y02T 10/7005
Y02T 10/7011
Y02T 10/7016
Y02T 10/621%
Y02T 10/622%
Y02T 10/623%
Y02T 10/624%
Y02T 10/625%
Y02T 10/626%
Excluded Codes
H02J 17%
H01M 12%
B60L 11/185
A.2 SCOPUS code for search query
(ALL(battery)
AND NOT KEY(primary)
AND TITLE-ABS-KEY("battery system")
OR TITLE-ABS-KEY("battery module")
OR TITLE-ABS-KEY("battery pack")
AND TITLE-ABS-KEY("secondary battery"))
AND PUBYEAR > 1989 AND PUBYEAR < 2016
AND ( LIMIT-TO(SUBJAREA,"ENGI" )
OR LIMIT-TO(SUBJAREA,"ENER" )
OR LIMIT-TO(SUBJAREA,"COMP" )
OR LIMIT-TO(SUBJAREA,"ENVI" )
OR LIMIT-TO(SUBJAREA,"MATH" ))
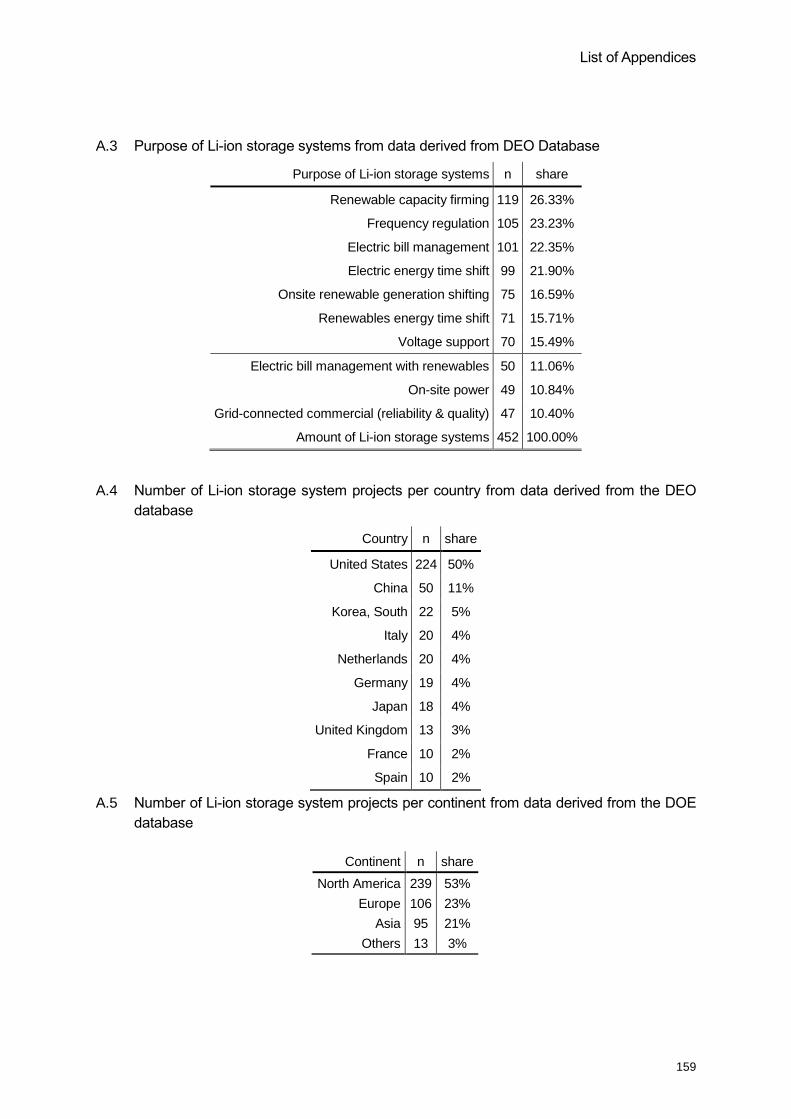
List of Appendices
159
A.3 Purpose of Li-ion storage systems from data derived from DEO Database
Purpose of Li-ion storage systems n share
Renewable capacity firming 119 26.33%
Frequency regulation 105 23.23%
Electric bill management 101 22.35%
Electric energy time shift 99 21.90%
Onsite renewable generation shifting 75 16.59%
Renewables energy time shift 71 15.71%
Voltage support 70 15.49%
Electric bill management with renewables 50 11.06%
On-site power 49 10.84%
Grid-connected commercial (reliability & quality) 47 10.40%
Amount of Li-ion storage systems 452 100.00%
A.4 Number of Li-ion storage system projects per country from data derived from the DEO
database
Country n share
United States 224 50%
China 50 11%
Korea, South 22 5%
Italy 20 4%
Netherlands 20 4%
Germany 19 4%
Japan 18 4%
United Kingdom 13 3%
France 10 2%
Spain 10 2%
A.5 Number of Li-ion storage system projects per continent from data derived from the DOE
database
Continent n share
North America 239 53%
Europe 106 23%
Asia 95 21%
Others 13 3%
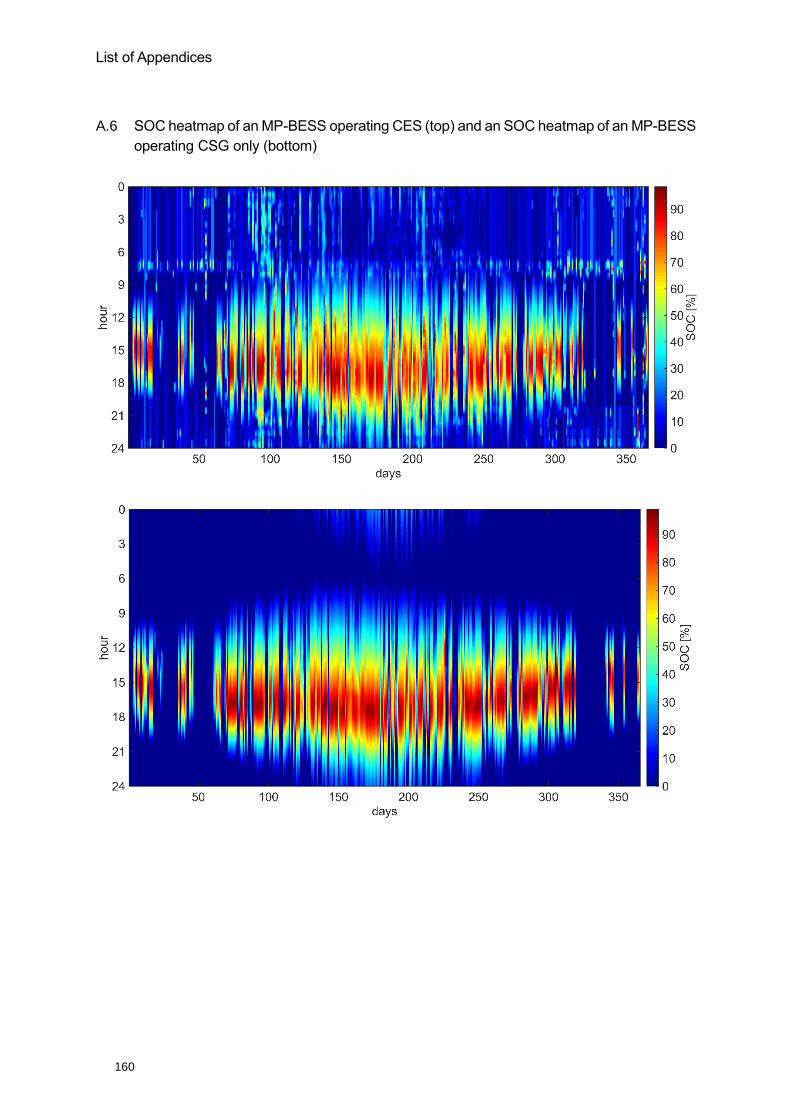
List of Appendices
160
A.6 SOC heatmap of an MP-BESS operating CES (top) and an SOC heatmap of an MP-BESS
operating CSG only (bottom)
Related Documents