American Mineralogist, Volume 76, pages313-i31' 1991 Static lattice energy minimization and lattice dynamicscalculations on aluminosilicateminerals B.ronNWruxr,nn, M,lnrrN T. Dovn Department of Earth Sciences, University of Cambridge, Downing Street,Cambridge CB2 3EQ, United Kingdom MaunrcB Lrsr.rn Daresbury Laboratory, Warrington, CheshireWA4 4AD, United Kingdom Ansrn-lcr Iattice energy minimization and lattice dynamics calculations for the minerals anda- lusite, sillimanite, kyanite, diopside, cordierite, gehlenite,leucite, orthozoisite, grossular, and pyrope are compared with experimentaldata and previous calculations.The potential models used in this study included bond-bending interactions, short-rangeBorn-Mayer forces, effective dispersive interactions, long-rangeCoulomb interactions, and harmonic core-shellinteractions for the O ions. Parameters for the potential models were generally taken from the literature, but the core-shell force constant was modified to give better agreement with experimental data for refractive indices. It was necessary to include bond- bending interactions for Al-O polyhedra with coordination numbers even larger than four' A method for describing effective potentials with Al-Si disorder and solid-solution is presented.Modified Morse and Buckingham potentials were used to model O-H bonds. Relaxed energy-minimum structureswere calculated, allowing cell parametersto change and treating atomic cores and shells as independent entities within the adiabatic approx- imation. Calculated phonon frequencies for the relaxed structureswere used to construct thermodynamic functions. Elastic and dielectric constantswere also calculated.Compar- isons between calculated structures and other properties with experimental data have shown that the model is genuinelytransferable and givesreasonable predictions of crystallograph- ic, physical, and thermodynamic properties. Detailed analysis gives a measureof the re- liability of the model. INrnonucrroN The first aim of this study is to assess the transferability of previously published potentials for modeling the struc- The recent interest in static lattice energy calculations tures of complex minerals using SLEC. We have selected (SLEC) and harmonic lattice dynamici calculations a number of structures that we consider to have features (HLDC) for aluminosilicate minerals is partly motivated that provide balancedtests. The AlrSiOs polymorphs, an- by the insights such calculations give about interatomic dalusite, sillimanite, and kyanite, each have one six-co- forces. An immediate application of reliable SLEC and ordinated Al and one four-coordinated Si, but differ in HLDC is for equilibrium thermodynamics, where such the coordination number of the secondAl, which is four models could provide data, e.g.,on iolid solutions, which in sillimanite, five in andalusite, and six in kyanite. Di- are tedious to obtain experimentally. It is hoped that these opside (CaMgSirOu) has a complex chain structure with calculations can provide information about thermody- irregular Ca coordination. Gehlenite (CarAlrSiO') has a namic and physical properties of minerals under extreme layer structure with Al-Si disorder and significantly dif- conditions of pressrr.e or temperaturethat are not readily ferent bond lengths within the Ca coordination polyhe- attainable in the laboratory. Reliable HLDC models will dron. Cordierite (MgrsisAloO,r) is by some definitions a also permit the interpretation of complex spectroscopic framework structure with an Al-Si order-disorder phase aata(e.g.,Raman,infrared,orinelasticneutronscattering transition that is accompanied by a small spontaneous data). Furthermore, thermodynamic properties can be strain. Leucite (KAlSi'O.) hasa true framework structure. calculated from SLEC and HLDC, and these relations can Experiments suggest that there is no long-range Al-Si or- be used to provide valuable insights into phase transition der at all temperatures. Leucite also undergoesa struc- behavior. Other applications include studiesofdefect en- tural phase transition that is accompanied by a sponta- ergies and transport mechanisms. Finally, as molecular neous strain. The garnets pyrope (MgrAlrSirO'r) and dynamics simulaiions are usedincreasingly to study phase grossular(CarAlrSi.O,r) are orthosilicates in which all the transitions in minerals, the need for testedreliable poten- cornersof the SiO4 tetrahedraand the AlOu octahedra are tials becomesmore urgent. shared, leading to nearly regular triangular dodecahedra 0003-004x/9 l/0304-{3 I 3$02.00 3I 3

Welcome message from author
This document is posted to help you gain knowledge. Please leave a comment to let me know what you think about it! Share it to your friends and learn new things together.
Transcript

American Mineralogist, Volume 76, pages 313-i31' 1991
Static lattice energy minimization and lattice dynamics calculations onaluminosilicate minerals
B.ronN Wruxr,nn, M,lnrrN T. DovnDepartment of Earth Sciences, University of Cambridge, Downing Street, Cambridge CB2 3EQ, United Kingdom
MaunrcB Lrsr.rnDaresbury Laboratory, Warrington, Cheshire WA4 4AD, United Kingdom
Ansrn-lcr
Iattice energy minimization and lattice dynamics calculations for the minerals anda-lusite, sillimanite, kyanite, diopside, cordierite, gehlenite, leucite, orthozoisite, grossular,
and pyrope are compared with experimental data and previous calculations. The potential
models used in this study included bond-bending interactions, short-range Born-Mayerforces, effective dispersive interactions, long-range Coulomb interactions, and harmonic
core-shell interactions for the O ions. Parameters for the potential models were generally
taken from the literature, but the core-shell force constant was modified to give better
agreement with experimental data for refractive indices. It was necessary to include bond-bending interactions for Al-O polyhedra with coordination numbers even larger than four'
A method for describing effective potentials with Al-Si disorder and solid-solution ispresented. Modified Morse and Buckingham potentials were used to model O-H bonds.Relaxed energy-minimum structures were calculated, allowing cell parameters to changeand treating atomic cores and shells as independent entities within the adiabatic approx-imation. Calculated phonon frequencies for the relaxed structures were used to construct
thermodynamic functions. Elastic and dielectric constants were also calculated. Compar-isons between calculated structures and other properties with experimental data have shownthat the model is genuinely transferable and gives reasonable predictions of crystallograph-ic, physical, and thermodynamic properties. Detailed analysis gives a measure of the re-
liability of the model.
INrnonucrroN The first aim of this study is to assess the transferabilityof previously published potentials for modeling the struc-
The recent interest in static lattice energy calculations tures of complex minerals using SLEC. We have selected
(SLEC) and harmonic lattice dynamici calculations a number of structures that we consider to have features
(HLDC) for aluminosilicate minerals is partly motivated that provide balanced tests. The AlrSiOs polymorphs, an-
by the insights such calculations give about interatomic dalusite, sillimanite, and kyanite, each have one six-co-
forces. An immediate application of reliable SLEC and ordinated Al and one four-coordinated Si, but differ in
HLDC is for equilibrium thermodynamics, where such the coordination number of the second Al, which is four
models could provide data, e.g., on iolid solutions, which in sillimanite, five in andalusite, and six in kyanite. Di-
are tedious to obtain experimentally. It is hoped that these opside (CaMgSirOu) has a complex chain structure with
calculations can provide information about thermody- irregular Ca coordination. Gehlenite (CarAlrSiO') has a
namic and physical properties of minerals under extreme layer structure with Al-Si disorder and significantly dif-
conditions of pressrr.e or temperature that are not readily ferent bond lengths within the Ca coordination polyhe-
attainable in the laboratory. Reliable HLDC models will dron. Cordierite (MgrsisAloO,r) is by some definitions a
also permit the interpretation of complex spectroscopic framework structure with an Al-Si order-disorder phase
aata(e.g.,Raman,infrared,orinelasticneutronscattering transition that is accompanied by a small spontaneous
data). Furthermore, thermodynamic properties can be strain. Leucite (KAlSi'O.) has a true framework structure.
calculated from SLEC and HLDC, and these relations can Experiments suggest that there is no long-range Al-Si or-
be used to provide valuable insights into phase transition der at all temperatures. Leucite also undergoes a struc-
behavior. Other applications include studies ofdefect en- tural phase transition that is accompanied by a sponta-
ergies and transport mechanisms. Finally, as molecular neous strain. The garnets pyrope (MgrAlrSirO'r) and
dynamics simulaiions are used increasingly to study phase grossular (CarAlrSi.O,r) are orthosilicates in which all the
transitions in minerals, the need for tested reliable poten- corners of the SiO4 tetrahedra and the AlOu octahedra are
tials becomes more urgent. shared, leading to nearly regular triangular dodecahedra
0003-004x/9 l/0304-{3 I 3$02.00 3 I 3

3t4 WINKLER ET AL.: LATTICE ENERGY AND LATTICE DYNAMICS
containing the Ca or Mg cations. The complex structureof zoisite [CarAlrSir(OH)O,r] contains SirO? and SiOogroups as well as chains of AlOu octahedra that are partlylinked by H bonds. Such a wide range of structures pro-vides a stringent test for a single set of transferable po-tential parameters.
The second aim of this study is to demonstrate thatthese same transferable potential parameters can also re-produce vibrational properties using HLDC. The thirdaim is to show that reliable thermodynamic functions forcomplex minerals can be obtained from HLDC. This em-phasizes the link between microscopic interactions andmacroscopic properties.
The development of transferable model potentials forminerals is vital if computer modeling techniques are tobe used as predictive methods. As Dove (1989) has point-ed out, there is no overall consensus on the forms ofthepotentials to be used and on how numerical values ofparameters in the respective models should be obtained.The potentials that are currently available have been de-rived by a number of different method's, e.g., ab initioquantum mechanical calculations (Lasaga and Gibbs,1987), modified electron gas (MEG) calculations (Postand Burnham, 1986), and empirical fitting procedures(Abbott et al., 1989a, 1989b; Collins and Catlow, 1990).A promising empirical approach has been srrggested bythe very successfirl modeling of quartz (Sanders et al.,1984), forsterite (Price and Parker, 1988), diopside (Dove,1989), micas (Collins and Catlow, 1990), and zeolites(Jackson and Catlow, 1988) using a model that includesthree-body bond-bending interactions and core-shellforces. We have therefore chosen to work oxclusively withthis model in this study, employing previously publishedpotential parameters where appropriate.
The outline of this paper is as follows. In the next sec-tion we summarize the thermodynamic relations used inthis paper. Then we discuss the potential models in detail.Following that, we present the results of our SLEC andHLDC for each material studied. Our aim is to present abrief comparison between the calculated and observedstructures for each example and to give a more detailedanalysis of some of the more interesting features of eachcalculation. This reflects the fact that the best tests ofanymodel are the predictions of subtle effects (such as maybe associated with phase transitions). These are a greaterchallenge for the modeler than simply the predictions ofstructures. Finally we present a general analysis of theresults common to all systems, highlighting the transfer-able aspects of the potential model.
Trru rrrnntvtoDyNAMrc BAsrs
In the quasi-harmonic approximation, a crystal's in-ternal energy, E, can be described as a sum ofthe staticlattice energy, g, and the vibrational energy, -8",0:
E :9 * E " ,o . ( l )
The static lattice energy, I, is the sum over all inter-
atomic interactions. The vibrational energy, E",o, is givenby
E",o: Zn,,,u,[i + ,r., n) (2)
where arr(k) denotes the frequency of the "/th mode atwavevector k. The term, n(a, 7), is the Bose-Einsteindistribution:
Since n (<.r, Z) is independent of wavevector and modenumber, the sum in Equation 2 can be replaced by anintegral over the density of states, g(co):
r f r IE"*: J n,fj + n(<t.T)fkr)do;. (4)
Note that we are assuming infinite perfect crystalsthroughout this study. The only quantity in Equation 4that is dependent on the actual structure is g(or). Thedensity of states is a rather demanding quantity to cal-culate from a computational viewpoint. Calculations in-volving a fine grid over the Brillouin zone are impracti-cal; however, calculations using only a single point (e.g.,the I or k : 0 point) are prone to errors caused by theneglect of phonon dispersion. This point is discussed inmore detail by Price and Parker (1988). The use of rep-resentative points for cubic lattices has been suggested(Baldereschi, 1973), but such points are also prone toerrors in the calculated g(<o), particularly at low frequen-cies. We used the Baldereschi point ('1, '/r, t/r) for theI-centered cubic garnets. For all other systems we havemade the pragmatic choice of constmcting g(<.r) fromHLDC performed at the I point and at points on the facesof the Brillouin zone. By doing this, we hope that theeffects offrequency dispersions are adequately taken intoaccount, albeit in a coarse way. However, since most ofthe modes only show weak dispersion, the only significantsource of error will arise from the contribution of theacoustic models to g(co). This is only a problem for thecalculation of thermodynamic properties at low temper-ature (Z < 50 K), which is lower than the range of interestof most mineral scientists.
The heat capacity at constant volume, Cr, can be cal-culated readily from the internal energy:
/ar\t': lar),
: k" I lw*7' *' (o+J g(cu)da,. (5)The heat capacity at constant pressure, C", is the exper-imentally determined quality. It can be derived ftorn C,using the isotropic thermal expansion coefficient, a, andthe isotropic compressibility modulus, B:
n(,,;,r): {.-[#r] - r]
'(3)
Cr: C, * TVoa2B-t (6)

WINKLER ET AL.: LATTICE ENERGY AND LATTICE DYNAMICS 3 1 5
where Zo is the molar volume at 298 K and I bar. In ourcalculations of the heat capacities, we used experimentalvalues for the coefficients a and B. They could in fact havebeen calculated from a lattice dynamics calculation (Priceand Parker, 1988) within the quasi-harmonic approxi-mation using the Grtineisen approach. However, suchcalculations are rather lengthy, and, for the purposes ofthis paper, the effort expended on these calculations wouldnot be justified. Instead, when we compared calculatedand measured heat capacities, it should be consideredthat we really compared C, rather than C.. In any case,the differences between these quantities are never largeat the temperatures we considered. It should be stressedthat we used thermodynamic quantities in this paper, notto test the basic model, but to show that our model iscapable of giving thermodynarnic information for manycases ofinterest.
The Helmhollz free energy, F, for a vibrating crystalhas been given by Born and Huang (195a):
f [ r IF : e -
J 1i n, + kBr rnln(r, OJ fe(,) d,. (7)
The entropy, S, is then
s : - d F" d T
.g(<,r) d<,r. (8)
Phase boundaries can be determined by the Clausius-Cla-peyron equation. We neglect the pressure dependence ofthe entropy term and write
dP a^s(r)dr: ^i(i'3,' (e)
Implicit in the applications of these equations is the as-sumption that g(<.r) is independent of 7 and P. This im-plies the neglect ofphonon frequency renormalization dueto anharmonic effects. Although experimentally it isknown that the individual phonon frequencies do varysignificantly with 7' and P, the overall effect on g(o,) ismuch smaller. Moreover, for calculations of phaseboundaries, the important aspects are the differences be-tween g(<o) ofdifferent phases, and these are expected tobe even less sensitive to changes in ?"and P.
THn rNrpuroMrc poirENTrAL MoDEL
The basic interatomic potential model has been de-scribed by Catlow (1988). O ions are modeled using thecore-shell model, where a massless shell is linked to thecore by ideal harmonic interactions of the form
where d is the separation between centers of core andshell. Polarization effects are therefore taken into ac-count, enabling the high frequency dielectric constant tobe correctly evaluated.
Pair interactions between neighboring O shells aremodeled using a Buckingham potential:
( l l )
where r is the interionic distance. The same potential isused for Si-O interactions, where the interaction involvesthe O shell and a rigid Si ion.
Al-O pair interactions are modeled using a Born-Mayerpotential:
v( i : -1* B ".e(- ,
e(r) -- B*r(-,
e(o):+k@ - oo)2
(r2)
where the interaction is between a rigid Al ion and the Oshell. The same potential was used for Al in all coordi-nations. All other cation-O pair interactions are modeledsimilarly. Electrostatic Coulomb interactions are evalu-ated using formal charges. Covalent effects are simulatedusing three-body bond-bending interactions. They havethe form
: h I {t, , trt , ty +)rn*-, O + rr}
( l 3)
where 0 is the O-Si-O or O-AI-O bond angle, do being therespective angle in an undistorted polyhedron.
The values for the parameters in Equations 10-13 aregiven in Table l. The values for Si-O and O-O interac-tions have been taken from the work of Sanders et al.(1984) on quartz. Following Jackson and Catlow (1988),we have taken the values for Al-O interactions from Cat-low et al. (1982) and have used these values for all co-ordinations. The value for k in Equation 13 was consid-ered to be the same for all Al coordinations and equal tothe value for O-Si-O interactions. Only the value of dowas modified for different coordinations. We have mod-ified the value of Kin Equation 10. Parameters for Ca-Oand K-O interactions have been taken from the MEGcalculations of Post and Burnham (1986). The parame-ters for the Mg-O interaction could have been taken fromthe same source; instead, we used the same values usedby Price and Parker (1988) and Dove (1989). Dove (1989)has pointed out that these potentials give similar results.
O-H potentials were adapted by us from the work ofCollins and Catlow (1990), who used a modified Morsepotential ofthe form
9(r) : e{1.0 - exp[-a(r - p)l]' - e - 9a"r.-6. (14)
The parameters for Equation 14 are also given in Ta-ble l.
The SLEC and HLDC were performed using the pro-grams THB-REL and THB---PHON, respectively, whichexplicitly include the interactions described above. Theseprograms evaluate the Coulomb contribution to the lat-tice energy using the Ewald method. THB-REL uses a
e@ : tKd' (10)

3 1 6 WINKLER ET AL.: LATTICE ENERGY AND LATTICE DYNAMICS
p ClA l [ eVA1 Re f . n
0.3205 10.6616 t1l0.3012 0.0 I2l0.29912 0.0 t310.2130 0.0 t410.2516 0.0 t410.2945 0.0 I510.149 27.88 I110.2s 0.0 16l
Short-range interactions: moditied Morse type between cores5q p
lA-'l tAlH0426+-O1426 7.0525 2.1996 0.9495 l2l
Shell-core interaction between O shell and O core6K
lev A*l
OAoeeo2 - O2@@ 60.00Three-body bond-bending interactionsT
k d "[evrad ,]
TABLE 1. Potential parameters used in this workl
Short-range inleractions: Born-Mayer or Buckingham type betweencation cores and O shells,
strains are coupled automatically give the relaxation ofthe structure under strain, ensuring that all the contri-butions to the elastic constants are correctly evaluated.
Sorvrn GENERAL oBsERvATroNS
We found that some complex structures containing Alcoordinated by more than four O atoms could not besuccessfully relaxed without taking the covalent bond-bending effects into account. We found that our best modelfor six-coordinated Al includes O-AI-O three-body bond-bending interactions for all O-O distances tess than 3 Awith do : 90" in Equation 13, whereas the parameter k inEquation l3 is the same as for tetrahedrally coordinatedAl and Si (Table l). We found that, in the case of five-coordinated Al in andalusite, the best model included thebond-bending term with 0o: 95o. We should remind thereader that identical Born-Mayer Al-O pair interactionswere used for all coordinations.
When using a force constant, K:74 eV A-t, for thecore-shell interaction in Equation I 0 (Sanders et al., I 9 84),we found that our calculations ofthe high-frequency di-electric constant gave values that were generally approx-imately 20o/o too low when compared with experimentaldata. For example, the average observed values for an-dalusite and kyanite are 2.7 and 3.0, respectively (valueshave been taken as the squares of the average refractiveindices given by Deer et al., I 966), and the correspondingcalculated values are 2.2 and 2.5. A decrease of the valueofthis force constant to 60 eV A-' gave improved results,not only for the high-frequency dielectric constants (newvalues for andalusite and kyanite are 2.54 and 2.88), butalso for most of the basic structures and the elastic con-stants, although for some structures the changes weresmall. We note that the introduction of a further valuefor a potential parameter might be confusing, but we be-lieve that our results justify this. However, our new valueis not an optimized value and, therefore, should be im-proved upon in any future attempt to develop the poten-tial model.
A lroonr. FoR Al-Si DTsoRDER ANDSOLID SOLUTIONS
In some of the systems we have studied there is siteoccupancy disorder, such as in disordered Al-Si arrange-ments or as in a solid solution. In order to model thesecases, we have devised a simple recipe to construct effec-tive interactions from the pure interactions as given inTable l. In our formulation, the fraction of atom type Ion a site is x, so that the fraction of type 2 is (l - ;r).The effective charge is thus
Q*n: xQ, + Q - x)Qr. (l s)The effective A parameter for the r 6 interaction in theBuckingham potential of Equation I I is similarly grven by
A,n: xA, + ( l - x)Ar . (16)
The effective Born-Mayer coefrcients B and r for ijqua-tions I I and 12 were determined by setting the first and
Alevl
si4+_02-si4+_01426-Al3+ _ or-K* - O'-Ca,+ - O,Mg'?+ - O'?o - - 02 -H * - O 2
1 283.9073999.98
1460.365269.716958.31428.5
22764.O31 1.97
f
levl
0202-
_ or-_ 0 2
rlt1 l- Sio*
- Al3*2.09724 109.472.09724 90.95. 109.478
IeV units are quoted as these are the units used by THB-REL. 1 eV: 96.484 kJ mol-'.
'? Defined by Equations 1 1-12.3 The charges used are given in the ion description, in units of the electron
charge.4The references cited are: [1] Sanders et al. (1984), [2] Collins and
Catlow (1990), [3] Catlow et al., (1982), [4] Post and Burnham (1986), tslPrice and Parker (1988), [6] Abbott et al., (1989a, 1989b).
5 Defined by Equation 14.6 Defined by Equation 10.? Defined by Equation 1 1 .8 The three values given tor the three-body O-AI-O bond-bending inter-
actions refer to octahedral, irregular five-, and tetrahedral coordination,respectively.
standard Newton minimization technique for the latticerelaxation. THB-REL does not use symmetry, and theminimizations are performed assuming triclinic (Pl)symmetry. Thus, ifthe relaxed structure contains a highersymmetry (e.g., equal cell lengths or atoms in a specialposition) the symmetric structure represents a globalminimum and not a minimum under any constraints.The only condition imposed is the number of atoms inthe unit cell and, in practice, the topology of the structure.In all cases where a structure with a symmetry higherthan Pl was obtained, we report only the symmetricallyindependent parameter values rather than duplicateequivalent quantities. We found that, in these cases, celllengths were calculated to be equal with precision fargreater than that given in the tables, and that deviationsfrom special angles, 90'or 120', did not appear in thefirst ten digits. Degenerate phonon frequencies deviatedby less than l0 5ol0.
THB-REL automatically calculates the complete elas-tic constant tensor. The components are evaluated in theprogram from the strain derivatives ofa series expansionof the lattice energy in terms of lattice and internal strains.The terms in which the lattice strains and the internal

WINKLER ET AL.: LATTICE ENERGY AND LATTICE DYNAMICS 3r7
second derivatives ofthe effective interaction equal to theweighted averages of the derivatives of the componentinteractions for the observed bond length r: ro:
(r7)
la,p-") /a,p,\ /a,c-\r - r : y r - - ; l + ( l - x ) l - l ( 18 )\ 0r ' l , : ,o
' " \0r- 1, -o \dr . / , ,o
This gives the following relations for p.,, and 8",r..
^ _xpltB,exp(-ro/p,) + (l - x)p;tBrexp(-ro/pr)t'* -
( le)
p _xpltBrexp(-ro/p,) + ( l - x)prtBrexp(-ro/pr)pelr'"-p(-rlArJ
(20)
This formalism can be readily extended for cases involv-ing more than two atom types. It should be noted thatalthough this method should give reliable diferentials ofthe effective potential, and hence for equilibrium struc-tures, it is not expected to give accurate values for theeffective energy, since the energy has not been incorpo-rated into the method. However, we will find that thismethod still gives good results for the energy of mixingin a solid solution.
Tnn AlrSiOs poLyMoRpHS
There are three AlrSiO, polymorphs: andalusite (Pnnm),sillimanite (Pbnm), and kyanite (PI). In all three struc-tures there are Z : 4 formula units per unit cell; for ourpurposes, the significant difference among the three struc-tures is in the coordination of one of the Al atoms, asdescribed earlier. The structures of the AlrSiO, poly-morphs are therefore a good test of transferable Al-Opotentials. Moreover, the calculation of the AlrSiO, phasediagram was seen as a test of whether our model couldreproduce the relatively small differences in the thermo-dynamic properties of the polymorphs. This is importantfor the application of SLEC and HLDC in equilibriumthermodynamics as needed in petrology.
Because of the use of the AlrSiO, polymorphs as pet-rogenetic indicators, a number of experimental studieshave been performed to determine the positions of theunivariant reaction boundaries and the triple point ofthissystem. Robie and Hemingway (1984) summarized pre-viously published work and determined the thermody-namic properties of all the polymorphs. Furthermore, theyredetermined the AlrSiO, phase diagram (Fig. I and Ta-ble 2). There are difficulties in determining the reactionboundaries accurately, due to small differences in the re-spective Gibbs free energies, kinetic problems, and influ-ence of defects and fibrolitization, as discussed by Saljeand Werneke (1982a,1982b) and Salje (1986). To over-come these problems, Salje and Werneke (1982a, 1982b)
0400 600 800 1000
Temperature IK]Fig. l. The phase diagram of AlrSiOr. The experimental data
(thin lines) are from Robie and Hemingway (1984). The resultsfrom our calculations (model I and model 2, see text) are givenas thick lines. The boxes and connected circles indicate the rangeof experimental data, as given by Robie and Hemingway (1984).
used infrared (IR) and Raman spectroscopic data in acalculation of the phase boundary between sillimanite andandalusite, and they estimated that the triple point occursaround 643-663 K and 3.0-3.2kbar, excluding all effectsdue to lattice faults and Al-Si disorder. Salje (1986) mea-sured heat capacities of samples of andalusite and silli-manite of different origins. He determined the influenceof fibrolitization on the P, 7 dependence of the univariantreaction curve between andalusite and sillimanite. Usingthe previously published standard entropy of andalusite(Robie and Hemingway, 1984) and a standard entropyfor sillimanite calculated from Raman and IR spectro-scopic data, Salje (1986) determined the triple point in asystem containing ideal sillimanite to be at 715 K and3.2kbar, whereas the measured triple point of bulky sil-limanite was determined to be at 795 + l5 K and 4.2 +0.2 kbar. The possibility of Al-Si disorder in sillimanitehas been a controversial subject (Ribbe, 1982), but Hol-land and Carpenter (1984) concluded that "stoichiomet-ric sillimanite is ordered at all geological temperatures."We therefore did not include anv Al-Si disorder in ourmodel.
10
(#), " :,(*),,,+ (, - o(*),-,"
L(ultl.
lsq r -
3ooot
SILLIMANITE
ANDALUSITE ,O\'d

3 1 8 WINKLER ET AL.: LATTICE ENERGY AND LATTICE DYNAMICS
TABLE 2. Comparison of the experimentally determined and the calculated phase diagram of the AlrSiOs polymorphs
Thermal expansion coefficients, a, and compressibilities, pAndalusite Sillimanite Kyanite
o (10s K 1)
B (kbar ')
7 9 0 + 2 5 K693 - 713 K715 K800 K750 K
And-Sill
And-KySill-Ky
2.394 1.3860.67 0.65
Ueasured and calculated values for lhe triple point4.0 + 0.5 kbar (Robie and Hemingway, 1984, exp)3.0 - 3.2 kbar (Salje and Werneke, 1982a, 1 982b, calc)3.2 kbar (Salie, 1986, ideal sillimanite)4.2kbar (this work, model 1)4.0 kbar (this work, model 2)
Slopo of univariani reaction boundariesExperimental Model 1
2.5960.70
Model 2
-19.5 bar/K-13.5 bar/K
1 1.8 bar/K2O.1 batlK
090 < r< 850 K)(r> 850 K) -19.2barlK
17.6 bar/K26.3 bar/K
-13.3 bar/K17.ObatlK45 bar/K
Note; The thermal expansion coefficients, d, were calculated from the molar volume data at 298 and 873 K from Winter and Ghose (1979); themmpressibilities, B, were taken from Brace et al. (1969); the slopes of the experimentally determined reaction boundaries are those given by Robieand Hemingway (1984).
We found that, in order to model the different struc-tures of the polymorphs successfully, it is necessary toinclude a bond-bending term for all Al polyhedra. Thecalculated lattice parameters deviate only in one case bymore than 2o/o (Table 3) from the experimentally deter-mined data, and we note that the cell angles for triclinickyanite are calculated to within 0.6". The calculated atomiccoordinates are compared with experimental data in Ta-bles 4-6. The agreement is generally good. The majordiscrepancy is that the model underestimates the lengthof the anomalously short O(3)-O(3) distance. The cal-culated value of 2.06 A is considerably less than the ex-perimental value of 2.26 A. This contact occurs withinthe five-coordinated Al polyhedron and points to inade-quacies in the model at this point. Further investigationshowed that the value for do used in the calculations isclose to the optimum value, suggesting that improve-ments to the model will lie in f,nding a better value forthe strength of the bond-bending force constant for this
coordination. The calculated elastic constants of anda-lusite and sillimanite are compared in Table 3 to mea-sured values (Vaughan and Weidner, 1978); no experi-mental values are available for kyanite. The agreement isreasonably good, taking into account the fact that onlythe off-diagonal elements of the elastic constant tensordeviate by more than 150/o from measured values in an-dalusite. The only major discrepancy is for C, in silli-manite; there are, however, no two independent experi-mental studies available. As we are confident in thepredictive value ofour calculations, we also give our cal-culated values for the diagonal elements of the elasticconstant tensor for kyanite (Table 3).
The calculated vibrational frequencies can be com-pared with spectroscopic data. The experimentally deter-mined frequency range for optic modes at the I point is87- l l13 cm-r for andalus i te and 70-1170 cm ' for s i l -limanite (Salje and Werneke, 1982a, 1982b). The calcu-lated frequencies range from 87 to 1012 cm ' for anda-
Tlele 3, Comparison of experimental and calculated lattic€ parameters, molar volumes (y), and maindiagonal components of theelastic tensor (q,,, units of Mbar) for the three AlrSiOu polymorphs
Andalusite Sillimanite Kyanite
exp exp
a (A)b (A)c (A)c (')pf )r (')Y(cm3 mol 1)
7.79807.90315.5566
90.090.090.051.58
exp
7.7557.8083.CCO
90.090.090.050.67caE
7.48837.68085.7774
90.090.090.0s0.049
exp
7.2717.5145.862
90.090.090.048.23carc
7.'t2627.85205.5724
89.99101.1 1106.0344.22exp
6.9767.8295.589
90.55101.37106.1643.16calc
2.352.893.801.000.881 . 1 2
2.642.544.380.850.811.20
2.872.323.881.220.810.89
2.8s2.775.391.300.890.85
3.794.395.032.111.051.02
cr"ceCnoCuuc6
Note.' Experimentally determined lattice parameters were taken from winter and Ghose (1979). Measured elastic constants are from Vaugh,rn andWeidner (1978).

WINKLER ET AL.: LATTICE ENERGY AND LATTICE DYNAMICS
TABLE 4. Observed and calculated fractional atomic coordinates of andalusite
3 1 9
f* f*t
A(1)A(2)s(1)o(1)o(2)o(3)o(4)
0.00.37050.2460o.4233o.42460.10300.2305
0.00.1 3910.25200.36290.36290.40030.1339
0.24190.50.00.50.00.00.2394
0.00.36800.23560.44170.42090.09750.2210
0.00.13950.25440.35550.36ii!90.41040.1438
0.24590.50.00.50.00.00.2315
Nofe: Observed values were taken from Winter and Ghos€ (1979).
lusite and ftom 52 to 1053 cm ' for sillimanite; in general,we have found that the calculations give frequencies thatare slightly lower than experimental data, as in this case,Detailed comparisons of the I point frequencies withspectroscopic data and of the low-frequency dispersioncurves with new inelastic neutron scattering data for an-dalusite are given in Winkler and Buehrer (1990). Theoverall comparison shows that the model gives a reason-able representation of the phonon frequencies for allwavevectors.
The HLDC results were used to calculate the thermo-dynamic properties of andalusite and sillimanite. A com-parison of experimental data for the heat capaeities, aspublished by Salje and Werneke (1982a,1982b), is givenin Figures 2 and 3. The agreement between calculationand experiment is very good if the sampling is performedover more than one point in the Brillouin zone; for theAlrSiO, polymorphs, we used the I point and seven pointson the faces of the Brillouin zone, (0 0 y2,0 Yz t/2, t/z Vz t/2,etc.). Deviations from the expected behavior at T < 50K are due to the coarse sampling of the Brillouin zone(see above).
We calculated the phase diagram of the system usingtwo models. Model I was based on the molar volumestaken from Robie and Hemingway (1984), whereas mod-el 2 was based on the molar volumes from our SLEC.The respective values are given in Table 3. In both mod-els, the same thermal expansion coefficients for the poly-morphs and the same compressibilities were ernployed.
Tlsr-e 5. Observed and calculated fractional atomic coordinates of kyanite
The former were calculated from the molar volumes ofthe polymorphs at 298 and 873 K as given by Winter andGhose (1979), and the small temperature dependenciesof the thermal expansion coefficients were neglected. Thecompressibilities were taken from Brace et al. (1959). Therespective values are given in Table 2. Equilibrium pointswere taken to lie on the andalusite-sillimanite boundaryat 1048 K and I bar and on the andalusite-kyaniteboundary at 656 K and 2.4 kbar. The AS(7) was takenfrom our HLDC. The calculated phase diagrams are com-pared to the one grven by Robie and Hemingway (1984)in Figure I and Table 2. The sillimanite-kyanite curvedid not cross the triple point as determined by the kya-nite-andalusite and andalusite-sillimanite reaction curyesin either of the models when we used any of the equilib-rium points given by Robie and Hemingway (198a). Thetriple points using the kyanite-sillimanite and andalusite-sillimanite reaction curves would be at approximately 890K and 4 kbar in model 1 and at 890 K and 2 kbar inmodel 2. In general, model I shows a satisfactory agree-ment for all three univariant reaction boundaries. where-as model 2, although giving reasonable kyanite-andalu.site and andalusite-sillimanite reaction curves, yields akyanite-sillimanite reaction curye with far too steep aslope.
We conclude that the model used in the present studymay be used in equilibrium thermodynamic studies, pro-vided that additional experimental data for thermal ex-pansions, compressibilities, and molar volumes are avail-
/.* 1"""A(1)A(2)A(3)A(4)s(1)s(2)o(1)o(2)o(3)o(4)o(5)o(6)o(7)o(8)o(s)o(10)
o.32540.29740.09980.1 1200.29620.29100.10950.12300.27470.28310.12190.28220.29150.50080.1 0840.5015
0.70400.69890.38620.91750.06490.33170.14680,68560.45450.93s40.63070.44530.94670.27490.15200.2312
0.45820.95050.64030.1 6490.70660.1 8920.1 2880.18120.95470.93530.63890.42880.46590.24400.66690.7553
0.33480.30330.1 004o.1174o.29470.28710.09640.12340.28380.29610.12350.29110.30680.49240.09670.4937
0.70610.70060.38250.92300.05830.3i1650.14820.0845o.45840.93750.632s0.44760.949s0.26200.14350.2417
0.46070.95180.63670.16890.70910.1828o.12370.18250.94s10.94910.04090.43460.46460.23760.65630.7585
Notei Observed values were taken from Winter and Ghose (1979).

320 WINKLER ET AL.: LATTICE ENERGY AND LATTICE DYNAMICS
Tlele 6, Observed and calculated fractional atomic coordinates of sillimanite
A(1)At(2)Sio(1)o(2)o(3)o(4)
0.00.14'170.15330.36050.35690.47630.1252
0.00.3449o.34020.40940.43410.0015o.2230
0.0o.250.750.750.250.750.5145
0.00.13720.1 5300.3663o.35740.47260.1246
0.00.34410.33300.40120.43670.99980.2176
0.0o.250.750.750.250.750.5129
Note; Observed values were taken from Winter and Ghose (1979).
able. As discussed above, it should, in principle, bepossible to determine these quantities from free energyminimization calculations (Parker and Price, 1989; Col-lins and Catlow, 1990). One difficulty in the present caseis that we expect different energies for four-, five-, andsix-coordinated Al because of covalent effects that themodel does not attempt to handle-the model is reallyonly designed to get the first and second differentials cor-rect. We therefore cannot expect to be able to comparethe energies ofthe three phases and have had to includeexperimental state points in our calculation of the phaseboundaries. Price and Parker (1988) did not face thisproblem in their determination of the olivine-spinel phasediagram.
1 6 0 ANDALUSITE
120
1 0 0 2 0 0 3 0 0 4 0 0 5 0 0
Temperature [K]Fig. 2. Comparison of the experimentally determined heat
capacity (C,) of andalusite (points, Salje and Werneke, 1982a,1982b) with calculated values (line). The deviation from the ex-pected behavior at T < 50 K is due to the coarse sampling ofthe Brillouin zone (see text).
Dropsror
Diopside, CaMgSirOu, is a good example of a chainsilicate (C2/c, Z: 4). SLEC, using models almost iden-tical to those used in this study, have recently been dis-cussed in some detail (Dove, 1989). The bond-bendingpotentials are essential in order to reproduce accuratelythe details of the structure, particularly with regard to thebond angles within the silicate chains, the Mg and Cacoordination, and the relative Si-O bond lengths forbridging and dangling bonds. Diopside has proven to bea demanding challenge for modelers (e.g., Post and Burn-ham, 1986).
We have performed additional calculations for diop-side using our new value for the parameter Kin Equation10, and have also included diopside in this paper because
SILLIMANITE
120
o 100 200 300 400 500
Temperature [K]Fig. 3. Comparison of the experimentally determined heat
capacity (C,) of sillimanite (points, Salje and Werneke, 1982a,1982b) with calculated values (line). The deviation from the ex-pected behavior at T < 50 K is due to the coarse sampling ofthe Brillouin zone (see text).
160
YoE?
o(ECL(EoGoI
8 0
4 0
YoE.?
=o(ECL(E()
(soI
8 0
40
0

WINKLER ET AL.: LATTICE ENERGY AND LATTICE DYNAMICS
TABLE 7. Comparison of observed and calculated structure and elastic constants of diopside
Unit-cell parameters
321
a (A)b (A)c(A)B f )
9.7468.8995.251
105.63
9.51978.70965.1 496
104.47Atomic fractional coordinates
SiMgCao(1)o(2)o(3)
0.09330.90820.30150.08730.25000.0176
calc
0.28500.00.00.1 1050.35850.3615
0.09700.905s0.30570.0936o.25710.0213
0.2304o.250.250.14420.32880.9950
calc
0.28620.00.00.1 1 560.36110.3505
obs
0.22930.250.250.14220.31800.9953
Elastic constants (Mbar)
0.770.810.570.170.070.430.07
't.201.060.850.200.040.620.04
Ct"C""
cr"
Coa
2.681.992.720.650.800.98
2.231.712.3s0.740.670.66
c.,
Vs
c4cu,
/vote.'Observed structural data were taken from Clark et al. (1969); elastic constant data are from Levien et al. (1979).
we wanted to include diopside, as a chain structure, inthe data base for more detailed analysis. The results forthe calculated equilibrium structure are given in Table 7,where they are compared with the results of the structurerefinement of Clark et al. (1969). The differences fromthe results of previous calculations (Dove, 1989) are onlyslight, but nevertheless represent a modest improvementon the agreement with experimental data. We recall thatthe conclusion reached from the previous calculations(Dove, 1989) was that the chain structure, differences inthe Si-O bond lengths, and the Mg and Ca coordinationscan all be reproduced by the model; this conclusion holdswith the modified core-shell interaction parameter.
ConorrnrrB
Cordierite (MgrSirAloO,r) is of interest because it existsas either of two polymorphs, an ordered orthorhombicphase (Cccm, Z : 4) or a hexagonal phase with Al-Si sitedisorder (P6/mcc, Z:2). We have modeled both phases.
Hexagonal cordierite contains two nonequivalent tet-rahedral sites: site I [denoted T(l)] with % Al and 24 Si,
TABLE 8. Crystal structure of hexagonal cordierite
and site 2 [denoted T(2)] with 2/t Aland Yr Si (Dove et al.,in preparation). Effective interactions were constructedusing Equations 15-20 for both sites. The calculatedequilibrium crystal structure for this model is comparedwith the experimental structure (Dove et al., in prepara-tion; Armbruster, 1985) in Table 8. The agreement issatisfactory. It should be noted that the energy minimi-zation was performed starting from an orthorhombicstructure with only two types of tetrahedral sites. Thatthe energy minimization yielded the hexagonal structureshows that the observed phase transition to the ortho-rhombic phase is triggered only by Al-Si ordering. Thisis consistent with kinetic observations but is different fromthe case ofleucite (see below).
Coordinates and other data for the relaxed structure ofthe fully ordered orthorhombic form are compared withthose of the experimental structure (Dove et al., in prep-aration;Gibbs, 1966; Cohen etal.,1977) in Table 9. Thereis again satisfactory agreement. But ofgreater significancethan the comparison of the absolute structures is the cal-culation ofthe distortion ofthe structure ofthe ordered
Unit-cell parameters
a (A)c(A)
9.76839.3408
Xox
9.85489.1 134
Atomic flactional coordinate3
V4V4
V4U4
Mgr(1)r(2)o(1)o(2)
V3Y2
0.37240.48530.2304
Cath
0.26620.34920.3081
00.1 4390
t/3
Y20.36930.48460.2315
2h
V20.26280.34610.3080
0o.14790
Note.'Observed values are trom Dove et al. (in preparation), which are consistent with Armbruster (1985). T denotes a tetrahedral site.
322 WINKIER ET AL.: LATTICE ENERGY AND LATTICE DYNAMICS
TffiLe 9. Data for the crystal structure of orthorhombic cordierite
Unit-cell parametersca|c
a (A)b (A)c(A)es
17.04489.71279.3i]180.00655
Xo*
17.',t6749.75179.06610.00813
Atomic fractional coordinate3
MgA(1)A(2)s(1)s(2)s(3)o(1)o(2)o(3)o(4)o(s)o(6)
0.33720.250.05110.00.19270.13490.24610.0630
-0.17300.04390.12160.1636
0.00.250.30800.50.0789
-0.2363-0.1029-0.4152-0.3100-0.2515
0.1863-0.0800
0.250.25410.00.250.00.0o.35720.34940.35850.00.00.0
0.33670.250.05030.00.19130.13190.24660,0637
-0.17000.04050,12180.1713
0.00.250.30310.50.0766
-0.2355-0.1001-0.4144-0 .3110-0.2351
0.1829-0.0844
0.250.25370.00.250.00.00.35390.34830.3s380.00.00.0
Nofe.-Observed data are from Dove et al. (in preparation), which are consistent with Gibbs (1966) and Cohen et al. (1977); es is the spontan€ousstrain defined by Equation 21.
phase from the hexagonal structure of the disordered form.This is quantified by the spontaneous stfttin, e., defined as
a - \/tbo : -v s
a + $ b
where c and b are the orthorhombic unit-cell parameters(a - l\b in the hexagonal phase). The calculated andobserved values of es are, respectively, 0.0081 and 0.0066(Dove et al., in preparation). The sizo of this strain isslightly smaller than the differences between the calculat-ed and observed cell lengths and thereby provides a sub-lle test of the predictive ability of these models. Theagreement between the calculated and observed Yalues ofe. is encouraging.
GBur-nxrrB
The crystal structure of gehlenite, Ca'AlrSiO', is te-tragonal (P42rm, Z : 4).The main feature of the struc-ture is that it is composed of layers of five-memberedrings of tetrahedra, with Ca in the large gaps between thelayers. These features make gehlenite a useful system for
testing transferable potential models. There are two dis-tinct tetrahedral sites in the structure. The first site, T(l),is at the origin of the unit cell and has 4 symmetry. Crys'tal structure analysis has shown that this site contains Al(Kimata and Ii, 1982; Swainson et al., in preparation).The second site, T(2), is disordered, containing Yz Al andYz Si. The effective potential for this site was again cal-culated from Equations 15-20. The results ofthe SLECare given in Table 10, where they are compared withthose of the observed structure (Swainson et al., in prep-
aration; Kimata and Ii, 1982). The agreement is reason-able, and the model correctly reproduces the differentT(2)-O bond lengths. The model also reproduces the Cacoordination satisfactorily.
Lnucrrr,Irucite, KAlSirO6, is a framework structure (I4r/a, Z
: 8), which is an ideal system for testing modol potentialsbecause the tetragonal structure is a slight distortion froma high-temperature cubic structure (Im3m, Z : 8). Agood model, therefore, should be able to reproduce this
(2r)
Tmr-e 10. Crystal structure data for gehlenite
Unit-cell parametero
a (A)c(A)
7.68505.0636
Xou
7.59154.8964
Atomic fractional coordinategf*
Car(1)r(2)o(1)o(2)o(3)
0.3389o,'t4340.00.50.14280.0876
0.16110.35660.00.0o.35720.1 676
0.51040.95400.00.17650.28350.8077
0.34070.14260.00.50.14060.0928
0.15930.35740.00.00.35940.1 649
0.51720.95720.00.1963o.29970.7953
Note..Observed data are from Swainson et al. (in preparation), which are consistent with Kimata and li (1982). T(1) is occupied by Al and T(2) is
occupied by Alo.Sio", as described in the text.
WINKLER ET AL.: LATTICE ENERGY AND LATTICE DYNAMICS 323
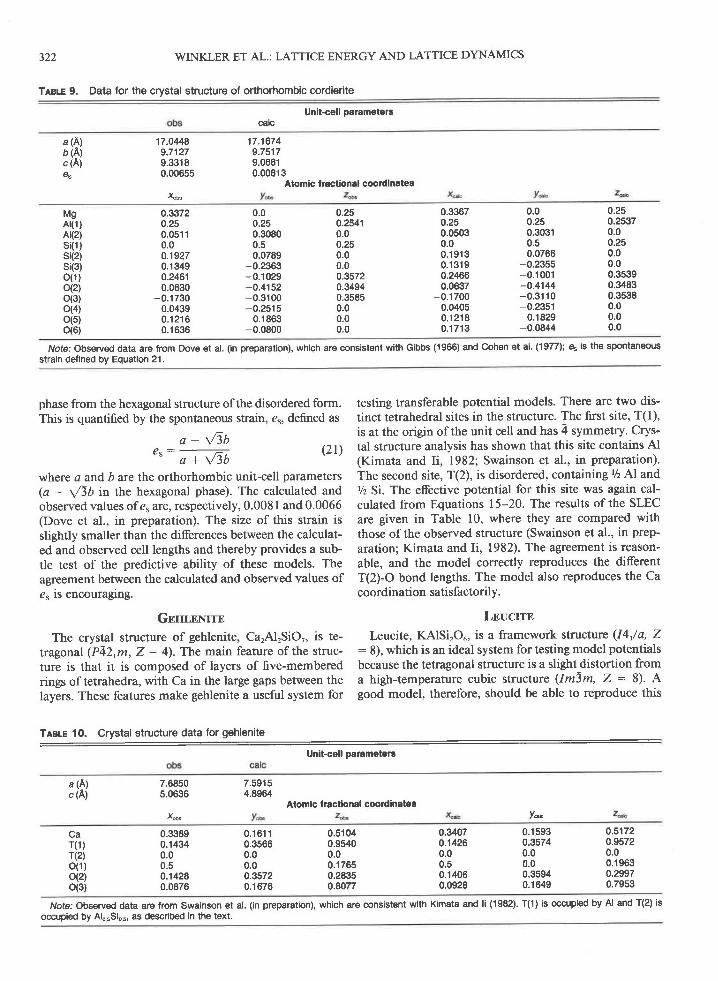
Fig. 4. Projection down I I I l] of the structure of leucite: (a) observed tetragonal structure at room temperature, @) calculatedtetragonal structure, (c) observed cubic structure. The comparison ofa and b shows that our model has reproduced the tetragonaldistortion from c. observed structure data are from Dove and Palmer (in preparation).
small distortion. In the cubic phase (which is stable above940 K), there is only one symmetrically distinct tetrahe-dral site, so this phase must have no long-range Al-Si siteorder. There are no other sites (e.g., octahedral) in eitherphase for Al or Si atonns. The cubic-to-tetragonal phasetransition occurs much faster than would be expected fora transition due to Al-Si ordering (Palmer et al., 1989;Palmer et al., 1990; Heaney and Veblen, 1990). There-fore, we would expect the tetragonal phase to remain dis-ordered. This has been confirmed by diffraction experi-ments (Mazzi et al., 1976; Grogel et al., 1984; Dove andPalmer, in preparation), which are sensitive to long-rangeorder, although there is evidence (albeit contradictory)for the existence ofshort-range order from nuclear mag-netic resonance experiments (Brown et al., 1987; Mur-doch et al., 1988; Phillips et al., 1989).
Effective interactions for the tetrahedral sites were con-structed assuming complete Al-Si disorder [i.e., each sitecontains (Al + 2Si)/31 and using one mean bond lengthobtained from the three sites in the tetragonal structure.It should be noted that leucite is our only example thattests the K-O potential parameters.
The tetragonal structure could be relaxed easily, sinceit is the stable leucite structure. A straightforward energyminimization allowing for changes in the cell volume wasnot possible because the cubic structure is unstable withrespect to the tetragonal distortion and the programTHB-REL does not incorporate the use of constraintson the symmetry of the structure or on the shape of theunit cell. We therefore carried out a number of constant-volume energy minimizations of the cubic structure, us-ing different unit-cell edge lengths. We then fitted theminimum eneryies to a fourth-order polynomial in thecubic unit-cell edge length. The strain-free unit-cell edgelength was obtained from the minimum of this polyno-mial, and another structure relaxation was carried out
using this value for the unit-cell edge length. The resultsof this energy minimization confirmed that the relaxedstructure was actually free of all residual stresses.
The results ofSLEC for both the tetragonal and cubicphases are given in Table I l, where they are comparedwith observed results (Dove and Palmer, in preparation;Mazzi eI al., 1976; Grogel et al., 1984). The details arebest discussed with reference to Figure 4, which showsthe [ 1 l] projection ofthe tetragonal phase as determinedby experiment and as given by SLEC, together with thesame projection of the cubic phase as determined by dif-fraction data. This projection highlights the loss of thethree-fold axis on transformation from the cubic to thetetragonal form. The key features to note are the distor-tion of the six-membered ring of tetrahedra surroundingthe [Il] axis and the off-centering of the K ions. Bothof these features are reproduced remarkably well in ourcalculations.
The transition also involves a change in volume and aspontaneous strain (Palmer et al., 1989). Palmer et al.(1989) define the two strain parameters e^and eri
(22)
(23)
where c and c are the tetragonal unit-cell lengths, ao isthe actual cubic unit-cell length, and do is given by
c - t 2 ad o : (24)
The d. would be equal to a. if the transition were purelyferroelastic, but experimentally it is found that these twoquantities have very different values. Hence e, gives ameasure of the pure ferroelastic strain, and e" gives a

324 WINKLER ET AL.: LATTICE ENERGY AND LATTICE DYNAMICS
TABLE 11, Crystal structure and spontandous strain parameters of leucite
Unit-cell parametels and spontaneous strain parameterscalc
a (A)c (A)ao (A)-a. (A)-e3'e.'
13.089713.753014.38*13.31080.03320.013
1 2.988413.80001 3.644411 3.25890.04080.0291
Fractional atomic cooldinates fot the tetragonal phase
Kr(1)+r(2)+r(3)+o(1)o(21o(3)o(4)o(5)o(6)
0.36630.05820.16850.39330.1308o.09270.1 4550.1342o.28920.4841
obs
0.36540.39670.61240.64060.31360.51050.67900.6839o.57730.6175
0.'11710.1 6540.12790.08630 . 1 1 1 10.1310o.22690.03580.12120.1 665
0.36590.05630.1 6680.3929o.13270.08810.1 4590.1 3250.28940.4839
0.36310.39710.61 150.64070.31620.51350.68190.68570.57330.6161
0.1 0730.16710.12690.08480.1 0970.1 3290.22570.03590.1 1 830.1 658
Mean T-O bond lengths (in A) for the tetragonal phase$calc cubic phase
r(1)-or(2)-or(3)-o
1.642(17)1 .648(1 0)1 .658(1 2)
Xo*
1.646(6) 1.622(2)1 .654(1 5)1.663(4)
Atomic coordinates tor the cubic phase
Kr+
0.3750.08780.1 329
0.3750.3750.2806
0.125o.16220.1034
0.3750.08770.1 354
0.3750.3750.2813
0.1250.1 6230.1035
A/ote.'Observed data are from Palmer et al. (1989) and Dove and Palmer (in preparation). The observed structure data are consistent with Mazzi etal. (1976) and Grogel et al. (1984).
'Quantities defined in the text by Equations 22-24..* Value obtained by extrapolation trom high temperature data.f Value obtained from energy minimization of cubic structure.+ T denotes disordered tetrahedral site containing Alr^Si2is.$ Quantities in brackets give standard deviations over four bond lengths.
measure of the nonferroelastic strain. Most of the volumechange associated with the phase transition is due to thenonferroelastic strain e..
The observed and calculated values for these strainquantities are given in Table I l. Although the calculatedvalue of the ferroelastic strain e3 agrees well with the ex-perimental value, there is a difference of a factor of 2between the calculated and observed values of the non-ferroelastic strain e". This is principally due to the factthat the calculated cubic unit-cell edge length, a., differsfrom the experimentally determined value by more thanthe differences between any of the other calculated andobserved lengths. That said, the discrepancy is as smallas l.2o/o, so we are really talking of small errors that aregreatly magnified when subtracting two similar largenumbers. It should be noted that the experimental valueof a" was obtained by extrapolation over a range of 650K away from the actual experimental data, but the dis-crepancy between the calculated and observed valuescannot be fully accounted for by postulating the existenceofundetected errors in the extrapolation procedure. Thediscrepancies that we have pointed out should not detractfrom the fact that the model has given the essential qual-itative details of the strain distortions, which means thatthe model correctly reproduces the couplings between the
order parameters associated with the symmetry changesand the spontaneous strains.
We can therefore conclude that the basic model is ableto reproduce the phase transition behavior in leucite, withthe correct couplings between the framework distortions,K ion displacements, and volume and strain distortions.
One other feature ofthe tetragonal structure that is ofinterest is the range of tetrahedral bond lengths. In thetetragonal phase there are three nonequivalent tetrahe-dral sites, so in principle there could be some Al-Si or-dering. An analysis of the experimental bond lengths hassuggested that the degree of any ordering will be small,but it has been noted that the bond lengths for the differ-ent sites are not equal. Our model has used identical po-tentials for each of the sites (the assumption of completedisorder). The calculated structure gives unequal bondlengths similar to those calculated from the observedstructure parameters (Table I l). We can therefore con-clude that the experimental structures are consistent withthe complete lack of any long-range Al-Si order. We canalso conclude that the observed strain distortions are notcaused by Al-Si ordering. This has been confirmed by acalculation for a hypothetical ordered structure, with Alon the T(2) site and Si on the other two tetrahedral sites.The strain distortions given by this structure were barely

different from the strain distortions given by our disor-dered model. A more detailed study elucidating the roleof Al-Si ordering will be presented elsewhere (Dove et al.,in preparation).
Z,orsrrnZoisite, CarAlr[O/OH/SiOr/SirO?], is an Fe-free ortho-
rhombic (Pnma, Z: 4) end-member of the epidote group.The structure, as determined by Dollase (1963), containsSiOo and SirO, groups, as well as chains of edge-sharingAl octahedra running parallel to [010]. H bonds are lo-cated between these chains. The Ca atoms are situated inirregular polyhedra. If a cutoff value of 2.85 A for bondlengths is used, both independent Ca atoms are sevencoordinated (Dollase, I 968).
Not only is the complexity of this structure a challengefor modeling, but it is also a good test case for O-H po-tentials. Because of the relatively small numbers of Hatoms, one can neglect direct non-Coulombic H-H inter-actions in a first approach. The modeling of OH groupsis not straightforward. Different potentials have been pro-posed (Saul et al., 1985; Abbotr et al., 1989a, 1989b;Collins and Catlow, 1990). The potentials suggested byAbbott et al. (1989a, 1989b) were derived from energy-minimum search calculations for brucite OH and micaOH in a number of structures (e.g., chlorite, clintonite,lizardite, tremolite). Abbott et al. (1989a, 1989b) sug-gested a value of p : 2.5 A in Equation 12. They con-cluded that the O-H distances and orientations are mod-eled best with Bo" : 30000 kJ/mol for trioctahedral micalayers and tremolite, and -Bo, : 24250 kJlmol for brucitesheets in chlorite. O atoms were modeled as rigid ionswith a formal charge of -2e, and H atoms were giventhe charge *le. Collins and Catlow (1990) successfullymodeled micas using a model similar to the one describedin the present paper. They modeled the O-H interactionwith the modified Morse function of Equation 14, theparameters for which are given in Table l. The O in theO-H group was modeled as a rigid ion with a charge of-1.426e, whereas the H atom was assigned a charge of+0.426e. The O-H bond distance in the model was cal-culated to be about 60/o larger than the experimentallydetermined one (Collins and Catlow, 1990). All other Oatoms were modeled with a core and a shell. Neithermodel has been tested by HLDC, which we regard as themost stringent test of any O-H potential.
Dollase (1968) determined the O-H distance tobe 1.2(2)A and the length of rhe OH . . . H H bridge r"obe 2.76(2)A. Linke (1970) confirmed by single-crystal polarized lighrIR spectroscopy that the O-H dipole is parallel to [001].We tested the potential parameters of Abbott et al. (1989a,1989b) and Collins and Catlow (1990) in our model ofthe zoisite structure. The potential parameters of Coltinsand Catlow (1990) did not work initially, because of thelarge attractive electrostatic forces on the H atoms fromO atoms not belonging to the OH group. The inclusionof short-range repulsive interactions using the potentialparameters of Abbott et al. (1989a, 1989b) led to a sat-
325
TABLE 12, Comparison of observed data and results of SLECand HDLC for zoisite
obs Model 1 Model 2
WINKLER ET AL.: LATTICE ENERGY AND LATTICE DYNAMICS
a (A)b (A)c (A)o-H (A)<oH,[001]oH-o (A)ioH (cm 1)
Other opticphonons
1 6.1 93(2)5.549(1)
1 0.036(2)1.2(2)
e2.75(21
-3160
<1 160 cm 1
15.9275.5349.7311 . 1 2 60.062.44
-2325
50-1069. cm-1
15.7255.608
10.0030.9830.022.66
-4029
50-1072 cm 1
/Vote: Observed data were taken from Langer and Lattard (1 980); model1 uses the parameters of Abbott et al. (1989a, 1989b), and model 2 usesthose of Collins and Catlow (1990) as described in the text.
. Excluding the modes related to the bending vibration of the H bond at-1420 cm 1.
isfactory relaxation ofthe structure. The calculated latticeparameters for both models are given in Table 12. Asmay be seen from Table 12, both models reproduced theorientation of the OH group with respect to the c axisvery well. Both models gave an O-H bond distance thatwas too short, the modified Collins and Catlow modelgiving an even shorter bond than the Abbott et al. (l 989a,1989b) model. There are two different Ca polyhedra inzoisite structure. The O-Ca-O bond angles are modeledto better than 8o for polyhedra, whereas the bond lengthsare all about 0.1 A too short.
HLDC were performed to elucidate the reliability ofthe OH potential further. We calculated the phonons atthe I point. IR studies in the frequency range above 400cm-r were performed by several authors, e.g., Linke(1970), Langer and Raith (1974), Langer and Lattard(1980), and Winkler et al. (1989). The IR spectrum ofzoisite in the region above 400 cm-' may be subdividedinto three regions: the OH stretching vibrations occur ataround 3160 cm-', there is a distinct band at about 2160cm-l, and the normal lattice modes have wavenumbers<1160 cm-'. The normal lattice modes below approxi-mately 1160 cm-r are correctly calculated using bothmodels; the calculated frequency range is 50-1070 cm-'.Langer and Lattard (1980) assigned the 2160 cm-' bandto an unusually strong, second H bridge. On deuterationthis band shifts to lower frequencies (Langer and Lattard,1980) and shifts to higher frequencies with increasingpressure (Winkler et al., 1989). Because of these shiftsand the unlikelihood ofthe existence ofsuch a strong Hbridge in silicates [the stretching frequency is expected toshift from approximately 3700 cm ' to 2160 cm-' whenthe OH-O distance is approximately 2.5 A (Nakamoto etal., 1955), Winkler et al., (1989) concluded that the pre-vious assignment of Langer and Lattard (1980) was in-correct and suggested that, instead, the band was causedby a mode-mode coupling of the bending vibration of theH bond and a lattice mode. In general, the OH stretchingfrequency is a function of the OH-O distance and theO-H distance (Nakamoto et aL, 1955; Novak, 1974). Bothmodels gave O-H distances that were too short, and this
o.s.IEo F>'i-eE( E t r
EJoooC)xuJ
0.5
0.4
- o '3ct
E o.2()
0.1
0
326
C').ExEoq,
E:o
oooIJxul
WINKLER ET AL.: LATTICE ENERGY AND LATTICE DYNAMICS
14
12
10
-0 .1
-o.20 20 40 60 80 100
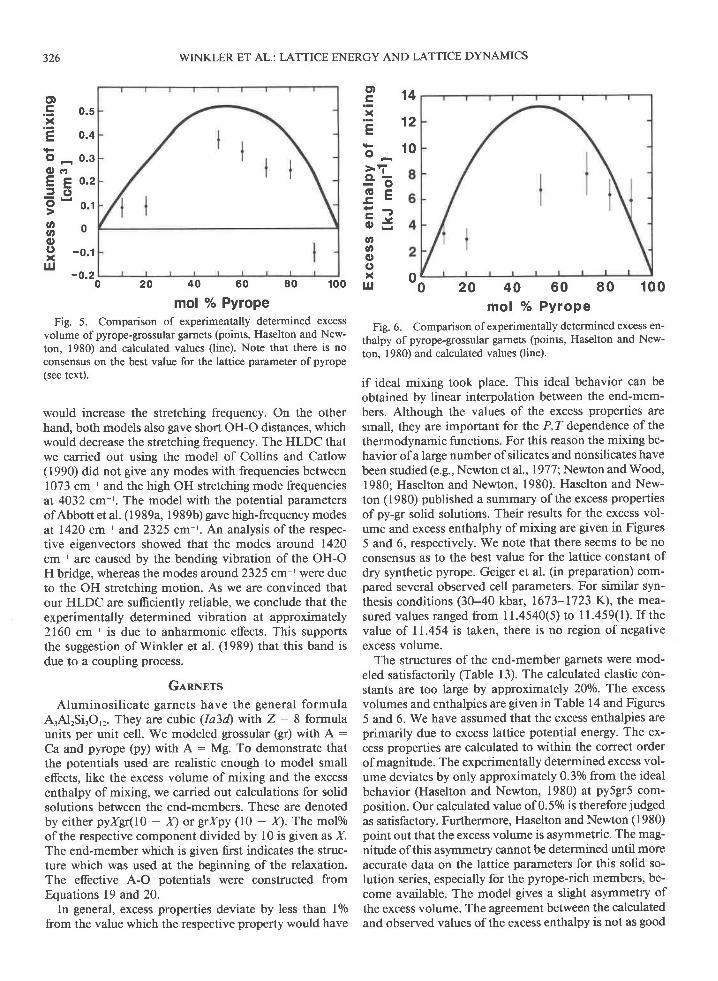
mol % PyropeFig. 5. Comparison of experimentally determined excess
volume of pyrope-grossular garnets (points, Haselton and New-ton, 1980) and calculated values (line). Note that there is noconsensus on the best value for the lattice parameter of pyrope(see text).
would increase the stretching frequency. On the otherhand, both models also gave short OH-O dislances, whichwould decrease the stretching frequency. The HLDC thatwe carried out using the model of Collins and Catlow(1990) did not give any modes with frequencies between1073 cm ' and the high OH stretching mode frequenciesat 4032 cm-l. The model with the potential parametersofAbbott et al. (1989a, 1989b) gave high-frequency modesat 1420 cm I and 2325 cm-'. An analysis of the respec-tive eigenvectors showed that the modes around 1420cm-r are caused by the bending vibration of the OH-OH bridge, whereas the modes around 2325 cm ' were dueto the OH stretching motion. As we are convinced thatour HLDC are sufficiently reliable, we conclude that theexperimentally determined vibration at approximately2160 cm-' is due to anharmonic effects. This supportsthe suggestion of Winkler et al. (1989) that this band isdue to a coupling process.
GlnNnrs
Aluminosilicate garnets have the general formulaA3Al2Si3O,,. They are cubic (Ia3d) with Z: 8 formulaunits per unit cell. We modeled grossular (gr) with A :
Ca and pyrope (py) with A : Mg. To demonstrate thatthe potentials used are realistic enough to model smalleffects, like the excess volume of mixing and the excessenthalpy of mixing, we carried out calculations for solidsolutions between the end-members. These are denotedby either pyXgr(I0 - X) or grXpy (10 - X). The molo/oof the respective component divided by l0 is given as X.The end-member which is given first indicates the struc-ture which was used at the beginning of the relaxation.The effective A-O potentials were constructed fromEquations 19 and 20.
In general, excess properties deviate by less than lolofrom the value which the respective property would have
0620 40 60 80 100
firol o/o PyropeFig. 6. Comparison of experimentally determined excess en-
thalpy of pyrope-grossular garnets (points, Haselton and New-ton, 1980) and calculated values (line).
if ideal mixing took place. This ideal behavior can beobtained by linear interpolation between the end-mem-bers. Although the values of the excess properties aresmall, they are important for the P, Z dependence of thethermodynamic functions. For this reason the mixing be-havior of a large number of silicates and nonsilicates havebeen studied (e.g., Newton et al., 19771, Newton and Wood,1980; Haselton and Newton, 1980). Haselton and New-ton (1980) published a summary of the excess propertiesofpy-g solid solutions. Their results for the excess vol-ume and excess enthalphy of mixing are given in Figures5 and 6, respectively. We note that there seems to be noconsensus as to the best value for the lattice constant ofdry synthetic pyrope. Geiger et al. (in preparation) com-pared several observed cell parameters. For similar syn-thesis conditions (30-40 kbar, 1673-1723 K), the mea-sured values ranged from 11.4540(5) to 11.459(l). Ifthevalue of 11.454 is taken, there is no region of negativeexcess volume.
The structures of the end-member garnets were mod-eled satisfactorily (Table l3). The calculated elastic con-stants are too large by approximately 20o/o. The excessvolumes and enthalpies are given in Table 14 and Figures5 and 6. We have assumed that the excess enthalpies areprimarily due to excess lattice potential energy. The ex-cess properties are calculated to within the correct orderof magnitude. The experimentally determined excess vol-ume deviates by only approximately 0.3o/o from the idealbehavior (Haselton and Newton, 1980) at py5gr5 com-position. Our calculated value of 0.50/o is therefore judged
as satisfactory. Furthermore, Haselton and Newton (1980)point out that the excess volume is asymmetric. The mag-nitude of this asymmetry cannot be determined until moreaccurate data on the lattice parameters for this solid so-lution series, especially for the pyrope-rich members, be-come available. The model gives a slight asymmetry ofthe excess volume. The agreement between the calculatedand observed values ofthe excess enthalpy is not as good

WINKLER ET AL.: LATTICE ENERGY AND LATTICE DYNAMICS 327
Tmu 13. Crystal structures and elastic constants (units of Mbar) TABLE 14. Calculated mixing properites of pyrope-grossular sol-of pyrope and grossular id solutions
Pyrope Grossular
catc
Molar Ex@ss Lattice Excessvolume volume energy energy
(cm3/mol) (cft3/mol) (ev/mol) (ev/mol)a (A)xvzcuC,"
't1.4540.03280.05020.65342.871.050.92
1 1.3020.03110.05490.65263.391.321 . 1 5
1 1.8460.03800.04500.65183.220.911.05
11.5650.03560.05150.65063.970.980.94
pyropepygSrlpy7gr3py6g14pysg15gr5py3g€pylgrossular
108.68109.6811 1 .48112.30113.08114 .51115 .82116 .43
0.220.47o,520.530.400.17
338.03337.80 0.03337.36 0.07337.16 0.07336.95 0.08336.95 0.08336.56 0.07
Note: x, y, z are the fractional coordihates for the O atom; all othelcoordinates are defined for special positions of the space group. Observeddata for the crystal structures were taken from Hazen and Finger (1978);elastic constants for pyrope are from lsaak and Graham (1 976), and elasticconstants for grossular are trom Bass (1989).
as for the excess volume, although it should be noted thatthe size of the effect is as small as 0.0206 of the calculatedlattice energy.
Table l5 shows a comparison of some of the calculatedk : 0 optic mode frequencies for pyrope with corre-sponding experimental values determined by IR spec-troscopy. The agreement is reasonably good. We havealso calculated the specific heat and the entropy for py-rope. The density of states was calculated by using themean point of the Brillouin zone of an I-centered cubiclattice at ('/u, Yu, Yr) (Baldereschi, 1973). The calculatedvalues are compared with the data published by Haseltonand Westrum (1980) in Table 16. The agreemenr wirhthe experimental data is not as good as for other systems.We attribute this to the neglect of Mg anharmonicity orsite disorder in the model, which will cause the entropyto be underestimated.
GnNnnLr, ANALysrs
The previous sections have shown that the basic po-tential model used in this paper is able to reproduce awide range of alurninosilicate structures. A general quan-titative assessment of the accuracy of the model is there-fore possible. We need to define two standard deviationsfor this:
(2s)
f r;(P'o"=^r,r,"'"1'1"' (26)o*": l lr 3\ p",- ) )
where.Fb" 41d fidc are observed and calculated quantities(such as cell edges, bond lengths), respectively. N is thenumber of quantities used in the calculation of these stan-dard deviations. The weighted deviation, o*o, gives ameasure of the agreement as a proportion and will beused for quantities such as the unit-cell edges, which havea wide range of values. On the other hand, the quantity,oo, gives a measure of the absolute agreement and is use-ful for quantities such as bond lengths, which do notchange much from one structure to another. It is instruc-
tive to compare calculated values of ao with the regularstandard deviation for the experimental data, o, given as
"": [#,? o'' - 'ie'f
(27)
where P is the mean of the observations. We expect thatoo will be less than o if the model has given satisfactoryresults.
It should be noted that, in the analysis presented below,we have included the results from both models of zoisite.We have excluded the results for the cubic phase of leu-cite, since the experimental data are necessarily for hightemperatures.
Unit-cell edge length
Averaging over all the cell edge lengths, we obtain
mean observed cell edge length:9.3313 Amean calculated cell edge length : 9.22t1 A
oro : 0.0184N : 3 6 .
The model, in general, reproduces the cell edge lengthsto within 2o/o, which gives on average a slight underesti-mate of lol0.
Bond lengths
Averaging over all the Si-O bond lengths, we obtain
mean observed bond length: 1.628 A (o : 0.029 A)mean calculated bond length : 1.641 A (o : 0.041 A)
TABLE 15. Calculated and observed T," k : 0 optic phononfrequencies in pyrope
Obs (cm-t; Calc (cm ')
":[-5,?o,* - u,'f
331387420450480508836868969
339386424463482539877907967
A/ote: Observed data were taken from Geiger et al. (1989).

328
TABLE 16. Heat capacities, Cp in (J mol-' 6-';, and third lawentropies, St, - S8 in (J mol-' K-'), of pyrope gros-sular garnets
obs calc
c", 150 K 171.5 157.75Ce,298 K 325.3 323.04So, - 53, 150 K 95.56 74.45so, - s3,298 K 266.3 237.32
A/ote-'Observed data were taken from Haselton and Westrum (1980);the Cvto Cpconversion factors weretaken from Holland and Powell (1989)'
oD: 0 ' 021 Ao*o : 0 .013
N : 3 0 .
The model gives, in general, a slight overestimate, butnevertheless the bond lengths are reproduced to withinlo/o.
For A1-O bond lengths we need to consider both tet-rahedral and octahedral bond lengths. From the averag-ing we obtain
mean observed tetrahedral bond length : | .7 40 A(a : 0.033 A)
mean calculated tetrahedral bond length: 1.740 A(o : 0 .041 A )o D : 0 ' 0 1 7 Ao*o : 0 '010
N : 9mean observed octahedral bond length : 1.907 A
(o : 0.073 A)
mean calculated octahedral bond length : 1.396 A(o : 0.073 A).il:8ilf
N : 5 4 .
The agreement is comparable with the agreement for theSi-O bond lengths. It may seem remarkable that the useofa single Al-O interaction for both types ofcoordinationpolyhedra can give similar accuracy for both types of bondlengths.
The statistical analysis of all bond lengths shows thatthe model can give individual bond lengths to an accu-racy of better than2o/o. The mean calculated bond lengthsare within lolo of the observed mean values. There is a
distribution ofactual bond length values in the differentcrystals, and our model reproduces this distribution.
Bond angles
We now perform a similar analysis for the tetrahedraland octahedral bond angles, including Si-O, Al-O anddisordered bonds in the data set
mean observed tetrahedral angle : 109.49"
mean calculated tetrahedral angle : 109.44
oD: 1 .38o
WINKLER ET AL.: LATTICE ENERGY AND LATTICE DYNAMICS
mean absolute difference: 2.18"
N : 7 2
mean observed octahedral angle : 89.96'
mean calculated octahedral angle : 89.89"
o o : l ' 2 3mean absolute difference: 1.85"
N : 5 4 .
This analysis, and the previous bond length analysis,enables us to conclude that the size and shape of the Al-
Si tetrahedra and octahedra can be accurately reproducedby the model for the whole range of different aluminosili-cate structures studied. We are confident that other struc-tures can be modeled with similar accuracy.
Cation coordination
The potentials we have used for Mg-O, Ca-O, and K-O
interactions have been obtained independently ofthe Al-O
and Si-O potentials described above. The averages overall the systems give
mean observed Mg-O distance :2.136 A (": 0.088 A)
mean calculated Mg-O distance :2.096 A (" : 0.078 A),:_:!_zTr:N : 8
mean observed Ca-O distance :2.575 A (": 0.229 A)
mean calculated Ca-O distance : 2.495 A (" : 0.246 A)
':-::-"::r:
N : 3 5mean observed K-O distance : 3.028 A (" : 0.072 L)mean calculated K-o distance :2.956 A t" : 0.065 A)
:;:311,fN : 6 .
We conclude from these figures that the model is alsocapable ofreproducing the general cation-O bond lengthsto within 4o/o in all cases, and the average bond lengthsare in even better agreement.
Bond orientations
The structure is characterized by the size and shape of
the coordination polyhedra, which we have shown are
accurately reproduced by the model, and also by the ori-entations ofthe polyhedra. These orientations can be an-
alyzed by considering the orientations of the individualbond vectors. We have calculated the root-mean-squareangle between the observed and calculated bond vectorsfor the structures we have modeled:
tetrahedral (Si,Al)-O rms angle : 2.49"
octahedral Al-O rms angle:2.24'Mg-O rms angle : 1.88"
Ca-O rms angle : 2.51"
K-O rms angle:2.13.

The rms angle, in all cases, was found to be larger thanthe mean of the angle moduli. It is clear from this analysisthat both the shapes and the orientations ofthe polyhedraare correctly given to within 2-3o on average. In the fullanalysis, the maximum difference was 6".
There is an interesting interplay between short-rangeand long-range interactions in aluminosilicate structures.For any aluminosilicate structure, there will be a groupof normal mode type distortions in which the basic rigidunits (tetrahedra or octahedra) remain undistorted andonly the connecting frameworks is distorted. These arecalled rigid-unit modes, and they form a small subset ofthe full set of allowed vibrational normal modes. Thenumber of rigid-unit modes will depend on the structure,and the existence of any rigid-unit modes will also de-pend on the wavevector. This idea was first pointed outin connection with the phase transitions in quartz (Grimmand Dorner, 1975; Berge et al., 1986), and a generalmethod for the evaluation of the set of rigid-unit modesin any crystal structure has been described by Giddy etal. (in preparation). From the point of view of structuremodeling, the existence of rigid-unit modes presents anadditional challenge since it is then possible to get theshort-range aspects of the structure exactly correct (forexample, the Si-O bond lengths) without consequentlygetting the framework structure correct to the same ac-curacy. The latter aspect is determined by the longer-range forces, namely the electrostatic interactions and theO . . . O dispersive interaction.
Suurvrlnv
We have reported lattice energy minimization studiesfor a wide variety of aluminosilicate minerals, and wehave augmented some of these with harmonic lattice dy-namics calculations. Our primary aim has been to testone specific model, and we have been able to concludethat the basic model works rather well. We have madesome minor modifications that we believe have im-proved the performance of the model. We have also in-troduced a method that can handle site occupancy dis-order (either due to order-disorder phase transitions orsolid solution formation), and we have shown that thismethod works well as far as the structures and energeticsare concerned.
Our criteria for testing the potential model have gonebeyond the reproduction of structures only; we are moreinterested in using the potentials in the study of moresubtle effects, such as the properties associated with phasetransitions. We have therefore used the model to predicta phase diagram (AlrSiO,) and to calculate the following:the coupling between an order-disorder phase transitionand spontaneous strain distortions (cordierite), the simi-lar couplings between a displacive phase transition andspontaneous strain distortions (leucite), departures fromideal solid solution behavior (pyrope-grossular solid so-lution), and thermodynamic quantities. We have foundthat the model always gives the correct qualitative be-havior, and in many cases, we have found that the quan-titative agreement between calculation and experiment is
329
far better than one might have expected for such a simplemodel. The reader should note that these tests are push-ing the model to limits beyond those for which it wasdesigned. Although the discrepancies between calculatedand observed properties point to inadequacies of themodel, the essential result is that the model is nearly ableto account corectly for such subtle effects.
If we combine our results with the results from theapplications of this basic model to MgrSiOo (Price andParker, 1988), SiO, (Sanders et al., 1984), and zeolites(Jackson and Catlow, 1988), we can conclude that thebasic model described in this paper is a genuine transfer-able model that can be applied to a wide range of struc-ture topologies (ortho-, chain-, layer-, and framework-aluminosilicates). It can model both structural and latticedynamics aspects reasonably well. We have also testedthe model on a number of other systems that have notbeen reported here (due to space limitations) and havefound results that support our conclusion of the accuracyand transferability of the model.
However, we believe that the model can, and should,be improved, particularly with regard to the Al-O poten-tials. Although such an enterprise may seem daunting,the way ahead is clear. The potential parameters of thebasic model can be refined by fitting calculated structures,elastic and dielectric constants, and vibrational frequen-cies to available observed data for a wide range of sys-tems. This point was discussed by Dove (1989). Our ownpreliminary investigations of the model for andalusitehave shown that minor modification of the value of theO-AI-O bond-bending force constant for the five-coor-dinated Al does lead to significant improvements in theresultant calculated structure. However, it is our opinion,supported by the experience of similar enterprises formodeling organic materials (Dove, 1989), that focusingon only a single system invariably leads to a potentialmodel that is no more transferable than the starting point;instead, a wide number of structures is required for thedevelopment of a transferable model.
In the meantime. we believe that reliable results canstill be obtained from studies using the model as it stands.One of the features we wish to highlight is the success ofthe potentials for Mg-O, Ca-O, and K-O interactions ob-tained from MEG calculations (Post and Burnham, 1986).We have also shown, in unreported work, that some ofthe other potentials given by Post and Burnham areequally useful. Additional potentials obtained by thismethod (e.g., for Rb-O and Cs-O interactions) would beextremely helpful.
We hope also that we have been able to demonstratethe predictive benefits of the model. This point has beenexemplified by our discovery that the mechanism of theferrodistortive phase transition in leucite is virtually in-dependent ofany Al-Si ordering. Our successful calcula-tions of phase diagrams and excess properties of solidsolutions also point to future applications of the model'It is our hope that the general analysis we have performedwill now enable the model to be used with some confi-dence, given the knowledge of the limits of its reliability.
WINKLER ET AL.: LATTICE ENERGY AND LATTICE DYNAMICS

330 WINKLER ET AL.: LATTICE ENERGY AND LATTICE DYNAMICS
AcxNowr.rIGMENTS
We thank Jennifer-Anne Dove for her encouragement. We are gratefulto the authors ofAbbott et al. (1989a, 1989b) and Collins and Caflow(1990) for sending us preprint copies oftheir papers. B.W. gratefully ac-knowledges a grant from the German Academic Exchange Service (DAAD).We are also grateful to Pat Hancock for her help in the preparation ofthis document. This is Earth Science Contribution ES 1765.
RnrnnrNcBs crrEDAbbott, R.N., Jr., Post, J.E., and Burnham, C.w. (1989a) Treatment of
the hydroxyl in structure-energy calculations. American Mineralogist,74, t4t-150.
Abbott, R.N., Jr., Burnham, C.W., and Post, J.E. (1989b) Hydrogen inhumite-group minerals: Structure-energy calculations. Arnerican Min-eralogist, 74, 1300-1306.
Armbruster, T. (1985) Crystal structure, Si,Al-ordering, and twinning in"pseudo-hexagonal" Mg-cordierite. Neues Jahrbuch fuer MineralogieMonatshefte, M6, 255-267.
Baldereschi, A. (1973) Mean value point in the Brillouin Zone. PhysicsReview 87. 12. 5212-5215.
Bass, J.D. (1989) Elasticity ofgrossular and spessani& garnets by Bril-louin Spectroscopy. Joumal of Geophysical Research, 94,86, 7621-7628.
Berge, B., Baccheimer, J.P., Dolino, G., and Vallade, M. (1986) Inelasticneutron scattering study ofquartz near the incommensurate phase tran-sition. Ferrolectrics. 66. 73-84.
Bom, M., and Huang, K. (1954) Dynamical theory of crystal lattices.Oxford Universiry Press, Oxford, United Kingdom.
Brace, W.F., Scholtz, C.H., and La Mori, P.N. (1969) Isothermal com-pressibility of kyanite, andalusite and sillimanite from synthetic aggre-gates. Journal of Geophysical Research, 74, 2089-2098.
Brown, I.W.M., Cardile, C.M., Mackenzie, K.J.D., Ryan, M.J., and Mein-hold, R.H. (1987) Natural and synthetic leucites studied by solid state29-Si NMR and 57-Fe Mossbauer spectroscopy. Physics and Chemis-try of Minerals, 15, 78-83.
Catlow, C.R.A. (1988) Cornputer modelling of silicates. In E.K.H. Salje,Ed., Physical properties and thermodynamic behaviour of minerals,NATO ASI Series C, vol.225, p. 619-638, Reidel, Boston.
Catlow, C.R.A., Mackrodt, J.R., and Stewart, R.F. (1982) Defect energiesin aluminium oxide and rutile titanium oxide. Physical Review B, 25,1006-1026.
Clark, J.R., Appleman, D.E., and Papike, J.J. (1969) Crystal-chemicalcharacterization ofclinopyroxenes based on eight new slructure refrne-ments. Mineralogical Society of America Special Paper, 2,31-50.
Cohen, J.P., Ross, F.K., and Gibbs, G.V. (1977) An X-ray and neutrondiftaction study of hydrous low cordierite. American Mineralogist, 62,67-78.
Collins, D.R., and Catlow, C.R.A. (1990) Interactive potentials for micas.Molecular Simularion. 4. 341-346.
Deer, W.A., Howie, R.A., and Zussman, J. (1966) An introduction torock forming minerals. Longman, London.
Dollase, W.A. (1968) Refinement and comparison of the structures ofzoisite and clinozoisite. American Mineralogist, 53, 1882-1898.
Dove, M.T. (19E9) On the computer modeling of diopside: Toward atransferable potential for silicate minerals. American Mineralogist, 74,774-779.
Geiger, C.A., Winkler, B., and Langer, K. (1989) Infrared spectra of syn-thetic almandine-grossular and aldamine-pyrope garnet solid solutions:Evidence for equivalent site behaviour. Mineralogical INdagazine,53,23r-237.
Gibbs, G.V. (1966) The polymorphism of cordierite I: The crystal struc-ture of low cordierite. American Mineralogist, 51, 1068-1087.
Grimm, H., and Dorner, B. (1975) On the mechanism of the a-p phasetransformation ofquartz. Journal ofPhysics and Chemistry ofSolids,36,407-413.
Grogel, T., Boysen, H., and Frey, F. (1984) Neutron powder investigationofl4,/a-la3d, in leucite. Collected abstracts of l3th intemational con-ference of cryslallography, C256-257 .
Haselton, H.T., and Newton, R.C. (1980) Thermodynamics of pyrope-grossular giarnets and their stabilities at high temperatures and highpressures. Journal ofGeophysical Research, 85, Bl2, 6973-6982.
Haselton, H.T., and Westrum, E.F. (1980) Irw-temperature heat capac'ities of synrhetic pyrope, grossular, and pyrope"ogrossular*. Geochirn-ica et Cosmochimica Acta, 44,701-709.
Hazen, R.M., and Finger, L.W. (1978) Crystal structures and compressi-bilities ofpyrope and grossular to 60 kbar. American Mineralogist, 63,297-303.
Heaney, P.J., and Veblen, D.R. (1990) A high-temperature study of thelow-high leucite phase transition using the transmission electron mi-croscope. American Mineralogist, 7 5, 47 7 -489.
Holland, T.J.B., and Carpent€r, M.A. (1984) Order-disorder in silliman-ite. In C.M.B. Henderson, Ed., Progress in experimental petrology. TheNatural Environmental Research Counsel Publications Series D, no.25, p. 183-185.
Holland, T.J.B., and Powell, R. (1989) An enlarged and updated inter-nally consistent thermodynamic dataset with uncertainties and cone-lations: The system KrO-NarO-MgO-MnO-FeO-Fe'Or-Al,Or-TiOr-SiOr-C-Hr-Or. Journal of Metamorphic Geology, in press.
Isaak, D.G., and Graham, E.K. (1976) The elasric properties of an al-mandine-spessartine garnet and elasticity in the garnet solid solutionseries. Journal of Geophysical Research, 8 1, 2483-2489.
Jackson, R.A., and Catlow, C.R.A. (1988) Computer simulation studiesof zeolite structures. Molecular Simulation. l. 207 -224.
Kimata, M., and Ii, N. (1982) The structural properties of synthetic geh-lenite CarAlrSiOr. Neues Jahrbuch fuer Mineralogie Abhandlungen, 144,254-267.
Ianger, K., and Lattard, D. (1980) Identifrcation of a low energy OH-valence vibration in zoisite. American Mineralogist, 65,779-783.
l,anger, K., and Raith, M. (1974) Infrared spectra ofAl-Fe(Ill)-epidotesand zoisites, CadAl,-,Fe,)Al,O(OH)[Si,O?][SiO.]. American Mineralo-gtst,59, 1249-1258.
Lasaga, A.C., and Gibbs, G.V. (1987) Applications of quanlum mechan-ical potential surfaces to mineral physics calculations. Physics andChemistry of Minerals, 14, l07-ll7.
Levien, L., Weidner, D.J., and Prewitt, C.T. (1979) Elasticity of diopside.Physics and Chemistry of Minerals, 4, 105-133.
Linke, W. (1970) Messnng des Ultrarot-Pleochroismus der OH Streck-frequenz in Zoisit. Tschermak's mineralogische und p€trographischeMitteilunge, 14, 6l-63.
Mazzi, F., Galti, 8., and Gottardi, G. (1976) The crystal structure oftetragonal leucite. American Mineralogist, 6l , 108-l 15.
Murdoch, J.8., Stebbins, J.F., Carmichael, I.S.E., and Pines, A. (1988) Asilicon-29 nuclear magnetic resonanc€ study of silicon-aluminum or-dering in leucite and analcite. Physics and Chemistry ofMinerals, 15,370-t82.
Nakamoto, K., Margoshes, M., and Rundle, R.E. (1955) Stretching fre-quencies as a function of distances in hydrogen bonds. Journal of theAmerican Chemical Society, 77, 6480-6486.
Newtod, R.C., Charlu, T.V., and Kleppa, O.J. (1977) Thermochemistryof high pressure garnets and clinopyroxenes in the system CaO-MgO-AlrO3-SiOr. Geochimica et Cosmochimica Acta, 4 1, 369-37 7 .
Newton, R.C., and Wood, B.J. (1980) Volume behavior of sitcate solidsolutions. American Mineralogist, 65, 7 33-7 45.
Novak, A. (1974) Hydrogen bonding in solids. Conelation of spectro-scopic and crystallographic data. Structure and Bonding, 18, 177-216.
Palmer, D.C., Salje, E.K.H., and Schmahl, W.W. (1989) Phase transitionsin leucite: X-ray diffraction studies. Physics and Chemistry of Mineralst6, 7 l4-7 t9.
Palmer, D.C., Bismayer, U., and Salje, E.K.H. (1990) Phase transition inleucite: Order parameter behaviour and the Landau potential deducedfrom Raman spectroscopy and birefringence sludies. Physics andChemistry of Minerals, 17,259-265.
Parker, S.C., and Price, G.D. (1989) Computer rnodelling of phase tran-sitions in minerals. Advances in Solid State Chemistry, l, 295.
Phillips, B.L., Kirkpatrick, R.J., and Putnis, A. (1989) Si,Al ordering inleucite by high-resolution 27-Al MAS NMR spectroscopy. Physics andChemistry of Minerals, 16, 591-598.
Post, J.E., and Bumham, C.W. (1986) Ionic modeling of mineral struc-
WINKLER ET AL.: LATTICE ENERGY AND LATTICE DYNAMICS J J I
tures and energies in the electron gas approximation: TiO, polymorphs,quartz, forsterite, diopside. American Mineralogist, 7 l, 1 42-l 50.
Price, G.D., and Parker, S.C. (1988) The computer simulation of thelattice dynamics of silicates. In E.K.H. Salje, Ed., Physical propertiesand thermodynamic behaviour of minerals, NATO ASI Series C, vol.225, p. 59 l-618. Reidel, Boston.
Ribbe, P.H. (1982) Kyanite, andalusite and other aluminum silicates. InMineralogical Society of America, Reviews in Mineralogy, 5, 189-214.
Robie, R.A., and Hemingway, B.S. (1984) Entropies ofkyanite, andalusiteand sillimanite: Additional constraints on the pressure and temperatureof the Al,SiO, triple point. American Mineralogist, 69,298-306.
Salje, E. (1986) Heat capacities and entropies ofandalusite and silliman-ite: The influence offibrolitization on the phase-dia$am ofthe AlrSiO,polymorphs. American Mineralogist, 7 l, 1366-1 37 L
Salje, E., and Werneke, C. (1982a) The phase equilibrium between silli-manite and andalusite as determined from lattice vibrations. Contri-butions to Mineralogy and Petrology, 79,56-76.
Salje, E., and Werneke, C. (1982b) How to determine phase stabilitiesfrorn lattice vibrations. In W. Schreyer, Ed., High pressure researchesin geoscience. E Schweitzerbart'sche Verlagsbuchhandlung, Stuttgart,Germany
Sanders, M.J., l-eslie, M., and Catlow, C.R.A. (1984) Interatomic poten-tials for SiOr. Journal of the Chemical Society, Chemical Communi-cations, 127 l-1273.
Saul, P., Catlow, C.R.A., and Kendrick, J. (1985) Theoretical studies ofprotons in sodium hydroxide. Philosophical Magazine B, 51, 107-117.
Vaugban, M.T., and Weidner, D.J. (1978) The relationship of elasticityand crystal structure in andalusite and sillimanite. Physics and Chem-istry of Minerals,3, 133-144.
Winkler, B., and Buehrer, W. (1990) The lattice dynamics of andalusite:Prediction and experiment. Physics and Chemistry of Minerals, 17,453-46r.
Winkler, B., Langer, K., and Johannsen, P.G. (1989) The influence ofpressure on the OH valence vibration ofzoisite. Physics and Chemistryof Minerafs. 16. 668-67 l.
Winter, J.K., and Ghose, S. (1979) Thermal expansion and high temper-ature crystal chemistry of the AIrSiO5 polymorphs. American Miner-alogist, 64, 573-586.
Mnm-rscnrvr RTCEMD Mencn 5, 1990MeNuscnrpr AccEprED Deceunpn 20. 1990
Related Documents