STATEWIDE PLANNING PROGRAM TECHNICAL PAPER Number: 157 Date: July 2006 Statewide Travel Model Update (2006) Statewide Planning Program Rhode Island Department of Administration Division of Planning One Capitol Hill Providence, Rhode Island 02908-5870 www.planning.ri.gov

Welcome message from author
This document is posted to help you gain knowledge. Please leave a comment to let me know what you think about it! Share it to your friends and learn new things together.
Transcript

STATEWIDE PLANNING PROGRAM TECHNICAL PAPER
Number: 157 Date: July 2006
Statewide Travel Model Update (2006)
Statewide Planning Program Rhode Island Department of Administration Division of Planning One Capitol Hill Providence, Rhode Island 02908-5870 www.planning.ri.gov
Introduction
1 The Rhode Island State Planning Council, the Metropolitan Planning Organization (MPO) for the state is responsible for developing and maintaining a statewide travel demand forecasting model. The Rhode Island Statewide Planning Program (RISPP), staff of the MPO, in association with the Department of Transportation, created a statewide travel demand model in the 1990s that incorporated demographic data and a roadway network system to comply with the air quality and congestion management requirements of the 1990 CAAA and 1991 Intermodal Surface Transportation Efficiency Act (ISTEA). Over the years 2003-2006 this model was updated by Vanasse Hangen Brustlin, Inc. (VHB) in coordination with the Rhode Island Statewide Planning Program and the Rhode Island Department of Transportation (RIDOT). The most significant use of the Rhode Island Statewide Travel Demand Model (RISM) to date has been for supporting air quality analyses for Transportation Conformity requirements. These revisions and updates were designed to improve the model’s accuracy for air quality analysis, travel demand forecasting studies and to simplify its use for Statewide Planning staff. The RISM is capable of forecasting automobile traffic, and is currently being updated to include a transit component and in the near future, a freight modeling component. Some of the model revisions or updates include:
incorporation of Census 2000 data and geography; inclusion of population and employment forecasts developed by Statewide
Planning staff; redefinition of the RISM Traffic Analysis Zone (TAZ) system update and refinement of the model roadway network; and edits to the macro that runs the model to correct previous programming
errors and make more “user friendly”.
Chapter 1 – Introduction 1

The Rhode Island Statewide Model (RISM) continues to run on the TransCAD software platform. TransCAD is a powerful Geographic Information System (GIS) based travel demand modeling package that can directly import Census data and geography. The software is Windows compliant and can also import and export ArcGIS (ArcView, ArcInfo) shape files and coverages for analysis in other GIS software packages. TransCAD has numerous transportation planning utilities and tools that enable the user to create flow maps, create new interchanges, merge and dualize network links and check for proper line connectivity. The purpose of this paper is to document the improvements undertaken, the method used to complete each task, and describe how the model can be run within the TransCAD software. This document also serves as a reference for anyone who needs to apply the model for various traffic data needs and studies outside of the Transportation Conformity process. The report is divided into six sections. Chapter 2 describes the improvements to the Traffic Analysis Zone (TAZ) structure, as well as the updated land use assumptions. Chapter 3 outlines the updates to the roadway network. Chapter 4 describes the model assumptions and inputs as well as the model calibration. Finally, Chapter 5 is a step-by-step user’s guide for anyone running the Statewide Model in TransCAD. Chapter 6 addresses ongoing improvements and enhancements to the RISM and suggestions for new uses and enhancements. The appendix includes tables showing model outputs, including Vehicle Miles Traveled (VMT), for all forecast years, detailed model macro instructions, and socioeconomic data contained in the model.
Chapter 1 – Introduction 2

2
Traffic Analysis Zones
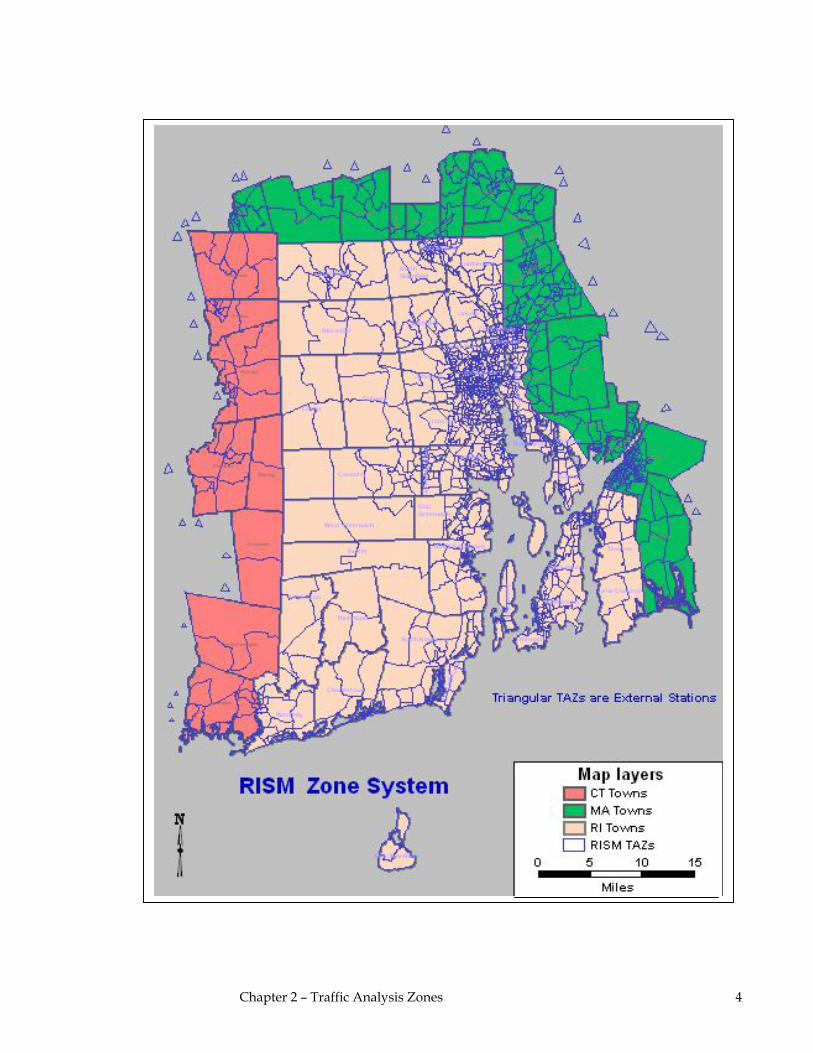
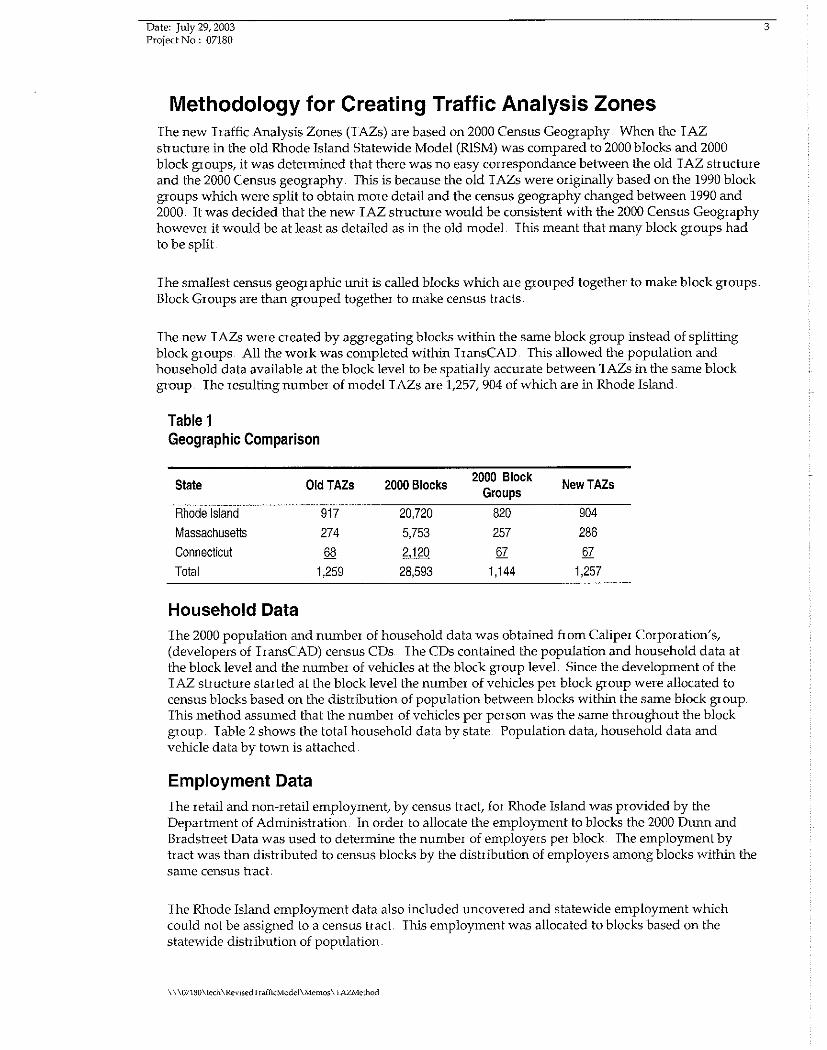
Traffic Analysis Zone (TAZ) Development The Rhode Island Statewide Model (RISM) contains 1,257 Traffic Analysis Zones (TAZs) encompassing the entire state of Rhode Island as well as the bordering towns of Massachusetts and Connecticut. A TAZ is the geographic unit that contains the socio-economic and trip data that ultimately is loaded onto the model network in the Assignment step of the travel demand forecasting process. The updated RISM TAZs are based on year 2000 census geography. The Rhode Island TAZs in the original model were based on the 1990 census block group with some larger TAZs being split in an effort to obtain more detail. In Connecticut and Massachusetts, the TAZ’s coincided with census tracts, the next largest geographic unit. The building block of the RISM TAZ is the census block, the smallest census geographic unit. In general, Census blocks are grouped to make Block Groups and Block Groups are combined to make census tracts. Many 1990 block group boundaries changed with the 2000 Census, so no easy correspondence could be made between the old TAZ structure and the year 2000 Census geography.
Chapter 2 – Traffic Analysis Zones 3
Chapter 2 – Traffic Analysis Zones 4

It was decided to create the new TAZs by aggregating blocks within a block group instead of splitting block groups. This was done for blocks in Rhode Island, Massachusetts, and Connecticut. No TAZ is larger than a block group and all TAZ editing was completed with the TransCAD software. The aggregation of blocks allowed the population and household data available at the block level to be spatially accurate between TAZs within the same block group. The resulting number of model TAZs is 1,257; Rhode Island contains 904 of these, the remainder are in Connecticut and Massachusetts Including TAZs in bordering Connecticut and Massachusetts municipalities increases the sensitivity of the model by providing a sound geographic basis for estimating traffic to and from all areas within the model. Table 2.1 Geographic Comparison
State Previous
TAZs Year 2000
Blocks Year 2000
Block Groups New TAZs Rhode Island 917 20,720 820 904 Massachusetts 274 5,753 257 286 Connecticut 68 2,120 67 67Total 1,259 28,593 1,144 1,257
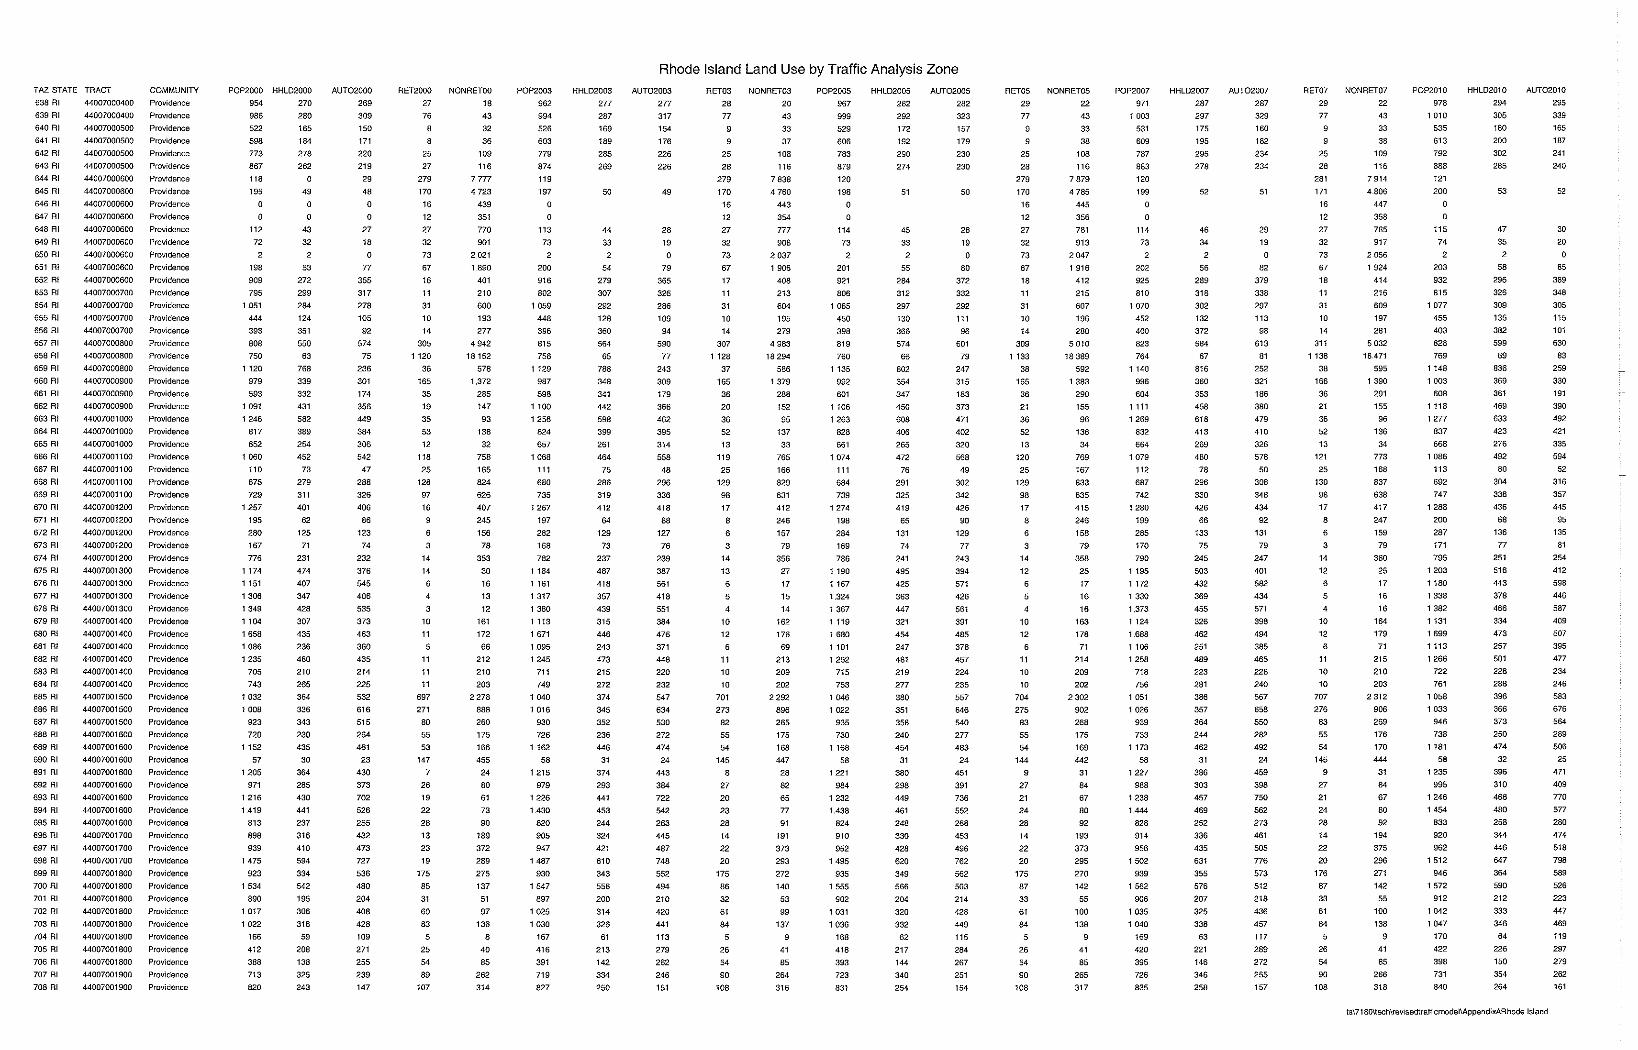
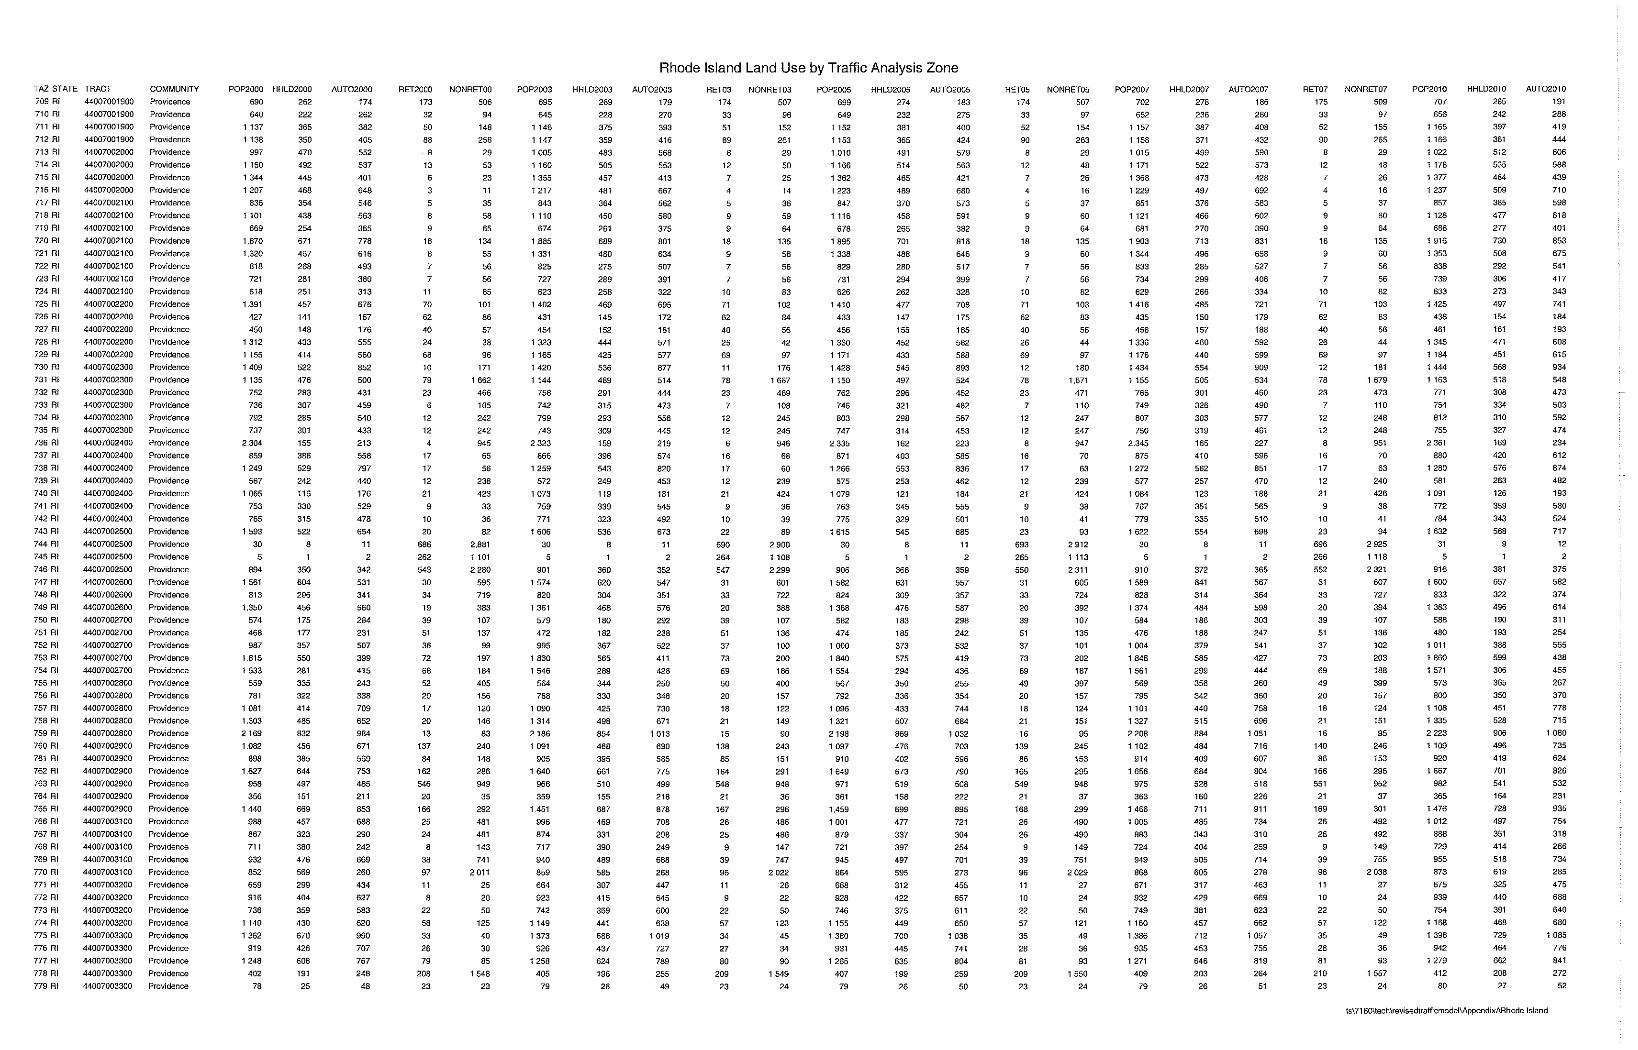
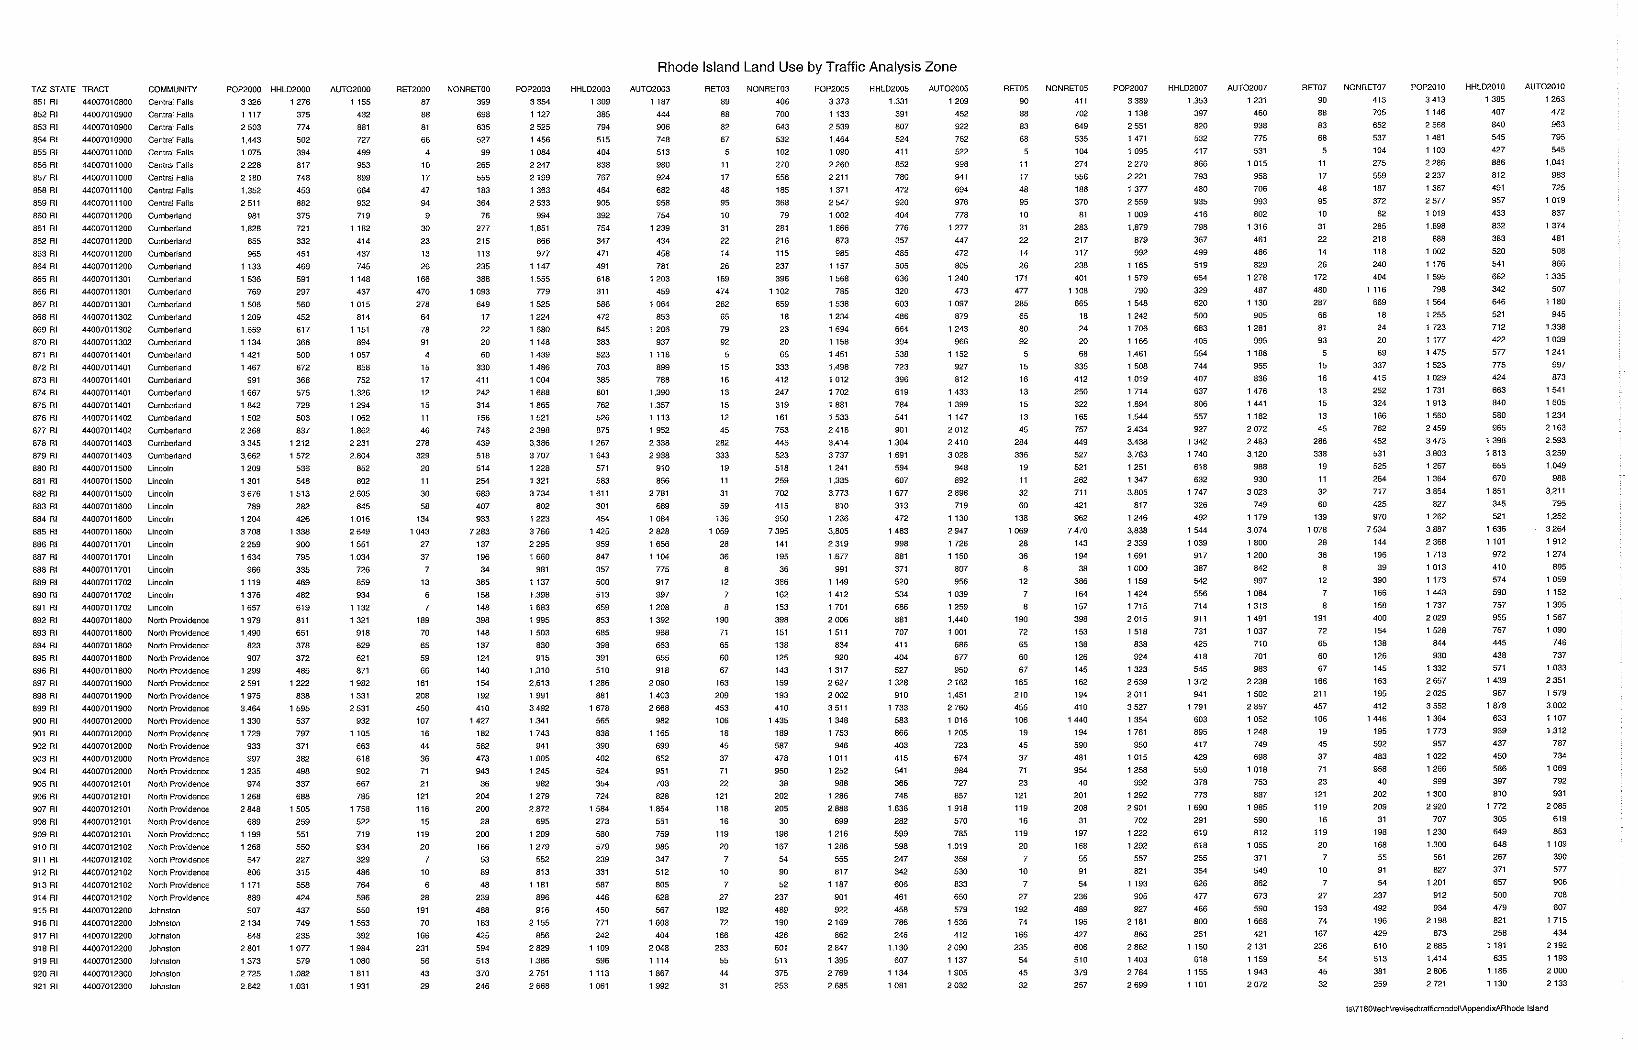
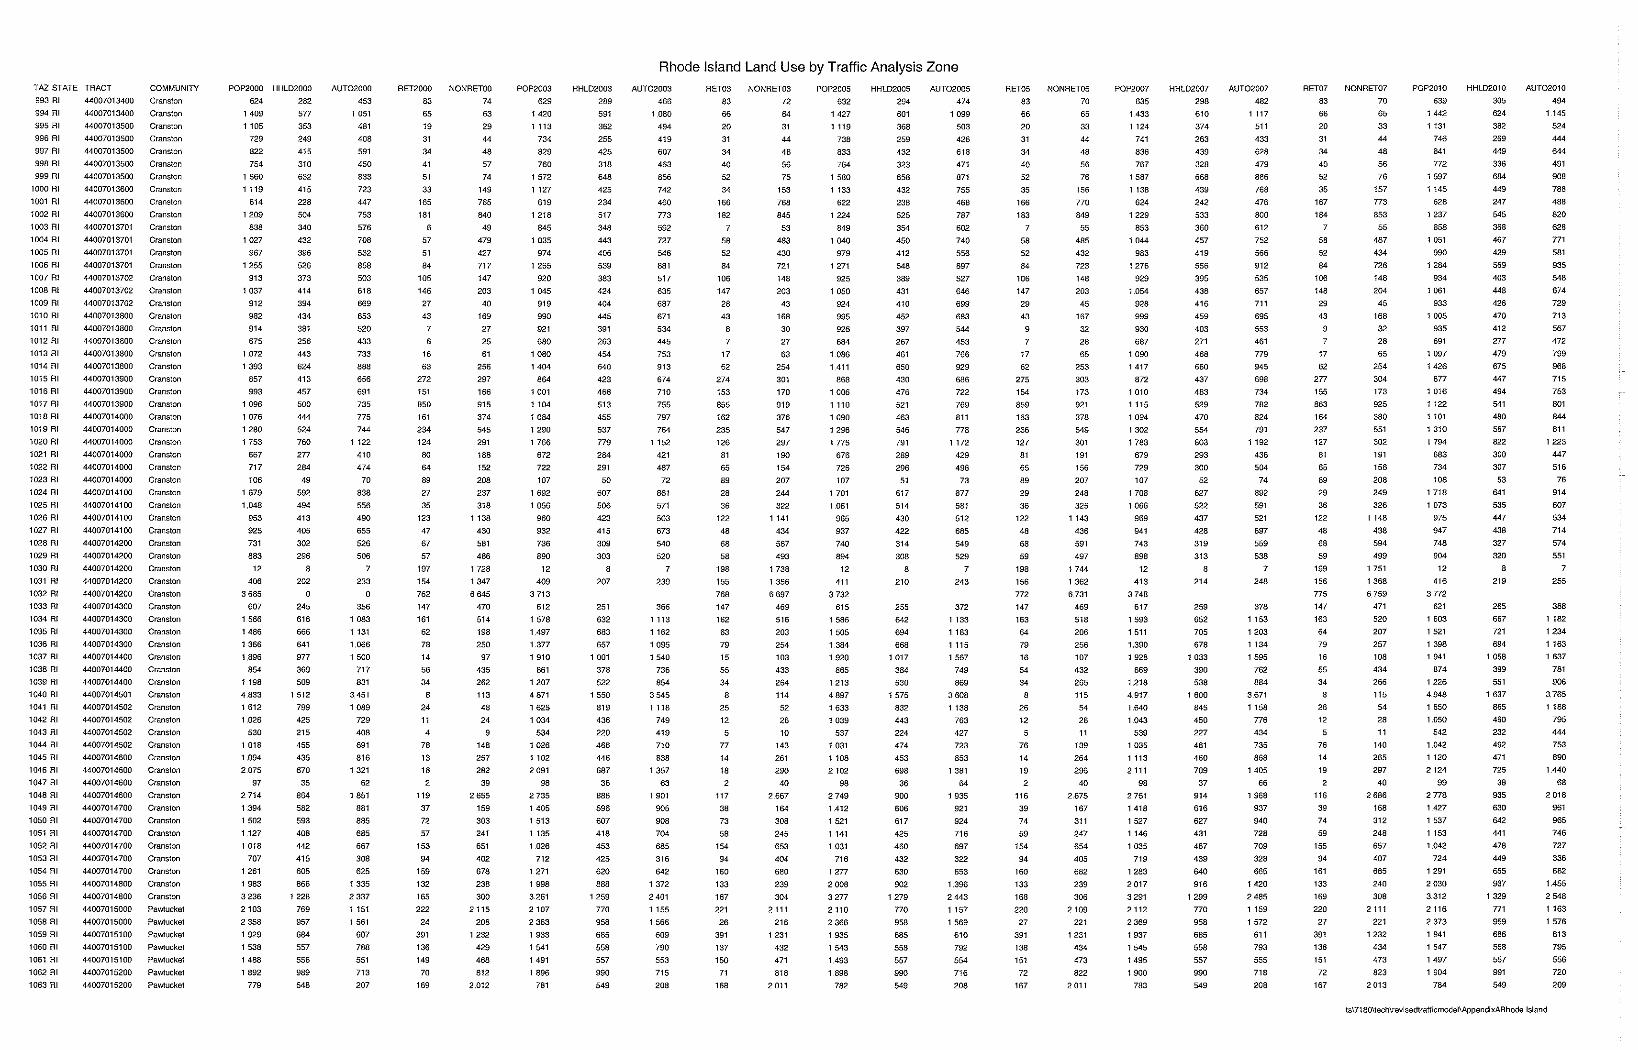
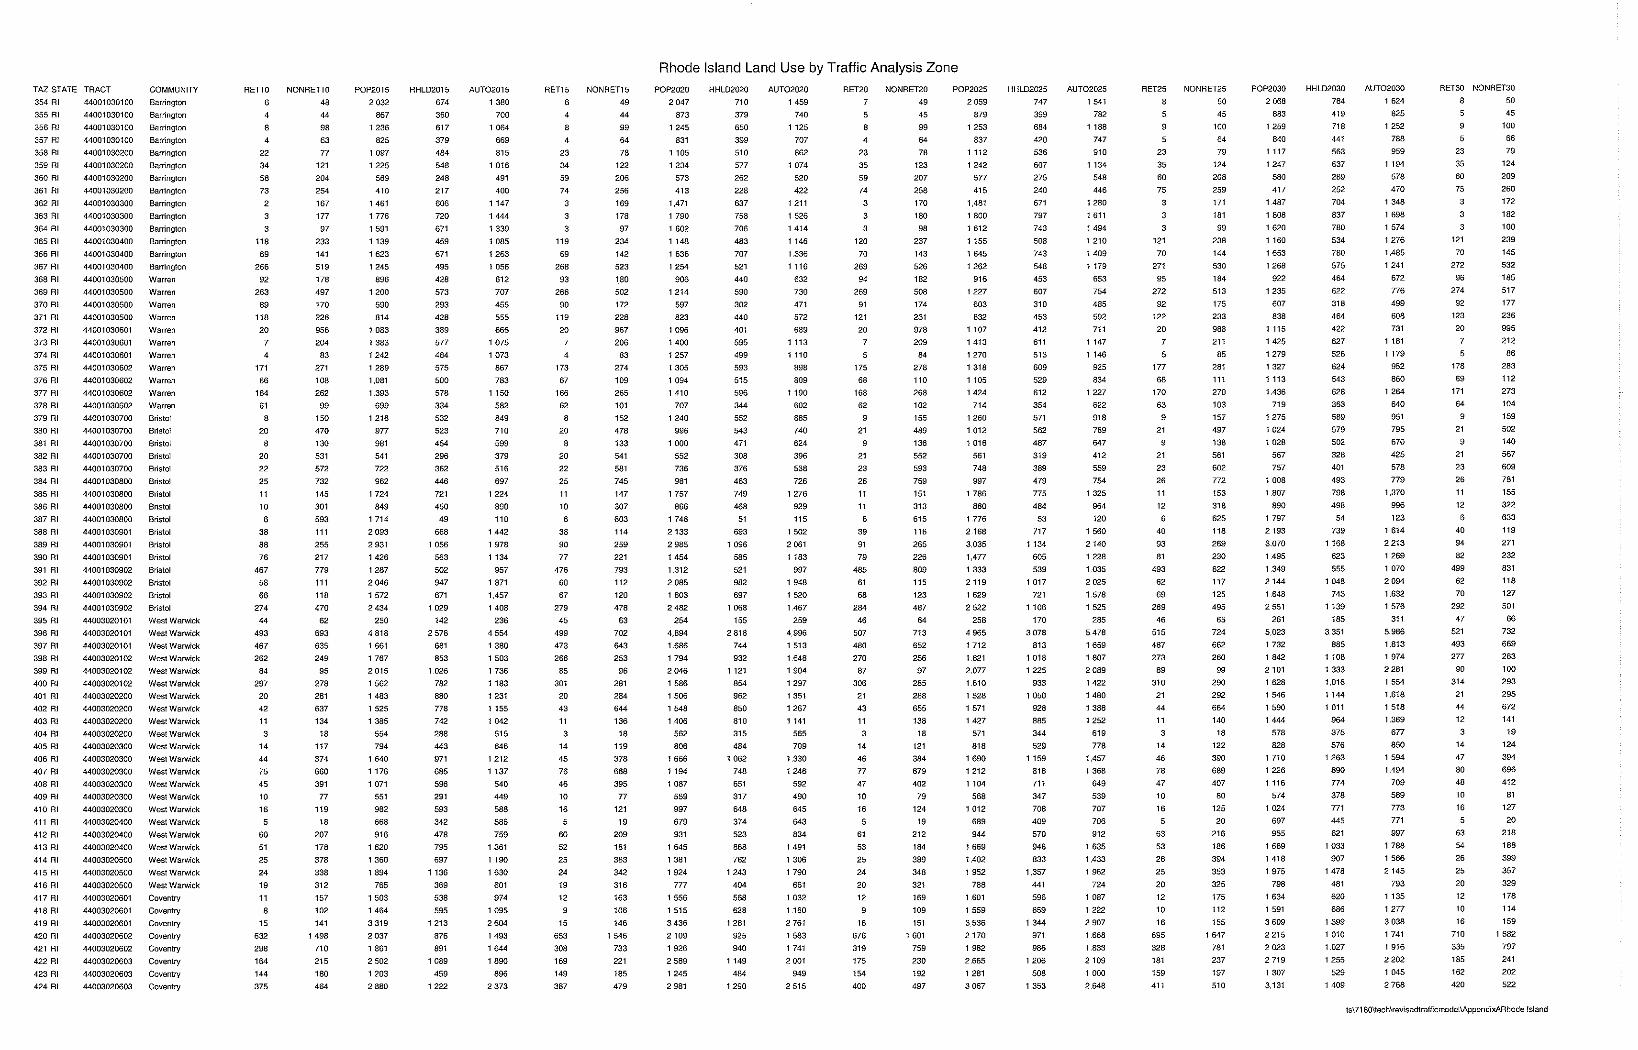
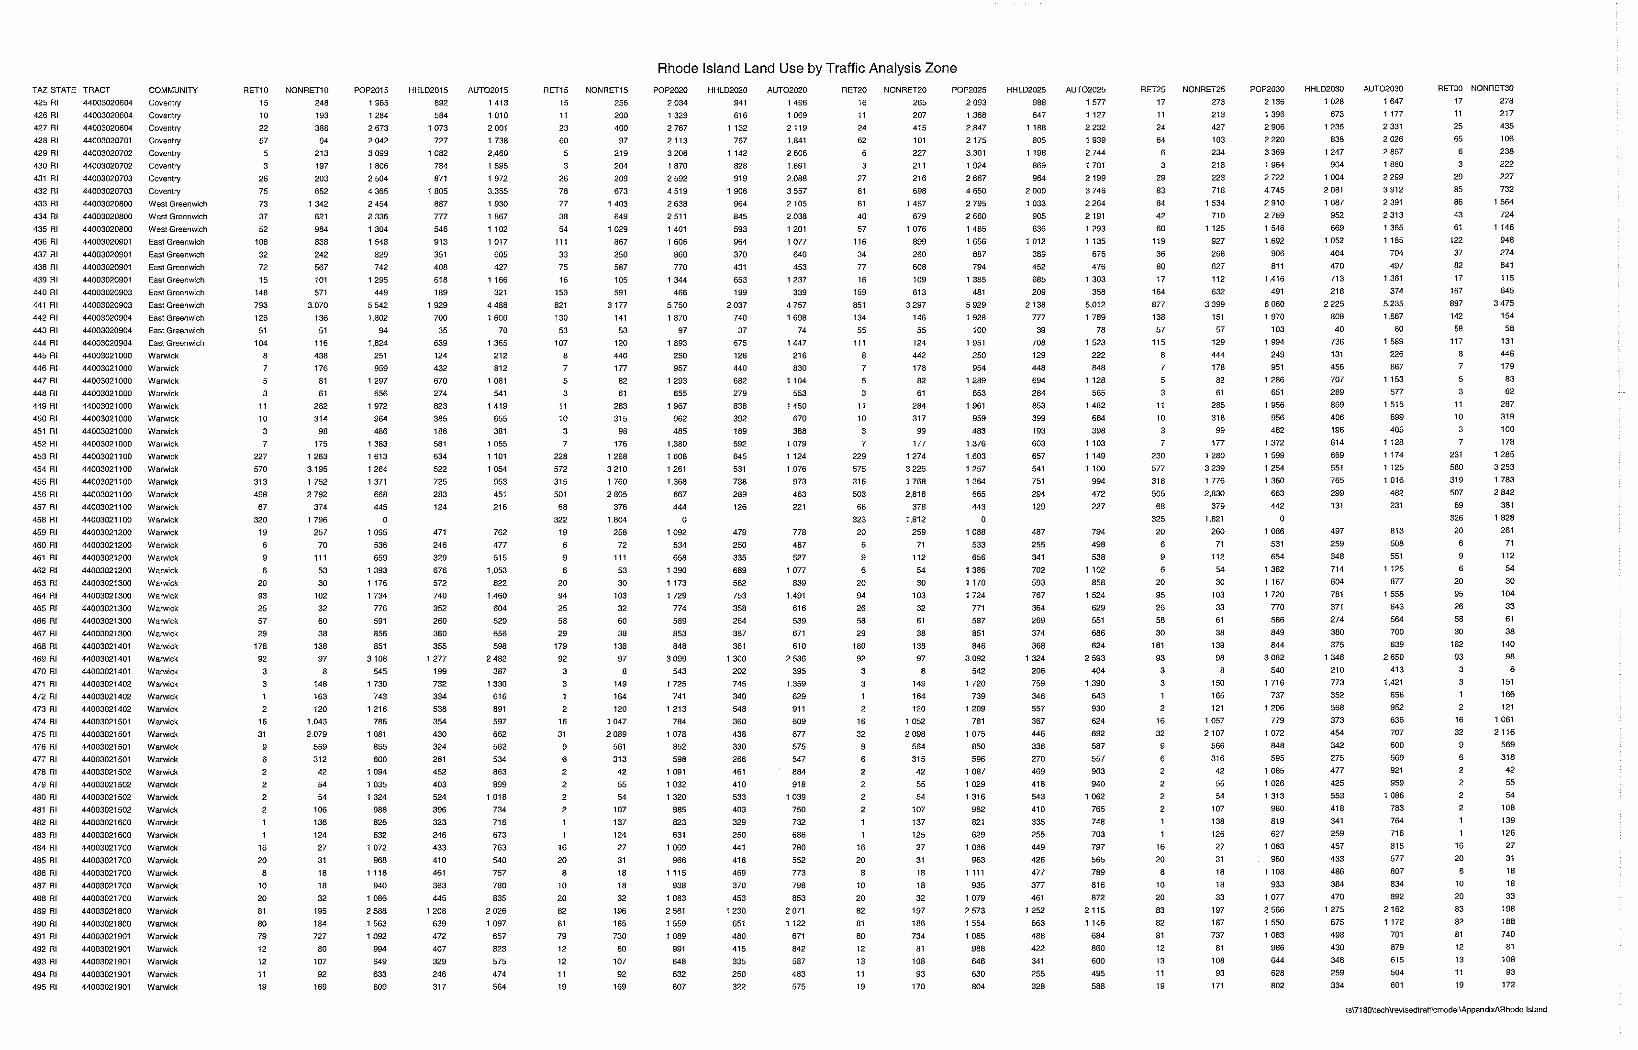
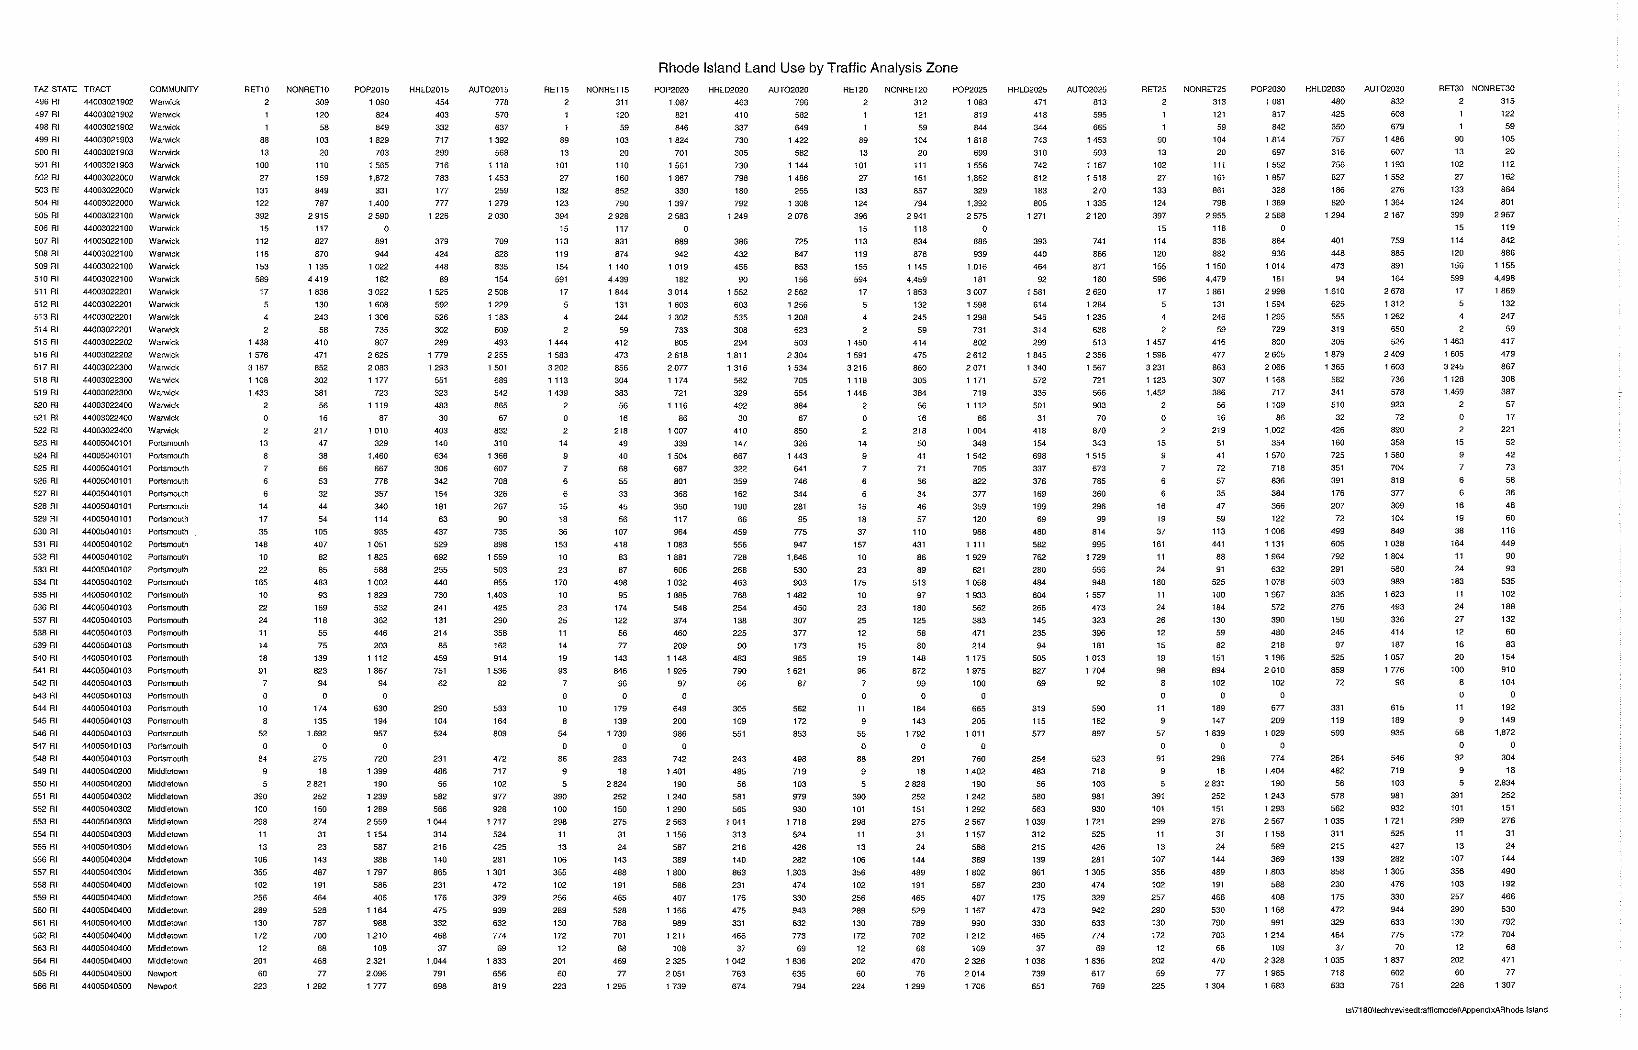
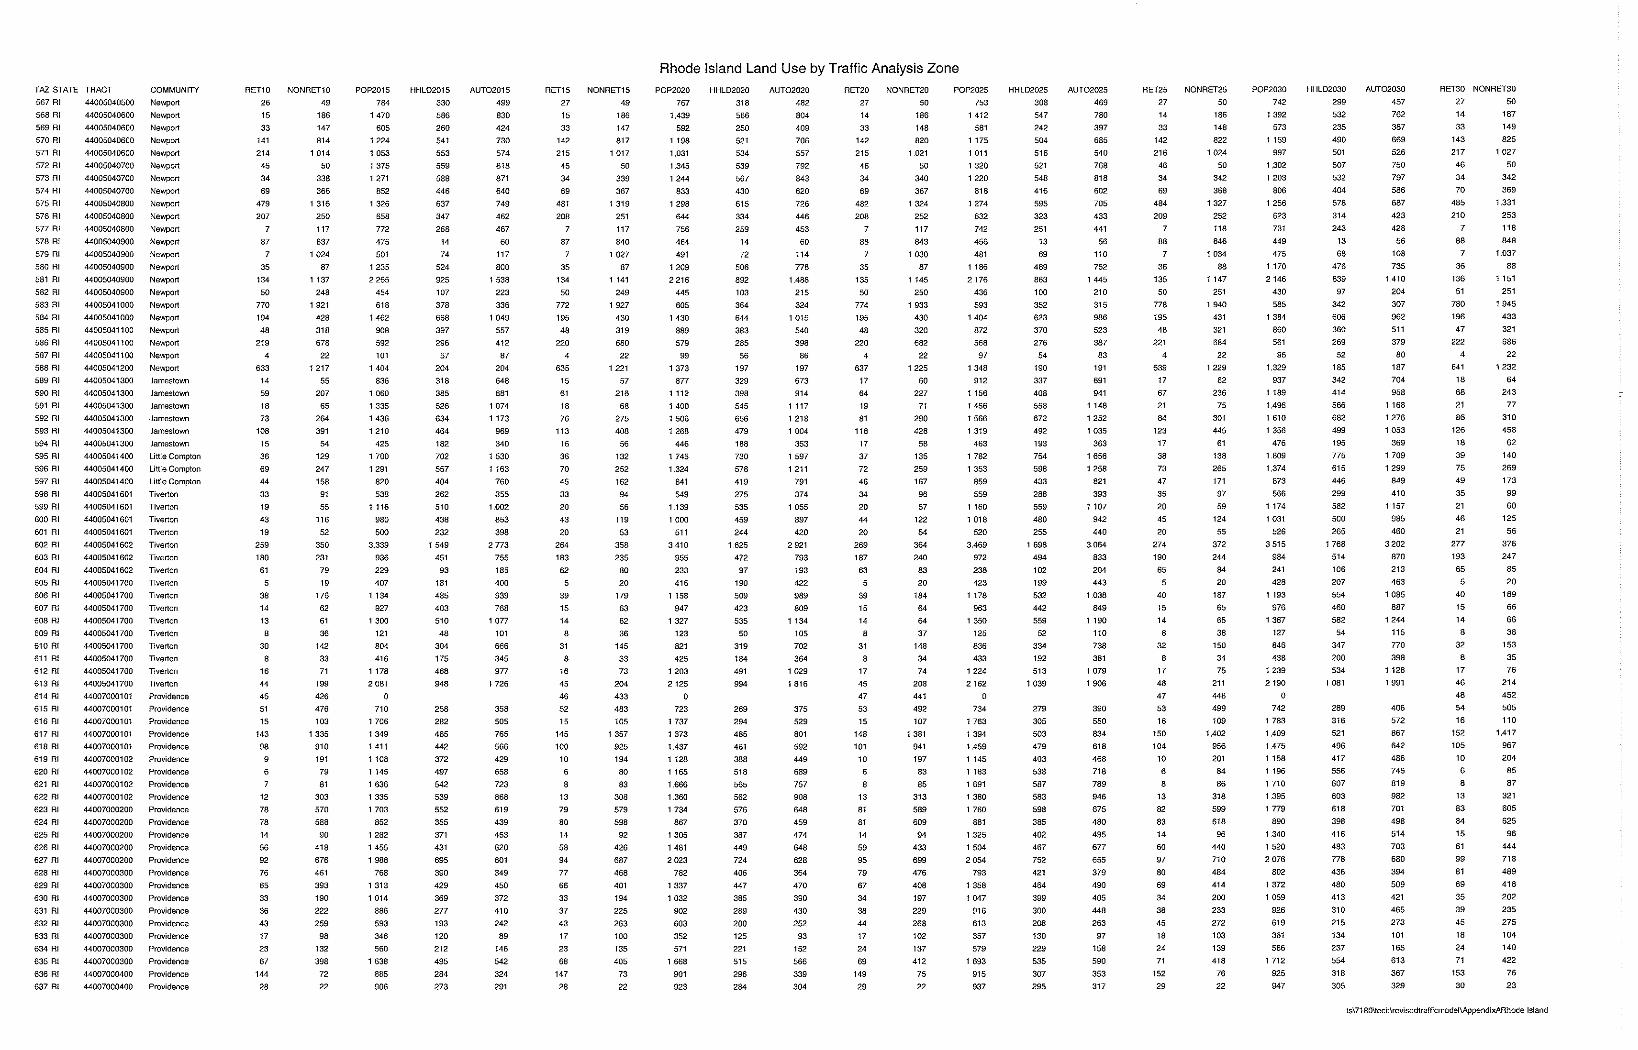
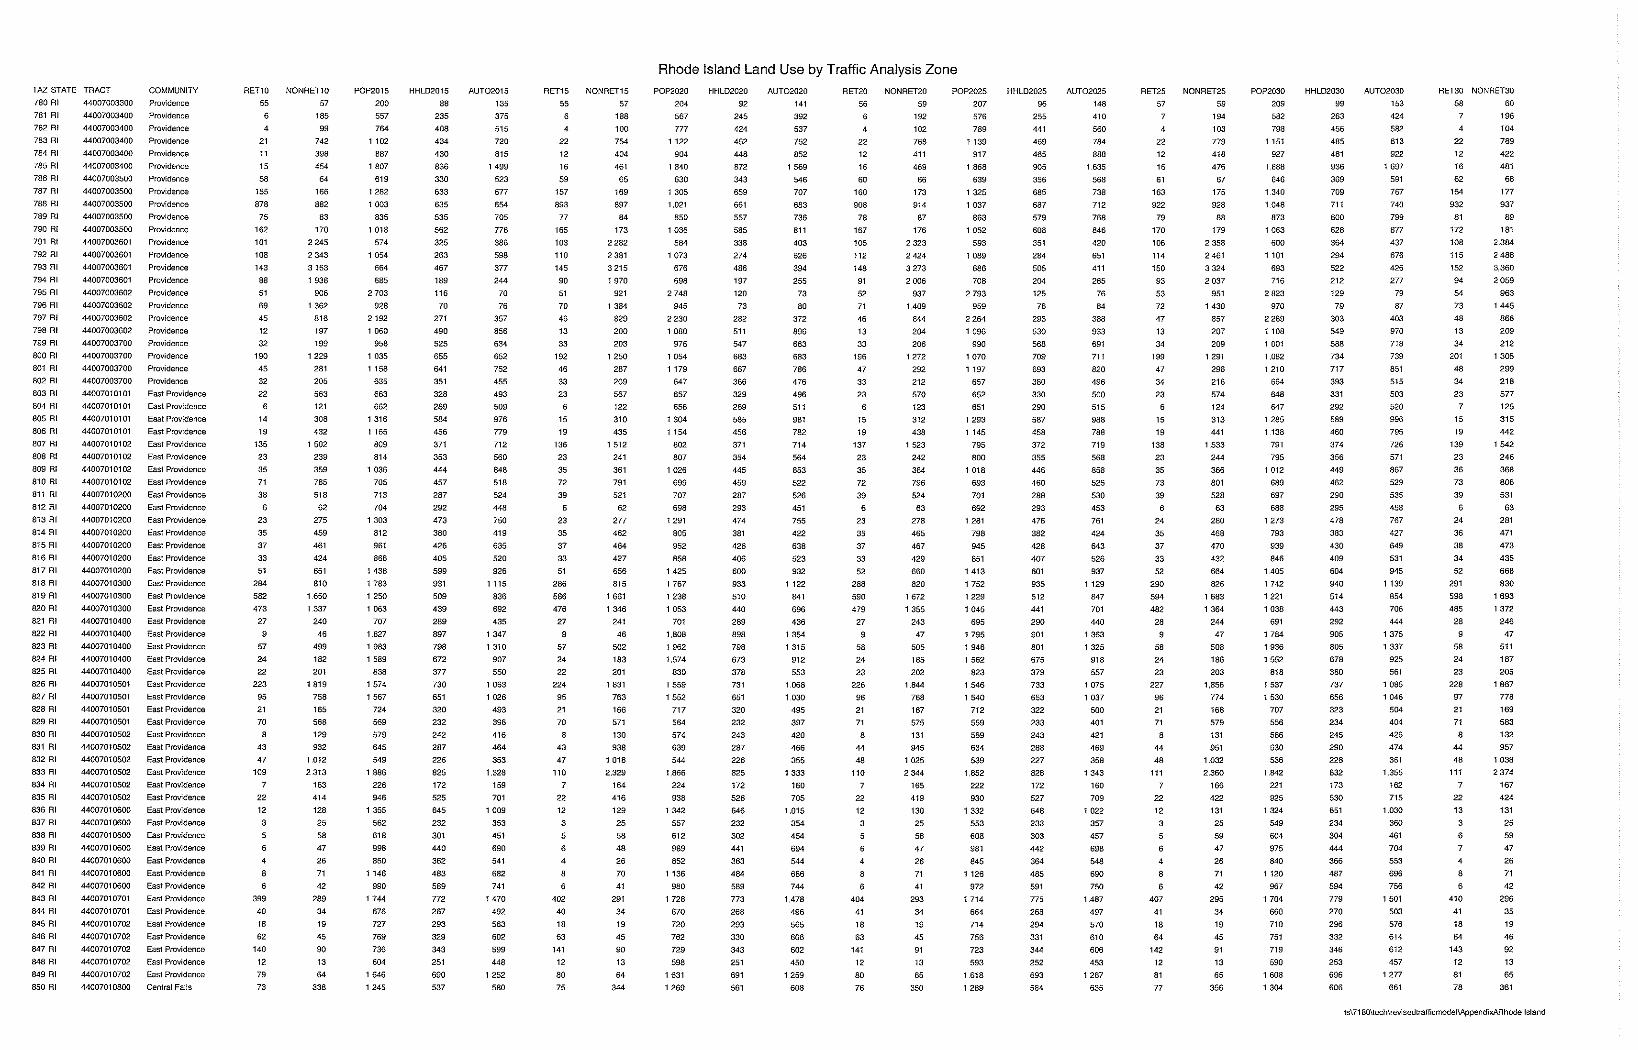
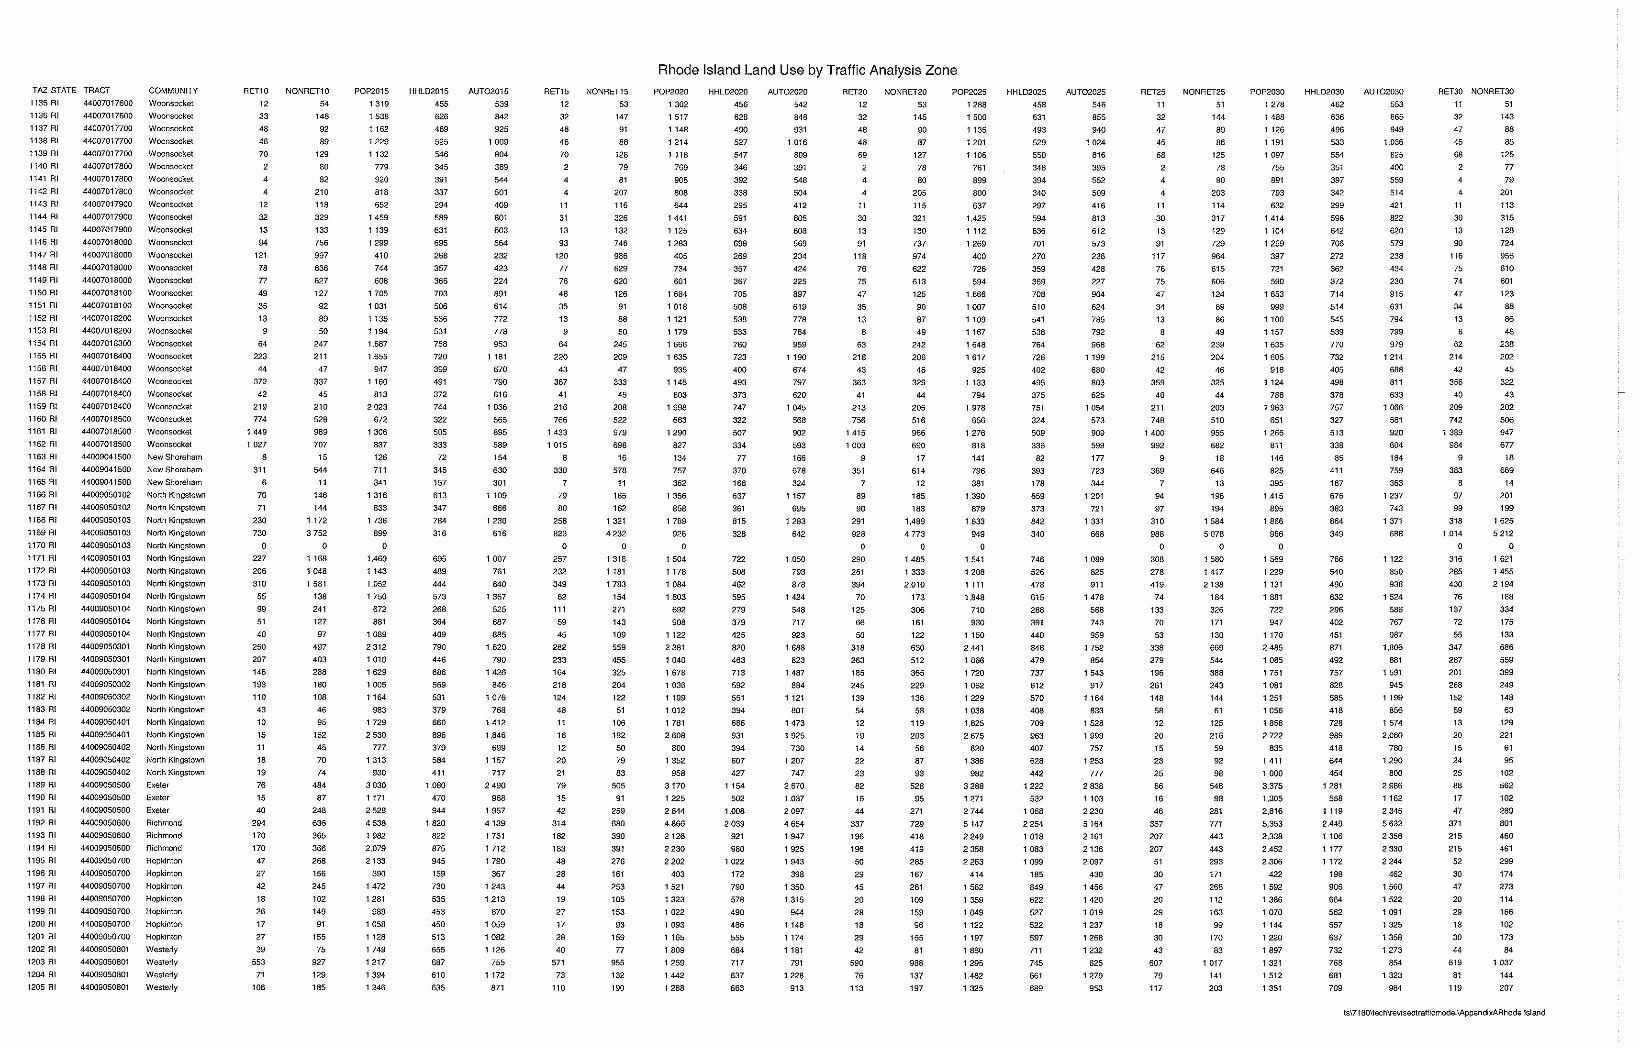
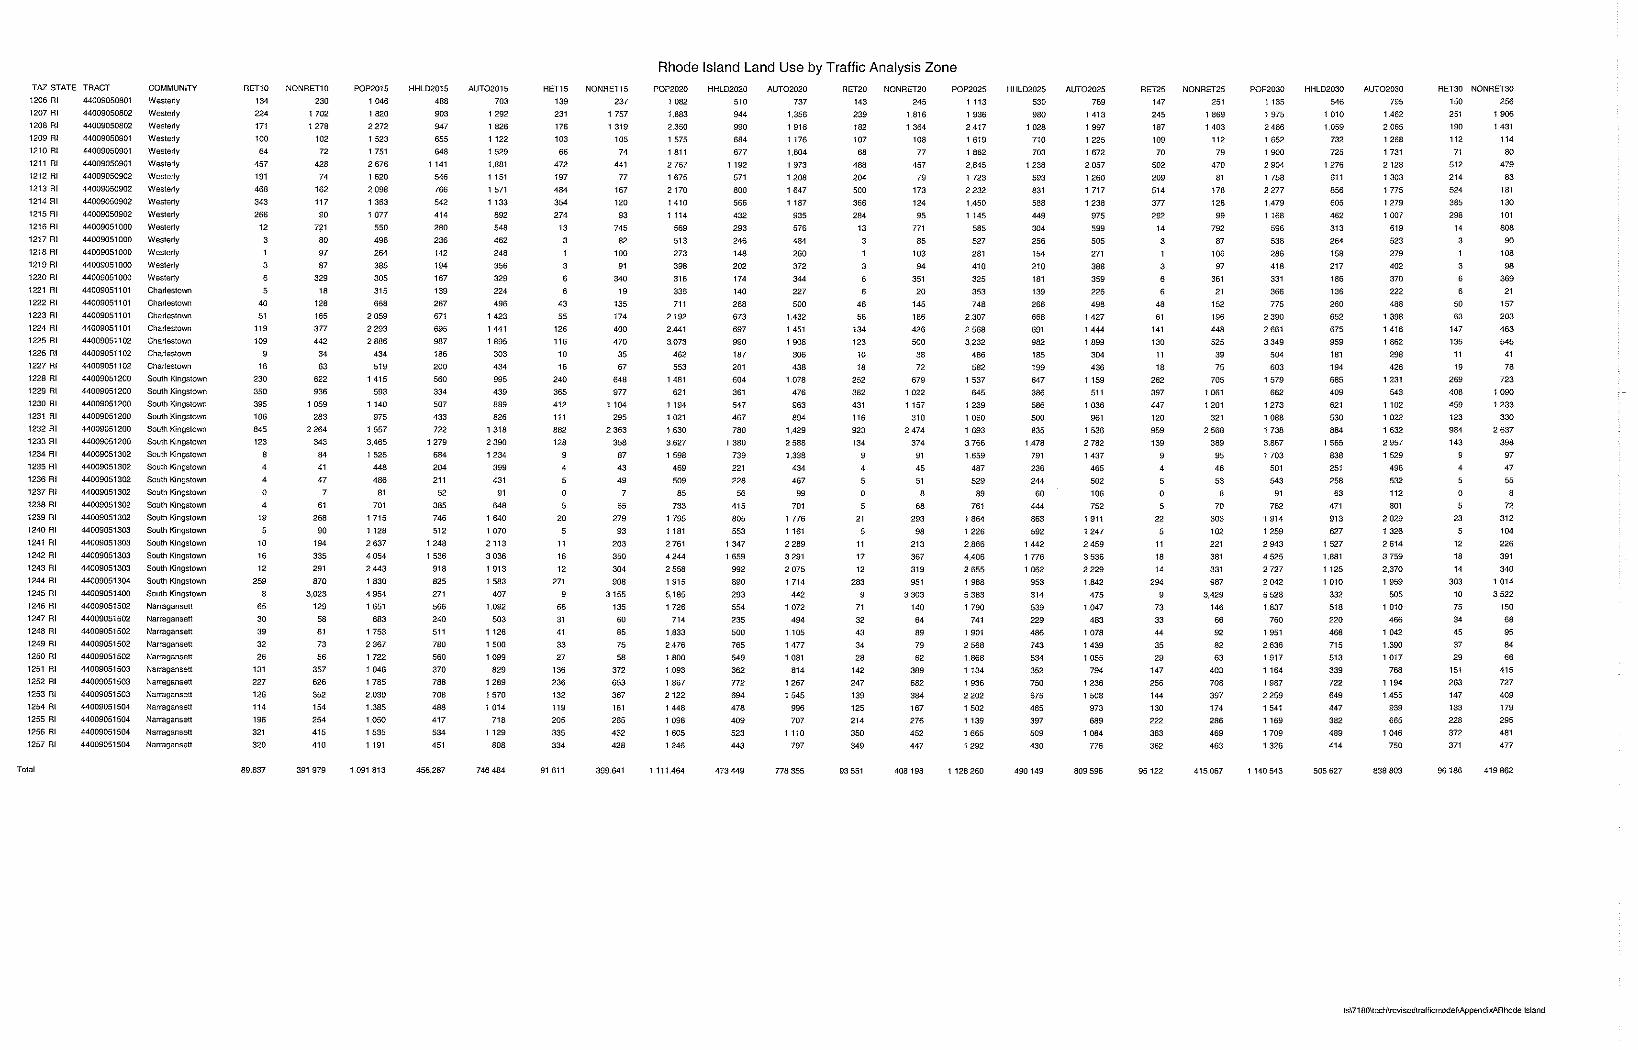
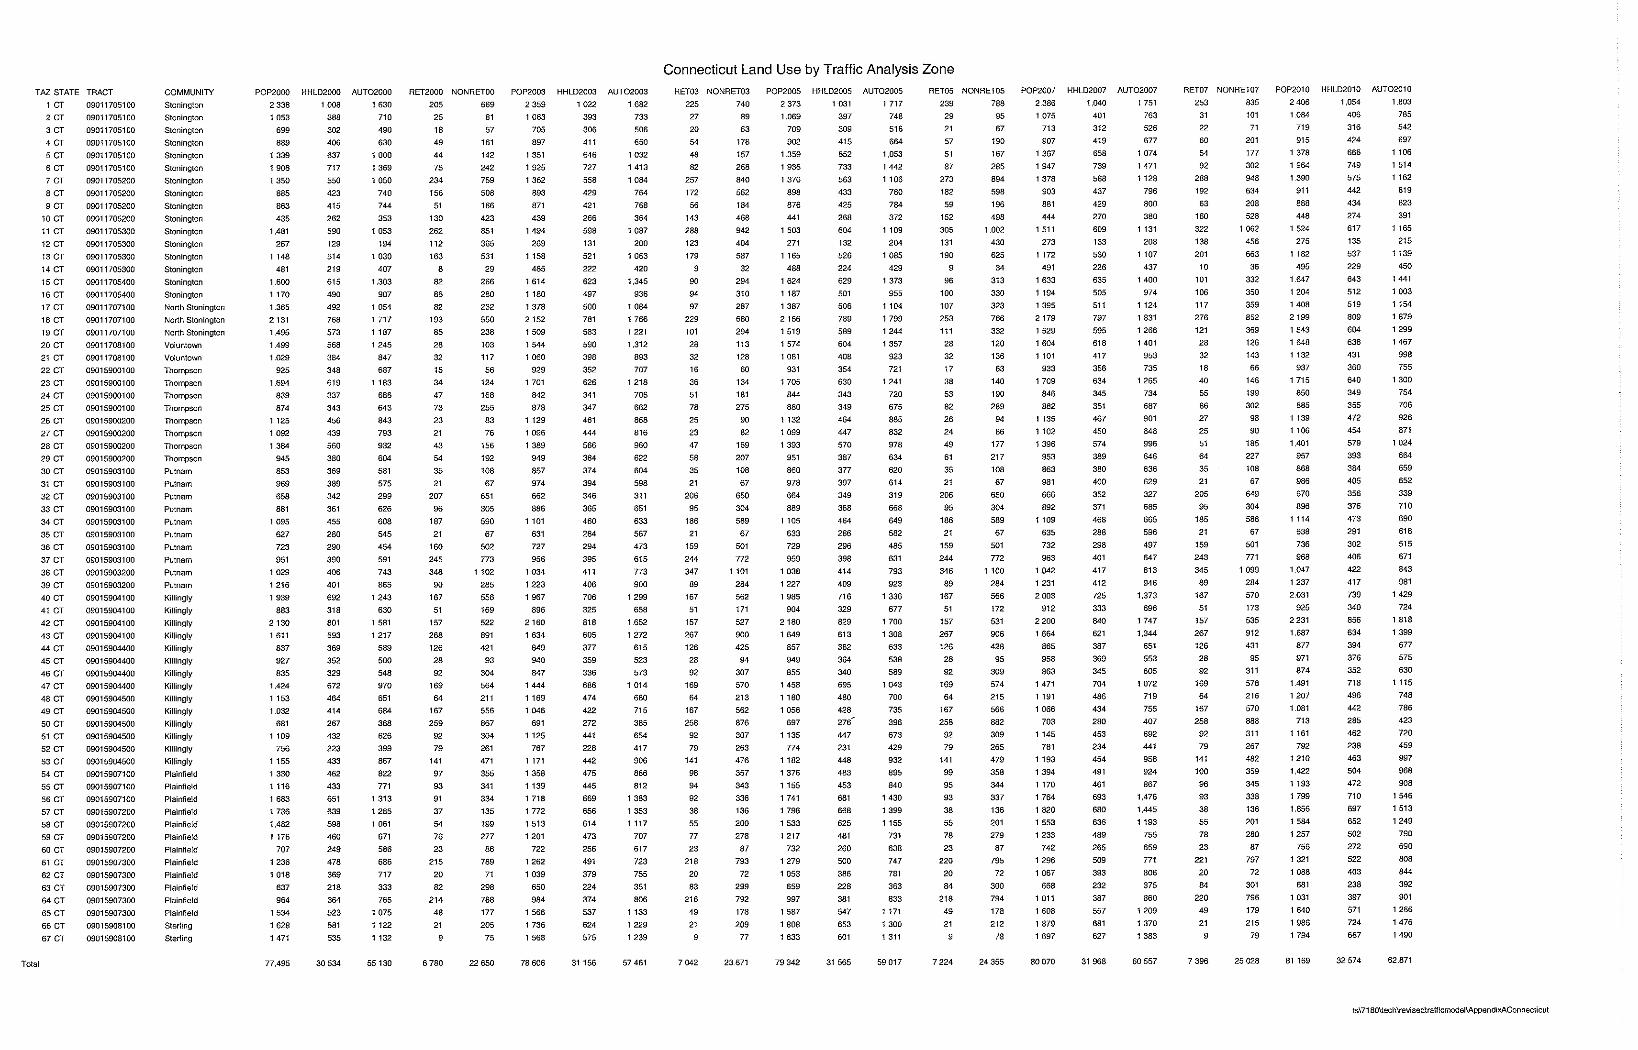
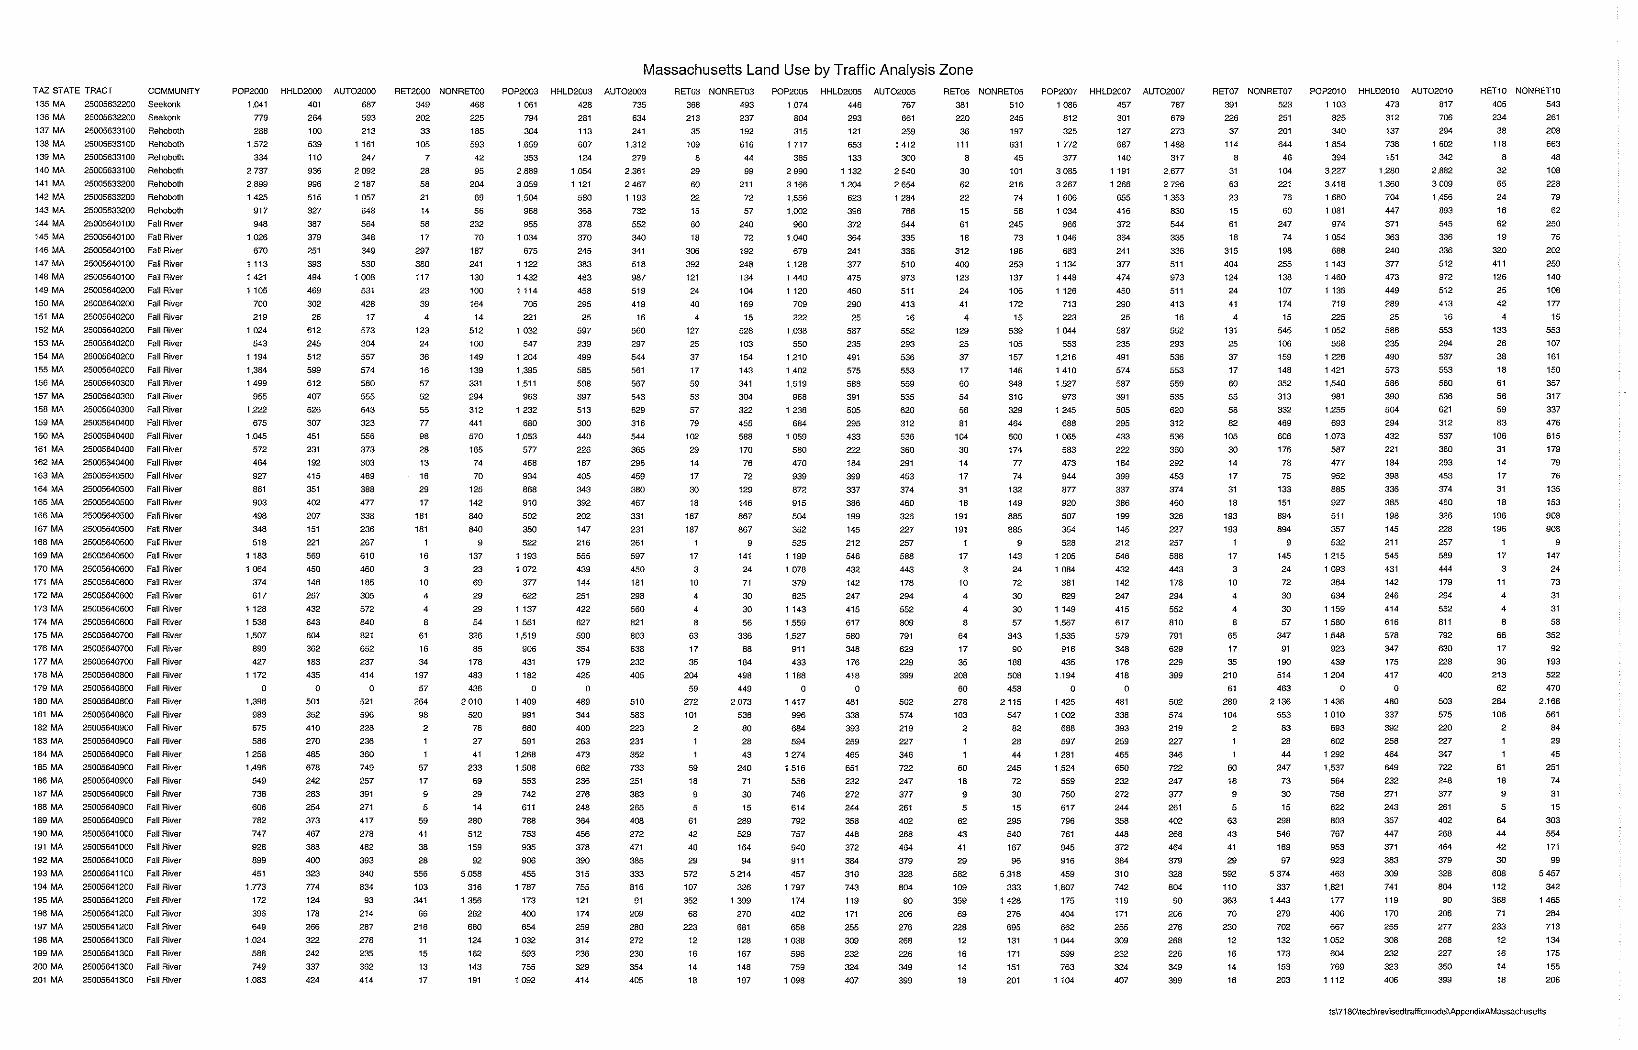
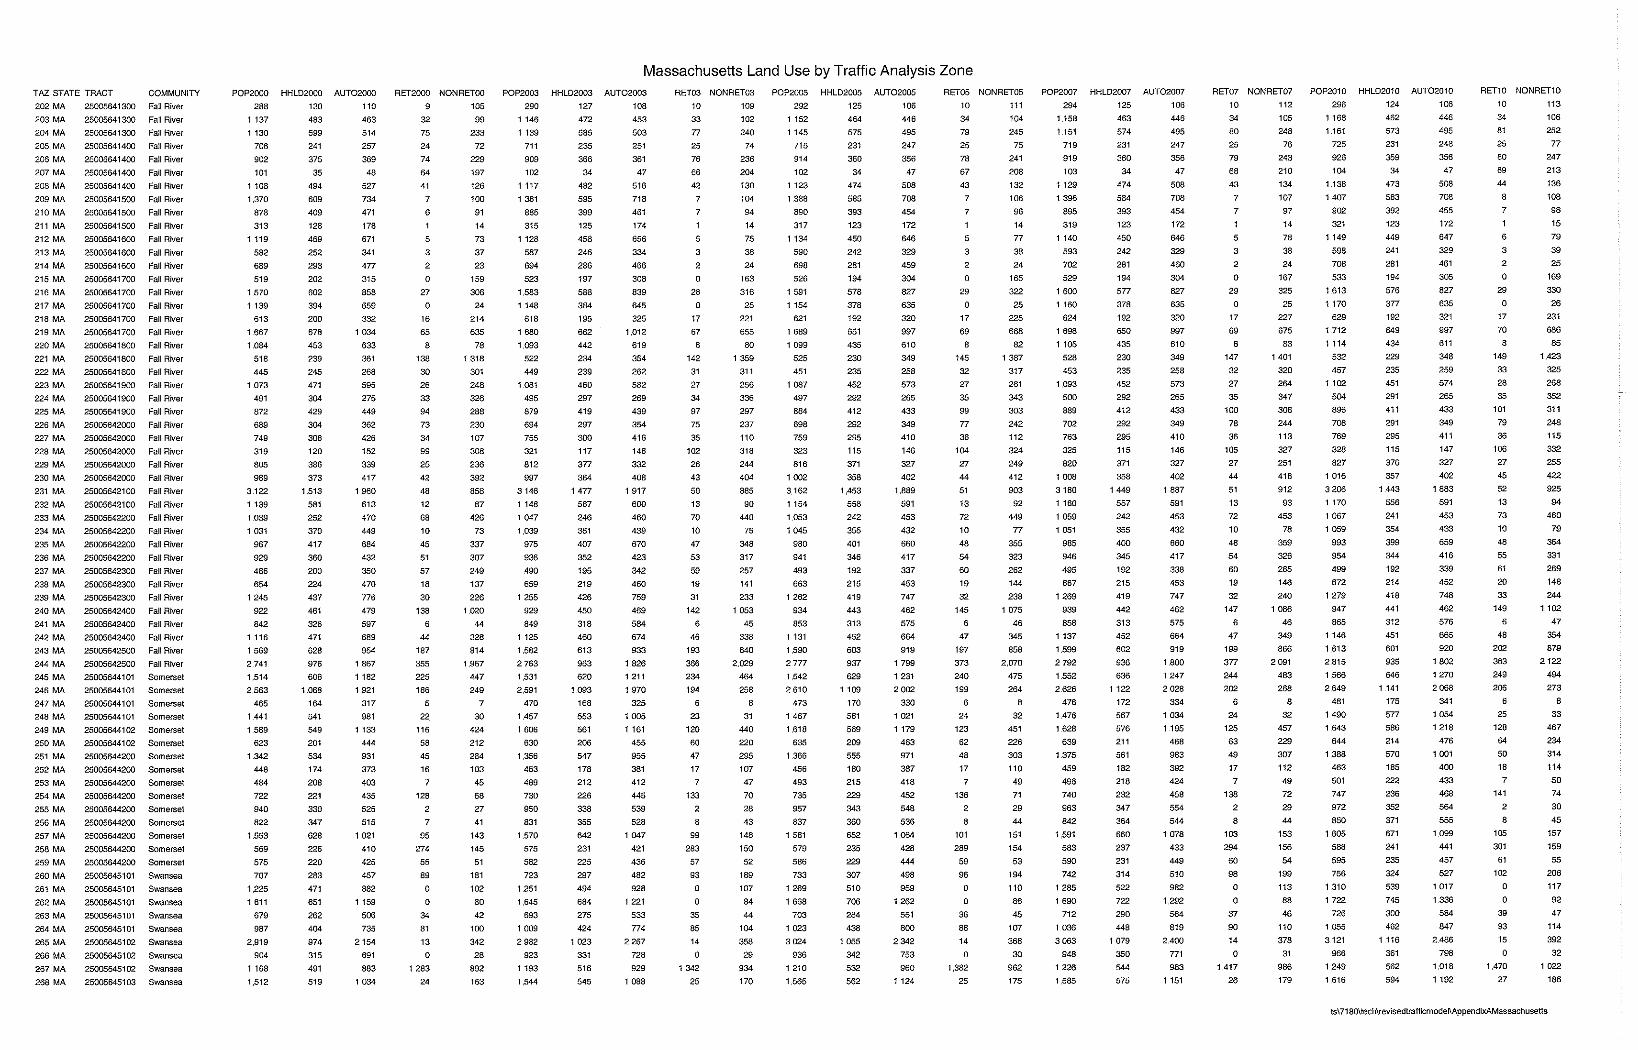
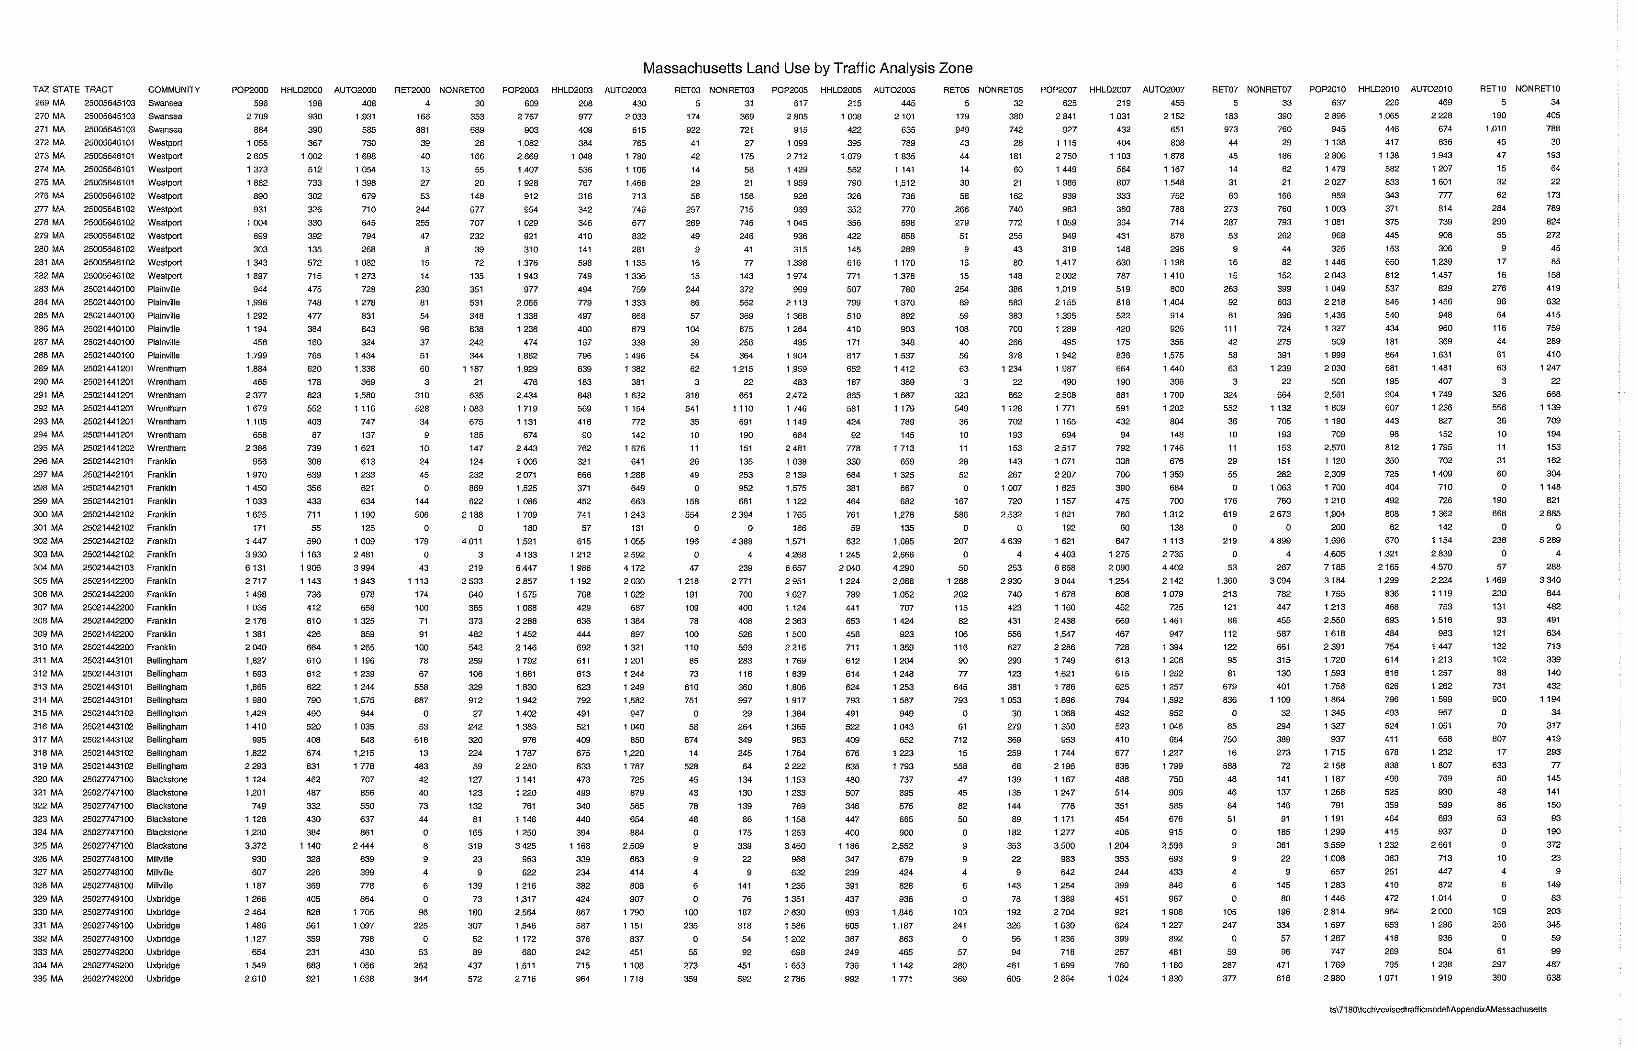
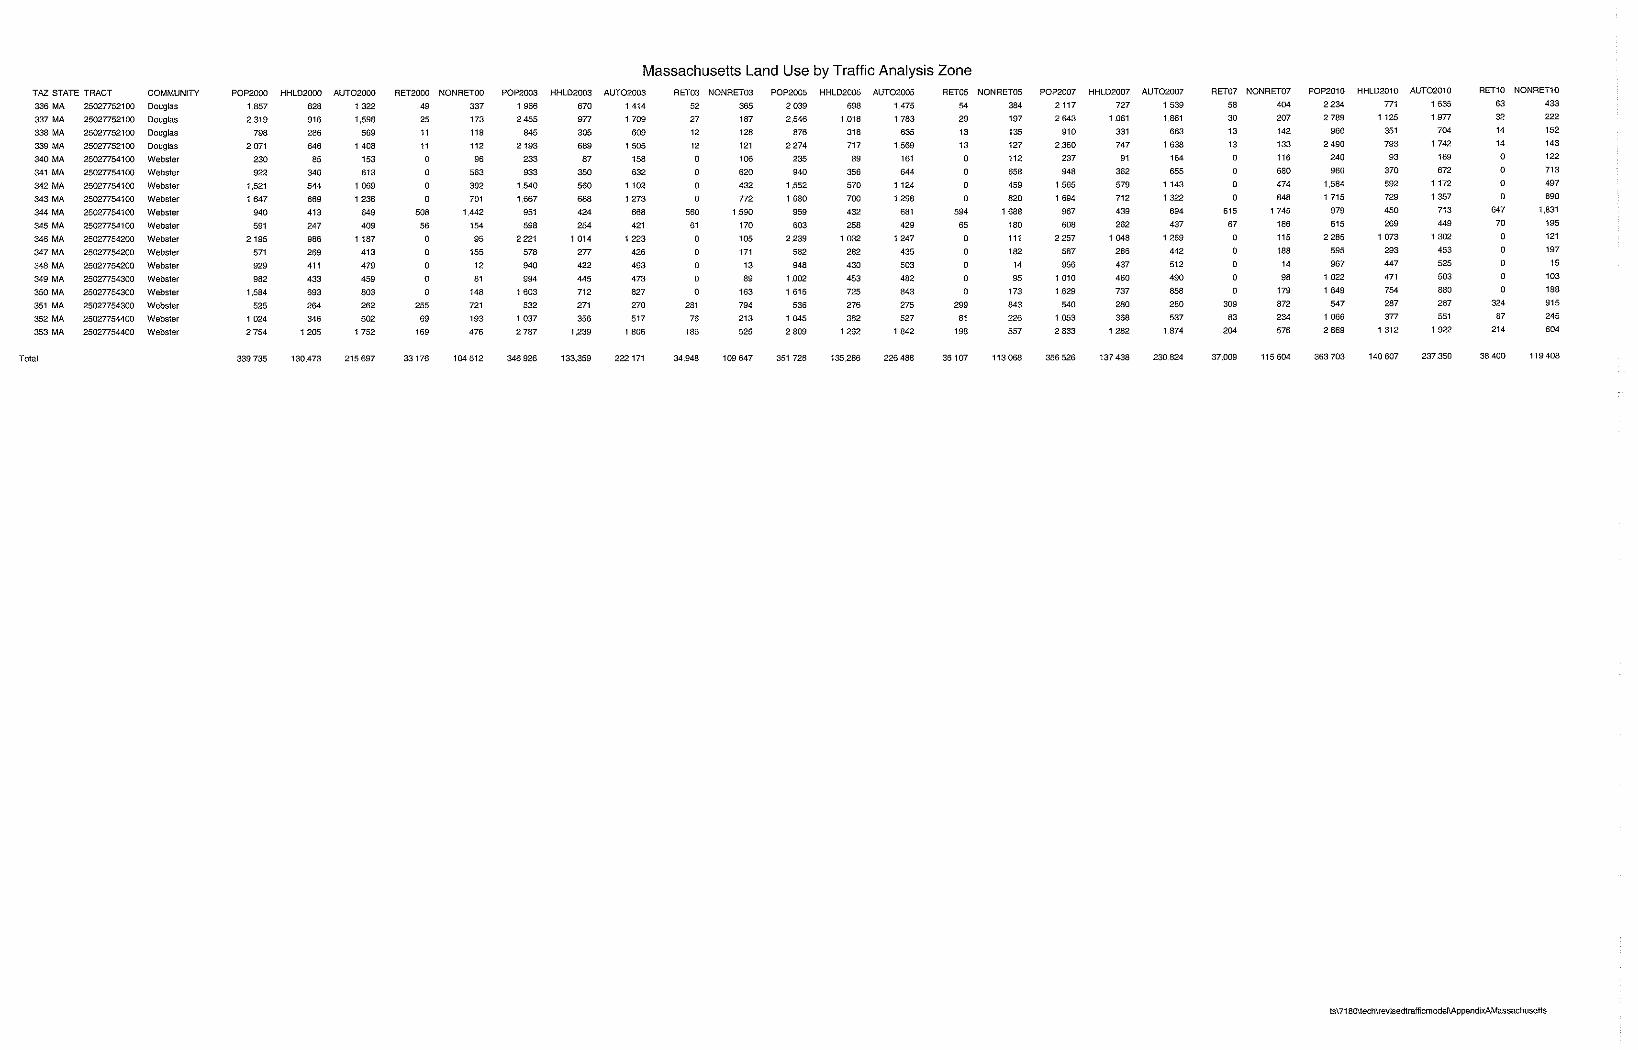
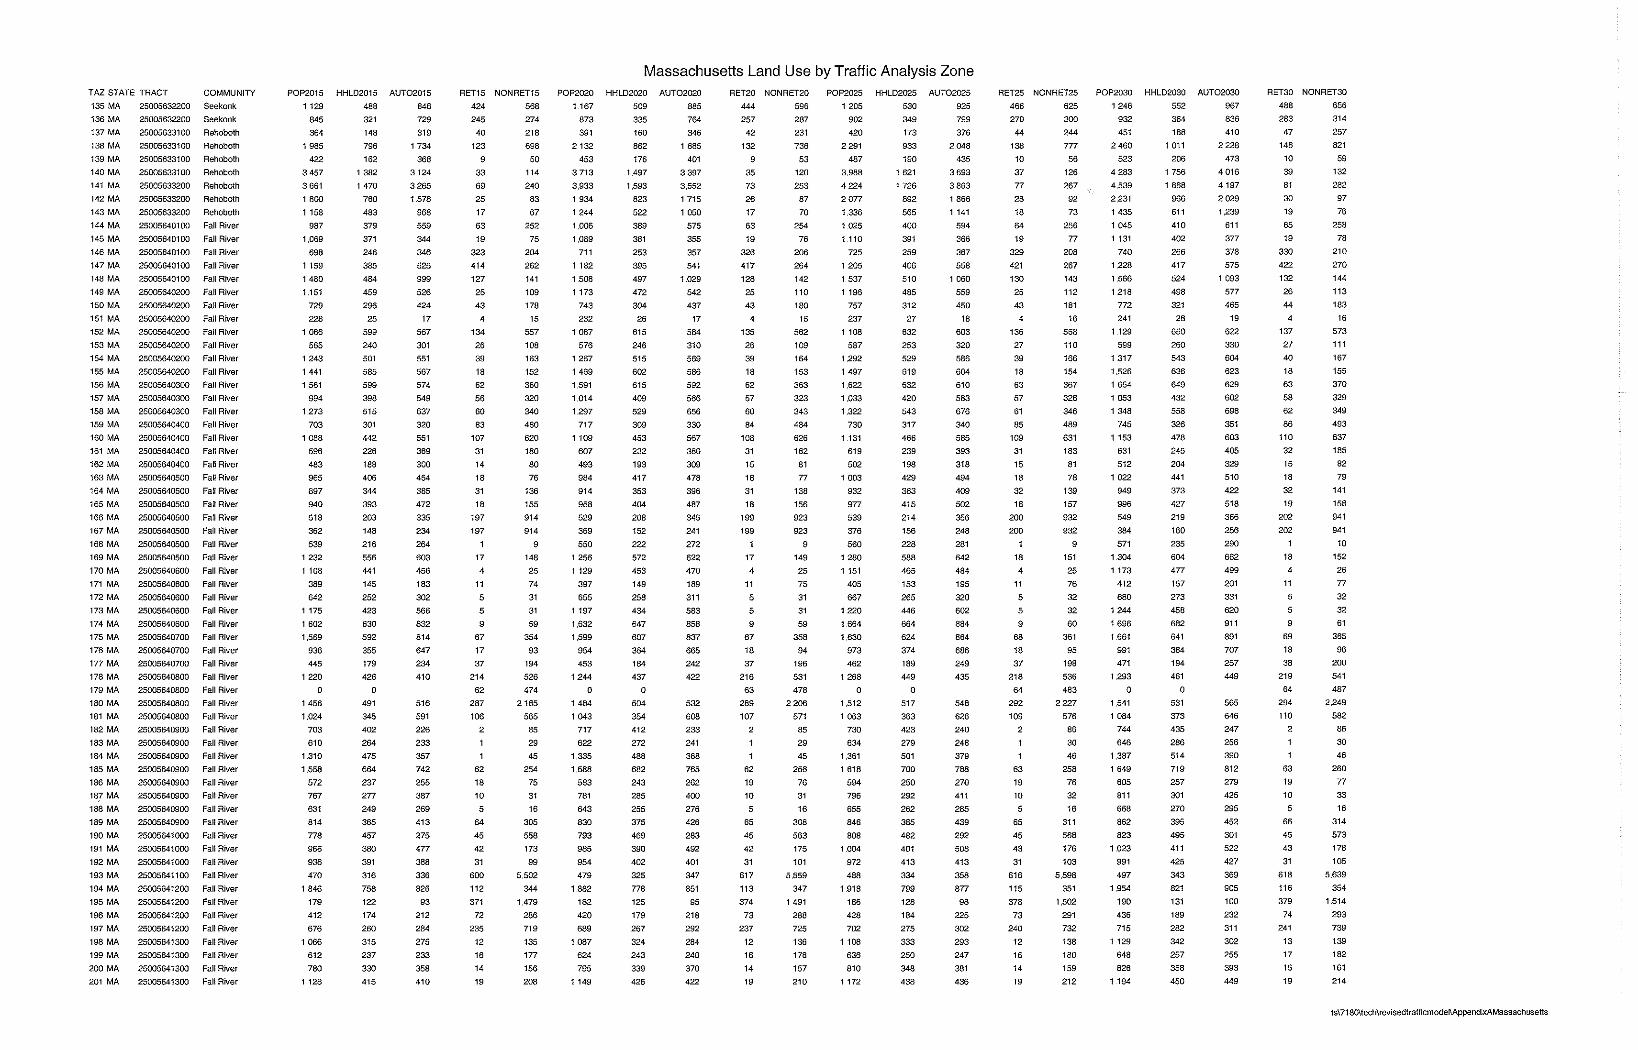
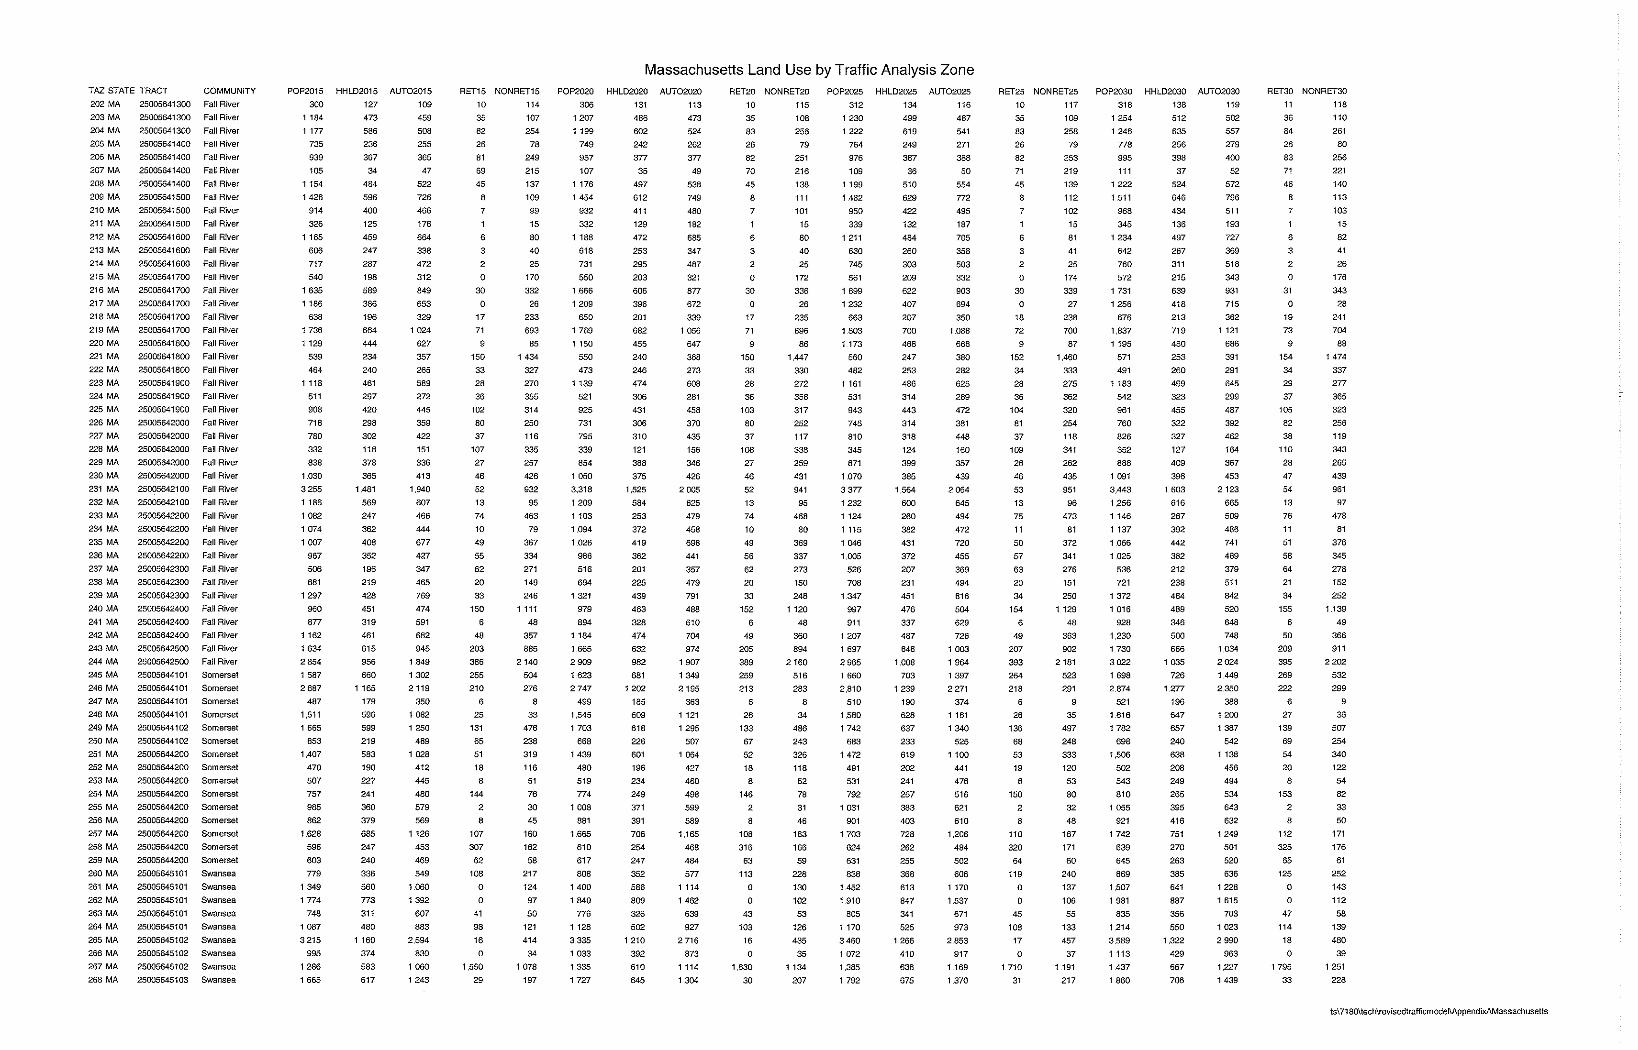
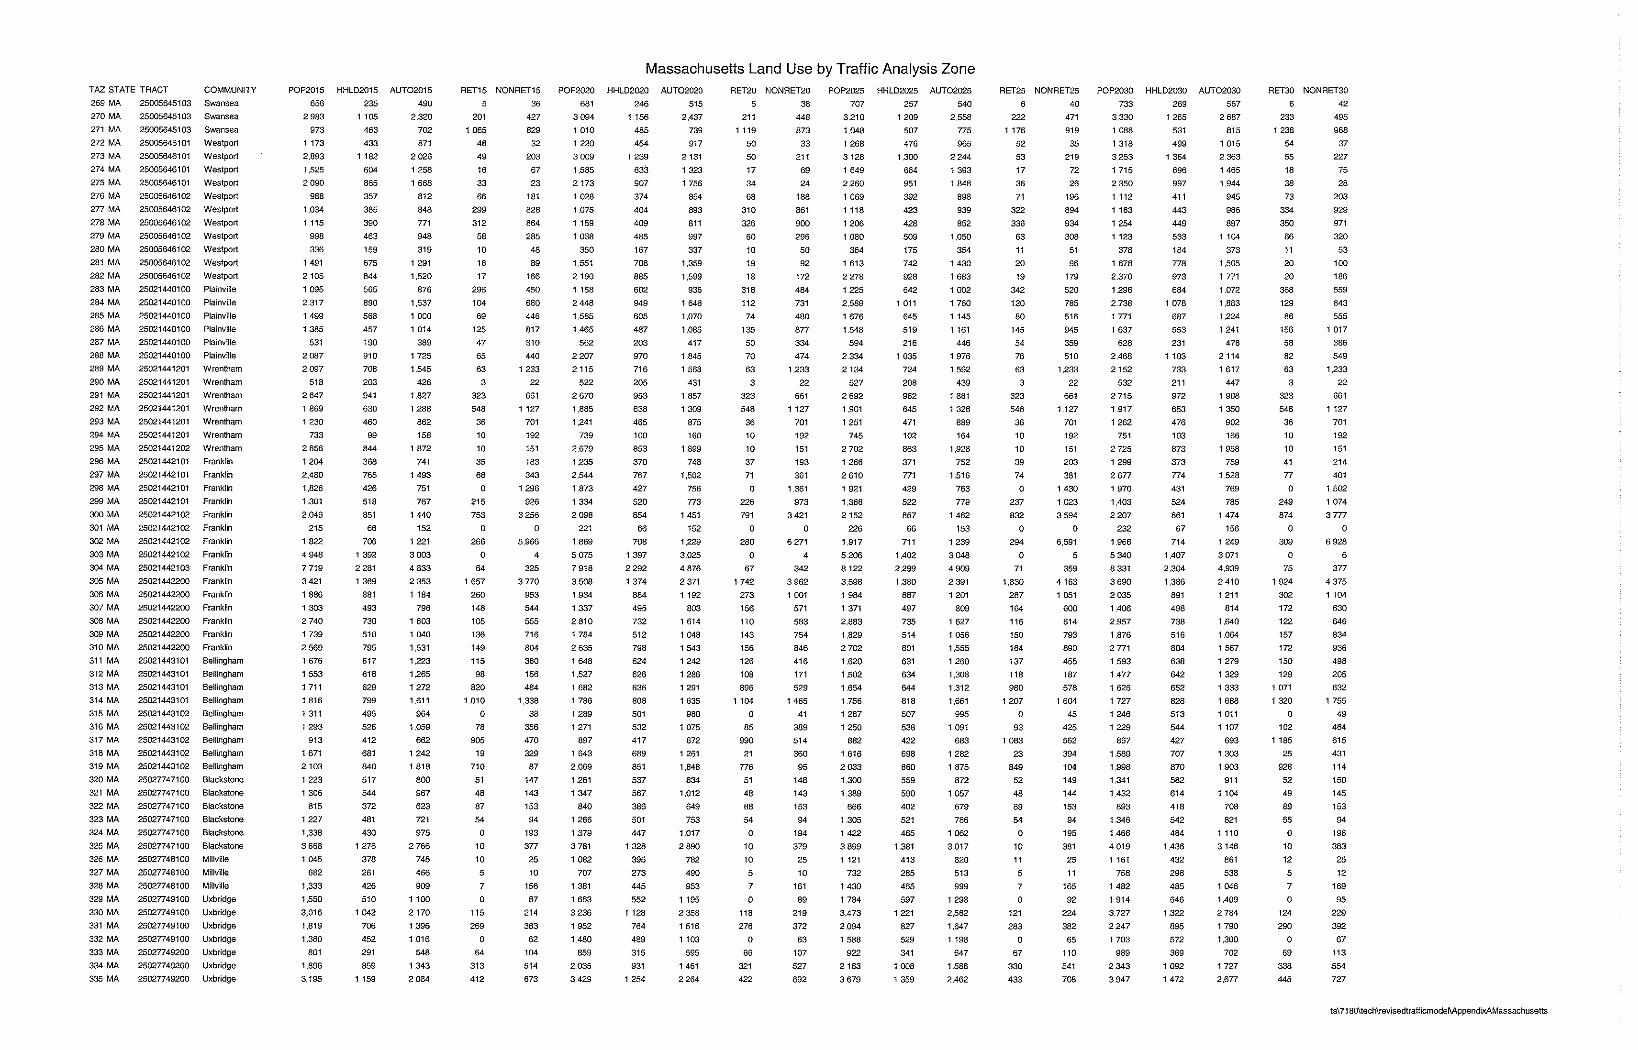
Year 2000 Household Data The year 2000 population, number of households, and number of vehicles was obtained from Caliper Corporation’s1 census CDs. The CDs contained the population and household data at the block level and the number of vehicles at the block group level for Rhode Island and portions of Massachusetts and Connecticut. The population and number of households at the block level was aggregated up to the TAZ structure. Since the numbers of vehicles were not available at the block level, the numbers of vehicles per block group were allocated down to census blocks based on the distribution of population between blocks within the same block group. This method assumed that the number of vehicles per person was the same throughout the block group. Table 2.2 shows the total household data by state. Population data, household data, and vehicle data by town and by TAZ is included in the Appendix.
1 TransCAD software developer
Chapter 2 – Traffic Analysis Zones 5
Year 2000 Employment Data The retail and non-retail employment for Rhode Island, by census tract, was provided by the RISPP. To help allocate the employment to blocks, year 2000 Dunn and Bradstreet data was used to determine the number of employers per block. Dunn and Bradstreet data contains the geographic location of each employer as well as the number of employees and employment type. The employment by tract from DOA was then distributed to census blocks by the distribution of employers among blocks within the same census tract. The first round of employment allocation was reviewed by the RISPP. After the review, the allocation of employment was adjusted based on the RISPP comments as well as a list of Rhode Island’s top 100 employers (as of April of 2002), obtained from the Rhode Island Economic Development Corporation, Research Division. In some instances, it was necessary to shift employment between retail and non-retail employment to appropriately take into account large employers. An additional adjustment was made in the Aquidneck Island area. Aquidneck Island recently developed a sub-regional model with greater detail. During model development, an employment survey was conducted to better understand the distribution of employment on the Island. The distribution of employment from the Aquidneck Island was used to allocate the RISPP employment values by census tracts to the Statewide Model TAZ structure. In some instances, it was necessary to shift employment among tracts in a town to match the allocation of employment among model TAZs. The Rhode Island employment data also includes a “statewide”employment figure that is not allocated to any one city or town. This employment was allocated to blocks based on the statewide distribution of population. There are 1,801 statewide retail employees and 6,774 statewide non-retail employees that were distributed among TAZs based on the distribution of population. To determine year 2000 employment by TAZs for Massachusetts and Connecticut, the land-use assumptions from the statewide models were obtained from each state. First, the TAZ shape in the Connecticut Statewide Model was compared to the TAZ shapes in the Rhode Island Statewide Model. It was determined that the shapes varied greatly; however, the employment values in the Connecticut Statewide Model could easily be summed to a town-wide total. Second, the town-wide total of retail and non-retail employment was then allocated to the Rhode Island Statewide Model TAZs by the year 2000 Dunn and Bradstreet data distribution of employers.
Chapter 2 – Traffic Analysis Zones 6

The Massachusetts Statewide Model TAZ system was based on year 2000 census block groups. Therefore, it was simple to assign the Massachusetts year 2000 employment to the Rhode Island Statewide Model TAZs. However, there were instances where there was not a ‘one-to–one’ relationship between the two TAZ structures. The year 2000 Dunn and Bradstreet data distribution of employers was used to help allocate the employees appropriately. It was decided to not keep Rhode Island’s original model allocation of employment by TAZ because it was not as accurate as required. For example, it was previously assumed that if a town outside Rhode Island was comprised of four TAZs and contained 100 employees, each TAZ was assigned 25 employees. The method described above using Massachusetts data, Connecticut data, and the Dunn and Bradstreet data is more accurate than this equal-weighting assignment of employees. The year 2000 land-use assumptions in the Rhode Island Statewide Model is now consistent with the data assumed in the statewide models in Connecticut and Massachusetts. Table 2.2 includes the retail and non-retail employment by state. The employment data by town and TAZ is included in the Appendix.
Table 2.2 Year 2000 Land Use Assumptions
State Rhode Island Massachusetts Connecticut Total Population 1,048,319 339,735 77,495 1,465,549 # of Households 408,424 130,473 30,534 569,431 Average Household Size 2.57 2.60 2.54 2.57 # of Autos 658,520 215,697 55,130 929,347 Autos per Household 1.61 1.65 1.81 1.63 Retail Employment 87,818 33,176 6,780 127,774 Non-Retail Employment 378,481 104,512 22,650 505,643
Future Household Data Population forecasts for each town in Rhode Island were provided by the RISPP for the years 2005, 2010, 2015, 2020, 2025, and 2030. The forecasted population was then allocated to TAZs based on the current distribution of population among the TAZs in each town. In addition, maps provided by RISPP displaying planned housing developments were checked to ensure that large developments were properly taken into account. The model includes forecasts for both households and vehicles for 2005, 2010, 2015, 2020, and 2025. The relationship between population and households in the old model was used to convert the currently forecasted population to number of households.
Chapter 2 – Traffic Analysis Zones 7

In a similar manner, the relationship between population and vehicles in the previous model was used to determine the updated number of vehicles per TAZ in the current model. In general, the household size decreased over time and the number of vehicles per household increased over time and is consistent with Connecticut and Massachusetts future forecasts. Table 2.3 shows the forecasted values for each of the years. The forecasts for the years 2003 and 2007 were interpolated between 2000 and 2005 and 2005 and 2010, respectively. Land use forecasts were needed for 2003 to calibrate the model output to the most recent Highway Performance Monitoring System (HPMS) traffic data (2003). FHWA requires state DOT’s to collect the HPMS sample count data from roads throughout the state. This calibration ensured the appropriateness of the assumptions used in the model and helped determine HPMS adjustment factors for the air quality analysis. Land use forecasts were also needed for the year 2007 because 2007 is the base year used for air quality conformity analysis. Table 2.3 Rhode Island Household Land Use Forecast Assumptions
Year Population Number of
Households Household
Size Number of
Autos Autos per Household
2000 1,048,319 408,424 2.57 658,520 1.61 2003 1,056,798 418,131 2.53 676,165 1.62 2005 1,062,441 424,558 2.50 687,954 1.62 2007 1,067,139 430,970 2.48 699,712 1.62 2010 1,074,199 440,602 2.44 717,385 1.63 2015 1,091,813 456,287 2.39 746,484 1.64 2020 1,111,464 473,449 2.35 778,355 1.64 2025 1,128,260 490,149 2.30 809,596 1.65 2030 1,140,543 505,627 2.26 838,803 1.66
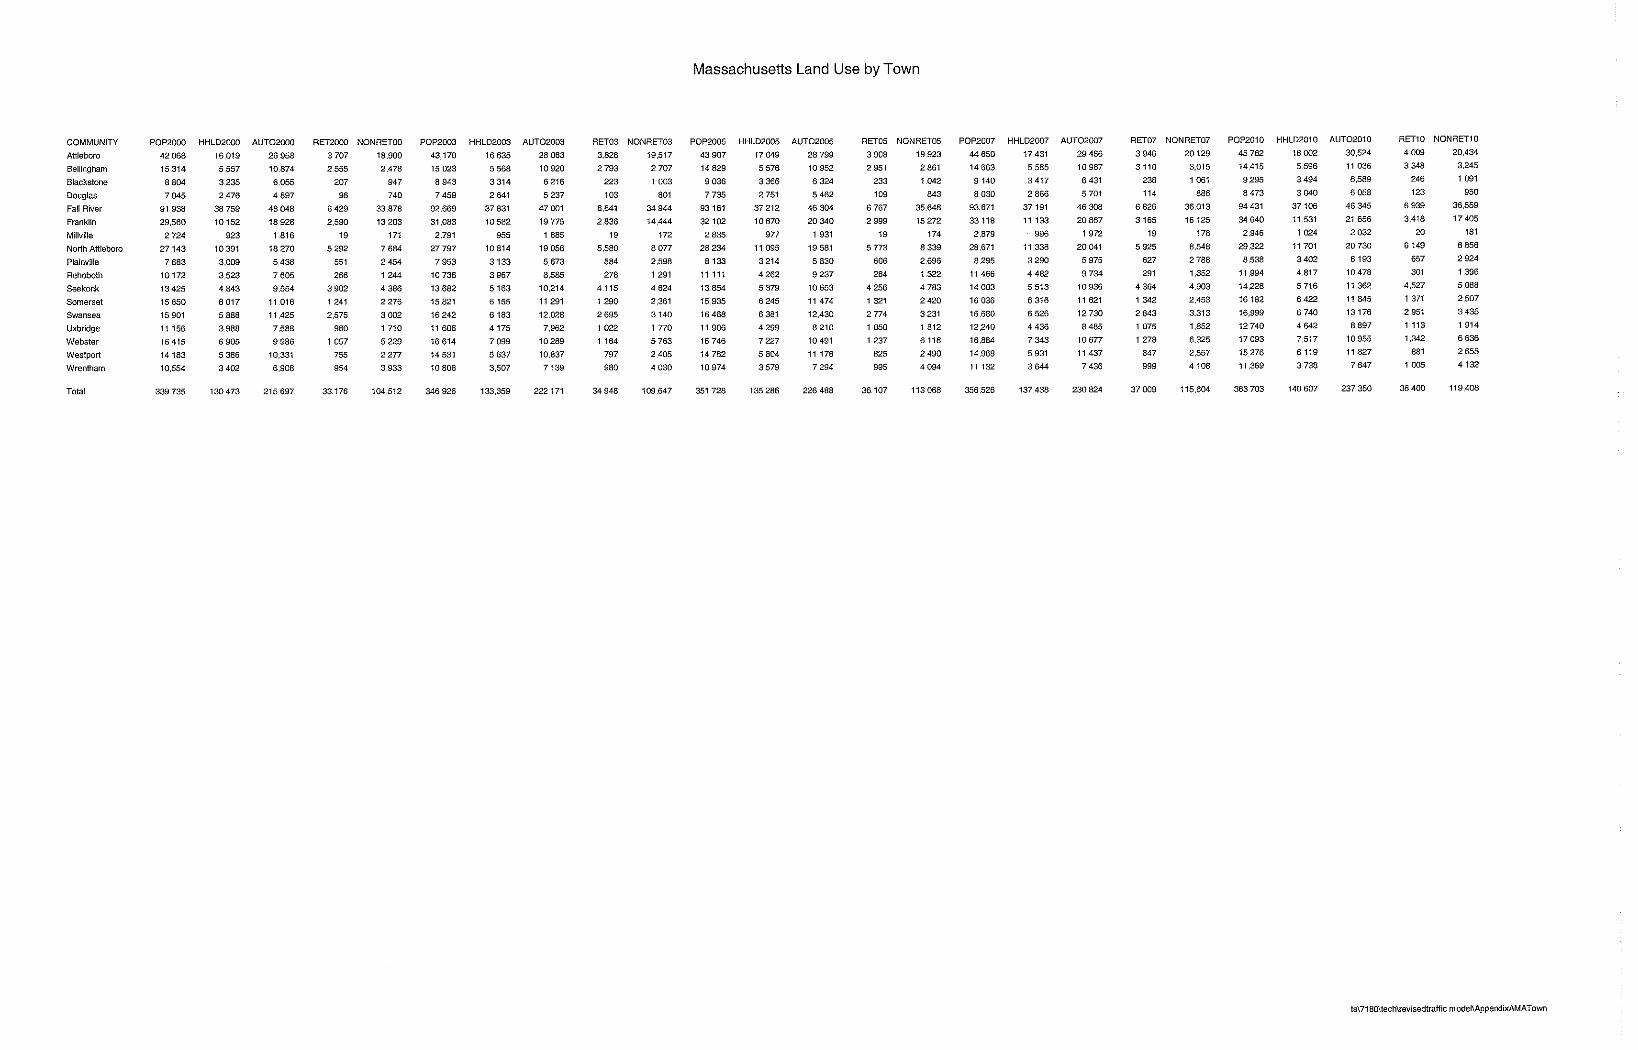
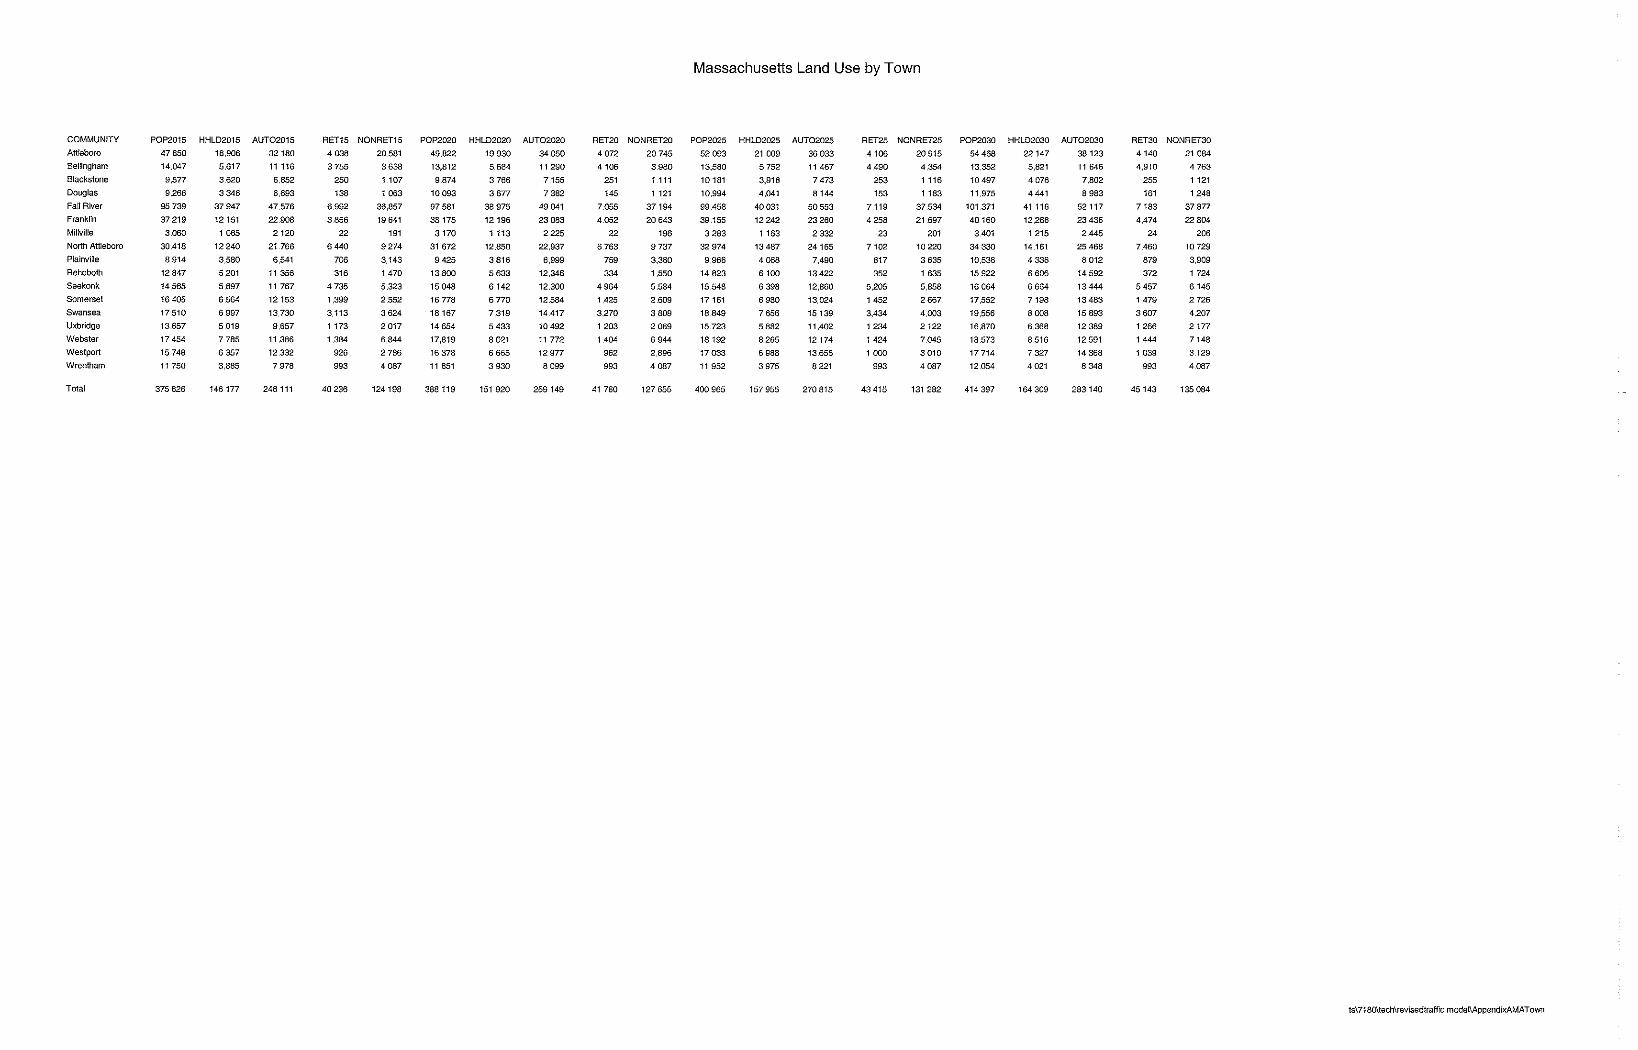
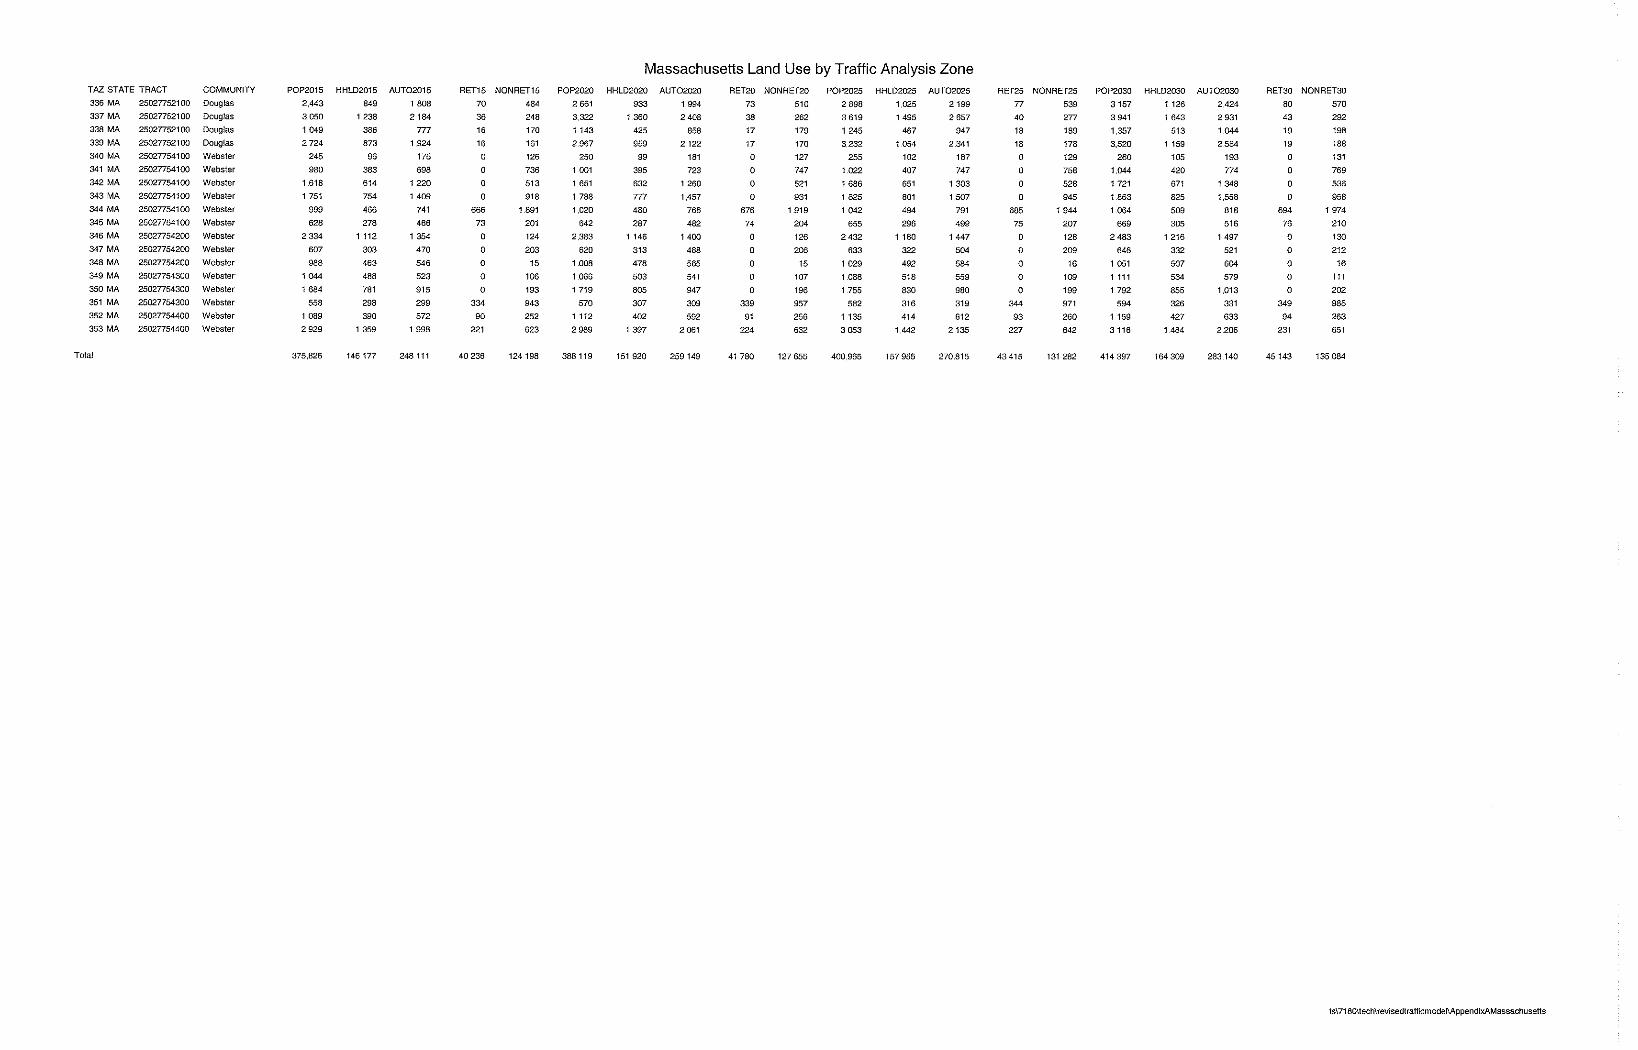
The land use forecasts for Massachusetts towns were extracted from its statewide model for the years 2007, 2015, and 2025. The interim years of 2003, 2005, 2010, and 2020 as well as 2030 were interpolated/extrapolated between/from the data for the given years. The number of vehicles per TAZ was calculated based on the relationship between households and vehicles from the old model. Table 2.4 shows the resulting land use forecasts for nine analysis years.
Chapter 2 – Traffic Analysis Zones 8

Table 2.4 Massachusetts Household Land Use Forecast Assumptions
Year Population Number of
Households Household
Size Number of
Autos Autos per Household
2000 339,735 130,473 2.60 215,697 1.65 2003 346,926 133,359 2.60 222,171 1.67 2005 351,728 135,286 2.60 226,488 1.67 2007 356,526 137,438 2.59 230,824 1.68 2010 363,703 140,607 2.59 237,350 1.69 2015 375,826 146,177 2.57 248,111 1.70 2020 388,119 151,920 2.55 259,149 1.71 2025 400,965 157,955 2.54 270,815 1.69 2030 414,397 164,309 2.52 283,140 1.72
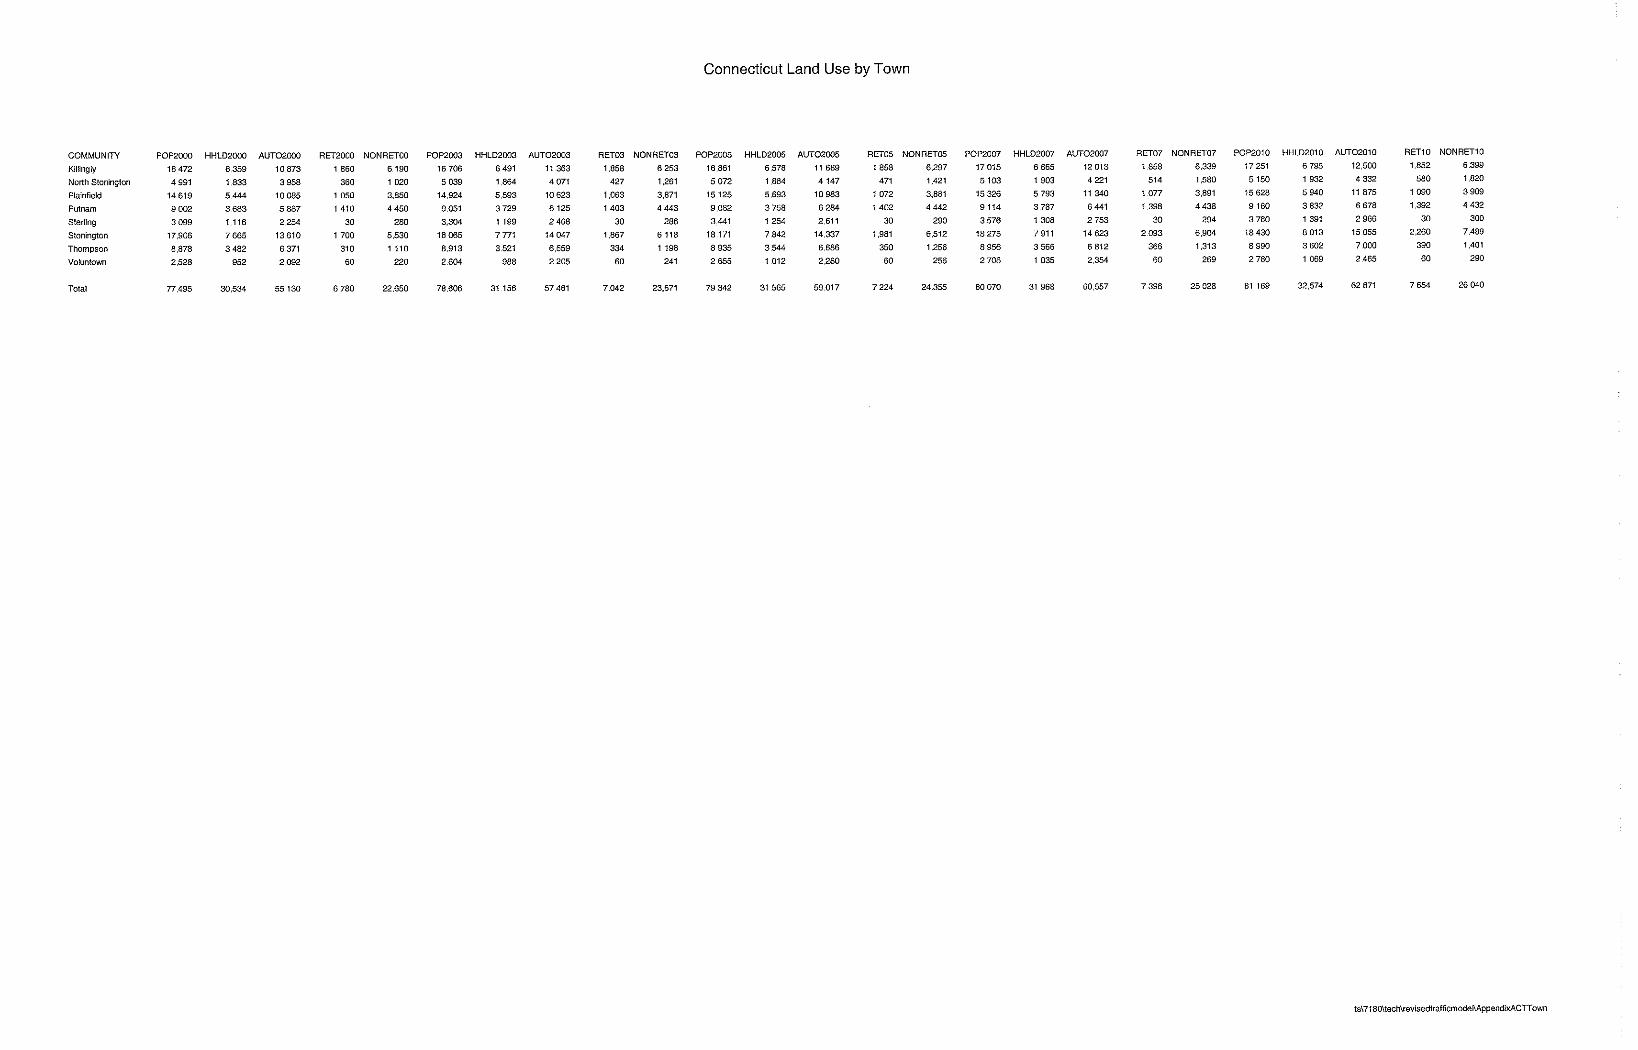
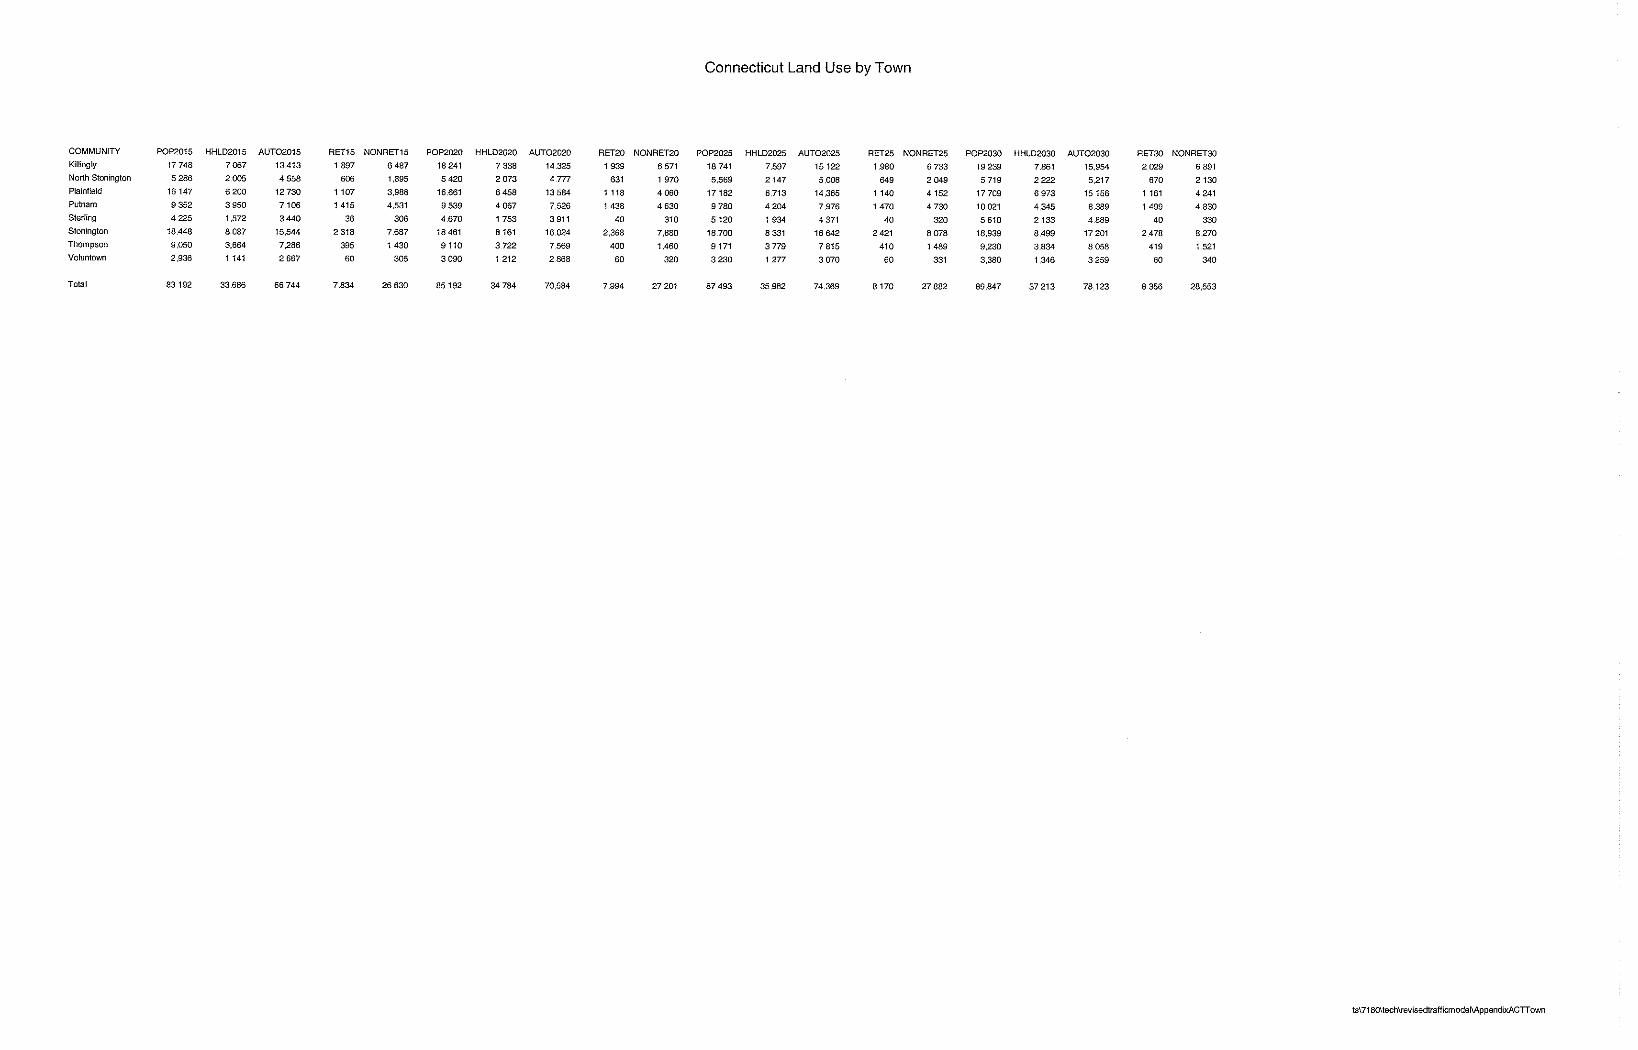
Similiarly, the land use forecasts for Connecticut were extracted from Connecticut’s Statewide Model, and also includes interpolating the years 2003 and 2007 between years 2000 and 2005 and 2005 and 2010, respectively. Table 5 shows the resulting land use forecasts for the nine analysis years. Table 2.5 Connecticut Household Land Use Forecast Assumptions
Year Population Number of
Households Household
Size Number of
Autos Autos per Household
2000 77,495 30,534 2.54 55,130 1.81 2003 78,606 31,156 2.52 57,461 1.84 2005 79,342 31,565 2.51 59,017 1.87 2007 80,070 31,968 2.50 60,557 1.89 2010 81,169 32,574 2.49 62,871 1.93 2015 83,192 33,686 2.47 66,744 1.98 2020 85,192 34,784 2.45 70,584 2.03 2025 87,493 35,982 2.54 74,369 2.07 2030 89,847 37,213 2.52 78,123 2.10
The final forecasts for each model TAZ are included in the Appendix.
Future Employment Data As noted above, RISPP provided retail and non-retail 2000 employment and future year forecasts at the census tract level.
Chapter 2 – Traffic Analysis Zones 9
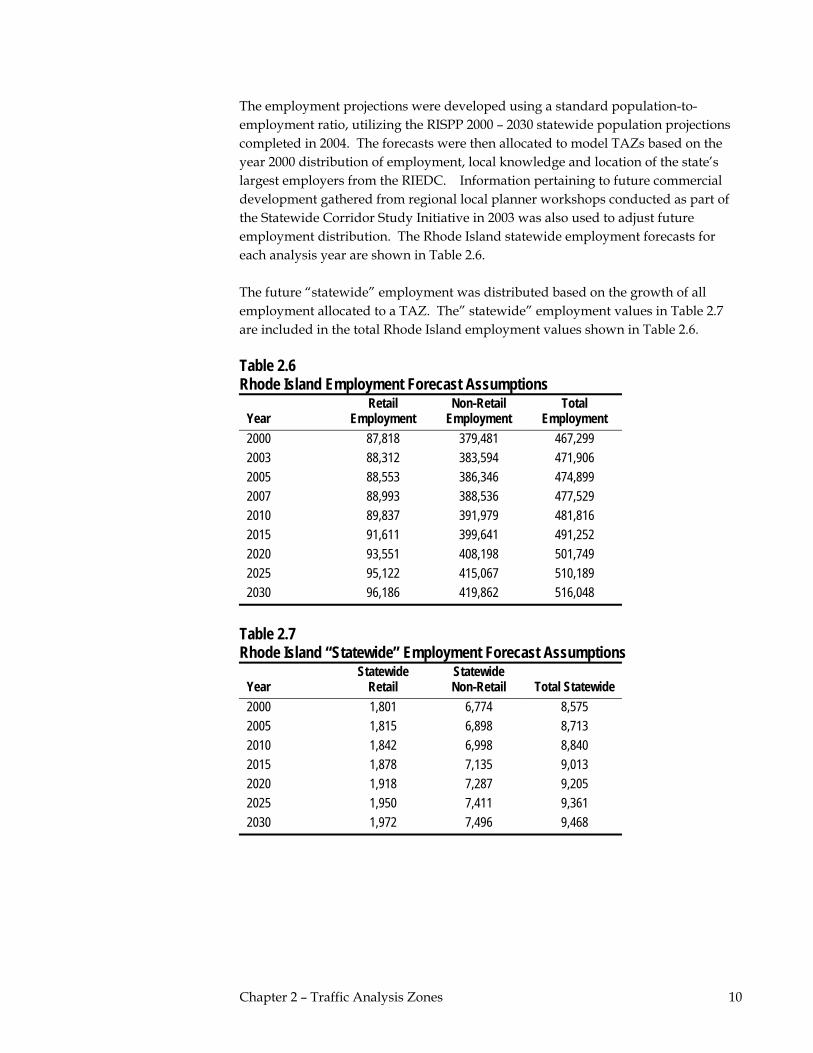
The employment projections were developed using a standard population-to-employment ratio, utilizing the RISPP 2000 – 2030 statewide population projections completed in 2004. The forecasts were then allocated to model TAZs based on the year 2000 distribution of employment, local knowledge and location of the state’s largest employers from the RIEDC. Information pertaining to future commercial development gathered from regional local planner workshops conducted as part of the Statewide Corridor Study Initiative in 2003 was also used to adjust future employment distribution. The Rhode Island statewide employment forecasts for each analysis year are shown in Table 2.6. The future “statewide” employment was distributed based on the growth of all employment allocated to a TAZ. The” statewide” employment values in Table 2.7 are included in the total Rhode Island employment values shown in Table 2.6. Table 2.6 Rhode Island Employment Forecast Assumptions
Year Retail
Employment Non-Retail
Employment Total
Employment 2000 87,818 379,481 467,299 2003 88,312 383,594 471,906 2005 88,553 386,346 474,899 2007 88,993 388,536 477,529 2010 89,837 391,979 481,816 2015 91,611 399,641 491,252 2020 93,551 408,198 501,749 2025 95,122 415,067 510,189 2030 96,186 419,862 516,048
Table 2.7 Rhode Island “Statewide” Employment Forecast Assumptions
Year Statewide
Retail Statewide Non-Retail Total Statewide
2000 1,801 6,774 8,575 2005 1,815 6,898 8,713 2010 1,842 6,998 8,840 2015 1,878 7,135 9,013 2020 1,918 7,287 9,205 2025 1,950 7,411 9,361 2030 1,972 7,496 9,468
Chapter 2 – Traffic Analysis Zones 10
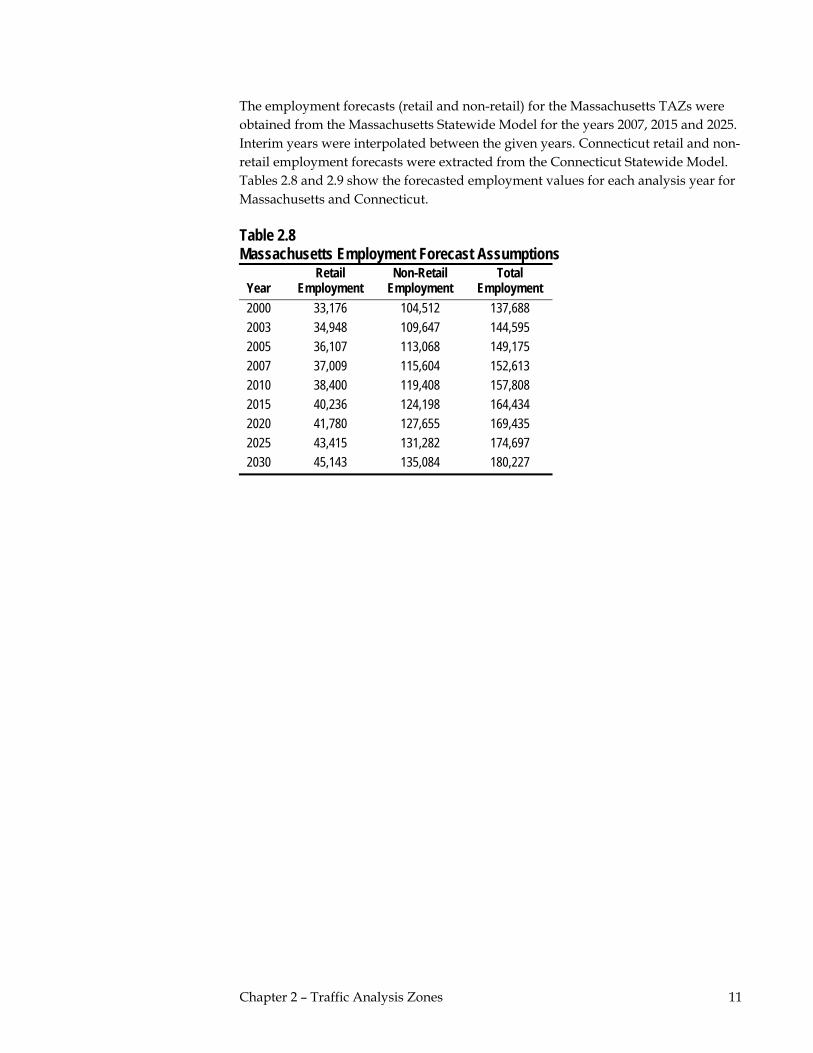
The employment forecasts (retail and non-retail) for the Massachusetts TAZs were obtained from the Massachusetts Statewide Model for the years 2007, 2015 and 2025. Interim years were interpolated between the given years. Connecticut retail and non-retail employment forecasts were extracted from the Connecticut Statewide Model. Tables 2.8 and 2.9 show the forecasted employment values for each analysis year for Massachusetts and Connecticut. Table 2.8 Massachusetts Employment Forecast Assumptions
Year Retail
Employment Non-Retail
Employment Total
Employment 2000 33,176 104,512 137,688 2003 34,948 109,647 144,595 2005 36,107 113,068 149,175 2007 37,009 115,604 152,613 2010 38,400 119,408 157,808 2015 40,236 124,198 164,434 2020 41,780 127,655 169,435 2025 43,415 131,282 174,697 2030 45,143 135,084 180,227
Chapter 2 – Traffic Analysis Zones 11

Table 2.9 Connecticut Employment Forecast Assumptions
Year Retail
Employment Non-Retail
Employment Total
Employment 2000 6,780 22,650 29,430 2003 7,032 23,671 30,706 2005 7,224 24,355 31,579 2007 7,396 25,028 32,424 2010 7,654 26,040 33,694 2015 7,834 26,630 34,464 2020 7,994 27,201 35,195 2025 8,170 27,882 36,052 2030 8,356 28,553 36,909
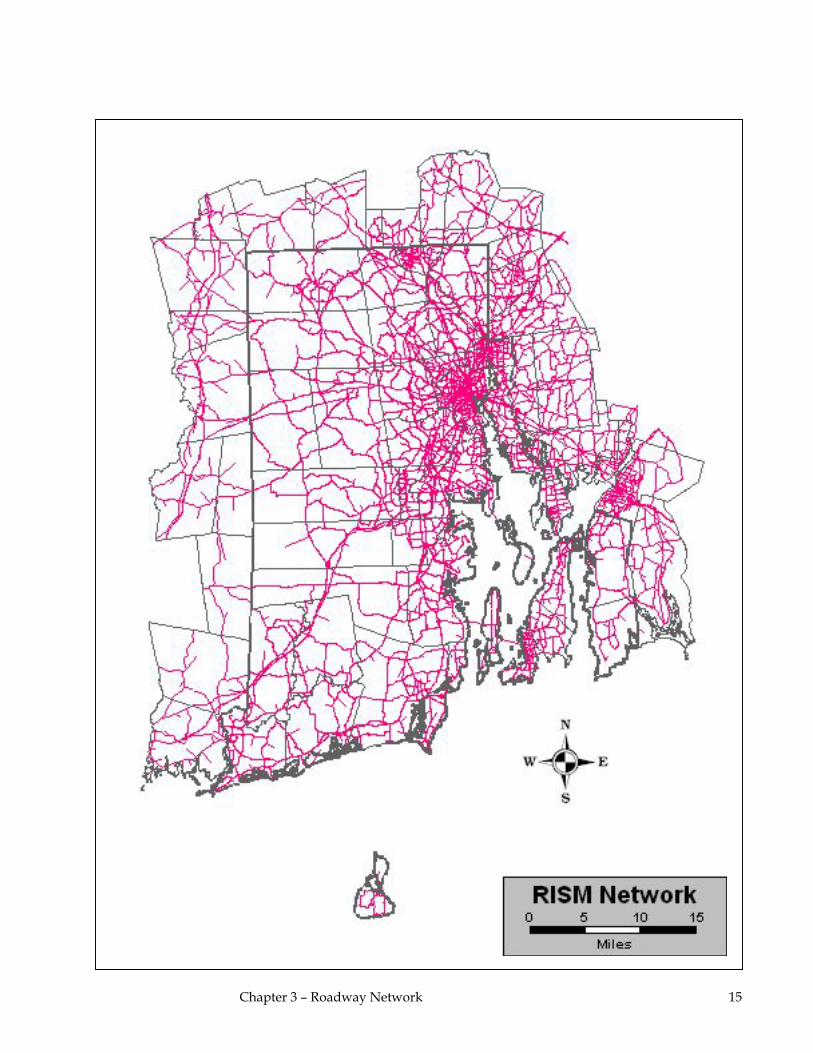
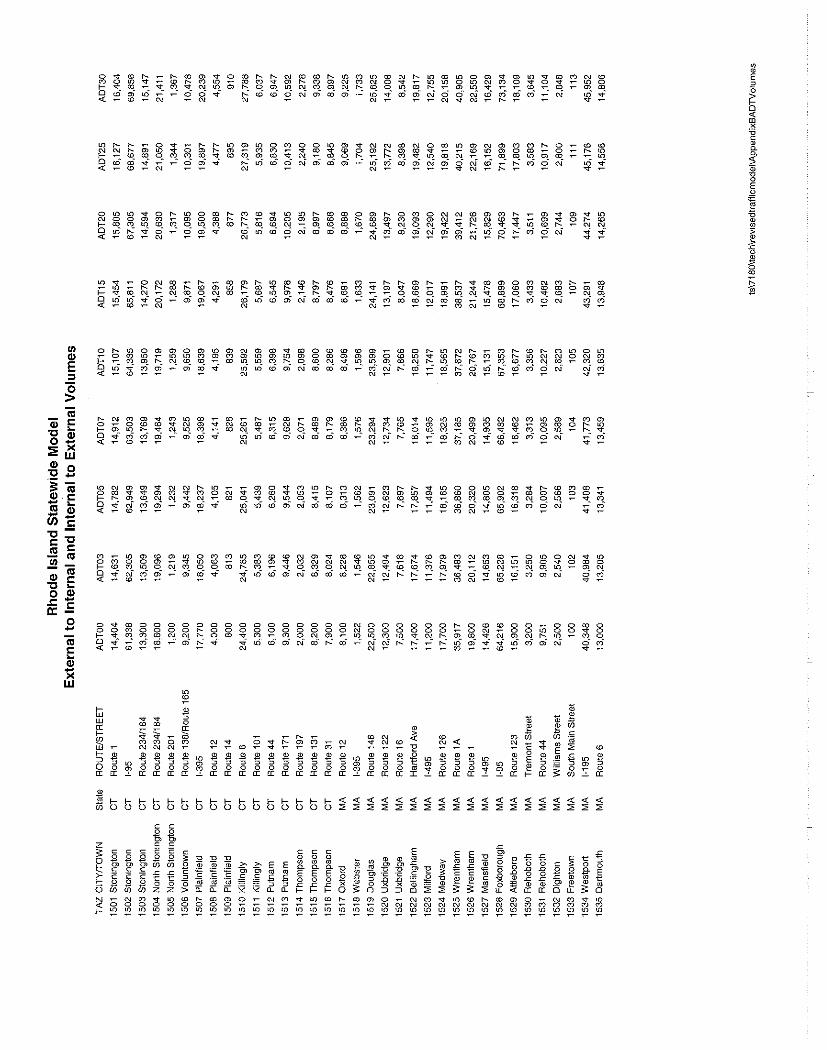
External Stations External stations represent the traffic entering the model area from areas of Massachusetts and Connecticut, outside the RISM area. Each model roadway that crosses the model border is assigned an external station TAZ number. External stations differ from the other TAZs in that they only load traffic on to the network and do not contain any socioeconomic or geographic attributes. The Massachusetts and Connecticut traffic count databases for the year 2000 were reviewed to determine the number of vehicles entering the model area at each of the external stations. There are 35 external TAZs in the current Rhode Island Statewide Model and are the triangular shaped zones shown on the page 2 map. The external station volumes are characterized as follows:
traffic volumes traveling from outside the model area to outside the model area (external-to-external, denoted as ‘EE’);
trips traveling from outside the model area to inside the model area (external-to-internal, denoted as ‘EI’);
and trips traveling from inside the model area to outside the model area (internal-to-external, denoted as ‘IE’).
To determine the future growth rate for the EI/IE component of the external volumes, the land use growth in the model was analyzed. It was determined that an annual growth rate would be calculated by averaging the annual growth rates of population and employment. The annual growth rates assumed are shown in Table 10.
Chapter 2 – Traffic Analysis Zones 12

Table 2.10 External Annual Growth Rates
Years Annual Growth 2000 to 2005 0.52 % 2005 to 2010 0.44 % 2010 to 2015 0.45 % 2015 to 2020 0.45 % 2020 to 2025 0.44 % 2025 to 2030 0.34 %
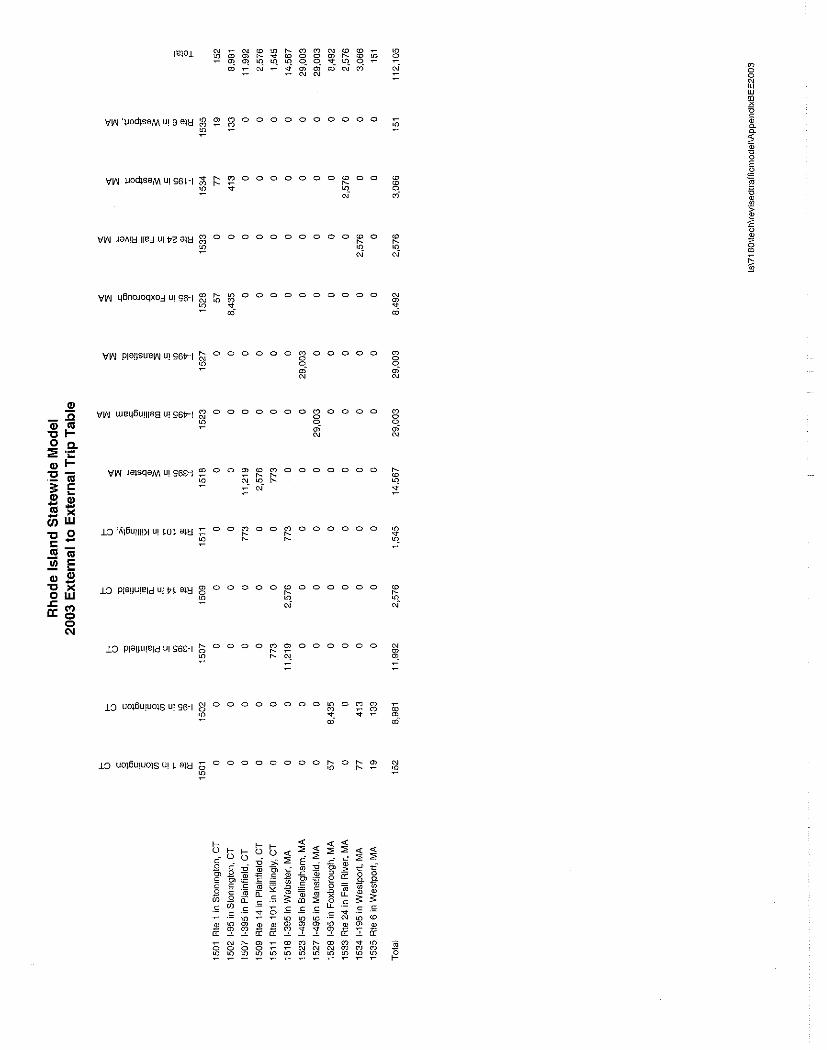
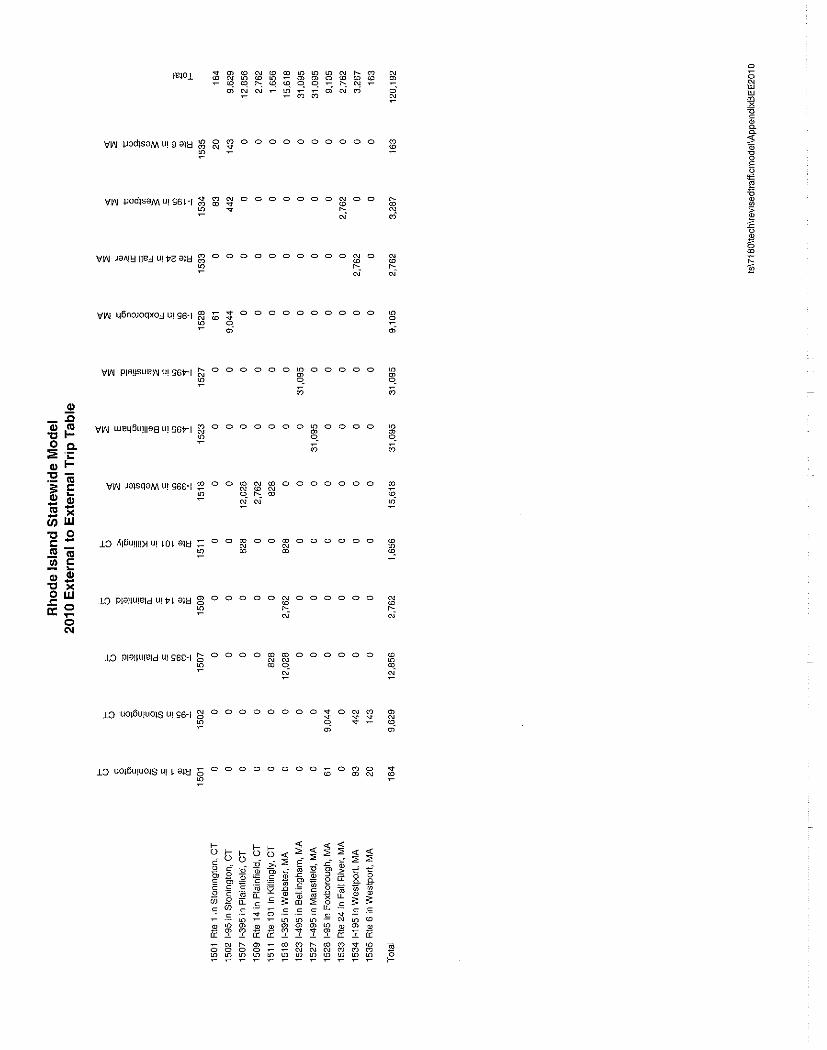
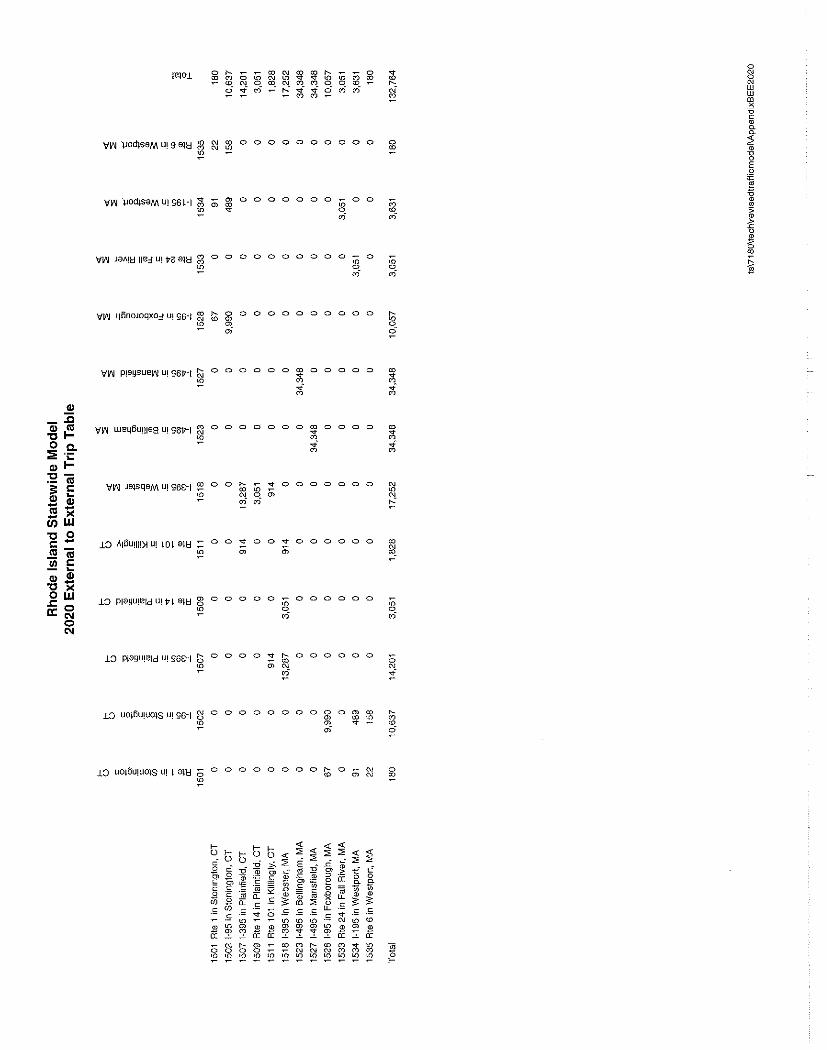
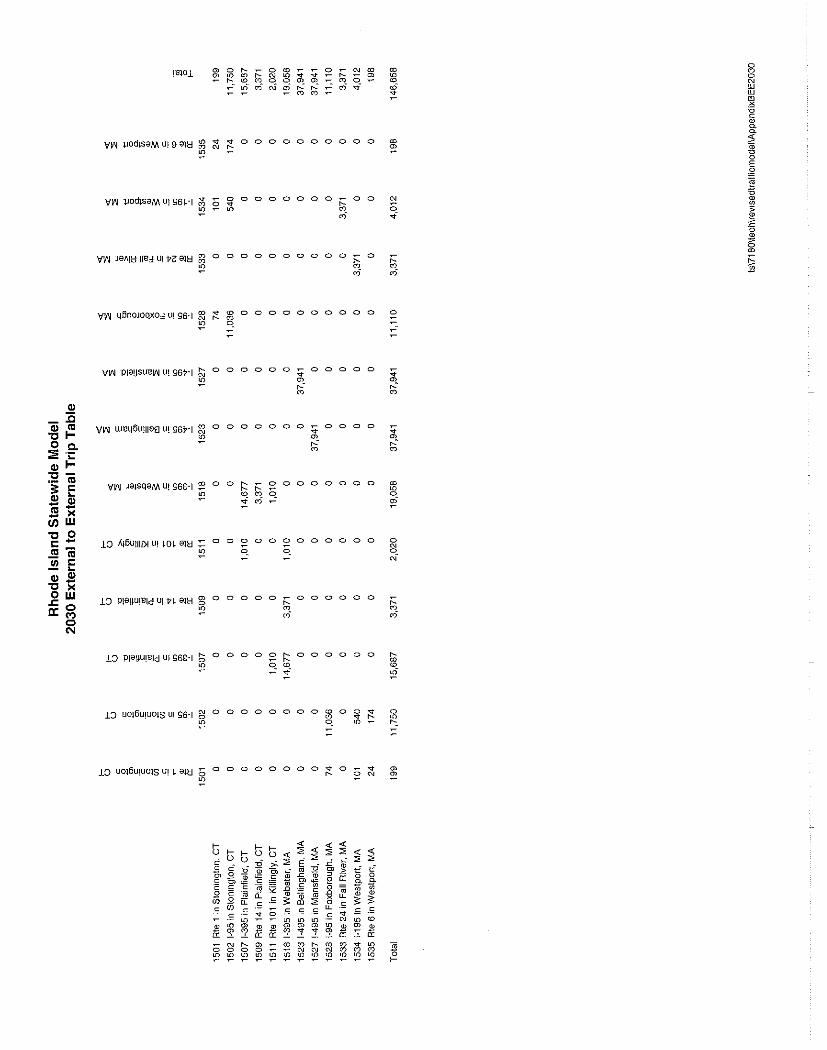
The old Rhode Island Statewide Model assumed a 1.30 percent annual growth rate for the EE trip tables. A trip table is a matrix that defines the number of trips that travel between TAZs. The 1.30 percent growth rate was determined to be too high, based upon the historical count data and future population and employment growth. The growth rate for the EE trip table was assumed to be 1.00 percent per year. The Appendix includes the non EE average daily traffic volumes at each external station, as well as the EE trip tables for each analysis year.
Chapter 2 – Traffic Analysis Zones 13

3
Roadway Network
Existing Roadway Network
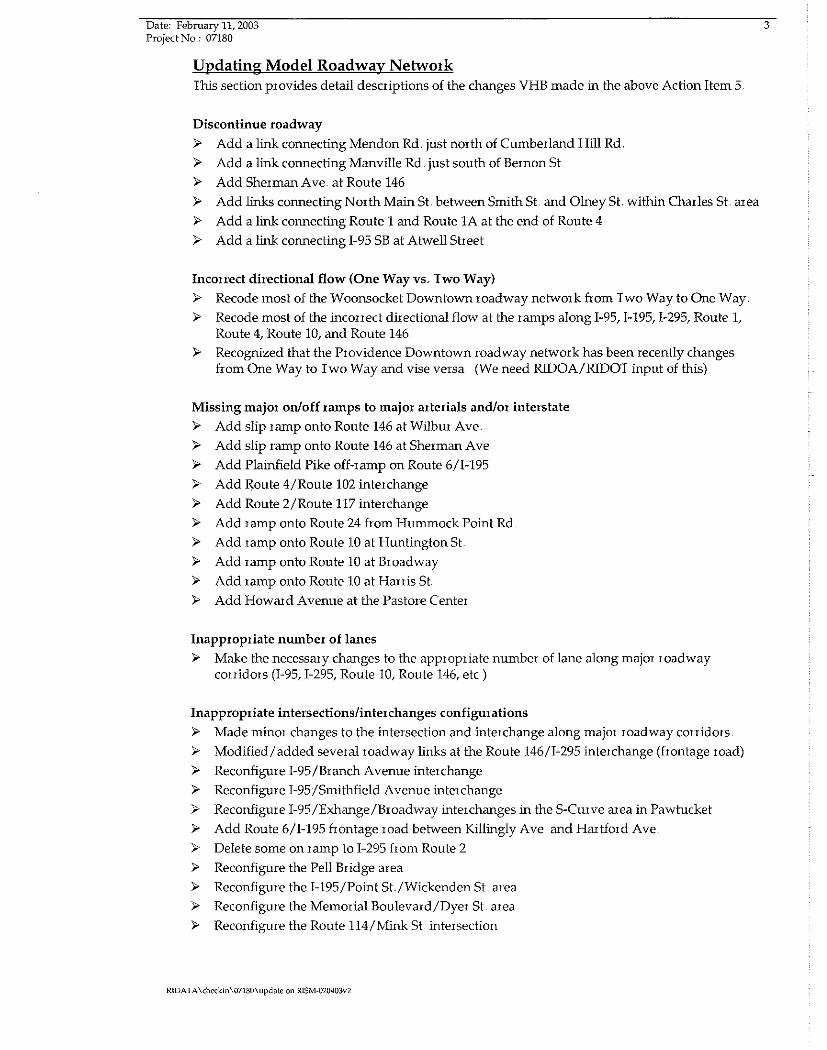
The original Rhode Island Statewide Model network was conflated to align with the latest1 RIDOT statewide roads centerline layer. When the original model network was displayed with the Rhode Island roadway layer, the alignment was slightly off. For graphical and consistency purposes, the decision was made to adjust, or conflate the model network so that it would align perfectly with the Statewide GIS layer. By conflating the original model network, valuable link information could also be retained. Another advantage to having the statewide GIS roads layer as a guide will allow for any future sub-regional modeling studies that might require more detail, such as local, unclassified roads, which could easily be added to the model network. The statewide roadway GIS layer contains all roads in Rhode Island whereas the network models all roads above local, un-classified roads. Once the conflation was completed, the network was reviewed for any errors and inconsistencies. A detailed list of the found errors was included in a February 11, 2003 memorandum, included in the Appendix to this document. The following is a general list of the errors fixed: Broken or discontinued network links Incorrect directional flows Missing on/off ramps to major arterials and/or interstate highways Incorrect number of lanes Inappropriate intersections/interchanges configuration
Chapter 3 – Roadway Network 14
Chapter 3 – Roadway Network 15

In addition to fixing coding errors and link adjustments, the following network segments were added to the model based on feedback from the February 11, 2003 meeting: Route 99 Additional ramps at Route 146/Mineral Spring Avenue Additional ramps at Route 146/Louisquisset Pike Providence Place Mall ramps (Civic Center Interchange) Dean Street and Route 10 connection Route 10 at Park Avenue interchange Route 6/I-195 at the I-195 interchange and frontage road
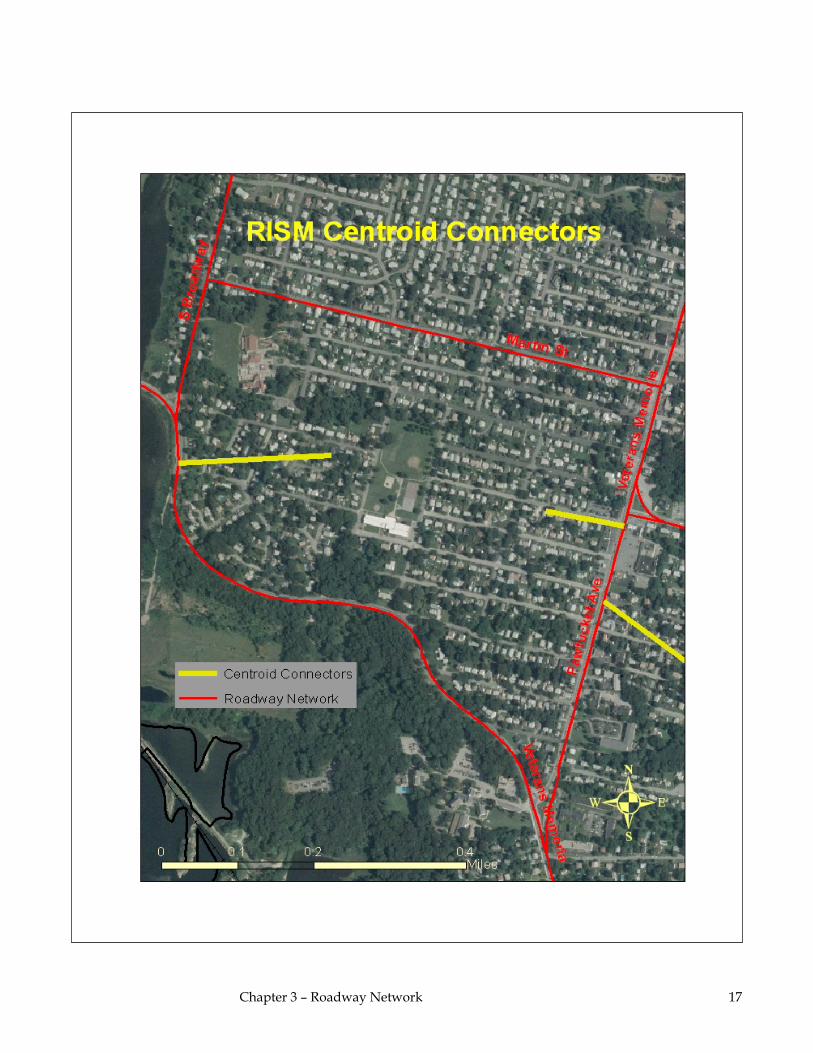
Additional edits entailed creating new centroid connectors. Centroid connectors are coded network links that load or feed the TAZ trip data on to the model network in the assignment step. Conceptually, they represent local roadways in the network. The original RISM centroid connectors were deleted because the new TAZ structure was updated and renumbered using Census 2000 geography. The new centroid connectors are now representative of the updated TAZ structure. The TransCAD software was used to automatically create one centroid connector per TAZ. Once the initial centroid connector was created, the entire network was scanned to make sure that traffic from each TAZ was accessing the model network accurately. If traffic did not access the network in the correct location, the initial centroid connector was moved accordingly. In some instances, additional connectors were added so as to more accurately load trips on to the network. In total, there are 904 TAZs in Rhode Island with 957 centroid connectors.
Chapter 3 – Roadway Network 16
Chapter 3 – Roadway Network 17

Future Roadway Network To eliminate network inconsistencies between different years of analysis, one roadway network is maintained. The network link table attributes contain information showing when roadway links are built, improved, or removed in the future and includes information on specific years of inclusion or exclusion. The following network link attributes provide the future year network information: begin_yr equals the year the link should be included in the network. begin_yr
equals ‘1990’ for links that existed before 1990. If begin_yr equals ‘2010’ it means that the link will be open for traffic in 2010 and should be included in the 2010 network, as well as any networks after 2010.
end_yr equals the year the link will be deleted from the roadway network. The majority of links have an end_yr equal to ‘3000’ and basically means the links are never deleted from the network. If end_yr equals ‘2010’ it means the link will be closed for traffic starting in 2010.
airq_status defines whether the new link or deleted link is present in the no-build scenario or only the build scenario.
chg_year equals the year a roadway link is improved. chg_status defines whether the link is improved in the no-build scenario or only
the build scenario. chg_speed is equal to the change in speed given the defined improvement (if
any). chg_h_cap is equal to the change in hourly capacity given the defined
improvement (if any). project_id is a brief project description. sel_tag is equal to ‘1’ if the link exists in the analysis year being conducted.
sel_tag is automatically assigned a 1 or a 0 based on the information for the link described above.
The recently completed projects coded in the model that were assumed to be present in the year 2000 are as follows: Memorial Boulevard (Providence) Civic Center interchange (Providence) Highland II (Cumberland)
The no-build projects coded into the roadway network include: Warren Avenue Extension (2001) (East Providence) Brewery (2002 – west side of Highway 10; 2003 – east side of Highway 10)
(Cranston) Route 146/Route 116 (2004) (Lincoln)
Chapter 3 – Roadway Network 18

Scituate Avenue Interchange (2004) (Cranston) Sockanossett (2004) (Cranston) Relocate Route 403 (Quonset Point Davisville) (2006 – east of railroad tracks; 2008
– west of railroad tracks; 2008 – new ramps at State Highway 4) Connection between Warren Avenue and the industrial park (2007) I-195 Relocation (2010)
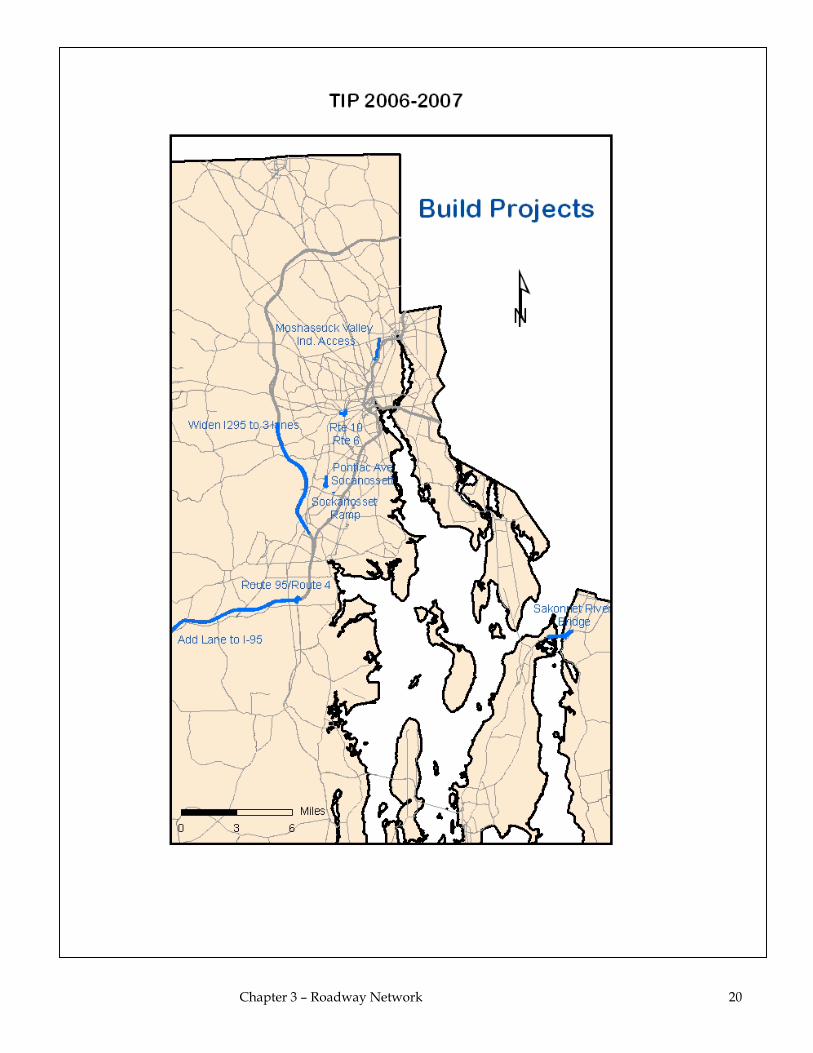
No-build projects are those regionally significant projects that have National Environmental Policy Act (NEPA) approval and are funded in the statewide Transportation Improvement Program (TIP). In effect, these projects are modeled as part of the existing network as per the project’s begin_yr delineation. Regionally significant Build projects are those projects that do not have NEPA approval but are in the Study and Development Program of the TIP. The Build projects and estimated begin_yr are coded into the roadway network for the conformity modeling process for the 2006-2007 TIP include: Route 10/Route 6 (2010) (Providence) I-95/Route 4 (2015) (Warwick, E. Greenwich, W.Warwick) Moshassuck Valley Industrial Access Road (2020) (Pawtucket) Waterfront Drive (2020) (E. Providence) Pontiac Avenue/Sockanossett Cross Road (2020) (Cranston) Sakonnet River Bridge (2020) (Portsmouth) Additional lane along I-95 between State Highway 4 and the CT state line (2025) Additional lane along I-295 between Scituate Avenue in Johnston and I-95 in
Warwick (2025)
Chapter 3 – Roadway Network 19
Chapter 3 – Roadway Network 20
4
Model Calibration
The original Rhode Island Statewide Model was updated with information relating to new land uses, new TAZ structure, new roadway network, and new model application. Therefore, it was re-calibrated to match year 2000 travel patterns and traffic volumes in Rhode Island.
Network Updates There were additional edits made to the model network during calibration. The first major edit was to update the roadway functional classifications to match the newest functional classification received from the RISPP1. The major difference in the functional classification from the old information was that the urban/rural boundaries changed with the year 2000 census. The following is the definition of the functional classification codes; the code is located in the HPMS_Code column in the network line layer: 1 – Rural Interstate 2 – Rural Principal Arterial 6 – Rural Minor Arterial 7 – Rural Major Collector 8 – Rural Minor Collector 11 – Urban Interstate 12 – Urban Other Freeway & Expressway 14 – Urban Principal Arterial 16 – Urban Minor Arterial 17 – Urban Collector
The area column was also adjusted to match the new urban/rural boundaries. The value in the column is equal to ‘1’ if the link is in the ‘urban’ area and ‘3’ if the link is in the ‘rural’ area.
1 Received in December 14, 2004 (hope_rds.shp)
Chapter 4 – Model Calibration 21
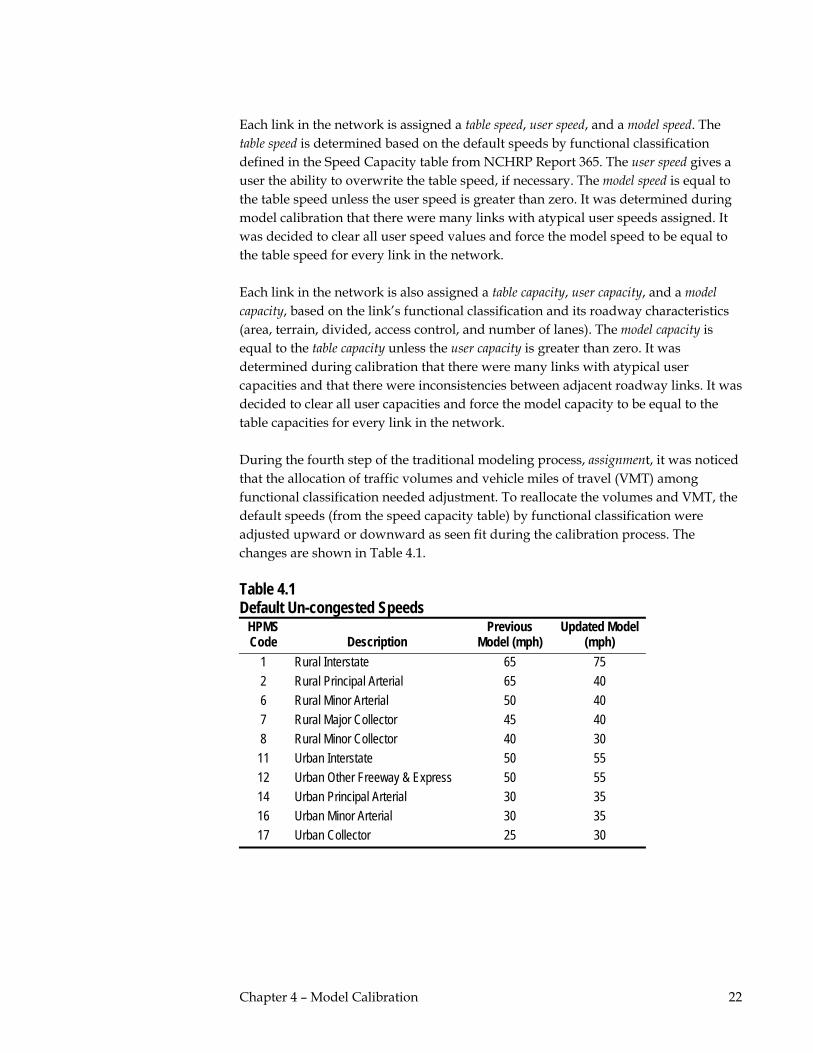
Each link in the network is assigned a table speed, user speed, and a model speed. The table speed is determined based on the default speeds by functional classification defined in the Speed Capacity table from NCHRP Report 365. The user speed gives a user the ability to overwrite the table speed, if necessary. The model speed is equal to the table speed unless the user speed is greater than zero. It was determined during model calibration that there were many links with atypical user speeds assigned. It was decided to clear all user speed values and force the model speed to be equal to the table speed for every link in the network. Each link in the network is also assigned a table capacity, user capacity, and a model capacity, based on the link’s functional classification and its roadway characteristics (area, terrain, divided, access control, and number of lanes). The model capacity is equal to the table capacity unless the user capacity is greater than zero. It was determined during calibration that there were many links with atypical user capacities and that there were inconsistencies between adjacent roadway links. It was decided to clear all user capacities and force the model capacity to be equal to the table capacities for every link in the network. During the fourth step of the traditional modeling process, assignment, it was noticed that the allocation of traffic volumes and vehicle miles of travel (VMT) among functional classification needed adjustment. To reallocate the volumes and VMT, the default speeds (from the speed capacity table) by functional classification were adjusted upward or downward as seen fit during the calibration process. The changes are shown in Table 4.1. Table 4.1 Default Un-congested Speeds
HPMS Code Description
Previous Model (mph)
Updated Model (mph)
1 Rural Interstate 65 75 2 Rural Principal Arterial 65 40 6 Rural Minor Arterial 50 40 7 Rural Major Collector 45 40 8 Rural Minor Collector 40 30 11 Urban Interstate 50 55 12 Urban Other Freeway & Express 50 55 14 Urban Principal Arterial 30 35 16 Urban Minor Arterial 30 35 17 Urban Collector 25 30
Chapter 4 – Model Calibration 22
Trip Generation Trip Generation is considered the first step in the traditional four- step modeling process, followed by:
Trip Distribution; Mode Choice; and Trip Assignment.
The purpose of trip generation is to predict the number of person trips produced (productions) by and attracted (attractions) to each TAZ in the model area. Trip generation is comprised of two main components: trip productions and trip attractions. Trip productions are trips created by the household and trip attractions are trips created by the employment. Trip productions and attractions were estimated for TAZs by applying person trip rates based on the 1999 National Cooperative Highway Research Program, Report 365: Travel Estimation Techniques for Urban Planning (NCHRP Report 365). Similar to many travel demand models and the original model, the three trip purposes used in the RISM are home-based work (HBW), home-based other (HBO), and non-home-based (NHB). The home-based work trips represent trips traveling between a person’s home (produced) and work (attracted) without stopping between the two locations. Home-based other trips are trips traveling between home and a non-work destination without stopping between the two locations. Non-home-based trips include all other trips where neither end is the home. An example of this type of trip purpose is a person running an errand and making a trip from their place of work and then returning back to work.
Trip Productions
Based on NCHRP Report 365, person trip productions were calculated using a cross-classification method that incorporates a 20-cell matrix of households by size and auto availability. The rates are shown in Tables 4.2 through 4.7 and vary for urban and rural areas. The production rates remained identical to the rates in the old model, except for the home-based work trip rates, which increased slightly.
Chapter 4 – Model Calibration 23

Table 4.2 Daily Weekday Person Trip Rates per Household (HBW) – Urban
# of Vehicles 1 PERS HHLD
2 PERS HHLD
3 PERS HHLD
4+ PERS HHLD
0 3.24 5.88 0.77 0.87 1 5.88 0.92 1.13 1.35 2 5.88 1.07 1.35 1.56 3 5.88 1.07 1.56 1.76 4-plus 5.88 1.07 1.76 1.98
Table 4.3 Daily Weekday Person Trip Rates per Household (HBO) – Urban
# of Vehicles 1 PERS HHLD
2 PERS HHLD
3 PERS HHLD
4+ PERS HHLD
0 1.58 2.83 3.40 4.99 1 2.83 4.08 5.43 7.94 2 2.83 4.64 6.35 9.53 3 2.83 4.64 7.37 10.67 4-plus 2.83 4.64 8.61 11.91
Table 4.4 Daily Weekday Person Trip Rates per Household (NHB) – Urban
# of Vehicles 1 PERS HHLD
2 PERS HHLD
3 PERS HHLD
4+ PERS HHLD
0 0.64 1.19 1.40 1.73 1 1.19 1.62 2.16 2.70 2 1.19 1.94 2.59 3.24 3 1.19 1.94 3.03 3.57 4-plus 1.19 1.94 3.46 4.00
Table 4.5 Daily Weekday Person Trip Rates per Household (HBW) – Rural
# of Vehicles 1 PERS HHLD
2 PERS HHLD
3 PERS HHLD
4+ PERS HHLD
0 3.24 5.17 0.82 1.03 1 5.17 0.87 0.97 1.30 2 5.17 1.03 1.13 1.51 3 5.17 1.03 1.30 1.66 4-plus 5.17 1.07 1.40 1.83
Chapter 4 – Model Calibration 24

Table 4.6 Daily Weekday Person Trip Rates per Household (HBO) – Rural
# of Vehicles 1 PERS HHLD
2 PERS HHLD
3 PERS HHLD
4+ PERS HHLD
0 1.58 2.94 4.64 6.92 1 2.49 4.08 5.89 8.61 2 2.49 4.99 6.69 10.20 3 2.49 4.99 7.60 11.34 4-plus 2.49 5.33 8.51 12.48
Table 4.7 Daily Weekday Person Trip Rates per Household (NHB) – Rural
# of Vehicles 1 PERS HHLD
2 PERS HHLD
3 PERS HHLD
4+ PERS HHLD
0 0.76 1.29 2.06 2.37 1 1.07 1.83 2.49 3.03 2 1.07 2.27 2.91 3.57 3 1.07 1.49 3.24 4.00 4-plus 1.07 1.49 3.67 4.00
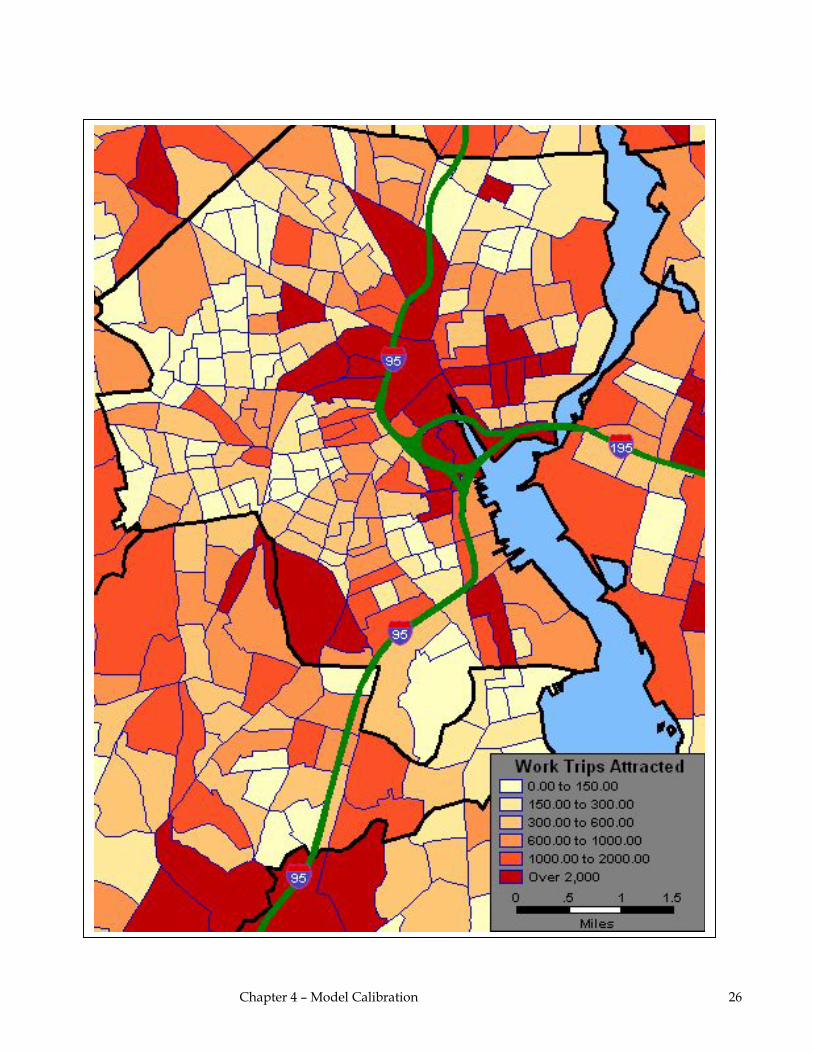
Trip Attractions
The prior model version trip attractions equations were updated to be consistent with rates documented in NCHRP Report 365, “Travel Estimation Techniques for Urban Planning”. The rates in NCHRP 365 assume retail employment, service employment and other employment. The rates from NCHRP 365 were adjusted to account for the fact that the Rhode Island model assumes only retail and non-retail employment. In addition, the rates were further adjusted further during model calibration. The current models trip attraction rates are shown below. Trip attraction estimates trips attracted to zones using a regression process and is calculated using the following equations. HBW Attractions = 2.03 * Total Employment
HBO Attractions = (13.05 * Retail Employment) + (2.26 * Non-Retail Employment) + (0.9 * Number of Households)
NHB Attractions = (1.39 * Retail Employment) + (1.78 * Non-Retail Employment) + (0.5 * Number of Households)
Chapter 4 – Model Calibration 25
Chapter 4 – Model Calibration 26

External Trips
As previously stated, the model contains 35 external stations. External stations represent the traffic entering the model area from an area of Massachusetts and/or Connecticut that are outside the the RISM. Each model roadway that crosses the model border is assigned an external TAZ number. The external volumes are made up of traffic volumes traveling through the model (external-to-external, denoted as ‘EE’); trips traveling from outside the model area to inside the model area (external-to-internal, denoted as ‘EI’); and trips traveling from inside the model area to outside the model area (internal-to-external, denoted as ‘IE’). The EI and IE trips are split into the three trip purposes and then converted into
person trips.
Approximately 23 percent of the EI and IE trip volume is assigned to home-based work trips, split evenly between productions and attractions. The external work trips are then converted to person trips using an auto-occupancy rate of 1.12.
Approximately 51 percent of the EI and IE trip volume is assigned to home-based other trips, split evenly between productions and attractions. The external home-based other trips are then converted to person trips using an auto-occupancy rate of 1.56.
The remainder of the EI and IE volume is assigned to non-home-based trips and then converted to person trips assuming an auto-occupancy rate of 1.56.
The resulting EI and IE productions and attraction values are entered into the trip-generation portion of the travel demand model.
The remainder of the traffic volume is assumed as EE trip volume and is accounted for in the external-to-external trip table. The Appendix presents the external-to-external trip tables.
The trip tables show the number of vehicle trips that travel between each of the external stations. If an external station is not in the table, there are no through (EE) trips assigned to that station. The method for handling the external trip volumes was not adjusted during model calibration. However, the model does contain updated year 2000 traffic counts at each of the external stations, as well as updated growth assumptions for the future year volumes.
Chapter 4 – Model Calibration 27

Trip Balancing
Once the trip production and attractions are updated, they need to be balanced so that the total number of trips produced equals the total number of trips attracted. This method of balancing is done because for every trip produced, it needs to be attracted to a destination. The total number of home-based work attractions and home-based other attractions are balanced to match the total number of productions for each of the two purposes. The non-home-based trip attractions are balanced to match the total non-home-based trip productions and then the productions are set equal to the balanced trip attractions. The EI and IE production and attractions remain constant for all trip purposes. The trip balancing is performed using the procedure in TransCAD Planning – Balance , the same procedure used in the prior model version. Trip productions were held constant in the procedure as there is generally a greater degree of reliability in production (household) model data than attraction (activity center/work) model data. Trip attractions are then scaled to the productions. The values have obviously changed because of the new land use assumptions as well as the new TAZ structure. Table 4.8 shows the number of year 2000 trips by trip purpose and compares them to default percentages from NCHRP Report 365, “Travel Estimation Techniques for Urban Planning”. Table 4.8 Percent Distribution by Trip Purpose
Trip Purpose Modeled Trips % Distribution NCHRP 365 Home-based Work 1,214,359 20.9% 20.0% Home-based Other 3,279,188 56.5% 57.0% Non-home-based 1,307,628 22.6% 23.0%Total 5,801,175 100% 100%
The model estimates 3.96 trips per person and 10.19 trips per household per day. The NCHRP 365 report indicates a national average of 9.2 trips per household. The model also predicts about 1.92 home-based work trips per employee in the model.
Chapter 4 – Model Calibration 28
Highway Skim Before the trip distribution step of the model can be performed, the travel time between each TAZ is calculated based on the model base year highway network. The highway skim matrix contains the travel times between each TAZ. The travel time between external stations, known as impedance, is set to a very high value (300 minutes) so that trips between external TAZs are not distributed. All external-to-external trips are defined in the EE trip table shown in the Appendix. The intra-zonal travel time is calculated based on the average travel time to the closest three TAZs multiplied by a factor of 0.17. As mentioned previously, the underlying model network was completely revised, resulting in new travel times between each TAZ.
Trip Distribution The trip generation step determines the number of trips being produced and attracted by each TAZ. The highway skim step determines the travel time between each TAZ. The trip distribution step determines where each trip goes. It matches trip productions to trip attractions. The trip distribution is calculated using a gravity model that works similar to Newton’s Law of Gravity: the ‘force’ between TAZs is calculated as the productions and attractions that are being ‘pulled apart’ by the travel time between TAZs. The gravity model used in the Statewide model is based on typical travel demand model exponential equations with c-values equal to 0.195 for home-based work trips; 0.145 for home-based other trips; and 0.135 for non-home-based trips. These c-values are exponential coefficients used in the gravity model to weight the relationship between travel time and the pull, or attraction between two TAZs. During gravity model calibration, the c-values were slightly adjusted to achieve more accurate trip patterns and average trip lengths. The adjusted values are 0.100 for home-based work trips; 0.200 for home-based other trips; and 0.200 for non-home-based trips. The maximum number of iterations was increased from 10 to 35 and the convergence factor was held constant at 0.001.
Chapter 4 – Model Calibration 29

Trip distribution allocates trip productions to trip attractions based on the travel time impedance between two TAZs and the amount of trip attractions each TAZ has compared to all other TAZs. The first iteration allocates trip productions by TAZ to trip attractions by TAZ. The number of attractions destined to each TAZ is summed and compared to the actual number of attractions. The trips are then factored to match total attractions by TAZ. The second iteration allocates the new number of productions to the new number of attractions. The process repeats until the sum of productions for each TAZ and the sum of attractions for each TAZ is within 0.001 percent of the total number of productions and attractions of each TAZ, or until the maximum number of iterations is reached. Previously, the maximum number of iterations was set at 10, but the trip distribution gravity model did not converge for any of the trip purposes. By increasing the number of iterations to 35, it enables the trip distribution model to converge for each trip purpose. The prior model version included a matrix of k-factors that adds additional weights between certain TAZs. A k-factor greater than one (1.0) increases the interaction between areas. Conversely, a k-factor less than one decreases the interaction between areas. A k-factor of one equates to neither an increase nor a decrease in interaction between areas. The default k-factor value at the start of model calibration was set to ‘1’. A couple of k-factors were added to help with trip pattern calibration. In the updated model, k-factors were increased in Massachusetts to reduce the interaction between Massachusetts and Rhode Island. Without the k-factors, the model overestimated the interaction between these two states. In particular, the interaction between Fall River and Rhode Island was too high, compared to year 2000 Journey-to-Work data. K-factors between all TAZs in RI are assumed to be ‘1’. The following tables demonstrate the gravity model calibration. Table 4.9 shows the average travel time by trip purpose. The average trip lengths fall with in the acceptable range of NCHRP 365 defaults. The model’s average HBW trip length of 21.59 minutes is slightly less the than the year 2000 Journey-to-Work average. However, the year 2000 JTW average includes travel time outside the model area, whereas the average trip time for the model is only time traveled inside the model area. For example, if a trip is made from Providence to Boston, the JTW time includes the entire portion of the trip, while the average time from the model only includes the time to the I-95/I-495 interchange.
Chapter 4 – Model Calibration 30

Table 4.9 Average Trip Lengths in Minutes
Trip Purpose Year 2000 Model 2000 JTW aHome-based Work 21.59 24.16 Home-based Other 15.64 Non-home-based 14.45
a NCHRP 365 Defaults – HBW average travel times for small communities are 15 to 20 minutes; for large communities, the average travel times are 25 to 30 minutes. Average trip lengths for non-work trips is about 75 to 85 percent of HBW trip length.
Table 4.10 compares the model distribution to year 2000 Journey-to-Work for
people living in Connecticut, Massachusetts or Rhode Island and working in Rhode Island.
Table 4.11 compares the model distribution to year 2000 Journey-to-Work for people working in Connecticut, Massachusetts, or Rhode Island and living in Rhode Island.
Table 4.12 compares the model distribution to year 2000 Journey-to-Work for people working in the city of Providence.
Table 4.10 Year 2000 Journey to Work Comparison (People Working in Rhode Island)
Live In Model Percent Year 2000
JTW Percent Connecticut 28,548 3.4% 7,996 0.9% Massachusetts 84,777 10.0% 63,012 6.9% Rhode Island 731,244 86.6% 840,568 92.2%Total Work in Rhode Island 844,569 100.0% 911,576 100.0%
Table 4.11 Year 2000 Journey to Work Comparison (People Living in Rhode Island)
Work In Model Percent Year 2000
JTW Percent Connecticut 20,923 2.5% 22,630 2.3% Massachusetts 82,973 9.9% 112,276 11.5% Rhode Island 731,244 87.6% 840,568 86.2%Total Living in Rhode Island 835,140 100.0% 975,474 100.0%
Chapter 4 – Model Calibration 31

Table 4.12 Year 2000 Journey to Work Comparison (People Working in Providence City)
Live In Model Percent Year 2000
JTW Percent Bristol County 9,083 4.1% 7,912 3.6% Kent County 28,524 12.9% 27,306 12.4% Newport County 5,297 2.4% 4,162 1.9% Providence County 98,560 44.7% 83,476 38.0% Providence City 48,396 22.0% 67,876 30.9% Washington County 7,142 3.2% 10,164 4.6% Massachusetts 19,876 9.0% 17,636 8.0% Connecticut 3,500 1.6% 1,062 0.5%Total Work in Providence City 220,378 100.0% 219,594 100.0%
Once the trip distribution step is complete, the production/attraction trip table is converted to an origin/destination trip table. The difference between production/attraction and origin/destination is described in the following example. A couple travels from home to work and then back home again; their home is located in TAZ 10 and their place of work is located in TAZ 12. Therefore, the production/attraction trip table would have two trips produced in TAZ 10 and two trips attracted in TAZ 12. The origin/destination trip table would have one origin in TAZ 10, one destination in TAZ 12, one origin in TAZ 12 and one destination in TAZ 10. To convert the production/attraction matrix into an origin/destination matrix, the production/attraction trip table is transposed (row and column data are swapped), added to the original production /attraction trip table, and then divided by two. The conversion assumes that if a trip leaves the home-end to go to work, the same person will return home sometime during the same day. There is no change in the method to convert the production/attraction trip table into the origin/destination trip table from the previous model to the current model. While the trip table is converted to origin/destination format, it is also converted from a person trip table to a vehicle-trip table by applying average auto-occupancy rates: home-based work: 1.12 home-based other: 1.56 non-home-based: 1.56
These rates were not adjusted from the prior model version during model calibration.
Chapter 4 – Model Calibration 32
The final portion of the trip distribution step is to append the EE trip table onto the vehicle trip tables for home-based work trips, home-based other trips, and non-home-based trips. All four tables are then summed and the total trip table is entered into the traffic assignment step of the model.
Modal Choice Currently, the Rhode Island Statewide Model estimates vehicle traffic only. There is no transit mode or non-vehicle mode. Therefore the modal choice step consists of converting the person trips to vehicle trips with the following rates that are described in the previous Trip Distribution section. home-based work: 1.12 home-based other: 1.56 non-home-based: 1.56
Traffic Assignment The traffic assignment step essentially loads the total vehicle-trip table calculated in the trip distribution step onto the model network in an effort to simulate traffic flow for a particular analysis year. The process predicts travelers route choices and identifies paths between origins and destinations that will have the shortest travel times or costs. The TransCAD procedure PLANNING_TRAFFIC ASSIGNMENT prompts the user for the appropriate OD trip table to be assigned to the network. To improve model assignment results, the minimum number of equilibrium iterations was increased from 7 to 40, and the convergence criteria was reduced from 0.01 to 0.005. The convergence factor is a measure of how close the volumes need to be between iterations; the smaller the convergence factor and the higher the number of iterations, the more accurate the assignment. Table 4.13 shows the comparison of total traffic counts to total model traffic volumes for the final model calibration run, disaggregated by functional classification and area type. Table 4.14 shows the comparison by overall functional classification. Table 4.15 compares the distribution of HPMS VMT to model VMT for the old model and the final model calibration run. The Appendix includes VMT and growth in VMT by functional class and by county for years 2000, 2007, 2010, 2015, 2020, 2025 and 2030.
Chapter 4 – Model Calibration 33
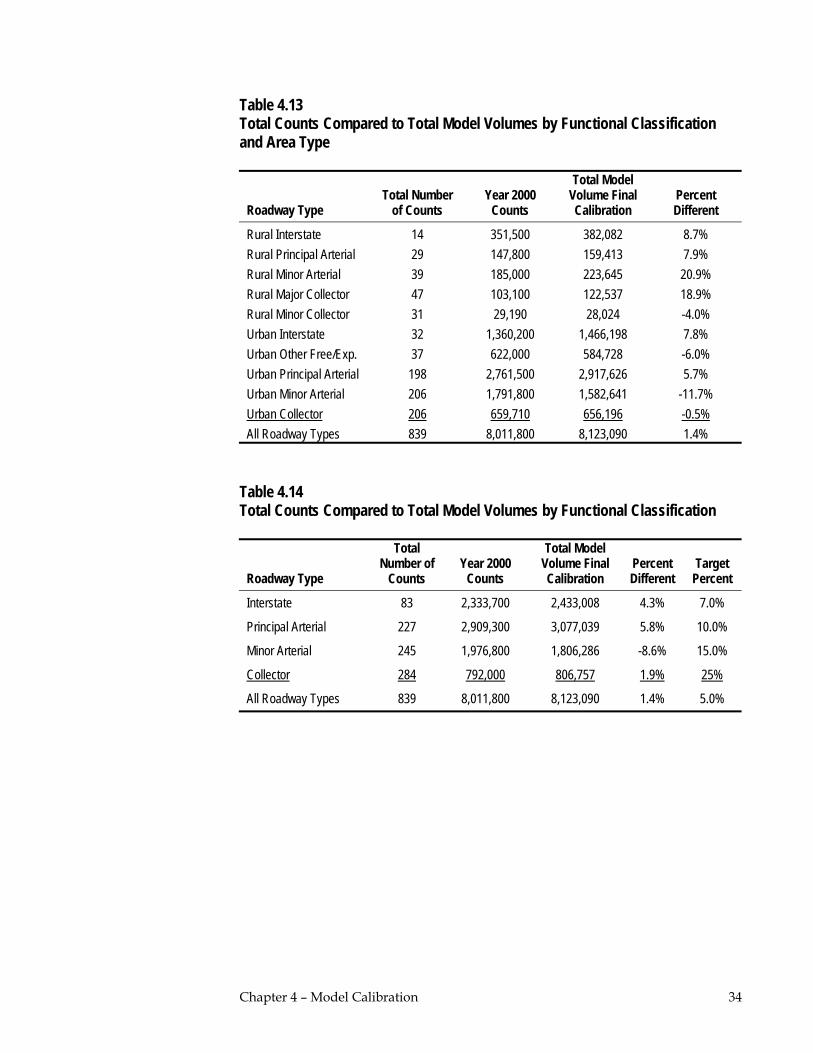
Table 4.13 Total Counts Compared to Total Model Volumes by Functional Classification and Area Type
Roadway Type Total Number
of Counts Year 2000
Counts
Total Model Volume Final Calibration
Percent Different
Rural Interstate 14 351,500 382,082 8.7% Rural Principal Arterial 29 147,800 159,413 7.9% Rural Minor Arterial 39 185,000 223,645 20.9% Rural Major Collector 47 103,100 122,537 18.9% Rural Minor Collector 31 29,190 28,024 -4.0% Urban Interstate 32 1,360,200 1,466,198 7.8% Urban Other Free/Exp. 37 622,000 584,728 -6.0% Urban Principal Arterial 198 2,761,500 2,917,626 5.7% Urban Minor Arterial 206 1,791,800 1,582,641 -11.7% Urban Collector 206 659,710 656,196 -0.5%All Roadway Types 839 8,011,800 8,123,090 1.4%
Table 4.14 Total Counts Compared to Total Model Volumes by Functional Classification
Roadway Type
Total Number of
Counts Year 2000
Counts
Total Model Volume Final Calibration
Percent Different
Target Percent
Interstate 83 2,333,700 2,433,008 4.3% 7.0%
Principal Arterial 227 2,909,300 3,077,039 5.8% 10.0%
Minor Arterial 245 1,976,800 1,806,286 -8.6% 15.0%
Collector 284 792,000 806,757 1.9% 25%
All Roadway Types 839 8,011,800 8,123,090 1.4% 5.0%
Chapter 4 – Model Calibration 34
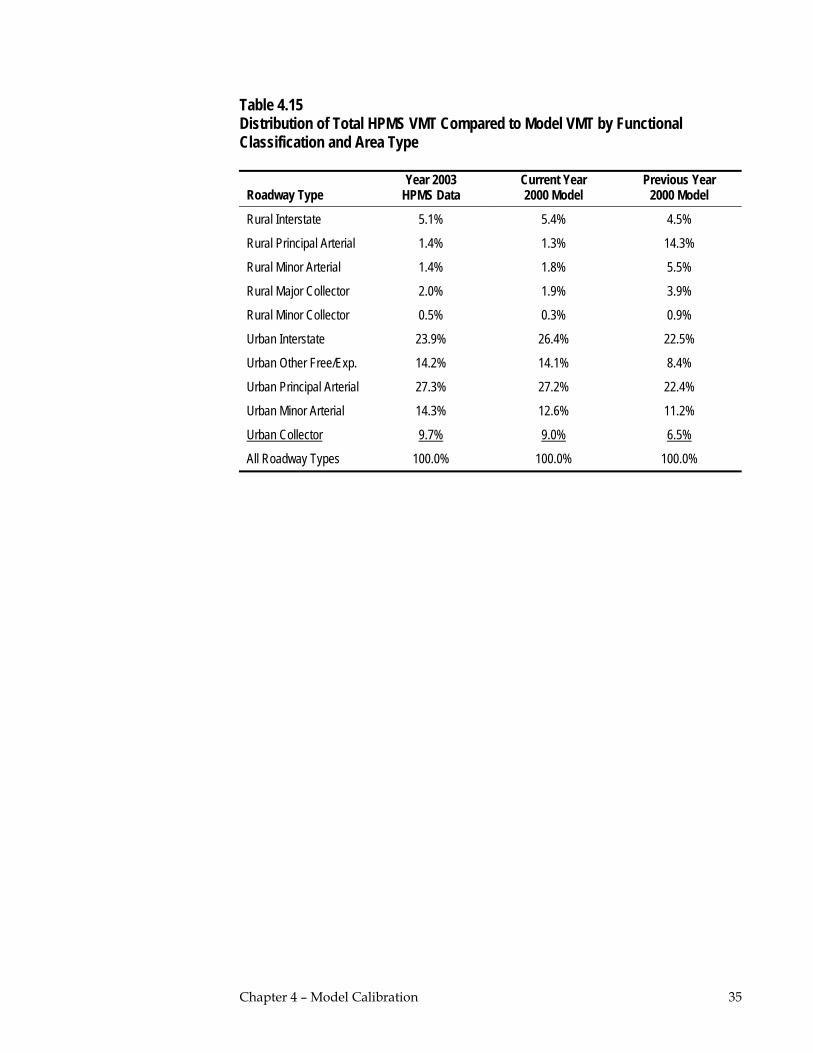
Table 4.15 Distribution of Total HPMS VMT Compared to Model VMT by Functional
Classification and Area Type
Roadway Type Year 2003
HPMS Data Current Year 2000 Model
Previous Year 2000 Model
Rural Interstate 5.1% 5.4% 4.5%
Rural Principal Arterial 1.4% 1.3% 14.3%
Rural Minor Arterial 1.4% 1.8% 5.5%
Rural Major Collector 2.0% 1.9% 3.9%
Rural Minor Collector 0.5% 0.3% 0.9%
Urban Interstate 23.9% 26.4% 22.5%
Urban Other Free/Exp. 14.2% 14.1% 8.4%
Urban Principal Arterial 27.3% 27.2% 22.4%
Urban Minor Arterial 14.3% 12.6% 11.2%
Urban Collector 9.7% 9.0% 6.5%
All Roadway Types 100.0% 100.0% 100.0%
Chapter 4 – Model Calibration 35
5
TransCAD 4.7 Model Setup
The original Rhode Island Statewide Model ran on the TransCAD travel demand modeling software (“TransCAD”) by using a macro that ran through steps automatically, as well as menu-driven steps described in an instructional manual. It was determined that there were a number of issues with the menu-driven method, namely that it was easy to make a mistake and it was difficult for infrequent users to run the model successfully. The purpose of the model update was to create a program that allowed users to more easily run the model with little room for error. VHB worked with Caliper to update the model to the most recent software release of TransCAD (version 4.7) at the time, as well as create a user-friendly model interface. The Appendix includes detailed model instructions created by Caliper. The title of the document is “User’s Guide for the Rhode Island Statewide Model in TransCAD 4.7”. The remainder of this chapter summarizes each step in the model and describes the inputs and parameters used, as well as the outputs created. After the model is installed all the required models are located in the RISM2005 directory.
Update Link Capacities This step defines which links are in the network and what speeds and capacities are assigned to each link. The following inputs are used: highway db (RINet.dbd, dated 4/28/05) – the geographic roadway network
speed capacity table (RISpdCap.dbf, dated 3/17/05) – the default capacities and speeds based on roadway functional classification, area type and roadway characteristics
Chapter 5 – TransCAD 4.7 Model Setup 36

alpha beta table (RI_alphabeta.dbf, dated 10/23/02) – contains alpha/beta values by link functional classification and is used in the highway assignment step. The values are calibration parameters used in the Bureau of Public Roads (BPR) volume-delay function, which takes into account link travel times, volumes and capacities.
The following parameters are used: run year defines the analysis year. The value is used to determine which links are
assumed in the network and what speeds and capacities will be assigned to each link.
build condition defines whether the run is for a no-build condition or for a build condition. The only roadways that will be included in the no-build condition are existing roadways and any roadway project with NEPA approval. Roadways included in the build network would be all roads with NEPA approval, as well as all roads that are in the planning stage.
The following output is created: a highway .bin file – The updated link capacities updates the values in the
database associated with the highway db file. The program assigns model speeds, model capacities, and alpha/beta values to each link as well as flags links that should be included in the designated analysis year and condition.
Build Network The build network takes the data created in the Update Link Capacities step and creates a network (*.net) file that can be used by TransCAD for further analysis. The following inputs are used: The highway db file and associated .bin file contain the information needed to
create a network to be used for analysis. The location of this file does not need to be defined in the setup; the network is automatically created using the highway db file and associated .bin file defined in Update Link Capacities.
No parameters need to be defined for this step. The following output is created: Network file that will be used for analysis in the next steps.
Chapter 5 – TransCAD 4.7 Model Setup 37
Trip Generation The trip-generation stage uses the land use information for each TAZ and the assumed trip rates and determines the number of trips by trip purpose for each TAZ. The trip-generation stage is split into two steps: the first step estimates the total number of productions and attractions by trip purpose for each TAZ; the second step balances the total attractions to match total productions. The following inputs are used: rate table (RIGNRate.dbf, dated 1/4/05) contains the trip rates by purpose and
area type.
taz db (RI TAZ.dbd, dated 4/28/05) is the TAZ geographic file and the associated database RI TAZ.bin, which contains the population, number of households, number of vehicles, and number of retail and non-retail employees by TAZ.
No parameters need to be defined for this step. The following output is created: P/A table (ri_pa.bin) contains the results of trip generation.
Highway Skim The following inputs are used: The network file created in the Build Network step is used to create the highway
skims. The location of this file does not need to be defined. No parameters need to be defined for this step. The following output is created: spmat.mtx contains the free-flow travel times between each of the TAZs. There
are 1,292 TAZs (including external TAZs) in the model; the matrix is 1,292 cells by 1,292 cells.
Chapter 5 – TransCAD 4.7 Model Setup 38

Trip Distribution The trip distribution step uses the skim matrix (spmat.mtx) file created in the Highway Skim step and balances production/attraction information by TAZ to determine the number of vehicle trips traveling between each of the 1,292 TAZs. The trip distribution is split into four steps: The first step determines the number of person trips that are traveling between
each TAZ.
The second step converts the production/attraction trip table into an origin/destination trip table.
The third step converts the person origin/destination trip table into a vehicle trip table.
The fourth step adds the EE trip table. The following inputs are used: k-factors (k_factors.mtx, dated 2/10/05) contains factors used during Trip
Distribution.
EE matrix (00extextrev.mtx, dated 4/12/05) contains the number of trips traveling through the model area. The file is a trip table showing the daily EE trips between external stations.
The following parameters are used: iterations (35) convergence criterion for gravity application (0.001) exponential c-values (0.1 for HBW; 0.2 for HBO; 0.2 for NHB) average auto-occupancy rates (1.12 for HBW; 1.56 for HBO; 1.56 for NHB)
The following outputs are created: P/A matrix (cgrav.mtx) contains three matrices (one for each trip purpose) with
the number of person-trips traveling between each TAZ. The table is in production-to-attraction format.
O/D matrix (PA2OD.mtx) contains three matrices (one for each trip purpose) with the number of vehicle trips traveling between each TAZ. The table is in origin-to-destination format.
daily O/D matrix (total2000.mtx) contains five matrices. The first three matrices are set equal to the three matrices in the O/D matrix. The fourth matrix is set equal to the EE trip table, and the fifth matrix is the sum of the first four matrices. The fifth matrix contains the total number of vehicle trips that travel between each of the 1,292 TAZs. The fifth matrix is used in traffic assignment.
Chapter 5 – TransCAD 4.7 Model Setup 39
Assignment The assignment step uses the fifth matrix in the daily O/D matrix file and the network created in the Build Network step to determine the number of daily vehicles traveling on each roadway link. During this step the vol_A_B, vol_B_A, cong_timeAB, and cong_timeBA are updated in the highway.bin files so that the ‘update Air Quality Speeds’ step (described next) works properly. The following inputs are used: The daily O/D matrix created in the Trip Distribution step – The location of this
file does not need to be defined. The network file created in the Create Network step – The location of this file
does not need to be defined. The following parameters are defined and built into this step in the model macro: number iterations (40) convergence criterion for gravity application (0.005)
The following output is created: Flow Table (asn_link.bin) contains the resulting traffic volumes for each link as
well as the congested time for each link.
Update Air Quality Speeds This step updates the roadway database (highway.bin) with the resulting travel volumes and the congested speed. The following inputs are used: The Highway DB file and associated .bin file –The location of this file does not
need to be defined. No parameters need to be defined The following output is created: There is no output file; however, the highway network database (.bin) is updated
with information from the most recent model run. The four variables updated are AB_FF_speed, BA_FF_speed, AB_con_speed, and BA_con_speed and are used as inputs to the EPA Mobile 6.2 emission factor model.
Chapter 5 – TransCAD 4.7 Model Setup 40
6
Next Steps
As previously mentioned, the primary use of the RISM has been for support of air quality analyses. The RISM should also be utilized to evaluate the existing transportation system and how that system will perform based on future socioeconomic forecasts for the model area. The following are some model improvements and additions that are taking place and suggestions to enhance the RISM for future regional planning studies and enhanced air quality analysis:
Transit Component Incorporation of the transit (bus and future rail) component will allow for a true mode choice/mode split step in the modeling process and allow for transit service studies. Other non-highway modes that can be incorporated into the model as mode choice options in the future would be rail and water. A multi-modal model would enable users to simulate non-auto transportation projects and analyze the effects of such projects on the overall transportation system.
Network/TAZ Updates Continue to update and revise the model network with any functional classification changes, new regionally significant TIP projects and incorporating changes resulting from ongoing error checking of the model network and TAZ database.
Freight Modeling To address freight mobility in the transportation planning process, model regional freight movements and future freight demand to plan for the efficient flow of
Chapter 6 – Next Steps 41
commodities in and through the region by truck, rail and boat. A first step in this direction might include developing a truck trip table in an effort to forecast truck traffic on interstates or freeways corridors in the RISM area. Future, more detailed studies could be estimating truck movements and developing/altering pavement management strategies, and designating or developing truck routes.
Special Generators Develop a database of “special generators” which have unique traffic generation characteristics, with separate trip production and attraction rates that are specific to that the type of facility or location. Examples of “special generators” include:
major airports military bases regional shopping malls casinos major sports venues major beaches and recreational facilities port facilities prisons
Planning Studies Utilize the model with the congestion management system to assess current and likely future traffic problems, develop alternative solutions and evaluate those alternatives. The model and travel demand forecasting can also be used to study the impacts of policies and/or programs such as tax incentives for telecommuting, on the transportation system. Use of the model to study projected volumes and volume to capacity ratios (V/C) on identified travel corridors in the state and region help identify future congestion choke points can also be performed. The model can also be useful in testing different travel corridor future land use and land intensity scenarios and what transportation impacts would result from those scenarios. Currently the RISM is being used a s tool to evaluate hurricane evacuation routes, as identified by municipalities located in designated evacuation areas along the coastline. The sub-model will be used to identify any volume to capacity choke points resulting from any ordered hurricane evacuations.
Chapter 6 – Next Steps 42

Travel Surveys Develop statewide travel surveys (household and workplace) to obtain more accurate information for use in trip generation and trip distribution. Rhode Island specific trip production and attraction rates by trip purpose, average trip lengths, and trip length frequency distributions by trip purpose are all estimates that can be used to better calibrate and validate the model in the future.
Model Users Group Develop a model users group to meet and discuss ways to improve or enhance the RISM as well as develop and share ideas for new applications for the model as a transportation planning tool.
Chapter 6 – Next Steps 43

APPENDIX
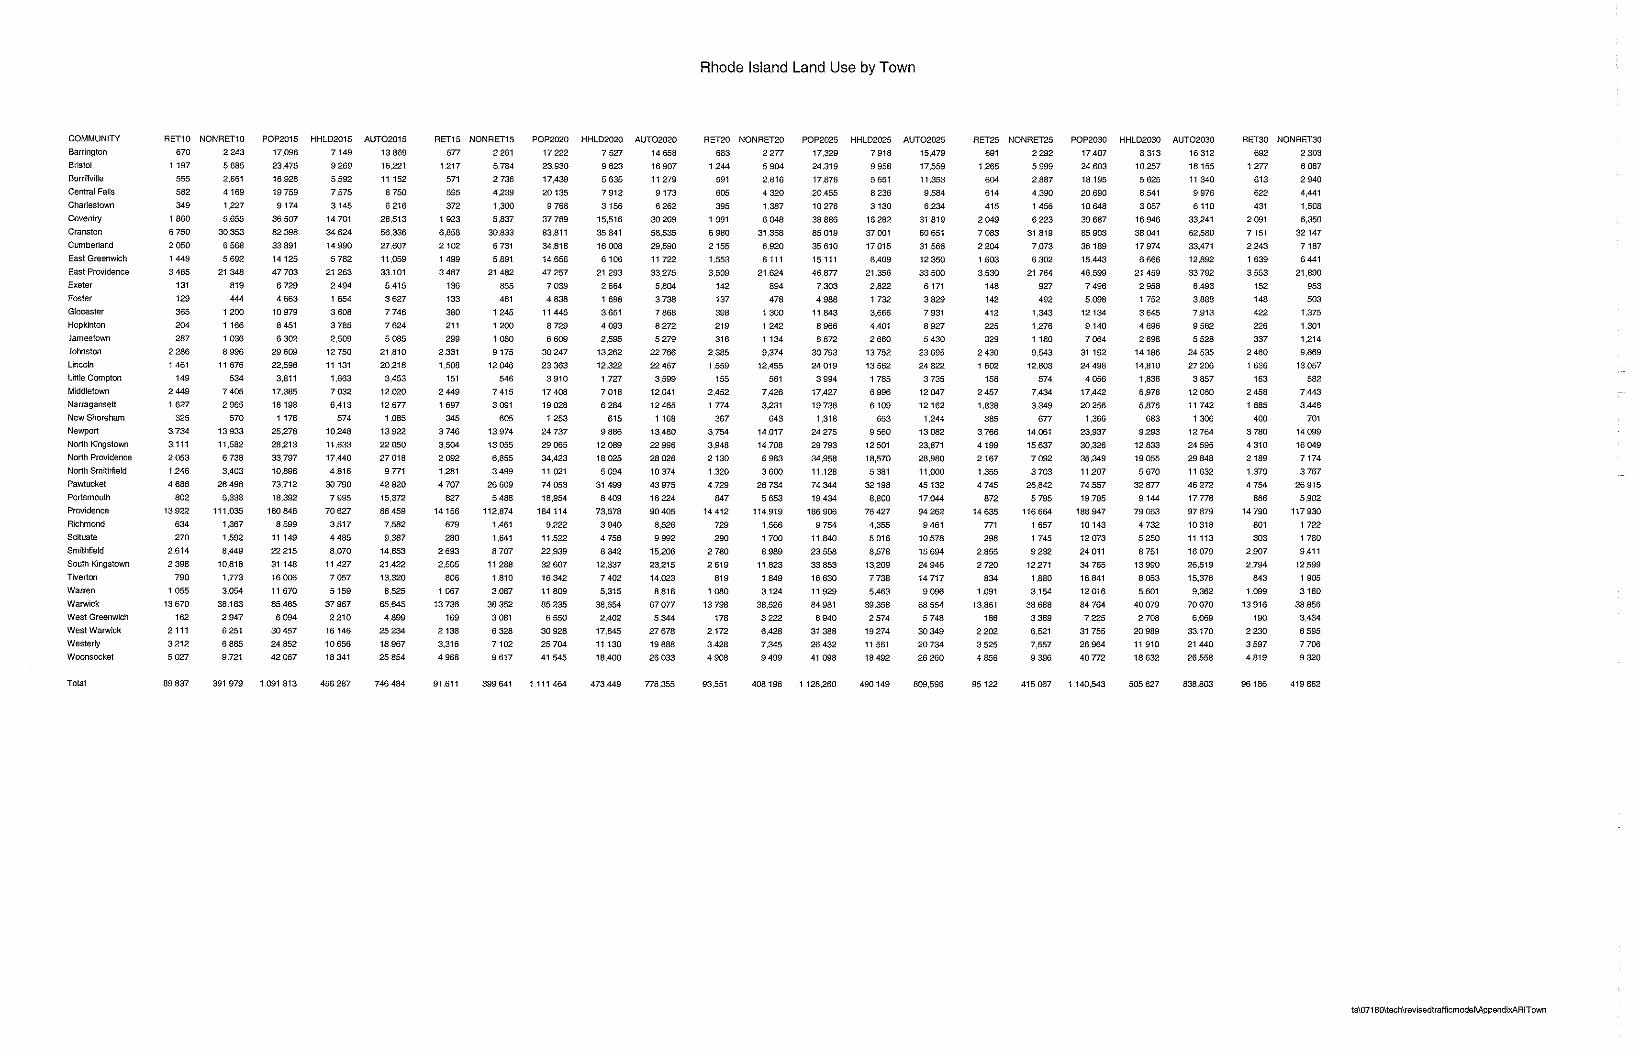
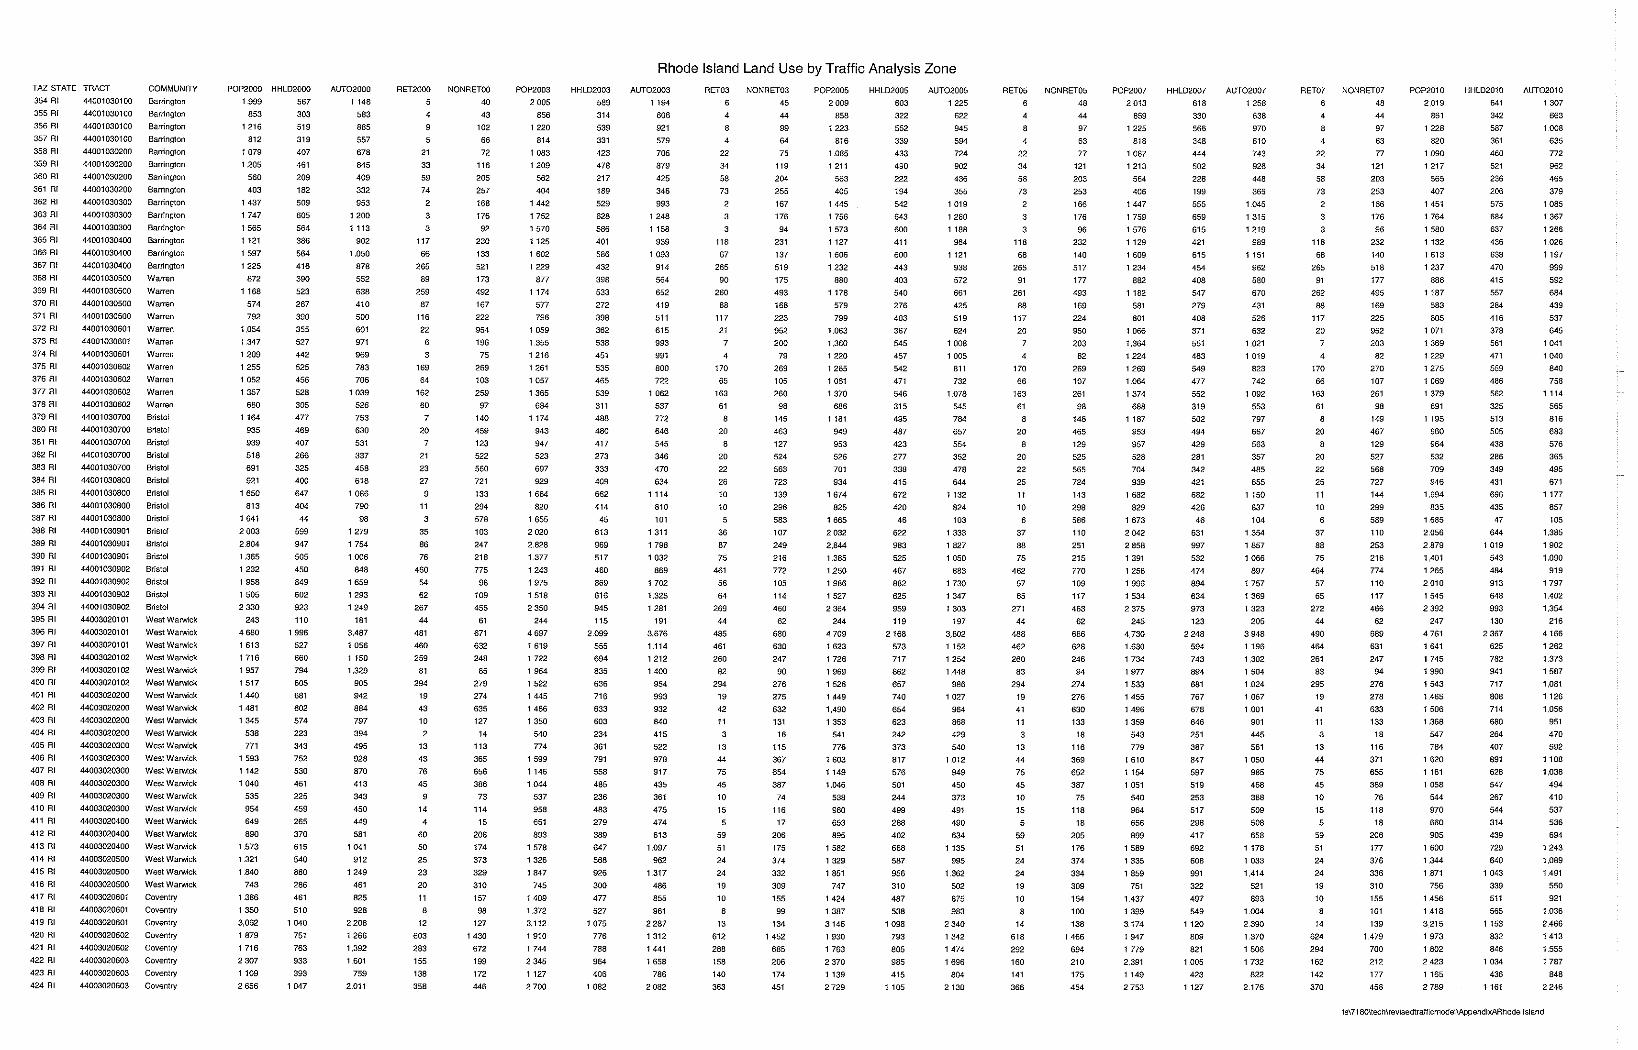
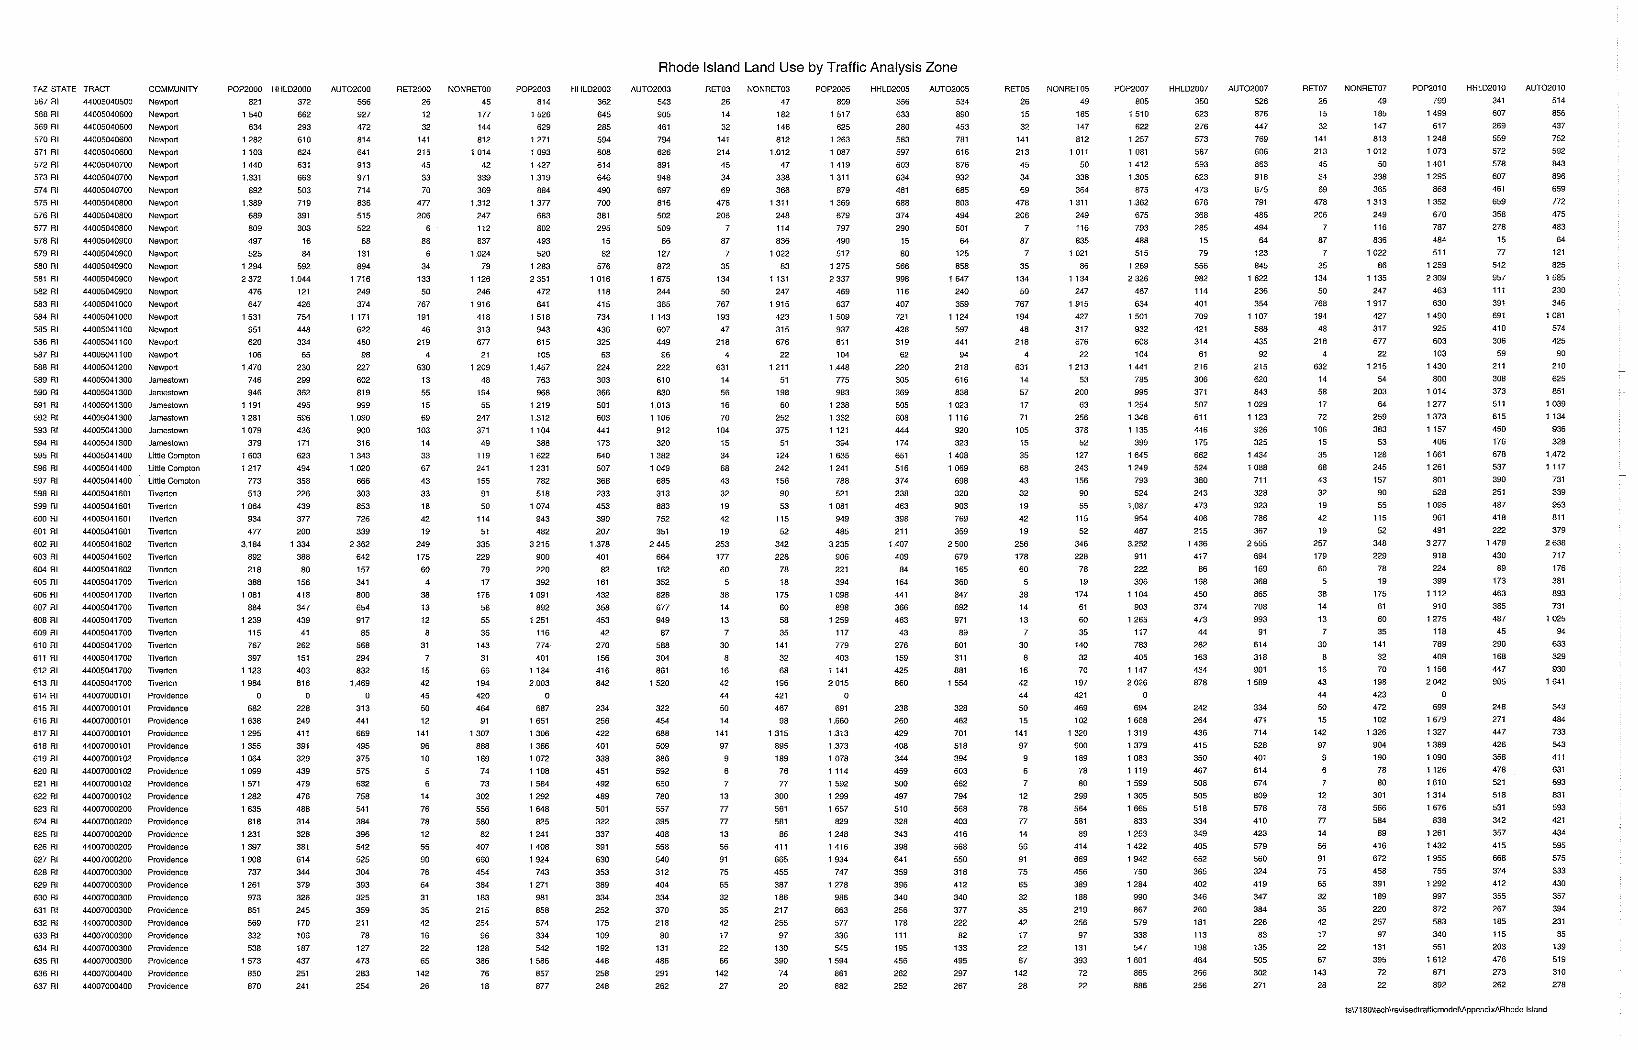
Population, Household, Vehicle and Employment Data
External Volumes and External to External Trip Tables
February 11, 2003 and July 29, 2003 Memorandums
Caliper Detailed Model Instructions
Roadway and TAZ File Formats
VMT Growth for 2007, 2010, 2015, 2020, 2025 and 2030

Population, Household, Vehicle and Employment Data


External Volumes and External to External Trip Tables


February 11, 2003 and July 29, 2003 Memorandums


Caliper Detailed Model Instructions

User’s Guide
for the
Rhode Island Statewide Model in TransCAD 4.7
7/18/06 Copyright ©2002 Caliper Corporation, All Rights Reserved.
Caliper Corporation

Page 2
This User’s Guide is designed to help you learn and use the Rhode Island Statewide Demand Model custom Add-in in TransCAD. In this document you will learn how to install and launch the Add-in and how to setup and run different scenarios. A separate manual on Model Documentation describes the models, including the details on the input files, output files, and model parameters.
In This User’s Guide
In This User’s Guide...................................................................................................................................... 2 Introduction .................................................................................................................................................... 2 Installing the Add-in....................................................................................................................................... 3 Launching the Add-in .................................................................................................................................... 4 Working with the Year 2000, No Build Base Scenario................................................................................ 4
Setting up the Year 2000, No Build Base Scenario................................................................................. 4 Running the Year 2000, No Build Base Scenario ................................................................................... 6 Viewing and Analyzing Outputs for the Year 2000, No Build Base Scenario ........................................ 7
Working with Additional Scenarios ............................................................................................................. 10 Adding a Scenario ................................................................................................................................... 10 Modifying Scenarios................................................................................................................................ 10 Managing Scenarios ............................................................................................................................... 14 Running a Scenario................................................................................................................................. 16 Viewing and Analyzing Outputs from a Scenario .................................................................................. 17
Introduction
The Rhode Island Statewide Model (RISM) custom application performs the following transportation planning procedures:
• Trip Generation • Trip Distribution • Trip Assignment In this User’s Guide you will learn how to setup scenarios, run the models, and view the output.
The Add-in allows you to store any number of scenarios. For example, you may want to have a Year 2010 Scenario and a Year 2025 Scenario. Scenarios are defined by a scenario name, a set of input files, output files, and model parameters, and there are special features in the Add-in to assist in setting up scenarios. Once you have setup a scenario, the model steps for a scenario can be run separately or in groups.
There are three key dialog boxes, shown below, that are used to manage and run the model.

Page 3
• The first is the main dialog box (called the Rhode Island Statewide Planning Model dialog box), which is what appears when the Add-in is launched. From this dialog box, scenarios are selected and the models are run.
• The second dialog box is the Project Scenarios dialog box. This is invoked by clicking on the Setup button from the main dialog box. In this dialog box, the scenarios are managed. Here you can add, delete, sort, describe, and rename scenarios. Each scenario is defined by a set of input files, output files, and parameters.
• The third dialog box is where you enter and view the detailed information regarding the scenario. This type of dialog box is launched by clicking the Contents button in the Project Scenarios dialog box. The parameter manager dialog box gives you control over the input, output and parameter information for the model step and scenario highlighted in the Project Scenarios dialog box. From the parameter manager dialog box you can open input or output files, change input or output files, and view and change model parameters.
The rest of this User’s Guide explains how to work with these dialog boxes to setup and run the Rhode Island Statewide Model.
Main Dialog Box Scenario Manager Input/Output File and Parameter Managers
Installing the Add-in
The custom Add-in is packaged in an easy-to-install setup program. Before installing the Add-in, make sure to delete all other previous versions of the Rhode Island
Page 4
Statewide model that are installed on the computer. The setup program is called setup.exe. It is located on the CD provided and should be run from within Windows. It will prompt you for the directory in which TransCAD is located and a directory into which the data files are to be copied.
This step only needs to be run one time (per computer). After it is installed, running the Add-in is as simple as running TransCAD. First, start TransCAD, then go to Tools-Add-ins and choose the Add-in entitled RHODE ISLAND Model. Click on OK to launch the custom scenario manager interface.
Launching the Add-in
Once the Add-in is installed using the steps described above, the main dialog box is launched through the Tools-Add-ins feature in TransCAD.
♦ To Launch the Add-in
1. If TransCAD is not running, launch TransCAD.
2. Choose Tools-Add-ins.
3. Choose RHODE ISLAND Model and click OK to display the RISPM dialog box. (If you do not see RHODE ISLAND Model in the Add-ins window, click Cancel and INSTALL the Add-in by following the directions above.)
All other funtionality for the Add-in is accessed through this main dialog box.
Working with the Year 2000, No Build Base Scenario
In this section you will learn how to setup, run, and view outputs for the Year 2000, No Build Base Scenario.
Setting up the Year 2000, No Build Base Scenario
Before you run the model, you must first define a scenario. This means providing TransCAD the name of the scenario along with the set of input files, output files, and parameters that define the scenario. This information is entered and viewed using the Project Scenarios and Parameter Manager dialog boxes. You can store any number of scenarios in the custom Add-in.
The Year 2000, No Build Base Scenario is particularly straightforward to setup because it is the default scenario provided with the custom Add-in (as defined in the RI_MOD.BIN file installed with the Add-in).
Page 5
♦ To Setup the Year 2000, No Build Base Scenario
1. If the Scenario Manager dialog box is not open, launch it from Tools-Add-ins.
2. From the RISM dialog box, click on the Setup button to open the Project Scenarios dialog box. If no scenarios have been created yet, you will be asked whether you would like to create a new scenario file. Click Yes. All of your scenarios and scenario settings will be stored in a binary scenario file ri_mod.arr.
3. Click the Add button to add a new scenario.
A scenario named New Scen is automatically created and added to the list of scenarios in the text box at the top of the Project Scenarios dialog box, and the current time is also listed. By default, New Scen is the Year 2000, No Build Base Scenario. The input and output files as well as the parameters are automatically entered, and the model is ready to run. Note that if you are setting up any Scenario other than the base scenario, you will have to modify at least some of the input files and parameters to match the scenario of interest. This is described later in the section on Working with Additional Scenarios.
Page 6
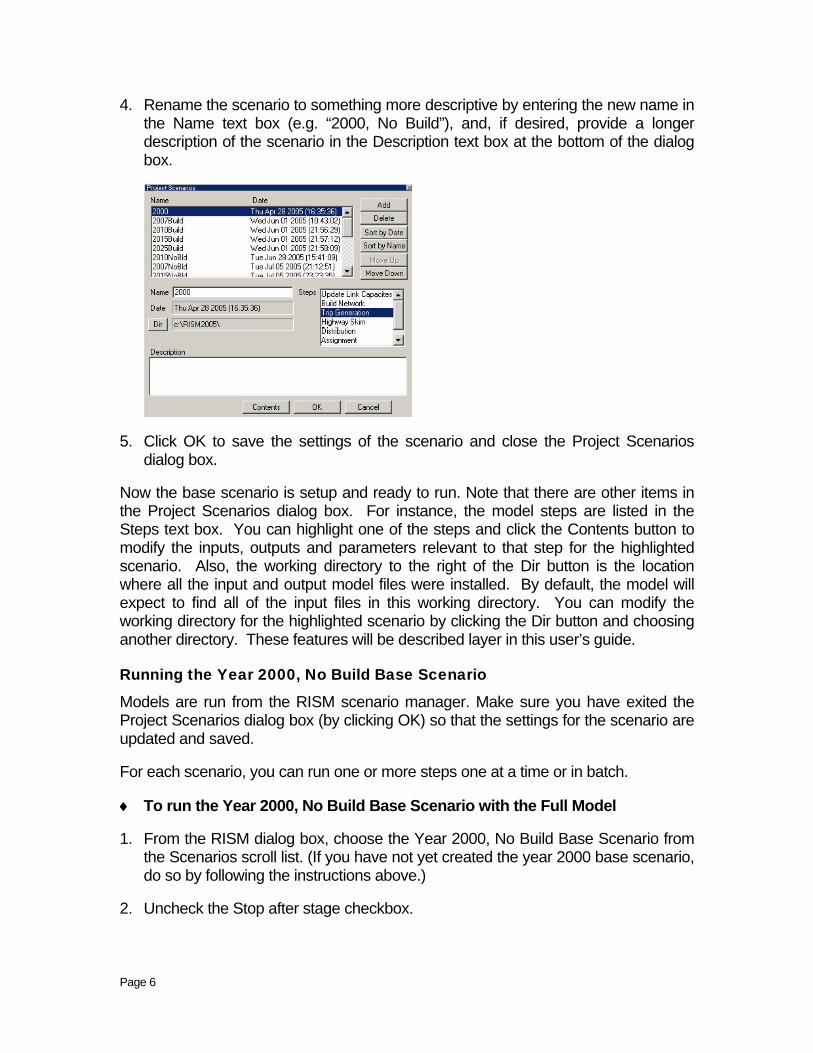
4. Rename the scenario to something more descriptive by entering the new name in the Name text box (e.g. “2000, No Build”), and, if desired, provide a longer description of the scenario in the Description text box at the bottom of the dialog box.
5. Click OK to save the settings of the scenario and close the Project Scenarios dialog box.
Now the base scenario is setup and ready to run. Note that there are other items in the Project Scenarios dialog box. For instance, the model steps are listed in the Steps text box. You can highlight one of the steps and click the Contents button to modify the inputs, outputs and parameters relevant to that step for the highlighted scenario. Also, the working directory to the right of the Dir button is the location where all the input and output model files were installed. By default, the model will expect to find all of the input files in this working directory. You can modify the working directory for the highlighted scenario by clicking the Dir button and choosing another directory. These features will be described layer in this user’s guide.
Running the Year 2000, No Build Base Scenario
Models are run from the RISM scenario manager. Make sure you have exited the Project Scenarios dialog box (by clicking OK) so that the settings for the scenario are updated and saved.
For each scenario, you can run one or more steps one at a time or in batch.
♦ To run the Year 2000, No Build Base Scenario with the Full Model
1. From the RISM dialog box, choose the Year 2000, No Build Base Scenario from the Scenarios scroll list. (If you have not yet created the year 2000 base scenario, do so by following the instructions above.)
2. Uncheck the Stop after stage checkbox.

Page 7
3. Click the Update Link Capacities button.
The custom Add-in will first run all model steps from Update Link Capacities through Update Air Quality (AQ) Speeds.
♦ To Run a Single Model Step of Year 2000, No Build Base Scenario
1. From the Rhode Island dialog box choose the Year 2000, No Build Base Scenario from the Scenarios scroll list.
2. Make sure that the Stop after stage checkbox is checked.
3. Make sure that the input files necessary for the model you want to run exist. For the base scenario, the input files should be in the directories into which they were originally installed. If they are not found, an error message will appear.
4. Click the button that corresponding to the step you want to run (e.g., Assignment).
The custom Add-in will run only the one stage and stop.
Viewing and Analyzing Outputs for the Year 2000, No Build Base Scenario
The full functionality of TransCAD is available to analyze the outputs of a model run. There are innumerable ways to perform the analysis. Below are a few suggestions to get started viewing the output results. For more information, see the TransCAD User’s Guide and Travel Demand Modeling with TransCAD manual.
♦ To Open the Output (or Input) Files for any Model Step
If you know the name and location of the output file, you can always choose File-Open in the TransCAD menu, choose the file type you wish to view (Geographic File, Dbase table, Matrix, etc.) and choose the file you wish to open. Alternatively, you can open the files from the Parameter manager dialog box of the Add-in. To use this approach:
1. Click the Setup button in the RISM scenario manager to open the Project Scenarios dialog box.
2. Select the Scenario and model Step of Interest. In the example below, the 2000, No Build scenario is selected and the Highway Skim step for that scenario is selected.

Page 8
3. Click the Contents button to open the Parameter Manager dialog box, shown below.
4. Click the Input or Output radio button to get the list of input or output files, respectively.
5. Select the files that you want to open (use Shift-click or Ctrl-click to select multiple files). In the example shown above, the shortest path matrix SPMAT.MTX is an output of the Highway Skim step. The Status column of the Files scroll list indicates whether or not the file exists.
6. Click the Open button and the Add-in will open the files into TransCAD.
Note that when the Parameter Manager dialog box is open, you can change the step or the scenario that is displayed in the dialog box by clicking on a new step in the Steps scroll list in the Project Scenarios dialog box.
There are many files that play a role in several of the model steps. For example, the trip distribution and PA to OD steps generate an OD flow matrix as an output, which

Page 9
is an input to the assignment step. However, each file will appear only once (for the first model step where it is used) in the entire set of Parameter Manager dialog boxes. This is to prevent conflicting files from being used at different stages of the model.
♦ To View the Running Log and Report Files
Each time a model is run, the Add-in will save information on the run in two text files, the log file and the report file. The log file lists every procedure that you run and any warnings that were encountered. The report file lists every procedure that you run. It also lists all of the input data that was used for the procedure. To view these files:
1. Choose Edit-Preferences from the TransCAD menu to open the Preferences dialog box.
2. Choose the Logging tab.
3. Click on the Display button to display either the log file or the report file.
Information on the most recent model run will be at the end of these files.

Page 10
Working with Additional Scenarios
Any number of scenarios can be created, saved, and run using the Add-in.
Adding a Scenario
♦ To Create an Additional Scenario
1. From the RISM scenario manager dialog box, click on the Setup button to open the Project Scenarios dialog box.
2. Click the Add button to add a new scenario. The Add-in will create a scenario named New Scen and add it (along with the current date and time) to the end of the list of scenarios in the dialog box.
3. Rename the scenario using the Name text box.
4. Enter a description for the scenario in the Description text box.
By default, the added scenario is created using the settings for the default Year 2000, No Build Base Scenario, and so you will have to specify those settings that distinguish it from the base scenario. The next step describes how to do this.
Modifying Scenarios
A scenario is defined by the set of input files, output files, and parameters for which the model is to be run. Each step of the model has a different set of files and parameters. These settings are managed using the Parameter manager dialog boxes, for which there is a different dialog box for each model step. When you change the working directory, the input files, output files, or parameters in the Project Scenarios or Parameter Manager dialog boxes, you are changing those settings only for the current, highlighted scenario.
An important point in selecting the input files to use for a given scenario is that these files must be consistent with the input files provided for the default Year 2000, No Build Base Scenario. This means that:
• All table inputs (Demographics table, trip rates table, etc.) must contain the same field names as the original default files. However, you can use any of the following formats for the tables: DBASE, Comma Delimited ASCII, Fixed Format ASCII and Fixed Format Binary
• Matrices must contain the IDs of the current Rhode Island Statewide centroid nodes found on the node layer of the highway database.
If any of these restrictions are violated, the Add-in will give you error messages if you attempt to run the model.
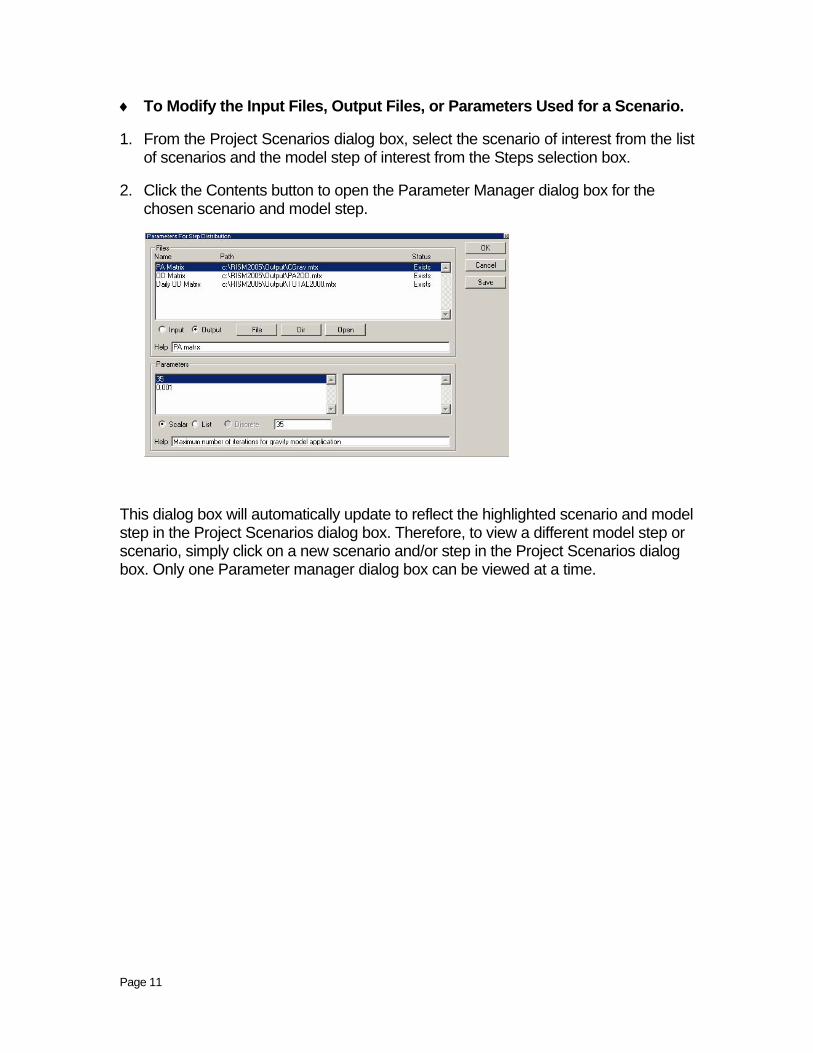
Page 11
♦ To Modify the Input Files, Output Files, or Parameters Used for a Scenario.
1. From the Project Scenarios dialog box, select the scenario of interest from the list of scenarios and the model step of interest from the Steps selection box.
2. Click the Contents button to open the Parameter Manager dialog box for the chosen scenario and model step.
This dialog box will automatically update to reflect the highlighted scenario and model step in the Project Scenarios dialog box. Therefore, to view a different model step or scenario, simply click on a new scenario and/or step in the Project Scenarios dialog box. Only one Parameter manager dialog box can be viewed at a time.

Page 12
Use this dialog box to manage the input and output files as follows
To do this… Do this…
View the list of input files Click the Input radio button, and all input files for the model step will be displayed in the Files scroll list.
View the list of output files Click the Output radio button, and all output files for the step will be displayed in the Files scroll list.
Obtain a description of the file Select the file of interest from the Files scroll list, and a description will be provided in the Help text box.
Check the status of a file The Status column in the Files scroll list states whether a file Exists, is In Use, or is Missing.
In Use files will be automatically closed when a model is run.
All of the input files must Exist in order for a model to be run.
Any output files that Exist will be overwritten when a model is run.
Open a file Either double click on the file in the Files scroll list, or select the file in the Files scroll list and Click the Open button. Networks (.NET) and transit networks (.TNW) cannot be opened, but their geographic counterparts (.DBD line geographic files and .RTS route systems) can.
Change the file that is used Select the file you want to change from the Files scroll list. Click on File and select the file that you want to use.
All input files must match the structure of the input files provided with the Year 2000 Base Scenario
Change the directory of a file To change the directory of a file, select it from the Files scroll list, click on Dir and select the directory. To change the directory for multiple files, use Shift-click or Ctrl-click to select multiple files from the Files scroll list.

Page 13
3. Use this dialog box to manage the parameters as follows
To do this… Do this…
View scalar parameters Click the Scalar radio button and the scalar parameters will be listed in the Parameters scroll list.
View List (Vector) parameters Click the List radio button and any parameter lists will be displayed in the left Parameters scroll list. Click on a parameter list and the parameters that make up the list will be displayed in the right Parameters scroll list.
View Discrete parameters Click the Discrete radio button and any discrete choice lists will be displayed in the left Parameters scroll list. Click on a parameter list and the parameters that make up the list will be displayed in the right Parameters scroll list.
Discrete parameters include single (scalar) parameters that must be selected from a predefined set of alternatives. In the left Parameters scroll list, the current choice is separated from the choice list by a “;”.
Obtain a description Select a parameter from the Parameters scroll of the Parameter list, and a description will be provided in the
Help text box.
Change the parameter Select the parameter from the Parameters scroll list and enter the value of the parameter in the text box.
For discrete parameters, you cannot edit the values that make up the choice set. Rather, you click on the value in the list in the right Parameters scroll list to choose that value.
Note that Run Year and Build Condition parameters can also be selected from the drop-down lists in the RISM scenario manager dialog box. This will change the parameter value for the scenario highlighted in the Scenarios scroll list.

Page 14
Managing Scenarios
Any number of scenarios can be stored in the Add-in. Scenarios can be added, deleted, and modified at will.
♦ To Manage the Scenarios
1. From the RISM scenario manager, click the Setup button to open the Project Scenarios dialog box.

Page 15
2. Use this dialog box to manage the scenarios as follows
To do this… Do this…
Add a new scenario Click the Add button and a scenario named New Scen will be added to the bottom of the list of scenarios along with a time stamp. This scenario will, by default, be setup with the Year 2000 Base Scenario settings.
Delete a scenario Select the scenario you want to delete from the Scenario scroll list, and click the Delete button.
Sort the scenarios by date Click the Sort by Date button.
Sort the scenarios by name Click the Sort by Name button.
Move a scenario up or down Select the scenario you want to move up in the scenario list and click the Move Up or Move Down button.
Rename a scenario Select the scenario you want to rename and enter the new name in the Name text box.
Change the default directory Select the scenario for which you want to change the default directory for the input and output files, click the Dir button and select the directory. The directory for all input and output files for the scenario will be changed to this default directory.
Provide a description Select the scenario for which you want to provide a description, and enter the description in the Description text box.
Save scenario settings Click OK.
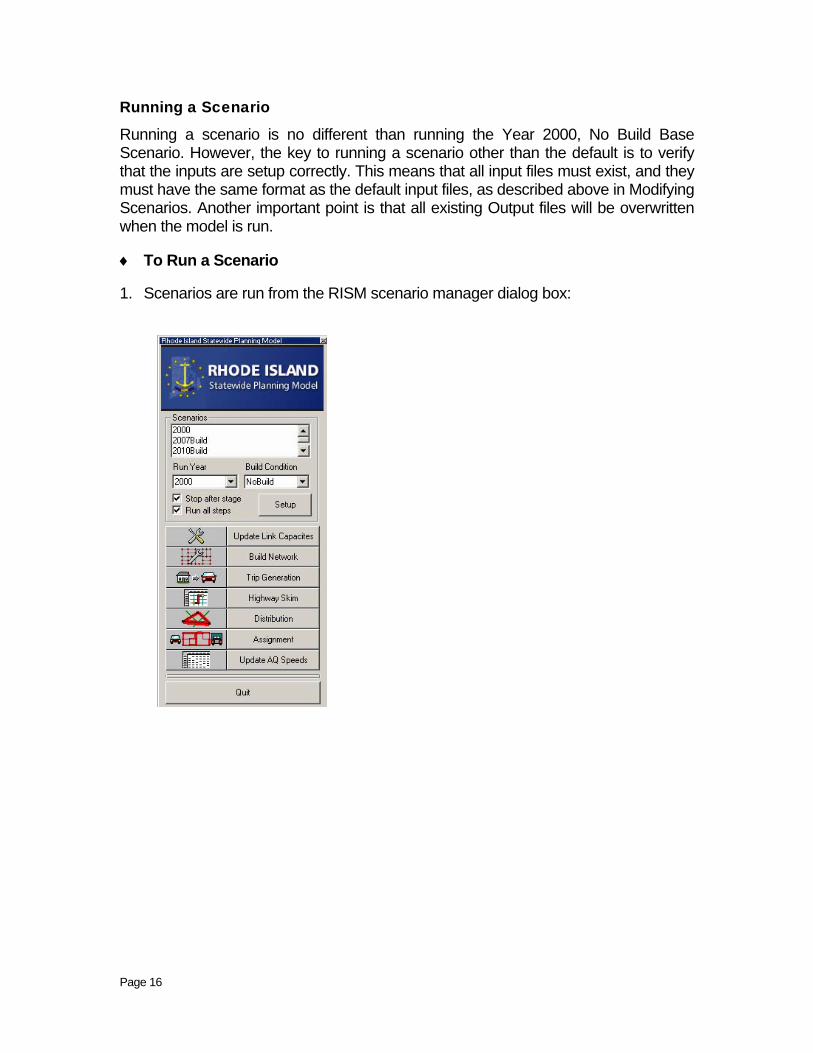
Page 16
Running a Scenario
Running a scenario is no different than running the Year 2000, No Build Base Scenario. However, the key to running a scenario other than the default is to verify that the inputs are setup correctly. This means that all input files must exist, and they must have the same format as the default input files, as described above in Modifying Scenarios. Another important point is that all existing Output files will be overwritten when the model is run.
♦ To Run a Scenario
1. Scenarios are run from the RISM scenario manager dialog box:

Page 17
2. Select the scenario you want to run from the list of scenarios, and use this dialog box to run models as follows:
To do this… Do this…
Run one model step Verify that all inputs for the model step exist. Check the Stop after stage checkbox, check Run all steps, and click the button corresponding to the model step you want to run.
Skip a model step Click on the picture button next to the step you want to skip to open the Stage Step Settings dialog box. Some model stages are split into sub-steps. These sub-steps are listed in the Stage Step Settings dialog box. Uncheck any step you do not want to run and click OK. The Run all steps checkbox will automatically be unchecked.
View/modify scenario settings Click Setup to open the Project Scenarios dialog box, and follow instructions above regarding setting up scenarios.
Exit the Add-in Click Quit
Viewing and Analyzing Outputs from a Scenario
Once the model is run, you can use all of the functionality in TransCAD to view and analyze results. There are innumerable ways to perform the analysis. Examples of such analysis were provided under the heading of Viewing and Analyzing Outputs of the Year 2000 Base Year Scenario. For more information, see the TransCAD User’s Guide and Travel Demand Modeling with TransCAD manual.

Roadway and TAZ File Formats

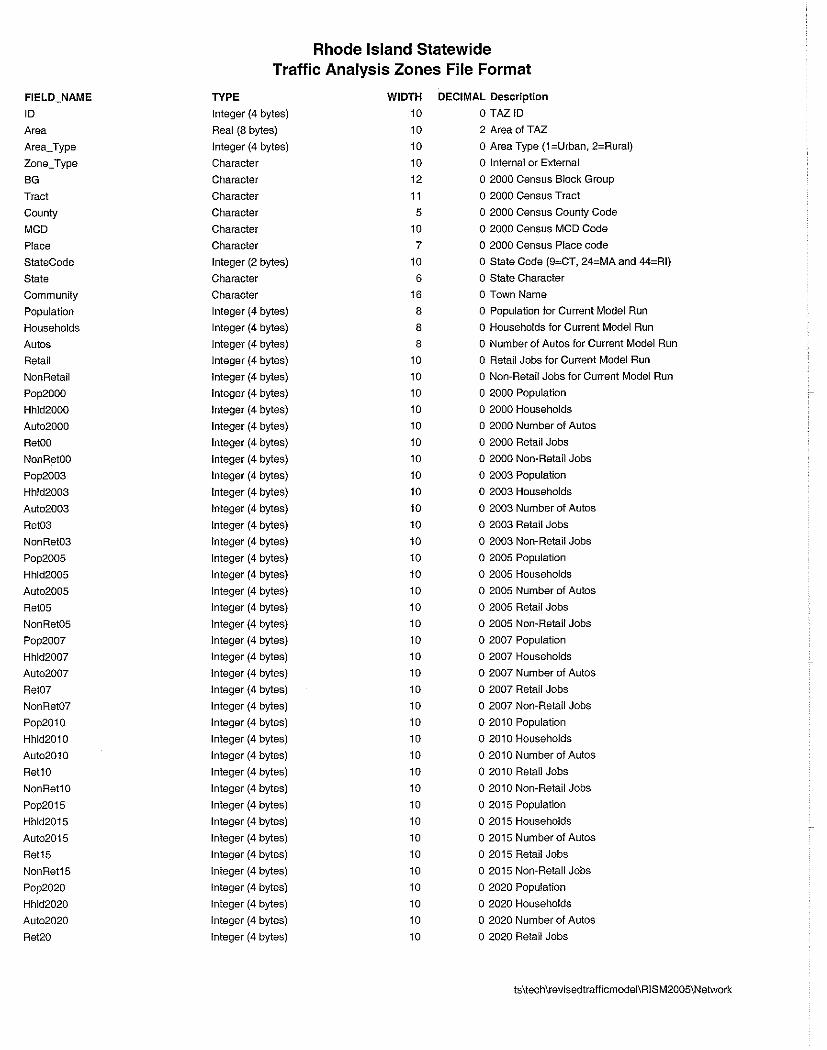


VMT Growth for 2007, 2010, 2015, 2020, 2025, 2030


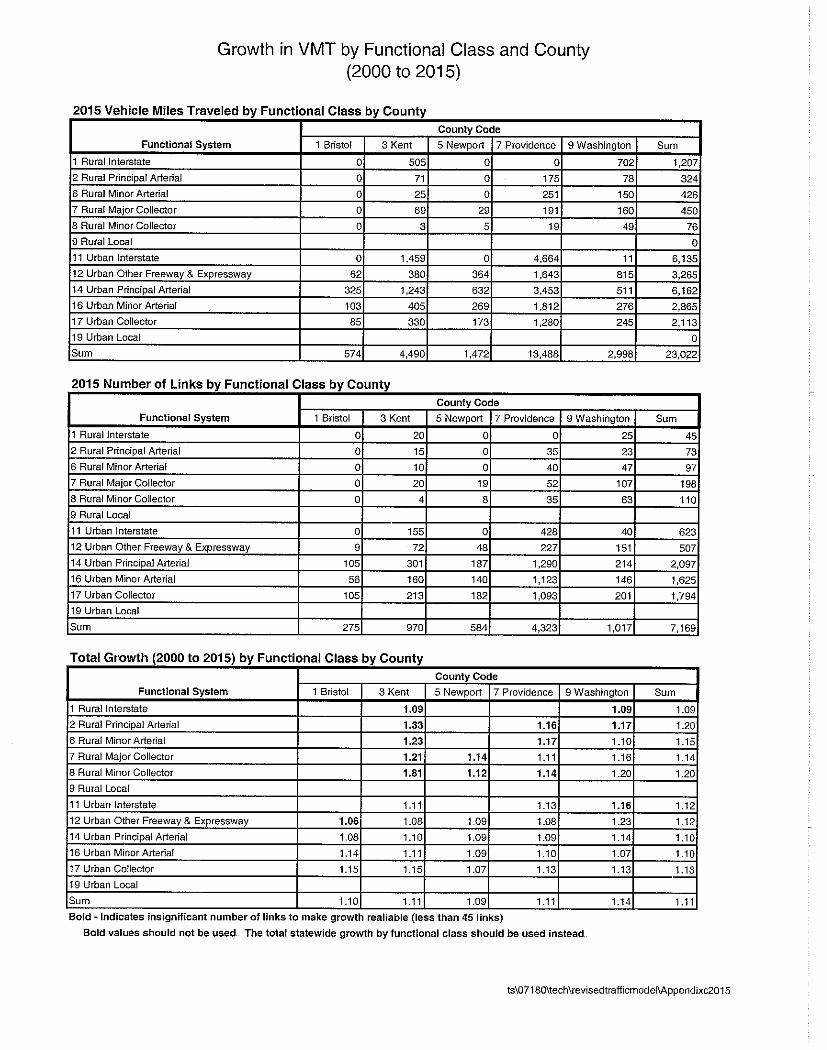
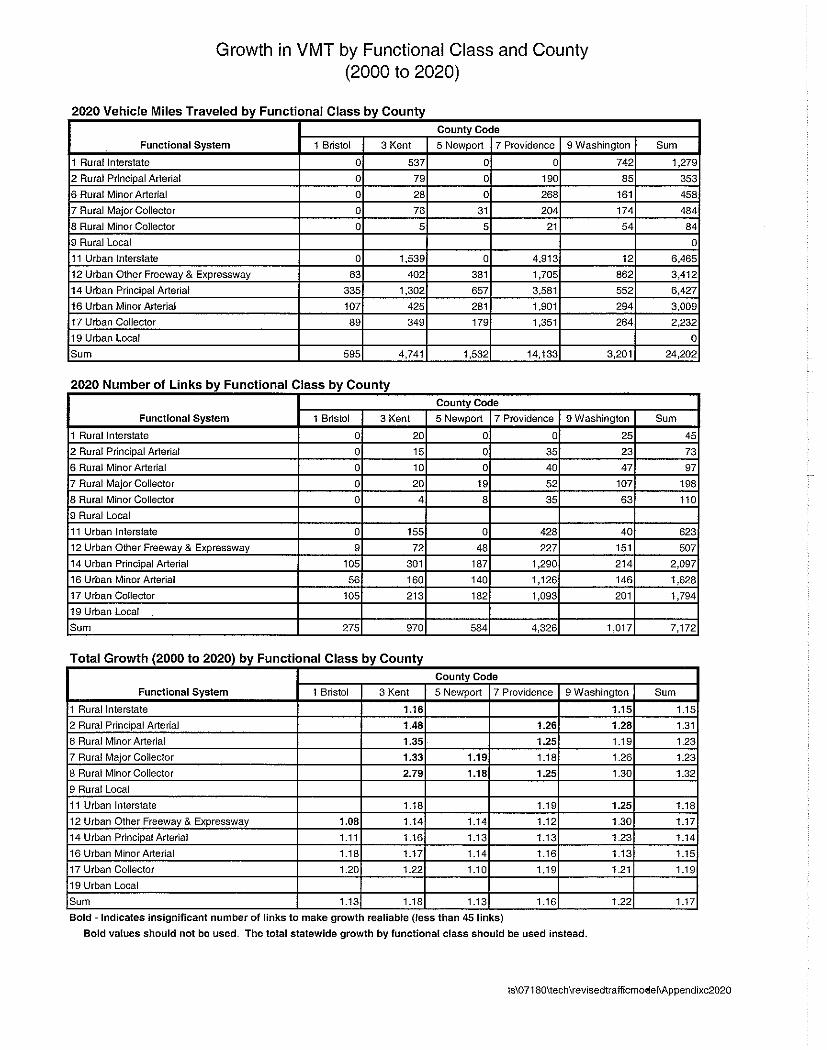


Related Documents