Statewide Epidemiology Workgroup March 16, 2011

Statewide Epidemiology Workgroup March 16, 2011. National Survey on Drug Use and Health (NSDUH) Office of Applied Studies, Substance Abuse and Mental.
Dec 25, 2015
Welcome message from author
This document is posted to help you gain knowledge. Please leave a comment to let me know what you think about it! Share it to your friends and learn new things together.
Transcript

Statewide Epidemiology Workgroup
March 16, 2011

National Survey on Drug Use and Health (NSDUH)
Office of Applied Studies, Substance Abuse and Mental Health Services
Administration (SAMHSA)

• NSDUH is the primary source of information on the prevalence, patterns, and consequences of alcohol, tobacco and illegal drug use and abuse in the general civilian non-institutionalized population, aged 12 and older.
• In the combined surveys for 2006 through 2008, data were collected from 204,408 respondents with a design intended to obtain representative samples from all 50 states and the District of Columbia.

Estimate95%
Confidence Interval
Estimate95%
Confidence Interval
Estimate95%
Confidence Interval
Estimate95%
Confidence Interval
Estimate95%
Confidence Interval
United States 51.23 (50.76-51.71) 23.26 (22.92-23.61) 41.95 (41.51-42.38) 27.53 (27.01-28.05) 18.31 (17.88-18.75)Maryland 54.72 (52.30-57.11) 21.67 (19.81-23.65) 43.19 (40.67-45.75) 27.28 (25.22-29.44) 16.92 (15.16-18.85)
Anne Arundel 58.98 (53.07-64.63) 23.80 (20.06-27.98) 39.73 (35.22-44.41) 29.96 (25.34-35.03) 20.49 (16.40-25.28)Baltimore City 43.29 (37.92-48.83) 21.67 (18.28-25.49) 49.09 (44.49-53.72) 23.80 (19.81-28.32) 14.78 (11.60-18.65)Baltimore County 59.56 (53.85-65.02) 23.55 (20.00-27.51) 41.21 (37.11-45.43) 30.35 (26.35-34.68) 19.30 (15.92-23.19)Montgomery 58.68 (53.31-63.86) 20.92 (17.71-24.54) 44.50 (40.14-48.94) 26.58 (22.50-31.10) 16.38 (13.02-20.39)North Central 61.50 (55.53-67.14) 22.73 (18.98-26.97) 40.10 (35.45-44.94) 29.36 (24.91-34.23) 19.07 (15.17-23.70)Northeast 58.65 (52.51-64.53) 23.20 (19.30-27.63) 38.79 (34.51-43.26) 29.98 (24.95-35.55) 19.30 (15.21-24.19)Prince George's 47.26 (41.94-52.65) 18.08 (15.01-21.61) 49.57 (45.30-53.86) 22.88 (19.16-27.08) 12.15 (9.35-15.64)South 50.99 (44.90-57.06) 20.35 (16.92-24.29) 41.18 (36.63-45.88) 27.08 (22.77-31.88) 16.91 (13.32-21.23)West 56.66 (50.35-62.76) 22.91 (19.19-27.09) 38.21 (33.73-42.90) 30.56 (25.88-35.69) 18.81 (14.83-23.58)
Estimate95%
Confidence Interval
Estimate95%
Confidence Interval
United States 7.53 (7.34-7.73) 9.07 (8.86-9.29)Maryland 7.30 (6.34-8.40) 8.72 (7.66-9.92)
Anne Arundel 7.71 (6.00-9.87) 9.83 (7.64-12.57)Baltimore City 7.64 (5.96-9.75) 9.74 (7.59-12.42)Baltimore County 7.90 (6.23-9.97) 9.45 (7.44-11.93)Montgomery 6.20 (4.84-7.92) 7.31 (5.66-9.40)North Central 7.58 (5.82-9.80) 8.69 (6.70-11.19)Northeast 7.95 (6.09-10.30) 9.61 (7.41-12.39)Prince George's 6.93 (5.34-8.94) 8.17 (6.30-10.52)South 7.26 (5.60-9.37) 8.23 (6.25-10.75)West 7.28 (5.59-9.43) 8.31 (6.40-10.74)
Dependence on or Abuse of Alcohol
Dependence on or Abuse of Alcohol and/or Illicit
DrugsRegion
Age 12 to 20 Binge Alcohol Use Past Month
Region
Alcohol Use Past Month
Binge Alcohol Use Past Month
Perception of Great Risk of Binge Alcohol Use
Once or Twice a Week
Age 12 to 20 Alcohol Use Past Month
North Central - Carroll and Howard counties. Northeast - Caroline, Cecil, Harford, Kent, Queen Anne's and Talbot counties. South - Calvert, Charles, Dorchester, St. Mary's, Somerset, Wicomico and Worcester counties. West - Allegany, Frederick, Garrett and Washington counties.
Adapted by ADAA from the Substance Abuse and Mental Health Services Administration (SAMHSA) National Survey on Drug Use and Health (NSDUH), 2006 - 2008.

*Low precision; no estimate reported.
Estimate95%
Confidence Interval
Estimate95%
Confidence Interval
Estimate95%
Confidence Interval
Estimate95%
Confidence Interval
United States 15.70 (15.31 -16.09) 61.42 (60.80 -62.03) 54.18 (53.58 -54.78) 55.24 (54.72 -55.77) Northeast U.S. 17.69 (16.95 -18.45) 66.84 (65.72 -67.95) 59.24 (58.16 -60.30) 60.32 (59.37 -61.27) Maryland 14.89 (13.04 -16.94) 64.38 (61.12 -67.53) 58.38 (55.40 -61.30) 59.24 (56.57 -61.85)
Anne Arundel 17.02 (12.95 -22.05) * (* -*) * (* -*) 63.60 (57.16 -69.58)Baltimore City 11.66 (8.74 -15.38) 54.18 (47.48 -60.74) 45.35 (38.86 -52.01) 46.85 (40.95 -52.84)Baltimore County 16.44 (12.46 -21.38) 69.14 (63.07 -74.61) * (* -*) 64.13 (57.91 -69.91)Montgomery 16.37 (12.57 -21.05) 68.05 (61.45 -73.99) 62.77 (56.47 -68.66) 63.40 (57.54 -68.89)North Central 16.83 (12.61 -22.10) * (* -*) * (* -*) 67.03 (60.41 -73.04)Northeast 17.65 (13.34 -22.98) * (* -*) * (* -*) 63.35 (56.64 -69.58)Prince George's 9.58 (7.07 -12.85) * (* -*) 50.63 (44.18 -57.06) 51.90 (46.00 -57.74)South 14.72 (11.29 -18.96) * (* -*) * (* -*) 55.12 (48.42 -48.42)West 17.25 (13.23 -22.19) * (* -*) * (* -*) * (* -*)
Estimate95%
Confidence Interval
Estimate95%
Confidence Interval
Estimate95%
Confidence Interval
Estimate95%
Confidence Interval
United States 9.56 (9.26 -9.87) 41.71 (41.11 -42.32) 21.89 (21.47 -22.32) 24.81 (24.43 -25.20) Northeast U.S. 10.77 (10.19 -11.37) 45.42 (44.37 -46.47) 22.35 (21.49 -23.24) 25.64 (24.87 -26.43) Maryland 8.93 (7.49 -10.61) 39.08 (35.94 -42.32) 20.46 (18.27 -22.85) 23.11 (21.06 -25.30)
Anne Arundel 11.12 (8.13 -15.01) * (* -*) 21.88 (17.96 -26.39) 25.19 (21.18 -29.67)Baltimore City 6.27 (4.51 -8.67) 31.61 (25.95 -37.87) 21.71 (17.83 -26.18) 23.40 (19.68 -27.58)Baltimore County 9.65 (7.06 -13.07) 45.46 (39.01 -52.07) 21.76 (17.87 -26.23) 25.02 (21.20 -29.28)Montgomery 9.78 (7.13 -13.27) * (* -*) 19.52 (16.03 -23.55) 22.16 (18.70 -26.06)North Central 10.60 (7.83 -14.21) * (* -*) 20.97 (17.05 -25.51) 24.23 (20.16 -28.83)Northeast 11.46 (8.40 -15.44) * (* -*) 21.57 (17.49 -26.30) 24.55 (20.32 -29.33)Prince George's 4.88 (3.39 -6.99) 27.70 (22.07 -34.12) 18.10 (14.68 -22.10) 19.70 (16.32 -23.58)South 9.02 (6.55 -12.31) * (* -*) 19.22 (15.57 -23.48) 21.64 (17.91 -25.91)West 10.76 (7.88 -14.52) * (* -*) 20.73 (16.91 -25.15) 24.21 (20.21 -28.72)
Alcohol Use in the Past Month by Age Group12 to 17 18 to 25 26 and Older 18 and Older
Binge Alcohol Use in the Past Month by Age Group12 to 17 18 to 25 26 and Older 18 and Older
Region
Region

*Low precision; no estimate reported.
Estimate95%
Confidence Interval
Estimate95%
Confidence Interval
Estimate95%
Confidence Interval
Estimate95%
Confidence Interval
United States 39.81 (39.28 -40.34) 33.01 (32.47 -33.55) 43.77 (43.22 -44.32) 42.19 (41.71 -42.67) Northeast U.S. 38.72 (37.78 -39.67) 30.44 (29.49 -31.41) 41.91 (40.91 -42.91) 40.27 (39.40 -41.15) Maryland 42.18 (38.95 -45.48) 36.73 (33.76 -39.80) 44.40 (41.37 -47.48) 43.31 (40.62 -46.04)
Anne Arundel 38.36 (32.75 -44.29) 31.57 (26.62 -36.97) 41.16 (35.88 -46.66) 39.88 (35.10 -44.86)Baltimore City 49.16 (42.73 -55.62) 46.09 (40.21 -52.08) 49.70 (44.25 -55.17) 49.09 (44.22 -53.97)Baltimore County 39.98 (33.78 -46.53) 33.27 (28.41 -38.52) 42.62 (37.80 -47.58) 41.33 (37.03 -45.78)Montgomery 42.46 (36.61 -48.52) 35.93 (30.25 -42.04) 45.91 (40.87 -51.04) 44.72 (40.12 -49.42)North Central 39.33 (33.33 -45.68) 29.16 (23.42 -35.66) 41.82 (36.49 -47.35) 40.20 (35.27 -45.34)Northeast 37.61 (31.80 -43.79) 30.36 (24.77 -36.61) 40.24 (35.31 -45.38) 38.93 (34.40 -43.66)Prince George's 50.10 (44.17 -56.03) 46.40 (40.52 -52.37) 50.13 (45.08 -55.18) 49.51 (45.04 -53.98)South 39.13 (33.50 -45.07) 34.74 (28.96 -41.02) 42.60 (37.34 -48.03) 41.41 (36.65 -46.34)West 35.52 (29.60 -41.93) 28.47 (23.23 -34.37) 40.10 (34.88 -45.57) 38.50 (33.80 -43.42)
Estimate95%
Confidence Interval
Estimate95%
Confidence Interval
Estimate95%
Confidence Interval
Estimate95%
Confidence Interval
United States 5.20 (4.97 -5.43) 17.19 (16.78 -17.61) 6.18 (5.95 -6.42) 7.80 (7.59 -8.01) Northeast U.S. 4.98 (4.60 -5.40) 17.31 (16.51 -18.14) 5.69 (5.28 -6.13) 7.34 (6.96 -7.75) Maryland 4.65 (3.70 -5.82) 16.63 (14.50 -19.01) 6.10 (5.07 -7.33) 7.60 (6.58 -8.77)
Anne Arundel 5.15 (3.50 -7.52) 19.32 (14.57 -25.16) 6.24 (4.60 -8.43) 7.99 (6.17 -10.29)Baltimore City 3.04 (2.06 -4.48) 14.82 (11.36 -19.12) 6.79 (5.00 -9.16) 8.16 (6.33 -10.46)Baltimore County 4.90 (3.37 -7.07) 19.31 (15.19 -24.23) 6.45 (4.76 -8.68) 8.22 (6.44 -10.44)Montgomery 5.00 (3.45 -7.18) 15.37 (11.69 -19.94) 5.11 (3.77 -6.91) 6.34 (4.89 -8.17)North Central 5.83 (3.97 -8.47) * (* -*) 5.91 (4.27 -8.13) 7.79 (5.93 -10.18)Northeast 5.97 (4.12 -8.57) * (* -*) 6.43 (4.69 -8.75) 8.17 (6.21 -10.68)Prince George's 3.02 (2.02 -4.50) 12.74 (9.55 -16.81) 6.34 (4.62 -8.65) 7.41 (5.68 -9.61)South 4.89 (3.35 -7.09) 15.94 (11.89 -21.04) 6.04 (4.40 -8.23) 7.53 (5.76 -9.78)West 5.52 (3.76 -8.03) 17.22 (12.93 -22.55) 5.91 (4.29 -8.10) 7.47 (5.69 -9.75)
18 and Older
Alcohol Dependence or Abuse in Past Year by Age Group12 to 17 18 to 25
Region
Region
26 and Older 18 and Older
Perception of Great Risk of Binge Alcohol Use Once or Twice a Week by Age Group12 to 17 18 to 25 26 and Older

Estimate95%
Confidence Interval
Estimate95%
Confidence Interval
Estimate95%
Confidence Interval
Estimate95%
Confidence Interval
United States 7.78 (7.51 -8.06) 20.91 (20.46 -21.37) 7.20 (6.95 -7.46) 9.22 (8.99 -9.46) Northeast U.S. 7.46 (6.99 -7.96) 21.49 (20.63 -22.39) 6.68 (6.23 -7.16) 8.79 (8.38 -9.22) Maryland 7.01 (5.81 -8.43) 19.59 (17.29 -22.12) 7.14 (5.97 -8.53) 8.92 (7.79 -10.19)
Anne Arundel 8.02 (5.75 -11.10) * (* -*) 7.87 (5.73 -10.72) 10.03 (7.72 -12.93)Baltimore City 5.60 (4.00 -7.79) 18.02 (13.95 -22.97) 8.61 (6.29 -11.67) 10.21 (7.90 -13.10)Baltimore County 7.58 (5.45 -10.44) 21.94 (17.51 -27.13) 7.69 (5.65 -10.38) 9.65 (7.53 -12.28)Montgomery 7.11 (5.13 -9.79) 18.26 (13.85 -23.68) 5.86 (4.27 -7.99) 7.34 (5.61 -9.54)North Central 7.94 (5.70 -10.95) * (* -*) 6.62 (4.79 -9.09) 8.78 (6.69 -11.44)Northeast 8.68 (6.19 -12.04) * (* -*) 7.55 (5.47 -10.32) 9.72 (7.41 -12.65)Prince George's 5.01 (3.54 -7.03) 14.93 (11.23 -19.58) 7.28 (5.33 -9.87) 8.55 (6.54 -11.11)South 7.11 (5.10 -9.84) * (* -*) 6.62 (4.75 -9.15) 8.35 (6.27 -11.04)West 7.76 (5.53 -10.78) 19.93 (15.02 -25.94) 6.52 (4.72 -8.95) 8.37 (6.38 -10.92)
* Low precision; no estimate reported.
Region
Dependence on or Abuse of Illicit Drugs or Alcohol in Past Year by Age Group12 to 17 18 to 25 26 and Older 18 and Older

Estimate95%
Confidence Interval
Estimate95%
Confidence Interval
Estimate95%
Confidence Interval
Estimate95%
Confidence Interval
Estimate95%
Confidence Interval
United States 8.14 (7.93-8.35) 3.71 (3.58-3.86) 5.99 (5.82-6.17) 1.64 (1.59-1.69) 38.31 (37.86-38.75)Maryland 6.74 (5.80-7.82) 3.13 (2.50-3.92) 4.93 (4.18-5.81) 1.72 (1.53-1.95) 38.71 (36.19-41.28)
Anne Arundel 6.43 (4.80-8.56) 3.24 (2.26-4.64) 4.50 (3.19-6.32) 1.85 (1.41-2.44) 34.81 (29.69-40.30)Baltimore City 9.79 (7.56-12.59) 3.44 (2.42-4.87) 7.43 (5.55-9.88) 1.81 (1.41-2.32) 43.19 (38.12-48.41)Baltimore County 7.30 (5.57-9.51) 3.15 (2.23-4.43) 5.26 (3.89-7.08) 2.35 (1.85-2.98) 38.06 (33.04-43.36)Montgomery 6.01 (4.47-8.03) 2.87 (1.99-4.12) 4.57 (3.30-6.29) 1.44 (1.13-1.84) 37.59 (32.79-42.65)North Central 5.98 (4.40-8.08) 3.01 (2.09-4.31) 4.45 (3.13-6.30) 1.60 (1.20-2.12) 33.98 (28.63-39.78)Northeast 7.10 (5.23-9.57) 3.74 (2.62-5.32) 4.65 (3.24-6.63) 1.79 (1.33-2.40) 34.38 (29.06-40.13)Prince George's 6.01 (4.50-7.97) 2.81 (1.96-4.01) 4.52 (3.22-6.31) 1.79 (1.41-2.28) 43.46 (38.58-48.48)South 5.88 (4.34-7.91) 3.04 (2.14-4.30) 4.24 (2.98-5.98) 1.44 (1.10-1.88) 39.72 (34.41-45.28)West 6.08 (4.48-8.20) 3.26 (2.30-4.60) 4.44 (3.14-6.23) 1.39 (1.06-1.81) 39.37 (33.92-45.09)
Estimate95%
Confidence Interval
Estimate95%
Confidence Interval
Estimate95%
Confidence Interval
Estimate95%
Confidence Interval
Total United States 2.32 (2.21-2.43) 5.00 (4.85-5.15) 2.82 (2.72-2.93) 9.07 (8.86-9.29)Maryland 2.03 (1.55-2.67) 3.93 (3.23-4.77) 2.71 (2.20-3.34) 8.72 (7.66-9.92)
Anne Arundel 1.99 (1.31-3.02) 4.38 (3.22-5.93) 3.28 (2.19-4.88) 9.83 (7.64-12.57)Baltimore City 2.72 (1.70-4.33) 3.74 (2.74-5.09) 3.75 (2.53-5.52) 9.74 (7.59-12.42)Baltimore County 2.14 (1.42-3.22) 4.27 (3.21-5.67) 2.48 (1.69-3.63) 9.45 (7.44-11.93)Montgomery 1.65 (1.09-2.50) 3.39 (2.48-4.63) 2.37 (1.58-3.53) 7.31 (5.66-9.40)North Central 1.85 (1.21-2.80) 4.17 (3.06-5.68) 2.49 (1.66-3.72) 8.69 (6.70-11.19)Northeast 2.19 (1.45-3.28) 4.89 (3.58-6.65) 3.21 (2.11-4.88) 9.61 (7.41-12.39)Prince George's 1.93 (1.23-3.02) 3.14 (2.26-4.36) 2.36 (1.55-3.56) 8.17 (6.30-10.52)South 2.03 (1.37-3.00) 4.05 (2.99-5.47) 2.32 (1.54-3.48) 8.23 (6.25-10.75)West 1.88 (1.24-2.85) 4.14 (3.02-5.65) 2.52 (1.67-3.79) 8.31 (6.40-10.74)
Perception of Great Risk of Smoking Marijuana
Once a Month
Dependence on or Abuse of Illicit Drugs
Dependence on or Abuse of Alcohol and/or
Illicit Drugs
Region
Cocaine Use Past Year Nonmedical Use of Pain
Relievers Past Year
Region
Illicit Drug Use in Past Month
Illicit Drug Use Other than Marijuana in Past Month
Marijuana Use Past Month
Avg. Annual Rate of First Use of Marijuana

*Low precision; no estimate.
Estimate95%
Confidence Interval
Estimate95% Confidence
IntervalEstimate
95% Confidence
IntervalEstimate
95% Confidence
IntervalUnited States 9.54 (9.25 - 9.85) 19.71 (19.27 - 20.17) 5.96 (5.73 -6.20) 7.98 (7.76 - 8.21)Northeast U.S. 9.81 (9.28 - 10.36) 22.16 (21.18 - 23.17) 6.06 (5.60 -6.56) 8.36 (7.93 - 8.80)Maryland 8.53 (7.23 - 10.04) 18.22 (15.89 - 20.80) 4.60 (3.65 -5.79) 6.54 (5.54 - 7.70)
Anne Arundel 8.32 (5.99 -11.47) 18.75 (14.18 -24.38) 4.28 (2.87 -6.34) 6.22 (4.56 - 8.43)Baltimore City 10.36 (7.64 -13.89) 22.30 (17.56 -27.89) 7.15 (4.98 -10.16) 9.73 (7.40 -12.68) Baltimore County 9.57 (7.04 -12.88) 19.40 (15.09 -24.59) 5.09 (3.50 -7.34) 7.06 (5.29 -9.36) Montgomery 8.31 (6.09 -11.25) 18.09 (13.67 -23.54) 4.08 (2.71 -6.10) 5.75 (4.18 -7.86) North Central 8.15 (5.80 -11.35) * (* -*) 3.90 (2.58 -5.85) 5.71 (4.12 -7.87) Northeast 9.31 (6.60 -12.98) * (* -*) 4.62 (3.08 -6.88) 6.85 (4.96 -9.39) Prince George's 7.28 (5.28 -9.95) 14.22 (10.65 -18.74) 4.18 (2.80 -6.19) 5.85 (4.30 -7.91) South 7.74 (5.59 -10.63) 15.63 (11.55 -20.82) 3.90 (2.58 -5.85) 5.67 (4.10 -7.79) West 7.91 (5.68 -10.92) 17.79 (13.17 -23.60) 3.97 (2.64 -5.93) 5.88 (4.25 -8.08)
Estimate95%
Confidence Interval
Estimate95% Confidence
IntervalEstimate
95% Confidence
IntervalEstimate
95% Confidence
IntervalUnited States 4.66 (4.46 - 4.88) 8.25 (7.96 - 8.55) 2.81 (2.64 -2.98) 3.61 (3.46 - 3.76)Northeast U.S. 4.11 (3.77 - 4.48) 7.98 (7.47 - 8.53) 2.69 (2.39 -3.03) 3.45 (3.16 - 3.75)Maryland 3.92 (3.17 -4.84) 7.12 (5.81 -8.69) 2.37 (1.71 -3.26) 3.04 (2.38 - 3.89)
Anne Arundel 4.15 (2.92 -5.87) 8.08 (5.57 -11.58) 2.38 (1.46 -3.86) 3.14 (2.12 - 4.63)Baltimore City 3.84 (2.68 -5.47) 6.43 (4.48 -9.16) 2.77 (1.72 -4.43) 3.39 (2.32 - 4.94)Baltimore County 4.06 (2.86 -5.72) 7.24 (5.10 -10.18) 2.38 (1.49 -3.79) 3.05 (2.10 - 4.42)Montgomery 3.83 (2.72 -5.37) 6.99 (4.91 -9.86) 2.19 (1.33 -3.58) 2.76 (1.85 - 4.10)North Central 3.82 (2.72 -5.34) 7.60 (5.13 -11.13) 2.22 (1.35 -3.62) 2.91 (1.95 - 4.32) Northeast 4.60 (3.24 -6.50) 10.20 (6.97 -14.71) 2.64 (1.62 -4.26) 3.64 (2.47 - 5.33) Prince George's 3.30 (2.33 -4.65) 5.08 (3.45 -7.41) 2.29 (1.41 -3.69) 2.75 (1.85 - 4.06)South 4.04 (2.92 -5.57) 7.01 (4.82 -10.09) 2.20 (1.35 -3.56) 2.92 (1.98 - 4.29)West 4.20 (2.99 -5.88) 8.25 (5.76 -11.69) 2.34 (1.44 -3.78) 3.16 (2.16 - 4.59)
18 to 25 26 and Older 18 and Older
Region
Region
Illicit Drug Use in Past Month by Age Group
Illicit Drug Use Other than Marijuana in Past Month by Age Group12 to 17 18 to 25 26 and Older 18 and Older
12 to 17

*Low precision; no estimate.
Estimate95%
Confidence Interval
Estimate95% Confidence
IntervalEstimate
95% Confidence
IntervalEstimate
95% Confidence
IntervalUnited States 6.68 (6.44 - 6.93) 16.36 (15.94 - 16.79) 4.12 (3.93 -4.32) 5.92 (5.73 - 6.11)Northeast U.S. 7.42 (6.95 - 7.93) 19.44 (18.51 - 20.42) 4.24 (3.90 -4.62) 6.41 (6.09 - 6.76)Maryland 5.86 (4.75 -7.20) 15.22 (12.95 -17.82) 3.10 (2.38 -4.03) 4.83 (4.05 - 5.75)
Anne Arundel 5.37 (3.46 -8.24) * (* -*) 2.66 (1.65 -4.26) 4.41 (3.09 - 6.24)Baltimore City 6.59 (4.37 -9.83) 19.80 (15.05 -25.61) 5.00 (3.31 -7.50) 7.52 (5.58 - 10.08)Baltimore County 6.57 (4.42 -9.65) 16.38 (12.47 -21.21) 3.33 (2.16 -5.09) 5.13 (3.74 - 6.98)Montgomery 6.38 (4.24 -9.50) 14.96 (11.06 -19.94) 2.93 (1.87 -4.55) 4.36 (3.11 - 6.09)North Central 5.98 (3.90 -9.08) * (* -*) 2.65 (1.63 -4.29) 4.26 (2.95 - 6.12)Northeast 6.05 (3.86 -9.37) * (* -*) 2.65 (1.62 -4.31) 4.49 (3.09 - 6.47)Prince George's 4.82 (3.20 -7.21) 11.36 (8.17 -15.60) 3.11 (1.96 -4.89) 4.48 (3.15 - 6.35)South 5.06 (3.32 -7.63) 12.78 (8.98 -17.86) 2.61 (1.63 -4.16) 4.14 (2.88 - 5.93)West 5.78 (3.71 -8.90) * (* -*) 2.49 (1.56 -3.97) 4.29 (3.01 - 6.09)
Estimate95%
Confidence Interval
Estimate95% Confidence
IntervalEstimate
95% Confidence
IntervalEstimate
95% Confidence
IntervalUnited States 5.56 (5.37 - 5.75) 6.39 (6.11 - 6.68) 0.12 (0.10 -0.15) 0.96 (0.91 - 1.01)Northeast U.S. 5.86 (5.57 - 6.16) 7.03 (6.57 - 7.53) 0.12 (0.09 -0.16) 0.98 (0.89 - 1.07)Maryland 5.68 (4.93 -6.54) 7.08 (6.00 -8.35) 0.13 (0.09 -0.19) 1.03 (0.87 -1.21)
Anne Arundel 6.08 (4.35 -8.44) 7.93 (5.52 -11.25) * (* -*) 1.08 (0.79 - 1.47)Baltimore City 5.81 (4.23 -7.93) 6.28 (4.53 -8.64) * (* -*) 1.10 (0.82 - 1.48)Baltimore County 7.87 (5.80 -10.59) 10.51 (7.77 -14.08) * (* -*) 1.37 (1.04 - 1.82)Montgomery 5.30 (3.84 -7.27) 7.14 (5.15 -9.83) * (* -*) 0.83 (0.62 - 1.11)North Central 5.05 (3.53 -7.19) 7.11 (4.81 -10.40) * (* -*) 0.92 (0.66 - 1.27)Northeast 6.26 (4.41 -8.83) 7.38 (4.98 -10.79) * (* -*) 0.95 (0.68 - 1.31)Prince George's 5.07 (3.72 -6.87) 6.65 (4.82 -9.11) * (* -*) 1.19 (0.89 - 1.59)South 4.77 (3.43 -6.60) 5.10 (3.52 -7.36) * (* -*) 0.85 (0.62 - 1.17)West 4.70 (3.31 -6.63) 6.00 (4.16 -8.58) * (* -*) 0.84 (0.62 - 1.14)
Marijuana Use in the Past Month by Age Group12 to 17 18 to 25 26 and Older 18 and Older
Region
Region
First Use of Marijuana in the Past Year by Age Group12 to 17 18 to 25 26 and Older 18 and Older

Low precision; no estimate.
Estimate95%
Confidence Interval
Estimate95% Confidence
IntervalEstimate
95% Confidence
IntervalEstimate
95% Confidence
IntervalUnited States 34.24 (33.72 - 34.77) 24.16 (23.68 - 24.65) 41.29 (40.72 -41.86) 38.77 (38.28 - 39.26)Northeast U.S. 31.96 (31.03 - 32.89) 21.29 (20.52 - 22.08) 39.29 (38.25 -40.33) 36.72 (35.82 - 37.63)Maryland 33.74 (30.91 -36.70) 23.60 (21.07 -26.34) 41.87 (38.79 -45.01) 39.27 (36.55 - 42.06)
Anne Arundel 31.84 (26.15 -38.12) 20.84 (16.20 -26.39) 37.35 (31.41 -43.69) 35.14 (29.77 - 40.91Baltimore City 36.34 (30.25 -42.89) 27.40 (22.23 -33.25) 47.37 (41.28 -53.54) 43.96 (38.62 - 49.46)Baltimore County 33.19 (27.49 -39.44) 20.93 (16.63 -25.99) 41.39 (35.49 -47.56) 38.58 (33.29 - 44.16)Montgomery 33.36 (27.43 -39.87) 26.05 (20.80 -32.10) 39.68 (34.17 -45.47) 38.06 (33.00 - 43.40)North Central 31.39 (25.66 -37.75) 19.10 (14.36 -24.94) 36.54 (30.32 -43.24) 34.30 (28.65 - 40.44)Northeast * (* -*) * (* -*) 37.08 (30.93 -43.68) 34.74 (29.15 - 40.79)Prince George's 33.68 (28.01 -39.85) 25.07 (20.18 -30.69) 48.60 (42.70 -54.53) 44.67 (39.49 - 49.96)South 36.45 (30.33 -43.04) 25.84 (20.36 -32.18) 42.62 (36.46 -49.02) 40.09 (34.53 - 45.92)West * (* -*) * (* -*) 42.46 (36.21 -48.97) 39.73 (34.04 - 45.71)
Estimate95%
Confidence Interval
Estimate95% Confidence
IntervalEstimate
95% Confidence
IntervalEstimate
95% Confidence
IntervalUnited States 6.75 (6.50 -7.01) 12.21 (11.87 -12.56) 3.53 (3.36 -3.71) 4.80 (4.64 -4.97) Northeast U.S. 5.41 (5.01 -5.84) 11.23 (10.61 -11.88) 2.95 (2.65 -3.28) 4.13 (3.84 -4.44) Maryland 5.20 (4.27 -6.32) 10.11 (8.43 -12.08) 2.73 (2.06 -3.61) 3.78 (3.05 -4.67)
Anne Arundel 6.01 (4.20 -8.52) 12.71 (9.12 -17.45) 2.89 (1.91 -4.35) 4.20 (3.03 -5.80)Baltimore City 4.60 (3.20 -6.59) 8.40 (5.99 -11.66) 2.67 (1.74 -4.06) 3.64 (2.61 -5.07)Baltimore County 5.92 (4.22 -8.26) 11.39 (8.50 -15.11) 2.94 (1.97 -4.35) 4.10 (3.02 -5.54)Montgomery 4.32 (3.00 -6.17) 9.72 (6.97 -13.40) 2.42 (1.58 -3.69) 3.29 (2.35 -4.60)North Central 5.36 (3.76 -7.60) 12.14 (8.59 -16.88) 2.83 (1.87 -4.27) 4.03 (2.87 -5.61)Northeast 6.83 (4.80 -9.63) 14.40 (10.29 -19.78) 3.18 (2.07 -4.85) 4.67 (3.34 -6.50)Prince George's 3.69 (2.54 -5.35) 6.55 (4.58 -9.28) 2.38 (1.53 -3.68) 3.07 (2.16 -4.37)South 6.05 (4.29 -8.46) 9.50 (6.75 -13.21) 2.82 (1.88 -4.22) 3.83 (2.75 -5.31)West 5.75 (4.07 -8.06) 11.02 (7.84 -15.28) 2.84 (1.85 -4.33) 3.97 (2.83 -5.54)
Perceptions of Great Risk of Smoking Marijuana Once a Month by Age Group
Region
Region
Nonmedical Use of Pain Relievers in the Past Year by Age Group12 to 17 18 to 25 26 and Older 18 and Older
12 to 17 18 to 25 26 and Older 18 and Older

Estimate95%
Confidence Interval
Estimate95% Confidence
IntervalEstimate
95% Confidence
IntervalEstimate
95% Confidence
IntervalUnited States 1.45 (1.34 - 1.58) 6.26 (5.99 -6.54) 1.75 (1.63 -1.89) 2.42 (2.30 -2.54) Northeast U.S. 1.28 (1.09 -1.49) 6.54 (6.05 -7.06) 1.89 (1.65 -2.17) 2.55 (2.32 -2.81) Maryland 1.16 (0.82 -1.65) 5.01 (3.94 -6.36) 1.65 (1.15 -2.37) 2.13 (1.60 -282)
Anne Arundel 1.34 (0.80 -2.21) 6.26 (4.14 -9.35) 1.41 (0.82 -2.44) 2.06 (1.33 -3.19)Baltimore City * (* -*) 3.36 (2.19 -5.11) 2.89 (1.67 -4.96) 2.97 (1.84 -4.75)Baltimore County 1.24 (0.75 -2.03) 5.51 (3.74 -8.05) 1.72 (1.01 -2.90) 2.24 (1.47 -3.41)Montgomery 1.45 (0.88 -2.39) 4.91 (3.25 -7.37) 1.23 (0.71 -2.13) 1.67 (1.07 -2.59)North Central 1.62 (0.98 -2.68) 6.44 (4.19 -9.78) * (* -*) 1.87 (1.20 -2.91)Northeast * (* -*) 7.37 (4.84 -11.07) * (* -*) 2.28 (1.48 -3.47)Prince George's 0.64 (0.38 -1.10) 2.96 (1.92 -4.54) 1.92 (1.12 -3.29) 2.09 (1.32 -3.31)South 1.18 (0.73 -1.93) 5.43 (3.63 -8.03) 1.54 (0.92 -2.56) 2.13 (1.41 -3.19)West 1.38 (0.82 -2.31) 6.08 (4.01 -9.11) * (* -*) 1.94 (1.26 -2.98)
Estimate95%
Confidence Interval
Estimate95% Confidence
IntervalEstimate
95% Confidence
IntervalEstimate
95% Confidence
IntervalUnited States 4.53 (4.33 -4.73) 7.88 (7.60 -8.18) 1.72 (1.61 -1.84) 2.63 (2.52 -2.74) Northeast U.S. 4.25 (3.91 -4.61) 8.56 (8.01 -9.14) 1.66 (1.45 -1.90) 2.64 (2.44 -2.87) Maryland 4.02 (3.26 -4.95) 7.58 (6.17 -9.28) 1.73 (1.24 -2.42) 2.56 (2.03 -3.24)
Anne Arundel 4.57 (3.20 -6.48) 10.43 (6.93 -15.41) 2.02 (1.13 -3.58) 3.14 (2.02 -4.86)Baltimore City 4.02 (2.81 -5.72) 8.38 (5.65 -12.25) 2.76 (1.61 -4.70) 3.72 (2.44 -5.64)Baltimore County 3.98 (2.79 -5.63) 7.23 (4.88 -10.60) 1.54 (0.89 -2.67) 2.33 (1.52 -3.54)Montgomery 4.28 (3.00 -6.08) 7.52 (4.86 -11.48) 1.43 (0.81 -2.51) 2.15 (1.37 -3.37)North Central 4.16 (2.89 -5.95) 8.01 (5.13 -12.30) 1.44 (0.81 -2.55) 2.29 (1.45 -3.58)Northeast 4.80 (3.29 -6.95) * (* -*) 1.90 (1.05 -3.41) 3.03 (1.90 -4.80)Prince George's 3.15 (2.14 -4.61) 4.95 (3.20 -7.60) 1.72 (0.97 -3.01) 2.26 (1.43 -3.55)South 3.66 (2.55 -5.23) 6.50 (4.15 -10.04) 1.39 (0.79 -2.46) 2.16 (1.38 -3.39)West 4.12 (2.87 -5.90) 7.64 (4.91 -11.71) 1.51 (0.85 -2.66) 2.35 (1.49 -3.70)
* Low precision; no estimate reported.
Illicit Drug Dependence or Abuse in the Past Year by Age Group12 to 17 18 to 25 26 and Older 18 and Older
Region
12 to 17 18 to 25 26 and Older 18 and Older
Region
Cocaine Use in the Past Year by Age Group
Estimate95%
Confidence Interval
Estimate95%
Confidence Interval
Estimate95%
Confidence Interval
United States 24.55 (24.16-24.95) 29.03 (28.62-29.45) 73.65 (73.28-74.03)Maryland 21.77 (20.00-23.64) 25.25 (23.27-27.34) 73.87 (71.67-75.96)
Anne Arundel 22.27 (18.87-26.08) 26.28 (22.51-30.43) 73.63 (69.72-77.21)Baltimore City 27.83 (24.06-31.94) 32.11 (28.02-36.50) 72.45 (68.63-75.96)Baltimore County 23.24 (19.63-27.28) 27.10 (23.20-31.38) 72.84 (68.97-76.39)Montgomery 15.53 (12.84-18.67) 17.51 (14.63-20.81) 77.72 (74.41-80.72)North Central 18.81 (15.57-22.53) 22.01 (18.64-25.79) 74.49 (70.71-77.94)Northeast 25.57 (21.46-30.16) 29.28 (24.96-34.01) 71.42 (67.24-75.26)Prince George's 18.84 (15.90-22.19) 22.07 (18.75-25.80) 76.33 (73.10-79.28)South 24.35 (20.46-28.71) 28.14 (24.04-32.65) 71.00 (66.97-74.72)West 23.76 (19.92-28.08) 28.01 (23.95-32.48) 71.16 (67.01-74.99)
Estimate95%
Confidence Interval
Estimate95%
Confidence Interval
Estimate95%
Confidence Interval
Estimate95%
Confidence Interval
United States 9.77 (9.47 -10.08) 37.02 (36.46 -37.58) 24.36 (23.88 -24.85) 26.22 (25.79 -26.66) Northeast U.S. 9.25 (8.72 -9.80) 36.10 (34.84 -37.38) 22.29 (21.43 -23.18) 24.26 (23.52 -25.02) Maryland 8.18 (7.01 -9.53) 32.82 (29.82 -35.98) 21.73 (19.62 -23.99) 23.31 (21.37 -25.37)
Anne Arundel 8.77 (6.34 -12.02) * (* -*) 21.79 (18.06 -26.05) 23.76 (20.10 -27.84)Baltimore City 7.59 (5.42 -10.52) 31.76 (26.10 -38.02) 29.78 (25.37 -34.61) 30.11 (26.01 -34.55)Baltimore County 9.31 (6.70 -12.80) 33.81 (28.35 -39.73) 23.26 (19.19 -27.89) 24.71 (20.85 -29.03)Montgomery 7.64 (5.56 -10.43) 30.39 (24.81 -36.62) 14.51 (11.62 -17.97) 16.41 (13.53 -19.77)North Central 8.66 (6.10 -12.17) * (* -*) 17.74 (14.36 -21.72) 20.06 (16.58 -24.06)Northeast 10.77 (7.58 -15.08) * (* -*) 24.86 (20.41 -29.90) 27.26 (22.85 -32.18)Prince George's 5.18 (3.66 -7.30) 24.36 (19.53 -29.94) 19.77 (16.37 -23.68) 20.52 (17.29 -24.18)South 8.95 (6.58 -12.06) * (* -*) 24.63 (20.35 -29.47) 26.11 (21.90 -30.80)West 9.27 (6.56 -12.93) * (* -*) 23.49 (19.35 -28.20) 25.32 (21.21 -29.92)
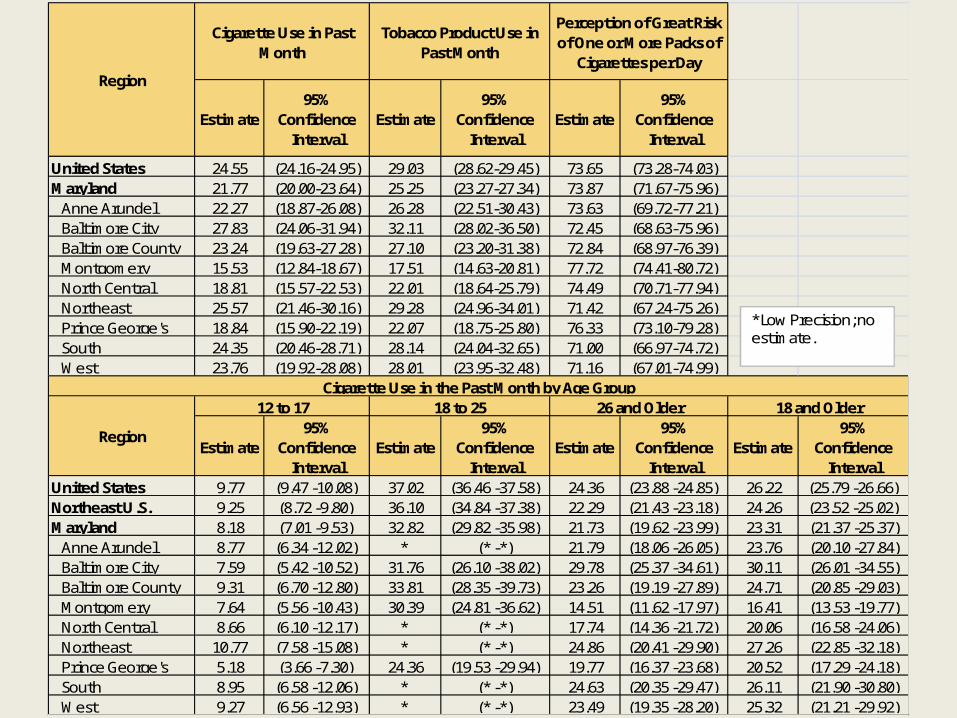
Perception of Great Risk of One or More Packs of
Cigarettes per Day
Cigarette Use in Past Month
Tobacco Product Use in Past Month
Cigarette Use in the Past Month by Age Group12 to 17 18 to 25 26 and Older 18 and Older
Region
Region
*Low Precision; no estimate.

Estimate95%
Confidence Interval
Estimate95%
Confidence Interval
Estimate95%
Confidence Interval
Estimate95%
Confidence Interval
United States 12.25 (11.90 -12.60) 42.65 (42.08 -43.22) 28.90 (28.39 -29.42) 30.92 (30.47 -31.38) Northeast U.S. 11.74 (11.14 -12.38) 41.88 (40.63 -43.13) 26.29 (25.36 -27.24) 28.51 (27.69 -29.34) Maryland 9.58 (8.14 -11.25) 37.37 (34.27 -40.57) 25.31 (22.97 -27.81) 27.03 (24.88 -29.29)
Anne Arundel 10.39 (7.47 -14.26) 42.42 (35.82 -49.31) 25.80 (21.66 -30.43) 28.03 (24.01 -32.43)Baltimore City 9.71 (7.00 -13.33) 35.90 (30.19 -42.05) 34.39 (29.51 -39.62) 34.63 (30.23 -39.32)Baltimore County 10.79 (7.83 -14.70) 40.25 (34.45 -46.32) 27.00 (22.62 -31.88) 28.83 (24.69 -33.35)Montgomery 8.27 (5.89 -11.49) 34.12 (28.25 -40.53) 16.42 (13.36 -20.02) 18.54 (15.49 -22.02)North Central 9.41 (6.69 -13.10) * (* -*) 21.00 (17.35 -25.19) 23.57 (19.97 -27.59)Northeast 12.93 (9.34 -17.65) * (* -*) 28.74 (24.02 -33.97) 31.16 (26.58 -36.15)Prince George's 6.21 (4.32 -8.85) 27.63 (22.30 -33.69) 23.31 (19.45 -27.67) 24.02 (20.41 -28.05)South 10.50 (7.51 -14.51) * (* -*) 28.73 (24.16 -33.79) 30.15 (25.76 -34.93)West 11.33 (8.20 -15.45) * (* -*) 27.81 (23.36 -32.76) 29.81 (25.49 -34.51)
Estimate95%
Confidence Interval
Estimate95%
Confidence Interval
Estimate95%
Confidence Interval
Estimate95%
Confidence Interval
United States 68.95 (68.47 -69.43) 69.84 (69.36 -70.32) 74.93 (74.46 -75.40) 74.18 (73.77 -74.60) Northeast U.S. 71.28 (70.39 -72.16) 72.67 (71.67 -73.64) 77.53 (76.62 -78.41) 76.84 (76.02 -77.63) Maryland 68.54 (65.67 -71.27) 69.38 (66.60 -72.03) 75.32 (72.62 -77.84) 74.48 (72.06 -76.76)
Anne Arundel 68.78 (63.57 -73.55) 68.91 (63.40 -73.94) 74.98 (70.23 -79.20) 74.17 (69.90 -78.02)Baltimore City 65.29 (60.14 -70.11) 70.13 (64.92 -74.86) 73.90 (69.15 -78.14) 73.25 (69.09 -77.04)Baltimore County 67.23 (62.10 -71.98) 69.20 (64.42 -73.60) 74.11 (69.37 -78.35) 73.44 (69.23 -77.25)Montgomery 71.00 (66.32 -75.27) 72.70 (67.72 -77.18) 79.25 (75.26 -82.74) 78.47 (74.86 -81.70)North Central 70.36 (65.47 -74.83) 68.27 (62.51 -73.53) 75.99 (71.39 -80.06) 75.00 (70.84 -78.75)Northeast 66.64 (61.24 -71.63) 65.75 (59.62 -71.39) 72.92 (67.88 -77.43) 71.97 (67.40 -76.12)Prince George's 69.95 (65.16 -74.34) 71.37 (66.40 -75.87) 78.27 (74.25 -81.82) 77.12 (73.59 -80.30)South 68.36 (63.50 -72.86) 67.69 (62.00 -72.91) 71.94 (67.03 -76.38) 71.30 (66.91 -75.33)West 67.61 (62.35 -72.46) 65.84 (59.92 -71.30) 72.46 (67.46 -76.95) 71.54 (67.05 -75.65)
* Low precision; no estimate reported.
Perceptions of Great Risk of Smoking One or More Packs of Cigarettes per Day by Age Group12 to 17 18 to 25 26 and Older 18 and Older
Region
Tobacco Product Use in the Past Month by Age Group12 to 17 18 to 25 26 and Older 18 and Older
Region

Crash Data from the Maryland Automated
Accident Reporting System (MAARS)
Traffic Safety Analysis Division, Office of Traffic and Safety, Maryland State
Highway Administration (SHA)

All crashes resulting in a vehicle being towed away, personal injury, or fatality are reported.
The state, county, or local law enforcement officer who first arrives at the scene of a
reportable accident records the crash data. Typically within 10 days the accident report is
submitted to the Maryland State Police Central Records Division for transfer into the
Maryland Automated Accident Reporting System (MAARS) database files; within 30
days, the data is uploaded to the Maryland State Highway Administration's database and
the Maryland State Police database

Percentage of Subdivision Crashes* that were Alcohol and/or Other Drug (AOD)-Related**, 2009
20.0
17.5
13.7
13.3
13.0
12.6
11.5
11.4
11.3
11.1
10.8
10.3
10.3
10.2
10.1
10.1
10.0
9.8
9.1
9.1
9.1
9.0
8.6
8.3
5.5
Caroline
Worcester
Dorchester
Queen Anne's
Carroll
Allegany
Kent
Harford
Washington
Calvert
Howard
Cecil
Anne Arundel
Prince George's
Frederick
Talbot
Wicomico
Somerset
State Total
Charles
St. Mary's
Baltimore Co.
Montgomery
Garrett
Baltimore City
0.0 5.0 10.0 15.0 20.0 25.0*Crash: An event that produces injury, fatality and/or property damage, involves a motor vehicle in transport, and occurs on a trafficway while the vehicle is still in motion after running off the trafficway. **AOD-Related Crash: A crash that involves an alcohol and/or drug-impaired driver.
Source: Adapted by ADAA from data provided by the University of Maryland School of Medicine from the Maryland Automated Accident Reporting System (MAARS), Traffic Safety Analysis Division, Office of Traffic and Safety, Maryland State Highway Administration (SHA).

Percentage of Subdivision Injury and Fatal Crashes* that were Alcohol and/or Other Drug (AOD)-Related**, 2009
19.9
15.4
14.9
14.6
13.3
12.1
11.6
11.4
11.2
11.1
10.8
10.7
10.7
10.7
10.7
10.6
10.6
10.5
10.4
10.0
9.8
9.8
9.7
7.5
6.0
Caroline
Carroll
Queen Anne's
Worcester
Dorchester
Allegany
Howard
Garrett
Washington
Anne Arundel
Kent
Harford
Talbot
Cecil
Charles
St. Mary's
Calvert
Prince George's
Somerset
Frederick
Wicomico
Baltimore Co.
State Total
Montgomery
Baltimore City
0.0 5.0 10.0 15.0 20.0 25.0*Crash: An event that produces injury and/or fatality, involves a motor vehicle in transport, and occurs on a trafficway while the vehicle is still in motion after running off the trafficway. **AOD-Related Crash: A crash that involves an alcohol and/or drug-impaired driver.
Source: Adapted by ADAA from data provided by the University of Maryland School of Medicine from the Maryland Automated Accident Reporting System (MAARS), Traffic Safety Analysis Division, Office of Traffic and Safety, Maryland State Highway Administration (SHA).

2008 2009 2008 2009 2008 2009 2008 2009
Allegany 72,532 1.3 706 738 4.5 65 93 43.1 12.6 1.1 283 290 2.5 25 35 40.0 12.1 0.8Anne Arundel 521,209 9.1 8,427 8,995 6.7 799 924 15.6 10.3 10.5 2997 3127 4.3 288 347 20.5 11.1 9.6Baltimore City 637,418 11.2 19,061 19,796 3.9 1,050 1,083 3.1 5.5 12.3 5097 4987 -2.2 272 297 9.2 6.0 9.1Baltimore Co. 789,814 13.9 14,261 13,254 -7.1 1,144 1,187 3.8 9.0 13.5 4834 4370 -9.6 421 429 1.9 9.8 14.1Calvert 89,212 1.6 1,167 1,247 6.9 160 139 -13.1 11.1 1.6 453 492 8.6 69 52 -24.6 10.6 2.3Caroline 33,367 0.6 409 411 0.5 66 82 24.2 20.0 0.9 157 151 -3.8 32 30 -6.3 19.9 1.1Carroll 170,089 3.0 1,839 1,997 8.6 238 259 8.8 13.0 2.9 693 778 12.3 98 120 22.4 15.4 3.3Cecil 100,796 1.8 1,624 1,691 4.1 194 175 -9.8 10.3 2.0 665 712 7.1 82 76 -7.3 10.7 2.7Charles 142,226 2.5 2,525 2,601 3.0 212 237 11.8 9.1 2.7 891 882 -1.0 83 94 13.3 10.7 2.8Dorchester 32,043 0.6 450 437 -2.9 52 60 15.4 13.7 0.7 210 173 -17.6 32 23 -28.1 13.3 1.1Frederick 227,980 4.0 2,894 2,888 -0.2 285 291 2.1 10.1 3.3 1198 1143 -4.6 130 114 -12.3 10.0 4.3Garrett 29,555 0.5 602 593 -1.5 66 49 -25.8 8.3 0.6 205 220 7.3 24 25 4.2 11.4 0.8Harford 242,514 4.3 3,254 3,129 -3.8 356 356 0.0 11.4 4.0 1331 1229 -7.7 145 132 -9.0 10.7 4.9Howard 281,884 4.9 3,258 3,442 5.6 336 371 10.4 10.8 4.2 1189 1199 0.8 138 139 0.7 11.6 4.6Kent 20,247 0.4 208 244 17.3 31 28 -9.7 11.5 0.3 103 93 -9.7 13 10 -23.1 10.8 0.4 Montgomery 971,600 17.0 11,925 12,311 3.2 877 1,055 20.3 8.6 12.0 4787 4941 3.2 314 372 18.5 7.5 10.5Prince George's 834,560 14.6 14,289 13,769 -3.6 1,359 1,398 2.9 10.2 15.9 4941 4603 -6.8 471 485 3.0 10.5 15.8Queen Anne's 47,958 0.8 640 754 17.8 81 100 23.5 13.3 1.1 256 261 2.0 32 39 21.9 14.9 1.1St. Mary's 102,999 1.8 1,402 1,451 3.5 143 132 -7.7 9.1 1.5 575 650 13.0 54 69 27.8 10.6 1.8Somerset 25,959 0.5 274 315 15.0 30 31 3.3 9.8 0.4 114 135 18.4 12 14 16.7 10.4 0.4Talbot 36,262 0.6 770 815 5.8 68 82 20.6 10.1 0.9 273 262 -4.0 27 28 3.7 10.7 0.9Washington 145,910 2.6 2,399 2,322 -3.2 226 262 15.9 11.3 3.0 933 855 -8.4 100 96 -4.0 11.2 3.3Wicomico 94,222 1.7 1,837 1,999 8.8 171 200 17.0 10.0 2.3 706 863 22.2 69 85 23.2 9.8 2.3Worcester 49,122 0.9 1,133 1,193 5.3 136 209 53.7 17.5 2.4 424 458 8.0 58 67 15.5 14.6 1.9State Total 5,699,478 100.0 95,354 96,392 1.1 8,145 8,803 8.1 9.1 100.0 33315 32874 -1.3 2989 3178 6.3 9.7 100.0
― 0 0480912 25 35
2296 2356
Alcohol and/or Drug (AOD)-Related Crashes* and Injury/Fatal Crashes** by Maryland Subdivision, 2008 and 2009
Total Crashes 2008-2009
∆
Number of AOD-Related Crashes
2008-2009
∆
Percentage of 2009 Crashes that were
AOD-Related
Percentage of State
2009 AOD-Related Crashes
Occurring in Subdivision
Estimated 2009
Population
Percent Population
in Subdivision
Subdivision
Total Injury and Fatal Crashes
2008-2009
∆
AOD-Related Injury and
Fatal Crashes
2008-2009
∆
Percentage of 2009 Injury and Fatal
Crashes that were AOD-Related
Percentage of State 2009 AOD-Related Injury and
Fatal Crashes Occurring in Subdivision
*Crash: An event that produces injury and/or property damage, involves a motor vehicle in transport, and occurs on a trafficwayor while the vehicle is still in motion after running off the trafficway. **Injury/Fatal Crash: A police-reported crash involving a motor vehicle in transport on a trafficway in which a personal injury occurs or at least one person dies within 30 days of the crash. SOURCE: Adapted by ADAA from data provided by the University of Maryland School of Medicine from the Maryland Automated Accident Reporting System (MAARS), Traffic Safety Analysis Division, Office of Traffic and Safety, Maryland State Highway Administration (SHA).

Uniform Crime Report
Maryland State Police

The Maryland Uniform Crime Reporting (UCR) Program
establishes a method to collect, evaluate and process uniform
statistical data on crime statewide.

• There were 215,921 total crime incidents reported in 2009 compared to 233,566 in 2008.
• Violent crime decreased five percent and property crime decreased eight percent in 2009.

Nationwide Estimates from The Economic Costs of Alcohol and Drug Abuse in the United States –
1992
• About 30 percent of murders and aggravated assaults, 23 percent of rapes and 3 percent of robberies are alcohol-related.
• About 30 percent of breaking and entering and larceny/theft, and 7 percent of motor-vehicle thefts are drug-related.


#% in Juris.
Rate*Est. # Alc.
Rel.**#
% in Juris.
Rate*Est. # Alc.
Rel.**#
% in Juris.
Rate*Est. # Alc.
Rel.**
# Re-ported
% in Juris.
Rate*Est. # Alc.
Rel.**#
% in Juris.
Rate*Est. # Alc.
Rel.**
Allegany 72,532 1.3 323 1.0 445.3 84.9 1 0.2 1.4 0.3 25 2.2 34.5 5.8 38 0.3 52.4 1.1 259 1.3 357.1 77.7Anne Arundel 521,209 9.1 2920 8.7 560.2 667.9 16 3.6 3.1 4.8 95 8.2 18.2 21.9 746 6.2 143.1 22.4 2063 10.3 395.8 618.9Baltimore City 637,418 13.9 9701 28.8 1228.3 1893.2 238 54.1 30.1 71.4 158 13.7 20.0 36.3 3726 31.0 471.8 111.8 5579 27.9 706.4 1673.7Baltimore Co. 789,814 11.2 4555 13.5 714.6 958.6 32 7.3 5.0 9.6 154 13.3 24.2 35.4 1471 12.3 230.8 44.1 2898 14.5 454.6 869.4Calvert 89,212 1.6 271 0.8 303.8 73.0 0 0.0 0.0 0.0 11 1.0 12.3 2.5 28 0.2 31.4 0.8 232 1.2 260.1 69.6Caroline 33,367 0.6 126 0.4 377.6 31.2 1 0.2 3.0 0.3 13 1.1 39.0 3.0 21 0.2 62.9 0.6 91 0.5 272.7 27.3Carroll 170,089 3.0 393 1.2 231.1 103.2 2 0.5 1.2 0.6 29 2.5 17.0 6.7 47 0.4 27.6 1.4 315 1.6 185.2 94.5Cecil 100,796 1.8 746 2.2 740.1 180.3 2 0.5 2.0 0.6 23 2.0 22.8 5.3 155 1.3 153.8 4.7 566 2.8 561.5 169.8Charles 142,226 2.5 701 2.1 492.9 157.9 7 1.6 4.9 2.1 35 3.0 24.6 8.1 185 1.5 130.1 5.6 474 2.4 333.3 142.2Dorchester 32,043 0.6 183 0.5 571.1 46.6 0 0.0 0.0 0.0 11 1.0 34.3 2.5 28 0.2 87.4 0.8 144 0.7 449.4 43.2Frederick 227,980 4.0 793 2.4 347.8 187.3 9 2.0 3.9 2.7 33 2.9 14.5 7.6 179 1.5 78.5 5.4 572 2.9 250.9 171.6Garrett 29,555 0.5 68 0.2 230.1 19.9 0 0.0 0.0 0.0 4 0.3 13.5 0.9 1 0.0 3.4 0.0 63 0.3 213.2 18.9Harford 242,514 4.3 884 2.6 364.5 199.4 4 0.9 1.6 1.2 60 5.2 24.7 13.8 228 1.9 94.0 6.8 592 3.0 244.1 177.6Howard 281,884 4.9 751 2.2 266.4 151.5 2 0.5 0.7 0.6 44 3.8 15.6 10.1 262 2.2 92.9 7.9 443 2.2 157.2 132.9Kent 20,247 0.4 86 0.3 424.8 22.0 1 0.2 4.9 0.3 1 0.1 4.9 0.2 14 0.1 69.1 0.4 70 0.3 345.7 21 Montgomery 971,600 17.0 2162 6.4 222.5 352.8 13 3.0 1.3 3.9 130 11.2 13.4 29.9 1062 8.8 109.3 31.9 957 4.8 98.5 287.1Prince George's 834,560 14.6 6621 19.7 793.4 1073.4 96 21.8 11.5 28.8 221 19.1 26.5 50.8 3324 27.7 398.3 99.7 2980 14.9 357.1 894Queen Anne's 47,958 0.8 117 0.3 244.0 31.8 0 0.0 0.0 0.0 12 1.0 25.0 2.8 9 0.1 18.8 0.3 96 0.5 200.2 28.8St. Mary's 102,999 1.8 308 0.9 299.0 78.9 0 0.0 0.0 0.0 20 1.7 19.4 4.6 45 0.4 43.7 1.4 243 1.2 235.9 72.9Somerset 25,959 0.5 102 0.3 392.9 23.4 1 0.2 3.9 0.3 7 0.6 27.0 1.6 25 0.2 96.3 0.8 69 0.3 265.8 20.7Talbot 36,262 0.6 86 0.3 237.2 19.2 1 0.2 2.8 0.3 5 0.4 13.8 1.2 23 0.2 63.4 0.7 57 0.3 157.2 17.1Washington 145,910 2.6 395 1.2 270.7 90.8 2 0.5 1.4 0.6 25 2.2 17.1 5.8 96 0.8 65.8 2.9 272 1.4 186.4 81.6Wicomico 94,222 1.7 926 2.8 982.8 208.3 6 1.4 6.4 1.8 32 2.8 34.0 7.4 249 2.1 264.3 7.5 639 3.2 678.2 191.7Worcester 49,122 0.9 271 0.8 551.7 69.4 0 0.0 0.0 0.0 8 0.7 16.3 1.8 42 0.3 85.5 1.3 221 1.1 449.9 66.3Statewide*** ― ― 137 0.4 ― 40.3 6 1.4 ― 1.8 0 0.0 ― 0.0 3 0.0 ― 0.1 128 0.6 ― 38.4State Total 5,699,478 100.0 33626 100.0 590.0 6765.0 440 100.0 7.7 132.0 1,156 100.0 20.3 265.9 12007 100.0 210.7 360.2 20023 100.0 351.3 6006.9
Jurisdiction Population% of
Pop. in Juris.
Violent Crimes in Maryland by Type of Crime and Maryland Jurisdiction, 2009Total Violent Crimes Murder Rape Robbery Aggravated Assault
Rates per 100,000 population, based on population estimates for July 1, 2009 from the Maryland Department of Planning. **Estimated numbers of crimes that are alcohol-related are based on nationwide percentage estimates from The Economic Costs of Alcohol and Drug Abuse in the United States - 1992. ***Statewide agencies report offenses but do not report jurisdiction of occurrence. SOURCE: Adapted by ADAA from the Crime in Maryland, 2009 Uniform Crime Report, Maryland State Police.


#% in Juris.
Rate*Est. # Drug
Rel.**#
% in Juris.
Rate*Est. # Drug
Rel.**#
% in Juris.
Rate*Est. # Drug
Rel.**#
% in Juris.
Rate*Est. # Drug
Rel.**
Allegany 72,532 1.3 2277 1.2 3139.3 671.8 606 1.6 835.5 181.8 1622 1.3 2236.3 486.6 49 0.2 67.6 3.4Anne Arundel 521,209 9.1 16964 9.0 3254.7 4828.4 3067 8.3 588.4 920.1 12763 10.1 2448.7 3828.9 1134 4.5 217.6 79.4Baltimore City 637,418 13.9 29589 15.7 3746.3 7811.3 7856 21.3 994.7 2356.8 17101 13.6 2165.2 5130.3 4632 18.3 586.5 324.2Baltimore Co. 789,814 11.2 26295 14.0 4125.2 7326.6 4316 11.7 677.1 1294.8 19536 15.5 3064.9 5860.8 2443 9.6 383.3 171.0Calvert 89,212 1.6 1838 1.0 2060.3 527.5 436 1.2 488.7 130.8 1298 1.0 1455.0 389.4 104 0.4 116.6 7.3Caroline 33,367 0.6 1017 0.5 3047.9 295.4 342 0.9 1025.0 102.6 633 0.5 1897.1 189.9 42 0.2 125.9 2.9Carroll 170,089 3.0 2724 1.4 1601.5 793.7 567 1.5 333.4 170.1 2055 1.6 1208.2 616.5 102 0.4 60.0 7.1Cecil 100,796 1.8 3664 1.9 3635.1 1042.2 977 2.6 969.3 293.1 2439 1.9 2419.7 731.7 248 1.0 246.0 17.4Charles 142,226 2.5 3732 2.0 2624.0 1057.0 598 1.6 420.5 179.4 2862 2.3 2012.3 858.6 272 1.1 191.2 19.0Dorchester 32,043 0.6 960 0.5 2996.0 282.0 253 0.7 789.6 75.9 681 0.5 2125.3 204.3 26 0.1 81.1 1.8Frederick 227,980 4.0 3944 2.1 1730.0 1143.0 687 1.9 301.3 206.1 3082 2.5 1351.9 924.6 175 0.7 76.8 12.3Garrett 29,555 0.5 506 0.3 1712.1 148.6 170 0.5 575.2 51.0 322 0.3 1089.5 96.6 14 0.1 47.4 1.0Harford 242,514 4.3 4542 2.4 1872.9 1304.9 809 2.2 333.6 242.7 3482 2.8 1435.8 1044.6 251 1.0 103.5 17.6Howard 281,884 4.9 7020 3.7 2490.4 2015.6 1209 3.3 428.9 362.7 5418 4.3 1922.1 1625.4 393 1.6 139.4 27.5Kent 20,247 0.4 338 0.2 1669.4 98.4 130 0.4 642.1 39.0 195 0.2 963.1 58.5 13 0.1 64.2 0.9 Montgomery 971,600 17.0 24072 12.8 2477.6 6802.1 3142 8.5 323.4 942.6 19106 15.2 1966.4 5731.8 1824 7.2 187.7 127.7Prince George's 834,560 14.6 38145 20.3 4570.7 9772.3 8219 22.3 984.8 2465.7 22660 18.0 2715.2 6798.0 7266 28.7 870.6 508.6Queen Anne's 47,958 0.8 917 0.5 1912.1 268.2 206 0.6 429.5 61.8 681 0.5 1420.0 204.3 30 0.1 62.6 2.1St. Mary's 102,999 1.8 2056 1.1 1996.1 590.4 435 1.2 422.3 130.5 1506 1.2 1462.2 451.8 115 0.5 111.7 8.1Somerset 25,959 0.5 700 0.4 2696.6 207.2 268 0.7 1032.4 80.4 420 0.3 1617.9 126.0 12 0.0 46.2 0.8Talbot 36,262 0.6 976 0.5 2691.5 288.4 229 0.6 631.5 68.7 728 0.6 2007.6 218.4 19 0.1 52.4 1.3Washington 145,910 2.6 2864 1.5 1962.9 817.3 625 1.7 428.3 187.5 2057 1.6 1409.8 617.1 182 0.7 124.7 12.7Wicomico 94,222 1.7 4270 2.3 4531.9 1242.1 1285 3.5 1363.8 385.5 2816 2.2 2988.7 844.8 169 0.7 179.4 11.8Worcester 49,122 0.9 2299 1.2 4680.2 673.4 439 1.2 893.7 131.7 1789 1.4 3642.0 536.7 71 0.3 144.5 5.0Statewide*** ― ― 586 0.3 ― 168.2 34 0.1 ― 10.2 519 0.4 ― 155.7 33 0.1 ― 2.3State Total 5,699,478 100.0 188016 100.0 3298.8 50576.6 36905 100.0 647.5 11071.5 125771 100.0 2206.7 37731.3 25340 100.0 444.6 1773.8
Jurisdiction Population% in Juris.
Property Crimes in Maryland by Type of Crime and Maryland Jurisdiction, 2009Total Property Crimes Breaking and Entering Larceny/Theft Motor Vehicle Thefts
*Rates per 100,000 population, based on population estimates for July 1, 2009 from the Maryland Department of Planning. **Estimated numbers of crimes that are drug-related are based on nationwide percentage estimates from The Economic Costs of Alc ohol and Drug Abuse in the United States -1992. ***Statewide agencies report offenses but do not report jurisdiction of occurrence. SOURCE: Adapted by ADAA from the Crime in Maryland, 2009 Uniform Crime Report, Maryland State Police.

• Arrests in Maryland decreased six percent in 2009. There were 285,788 arrests reported in 2009 compared to 303,270 in 2008.
• Arrests for drug offenses totaled 51,898 in 2009, a ten percent decrease from 2008.
• In 2009, 23,518 persons were arrested for driving while intoxicated, a two percent decline from 2008.


2008 2009 ∆2009 % in Juris.
2009 Rate*
2008 2009 ∆2009 % in Juris.
2009 Rate*
2008 2009 ∆2009 % in Juris.
2009 Rate*
Allegany 72,532 1.3 87 68 -21.8 0.6 93.8 473 472 -0.2 1.2 650.7 579 549 -5.2 2.3 756.9Anne Arundel 521,209 9.1 851 719 -15.5 6.1 137.9 1714 1607 -6.2 4.0 308.3 2152 2054 -4.6 8.7 394.1Baltimore City 637,418 13.9 7103 6012 -15.4 51.0 761.2 20744 17917 -13.6 44.7 2268.5 319 251 -21.3 1.1 31.8Baltimore Co. 789,814 11.2 922 941 2.1 8.0 147.6 4036 4048 0.3 10.1 635.1 1944 2119 9.0 9.0 332.4Calvert 89,212 1.6 76 48 -36.8 0.4 53.8 652 650 -0.3 1.6 728.6 979 889 -9.2 3.8 996.5Caroline 33,367 0.6 17 20 17.6 0.2 59.9 217 245 12.9 0.6 734.3 283 324 14.5 1.4 971.0Carroll 170,089 3.0 90 60 -33.3 0.5 35.3 733 544 -25.8 1.4 319.8 678 640 -5.6 2.7 376.3Cecil 100,796 1.8 71 82 15.5 0.7 81.4 614 470 -23.5 1.2 466.3 1065 954 -10.4 4.1 946.5Charles 142,226 2.5 204 191 -6.4 1.6 134.3 1273 1163 -8.6 2.9 817.7 1066 820 -23.1 3.5 576.5Dorchester 32,043 0.6 56 41 -26.8 0.3 128.0 243 184 -24.3 0.5 574.2 290 213 -26.6 0.9 664.7Frederick 227,980 4.0 205 216 5.4 1.8 94.7 1136 1094 -3.7 2.7 479.9 1095 1146 4.7 4.9 502.7Garrett 29,555 0.5 15 16 6.7 0.1 54.1 128 89 -30.5 0.2 301.1 261 206 -21.1 0.9 697.0Harford 242,514 4.3 250 216 -13.6 1.8 89.1 807 639 -20.8 1.6 263.5 994 873 -12.2 3.7 360.0Howard 281,884 4.9 28 41 46.4 0.3 14.5 1342 1311 -2.3 3.3 465.1 1357 1547 14.0 6.6 548.8Kent 20,247 0.4 33 52 57.6 0.4 256.8 239 145 -39.3 0.4 716.2 116 103 -11.2 0.4 508.7 Montgomery 971,600 17.0 540 661 22.4 5.6 68.0 2328 2287 -1.8 5.7 235.4 3854 4323 12.2 18.4 444.9Prince George's 834,560 14.6 1442 1102 -23.6 9.4 132.0 2769 2575 -7.0 6.4 308.5 1831 1879 2.6 8.0 225.1Queen Anne's 47,958 0.8 20 36 80.0 0.3 75.1 334 250 -25.1 0.6 521.3 407 392 -3.7 1.7 817.4St. Mary's 102,999 1.8 14 12 -14.3 0.1 11.7 589 499 -15.3 1.2 484.5 699 685 -2.0 2.9 665.1Somerset 25,959 0.5 35 37 5.7 0.3 142.5 160 132 -17.5 0.3 508.5 232 208 -10.3 0.9 801.3Talbot 36,262 0.6 75 47 -37.3 0.4 129.6 267 280 4.9 0.7 772.2 464 443 -4.5 1.9 1221.7Washington 145,910 2.6 413 468 13.3 4.0 320.7 771 695 -9.9 1.7 476.3 785 646 -17.7 2.7 442.7Wicomico 94,222 1.7 214 154 -28.0 1.3 163.4 757 653 -13.7 1.6 693.0 677 520 -23.2 2.2 551.9Worcester 49,122 0.9 105 130 23.8 1.1 264.6 1131 1058 -6.5 2.6 2153.8 861 822 -4.5 3.5 1673.4Statewide** ― ― 393 407 3.6 3.5 ― 964 1114 15.6 2.8 ― 1004 912 -9.2 3.9 ―State Total 5,699,478 100.0 13259 11777 -11.2 100.0 206.6 44421 40121 -9.7 100.0 703.9 23992 23518 -2.0 100.0 412.6
% in Juris.
Drug-Related and DWI Arrests in Maryland by Maryland Jurisdiction, 2008 and 2009
Sales/Manufacture Possession
Drug-RelatedDWI
Jurisdiction Population
*Rates per 100,000 population, based on population estimates for July 1, 2009 from the Maryland Department of Planning. **Statewide agencies report offenses but do not report jurisdiction of occurrence. SOURCE: Adapted by ADAA from the Crime in Maryland, 2009 Uniform Crime Report, Maryland State Police.

• There were 1,978 arrests of juveniles for sale or manufacture of illegal drugs in Maryland during 2009, a 17 percent decline from the previous year.
• Arrests of juveniles for possession of illegal drugs decreased by 15 percent during 2009 for a total of 4,563.
• Juvenile arrests for DWI and liquor law violations totaled 1,436 during 2009, declining by less than one percent from 2008.


2008 2009 ∆2009 % in Juris.
2009 Rate*
2008 2009 ∆2009 % in Juris.
2009 Rate*
2008 2009 ∆2009 % in Juris.
2009 Rate*
2008 2009 ∆2009 % in Juris.
2009 Rate*
Allegany 13,201 1.0 12 3 -75.0 0.2 22.7 44 32 -27.3 0.7 242.4 10 6 -40.0 3.0 45.5 74 46 -37.8 3.7 348.5Anne Arundel 120,920 9.0 77 78 1.3 3.9 64.5 425 351 -17.4 7.7 290.3 26 23 -11.5 11.4 19.0 145 86 -40.7 7.0 71.1Baltimore City 142,782 12.8 1827 1420 -22.3 71.8 821.0 1366 945 -30.8 20.7 546.3 0 0 ― 0.0 0.0 10 11 10.0 0.9 7.7Baltimore Co. 172,969 10.6 98 113 15.3 5.7 79.1 801 812 1.4 17.8 568.7 19 21 10.5 10.4 14.7 123 61 -50.4 4.9 35.3Calvert 22,927 1.7 8 11 37.5 0.6 48.0 95 85 -10.5 1.9 370.7 7 5 -28.6 2.5 21.8 39 63 61.5 5.1 274.8Caroline 8,242 0.6 2 1 -50.0 0.1 12.1 50 31 -38.0 0.7 376.1 8 4 -50.0 2.0 48.5 9 17 88.9 1.4 206.3Carroll 41,842 3.1 19 14 -26.3 0.7 33.5 161 134 -16.8 2.9 320.3 10 14 40.0 6.9 33.5 85 84 -1.2 6.8 200.8Cecil 24,897 1.8 9 9 0.0 0.5 36.1 108 74 -31.5 1.6 297.2 11 7 -36.4 3.5 28.1 18 14 -22.2 1.1 56.2Charles 37,974 2.8 20 18 -10.0 0.9 47.4 203 145 -28.6 3.2 381.8 5 2 -60.0 1.0 5.3 0 0 ― 0.0 0.0Dorchester 6,793 0.5 4 1 -75.0 0.1 14.7 50 21 -58.0 0.5 309.1 8 2 -75.0 1.0 29.4 9 29 222.2 2.4 426.9Frederick 58,135 4.3 11 27 145.5 1.4 46.4 136 194 42.6 4.3 333.7 10 7 -30.0 3.5 12.0 11 21 90.9 1.7 36.1Garrett 6,354 0.5 2 2 0.0 0.1 31.5 3 8 166.7 0.2 125.9 3 2 -33.3 1.0 31.5 0 0 ― 0.0 0.0Harford 59,658 4.4 20 18 -10.0 0.9 30.2 179 131 -26.8 2.9 219.6 16 9 -43.8 4.5 15.1 39 19 -51.3 1.5 31.8Howard 72,726 5.4 2 2 0.0 0.1 2.8 243 233 -4.1 5.1 320.4 12 20 66.7 9.9 27.5 229 378 65.1 30.6 519.8Kent 4,090 0.3 2 1 -50.0 0.1 24.5 44 9 -79.5 0.2 220.1 2 3 50.0 1.5 73.4 11 3 -72.7 0.2 73.4 Montgomery 238,042 17.6 50 83 66.0 4.2 34.9 448 431 -3.8 9.4 181.1 28 30 7.1 14.9 12.6 283 211 -25.4 17.1 88.6Prince George's 206,971 15.3 109 103 -5.5 5.2 49.8 374 367 -1.9 8.0 177.3 2 5 150.0 2.5 2.4 16 33 106.3 2.7 15.9Queen Anne's 11,270 0.8 3 5 66.7 0.3 44.4 49 38 -22.4 0.8 337.2 3 7 133.3 3.5 62.1 2 0 -100.0 0.0 0.0St. Mary's 26,265 1.9 4 1 -75.0 0.1 3.8 68 60 -11.8 1.3 228.4 2 4 100.0 2.0 15.2 53 29 -45.3 2.4 110.4Somerset 4,673 0.3 6 2 -66.7 0.1 42.8 25 11 -56.0 0.2 235.4 2 4 100.0 2.0 85.6 10 0 -100.0 0.0 0.0Talbot 7,144 0.5 6 4 -33.3 0.2 56.0 31 28 -9.7 0.6 392.0 6 10 66.7 5.0 140.0 15 34 126.7 2.8 475.9Washington 33,413 2.5 25 24 -4.0 1.2 71.8 106 61 -42.5 1.3 182.6 9 1 -88.9 0.5 3.0 85 18 -78.8 1.5 53.9Wicomico 21,954 1.6 25 12 -52.0 0.6 54.7 83 84 1.2 1.8 382.6 5 1 -80.0 0.5 4.6 35 12 -65.7 1.0 54.7Worcester 9,235 0.7 10 14 40.0 0.7 151.6 205 203 -1.0 4.4 2198.2 9 13 44.4 6.4 140.8 27 37 37.0 3.0 400.7Statewide** ― ― 20 12 -40.0 0.6 ― 46 75 63.0 1.6 ― 3 2 -33.3 1.0 ― 2 28 1300.0 2.3 ―State Total 1,350,776 100.0 2371 1978 -16.6 100.0 146.4 5343 4563 -14.6 100.0 337.8 216 202 -6.5 100.0 15.0 1230 1234 0.3 100.0 91.4
DWI Liquor Law ViolationsAlcohol-Related
Juvenile Drug and Alcohol-Related Arrests in Maryland by Maryland Jurisdiction, 2008 and 2009
% in Juris.
Sales/Manufacture Possession
Drug-Related
JurisdictionPopulation Under Age
18
*Rates per 100,000 population, based on population estimates for 2009 from the United States Census Bureau. **Statewide agencies report offenses but do not report jurisdiction of occurrence. SOURCE: Adapted by ADAA from Uniform Crime Report, Maryland State Police.

Maryland Public School Suspensions
Maryland State Department of Education Division of Accountability
and Assessment

Data reflect the number of combined in-school and out-of-school suspension incidents in
each local school system during the 2009-10 school year, which are
categorized in eight major groupings including Dangerous
Substance-Related.

Rate* (per 100,000 Students) of Alcohol-Related Suspensions and Expulsions in Maryland Public Schools by Local School Unit, 2009-2010 School Year
228.9
205.8
162.4
141.5
135.2
108.3
108.0
102.7
98.9
98.7
90.1
86.6
84.3
76.5
73.4
72.2
69.0
66.7
64.8
51.8
43.2
34.2
25.7
22.8
13.3
Kent
Calvert
Garrett
Washington
Worcester
Charles
Montgomery
Howard
St. Mary's
Cecil
Caroline
Carroll
Anne Arundel
Allegany
State Total
Frederick
Somerset
Talbot
Baltimore Co.
Harford
Dorchester
Wicomico
Queen Anne's
Prince George's
Baltimore City
0.0 50.0 100.0 150.0 200.0 250.0
*Rates calculated using public-school enrollment figures for September, 2009 from the Maryland State Department of Education..
Source: Adapted by ADAA from Suspensions, Expulsions and Health-Related Exclusions, Maryland Public Schools, 2009-2010, Division of Accountability and Assessment, Maryland State Department of Education (MSDE).

Rate* (per 100,000 Students) of Tobacco-Related Suspensions in Maryland Public Schools by Local School Unit, 2009-2010
705.8
686.8
573.9
502.6
432.4
335.7
276.4
243.3
237.7
185.6
172.5
139.4
120.1
113.1
100.4
66.7
59.7
34.2
31.5
26.1
25.3
21.7
19.9
10.9
0.0
Queen Anne's
Kent
Cecil
Allegany
Caroline
Anne Arundel
Calvert
Harford
Dorchester
Garrett
Somerset
Baltimore Co.
Worcester
State Total
Washington
Talbot
Charles
Wicomico
Prince George's
Montgomery
Carroll
Howard
Frederick
Baltimore City
St. Mary's
0.0 200.0 400.0 600.0 800.0
*Rates calculated using public-school enrollment figures for September, 2009 from the Maryland State Department of Education..
Source: Adapted by ADAA from Suspensions, Expulsions and Health-Related Exclusions, Maryland Public Schools, 2009-2010, Division of Accountability and Assessment, Maryland State Department of Education (MSDE).

Rate* (per 100,000 Students) of Other Drug-Related Suspensions in Maryland Public Schools by Local School Unit, 2009-2010
529.5
487.1
482.2
440.6
419.6
367.5
366.3
363.6
326.2
320.8
310.5
270.3
252.9
246.1
240.4
234.5
232.6
223.3
207.0
206.0
178.0
177.7
126.1
98.4
64.8
St. Mary's
Garrett
Calvert
Charles
Cecil
Harford
Kent
Frederick
Baltimore Co.
Queen Anne's
Washington
Worcester
State Total
Anne Arundel
Allegany
Carroll
Wicomico
Baltimore City
Somerset
Montgomery
Talbot
Howard
Caroline
Prince George's
Dorchester
0.0 100.0 200.0 300.0 400.0 500.0 600.0
*Rates calculated using public-school enrollment figures for September, 2009 from the Maryland State Department of Education..
Source: Adapted by ADAA from Suspensions, Expulsions and Health-Related Exclusions, Maryland Public Schools, 2009-2010, Division of Accountability and Assessment, Maryland State Department of Education (MSDE).

2007-2008
2008-2009
2009-2010
2008/2009 - 2009/2010
∆
2009-2010 % in Unit
2009-2010
Rate*
2007-2008
2008-2009
2009-2010
2008/2009 - 2009/2010
∆
2009-2010 % in Unit
2009-2010
Rate*
2007-2008
2008-2009
2009-2010
2008/2009 - 2009/2010
∆
2009-2010 % in Unit
2009-2010
Rate*
Allegany 9152 1.1 2595 1.9 7 11 7 -36.4 1.6 76.5 55 44 46 4.5 3.9 502.6 29 25 22 -12.0 1.2 240.4Anne Arundel 74776 8.8 13798 9.9 79 66 63 -4.5 9.4 84.3 231 305 251 -17.7 27.2 335.7 156 155 184 18.7 7.6 246.1Baltimore City 82866 12.2 10267 7.4 20 29 11 -62.1 4.1 13.3 36 25 9 -64.0 2.2 10.9 222 198 185 -6.6 9.7 223.3Baltimore Co. 103324 9.8 20148 14.5 63 68 67 -1.5 9.7 64.8 130 136 144 5.9 12.1 139.4 352 337 337 0.0 16.6 326.2Calvert 17006 2.0 4975 3.6 22 20 35 75.0 2.9 205.8 35 37 47 27.0 3.3 276.4 45 68 82 20.6 3.3 482.2Caroline 5551 0.7 1828 1.3 8 3 5 66.7 0.4 90.1 47 51 24 -52.9 4.5 432.4 12 29 7 -75.9 1.4 126.1Carroll 27721 3.3 2574 1.9 37 37 24 -35.1 5.3 86.6 10 8 7 -12.5 0.7 25.3 80 78 65 -16.7 3.8 234.5Cecil 16205 1.9 5254 3.8 22 31 16 -48.4 4.4 98.7 132 111 93 -16.2 9.9 573.9 58 96 68 -29.2 4.7 419.6Charles 26779 3.2 7467 5.4 35 33 29 -12.1 4.7 108.3 11 11 16 45.5 1.0 59.7 71 76 118 55.3 3.7 440.6Dorchester 4628 0.5 2677 1.9 5 0 2 ― 0.0 43.2 7 4 11 175.0 0.4 237.7 17 7 3 -57.1 0.3 64.8Frederick 40159 4.7 5661 4.1 50 47 29 -38.3 6.7 72.2 33 18 8 -55.6 1.6 19.9 78 103 146 41.7 5.1 363.6Garrett 4311 0.5 354 0.3 16 7 7 0.0 1.0 162.4 14 10 8 -20.0 0.9 185.6 40 29 21 -27.6 1.4 487.1Harford 38636 4.6 5558 4.0 29 40 20 -50.0 5.7 51.8 91 106 94 -11.3 9.4 243.3 106 91 142 56.0 4.5 367.5Howard 50641 6.0 3445 2.5 53 48 52 8.3 6.9 102.7 29 33 11 -66.7 2.9 21.7 100 88 90 2.3 4.3 177.7Kent 2184 0.3 729 0.5 3 0 5 ― 0.0 228.9 9 3 15 400.0 0.3 686.8 13 14 8 -42.9 0.7 366.3 Montgomery 141722 16.7 5361 3.9 197 148 153 3.4 21.2 108.0 70 50 37 -26.0 4.5 26.1 247 257 292 13.6 12.6 206.0Prince George's 127039 15.0 21852 15.7 64 42 29 -31.0 6.0 22.8 78 46 40 -13.0 4.1 31.5 268 108 125 15.7 5.3 98.4Queen Anne's 7793 0.9 890 0.6 9 5 2 -60.0 0.7 25.7 40 48 55 14.6 4.3 705.8 14 16 25 56.3 0.8 320.8St. Mary's 17186 2.0 6009 4.3 16 18 17 -5.6 2.6 98.9 91 0 0 ― 0.0 0.0 50 106 91 -14.2 5.2 529.5Somerset 2898 0.3 1835 1.3 1 0 2 ― 0.0 69.0 10 5 5 0.0 0.4 172.5 16 12 6 -50.0 0.6 207.0Talbot 4495 0.5 647 0.5 10 2 3 50.0 0.3 66.7 18 13 3 -76.9 1.2 66.7 9 4 8 100.0 0.2 178.0Washington 21902 2.6 4103 3.0 17 15 31 106.7 2.1 141.5 30 38 22 -42.1 3.4 100.4 76 53 68 28.3 2.6 310.5Wicomico 14619 1.7 9431 6.8 23 19 5 -73.7 2.7 34.2 11 12 5 -58.3 1.1 34.2 37 57 34 -40.4 2.8 232.6Worcester 6659 0.8 1335 1.0 2 10 9 -10.0 1.4 135.2 11 9 8 -11.1 0.8 120.1 17 29 18 -37.9 1.4 270.3State Total 848252 100.0 138793 100.0 788 699 623 -10.9 100.0 73.4 1229 1123 959 -14.6 100.0 113.1 2113 2036 2145 5.4 100.0 252.9
% in Local Unit
Dangerous Substance-Related In-School and Out-of-School Suspensions and Expulsions from Maryland Public Schools, 2007-2008, 2008-2009 and 2009-2010
Alcohol-Related Tobacco-Related
Local Unit2009-2010
EnrollmentAll Sus-
pensions
% in Local Unit
Other Drug-Related‡Suspensions and Expulsions
*Rates per 100,000 student enrollment based on Maryland State Department of Education (MSDE) public school enrollment figure s as of September 30,2009. ‡Other drug-related suspensions include the categories of drugs, inhalants, sells or solicits sale of controlled substance, or p ossesses or uses illegal drugs. SOURCE: Adapted by ADAA from the 2007-2008, 2008-2009 and 2009-2010 reports on Suspensions, Expulsions and Health-Related Exclusions, Maryland Public Schools, Division of Accountability and Assessment, Maryland State Department of Education (MSDE).

SYNAR Survey of Retail Tobacco Outlets in
MarylandMaryland Alcohol and Drug Abuse Administration (ADAA), Maryland Department of Health and Mental
Hygiene (DHMH)

• In accordance with Federal tobacco regulations, states are required to conduct annual random and unannounced inspections of stores and vending machines to ensure that laws prohibiting sales of tobacco products to minors are being enforced and to demonstrate that sales to minors are decreasing.
• Each year a random sample of 10 percent is drawn from the list of licensed tobacco outlets provided by the Office of the Comptroller of Maryland.
• Compliance is measured by retailers’ positive response to youth workers’ requests for tobacco products.

Maryland SYNAR Survey Noncompliance Rates1997 to 2010
54.6
36.1 35.432.5
25.4 25.0
10.4 12.28.0 9.5
15.9
4.9
16.6 16.9
1997 1998 1999 2000 2001 2002 2003 2004 2005 2006 2007 2008 2009 20100.0
10.0
20.0
30.0
40.0
50.0
60.0
SOURCE: Alcohol and Drug Abuse Administration (ADAA)

# % # % # % # %Allegany 9 1 11.1 5 0 0.0 6 0 0.0 5 1 20.0Anne Arundel 56 12 21.4 53 2 3.8 52 9 17.3 58 13 22.4Baltimore City 116 7 6.0 122 13 10.7 126 37 29.4 135 28 20.7Baltimore County 76 38 50.0 83 8 9.6 73 17 23.3 78 17 21.8Calvert 7 1 14.3 7 0 0.0 9 0 0.0 8 1 12.5Caroline 3 0 0.0 4 0 0.0 4 0 0.0 3 0 0.0Carroll 14 1 7.1 15 0 0.0 16 2 12.5 16 4 25.0Cecil 14 0 0.0 11 0 0.0 13 2 15.4 13 2 15.4Charles 12 1 8.3 15 0 0.0 13 3 23.1 14 2 14.3Dorchester 7 1 14.3 5 0 0.0 5 0 0.0 5 0 0.0Frederick 18 0 0.0 16 0 0.0 16 0 0.0 18 1 5.6Garrett 3 0 0.0 3 0 0.0 5 0 0.0 5 0 0.0Harford 22 2 9.1 16 0 0.0 21 1 4.8 18 2 11.1Howard 18 8 44.4 20 0 0.0 21 1 4.8 22 4 18.2Kent 5 0 0.0 3 0 0.0 4 0 0.0 4 0 0.0Montgomery 54 2 3.7 58 0 0.0 64 6 9.4 55 1 1.8Prince George's 74 8 10.8 83 5 6.0 85 19 22.4 85 17 20.0Queen Anne's 7 0 0.0 8 1 12.5 5 0 0.0 6 3 50.0St. Mary's 9 2 22.2 9 0 0.0 11 1 9.1 11 2 18.2Somerset 3 1 33.3 3 0 0.0 3 0 0.0 3 0 0.0Talbot 6 1 16.7 6 0 0.0 5 0 0.0 3 1 33.3Washington 16 1 6.3 15 0 0.0 11 0 0.0 14 0 0.0Wicomico 11 2 18.2 11 0 0.0 8 0 0.0 9 1 11.1Worcester 19 3 15.8 16 0 0.0 15 0 0.0 14 2 14.3Total 579 92 15.9 587 29 4.9 591 98 16.6 602 102 16.9
Maryland SYNAR Inspections of Tobacco Retail Outlets 2007 - 2010
2009 2010Noncompliant Noncompliant Noncompliant NoncompliantCompleted
InspectionsCompleted Inspections
Completed Inspections
Outlet Location2007 2008
Completed Inspections
SOURCE: Alcohol and Dtug Abuse Administration (ADAA).

Maryland Youth Risk Behavior Survey (YRBS)
Maryland State Department of Education (MSDE) and the U.S. Centers
for Disease Control and Prevention (CDC)

• The Maryland YRBS is part of the Youth Risk Behavior Surveillance System (YRBSS) developed in 1990 by the U.S. Centers for Disease Control and Prevention (CDC) to monitor behaviors that affect morbidity and mortality among high-school-age youth.
• In the spring of 2009, the Maryland YRBS was administered to students in a representative sample of Maryland public-high-school classrooms. The law requires the survey to be administered every two years.
• A total of 1,644 students in 30 Maryland public high schools completed the survey, resulting in a 78% response rate. The 2009 Maryland YRBS results are representative of all Maryland’s public-school students in grades 9 through 12.

Maryland Youth Risk Behavior Survey Percentages Maryland Youth Risk Behavior Survey
2005, 2007, 2009
39.8
20.818.5
2.4
16.5
7.4
42.9
23.9
19.4
2.6
16.8
7.4
37.0
19.421.9
3.2
11.9
4.4
Current Drinker Binge Drinker Current Marijuana Current Cocaine Current Smoker Heavy Smoker
0.0
10.0
20.0
30.0
40.0
50.0
2005
2007
2009

Behavioral Risk Factor Surveillance System
Maryland Department of Health and Mental Hygiene (DHMH) and U.S. Centers for Disease Control and
Prevention (CDC)

• The Maryland Behavioral Risk Factor Surveillance System (BRFSS) is funded by the U.S. Centers for Disease Control and Prevention.
• The emphasis of this survey is on health-related behaviors in the Maryland adult population with a specific focus on behaviors and conditions that place Maryland adults at risk for chronic diseases, injuries, and preventable infectious diseases.
• The survey is part of a surveillance effort conducted by the Maryland Department of Health and Mental Hygiene in cooperation with the Centers for Disease Control and Prevention.
• Annual sample size for this survey is approximately 4,400 interviews.

200895%
Confidence Interval
200995%
Confidence Interval
∆ 200895%
Confidence Interval
200995%
Confidence Interval
∆ 200895%
Confidence Interval
200995%
Confidence Interval
∆
Allegany 17.6 12.3 - 22.9 12.2 7.3 - 17.1 -30.7 4.4 1.5 - 7.3 3.6 0.8 - 6.4 -18.2 23.3 17.4 - 29.2 27.4 20.8 - 34.0 17.6Anne Arundel 17.2 13.6 - 20.8 15.7 12.0 - 19.4 -8.7 6.6 4.2 - 9.0 4.3 2.2 - 6.4 -34.8 13.7 10.5 - 17.0 13.3 9.9 - 16.8 -2.9Baltimore City 15.2 11.7 - 18.7 15.0 11.2 - 18.8 -1.3 4.5 2.5 - 6.5 15.0 11.2 - 18.8 233.3 21.9 17.9 - 26.0 26.8 22.1 - 31.5 22.4Baltimore Co. 14.2 11.6 - 16.8 12.9 10.3 - 15.5 -9.2 4.8 3.2 - 6.4 4.1 2.6 - 5.6 -14.6 16.9 14.1 - 19.7 13.7 11.1 - 16.3 -18.9Calvert 16.6 11.0 - 22.3 19.8 13.3 - 26.3 19.3 4.4 1.3 - 7.5 7.6 3.3 - 11.9 72.7 20.0 13.9 - 26.1 21.1 14.5 - 27.7 5.5Caroline 22.4 14.9 - 29.9 10.9 5.0 - 16.8 -51.3 3.6 0.3 - 6.9 1.2 0.0 - 3.3 -66.7 19.0 12.1 - 25.9 15.9 9.1 - 22.7 -16.3Carroll 16.8 10.7 - 22.9 25.7 18.0 - 33.5 53.0 3.7 0.6 - 6.8 10.5 5.1 - 15.9 183.8 12.0 6.7 - 17.3 26.2 18.5 - 33.9 118.3Cecil 11.5 6.8 - 16.2 22.7 16.3 - 29.2 97.4 3.4 0.7 - 6.1 3.5 0.7 - 6.4 2.9 22.4 16.3 - 28.5 23.1 16.7 - 29.5 3.1Charles 15.8 10.8 - 20.8 9.6 5.6 - 13.6 -39.2 9.6 5.5 - 13.7 2.3 0.3 - 4.4 -76.0 18.2 12.9 - 23.5 14.0 9.3 - 18.7 -23.1Dorchester 12.2 6.7 - 17.7 9.2 4.3 - 14.1 -24.6 4.5 1.0 - 8.0 4.1 0.7 - 7.5 -8.9 19.7 13.1 - 26.4 15.7 9.6 - 21.8 -20.3Frederick 18.2 14.4 - 22.0 12.7 9.3 - 16.1 -30.2 5.5 3.2 - 7.8 3.3 1.5 - 5.2 -40.0 13.9 10.5 - 17.3 15.0 11.3 - 18.7 7.9Garrett 11.3 6.3 - 16.3 18.8 12.5 - 25.1 66.4 8.2 3.9 - 12.5 4.3 1.0 - 7.6 -47.6 18.0 12.0 - 24.0 15.2 9.4 - 21.0 -15.6Harford 14.7 9.7 - 19.7 14.0 8.8 - 19.2 -4.8 3.9 1.2 - 6.6 4.0 1.1 - 7.0 2.6 20.8 15.1 - 26.5 20.3 14.3 - 26.3 -2.4Howard 10.7 6.8 - 14.6 10.2 6.2 - 14.2 -4.7 5.5 2.7 - 8.4 2.4 0.4 - 4.4 -56.4 6.5 3.4 - 9.6 6.5 3.3 - 9.7 0.0Kent 13.9 7.6 - 20.2 13.1 6.9 - 19.3 -5.8 4.4 0.6 - 8.2 5.4 1.2 - 9.6 22.7 13.7 7.5 - 19.9 15.7 9.1 - 22.3 14.6 Montgomery 11.0 8.8 - 13.2 10.7 8.4 - 13.0 -2.7 3.7 2.4 - 5.0 4.2 2.7 - 5.7 13.5 8.1 6.2 - 10.0 7.4 5.5 - 9.3 -8.6Prince George's 9.9 7.2 - 12.6 5.7 3.5 - 7.9 -42.4 3.9 2.2 - 5.6 2.7 1.1 - 4.3 -30.8 12.0 9.2 - 14.9 14.5 11.2 - 17.9 20.8Queen Anne's 16.5 11.4 - 21.6 25.0 18.5 - 31.5 51.5 7.0 3.5 - 10.5 10.8 6.1 - 15.5 54.3 19.0 13.7 - 24.3 14.6 9.4 - 19.8 -23.2St. Mary's 21.8 15.9 - 27.7 14.6 9.4 - 19.9 -33.0 3.7 1.0 - 6.4 3.6 0.8 - 6.4 -2.7 22.3 16.4 - 28.2 20.4 14.5 - 26.3 -8.5Somerset 10.8 4.1 - 17.5 8.9 2.6 - 15.2 -17.6 1.5 0.0 - 4.1 3.6 0.0 - 7.7 140.0 27.9 18.2 - 37.6 14.4 6.6 - 22.2 -48.4Talbot 11.3 6.6 - 16.0 20.4 13.8 - 27.0 80.5 6.5 2.8 - 10.2 6.7 2.6 - 10.8 3.1 12.6 7.7 - 17.5 11.7 6.5 - 16.9 -7.1Washington 15.7 11.5 - 19.9 14.0 9.5 - 18.5 -10.8 4.7 2.3 - 7.1 3.3 1.0 - 5.6 -29.8 25.7 20.7 - 30.7 22.5 17.2 - 27.8 -12.5Wicomico 15.9 10.6 - 21.2 9.5 5.0 - 14.0 -40.3 5.7 2.3 - 9.1 4.2 1.1 - 7.3 -26.3 17.3 11.8 - 22.8 18.2 12.3 - 24.1 5.2Worcester 13.0 7.0 - 19.1 13.1 6.8 - 19.4 0.8 7.5 2.7 - 12.3 7.2 2.4 - 12.0 -4.0 17.2 10.5 - 23.9 17.7 10.8 - 24.7 2.9State Total 13.8 12.9 - 14.7 12.6 11.7 - 13.5 -8.7 4.7 4.2 - 5.2 4.3 3.8 - 4.8 -8.5 14.9 14.0 - 15.8 15.2 14.3 - 16.1 2.0
Jurisdiction
Percentages* of Past Month Binge and Chronic Alcohol Use and Tobacco Smoking among Adults by Maryland Jurisdiction, 2008 and 2009
Curren Smoker**Binge Drinking** Chronic Drinking**
*Percentages are weighted to the Maryland population. **Binge drinking is defined as consuming five or more drinks on the same occasion. Chronic drinking is defined as consuming an average of more than two drinks per day for men and more than one drink per day for women in the past month. Current smoker is defined as having smok ed at least 100 lifetime cigarettes and currently smoking. SOURCE: Adapted by ADAA from the Centers for Disease Control and Prevention (CDC) Behavioral Risk Factor Surveillance System (www.marylandbrfss.org).

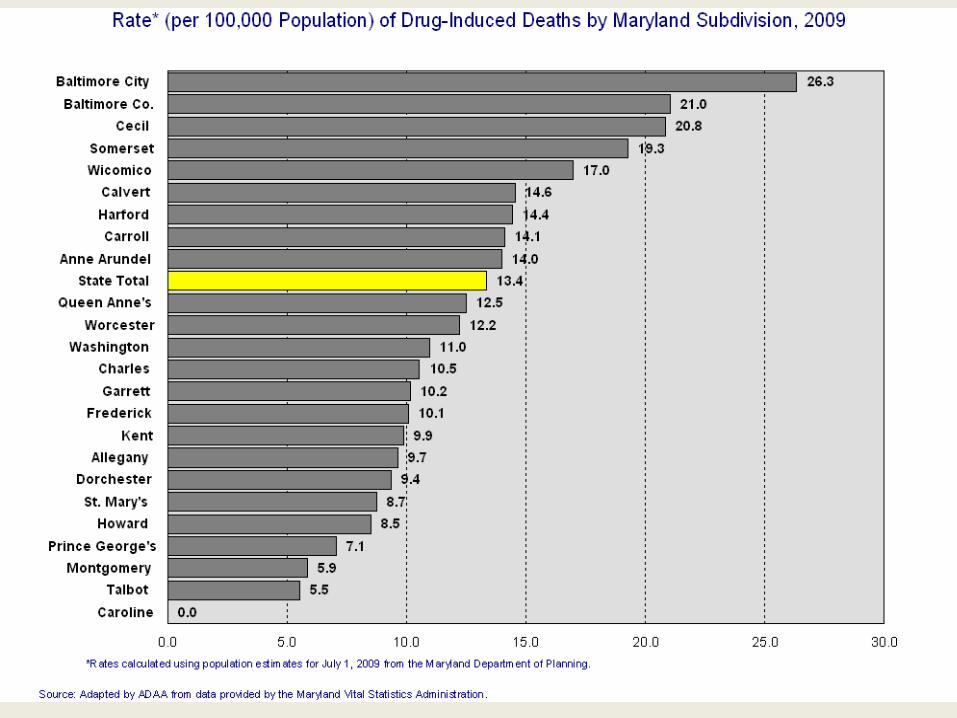
Alcohol and Drug-Induced Deaths
Vital Statistics Administration, Maryland Department of Health and
Mental Hygiene (DHMH)
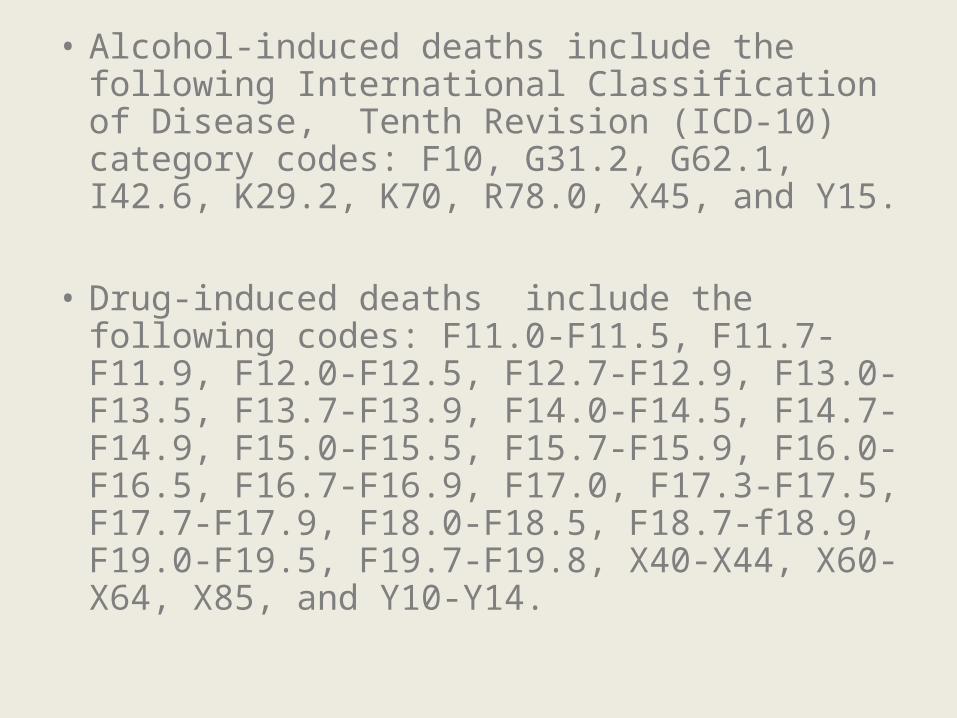
• Alcohol-induced deaths include the following International Classification of Disease, Tenth Revision (ICD-10) category codes: F10, G31.2, G62.1, I42.6, K29.2, K70, R78.0, X45, and Y15.
• Drug-induced deaths include the following codes: F11.0-F11.5, F11.7-F11.9, F12.0-F12.5, F12.7-F12.9, F13.0-F13.5, F13.7-F13.9, F14.0-F14.5, F14.7-F14.9, F15.0-F15.5, F15.7-F15.9, F16.0-F16.5, F16.7-F16.9, F17.0, F17.3-F17.5, F17.7-F17.9, F18.0-F18.5, F18.7-f18.9, F19.0-F19.5, F19.7-F19.8, X40-X44, X60-X64, X85, and Y10-Y14.


2008 20092009 % in Juris.
2008 2009 ∆2009 % in Juris.
2009 Rate*
2008 2009 ∆2009 % in Juris.
2009 Rate*
Allegany 72,532 1.3 856 877 2.0 5 7 40.0 2.5 9.7 11 7 -36.4 0.9 9.7Anne Arundel 521,209 9.1 3830 3695 8.4 21 31 47.6 10.9 5.9 78 73 -6.4 9.6 14.0Baltimore City 637,418 13.9 6509 6503 14.9 58 61 5.2 21.5 7.7 166 208 25.3 27.3 26.3Baltimore Co. 789,814 11.2 7692 7829 17.9 40 38 -5.0 13.4 6.0 140 134 -4.3 17.6 21.0Calvert 89,212 1.6 609 586 1.3 3 5 66.7 1.8 5.6 8 13 62.5 1.7 14.6Caroline 33,367 0.6 315 328 0.7 3 3 0.0 1.1 9.0 5 0 -100.0 0.0 0.0Carroll 170,089 3.0 1329 1337 3.1 8 7 -12.5 2.5 4.1 19 24 26.3 3.2 14.1Cecil 100,796 1.8 812 857 2.0 3 8 166.7 2.8 7.9 16 21 31.3 2.8 20.8Charles 142,226 2.5 878 871 2.0 4 1 -75.0 0.4 0.7 17 15 -11.8 2.0 10.5Dorchester 32,043 0.6 356 370 0.8 5 5 0.0 1.8 15.6 5 3 -40.0 0.4 9.4Frederick 227,980 4.0 1477 1472 3.4 12 10 -16.7 3.5 4.4 16 23 43.8 3.0 10.1Garrett 29,555 0.5 321 325 0.7 2 2 0.0 0.7 6.8 3 3 0.0 0.4 10.2Harford 242,514 4.3 1811 1797 4.1 13 8 -38.5 2.8 3.3 39 35 -10.3 4.6 14.4Howard 281,884 4.9 1474 1404 3.2 7 6 -14.3 2.1 2.1 17 24 41.2 3.2 8.5Kent 20,247 0.4 254 265 0.6 0 0 ― 0.0 0.0 4 2 -50.0 0.3 9.9 Montgomery 971,600 17.0 5560 5493 12.6 21 24 14.3 8.5 2.5 58 57 -1.7 7.5 5.9Prince George's 834,560 14.6 5268 5133 11.7 40 37 -7.5 13.0 4.4 47 59 25.5 7.8 7.1Queen Anne's 47,958 0.8 356 343 0.8 0 3 ― 1.1 6.3 7 6 -14.3 0.8 12.5St. Mary's 102,999 1.8 653 703 1.6 4 6 50.0 2.1 5.8 13 9 -30.8 1.2 8.7Somerset 25,959 0.5 225 271 0.6 1 3 200.0 1.1 11.6 3 5 66.7 0.7 19.3Talbot 36,262 0.6 455 440 1.0 1 2 100.0 0.7 5.5 3 2 -33.3 0.3 5.5Washington 145,910 2.6 1334 1351 3.1 7 4 -42.9 1.4 2.7 21 16 -23.8 2.1 11.0Wicomico 94,222 1.7 885 923 2.1 1 7 600.0 2.5 7.4 12 16 33.3 2.1 17.0Worcester 49,122 0.9 590 590 1.3 5 6 20.0 2.1 12.2 11 6 -45.5 0.8 12.2State Total 5,699,478 100.0 43849 43763 100.0 264 284 7.6 100.0 5.0 719 761 5.8 100.0 13.4
% in Juris.
Alcohol and Drug-Induced Deaths by Maryland Jurisdiction, 2008 and 2009
Alcohol-Induced** Drug-Induced**
Alcohol and Drug -Induced Deaths
Jurisdiction Population
Deaths Due to All Causes
*Rates per 100,000 population, based on population estimates for July 1, 2009 from the Maryland Department of Planning. SOURCE: Adapted by ADAA from data obtained from the Maryland Vital Statistics Administration.

Intoxication Deaths
Maryland Office of the Chief Medical Examiner (OCME)
• The OCME is responsible for investigating all deaths in Maryland caused by violence, suicide, or injury; sudden deaths in apparently healthy individuals; and deaths that are suspicious or unusual. Intoxication deaths are those in which the OCME-determined cause of death included the word “intoxication”.
• In 90 percent of the intoxication deaths from 2006 to 2010 the manner of death (accident/suicide/homicide) was reported as undetermined, and multiple substances were involved in 40 percent or more of intoxication deaths.

Percentage of Intoxication Deaths in Maryland with Mention of Selected Substances2006 to 2009
2006 2007 2008 2009 20100
5
10
15
20
25
30
35 Alcohol
Cocaine
Heroin
Methadone
Oxycodone
Other Prescription Opiate(s)
Benzodiazepines
Other Prescription Drug(s)
Unspecified Narcotic(s)
Note: Adapted by ADAA from data supplied by the Maryland Office of the Chief Medical ExaminerN = 830 N = 867 N = 741 N = 780 N = 671

2009 2010 ∆ 2009 2010 ∆ 2009 2010 ∆ 2009 2010 ∆ 2009 2010 ∆ 2009 2010 ∆ 2009 2010 ∆ 2009 2010 ∆ 2009 2010 ∆
Allegany 3 4 33.3 1 1 0.0 0 1 ― 1 3 200.0 1 3 200.0 3 8 166.7 0 1 ― 0 3 ― 0 5 ―Anne Arundel 11 11 0.0 13 13 0.0 16 8 -50.0 11 18 63.6 4 6 50.0 11 15 36.4 3 3 0.0 4 5 25.0 11 11 0.0Baltimore City 55 40 -27.3 76 47 -38.2 69 43 -37.7 53 58 9.4 11 8 -27.3 46 34 -26.1 54 25 -53.7 13 14 7.7 20 16 -20.0Baltimore Co. 19 27 42.1 20 19 -5.0 25 19 -24.0 14 31 121.4 16 18 12.5 23 20 -13.0 10 9 -10.0 7 15 114.3 25 18 -28.0Calvert 5 0 -100.0 1 3 200.0 3 0 -100.0 2 1 -50.0 3 2 -33.3 5 2 -60.0 1 0 -100.0 1 0 -100.0 3 2 -33.3Caroline 1 0 -100.0 1 0 -100.0 0 0 ― 0 1 ― 1 1 0.0 0 1 ― 0 0 ― 0 0 ― 0 0 ―Carroll 6 3 -50.0 3 6 100.0 3 2 -33.3 4 2 -50.0 4 5 25.0 5 3 -40.0 1 1 0.0 2 1 -50.0 6 2 -66.7Cecil 6 5 -16.7 4 3 -25.0 2 1 -50.0 7 7 0.0 3 13 333.3 6 7 16.7 6 0 -100.0 3 2 -33.3 1 3 200.0Charles 1 5 400.0 2 2 0.0 2 3 50.0 2 0 -100.0 5 3 -40.0 3 1 -66.7 0 2 ― 0 0 ― 4 2 -50.0Dorchester 0 1 ― 0 1 ― 0 1 ― 0 0 ― 0 3 ― 1 3 200.0 0 1 ― 0 1 ― 1 2 100.0Frederick 8 5 -37.5 3 3 0.0 3 1 -66.7 4 1 -75.0 5 3 -40.0 4 5 25.0 4 2 -50.0 2 1 -50.0 4 1 -75.0Garrett 1 0 -100.0 1 0 ― 1 0 -100.0 1 1 0.0 0 0 ― 3 0 -100.0 1 0 -100.0 1 0 -100.0 0 0 ―Harford 6 11 83.3 5 4 -20.0 7 2 -71.4 8 17 112.5 3 12 300.0 8 9 12.5 6 2 -66.7 2 2 0.0 5 3 -40.0Howard 5 3 -40.0 3 1 -66.7 3 3 0.0 4 1 -75.0 0 4 ― 3 0 -100.0 1 0 -100.0 2 1 -50.0 4 1 -75.0Kent 0 1 ― 0 1 ― 0 0 ― 2 2 0.0 1 2 100.0 0 0 ― 0 0 ― 0 0 ― 0 2 ― Montgomery 10 13 30.0 7 4 -42.9 6 7 16.7 7 5 -28.6 10 9 -10.0 12 9 -25.0 3 1 -66.7 4 3 -25.0 21 15 -28.6Prince George's 13 19 46.2 13 11 -15.4 13 6 -53.8 5 8 60.0 2 8 300.0 15 12 -20.0 9 2 -77.8 1 1 0.0 7 9 28.6Queen Anne's 0 1 ― 2 0 ― 1 0 -100.0 1 2 100.0 1 1 0.0 0 2 ― 1 1 0.0 0 1 ― 0 2 ―St. Mary's 3 5 66.7 1 2 100.0 0 0 ― 3 5 66.7 5 4 -20.0 1 5 400.0 0 0 ― 0 0 ― 1 4 300.0Somerset 1 0 -100.0 1 1 ― 0 0 ― 0 0 ― 1 1 0.0 1 1 0.0 0 0 ― 0 0 ― 0 0 ―Talbot 0 0 ― 1 0 ― 0 0 ― 2 1 -50.0 0 1 ― 0 1 ― 0 0 ― 0 0 ― 0 1 ―Washington 4 4 0.0 0 2 ― 5 3 -40.0 0 3 ― 3 2 -33.3 2 5 150.0 6 1 -83.3 1 2 100.0 3 6 100.0Wicomico 3 4 33.3 2 3 50.0 1 1 0.0 2 3 50.0 4 2 -50.0 6 2 -66.7 1 2 100.0 2 0 -100.0 3 2 -33.3Worcester 3 6 100.0 0 2 ― 0 0 ― 1 1 0.0 4 2 -50.0 3 2 -33.3 2 1 -50.0 1 0 -100.0 3 1 -66.7Unspecified 0 1 ― 0 0 ― 0 0 ― 0 0 ― 0 0 ― 0 0 ― 0 0 ― 0 0 ― 0 0 ―State Total 164 169 3.0 160 129 -19.4 160 101 -36.9 134 171 27.6 87 113 29.9 161 147 -8.7 109 54 -50.5 46 52 13.0 122 108 -11.5
Other Rx Opiates Benzodiazepines Other Rx DrugsUnspecified
Narcotics
Intoxication Deaths by Maryland Jurisdiction, 2009 and 2010Substance Mentions*
JurisdictionHeroin MethadoneAlcohol Cocaine Oxycodone
*Each reported death may involve multiple substances. SOURCE: Adapted by ADAA from data provided by the Office of the Chief Medical Examiner (OCME).

Substance-Abuse Treatment Admissions
Maryland Alcohol and Drug Abuse Administration (ADAA), Maryland Department of Health and Mental
Hygiene (DHMH)

• All publicly-funded Maryland alcohol and drug-abuse-treatment providers are required to report information on admissions to and discharges from treatment via the Web-based Statewide Maryland Automated Record Tracking (SMART) system.
• During 2010 35,246 individuals accounted for 43,431 recorded admissions to State-funded treatment, a 2.6 percent increase from the previous year.

• From CY 2007 to 2010 Oxycodone-related admissions increased 130 percent and total prescription-opiate-related admissions doubled.
• Benzodiazepine-related treatment admissions increased by 94 percent, PCP by 35 percent and marijuana by 7 percent.
• During 2010 heroin-related admissions increased 8 percent from the previous year; alcohol-related admissions were level.
• Cocaine-related admissions fell by 26 percent over the four years.

Selected Substance Problems* Reported for Admissions to State-Funded Alcohol and Drug Abuse Treatment Programs
2007 to 2010
2007 2008 2009 20100
5
10
15
20
25Thousands
Alcohol
Cocaine
Marijuana
Heroin
Prescription Opiates
Benzodiazepines
*Up to three substance problems may be reported for each admission.
Source: Adapted by ADAA from the State of Maryland Automated Record Tracking (SMART) system,.
Leading Substance Problems* Reported for Admissions to State-Funded Alcohol and Drug Abuse Treatment Programs Under Age 21
2007 to 2010
2007 2008 2009 20100
500
1000
1500
2000
2500
3000
3500
4000
Alcohol & Marijuana
Other Alcohol
Other Marijuana
Cocaine
Heroin
Prescription Opiates
Benzodiazepines
*Up to three substance problems may be reported for each admission.
Source: Adapted by ADAA from the State of Maryland Automated Record Tracking (SMART) system,.

2008 2009 2010 2008 2009 2010 2008 2009 2010 2008 2009 2010 2008 2009 2010 2008 2009 2010 2008 2009 2010
Allegany 65 29 49 69.0 103 49 81 65.3 7 5 5 0.0 0 2 0 -100.0 9 8 11 37.5 6 0 5 ― 115 53 85 60.4
Anne Arundel 96 50 75 50.0 141 87 127 46.0 14 6 5 -16.7 8 4 10 150.0 15 19 24 26.3 0 4 4 0.0 155 98 145 48.0
Baltimore City 164 199 244 22.6 531 702 800 14.0 3 1 2 100.0 0 1 1 0.0 7 3 12 300.0 1 1 3 200.0 566 731 822 12.4
Baltimore. Co. 206 204 309 51.5 363 393 607 54.5 11 5 17 240.0 8 11 11 0.0 29 33 41 24.2 12 10 19 90.0 378 408 672 64.7
Calvert 74 58 60 3.4 94 79 95 20.3 5 2 3 50.0 3 0 0 ― 13 13 21 61.5 0 2 1 -50.0 108 88 100 13.6
Caroline 62 63 45 -28.6 79 81 61 -24.7 1 3 2 -33.3 5 1 0 -100.0 14 9 7 -22.2 2 4 0 -100.0 97 94 73 -22.3
Carroll 91 68 87 27.9 128 126 126 0.0 5 3 9 200.0 4 3 10 233.3 16 19 29 52.6 2 4 1 -75.0 145 134 136 1.5
Cecil 37 39 33 -15.4 57 59 52 -11.9 7 1 1 0.0 3 4 5 25.0 16 15 16 6.7 3 4 2 -50.0 69 73 68 -6.8
Charles 48 72 62 -13.9 78 114 101 -11.4 2 6 5 -16.7 1 1 0 -100.0 8 24 22 -8.3 1 2 3 50.0 88 127 112 -11.8
Dorchester 32 35 29 -17.1 78 52 51 -1.9 2 4 0 -100.0 0 0 0 ― 1 4 3 -25.0 0 0 0 ― 85 59 63 6.8
Frederick 78 61 53 -13.1 152 177 152 -14.1 14 6 2 -66.7 1 6 6 0.0 9 25 21 -16.0 2 3 4 33.3 158 187 162 -13.4
Garrett 21 35 10 -71.4 13 29 10 -65.5 1 0 0 ― 0 1 0 -100.0 4 5 5 0.0 0 0 1 ― 29 46 19 -58.7
Harford 139 74 72 -2.7 161 117 126 7.7 5 2 3 50.0 2 1 4 300.0 16 16 21 31.3 1 2 2 0.0 186 131 140 6.9
Howard 51 59 53 -10.2 90 98 119 21.4 2 2 4 100.0 3 8 6 -25.0 3 6 12 100.0 0 2 3 50.0 100 116 131 12.9
Kent 30 24 28 16.7 50 37 36 -2.7 2 0 0 ― 1 2 2 0.0 2 3 4 33.3 2 0 1 ― 56 38 48 26.3
Montgomery 123 122 140 14.8 190 184 206 12.0 14 12 6 -50.0 3 5 4 -20.0 16 14 11 -21.4 2 2 7 250.0 196 190 211 11.1
Prince George's 123 117 93 -20.5 275 286 306 7.0 7 4 1 -75.0 2 0 0 ― 2 2 3 50.0 0 1 3 ― 304 301 324 7.6
Queen Anne's 47 43 30 -30.2 55 64 49 -23.4 5 3 0 -100.0 1 2 1 -50.0 12 18 9 -50.0 1 2 2 0.0 64 75 50 -33.3
St. Mary's 20 44 46 4.5 45 55 72 30.9 3 2 0 -100.0 0 1 0 -100.0 9 10 9 -10.0 1 0 1 ― 49 60 80 33.3
Somerset 34 30 19 -36.7 56 44 29 -34.1 3 9 2 -77.8 0 0 0 ― 0 3 3 0.0 0 1 2 100.0 61 48 32 -33.3
Talbot 83 64 48 -25.0 86 51 41 -19.6 12 2 2 0.0 0 0 1 ― 10 10 5 -50.0 0 2 0 -100.0 106 73 52 -28.8
Washington 69 75 44 -41.3 135 116 95 -18.1 7 6 1 -83.3 0 1 0 -100.0 3 16 10 -37.5 0 0 1 ― 142 130 99 -23.8
Wicomico 75 128 147 14.8 125 187 211 12.8 9 9 5 -44.4 0 0 0 ― 15 24 10 -58.3 4 2 3 50.0 132 189 214 13.2
Worcester 38 30 38 26.7 58 60 58 -3.3 8 4 7 75.0 1 2 1 -50.0 6 5 4 -20.0 2 0 3 ― 64 63 65 3.2
Out-of-State 25 23 31 34.8 37 31 62 100.0 5 3 5 66.7 5 3 6 100.0 11 14 16 14.3 4 2 12 500.0 45 37 68 83.8
Total 1831 1746 1845 5.7 3180 3278 3673 12.1 154 100 87 -13.0 51 59 68 15.3 246 318 329 3.5 46 50 83 66.0 3498 3549 3971 11.9
Under Age 18 Substance-Problem Admissions to Maryland State-Funded Alcohol and Drug Abuse Treatment by Subdivision of Residence, 2008 to 2010
Total with Substance Problem(s)
Calendar Year of Admission
2009 - 2010
∆
Residence
Benzodiazepine-Related
Calendar Year of Admission 2009 -
2010 ∆
Prescription-Opiate-Related
Calendar Year of Admission
2009 - 2010
∆
Heroin-Related
Calendar Year of Admission
2009 -
2010 ∆
Cocaine-RelatedAlcohol-Related Marijuana-Related
Calendar Year of Admission
2009 - 2010
∆
Calendar Year of Admission
2009 - 2010
∆
Calendar Year of Admission
2009 - 2010
∆
Source: Alcohol and Drug Abuse Administration (ADAA)

2008 2009 2010 2008 2009 2010 2008 2009 2010 2008 2009 2010 2008 2009 2010 2008 2009 2010 2008 2009 2010
Allegany 56 40 38 -5.0 65 52 53 1.9 15 12 8 -33.3 6 3 13 333.3 28 16 22 37.5 5 1 2 100.0 82 65 65 0.0
Anne Arundel 189 181 181 0.0 281 241 272 12.9 51 49 61 24.5 98 100 106 6.0 57 89 108 21.3 11 18 25 38.9 402 366 418 14.2
Baltimore City 95 112 118 5.4 240 241 314 30.3 35 23 27 17.4 40 46 43 -6.5 17 30 30 0.0 10 10 6 -40.0 292 289 365 26.3
Baltimore. Co. 171 175 197 12.6 256 323 364 12.7 36 41 30 -26.8 50 80 85 6.3 31 81 67 -17.3 5 20 29 45.0 341 426 467 9.6
Calvert 112 134 105 -21.6 140 168 150 -10.7 26 23 16 -30.4 25 36 11 -69.4 40 68 113 66.2 1 11 8 -27.3 184 227 196 -13.7
Caroline 26 21 22 4.8 24 32 23 -28.1 5 2 6 200.0 9 3 5 66.7 8 11 14 27.3 1 1 1 0.0 41 43 43 0.0
Carroll 69 70 73 4.3 95 85 100 17.6 13 18 26 44.4 10 25 38 52.0 18 26 20 -23.1 5 4 12 200.0 115 120 133 10.8
Cecil 39 21 32 52.4 58 32 48 50.0 18 4 8 100.0 16 12 14 16.7 25 35 59 68.6 2 5 8 60.0 79 63 88 39.7
Charles 86 78 68 -12.8 88 104 101 -2.9 15 13 10 -23.1 9 15 13 -13.3 16 38 53 39.5 0 6 2 -66.7 122 147 134 -8.8
Dorchester 31 39 37 -5.1 46 53 49 -7.5 17 14 12 -14.3 5 11 6 -45.5 3 6 12 100.0 2 4 3 -25.0 61 74 65 -12.2
Frederick 52 49 74 51.0 80 97 118 21.6 19 19 23 21.1 11 24 31 29.2 6 33 58 75.8 4 3 6 100.0 94 125 157 25.6
Garrett 13 23 25 8.7 22 17 23 35.3 1 3 3 ― 2 2 5 150.0 8 12 9 -25.0 0 2 2 ― 26 32 37 15.6
Harford 40 43 37 -14.0 80 72 50 -30.6 19 17 10 -41.2 24 33 18 -45.5 19 20 30 50.0 1 8 5 -37.5 97 104 83 -20.2
Howard 40 47 64 36.2 55 75 89 18.7 9 6 13 116.7 16 15 18 20.0 6 10 20 100.0 1 2 5 150.0 77 103 124 20.4
Kent 35 35 25 -28.6 45 34 26 -23.5 6 5 4 -20.0 5 3 3 0.0 13 4 4 0.0 8 0 2 ― 56 50 34 -32.0
Montgomery 140 121 82 -32.2 193 154 116 -24.7 35 34 33 -2.9 22 57 49 -14.0 29 43 48 11.6 10 15 16 6.7 228 231 180 -22.1
Prince George's 77 85 83 -2.4 155 182 142 -22.0 8 11 11 0.0 11 11 18 63.6 14 15 11 -26.7 2 2 2 0.0 176 205 175 -14.6
Queen Anne's 77 80 51 -36.3 72 95 69 -27.4 14 15 9 -40.0 10 22 16 -27.3 15 27 27 0.0 0 6 2 -66.7 94 121 88 -27.3
St. Mary's 53 46 54 17.4 73 64 74 15.6 20 11 8 -27.3 6 6 4 -33.3 22 26 35 34.6 2 1 2 100.0 96 92 104 13.0
Somerset 13 16 9 -43.8 25 30 25 -16.7 2 5 1 -80.0 0 1 0 -100.0 3 3 5 66.7 0 0 1 ― 28 35 26 -25.7
Talbot 36 38 44 15.8 37 35 46 31.4 8 5 7 40.0 1 1 0 -100.0 2 5 8 60.0 0 2 0 -100.0 45 49 67 36.7
Washington 104 99 57 -42.4 109 130 101 -22.3 21 25 7 -72.0 12 18 12 -33.3 12 25 28 12.0 1 1 2 100.0 158 158 119 -24.7
Wicomico 57 65 66 1.5 84 105 106 1.0 27 30 17 -43.3 7 15 17 13.3 18 45 38 -15.6 4 8 8 0.0 111 131 139 6.1
Worcester 48 45 31 -31.1 53 44 54 22.7 15 14 14 0.0 4 7 11 57.1 15 14 16 14.3 1 4 9 125.0 69 65 72 10.8
Out-of-State 31 43 38 -11.6 42 63 56 -11.1 12 13 8 -38.5 9 19 19 0.0 14 42 52 23.8 7 12 15 25.0 62 104 96 -7.7
Total 1690 1706 1611 -5.6 2418 2528 2569 1.6 447 412 372 -9.7 408 565 555 -1.8 439 724 887 22.5 83 146 173 18.5 3136 3425 3475 1.5
2009-2010 ∆
Calendar Year of Admission
2009-2010
∆
Calendar Year of Admission 2009-
2010 ∆
Calendar Year of Admission 2009-
2010 ∆
Calendar Year of Admission
Age 18 to 20 Substance-Problem Admissions to Maryland State-Funded Alcohol and Drug Abuse Treatment by Subdivision of Residence, 2008 to 2010
Residence
Alcohol-Related Marijuana-Related Cocaine-Related Heroin-RelatedPrescription-Opiate-
RelatedBenzodiazepine-Related
Total with Substance Problem(s)
Calendar Year of Admission
2009-2010
∆
Calendar Year of Admission
2009-2010
∆
Calendar Year of Admission
2009-2010
∆
Source: Alcohol and Drug Abuse Administration (ADAA)

2008 2009 2010 2008 2009 2010 2008 2009 2010 2008 2009 2010 2008 2009 2010 2008 2009 2010 2008 2009 2010
Allegany 484 490 451 -8.0 289 305 325 6.6 208 177 177 0.0 88 85 113 32.9 177 180 221 22.8 49 56 60 7.1 691 686 701 2.2
Anne Arundel 1595 1541 1723 11.8 701 773 829 7.2 911 769 723 -6.0 711 712 792 11.2 339 445 551 23.8 96 109 204 87.2 2569 2535 2933 15.7
Baltimore City 4125 4385 4645 5.9 2014 2074 2350 13.3 6485 5801 5684 -2.0 7858 7456 7404 -0.7 476 671 836 24.6 235 312 356 14.1 11374 11151 11445 2.6
Baltimore. Co. 1642 1631 1478 -9.4 785 925 828 -10.5 1270 1060 936 -11.7 1096 1241 1127 -9.2 497 662 666 0.6 221 282 317 12.4 3041 3189 3000 -5.9
Calvert 625 749 794 6.0 339 442 449 1.6 257 304 290 -4.6 71 154 112 -27.3 173 260 331 27.3 27 46 57 23.9 819 1055 1136 7.7
Caroline 204 227 238 4.8 118 116 128 10.3 95 72 74 2.8 29 35 43 22.9 28 47 77 63.8 6 11 16 45.5 282 313 353 12.8
Carroll 396 456 560 22.8 171 216 281 30.1 285 268 317 18.3 235 244 309 26.6 84 106 173 63.2 37 49 82 67.3 616 750 931 24.1
Cecil 439 374 424 13.4 212 175 224 28.0 251 178 192 7.9 145 123 111 -9.8 117 142 300 111.3 39 41 61 48.8 663 595 730 22.7
Charles 768 711 622 -12.5 373 363 308 -15.2 307 292 212 -27.4 42 78 79 1.3 106 145 195 34.5 13 21 28 33.3 921 967 847 -12.4
Dorchester 318 353 388 9.9 202 255 258 1.2 205 233 258 10.7 51 78 68 -12.8 29 48 48 0.0 8 18 20 11.1 432 504 560 11.1
Frederick 706 679 714 5.2 338 358 421 17.6 411 369 351 -4.9 135 183 229 25.1 119 220 263 19.5 44 55 89 61.8 972 1006 1103 9.6
Garrett 214 231 247 6.9 81 93 98 5.4 45 38 30 -21.1 21 46 43 -6.5 40 57 62 8.8 15 26 22 -15.4 257 294 304 3.4
Harford 334 421 432 2.6 230 250 266 6.4 239 202 221 9.4 199 141 202 43.3 102 131 239 82.4 18 50 52 4.0 630 700 857 22.4
Howard 283 382 470 23.0 110 148 239 61.5 140 135 155 14.8 91 124 137 10.5 33 63 88 39.7 14 19 35 84.2 426 563 694 23.3
Kent 224 196 216 10.2 126 120 105 -12.5 117 96 95 -1.0 27 22 30 36.4 44 48 58 20.8 11 13 21 61.5 312 278 289 4.0
Montgomery 1640 1432 1175 -17.9 777 698 538 -22.9 945 873 616 -29.4 249 331 318 -3.9 203 256 332 29.7 58 101 110 8.9 2297 2194 1822 -17.0
Prince George's 1269 1334 1270 -4.8 840 905 746 -17.6 884 780 621 -20.4 179 166 165 -0.6 71 93 99 6.5 17 26 25 -3.8 1983 2076 1922 -7.4
Queen Anne's 319 466 375 -19.5 156 222 207 -6.8 141 199 141 -29.1 72 122 92 -24.6 74 99 105 6.1 22 23 25 8.7 435 609 543 -10.8
St. Mary's 640 628 674 7.3 265 259 296 14.3 330 326 320 -1.8 46 54 53 -1.9 136 182 240 31.9 19 15 39 160.0 843 901 995 10.4
Somerset 202 214 174 -18.7 110 121 115 -5.0 103 119 75 -37.0 26 37 30 -18.9 32 52 58 11.5 2 7 26 271.4 280 316 276 -12.7
Talbot 232 317 279 -12.0 132 120 144 20.0 117 114 114 0.0 44 31 46 48.4 20 26 37 42.3 13 16 13 -18.8 320 390 376 -3.6
Washington 633 690 623 -9.7 367 451 401 -11.1 333 352 267 -24.1 125 151 121 -19.9 105 160 170 6.3 20 32 28 -12.5 888 1042 932 -10.6
Wicomico 626 615 722 17.4 356 396 501 26.5 440 391 443 13.3 129 154 184 19.5 119 168 219 30.4 43 60 70 16.7 923 960 1130 17.7
Worcester 592 500 457 -8.6 235 232 204 -12.1 281 212 167 -21.2 53 79 74 -6.3 76 106 83 -21.7 22 20 27 35.0 731 655 614 -6.3
Out-of-State 679 649 667 2.8 324 379 341 -10.0 479 387 371 -4.1 227 229 221 -3.5 181 252 339 34.5 75 122 136 11.5 1167 1188 1191 0.3
Total 19189 19671 19818 0.7 9651 10396 10602 2.0 15279 13747 12850 -6.5 11949 12076 12103 0.2 3381 4619 5790 25.4 1124 1530 1919 25.4 33872 34917 35684 2.2
2009-
2010 ∆
Calendar Year of Admission
2009-2010
∆
Calendar Year of Admission
2009-
2010 ∆
Calendar Year of Admission
2009-2010
∆
Calendar Year of Admission
Age 21 and Older Substance-Problem Admissions to Maryland State-Funded Alcohol and Drug Abuse Treatment by Subdivision of Residence, 2008 to 2010
Residence
Alcohol-Related Marijuana-Related Cocaine-Related Heroin-RelatedPrescription-Opiate-
RelatedBenzodiazepine-Related
Total with Substance Problem(s)
Calendar Year of Admission
2009-2010
∆
Calendar Year of Admission
2009-2010
∆
Calendar Year of Admission
2009-2010
∆
Source: Alcohol and Drug Abuse Administration (ADAA)

Alcohol-Related State-Funded Treatment Admission Rate* (per 100,000 Population) by Residence, FY 2010
1648.7
1448.5
1391.5
1366.3
1341.3
1303.6
1157.5
1065.1
1052.3
1008.3
928.9
924.2
904.8
717.2
691.4
561.8
487.0
472.6
463.9
436.2
310.3
283.2
238.5
226.5
196.2
Dorchester
Kent
Queen Anne's
Talbot
Calvert
Worcester
Caroline
Garrett
Wicomico
Somerset
St. Mary's
Baltimore City
Allegany
Charles
Washington
Cecil
State Total
Frederick
Carroll
Anne Arundel
Baltimore Co.
Harford
Howard
Prince George's
Montgomery
0.0 500.0 1000.0 1500.0 2000.0
*Rates calculated using estimates for the population over age 14 for July 1, 2009 from the Maryland Department of Planning.

Marijuana-Related State-Funded Treatment Admission Rate* (per 100,000 Population) by Residence, FY 2010
1286.5
1036.6
1022.3
952.2
894.2
871.0
840.3
741.5
735.7
725.5
623.3
575.4
534.6
509.5
493.0
371.6
349.8
336.8
334.9
269.0
266.4
220.7
199.7
169.3
118.2
Dorchester
Calvert
Queen Anne's
Kent
Wicomico
Caroline
Worcester
Somerset
Talbot
Allegany
Baltimore City
Washington
Garrett
St. Mary's
Charles
Frederick
State Total
Cecil
Carroll
Anne Arundel
Baltimore Co.
Harford
Prince George's
Howard
Montgomery
0.0 500.0 1000.0 1500.0
*Rates calculated using estimates for the population over age 14 for July 1, 2009 from the Maryland Department of Planning.
Cocaine-Related State-Funded Treatment Admission Rate* (per 100,000 Population) by Residence, FY 2010
1120.0
969.6
557.1
525.2
516.2
501.8
475.0
465.7
436.7
390.8
346.9
313.5
294.5
279.3
253.7
244.0
223.7
219.4
192.4
162.1
127.1
126.5
106.2
101.5
72.8
Baltimore City
Dorchester
Wicomico
Kent
Calvert
Worcester
Queen Anne's
Somerset
St. Mary's
Talbot
Caroline
Allegany
State Total
Washington
Charles
Carroll
Cecil
Frederick
Anne Arundel
Baltimore Co.
Harford
Garrett
Prince George's
Montgomery
Howard
0.0 200.0 400.0 600.0 800.0 1000.0 1200.0 1400.0
*Rates calculated using estimates for the population over age 14 for July 1, 2009 from the Maryland Department of Planning.
Heroin-Related State-Funded Treatment Admission Rate* (per 100,000 Population) by Residence, FY 2010
1471.6
405.3
324.5
281.5
247.0
244.9
238.4
234.1
220.0
212.2
202.5
192.3
190.4
188.5
151.6
147.8
146.6
145.6
144.7
117.8
90.5
71.9
70.3
50.7
28.3
Baltimore City
Queen Anne's
Dorchester
State Total
Carroll
Worcester
Wicomico
Calvert
Anne Arundel
Garrett
Baltimore Co.
Allegany
Kent
Caroline
Cecil
Talbot
Frederick
Washington
Somerset
Harford
Charles
Howard
St. Mary's
Montgomery
Prince George's
0.0 500.0 1000.0 1500.0
*Rates calculated using estimates for the population over age 14 for July 1, 2009 from the Maryland Department of Planning.

Prescription-Opiate-Related State-Funded Treatment Admission Rate* (per 100,000 Population) by Residence, FY 2010
616.3
395.0
394.3
340.5
323.2
320.5
315.8
293.8
292.9
280.5
225.0
222.6
217.0
185.5
174.3
149.6
146.6
139.2
131.5
128.1
124.1
123.0
48.5
45.7
14.6
Calvert
Queen Anne's
Allegany
Cecil
Kent
Caroline
St. Mary's
Garrett
Worcester
Wicomico
Charles
Dorchester
Somerset
Frederick
Washington
Anne Arundel
Baltimore City
Carroll
State Total
Talbot
Baltimore Co.
Harford
Howard
Montgomery
Prince George's
0.0 100.0 200.0 300.0 400.0 500.0 600.0 700.0
*Rates calculated using estimates for the population over age 14 for July 1, 2009 from the Maryland Department of Planning.

Benzodiazepine-Related State-Funded Treatment Admission Rate* (per 100,000 Population) by Residence,
FY 2010
122.4
121.2
113.1
105.6
95.9
90.4
86.4
82.6
78.3
69.8
64.1
62.8
58.6
52.5
51.7
46.7
40.2
39.0
35.8
34.6
27.9
22.4
16.7
14.8
3.8
Garrett
Kent
Allegany
Dorchester
Calvert
Somerset
Worcester
Queen Anne's
Cecil
Wicomico
Caroline
Baltimore City
Carroll
Talbot
Baltimore Co.
Frederick
Anne Arundel
State Total
St. Mary's
Harford
Washington
Charles
Montgomery
Howard
Prince George's
0.0 20.0 40.0 60.0 80.0 100.0 120.0 140.0
*Rates calculated using estimates for the population over age 14 for July 1, 2009 from the Maryland Department of Planning.

State-Funded Treatment Admission Rate* (per 100,000 Population) by Residence, FY 2010
2618.3
2381.7
2077.6
2049.8
2030.9
1911.0
1802.3
1717.7
1685.7
1550.8
1489.6
1474.2
1371.8
1088.3
1051.5
943.3
908.4
872.8
808.1
779.2
637.8
541.0
393.0
388.9
311.7
Dorchester
Baltimore City
Kent
Queen Anne's
Calvert
Worcester
Caroline
Talbot
Wicomico
Somerset
Garrett
St. Mary's
Allegany
Washington
Charles
Cecil
State Total
Carroll
Frederick
Anne Arundel
Baltimore Co.
Harford
Howard
Prince George's
Montgomery
0.0 500.0 1000.0 1500.0 2000.0 2500.0 3000.0
*Rates calculated using estimates for the population over age 14 for July 1, 2009 from the Maryland Department of Planning.

HIV Surveillance Data
Infectious Disease and Environmental Health Administration, Maryland
Department of Health and Mental Hygiene (DHMH)

• Physicians are required by law to report patients with HIV or AIDS diagnoses and infants born to HIV positive mothers.
• Hospitals, nursing homes, hospice facilities, medical clinics in correctional facilities, inpatient psychiatric facilities and inpatient drug rehabilitation facilities are required to report patients in their care with HIV or AIDS diagnoses.
• Laboratory directors are required to report patients with laboratory results indicating HIV infection.

• About 24 percent of Maryland HIV cases diagnosed in 2008 were categorized as having been exposed through injecting drug use; this percentage has declined steadily from about 47 percent of those diagnosed in 2001.
• About 40 percent of those living with an HIV diagnosis in 2008 were reported as having been exposed through injecting drug use.


Jurisdiction Population% in Juris.
Reported HIV
Diagnosis 2008
% in Juris.
% IDU
Rate*
Reported AIDS
Diagnosis 2008
% in Juris.
% IDU
Rate*Living
with HIV 2008**
% in Juris.
% IDU
Rate*
Allegany 72,658 1.3 4 0.2 ― 5.5 3 0.3 ― 4.1 71 0.2 ― 97.7Anne Arundel 515,328 9.1 107 4.1 ― 20.8 51 4.9 ― 9.9 984 3.4 ― 190.9Baltimore City 638,091 11.3 932 36.0 33.1 146.1 404 38.9 47.8 63.3 13155 45.3 33.7 2,061.6Baltimore Co. 788,454 13.9 216 8.4 ― 27.4 86 8.3 ― 10.9 2205 7.6 ― 279.7Calvert 88,560 1.6 9 0.3 ― 10.2 6 0.6 ― 6.8 93 0.3 ― 105.0Caroline 33,279 0.6 3 0.1 ― 9.0 3 0.3 ― 9.0 57 0.2 ― 171.3Carroll 169,794 3.0 8 0.3 ― 4.7 3 0.3 ― 1.8 116 0.4 ― 68.3Cecil 99,949 1.8 6 0.2 ― 6.0 5 0.5 ― 5.0 109 0.4 ― 109.1Charles 141,444 2.5 32 1.2 ― 22.6 15 1.4 ― 10.6 283 1.0 ― 200.1Dorchester 32,017 0.6 2 0.1 ― 6.2 4 0.4 ― 12.5 99 0.3 ― 309.2Frederick 226,525 4.0 38 1.5 ― 16.8 14 1.3 ― 6.2 285 1.0 ― 125.8Garrett 29,658 0.5 0 0.0 ― 0.0 0 0.0 ― 0.0 10 0.0 ― 33.7Harford 241,393 4.3 39 1.5 ― 16.2 12 1.2 ― 5.0 371 1.3 ― 153.7Howard 277,187 4.9 31 1.2 ― 11.2 12 1.2 ― 4.3 395 1.4 ― 142.5Kent 20,269 0.4 2 0.1 ― 9.9 0 0.0 ― 0.0 37 0.1 ― 182.5 Montgomery 953,685 16.9 369 14.3 5.2 38.7 120 11.6 4.5 12.6 3008 10.4 12.5 315.4Prince George's 830,514 14.7 638 24.7 9.2 76.8 230 22.2 12.5 27.7 5463 18.8 16.9 657.8Queen Anne's 47,465 0.8 3 0.1 ― 6.3 2 0.2 ― 4.2 39 0.1 ― 82.2St. Mary's 101,664 1.8 9 0.3 ― 8.9 5 0.5 ― 4.9 97 0.3 ― 95.4Somerset 26,131 0.5 2 0.1 ― 7.7 2 0.2 ― 7.7 47 0.2 ― 179.9Talbot 36,112 0.6 6 0.2 ― 16.6 4 0.4 ― 11.1 58 0.2 ― 160.6Washington 145,450 2.6 42 1.6 ― 28.9 13 1.3 ― 8.9 292 1.0 ― 200.8Wicomico 93,859 1.7 21 0.8 ― 22.4 13 1.3 ― 13.9 229 0.8 ― 244.0Worcester 49,169 0.9 7 0.3 ― 14.2 4 0.4 ― 8.1 81 0.3 ― 164.7Corrections ― ― 60 ― ― ― 27 ― ― ― 1437 ― ― ―State Total 5,658,655 100.0 2586 100.0 23.6 45.7 1038 100.0 36.8 18.3 29021 100.0 40.0 512.9
HIV and AIDS Diagnosis and Living with HIV Cases by Maryland Jurisdiction, 2008
*Rates per 100,000 population, based on population estimates for July 1, 2008 from the Maryland Department of Planning. **Number of living cases on December 31, 2008. SOURCE: Adapted by ADAA from the Center for HIV Surveillance and Epidemiology, Infectios Disease and Environmental Health Administration Maryland HIV/AIDS Epidemiological Profile, Fourth Quarter, 2009.

Reported HIV Diagnosis Percentage Trends by RaceIDU Exposure2000 to 2009
2000 2001 2002 2003 2004 2005 2006 2007 2008 20090
20
40
60
80
100
NH Black
NH White
Source: Maryland Infectious Disease and Environmental Health Administration

Primary Inhalation and Injection of Heroin-Related Admissions to Maryland State-Funded Alcohol and Drug Abuse Treatment Programs
CY 2007 to CY 2010
2007 2008 2009 20100
2
4
6
8Thousands
Inhalation
Injection
Source: Alcohol and Drug Abuse Administration

Heroin-Related Admissions to State-Funded Alcohol and Drug Abuse Treatment by Race and Primary Route of Administration
FY 2007 to FY 2010
2007 2008 2009 20100
1
2
3
4
5
6Thousands
NH Black Inhalers
NH White Inhalers
NH Black Injectors
NH White Injectors
Source: Maryland Alcohol and Drug Abuse Administration

Heroin-Related Admissions to Maryland State-Funded TreatmentPrimary Route of Administration by Race and Age
CY 2010
1415161718192021222324252627282930313233343536373839404142434445464748495051525354555657585960616263646566676869707172737482
Age at Admission
0
50
100
150
200
250
300
350
White Injectors
Black Injectors
White Inhalers
Black Inhalers
(14 to 82)Source: Alcohol and Drug Abuse Administration
Related Documents