States of Jersey Police Performance Briefing January – March 2020 1

Welcome message from author
This document is posted to help you gain knowledge. Please leave a comment to let me know what you think about it! Share it to your friends and learn new things together.
Transcript
States of Jersey PolicePerformance Briefing
January – March 2020
1

1. Jersey is safe and crime is reduced
• Recorded crime per 1,000 population (SIs 1.1, 1.2)
• All recorded crime• Incident response times (KPIs 1.1, 1.2)
• Reoffenders (within-year) (KPI 1.4)
• Offences against the person and domestic abuse (KPIs 1.3, 1.6, 1.7)
• Intelligence and RTCs (KPIs 1.8, 1.9)
• Investigation times (KPIs 1.10, 1.11, 1.12, 1.13)
• OCGs, Financial Crime and NSIR (KPIs 1.14-1.18)
• Home Office outcomes and sanction detections (KPIs 1.19, 1.20; KPIs 1.21-1.27)

Recorded crime per 1,000 population and neighbourhood safety
Measure Strategic indicators Jan-Mar 2019 Jan-Mar 2020 Diff. Apr 18 - Mar 19 Apr 19 - Mar 20 Diff 2017 2018 2019 2020 vs. 2017-19 av.SI 1.1 % change in overall number of recorded crimes per 1,000 population 6.2 6.8 9.3% 30.6 32.3 5.6% 7.4 6.4 6.2 2.0%
SI 1.2 % resident population that feel safe in their neighbourhood 2% points
Trend analysis (YTD)Year-to-Date comparison Rolling 12 month comparison
94% (2016) 96% (2018)
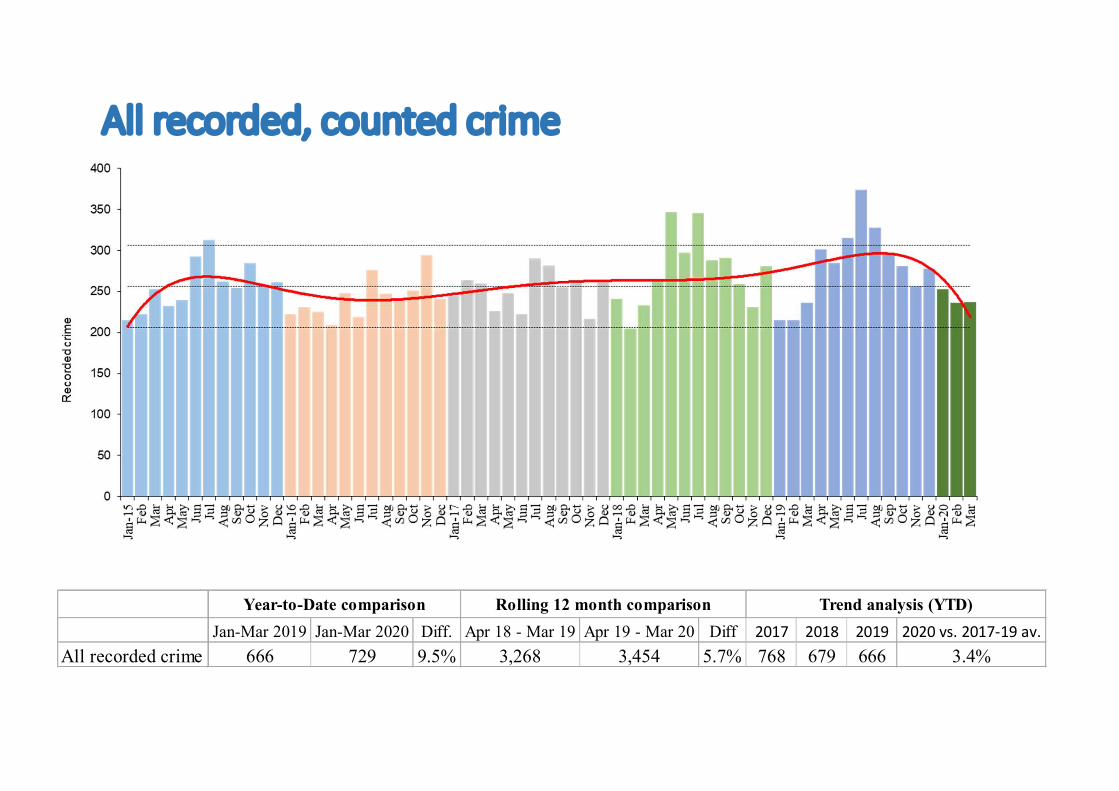
All recorded, counted crime
Jan-Mar 2019 Jan-Mar 2020 Diff. Apr 18 - Mar 19 Apr 19 - Mar 20 Diff 2017 2018 2019 2020 vs. 2017-19 av.All recorded crime 666 729 9.5% 3,268 3,454 5.7% 768 679 666 3.4%
Year-to-Date comparison Rolling 12 month comparison Trend analysis (YTD)
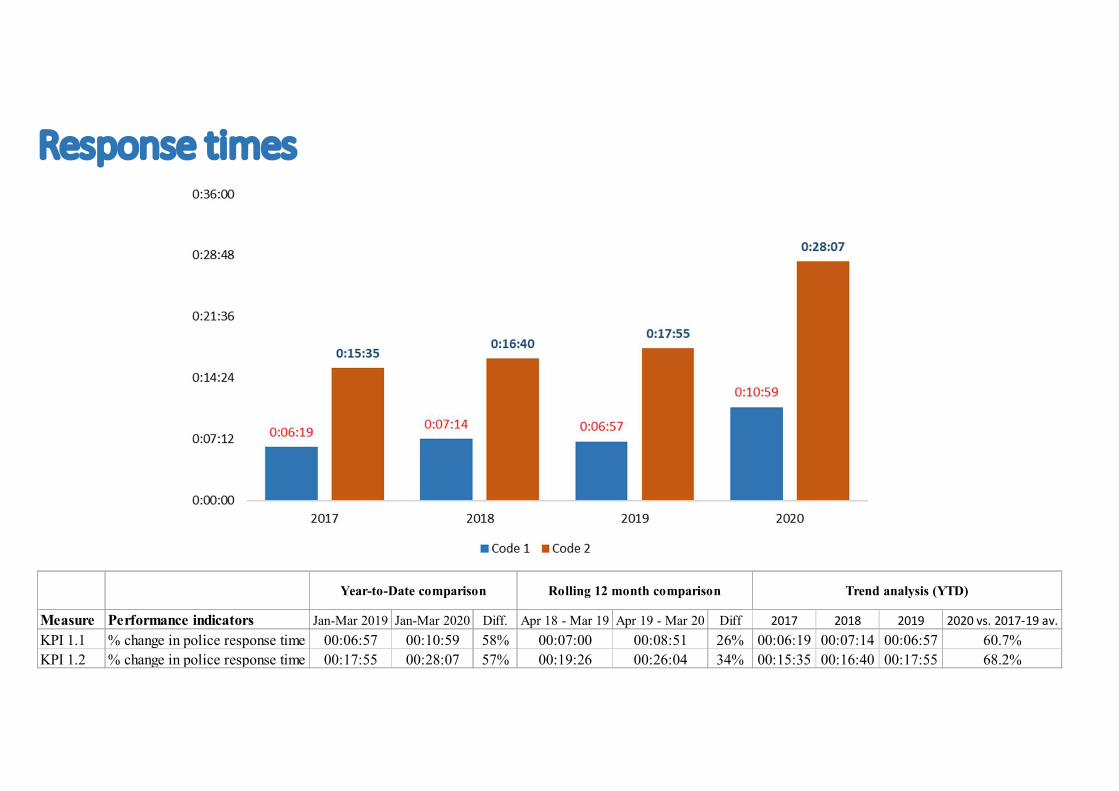
Response times
Measure Performance indicators Jan-Mar 2019 Jan-Mar 2020 Diff. Apr 18 - Mar 19 Apr 19 - Mar 20 Diff 2017 2018 2019 2020 vs. 2017-19 av.KPI 1.1 % change in police response time to Code 1 responses00:06:57 00:10:59 58% 00:07:00 00:08:51 26% 00:06:19 00:07:14 00:06:57 60.7%KPI 1.2 % change in police response time to Code 2 responses00:17:55 00:28:07 57% 00:19:26 00:26:04 34% 00:15:35 00:16:40 00:17:55 68.2%
Year-to-Date comparison Rolling 12 month comparison Trend analysis (YTD)

Reoffenders
Performance indicators Jan-Mar 2019 Jan-Mar 2020 Diff. Apr 18 - Mar 19 Apr 19 - Mar 20 Diff 2017 2018 2019 2020 vs. 2017-19 av.KPI 1.4 % change in re-offending 17 12 -29% 123 112 -9% 22 22 17 -40.9%
Year-to-Date comparison Rolling 12 month comparison Trend analysis (YTD)

Offences against the person, domestic incidents and domestic crime
Measure Performance indicators Jan-Mar 2019 Jan-Mar 2020 Diff. Apr 18 - Mar 19 Apr 19 - Mar 20 Diff 2017 2018 2019 2020 vs. 2017-19 av.KPI 1.3 % change in recorded crimes involving offences against the person 326 356 9% 1,595 1,715 8% 328 282 326 14.1%KPI 1.6 % change in recorded domestic abuse incidents 299 341 14% 1,212 1,369 13% 225 213 299 38.8%KPI 1.7 % change in recorded domestic crime 99 113 14% 492 531 8% 90 73 99 29.4%
Year-to-Date comparison Rolling 12 month comparison Trend analysis (YTD)
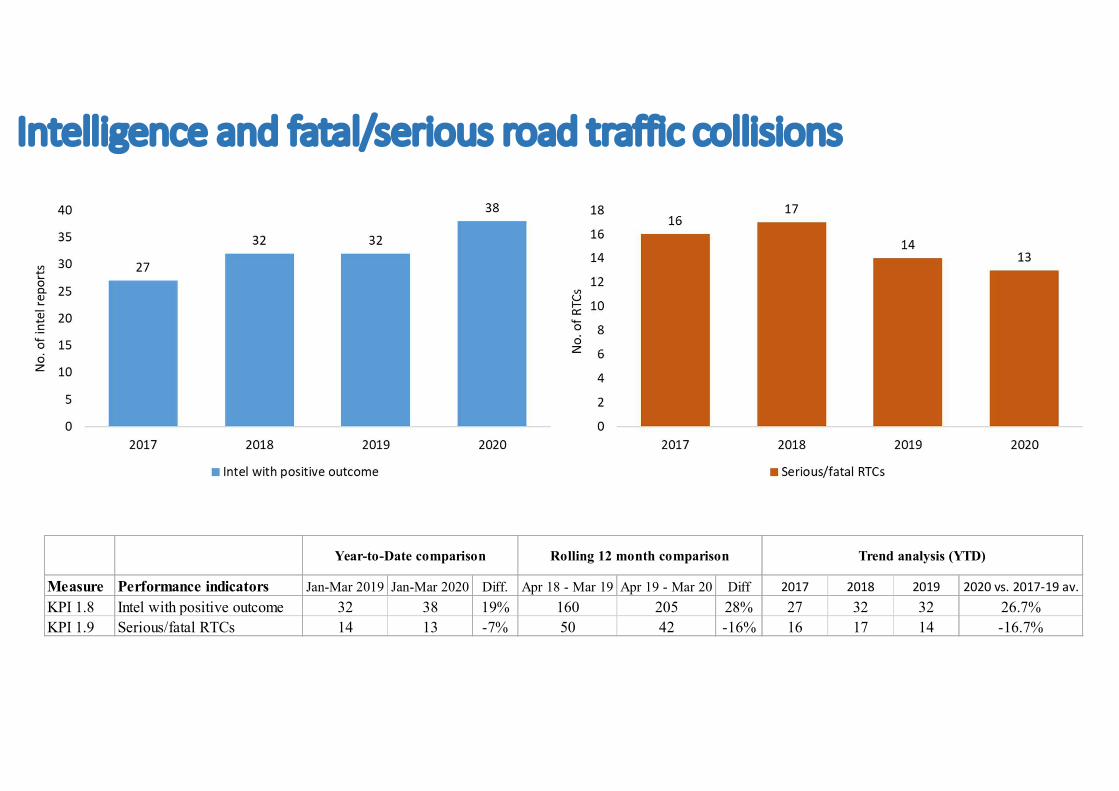
Intelligence and fatal/serious road traffic collisions
Measure Performance indicators Jan-Mar 2019 Jan-Mar 2020 Diff. Apr 18 - Mar 19 Apr 19 - Mar 20 Diff 2017 2018 2019 2020 vs. 2017-19 av.KPI 1.8 Intel with positive outcome 32 38 19% 160 205 28% 27 32 32 26.7%KPI 1.9 Serious/fatal RTCs 14 13 -7% 50 42 -16% 16 17 14 -16.7%
Year-to-Date comparison Rolling 12 month comparison Trend analysis (YTD)
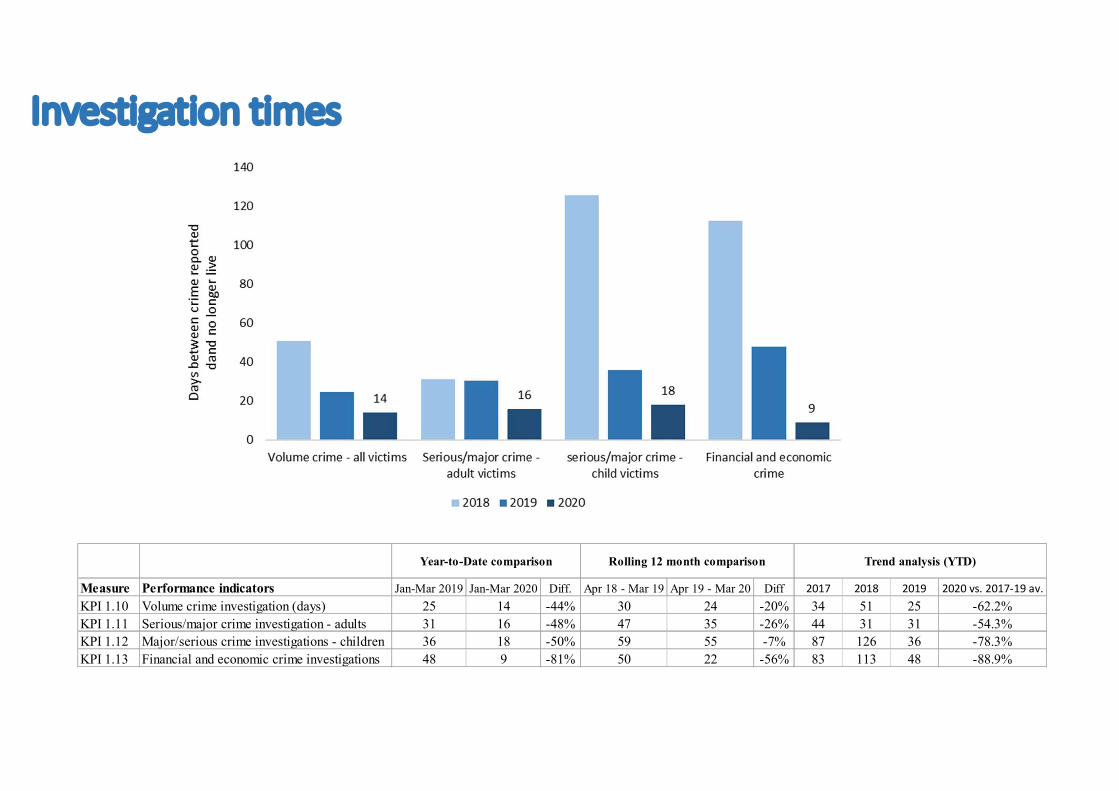
Investigation times
Measure Performance indicators Jan-Mar 2019 Jan-Mar 2020 Diff. Apr 18 - Mar 19 Apr 19 - Mar 20 Diff 2017 2018 2019 2020 vs. 2017-19 av.KPI 1.10 Volume crime investigation (days) 25 14 -44% 30 24 -20% 34 51 25 -62.2%KPI 1.11 Serious/major crime investigation - adults 31 16 -48% 47 35 -26% 44 31 31 -54.3%KPI 1.12 Major/serious crime investigations - children 36 18 -50% 59 55 -7% 87 126 36 -78.3%KPI 1.13 Financial and economic crime investigations 48 9 -81% 50 22 -56% 83 113 48 -88.9%
Year-to-Date comparison Rolling 12 month comparison Trend analysis (YTD)
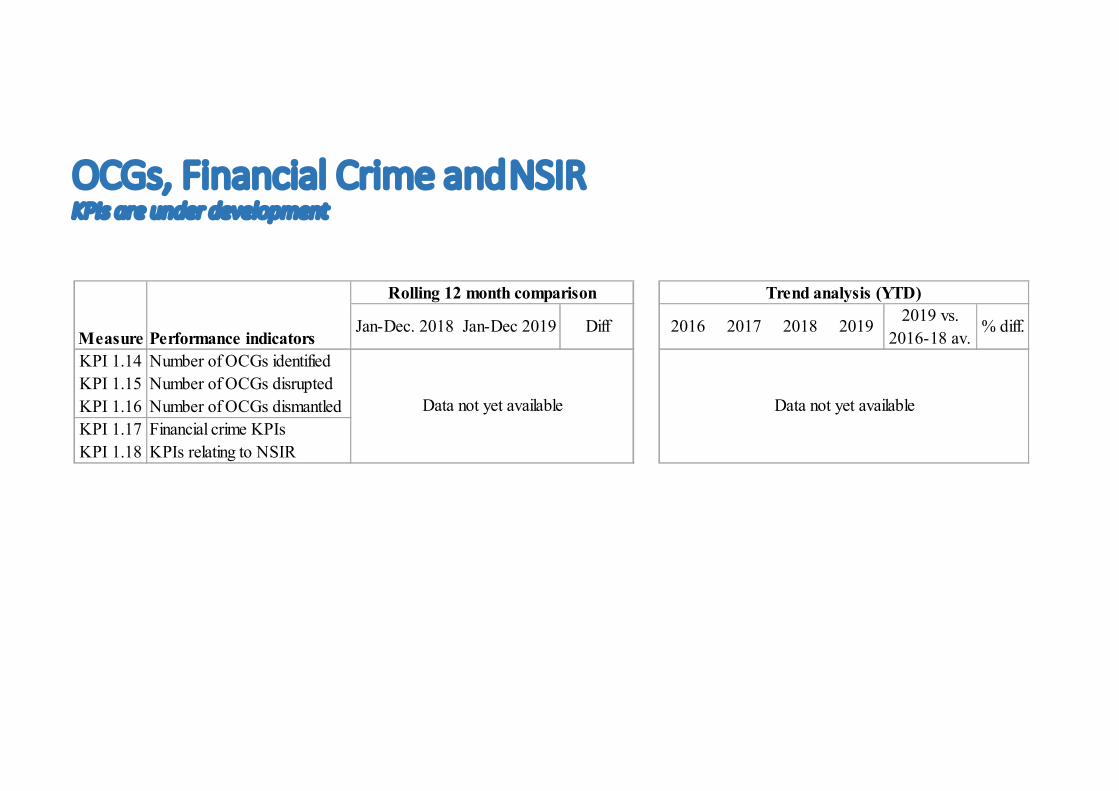
OCGs, Financial Crime andNSIRKPIs are under development
Jan-Dec. 2018 Jan-Dec 2019 Diff 2016 2017 2018 20192019 vs.
2016-18 av.% diff.
KPI 1.14 Number of OCGs identifiedKPI 1.15 Number of OCGs disruptedKPI 1.16 Number of OCGs dismantledKPI 1.17 Financial crime KPIsKPI 1.18 KPIs relating to NSIR
Measure Performance indicators
Rolling 12 month comparison Trend analysis (YTD)
Data not yet available Data not yet available
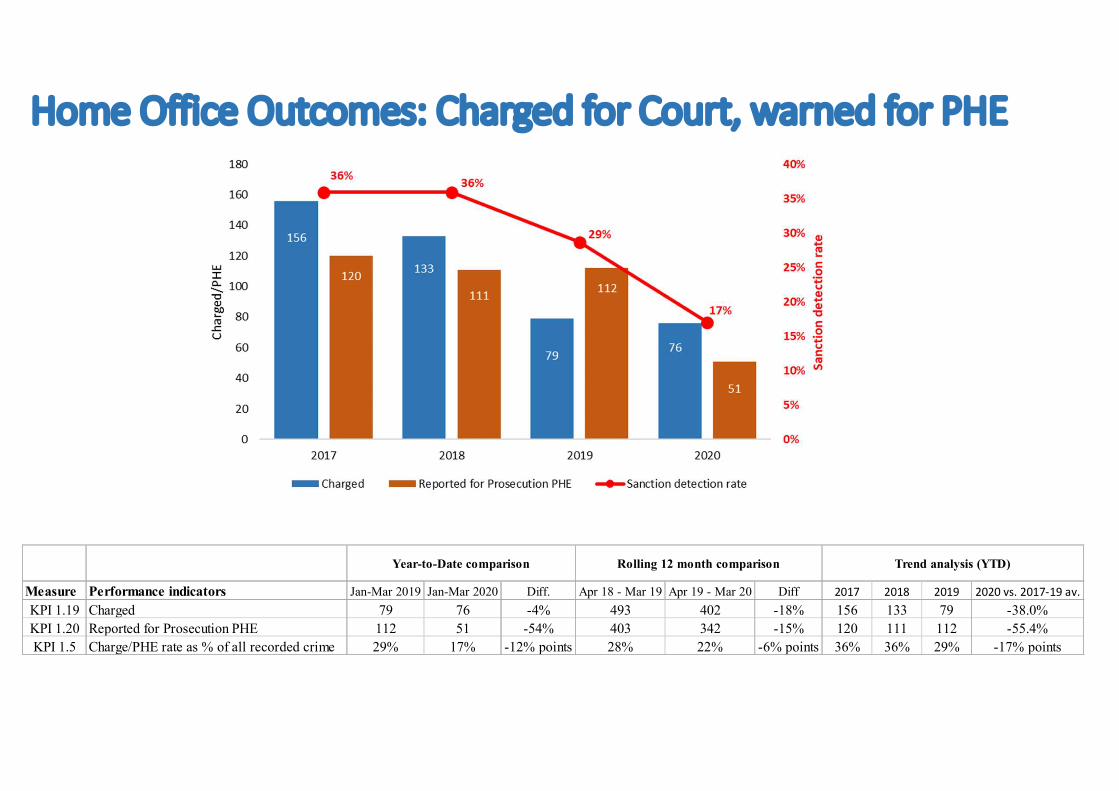
Home Office Outcomes: Charged for Court, warned for PHE
Measure Performance indicators Jan-Mar 2019 Jan-Mar 2020 Diff. Apr 18 - Mar 19 Apr 19 - Mar 20 Diff 2017 2018 2019 2020 vs. 2017-19 av.KPI 1.19 Charged 79 76 -4% 493 402 -18% 156 133 79 -38.0%KPI 1.20 Reported for Prosecution PHE 112 51 -54% 403 342 -15% 120 111 112 -55.4%KPI 1.5 Charge/PHE rate as % of all recorded crime 29% 17% -12% points 28% 22% -6% points 36% 36% 29% -17% points
Year-to-Date comparison Rolling 12 month comparison Trend analysis (YTD)
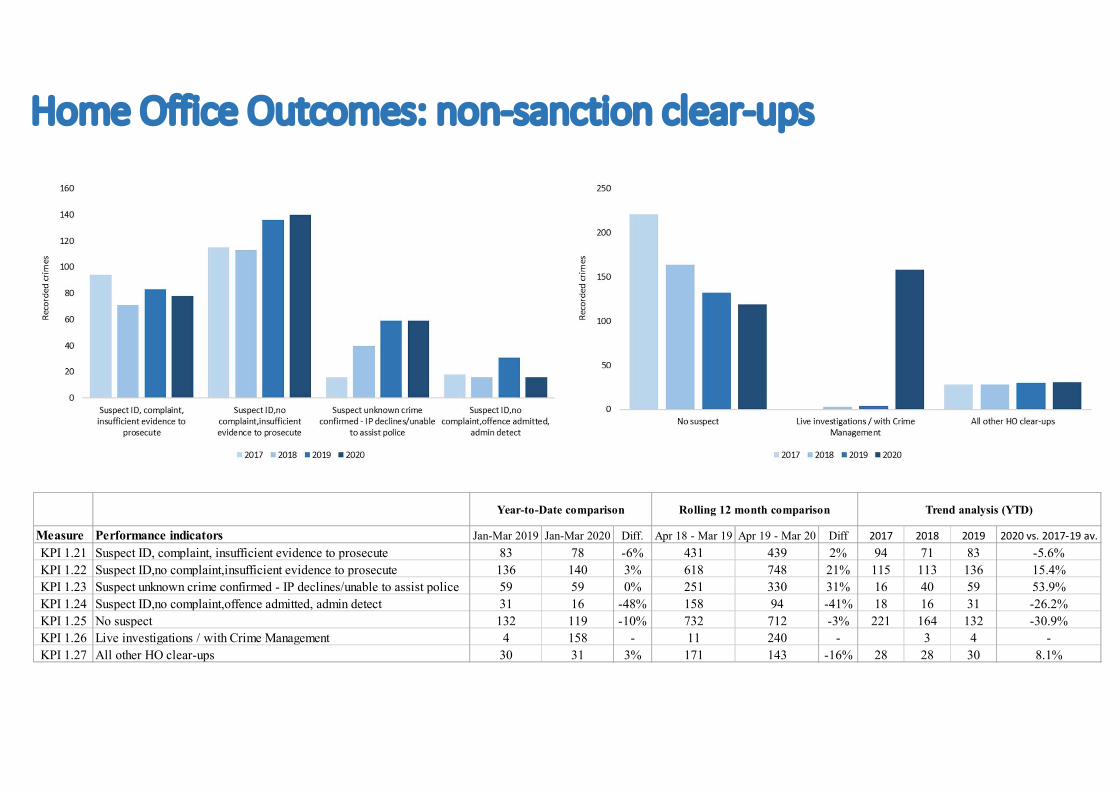
Home Office Outcomes: non-sanction clear-ups
Measure Performance indicators Jan-Mar 2019 Jan-Mar 2020 Diff. Apr 18 - Mar 19 Apr 19 - Mar 20 Diff 2017 2018 2019 2020 vs. 2017-19 av.KPI 1.21 Suspect ID, complaint, insufficient evidence to prosecute 83 78 -6% 431 439 2% 94 71 83 -5.6%KPI 1.22 Suspect ID,no complaint,insufficient evidence to prosecute 136 140 3% 618 748 21% 115 113 136 15.4%KPI 1.23 Suspect unknown crime confirmed - IP declines/unable to assist police 59 59 0% 251 330 31% 16 40 59 53.9%KPI 1.24 Suspect ID,no complaint,offence admitted, admin detect 31 16 -48% 158 94 -41% 18 16 31 -26.2%KPI 1.25 No suspect 132 119 -10% 732 712 -3% 221 164 132 -30.9%KPI 1.26 Live investigations / with Crime Management 4 158 - 11 240 - 3 4 -KPI 1.27 All other HO clear-ups 30 31 3% 171 143 -16% 28 28 30 8.1%
Year-to-Date comparison Rolling 12 month comparison Trend analysis (YTD)
2. Victims of crime and vulnerable people are protected
• Victims supporting complaint (SIs 2.1, 2.2; kPIs 2.1, 2.2)
• Repeat victims (KPIs 2.3-2.7)
• Missing persons, mental health incidents and protection notices (KPIs 2.8-2.12)
• Children as victims of crime (KPIs 2.13-2.15)
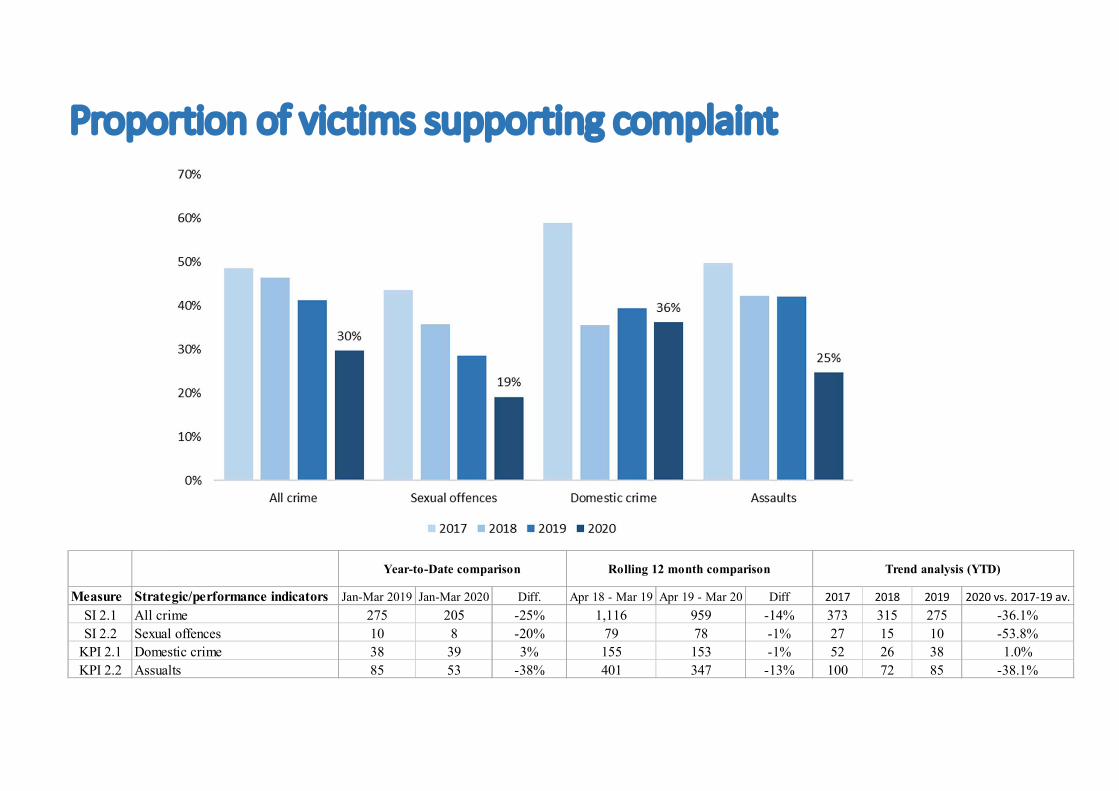
Proportion of victims supporting complaint
Measure Strategic/performance indicators Jan-Mar 2019 Jan-Mar 2020 Diff. Apr 18 - Mar 19 Apr 19 - Mar 20 Diff 2017 2018 2019 2020 vs. 2017-19 av.SI 2.1 All crime 275 205 -25% 1,116 959 -14% 373 315 275 -36.1%SI 2.2 Sexual offences 10 8 -20% 79 78 -1% 27 15 10 -53.8%
KPI 2.1 Domestic crime 38 39 3% 155 153 -1% 52 26 38 1.0%KPI 2.2 Assualts 85 53 -38% 401 347 -13% 100 72 85 -38.1%
Year-to-Date comparison Rolling 12 month comparison Trend analysis (YTD)

Repeat victims
Measure Performance indicators Jan-Mar 2019 Jan-Mar 2020 Diff. Apr 18 - Mar 19 Apr 19 - Mar 20 Diff 2017 2018 2019 2020 vs. 2017-19 av.KPI 2.3 All crime 22 35 59% 207 239 15% 14 8 22 139.7%KPI 2.4 Sexual offences 0 2 - 14 8 -43% 1 1 0 200.0%KPI 2.5 Domestic crime 9 6 -33% 51 66 29% 3 3 9 20.0%KPI 2.6 Assaults 11 12 9% 88 94 7% 3 3 11 111.8%KPI 2.7 Offences against children 2 9 350% 23 35 52% 1 2 2 440.2%
Year-to-Date comparison Rolling 12 month comparison Trend analysis (YTD)

Missing persons, mental health and protection notices
Measure Performance indicators Jan-Mar 2019 Jan-Mar 2020 Diff. Apr 18 - Mar 19 Apr 19 - Mar 20 Diff 2017 2018 2019 2020 vs. 2017-19 av.KPI 2.8 Missing persons 190 273 44% 894 797 -11% 149 194 190 53.7%KPI 2.9 Mental health Ilogs 97 247 155% 576 785 36% 73 123 97 155.6%
KPI 2.11 APNs 286 267 -7% 992 1,248 26% 171 172 286 27.4%KPI 2.12 CPNs 712 797 12% 2,861 2,983 4% 651 631 712 19.9%
Year-to-Date comparison Rolling 12 month comparison Trend analysis (YTD)
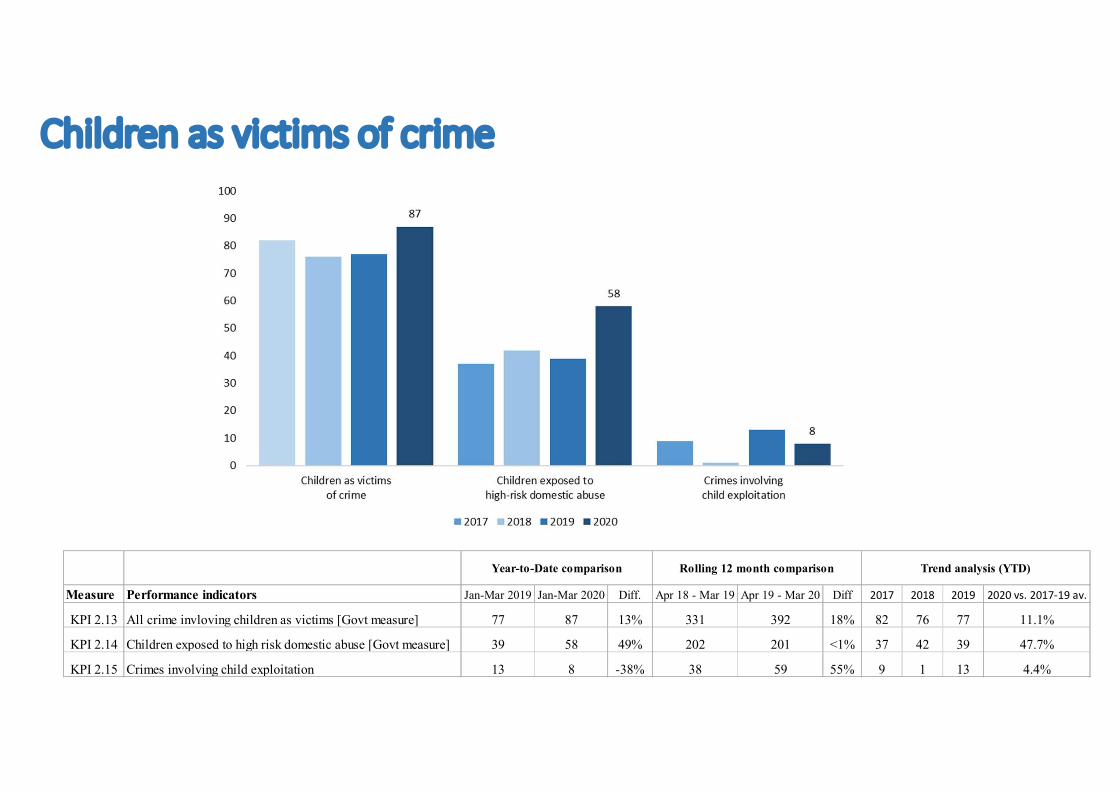
Children as victims of crime
Measure Performance indicators Jan-Mar 2019 Jan-Mar 2020 Diff. Apr 18 - Mar 19 Apr 19 - Mar 20 Diff 2017 2018 2019 2020 vs. 2017-19 av.
KPI 2.13 All crime invloving children as victims [Govt measure] 77 87 13% 331 392 18% 82 76 77 11.1%
KPI 2.14 Children exposed to high risk domestic abuse [Govt measure] 39 58 49% 202 201 <1% 37 42 39 47.7%
KPI 2.15 Crimes involving child exploitation 13 8 -38% 38 59 55% 9 1 13 4.4%
Year-to-Date comparison Rolling 12 month comparison Trend analysis (YTD)
3. People have confidence in the police
• 2016 Jersey Opinion and Lifestyle Survey KPIs (SI 3.1, 3.2; KPI 3.1)
• Hate crime and stop searches (KPIs 3.3, 3.5)
• Workforce profile (KPIs 3.6, 3.7)
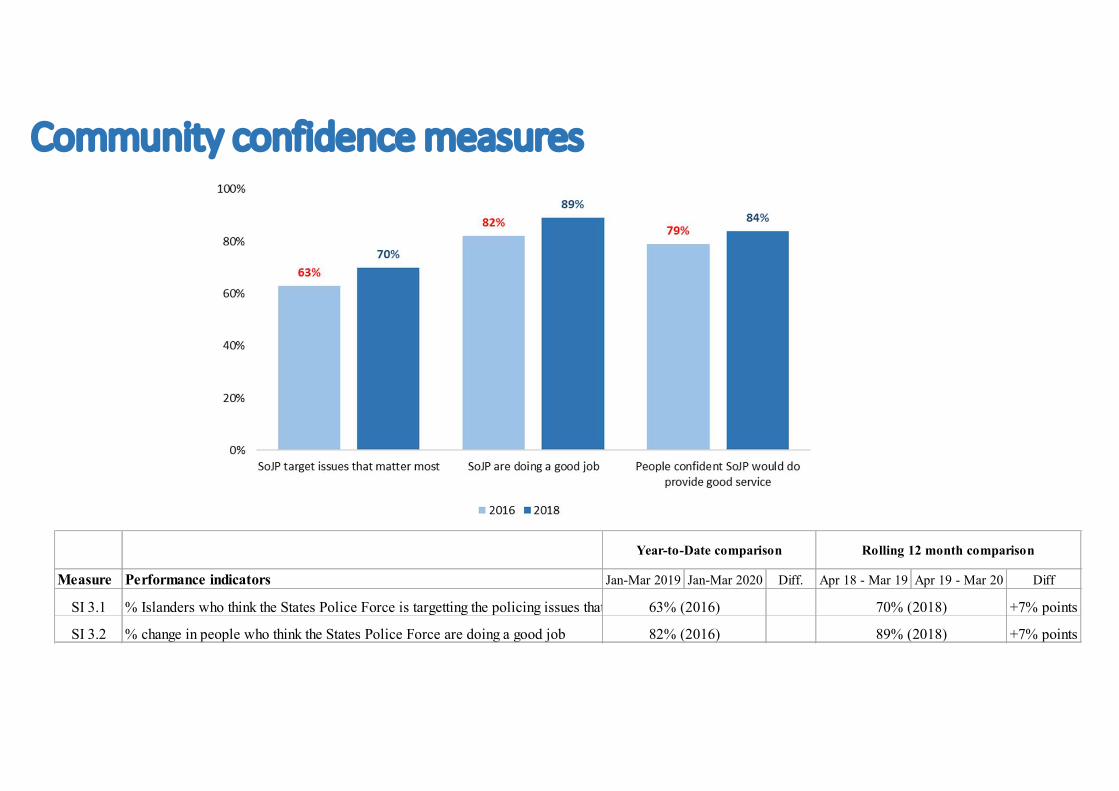
Community confidence measures
Measure Performance indicators Jan-Mar 2019 Jan-Mar 2020 Diff. Apr 18 - Mar 19 Apr 19 - Mar 20 Diff
SI 3.1 % Islanders who think the States Police Force is targetting the policing issues that matter most in the community +7% points
SI 3.2 % change in people who think the States Police Force are doing a good job +7% points89% (2018)
63% (2016) 70% (2018)
82% (2016)
Year-to-Date comparison Rolling 12 month comparison
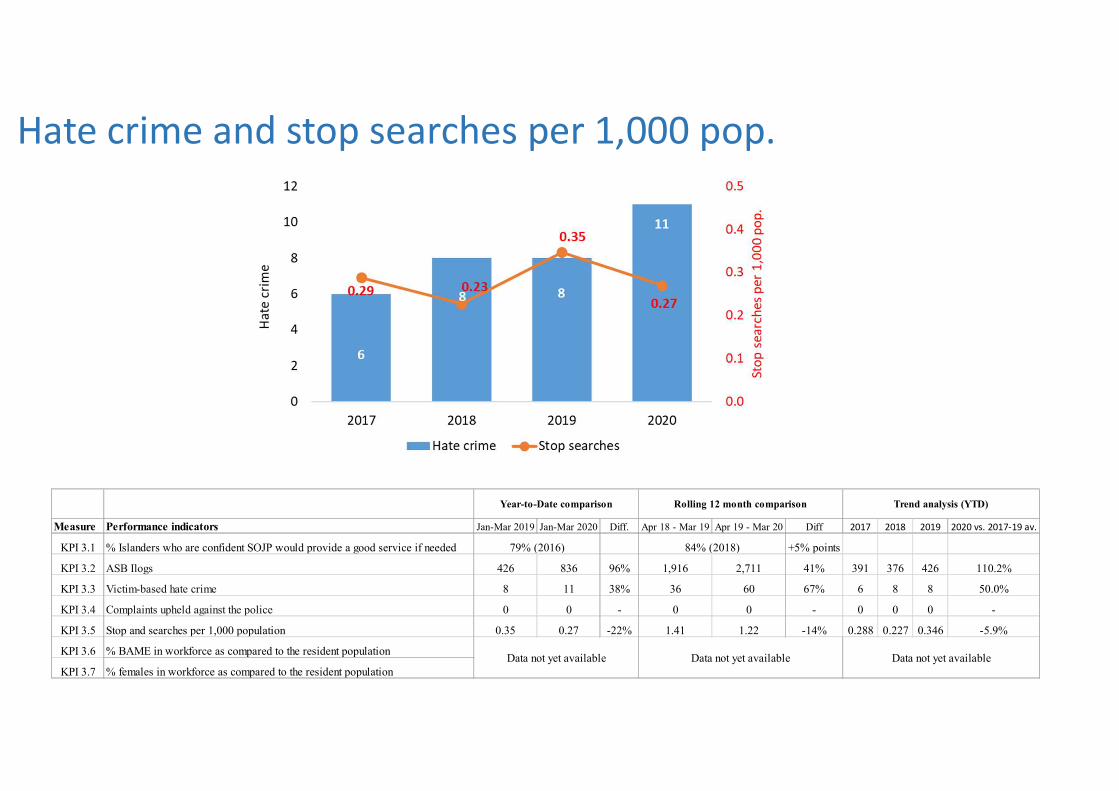
Hate crime and stop searches per 1,000 pop.
Measure Performance indicators Jan-Mar 2019 Jan-Mar 2020 Diff. Apr 18 - Mar 19 Apr 19 - Mar 20 Diff 2017 2018 2019 2020 vs. 2017-19 av.
KPI 3.1 % Islanders who are confident SOJP would provide a good service if needed +5% points
KPI 3.2 ASB Ilogs 426 836 96% 1,916 2,711 41% 391 376 426 110.2%
KPI 3.3 Victim-based hate crime 8 11 38% 36 60 67% 6 8 8 50.0%
KPI 3.4 Complaints upheld against the police 0 0 - 0 0 - 0 0 0 -
KPI 3.5 Stop and searches per 1,000 population 0.35 0.27 -22% 1.41 1.22 -14% 0.288 0.227 0.346 -5.9%
KPI 3.6 % BAME in workforce as compared to the resident population
KPI 3.7 % females in workforce as compared to the resident population
79% (2016) 84% (2018)
Data not yet available Data not yet available Data not yet available
Year-to-Date comparison Rolling 12 month comparison Trend analysis (YTD)
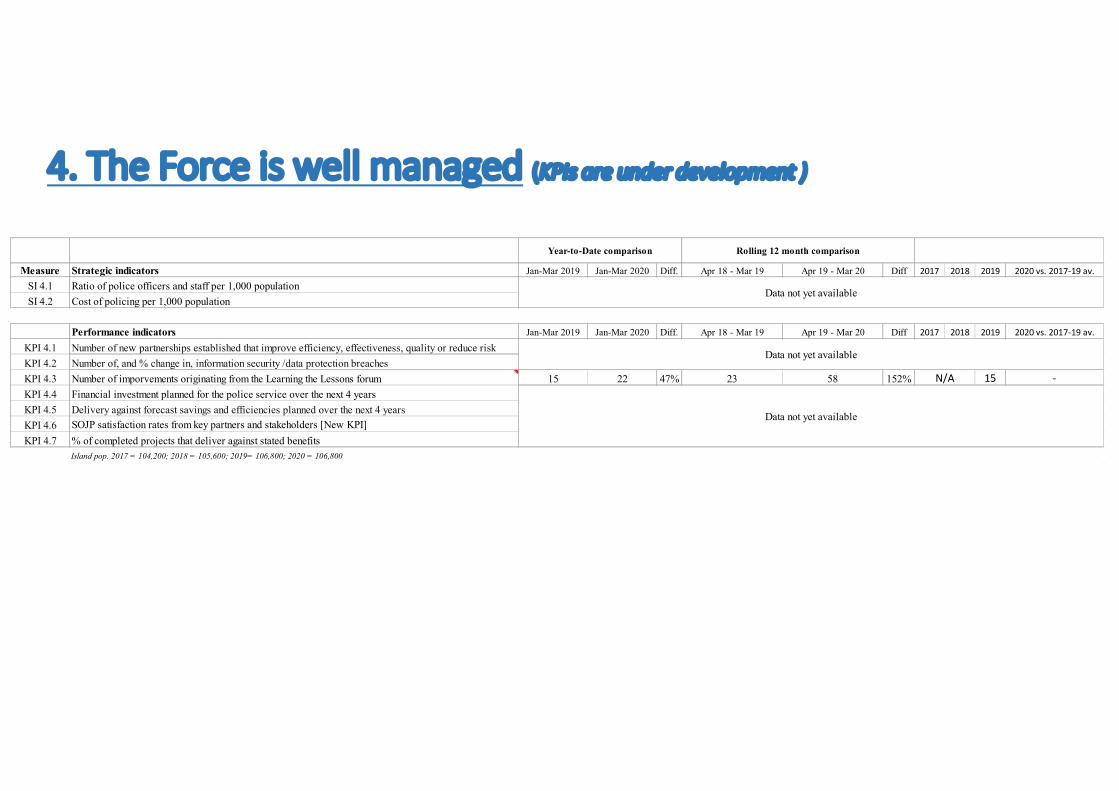
4. The Force is well managed (KPIs are under development )
Measure Strategic indicators Jan-Mar 2019 Jan-Mar 2020 Diff. Apr 18 - Mar 19 Apr 19 - Mar 20 Diff 2017 2018 2019 2020 vs. 2017-19 av.
SI 4.1 Ratio of police officers and staff per 1,000 population
SI 4.2 Cost of policing per 1,000 population
Performance indicators Jan-Mar 2019 Jan-Mar 2020 Diff. Apr 18 - Mar 19 Apr 19 - Mar 20 Diff 2017 2018 2019 2020 vs. 2017-19 av.
KPI 4.1 Number of new partnerships established that improve efficiency, effectiveness, quality or reduce risk
KPI 4.2 Number of, and % change in, information security /data protection breaches
KPI 4.3 Number of imporvements originating from the Learning the Lessons forum 15 22 47% 23 58 152% 15 -KPI 4.4 Financial investment planned for the police service over the next 4 years
KPI 4.5 Delivery against forecast savings and efficiencies planned over the next 4 years
KPI 4.6 SOJP satisfaction rates from key partners and stakeholders [New KPI]
KPI 4.7 % of completed projects that deliver against stated benefits Island pop. 2017 = 104,200; 2018 = 105,600; 2019= 106,800; 2020 = 106,800
Data not yet available
N/A
Data not yet available
Year-to-Date comparison Rolling 12 month comparison
Data not yet available

5. The Force has a capable and resilient workforce(KPIs are under development )
Measure Strategic indicators Jan-Mar 2019 Jan-Mar 2020 Diff. Apr 18 - Mar 19 Apr 19 - Mar 20 Diff 2017 2018 2019 2020 vs. 2017-19 av.
SI 5.1 % workforce who would describe SOJP as a good place to work [New measure] 76% 76%
SI 5.2 % officers and staff who consider themselves competent to undertake their role [New measure] 90% 90%
Island pop. 2017 = 104,200; 2018 = 105,600; 2019= 106,800; 2020 = 106,800
Performance indicators Jan-Mar 2019 Jan-Mar 2020 Diff. Apr 18 - Mar 19 Apr 19 - Mar 20 Diff 2017 2018 2019 2020 vs. 2017-19 av.
KPI 5.1 % succession and talent development plans are in place
KPI 5.2 % officers passed fitness test
KPI 5.3 % change in sickness absence across the States Police Force
KPI 5.4 % change in recorded sickness absence diagnosed as stress/anxiety/depression related
KPI 5.5 % PRA completion
KPI 5.6 % of police officers on 'restricted duties'
KPI 5.7 % turnover of police officers
KPI 5.8 % turnover of police staff
Year-to-Date comparison Rolling 12 month comparison
Data not yet available
Related Documents


