Stated values and reminders of substitute goods: Testing for framing eects with choice modelling John Rolfe, Je Bennett and Jordan Louviere* Choice modelling, a non-market valuation technique, is used to explore framing issues in the context of environmental valuations. Choice modelling appears to have promise in simultaneously valuing a pool of substitute amenities and goods. Describing choices according to component attributes can also help to frame choices according to a number of trade-os. The statistical information available helps to determine where framing eects have occurred. Three choice modelling experiments were reviewed to show that framing eects may be more widespread in non-market valuation studies than is commonly thought. 1. Introduction Researchers using stated preference valuation techniques have always been interested in determining the extent to which survey respondents consider substitute and complementary goods when they value the trade-os presented to them (Boyle 1989; Mitchell and Carson 1989; Carson and Mitchell 1995). There has often been suspicion that under survey conditions, perceptions about budget and substitute constraints vary markedly from what they would in a ‘real life’ situation. Information about the influence of substitute goods remains largely hidden to the analyst in applications of the contingent valuation method (CVM). In this paper we discuss the benefits of another stated preference technique termed Choice Modelling (CM). The NOAA panel (1993) recommended that reminders of substitute goods and budget constraints be included within applications of the contingent valuation method (CVM). Since that recommendation there has been increasing interest in the eectiveness and form of information about substitute goods, and the extent to which they help the respondent to frame the trade-o of interest (Loomis et al. 1994; Whitehead and Bloomquist 1995; Kotchen and Reiling 1999; Whitehead and Bloomquist 1999). Framing eects occur when the respondent to a survey is unduly sensitive to the *John Rolfe, Faculty of Business and Law, Central Queensland University, Emerald, Qld; Je Bennett, National Centre for Development Studies, Australian National University, Canberra, ACT; Jordan Louviere, Memetrics Pty Ltd, Sydney, NSW, Australia. Ó Australian Agricultural and Resource Economics Society Inc. and Blackwell Publishers Ltd 2002 The Australian Journal of Agricultural and Resource Economics, 46:1, pp. 1–20

Welcome message from author
This document is posted to help you gain knowledge. Please leave a comment to let me know what you think about it! Share it to your friends and learn new things together.
Transcript

Stated values and reminders of substitute goods:Testing for framing e�ects with choice modelling
John Rolfe, Je� Bennett and Jordan Louviere*
Choice modelling, a non-market valuation technique, is used to explore framingissues in the context of environmental valuations. Choice modelling appears to havepromise in simultaneously valuing a pool of substitute amenities and goods.Describing choices according to component attributes can also help to frame choicesaccording to a number of trade-o�s. The statistical information available helps todetermine where framing e�ects have occurred. Three choice modelling experimentswere reviewed to show that framing e�ects may be more widespread in non-marketvaluation studies than is commonly thought.
1. Introduction
Researchers using stated preference valuation techniques have always beeninterested in determining the extent to which survey respondents considersubstitute and complementary goods when they value the trade-o�spresented to them (Boyle 1989; Mitchell and Carson 1989; Carson andMitchell 1995). There has often been suspicion that under survey conditions,perceptions about budget and substitute constraints vary markedly fromwhat they would in a `real life' situation. Information about the in¯uence ofsubstitute goods remains largely hidden to the analyst in applications of thecontingent valuation method (CVM). In this paper we discuss the bene®ts ofanother stated preference technique termed Choice Modelling (CM).The NOAA panel (1993) recommended that reminders of substitute goods
and budget constraints be included within applications of the contingentvaluation method (CVM). Since that recommendation there has beenincreasing interest in the e�ectiveness and form of information aboutsubstitute goods, and the extent to which they help the respondent to framethe trade-o� of interest (Loomis et al. 1994; Whitehead and Bloomquist1995; Kotchen and Reiling 1999; Whitehead and Bloomquist 1999). Framinge�ects occur when the respondent to a survey is unduly sensitive to the
*John Rolfe, Faculty of Business and Law, Central Queensland University, Emerald, Qld; Je� Bennett,
National Centre for Development Studies, Australian National University, Canberra, ACT; Jordan
Louviere, Memetrics Pty Ltd, Sydney, NSW, Australia.
Ó Australian Agricultural and Resource Economics Society Inc. and Blackwell Publishers Ltd 2002
The Australian Journal of Agricultural and Resource Economics, 46:1, pp. 1±20

context in which a particular trade-o� is o�ered. There are three areas ofparticular interest to practitioners of non-market valuation.The ®rst of these areas relate to the issues involving framing lesser known
amenities and trade-o�s. It is di�cult in the performance of a statedpreference survey to provide the same amount of information about varioussubstitutes as well as the issue of interest. The fact that an issue has beenselected is also likely to create an implicit signal about the importance of theissue relative to substitutes.The second framing issue relates to the uncertainty surrounding the
e�ectiveness of direct reminders in CVM surveys. There is some evidence thatthe inclusion of reminders in CVM studies has little e�ect on the valuesestimated (Loomis et al. 1994; Kotchen and Reiling 1999). It is possible thatsuch reminders do little to increase the awareness of respondents aboutsubstitute goods. This may be because the e�ect of the reminders may besmall compared to other sources of variability (Loomis et al. 1994), orbecause respondents need much more detailed knowledge about substitutesthan a simple reminder will provide (Whitehead and Bloomquist 1999). Thesereasons suggest that as the CVM is applied to lesser-known goods, theproblems relating to framing choices against substitutes intensify.It is also possible that simple reminders may not be e�ective in changing
the structure of choice and information transfer. The position of an amenityin a queue of choices will in¯uence values through a type of sequencing e�ect(Randall and Hoehn 1996), implying that reminders of substitutes that donot change the order in which items are viewed will not have substantialimpact on values. Neill (1995) showed that substitution e�ects vary accordingto whether respondents are simply reminded of their existence (as accordingto the NOAA recommendations) or whether they are directly forced toconsider them. Hoehn and Randall (1987), Hoehn (1991), Hoehn andLoomis (1993), Cummings et al. (1994) and Neil (1995), have suggested thatin order to generate unbiased estimates of value for a particular good,respondents must be asked to simultaneously value the good in questiontogether with relevant substitutes and/or complements.The third broad framing issue relates to the di�culties in distinguishing
di�erences in value estimates between similar trade-o�s. Boyle (1989)suggested that small variations in commodity descriptions will not producevaluation e�ects, whereas large variations will. However, many issues arecomplex and multifaceted, meaning that there are a variety of ways in whichsubstitutes are perceived. For example, substitutes for rainforests may beperceived to be other vegetation types, other habitats for birds and mammals,other destinations for tourists to visit, or other areas for Indigenous people tolive. It is not always easy for researchers to remind potential respondents ofthe range of di�erent substitutes that they may need to consider, to determine
J. Rolfe et al.2
Ó Australian Agricultural and Resource Economics Society Inc. and Blackwell Publishers Ltd 2002

when a variation is likely to cause a framing e�ect or, indeed, to determinewhen a failure has occurred.In this paper, we explore the use of another stated preference technique
termed Choice Modelling (CM) to address some of these framing issues. Inthe next section, a brief overview of the CM technique is presented. Insection three, an analysis of framing issues and CM is presented, followedin section four by details of three CM experiments designed speci®cally toexplore framing and substitute amenities. Final conclusions are drawn insection ®ve.
2. The Choice Modelling technique
Choice Modelling is a stated preference technique that has some similaritiesto the CVM. In general, CM involves the use of a series of choice sets inwhich respondents indicate their preferred choice from a pool of alternatives.Each o�ering consists of at least two choice options described by a number ofattributes, the levels of which are varied systematically to form the scenariosand provide certain statistical properties necessary for estimating theparameters of families of probabilistic discrete choice models. In comparison,the CVM is a single-shot approach, where respondents are usually onlypresented with one option and asked if they prefer it to the current situation.Respondents to a CM survey usually answer a number of designed
scenarios, so there are su�cient data to enable the analyst to estimate thecontribution of di�erent attributes to the choices made. This then enablespredictions to be made about choices and, hence, valuations to be made. Theaim of the CM process is to estimate a model to predict choice on the basis ofthe attributes that describe the amenities of interest.TheMultinomial Logit model (MNL) used to analyse CMdata is motivated
by the consideration of a conditional indirect utility function of the form:
V � b� b1Z1 � b2Z2 � . . . :bNZN � h1S1 � h2S2 � . . . :hMSM �1�
where V is the indirect utility function, b1 to bN are elements of the vector ofcoef®cients attached to the vector of attributes (Z) describing the environ-mental resource, and h1 to hM are elements of the vector of coef®cientsattached to the vector of individual characteristics (S), with the latter usuallyincluding income. The intercept (b) represents the in¯uence of unobservedattributes. For some models, particularly when the alternatives arelabelled, this intercept term can be disaggregated into alternate speci®cconstants (ASC) to generate more accurate models of choice. An importantattribute included in the indirect utility function is some willingness to pay(WTP) measure for provision of the described environmental amenity. The
Testing for framing e�ects 3
Ó Australian Agricultural and Resource Economics Society Inc. and Blackwell Publishers Ltd 2002

coe�cient of the monetary attribute used in describing the choice sets isdenoted by b$.This vector of utility parameters includes an element of variance, re¯ecting
an unexplainable component of observations (error term). The randomutility maximisation (RUM) model allows choice probabilities to beestimated for utilities that contain random elements (McFadden 2001). TheRUM model underpins the use of both logit and probit models to analysechoice data. Assuming an extreme value (Gumbel) distribution of the errorterms allows the MNL model to be applied to choice data (McFadden 2001).It is possible to express each of the beta coe�cients (relating to bothalternatives and attributes) in equation 1 as kb, where k represents a scaleparameter. This scale parameter is inversely proportional to the standarddeviation of the random component inherent in a choice experiment(Louviere 2001). The scale parameter cannot be identi®ed in a speci®cmodel, but the comparison of di�erent models does allow identi®cation ofthe di�erences in error terms.It is a condition of the MNL model that the error terms associated with
each alternative have to be independently and identically distributed (IID),giving rise to an independence from irrelevant alternatives (IIA) condition.This means that the probability of an option being chosen should beuna�ected by the inclusion or omission of other alternatives. The condition isnormally tested by omitting an alternative in turn from the choice sets andtesting to see if there is signi®cant di�erence in parameter estimates.Welfare estimates can be obtained by using the following formula to
estimate compensating variation (CV) as described by Hanemann (1984):
CV � ÿ1=a lnX
exp V 0 ÿ lnX
exp V 1h i
�2�
where a is the marginal utility of income, and V0 and V1 represent the utilitybefore and after the change under consideration. Here the welfare estimate isobtained by ®nding the di�erence in utility between two options and scalingthat utility to a metric measure with the aid of the marginal utility of income.In CM, the monetary coe�cient (kb$) generated as a model parameter is usedas an estimate of the marginal utility of income. Changes in utility can arisefrom both changes in the attributes of alternatives, or the inclusion orremoval of alternatives altogether.In situations where the choice set includes a single before and after option,
the welfare measure described in equation 2 reduces to:
CV � ÿ1=a�ln�exp V 0� ÿ ln�exp V 1�� � ÿ1=kb$�V 0 ÿ V 1� �3�In some cases the before and after options may di�er only because of changesin a single attribute. For attributes representing non-continuous data, the CV
J. Rolfe et al.4
Ó Australian Agricultural and Resource Economics Society Inc. and Blackwell Publishers Ltd 2002

will be represented by the di�erence between the attribute coe�cients for therelevant levels, divided by the monetary coe�cient, as prescribed by equation3. For continuous data though, the marginal value of a change within a singleattribute can be represented as a ratio of coe�cients, where equation 3reduces further to:
W � kb=kb$ �4�This formula for the value of a single attribute change (termed a `part-worth')e�ectively provides the marginal rate of substitution between WTP and theattribute in question. The formula also demonstrates that the scale parameteris cancelled out in the estimation process. This means that while modelcoe�cients cannot be directly compared between di�erent CM experimentsbecause of di�ering (but unknown) scale parameters, resulting valueestimates are comparable.
3. Choice Modelling and framing issues
Choice Modelling appears to o�er several advantages over other non-market valuation techniques for framing purposes. The ®rst, and perhapsmost signi®cant advantage, is that it allows the simultaneous presentationof a pool of alternative and substitute goods. This explicitly requiresrespondents to consider complementary and substitution e�ects in thechoice process. In addition, problems of bias can be minimised because theamenity of interest can be `hidden' within the pool of available goods usedin a CM experiment.These strengths are demonstrated in relation to the experiments reported in
the following section. The issue of interest was the estimation of non-usevalues held by Australians for rainforest conservation in Vanuatu, one of thePaci®c nations. Because Australians are not well informed about Vanuatu orseveral other countries where rainforest conservation is an important issue,any potential application of the CVM for that purpose would be problem-atic. The more appropriate way of framing these choices was to presentVanuatu in a pool of other countries (including Australia) where rainforestscould be preserved (see ®gure 1).A second major advantage of CM is that it provides a more realistic way
for respondents to trade-o� opportunity costs than CVM allows. This occursin two important ways: (i) the WTP attribute is only one of several attributesthat de®nes pro®les and, hence, is de-emphasized in importance relative to itscentral role in the CVM; and (ii) CM allows one to introduce a variety ofopportunity costs, not just some WTP mechanism.In the Vanuatu study, choices were framed against the range of attributes
that respondents commonly used to make choices about rainforest
Testing for framing e�ects 5
Ó Australian Agricultural and Resource Economics Society Inc. and Blackwell Publishers Ltd 2002

conservation. Focus groups were held in Brisbane and participants wereasked to indicate the key issues that they would consider in choices aboutrainforest conservation (Rolfe and Bennett 1995). From the results of thefocus groups, the attributes chosen to describe the rainforest conservationpro®les were:
· Location (country)· Area (of the conservation proposal)· Rarity· Potential to visit· E�ect on local populations
Figure 1 A sample choice set from Experiment A
J. Rolfe et al.6
Ó Australian Agricultural and Resource Economics Society Inc. and Blackwell Publishers Ltd 2002

· Special features of the area· Price of the proposal (framed as a donation)
Apart from the location, the attributes describing each pro®le could beclassi®ed by three environmental attributes (area, rarity and special features),and three socioeconomic attributes (visits, locals and price). This approachhad a number of advantages. It de-emphasised price as a trade-o�, made thescenarios more realistic, and provided some indication about how peopleviewed trade-o�s between social and environmental factors.1
A third framing bene®t involves the ability to analyse and compare CMexperiments. This allows the analyst to test whether di�erences in framing thechoices to respondents cause variations in the parameters of the resultingchoice models. For convenience, di�erences in framing can be categorisedinto slight variations in the description of essentially the same good, andlarger variations that change the structure of the choices involved (Boyle1989). Both of these possible di�erences can be tested by examining theinternal validity of models and di�erences in choice model parameters.The ®rst test that can be performed is to check that violations in model
assumptions have not occurred. The internal validity of choice models can betested by identifying any IIA/IID violations. The presence of these violationswould suggest that choices have not been consistent (independent) and,therefore, that respondents have had di�culty in framing choices through thecourse of the experiments.The second test that can be performed is to determine whether slight
di�erences in the way that choices are presented to respondents have impactson model parameters and, hence, on value estimation. If slight di�erences inframing do not cause value estimates to change, as Cummings, Brookshireand Schulze (1986) and Boyle (1989) hypothesised, then the parameters forthe di�erently framed choice models should be identical.The third test that can be performed is to determine whether substantial
di�erences in framing between choice experiments cause changes in value onlyto those attributes that are not shared by the choice frameworks, or whetherthey also cause changes to the common attributes as well.2 Substantialdi�erences can be introduced into CM experiments by including di�erentsubstitute goods. It would be expected that overall values would di�erbetween choice experiments when there are major di�erences in the underlying
1The part-worth formula described in equation 4 can be used to give any marginal rate ofsubstitution between two attributes by using the relevant beta coe�cients.
2Boyle (1989) concluded that substantial framing di�erences caused value changes. This isnot surprising to economists. What is more di�cult to ascertain from CVM experiments iswhether substantial framing di�erences causes systematic value changes, or only changes inthe components not common across the di�erent experiments.
Testing for framing e�ects 7
Ó Australian Agricultural and Resource Economics Society Inc. and Blackwell Publishers Ltd 2002

components. However, it could be expected that attributes common betweenchoice experiments are valued in the same way. If they are not, it could bebecause they have been framed by respondents in di�erent ways.If the in¯uence on choice of particular attributes is independent of other
attributes and choice alternatives and, hence, una�ected by the introductionof other substitutes, this implies that no framing e�ects are present.Signi®cant changes in beta coe�cients common between CM experimentsthat involve di�erent substitutes will therefore indicate that framing e�ectshave occurred, while insigni®cant changes will indicate the reverse.These di�erences in model parameters can be tested in two main ways.
First, con®dence intervals for part-worths can be compared to isolate anydi�erences that might exist between models. Signi®cant di�erences suggestframing problems. Second, log-likelihood tests can be used to identifywhether model parameters di�er by any more than variations in the relevantscale parameters. Here, the relevant tests are described in more detail.
3.1 The part-worth tests
One way to identify framing e�ects is to compare the part-worths that areavailable from models estimated from CM surveys. These are directlycomparable between models because the scaling (k) terms are cancelled out ofsuch equations. In order to estimate whether di�erences between part-worthsgenerated from di�erent experiments are statistically robust, con®denceintervals need to be generated.This can be done using Fieller's Method as proposed by Krinsky and Robb
(1986). It involves the simulation of an asymptotic distribution of thecoe�cients that are generated in a CM experiment, from which con®denceintervals can then be computed. The distribution is achieved by takingrepeated random draws of `the coe�cient vectors from a multivariate normaldistribution with mean and variance equal to the b vector and variance±covariance matrix from the estimated multinomial logit model' (Morrisonet al. 1998, p. 10). Implicit prices can then be calculated from each of therandom draws of coe�cients, and con®dence intervals estimated byidentifying the values at each tail of the distribution of implicit prices.
3.2 The scale parameter (Swait±Louviere) tests
The Swait±Louviere test entails a proportionality restriction on the param-eters of one dataset relative to the second, and a test of whether the sum ofthe log-likelihoods for the two di�erent datasets di�ers signi®cantlyfrom the log-likelihood for a model estimated from the pooled datasets withthe parameter proportion restriction. The pathway for this analysis is
J. Rolfe et al.8
Ó Australian Agricultural and Resource Economics Society Inc. and Blackwell Publishers Ltd 2002

through the estimation of the ratio of scale parameters for the di�erentmodels.A scale parameter (the constant of proportionality) is inversely
proportional to the standard deviation of the error distribution for eachdataset. Steps to ®nd the ratio of the scale parameters involve stackingtwo datasets, X1 and X2, and multiplying one of the datasets by a scalarvalue (i.e. X1*�/X1) (Swait and Louviere 1993). (The alternate speci®cconstants are not rescaled). The purpose is to determine the value of thescalar / that optimizes the log-likelihood of the MNL model whenestimated using the pooled datasets. Rescaling and model estimationcontinues in an iterative process until the log-likelihood values indicatethat a `best ®t' has been obtained.If both datasets have identical parameters, rescaling is unnecessary and
the ratio of scale parameters is 1 (Blamey et al. 1998). If dataset X1 hasmore random noise than dataset X2 the variance-scale parameter ratio, /1/2,will be less than 1; if the opposite is true, ratios will be greater than 1.Signi®cant di�erences between datasets are tested with a form of thelikelihood ratio test (Swait and Louviere 1993). This takes the followingform:
LR � ÿ2�LogLX�1=2� ÿ �LogLX1� LogLX2
�� �5�
where LogLX(1/2)is the log-likelihood value attached to the MNL model of the
stacked dataset at the optimum level of /, and LogLX1and LogLX2
are thelog-likelihoods of the MNL models for the individual datasets (Swait andLouviere 1993; Blamey et al. 1998). The resulting likelihood ratio statisticfollows an asymptotic v2 distribution with (P + 1) degrees of freedom, whereP is the number of parameters across the three models involved.
4. Framing estimates of value for international rainforest conservation
Surveys involving CM experiments were designed to estimate the preserva-tion values that Australians might hold for rainforest in Vanuatu. Anexperimental design procedure was used to design the scenario choicespresented to survey respondents, based on the attributes noted earlier. Threesuccessive surveys were run in Brisbane, Australia in 1995 and 1996 by amarket research ®rm. These surveys involved 100, 200 and 100 respondentsrespectively.The three surveys consisted of some general ranking and choice exercises
designed to remind respondents about a range of environmental issues andbudget constraints, a CM experiment section, and questions about the
Testing for framing e�ects 9
Ó Australian Agricultural and Resource Economics Society Inc. and Blackwell Publishers Ltd 2002

characteristics of respondents. The surveys di�ered only in attributesand levels used in the CM experiment section.3 These are displayed in table 1.In each of the surveys, a labelled model format was employed. Respond-
ents were presented with nine choice sets, each with a standard six locationson o�er, as well as a no choice option (®gure 1). This meant that sevenchoices were available in each set of pro®les. Hence, each location became alabelled alternative in which a number of other unrecognised attributesspeci®c to the locations may have contributed to choices. These e�ects werethen captured in the estimation of ASC in the models.Holding the number of locations to six, and allowing the other attributes
to vary across only three levels, enabled a powerful experimental designprocess to be generated. This selected 81 choice sets from the full factorial ofpossible choices. For convenience, these were blocked into groups of nine, sothat there were nine versions of the survey. Each respondent was given arandom version, which contained nine choice sets each.
4.1 Experiment A: framing rainforest preservation measures
Some of the strengths of CM can be seen in relation to experiment A, where asample choice set is presented in ®gure 1. This demonstrates that CM can besuccessfully used to disguise a particular issue within a pool of substitutesand frame the choices against a range of component attributes.In experiment A, respondents were o�ered one Australian and ®ve
international locations for rainforest conservation. The results of the survey,including two signi®cant interactions between attributes, are given intable 2.4
Signi®cant interactions were detected between attributes area and potentialto visit; and area and special features. The e�ect of those interactions was tomake two of the individual attributes (area and potential to visit) insigni-®cant. All other attributes in the model were statistically signi®cant atconventional levels and their signs were as expected a priori. The overall ®t ofthe model, as measured by McFadden's R-squared, was also very good bythe conventional standards used to judge probabilistic discrete choice models.The coe�cients for location ASC indicate that Indonesia was the leastpreferred location.
3Copies of the surveys are available from the authors on request.
4More accurate models can often be generated by including the socioeconomic character-istics of respondents (Rolfe et al. 2000), and/or the use of nested logit models. For brevity,these expanded models have not been reported here.
J. Rolfe et al.10
Ó Australian Agricultural and Resource Economics Society Inc. and Blackwell Publishers Ltd 2002

Table 1 Attributes and levels used in the Choice Modelling experiments
AttributeLevels ±
Experiment ALevels ±
Experiment BLevels ±
Experiment C
Location Vanuatu Vanuatu VanuatuFar North Queensland Far North Queensland Far North QueenslandPapua New GuineaSouth America South America South AmericaThailandIndonesia Indonesia Indonesia
South-east Queensland South-east QueenslandNorthern New SouthWales
Northern New SouthWales
Area 100 ha 100 ha 100 ha1,000 ha 1,000 ha 1,000 ha10,000 ha 10,000 ha 10,000 ha
Rarity Not rare at all Not rare at all Not rare at allFairly rare Fairly rare Fairly rareExtremely rare Extremely rare Extremely rare
Visits No visits allowed No visits allowed No visits allowedVisits possible but Visits possible but Visits possible butmoderate access moderate access moderate accessand few facilities and few facilities and few facilities
Easy to visit with Easy to visit with Easy to visit withfull facilities full facilities full facilities
Localpeople
Local people will beworse o�
No local people
Local peoplewill be worse o�
No local people
Local people will beworse o�
No local people
Local people Local people Local peoplewill be better o� will be better o� will be better o�
Specialfeatures
No special features No special features
Special plants andanimals
Special plants andanimals
Special landscapes &plants and animals
Special landscapes &plants and animals
Vegetation RainforestWetlandsRangelands
Price $ 5 $ 5 $ 5$10 $10 $10$50 $50 $50
Testing for framing e�ects 11
Ó Australian Agricultural and Resource Economics Society Inc. and Blackwell Publishers Ltd 2002
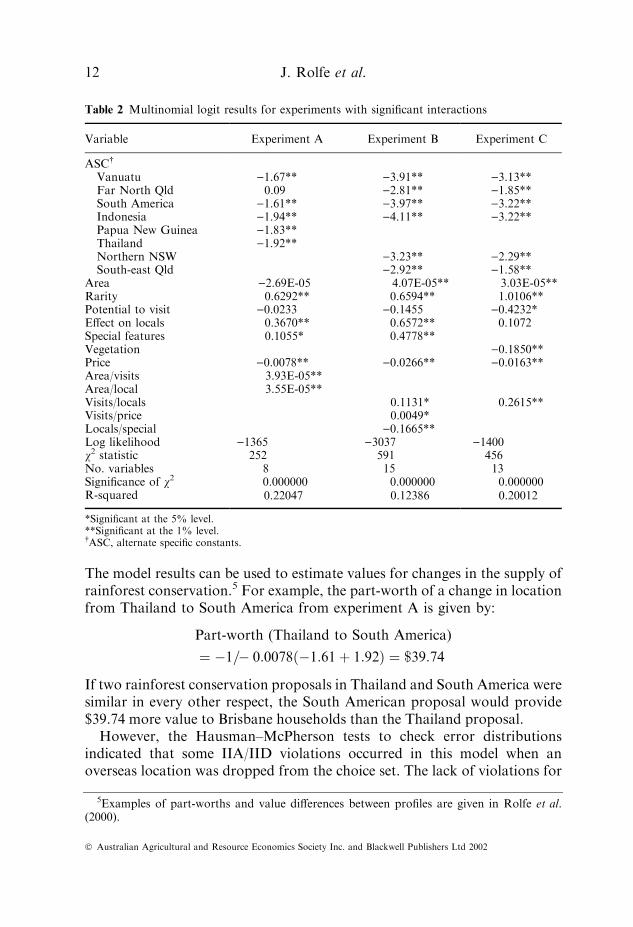
The model results can be used to estimate values for changes in the supply ofrainforest conservation.5 For example, the part-worth of a change in locationfrom Thailand to South America from experiment A is given by:
Part-worth (Thailand to South America)
� ÿ1=ÿ 0:0078�ÿ1:61� 1:92� � $39:74
If two rainforest conservation proposals in Thailand and South America weresimilar in every other respect, the South American proposal would provide$39.74 more value to Brisbane households than the Thailand proposal.However, the Hausman±McPherson tests to check error distributions
indicated that some IIA/IID violations occurred in this model when anoverseas location was dropped from the choice set. The lack of violations for
Table 2 Multinomial logit results for experiments with signi®cant interactions
Variable Experiment A Experiment B Experiment C
ASC
Vanuatu )1.67** )3.91** )3.13**Far North Qld 0.09 )2.81** )1.85**South America )1.61** )3.97** )3.22**Indonesia )1.94** )4.11** )3.22**Papua New Guinea )1.83**Thailand )1.92**Northern NSW )3.23** )2.29**South-east Qld )2.92** )1.58**
Area )2.69E-05 4.07E-05** 3.03E-05**Rarity 0.6292** 0.6594** 1.0106**Potential to visit )0.0233 )0.1455 )0.4232*E�ect on locals 0.3670** 0.6572** 0.1072Special features 0.1055* 0.4778**Vegetation )0.1850**Price )0.0078** )0.0266** )0.0163**Area/visits 3.93E-05**Area/local 3.55E-05**Visits/locals 0.1131* 0.2615**Visits/price 0.0049*Locals/special )0.1665**Log likelihood )1365 )3037 )1400v2 statistic 252 591 456No. variables 8 15 13Signi®cance of v2 0.000000 0.000000 0.000000R-squared 0.22047 0.12386 0.20012
*Signi®cant at the 5% level.**Signi®cant at the 1% level. ASC, alternate speci®c constants.
5Examples of part-worths and value di�erences between pro®les are given in Rolfe et al.(2000).
J. Rolfe et al.12
Ó Australian Agricultural and Resource Economics Society Inc. and Blackwell Publishers Ltd 2002

the no choice, Far North Queensland (FNQ) and Papua New Guinea (PNG)alternatives meant that dropping either of these alternatives did not changethe ratio of choice probabilities for the other alternatives. However, when theVanuatu and South America locations were dropped, IIA/IID violationswere present in the model.6 This implies that the other overseas locations arebeing viewed by respondents as substitutes, rather then as independentalternatives. In contrast, the Far North Queensland location was viewed asan independent alternative. The choice alternatives were not being framed byrespondents consistently, and value estimates, as demonstrated above, maynot be accurate.These IIA/IID tests lead to an important conclusion: framing problems
may be involved in valuation experiments that otherwise appear robust. Aninconsistency has been identi®ed in the CM experiment that would haveremained hidden in a similar CVM approach. It was hypothesised thatthese framing inconsistencies may have been occurring because the choicesets were unbalanced between Australian and overseas locations. Somerespondents may have always wanted choices that involved attractiveAustralian pro®les. From the wide selection of possible locations forrainforest conservation around the world, the six locations that have beenchosen have not been particularly suitable in this survey format.
4.2 Experiment B: testing for minor framing e�ects
Experiment B was conducted with two location changes from experiment Ato give three Australian and three overseas locations.7 All other factors wereheld constant in the choice sets, including the experimental design, and theresults are reported in table 2.For the model generated from this survey, no IIA/IID violations could be
detected. This suggested that o�ering a more balanced set of locations couldalter signi®cantly the way in which respondents framed choices. To testwhether di�erences between the models reported in table 2 were due to otherfactors apart from scale parameter di�erences, the con®dence intervals forpart-worths were estimated.8
These estimates were conducted by taking 200 repeated draws of the vectorof coe�cients, and then omitting the upper and lower tails of the
6The use of nested models with Pay/NoPay and Australian/Overseas decision branches didnot appear to remove these violations.
7Papua New Guinea was replaced by northern New South Wales, and Thailand wasreplaced by South-east Queensland.
8It was di�cult to apply the Swait±Louviere test for this purpose because the alternativeswere not consistent between the choice sets.
Testing for framing e�ects 13
Ó Australian Agricultural and Resource Economics Society Inc. and Blackwell Publishers Ltd 2002

distributions. The tests are reported below in table 4. The results indicate thatthe only signi®cant di�erence in part-worths exists for the area attribute andthe Far North Queensland (FNQ) location. The latter result con®rms thehypothesis that respondents found it di�cult to frame choices in experimentA where only one Australian location was o�ered in the choice sets. Framingthe Australian choices in a di�erent way a�ected the value of conservationsites in FNQ. The results demonstrate that the part-worth tests isolate theframing e�ects between experiments to the particular components of choicewhere they are occurring.In addition, a comparison of the con®dence intervals con®rmed that the
choices expressed in experiment B were more deterministic than the choicesexpressed in experiment A. The con®dence intervals for the part-worths fromexperiment B are much tighter than the corresponding part-worths fromexperiment A, indicating that lower levels of variation in choice occurred inthat experiment. This meets with a priori expectations, because experiment Bdid not have the framing issues associated with experiment A.
Table 3 Independent from irrelevant alternatives (IIA)/independent and identically distrib-uted (IID) tests for Experiment A
Alternative omitted v2 (d.f.) Pr(C>c) Signi®cant
No choice 35.9283 (6) 0.000003 YesFNQ 46.8908 (6) 0.000000 YesVanuatu 8.3572 (6) 0.213083 NoPNG 14.7594 (6) 0.022212 YesSouth America 7.9187 (6) 0.239448 No
d.f., Degrees of freedom; FNQ, Far North Queensland; PNG, Papua New Guinea.
Table 4 Part-worths for simple Multinomial Logit models of experiments A and B
Experiment A (A$) Experiment B (A$)
Part-worth Mean95% Con®dence
interval Mean95% Con®dence
interval
Area 0.0084 0.0047, 0.0238 0.0025 0.0016, 0.0036
Rare 55.61 32.79, 124.05 39.17 30.4, 48.6Potential to visit 15.42 0.26, 46.15 9.94 5.7, 14.8E�ect on locals 64.30 37.98, 190.92 35.20 28.6, 44.6Special features 11.94 )1.30, 37.61 9.38 5.29, 14.31Vanuatu )194.66 )521, )112 )240.27 )303, )192Far North Qld 7.94 )58.6, 70.1 )168.65 )211, )132South America )227.72 )609, )121 )247.44 )306, )201Indonesia )272.25 )794, )158 )251.7 )316, )202
J. Rolfe et al.14
Ó Australian Agricultural and Resource Economics Society Inc. and Blackwell Publishers Ltd 2002

4.3 The e�ect of framing di�erent choices
Experiment C was designed to test for framing e�ects when a wider group ofsubstitutes were presented to respondents. Instead of concentrating onrainforests, three types of vegetation (i.e. rainforests, wetlands and range-lands) were included in the pro®les. This essentially expanded the set ofsubstitutes for respondents to consider. Respondents were told that possibleconservation sites for each type of vegetation had been identi®ed in thelocations used in the pro®les.To enable comparisons with experiment B, the same experimental design
was used and the new vegetation attribute was substituted in place of thespecial features attribute. All the locations and other attributes used inexperiment B were maintained for experiment C. No IIA/IID violations weredetected in the results, indicating that respondents were able to frame choicesconsistently. Results are reported in table 2.To test for framing e�ects, we wanted to consider whether the in¯uence on
choice of attributes common between experiments B and C had changed.Because the coe�cients are not directly comparable, the Swait±Louviere testwas performed as a way of identifying whether framing e�ects could beisolated between the models. The data for the surveys were stacked bystripping out the attributes that were not common to each survey and thencombining the sets. The survey codes for the dataset from experiment B werevaried according to a scalar factor /, while the codes for the other datasetwere maintained.The dataset from experiment B had twice the number of observations as
the dataset from experiment C, so the latter was stacked twice to maintain
Table 5 Results for single and stacked datasets*
Variable Experiment B Experiment C Joint B&C
Vanuatu )3.5064 )4.5717 )3.9929Far North Qld )2.3741 )3.2511 )2.7754New South Wales )2.8238 )3.7363 )3.2401South America )3.5312 )4.6137 )4.0243South-east Qld )2.5126 )3.0229 )2.7300Indonesia )3.6600 )4.6014 )4.0884Rare 0.61269 0.93578 0.79047Visit 0.15722 0.12009 0.13817Local 0.55670 0.65376 0.61996Area 0.00004 0.00004 0.00004Price )0.01469 )0.01388 )0.01468
Log-likelihood )3056.756 )2827.778 )5911.073R-squared 0.12730 0.19357 0.15667v2 (5) 549.9 863.9 1328.6
*All parameters were signi®cant at the 1% level.
Testing for framing e�ects 15
Ó Australian Agricultural and Resource Economics Society Inc. and Blackwell Publishers Ltd 2002

consistency. Repeated MNL models for the stacked dataset were calculatedwith varying levels of /. The maximum log-likelihood value of the MNLmodel was achieved when / assumed a value of 0.94. The MNL models forthe individual datasets were also calculated, and the results for the threemodels are reported in table 5.This enabled the likelihood ratio test to be performed as follows:
LR � ÿ2�ÿ5911:073ÿ �ÿ3056:756ÿ 2827:778��� 53:078 �6�
There are (11 + 1) degrees of freedom associated with the test, implyingthat the v2 statistic at a 5 per cent signi®cance level is 21.026. This is smallerthan the calculated statistic, and means that the hypothesis; that is, that thevector of parameters are equivalent across the two datasets, should berejected. The di�erences in the scale parameter are not enough to account forthe variations in the coe�cients.The conclusion from this test is that framing e�ects have occurred
between experiments B and C. After di�erences in the scale parameters hadbeen accounted for, the variations in the coe�cients were still signi®cant.This means that the introduction of a wider choice set in experiment Ccompared with experiment B has impacted on the relative values of thedi�erent coe�cients.The size of the scalar factor ratio / identi®ed in the analysis also gives
some indication about how respondents framed their choices. This is becausethe scalar factor ratio is essentially the inverse of the standard deviation ofthe error distributions for the di�erent models. Because the scalar factor ratioidenti®ed is less than 1, the dataset from experiment B has more randomnoise than the set from experiment C. This indicates that respondents wereslightly more comfortable with the wider choice than with the narrowlyde®ned experiment that focused only on rainforests.9
More precise evidence about where framing e�ects have occurred can begained by comparing the 95% con®dence intervals for the part-worths thatare common to both experiments. These are set out in table 6.The results showed that while the means for the part-worths for the
attributes appeared to be higher for experiment C than for experiment B,the corresponding means for the part-worths for the ASC (locations)between the same two experiments appeared to be lower. However, therewas no signi®cant di�erence in part-worths between the experiments, apartfrom the rarity attribute. For that attribute, the value derived from experi-ment C was signi®cantly di�erent to the value derived from experiment B.
9Because the scale parameter identi®ed was very close to a unity value, the framingdi�erences between the two CM experiments were slight.
J. Rolfe et al.16
Ó Australian Agricultural and Resource Economics Society Inc. and Blackwell Publishers Ltd 2002

This indicates that framing e�ects involved in moving from the rainforestscenarios to broader vegetation conservation scenarios are centred on therarity attribute.
5. Conclusion
The CM technique has signi®cant strengths for estimating values forenvironmental goods in ways that minimise potential problems of framing.On one level, the technique o�ers signi®cant advantages over the CVM in itsability to o�er respondents choices from a wide pool of potentiallysubstitutable goods. The ability to disguise an amenity of interest within apool of potential trade-o�s is an important way of minimising informationtransfer and other potential biases, and modelling realistic choices. Thisappears to be important where the amenity of interest may not beparticularly familiar to respondents.On another level, the technique has signi®cant advantages in that it can
frame choices according to a number of attributes, including o�setting socio-economic and environmental ones. This frames choices in more realisticcontexts, as well as providing analysts with a rich information set about valuetrade-o�s.The CM technique allows for a more rigorous testing of framing e�ects
than does the CVM. The evidence from three experiments reported in thispaper suggests that framing e�ects in relation to substitutes are morewidespread in stated preference valuation experiments thanmay be commonlythought. First, the results indicate that respondents may have di�culties inframing some choices, depending on the pool of substitutes and choice optionso�ered. In contrast to the conclusions of Boyle (1989), it appears that small
Table 6 Part-worths for simple multinomial logit models of experiments B and C
Part-worth
Experiment B (A$) Experiment C (A$)
Mean95% Con®dence
interval Mean95% Con®dence
interval
Area 0.0025 0.0016±0.0036 0.0029 0.0016±0.0045Rare 39.17 30.4±48.6 65.59 49.8±92.5Potential to visit 9.94 5.7±14.8 10.69 3.3±20.0E�ect on locals 35.20 28.6±44.6 44.39 32.7±69.0Vanuatu )240.27 )303±)192 )298.65 )347±)222Far North Qld )168.65 )211±)132 )202.88 )306±)147New South Wales )192.89 )242±)153 )237.65 )364±)179South America )247.44 )306±)201 )303.72 )445±)222South-east Qld )175.37 )224±)139 )185.74 292±)133Indonesia )251.7 )316±)202 )300.21 )444±)221
Testing for framing e�ects 17
Ó Australian Agricultural and Resource Economics Society Inc. and Blackwell Publishers Ltd 2002

di�erences in experiment presentation can in¯uence choice consistency andalso lead to signi®cant changes in model parameters. It is notable though thatframing e�ects are often concentrated on a subset of attributes involved,implying that they may not be distinguishable in a similar CVM study.Second, changes in the range of substitutes that respondents have to
consider also may cause framing e�ects. In the experiments reported in thispaper, a substantial expansion of the pool of substitutes on o�er led tovariation in model parameters. It is notable though that when the part-worths were considered, this variation concentrated on the coe�cients forone attribute (rarity), and that no signi®cant di�erences could be found forthe locations and other attributes.These results give a very di�erent interpretation to framing e�ects o�ered
by Boyle (1989). The CM experiments reveal that small di�erences intrade-o�s and consideration of trade-o�s can lead to framing e�ects, but thatlarge changes in the range of substitutes does not automatically lead to largerframing e�ects. Indeed, the experiments presented showed that the framinge�ects were very limited in the latter case. One conclusion that can be drawnfrom this result is that framing e�ects may not automatically be associatedwith substantial changes in the range of substitutes that respondents areasked to consider. There appears to be signi®cant potential for the CMtechnique to be used to research this issue further.The key conclusion that can be drawn about good design practice in CM is
that choices should be framed in ways that survey respondents feelcomfortable with. When respondents view the number and types of choicesas being realistic, then the evidence suggests that common attributes betweensimilar studies are valued in much the same way. When respondents do notview choices as being realistic, then small changes in presentation appear todrive value changes. These results suggest that the time spent in focus groupsand pretests and on presentation issues when developing CM applicationsmay be crucial in achieving robust outcomes.
Acknowledgements
The research reported in this paper has been supported by the AustralianCentre for International Agricultural Research (ACIAR) Project 9020 (Thesocioeconomic assessment of native forest preservation proposals in Vanuatu:implications for forest management).
References
Blamey, R.K., Bennett, J.W., Louviere, J.J., Morrison, M.D. and Rolfe, J.C. 1998, Attribute
selection in environmental choice modelling studies: the e�ect of causually prior attributes,
J. Rolfe et al.18
Ó Australian Agricultural and Resource Economics Society Inc. and Blackwell Publishers Ltd 2002

Choice Modelling Research Report No. 7, University College, University of New SouthWales, Canberra.
Boyle, K.J. 1989, `Commodity speci®cation and the framing of contingent-valuationquestions' , Land Economics, vol. 65, pp. 57±63.
Carson, R.T. and Mitchell, R.C. 1995, `Sequencing and nesting in contingent valuation
surveys' , Journal of Environmental Economics and Management, vol. 28, pp. 155±73.Cummings, R.G., Brookshire, D.S. and Schultze, W.D. (eds), 1986, Valuing Environmental
Goods: A State of the Art Assessment of the Contingent Valuation Method, Rowman and
Allanheld, Totowa.Cummings, R.G., Ganderton, P.T. and McGuckin, T. 1994, `Substitution e�ects in CVM
values' , American Journal of Agricultural Economics, vol. 76, pp. 205±14.Hanemann, W.M. 1984, Applied Welfare Analysis with Quantitative Response Models,
Working Paper no. 241. University of California, Berkeley.Hoehn, J.P. 1991, `Valuing the multidimensional impacts of environmental policy: theory and
methods' , American Journal of Agricultural Economics, vol. 73, pp. 289±99.
Hoehn, J.P. and Loomis, J. 1993, `Substitution e�ects in the contingent valuation of multipleenvironmental programs: a maximum liklihood estimator and empirical tests' , Journal ofEnvironmental Economics and Management, vol. 25, pp. 56±75.
Hoehn, J.P. and Randall, A. 1987, `A satisfactory Bene®t±Cost indicator from contin-gent valuation' , Journal of Environmental Economics and Management, vol. 14, pp.226±47.
Kotchen, M.J. and Reiling, S.D. 1999, `Do reminders of substitutes and budget constraintsin¯uence contingent valuation estimates? Another comment' , Land Economics, vol. 75, pp.478±82.
Krinsky, I. and Robb, A. 1986, `Approximating the statistical properties of elasticities' ,
Review of Economics and Statistics, vol. 68, pp. 715±19.Loomis, J.B., Gonzalez-Caban, A. and Gregory, R. 1994, `Substitutes and budget constraints
in contingent valuation' , Land Economics, vol. 70, pp. 499±506.
Louviere, J.J. 2001, `Choice experiments: an overview of the concepts and issues' , in Bennett,J.W. and Blamey, R.K. (eds), The Choice Modelling Approach to Environmental Valuation,Edward Elgar, Cheltenham.
McFadden, D. 2001, `Economic choices' , American Economic Review, vol. 91, pp. 351±78.Mitchell, R.C. and Carson, R.T. 1989, Using Surveys to Value Public Goods: The Contingent
Valuation Method, Resources for the Future, Washington.Morrison, M.D., Bennett, J.W. and Blamey, R.K. 1998, Valuing Improved Wetland Quality
Using Choice Modelling, Choice Modelling Research Report No. 6, University College,University of New South Wales, Canberra.
Neill, H.R. 1995, `The context for substitutes in CVM studies: some empirical observations' ,
Journal of Environmental Economics and Management, vol. 29, pp. 393±7.NOAA 1993, `Report of the NOAA panel on contingent valuation' , Federal Register, vol. 58,
pp. 4602±14.
Randall, A. and Hoehn, J.P. 1996, `Embedding in market demand systems' , Journal ofEnvironmental Economics and Management, vol. 30, pp. 369±80.
Rolfe, J. and Bennett, J.W. 1995, Using Focus Groups to Establish Valuation Frameworks for
International Rainforests, Vanuatu Forest Conservation Research Report No. 9, UniversityCollege, University of New South Wales, Canberra.
Rolfe, J., Bennett, J. and Louviere, J. 2000, `Choice modelling and its potential application totropical rainforest preservation.' , Ecological Economics, vol. 35, pp. 289±302.
Testing for framing e�ects 19
Ó Australian Agricultural and Resource Economics Society Inc. and Blackwell Publishers Ltd 2002

Swait, J. and Louviere, J.J. 1993, `The role of the scale parameter in the estimation andcomparison of multinomial logit models' , Journal of Marketing Research, vol. 30, pp.
305±14.Whitehead, J.C. and Bloomquist, G.C. 1995, `Do reminders of substitutes and budget
constraints in¯uence contingent valuation estimates: comment?' , Land Economics, vol. 71,
pp. 541±3.Whitehead, J.C. and Bloomquist, G.C. 1999, `Do reminders of substitutes and budget
constraints in¯uence contingent valuation estimates: reply to another comment? ', Land
Economics, vol. 75, pp. 483±4.
J. Rolfe et al.20
Ó Australian Agricultural and Resource Economics Society Inc. and Blackwell Publishers Ltd 2002
Related Documents