State-wise analysis of Production, Storage, Market arrival and Price trends for Onion and Potato Horticulture Statistics Division D/o Agriculture & Cooperation

Welcome message from author
This document is posted to help you gain knowledge. Please leave a comment to let me know what you think about it! Share it to your friends and learn new things together.
Transcript

State-wise analysis of Production, Storage, Market arrival and
Price trends for Onion and Potato
Horticulture Statistics Division D/o Agriculture & Cooperation

Onion Season
• In India, three crops of onion are grown: Rabi (March-June) Kharif (October-December) Late Kharif (January-March).
• Kharif produce is available in the market from October to December, which accounts for 15-20%.
• Late Kharif produce comes in the market from January to March and accounts for 20-25%.
• The Rabi crop is harvested in April to June which accounts for 60-65%. Mainly, the Rabi onion is stored till October-November and is made available steadily for domestic as well as export markets.
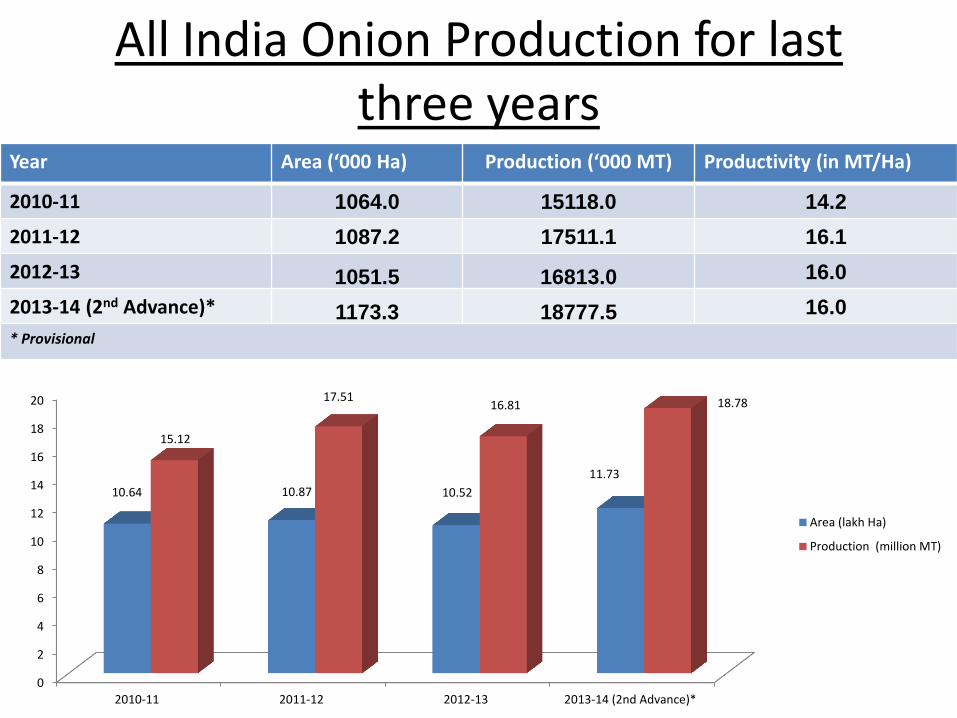
All India Onion Production for last three years
Year Area (‘000 Ha) Production (‘000 MT) Productivity (in MT/Ha)
2010-11 1064.0 15118.0 14.2
2011-12 1087.2 17511.1 16.1
2012-13 1051.5 16813.0 16.0
2013-14 (2nd Advance)* 1173.3 18777.5 16.0
* Provisional
0
2
4
6
8
10
12
14
16
18
20
2010-11 2011-12 2012-13 2013-14 (2nd Advance)*
10.64 10.87 10.52
11.73
15.12
17.51 16.81 18.78
Area (lakh Ha)
Production (million MT)
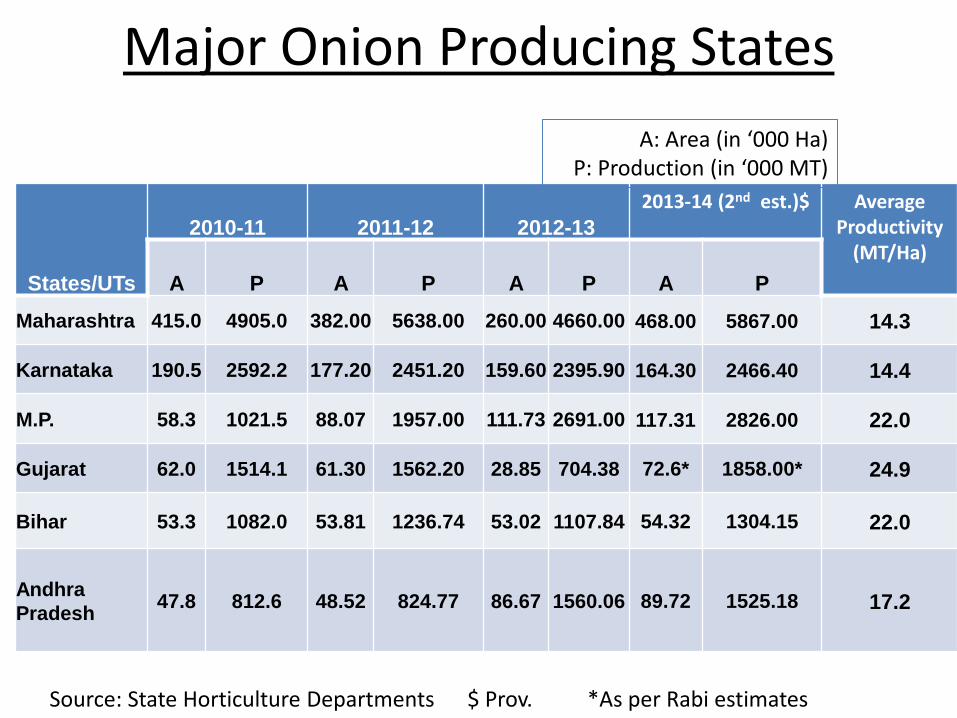
Major Onion Producing States
States/UTs
2010-11 2011-12 2012-13
2013-14 (2nd est.)$ Average Productivity
(MT/Ha) A P A P A P A P
Maharashtra 415.0 4905.0 382.00 5638.00 260.00 4660.00 468.00 5867.00 14.3
Karnataka 190.5 2592.2 177.20 2451.20 159.60 2395.90 164.30 2466.40 14.4
M.P. 58.3 1021.5 88.07 1957.00 111.73 2691.00 117.31 2826.00 22.0
Gujarat 62.0 1514.1 61.30 1562.20 28.85 704.38 72.6* 1858.00* 24.9
Bihar 53.3 1082.0 53.81 1236.74 53.02 1107.84 54.32 1304.15 22.0
Andhra
Pradesh 47.8 812.6 48.52 824.77 86.67 1560.06 89.72
1525.18
17.2
A: Area (in ‘000 Ha) P: Production (in ‘000 MT)
Source: State Horticulture Departments $ Prov. *As per Rabi estimates

Present Situation in Onion
• As per Agriwatch estimates, the lower production in Maharashtra in 2013-14 owing to rains and hailstorms is expected to be compensated by higher production in Gujarat and Karnataka.
As per Agriwatch: Total Rabi production - in the range of 95-100 lakh
tons. As per State Government figures: Total Rabi production – around 112 lakh
tons.(assuming 60% of total onion production)

Present Situation in Onion
• As per State Government of Maharashtra:
Total Rabi area ~ 2.14 lakh ha
Affected area by rains & hailstorms ~1.20 lakh ha
2012-13 Rabi onion acreage was 1.56 lakh ha.
It is estimated that total Rabi onion production this year in the
state would be similar to that of last year.
• •• In Karnataka:
Total targeted area for Rabi crop ~21,967 ha.
Sowing was completed in 28,078 ha
Area affected due to hailstorm and rains ~ 1,777 ha.
Rabi yield is expected to be15 ton/ha.
• •• In Madhya Pradesh:
Total area for Rabi crop ~1,17,000 ha.
10–15% of crop loss is expected but exact estimation is
expected to be made after a couple of weeks.

Market Arrival of Onion in 2013-14 vis-a-vis in 2012-13
States/UTs Market Arrival (in '000 MT)
Nov-13 Nov-12 Dec-13 Dec-12 Jan-14 Jan-13 Feb-14 Feb-13 Mar-14 Mar-13 Apr-14 Apr-13
MAHARASHTRA 201.04 191.19 317.84 318.55 467.08 368.92 335.93 307.58 311.58 287.64 236.72 293.48
MADHYA PRADESH 40.04 57.95 34.12 52.18 39.62 35.69 30.6 25.21 37.68 39.18 53.73 57.60
KARNATAKA 151.57 129.37 103.98 80.57 84.3 64.80 72.56 56.28 86.23 57.45 87.99 55.55
ANDHRA PRADESH 19.6 9.49 9.97 8.09 12.85 1.30 13.68 2.06 20.97 3.10 18.12 6.91
GUJARAT 70.62 34.38 181.48 40.48 198.26 112.19 328.6 195.69 268.72 145.90 271.99 80.15
OTHERS 297.5 191.17 455.9 219.30 469.26 271.49 291.34 211.95 339.68 311.15 375.55 305.22
TOTAL 780.37 613.54 1103.29 719.17 1271.37 854.38 1072.71 798.82 1064.86 844.42 1044.1 798.91
Source: AGMARKNET
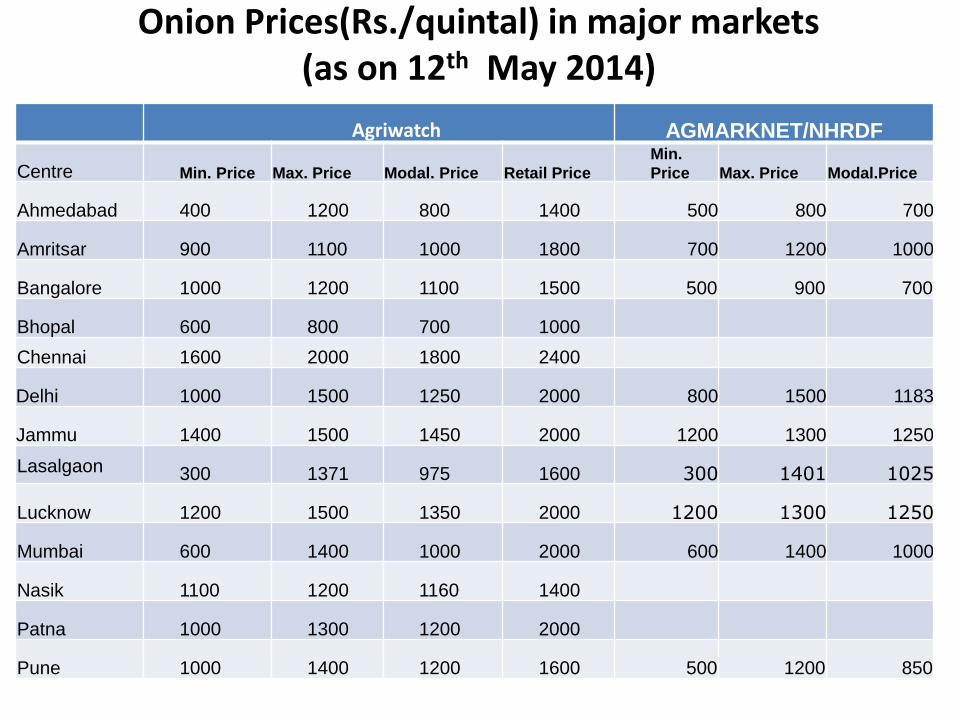
Onion Prices(Rs./quintal) in major markets (as on 12th May 2014)
Agriwatch AGMARKNET/NHRDF
Centre Min. Price Max. Price Modal. Price Retail Price
Min.
Price Max. Price Modal.Price
Ahmedabad 400 1200 800 1400 500 800 700
Amritsar 900 1100 1000 1800 700 1200 1000
Bangalore 1000 1200 1100 1500 500 900 700
Bhopal 600 800 700 1000
Chennai 1600 2000 1800 2400
Delhi 1000 1500 1250 2000 800 1500 1183
Jammu 1400 1500 1450 2000 1200 1300 1250
Lasalgaon 300 1371 975 1600 300 1401 1025
Lucknow 1200 1500 1350 2000 1200 1300 1250
Mumbai 600 1400 1000 2000 600 1400 1000
Nasik 1100 1200 1160 1400
Patna 1000 1300 1200 2000
Pune 1000 1400 1200 1600 500 1200 850

State wise Wholesale Prices(Rs./quintal) Weekly Analysis for
Onion for Major States
State 09-15 May 2014 09-15 May 2013 % Change
(Over Previous Year)
Andhra Pradesh 706.37 916.74 -22.95
Gujarat 626.05 781.06 -19.85
Karnataka 866.26 914.18 -5.24
Madhya Pradesh 686.37 450.24 52.45
Maharashtra 858.97 795.79 7.94
NCT of Delhi 1131.77 891.19 27
Orissa 1283.75 1503.51 -14.62
Punjab 930.15 883.71 5.26
Rajasthan 681.03 703.72 -3.22
Uttar Pradesh 1096.35 1020.53 7.43
West Bengal 1312.71 1193.38 10
Average 1264.6 1102.67 As per the data reported by APMCs

State-wise onion storage during 2010-2014
Quantity in Lakh MT
STATES 2010-11 2011-12
2012-13
(Estimated)
2013-14
(Estimated)
MAHARASHTRA 14.50 15.50 15.00
Information
awaited from
States
GUJARAT 2.00 1.80 0.85
BIHAR & JHARKHAND 1.50 1.50 1.65
HARYANA 0.75 0.75 0.85
KARNATAKA 1.25 1.25 0.85
M.P. & CHHATTISGARH 1.75 1.85 1.25
U.P. & UTTARAKHAND 1.85 1.80 1.75
ORISSA 0.50 0.50 0.50
RAJASTHAN 1.75 1.75 1.85
PUNJAB 0.75 0.75 0.75
TAMIL NADU 1.00 1.00 1.00
ANDHRA PRADESH 0.30 0.45 0.45
OTHERS 0.50 0.60 0.75
TOTAL 28.40 29.50 27.50

Onion Balance Sheet –Agriwatch (as on 24th April 2014)
Year 2014
(Qty in Lakh Tons) Jan, 2014
Feb, 2014
March 2014
April 2014
May 2014
June 2014
July 2014
Aug 2014
Sep 2014
Stored /Carry-in 0.7 0.9 2.6 2.6 25.1 49.8 42.6 29.6 19.4
Fresh Prod/arrivals 12.0 15.0 14.0 40.0 43.0 7.0 0.0 0.0 0.0 Imports 0.0 0.0 0.0 0.0 0.0 0.0 0.0 0.0 0.0
Availability 12.7 15.9 16.6 42.6 68.1 56.8 42.6 29.6 19.4
In LT Storage 0.0 22.5 47.2 40.0 27.0 16.7 6.9
Consumption 10.0 11.0 12.0 12.0 12.0 11.0 11.0 9.0 9.0
Exports 1.2 1.5 1.2 1.5 1.5 1.5 1.2 0.8 0.6 post production losses 0.6 0.8 0.8 4.0 4.8 1.7 0.8 0.5 0.3
Total Usage 11.8 13.3 14.0 17.5 18.3 14.2 13.0 10.3 9.9 Carry out (incl temp storage) 0.9 2.6 2.6 25.1 49.8 42.6 29.6 19.4 9.5

Assumptions made by AGRIWATCH
• Rabi production is expected to be 95-100 Lakh ton. • Higher water content in onion has led to higher post
harvest losses in Maharashtra • Rabi arrivals start from March end and continue till May-
June • Exports till February are actual and from March it is
estimated based on past trend and prices • Post harvest losses are assumed to be 10% of fresh
arrivals and 2% monthly of stored onion • There could be further losses in cold stores like weight
loss etc • Lower production in Maharashtra is compensated by
higher production in Gujarat and Karnataka

Conclusion
• As is evident from the Balance Sheet, there is a monthly surplus even during the months July-September, when there is no fresh production of onion. This is presuming that the post harvest loss in the stored onion is not over 10%.
• If losses in stored onion in Maharashtra and Madhya Pradesh are higher because of onion bulbs rotting due to higher water content, the availability of onions in the months of July to September may be affected.

Critical Issues
• The States of Maharashtra and Madhya Pradesh have not furnished the production figures of onion for 2013-14 in the second advance estimates taking into account the loss incurred due to hailstorms and rains. The area and production figures for onion of Gujarat for 2013-14 are also awaited.
• States need to furnish the onion storage figures for 2013-14.
• In order to work out a month wise balance sheet for onion, it is pertinent for the States to furnish month wise, season wise area, production and storage (Farmer level and in cold storage) figures for onion.

POTATO
SCENARIO

Potato Season
Potato is mainly a Rabi crop in the country.
Sl.
No Region Crop Planting Harvesting
A Hills
North-western Summer January-Feb
July-Aug
North-eastern Summer March-April Sept-Oct
Southern a. Summer March-April Aug-Sept
b. Autumn Aug-Sept Dec-January
c.Spring Jan-Feb May-June
B. Plains:
Northern a. Autum Sep-Oct Dec-January
b.Winter Oct-Nov Feb-March Contributes about 80% of the production
c.Spring Dec-Jan March-Apr
C Plateau a. Kharif June Sept-Oct
b. Rabi Oct-Nov Feb-March

Potato All India Production Year Area (lakh Ha) Production (million MT) Productivity (in MT/Ha)
2010-11 18.63 42.34 22.7
2011-12 19.07 41.48 21.8
2012-13 19.92 45.34
22.8
2013-14 (2nd
Advance)* 20.32 46.61
22.9
* Provisional
0
5
10
15
20
25
30
35
40
45
50
2010-11 2011-12 2012-13 2013-14 (2ndAdvance)*
18.63 19.07 19.92 20.32
42.34 41.48
45.34 46.61
Area (lakh Ha)
Production (millionMT)

Top Potato producing States
States/UTs
2010-11 2011-12 2012-13
2013-14 (2nd est.) * Average Productivity(MT/Ha)
A P A P A P A P
U.P 556.5 13577 568 14125 604 14430 616 15013 24.4
West Bengal 406 13391 377 9693 387 11591 400 12000 29.7
Bihar 314 5784 315 6102 323 6641 318.5 6536 19.7
M.P 62 743 88 1817 109 2299 109.9 2322 18.7
Punjab 84 2088 84 2104 85 2132 87.20 2180 25.0
Gujarat 65 1882 81 2396 81 2500 81 2500 30.1
Others 375 4874 395 5247 404 5750 418 6044 13.7
Total-India 1863 42339 1907 41483 1992 45344 2032 46609 22.5
*Provisional
Units: A: Area in ‘000 Ha P: Production in ‘000 MT

Market Arrival of Potato in 2013-14
vis-a vis in 2012-13
STATES/
UTs
Market Arrival (IN ‘000 MT)
Nov-13 Nov-12 Dec-13 Dec-12 Jan-14 Jan-13 Feb-14 Feb-13 Mar-14 Mar-13 Apr-14 Apr-13
U.P 259.15 276.97 429.73 480.70 688.99 560.51 503.77 483.14 517.76 539.09 425.95 460.28
West
Bengal 22.82 38.28 27.14 38.25 28.72 40.07 32.99 40.97 156.66 201.56 64.21 52.53
M.P 7.85 13.07 23.20 13.51 25.97 17.21 30.12 22.53 25.30 22.44 13.63 8.07
Punjab 28.03 32.45 45.91 65.38 33.64 57.54 30.19 47.00 84.95 41.07 110.96 26.73
Gujarat 38.06 33.46 61.24 56.83 50.11 60.83 43.98 49.28 57.35 57.98 42.26 44.37
Others 577.83 261.89 634.85 300.87 472.18 413.06 357.22 349.21 363.57 395.70 319.77 377.23
Total-
India 933.73 656.12 1222.07 955.81 1299.61 1149.21 998.26 992.12 1205.58 1257.83 976.78 969.20
Source: AGMARKNET
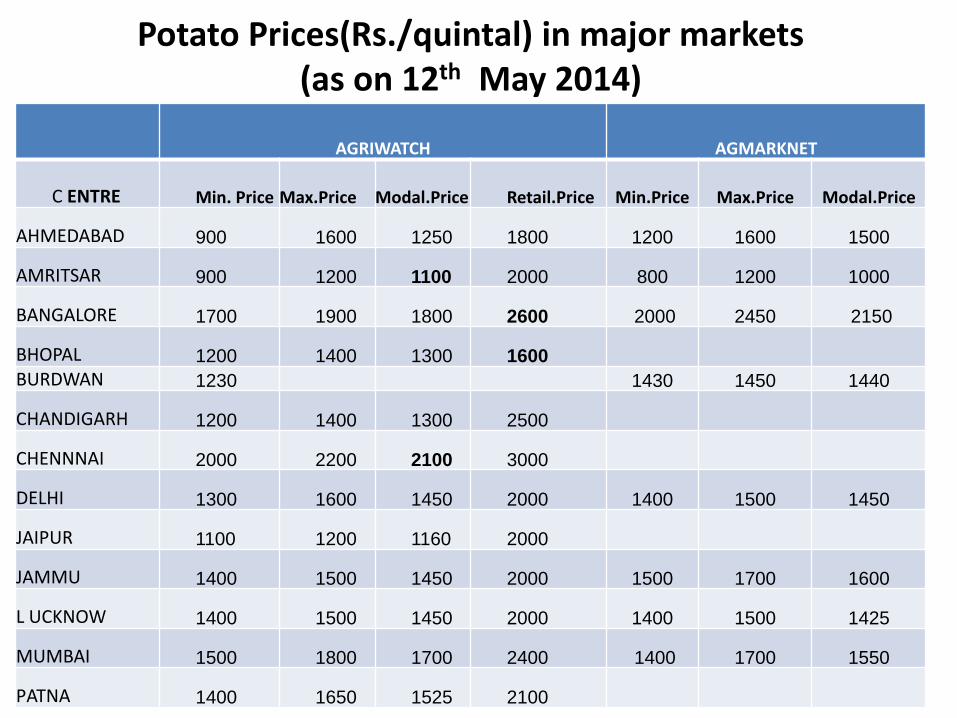
Potato Prices(Rs./quintal) in major markets (as on 12th May 2014)
AGRIWATCH AGMARKNET
C ENTRE Min. Price Max.Price Modal.Price Retail.Price Min.Price Max.Price Modal.Price
AHMEDABAD 900 1600 1250 1800 1200 1600 1500
AMRITSAR 900 1200 1100 2000 800 1200 1000
BANGALORE 1700 1900 1800 2600 2000 2450 2150
BHOPAL 1200 1400 1300 1600
BURDWAN 1230 1430 1450 1440
CHANDIGARH 1200 1400 1300 2500
CHENNNAI 2000 2200 2100 3000
DELHI 1300 1600 1450 2000 1400 1500 1450
JAIPUR 1100 1200 1160 2000
JAMMU 1400 1500 1450 2000 1500 1700 1600
L UCKNOW 1400 1500 1450 2000 1400 1500 1425
MUMBAI 1500 1800 1700 2400 1400 1700 1550
PATNA 1400 1650 1525 2100

State wise Wholesale Prices Weekly Analysis for Potato
Second week May, 2014 Prices in Rs/Quintal
State 09-15 May 2014 09-15 May 2013 % Change
(Over Previous Year)
Andhra Pradesh 1487.59 1113.33 33.62 Gujarat 1421.63 1183.71 20.1 Himachal Pradesh 1506.21 963.49 56.33
Karnataka 1673.41 1347.98 24.14
Madhya Pradesh 943.24 603.92 56.19
Maharashtra 1574.55 1311.29 20.08
NCT of Delhi 1440.09 944.64 52.45 Odisha 1359.03 1061.71 28
Punjab 1081.08 736.6 46.77 Uttar Pradesh 1312.11 850.61 54.26 Uttarakhand 856.11 562.57 52.18 West Bengal 1364.13 800.07 70.5 Average 1528.17 1051.76
As per the data reported by APMCs

Potato Current Scenario
• In Khandauli (Agra), modal prices are hovering in
the range of Rs 1450/ quintal compared to last year price of Rs 1050/ quintal during same time. The reason for higher prices is due to less storage in cold stores.
• In West Bengal, cold storages are filled with approximately 60.84 lakh ton of potatoes.
• In West Bengal, approximately 50% of the Cold storages have opened and expected that rest of the cold storages will open fully after 16 May.

Potato –Future Prices
• Future prices of potatoes are showing sharp increasing trend.
• For delivery of 30th September 2014,
Initial price as on 20 Feb, 2014 : Rs. 1400/ quintal
28th April, 2014 : Rs. 1646/ quintal and now fallen to Rs 1410/qtl.
• Similarly, prices for August, July and June deliveries are also showing falling trend after showing increase in April.
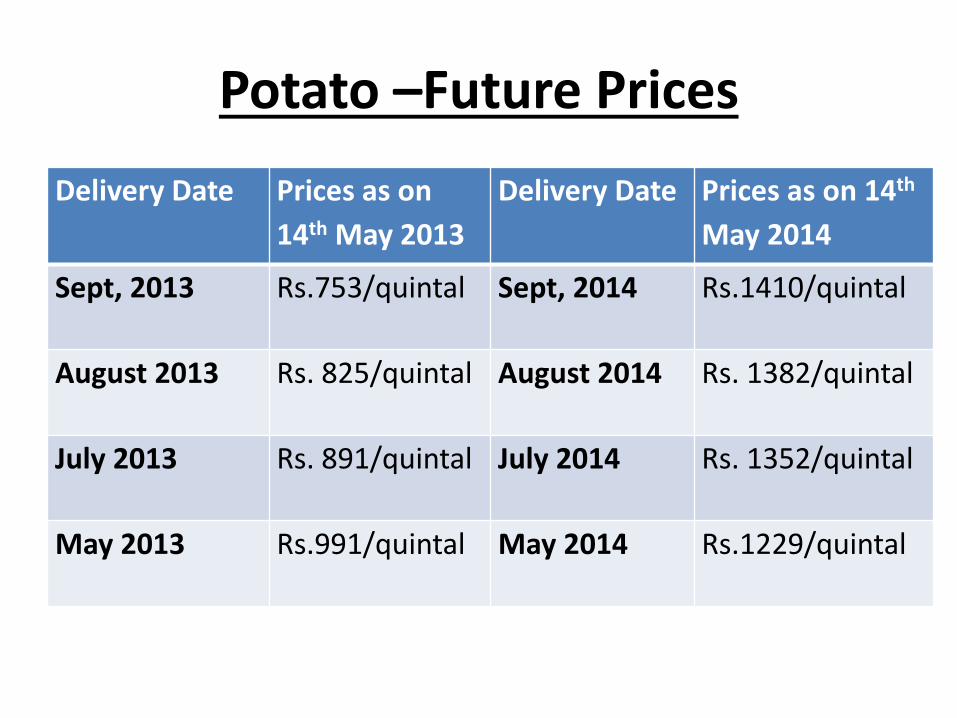
Potato –Future Prices
Delivery Date Prices as on
14th May 2013
Delivery Date Prices as on 14th
May 2014
Sept, 2013 Rs.753/quintal Sept, 2014 Rs.1410/quintal
August 2013 Rs. 825/quintal August 2014 Rs. 1382/quintal
July 2013 Rs. 891/quintal July 2014 Rs. 1352/quintal
May 2013 Rs.991/quintal May 2014 Rs.1229/quintal

Potato Balance Sheet - AGRIWATCH (Figures in million tons)
Population (in billion) 1.175 1.206 1.22 1.23 1.24
Quarterly
Year
2008-09*
2010
2011-12 Nov-Oct
2012-13 Nov-Oct
2013-14 Nov-Oct
2013-14 Nov-Jan
2013-14 Feb-April
2013-14 May-July
2013-14 Aug-Oct
Carry-in(A) 0.00 0.59 3.92 3.92 0.92 25.20 15.18
Production(B) 34.39 42.33 41.48 45.34 41.00 4.00 36.00 1.00 Total Availability (C=A+B) 34.39 42.33 41.48 45.93 44.92 7.92 36.92 25.20 16.18 Table Consumption(D) 22.30 22.91 23.79 24.60 24.80 6.20 6.50 6.10 6.00
Processing Purpose(E) 2.67 2.80 2.94 3.12 3.31 0.00 2.25 1.05 0.00
Post harvest losses (F) 4.07 6.35 8.30 9.07 8.20 0.80 2.47 2.47 2.46
Exports(G) 1.85 1.59 1.71 1.14 1.30 0.00 0.50 0.40 0.40
Usage (H=D+E+F+G) 30.89 33.65 36.74 37.93 37.61 7.00 11.72 10.02 8.86
Seed Purpose (I) 3.42 4.23 4.15 4.08 4.10 0.00 0.00 0.00 4.10
Balance (J=C-H-I) 0.08 4.45 0.59 3.92 3.21 0.92 25.20 15.18 3.22 (* CPRI, Agriwatch Research)

Assumptions made by AGRIWATCH
• Potato production for 2013-14 assumed to be 41 million MT.
• Potato year is taken as November to October, as fresh arrivals starts from Punjab in November.
• Post harvest losses are 15-20%. 20% has been taken for this exercise. Losses in Feb to Oct are equally spread.
• Potato processing industry growing at CAGR 5-6%. • Tables consumption is approximately 19-20 kg/capita. • 60-70% of Rabi production goes to store. • Table consumption is expected to grow at 3% p.a. • Seed requirement is approx 10% of production.
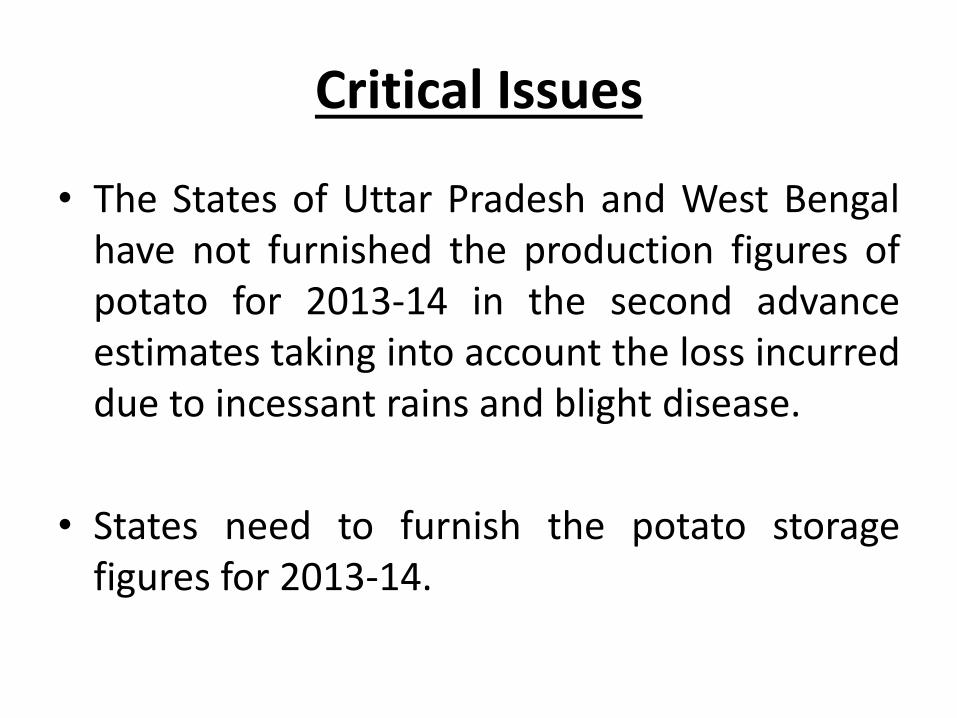
Critical Issues
• The States of Uttar Pradesh and West Bengal have not furnished the production figures of potato for 2013-14 in the second advance estimates taking into account the loss incurred due to incessant rains and blight disease.
• States need to furnish the potato storage figures for 2013-14.

THANK YOU
Related Documents