DATE: September 27, 2005 TO: House Appropriations Subcommittee on Higher Education FROM: Kyle I. Jen, Senior Fiscal Analyst RE: State University Funding Model—UPDATED FOR CONFERENCE REPORT This memo provides a technical explanation of the funding model used to determine state university operations funding amounts for July and August 2006 under section 418 of Article 8 of the conference report for House Bill 4831, the FY 2005-06 omnibus budget bill. Attached are a flowchart illustrating the methodology for distributing funds under the model and a four-page spreadsheet detailing the calculations made to determine state university funding amounts under the model. Initially, the funding model determines full-year funding amounts for each university. The total funding allocated to the 15 state universities under the model is $1,414,319,000. This amount is equal to the total of the following two amounts: • The FY 2005-06 Executive Recommendation for state university operations: $1,400,524,800 • An amount equal to the funding restoration to FY 2004-05 university appropriations resulting from the May 19 Consensus Revenue Estimating Conference: $13,794,200 1 These funds are allocated to three funding components: • Enrollment-based component: 37.5 percent ($530.4 million) is allocated to an enrollment-based component under which the universities receive a base per-student funding amount, with resident students and nonresident undergraduate students funded at a higher level than nonresident graduate students. • Degree-based component: 37.5 percent ($530.4 million) is allocated to a degree-based component under the which the universities receive a funding amount that varies by academic level and program category for each degree conferred. • Research-based component: 25.0 percent ($353.6 million) is allocated to a research-based component under which the universities receive matching funds for science- and engineering- related funds awarded to them by the federal government. These three components are described in greater detail below. 1 Funding for the King-Chavez-Parks programs and the National Charter Schools Institute, while ultimately included in the university operations line items, can be considered distinct from the funds allocated through the funding model. MEMORANDUM

Welcome message from author
This document is posted to help you gain knowledge. Please leave a comment to let me know what you think about it! Share it to your friends and learn new things together.
Transcript

DATE: September 27, 2005 TO: House Appropriations Subcommittee on Higher Education FROM: Kyle I. Jen, Senior Fiscal Analyst RE: State University Funding Model—UPDATED FOR CONFERENCE REPORT This memo provides a technical explanation of the funding model used to determine state university operations funding amounts for July and August 2006 under section 418 of Article 8 of the conference report for House Bill 4831, the FY 2005-06 omnibus budget bill. Attached are a flowchart illustrating the methodology for distributing funds under the model and a four-page spreadsheet detailing the calculations made to determine state university funding amounts under the model. Initially, the funding model determines full-year funding amounts for each university. The total funding allocated to the 15 state universities under the model is $1,414,319,000. This amount is equal to the total of the following two amounts: • The FY 2005-06 Executive Recommendation for state university operations: $1,400,524,800 • An amount equal to the funding restoration to FY 2004-05 university appropriations resulting
from the May 19 Consensus Revenue Estimating Conference: $13,794,2001 These funds are allocated to three funding components: • Enrollment-based component: 37.5 percent ($530.4 million) is allocated to an enrollment-based
component under which the universities receive a base per-student funding amount, with resident students and nonresident undergraduate students funded at a higher level than nonresident graduate students.
• Degree-based component: 37.5 percent ($530.4 million) is allocated to a degree-based
component under the which the universities receive a funding amount that varies by academic level and program category for each degree conferred.
• Research-based component: 25.0 percent ($353.6 million) is allocated to a research-based
component under which the universities receive matching funds for science- and engineering-related funds awarded to them by the federal government.
These three components are described in greater detail below.
1Funding for the King-Chavez-Parks programs and the National Charter Schools Institute, while ultimately included in the university operations line items, can be considered distinct from the funds allocated through the funding model.
M E M O R A N D U M

2
Enrollment-Based Component This component is calculated based on FY 2003-04 fiscal year-equated student (FYES) data from the Higher Education Institutional Data Inventory (HEIDI), a database maintained by the State of Michigan. The FYES measure is a calculated equivalent of the number of full-time students at each university. At the undergraduate level, FYES is equal to student credit hours divided by 30; the calculation differs for the three levels of graduate instruction. The residency definition used in reporting data to HEIDI is based on the residency policies adopted by the individual universities to determine tuition status. Under the funding model, the funding amount per nonresident graduate FYES is set at 75.0 percent of the funding amount per resident FYES or nonresident undergraduate FYES. Given this condition and the amount of funds allocated for the enrollment-based component, the funding amount per resident FYES or nonresident undergraduate FYES is $2,150 and the funding amount per nonresident graduate FYES is $1,613.2 Degree-Based Component This component is based on FY 2003-04 degree data initially reported to the federal Integrated Postsecondary Education Data System (IPEDS) and subsequently included in the HEIDI database. The funding amount awarded for each degree conferred by a university varies based on the academic level and program category of the degree. The weights by academic level are as follows: • 0.25 for an associate's degree • 1.00 for a bachelor's degree • 0.25 for a master's or doctoral degree • 0.50 for a professional degree The weights by program category are as follows: • 1.00 for a degree in a general area • 2.00 for a degree in a natural science-related area • 4.00 for a degree in an engineering- or technology-related area • 4.00 for a degree in a health-related area A table showing the assignment of degree program areas to the four broader categories is attached. These weights are multiplied in sequence—so, for example, a bachelor's degree in a general area (1.00 times 1.00 equals 1.00) would have the same final weight as a master's degree in engineering (0.25 times 4.00 equals 1.00). Given these weights and the amount of funds allocated for this component, the base amount for a bachelor's degree in a general field is equal to $7,039. 2 Throughout the funding model calculations none of the figures have been rounded, so the results vary slightly from the amounts that would be derived from using the rounded amounts appearing in this memo to calculate university funding amounts.

3
Research-Based Component This component is based on a two-year average of data from the National Science Foundation (NSF) on federal obligations to institutions of higher education for research and development and other science- and engineering-related purposes. The data are based on an annual survey of federal agencies conducted by NSF. The most recent data available are for FY 2001-02, so the two-year average is calculated using FY 2000-01 and FY 2001-02 data. The survey reports a single amount for obligations to the University of Michigan; under the funding model, the obligations have been allocated to the university's three campuses (Ann Arbor, Dearborn, and Flint) in proportion to FY 2003-04 current fund expenditures for research at the three campuses using expenditure data from HEIDI. An attached spreadsheet shows the calculations made to determine the data for this component. The amount that a university can receive under this component is capped at 40.0 percent of the total funds allocated to the component, which equates to $141.4 million. Only the University of Michigan-Ann Arbor is directly affected by this cap. Given the cap and the amount of funds allocated for this component, the matching rate for federal obligations is 83.7 percent. Subsection (7) of section 418 states that, if the funding model is used to determine university appropriation amounts in future fiscal years, it is the intent of the Legislature that any future increases in reported federal science- and engineering-related obligations for a university receiving a capped amount of funding in fiscal year 2005-06 will be eligible for increased funding under the funding model. This language would apply to UM-Ann Arbor. Total Funding Amounts The total initial full-year funding amount for each university is equal to the sum of the amounts allocated to that university under each of the three funding components. The total amount of funds allocated is $13.8 million greater than the FY 2005-06 Executive Recommendation. There are significant differences between the unadjusted funding amounts determined by the model and the amounts proposed by the Executive Recommendation on a university-by-university basis. In dollar terms, the differences range from a positive $13.7 million (Grand Valley State) to a negative $35.8 million (Wayne State). In percentage terms, the differences range from a positive 28.9 percent (UM-Dearborn) to a negative 30.5 percent (Northern Michigan). These differences have been moderated by limiting both positive and negative differences from the Executive Recommendation. Positive differences are limited to 10.0 percent, and negative differences are limited to 5.0 percent. Funding is 10.0 percent higher than the Executive Recommendation for five universities: Central, Grand Valley, Oakland, Saginaw Valley, and UM-Dearborn. Eight other universities show positive differences from the Executive Recommendation ranging from 0.3 to 5.0 percent. Two universities—Northern Michigan and Wayne State—show 5.0 percent negative differences from the Executive Recommendation. The budget bill language provides, however, that funds be added to exactly offset those differences. Effectively, then, the full-year funding amounts for those two universities are equal to the Executive Recommendation.

4
Monthly Payment Amounts Under the FY 2005-06 conference report for Higher Education, this funding model is utilized to determine university funding amounts for only July and August 2006—the final two monthly payments of the 11-month payment schedule for state aid to state universities. The payment amount for each of those two months for each university is calculated by dividing the full-year funding model amount by 11. The total payment amount for each month is $130.8 million; the total for the two months combined is $261.6 million. The total July/August funding model amounts are higher than the amounts that would have been paid in those two months under the Executive Recommendation for 13 universities. The positive differences for those universities range from $10,800 (UM-Flint) to $1.4 million (Central). The total increase in funding from the Executive Recommendation is $6,951,700. In addition to this funding increase, the FY 2005-06 conference report for Higher Education also includes a $2.5 million across-the-board increase and a $6.9 million increase to establish a funding floor of $3,650 per FYES. The across-the-board and funding floor increases will be included in the nine equal payments that will be made to the universities over the nine months from October 2005 through June 2006 pursuant to section 212(1) of Article 8 of the omnibus conference report. Attachments (4) c: Mitch Bean Mary Ann Cleary Key Staff

HFA: 9/27/05
State University Funding ModelConference Report
Total Funds Allocated: $1.414 billion
Enrollment-basedComponent Degree-based Component Research-based
Component
37.5%=$530 million 37.5%=$530 million 25.0%=$354 million
(ResidentFYES +
NonresidentUndegrad.
FYES)X
$2,150
NonresidentGraduate
FYESX
$1,613(75% ofresidentamount)
$ Amount perAssociate’s Degree
General: $1,760Nat Sci: $3,519
Eng/Tech: $7,039Health: $7,039
$ Amount perBachelor’s Degree
General: $7,039Nat Sci: $14,077
Eng/Tech: $28,154Health: $28,154
Federal Science/Engineering Obligations
(Two-Year Avg.)X
83.7%Cap=40% of component $
Degree Weights:Academic Level Program CategoryAssociate’s: 0.25 General: 1.00 Base amount for Bachelor’s: 1.00 Natural Science: 2.00 bachelor’s degreeMaster’s/Doctoral: 0.25 Engineering/Tech: 4.00 in a generalProfessional: 0.50 Health: 4.00 field: $7,039
FYES=Fiscal YearEquated Students
$ Amount perMaster’s/Doc Degree
General: $1,760Nat Sci: $3,519
Eng/Tech: $7,039Health: $7,039
$ Amount perProfessional Degree
General: $3,519Health: $14,077
Note: Flowchart reflectscalculation of full-yearfunding amounts prior toimposition of limits vs.Exec Rec.
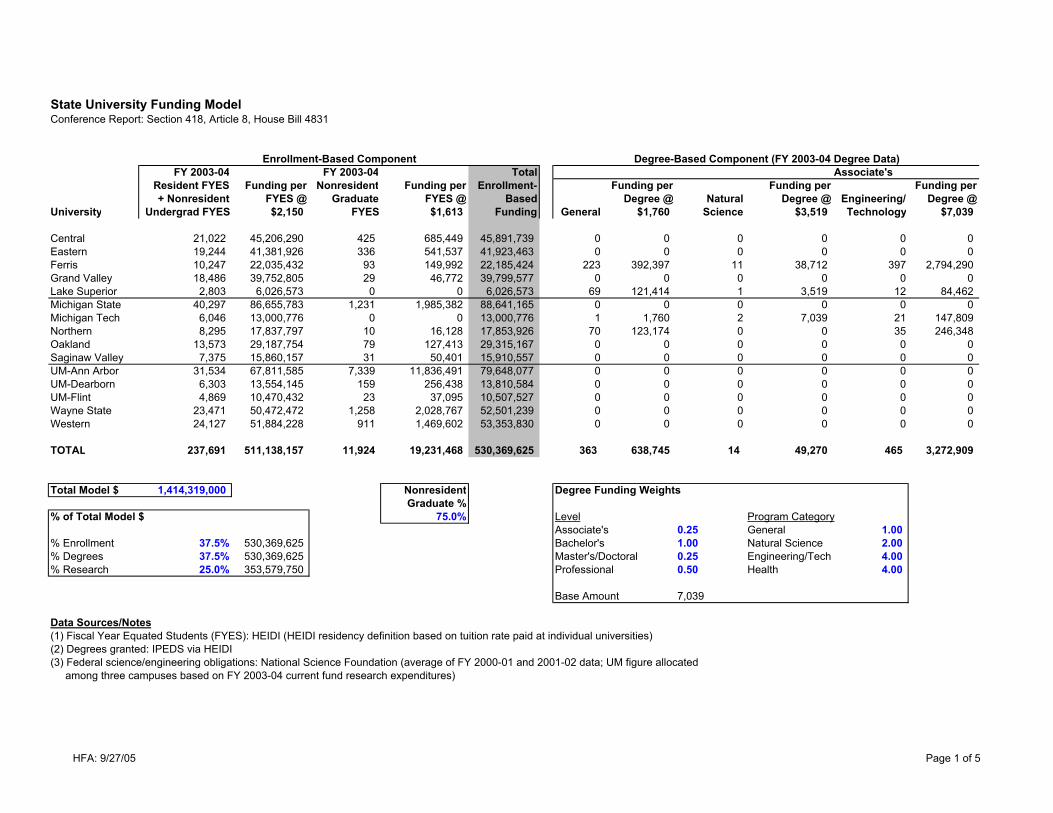
State University Funding ModelConference Report: Section 418, Article 8, House Bill 4831
FY 2003-04 FY 2003-04 TotalResident FYES Funding per Nonresident Funding per Enrollment- Funding per Funding per Funding per+ Nonresident FYES @ Graduate FYES @ Based Degree @ Natural Degree @ Engineering/ Degree @
University Undergrad FYES $2,150 FYES $1,613 Funding General $1,760 Science $3,519 Technology $7,039
Central 21,022 45,206,290 425 685,449 45,891,739 0 0 0 0 0 0Eastern 19,244 41,381,926 336 541,537 41,923,463 0 0 0 0 0 0Ferris 10,247 22,035,432 93 149,992 22,185,424 223 392,397 11 38,712 397 2,794,290Grand Valley 18,486 39,752,805 29 46,772 39,799,577 0 0 0 0 0 0Lake Superior 2,803 6,026,573 0 0 6,026,573 69 121,414 1 3,519 12 84,462Michigan State 40,297 86,655,783 1,231 1,985,382 88,641,165 0 0 0 0 0 0Michigan Tech 6,046 13,000,776 0 0 13,000,776 1 1,760 2 7,039 21 147,809Northern 8,295 17,837,797 10 16,128 17,853,926 70 123,174 0 0 35 246,348Oakland 13,573 29,187,754 79 127,413 29,315,167 0 0 0 0 0 0Saginaw Valley 7,375 15,860,157 31 50,401 15,910,557 0 0 0 0 0 0UM-Ann Arbor 31,534 67,811,585 7,339 11,836,491 79,648,077 0 0 0 0 0 0UM-Dearborn 6,303 13,554,145 159 256,438 13,810,584 0 0 0 0 0 0UM-Flint 4,869 10,470,432 23 37,095 10,507,527 0 0 0 0 0 0Wayne State 23,471 50,472,472 1,258 2,028,767 52,501,239 0 0 0 0 0 0Western 24,127 51,884,228 911 1,469,602 53,353,830 0 0 0 0 0 0
TOTAL 237,691 511,138,157 11,924 19,231,468 530,369,625 363 638,745 14 49,270 465 3,272,909
Total Model $ 1,414,319,000 Nonresident Degree Funding WeightsGraduate %
% of Total Model $ 75.0% Level Program CategoryAssociate's 0.25 General 1.00
% Enrollment 37.5% 530,369,625 Bachelor's 1.00 Natural Science 2.00% Degrees 37.5% 530,369,625 Master's/Doctoral 0.25 Engineering/Tech 4.00% Research 25.0% 353,579,750 Professional 0.50 Health 4.00
Base Amount 7,039
Data Sources/Notes(1) Fiscal Year Equated Students (FYES): HEIDI (HEIDI residency definition based on tuition rate paid at individual universities)(2) Degrees granted: IPEDS via HEIDI(3) Federal science/engineering obligations: National Science Foundation (average of FY 2000-01 and 2001-02 data; UM figure allocated among three campuses based on FY 2003-04 current fund research expenditures)
Associate'sEnrollment-Based Component Degree-Based Component (FY 2003-04 Degree Data)
HFA: 9/27/05 Page 1 of 5

Funding per Funding per Funding per Funding per Funding per Funding perDegree @ Degree @ Natural Degree @ Engineering/ Degree @ Degree @ Degree @
University Health $7,039 General $7,039 Science $14,077 Technology $28,154 Health $28,154 General $1,760
Central 0 0 2,922 20,566,538 141 1,984,861 241 6,785,127 244 6,869,590 2,065 3,633,633Eastern 0 0 2,352 16,554,585 83 1,168,393 252 7,094,822 197 5,546,349 1,106 1,946,149Ferris 203 1,428,818 866 6,095,353 32 450,465 388 10,923,774 136 3,828,952 92 161,886Grand Valley 0 0 2,112 14,865,342 223 3,139,177 161 4,532,803 184 5,180,346 692 1,217,663Lake Superior 9 63,347 365 2,569,058 47 661,620 63 1,773,706 36 1,013,546 6 10,558Michigan State 0 0 5,665 39,873,182 1,103 15,526,962 725 20,411,691 290 8,164,676 1,799 3,165,572Michigan Tech 0 0 180 1,266,933 94 1,323,241 758 21,340,774 10 281,541 35 61,587Northern 25 175,963 830 5,841,967 101 1,421,780 81 2,280,479 89 2,505,711 185 325,531Oakland 0 0 1,542 10,853,389 119 1,675,166 205 5,771,581 162 4,560,957 646 1,136,720Saginaw Valley 0 0 869 6,116,469 38 534,927 113 3,181,408 65 1,830,014 466 819,987UM-Ann Arbor 0 0 4,022 28,308,903 436 6,137,584 1,335 37,585,665 130 3,660,027 2,144 3,772,643UM-Dearborn 0 0 762 5,363,348 74 1,041,700 216 6,081,276 8 225,232 302 531,408UM-Flint 0 0 685 4,821,382 44 619,389 30 844,622 110 3,096,946 128 225,232Wayne State 0 0 1,681 11,831,742 158 2,224,170 244 6,869,590 297 8,361,755 1,766 3,107,504Western 0 0 3,485 24,529,221 170 2,393,095 479 13,485,793 165 4,645,419 1,205 2,120,352
TOTAL 237 1,668,128 28,338 199,457,409 2,863 40,302,531 5,291 148,963,110 2,123 59,771,061 12,637 22,236,425
Bachelor'sDegree-Based Component (FY 2003-04 Degree Data)
HFA: 9/27/05 Page 2 of 5
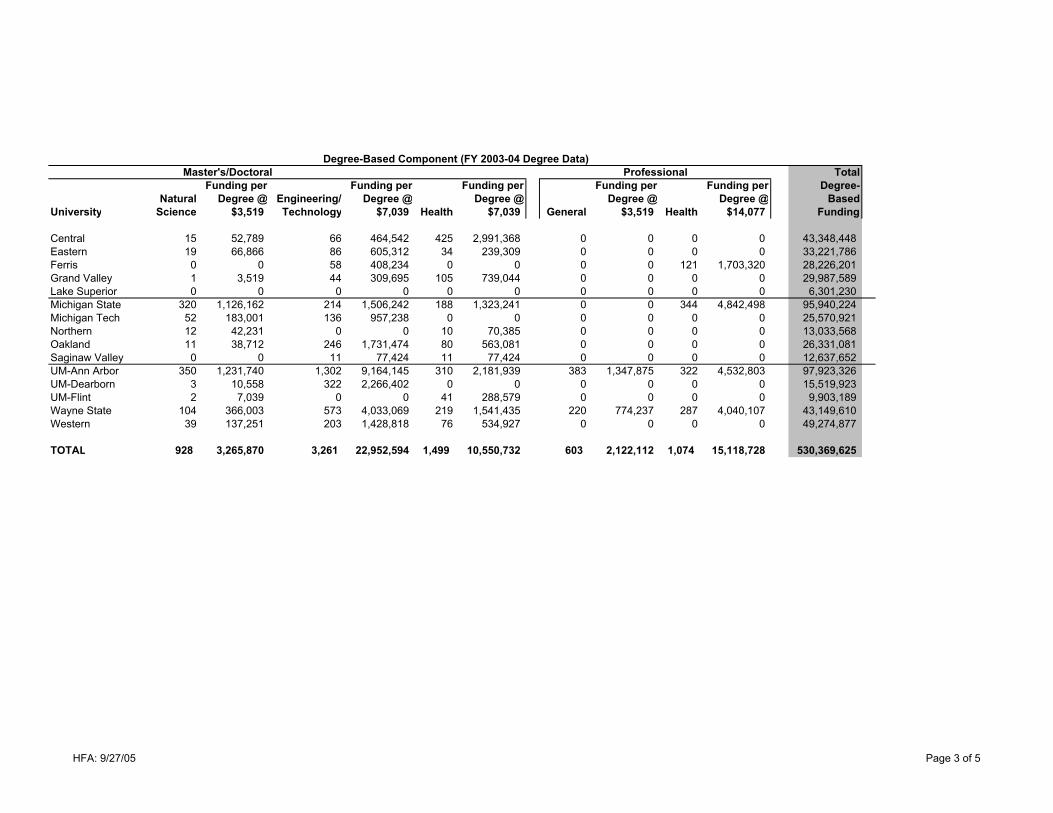
TotalFunding per Funding per Funding per Funding per Funding per Degree-
Natural Degree @ Engineering/ Degree @ Degree @ Degree @ Degree @ BasedUniversity Science $3,519 Technology $7,039 Health $7,039 General $3,519 Health $14,077 Funding
Central 15 52,789 66 464,542 425 2,991,368 0 0 0 0 43,348,448Eastern 19 66,866 86 605,312 34 239,309 0 0 0 0 33,221,786Ferris 0 0 58 408,234 0 0 0 0 121 1,703,320 28,226,201Grand Valley 1 3,519 44 309,695 105 739,044 0 0 0 0 29,987,589Lake Superior 0 0 0 0 0 0 0 0 0 0 6,301,230Michigan State 320 1,126,162 214 1,506,242 188 1,323,241 0 0 344 4,842,498 95,940,224Michigan Tech 52 183,001 136 957,238 0 0 0 0 0 0 25,570,921Northern 12 42,231 0 0 10 70,385 0 0 0 0 13,033,568Oakland 11 38,712 246 1,731,474 80 563,081 0 0 0 0 26,331,081Saginaw Valley 0 0 11 77,424 11 77,424 0 0 0 0 12,637,652UM-Ann Arbor 350 1,231,740 1,302 9,164,145 310 2,181,939 383 1,347,875 322 4,532,803 97,923,326UM-Dearborn 3 10,558 322 2,266,402 0 0 0 0 0 0 15,519,923UM-Flint 2 7,039 0 0 41 288,579 0 0 0 0 9,903,189Wayne State 104 366,003 573 4,033,069 219 1,541,435 220 774,237 287 4,040,107 43,149,610Western 39 137,251 203 1,428,818 76 534,927 0 0 0 0 49,274,877
TOTAL 928 3,265,870 3,261 22,952,594 1,499 10,550,732 603 2,122,112 1,074 15,118,728 530,369,625
Master's/Doctoral ProfessionalDegree-Based Component (FY 2003-04 Degree Data)
HFA: 9/27/05 Page 3 of 5

+ Difference 10.0%- Difference 5.0%
2-Year Avg Match Rate:Federal 83.7% Total $ Difference % Difference $ Difference % Difference
Science/Engin Cap: 40% of Model FY 2005-06 Model from Model from *Full-Year Model from Model fromUniversity Obligations Component $ Funding Exec Rec Exec Rec Exec Rec Funding Exec Rec Exec Rec
Central 418,500 350,453 89,590,640 77,797,000 11,793,640 15.2 85,576,700 7,779,700 10.0Eastern 1,116,500 934,961 76,080,211 75,712,000 368,211 0.5 76,080,200 368,200 0.5Ferris 23,500 19,679 50,431,304 48,010,900 2,420,404 5.0 50,431,300 2,420,400 5.0Grand Valley 900,000 753,663 70,540,829 56,806,100 13,734,729 24.2 62,486,700 5,680,600 10.0Lake Superior 235,000 196,790 12,524,593 12,403,400 121,193 1.0 12,524,600 121,200 1.0Michigan State 121,483,000 101,730,321 286,311,710 282,130,700 4,181,010 1.5 286,311,700 4,181,000 1.5Michigan Tech 11,343,500 9,499,090 48,070,787 47,707,500 363,287 0.8 48,070,800 363,300 0.8Northern 357,500 299,372 31,186,866 44,887,400 (13,700,534) (30.5) 42,643,000 (2,244,400) (5.0)Oakland 4,449,500 3,726,028 59,372,276 47,076,000 12,296,276 26.1 51,783,600 4,707,600 10.0Saginaw Valley 575,500 481,926 29,030,135 25,611,600 3,418,535 13.3 28,172,800 2,561,200 10.0UM-Ann Arbor 443,269,022 141,431,900 319,003,302 314,733,000 4,270,302 1.4 319,003,300 4,270,300 1.4UM-Dearborn 2,207,814 1,848,832 31,179,339 24,179,500 6,999,839 28.9 26,597,500 2,418,000 10.0UM-Flint 514,164 430,563 20,841,279 20,782,000 59,279 0.3 20,841,300 59,300 0.3Wayne State 98,551,500 82,527,397 178,178,246 214,013,900 (35,835,654) (16.7) 203,313,200 (10,700,700) (5.0)Western 11,164,000 9,348,776 111,977,482 108,673,800 3,303,682 3.0 111,977,500 3,303,700 3.0
TOTAL 696,609,000 353,579,750 1,414,319,000 1,400,524,800 13,794,200 1.0 1,425,814,200 25,289,400 1.8
*Amounts rounded to nearestincrement of one hundred
Limit Differences from Exec RecUnadjusted Funding Model ResultsResearch-Based Component
HFA: 9/27/05 Page 4 of 5
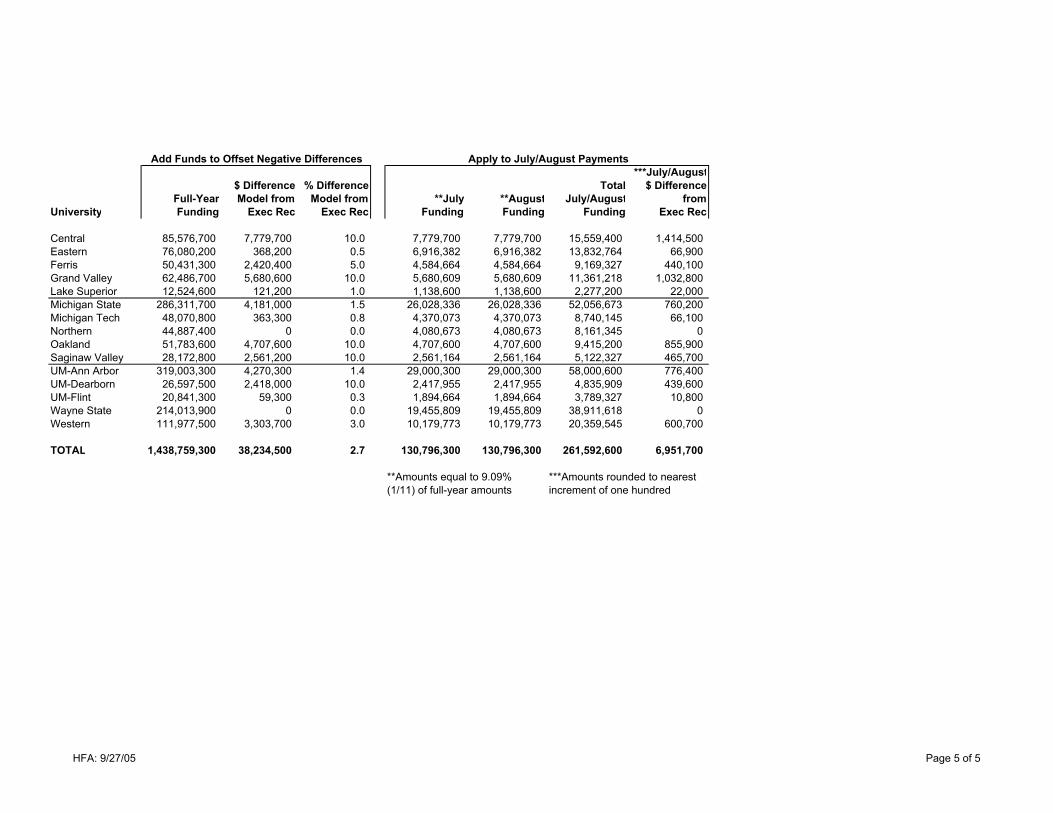
***July/August$ Difference % Difference Total $ Difference
Full-Year Model from Model from **July **August July/August fromUniversity Funding Exec Rec Exec Rec Funding Funding Funding Exec Rec
Central 85,576,700 7,779,700 10.0 7,779,700 7,779,700 15,559,400 1,414,500Eastern 76,080,200 368,200 0.5 6,916,382 6,916,382 13,832,764 66,900Ferris 50,431,300 2,420,400 5.0 4,584,664 4,584,664 9,169,327 440,100Grand Valley 62,486,700 5,680,600 10.0 5,680,609 5,680,609 11,361,218 1,032,800Lake Superior 12,524,600 121,200 1.0 1,138,600 1,138,600 2,277,200 22,000Michigan State 286,311,700 4,181,000 1.5 26,028,336 26,028,336 52,056,673 760,200Michigan Tech 48,070,800 363,300 0.8 4,370,073 4,370,073 8,740,145 66,100Northern 44,887,400 0 0.0 4,080,673 4,080,673 8,161,345 0Oakland 51,783,600 4,707,600 10.0 4,707,600 4,707,600 9,415,200 855,900Saginaw Valley 28,172,800 2,561,200 10.0 2,561,164 2,561,164 5,122,327 465,700UM-Ann Arbor 319,003,300 4,270,300 1.4 29,000,300 29,000,300 58,000,600 776,400UM-Dearborn 26,597,500 2,418,000 10.0 2,417,955 2,417,955 4,835,909 439,600UM-Flint 20,841,300 59,300 0.3 1,894,664 1,894,664 3,789,327 10,800Wayne State 214,013,900 0 0.0 19,455,809 19,455,809 38,911,618 0Western 111,977,500 3,303,700 3.0 10,179,773 10,179,773 20,359,545 600,700
TOTAL 1,438,759,300 38,234,500 2.7 130,796,300 130,796,300 261,592,600 6,951,700
**Amounts equal to 9.09% ***Amounts rounded to nearest(1/11) of full-year amounts increment of one hundred
Add Funds to Offset Negative Differences Apply to July/August Payments
HFA: 9/27/05 Page 5 of 5
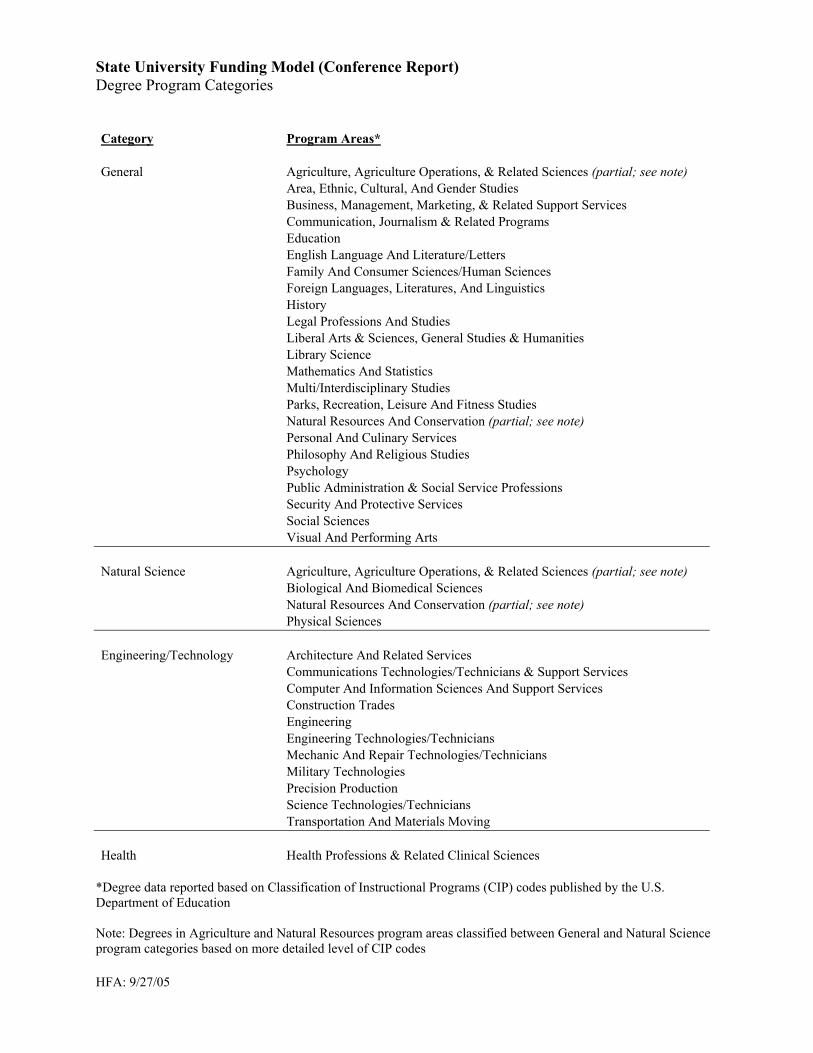
State University Funding Model (Conference Report) Degree Program Categories Category Program Areas* General Agriculture, Agriculture Operations, & Related Sciences (partial; see note) Area, Ethnic, Cultural, And Gender Studies
Business, Management, Marketing, & Related Support Services Communication, Journalism & Related Programs Education English Language And Literature/Letters Family And Consumer Sciences/Human Sciences Foreign Languages, Literatures, And Linguistics History Legal Professions And Studies Liberal Arts & Sciences, General Studies & Humanities Library Science Mathematics And Statistics Multi/Interdisciplinary Studies Parks, Recreation, Leisure And Fitness Studies Natural Resources And Conservation (partial; see note) Personal And Culinary Services Philosophy And Religious Studies Psychology Public Administration & Social Service Professions Security And Protective Services Social Sciences Visual And Performing Arts
Natural Science Agriculture, Agriculture Operations, & Related Sciences (partial; see note) Biological And Biomedical Sciences Natural Resources And Conservation (partial; see note) Physical Sciences
Engineering/Technology Architecture And Related Services Communications Technologies/Technicians & Support Services Computer And Information Sciences And Support Services Construction Trades Engineering Engineering Technologies/Technicians Mechanic And Repair Technologies/Technicians Military Technologies Precision Production Science Technologies/Technicians Transportation And Materials Moving
Health Health Professions & Related Clinical Sciences *Degree data reported based on Classification of Instructional Programs (CIP) codes published by the U.S. Department of Education Note: Degrees in Agriculture and Natural Resources program areas classified between General and Natural Science program categories based on more detailed level of CIP codes HFA: 9/27/05
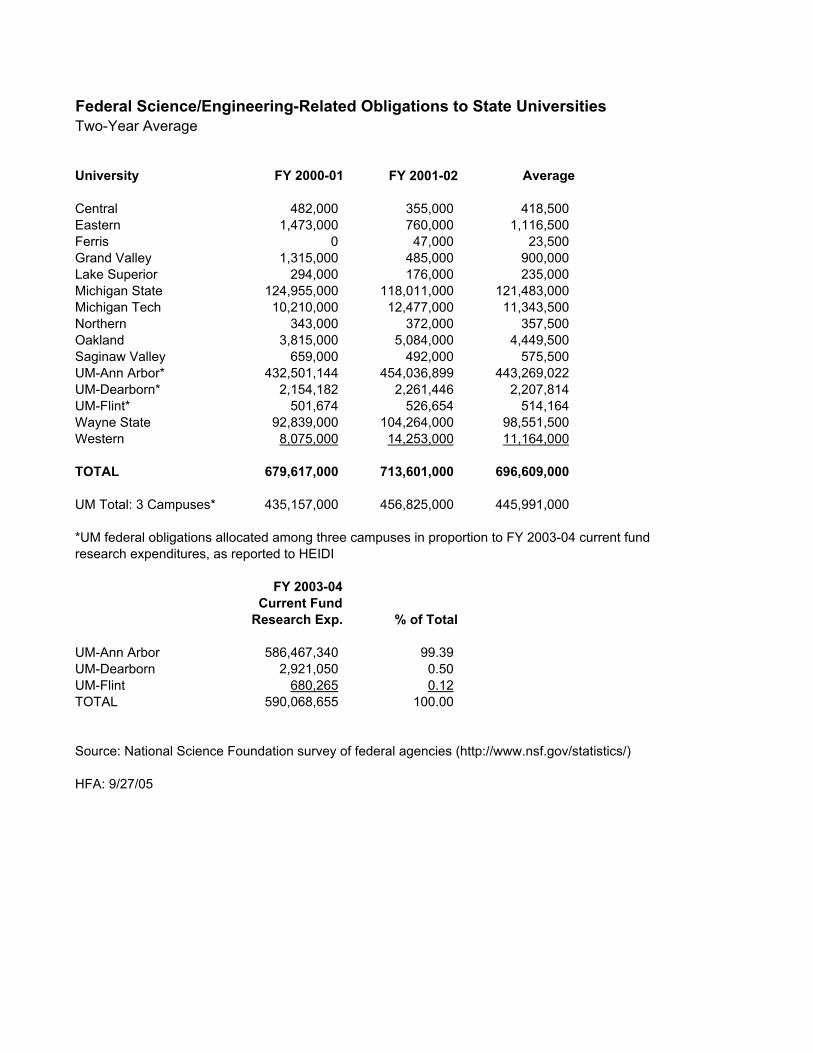
Federal Science/Engineering-Related Obligations to State UniversitiesTwo-Year Average
University FY 2000-01 FY 2001-02 Average
Central 482,000 355,000 418,500Eastern 1,473,000 760,000 1,116,500Ferris 0 47,000 23,500Grand Valley 1,315,000 485,000 900,000Lake Superior 294,000 176,000 235,000Michigan State 124,955,000 118,011,000 121,483,000Michigan Tech 10,210,000 12,477,000 11,343,500Northern 343,000 372,000 357,500Oakland 3,815,000 5,084,000 4,449,500Saginaw Valley 659,000 492,000 575,500UM-Ann Arbor* 432,501,144 454,036,899 443,269,022UM-Dearborn* 2,154,182 2,261,446 2,207,814UM-Flint* 501,674 526,654 514,164Wayne State 92,839,000 104,264,000 98,551,500Western 8,075,000 14,253,000 11,164,000
TOTAL 679,617,000 713,601,000 696,609,000
UM Total: 3 Campuses* 435,157,000 456,825,000 445,991,000
FY 2003-04Current Fund
Research Exp. % of Total
UM-Ann Arbor 586,467,340 99.39UM-Dearborn 2,921,050 0.50UM-Flint 680,265 0.12TOTAL 590,068,655 100.00
Source: National Science Foundation survey of federal agencies (http://www.nsf.gov/statistics/)
HFA: 9/27/05
*UM federal obligations allocated among three campuses in proportion to FY 2003-04 current fund research expenditures, as reported to HEIDI
Related Documents