1984314.16.1.AM.RTL October 2018 Edition State Street Global Advisors SPDR ® ETFs Chart Pack Please see Appendix D for more information on investment terms used in this Chart Pack.

Welcome message from author
This document is posted to help you gain knowledge. Please leave a comment to let me know what you think about it! Share it to your friends and learn new things together.
Transcript
1984314.16.1.AM.RTL
October 2018 Edition
State Street Global Advisors
SPDR® ETFs Chart Pack
Please see Appendix D for more information on investment terms used in this Chart Pack.
Chart Pack Table of Contents
2
I. Market Environment
• Performance
• Investor Confidence
• Volatility
• Midterm Elections
• Risk
• Active Environment
Barometer
• State Street Current
Positioning
II. Global Flows & Fundamentals, US Factors
• Asset Class Flows
• Global Earnings
• Earnings Guidance
• Valuations
• US Factor Trends
• Growth vs. Value
III. Sectors
• Flows & Returns
• Sector Scorecard
• Sector Trends
• Sector Earnings
IV. Fixed Income
• Yield Curve
• Global Yield
• Inflation
• Treasury Positions
• Bond Market
• Short Duration
• Credit Trends
• EM Debt
1984314.16.1.AM.RTL

Market Environment
3 1984314.16.1.AM.RTL
17.9
15.2
2.7
-0.8
3.0
4.9
-1.7 -1.2 -1.6
-7.5
0.9
2.2
10.6 11.5
-1.4
-7.7
2.6 3.9
-2.5 -1.6 -1.7
-8.0
-3.4
3.3
0.6 -2.4
0.9 -0.5
0.6 0.7
1.2 -0.6 -0.9 -1.3
1.7
0.0
US LARGE CAP US SMALL CAP DEVELOPED EMERGING HIGH YIELD SENIOR LOAN EM HARDCURRENCY DEBT
AGG TREASURIES GOLD BROADCOMMODITIES
US DOLLAR
S&P 500 Index Russell 2000Index
MSCI EAFE Index MSCI EmergingMarkets Index
BloombergBarclays US
Corporate HighYield Index
S&P/LSTALeveraged Loan
100 Index
BloombergBarclays EM
Hard CurrencyIndex
BloombergBarclays US
Aggregate Index
BloombergBarclays US
Treasury Index
LBMA Gold Price BloombergCommodity
Index
DXY Dollar Index
Trailing 12 Month YTD Prior Month
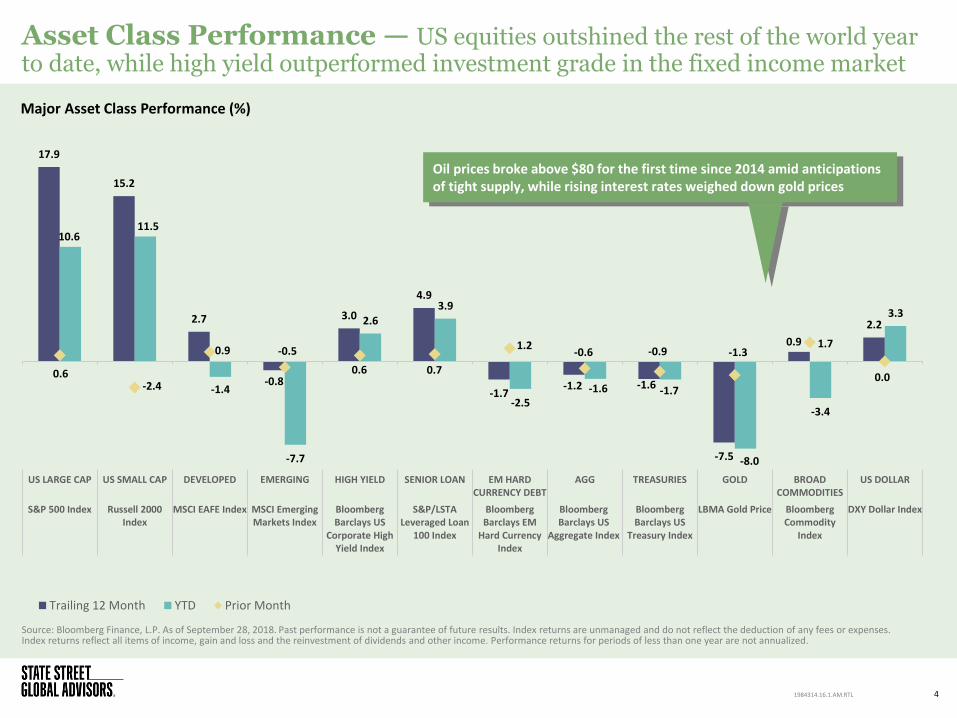
Asset Class Performance — US equities outshined the rest of the world year to date, while high yield outperformed investment grade in the fixed income market
Source: Bloomberg Finance, L.P. As of September 28, 2018. Past performance is not a guarantee of future results. Index returns are unmanaged and do not reflect the deduction of any fees or expenses. Index returns reflect all items of income, gain and loss and the reinvestment of dividends and other income. Performance returns for periods of less than one year are not annualized.
Major Asset Class Performance (%)
4 1984314.16.1.AM.RTL
Oil prices broke above $80 for the first time since 2014 amid anticipations of tight supply, while rising interest rates weighed down gold prices
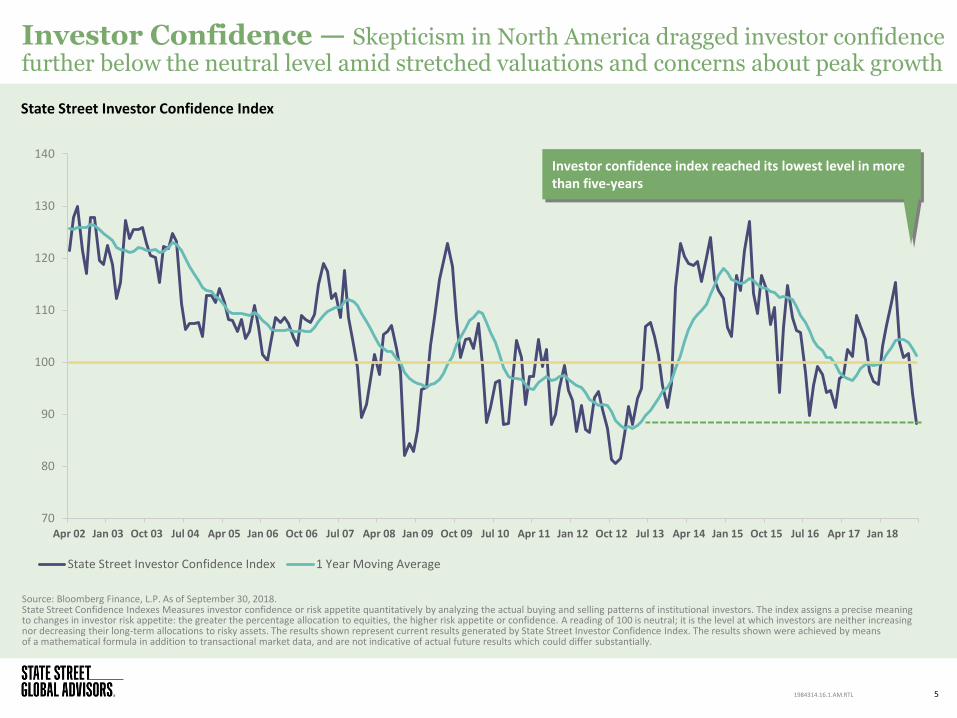
Investor Confidence — Skepticism in North America dragged investor confidence further below the neutral level amid stretched valuations and concerns about peak growth
Source: Bloomberg Finance, L.P. As of September 30, 2018. State Street Confidence Indexes Measures investor confidence or risk appetite quantitatively by analyzing the actual buying and selling patterns of institutional investors. The index assigns a precise meaning to changes in investor risk appetite: the greater the percentage allocation to equities, the higher risk appetite or confidence. A reading of 100 is neutral; it is the level at which investors are neither increasing nor decreasing their long-term allocations to risky assets. The results shown represent current results generated by State Street Investor Confidence Index. The results shown were achieved by means of a mathematical formula in addition to transactional market data, and are not indicative of actual future results which could differ substantially.
State Street Investor Confidence Index
5 1984314.16.1.AM.RTL
70
80
90
100
110
120
130
140
Apr 02 Jan 03 Oct 03 Jul 04 Apr 05 Jan 06 Oct 06 Jul 07 Apr 08 Jan 09 Oct 09 Jul 10 Apr 11 Jan 12 Oct 12 Jul 13 Apr 14 Jan 15 Oct 15 Jul 16 Apr 17 Jan 18
State Street Investor Confidence Index 1 Year Moving Average
Investor confidence index reached its lowest level in more than five-years
90
71
60 62
78
37
88
73
58 61
72
30
118
124 128
115
122
101
76
68
45 49
57
30
76
70
47 50
60
48
25
45
65
85
105
125
145
Currency Rates Oil S&P 500 Index Emerging Markets Equity U.S. High Yield CorproateBonds
Imp
lied
Vo
lati
lity
Ind
ex
Leve
l (B
ase
= 1
00
)
Current Last month Max Min 1/1/2018
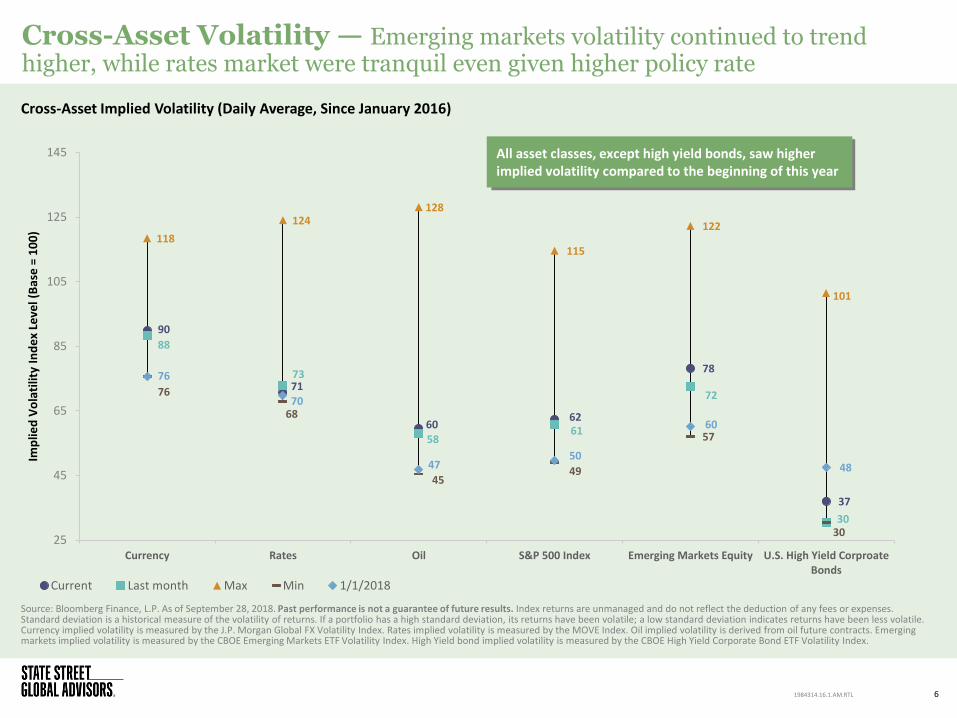
Cross-Asset Volatility — Emerging markets volatility continued to trend higher, while rates market were tranquil even given higher policy rate
Source: Bloomberg Finance, L.P. As of September 28, 2018. Past performance is not a guarantee of future results. Index returns are unmanaged and do not reflect the deduction of any fees or expenses. Standard deviation is a historical measure of the volatility of returns. If a portfolio has a high standard deviation, its returns have been volatile; a low standard deviation indicates returns have been less volatile. Currency implied volatility is measured by the J.P. Morgan Global FX Volatility Index. Rates implied volatility is measured by the MOVE Index. Oil implied volatility is derived from oil future contracts. Emerging markets implied volatility is measured by the CBOE Emerging Markets ETF Volatility Index. High Yield bond implied volatility is measured by the CBOE High Yield Corporate Bond ETF Volatility Index.
6 1984314.16.1.AM.RTL
Cross-Asset Implied Volatility (Daily Average, Since January 2016)
All asset classes, except high yield bonds, saw higher implied volatility compared to the beginning of this year
0
5
10
15
20
25
-2
-1
0
1
2
3
4
Jan Feb Mar Apr May Jun Jul Aug Sep Oct Nov Dec
VIX
Ind
ex
Re
turn
(%
)
Avg Monthly S&P 500 Return: Midterm year Avg Monthly S&P 500 Return: Non-midterm year Average Monthly Return Avg VIX Index (Since 1990)
Source: State Street Global Advisors. Strategas Research, govtrack.us, As of September 28, 2018. Past performance is not a guarantee of future results. Index returns are unmanaged and do not reflect the deduction of any fees or expenses.
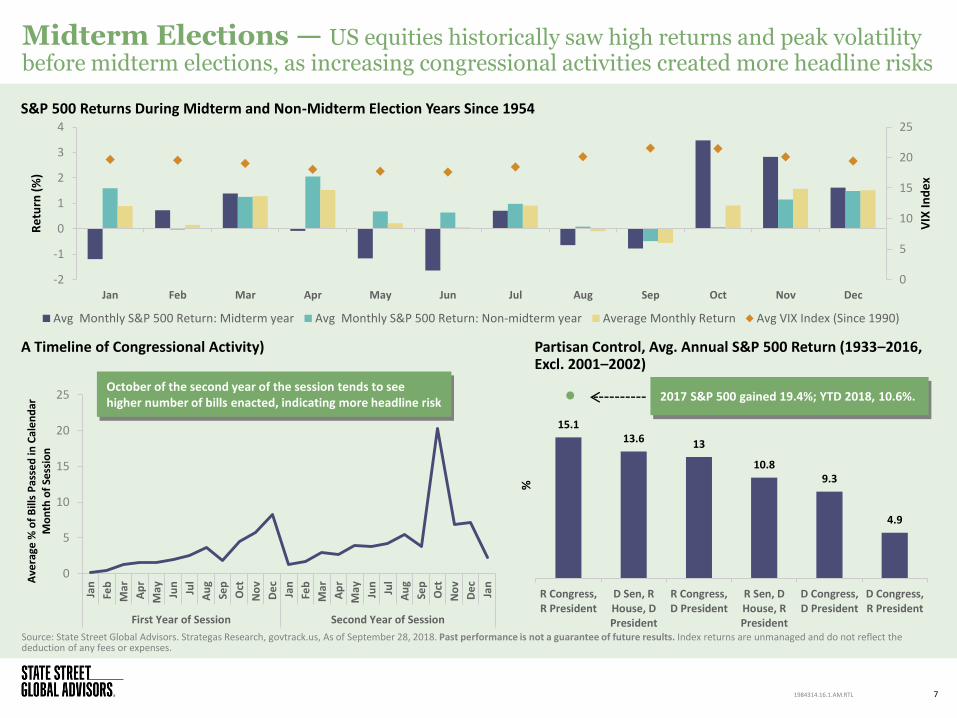
Midterm Elections — US equities historically saw high returns and peak volatility before midterm elections, as increasing congressional activities created more headline risks
7 1984314.16.1.AM.RTL
S&P 500 Returns During Midterm and Non-Midterm Election Years Since 1954
15.1 13.6 13
10.8 9.3
4.9
R Congress,R President
D Sen, RHouse, DPresident
R Congress,D President
R Sen, DHouse, RPresident
D Congress,D President
D Congress,R President
%
2017 S&P 500 gained 19.4%; YTD 2018, 10.6%.
Partisan Control, Avg. Annual S&P 500 Return (1933–2016, Excl. 2001–2002)
A Timeline of Congressional Activity)
0
5
10
15
20
25
Jan
Feb
Mar
Ap
r
May Jun
Jul
Au
g
Sep
Oct
No
v
De
c
Jan
Feb
Mar
Ap
r
May Jun
Jul
Au
g
Sep
Oct
No
v
De
c
Jan
First Year of Session Second Year of Session
Ave
rage
% o
f B
ills
Pas
sed
in C
ale
nd
ar
Mo
nth
of
Sess
ion
October of the second year of the session tends to see higher number of bills enacted, indicating more headline risk
45
50
55
60
65
70
75
80
85
2450
2550
2650
2750
2850
2950
18-Sep-17 18-Nov-17 18-Jan-18 18-Mar-18 18-May-18 18-Jul-18 18-Sep-18
% o
f St
ock
s
Ind
ex
Leve
l
S&P 500 Index % of S&P 500 stocks above 200-day moving average
8
13
18
23
28
115
120
125
130
135
140
145
150
Oct-13 Feb-14 Jun-14 Oct-14 Feb-15 Jun-15 Oct-15 Feb-16 Jun-16 Oct-16 Feb-17 Jun-17 Oct-17 Feb-18 Jun-18
CB
OE
VIX
Ind
ex
CB
OE
SKEW
In
de
x
CBOE VIX Index 20-Day Moving Average CBOE SKEW Index 20-Day Moving Average
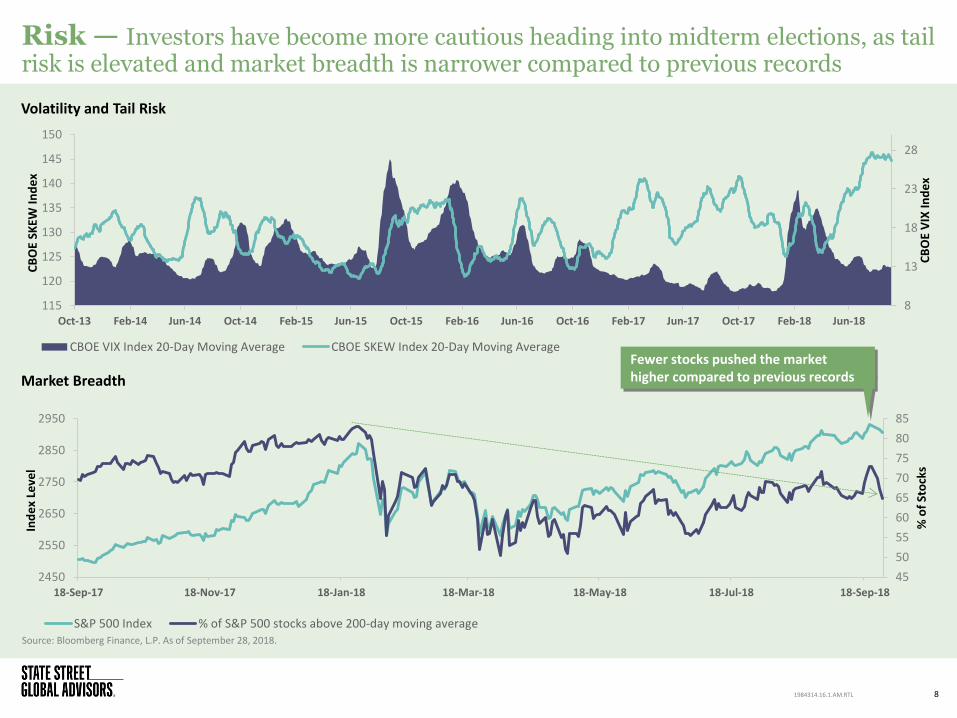
Risk — Investors have become more cautious heading into midterm elections, as tail risk is elevated and market breadth is narrower compared to previous records
Source: Bloomberg Finance, L.P. As of September 28, 2018.
Volatility and Tail Risk
8 1984314.16.1.AM.RTL
Market Breadth
Fewer stocks pushed the market higher compared to previous records
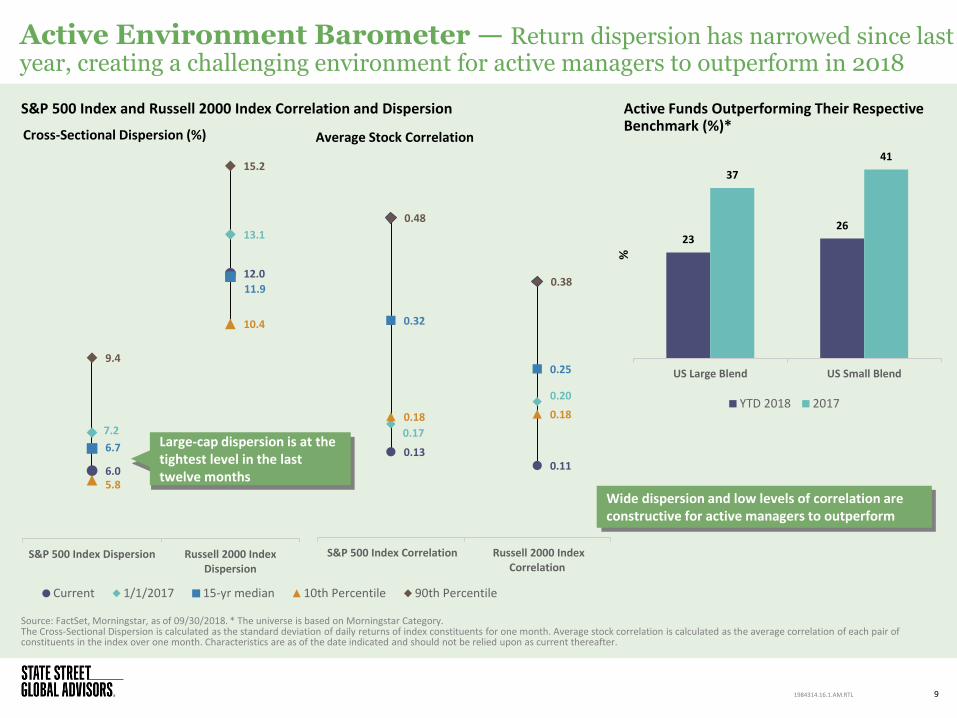
Active Environment Barometer — Return dispersion has narrowed since last year, creating a challenging environment for active managers to outperform in 2018
Source: FactSet, Morningstar, as of 09/30/2018. * The universe is based on Morningstar Category. The Cross-Sectional Dispersion is calculated as the standard deviation of daily returns of index constituents for one month. Average stock correlation is calculated as the average correlation of each pair of constituents in the index over one month. Characteristics are as of the date indicated and should not be relied upon as current thereafter.
9 1984314.16.1.AM.RTL
S&P 500 Index and Russell 2000 Index Correlation and Dispersion
6.0
12.0
7.2
13.1
6.7
11.9
5.8
10.4
9.4
15.2
S&P 500 Index Dispersion Russell 2000 IndexDispersion
Cross-Sectional Dispersion (%)
Current 1/1/2017 15-yr median 10th Percentile 90th Percentile
0.13 0.11
0.17
0.20
0.32
0.25
0.18 0.18
0.48
0.38
S&P 500 Index Correlation Russell 2000 IndexCorrelation
Average Stock Correlation
23 26
37
41
US Large Blend US Small Blend
%
YTD 2018 2017
Active Funds Outperforming Their Respective Benchmark (%)*
Large-cap dispersion is at the tightest level in the last twelve months
Wide dispersion and low levels of correlation are constructive for active managers to outperform
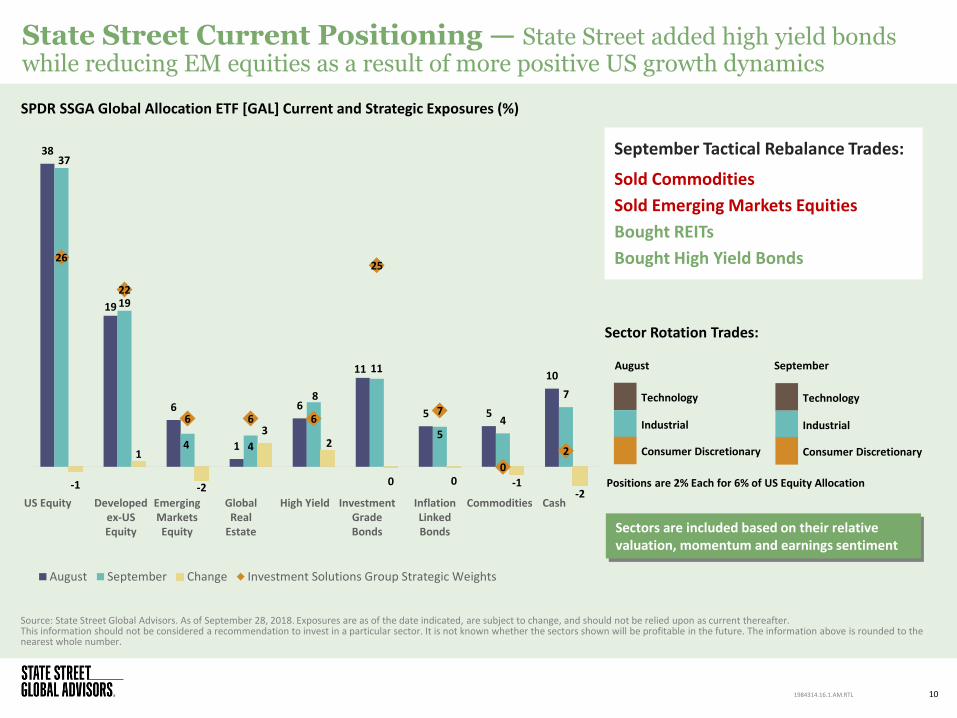
Source: State Street Global Advisors. As of September 28, 2018. Exposures are as of the date indicated, are subject to change, and should not be relied upon as current thereafter. This information should not be considered a recommendation to invest in a particular sector. It is not known whether the sectors shown will be profitable in the future. The information above is rounded to the nearest whole number.
State Street Current Positioning — State Street added high yield bonds while reducing EM equities as a result of more positive US growth dynamics
10
August
Sector Rotation Trades:
September Tactical Rebalance Trades:
Sold Commodities
Sold Emerging Markets Equities
Bought REITs
Bought High Yield Bonds
1984314.16.1.AM.RTL
Positions are 2% Each for 6% of US Equity Allocation
SPDR SSGA Global Allocation ETF [GAL] Current and Strategic Exposures (%)
Technology
Industrial
Consumer Discretionary
US Equity Developed ex-US Equity
Emerging Markets Equity
Global Real
Estate
High Yield Investment Grade Bonds
Inflation Linked Bonds
Commodities Cash
Sectors are included based on their relative valuation, momentum and earnings sentiment
38
19
6
1
6
11
5 5
10
37
19
4 4
8
11
5 4
7
-1
1
-2
3 2
0 0 -1 -2
26
22
6 6 6
25
7
0
2
August September Change Investment Solutions Group Strategic Weights
September
Technology
Industrial
Consumer Discretionary

Global Flows & Fundamentals, US Factors
11 1984314.16.1.AM.RTL
26 19 26 40
-22 -12
6
27 6
19 16 29
15 11
14
27
10 4 4
-3 -10
10 6 7
9
2 5 15
7
8
11 7 6
-30
-10
10
30
50
70
90
Oct-17 Nov-17 Dec-17 Jan-18 Feb-18 Mar-18 Apr-18 May-18 Jun-18 Jul-18 Aug-18 Sep-18
Bill
ion
s
US Equity Non-US Equity Fixed Income
28.6
1.9
-0.5 0.0
0.1
-0.7 -0.3
-2.0%
-1.0%
0.0%
1.0%
2.0%
(10)
-
10
20
30
40
U.S. Intl.Developed
SingleCountry
Intl. EM Global Regional CurrencyHedged
% A
UM
Gro
wth
fro
m F
low
s
Flo
ws
($B
)
September Month to Date (% of Start of Month AUM)
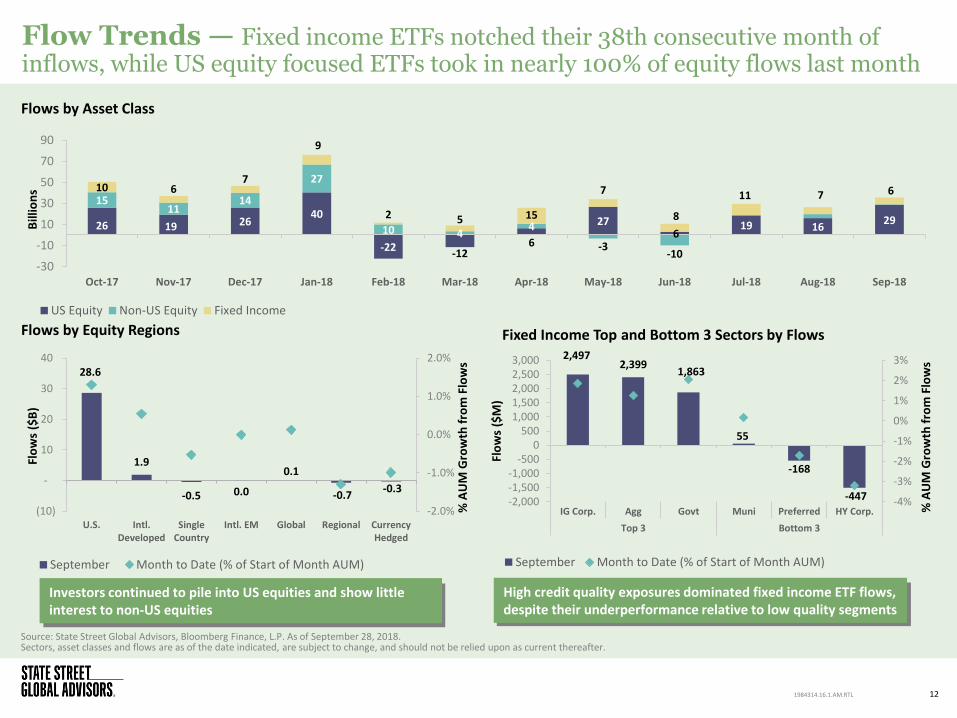
Flow Trends — Fixed income ETFs notched their 38th consecutive month of inflows, while US equity focused ETFs took in nearly 100% of equity flows last month
Source: State Street Global Advisors, Bloomberg Finance, L.P. As of September 28, 2018. Sectors, asset classes and flows are as of the date indicated, are subject to change, and should not be relied upon as current thereafter.
12 1984314.16.1.AM.RTL
Flows by Asset Class
Flows by Equity Regions Fixed Income Top and Bottom 3 Sectors by Flows 2,497
2,399 1,863
55
-168
-447 -4%
-3%
-2%
-1%
0%
1%
2%
3%
-2,000-1,500-1,000
-5000
5001,0001,5002,0002,5003,000
IG Corp. Agg Govt Muni Preferred HY Corp.
Top 3 Bottom 3
% A
UM
Gro
wth
fro
m F
low
s
Flo
ws
($M
)
September Month to Date (% of Start of Month AUM)
High credit quality exposures dominated fixed income ETF flows, despite their underperformance relative to low quality segments
Investors continued to pile into US equities and show little interest to non-US equities
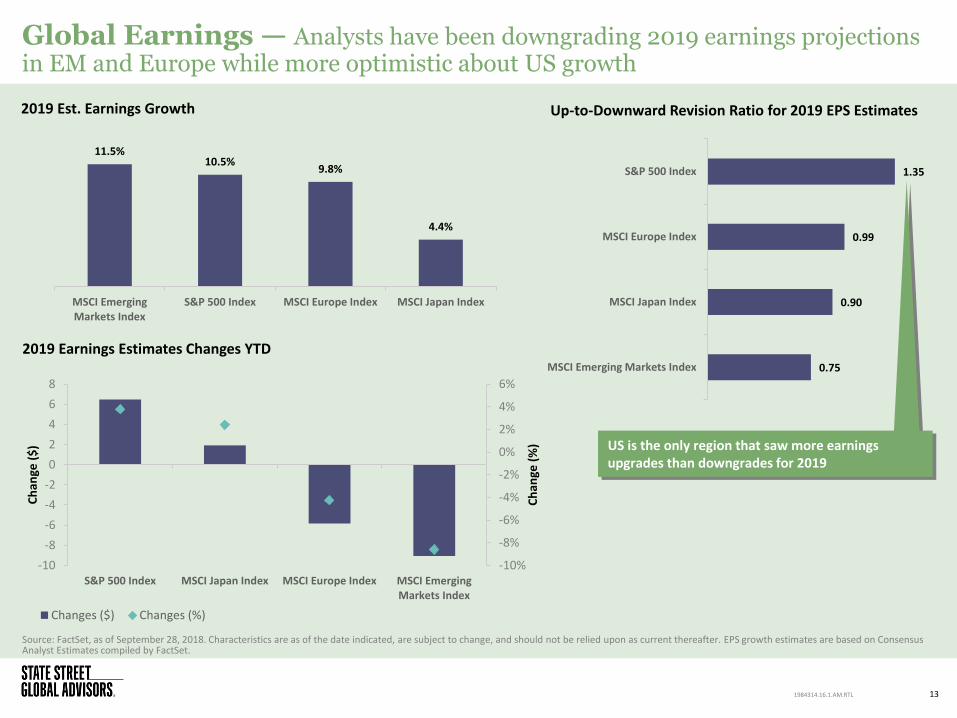
Global Earnings — Analysts have been downgrading 2019 earnings projections in EM and Europe while more optimistic about US growth
Source: FactSet, as of September 28, 2018. Characteristics are as of the date indicated, are subject to change, and should not be relied upon as current thereafter. EPS growth estimates are based on Consensus Analyst Estimates compiled by FactSet.
13 1984314.16.1.AM.RTL
2019 Earnings Estimates Changes YTD 0.75
0.90
0.99
1.35
MSCI Emerging Markets Index
MSCI Japan Index
MSCI Europe Index
S&P 500 Index
Up-to-Downward Revision Ratio for 2019 EPS Estimates
11.5% 10.5%
9.8%
4.4%
MSCI EmergingMarkets Index
S&P 500 Index MSCI Europe Index MSCI Japan Index
-10%
-8%
-6%
-4%
-2%
0%
2%
4%
6%
-10
-8
-6
-4
-2
0
2
4
6
8
S&P 500 Index MSCI Japan Index MSCI Europe Index MSCI EmergingMarkets Index
Ch
ange
(%
)
Ch
ange
($
)
Changes ($) Changes (%)
2019 Est. Earnings Growth
US is the only region that saw more earnings upgrades than downgrades for 2019
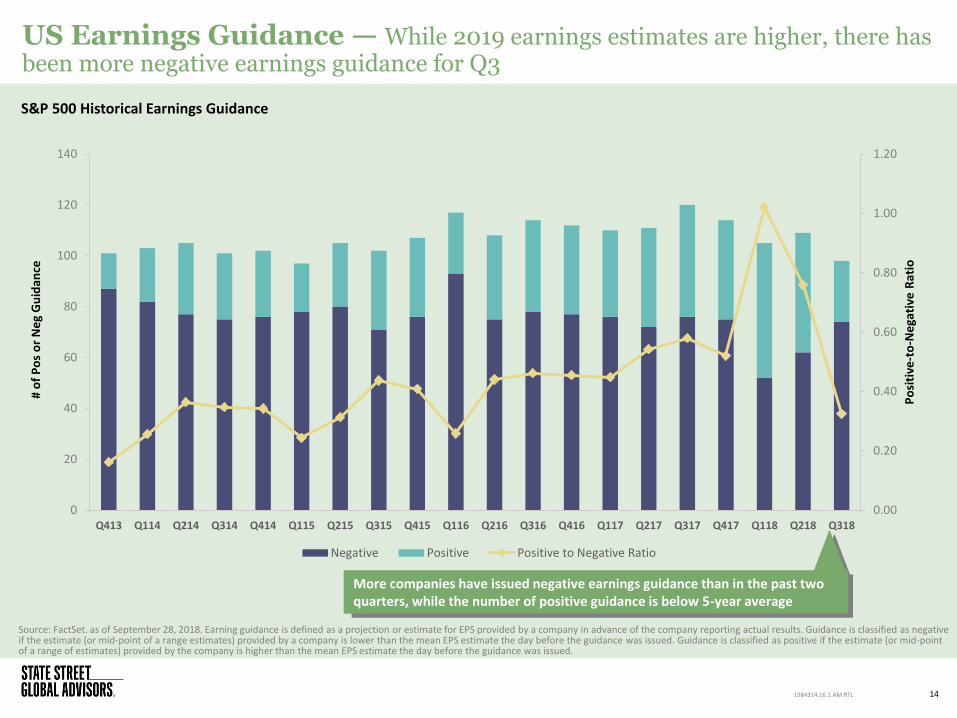
US Earnings Guidance — While 2019 earnings estimates are higher, there has been more negative earnings guidance for Q3
Source: FactSet. as of September 28, 2018. Earning guidance is defined as a projection or estimate for EPS provided by a company in advance of the company reporting actual results. Guidance is classified as negative if the estimate (or mid-point of a range estimates) provided by a company is lower than the mean EPS estimate the day before the guidance was issued. Guidance is classified as positive if the estimate (or mid-point of a range of estimates) provided by the company is higher than the mean EPS estimate the day before the guidance was issued.
14 1984314.16.1.AM.RTL
0.00
0.20
0.40
0.60
0.80
1.00
1.20
0
20
40
60
80
100
120
140
Q413 Q114 Q214 Q314 Q414 Q115 Q215 Q315 Q415 Q116 Q216 Q316 Q416 Q117 Q217 Q317 Q417 Q118 Q218 Q318
Po
siti
ve-t
o-N
ega
tive
Rat
io
# o
f P
os
or
Ne
g G
uid
ance
Negative Positive Positive to Negative Ratio
More companies have issued negative earnings guidance than in the past two quarters, while the number of positive guidance is below 5-year average
S&P 500 Historical Earnings Guidance
15
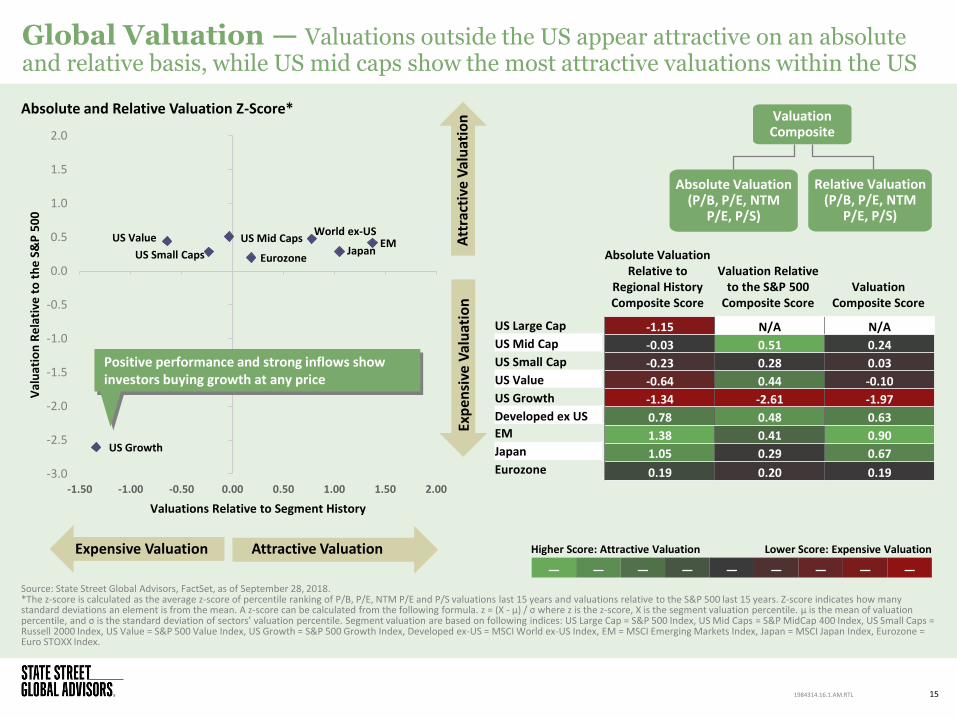
Global Valuation — Valuations outside the US appear attractive on an absolute and relative basis, while US mid caps show the most attractive valuations within the US
1984314.16.1.AM.RTL
Relative Valuation (P/B, P/E, NTM
P/E, P/S)
Absolute Valuation (P/B, P/E, NTM
P/E, P/S)
Valuation Composite
Higher Score: Attractive Valuation Lower Score: Expensive Valuation
— — — — — — — — —
Absolute Valuation Relative to
Regional History Composite Score
Valuation Relative to the S&P 500
Composite Score Valuation
Composite Score
US Large Cap
US Mid Cap
US Small Cap
US Value
US Growth
Developed ex US
EM
Japan
Eurozone
Source: State Street Global Advisors, FactSet, as of September 28, 2018. *The z-score is calculated as the average z-score of percentile ranking of P/B, P/E, NTM P/E and P/S valuations last 15 years and valuations relative to the S&P 500 last 15 years. Z-score indicates how many standard deviations an element is from the mean. A z-score can be calculated from the following formula. z = (X - μ) / σ where z is the z-score, X is the segment valuation percentile. μ is the mean of valuation percentile, and σ is the standard deviation of sectors’ valuation percentile. Segment valuation are based on following indices: US Large Cap = S&P 500 Index, US Mid Caps = S&P MidCap 400 Index, US Small Caps = Russell 2000 Index, US Value = S&P 500 Value Index, US Growth = S&P 500 Growth Index, Developed ex-US = MSCI World ex-US Index, EM = MSCI Emerging Markets Index, Japan = MSCI Japan Index, Eurozone = Euro STOXX Index.
Att
ract
ive
Val
uat
ion
Ex
pen
sive
Val
uat
ion
Attractive Valuation Expensive Valuation
US Mid Caps
US Small Caps
US Value
US Growth
World ex-US EM
Japan Eurozone
-3.0
-2.5
-2.0
-1.5
-1.0
-0.5
0.0
0.5
1.0
1.5
2.0
-1.50 -1.00 -0.50 0.00 0.50 1.00 1.50 2.00
Val
uat
ion
Re
lati
ve t
o t
he
S&
P 5
00
Valuations Relative to Segment History
-1.15 N/A N/A
-0.03 0.51 0.24
-0.23 0.28 0.03
-0.64 0.44 -0.10
-1.34 -2.61 -1.97
0.78 0.48 0.63
1.38 0.41 0.90
1.05 0.29 0.67
0.19 0.20 0.19
Absolute and Relative Valuation Z-Score*
Positive performance and strong inflows show investors buying growth at any price
90
95
100
105
110
115
120
Sep-15 Jan-16 May-16 Sep-16 Jan-17 May-17 Sep-17 Jan-18 May-18 Sep-18
No
rmal
ize
d In
de
x Le
vel
Min. Vol Quality Size Yield Momentum Value
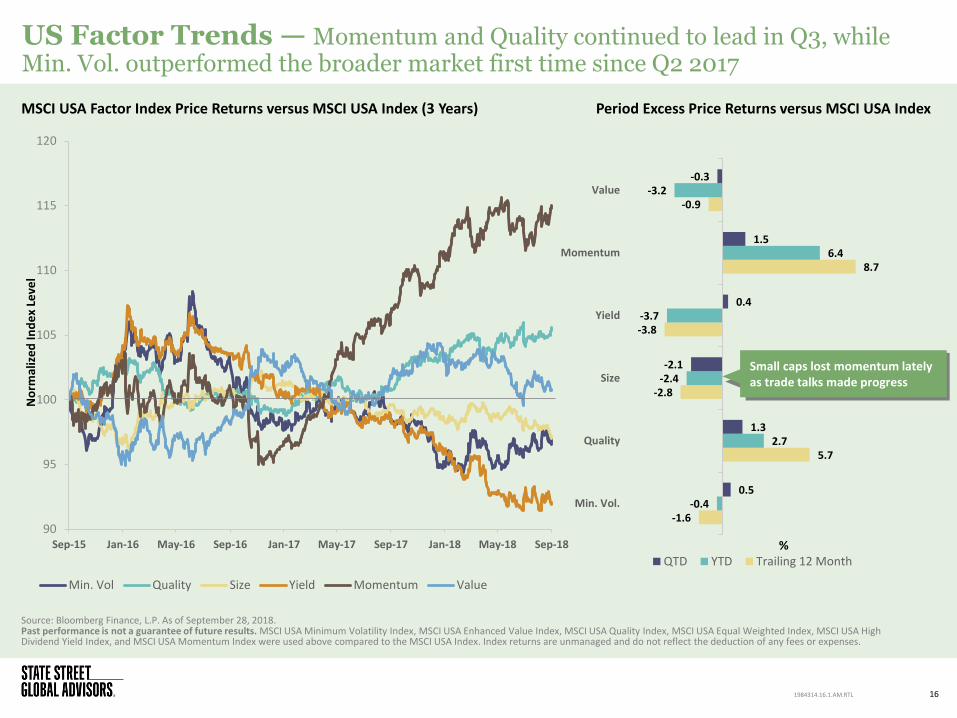
US Factor Trends — Momentum and Quality continued to lead in Q3, while Min. Vol. outperformed the broader market first time since Q2 2017
16
Source: Bloomberg Finance, L.P. As of September 28, 2018. Past performance is not a guarantee of future results. MSCI USA Minimum Volatility Index, MSCI USA Enhanced Value Index, MSCI USA Quality Index, MSCI USA Equal Weighted Index, MSCI USA High Dividend Yield Index, and MSCI USA Momentum Index were used above compared to the MSCI USA Index. Index returns are unmanaged and do not reflect the deduction of any fees or expenses.
MSCI USA Factor Index Price Returns versus MSCI USA Index (3 Years) Period Excess Price Returns versus MSCI USA Index
1984314.16.1.AM.RTL
-1.6
5.7
-2.8
-3.8
8.7
-0.9
-0.4
2.7
-2.4
-3.7
6.4
-3.2
0.5
1.3
-2.1
0.4
1.5
-0.3
Min. Vol.
Quality
Size
Yield
Momentum
Value
% QTD YTD Trailing 12 Month
Small caps lost momentum lately as trade talks made progress
0.8
1
1.2
1.4
1.6
1.8
2
2.2
2.4
1978 1980 1982 1984 1986 1988 1990 1992 1994 1996 1998 2000 2002 2004 2006 2008 2010 2012 2014 2016
Re
lati
ve P
erf
orm
ance
Rat
io
Russell 1000 Growth/ Russell 1000 Value Relative Performance Median
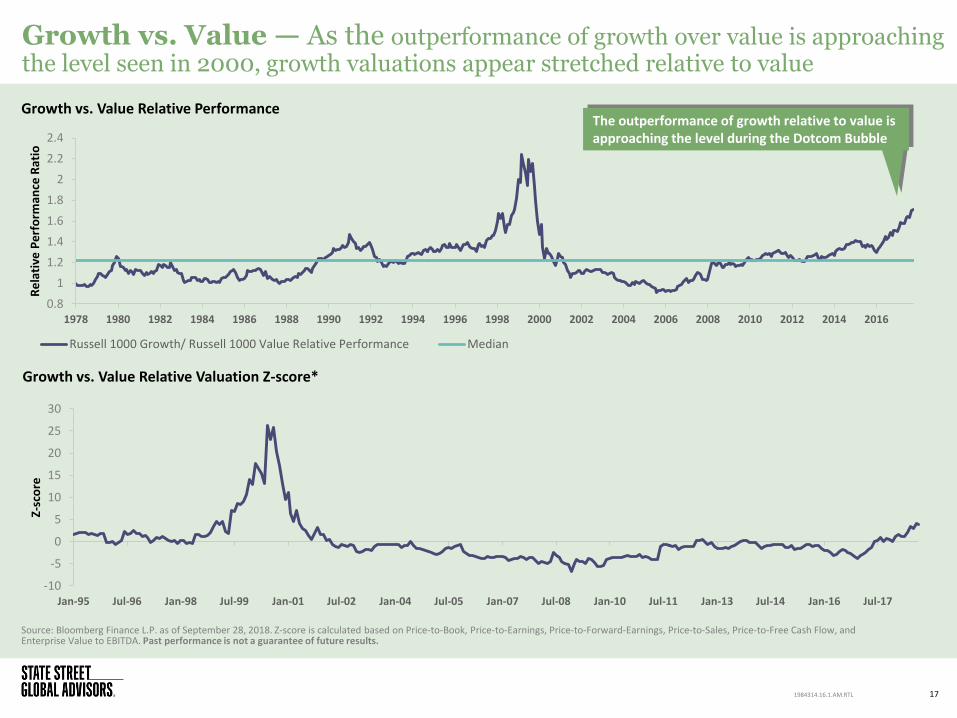
Growth vs. Value — As the outperformance of growth over value is approaching the level seen in 2000, growth valuations appear stretched relative to value
Source: Bloomberg Finance L.P. as of September 28, 2018. Z-score is calculated based on Price-to-Book, Price-to-Earnings, Price-to-Forward-Earnings, Price-to-Sales, Price-to-Free Cash Flow, and Enterprise Value to EBITDA. Past performance is not a guarantee of future results.
17 1984314.16.1.AM.RTL
-10
-5
0
5
10
15
20
25
30
Jan-95 Jul-96 Jan-98 Jul-99 Jan-01 Jul-02 Jan-04 Jul-05 Jan-07 Jul-08 Jan-10 Jul-11 Jan-13 Jul-14 Jan-16 Jul-17
Z-sc
ore
Growth vs. Value Relative Valuation Z-score*
The outperformance of growth relative to value is approaching the level during the Dotcom Bubble
Growth vs. Value Relative Performance

Sectors
18 1984314.16.1.AM.RTL
260 384
227 732
(160) (1,073)
(84) 4
2,573 5,600
(4) 966
(127) 4,485
395 (185)
36 14,298
1,563 2,351
292 308
Consumer Discretionary 10.4% 10.4%
Consumer Staples 7.7% 7.8%
Energy 11.4% 11.1%
Financial 6.5% 6.1%
Health Care 10.6% 10.8%
Industrials 8.6% 8.6%
Materials 7.7% 5.9%
Real Estate 5.6% 4.5%
Technology 10.6% 9.7%
Communication 0.6% 1.0%
Utilities 24.7% 24.3%
Positioning Returns
Prior Month Flow ($M)
YTD Flow ($M)
Current Short Interest (%)
1M Prior Short Interest (%)
Prior Month Return (%)
3-Month Return (%) YTD Return (%)
19
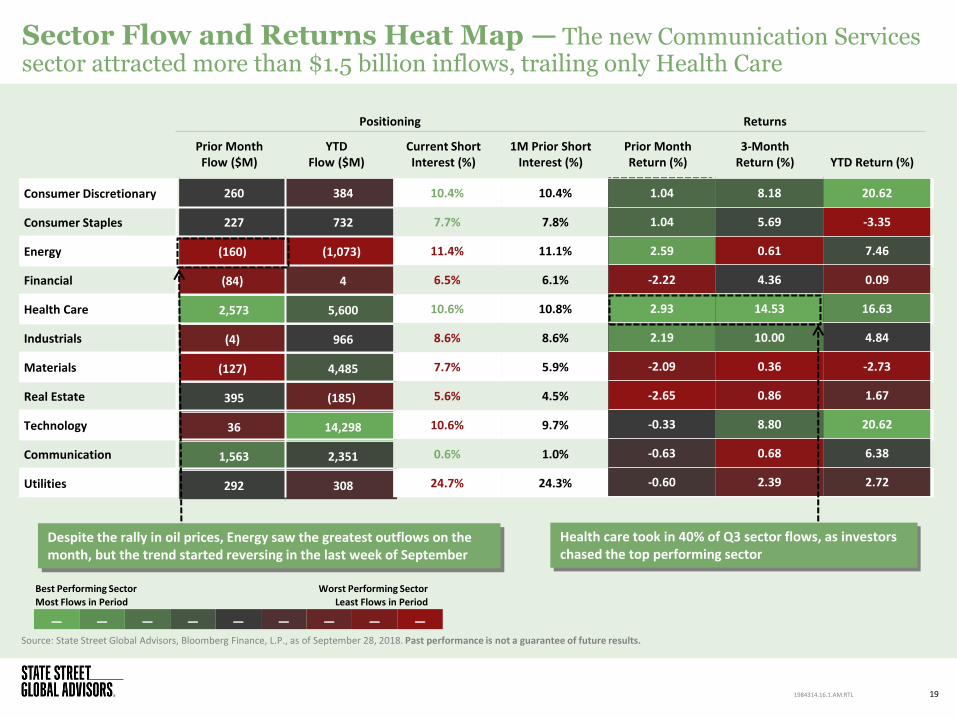
Sector Flow and Returns Heat Map — The new Communication Services sector attracted more than $1.5 billion inflows, trailing only Health Care
1984314.16.1.AM.RTL
Source: State Street Global Advisors, Bloomberg Finance, L.P., as of September 28, 2018. Past performance is not a guarantee of future results.
Worst Performing Sector
Least Flows in Period
Best Performing Sector
Most Flows in Period
— — — — — — — — —
1.04 8.18 20.62
1.04 5.69 -3.35
2.59 0.61 7.46
-2.22 4.36 0.09
2.93 14.53 16.63
2.19 10.00 4.84
-2.09 0.36 -2.73
-2.65 0.86 1.67
-0.33 8.80 20.62
-0.63 0.68 6.38
-0.60 2.39 2.72
Health care took in 40% of Q3 sector flows, as investors chased the top performing sector
Despite the rally in oil prices, Energy saw the greatest outflows on the month, but the trend started reversing in the last week of September
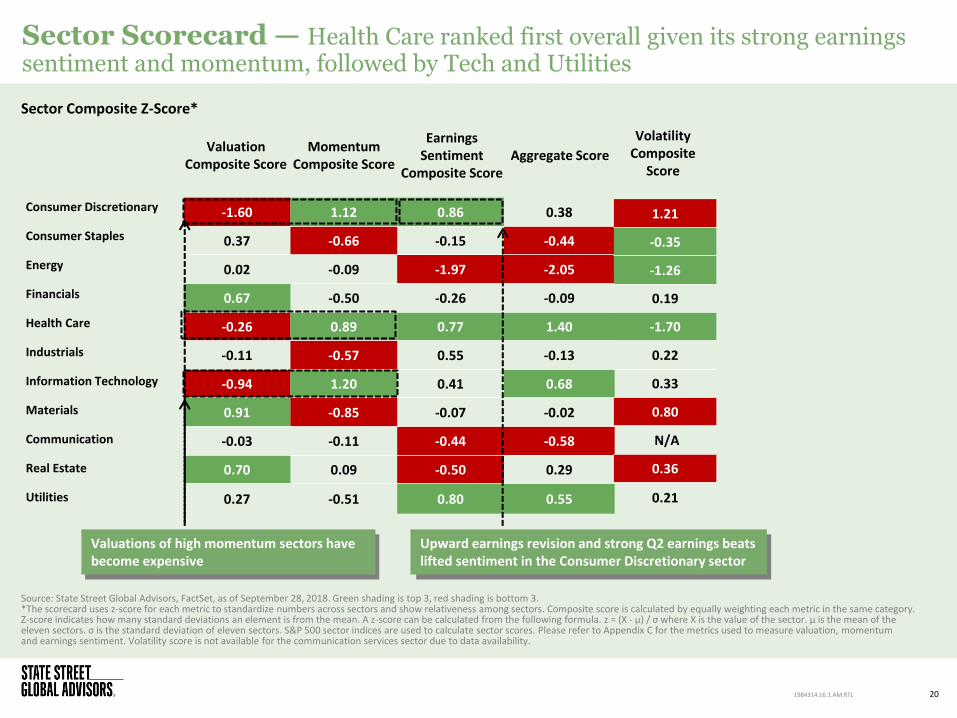
Consumer Discretionary
Consumer Staples
Energy
Financials
Health Care
Industrials
Information Technology
Materials
Communication
Real Estate
Utilities
-1.60 1.12 0.86 0.38
0.37 -0.66 -0.15 -0.44
0.02 -0.09 -1.97 -2.05
0.67 -0.50 -0.26 -0.09
-0.26 0.89 0.77 1.40
-0.11 -0.57 0.55 -0.13
-0.94 1.20 0.41 0.68
0.91 -0.85 -0.07 -0.02
-0.03 -0.11 -0.44 -0.58
0.70 0.09 -0.50 0.29
0.27 -0.51 0.80 0.55
1.21
-0.35
-1.26
0.19
-1.70
0.22
0.33
0.80
N/A
0.36
0.21
20
Sector Scorecard — Health Care ranked first overall given its strong earnings sentiment and momentum, followed by Tech and Utilities
1984314.16.1.AM.RTL
Sector Composite Z-Score*
Source: State Street Global Advisors, FactSet, as of September 28, 2018. Green shading is top 3, red shading is bottom 3. *The scorecard uses z-score for each metric to standardize numbers across sectors and show relativeness among sectors. Composite score is calculated by equally weighting each metric in the same category. Z-score indicates how many standard deviations an element is from the mean. A z-score can be calculated from the following formula. z = (X - μ) / σ where X is the value of the sector. μ is the mean of the eleven sectors. σ is the standard deviation of eleven sectors. S&P 500 sector indices are used to calculate sector scores. Please refer to Appendix C for the metrics used to measure valuation, momentum and earnings sentiment. Volatility score is not available for the communication services sector due to data availability.
Valuation Composite Score
Momentum Composite Score
Earnings Sentiment
Composite Score Aggregate Score
Volatility Composite
Score
Upward earnings revision and strong Q2 earnings beats lifted sentiment in the Consumer Discretionary sector
Valuations of high momentum sectors have become expensive
21
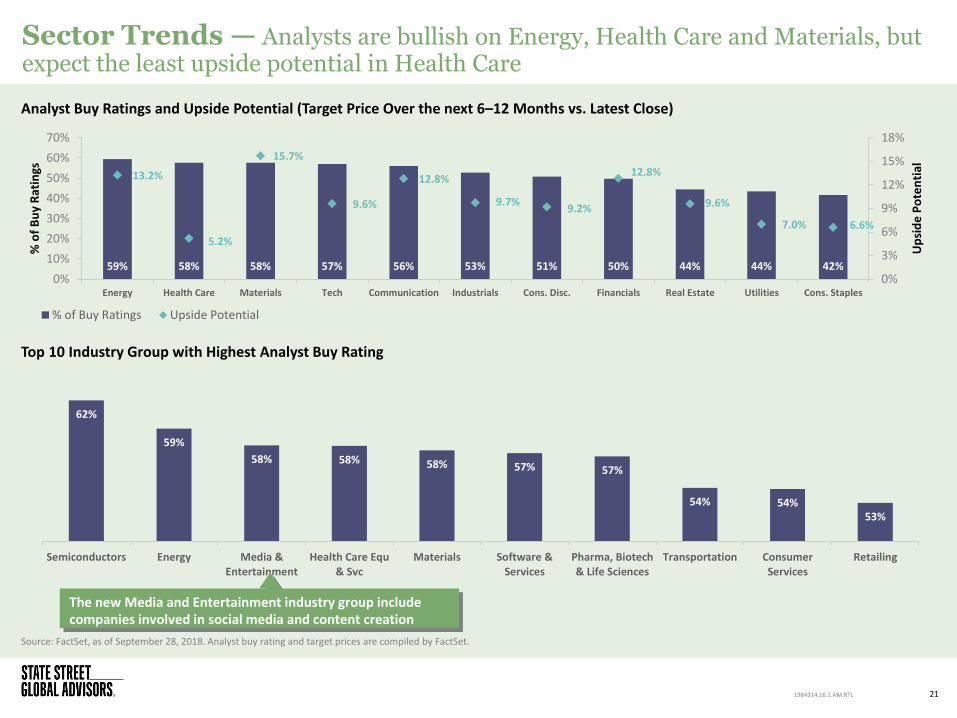
Sector Trends — Analysts are bullish on Energy, Health Care and Materials, but expect the least upside potential in Health Care
1984314.16.1.AM.RTL
Analyst Buy Ratings and Upside Potential (Target Price Over the next 6–12 Months vs. Latest Close)
Source: FactSet, as of September 28, 2018. Analyst buy rating and target prices are compiled by FactSet.
Top 10 Industry Group with Highest Analyst Buy Rating
62%
59%
58% 58% 58% 57% 57%
54% 54% 53%
Semiconductors Energy Media &Entertainment
Health Care Equ& Svc
Materials Software &Services
Pharma, Biotech& Life Sciences
Transportation ConsumerServices
Retailing
59% 58% 58% 57% 56% 53% 51% 50% 44% 44% 42%
13.2%
5.2%
15.7%
9.6%
12.8%
9.7% 9.2%
12.8%
9.6%
7.0% 6.6%
0%
3%
6%
9%
12%
15%
18%
0%
10%
20%
30%
40%
50%
60%
70%
Energy Health Care Materials Tech Communication Industrials Cons. Disc. Financials Real Estate Utilities Cons. Staples
Up
sid
e P
ote
nti
al
% o
f B
uy
Rat
ings
% of Buy Ratings Upside Potential
The new Media and Entertainment industry group include companies involved in social media and content creation
18.2
11.8 11.3 12.5
9.2
6.9 8.9
6.9 6.5 5.7
8.2
4.8
23.5
12.8 12.5 10.8 10.2 9.8 9.7
8.0 6.8
5.7 5.5 4.0
Energy Cons. Disc Industrials Comm. S&P 500 Tech Financials Health Care Materials Real Estate Cons. Staples Utilities
%
2019 Est. as of 6/30/2018 2019 Est. as of 9/30/2018
22
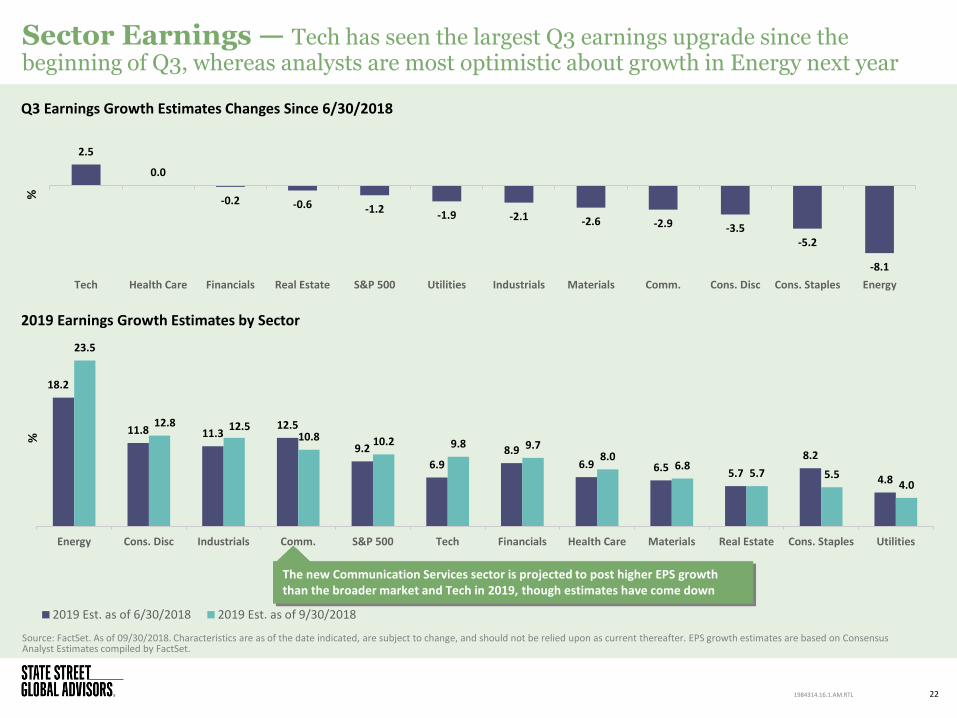
Sector Earnings — Tech has seen the largest Q3 earnings upgrade since the beginning of Q3, whereas analysts are most optimistic about growth in Energy next year
1984314.16.1.AM.RTL
Source: FactSet. As of 09/30/2018. Characteristics are as of the date indicated, are subject to change, and should not be relied upon as current thereafter. EPS growth estimates are based on Consensus Analyst Estimates compiled by FactSet.
2019 Earnings Growth Estimates by Sector
Q3 Earnings Growth Estimates Changes Since 6/30/2018
2.5
0.0
-0.2 -0.6 -1.2 -1.9 -2.1 -2.6 -2.9 -3.5
-5.2
-8.1
Tech Health Care Financials Real Estate S&P 500 Utilities Industrials Materials Comm. Cons. Disc Cons. Staples Energy
%
The new Communication Services sector is projected to post higher EPS growth than the broader market and Tech in 2019, though estimates have come down

Fixed Income
23 1984314.16.1.AM.RTL
0.94 1.05
1.19 1.29 1.49
1.62
1.94 2.17
2.33
2.86
1.93 2.10
2.27 2.45
2.63 2.69 2.74 2.81 2.86
3.02
2.11 2.20 2.37
2.57 2.82 2.88 2.95 3.02 3.06
3.21
0.0
0.5
1.0
1.5
2.0
2.5
3.0
3.5
1M 3M 6M 1Y 2Y 3Y 5Y 7Y 10Y 30Y
Yie
ld (
%)
US Treasury Active Curve 9/30/2017 US Treasury Active Curve 08/31/2018 US Treasury Active Curve 9/30/2018
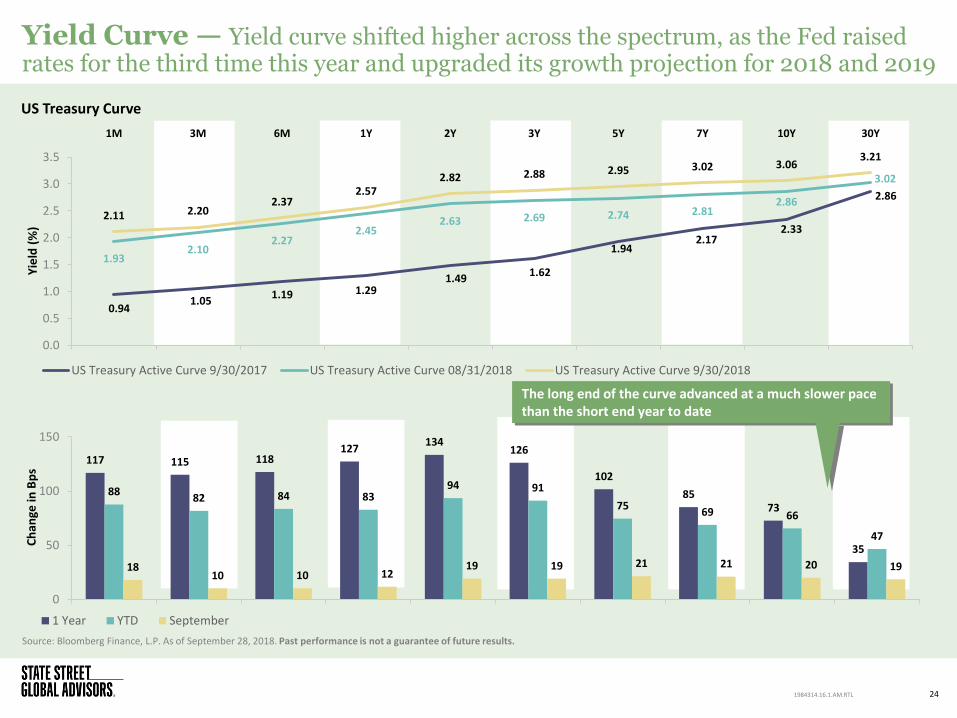
Yield Curve — Yield curve shifted higher across the spectrum, as the Fed raised rates for the third time this year and upgraded its growth projection for 2018 and 2019
Source: Bloomberg Finance, L.P. As of September 28, 2018. Past performance is not a guarantee of future results.
24
US Treasury Curve
1984314.16.1.AM.RTL
117 115 118 127
134 126
102
85 73
35
88 82 84 83
94 91
75 69 66
47
18 10 10 12
19 19 21 21 20 19
0
50
100
150
Ch
ange
in B
ps
1 Year YTD September
The long end of the curve advanced at a much slower pace than the short end year to date
83 83
59 53
43 37
30 28
9 9 9 8 4
-4 -20
-20
0
20
40
60
80
100
Canada India US Sweden Norway Korea China UK Switzerland Eurozone Denmark Australia Japan NewZealand
Mexico
Bas
is P
oin
t
25
27
26
28
24
2.78
2.54
22
23
24
25
26
27
28
29
1.5
2.0
2.5
3.0
3.5
Policy Rate 3M 6M 1Y 2Y
Ch
ange
s (B
asis
Po
int)
Imp
lied
Po
licy
Rat
es
%
Change in implied policy between current and historical selected date Current implied policy curve as of 9/28/2018
Historical implied policy curve as of 6/28/2018
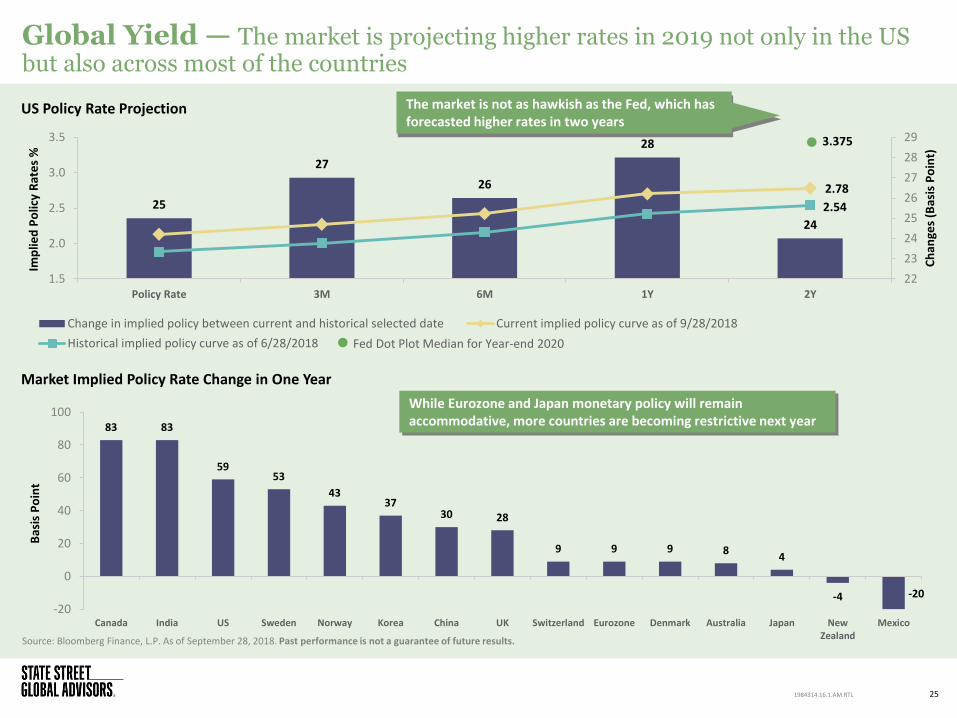
Global Yield — The market is projecting higher rates in 2019 not only in the US but also across most of the countries
Source: Bloomberg Finance, L.P. As of September 28, 2018. Past performance is not a guarantee of future results.
25
US Policy Rate Projection
1984314.16.1.AM.RTL
Market Implied Policy Rate Change in One Year
3.375
Fed Dot Plot Median for Year-end 2020
While Eurozone and Japan monetary policy will remain accommodative, more countries are becoming restrictive next year
The market is not as hawkish as the Fed, which has forecasted higher rates in two years
-2
-1
0
1
2
3
4
5
Dec-09 Dec-10 Dec-11 Dec-12 Dec-13 Dec-14 Dec-15 Dec-16 Dec-17
%
US 10 Year Yield US 2-Year Yield Adrian Crump & Moench 10 Year Treasury Term Premium US 10-Year and 2-Year Yield Spreads
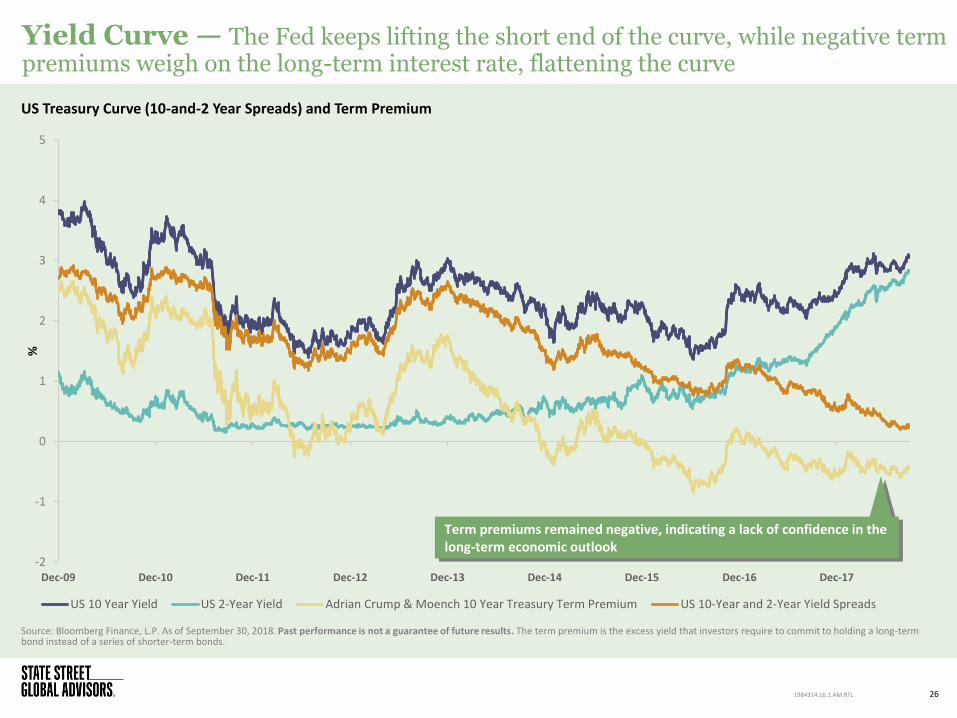
Yield Curve — The Fed keeps lifting the short end of the curve, while negative term premiums weigh on the long-term interest rate, flattening the curve
Source: Bloomberg Finance, L.P. As of September 30, 2018. Past performance is not a guarantee of future results. The term premium is the excess yield that investors require to commit to holding a long-term bond instead of a series of shorter-term bonds.
26
US Treasury Curve (10-and-2 Year Spreads) and Term Premium
1984314.16.1.AM.RTL
Term premiums remained negative, indicating a lack of confidence in the long-term economic outlook
0.0
0.5
1.0
1.5
2.0
2.5
3.0
Sep-08 Jul-09 May-10 Mar-11 Jan-12 Nov-12 Sep-13 Jul-14 May-15 Mar-16 Jan-17 Nov-17 Sep-18
%
US Personal Consumption Expenditure Core Price Index YoY US CPI Urban Consumers Less Food & Energy YoY
Federal Funds Target Rate Mid Point of Range
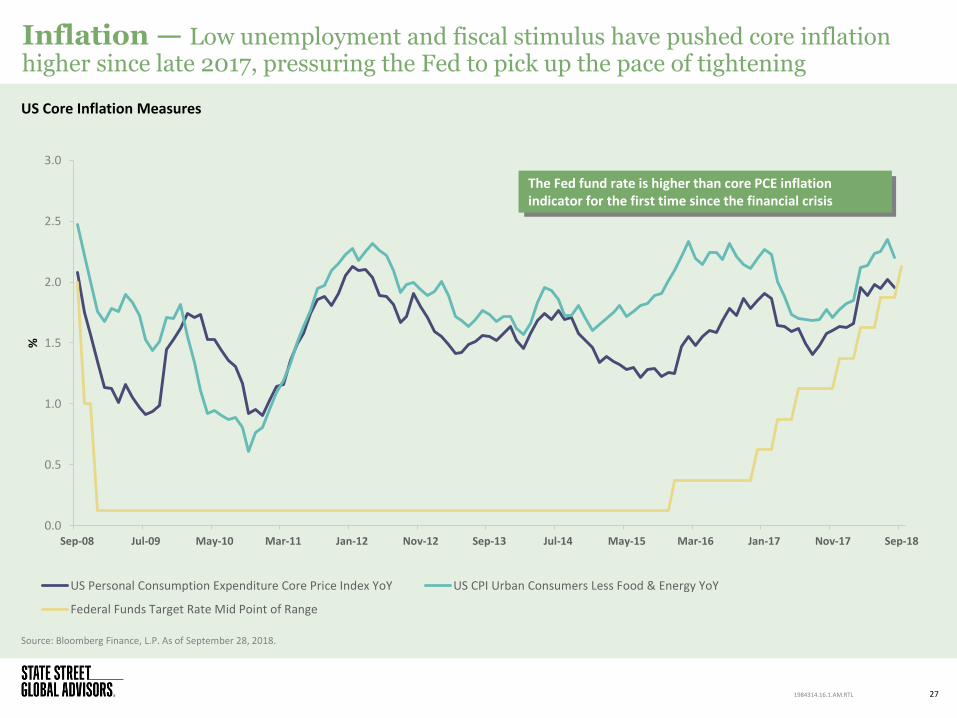
Inflation — Low unemployment and fiscal stimulus have pushed core inflation higher since late 2017, pressuring the Fed to pick up the pace of tightening
Source: Bloomberg Finance, L.P. As of September 28, 2018.
27
US Core Inflation Measures
1984314.16.1.AM.RTL
The Fed fund rate is higher than core PCE inflation indicator for the first time since the financial crisis
-1000
-800
-600
-400
-200
0
200
400
600
Jan-13 Sep-13 May-14 Jan-15 Sep-15 May-16 Jan-17 Sep-17 May-18
Futu
res
Po
siti
on
s in
Th
ou
san
ds
Bloomberg CFTC CBT 10-Yr US Treasury Notes Net Non-Commercial Futures Positions
Bloomberg CFTC CBT 2-Yr US Treasury Notes Net Non-Commercial Futures Positions
Bloomberg CFTC CBT 5-Yr US Treasury Note Net Non-Commercial Futures Positions
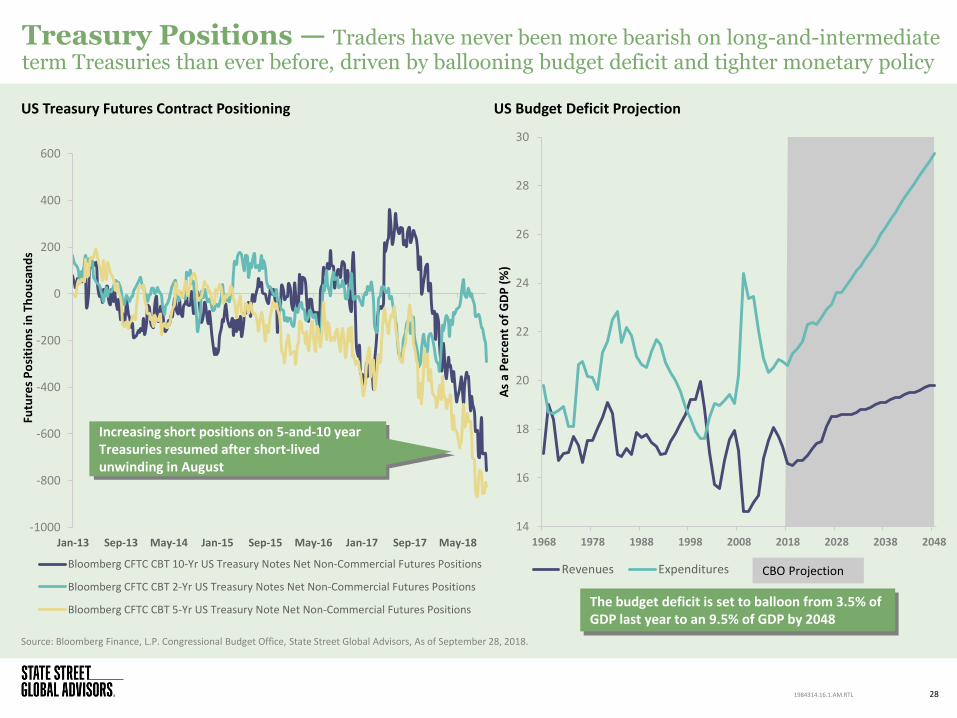
Treasury Positions — Traders have never been more bearish on long-and-intermediate term Treasuries than ever before, driven by ballooning budget deficit and tighter monetary policy
Source: Bloomberg Finance, L.P. Congressional Budget Office, State Street Global Advisors, As of September 28, 2018.
28
US Treasury Futures Contract Positioning
1984314.16.1.AM.RTL
US Budget Deficit Projection
14
16
18
20
22
24
26
28
30
1968 1978 1988 1998 2008 2018 2028 2038 2048
As
a P
erc
en
t o
f G
DP
(%
)
Revenues Expenditures CBO Projection
Increasing short positions on 5-and-10 year Treasuries resumed after short-lived unwinding in August
The budget deficit is set to balloon from 3.5% of GDP last year to an 9.5% of GDP by 2048
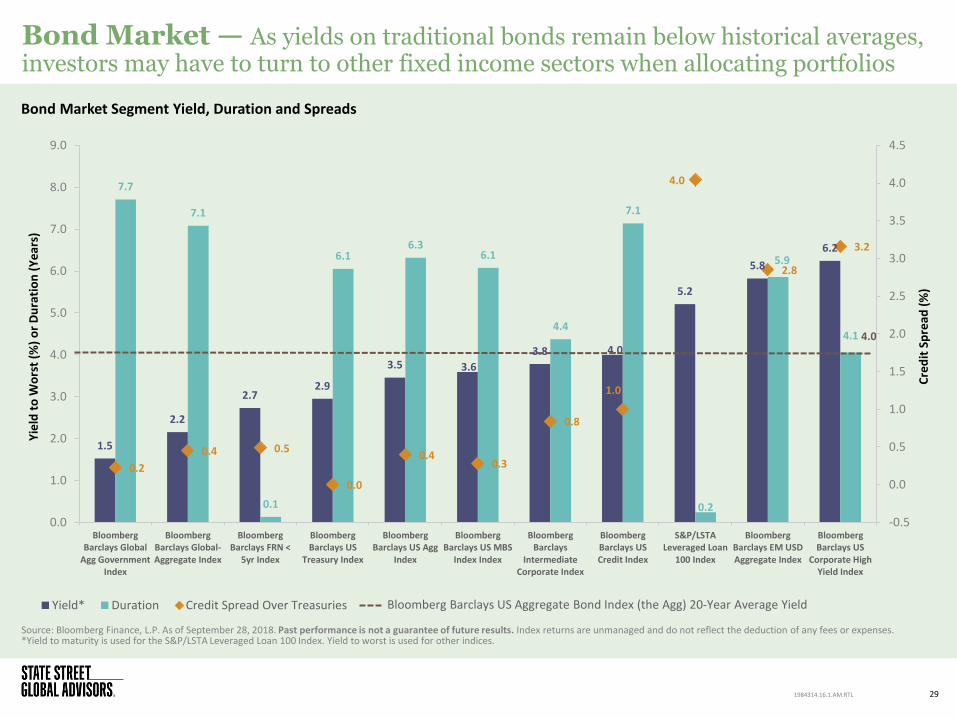
Bond Market — As yields on traditional bonds remain below historical averages, investors may have to turn to other fixed income sectors when allocating portfolios
Source: Bloomberg Finance, L.P. As of September 28, 2018. Past performance is not a guarantee of future results. Index returns are unmanaged and do not reflect the deduction of any fees or expenses. *Yield to maturity is used for the S&P/LSTA Leveraged Loan 100 Index. Yield to worst is used for other indices.
29 1984314.16.1.AM.RTL
Bond Market Segment Yield, Duration and Spreads
1.5
2.2
2.7 2.9
3.5 3.6
3.8 4.0
5.2
5.8
6.2
7.7
7.1
0.1
6.1 6.3
6.1
4.4
7.1
0.2
5.9
4.1
0.2
0.4 0.5
0.0
0.4 0.3
0.8
1.0
4.0
2.8
3.2
-0.5
0.0
0.5
1.0
1.5
2.0
2.5
3.0
3.5
4.0
4.5
0.0
1.0
2.0
3.0
4.0
5.0
6.0
7.0
8.0
9.0
BloombergBarclays Global
Agg GovernmentIndex
BloombergBarclays Global-Aggregate Index
BloombergBarclays FRN <
5yr Index
BloombergBarclays US
Treasury Index
BloombergBarclays US Agg
Index
BloombergBarclays US MBS
Index Index
BloombergBarclays
IntermediateCorporate Index
BloombergBarclays USCredit Index
S&P/LSTALeveraged Loan
100 Index
BloombergBarclays EM USDAggregate Index
BloombergBarclays US
Corporate HighYield Index
Cre
dit
Sp
read
(%
)
Yie
ld t
o W
ors
t (%
) o
r D
ura
tio
n (
Ye
ars)
Yield* Duration Credit Spread Over Treasuries
4.0
Bloomberg Barclays US Aggregate Bond Index (the Agg) 20-Year Average Yield
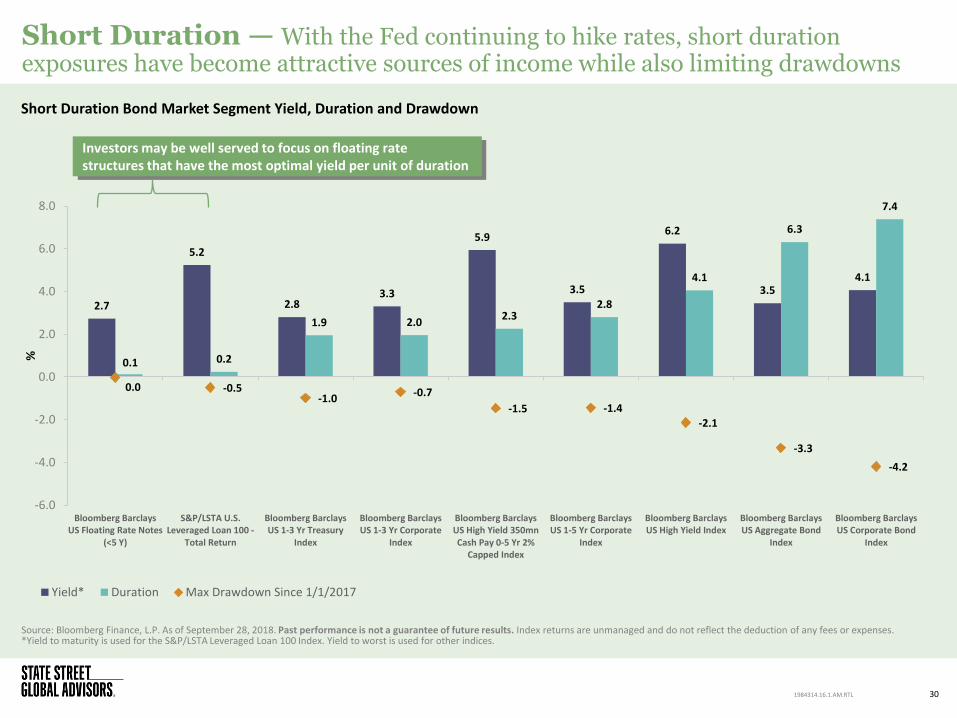
Short Duration — With the Fed continuing to hike rates, short duration exposures have become attractive sources of income while also limiting drawdowns
Source: Bloomberg Finance, L.P. As of September 28, 2018. Past performance is not a guarantee of future results. Index returns are unmanaged and do not reflect the deduction of any fees or expenses. *Yield to maturity is used for the S&P/LSTA Leveraged Loan 100 Index. Yield to worst is used for other indices.
30 1984314.16.1.AM.RTL
Short Duration Bond Market Segment Yield, Duration and Drawdown
4.0
Investors may be well served to focus on floating rate structures that have the most optimal yield per unit of duration
2.7
5.2
2.8 3.3
5.9
3.5
6.2
3.5 4.1
0.1 0.2
1.9 2.0 2.3
2.8
4.1
6.3
7.4
0.0 -0.5 -1.0
-0.7
-1.5 -1.4 -2.1
-3.3
-4.2
-6.0
-4.0
-2.0
0.0
2.0
4.0
6.0
8.0
Bloomberg BarclaysUS Floating Rate Notes
(<5 Y)
S&P/LSTA U.S.Leveraged Loan 100 -
Total Return
Bloomberg BarclaysUS 1-3 Yr Treasury
Index
Bloomberg BarclaysUS 1-3 Yr Corporate
Index
Bloomberg BarclaysUS High Yield 350mnCash Pay 0-5 Yr 2%
Capped Index
Bloomberg BarclaysUS 1-5 Yr Corporate
Index
Bloomberg BarclaysUS High Yield Index
Bloomberg BarclaysUS Aggregate Bond
Index
Bloomberg BarclaysUS Corporate Bond
Index
%
Yield* Duration Max Drawdown Since 1/1/2017
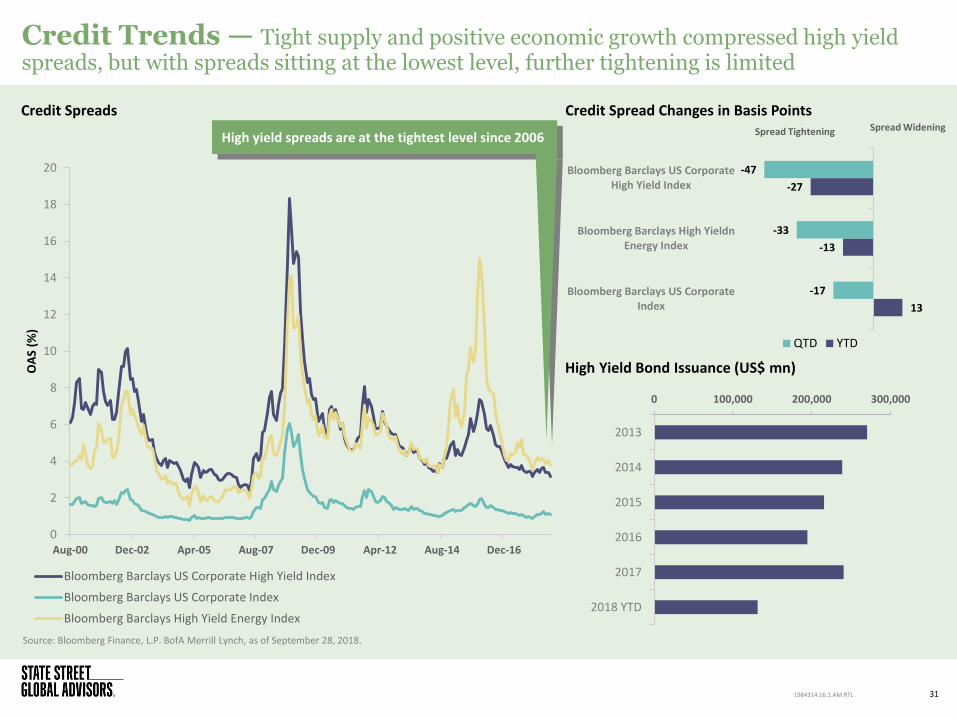
Credit Trends — Tight supply and positive economic growth compressed high yield spreads, but with spreads sitting at the lowest level, further tightening is limited
Source: Bloomberg Finance, L.P. BofA Merrill Lynch, as of September 28, 2018.
31
Credit Spreads
1984314.16.1.AM.RTL
Credit Spread Changes in Basis Points Spread Tightening Spread Widening
13
-13
-27
-17
-33
-47
Bloomberg Barclays US CorporateIndex
Bloomberg Barclays High YieldnEnergy Index
Bloomberg Barclays US CorporateHigh Yield Index
QTD YTD
0
2
4
6
8
10
12
14
16
18
20
Aug-00 Dec-02 Apr-05 Aug-07 Dec-09 Apr-12 Aug-14 Dec-16
OA
S (%
)
Bloomberg Barclays US Corporate High Yield Index
Bloomberg Barclays US Corporate Index
Bloomberg Barclays High Yield Energy Index
0 100,000 200,000 300,000
2013
2014
2015
2016
2017
2018 YTD
High Yield Bond Issuance (US$ mn)
High yield spreads are at the tightest level since 2006
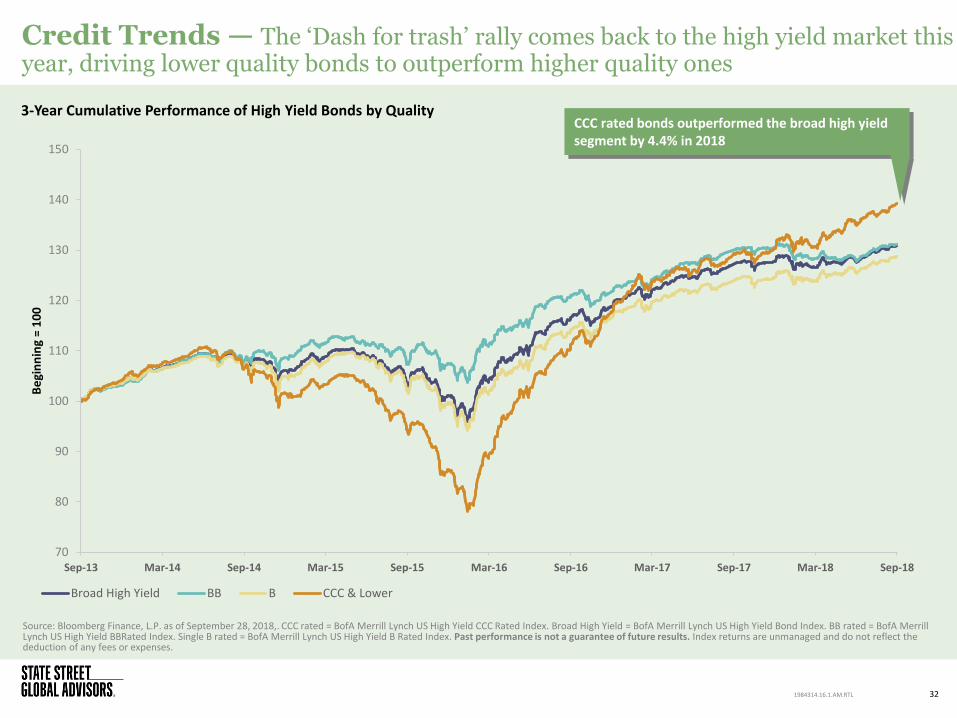
Credit Trends — The ‘Dash for trash’ rally comes back to the high yield market this year, driving lower quality bonds to outperform higher quality ones
Source: Bloomberg Finance, L.P. as of September 28, 2018,. CCC rated = BofA Merrill Lynch US High Yield CCC Rated Index. Broad High Yield = BofA Merrill Lynch US High Yield Bond Index. BB rated = BofA Merrill Lynch US High Yield BBRated Index. Single B rated = BofA Merrill Lynch US High Yield B Rated Index. Past performance is not a guarantee of future results. Index returns are unmanaged and do not reflect the deduction of any fees or expenses.
32
3-Year Cumulative Performance of High Yield Bonds by Quality
1984314.16.1.AM.RTL
70
80
90
100
110
120
130
140
150
Sep-13 Mar-14 Sep-14 Mar-15 Sep-15 Mar-16 Sep-16 Mar-17 Sep-17 Mar-18 Sep-18
Be
gin
nin
g =
10
0
Broad High Yield BB B CCC & Lower
CCC rated bonds outperformed the broad high yield segment by 4.4% in 2018
-3.0%
-2.0%
-1.0%
0.0%
1.0%
2.0%
3.0%
-30%
-20%
-10%
0%
10%
20%
30%
40%
50%
Dec-93 Dec-96 Dec-99 Dec-02 Dec-05 Dec-08 Dec-11 Dec-14 Dec-17
10
-Ye
ar Y
ield
Ch
ange
s
Ou
tpe
rfo
rman
ce
Outperformance of HY over IG Rolling 12-Month 10-Year Yield Changes Over 12 Months
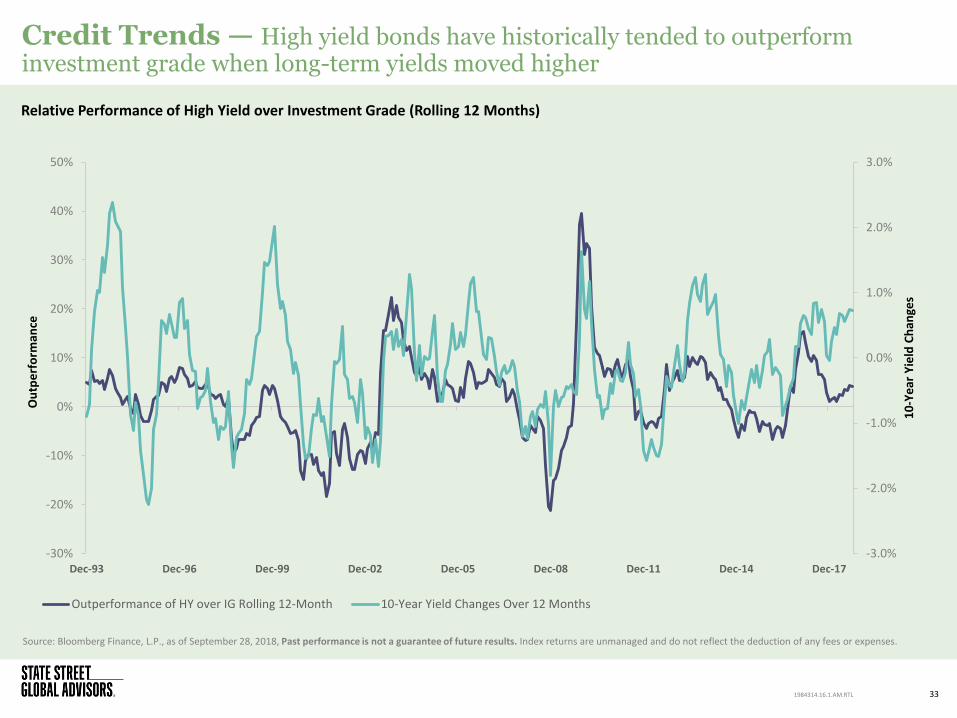
Credit Trends — High yield bonds have historically tended to outperform investment grade when long-term yields moved higher
Source: Bloomberg Finance, L.P., as of September 28, 2018, Past performance is not a guarantee of future results. Index returns are unmanaged and do not reflect the deduction of any fees or expenses.
33
Relative Performance of High Yield over Investment Grade (Rolling 12 Months)
1984314.16.1.AM.RTL
-2
0
2
4
6
8
10
12
Aug-00 Feb-02 Aug-03 Feb-05 Aug-06 Feb-08 Aug-09 Feb-11 Aug-12 Feb-14 Aug-15 Feb-17 Aug-18
%
HY Yield to Worst minus EM Debt Yield to Worst Median Since Aug 2000
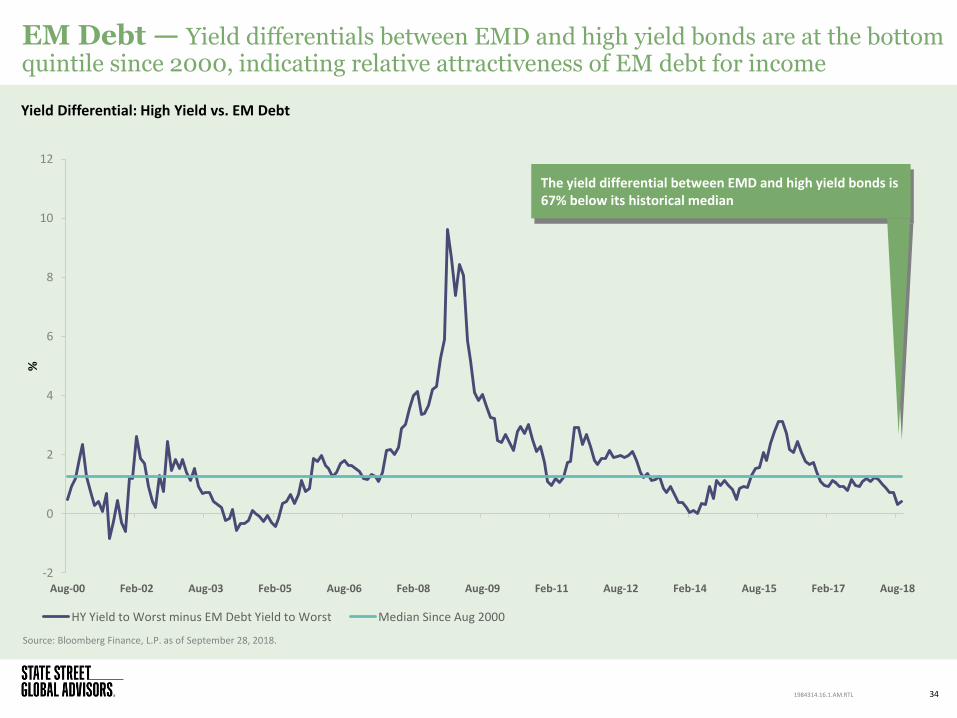
EM Debt — Yield differentials between EMD and high yield bonds are at the bottom quintile since 2000, indicating relative attractiveness of EM debt for income
Source: Bloomberg Finance, L.P. as of September 28, 2018.
34 1984314.16.1.AM.RTL
Yield Differential: High Yield vs. EM Debt
The yield differential between EMD and high yield bonds is 67% below its historical median

Appendix A: Flow Summary
35 1984314.16.1.AM.RTL
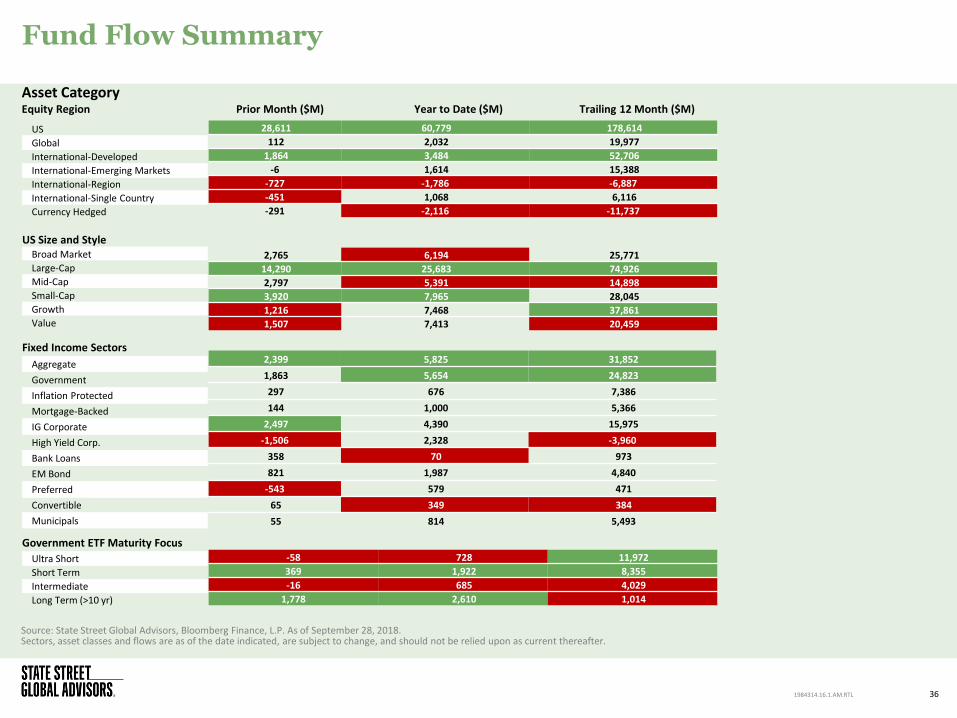
Fund Flow Summary
36 1984314.16.1.AM.RTL
Source: State Street Global Advisors, Bloomberg Finance, L.P. As of September 28, 2018. Sectors, asset classes and flows are as of the date indicated, are subject to change, and should not be relied upon as current thereafter.
Asset Category Equity Region Prior Month ($M) Year to Date ($M) Trailing 12 Month ($M)
US
Global
International-Developed
International-Emerging Markets
International-Region
International-Single Country
Currency Hedged
US Size and Style Broad Market
Large-Cap
Mid-Cap
Small-Cap
Growth
Value
Fixed Income Sectors
Aggregate
Government
Inflation Protected
Mortgage-Backed
IG Corporate
High Yield Corp.
Bank Loans
EM Bond
Preferred
Convertible
Municipals
Government ETF Maturity Focus
Ultra Short
Short Term
Intermediate
Long Term (>10 yr)
28,611 60,779 178,614
112 2,032 19,977
1,864 3,484 52,706
-6 1,614 15,388
-727 -1,786 -6,887
-451 1,068 6,116
-291 -2,116 -11,737
2,765 6,194 25,771
14,290 25,683 74,926
2,797 5,391 14,898
3,920 7,965 28,045
1,216 7,468 37,861
1,507 7,413 20,459
2,399 5,825 31,852
1,863 5,654 24,823
297 676 7,386
144 1,000 5,366
2,497 4,390 15,975
-1,506 2,328 -3,960
358 70 973
821 1,987 4,840
-543 579 471
65 349 384
55 814 5,493
-58 728 11,972
369 1,922 8,355
-16 685 4,029
1,778 2,610 1,014

Appendix B: Asset Class Forecast
37 1984314.16.1.AM.RTL
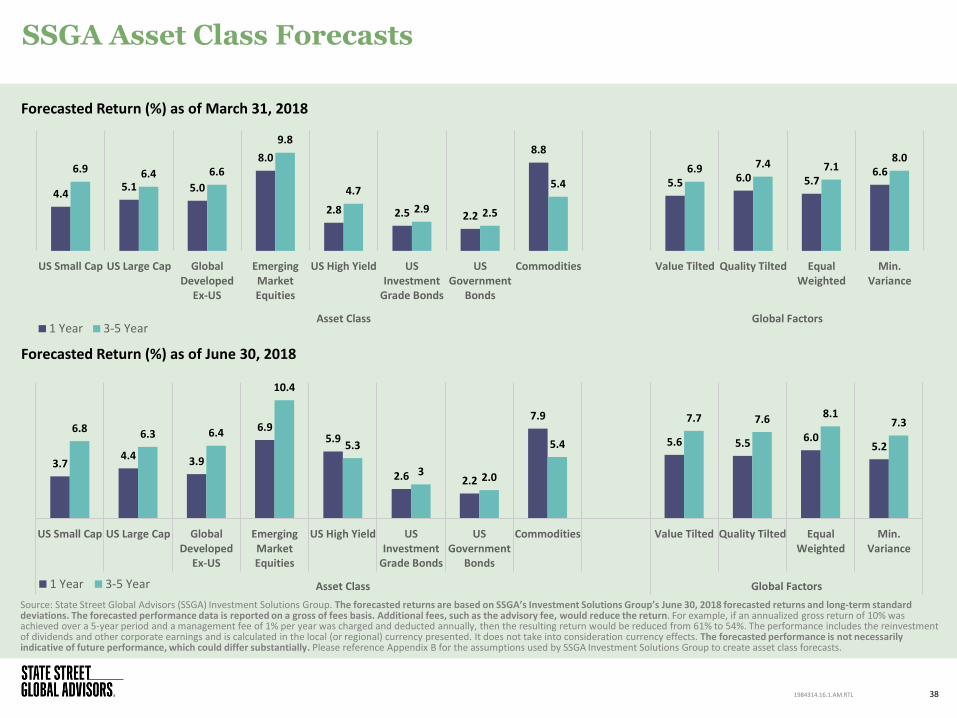
SSGA Asset Class Forecasts
Source: State Street Global Advisors (SSGA) Investment Solutions Group. The forecasted returns are based on SSGA’s Investment Solutions Group’s June 30, 2018 forecasted returns and long-term standard deviations. The forecasted performance data is reported on a gross of fees basis. Additional fees, such as the advisory fee, would reduce the return. For example, if an annualized gross return of 10% was achieved over a 5-year period and a management fee of 1% per year was charged and deducted annually, then the resulting return would be reduced from 61% to 54%. The performance includes the reinvestment of dividends and other corporate earnings and is calculated in the local (or regional) currency presented. It does not take into consideration currency effects. The forecasted performance is not necessarily indicative of future performance, which could differ substantially. Please reference Appendix B for the assumptions used by SSGA Investment Solutions Group to create asset class forecasts.
38
Forecasted Return (%) as of March 31, 2018
4.4 5.1 5.0
8.0
2.8 2.5 2.2
8.8
5.5 6.0 5.7 6.6 6.9 6.4 6.6
9.8
4.7
2.9 2.5
5.4
6.9 7.4 7.1 8.0
US Small Cap US Large Cap GlobalDeveloped
Ex-US
EmergingMarketEquities
US High Yield USInvestment
Grade Bonds
USGovernment
Bonds
Commodities Value Tilted Quality Tilted EqualWeighted
Min.Variance
Asset Class Global Factors1 Year 3-5 Year
3.7 4.4 3.9
6.9 5.9
2.6 2.2
7.9
5.6 5.5 6.0 5.2
6.8 6.3 6.4
10.4
5.3
3 2.0
5.4
7.7 7.6 8.1 7.3
US Small Cap US Large Cap GlobalDeveloped
Ex-US
EmergingMarketEquities
US High Yield USInvestment
Grade Bonds
USGovernment
Bonds
Commodities Value Tilted Quality Tilted EqualWeighted
Min.Variance
Asset Class Global Factors1 Year 3-5 Year
Forecasted Return (%) as of June 30, 2018
1984314.16.1.AM.RTL
Asset Class Forecast Assumptions
39 1984314.16.1.AM.RTL
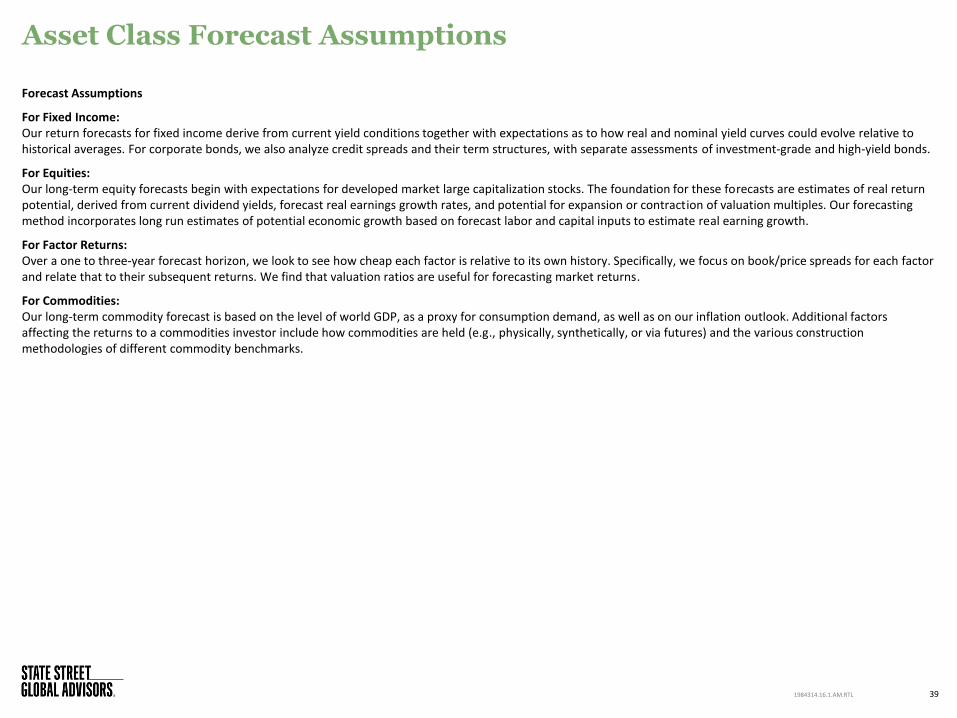
Forecast Assumptions
For Fixed Income: Our return forecasts for fixed income derive from current yield conditions together with expectations as to how real and nominal yield curves could evolve relative to historical averages. For corporate bonds, we also analyze credit spreads and their term structures, with separate assessments of investment-grade and high-yield bonds.
For Equities: Our long-term equity forecasts begin with expectations for developed market large capitalization stocks. The foundation for these forecasts are estimates of real return potential, derived from current dividend yields, forecast real earnings growth rates, and potential for expansion or contraction of valuation multiples. Our forecasting method incorporates long run estimates of potential economic growth based on forecast labor and capital inputs to estimate real earning growth.
For Factor Returns: Over a one to three-year forecast horizon, we look to see how cheap each factor is relative to its own history. Specifically, we focus on book/price spreads for each factor and relate that to their subsequent returns. We find that valuation ratios are useful for forecasting market returns.
For Commodities: Our long-term commodity forecast is based on the level of world GDP, as a proxy for consumption demand, as well as on our inflation outlook. Additional factors affecting the returns to a commodities investor include how commodities are held (e.g., physically, synthetically, or via futures) and the various construction methodologies of different commodity benchmarks.

Appendix C: SPDR Sector Scorecard
40 1984314.16.1.AM.RTL
SPDR Sector Scorecard
41 1984314.16.1.AM.RTL
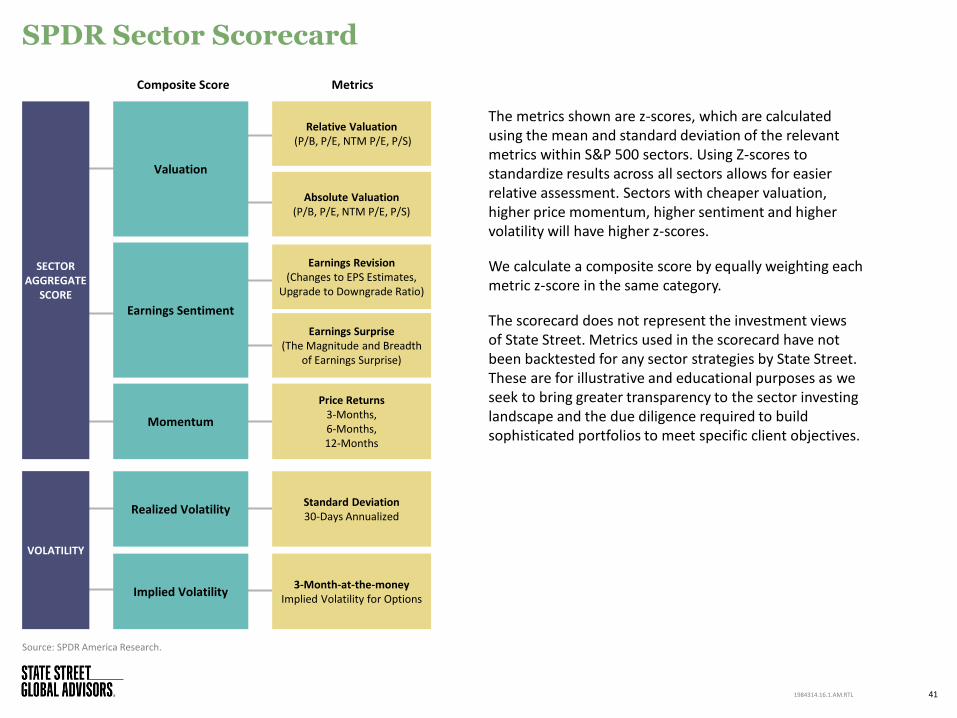
The metrics shown are z-scores, which are calculated using the mean and standard deviation of the relevant metrics within S&P 500 sectors. Using Z-scores to standardize results across all sectors allows for easier relative assessment. Sectors with cheaper valuation, higher price momentum, higher sentiment and higher volatility will have higher z-scores.
We calculate a composite score by equally weighting each metric z-score in the same category.
The scorecard does not represent the investment views of State Street. Metrics used in the scorecard have not been backtested for any sector strategies by State Street. These are for illustrative and educational purposes as we seek to bring greater transparency to the sector investing landscape and the due diligence required to build sophisticated portfolios to meet specific client objectives.
Source: SPDR America Research.
SECTOR AGGREGATE
SCORE
VOLATILITY
Momentum
Earnings Sentiment
Valuation
Realized Volatility
Implied Volatility
Absolute Valuation (P/B, P/E, NTM P/E, P/S)
Relative Valuation (P/B, P/E, NTM P/E, P/S)
Earnings Surprise (The Magnitude and Breadth
of Earnings Surprise)
Earnings Revision (Changes to EPS Estimates,
Upgrade to Downgrade Ratio)
Price Returns 3-Months, 6-Months, 12-Months
Standard Deviation 30-Days Annualized
3-Month-at-the-money Implied Volatility for Options
Composite Score Metrics

Appendix D: Definitions
42 1984314.16.1.AM.RTL

Definitions
S&P500 Index: A popular benchmark for US large-cap equities that includes 500 companies from leading industries and captures approximately 80% coverage of available market capitalization.
CBOE VIX Index: The Chicago Board Options Exchange (CBOE) Volatility Index shows the market’s expectation of 30-day volatility. It is constructed using the implied volatilities of a wide range of S&P 500 index options.
Implied Volatility: A way of estimating volatility of a security’s price based on a number of predictive variables. Implied volatility rises when the market is falling when investors believe that the asset’s price will decline over time, and it falls when the market is rising when investors believe that the security’s price will rise over time. This is due to the common belief that bearish markets are riskier than bullish markets.
MSCI Emerging Market Index: The MSCI Emerging Markets Index captures large and mid-cap representation across 23 emerging markets countries. With 834 constituents, the index covers approximately 85% of the free float-adjusted market capitalization in each country.
Russell 2000 Index: A benchmark that measures the performance of the small-cap segment of the US equity universe.
MSCI EAFE Index: An equities benchmark that captures large- and mid-cap representation across developed market countries around the world, excluding the US and Canada.
Bloomberg U.S. High Yield Index: The Bloomberg USD High Yield Corporate Bond Index is a rules-based, market-value weighted index engineered to measure publicly issued non-investment grade USD fixed-rate, taxable, corporate bonds. To be included in the index a security must have a minimum par amount of 250MM.
Bloomberg Barclays U.S. Aggregate Index: A benchmark that provides a measure of the performance of the US dollar denominated investment grade bond market, which includes investment grade government bonds, investment grade corporate bonds, mortgage pass through securities, commercial mortgage backed securities and asset backed securities that are publicly for sale in the US.
Bloomberg U.S. Treasury Index: The Bloomberg US Treasury Bond Index is a rules-based, market-value weighted index engineered to measure the performance and characteristics of fixed rate coupon US Treasuries which have a maturity greater than 12 months. To be included in the index a security must have a minimum par amount of 1,000MM.
Bloomberg Commodity Index: Bloomberg Commodity Index (BCOM) is calculated on an excess return basis and reflects commodity futures price movements. The index rebalances annually weighted 2/3 by trading volume and 1/3 by world production and weight-caps are applied at the commodity, sector and group level for diversification.
MSCI Europe Index: The MSCI Europe Index is a free-float weighted equity index designed to measure the equity market performance of the developed markets in Europe.
Euro STOXX 50 Index: Europe’s leading blue-chip index for the Eurozone, provides a blue-chip representation of super-sector leaders in the Eurozone. The index covers 50 stocks from 12 Eurozone countries.
MSCI Japan Index: The MSCI Europe Index is a free-float weighted equity index designed to measure the equity market performance of the developed markets in Japan.
Bloomberg Dollar Spot Index: The Bloomberg Dollar Spot Index tracks the performance of a basket of ten leading global currencies versus the US Dollar. Each currency in the basket and their weight is determined annually based on their share of international trade and FX liquidity.
Bloomberg Barclays Global Aggregate Bond Index: A benchmark that provides a broad-based measure of the global investment-grade fixed income markets. The three major components of this index are the US Aggregate, the Pan-European Aggregate, and the Asian-Pacific Aggregate Indices. The index also includes Eurodollar and Euro-Yen corporate bonds, Canadian government, agency and corporate securities, and USD investment-grade 144A securities.
State Street Confidence Indexes: Measures investor confidence or risk appetite quantitatively by analyzing the actual buying and selling patterns of institutional investors. The index assigns a precise meaning to changes in investor risk appetite: the greater the percentage allocation to equities, the higher risk appetite or confidence. A reading of 100 is neutral; it is the level at which investors are neither increasing nor decreasing their long-term allocations to risky assets. The results shown represent current results generated by State Street Investor Confidence Index. The results shown were achieved by means of a mathematical formula in addition to transactional market data, and are not indicative of actual future results which could differ substantially.
Yield to worst: Yield to worst is an estimate of the lowest yield that you can expect to earn from a bond when holding to maturity, absent a default. It is a measure that is used in place of yield to maturity with callable bonds.
43 1984314.16.1.AM.RTL

Definitions
MSCI USA Index: The MSCI World Index, which is part of The Modern Index Strategy, is a broad global equity benchmark that represents large and mid-cap equity performance across 23 developed markets countries. It covers approximately 85% of the free float-adjusted market capitalization in each country and MSCI World benchmark does not offer exposure to emerging markets.
MSCI USA Minimum Volatility Index: The MSCI USA Minimum Volatility (USD) Index aims to reflect the performance characteristics of a minimum variance strategy applied to the MSCI large and mid cap equity universe. The index is calculated by optimizing the MSCI USA Index, its parent index, for the lowest absolute risk (within a given set of constraints). Historically, the index has shown lower beta and volatility characteristics relative to the MSCI World Index.
MSCI USA Enhanced Value Weighted Index: The MSCI USA Enhanced Value Weighted Index captures large and mid-cap representation across the US equity markets exhibiting overall value style characteristics. The index is designed to represent the performance of securities that exhibit higher value characteristics relative to their peers within the corresponding GICS® sector.
MSCI USA Quality Index: The MSCI USA Quality Index is based on MSCI USA, its parent index. The index aims to capture the performance of quality growth stocks by identifying stocks with high quality scores based on three main fundamental variables: high return on equity (ROE), stable year-over-year earnings growth and low financial leverage.
MSCI USA Equal Weighted Index: The MSCI USA Equal Weighted Index represents an alternative weighting scheme to its market cap weighted parent index, the MSCI USA Index. At each quarterly rebalance date, all index constituents are weighted equally, effectively removing the influence of each constituent’s current price (high or low).
MSCI USA High Dividend Yield Index: The MSCI World High Dividend Yield Index is based on the MSCI USA Index, its parent index, and includes large and mid cap stocks. The index is designed to reflect the performance of equities in the parent index (excluding REITs) with higher dividend income and quality characteristics than average dividend yields that are both sustainable and persistent. The index also applies quality screens and reviews 12-month past performance to omit stocks with potentially deteriorating fundamentals that could force them to cut or reduce dividends.
Price-to-book ratio (P/B Ratio): The price-to-book ratio (P/B Ratio) is a ratio used to compare a stock’s market value to its book value. It is calculated by dividing the current closing price of the stock by the latest quarter’s book value per share. Also known as the “price-equity ratio.
Price-earnings ratio (P/E Ratio): The price-earnings ratio (P/E Ratio) is the ratio for valuing a company that measures its current share price relative to its per-share earnings. The price-earnings ratio can be calculated as: Market Value per Share/Earnings per Share.
Russell 1000 Growth Index: The index is a style index designed to track the performance of stocks that exhibit the strongest growth characteristics by using a style-attractiveness-weighting scheme.
Russell 1000 Value Index: The index is a style-concentrated index designed to track the performance of stocks that exhibit the strongest value characteristics by using a style-attractiveness-weighting scheme.
Russell 1000 Defensive Index and Russell 1000 Dynamic Index: The index measures a portion of the market based on the sensitivity to economic cycles, credit cycles, and market volatility, referred to as stability. Stability is measured at the company level in terms of volatility (price and earnings), leverage, and return on assets. The more stable half of the index is called the Defensive Index® and the less stable half is called the Dynamic Index®.
Z-score: It indicates how many standard deviations an element is from the mean. A z-score can be calculated from the following formula. z = (X - μ) / σ where z is the z-score, X is the sector relative performance. μ is the mean of the eleven sector relative performance, and σ is the standard deviation of sectors’ relative performance.
Implied Volatility: The estimated volatility of a security’s price. In general, implied volatility increases when the market is bearish and decreases when the market is bullish. This is due to the common belief that bearish markets are more risky than bullish markets.
Minimum Volatility Factor: A category of stocks that are characterized by relatively less movement in share price than many other equities.
Quality Factor: One of the six widely recognized, research-based smart beta factors that refers to “quality” equities. Companies whose stocks qualify exhibit consistent profitability, stability of earnings, low financial leverage and other characteristics consistent with long-term reliability such as ethical corporate governance.
Size Factor: A smart beta factor based on the tendency of small-cap stocks to outperform their large-cap peers over long time periods.
Yield Factor: A factor which screens for companies with a higher than average dividend yield relative to the broad market, and which have demonstrated dividend sustainability and persistence.
Momentum Factor: The tendency for a security to maintain a certain direction of price trajectory. This tendency is well documented in academic research, which has made “momentum” one of the six smart beta factors that are systematically being isolated in new-generation strategic indexes.
Value Factor: One of the basic elements of “style”-focused investing that focuses on companies that may be priced below intrinsic value. The most commonly used methodology to assess value is by examining price-to-book (P/B) ratios, which compare a company’s total market value with its assessed book value.
44 1984314.16.1.AM.RTL
Definitions
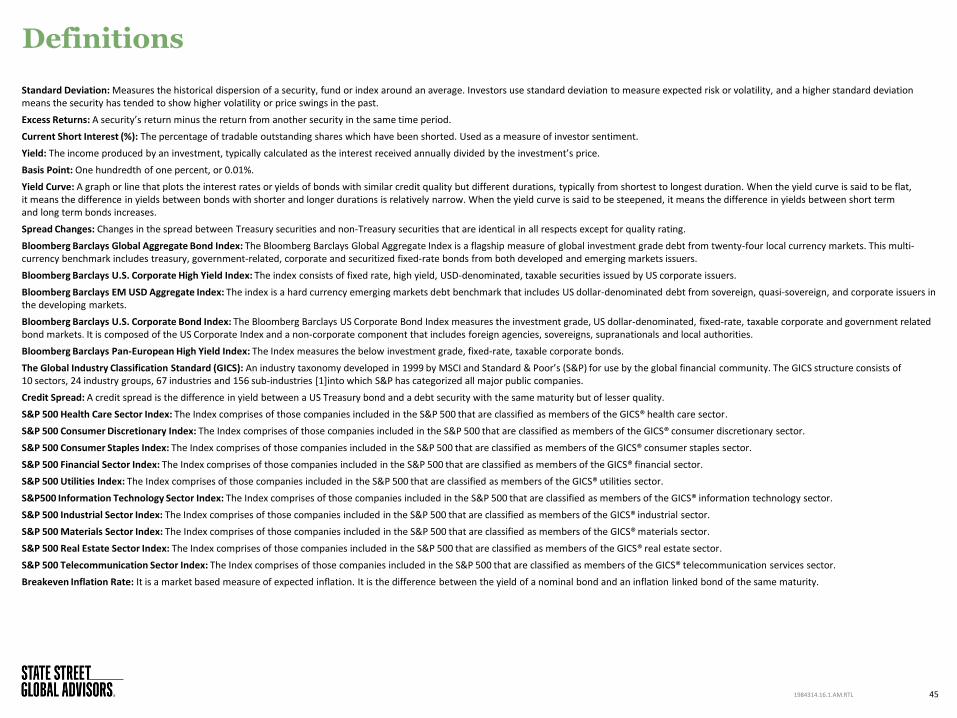
Standard Deviation: Measures the historical dispersion of a security, fund or index around an average. Investors use standard deviation to measure expected risk or volatility, and a higher standard deviation means the security has tended to show higher volatility or price swings in the past.
Excess Returns: A security’s return minus the return from another security in the same time period.
Current Short Interest (%): The percentage of tradable outstanding shares which have been shorted. Used as a measure of investor sentiment.
Yield: The income produced by an investment, typically calculated as the interest received annually divided by the investment’s price.
Basis Point: One hundredth of one percent, or 0.01%.
Yield Curve: A graph or line that plots the interest rates or yields of bonds with similar credit quality but different durations, typically from shortest to longest duration. When the yield curve is said to be flat, it means the difference in yields between bonds with shorter and longer durations is relatively narrow. When the yield curve is said to be steepened, it means the difference in yields between short term and long term bonds increases.
Spread Changes: Changes in the spread between Treasury securities and non-Treasury securities that are identical in all respects except for quality rating.
Bloomberg Barclays Global Aggregate Bond Index: The Bloomberg Barclays Global Aggregate Index is a flagship measure of global investment grade debt from twenty-four local currency markets. This multi-currency benchmark includes treasury, government-related, corporate and securitized fixed-rate bonds from both developed and emerging markets issuers.
Bloomberg Barclays U.S. Corporate High Yield Index: The index consists of fixed rate, high yield, USD-denominated, taxable securities issued by US corporate issuers.
Bloomberg Barclays EM USD Aggregate Index: The index is a hard currency emerging markets debt benchmark that includes US dollar-denominated debt from sovereign, quasi-sovereign, and corporate issuers in the developing markets.
Bloomberg Barclays U.S. Corporate Bond Index: The Bloomberg Barclays US Corporate Bond Index measures the investment grade, US dollar-denominated, fixed-rate, taxable corporate and government related bond markets. It is composed of the US Corporate Index and a non-corporate component that includes foreign agencies, sovereigns, supranationals and local authorities.
Bloomberg Barclays Pan-European High Yield Index: The Index measures the below investment grade, fixed-rate, taxable corporate bonds.
The Global Industry Classification Standard (GICS): An industry taxonomy developed in 1999 by MSCI and Standard & Poor’s (S&P) for use by the global financial community. The GICS structure consists of 10 sectors, 24 industry groups, 67 industries and 156 sub-industries [1]into which S&P has categorized all major public companies.
Credit Spread: A credit spread is the difference in yield between a US Treasury bond and a debt security with the same maturity but of lesser quality.
S&P 500 Health Care Sector Index: The Index comprises of those companies included in the S&P 500 that are classified as members of the GICS® health care sector.
S&P 500 Consumer Discretionary Index: The Index comprises of those companies included in the S&P 500 that are classified as members of the GICS® consumer discretionary sector.
S&P 500 Consumer Staples Index: The Index comprises of those companies included in the S&P 500 that are classified as members of the GICS® consumer staples sector.
S&P 500 Financial Sector Index: The Index comprises of those companies included in the S&P 500 that are classified as members of the GICS® financial sector.
S&P 500 Utilities Index: The Index comprises of those companies included in the S&P 500 that are classified as members of the GICS® utilities sector.
S&P500 Information Technology Sector Index: The Index comprises of those companies included in the S&P 500 that are classified as members of the GICS® information technology sector.
S&P 500 Industrial Sector Index: The Index comprises of those companies included in the S&P 500 that are classified as members of the GICS® industrial sector.
S&P 500 Materials Sector Index: The Index comprises of those companies included in the S&P 500 that are classified as members of the GICS® materials sector.
S&P 500 Real Estate Sector Index: The Index comprises of those companies included in the S&P 500 that are classified as members of the GICS® real estate sector.
S&P 500 Telecommunication Sector Index: The Index comprises of those companies included in the S&P 500 that are classified as members of the GICS® telecommunication services sector.
Breakeven Inflation Rate: It is a market based measure of expected inflation. It is the difference between the yield of a nominal bond and an inflation linked bond of the same maturity.
45 1984314.16.1.AM.RTL

Appendix D: Important Disclosures
46 1984314.16.1.AM.RTL
Important Disclosures
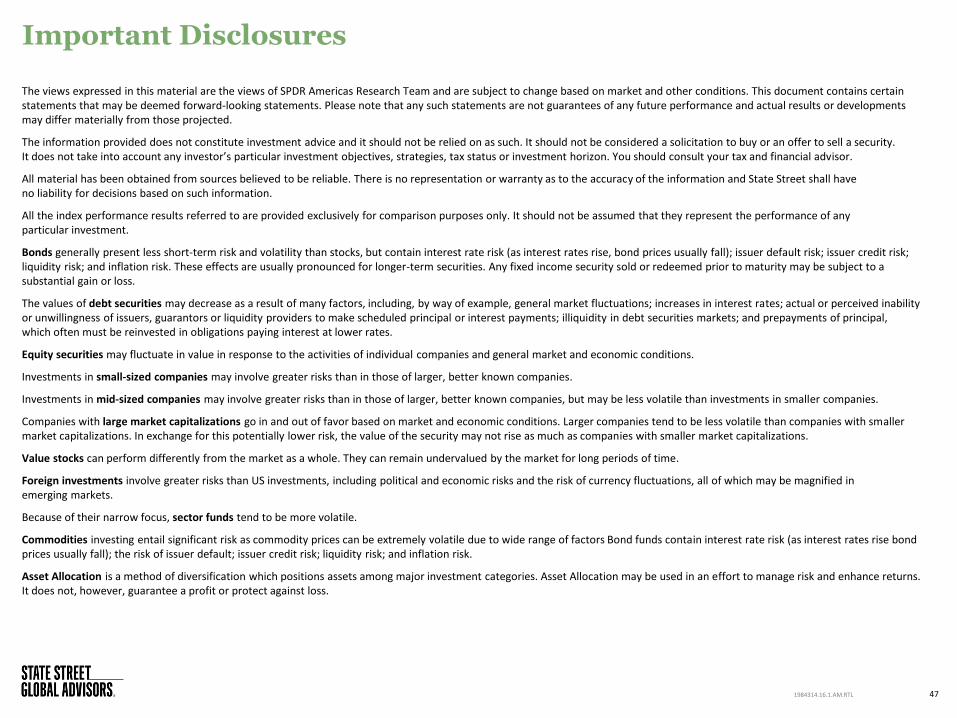
The views expressed in this material are the views of SPDR Americas Research Team and are subject to change based on market and other conditions. This document contains certain statements that may be deemed forward-looking statements. Please note that any such statements are not guarantees of any future performance and actual results or developments may differ materially from those projected.
The information provided does not constitute investment advice and it should not be relied on as such. It should not be considered a solicitation to buy or an offer to sell a security. It does not take into account any investor’s particular investment objectives, strategies, tax status or investment horizon. You should consult your tax and financial advisor.
All material has been obtained from sources believed to be reliable. There is no representation or warranty as to the accuracy of the information and State Street shall have no liability for decisions based on such information.
All the index performance results referred to are provided exclusively for comparison purposes only. It should not be assumed that they represent the performance of any particular investment.
Bonds generally present less short-term risk and volatility than stocks, but contain interest rate risk (as interest rates rise, bond prices usually fall); issuer default risk; issuer credit risk; liquidity risk; and inflation risk. These effects are usually pronounced for longer-term securities. Any fixed income security sold or redeemed prior to maturity may be subject to a substantial gain or loss.
The values of debt securities may decrease as a result of many factors, including, by way of example, general market fluctuations; increases in interest rates; actual or perceived inability or unwillingness of issuers, guarantors or liquidity providers to make scheduled principal or interest payments; illiquidity in debt securities markets; and prepayments of principal, which often must be reinvested in obligations paying interest at lower rates.
Equity securities may fluctuate in value in response to the activities of individual companies and general market and economic conditions.
Investments in small-sized companies may involve greater risks than in those of larger, better known companies.
Investments in mid-sized companies may involve greater risks than in those of larger, better known companies, but may be less volatile than investments in smaller companies.
Companies with large market capitalizations go in and out of favor based on market and economic conditions. Larger companies tend to be less volatile than companies with smaller market capitalizations. In exchange for this potentially lower risk, the value of the security may not rise as much as companies with smaller market capitalizations.
Value stocks can perform differently from the market as a whole. They can remain undervalued by the market for long periods of time.
Foreign investments involve greater risks than US investments, including political and economic risks and the risk of currency fluctuations, all of which may be magnified in emerging markets.
Because of their narrow focus, sector funds tend to be more volatile.
Commodities investing entail significant risk as commodity prices can be extremely volatile due to wide range of factors Bond funds contain interest rate risk (as interest rates rise bond prices usually fall); the risk of issuer default; issuer credit risk; liquidity risk; and inflation risk.
Asset Allocation is a method of diversification which positions assets among major investment categories. Asset Allocation may be used in an effort to manage risk and enhance returns. It does not, however, guarantee a profit or protect against loss.
47 1984314.16.1.AM.RTL
Important Disclosures (continued)
The trademarks and service marks referenced herein are the property of their respective owners. Third party data providers make no warranties or representations of any kind relating to the accuracy, completeness or timeliness of the data and have no liability for damages of any kind relating to the use of such data.
Standard & Poor’s, S&P and SPDR are registered trademarks of Standard & Poor/s Financial Services LLC (S&P); Dow Jones is a registered trademark of Dow Jones Trademark Holdings LLC (Dow Jones); and these trademarks have been licensed for use by S&P Dow Jones Indices LLC (SPDJI) and sublicensed for certain purposes by State Street Corporation. State Street Corporation’s financial products are not sponsored, endorsed, sold or promoted by SPDJI, Dow Jones, S&P, their respective affiliates and third party licensors and none of such parties make any representation regarding the advisability of investing in such product(s) nor do they have any liability in relation thereto, including for any errors, omissions, or interruptions of any index.
Distributor: State Street Global Advisors Funds Distributors LLC, member FINRA, SIPC, an indirect wholly owned subsidiary of State Street Corporation. References to State Street may include State Street Corporation and its affiliates. Certain State Street affiliates provide services and receive fees from the SPDR ETFs.
Before investing, consider the funds’ investment objectives, risks, charges and expenses. To obtain a prospectus or summary prospectus which contains this and other information, call 1-866-787-2257 or visit spdrs.com. Read it carefully.
State Street Global Advisors, One Iron Street, Boston, MA 02210.
© 2018 State Street Corporation — All Rights Reserved.
Tracking Code: 1984314.16.1.AM.RTL
Expiration Date: January 31, 2019
Not FDIC Insured — No Bank Guarantee — May Lose Value.
48 1984314.16.1.AM.RTL
Related Documents