STATE STREET GLOBAL ADVISORS LUXEMBOURG SICAV Société d'Investissement à Capital Variable Audited Annual Report For the Year ended December 31, 2012 No subscriptions can be received on the basis of the financial report alone. Subscriptions are only valid if made on the basis of the current Prospectus supplemented by a copy of the latest available Annual Report and a copy of the latest available Semi-Annual Report, if published later than the Annual Report. RCS Number B0141816

Welcome message from author
This document is posted to help you gain knowledge. Please leave a comment to let me know what you think about it! Share it to your friends and learn new things together.
Transcript
STATE STREET GLOBAL ADVISORS LUXEMBOURG SICAV
Société d'Investissement à Capital Variable
Audited Annual Report
For the Year ended December 31, 2012
No subscriptions can be received on the basis of the financial report alone.
Subscriptions are only valid if made on the basis of the current Prospectus supplemented by a copy of the latest available Annual Report
and a copy of the latest available Semi-Annual Report, if published later than the Annual Report.
RCS Number B0141816
Directors and Administration 1
Report of the Board of Directors 3
Report of the Investment Managers 5
Audit report 8
Combined Statement of Net Assets 10
Combined Statement of Operations 13
Combined Statement of Changes in Net Assets 16
Statistical Information 19
Schedules of Investments
SSgA Euro-Aggregate Corporate Bond Index Fund 21
SSgA Euro Treasury Bond Index Fund 42
SSgA Euro Sustainable Corporate Bond Index Fund 47
SSgA Euro Core Treasury Bond Index Fund 57
SSgA Global Treasury Bond Index Fund 60
SSgA US Issuer Scored Corporate Bond Index Fund 71
SSgA Active Global Inflation-Linked Bond Fund 78
SSgA Global Emerging Markets Local Currency Bond Fund 82
SSgA Europe Managed Volatility Equity Fund 86
SSgA Global Managed Volatility Equity Fund 89
SSgA EMU Alpha Equity Fund 94
SSgA Sectoral Healthcare Equity Fund 97
SSgA Active Fundamental Global Equity Spotlight Fund 99
SSgA Emerging Markets Select Equity Fund 101
SSgA Enhanced Emerging Markets Equity Fund 105
SSgA Emerging Markets SRI Enhanced Equity Fund 121
Notes to the Financial Statements 129
Risk Disclosure Information (Unaudited) 140
Note for Investors in Switzerland (Unaudited) 141
TABLE OF CONTENTS
STATE STREET GLOBAL ADVISORS LUXEMBOURG SICAV

STATE STREET GLOBAL ADVISORS LUXEMBOURG SICAV
DIRECTORS AND ADMINISTRATION
BOARD OF DIRECTORS OF THE COMPANY
Patrick Armstrong (*), Managing Director, State Street Global Advisors France S.A. Susanne van Dootingh, Chairman, Managing Director, State Street Global Advisors Limited Benoît Fally, Senior Managing Director, State Street Global Advisors Limited John Li How Cheong (**), Independent Director
THE COMPANY
State Street Global Advisors Luxembourg SICAV 49, Avenue J.F. Kennedy L-1855 Luxembourg Luxembourg
MANAGEMENT COMPANY
State Street Global Advisors Luxembourg Management S.à r.l. 49, Avenue J.F. Kennedy L-1855 Luxembourg Luxembourg
INVESTMENT MANAGER
State Street Global Advisors France S.A. Defense Plaza 23 – 25 Rue Delariviere-Lefoullon 92064 Paris la Défense Cedex France
SUB-INVESTMENT MANAGER
State Street Global Advisors, a division of State Street Bank and Trust Company 1 Lincoln Street Boston Massachusetts 02111 United States
State Street Global Advisors Limited 20 Churchill Place Canary Wharf London E14 5HJ United Kingdom
State Street Global Advisors Ireland Limited Two Park Place, Upper Hatch Street, Dublin 2 Ireland
Rexiter Capital Management Limited (***) 80 Cannon Street London EC4N 6HL United Kingdom
Sectoral Asset Management 1000 Sherbrooke Street West Suite 2120 Montreal Qc H3A 3G4 Canada
* until August 24, 2012 ** from May 14, 2012 *** until July 6, 2012
1

STATE STREET GLOBAL ADVISORS LUXEMBOURG SICAV
DIRECTORS AND ADMINISTRATION
PRINCIPAL DISTRIBUTOR
State Street Global Advisors Limited 20 Churchill Place Canary Wharf London E14 5HJ United Kingdom
AUDITOR
PricewaterhouseCoopers, Société cooperative 400, route d’Esch B.P. 1443 L-1014 Luxembourg Luxembourg
CENTRAL ADMINISTRATION, CUSTODIAN, PRINCIPAL PAYING AGENT, TRANSFER AGENT AND DOMICILIARY AGENT
State Street Bank Luxembourg S.A. 49, Avenue J.F. Kennedy L-1855 Luxembourg Luxembourg
LEGAL ADVISER
Linklaters LLP 35, Avenue J.F. Kennedy P.O. Box 1107 L-1011 Luxembourg Luxembourg
2
STATE STREET GLOBAL ADVISORS LUXEMBOURG SICAV
REPORT OF THE BOARD OF DIRECTORS
Dear Shareholders,
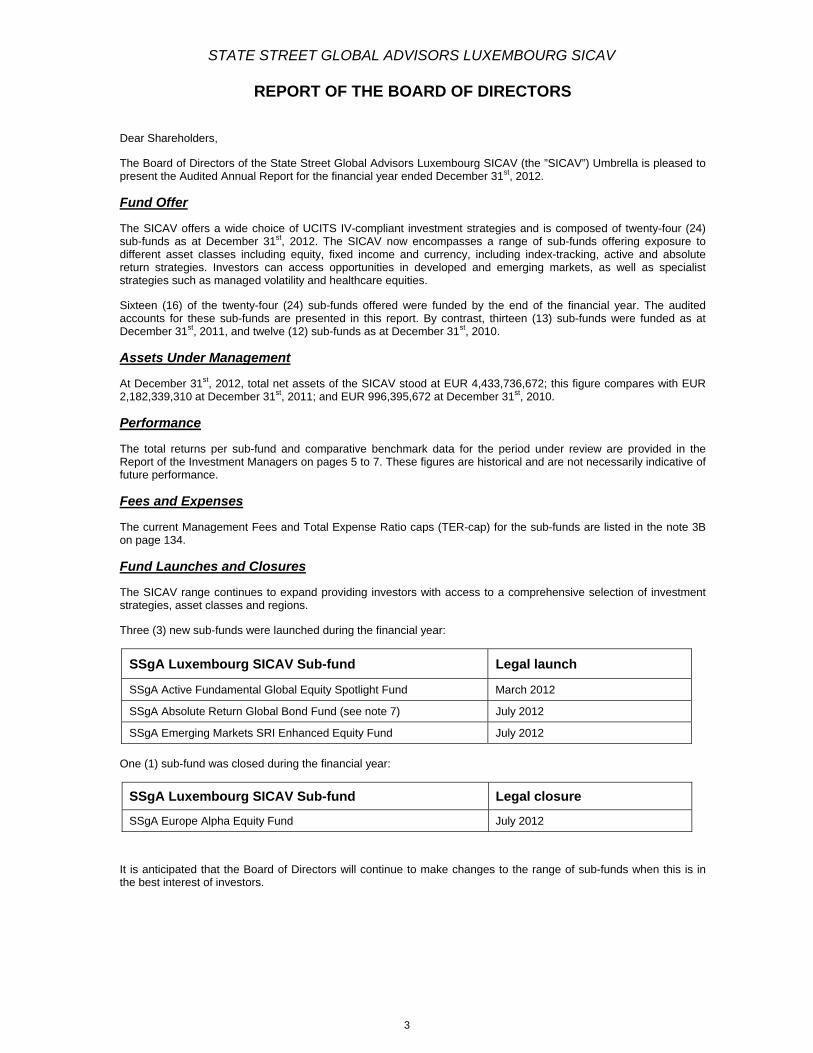
The Board of Directors of the State Street Global Advisors Luxembourg SICAV (the ”SICAV”) Umbrella is pleased to present the Audited Annual Report for the financial year ended December 31st, 2012.
Fund Offer
The SICAV offers a wide choice of UCITS IV-compliant investment strategies and is composed of twenty-four (24) sub-funds as at December 31st, 2012. The SICAV now encompasses a range of sub-funds offering exposure to different asset classes including equity, fixed income and currency, including index-tracking, active and absolute return strategies. Investors can access opportunities in developed and emerging markets, as well as specialist strategies such as managed volatility and healthcare equities.
Sixteen (16) of the twenty-four (24) sub-funds offered were funded by the end of the financial year. The audited accounts for these sub-funds are presented in this report. By contrast, thirteen (13) sub-funds were funded as at December 31st, 2011, and twelve (12) sub-funds as at December 31st, 2010.
Assets Under Management
At December 31st, 2012, total net assets of the SICAV stood at EUR 4,433,736,672; this figure compares with EUR 2,182,339,310 at December 31st, 2011; and EUR 996,395,672 at December 31st, 2010.
Performance
The total returns per sub-fund and comparative benchmark data for the period under review are provided in the Report of the Investment Managers on pages 5 to 7. These figures are historical and are not necessarily indicative of future performance.
Fees and Expenses
The current Management Fees and Total Expense Ratio caps (TER-cap) for the sub-funds are listed in the note 3B on page 134.
Fund Launches and Closures
The SICAV range continues to expand providing investors with access to a comprehensive selection of investment strategies, asset classes and regions.
Three (3) new sub-funds were launched during the financial year:
SSgA Luxembourg SICAV Sub-fund Legal launch
SSgA Active Fundamental Global Equity Spotlight Fund March 2012
SSgA Absolute Return Global Bond Fund (see note 7) July 2012
SSgA Emerging Markets SRI Enhanced Equity Fund July 2012
One (1) sub-fund was closed during the financial year:
SSgA Luxembourg SICAV Sub-fund Legal closure
SSgA Europe Alpha Equity Fund July 2012
It is anticipated that the Board of Directors will continue to make changes to the range of sub-funds when this is in the best interest of investors.
3
STATE STREET GLOBAL ADVISORS LUXEMBOURG SICAV
REPORT OF THE BOARD OF DIRECTORS
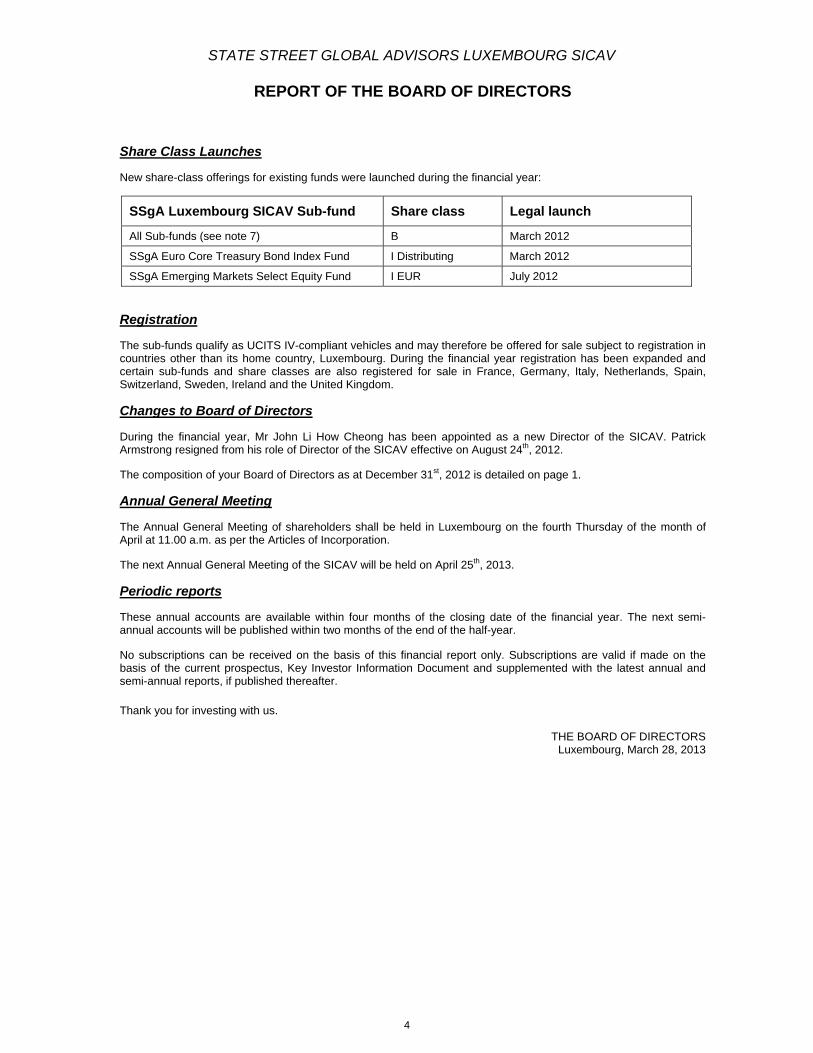
Share Class Launches
New share-class offerings for existing funds were launched during the financial year:
SSgA Luxembourg SICAV Sub-fund Share class Legal launch
All Sub-funds (see note 7) B March 2012
SSgA Euro Core Treasury Bond Index Fund I Distributing March 2012
SSgA Emerging Markets Select Equity Fund I EUR July 2012
Registration
The sub-funds qualify as UCITS IV-compliant vehicles and may therefore be offered for sale subject to registration in countries other than its home country, Luxembourg. During the financial year registration has been expanded and certain sub-funds and share classes are also registered for sale in France, Germany, Italy, Netherlands, Spain, Switzerland, Sweden, Ireland and the United Kingdom.
Changes to Board of Directors
During the financial year, Mr John Li How Cheong has been appointed as a new Director of the SICAV. Patrick Armstrong resigned from his role of Director of the SICAV effective on August 24th, 2012.
The composition of your Board of Directors as at December 31st, 2012 is detailed on page 1.
Annual General Meeting
The Annual General Meeting of shareholders shall be held in Luxembourg on the fourth Thursday of the month of April at 11.00 a.m. as per the Articles of Incorporation.
The next Annual General Meeting of the SICAV will be held on April 25th, 2013.
Periodic reports
These annual accounts are available within four months of the closing date of the financial year. The next semi-annual accounts will be published within two months of the end of the half-year.
No subscriptions can be received on the basis of this financial report only. Subscriptions are valid if made on the basis of the current prospectus, Key Investor Information Document and supplemented with the latest annual and semi-annual reports, if published thereafter.
Thank you for investing with us.
THE BOARD OF DIRECTORS Luxembourg, March 28, 2013
4

STATE STREET GLOBAL ADVISORS LUXEMBOURG SICAV
REPORT OF THE INVESTMENT MANAGERS
The figures stated in this report are historical and not indicative of future performance.
Market Review
Equity investors enjoyed a healthy return for the calendar year, though the gains were hard-won at times as economic and political events unsettled investors on occasion. Although 2012 began well for the world’s stock markets, the benefits flowing to investors from positive sentiment on euro prospects and bountiful liquidity provided by the European Central Bank to Europe’s stricken banks began to fade by the end of February. Concerns about Greece’s finances were exacerbated by election rhetoric that threatened to renege on agreed austerity measures. At the same time worries were mounting about Italy and Spain, particularly for the latter as bank and state balance sheets came under scrutiny. Equity markets experienced a steep decline through April and May before the election of a euro-friendly government in Greece settled nerves. Nonetheless, a wariness remained and non-euro assets tended to outperform at this time as investors favoured ‘safe-haven’ investments. UK assets benefited from this trend even as the UK economy slipped into a double-dip recession.
The pivotal moment of 2012 arguably came in late July when ECB President Mario Draghi stated that the bank would do ‘whatever it takes’ to support the euro. This followed a cut in the benchmark interest rate and backed up by renewed bond purchase plans and commitments from other central banks to expand quantitative easing measures, equities enjoyed particularly strong gains in the third quarter. The Q3 advances were achieved even as US and Chinese economic data looked to have taken a turn for the worse and as Europe lurched towards another recession. Corporate earnings also provided a signal that economic growth prospects had deteriorated, but through this period the expectation that central banks would avert a return to the financial crisis depths underpinned sentiment.
With markets more convinced about the EU’s commitment to the Euro, investors began to reverse flows back into European assets, narrowing and in some cases exceeding the return gap between US and European equities. In local currency, capital only terms, Germany’s Dax index climbed 29.1% in the year, with the French CAC 40 index gaining 15.2%. While the UK’s FTSE 100 gained 5.8%, the S&P 500 posted a return of 13.4% as mounting concerns about the ‘fiscal cliff’ in the final weeks took the shine off US equities. The election of a new Japanese government committed to inflating the economy saw the Nikkei gain 10% in December for a full-year gain of 22.9%. Chinese shares surged 14.6% in the same month to creep into positive territory for 2012 as the country’s leadership transition passed without incident and plans for an economic stimulus bolstered investor confidence.
The nature of the year under review was such that equity sector leadership fluctuated as investors moved between ‘defensive’ sectors and those that are more economically sensitive. However, when the performance for the 12 months is collated, it is those cyclical industries that tended to produce the best returns. US banks rallied on the overall economic improvement, with consumer discretionary stocks also in demand. A decline in commodity prices amid Chinese economy worries meant that mining stocks had a mixed year, notwithstanding a robust end to 2012. The traditional defensive areas of consumer staples, healthcare and utilities were generally weaker as investors rotated into ‘riskier’ alternatives.
Reflecting an environment of economic uncertainty globally, core government fixed income markets performed well, particularly in the first half of the year when demand for high-quality sovereigns such as the US, UK, Germany and Japan, drove yields to record low levels in all of these markets bar Japan (where yields have been low for many years). Unsurprisingly perhaps, Europe’s peripheral bonds experienced a more volatile period as concerns about the capacity of Spain and Italy to avoid requesting a bailout kept their borrowing costs at an elevated level before firmer European commitments to the euro, backed up by bond purchases, in the second half of the year resulted in a much stronger performance. As was the case for a number of ’core’ European countries, German bond yields turned negative for a time at the short-end of the yield curve (out to two years duration), while 10-year German yields fell to new record lows below 1.20 in June at the height of the euro crisis, before ending the year at a still-remarkable low level of 1.31%. Similar-dated French bond yields dropped to 1.99% despite a ratings downgrade, while peripheral borrowing costs fell the most: Irish 9-year yields fell to 4.5% from 8.4% in 2012, while Italian yields dropped to 4.49% from a start-of-year position of 7.11%. UK gilts delivered positive returns in the year, although they tended to underperform as stubbornly sluggish economic prospects and a reversal of sterling gains meant that gilt prices finished the year largely unchanged.
5
STATE STREET GLOBAL ADVISORS LUXEMBOURG SICAV
REPORT OF THE INVESTMENT MANAGERS
The figures stated in this report are historical and not indicative of future performance.
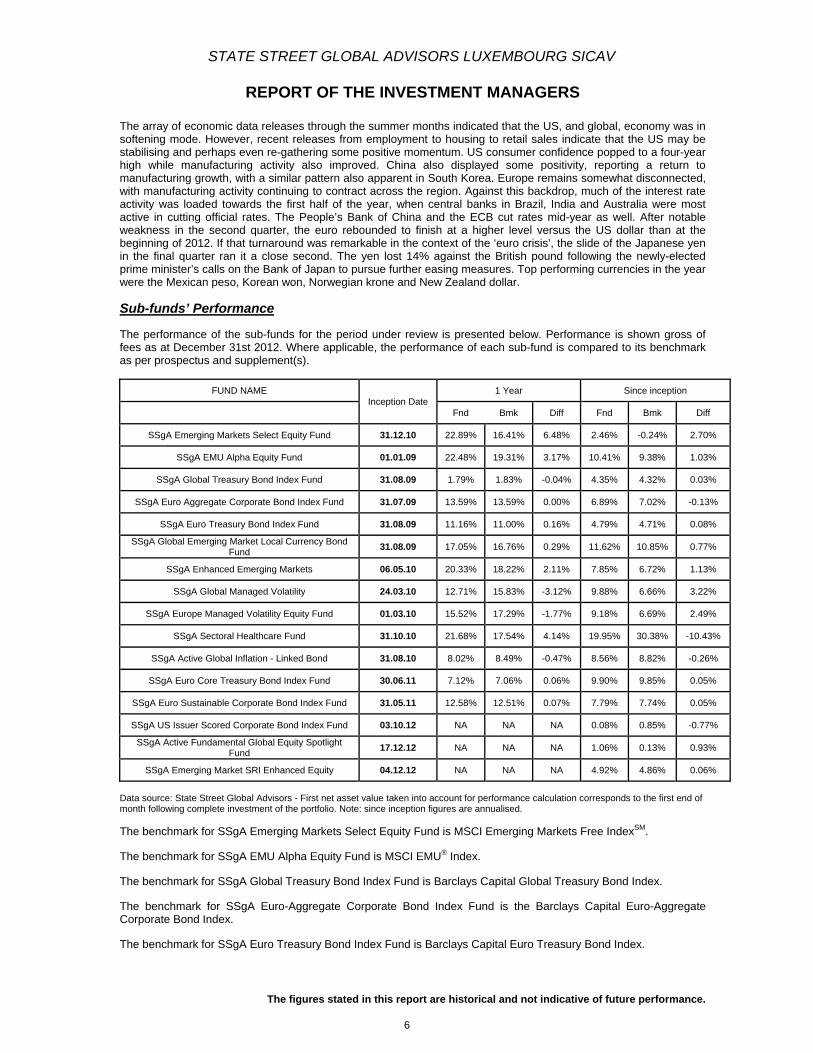
The array of economic data releases through the summer months indicated that the US, and global, economy was in softening mode. However, recent releases from employment to housing to retail sales indicate that the US may be stabilising and perhaps even re-gathering some positive momentum. US consumer confidence popped to a four-year high while manufacturing activity also improved. China also displayed some positivity, reporting a return to manufacturing growth, with a similar pattern also apparent in South Korea. Europe remains somewhat disconnected, with manufacturing activity continuing to contract across the region. Against this backdrop, much of the interest rate activity was loaded towards the first half of the year, when central banks in Brazil, India and Australia were most active in cutting official rates. The People’s Bank of China and the ECB cut rates mid-year as well. After notable weakness in the second quarter, the euro rebounded to finish at a higher level versus the US dollar than at the beginning of 2012. If that turnaround was remarkable in the context of the ‘euro crisis’, the slide of the Japanese yen in the final quarter ran it a close second. The yen lost 14% against the British pound following the newly-elected prime minister’s calls on the Bank of Japan to pursue further easing measures. Top performing currencies in the year were the Mexican peso, Korean won, Norwegian krone and New Zealand dollar.
Sub-funds’ Performance
The performance of the sub-funds for the period under review is presented below. Performance is shown gross of fees as at December 31st 2012. Where applicable, the performance of each sub-fund is compared to its benchmark as per prospectus and supplement(s).
FUND NAME Inception Date
1 Year Since inception
Fnd Bmk Diff Fnd Bmk Diff
SSgA Emerging Markets Select Equity Fund 31.12.10 22.89% 16.41% 6.48% 2.46% -0.24% 2.70%
SSgA EMU Alpha Equity Fund 01.01.09 22.48% 19.31% 3.17% 10.41% 9.38% 1.03%
SSgA Global Treasury Bond Index Fund 31.08.09 1.79% 1.83% -0.04% 4.35% 4.32% 0.03%
SSgA Euro Aggregate Corporate Bond Index Fund 31.07.09 13.59% 13.59% 0.00% 6.89% 7.02% -0.13%
SSgA Euro Treasury Bond Index Fund 31.08.09 11.16% 11.00% 0.16% 4.79% 4.71% 0.08%
SSgA Global Emerging Market Local Currency Bond Fund
31.08.09 17.05% 16.76% 0.29% 11.62% 10.85% 0.77%
SSgA Enhanced Emerging Markets 06.05.10 20.33% 18.22% 2.11% 7.85% 6.72% 1.13%
SSgA Global Managed Volatility 24.03.10 12.71% 15.83% -3.12% 9.88% 6.66% 3.22%
SSgA Europe Managed Volatility Equity Fund 01.03.10 15.52% 17.29% -1.77% 9.18% 6.69% 2.49%
SSgA Sectoral Healthcare Fund 31.10.10 21.68% 17.54% 4.14% 19.95% 30.38% -10.43%
SSgA Active Global Inflation - Linked Bond 31.08.10 8.02% 8.49% -0.47% 8.56% 8.82% -0.26%
SSgA Euro Core Treasury Bond Index Fund 30.06.11 7.12% 7.06% 0.06% 9.90% 9.85% 0.05%
SSgA Euro Sustainable Corporate Bond Index Fund 31.05.11 12.58% 12.51% 0.07% 7.79% 7.74% 0.05%
SSgA US Issuer Scored Corporate Bond Index Fund 03.10.12 NA NA NA 0.08% 0.85% -0.77%
SSgA Active Fundamental Global Equity Spotlight Fund
17.12.12 NA NA NA 1.06% 0.13% 0.93%
SSgA Emerging Market SRI Enhanced Equity 04.12.12 NA NA NA 4.92% 4.86% 0.06%
Data source: State Street Global Advisors - First net asset value taken into account for performance calculation corresponds to the first end of month following complete investment of the portfolio. Note: since inception figures are annualised. The benchmark for SSgA Emerging Markets Select Equity Fund is MSCI Emerging Markets Free IndexSM.
The benchmark for SSgA EMU Alpha Equity Fund is MSCI EMU® Index.
The benchmark for SSgA Global Treasury Bond Index Fund is Barclays Capital Global Treasury Bond Index.
The benchmark for SSgA Euro-Aggregate Corporate Bond Index Fund is the Barclays Capital Euro-Aggregate Corporate Bond Index.
The benchmark for SSgA Euro Treasury Bond Index Fund is Barclays Capital Euro Treasury Bond Index.
6
STATE STREET GLOBAL ADVISORS LUXEMBOURG SICAV
REPORT OF THE INVESTMENT MANAGERS
The figures stated in this report are historical and not indicative of future performance.
The benchmark for SSgA Global Emerging Markets Local Currency Bond Fund is JP Morgan Government Bond Index - Emerging Markets Global Diversified Index.
The benchmark for SSgA Enhanced Emerging Markets Equity Fund is MSCI Emerging Markets IndexSM.
The benchmark for SSgA Global Managed Volatility Equity Fund is MSCI World Index (Net).
The benchmark for SSgA Europe Managed Volatility Equity Fund is MSCI Europe Index (Net).
The benchmark for SSgA Sectoral Healthcare Equity Fund is MSCI Daily TR World Net Health Care USD Index.
The benchmark for SSgA Active Global Inflation-Linked Bond Fund is Barclays Capital Global Inflation-Linked Bond Index.
The benchmark for SSgA Euro Core Treasury Bond Index Fund is Barclays Capital Global Treasury Bond Index (The Index is composed of the following weighted indices: 40% Barclays Capital Global Treasury Germany Bond Index, 40% Barclays Capital Global Treasury France Bond Index and 20% Barclays Capital Global Treasury Netherlands Bond Index).
The benchmark for SSgA Euro Sustainable Corporate Bond Index Fund is Markit iBoxx Euro Sustainable Corporate Bond Custom Index.
The benchmark for SSgA US Issuer Scored Corporate Bond Index Fund is BarclaysCapital US Issuer Scored Corporate Index
The benchmark for SSgA Active Fundamental Global Equity Spotlight Fund is MSCI World Index
The benchmark for SSgA Emerging Markets SRI Enhanced Equity is MSCI Emerging Markets IndexSM
THE INVESTMENT MANAGERS Luxembourg, March 28, 2013
7
PrT:
CaR.C
Au ToST We
“S
Inv
Ch
no
Re
Th
in
an
fin
Re
Ou
ac
Se
ob
An
sta
as
tho
an
cir
au
es
sta
ricewaterhouseC +352 494848 1
abinet de révisioC.S. Luxembour
udit report
o the SharehTATE STRE
e have audite
ICAV”) and of
vestments as
hanges in Net A
otes to the finan
esponsibility of
he Board of Dir
accordance w
nd for such inte
nancial stateme
esponsibility of
ur responsibility
ccordance with
ecteur Financie
btain reasonabl
n audit involve
atements. The
ssessment of th
ose risk asses
nd fair present
rcumstances, b
udit also includ
stimates made
atements.
Coopers, Société1, F:+352 49484
on agréé. Experrg B 65 477 - TV
holders of ET GLOBAL
ed the accomp
f each of its su
at December
Assets for the
ncial statement
f the Board of D
rectors of the S
ith Luxembour
ernal control as
ents that are fre
f the “Réviseur
y is to express
International S
er”. Those stan
le assurance a
s performing p
e procedures s
he risks of ma
sments, the “R
tation of the
but not for the
des evaluating
by the Board
é coopérative, 448 2900, www.p
rt-comptable (aVA LU25482518
L ADVISORS
panying financ
ub-funds, whic
31, 2012 and
year then end
ts.
Directors of the
SICAV is respo
rg legal and reg
s the Board of D
ee from materia
d’entreprises a
s an opinion on
Standards on A
ndards require
about whether t
procedures to
selected depe
aterial misstate
Réviseur d’entre
financial state
purpose of ex
the appropriat
of Directors of
400 Route d’Escpwc.lu
utorisation gou8
S LUXEMBO
cial statements
ch comprise th
the Combined
ed, and a sum
e SICAV for the
nsible for the p
gulatory requir
Directors of the
al misstatemen
agréé”
n these financia
Auditing as ado
that we comply
the financial sta
obtain audit e
end on the jud
ment of the fin
eprises agréé”
ements in orde
pressing an op
teness of acco
f the SICAV, a
ch, B.P. 1443, L-
uvernementale n
OURG SICAV
s of State Stre
he Combined S
d Statement of
mmary of signifi
e financial state
preparation and
ements relating
e SICAV determ
nt, whether due
al statements b
opted for Luxem
y with ethical r
atements are fr
evidence about
dgment of the
nancial stateme
considers inte
er to design a
pinion on the e
ounting policies
as well as eval
-1014 Luxembou
n°10028256)
V
eet Global Ad
Statement of N
f Operations a
cant accountin
ements
d fair presentat
g to the prepar
mines is neces
e to fraud or er
based on our a
mbourg by the
requirements a
ree from mater
t the amounts
e “Réviseur d’e
ents, whether
ernal control re
audit procedur
effectiveness o
s used and the
luating the ove
urg
visors Luxemb
Net Assets and
and the Comb
ng policies and
tion of these fin
ration of the fin
sary to enable
ror.
audit. We cond
“Commission d
and plan and pe
rial misstateme
and disclosur
entreprises agré
due to fraud o
elevant to the e
res that are a
of the entity’s in
e reasonablen
erall presentati
bourg SICAV
d the Schedule
ined Statemen
other explana
nancial stateme
nancial stateme
the preparatio
ducted our aud
de Surveillance
erform the aud
ent.
es in the finan
éé”, including
or error. In ma
entity’s prepara
appropriate in
nternal control
ness of accoun
on of the finan
(the
e of
nt of
atory
ents
ents
on of
dit in
e du
dit to
ncial
the
king
ation
the
. An
nting
ncial
8
$x?we
We believe that the audit evidence we haro obtained is sufficient and appropriate to provide a basis for our auditopinion,
Opinion
In our opinion, the ffnanclal stiatements give a true and fiair view of the financlal positon of Slate Sbeet Global AdvlsorsLuxembourg SICAV and of each of its sub-funds as of December 31,2012, and of the results of their operations andc,hanges in $eir net assets br the year lhen ended in accordance with Luxembourg legal and regulatory requiremenbrelafing to the preparatlon of the financial statemenF.
Other mafrers
Supplementary inbrmation includd in the annual report has been reviewed in the context of our mandato but has notbeen subject to speciflc audit procedures canied out in accordance wilh the standards described above. Consequendy,we express no opinion on such information. However, we have no observation to make conceming sucfi information inthe context of the financial statements traken as a whole.
PricewaterhouseCoopers, Soci6t6 coop6raffveRepresented by
Luxembourg, March 28, 2013
/"k'
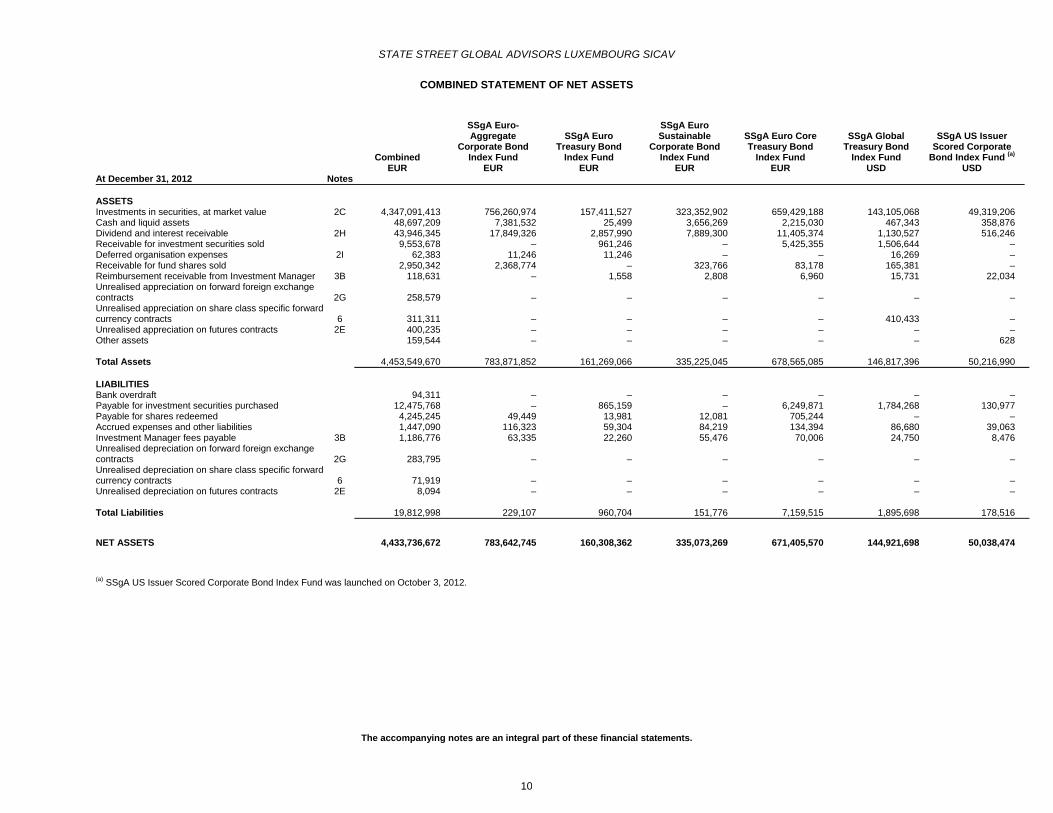
STATE STREET GLOBAL ADVISORS LUXEMBOURG SICAV
COMBINED STATEMENT OF NET ASSETS
The accompanying notes are an integral part of these financial statements.
Combined
SSgA Euro-Aggregate
Corporate Bond Index Fund
SSgA Euro Treasury Bond
Index Fund
SSgA Euro Sustainable
Corporate Bond Index Fund
SSgA Euro Core Treasury Bond
Index Fund
SSgA Global Treasury Bond
Index Fund
SSgA US Issuer Scored Corporate
Bond Index Fund (a) EUR EUR EUR EUR EUR USD USD
At December 31, 2012 Notes ASSETS Investments in securities, at market value 2C 4,347,091,413 756,260,974 157,411,527 323,352,902 659,429,188 143,105,068 49,319,206 Cash and liquid assets 48,697,209 7,381,532 25,499 3,656,269 2,215,030 467,343 358,876 Dividend and interest receivable 2H 43,946,345 17,849,326 2,857,990 7,889,300 11,405,374 1,130,527 516,246 Receivable for investment securities sold 9,553,678 – 961,246 – 5,425,355 1,506,644 – Deferred organisation expenses 2I 62,383 11,246 11,246 – – 16,269 – Receivable for fund shares sold 2,950,342 2,368,774 – 323,766 83,178 165,381 – Reimbursement receivable from Investment Manager 3B 118,631 – 1,558 2,808 6,960 15,731 22,034 Unrealised appreciation on forward foreign exchange contracts 2G 258,579 – – – – – – Unrealised appreciation on share class specific forward currency contracts 6 311,311 – – – – 410,433 – Unrealised appreciation on futures contracts 2E 400,235 – – – – – – Other assets 159,544 – – – – – 628 Total Assets 4,453,549,670 783,871,852 161,269,066 335,225,045 678,565,085 146,817,396 50,216,990 LIABILITIES Bank overdraft 94,311 – – – – – – Payable for investment securities purchased 12,475,768 – 865,159 – 6,249,871 1,784,268 130,977 Payable for shares redeemed 4,245,245 49,449 13,981 12,081 705,244 – – Accrued expenses and other liabilities 1,447,090 116,323 59,304 84,219 134,394 86,680 39,063 Investment Manager fees payable 3B 1,186,776 63,335 22,260 55,476 70,006 24,750 8,476 Unrealised depreciation on forward foreign exchange contracts 2G 283,795 – – – – – – Unrealised depreciation on share class specific forward currency contracts 6 71,919 – – – – – – Unrealised depreciation on futures contracts 2E 8,094 – – – – – – Total Liabilities 19,812,998 229,107 960,704 151,776 7,159,515 1,895,698 178,516
NET ASSETS 4,433,736,672 783,642,745 160,308,362 335,073,269 671,405,570 144,921,698 50,038,474
(a) SSgA US Issuer Scored Corporate Bond Index Fund was launched on October 3, 2012.
10
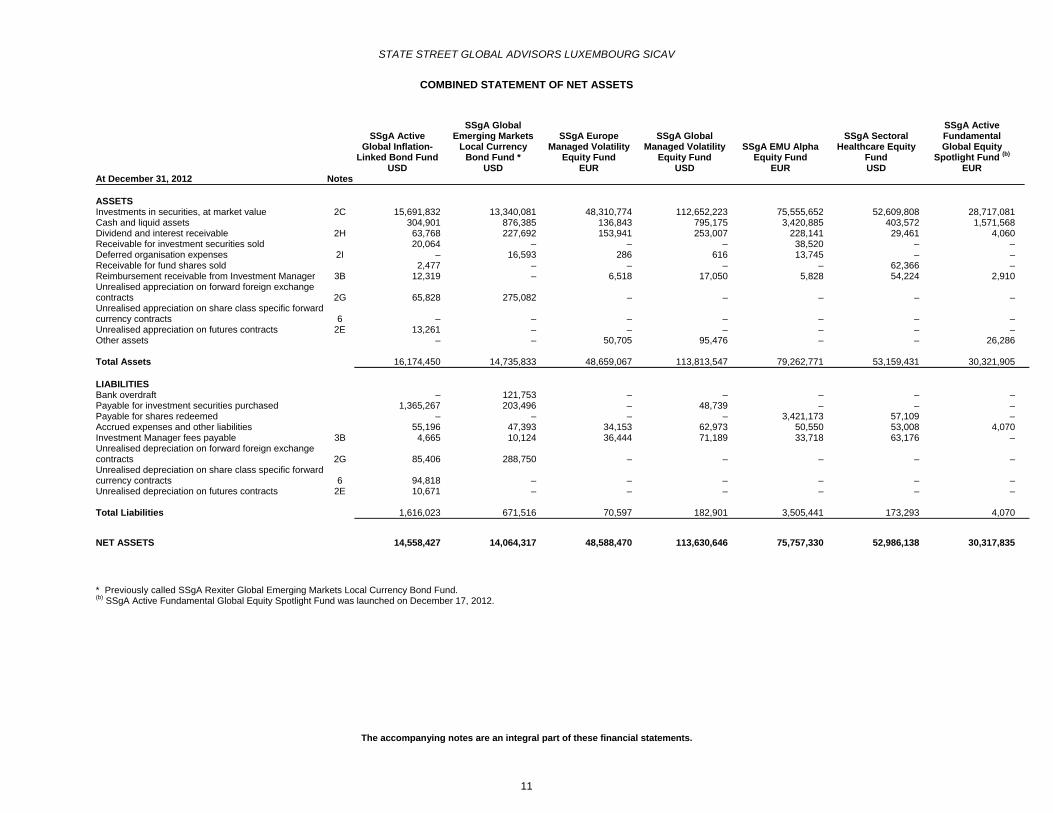
STATE STREET GLOBAL ADVISORS LUXEMBOURG SICAV
COMBINED STATEMENT OF NET ASSETS
The accompanying notes are an integral part of these financial statements.
SSgA Active Global Inflation-
Linked Bond Fund
SSgA Global Emerging Markets
Local Currency Bond Fund *
SSgA Europe Managed Volatility
Equity Fund
SSgA Global Managed Volatility
Equity Fund
SSgA EMU Alpha Equity Fund
SSgA Sectoral Healthcare Equity
Fund
SSgA Active Fundamental Global Equity
Spotlight Fund (b) USD USD EUR USD EUR USD EUR
At December 31, 2012 Notes ASSETS Investments in securities, at market value 2C 15,691,832 13,340,081 48,310,774 112,652,223 75,555,652 52,609,808 28,717,081 Cash and liquid assets 304,901 876,385 136,843 795,175 3,420,885 403,572 1,571,568 Dividend and interest receivable 2H 63,768 227,692 153,941 253,007 228,141 29,461 4,060 Receivable for investment securities sold 20,064 – – – 38,520 – – Deferred organisation expenses 2I – 16,593 286 616 13,745 – – Receivable for fund shares sold 2,477 – – – – 62,366 – Reimbursement receivable from Investment Manager 3B 12,319 – 6,518 17,050 5,828 54,224 2,910 Unrealised appreciation on forward foreign exchange contracts 2G 65,828 275,082 – – – – – Unrealised appreciation on share class specific forward currency contracts 6 – – – – – – – Unrealised appreciation on futures contracts 2E 13,261 – – – – – – Other assets – – 50,705 95,476 – – 26,286 Total Assets 16,174,450 14,735,833 48,659,067 113,813,547 79,262,771 53,159,431 30,321,905 LIABILITIES Bank overdraft – 121,753 – – – – – Payable for investment securities purchased 1,365,267 203,496 – 48,739 – – – Payable for shares redeemed – – – – 3,421,173 57,109 – Accrued expenses and other liabilities 55,196 47,393 34,153 62,973 50,550 53,008 4,070 Investment Manager fees payable 3B 4,665 10,124 36,444 71,189 33,718 63,176 – Unrealised depreciation on forward foreign exchange contracts 2G 85,406 288,750 – – – – – Unrealised depreciation on share class specific forward currency contracts 6 94,818 – – – – – – Unrealised depreciation on futures contracts 2E 10,671 – – – – – – Total Liabilities 1,616,023 671,516 70,597 182,901 3,505,441 173,293 4,070
NET ASSETS 14,558,427 14,064,317 48,588,470 113,630,646 75,757,330 52,986,138 30,317,835
* Previously called SSgA Rexiter Global Emerging Markets Local Currency Bond Fund. (b) SSgA Active Fundamental Global Equity Spotlight Fund was launched on December 17, 2012.
11
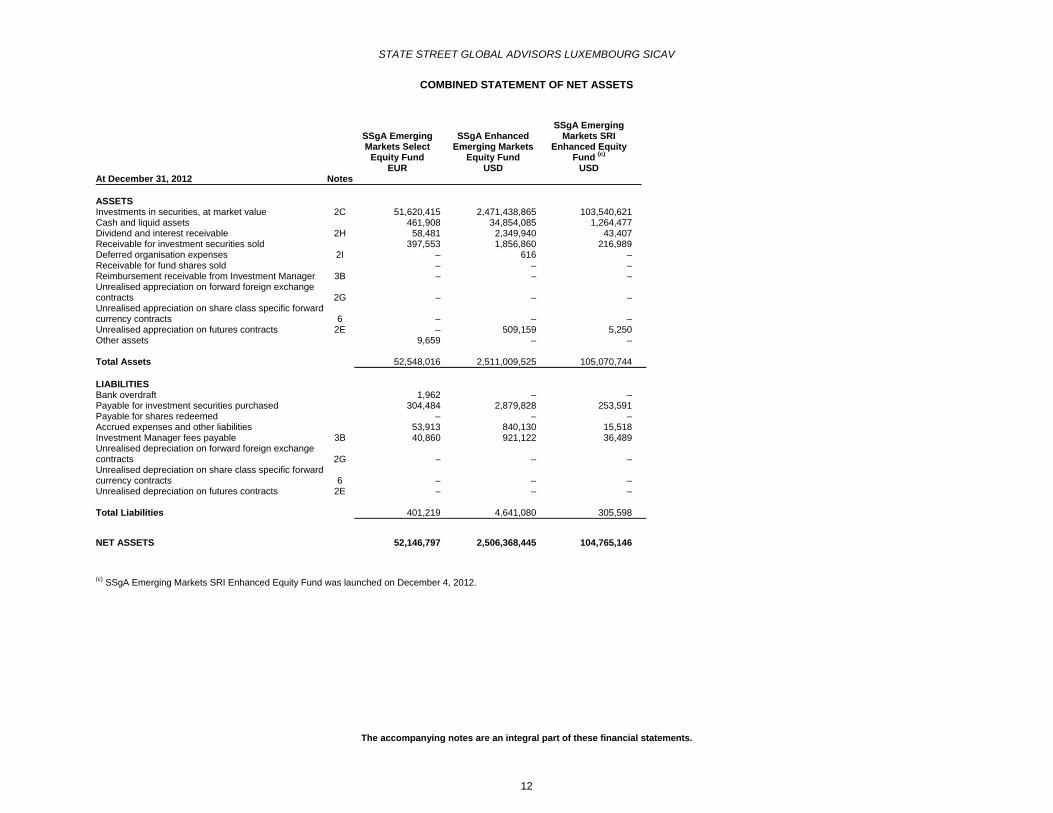
STATE STREET GLOBAL ADVISORS LUXEMBOURG SICAV
COMBINED STATEMENT OF NET ASSETS
The accompanying notes are an integral part of these financial statements.
SSgA Emerging Markets Select
Equity Fund
SSgA Enhanced Emerging Markets
Equity Fund
SSgA Emerging Markets SRI
Enhanced Equity Fund (c)
EUR USD USD At December 31, 2012 Notes ASSETS Investments in securities, at market value 2C 51,620,415 2,471,438,865 103,540,621 Cash and liquid assets 461,908 34,854,085 1,264,477 Dividend and interest receivable 2H 58,481 2,349,940 43,407 Receivable for investment securities sold 397,553 1,856,860 216,989 Deferred organisation expenses 2I – 616 – Receivable for fund shares sold – – – Reimbursement receivable from Investment Manager 3B – – – Unrealised appreciation on forward foreign exchange contracts 2G – – – Unrealised appreciation on share class specific forward currency contracts 6 – – – Unrealised appreciation on futures contracts 2E – 509,159 5,250 Other assets 9,659 – – Total Assets 52,548,016 2,511,009,525 105,070,744 LIABILITIES Bank overdraft 1,962 – – Payable for investment securities purchased 304,484 2,879,828 253,591 Payable for shares redeemed – – – Accrued expenses and other liabilities 53,913 840,130 15,518 Investment Manager fees payable 3B 40,860 921,122 36,489 Unrealised depreciation on forward foreign exchange contracts 2G – – – Unrealised depreciation on share class specific forward currency contracts 6 – – – Unrealised depreciation on futures contracts 2E – – – Total Liabilities 401,219 4,641,080 305,598
NET ASSETS 52,146,797 2,506,368,445 104,765,146
(c) SSgA Emerging Markets SRI Enhanced Equity Fund was launched on December 4, 2012.
12
STATE STREET GLOBAL ADVISORS LUXEMBOURG SICAV
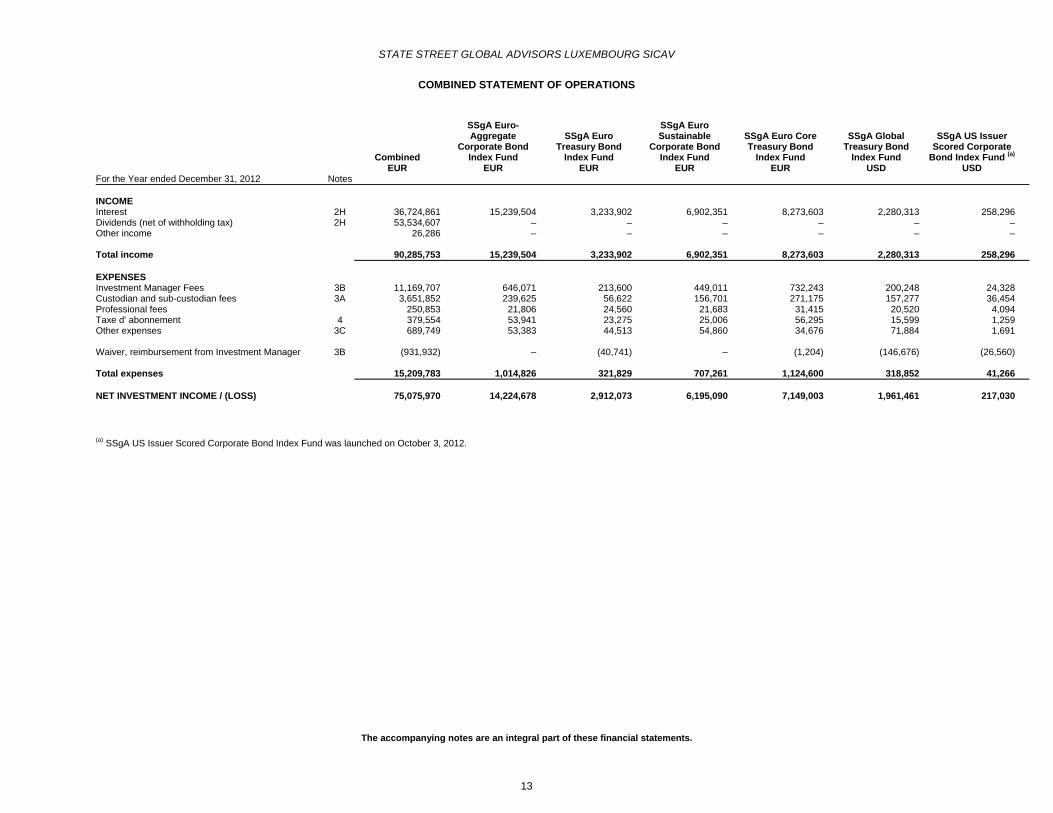
COMBINED STATEMENT OF OPERATIONS
The accompanying notes are an integral part of these financial statements.
Combined
SSgA Euro-Aggregate
Corporate Bond Index Fund
SSgA Euro Treasury Bond
Index Fund
SSgA Euro Sustainable
Corporate Bond Index Fund
SSgA Euro Core Treasury Bond
Index Fund
SSgA Global Treasury Bond
Index Fund
SSgA US Issuer Scored Corporate
Bond Index Fund (a) EUR EUR EUR EUR EUR USD USD
For the Year ended December 31, 2012 Notes INCOME Interest 2H 36,724,861 15,239,504 3,233,902 6,902,351 8,273,603 2,280,313 258,296 Dividends (net of withholding tax) 2H 53,534,607 – – – – – – Other income 26,286 – – – – – – Total income 90,285,753 15,239,504 3,233,902 6,902,351 8,273,603 2,280,313 258,296 EXPENSES Investment Manager Fees 3B 11,169,707 646,071 213,600 449,011 732,243 200,248 24,328 Custodian and sub-custodian fees 3A 3,651,852 239,625 56,622 156,701 271,175 157,277 36,454 Professional fees 250,853 21,806 24,560 21,683 31,415 20,520 4,094 Taxe d' abonnement 4 379,554 53,941 23,275 25,006 56,295 15,599 1,259 Other expenses 3C 689,749 53,383 44,513 54,860 34,676 71,884 1,691 Waiver, reimbursement from Investment Manager 3B (931,932) – (40,741) – (1,204) (146,676) (26,560) Total expenses 15,209,783 1,014,826 321,829 707,261 1,124,600 318,852 41,266 NET INVESTMENT INCOME / (LOSS) 75,075,970 14,224,678 2,912,073 6,195,090 7,149,003 1,961,461 217,030
(a) SSgA US Issuer Scored Corporate Bond Index Fund was launched on October 3, 2012.
13
STATE STREET GLOBAL ADVISORS LUXEMBOURG SICAV
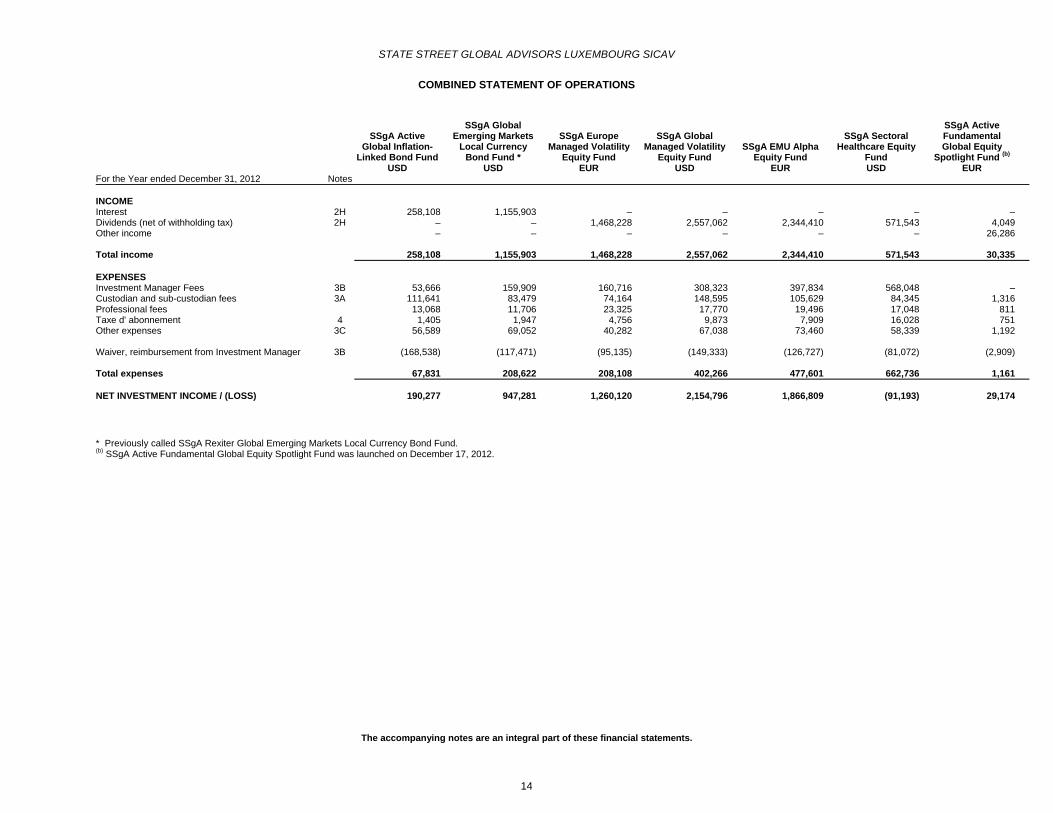
COMBINED STATEMENT OF OPERATIONS
The accompanying notes are an integral part of these financial statements.
SSgA Active Global Inflation-
Linked Bond Fund
SSgA Global Emerging Markets
Local Currency Bond Fund *
SSgA Europe Managed Volatility
Equity Fund
SSgA Global Managed Volatility
Equity Fund
SSgA EMU Alpha Equity Fund
SSgA Sectoral Healthcare Equity
Fund
SSgA Active Fundamental Global Equity
Spotlight Fund (b) USD USD EUR USD EUR USD EUR
For the Year ended December 31, 2012 Notes INCOME Interest 2H 258,108 1,155,903 – – – – – Dividends (net of withholding tax) 2H – – 1,468,228 2,557,062 2,344,410 571,543 4,049 Other income – – – – – – 26,286 Total income 258,108 1,155,903 1,468,228 2,557,062 2,344,410 571,543 30,335 EXPENSES Investment Manager Fees 3B 53,666 159,909 160,716 308,323 397,834 568,048 – Custodian and sub-custodian fees 3A 111,641 83,479 74,164 148,595 105,629 84,345 1,316 Professional fees 13,068 11,706 23,325 17,770 19,496 17,048 811 Taxe d' abonnement 4 1,405 1,947 4,756 9,873 7,909 16,028 751 Other expenses 3C 56,589 69,052 40,282 67,038 73,460 58,339 1,192 Waiver, reimbursement from Investment Manager 3B (168,538) (117,471) (95,135) (149,333) (126,727) (81,072) (2,909) Total expenses 67,831 208,622 208,108 402,266 477,601 662,736 1,161 NET INVESTMENT INCOME / (LOSS) 190,277 947,281 1,260,120 2,154,796 1,866,809 (91,193) 29,174
* Previously called SSgA Rexiter Global Emerging Markets Local Currency Bond Fund. (b) SSgA Active Fundamental Global Equity Spotlight Fund was launched on December 17, 2012.
14

STATE STREET GLOBAL ADVISORS LUXEMBOURG SICAV
COMBINED STATEMENT OF OPERATIONS
The accompanying notes are an integral part of these financial statements.
SSgA Emerging Markets Select
Equity Fund
SSgA Enhanced Emerging Markets
Equity Fund
SSgA Emerging Markets SRI
Enhanced Equity Fund (c)
EUR USD USD For the Year ended December 31, 2012 Notes INCOME Interest 2H – – – Dividends (net of withholding tax) 2H 2,051,151 58,058,717 73,802 Other income – – – Total income 2,051,151 58,058,717 73,802 EXPENSES Investment Manager Fees 3B 499,743 9,021,146 36,489 Custodian and sub-custodian fees 3A 184,787 2,661,783 8,883 Professional fees 28,216 15,752 2,268 Taxe d' abonnement 4 6,313 209,995 2,614 Other expenses 3C 37,721 122,982 1,809 Waiver, reimbursement from Investment Manager 3B (128,605) – – Total expenses 628,175 12,031,658 52,063 NET INVESTMENT INCOME / (LOSS) 1,422,976 46,027,059 21,739
(c) SSgA Emerging Markets SRI Enhanced Equity Fund was launched on December 4, 2012.
15
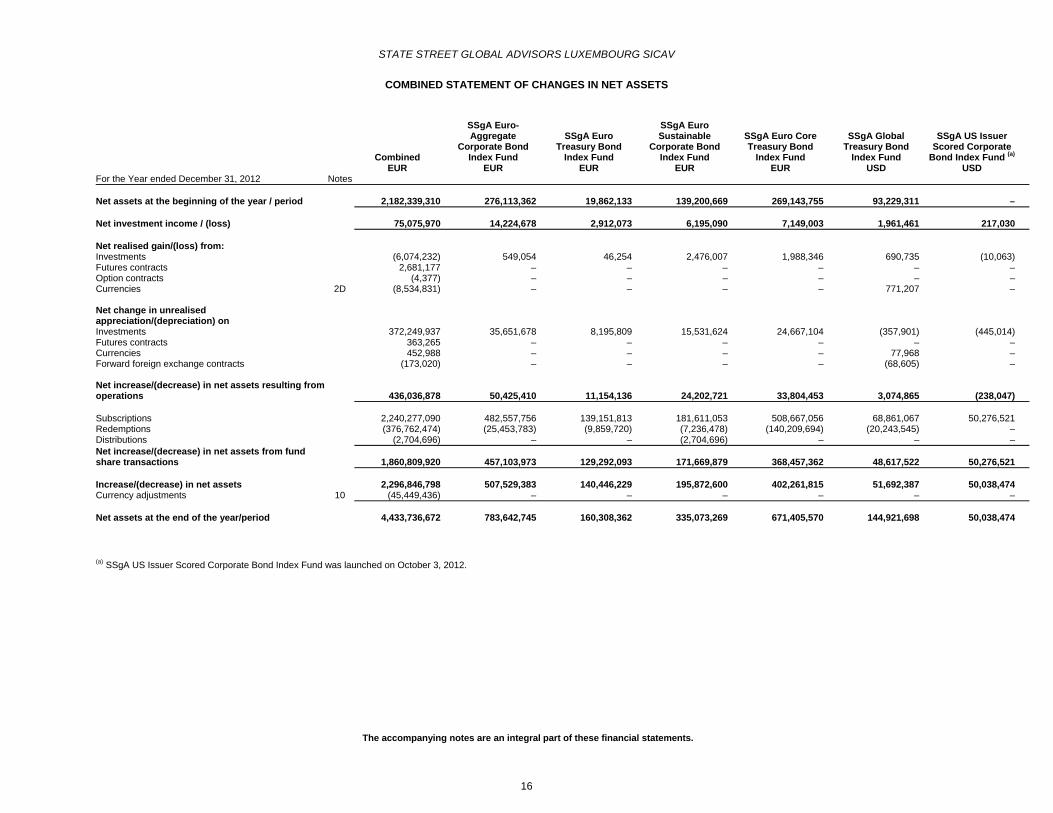
STATE STREET GLOBAL ADVISORS LUXEMBOURG SICAV
COMBINED STATEMENT OF CHANGES IN NET ASSETS
The accompanying notes are an integral part of these financial statements.
Combined
SSgA Euro-Aggregate
Corporate Bond Index Fund
SSgA Euro Treasury Bond
Index Fund
SSgA Euro Sustainable
Corporate Bond Index Fund
SSgA Euro Core Treasury Bond
Index Fund
SSgA Global Treasury Bond
Index Fund
SSgA US Issuer Scored Corporate
Bond Index Fund (a) EUR EUR EUR EUR EUR USD USD
For the Year ended December 31, 2012 Notes Net assets at the beginning of the year / period 2,182,339,310 276,113,362 19,862,133 139,200,669 269,143,755 93,229,311 – Net investment income / (loss) 75,075,970 14,224,678 2,912,073 6,195,090 7,149,003 1,961,461 217,030 Net realised gain/(loss) from: Investments (6,074,232) 549,054 46,254 2,476,007 1,988,346 690,735 (10,063) Futures contracts 2,681,177 – – – – – – Option contracts (4,377) – – – – – – Currencies 2D (8,534,831) – – – – 771,207 – Net change in unrealised appreciation/(depreciation) on Investments 372,249,937 35,651,678 8,195,809 15,531,624 24,667,104 (357,901) (445,014) Futures contracts 363,265 – – – – – – Currencies 452,988 – – – – 77,968 – Forward foreign exchange contracts (173,020) – – – – (68,605) – Net increase/(decrease) in net assets resulting from operations 436,036,878 50,425,410 11,154,136 24,202,721 33,804,453 3,074,865 (238,047) Subscriptions 2,240,277,090 482,557,756 139,151,813 181,611,053 508,667,056 68,861,067 50,276,521 Redemptions (376,762,474) (25,453,783) (9,859,720) (7,236,478) (140,209,694) (20,243,545) – Distributions (2,704,696) – – (2,704,696) – – – Net increase/(decrease) in net assets from fund share transactions 1,860,809,920 457,103,973 129,292,093 171,669,879 368,457,362 48,617,522 50,276,521 Increase/(decrease) in net assets 2,296,846,798 507,529,383 140,446,229 195,872,600 402,261,815 51,692,387 50,038,474 Currency adjustments 10 (45,449,436) – – – – – – Net assets at the end of the year/period 4,433,736,672 783,642,745 160,308,362 335,073,269 671,405,570 144,921,698 50,038,474
(a) SSgA US Issuer Scored Corporate Bond Index Fund was launched on October 3, 2012.
16

STATE STREET GLOBAL ADVISORS LUXEMBOURG SICAV
COMBINED STATEMENT OF CHANGES IN NET ASSETS
The accompanying notes are an integral part of these financial statements.
SSgA Active Global Inflation-
Linked Bond Fund
SSgA Global Emerging Markets
Local Currency Bond Fund *
SSgA Europe Managed Volatility
Equity Fund
SSgA Global Managed Volatility
Equity Fund
SSgA EMU Alpha Equity Fund
SSgA Sectoral Healthcare Equity
Fund
SSgA Active Fundamental Global Equity
Spotlight Fund (b) USD USD EUR USD EUR USD EUR
For the Year ended December 31, 2012 Notes Net assets at the beginning of the year / period 13,964,708 19,960,240 43,674,610 62,110,082 73,471,550 91,928,788 – Net investment income / (loss) 190,277 947,281 1,260,120 2,154,796 1,866,809 (91,193) 29,174 Net realised gain/(loss) from: Investments 448,482 966,575 (1,594,825) 1,528,158 (3,134,971) 5,124,675 23,935 Futures contracts (14,289) – (6) – (576) – – Option contracts (5,625) – – – – – – Currencies 2D (257,170) (691,933) 365,112 (305,808) – (589,312) 82,723 Net change in unrealised appreciation/(depreciation) on Investments 615,477 1,580,892 6,587,313 7,455,209 16,733,666 5,200,633 181,992 Futures contracts 2,590 – – – – – – Currencies 4,835 24,335 (1,220) (11,545) 71 2,205 11 Forward foreign exchange contracts (124,130) (29,630) – – – – – Net increase/(decrease) in net assets resulting from operations 860,447 2,797,520 6,616,494 10,820,810 15,464,999 9,647,008 317,835 Subscriptions 14,624,428 2,553,356 6,966,708 62,878,535 17,088,203 19,591,494 30,000,000 Redemptions (14,891,156) (11,246,799) (8,669,342) (22,178,781) (30,267,422) (68,181,152) – Distributions – – – – – – – Net increase/(decrease) in net assets from fund share transactions (266,728) (8,693,443) (1,702,634) 40,699,754 (13,179,219) (48,589,658) 30,000,000 Increase/(decrease) in net assets 593,719 (5,895,923) 4,913,860 51,520,564 2,285,780 (38,942,650) 30,317,835 Currency adjustments 10 – – – – – – – Net assets at the end of the year/period 14,558,427 14,064,317 48,588,470 113,630,646 75,757,330 52,986,138 30,317,835
* Previously called SSgA Rexiter Global Emerging Markets Local Currency Bond Fund. (b) SSgA Active Fundamental Global Equity Spotlight Fund was launched on December 17, 2012.
17

STATE STREET GLOBAL ADVISORS LUXEMBOURG SICAV
COMBINED STATEMENT OF CHANGES IN NET ASSETS
The accompanying notes are an integral part of these financial statements.
SSgA Emerging Markets Select
Equity Fund
SSgA Enhanced Emerging Markets
Equity Fund
SSgA Emerging Markets SRI
Enhanced Equity Fund (c)
EUR USD USD For the Year ended December 31, 2012 Notes Net assets at the beginning of the year / period 34,776,074 1,440,279,904 – Net investment income / (loss) 1,422,976 46,027,059 21,739 Net realised gain/(loss) from: Investments (97,052) (16,920,058) 34,948 Futures contracts (42,773) 3,346,366 169,480 Option contracts – – – Currencies 2D 1,469,167 (12,350,485) (9,149) Net change in unrealised appreciation/(depreciation) on Investments 6,628,225 313,084,734 4,539,659 Futures contracts – 459,027 5,250 Currencies (2,100) 485,323 3,219 Forward foreign exchange contracts – – – Net increase/(decrease) in net assets resulting from operations 9,378,443 334,131,966 4,765,146 Subscriptions 47,086,542 744,261,561 100,000,000 Redemptions (39,094,262) (12,304,986) – Distributions – – – Net increase/(decrease) in net assets from fund share transactions 7,992,280 731,956,575 100,000,000 Increase/(decrease) in net assets 17,370,723 1,066,088,541 104,765,146 Currency adjustments 10 – – – Net assets at the end of the year/period 52,146,797 2,506,368,445 104,765,146
(c) SSgA Emerging Markets SRI Enhanced Equity Fund was launched on December 4, 2012.
18
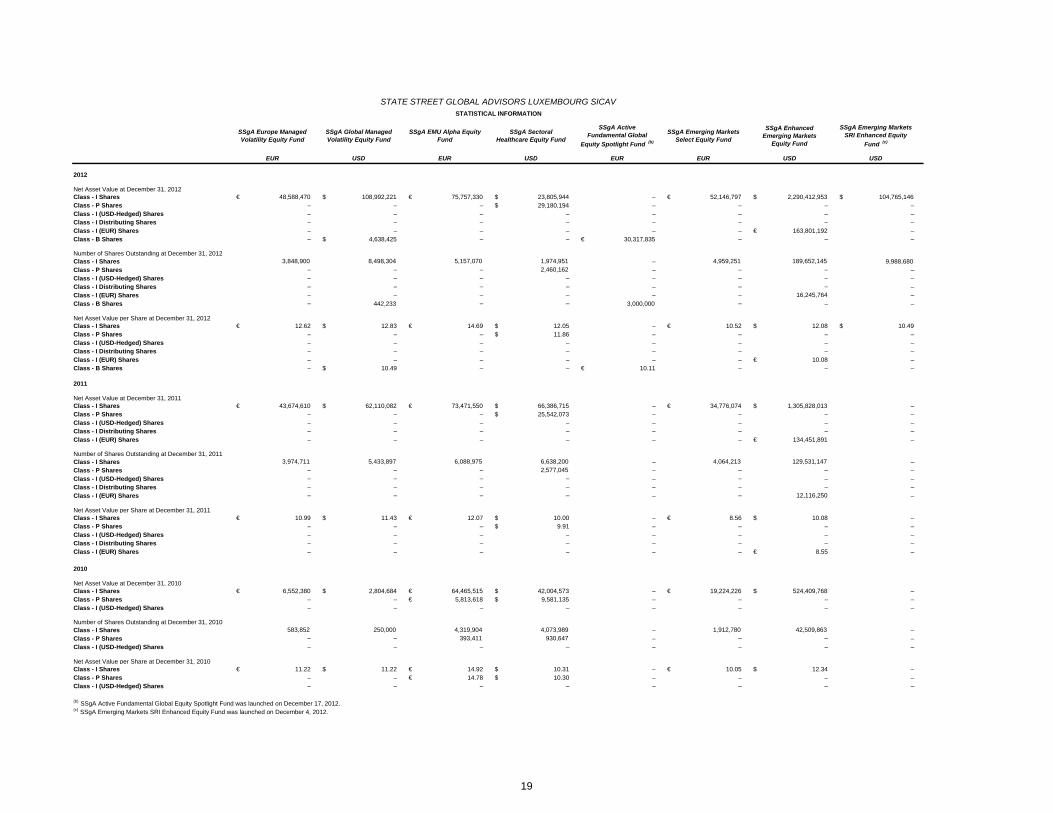
2012
Net Asset Value at December 31, 2012Class - I Shares € 48,588,470 $ 108,992,221 € 75,757,330 $ 23,805,944 – € 52,146,797 $ 2,290,412,953 $ 104,765,146Class - P Shares – – – $ 29,180,194 – – – –Class - I (USD-Hedged) Shares – – – – – – – –Class - I Distributing Shares – – – – – – – –Class - I (EUR) Shares – – – – – – € 163,801,192 –Class - B Shares – $ 4,638,425 – – € 30,317,835 – – –
Class - I Shares – 9,988,680 Class - P Shares – –Class - I (USD-Hedged) Shares – – –Class - I Distributing Shares – –Class - I (EUR) Shares – –Class - B Shares 442,233 3,000,000 – –
Net Asset Value per Share at December 31, 2012Class - I Shares € 12.62 $ 12.83 € 14.69 $ 12.05 – € 10.52 $ 12.08 $ 10.49Class - P Shares – – – $ 11.86 – – – –Class - I (USD-Hedged) Shares – – – – – – – –Class - I Distributing Shares – – – – – – – –Class - I (EUR) Shares – – – – – – € 10.08 –Class - B Shares – $ 10.49 – – € 10.11 – – –
2011
Net Asset Value at December 31, 2011Class - I Shares € 43,674,610 $ 62,110,082 € 73,471,550 $ 66,386,715 – € 34,776,074 $ 1,305,828,013 –Class - P Shares – – – $ 25,542,073 – – – –Class - I (USD-Hedged) Shares – – – – – – – –Class - I Distributing Shares – – – – – – – –Class - I (EUR) Shares – – – – – – € 134,451,891 –
Class - I Shares – –Class - P Shares – –Class - I (USD-Hedged) Shares – – –Class - I Distributing Shares – –Class - I (EUR) Shares – –
Net Asset Value per Share at December 31, 2011Class - I Shares € 10.99 $ 11.43 € 12.07 $ 10.00 – € 8.56 $ 10.08 –Class - P Shares – – – $ 9.91 – – – –Class - I (USD-Hedged) Shares – – – – – – – –Class - I Distributing Shares – – – – – – – –Class - I (EUR) Shares – – – – – – € 8.55 –
2010
Net Asset Value at December 31, 2010Class - I Shares € 6,552,380 $ 2,804,684 € 64,465,515 $ 42,004,573 – € 19,224,226 $ 524,409,768 –Class - P Shares – – € 5,813,618 $ 9,581,135 – – – –Class - I (USD-Hedged) Shares – – – – – – – –
Class - I Shares – –Class - P Shares – –Class - I (USD-Hedged) Shares – – –
Net Asset Value per Share at December 31, 2010Class - I Shares € 11.22 $ 11.22 € 14.92 $ 10.31 – € 10.05 $ 12.34 –Class - P Shares – – € 14.78 $ 10.30 – – – –Class - I (USD-Hedged) Shares – – – – – – – –
4,064,213
2,460,162 8,498,304
–
129,531,147 –
3,974,711 5,433,897 6,638,200
3,848,900 –
–––
––
SSgA Europe Managed Volatility Equity Fund
– ––
1,974,951
–
SSgA Emerging Markets SRI Enhanced Equity
Fund (c)
USD
– –
EUR USD
SSgA Emerging Markets Select Equity Fund
SSgA Enhanced Emerging Markets
Equity Fund
SSgA Global Managed Volatility Equity Fund
SSgA Sectoral Healthcare Equity Fund
189,652,145
SSgA EMU Alpha Equity Fund
EUR USD
4,959,251
– 16,245,764–
–
EUR USD
2,577,045 – –
–
– – –– 12,116,250
––– –
–– – – –
– – ––
42,509,863 583,852 250,000 4,073,989 930,647
– – – 393,411
–
STATE STREET GLOBAL ADVISORS LUXEMBOURG SICAV
– – 1,912,780
–– –
EUR
–
6,088,975 –
4,319,904
5,157,070 ––––
(b) SSgA Active Fundamental Global Equity Spotlight Fund was launched on December 17, 2012.(c) SSgA Emerging Markets SRI Enhanced Equity Fund was launched on December 4, 2012.
Number of Shares Outstanding at December 31, 2012
Number of Shares Outstanding at December 31, 2011
Number of Shares Outstanding at December 31, 2010
STATISTICAL INFORMATION
– – –
SSgA Active Fundamental Global
Equity Spotlight Fund (b)
19

2012
Net Asset Value at December 31, 2012Class - I Shares € 48,588,470 $ 108,992,221 € 75,757,330 $ 23,805,944 – € 52,146,797 $ 2,290,412,953 $ 104,765,146Class - P Shares – – – $ 29,180,194 – – – –Class - I (USD-Hedged) Shares – – – – – – – –Class - I Distributing Shares – – – – – – – –Class - I (EUR) Shares – – – – – – € 163,801,192 –Class - B Shares – $ 4,638,425 – – € 30,317,835 – – –
Class - I Shares – 9,988,680 Class - P Shares – –Class - I (USD-Hedged) Shares – – –Class - I Distributing Shares – –Class - I (EUR) Shares – –Class - B Shares 442,233 3,000,000 – –
Net Asset Value per Share at December 31, 2012Class - I Shares € 12.62 $ 12.83 € 14.69 $ 12.05 – € 10.52 $ 12.08 $ 10.49Class - P Shares – – – $ 11.86 – – – –Class - I (USD-Hedged) Shares – – – – – – – –Class - I Distributing Shares – – – – – – – –Class - I (EUR) Shares – – – – – – € 10.08 –Class - B Shares – $ 10.49 – – € 10.11 – – –
2011
Net Asset Value at December 31, 2011Class - I Shares € 43,674,610 $ 62,110,082 € 73,471,550 $ 66,386,715 – € 34,776,074 $ 1,305,828,013 –Class - P Shares – – – $ 25,542,073 – – – –Class - I (USD-Hedged) Shares – – – – – – – –Class - I Distributing Shares – – – – – – – –Class - I (EUR) Shares – – – – – – € 134,451,891 –
Class - I Shares – –Class - P Shares – –Class - I (USD-Hedged) Shares – – –Class - I Distributing Shares – –Class - I (EUR) Shares – –
Net Asset Value per Share at December 31, 2011Class - I Shares € 10.99 $ 11.43 € 12.07 $ 10.00 – € 8.56 $ 10.08 –Class - P Shares – – – $ 9.91 – – – –Class - I (USD-Hedged) Shares – – – – – – – –Class - I Distributing Shares – – – – – – – –Class - I (EUR) Shares – – – – – – € 11.10 –
2010
Net Asset Value at December 31, 2010Class - I Shares € 6,552,380 $ 2,804,684 € 64,465,515 $ 42,004,573 – € 19,224,226 $ 524,409,768 –Class - P Shares – – € 5,813,618 $ 9,581,135 – – – –Class - I (USD-Hedged) Shares – – – – – – – –
Class - I Shares – –Class - P Shares – –Class - I (USD-Hedged) Shares – – –
Net Asset Value per Share at December 31, 2010Class - I Shares € 11.22 $ 11.22 € 14.92 $ 10.31 – € 10.05 $ 12.34 –Class - P Shares – – € 14.78 $ 10.30 – – – –Class - I (USD-Hedged) Shares – – – – – – – –
129,531,147 –
3,974,711 5,433,897 6,638,200 4,064,213
–––
–
2,460,162 8,498,304
SSgA Europe Managed Volatility Equity Fund
3,848,900
––
– –
– 16,245,764–
– –
–
EUR USD
SSgA Emerging Markets SRI Enhanced Equity
Fund (c)
USD
– ––
–
EUR USD
SSgA Emerging Markets Select Equity Fund
SSgA Enhanced Emerging Markets
Equity Fund
1,974,951 4,959,251
SSgA Global Managed Volatility Equity Fund
SSgA Sectoral Healthcare Equity Fund
189,652,145
SSgA EMU Alpha Equity Fund
EUR USD
2,577,045 – –
– –– 12,116,250
–– – – ––
––– –
– – ––
42,509,863 583,852 250,000 4,073,989 930,647
– – – 393,411
–
STATE STREET GLOBAL ADVISORS LUXEMBOURG SICAV
– – 1,912,780
–– –
EUR
–
6,088,975 –
4,319,904
5,157,070 ––––
(b) SSgA Active Fundamental Global Equity Spotlight Fund was launched on December 17, 2012.(c) SSgA Emerging Markets SRI Enhanced Equity Fund was launched on December 4, 2012.
Number of Shares Outstanding at December 31, 2012
Number of Shares Outstanding at December 31, 2011
Number of Shares Outstanding at December 31, 2010
STATISTICAL INFORMATION
– – –
SSgA Active Fundamental Global
Equity Spotlight Fund (b)
20
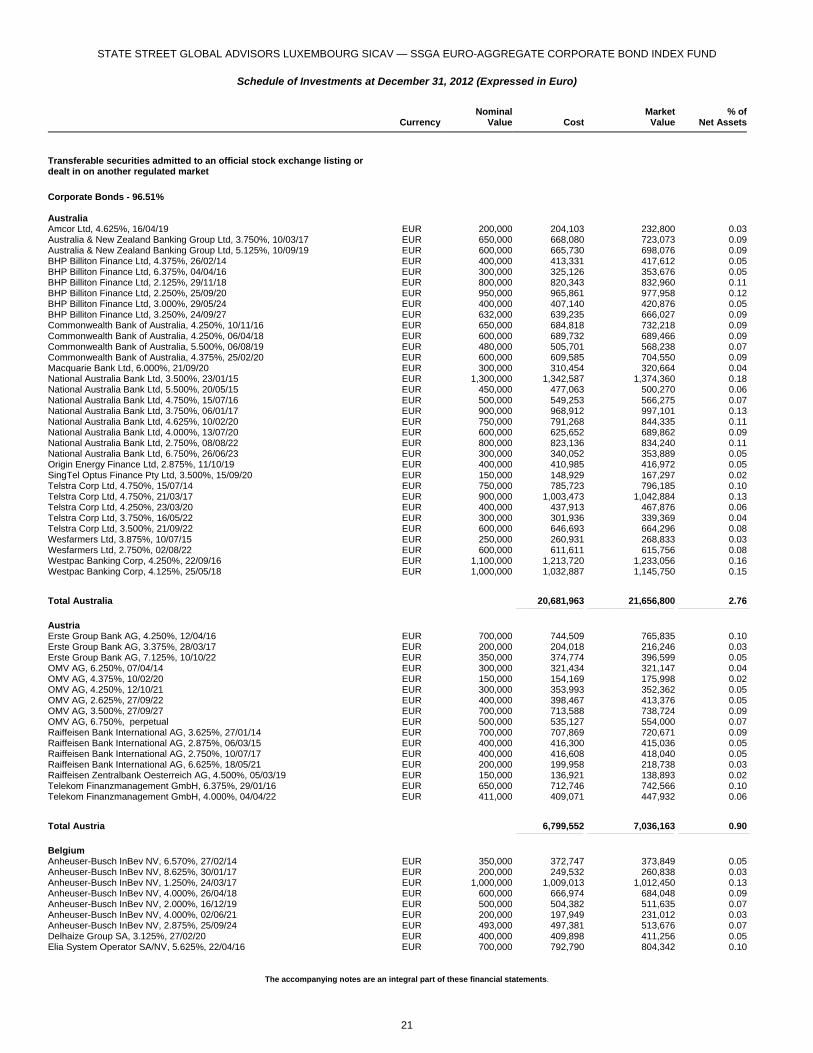
STATE STREET GLOBAL ADVISORS LUXEMBOURG SICAV — SSGA EURO-AGGREGATE CORPORATE BOND INDEX FUND
Schedule of Investments at December 31, 2012 (Expressed in Euro)
The accompanying notes are an integral part of these financial statements.
Currency
NominalValue Cost
MarketValue
% ofNet Assets
Transferable securities admitted to an official stock exchange listing or dealt in on another regulated market
Corporate Bonds - 96.51% Australia Amcor Ltd, 4.625%, 16/04/19 EUR 200,000 204,103 232,800 0.03Australia & New Zealand Banking Group Ltd, 3.750%, 10/03/17 EUR 650,000 668,080 723,073 0.09Australia & New Zealand Banking Group Ltd, 5.125%, 10/09/19 EUR 600,000 665,730 698,076 0.09BHP Billiton Finance Ltd, 4.375%, 26/02/14 EUR 400,000 413,331 417,612 0.05BHP Billiton Finance Ltd, 6.375%, 04/04/16 EUR 300,000 325,126 353,676 0.05BHP Billiton Finance Ltd, 2.125%, 29/11/18 EUR 800,000 820,343 832,960 0.11BHP Billiton Finance Ltd, 2.250%, 25/09/20 EUR 950,000 965,861 977,958 0.12BHP Billiton Finance Ltd, 3.000%, 29/05/24 EUR 400,000 407,140 420,876 0.05BHP Billiton Finance Ltd, 3.250%, 24/09/27 EUR 632,000 639,235 666,027 0.09Commonwealth Bank of Australia, 4.250%, 10/11/16 EUR 650,000 684,818 732,218 0.09Commonwealth Bank of Australia, 4.250%, 06/04/18 EUR 600,000 689,732 689,466 0.09Commonwealth Bank of Australia, 5.500%, 06/08/19 EUR 480,000 505,701 568,238 0.07Commonwealth Bank of Australia, 4.375%, 25/02/20 EUR 600,000 609,585 704,550 0.09Macquarie Bank Ltd, 6.000%, 21/09/20 EUR 300,000 310,454 320,664 0.04National Australia Bank Ltd, 3.500%, 23/01/15 EUR 1,300,000 1,342,587 1,374,360 0.18National Australia Bank Ltd, 5.500%, 20/05/15 EUR 450,000 477,063 500,270 0.06National Australia Bank Ltd, 4.750%, 15/07/16 EUR 500,000 549,253 566,275 0.07National Australia Bank Ltd, 3.750%, 06/01/17 EUR 900,000 968,912 997,101 0.13National Australia Bank Ltd, 4.625%, 10/02/20 EUR 750,000 791,268 844,335 0.11National Australia Bank Ltd, 4.000%, 13/07/20 EUR 600,000 625,652 689,862 0.09National Australia Bank Ltd, 2.750%, 08/08/22 EUR 800,000 823,136 834,240 0.11National Australia Bank Ltd, 6.750%, 26/06/23 EUR 300,000 340,052 353,889 0.05Origin Energy Finance Ltd, 2.875%, 11/10/19 EUR 400,000 410,985 416,972 0.05SingTel Optus Finance Pty Ltd, 3.500%, 15/09/20 EUR 150,000 148,929 167,297 0.02Telstra Corp Ltd, 4.750%, 15/07/14 EUR 750,000 785,723 796,185 0.10Telstra Corp Ltd, 4.750%, 21/03/17 EUR 900,000 1,003,473 1,042,884 0.13Telstra Corp Ltd, 4.250%, 23/03/20 EUR 400,000 437,913 467,876 0.06Telstra Corp Ltd, 3.750%, 16/05/22 EUR 300,000 301,936 339,369 0.04Telstra Corp Ltd, 3.500%, 21/09/22 EUR 600,000 646,693 664,296 0.08Wesfarmers Ltd, 3.875%, 10/07/15 EUR 250,000 260,931 268,833 0.03Wesfarmers Ltd, 2.750%, 02/08/22 EUR 600,000 611,611 615,756 0.08Westpac Banking Corp, 4.250%, 22/09/16 EUR 1,100,000 1,213,720 1,233,056 0.16Westpac Banking Corp, 4.125%, 25/05/18 EUR 1,000,000 1,032,887 1,145,750 0.15
Total Australia 20,681,963 21,656,800 2.76 _______________________________________________ ____________________________________________________________ __________________________________________________
Austria Erste Group Bank AG, 4.250%, 12/04/16 EUR 700,000 744,509 765,835 0.10Erste Group Bank AG, 3.375%, 28/03/17 EUR 200,000 204,018 216,246 0.03Erste Group Bank AG, 7.125%, 10/10/22 EUR 350,000 374,774 396,599 0.05OMV AG, 6.250%, 07/04/14 EUR 300,000 321,434 321,147 0.04OMV AG, 4.375%, 10/02/20 EUR 150,000 154,169 175,998 0.02OMV AG, 4.250%, 12/10/21 EUR 300,000 353,993 352,362 0.05OMV AG, 2.625%, 27/09/22 EUR 400,000 398,467 413,376 0.05OMV AG, 3.500%, 27/09/27 EUR 700,000 713,588 738,724 0.09OMV AG, 6.750%, perpetual EUR 500,000 535,127 554,000 0.07Raiffeisen Bank International AG, 3.625%, 27/01/14 EUR 700,000 707,869 720,671 0.09Raiffeisen Bank International AG, 2.875%, 06/03/15 EUR 400,000 416,300 415,036 0.05Raiffeisen Bank International AG, 2.750%, 10/07/17 EUR 400,000 416,608 418,040 0.05Raiffeisen Bank International AG, 6.625%, 18/05/21 EUR 200,000 199,958 218,738 0.03Raiffeisen Zentralbank Oesterreich AG, 4.500%, 05/03/19 EUR 150,000 136,921 138,893 0.02Telekom Finanzmanagement GmbH, 6.375%, 29/01/16 EUR 650,000 712,746 742,566 0.10Telekom Finanzmanagement GmbH, 4.000%, 04/04/22 EUR 411,000 409,071 447,932 0.06
Total Austria 6,799,552 7,036,163 0.90 _______________________________________________ ____________________________________________________________ __________________________________________________
Belgium Anheuser-Busch InBev NV, 6.570%, 27/02/14 EUR 350,000 372,747 373,849 0.05Anheuser-Busch InBev NV, 8.625%, 30/01/17 EUR 200,000 249,532 260,838 0.03Anheuser-Busch InBev NV, 1.250%, 24/03/17 EUR 1,000,000 1,009,013 1,012,450 0.13Anheuser-Busch InBev NV, 4.000%, 26/04/18 EUR 600,000 666,974 684,048 0.09Anheuser-Busch InBev NV, 2.000%, 16/12/19 EUR 500,000 504,382 511,635 0.07Anheuser-Busch InBev NV, 4.000%, 02/06/21 EUR 200,000 197,949 231,012 0.03Anheuser-Busch InBev NV, 2.875%, 25/09/24 EUR 493,000 497,381 513,676 0.07Delhaize Group SA, 3.125%, 27/02/20 EUR 400,000 409,898 411,256 0.05Elia System Operator SA/NV, 5.625%, 22/04/16 EUR 700,000 792,790 804,342 0.10
21
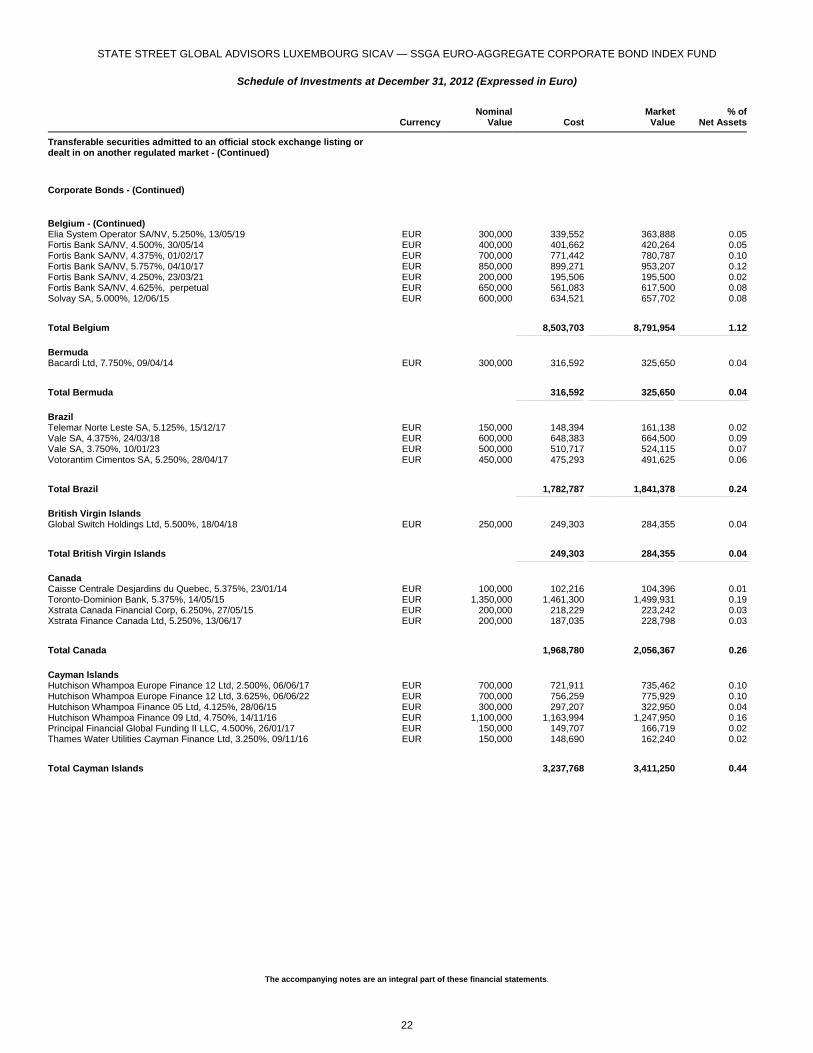
STATE STREET GLOBAL ADVISORS LUXEMBOURG SICAV — SSGA EURO-AGGREGATE CORPORATE BOND INDEX FUND
Schedule of Investments at December 31, 2012 (Expressed in Euro)
The accompanying notes are an integral part of these financial statements.
Currency
NominalValue Cost
MarketValue
% ofNet Assets
Transferable securities admitted to an official stock exchange listing or dealt in on another regulated market - (Continued)
Corporate Bonds - (Continued)
Belgium - (Continued) Elia System Operator SA/NV, 5.250%, 13/05/19 EUR 300,000 339,552 363,888 0.05Fortis Bank SA/NV, 4.500%, 30/05/14 EUR 400,000 401,662 420,264 0.05Fortis Bank SA/NV, 4.375%, 01/02/17 EUR 700,000 771,442 780,787 0.10Fortis Bank SA/NV, 5.757%, 04/10/17 EUR 850,000 899,271 953,207 0.12Fortis Bank SA/NV, 4.250%, 23/03/21 EUR 200,000 195,506 195,500 0.02Fortis Bank SA/NV, 4.625%, perpetual EUR 650,000 561,083 617,500 0.08Solvay SA, 5.000%, 12/06/15 EUR 600,000 634,521 657,702 0.08
Total Belgium 8,503,703 8,791,954 1.12 _______________________________________________ ____________________________________________________________ __________________________________________________
Bermuda Bacardi Ltd, 7.750%, 09/04/14 EUR 300,000 316,592 325,650 0.04
Total Bermuda 316,592 325,650 0.04 _______________________________________________ ____________________________________________________________ __________________________________________________
Brazil Telemar Norte Leste SA, 5.125%, 15/12/17 EUR 150,000 148,394 161,138 0.02Vale SA, 4.375%, 24/03/18 EUR 600,000 648,383 664,500 0.09Vale SA, 3.750%, 10/01/23 EUR 500,000 510,717 524,115 0.07Votorantim Cimentos SA, 5.250%, 28/04/17 EUR 450,000 475,293 491,625 0.06
Total Brazil 1,782,787 1,841,378 0.24 _______________________________________________ ____________________________________________________________ __________________________________________________
British Virgin Islands Global Switch Holdings Ltd, 5.500%, 18/04/18 EUR 250,000 249,303 284,355 0.04
Total British Virgin Islands 249,303 284,355 0.04 _______________________________________________ ____________________________________________________________ __________________________________________________
Canada Caisse Centrale Desjardins du Quebec, 5.375%, 23/01/14 EUR 100,000 102,216 104,396 0.01Toronto-Dominion Bank, 5.375%, 14/05/15 EUR 1,350,000 1,461,300 1,499,931 0.19Xstrata Canada Financial Corp, 6.250%, 27/05/15 EUR 200,000 218,229 223,242 0.03Xstrata Finance Canada Ltd, 5.250%, 13/06/17 EUR 200,000 187,035 228,798 0.03
Total Canada 1,968,780 2,056,367 0.26 _______________________________________________ ____________________________________________________________ __________________________________________________
Cayman Islands Hutchison Whampoa Europe Finance 12 Ltd, 2.500%, 06/06/17 EUR 700,000 721,911 735,462 0.10Hutchison Whampoa Europe Finance 12 Ltd, 3.625%, 06/06/22 EUR 700,000 756,259 775,929 0.10Hutchison Whampoa Finance 05 Ltd, 4.125%, 28/06/15 EUR 300,000 297,207 322,950 0.04Hutchison Whampoa Finance 09 Ltd, 4.750%, 14/11/16 EUR 1,100,000 1,163,994 1,247,950 0.16Principal Financial Global Funding II LLC, 4.500%, 26/01/17 EUR 150,000 149,707 166,719 0.02Thames Water Utilities Cayman Finance Ltd, 3.250%, 09/11/16 EUR 150,000 148,690 162,240 0.02
Total Cayman Islands 3,237,768 3,411,250 0.44 _______________________________________________ ____________________________________________________________ __________________________________________________
22
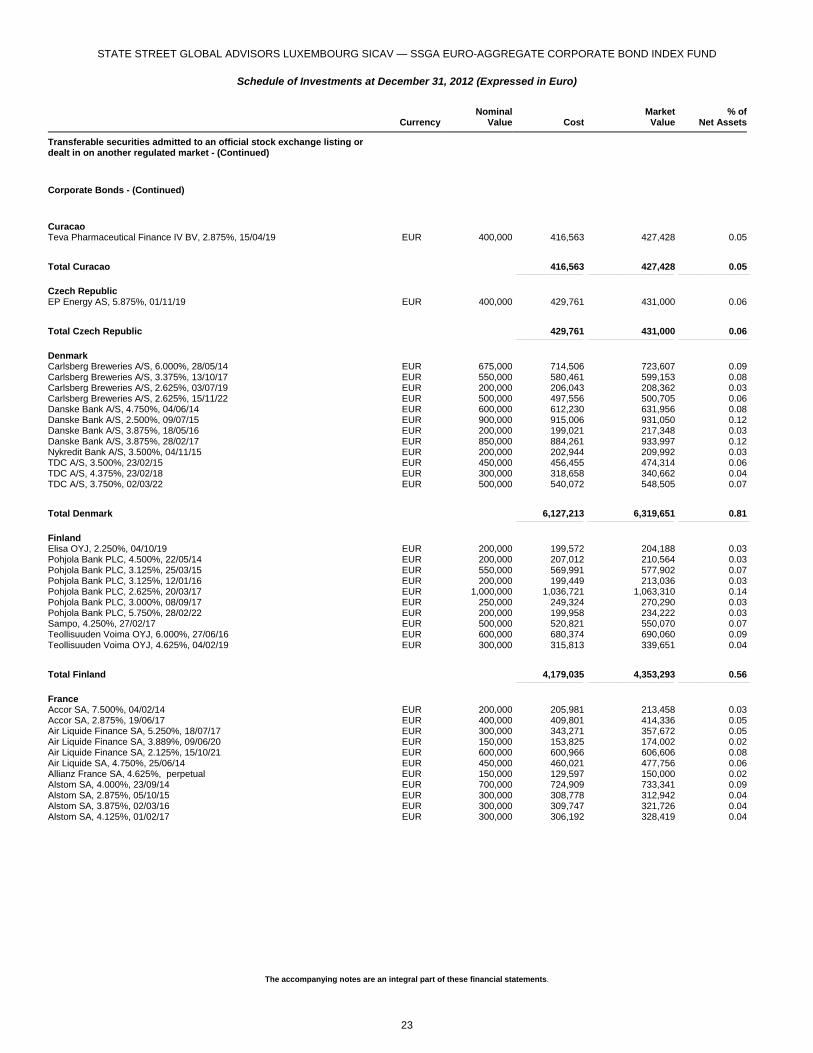
STATE STREET GLOBAL ADVISORS LUXEMBOURG SICAV — SSGA EURO-AGGREGATE CORPORATE BOND INDEX FUND
Schedule of Investments at December 31, 2012 (Expressed in Euro)
The accompanying notes are an integral part of these financial statements.
Currency
NominalValue Cost
MarketValue
% ofNet Assets
Transferable securities admitted to an official stock exchange listing or dealt in on another regulated market - (Continued)
Corporate Bonds - (Continued)
Curacao Teva Pharmaceutical Finance IV BV, 2.875%, 15/04/19 EUR 400,000 416,563 427,428 0.05
Total Curacao 416,563 427,428 0.05 _______________________________________________ ____________________________________________________________ __________________________________________________
Czech Republic EP Energy AS, 5.875%, 01/11/19 EUR 400,000 429,761 431,000 0.06
Total Czech Republic 429,761 431,000 0.06 _______________________________________________ ____________________________________________________________ __________________________________________________
Denmark Carlsberg Breweries A/S, 6.000%, 28/05/14 EUR 675,000 714,506 723,607 0.09Carlsberg Breweries A/S, 3.375%, 13/10/17 EUR 550,000 580,461 599,153 0.08Carlsberg Breweries A/S, 2.625%, 03/07/19 EUR 200,000 206,043 208,362 0.03Carlsberg Breweries A/S, 2.625%, 15/11/22 EUR 500,000 497,556 500,705 0.06Danske Bank A/S, 4.750%, 04/06/14 EUR 600,000 612,230 631,956 0.08Danske Bank A/S, 2.500%, 09/07/15 EUR 900,000 915,006 931,050 0.12Danske Bank A/S, 3.875%, 18/05/16 EUR 200,000 199,021 217,348 0.03Danske Bank A/S, 3.875%, 28/02/17 EUR 850,000 884,261 933,997 0.12Nykredit Bank A/S, 3.500%, 04/11/15 EUR 200,000 202,944 209,992 0.03TDC A/S, 3.500%, 23/02/15 EUR 450,000 456,455 474,314 0.06TDC A/S, 4.375%, 23/02/18 EUR 300,000 318,658 340,662 0.04TDC A/S, 3.750%, 02/03/22 EUR 500,000 540,072 548,505 0.07
Total Denmark 6,127,213 6,319,651 0.81 _______________________________________________ ____________________________________________________________ __________________________________________________
Finland Elisa OYJ, 2.250%, 04/10/19 EUR 200,000 199,572 204,188 0.03Pohjola Bank PLC, 4.500%, 22/05/14 EUR 200,000 207,012 210,564 0.03Pohjola Bank PLC, 3.125%, 25/03/15 EUR 550,000 569,991 577,902 0.07Pohjola Bank PLC, 3.125%, 12/01/16 EUR 200,000 199,449 213,036 0.03Pohjola Bank PLC, 2.625%, 20/03/17 EUR 1,000,000 1,036,721 1,063,310 0.14Pohjola Bank PLC, 3.000%, 08/09/17 EUR 250,000 249,324 270,290 0.03Pohjola Bank PLC, 5.750%, 28/02/22 EUR 200,000 199,958 234,222 0.03Sampo, 4.250%, 27/02/17 EUR 500,000 520,821 550,070 0.07Teollisuuden Voima OYJ, 6.000%, 27/06/16 EUR 600,000 680,374 690,060 0.09Teollisuuden Voima OYJ, 4.625%, 04/02/19 EUR 300,000 315,813 339,651 0.04
Total Finland 4,179,035 4,353,293 0.56 _______________________________________________ ____________________________________________________________ __________________________________________________
France Accor SA, 7.500%, 04/02/14 EUR 200,000 205,981 213,458 0.03Accor SA, 2.875%, 19/06/17 EUR 400,000 409,801 414,336 0.05Air Liquide Finance SA, 5.250%, 18/07/17 EUR 300,000 343,271 357,672 0.05Air Liquide Finance SA, 3.889%, 09/06/20 EUR 150,000 153,825 174,002 0.02Air Liquide Finance SA, 2.125%, 15/10/21 EUR 600,000 600,966 606,606 0.08Air Liquide SA, 4.750%, 25/06/14 EUR 450,000 460,021 477,756 0.06Allianz France SA, 4.625%, perpetual EUR 150,000 129,597 150,000 0.02Alstom SA, 4.000%, 23/09/14 EUR 700,000 724,909 733,341 0.09Alstom SA, 2.875%, 05/10/15 EUR 300,000 308,778 312,942 0.04Alstom SA, 3.875%, 02/03/16 EUR 300,000 309,747 321,726 0.04Alstom SA, 4.125%, 01/02/17 EUR 300,000 306,192 328,419 0.04
23

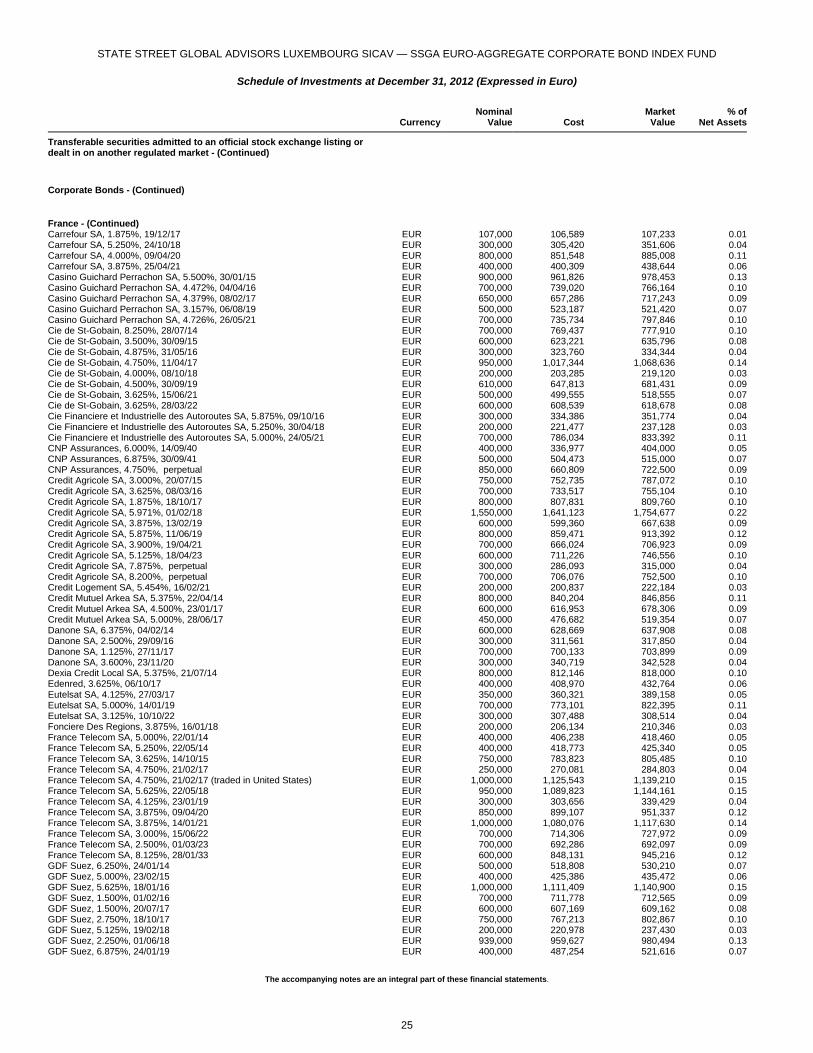
STATE STREET GLOBAL ADVISORS LUXEMBOURG SICAV — SSGA EURO-AGGREGATE CORPORATE BOND INDEX FUND
Schedule of Investments at December 31, 2012 (Expressed in Euro)
The accompanying notes are an integral part of these financial statements.
Currency
NominalValue Cost
MarketValue
% ofNet Assets
Transferable securities admitted to an official stock exchange listing or dealt in on another regulated market - (Continued)
Corporate Bonds - (Continued)
France - (Continued) Alstom SA, 2.250%, 11/10/17 EUR 300,000 305,570 305,589 0.04Alstom SA, 3.625%, 05/10/18 EUR 300,000 321,919 324,651 0.04Alstom SA, 4.500%, 18/03/20 EUR 450,000 463,638 506,795 0.06Arkema SA, 4.000%, 25/10/17 EUR 250,000 256,564 276,018 0.04Arkema SA, 3.850%, 30/04/20 EUR 300,000 324,078 325,863 0.04Autoroutes du Sud de la France SA, 4.000%, 24/09/18 EUR 700,000 761,123 785,274 0.10Autoroutes du Sud de la France SA, 7.375%, 20/03/19 EUR 700,000 871,802 923,153 0.12Autoroutes du Sud de la France SA, 4.125%, 13/04/20 EUR 200,000 204,041 225,634 0.03Autoroutes du Sud de la France SA, 5.625%, 04/07/22 EUR 900,000 1,003,790 1,127,700 0.14AXA SA, 4.500%, 23/01/15 EUR 500,000 517,891 536,835 0.07AXA SA, 5.250%, 16/04/40 EUR 850,000 822,475 888,233 0.11AXA SA, 5.777%, perpetual EUR 700,000 634,418 689,500 0.09AXA SA, 6.211%, perpetual EUR 300,000 231,726 292,500 0.04Banque Federative du Credit Mutuel SA, 4.250%, 05/02/14 EUR 600,000 612,226 622,674 0.08Banque Federative du Credit Mutuel SA, 5.000%, 30/09/15 EUR 500,000 518,062 540,110 0.07Banque Federative du Credit Mutuel SA, 3.000%, 29/10/15 EUR 700,000 724,414 738,850 0.09Banque Federative du Credit Mutuel SA, 4.375%, 31/05/16 EUR 900,000 940,018 994,545 0.13Banque Federative du Credit Mutuel SA, 4.625%, 27/04/17 EUR 200,000 205,954 227,328 0.03Banque Federative du Credit Mutuel SA, 2.875%, 21/06/17 EUR 600,000 635,113 637,938 0.08Banque Federative du Credit Mutuel SA, 3.750%, 26/01/18 EUR 600,000 617,684 667,656 0.09Banque Federative du Credit Mutuel SA, 4.125%, 20/07/20 EUR 1,150,000 1,211,055 1,318,268 0.17Banque Federative du Credit Mutuel SA, 4.000%, 22/10/20 EUR 600,000 606,605 623,964 0.08Banque Federative du Credit Mutuel SA, 3.250%, 23/08/22 EUR 500,000 530,471 536,335 0.07Banque Federative du Credit Mutuel SA, 4.471%, perpetual EUR 200,000 181,038 186,000 0.02Banque PSA Finance SA, 3.500%, 17/01/14 EUR 150,000 149,978 151,500 0.02Banque PSA Finance SA, 3.625%, 29/04/14 EUR 280,000 278,777 283,220 0.04Banque PSA Finance SA, 6.000%, 16/07/14 EUR 800,000 836,507 842,000 0.11Banque PSA Finance SA, 3.875%, 14/01/15 EUR 500,000 499,919 508,750 0.07Banque PSA Finance SA, 4.000%, 24/06/15 EUR 500,000 502,327 510,000 0.07Banque PSA Finance SA, 4.875%, 25/09/15 EUR 500,000 512,253 522,200 0.07Banque PSA Finance SA, 4.250%, 25/02/16 EUR 400,000 398,486 411,000 0.05BNP Paribas SA, 5.000%, 16/12/13 EUR 700,000 716,589 729,197 0.09BNP Paribas SA, 2.875%, 13/07/15 EUR 950,000 972,911 995,619 0.13BNP Paribas SA, 3.500%, 07/03/16 EUR 1,300,000 1,368,372 1,397,630 0.18BNP Paribas SA, 3.000%, 24/02/17 EUR 700,000 727,273 747,446 0.10BNP Paribas SA, 5.431%, 07/09/17 EUR 950,000 1,012,666 1,086,030 0.14BNP Paribas SA, 5.200%, 28/09/17 EUR 200,000 195,096 218,916 0.03BNP Paribas SA, 2.875%, 27/11/17 EUR 900,000 926,971 962,307 0.12BNP Paribas SA, 4.375%, 22/01/19 EUR 400,000 402,626 399,324 0.05BNP Paribas SA, 2.500%, 23/08/19 EUR 800,000 812,939 831,496 0.11BNP Paribas SA, 3.750%, 25/11/20 EUR 1,150,000 1,197,565 1,288,724 0.16BNP Paribas SA, 4.125%, 14/01/22 EUR 750,000 782,470 862,912 0.11BNP Paribas SA, 2.875%, 24/10/22 EUR 950,000 968,499 989,966 0.13BNP Paribas SA, 4.500%, 21/03/23 EUR 600,000 633,447 726,198 0.09BNP Paribas SA, 5.019%, perpetual EUR 400,000 302,598 378,000 0.05BNP Paribas SA, 7.781%, perpetual EUR 500,000 553,381 555,000 0.07Bouygues SA, 4.375%, 29/10/14 EUR 600,000 629,327 635,358 0.08Bouygues SA, 6.125%, 03/07/15 EUR 1,000,000 1,097,652 1,125,500 0.14Bouygues SA, 3.641%, 29/10/19 EUR 1,000,000 1,032,175 1,088,100 0.14Bouygues SA, 4.250%, 22/07/20 EUR 300,000 303,215 336,219 0.04Bouygues SA, 4.500%, 09/02/22 EUR 500,000 546,829 567,510 0.07Bouygues SA, 3.625%, 16/01/23 EUR 600,000 627,360 633,600 0.08BPCE SA, 2.875%, 22/09/15 EUR 1,100,000 1,129,498 1,152,723 0.15BPCE SA, 1.750%, 14/03/16 EUR 500,000 506,593 508,430 0.06BPCE SA, 3.750%, 21/07/17 EUR 1,200,000 1,278,275 1,321,884 0.17BPCE SA, 2.000%, 24/04/18 EUR 300,000 298,651 305,673 0.04BPCE SA, 4.500%, 10/02/22 EUR 1,000,000 1,076,680 1,167,030 0.15BPCE SA, 4.250%, 06/02/23 EUR 300,000 330,140 343,257 0.04BRE Finance France SA, 2.750%, 12/10/15 EUR 300,000 299,006 301,053 0.04Caisse Centrale du Credit Immobilier de France SA, 3.750%, 10/03/14 EUR 500,000 503,339 507,505 0.06Caisse Centrale du Credit Immobilier de France SA, 3.750%, 22/01/15 EUR 800,000 809,125 814,504 0.10Caisse Centrale du Credit Immobilier de France SA, 4.000%, 12/01/18 EUR 200,000 194,565 201,002 0.03Cap Gemini SA, 5.250%, 29/11/16 EUR 200,000 211,843 222,662 0.03Carrefour Banque SA, 2.875%, 25/09/15 EUR 400,000 411,704 415,880 0.05Carrefour SA, 6.625%, 02/12/13 EUR 100,000 103,118 105,382 0.01Carrefour SA, 5.125%, 10/10/14 EUR 1,200,000 1,275,221 1,287,228 0.16Carrefour SA, 5.375%, 12/06/15 EUR 850,000 909,058 936,351 0.12Carrefour SA, 4.375%, 02/11/16 EUR 300,000 317,896 330,981 0.04
24
STATE STREET GLOBAL ADVISORS LUXEMBOURG SICAV — SSGA EURO-AGGREGATE CORPORATE BOND INDEX FUND
Schedule of Investments at December 31, 2012 (Expressed in Euro)
The accompanying notes are an integral part of these financial statements.
Currency
NominalValue Cost
MarketValue
% ofNet Assets
Transferable securities admitted to an official stock exchange listing or dealt in on another regulated market - (Continued)
Corporate Bonds - (Continued)
France - (Continued) Carrefour SA, 1.875%, 19/12/17 EUR 107,000 106,589 107,233 0.01Carrefour SA, 5.250%, 24/10/18 EUR 300,000 305,420 351,606 0.04Carrefour SA, 4.000%, 09/04/20 EUR 800,000 851,548 885,008 0.11Carrefour SA, 3.875%, 25/04/21 EUR 400,000 400,309 438,644 0.06Casino Guichard Perrachon SA, 5.500%, 30/01/15 EUR 900,000 961,826 978,453 0.13Casino Guichard Perrachon SA, 4.472%, 04/04/16 EUR 700,000 739,020 766,164 0.10Casino Guichard Perrachon SA, 4.379%, 08/02/17 EUR 650,000 657,286 717,243 0.09Casino Guichard Perrachon SA, 3.157%, 06/08/19 EUR 500,000 523,187 521,420 0.07Casino Guichard Perrachon SA, 4.726%, 26/05/21 EUR 700,000 735,734 797,846 0.10Cie de St-Gobain, 8.250%, 28/07/14 EUR 700,000 769,437 777,910 0.10Cie de St-Gobain, 3.500%, 30/09/15 EUR 600,000 623,221 635,796 0.08Cie de St-Gobain, 4.875%, 31/05/16 EUR 300,000 323,760 334,344 0.04Cie de St-Gobain, 4.750%, 11/04/17 EUR 950,000 1,017,344 1,068,636 0.14Cie de St-Gobain, 4.000%, 08/10/18 EUR 200,000 203,285 219,120 0.03Cie de St-Gobain, 4.500%, 30/09/19 EUR 610,000 647,813 681,431 0.09Cie de St-Gobain, 3.625%, 15/06/21 EUR 500,000 499,555 518,555 0.07Cie de St-Gobain, 3.625%, 28/03/22 EUR 600,000 608,539 618,678 0.08Cie Financiere et Industrielle des Autoroutes SA, 5.875%, 09/10/16 EUR 300,000 334,386 351,774 0.04Cie Financiere et Industrielle des Autoroutes SA, 5.250%, 30/04/18 EUR 200,000 221,477 237,128 0.03Cie Financiere et Industrielle des Autoroutes SA, 5.000%, 24/05/21 EUR 700,000 786,034 833,392 0.11CNP Assurances, 6.000%, 14/09/40 EUR 400,000 336,977 404,000 0.05CNP Assurances, 6.875%, 30/09/41 EUR 500,000 504,473 515,000 0.07CNP Assurances, 4.750%, perpetual EUR 850,000 660,809 722,500 0.09Credit Agricole SA, 3.000%, 20/07/15 EUR 750,000 752,735 787,072 0.10Credit Agricole SA, 3.625%, 08/03/16 EUR 700,000 733,517 755,104 0.10Credit Agricole SA, 1.875%, 18/10/17 EUR 800,000 807,831 809,760 0.10Credit Agricole SA, 5.971%, 01/02/18 EUR 1,550,000 1,641,123 1,754,677 0.22Credit Agricole SA, 3.875%, 13/02/19 EUR 600,000 599,360 667,638 0.09Credit Agricole SA, 5.875%, 11/06/19 EUR 800,000 859,471 913,392 0.12Credit Agricole SA, 3.900%, 19/04/21 EUR 700,000 666,024 706,923 0.09Credit Agricole SA, 5.125%, 18/04/23 EUR 600,000 711,226 746,556 0.10Credit Agricole SA, 7.875%, perpetual EUR 300,000 286,093 315,000 0.04Credit Agricole SA, 8.200%, perpetual EUR 700,000 706,076 752,500 0.10Credit Logement SA, 5.454%, 16/02/21 EUR 200,000 200,837 222,184 0.03Credit Mutuel Arkea SA, 5.375%, 22/04/14 EUR 800,000 840,204 846,856 0.11Credit Mutuel Arkea SA, 4.500%, 23/01/17 EUR 600,000 616,953 678,306 0.09Credit Mutuel Arkea SA, 5.000%, 28/06/17 EUR 450,000 476,682 519,354 0.07Danone SA, 6.375%, 04/02/14 EUR 600,000 628,669 637,908 0.08Danone SA, 2.500%, 29/09/16 EUR 300,000 311,561 317,850 0.04Danone SA, 1.125%, 27/11/17 EUR 700,000 700,133 703,899 0.09Danone SA, 3.600%, 23/11/20 EUR 300,000 340,719 342,528 0.04Dexia Credit Local SA, 5.375%, 21/07/14 EUR 800,000 812,146 818,000 0.10Edenred, 3.625%, 06/10/17 EUR 400,000 408,970 432,764 0.06Eutelsat SA, 4.125%, 27/03/17 EUR 350,000 360,321 389,158 0.05Eutelsat SA, 5.000%, 14/01/19 EUR 700,000 773,101 822,395 0.11Eutelsat SA, 3.125%, 10/10/22 EUR 300,000 307,488 308,514 0.04Fonciere Des Regions, 3.875%, 16/01/18 EUR 200,000 206,134 210,346 0.03France Telecom SA, 5.000%, 22/01/14 EUR 400,000 406,238 418,460 0.05France Telecom SA, 5.250%, 22/05/14 EUR 400,000 418,773 425,340 0.05France Telecom SA, 3.625%, 14/10/15 EUR 750,000 783,823 805,485 0.10France Telecom SA, 4.750%, 21/02/17 EUR 250,000 270,081 284,803 0.04France Telecom SA, 4.750%, 21/02/17 (traded in United States) EUR 1,000,000 1,125,543 1,139,210 0.15France Telecom SA, 5.625%, 22/05/18 EUR 950,000 1,089,823 1,144,161 0.15France Telecom SA, 4.125%, 23/01/19 EUR 300,000 303,656 339,429 0.04France Telecom SA, 3.875%, 09/04/20 EUR 850,000 899,107 951,337 0.12France Telecom SA, 3.875%, 14/01/21 EUR 1,000,000 1,080,076 1,117,630 0.14France Telecom SA, 3.000%, 15/06/22 EUR 700,000 714,306 727,972 0.09France Telecom SA, 2.500%, 01/03/23 EUR 700,000 692,286 692,097 0.09France Telecom SA, 8.125%, 28/01/33 EUR 600,000 848,131 945,216 0.12GDF Suez, 6.250%, 24/01/14 EUR 500,000 518,808 530,210 0.07GDF Suez, 5.000%, 23/02/15 EUR 400,000 425,386 435,472 0.06GDF Suez, 5.625%, 18/01/16 EUR 1,000,000 1,111,409 1,140,900 0.15GDF Suez, 1.500%, 01/02/16 EUR 700,000 711,778 712,565 0.09GDF Suez, 1.500%, 20/07/17 EUR 600,000 607,169 609,162 0.08GDF Suez, 2.750%, 18/10/17 EUR 750,000 767,213 802,867 0.10GDF Suez, 5.125%, 19/02/18 EUR 200,000 220,978 237,430 0.03GDF Suez, 2.250%, 01/06/18 EUR 939,000 959,627 980,494 0.13GDF Suez, 6.875%, 24/01/19 EUR 400,000 487,254 521,616 0.07
25

STATE STREET GLOBAL ADVISORS LUXEMBOURG SICAV — SSGA EURO-AGGREGATE CORPORATE BOND INDEX FUND
Schedule of Investments at December 31, 2012 (Expressed in Euro)
The accompanying notes are an integral part of these financial statements.
Currency
NominalValue Cost
MarketValue
% ofNet Assets
Transferable securities admitted to an official stock exchange listing or dealt in on another regulated market - (Continued)
Corporate Bonds - (Continued)
France - (Continued) GDF Suez, 3.125%, 21/01/20 EUR 700,000 749,470 758,093 0.10GDF Suez, 6.375%, 18/01/21 EUR 200,000 222,841 263,818 0.03GDF Suez, 2.625%, 20/07/22 EUR 400,000 400,192 409,336 0.05GDF Suez, 3.500%, 18/10/22 EUR 650,000 670,544 714,285 0.09GDF Suez, 3.000%, 01/02/23 EUR 900,000 913,793 944,694 0.12GDF Suez, 5.950%, perpetual EUR 100,000 96,521 106,500 0.01Gecina SA, 4.500%, 19/09/14 EUR 400,000 407,856 422,012 0.05Gecina SA, 4.250%, 03/02/16 EUR 100,000 99,597 107,545 0.01Gecina SA, 4.750%, 11/04/19 EUR 500,000 535,824 552,775 0.07Gie GDF Suez Alliance, 5.750%, 24/06/23 EUR 500,000 577,955 641,295 0.08Groupe Auchan SA, 5.125%, 18/07/14 EUR 500,000 532,215 533,810 0.07Groupe Auchan SA, 4.750%, 15/04/15 EUR 100,000 101,840 108,963 0.01Groupe Auchan SA, 3.000%, 02/12/16 EUR 400,000 415,815 430,940 0.06Groupe Auchan SA, 2.875%, 15/11/17 EUR 100,000 99,640 108,092 0.01Groupe Auchan SA, 3.625%, 19/10/18 EUR 200,000 199,682 224,310 0.03Groupe Auchan SA, 6.000%, 15/04/19 EUR 300,000 335,110 380,652 0.05Groupe Auchan SA, 2.375%, 12/12/22 EUR 200,000 199,179 201,864 0.03HSBC France SA, 4.875%, 15/01/14 EUR 600,000 619,075 627,066 0.08Imerys SA, 5.000%, 18/04/17 EUR 300,000 312,926 335,964 0.04Klepierre, 4.250%, 16/03/16 EUR 50,000 49,674 54,229 0.01Klepierre, 4.000%, 13/04/17 EUR 1,000,000 1,044,080 1,091,660 0.14Klepierre, 2.750%, 17/09/19 EUR 600,000 603,792 609,372 0.08Legrand SA, 4.375%, 21/03/18 EUR 200,000 201,678 228,824 0.03Legrand SA, 3.375%, 19/04/22 EUR 500,000 537,572 545,830 0.07LVMH Moet Hennessy Louis Vuitton SA, 4.375%, 12/05/14 EUR 700,000 724,924 734,573 0.09LVMH Moet Hennessy Louis Vuitton SA, 3.375%, 07/04/15 EUR 300,000 312,990 317,829 0.04LVMH Moet Hennessy Louis Vuitton SA, 4.000%, 06/04/18 EUR 200,000 203,893 228,616 0.03Mercialys SA, 4.125%, 26/03/19 EUR 300,000 313,772 328,968 0.04Natixis, 4.125%, 20/01/17 EUR 200,000 193,178 209,568 0.03Natixis, 4.500%, 14/05/19 EUR 500,000 460,979 476,875 0.06Pernod-Ricard SA, 7.000%, 15/01/15 EUR 500,000 540,940 559,120 0.07Pernod-Ricard SA, 4.875%, 18/03/16 EUR 900,000 970,960 998,559 0.13Pernod-Ricard SA, 5.000%, 15/03/17 EUR 600,000 654,792 686,280 0.09PPR, 8.625%, 03/04/14 EUR 450,000 481,393 491,927 0.06PPR, 3.750%, 08/04/15 EUR 550,000 578,047 583,479 0.07PPR, 3.125%, 23/04/19 EUR 105,000 104,288 113,648 0.01RCI Banque SA, 3.250%, 17/01/14 EUR 100,000 100,905 101,915 0.01RCI Banque SA, 3.750%, 07/07/14 EUR 500,000 503,586 516,275 0.07RCI Banque SA, 2.125%, 24/11/14 EUR 800,000 807,569 808,024 0.10RCI Banque SA, 4.375%, 27/01/15 EUR 50,000 49,890 52,659 0.01RCI Banque SA, 5.625%, 13/03/15 EUR 750,000 793,051 812,467 0.10RCI Banque SA, 4.000%, 25/01/16 EUR 700,000 710,999 740,509 0.09RCI Banque SA, 4.000%, 16/03/16 EUR 400,000 394,647 424,404 0.05RCI Banque SA, 4.250%, 27/04/17 EUR 819,000 855,229 884,242 0.11Rhodia SA, 7.000%, 15/05/18 EUR 600,000 660,880 669,000 0.09Sanofi, 3.125%, 10/10/14 EUR 800,000 825,760 837,848 0.11Sanofi, 4.500%, 18/05/16 EUR 1,050,000 1,143,113 1,181,785 0.15Sanofi, 1.000%, 14/11/17 EUR 655,000 656,662 657,234 0.08Sanofi, 4.125%, 11/10/19 EUR 100,000 102,783 118,027 0.02Schneider Electric SA, 5.375%, 08/01/15 EUR 400,000 436,742 436,692 0.06Schneider Electric SA, 5.375%, 08/01/15 (traded in Luxembourg) EUR 200,000 212,285 218,346 0.03Schneider Electric SA, 2.875%, 20/07/16 EUR 350,000 365,830 374,567 0.05Schneider Electric SA, 4.000%, 11/08/17 EUR 650,000 686,316 734,591 0.09Schneider Electric SA, 3.750%, 12/07/18 EUR 500,000 532,238 561,890 0.07Schneider Electric SA, 3.500%, 22/01/19 EUR 400,000 433,371 444,892 0.06Schneider Electric SA, 3.625%, 20/07/20 EUR 100,000 99,336 112,251 0.01SCOR SE, 6.154%, perpetual EUR 150,000 124,949 153,375 0.02Societe Des Autoroutes Paris-Rhin-Rhone, 7.500%, 12/01/15 EUR 500,000 550,262 561,580 0.07Societe Des Autoroutes Paris-Rhin-Rhone, 4.375%, 25/01/16 EUR 200,000 207,729 216,090 0.03Societe Des Autoroutes Paris-Rhin-Rhone, 5.000%, 12/01/17 EUR 800,000 866,898 895,512 0.11Societe Des Autoroutes Paris-Rhin-Rhone, 4.875%, 21/01/19 EUR 400,000 387,984 455,528 0.06Societe Fonciere Lyonnaise SA, 4.625%, 25/05/16 EUR 500,000 525,064 533,715 0.07Societe Fonciere Lyonnaise SA, 3.500%, 28/11/17 EUR 200,000 199,099 206,414 0.03Societe Generale SA, 3.750%, 21/08/14 EUR 850,000 875,550 890,647 0.11Societe Generale SA, 3.000%, 31/03/15 EUR 1,200,000 1,210,964 1,251,168 0.16Societe Generale SA, 6.625%, 27/04/15 EUR 200,000 212,934 219,090 0.03Societe Generale SA, 2.375%, 13/07/15 EUR 900,000 927,964 928,944 0.12Societe Generale SA, 4.000%, 20/04/16 EUR 500,000 496,882 544,770 0.07
26

STATE STREET GLOBAL ADVISORS LUXEMBOURG SICAV — SSGA EURO-AGGREGATE CORPORATE BOND INDEX FUND
Schedule of Investments at December 31, 2012 (Expressed in Euro)
The accompanying notes are an integral part of these financial statements.
Currency
NominalValue Cost
MarketValue
% ofNet Assets
Transferable securities admitted to an official stock exchange listing or dealt in on another regulated market - (Continued)
Corporate Bonds - (Continued)
France - (Continued) Societe Generale SA, 3.750%, 01/03/17 EUR 300,000 312,191 328,167 0.04Societe Generale SA, 3.125%, 21/09/17 EUR 600,000 593,419 644,748 0.08Societe Generale SA, 2.375%, 28/02/18 EUR 1,100,000 1,116,691 1,140,480 0.15Societe Generale SA, 6.125%, 20/08/18 EUR 700,000 769,210 800,380 0.10Societe Generale SA, 4.750%, 02/03/21 EUR 600,000 653,714 706,752 0.09Societe Generale SA, 4.250%, 13/07/22 EUR 700,000 764,498 791,938 0.10Sodexo, 4.500%, 28/03/14 EUR 400,000 413,293 416,988 0.05Sodexo, 6.250%, 30/01/15 EUR 600,000 652,981 665,424 0.09Solvay Finance SA, 6.375%, perpetual EUR 300,000 325,425 323,268 0.04Suez Environnement Co, 4.875%, 08/04/14 EUR 650,000 677,776 682,162 0.09Suez Environnement Co, 6.250%, 08/04/19 EUR 150,000 161,669 189,854 0.02Suez Environnement Co, 4.078%, 17/05/21 EUR 300,000 300,323 343,422 0.04Suez Environnement Co, 4.125%, 24/06/22 EUR 700,000 760,029 803,705 0.10Suez Environnement Co, 5.500%, 22/07/24 EUR 300,000 389,223 384,300 0.05Suez Environnement Co, 4.820%, perpetual EUR 300,000 289,714 306,750 0.04Thales SA, 2.750%, 19/10/16 EUR 300,000 308,250 315,708 0.04Total Capital International SA, 2.125%, 15/03/23 EUR 400,000 395,487 400,612 0.05Total Capital SA, 3.500%, 27/02/14 EUR 850,000 866,972 879,512 0.11Total Capital SA, 3.625%, 19/05/15 EUR 800,000 845,617 857,480 0.11Total Capital SA, 4.875%, 28/01/19 EUR 800,000 937,072 969,328 0.12Total Capital SA, 3.125%, 16/09/22 EUR 200,000 201,429 221,010 0.03Total Capital SA, 5.125%, 26/03/24 EUR 700,000 869,992 910,301 0.12Total Infrastructures Gaz France SA, 4.339%, 07/07/21 EUR 200,000 227,245 231,886 0.03TPSA Eurofinance France SA, 6.000%, 22/05/14 EUR 400,000 419,241 426,432 0.05Unibail-Rodamco SE, 3.375%, 11/03/15 EUR 250,000 251,625 263,085 0.03Unibail-Rodamco SE, 3.500%, 06/04/16 EUR 500,000 526,424 538,145 0.07Unibail-Rodamco SE, 4.625%, 23/09/16 EUR 400,000 435,708 448,536 0.06Unibail-Rodamco SE, 1.625%, 26/06/17 EUR 114,000 113,443 115,117 0.01Unibail-Rodamco SE, 3.875%, 13/12/17 EUR 100,000 99,365 111,315 0.01Unibail-Rodamco SE, 2.250%, 01/08/18 EUR 700,000 714,207 721,644 0.09Unibail-Rodamco SE, 3.000%, 22/03/19 EUR 500,000 501,136 534,440 0.07Unibail-Rodamco SE, 3.875%, 05/11/20 EUR 500,000 545,072 567,250 0.07Valeo SA, 5.750%, 19/01/17 EUR 300,000 322,316 338,643 0.04Valeo SA, 4.875%, 11/05/18 EUR 200,000 202,524 222,478 0.03Vallourec SA, 4.250%, 14/02/17 EUR 300,000 309,445 329,514 0.04Vallourec SA, 3.250%, 02/08/19 EUR 300,000 316,602 312,672 0.04Veolia Environnement SA, 5.250%, 24/04/14 EUR 600,000 628,147 634,122 0.08Veolia Environnement SA, 4.000%, 12/02/16 EUR 500,000 527,909 546,095 0.07Veolia Environnement SA, 4.375%, 16/01/17 EUR 1,000,000 1,048,400 1,127,550 0.14Veolia Environnement SA, 6.750%, 24/04/19 EUR 650,000 779,509 825,181 0.11Veolia Environnement SA, 4.247%, 06/01/21 EUR 300,000 307,811 338,367 0.04Veolia Environnement SA, 5.125%, 24/05/22 EUR 850,000 957,137 1,012,698 0.13Veolia Environnement SA, 4.625%, 30/03/27 EUR 700,000 746,823 788,739 0.10Veolia Environnement SA, 6.125%, 25/11/33 EUR 200,000 221,761 258,826 0.03Vinci SA, 4.125%, 20/02/17 EUR 600,000 652,693 668,724 0.09Vinci SA, 3.375%, 30/03/20 EUR 500,000 503,919 538,510 0.07Vinci SA, 6.250%, perpetual EUR 200,000 193,482 212,500 0.03Vivendi SA, 7.750%, 23/01/14 EUR 400,000 414,603 428,376 0.05Vivendi SA, 3.500%, 13/07/15 EUR 1,000,000 1,023,234 1,052,700 0.13Vivendi SA, 4.250%, 01/12/16 EUR 250,000 253,428 274,698 0.04Vivendi SA, 4.000%, 31/03/17 EUR 700,000 722,330 763,126 0.10Vivendi SA, 4.125%, 18/07/17 EUR 1,000,000 1,059,012 1,095,530 0.14Vivendi SA, 4.875%, 30/11/18 EUR 100,000 107,141 115,123 0.01Vivendi SA, 4.875%, 02/12/19 EUR 150,000 149,895 174,182 0.02Vivendi SA, 2.500%, 15/01/20 EUR 600,000 595,913 599,664 0.08Vivendi SA, 4.750%, 13/07/21 EUR 700,000 789,279 804,027 0.10WPP Finance SA, 5.250%, 30/01/15 EUR 500,000 538,101 542,570 0.07
Total France 150,338,904 156,719,935 20.00 _______________________________________________ ____________________________________________________________ __________________________________________________
Germany Aareal Bank AG, 4.000%, 12/05/14 EUR 400,000 410,055 414,980 0.05Allianz SE, 5.625%, 17/10/42 EUR 1,100,000 1,165,370 1,236,752 0.16Allianz SE, 5.500%, perpetual EUR 900,000 882,538 922,500 0.12BASF SE, 1.500%, 01/10/18 EUR 700,000 710,417 715,764 0.09BASF SE, 2.000%, 05/12/22 EUR 1,000,000 987,593 996,590 0.13Bayer AG, 5.000%, perpetual EUR 700,000 698,892 740,250 0.09
27

STATE STREET GLOBAL ADVISORS LUXEMBOURG SICAV — SSGA EURO-AGGREGATE CORPORATE BOND INDEX FUND
Schedule of Investments at December 31, 2012 (Expressed in Euro)
The accompanying notes are an integral part of these financial statements.
Currency
NominalValue Cost
MarketValue
% ofNet Assets
Transferable securities admitted to an official stock exchange listing or dealt in on another regulated market - (Continued)
Corporate Bonds - (Continued)
Germany - (Continued) Berlin-Hannoversche Hypothekenbank AG, 3.500%, 03/02/15 EUR 200,000 201,454 210,166 0.03Bertelsmann SE & Co KGaA, 7.875%, 16/01/14 EUR 300,000 309,703 321,615 0.04Bertelsmann SE & Co KGaA, 4.750%, 26/09/16 EUR 1,000,000 1,091,665 1,128,480 0.14Bertelsmann SE & Co KGaA, 2.625%, 02/08/22 EUR 500,000 498,362 502,340 0.06Bilfinger SE, 2.375%, 07/12/19 EUR 400,000 409,922 414,760 0.05Commerzbank AG, 5.000%, 06/02/14 EUR 450,000 459,721 470,858 0.06Commerzbank AG, 4.750%, 26/01/15 EUR 550,000 575,675 594,072 0.08Commerzbank AG, 3.875%, 22/03/17 EUR 850,000 888,357 937,635 0.12Commerzbank AG, 3.625%, 10/07/17 EUR 800,000 841,470 876,304 0.11Commerzbank AG, 4.000%, 16/09/20 EUR 750,000 802,063 845,932 0.11Daimler AG, 4.625%, 02/09/14 EUR 900,000 933,716 957,492 0.12Daimler AG, 1.750%, 21/05/15 EUR 900,000 912,346 919,638 0.12Daimler AG, 4.125%, 19/01/17 EUR 700,000 750,963 782,677 0.10Daimler AG, 2.000%, 05/05/17 EUR 746,000 762,475 774,005 0.10Daimler AG, 2.125%, 27/06/18 EUR 700,000 714,963 724,486 0.09Daimler AG, 2.625%, 02/04/19 EUR 400,000 416,652 423,356 0.05Daimler AG, 1.750%, 21/01/20 EUR 600,000 597,341 597,336 0.08Daimler AG, 2.375%, 12/09/22 EUR 500,000 497,547 501,975 0.06Deutsche Bank AG, 5.125%, 31/08/17 EUR 3,600,000 4,032,129 4,246,740 0.54Deutsche Bank AG, 5.000%, 24/06/20 EUR 600,000 621,745 666,132 0.09Deutsche Boerse AG, 2.375%, 05/10/22 EUR 200,000 198,323 204,542 0.03Deutsche Pfandbriefbank AG, 2.500%, 11/09/15 EUR 600,000 609,455 611,340 0.08Deutsche Post AG, 2.875%, 11/12/24 EUR 200,000 199,502 205,452 0.03DVB Bank SE, 2.500%, 15/05/15 EUR 200,000 205,751 206,492 0.03DVB Bank SE, 2.500%, 30/08/17 EUR 200,000 202,917 209,378 0.03Eurogrid GmbH, 3.875%, 22/10/20 EUR 150,000 158,059 168,885 0.02Evonik Degussa GmbH, 5.125%, 10/12/13 EUR 650,000 671,884 672,776 0.09Evonik Industries AG, 7.000%, 14/10/14 EUR 350,000 376,472 386,264 0.05GEA GroupAG, 4.250%, 21/04/16 EUR 200,000 208,229 215,712 0.03Henkel AG & Co KGaA, 4.625%, 19/03/14 EUR 750,000 782,119 784,672 0.10Henkel AG & Co KGaA, 5.375%, perpetual EUR 900,000 920,322 969,750 0.12K+S AG, 5.000%, 24/09/14 EUR 600,000 635,196 641,388 0.08K+S AG, 3.000%, 20/06/22 EUR 300,000 299,963 314,316 0.04Linde AG, 1.750%, 17/09/20 EUR 1,000,000 998,361 1,003,110 0.13MAN SE, 1.000%, 21/09/15 EUR 600,000 603,115 604,824 0.08MAN SE, 2.125%, 13/03/17 EUR 500,000 505,363 519,660 0.07Merck Financial Services GmbH, 3.375%, 24/03/15 EUR 700,000 717,751 740,096 0.09Merck Financial Services GmbH, 4.500%, 24/03/20 EUR 850,000 969,085 1,005,422 0.13Metro AG, 5.750%, 14/07/14 EUR 300,000 311,325 320,049 0.04Metro AG, 7.625%, 05/03/15 EUR 650,000 721,958 734,727 0.09Metro AG, 3.375%, 01/03/19 EUR 329,000 330,990 349,398 0.04Muenchener Rueckversicherungs AG, 6.000%, 26/05/41 EUR 600,000 582,666 715,518 0.09Muenchener Rueckversicherungs AG, 6.250%, 26/05/42 EUR 600,000 668,632 724,470 0.09Muenchener Rueckversicherungs AG, 5.767%, perpetual EUR 850,000 809,415 896,750 0.11Rheinmetall AG, 4.000%, 22/09/17 EUR 200,000 197,843 216,090 0.03Rhoen Klinikum AG, 3.875%, 11/03/16 EUR 100,000 101,334 106,108 0.01Robert Bosch GmbH, 4.375%, 19/05/16 EUR 400,000 439,235 448,524 0.06Robert Bosch GmbH, 5.125%, 12/06/17 EUR 250,000 267,252 297,290 0.04RWE AG, 5.750%, 14/02/33 EUR 300,000 354,489 402,678 0.05RWE AG, 4.625%, perpetual EUR 1,000,000 974,440 1,021,000 0.13ThyssenKrupp AG, 8.000%, 18/06/14 EUR 500,000 526,769 544,855 0.07ThyssenKrupp AG, 4.375%, 18/03/15 EUR 200,000 196,882 209,166 0.03ThyssenKrupp AG, 4.375%, 28/02/17 EUR 700,000 716,881 727,391 0.09UniCredit Bank AG, 6.000%, 05/02/14 EUR 600,000 619,168 624,000 0.08UniCredit Bank AG, 3.250%, 15/07/14 EUR 200,000 202,865 206,706 0.03Voith GmbH, 5.375%, 21/06/17 EUR 350,000 383,466 407,519 0.05Volkswagen Financial Services AG, 6.875%, 15/01/14 EUR 400,000 419,139 425,216 0.05Volkswagen Financial Services AG, 3.375%, 28/07/14 EUR 700,000 719,509 729,428 0.09Volkswagen Leasing GmbH, 2.250%, 10/11/14 EUR 300,000 303,537 308,502 0.04Volkswagen Leasing GmbH, 2.750%, 13/07/15 EUR 800,000 820,658 838,072 0.11Volkswagen Leasing GmbH, 1.500%, 15/09/15 EUR 900,000 910,683 914,931 0.12Volkswagen Leasing GmbH, 3.375%, 03/06/16 EUR 100,000 99,876 107,893 0.01Volkswagen Leasing GmbH, 2.375%, 06/09/22 EUR 500,000 498,973 501,110 0.06Westfaelisch-Lippische SpA rkassen & Giroverband, 4.375%, 24/09/14 EUR 200,000 206,967 210,558 0.03
28

STATE STREET GLOBAL ADVISORS LUXEMBOURG SICAV — SSGA EURO-AGGREGATE CORPORATE BOND INDEX FUND
Schedule of Investments at December 31, 2012 (Expressed in Euro)
The accompanying notes are an integral part of these financial statements.
Currency
NominalValue Cost
MarketValue
% ofNet Assets
Transferable securities admitted to an official stock exchange listing or dealt in on another regulated market - (Continued)
Corporate Bonds - (Continued)
Germany - (Continued) Wirtschafts- und Infrastrukturbank Hessen, 1.750%, 06/12/22 EUR 300,000 299,747 301,830 0.04
Total Germany 43,119,700 44,676,693 5.70 _______________________________________________ ____________________________________________________________ __________________________________________________
Ireland Caterpillar International Finance Ltd, 2.750%, 06/06/14 EUR 200,000 200,672 206,176 0.03Caterpillar International Finance Ltd, 1.375%, 18/05/15 EUR 300,000 299,620 304,836 0.04Cloverie PLC for Swiss Reinsurance Co Ltd, 6.625%, 01/09/42 EUR 400,000 471,428 483,800 0.06Cloverie PLC for Zurich Insurance Co, 7.500%, 24/07/39 EUR 150,000 171,063 182,172 0.02CRH Finance Ltd, 7.375%, 28/05/14 EUR 100,000 101,994 108,923 0.01FGA Capital Ireland PLC, 5.250%, 28/02/14 EUR 300,000 305,021 306,750 0.04FGA Capital Ireland PLC, 4.375%, 18/09/14 EUR 300,000 302,991 306,000 0.04GE Capital European Funding, 4.250%, 06/02/14 EUR 1,700,000 1,750,174 1,765,552 0.22GE Capital European Funding, 4.625%, 04/07/14 EUR 400,000 417,473 423,092 0.05GE Capital European Funding, 4.750%, 30/07/14 EUR 1,200,000 1,259,623 1,274,892 0.16GE Capital European Funding, 2.875%, 28/10/14 EUR 500,000 502,309 518,335 0.07GE Capital European Funding, 2.000%, 27/02/15 EUR 1,100,000 1,123,332 1,127,522 0.14GE Capital European Funding, 5.250%, 18/05/15 EUR 1,200,000 1,246,632 1,321,896 0.17GE Capital European Funding, 2.875%, 17/09/15 EUR 800,000 834,637 840,920 0.11GE Capital European Funding, 1.250%, 15/10/15 EUR 600,000 606,722 607,050 0.08GE Capital European Funding, 3.750%, 04/04/16 EUR 800,000 859,034 868,288 0.11GE Capital European Funding, 4.125%, 27/10/16 EUR 400,000 408,248 443,124 0.06GE Capital European Funding, 4.250%, 01/03/17 EUR 1,050,000 1,125,824 1,176,273 0.15GE Capital European Funding, 5.375%, 16/01/18 EUR 500,000 592,528 596,105 0.08GE Capital European Funding, 6.000%, 15/01/19 EUR 700,000 823,563 871,059 0.11GE Capital European Funding, 2.875%, 18/06/19 EUR 1,100,000 1,135,055 1,176,725 0.15GE Capital European Funding, 5.375%, 23/01/20 EUR 1,000,000 1,079,765 1,224,950 0.16GE Capital European Funding, 4.625%, 22/02/27 EUR 300,000 285,517 360,789 0.05GE Capital European Funding, 6.025%, 01/03/38 EUR 500,000 537,328 662,910 0.08Willow No.2 Ireland PLC for Zurich Insurance Co Ltd, 3.375%, 27/06/22 EUR 550,000 571,115 594,038 0.08
Total Ireland 17,011,668 17,752,177 2.27 _______________________________________________ ____________________________________________________________ __________________________________________________
Italy Assicurazioni Generali SpA, 4.875%, 11/11/14 EUR 600,000 618,696 634,644 0.08Assicurazioni Generali SpA, 5.125%, 16/09/24 EUR 1,250,000 1,297,066 1,329,162 0.17Assicurazioni Generali SpA, 10.125%, 10/07/42 EUR 300,000 304,438 357,000 0.05Assicurazioni Generali SpA, 7.750%, 12/12/42 EUR 100,000 100,000 106,270 0.01Atlantia SpA, 5.000%, 09/06/14 EUR 1,300,000 1,355,573 1,368,861 0.18Atlantia SpA, 5.625%, 06/05/16 EUR 950,000 1,015,085 1,053,911 0.13Atlantia SpA, 3.375%, 18/09/17 EUR 500,000 502,033 517,705 0.07Atlantia SpA, 4.500%, 08/02/19 EUR 800,000 843,632 868,568 0.11Atlantia SpA, 4.375%, 16/03/20 EUR 500,000 508,011 532,715 0.07Atlantia SpA, 5.875%, 09/06/24 EUR 700,000 787,451 819,182 0.10Banco Popolare SC, 4.125%, 22/10/14 EUR 750,000 736,848 760,800 0.10Enel SpA, 5.250%, 20/06/17 EUR 650,000 684,483 715,942 0.09Enel SpA, 4.750%, 12/06/18 EUR 200,000 203,353 215,262 0.03Enel SpA, 5.250%, 20/05/24 EUR 300,000 302,001 311,583 0.04Enel SpA, 5.625%, 21/06/27 EUR 600,000 611,835 631,386 0.08Eni SpA, 5.875%, 20/01/14 EUR 500,000 521,506 526,175 0.07Eni SpA, 5.000%, 28/01/16 EUR 1,000,000 1,083,120 1,113,270 0.14Eni SpA, 4.750%, 14/11/17 EUR 900,000 964,647 1,038,231 0.13Eni SpA, 3.500%, 29/01/18 EUR 650,000 684,742 709,507 0.09Eni SpA, 3.750%, 27/06/19 EUR 400,000 443,279 443,828 0.06Eni SpA, 4.125%, 16/09/19 EUR 650,000 670,118 733,037 0.09Eni SpA, 4.250%, 03/02/20 EUR 700,000 746,010 795,242 0.10Eni SpA, 4.000%, 29/06/20 EUR 700,000 750,536 784,588 0.10Exor SpA, 5.375%, 12/06/17 EUR 350,000 357,590 375,322 0.05Finmeccanica SpA, 4.875%, 24/03/25 EUR 150,000 149,401 146,250 0.02Hera SpA, 4.500%, 03/12/19 EUR 500,000 507,014 531,715 0.07Intesa Sanpaolo SpA, 5.375%, 19/12/13 EUR 450,000 457,884 466,470 0.06Intesa Sanpaolo SpA, 3.375%, 19/01/15 EUR 1,000,000 1,008,310 1,022,880 0.13Intesa Sanpaolo SpA, 4.875%, 10/07/15 EUR 700,000 719,321 739,606 0.09Intesa Sanpaolo SpA, 4.125%, 14/01/16 EUR 700,000 706,379 729,064 0.09Intesa Sanpaolo SpA, 4.125%, 19/09/16 EUR 700,000 716,259 730,793 0.09
29
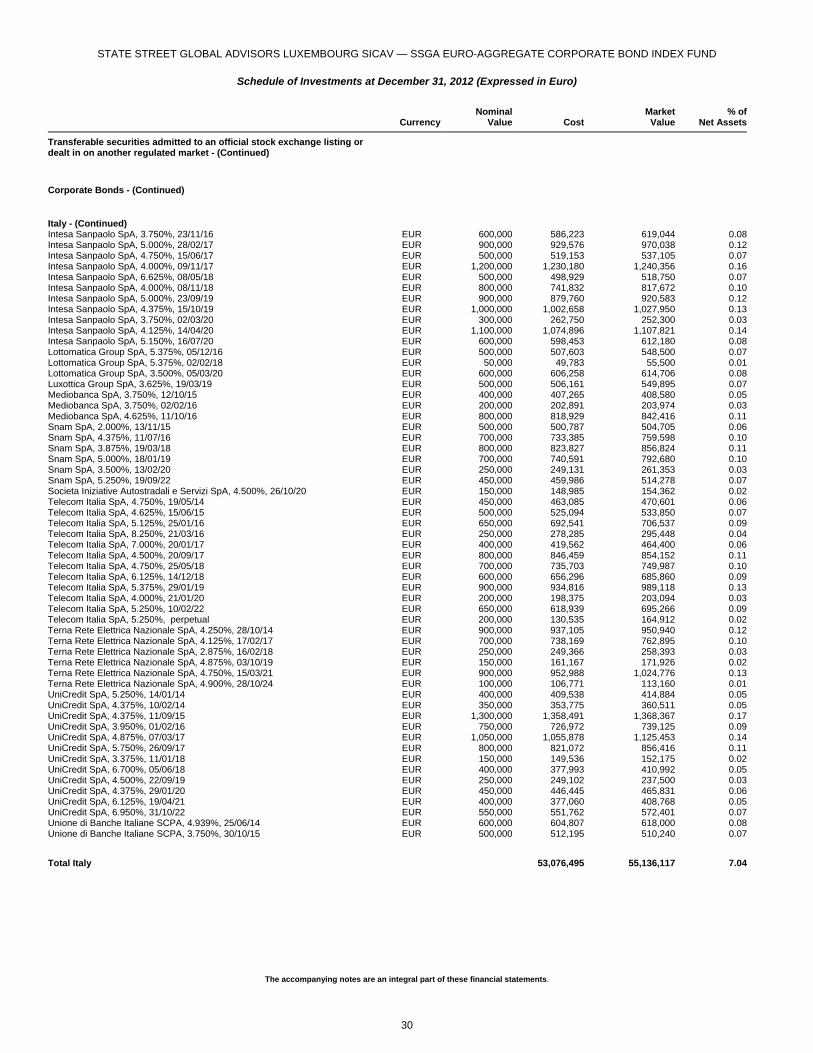
STATE STREET GLOBAL ADVISORS LUXEMBOURG SICAV — SSGA EURO-AGGREGATE CORPORATE BOND INDEX FUND
Schedule of Investments at December 31, 2012 (Expressed in Euro)
The accompanying notes are an integral part of these financial statements.
Currency
NominalValue Cost
MarketValue
% ofNet Assets
Transferable securities admitted to an official stock exchange listing or dealt in on another regulated market - (Continued)
Corporate Bonds - (Continued)
Italy - (Continued) Intesa Sanpaolo SpA, 3.750%, 23/11/16 EUR 600,000 586,223 619,044 0.08Intesa Sanpaolo SpA, 5.000%, 28/02/17 EUR 900,000 929,576 970,038 0.12Intesa Sanpaolo SpA, 4.750%, 15/06/17 EUR 500,000 519,153 537,105 0.07Intesa Sanpaolo SpA, 4.000%, 09/11/17 EUR 1,200,000 1,230,180 1,240,356 0.16Intesa Sanpaolo SpA, 6.625%, 08/05/18 EUR 500,000 498,929 518,750 0.07Intesa Sanpaolo SpA, 4.000%, 08/11/18 EUR 800,000 741,832 817,672 0.10Intesa Sanpaolo SpA, 5.000%, 23/09/19 EUR 900,000 879,760 920,583 0.12Intesa Sanpaolo SpA, 4.375%, 15/10/19 EUR 1,000,000 1,002,658 1,027,950 0.13Intesa Sanpaolo SpA, 3.750%, 02/03/20 EUR 300,000 262,750 252,300 0.03Intesa Sanpaolo SpA, 4.125%, 14/04/20 EUR 1,100,000 1,074,896 1,107,821 0.14Intesa Sanpaolo SpA, 5.150%, 16/07/20 EUR 600,000 598,453 612,180 0.08Lottomatica Group SpA, 5.375%, 05/12/16 EUR 500,000 507,603 548,500 0.07Lottomatica Group SpA, 5.375%, 02/02/18 EUR 50,000 49,783 55,500 0.01Lottomatica Group SpA, 3.500%, 05/03/20 EUR 600,000 606,258 614,706 0.08Luxottica Group SpA, 3.625%, 19/03/19 EUR 500,000 506,161 549,895 0.07Mediobanca SpA, 3.750%, 12/10/15 EUR 400,000 407,265 408,580 0.05Mediobanca SpA, 3.750%, 02/02/16 EUR 200,000 202,891 203,974 0.03Mediobanca SpA, 4.625%, 11/10/16 EUR 800,000 818,929 842,416 0.11Snam SpA, 2.000%, 13/11/15 EUR 500,000 500,787 504,705 0.06Snam SpA, 4.375%, 11/07/16 EUR 700,000 733,385 759,598 0.10Snam SpA, 3.875%, 19/03/18 EUR 800,000 823,827 856,824 0.11Snam SpA, 5.000%, 18/01/19 EUR 700,000 740,591 792,680 0.10Snam SpA, 3.500%, 13/02/20 EUR 250,000 249,131 261,353 0.03Snam SpA, 5.250%, 19/09/22 EUR 450,000 459,986 514,278 0.07Societa Iniziative Autostradali e Servizi SpA, 4.500%, 26/10/20 EUR 150,000 148,985 154,362 0.02Telecom Italia SpA, 4.750%, 19/05/14 EUR 450,000 463,085 470,601 0.06Telecom Italia SpA, 4.625%, 15/06/15 EUR 500,000 525,094 533,850 0.07Telecom Italia SpA, 5.125%, 25/01/16 EUR 650,000 692,541 706,537 0.09Telecom Italia SpA, 8.250%, 21/03/16 EUR 250,000 278,285 295,448 0.04Telecom Italia SpA, 7.000%, 20/01/17 EUR 400,000 419,562 464,400 0.06Telecom Italia SpA, 4.500%, 20/09/17 EUR 800,000 846,459 854,152 0.11Telecom Italia SpA, 4.750%, 25/05/18 EUR 700,000 735,703 749,987 0.10Telecom Italia SpA, 6.125%, 14/12/18 EUR 600,000 656,296 685,860 0.09Telecom Italia SpA, 5.375%, 29/01/19 EUR 900,000 934,816 989,118 0.13Telecom Italia SpA, 4.000%, 21/01/20 EUR 200,000 198,375 203,094 0.03Telecom Italia SpA, 5.250%, 10/02/22 EUR 650,000 618,939 695,266 0.09Telecom Italia SpA, 5.250%, perpetual EUR 200,000 130,535 164,912 0.02Terna Rete Elettrica Nazionale SpA, 4.250%, 28/10/14 EUR 900,000 937,105 950,940 0.12Terna Rete Elettrica Nazionale SpA, 4.125%, 17/02/17 EUR 700,000 738,169 762,895 0.10Terna Rete Elettrica Nazionale SpA, 2.875%, 16/02/18 EUR 250,000 249,366 258,393 0.03Terna Rete Elettrica Nazionale SpA, 4.875%, 03/10/19 EUR 150,000 161,167 171,926 0.02Terna Rete Elettrica Nazionale SpA, 4.750%, 15/03/21 EUR 900,000 952,988 1,024,776 0.13Terna Rete Elettrica Nazionale SpA, 4.900%, 28/10/24 EUR 100,000 106,771 113,160 0.01UniCredit SpA, 5.250%, 14/01/14 EUR 400,000 409,538 414,884 0.05UniCredit SpA, 4.375%, 10/02/14 EUR 350,000 353,775 360,511 0.05UniCredit SpA, 4.375%, 11/09/15 EUR 1,300,000 1,358,491 1,368,367 0.17UniCredit SpA, 3.950%, 01/02/16 EUR 750,000 726,972 739,125 0.09UniCredit SpA, 4.875%, 07/03/17 EUR 1,050,000 1,055,878 1,125,453 0.14UniCredit SpA, 5.750%, 26/09/17 EUR 800,000 821,072 856,416 0.11UniCredit SpA, 3.375%, 11/01/18 EUR 150,000 149,536 152,175 0.02UniCredit SpA, 6.700%, 05/06/18 EUR 400,000 377,993 410,992 0.05UniCredit SpA, 4.500%, 22/09/19 EUR 250,000 249,102 237,500 0.03UniCredit SpA, 4.375%, 29/01/20 EUR 450,000 446,445 465,831 0.06UniCredit SpA, 6.125%, 19/04/21 EUR 400,000 377,060 408,768 0.05UniCredit SpA, 6.950%, 31/10/22 EUR 550,000 551,762 572,401 0.07Unione di Banche Italiane SCPA, 4.939%, 25/06/14 EUR 600,000 604,807 618,000 0.08Unione di Banche Italiane SCPA, 3.750%, 30/10/15 EUR 500,000 512,195 510,240 0.07
Total Italy 53,076,495 55,136,117 7.04 _______________________________________________ ____________________________________________________________ __________________________________________________
30
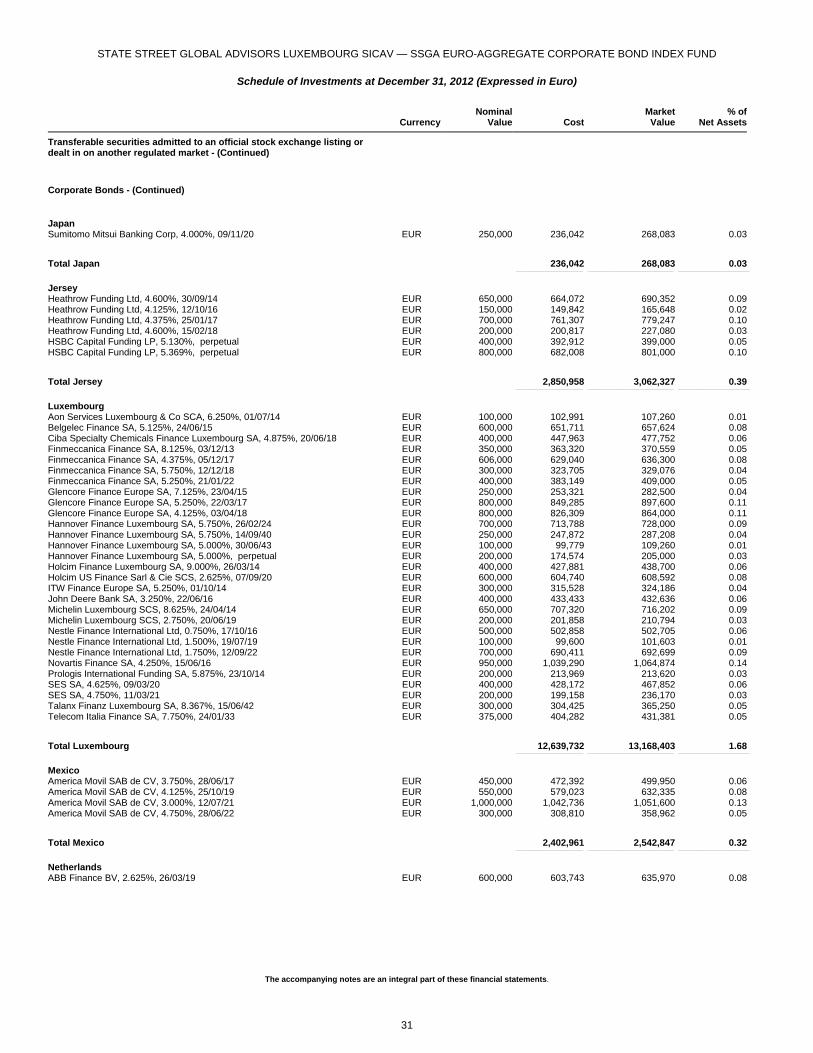
STATE STREET GLOBAL ADVISORS LUXEMBOURG SICAV — SSGA EURO-AGGREGATE CORPORATE BOND INDEX FUND
Schedule of Investments at December 31, 2012 (Expressed in Euro)
The accompanying notes are an integral part of these financial statements.
Currency
NominalValue Cost
MarketValue
% ofNet Assets
Transferable securities admitted to an official stock exchange listing or dealt in on another regulated market - (Continued)
Corporate Bonds - (Continued)
Japan Sumitomo Mitsui Banking Corp, 4.000%, 09/11/20 EUR 250,000 236,042 268,083 0.03
Total Japan 236,042 268,083 0.03 _______________________________________________ ____________________________________________________________ __________________________________________________
Jersey Heathrow Funding Ltd, 4.600%, 30/09/14 EUR 650,000 664,072 690,352 0.09Heathrow Funding Ltd, 4.125%, 12/10/16 EUR 150,000 149,842 165,648 0.02Heathrow Funding Ltd, 4.375%, 25/01/17 EUR 700,000 761,307 779,247 0.10Heathrow Funding Ltd, 4.600%, 15/02/18 EUR 200,000 200,817 227,080 0.03HSBC Capital Funding LP, 5.130%, perpetual EUR 400,000 392,912 399,000 0.05HSBC Capital Funding LP, 5.369%, perpetual EUR 800,000 682,008 801,000 0.10
Total Jersey 2,850,958 3,062,327 0.39 _______________________________________________ ____________________________________________________________ __________________________________________________
Luxembourg Aon Services Luxembourg & Co SCA, 6.250%, 01/07/14 EUR 100,000 102,991 107,260 0.01Belgelec Finance SA, 5.125%, 24/06/15 EUR 600,000 651,711 657,624 0.08Ciba Specialty Chemicals Finance Luxembourg SA, 4.875%, 20/06/18 EUR 400,000 447,963 477,752 0.06Finmeccanica Finance SA, 8.125%, 03/12/13 EUR 350,000 363,320 370,559 0.05Finmeccanica Finance SA, 4.375%, 05/12/17 EUR 606,000 629,040 636,300 0.08Finmeccanica Finance SA, 5.750%, 12/12/18 EUR 300,000 323,705 329,076 0.04Finmeccanica Finance SA, 5.250%, 21/01/22 EUR 400,000 383,149 409,000 0.05Glencore Finance Europe SA, 7.125%, 23/04/15 EUR 250,000 253,321 282,500 0.04Glencore Finance Europe SA, 5.250%, 22/03/17 EUR 800,000 849,285 897,600 0.11Glencore Finance Europe SA, 4.125%, 03/04/18 EUR 800,000 826,309 864,000 0.11Hannover Finance Luxembourg SA, 5.750%, 26/02/24 EUR 700,000 713,788 728,000 0.09Hannover Finance Luxembourg SA, 5.750%, 14/09/40 EUR 250,000 247,872 287,208 0.04Hannover Finance Luxembourg SA, 5.000%, 30/06/43 EUR 100,000 99,779 109,260 0.01Hannover Finance Luxembourg SA, 5.000%, perpetual EUR 200,000 174,574 205,000 0.03Holcim Finance Luxembourg SA, 9.000%, 26/03/14 EUR 400,000 427,881 438,700 0.06Holcim US Finance Sarl & Cie SCS, 2.625%, 07/09/20 EUR 600,000 604,740 608,592 0.08ITW Finance Europe SA, 5.250%, 01/10/14 EUR 300,000 315,528 324,186 0.04John Deere Bank SA, 3.250%, 22/06/16 EUR 400,000 433,433 432,636 0.06Michelin Luxembourg SCS, 8.625%, 24/04/14 EUR 650,000 707,320 716,202 0.09Michelin Luxembourg SCS, 2.750%, 20/06/19 EUR 200,000 201,858 210,794 0.03Nestle Finance International Ltd, 0.750%, 17/10/16 EUR 500,000 502,858 502,705 0.06Nestle Finance International Ltd, 1.500%, 19/07/19 EUR 100,000 99,600 101,603 0.01Nestle Finance International Ltd, 1.750%, 12/09/22 EUR 700,000 690,411 692,699 0.09Novartis Finance SA, 4.250%, 15/06/16 EUR 950,000 1,039,290 1,064,874 0.14Prologis International Funding SA, 5.875%, 23/10/14 EUR 200,000 213,969 213,620 0.03SES SA, 4.625%, 09/03/20 EUR 400,000 428,172 467,852 0.06SES SA, 4.750%, 11/03/21 EUR 200,000 199,158 236,170 0.03Talanx Finanz Luxembourg SA, 8.367%, 15/06/42 EUR 300,000 304,425 365,250 0.05Telecom Italia Finance SA, 7.750%, 24/01/33 EUR 375,000 404,282 431,381 0.05
Total Luxembourg 12,639,732 13,168,403 1.68 _______________________________________________ ____________________________________________________________ __________________________________________________
Mexico America Movil SAB de CV, 3.750%, 28/06/17 EUR 450,000 472,392 499,950 0.06America Movil SAB de CV, 4.125%, 25/10/19 EUR 550,000 579,023 632,335 0.08America Movil SAB de CV, 3.000%, 12/07/21 EUR 1,000,000 1,042,736 1,051,600 0.13America Movil SAB de CV, 4.750%, 28/06/22 EUR 300,000 308,810 358,962 0.05
Total Mexico 2,402,961 2,542,847 0.32 _______________________________________________ ____________________________________________________________ __________________________________________________
Netherlands ABB Finance BV, 2.625%, 26/03/19 EUR 600,000 603,743 635,970 0.08
31
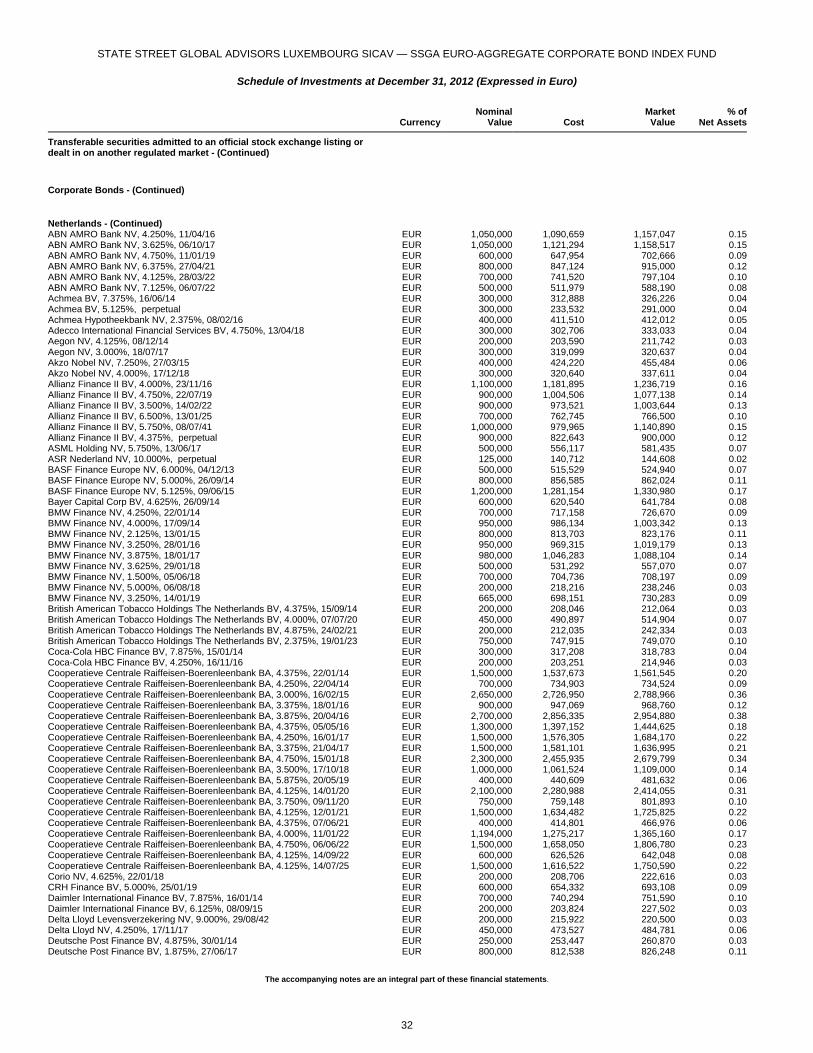
STATE STREET GLOBAL ADVISORS LUXEMBOURG SICAV — SSGA EURO-AGGREGATE CORPORATE BOND INDEX FUND
Schedule of Investments at December 31, 2012 (Expressed in Euro)
The accompanying notes are an integral part of these financial statements.
Currency
NominalValue Cost
MarketValue
% ofNet Assets
Transferable securities admitted to an official stock exchange listing or dealt in on another regulated market - (Continued)
Corporate Bonds - (Continued)
Netherlands - (Continued) ABN AMRO Bank NV, 4.250%, 11/04/16 EUR 1,050,000 1,090,659 1,157,047 0.15ABN AMRO Bank NV, 3.625%, 06/10/17 EUR 1,050,000 1,121,294 1,158,517 0.15ABN AMRO Bank NV, 4.750%, 11/01/19 EUR 600,000 647,954 702,666 0.09ABN AMRO Bank NV, 6.375%, 27/04/21 EUR 800,000 847,124 915,000 0.12ABN AMRO Bank NV, 4.125%, 28/03/22 EUR 700,000 741,520 797,104 0.10ABN AMRO Bank NV, 7.125%, 06/07/22 EUR 500,000 511,979 588,190 0.08Achmea BV, 7.375%, 16/06/14 EUR 300,000 312,888 326,226 0.04Achmea BV, 5.125%, perpetual EUR 300,000 233,532 291,000 0.04Achmea Hypotheekbank NV, 2.375%, 08/02/16 EUR 400,000 411,510 412,012 0.05Adecco International Financial Services BV, 4.750%, 13/04/18 EUR 300,000 302,706 333,033 0.04Aegon NV, 4.125%, 08/12/14 EUR 200,000 203,590 211,742 0.03Aegon NV, 3.000%, 18/07/17 EUR 300,000 319,099 320,637 0.04Akzo Nobel NV, 7.250%, 27/03/15 EUR 400,000 424,220 455,484 0.06Akzo Nobel NV, 4.000%, 17/12/18 EUR 300,000 320,640 337,611 0.04Allianz Finance II BV, 4.000%, 23/11/16 EUR 1,100,000 1,181,895 1,236,719 0.16Allianz Finance II BV, 4.750%, 22/07/19 EUR 900,000 1,004,506 1,077,138 0.14Allianz Finance II BV, 3.500%, 14/02/22 EUR 900,000 973,521 1,003,644 0.13Allianz Finance II BV, 6.500%, 13/01/25 EUR 700,000 762,745 766,500 0.10Allianz Finance II BV, 5.750%, 08/07/41 EUR 1,000,000 979,965 1,140,890 0.15Allianz Finance II BV, 4.375%, perpetual EUR 900,000 822,643 900,000 0.12ASML Holding NV, 5.750%, 13/06/17 EUR 500,000 556,117 581,435 0.07ASR Nederland NV, 10.000%, perpetual EUR 125,000 140,712 144,608 0.02BASF Finance Europe NV, 6.000%, 04/12/13 EUR 500,000 515,529 524,940 0.07BASF Finance Europe NV, 5.000%, 26/09/14 EUR 800,000 856,585 862,024 0.11BASF Finance Europe NV, 5.125%, 09/06/15 EUR 1,200,000 1,281,154 1,330,980 0.17Bayer Capital Corp BV, 4.625%, 26/09/14 EUR 600,000 620,540 641,784 0.08BMW Finance NV, 4.250%, 22/01/14 EUR 700,000 717,158 726,670 0.09BMW Finance NV, 4.000%, 17/09/14 EUR 950,000 986,134 1,003,342 0.13BMW Finance NV, 2.125%, 13/01/15 EUR 800,000 813,703 823,176 0.11BMW Finance NV, 3.250%, 28/01/16 EUR 950,000 969,315 1,019,179 0.13BMW Finance NV, 3.875%, 18/01/17 EUR 980,000 1,046,283 1,088,104 0.14BMW Finance NV, 3.625%, 29/01/18 EUR 500,000 531,292 557,070 0.07BMW Finance NV, 1.500%, 05/06/18 EUR 700,000 704,736 708,197 0.09BMW Finance NV, 5.000%, 06/08/18 EUR 200,000 218,216 238,246 0.03BMW Finance NV, 3.250%, 14/01/19 EUR 665,000 698,151 730,283 0.09British American Tobacco Holdings The Netherlands BV, 4.375%, 15/09/14 EUR 200,000 208,046 212,064 0.03British American Tobacco Holdings The Netherlands BV, 4.000%, 07/07/20 EUR 450,000 490,897 514,904 0.07British American Tobacco Holdings The Netherlands BV, 4.875%, 24/02/21 EUR 200,000 212,035 242,334 0.03British American Tobacco Holdings The Netherlands BV, 2.375%, 19/01/23 EUR 750,000 747,915 749,070 0.10Coca-Cola HBC Finance BV, 7.875%, 15/01/14 EUR 300,000 317,208 318,783 0.04Coca-Cola HBC Finance BV, 4.250%, 16/11/16 EUR 200,000 203,251 214,946 0.03Cooperatieve Centrale Raiffeisen-Boerenleenbank BA, 4.375%, 22/01/14 EUR 1,500,000 1,537,673 1,561,545 0.20Cooperatieve Centrale Raiffeisen-Boerenleenbank BA, 4.250%, 22/04/14 EUR 700,000 734,903 734,524 0.09Cooperatieve Centrale Raiffeisen-Boerenleenbank BA, 3.000%, 16/02/15 EUR 2,650,000 2,726,950 2,788,966 0.36Cooperatieve Centrale Raiffeisen-Boerenleenbank BA, 3.375%, 18/01/16 EUR 900,000 947,069 968,760 0.12Cooperatieve Centrale Raiffeisen-Boerenleenbank BA, 3.875%, 20/04/16 EUR 2,700,000 2,856,335 2,954,880 0.38Cooperatieve Centrale Raiffeisen-Boerenleenbank BA, 4.375%, 05/05/16 EUR 1,300,000 1,397,152 1,444,625 0.18Cooperatieve Centrale Raiffeisen-Boerenleenbank BA, 4.250%, 16/01/17 EUR 1,500,000 1,576,305 1,684,170 0.22Cooperatieve Centrale Raiffeisen-Boerenleenbank BA, 3.375%, 21/04/17 EUR 1,500,000 1,581,101 1,636,995 0.21Cooperatieve Centrale Raiffeisen-Boerenleenbank BA, 4.750%, 15/01/18 EUR 2,300,000 2,455,935 2,679,799 0.34Cooperatieve Centrale Raiffeisen-Boerenleenbank BA, 3.500%, 17/10/18 EUR 1,000,000 1,061,524 1,109,000 0.14Cooperatieve Centrale Raiffeisen-Boerenleenbank BA, 5.875%, 20/05/19 EUR 400,000 440,609 481,632 0.06Cooperatieve Centrale Raiffeisen-Boerenleenbank BA, 4.125%, 14/01/20 EUR 2,100,000 2,280,988 2,414,055 0.31Cooperatieve Centrale Raiffeisen-Boerenleenbank BA, 3.750%, 09/11/20 EUR 750,000 759,148 801,893 0.10Cooperatieve Centrale Raiffeisen-Boerenleenbank BA, 4.125%, 12/01/21 EUR 1,500,000 1,634,482 1,725,825 0.22Cooperatieve Centrale Raiffeisen-Boerenleenbank BA, 4.375%, 07/06/21 EUR 400,000 414,801 466,976 0.06Cooperatieve Centrale Raiffeisen-Boerenleenbank BA, 4.000%, 11/01/22 EUR 1,194,000 1,275,217 1,365,160 0.17Cooperatieve Centrale Raiffeisen-Boerenleenbank BA, 4.750%, 06/06/22 EUR 1,500,000 1,658,050 1,806,780 0.23Cooperatieve Centrale Raiffeisen-Boerenleenbank BA, 4.125%, 14/09/22 EUR 600,000 626,526 642,048 0.08Cooperatieve Centrale Raiffeisen-Boerenleenbank BA, 4.125%, 14/07/25 EUR 1,500,000 1,616,522 1,750,590 0.22Corio NV, 4.625%, 22/01/18 EUR 200,000 208,706 222,616 0.03CRH Finance BV, 5.000%, 25/01/19 EUR 600,000 654,332 693,108 0.09Daimler International Finance BV, 7.875%, 16/01/14 EUR 700,000 740,294 751,590 0.10Daimler International Finance BV, 6.125%, 08/09/15 EUR 200,000 203,824 227,502 0.03Delta Lloyd Levensverzekering NV, 9.000%, 29/08/42 EUR 200,000 215,922 220,500 0.03Delta Lloyd NV, 4.250%, 17/11/17 EUR 450,000 473,527 484,781 0.06Deutsche Post Finance BV, 4.875%, 30/01/14 EUR 250,000 253,447 260,870 0.03Deutsche Post Finance BV, 1.875%, 27/06/17 EUR 800,000 812,538 826,248 0.11
32
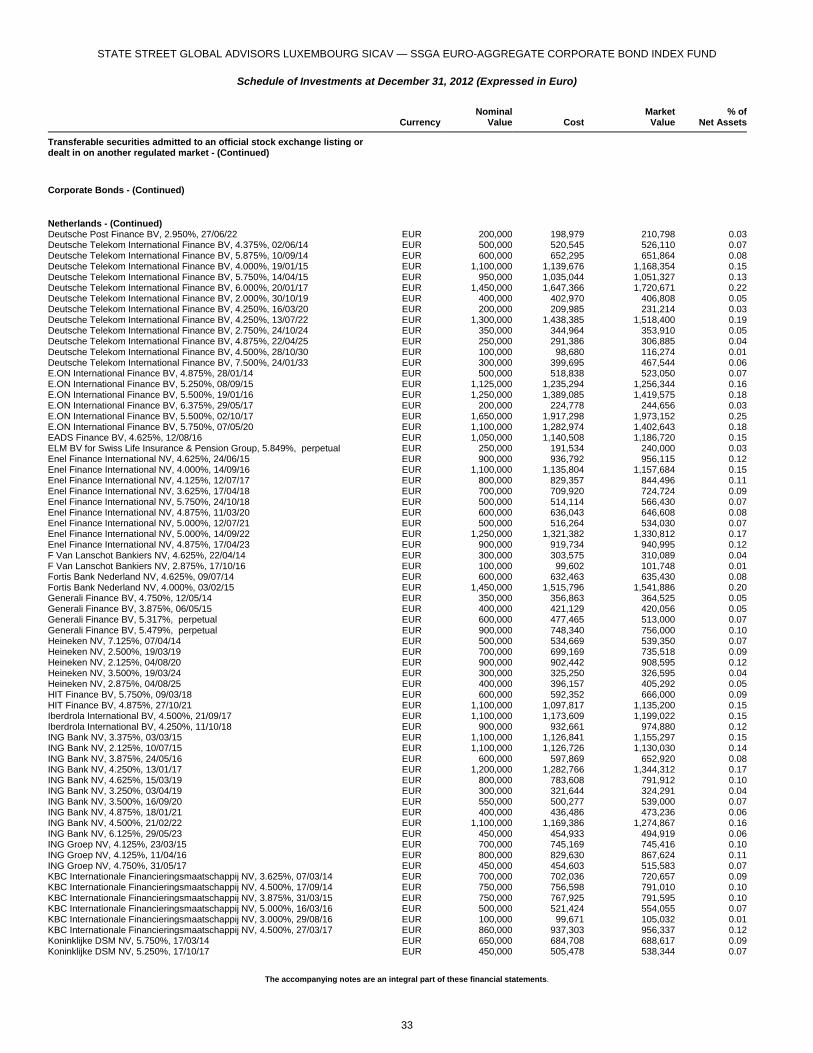
STATE STREET GLOBAL ADVISORS LUXEMBOURG SICAV — SSGA EURO-AGGREGATE CORPORATE BOND INDEX FUND
Schedule of Investments at December 31, 2012 (Expressed in Euro)
The accompanying notes are an integral part of these financial statements.
Currency
NominalValue Cost
MarketValue
% ofNet Assets
Transferable securities admitted to an official stock exchange listing or dealt in on another regulated market - (Continued)
Corporate Bonds - (Continued)
Netherlands - (Continued) Deutsche Post Finance BV, 2.950%, 27/06/22 EUR 200,000 198,979 210,798 0.03Deutsche Telekom International Finance BV, 4.375%, 02/06/14 EUR 500,000 520,545 526,110 0.07Deutsche Telekom International Finance BV, 5.875%, 10/09/14 EUR 600,000 652,295 651,864 0.08Deutsche Telekom International Finance BV, 4.000%, 19/01/15 EUR 1,100,000 1,139,676 1,168,354 0.15Deutsche Telekom International Finance BV, 5.750%, 14/04/15 EUR 950,000 1,035,044 1,051,327 0.13Deutsche Telekom International Finance BV, 6.000%, 20/01/17 EUR 1,450,000 1,647,366 1,720,671 0.22Deutsche Telekom International Finance BV, 2.000%, 30/10/19 EUR 400,000 402,970 406,808 0.05Deutsche Telekom International Finance BV, 4.250%, 16/03/20 EUR 200,000 209,985 231,214 0.03Deutsche Telekom International Finance BV, 4.250%, 13/07/22 EUR 1,300,000 1,438,385 1,518,400 0.19Deutsche Telekom International Finance BV, 2.750%, 24/10/24 EUR 350,000 344,964 353,910 0.05Deutsche Telekom International Finance BV, 4.875%, 22/04/25 EUR 250,000 291,386 306,885 0.04Deutsche Telekom International Finance BV, 4.500%, 28/10/30 EUR 100,000 98,680 116,274 0.01Deutsche Telekom International Finance BV, 7.500%, 24/01/33 EUR 300,000 399,695 467,544 0.06E.ON International Finance BV, 4.875%, 28/01/14 EUR 500,000 518,838 523,050 0.07E.ON International Finance BV, 5.250%, 08/09/15 EUR 1,125,000 1,235,294 1,256,344 0.16E.ON International Finance BV, 5.500%, 19/01/16 EUR 1,250,000 1,389,085 1,419,575 0.18E.ON International Finance BV, 6.375%, 29/05/17 EUR 200,000 224,778 244,656 0.03E.ON International Finance BV, 5.500%, 02/10/17 EUR 1,650,000 1,917,298 1,973,152 0.25E.ON International Finance BV, 5.750%, 07/05/20 EUR 1,100,000 1,282,974 1,402,643 0.18EADS Finance BV, 4.625%, 12/08/16 EUR 1,050,000 1,140,508 1,186,720 0.15ELM BV for Swiss Life Insurance & Pension Group, 5.849%, perpetual EUR 250,000 191,534 240,000 0.03Enel Finance International NV, 4.625%, 24/06/15 EUR 900,000 936,792 956,115 0.12Enel Finance International NV, 4.000%, 14/09/16 EUR 1,100,000 1,135,804 1,157,684 0.15Enel Finance International NV, 4.125%, 12/07/17 EUR 800,000 829,357 844,496 0.11Enel Finance International NV, 3.625%, 17/04/18 EUR 700,000 709,920 724,724 0.09Enel Finance International NV, 5.750%, 24/10/18 EUR 500,000 514,114 566,430 0.07Enel Finance International NV, 4.875%, 11/03/20 EUR 600,000 636,043 646,608 0.08Enel Finance International NV, 5.000%, 12/07/21 EUR 500,000 516,264 534,030 0.07Enel Finance International NV, 5.000%, 14/09/22 EUR 1,250,000 1,321,382 1,330,812 0.17Enel Finance International NV, 4.875%, 17/04/23 EUR 900,000 919,734 940,995 0.12F Van Lanschot Bankiers NV, 4.625%, 22/04/14 EUR 300,000 303,575 310,089 0.04F Van Lanschot Bankiers NV, 2.875%, 17/10/16 EUR 100,000 99,602 101,748 0.01Fortis Bank Nederland NV, 4.625%, 09/07/14 EUR 600,000 632,463 635,430 0.08Fortis Bank Nederland NV, 4.000%, 03/02/15 EUR 1,450,000 1,515,796 1,541,886 0.20Generali Finance BV, 4.750%, 12/05/14 EUR 350,000 356,863 364,525 0.05Generali Finance BV, 3.875%, 06/05/15 EUR 400,000 421,129 420,056 0.05Generali Finance BV, 5.317%, perpetual EUR 600,000 477,465 513,000 0.07Generali Finance BV, 5.479%, perpetual EUR 900,000 748,340 756,000 0.10Heineken NV, 7.125%, 07/04/14 EUR 500,000 534,669 539,350 0.07Heineken NV, 2.500%, 19/03/19 EUR 700,000 699,169 735,518 0.09Heineken NV, 2.125%, 04/08/20 EUR 900,000 902,442 908,595 0.12Heineken NV, 3.500%, 19/03/24 EUR 300,000 325,250 326,595 0.04Heineken NV, 2.875%, 04/08/25 EUR 400,000 396,157 405,292 0.05HIT Finance BV, 5.750%, 09/03/18 EUR 600,000 592,352 666,000 0.09HIT Finance BV, 4.875%, 27/10/21 EUR 1,100,000 1,097,817 1,135,200 0.15Iberdrola International BV, 4.500%, 21/09/17 EUR 1,100,000 1,173,609 1,199,022 0.15Iberdrola International BV, 4.250%, 11/10/18 EUR 900,000 932,661 974,880 0.12ING Bank NV, 3.375%, 03/03/15 EUR 1,100,000 1,126,841 1,155,297 0.15ING Bank NV, 2.125%, 10/07/15 EUR 1,100,000 1,126,726 1,130,030 0.14ING Bank NV, 3.875%, 24/05/16 EUR 600,000 597,869 652,920 0.08ING Bank NV, 4.250%, 13/01/17 EUR 1,200,000 1,282,766 1,344,312 0.17ING Bank NV, 4.625%, 15/03/19 EUR 800,000 783,608 791,912 0.10ING Bank NV, 3.250%, 03/04/19 EUR 300,000 321,644 324,291 0.04ING Bank NV, 3.500%, 16/09/20 EUR 550,000 500,277 539,000 0.07ING Bank NV, 4.875%, 18/01/21 EUR 400,000 436,486 473,236 0.06ING Bank NV, 4.500%, 21/02/22 EUR 1,100,000 1,169,386 1,274,867 0.16ING Bank NV, 6.125%, 29/05/23 EUR 450,000 454,933 494,919 0.06ING Groep NV, 4.125%, 23/03/15 EUR 700,000 745,169 745,416 0.10ING Groep NV, 4.125%, 11/04/16 EUR 800,000 829,630 867,624 0.11ING Groep NV, 4.750%, 31/05/17 EUR 450,000 454,603 515,583 0.07KBC Internationale Financieringsmaatschappij NV, 3.625%, 07/03/14 EUR 700,000 702,036 720,657 0.09KBC Internationale Financieringsmaatschappij NV, 4.500%, 17/09/14 EUR 750,000 756,598 791,010 0.10KBC Internationale Financieringsmaatschappij NV, 3.875%, 31/03/15 EUR 750,000 767,925 791,595 0.10KBC Internationale Financieringsmaatschappij NV, 5.000%, 16/03/16 EUR 500,000 521,424 554,055 0.07KBC Internationale Financieringsmaatschappij NV, 3.000%, 29/08/16 EUR 100,000 99,671 105,032 0.01KBC Internationale Financieringsmaatschappij NV, 4.500%, 27/03/17 EUR 860,000 937,303 956,337 0.12Koninklijke DSM NV, 5.750%, 17/03/14 EUR 650,000 684,708 688,617 0.09Koninklijke DSM NV, 5.250%, 17/10/17 EUR 450,000 505,478 538,344 0.07
33

STATE STREET GLOBAL ADVISORS LUXEMBOURG SICAV — SSGA EURO-AGGREGATE CORPORATE BOND INDEX FUND
Schedule of Investments at December 31, 2012 (Expressed in Euro)
The accompanying notes are an integral part of these financial statements.
Currency
NominalValue Cost
MarketValue
% ofNet Assets
Transferable securities admitted to an official stock exchange listing or dealt in on another regulated market - (Continued)
Corporate Bonds - (Continued)
Netherlands - (Continued) Koninklijke KPN NV, 6.250%, 04/02/14 EUR 300,000 316,377 316,755 0.04Koninklijke KPN NV, 4.000%, 22/06/15 EUR 1,100,000 1,152,387 1,170,851 0.15Koninklijke KPN NV, 6.500%, 15/01/16 EUR 500,000 557,572 571,060 0.07Koninklijke KPN NV, 4.750%, 17/01/17 EUR 500,000 500,972 554,390 0.07Koninklijke KPN NV, 7.500%, 04/02/19 EUR 350,000 418,815 445,774 0.06Koninklijke KPN NV, 3.750%, 21/09/20 EUR 600,000 619,787 633,186 0.08Koninklijke KPN NV, 3.250%, 01/02/21 EUR 800,000 810,650 798,360 0.10Koninklijke KPN NV, 4.500%, 04/10/21 EUR 100,000 99,506 108,553 0.01Koninklijke KPN NV, 4.250%, 01/03/22 EUR 500,000 528,895 531,780 0.07Koninklijke KPN NV, 5.625%, 30/09/24 EUR 500,000 559,906 579,375 0.07Lanxess Finance BV, 7.750%, 09/04/14 EUR 500,000 538,432 543,850 0.07Lanxess Finance BV, 4.125%, 23/05/18 EUR 300,000 319,476 339,993 0.04Lanxess Finance BV, 2.625%, 21/11/22 EUR 200,000 198,068 201,670 0.03LeasePlan Corp NV, 4.125%, 13/01/15 EUR 500,000 524,410 526,225 0.07LeasePlan Corp NV, 3.875%, 16/09/15 EUR 350,000 353,090 371,301 0.05LeasePlan Corp NV, 2.500%, 19/09/16 EUR 100,000 99,941 102,939 0.01Linde Finance BV, 6.750%, 08/12/15 EUR 400,000 445,936 470,620 0.06Linde Finance BV, 4.750%, 24/04/17 EUR 750,000 831,076 873,390 0.11Linde Finance BV, 3.125%, 12/12/18 EUR 200,000 211,044 221,142 0.03Linde Finance BV, 1.750%, 11/06/19 EUR 300,000 299,009 307,470 0.04Linde Finance BV, 3.875%, 01/06/21 EUR 200,000 212,644 231,940 0.03Linde Finance BV, 7.375%, perpetual EUR 300,000 326,957 351,450 0.04Metro Finance BV, 4.250%, 22/02/17 EUR 450,000 471,970 492,777 0.06Metro Finance BV, 2.250%, 11/05/18 EUR 150,000 149,240 153,117 0.02Nomura Europe Finance NV, 5.125%, 09/12/14 EUR 600,000 617,541 637,374 0.08PACCAR Financial Europe BV, 1.375%, 08/06/15 EUR 200,000 200,037 202,998 0.03PostNL NV, 5.375%, 14/11/17 EUR 400,000 424,708 454,120 0.06Repsol International Finance BV, 6.500%, 27/03/14 EUR 150,000 156,020 158,840 0.02Repsol International Finance BV, 6.500%, 27/03/14 EUR 200,000 209,358 211,786 0.03Repsol International Finance BV, 4.625%, 08/10/14 EUR 700,000 715,995 736,015 0.09Repsol International Finance BV, 4.250%, 12/02/16 EUR 500,000 515,015 532,685 0.07Repsol International Finance BV, 4.750%, 16/02/17 EUR 500,000 526,023 545,730 0.07Repsol International Finance BV, 4.375%, 20/02/18 EUR 500,000 529,106 537,775 0.07Repsol International Finance BV, 4.875%, 19/02/19 EUR 600,000 620,990 659,154 0.08Roche Finance Europe BV, 2.000%, 25/06/18 EUR 700,000 723,572 736,120 0.09Rodamco Europe Finance BV, 4.375%, 01/10/14 EUR 300,000 307,822 318,288 0.04RWE Finance BV, 5.000%, 10/02/15 EUR 400,000 415,467 435,200 0.06RWE Finance BV, 5.000%, 10/02/15 EUR 800,000 866,443 870,400 0.11RWE Finance BV, 6.250%, 20/04/16 EUR 700,000 785,330 819,532 0.10RWE Finance BV, 6.625%, 31/01/19 EUR 1,000,000 1,200,681 1,287,190 0.16RWE Finance BV, 6.500%, 10/08/21 EUR 900,000 1,162,805 1,211,607 0.15Schlumberger Finance BV, 4.500%, 25/03/14 EUR 500,000 513,503 523,575 0.07Schlumberger Finance BV, 2.750%, 01/12/15 EUR 400,000 407,775 424,432 0.05Shell International Finance BV, 4.500%, 09/02/16 EUR 900,000 969,791 1,008,225 0.13Shell International Finance BV, 4.625%, 22/05/17 EUR 500,000 531,918 581,020 0.07Shell International Finance BV, 4.375%, 14/05/18 EUR 1,450,000 1,641,466 1,700,270 0.22Siemens Financieringsmaatschappij NV, 5.375%, 11/06/14 EUR 900,000 947,468 962,505 0.12Siemens Financieringsmaatschappij NV, 0.375%, 10/09/14 EUR 400,000 400,448 400,168 0.05Siemens Financieringsmaatschappij NV, 5.125%, 20/02/17 EUR 1,300,000 1,481,784 1,523,990 0.19Siemens Financieringsmaatschappij NV, 5.625%, 11/06/18 EUR 450,000 501,134 554,805 0.07Siemens Financieringsmaatschappij NV, 1.500%, 10/03/20 EUR 800,000 795,060 795,272 0.10Siemens Financieringsmaatschappij NV, 5.250%, perpetual EUR 200,000 201,532 222,000 0.03SNS Bank NV, 4.625%, 18/02/14 EUR 400,000 404,867 410,396 0.05SNS Bank NV, 6.625%, 30/11/16 EUR 400,000 436,993 433,164 0.06Suedzucker International Finance BV, 4.125%, 29/03/18 EUR 300,000 341,828 342,177 0.04Swiss Reinsurance Co via ELM BV, 5.252%, perpetual EUR 500,000 453,826 510,000 0.07Syngenta Finance NV, 4.000%, 30/06/14 EUR 300,000 308,693 315,234 0.04Syngenta Finance NV, 4.125%, 22/04/15 EUR 100,000 102,193 108,029 0.01Telefonica Europe BV, 5.875%, 14/02/33 EUR 200,000 205,415 222,114 0.03ThyssenKrupp Finance Nederland BV, 8.500%, 25/02/16 EUR 900,000 1,030,768 1,048,500 0.13Unilever NV, 3.375%, 29/09/15 EUR 300,000 314,873 321,888 0.04Urenco Finance NV, 5.375%, 22/05/15 EUR 200,000 210,868 218,886 0.03Urenco Finance NV, 4.000%, 05/05/17 EUR 300,000 326,874 328,431 0.04Volkswagen International Finance NV, 2.125%, 19/01/15 EUR 1,400,000 1,424,085 1,437,128 0.18Volkswagen International Finance NV, 3.500%, 02/02/15 EUR 600,000 609,497 632,838 0.08Volkswagen International Finance NV, 7.000%, 09/02/16 EUR 900,000 1,037,078 1,064,178 0.14Volkswagen International Finance NV, 1.875%, 15/05/17 EUR 1,350,000 1,371,970 1,390,648 0.18Volkswagen International Finance NV, 5.375%, 22/05/18 EUR 350,000 359,718 421,456 0.05
34
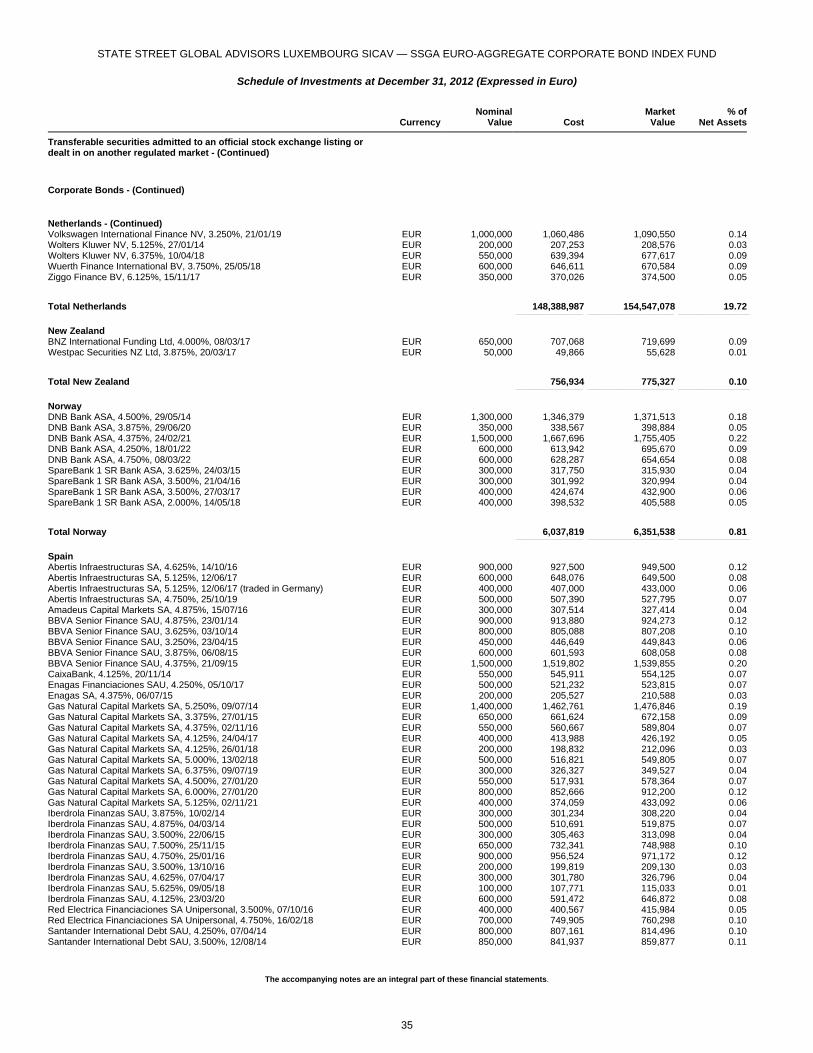
STATE STREET GLOBAL ADVISORS LUXEMBOURG SICAV — SSGA EURO-AGGREGATE CORPORATE BOND INDEX FUND
Schedule of Investments at December 31, 2012 (Expressed in Euro)
The accompanying notes are an integral part of these financial statements.
Currency
NominalValue Cost
MarketValue
% ofNet Assets
Transferable securities admitted to an official stock exchange listing or dealt in on another regulated market - (Continued)
Corporate Bonds - (Continued)
Netherlands - (Continued) Volkswagen International Finance NV, 3.250%, 21/01/19 EUR 1,000,000 1,060,486 1,090,550 0.14Wolters Kluwer NV, 5.125%, 27/01/14 EUR 200,000 207,253 208,576 0.03Wolters Kluwer NV, 6.375%, 10/04/18 EUR 550,000 639,394 677,617 0.09Wuerth Finance International BV, 3.750%, 25/05/18 EUR 600,000 646,611 670,584 0.09Ziggo Finance BV, 6.125%, 15/11/17 EUR 350,000 370,026 374,500 0.05
Total Netherlands 148,388,987 154,547,078 19.72 _______________________________________________ ____________________________________________________________ __________________________________________________
New Zealand BNZ International Funding Ltd, 4.000%, 08/03/17 EUR 650,000 707,068 719,699 0.09Westpac Securities NZ Ltd, 3.875%, 20/03/17 EUR 50,000 49,866 55,628 0.01
Total New Zealand 756,934 775,327 0.10 _______________________________________________ ____________________________________________________________ __________________________________________________
Norway DNB Bank ASA, 4.500%, 29/05/14 EUR 1,300,000 1,346,379 1,371,513 0.18DNB Bank ASA, 3.875%, 29/06/20 EUR 350,000 338,567 398,884 0.05DNB Bank ASA, 4.375%, 24/02/21 EUR 1,500,000 1,667,696 1,755,405 0.22DNB Bank ASA, 4.250%, 18/01/22 EUR 600,000 613,942 695,670 0.09DNB Bank ASA, 4.750%, 08/03/22 EUR 600,000 628,287 654,654 0.08SpareBank 1 SR Bank ASA, 3.625%, 24/03/15 EUR 300,000 317,750 315,930 0.04SpareBank 1 SR Bank ASA, 3.500%, 21/04/16 EUR 300,000 301,992 320,994 0.04SpareBank 1 SR Bank ASA, 3.500%, 27/03/17 EUR 400,000 424,674 432,900 0.06SpareBank 1 SR Bank ASA, 2.000%, 14/05/18 EUR 400,000 398,532 405,588 0.05
Total Norway 6,037,819 6,351,538 0.81 _______________________________________________ ____________________________________________________________ __________________________________________________
Spain Abertis Infraestructuras SA, 4.625%, 14/10/16 EUR 900,000 927,500 949,500 0.12Abertis Infraestructuras SA, 5.125%, 12/06/17 EUR 600,000 648,076 649,500 0.08Abertis Infraestructuras SA, 5.125%, 12/06/17 (traded in Germany) EUR 400,000 407,000 433,000 0.06Abertis Infraestructuras SA, 4.750%, 25/10/19 EUR 500,000 507,390 527,795 0.07Amadeus Capital Markets SA, 4.875%, 15/07/16 EUR 300,000 307,514 327,414 0.04BBVA Senior Finance SAU, 4.875%, 23/01/14 EUR 900,000 913,880 924,273 0.12BBVA Senior Finance SAU, 3.625%, 03/10/14 EUR 800,000 805,088 807,208 0.10BBVA Senior Finance SAU, 3.250%, 23/04/15 EUR 450,000 446,649 449,843 0.06BBVA Senior Finance SAU, 3.875%, 06/08/15 EUR 600,000 601,593 608,058 0.08BBVA Senior Finance SAU, 4.375%, 21/09/15 EUR 1,500,000 1,519,802 1,539,855 0.20CaixaBank, 4.125%, 20/11/14 EUR 550,000 545,911 554,125 0.07Enagas Financiaciones SAU, 4.250%, 05/10/17 EUR 500,000 521,232 523,815 0.07Enagas SA, 4.375%, 06/07/15 EUR 200,000 205,527 210,588 0.03Gas Natural Capital Markets SA, 5.250%, 09/07/14 EUR 1,400,000 1,462,761 1,476,846 0.19Gas Natural Capital Markets SA, 3.375%, 27/01/15 EUR 650,000 661,624 672,158 0.09Gas Natural Capital Markets SA, 4.375%, 02/11/16 EUR 550,000 560,667 589,804 0.07Gas Natural Capital Markets SA, 4.125%, 24/04/17 EUR 400,000 413,988 426,192 0.05Gas Natural Capital Markets SA, 4.125%, 26/01/18 EUR 200,000 198,832 212,096 0.03Gas Natural Capital Markets SA, 5.000%, 13/02/18 EUR 500,000 516,821 549,805 0.07Gas Natural Capital Markets SA, 6.375%, 09/07/19 EUR 300,000 326,327 349,527 0.04Gas Natural Capital Markets SA, 4.500%, 27/01/20 EUR 550,000 517,931 578,364 0.07Gas Natural Capital Markets SA, 6.000%, 27/01/20 EUR 800,000 852,666 912,200 0.12Gas Natural Capital Markets SA, 5.125%, 02/11/21 EUR 400,000 374,059 433,092 0.06Iberdrola Finanzas SAU, 3.875%, 10/02/14 EUR 300,000 301,234 308,220 0.04Iberdrola Finanzas SAU, 4.875%, 04/03/14 EUR 500,000 510,691 519,875 0.07Iberdrola Finanzas SAU, 3.500%, 22/06/15 EUR 300,000 305,463 313,098 0.04Iberdrola Finanzas SAU, 7.500%, 25/11/15 EUR 650,000 732,341 748,988 0.10Iberdrola Finanzas SAU, 4.750%, 25/01/16 EUR 900,000 956,524 971,172 0.12Iberdrola Finanzas SAU, 3.500%, 13/10/16 EUR 200,000 199,819 209,130 0.03Iberdrola Finanzas SAU, 4.625%, 07/04/17 EUR 300,000 301,780 326,796 0.04Iberdrola Finanzas SAU, 5.625%, 09/05/18 EUR 100,000 107,771 115,033 0.01Iberdrola Finanzas SAU, 4.125%, 23/03/20 EUR 600,000 591,472 646,872 0.08Red Electrica Financiaciones SA Unipersonal, 3.500%, 07/10/16 EUR 400,000 400,567 415,984 0.05Red Electrica Financiaciones SA Unipersonal, 4.750%, 16/02/18 EUR 700,000 749,905 760,298 0.10Santander International Debt SAU, 4.250%, 07/04/14 EUR 800,000 807,161 814,496 0.10Santander International Debt SAU, 3.500%, 12/08/14 EUR 850,000 841,937 859,877 0.11
35
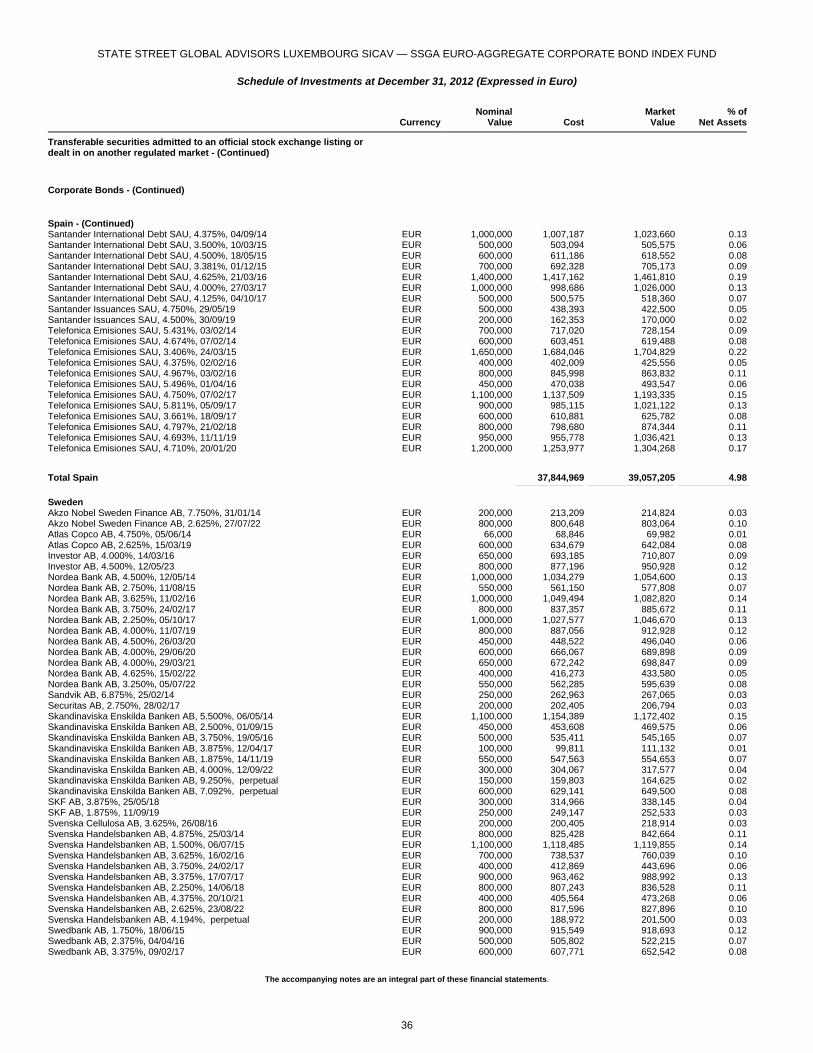
STATE STREET GLOBAL ADVISORS LUXEMBOURG SICAV — SSGA EURO-AGGREGATE CORPORATE BOND INDEX FUND
Schedule of Investments at December 31, 2012 (Expressed in Euro)
The accompanying notes are an integral part of these financial statements.
Currency
NominalValue Cost
MarketValue
% ofNet Assets
Transferable securities admitted to an official stock exchange listing or dealt in on another regulated market - (Continued)
Corporate Bonds - (Continued)
Spain - (Continued) Santander International Debt SAU, 4.375%, 04/09/14 EUR 1,000,000 1,007,187 1,023,660 0.13Santander International Debt SAU, 3.500%, 10/03/15 EUR 500,000 503,094 505,575 0.06Santander International Debt SAU, 4.500%, 18/05/15 EUR 600,000 611,186 618,552 0.08Santander International Debt SAU, 3.381%, 01/12/15 EUR 700,000 692,328 705,173 0.09Santander International Debt SAU, 4.625%, 21/03/16 EUR 1,400,000 1,417,162 1,461,810 0.19Santander International Debt SAU, 4.000%, 27/03/17 EUR 1,000,000 998,686 1,026,000 0.13Santander International Debt SAU, 4.125%, 04/10/17 EUR 500,000 500,575 518,360 0.07Santander Issuances SAU, 4.750%, 29/05/19 EUR 500,000 438,393 422,500 0.05Santander Issuances SAU, 4.500%, 30/09/19 EUR 200,000 162,353 170,000 0.02Telefonica Emisiones SAU, 5.431%, 03/02/14 EUR 700,000 717,020 728,154 0.09Telefonica Emisiones SAU, 4.674%, 07/02/14 EUR 600,000 603,451 619,488 0.08Telefonica Emisiones SAU, 3.406%, 24/03/15 EUR 1,650,000 1,684,046 1,704,829 0.22Telefonica Emisiones SAU, 4.375%, 02/02/16 EUR 400,000 402,009 425,556 0.05Telefonica Emisiones SAU, 4.967%, 03/02/16 EUR 800,000 845,998 863,832 0.11Telefonica Emisiones SAU, 5.496%, 01/04/16 EUR 450,000 470,038 493,547 0.06Telefonica Emisiones SAU, 4.750%, 07/02/17 EUR 1,100,000 1,137,509 1,193,335 0.15Telefonica Emisiones SAU, 5.811%, 05/09/17 EUR 900,000 985,115 1,021,122 0.13Telefonica Emisiones SAU, 3.661%, 18/09/17 EUR 600,000 610,881 625,782 0.08Telefonica Emisiones SAU, 4.797%, 21/02/18 EUR 800,000 798,680 874,344 0.11Telefonica Emisiones SAU, 4.693%, 11/11/19 EUR 950,000 955,778 1,036,421 0.13Telefonica Emisiones SAU, 4.710%, 20/01/20 EUR 1,200,000 1,253,977 1,304,268 0.17
Total Spain 37,844,969 39,057,205 4.98 _______________________________________________ ____________________________________________________________ __________________________________________________
Sweden Akzo Nobel Sweden Finance AB, 7.750%, 31/01/14 EUR 200,000 213,209 214,824 0.03Akzo Nobel Sweden Finance AB, 2.625%, 27/07/22 EUR 800,000 800,648 803,064 0.10Atlas Copco AB, 4.750%, 05/06/14 EUR 66,000 68,846 69,982 0.01Atlas Copco AB, 2.625%, 15/03/19 EUR 600,000 634,679 642,084 0.08Investor AB, 4.000%, 14/03/16 EUR 650,000 693,185 710,807 0.09Investor AB, 4.500%, 12/05/23 EUR 800,000 877,196 950,928 0.12Nordea Bank AB, 4.500%, 12/05/14 EUR 1,000,000 1,034,279 1,054,600 0.13Nordea Bank AB, 2.750%, 11/08/15 EUR 550,000 561,150 577,808 0.07Nordea Bank AB, 3.625%, 11/02/16 EUR 1,000,000 1,049,494 1,082,820 0.14Nordea Bank AB, 3.750%, 24/02/17 EUR 800,000 837,357 885,672 0.11Nordea Bank AB, 2.250%, 05/10/17 EUR 1,000,000 1,027,577 1,046,670 0.13Nordea Bank AB, 4.000%, 11/07/19 EUR 800,000 887,056 912,928 0.12Nordea Bank AB, 4.500%, 26/03/20 EUR 450,000 448,522 496,040 0.06Nordea Bank AB, 4.000%, 29/06/20 EUR 600,000 666,067 689,898 0.09Nordea Bank AB, 4.000%, 29/03/21 EUR 650,000 672,242 698,847 0.09Nordea Bank AB, 4.625%, 15/02/22 EUR 400,000 416,273 433,580 0.05Nordea Bank AB, 3.250%, 05/07/22 EUR 550,000 562,285 595,639 0.08Sandvik AB, 6.875%, 25/02/14 EUR 250,000 262,963 267,065 0.03Securitas AB, 2.750%, 28/02/17 EUR 200,000 202,405 206,794 0.03Skandinaviska Enskilda Banken AB, 5.500%, 06/05/14 EUR 1,100,000 1,154,389 1,172,402 0.15Skandinaviska Enskilda Banken AB, 2.500%, 01/09/15 EUR 450,000 453,608 469,575 0.06Skandinaviska Enskilda Banken AB, 3.750%, 19/05/16 EUR 500,000 535,411 545,165 0.07Skandinaviska Enskilda Banken AB, 3.875%, 12/04/17 EUR 100,000 99,811 111,132 0.01Skandinaviska Enskilda Banken AB, 1.875%, 14/11/19 EUR 550,000 547,563 554,653 0.07Skandinaviska Enskilda Banken AB, 4.000%, 12/09/22 EUR 300,000 304,067 317,577 0.04Skandinaviska Enskilda Banken AB, 9.250%, perpetual EUR 150,000 159,803 164,625 0.02Skandinaviska Enskilda Banken AB, 7.092%, perpetual EUR 600,000 629,141 649,500 0.08SKF AB, 3.875%, 25/05/18 EUR 300,000 314,966 338,145 0.04SKF AB, 1.875%, 11/09/19 EUR 250,000 249,147 252,533 0.03Svenska Cellulosa AB, 3.625%, 26/08/16 EUR 200,000 200,405 218,914 0.03Svenska Handelsbanken AB, 4.875%, 25/03/14 EUR 800,000 825,428 842,664 0.11Svenska Handelsbanken AB, 1.500%, 06/07/15 EUR 1,100,000 1,118,485 1,119,855 0.14Svenska Handelsbanken AB, 3.625%, 16/02/16 EUR 700,000 738,537 760,039 0.10Svenska Handelsbanken AB, 3.750%, 24/02/17 EUR 400,000 412,869 443,696 0.06Svenska Handelsbanken AB, 3.375%, 17/07/17 EUR 900,000 963,462 988,992 0.13Svenska Handelsbanken AB, 2.250%, 14/06/18 EUR 800,000 807,243 836,528 0.11Svenska Handelsbanken AB, 4.375%, 20/10/21 EUR 400,000 405,564 473,268 0.06Svenska Handelsbanken AB, 2.625%, 23/08/22 EUR 800,000 817,596 827,896 0.10Svenska Handelsbanken AB, 4.194%, perpetual EUR 200,000 188,972 201,500 0.03Swedbank AB, 1.750%, 18/06/15 EUR 900,000 915,549 918,693 0.12Swedbank AB, 2.375%, 04/04/16 EUR 500,000 505,802 522,215 0.07Swedbank AB, 3.375%, 09/02/17 EUR 600,000 607,771 652,542 0.08
36

STATE STREET GLOBAL ADVISORS LUXEMBOURG SICAV — SSGA EURO-AGGREGATE CORPORATE BOND INDEX FUND
Schedule of Investments at December 31, 2012 (Expressed in Euro)
The accompanying notes are an integral part of these financial statements.
Currency
NominalValue Cost
MarketValue
% ofNet Assets
Transferable securities admitted to an official stock exchange listing or dealt in on another regulated market - (Continued)
Corporate Bonds - (Continued)
Sweden - (Continued) Swedbank AB, 3.000%, 05/12/22 EUR 200,000 199,964 202,838 0.03Swedish Match AB, 3.875%, 24/11/17 EUR 150,000 149,672 167,240 0.02Telefonaktiebolaget LM Ericsson, 5.375%, 27/06/17 EUR 200,000 229,002 231,038 0.03TeliaSonera AB, 5.125%, 13/03/14 EUR 200,000 205,831 210,772 0.03TeliaSonera AB, 4.125%, 11/05/15 EUR 700,000 735,966 755,398 0.10TeliaSonera AB, 4.750%, 07/03/17 EUR 550,000 607,137 635,558 0.08TeliaSonera AB, 4.250%, 18/02/20 EUR 600,000 683,033 702,822 0.09TeliaSonera AB, 4.750%, 16/11/21 EUR 450,000 493,422 547,852 0.07TeliaSonera AB, 4.000%, 22/03/22 EUR 100,000 99,031 114,977 0.01TeliaSonera AB, 3.625%, 14/02/24 EUR 800,000 844,945 886,512 0.11TeliaSonera AB, 3.000%, 07/09/27 EUR 450,000 461,683 461,853 0.06Volvo Treasury AB, 9.875%, 27/02/14 EUR 400,000 434,192 439,848 0.06Volvo Treasury AB, 5.000%, 31/05/17 EUR 1,000,000 1,079,605 1,143,840 0.15
Total Sweden 31,094,505 32,222,707 4.11 _______________________________________________ ____________________________________________________________ __________________________________________________
Switzerland Credit Suisse AG, 6.125%, 16/05/14 EUR 600,000 629,681 644,142 0.08Credit Suisse AG, 2.875%, 24/09/15 EUR 1,200,000 1,241,042 1,262,616 0.16Credit Suisse AG, 3.875%, 25/01/17 EUR 1,600,000 1,704,905 1,775,952 0.23Credit Suisse AG, 5.125%, 18/09/17 EUR 1,100,000 1,199,314 1,295,547 0.17Credit Suisse AG, 4.750%, 05/08/19 EUR 1,400,000 1,532,090 1,662,570 0.21UBS AG, 5.625%, 19/05/14 EUR 600,000 605,617 639,822 0.08UBS AG, 3.500%, 15/07/15 EUR 1,600,000 1,672,236 1,706,448 0.22UBS AG, 3.125%, 18/01/16 EUR 900,000 928,201 959,625 0.12UBS AG, 4.750%, 07/06/17 EUR 500,000 563,426 577,780 0.07UBS AG, 6.000%, 18/04/18 EUR 1,050,000 1,176,063 1,294,608 0.17UBS AG, 4.500%, 16/09/19 EUR 650,000 655,629 666,562 0.08
Total Switzerland 11,908,204 12,485,672 1.59 _______________________________________________ ____________________________________________________________ __________________________________________________
United Arab Emirates Xstrata Finance Dubai Ltd, 1.500%, 19/05/16 EUR 1,000,000 996,055 997,740 0.12Xstrata Finance Dubai Ltd, 2.375%, 19/11/18 EUR 605,000 601,173 606,694 0.08
Total United Arab Emirates 1,597,228 1,604,434 0.20 _______________________________________________ ____________________________________________________________ __________________________________________________
United Kingdom 3i Group PLC, 5.625%, 17/03/17 EUR 100,000 100,352 110,160 0.01Abbey National Treasury Services PLC, 4.125%, 03/03/14 EUR 700,000 705,461 724,759 0.09Abbey National Treasury Services PLC, 3.375%, 20/10/15 EUR 700,000 729,205 742,980 0.09Anglian Water Services Ltd, 6.250%, 27/06/16 EUR 300,000 339,638 354,990 0.05Anglo American Capital PLC, 5.875%, 17/04/15 EUR 700,000 761,404 775,194 0.10Anglo American Capital PLC, 4.375%, 02/12/16 EUR 200,000 204,295 221,976 0.03Anglo American Capital PLC, 2.500%, 18/09/18 EUR 600,000 607,633 614,100 0.08Anglo American Capital PLC, 2.750%, 07/06/19 EUR 400,000 399,572 411,016 0.05Anglo American Capital PLC, 3.500%, 28/03/22 EUR 400,000 403,546 421,528 0.05AstraZeneca PLC, 5.125%, 15/01/15 EUR 300,000 318,712 328,209 0.04Aviva PLC, 6.875%, 22/05/38 EUR 200,000 195,447 218,000 0.03Aviva PLC, 4.729%, perpetual EUR 550,000 493,821 530,750 0.07Aviva PLC, 5.700%, perpetual EUR 450,000 439,564 441,000 0.06Barclays Bank PLC, 5.250%, 27/05/14 EUR 1,300,000 1,355,814 1,380,925 0.18Barclays Bank PLC, 3.500%, 18/03/15 EUR 700,000 716,938 740,915 0.09Barclays Bank PLC, 4.125%, 15/03/16 EUR 900,000 958,964 987,705 0.13Barclays Bank PLC, 4.000%, 20/01/17 EUR 1,600,000 1,717,024 1,778,528 0.23Barclays Bank PLC, 6.000%, 23/01/18 EUR 1,200,000 1,285,008 1,361,952 0.17Barclays Bank PLC, 4.500%, 04/03/19 EUR 400,000 382,278 402,000 0.05Barclays Bank PLC, 4.875%, 13/08/19 EUR 1,000,000 1,050,043 1,192,430 0.15Barclays Bank PLC, 6.000%, 14/01/21 EUR 800,000 758,879 901,208 0.11Barclays Bank PLC, 6.625%, 30/03/22 EUR 800,000 886,742 940,520 0.12BAT International Finance PLC, 5.875%, 12/03/15 EUR 1,000,000 1,083,256 1,108,900 0.14BAT International Finance PLC, 5.375%, 29/06/17 EUR 500,000 544,789 590,845 0.08BAT International Finance PLC, 3.625%, 09/11/21 EUR 200,000 203,605 222,952 0.03BG Energy Capital PLC, 3.000%, 16/11/18 EUR 800,000 840,029 867,832 0.11BG Energy Capital PLC, 3.625%, 16/07/19 EUR 400,000 415,915 448,696 0.06
37
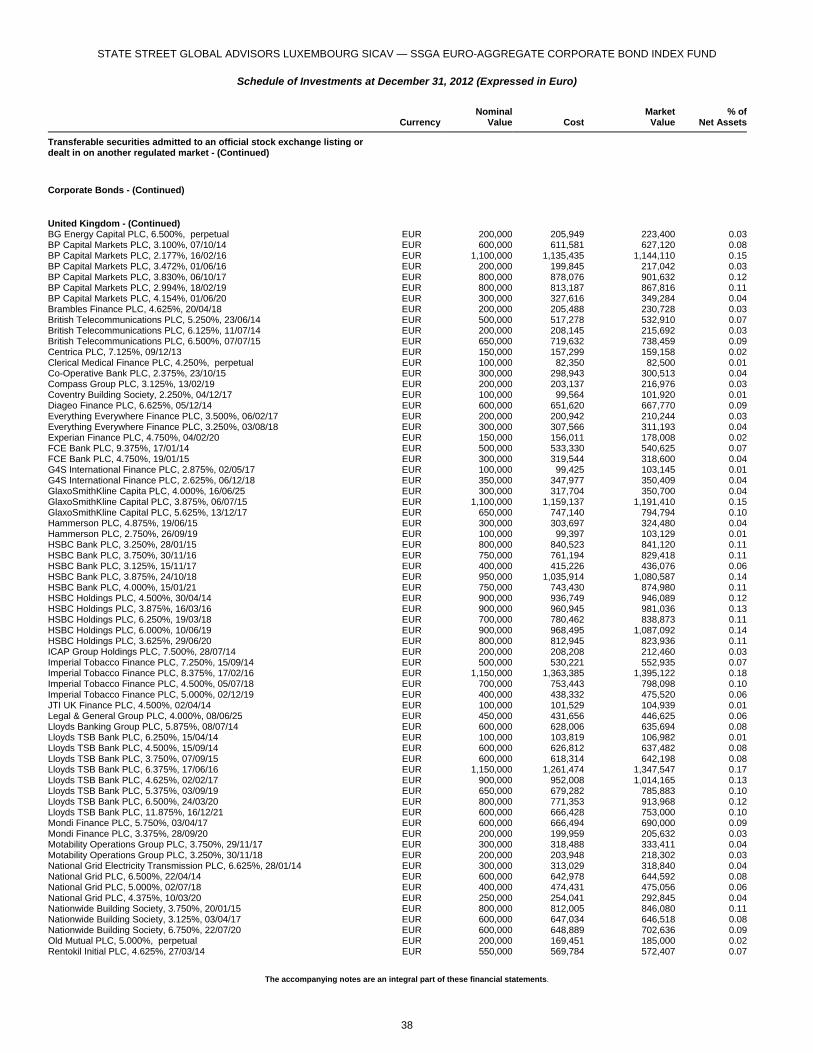
STATE STREET GLOBAL ADVISORS LUXEMBOURG SICAV — SSGA EURO-AGGREGATE CORPORATE BOND INDEX FUND
Schedule of Investments at December 31, 2012 (Expressed in Euro)
The accompanying notes are an integral part of these financial statements.
Currency
NominalValue Cost
MarketValue
% ofNet Assets
Transferable securities admitted to an official stock exchange listing or dealt in on another regulated market - (Continued)
Corporate Bonds - (Continued)
United Kingdom - (Continued) BG Energy Capital PLC, 6.500%, perpetual EUR 200,000 205,949 223,400 0.03BP Capital Markets PLC, 3.100%, 07/10/14 EUR 600,000 611,581 627,120 0.08BP Capital Markets PLC, 2.177%, 16/02/16 EUR 1,100,000 1,135,435 1,144,110 0.15BP Capital Markets PLC, 3.472%, 01/06/16 EUR 200,000 199,845 217,042 0.03BP Capital Markets PLC, 3.830%, 06/10/17 EUR 800,000 878,076 901,632 0.12BP Capital Markets PLC, 2.994%, 18/02/19 EUR 800,000 813,187 867,816 0.11BP Capital Markets PLC, 4.154%, 01/06/20 EUR 300,000 327,616 349,284 0.04Brambles Finance PLC, 4.625%, 20/04/18 EUR 200,000 205,488 230,728 0.03British Telecommunications PLC, 5.250%, 23/06/14 EUR 500,000 517,278 532,910 0.07British Telecommunications PLC, 6.125%, 11/07/14 EUR 200,000 208,145 215,692 0.03British Telecommunications PLC, 6.500%, 07/07/15 EUR 650,000 719,632 738,459 0.09Centrica PLC, 7.125%, 09/12/13 EUR 150,000 157,299 159,158 0.02Clerical Medical Finance PLC, 4.250%, perpetual EUR 100,000 82,350 82,500 0.01Co-Operative Bank PLC, 2.375%, 23/10/15 EUR 300,000 298,943 300,513 0.04Compass Group PLC, 3.125%, 13/02/19 EUR 200,000 203,137 216,976 0.03Coventry Building Society, 2.250%, 04/12/17 EUR 100,000 99,564 101,920 0.01Diageo Finance PLC, 6.625%, 05/12/14 EUR 600,000 651,620 667,770 0.09Everything Everywhere Finance PLC, 3.500%, 06/02/17 EUR 200,000 200,942 210,244 0.03Everything Everywhere Finance PLC, 3.250%, 03/08/18 EUR 300,000 307,566 311,193 0.04Experian Finance PLC, 4.750%, 04/02/20 EUR 150,000 156,011 178,008 0.02FCE Bank PLC, 9.375%, 17/01/14 EUR 500,000 533,330 540,625 0.07FCE Bank PLC, 4.750%, 19/01/15 EUR 300,000 319,544 318,600 0.04G4S International Finance PLC, 2.875%, 02/05/17 EUR 100,000 99,425 103,145 0.01G4S International Finance PLC, 2.625%, 06/12/18 EUR 350,000 347,977 350,409 0.04GlaxoSmithKline Capita PLC, 4.000%, 16/06/25 EUR 300,000 317,704 350,700 0.04GlaxoSmithKline Capital PLC, 3.875%, 06/07/15 EUR 1,100,000 1,159,137 1,191,410 0.15GlaxoSmithKline Capital PLC, 5.625%, 13/12/17 EUR 650,000 747,140 794,794 0.10Hammerson PLC, 4.875%, 19/06/15 EUR 300,000 303,697 324,480 0.04Hammerson PLC, 2.750%, 26/09/19 EUR 100,000 99,397 103,129 0.01HSBC Bank PLC, 3.250%, 28/01/15 EUR 800,000 840,523 841,120 0.11HSBC Bank PLC, 3.750%, 30/11/16 EUR 750,000 761,194 829,418 0.11HSBC Bank PLC, 3.125%, 15/11/17 EUR 400,000 415,226 436,076 0.06HSBC Bank PLC, 3.875%, 24/10/18 EUR 950,000 1,035,914 1,080,587 0.14HSBC Bank PLC, 4.000%, 15/01/21 EUR 750,000 743,430 874,980 0.11HSBC Holdings PLC, 4.500%, 30/04/14 EUR 900,000 936,749 946,089 0.12HSBC Holdings PLC, 3.875%, 16/03/16 EUR 900,000 960,945 981,036 0.13HSBC Holdings PLC, 6.250%, 19/03/18 EUR 700,000 780,462 838,873 0.11HSBC Holdings PLC, 6.000%, 10/06/19 EUR 900,000 968,495 1,087,092 0.14HSBC Holdings PLC, 3.625%, 29/06/20 EUR 800,000 812,945 823,936 0.11ICAP Group Holdings PLC, 7.500%, 28/07/14 EUR 200,000 208,208 212,460 0.03Imperial Tobacco Finance PLC, 7.250%, 15/09/14 EUR 500,000 530,221 552,935 0.07Imperial Tobacco Finance PLC, 8.375%, 17/02/16 EUR 1,150,000 1,363,385 1,395,122 0.18Imperial Tobacco Finance PLC, 4.500%, 05/07/18 EUR 700,000 753,443 798,098 0.10Imperial Tobacco Finance PLC, 5.000%, 02/12/19 EUR 400,000 438,332 475,520 0.06JTI UK Finance PLC, 4.500%, 02/04/14 EUR 100,000 101,529 104,939 0.01Legal & General Group PLC, 4.000%, 08/06/25 EUR 450,000 431,656 446,625 0.06Lloyds Banking Group PLC, 5.875%, 08/07/14 EUR 600,000 628,006 635,694 0.08Lloyds TSB Bank PLC, 6.250%, 15/04/14 EUR 100,000 103,819 106,982 0.01Lloyds TSB Bank PLC, 4.500%, 15/09/14 EUR 600,000 626,812 637,482 0.08Lloyds TSB Bank PLC, 3.750%, 07/09/15 EUR 600,000 618,314 642,198 0.08Lloyds TSB Bank PLC, 6.375%, 17/06/16 EUR 1,150,000 1,261,474 1,347,547 0.17Lloyds TSB Bank PLC, 4.625%, 02/02/17 EUR 900,000 952,008 1,014,165 0.13Lloyds TSB Bank PLC, 5.375%, 03/09/19 EUR 650,000 679,282 785,883 0.10Lloyds TSB Bank PLC, 6.500%, 24/03/20 EUR 800,000 771,353 913,968 0.12Lloyds TSB Bank PLC, 11.875%, 16/12/21 EUR 600,000 666,428 753,000 0.10Mondi Finance PLC, 5.750%, 03/04/17 EUR 600,000 666,494 690,000 0.09Mondi Finance PLC, 3.375%, 28/09/20 EUR 200,000 199,959 205,632 0.03Motability Operations Group PLC, 3.750%, 29/11/17 EUR 300,000 318,488 333,411 0.04Motability Operations Group PLC, 3.250%, 30/11/18 EUR 200,000 203,948 218,302 0.03National Grid Electricity Transmission PLC, 6.625%, 28/01/14 EUR 300,000 313,029 318,840 0.04National Grid PLC, 6.500%, 22/04/14 EUR 600,000 642,978 644,592 0.08National Grid PLC, 5.000%, 02/07/18 EUR 400,000 474,431 475,056 0.06National Grid PLC, 4.375%, 10/03/20 EUR 250,000 254,041 292,845 0.04Nationwide Building Society, 3.750%, 20/01/15 EUR 800,000 812,005 846,080 0.11Nationwide Building Society, 3.125%, 03/04/17 EUR 600,000 647,034 646,518 0.08Nationwide Building Society, 6.750%, 22/07/20 EUR 600,000 648,889 702,636 0.09Old Mutual PLC, 5.000%, perpetual EUR 200,000 169,451 185,000 0.02Rentokil Initial PLC, 4.625%, 27/03/14 EUR 550,000 569,784 572,407 0.07
38
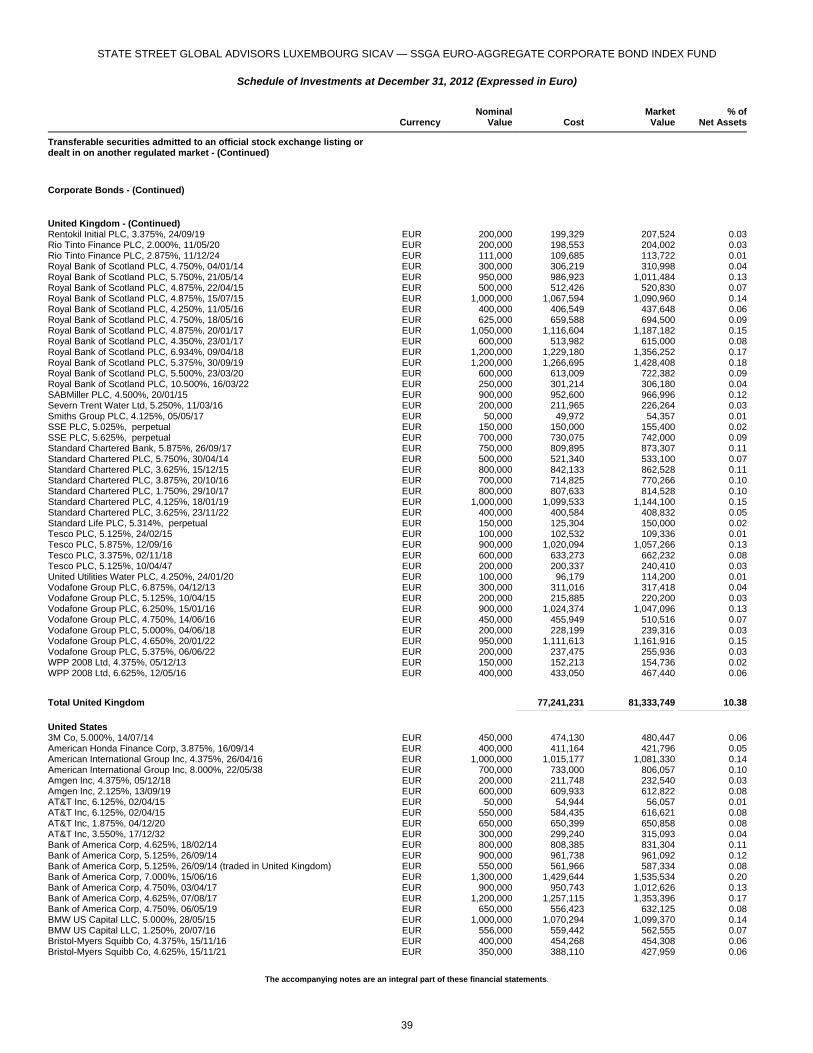
STATE STREET GLOBAL ADVISORS LUXEMBOURG SICAV — SSGA EURO-AGGREGATE CORPORATE BOND INDEX FUND
Schedule of Investments at December 31, 2012 (Expressed in Euro)
The accompanying notes are an integral part of these financial statements.
Currency
NominalValue Cost
MarketValue
% ofNet Assets
Transferable securities admitted to an official stock exchange listing or dealt in on another regulated market - (Continued)
Corporate Bonds - (Continued)
United Kingdom - (Continued) Rentokil Initial PLC, 3.375%, 24/09/19 EUR 200,000 199,329 207,524 0.03Rio Tinto Finance PLC, 2.000%, 11/05/20 EUR 200,000 198,553 204,002 0.03Rio Tinto Finance PLC, 2.875%, 11/12/24 EUR 111,000 109,685 113,722 0.01Royal Bank of Scotland PLC, 4.750%, 04/01/14 EUR 300,000 306,219 310,998 0.04Royal Bank of Scotland PLC, 5.750%, 21/05/14 EUR 950,000 986,923 1,011,484 0.13Royal Bank of Scotland PLC, 4.875%, 22/04/15 EUR 500,000 512,426 520,830 0.07Royal Bank of Scotland PLC, 4.875%, 15/07/15 EUR 1,000,000 1,067,594 1,090,960 0.14Royal Bank of Scotland PLC, 4.250%, 11/05/16 EUR 400,000 406,549 437,648 0.06Royal Bank of Scotland PLC, 4.750%, 18/05/16 EUR 625,000 659,588 694,500 0.09Royal Bank of Scotland PLC, 4.875%, 20/01/17 EUR 1,050,000 1,116,604 1,187,182 0.15Royal Bank of Scotland PLC, 4.350%, 23/01/17 EUR 600,000 513,982 615,000 0.08Royal Bank of Scotland PLC, 6.934%, 09/04/18 EUR 1,200,000 1,229,180 1,356,252 0.17Royal Bank of Scotland PLC, 5.375%, 30/09/19 EUR 1,200,000 1,266,695 1,428,408 0.18Royal Bank of Scotland PLC, 5.500%, 23/03/20 EUR 600,000 613,009 722,382 0.09Royal Bank of Scotland PLC, 10.500%, 16/03/22 EUR 250,000 301,214 306,180 0.04SABMiller PLC, 4.500%, 20/01/15 EUR 900,000 952,600 966,996 0.12Severn Trent Water Ltd, 5.250%, 11/03/16 EUR 200,000 211,965 226,264 0.03Smiths Group PLC, 4.125%, 05/05/17 EUR 50,000 49,972 54,357 0.01SSE PLC, 5.025%, perpetual EUR 150,000 150,000 155,400 0.02SSE PLC, 5.625%, perpetual EUR 700,000 730,075 742,000 0.09Standard Chartered Bank, 5.875%, 26/09/17 EUR 750,000 809,895 873,307 0.11Standard Chartered PLC, 5.750%, 30/04/14 EUR 500,000 521,340 533,100 0.07Standard Chartered PLC, 3.625%, 15/12/15 EUR 800,000 842,133 862,528 0.11Standard Chartered PLC, 3.875%, 20/10/16 EUR 700,000 714,825 770,266 0.10Standard Chartered PLC, 1.750%, 29/10/17 EUR 800,000 807,633 814,528 0.10Standard Chartered PLC, 4.125%, 18/01/19 EUR 1,000,000 1,099,533 1,144,100 0.15Standard Chartered PLC, 3.625%, 23/11/22 EUR 400,000 400,584 408,832 0.05Standard Life PLC, 5.314%, perpetual EUR 150,000 125,304 150,000 0.02Tesco PLC, 5.125%, 24/02/15 EUR 100,000 102,532 109,336 0.01Tesco PLC, 5.875%, 12/09/16 EUR 900,000 1,020,094 1,057,266 0.13Tesco PLC, 3.375%, 02/11/18 EUR 600,000 633,273 662,232 0.08Tesco PLC, 5.125%, 10/04/47 EUR 200,000 200,337 240,410 0.03United Utilities Water PLC, 4.250%, 24/01/20 EUR 100,000 96,179 114,200 0.01Vodafone Group PLC, 6.875%, 04/12/13 EUR 300,000 311,016 317,418 0.04Vodafone Group PLC, 5.125%, 10/04/15 EUR 200,000 215,885 220,200 0.03Vodafone Group PLC, 6.250%, 15/01/16 EUR 900,000 1,024,374 1,047,096 0.13Vodafone Group PLC, 4.750%, 14/06/16 EUR 450,000 455,949 510,516 0.07Vodafone Group PLC, 5.000%, 04/06/18 EUR 200,000 228,199 239,316 0.03Vodafone Group PLC, 4.650%, 20/01/22 EUR 950,000 1,111,613 1,161,916 0.15Vodafone Group PLC, 5.375%, 06/06/22 EUR 200,000 237,475 255,936 0.03WPP 2008 Ltd, 4.375%, 05/12/13 EUR 150,000 152,213 154,736 0.02WPP 2008 Ltd, 6.625%, 12/05/16 EUR 400,000 433,050 467,440 0.06
Total United Kingdom 77,241,231 81,333,749 10.38 _______________________________________________ ____________________________________________________________ __________________________________________________
United States 3M Co, 5.000%, 14/07/14 EUR 450,000 474,130 480,447 0.06American Honda Finance Corp, 3.875%, 16/09/14 EUR 400,000 411,164 421,796 0.05American International Group Inc, 4.375%, 26/04/16 EUR 1,000,000 1,015,177 1,081,330 0.14American International Group Inc, 8.000%, 22/05/38 EUR 700,000 733,000 806,057 0.10Amgen Inc, 4.375%, 05/12/18 EUR 200,000 211,748 232,540 0.03Amgen Inc, 2.125%, 13/09/19 EUR 600,000 609,933 612,822 0.08AT&T Inc, 6.125%, 02/04/15 EUR 50,000 54,944 56,057 0.01AT&T Inc, 6.125%, 02/04/15 EUR 550,000 584,435 616,621 0.08AT&T Inc, 1.875%, 04/12/20 EUR 650,000 650,399 650,858 0.08AT&T Inc, 3.550%, 17/12/32 EUR 300,000 299,240 315,093 0.04Bank of America Corp, 4.625%, 18/02/14 EUR 800,000 808,385 831,304 0.11Bank of America Corp, 5.125%, 26/09/14 EUR 900,000 961,738 961,092 0.12Bank of America Corp, 5.125%, 26/09/14 (traded in United Kingdom) EUR 550,000 561,966 587,334 0.08Bank of America Corp, 7.000%, 15/06/16 EUR 1,300,000 1,429,644 1,535,534 0.20Bank of America Corp, 4.750%, 03/04/17 EUR 900,000 950,743 1,012,626 0.13Bank of America Corp, 4.625%, 07/08/17 EUR 1,200,000 1,257,115 1,353,396 0.17Bank of America Corp, 4.750%, 06/05/19 EUR 650,000 556,423 632,125 0.08BMW US Capital LLC, 5.000%, 28/05/15 EUR 1,000,000 1,070,294 1,099,370 0.14BMW US Capital LLC, 1.250%, 20/07/16 EUR 556,000 559,442 562,555 0.07Bristol-Myers Squibb Co, 4.375%, 15/11/16 EUR 400,000 454,268 454,308 0.06Bristol-Myers Squibb Co, 4.625%, 15/11/21 EUR 350,000 388,110 427,959 0.06
39
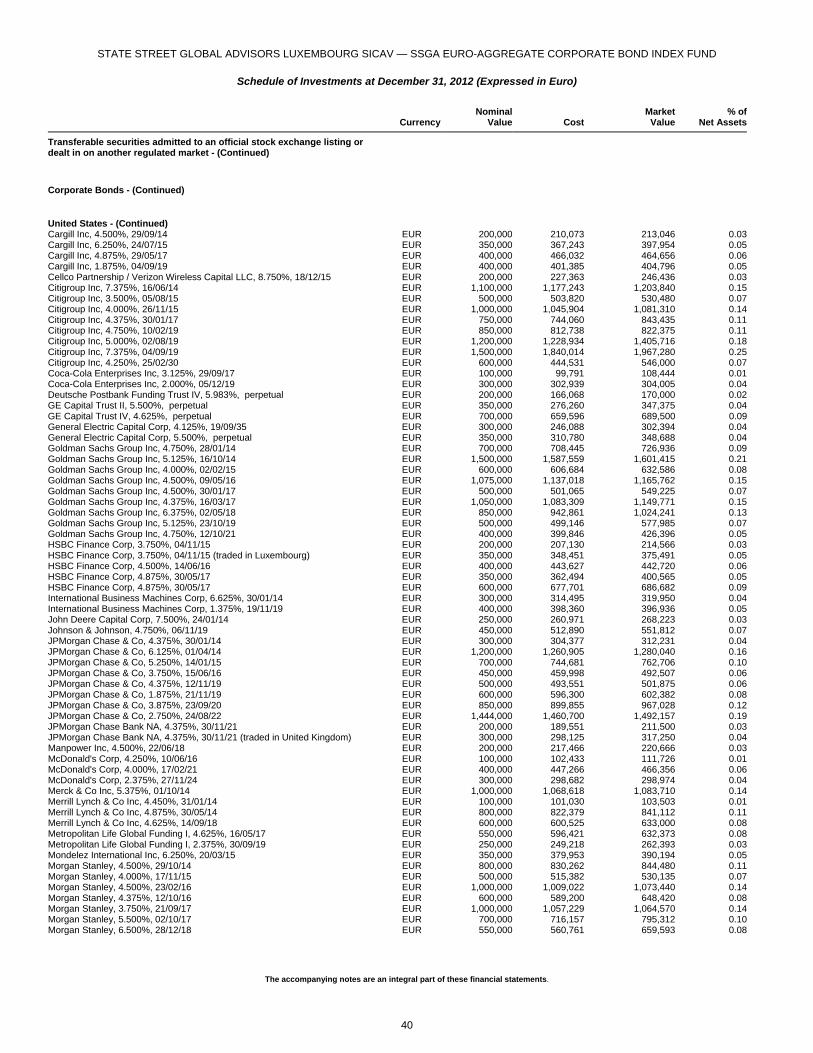
STATE STREET GLOBAL ADVISORS LUXEMBOURG SICAV — SSGA EURO-AGGREGATE CORPORATE BOND INDEX FUND
Schedule of Investments at December 31, 2012 (Expressed in Euro)
The accompanying notes are an integral part of these financial statements.
Currency
NominalValue Cost
MarketValue
% ofNet Assets
Transferable securities admitted to an official stock exchange listing or dealt in on another regulated market - (Continued)
Corporate Bonds - (Continued)
United States - (Continued) Cargill Inc, 4.500%, 29/09/14 EUR 200,000 210,073 213,046 0.03Cargill Inc, 6.250%, 24/07/15 EUR 350,000 367,243 397,954 0.05Cargill Inc, 4.875%, 29/05/17 EUR 400,000 466,032 464,656 0.06Cargill Inc, 1.875%, 04/09/19 EUR 400,000 401,385 404,796 0.05Cellco Partnership / Verizon Wireless Capital LLC, 8.750%, 18/12/15 EUR 200,000 227,363 246,436 0.03Citigroup Inc, 7.375%, 16/06/14 EUR 1,100,000 1,177,243 1,203,840 0.15Citigroup Inc, 3.500%, 05/08/15 EUR 500,000 503,820 530,480 0.07Citigroup Inc, 4.000%, 26/11/15 EUR 1,000,000 1,045,904 1,081,310 0.14Citigroup Inc, 4.375%, 30/01/17 EUR 750,000 744,060 843,435 0.11Citigroup Inc, 4.750%, 10/02/19 EUR 850,000 812,738 822,375 0.11Citigroup Inc, 5.000%, 02/08/19 EUR 1,200,000 1,228,934 1,405,716 0.18Citigroup Inc, 7.375%, 04/09/19 EUR 1,500,000 1,840,014 1,967,280 0.25Citigroup Inc, 4.250%, 25/02/30 EUR 600,000 444,531 546,000 0.07Coca-Cola Enterprises Inc, 3.125%, 29/09/17 EUR 100,000 99,791 108,444 0.01Coca-Cola Enterprises Inc, 2.000%, 05/12/19 EUR 300,000 302,939 304,005 0.04Deutsche Postbank Funding Trust IV, 5.983%, perpetual EUR 200,000 166,068 170,000 0.02GE Capital Trust II, 5.500%, perpetual EUR 350,000 276,260 347,375 0.04GE Capital Trust IV, 4.625%, perpetual EUR 700,000 659,596 689,500 0.09General Electric Capital Corp, 4.125%, 19/09/35 EUR 300,000 246,088 302,394 0.04General Electric Capital Corp, 5.500%, perpetual EUR 350,000 310,780 348,688 0.04Goldman Sachs Group Inc, 4.750%, 28/01/14 EUR 700,000 708,445 726,936 0.09Goldman Sachs Group Inc, 5.125%, 16/10/14 EUR 1,500,000 1,587,559 1,601,415 0.21Goldman Sachs Group Inc, 4.000%, 02/02/15 EUR 600,000 606,684 632,586 0.08Goldman Sachs Group Inc, 4.500%, 09/05/16 EUR 1,075,000 1,137,018 1,165,762 0.15Goldman Sachs Group Inc, 4.500%, 30/01/17 EUR 500,000 501,065 549,225 0.07Goldman Sachs Group Inc, 4.375%, 16/03/17 EUR 1,050,000 1,083,309 1,149,771 0.15Goldman Sachs Group Inc, 6.375%, 02/05/18 EUR 850,000 942,861 1,024,241 0.13Goldman Sachs Group Inc, 5.125%, 23/10/19 EUR 500,000 499,146 577,985 0.07Goldman Sachs Group Inc, 4.750%, 12/10/21 EUR 400,000 399,846 426,396 0.05HSBC Finance Corp, 3.750%, 04/11/15 EUR 200,000 207,130 214,566 0.03HSBC Finance Corp, 3.750%, 04/11/15 (traded in Luxembourg) EUR 350,000 348,451 375,491 0.05HSBC Finance Corp, 4.500%, 14/06/16 EUR 400,000 443,627 442,720 0.06HSBC Finance Corp, 4.875%, 30/05/17 EUR 350,000 362,494 400,565 0.05HSBC Finance Corp, 4.875%, 30/05/17 EUR 600,000 677,701 686,682 0.09International Business Machines Corp, 6.625%, 30/01/14 EUR 300,000 314,495 319,950 0.04International Business Machines Corp, 1.375%, 19/11/19 EUR 400,000 398,360 396,936 0.05John Deere Capital Corp, 7.500%, 24/01/14 EUR 250,000 260,971 268,223 0.03Johnson & Johnson, 4.750%, 06/11/19 EUR 450,000 512,890 551,812 0.07JPMorgan Chase & Co, 4.375%, 30/01/14 EUR 300,000 304,377 312,231 0.04JPMorgan Chase & Co, 6.125%, 01/04/14 EUR 1,200,000 1,260,905 1,280,040 0.16JPMorgan Chase & Co, 5.250%, 14/01/15 EUR 700,000 744,681 762,706 0.10JPMorgan Chase & Co, 3.750%, 15/06/16 EUR 450,000 459,998 492,507 0.06JPMorgan Chase & Co, 4.375%, 12/11/19 EUR 500,000 493,551 501,875 0.06JPMorgan Chase & Co, 1.875%, 21/11/19 EUR 600,000 596,300 602,382 0.08JPMorgan Chase & Co, 3.875%, 23/09/20 EUR 850,000 899,855 967,028 0.12JPMorgan Chase & Co, 2.750%, 24/08/22 EUR 1,444,000 1,460,700 1,492,157 0.19JPMorgan Chase Bank NA, 4.375%, 30/11/21 EUR 200,000 189,551 211,500 0.03JPMorgan Chase Bank NA, 4.375%, 30/11/21 (traded in United Kingdom) EUR 300,000 298,125 317,250 0.04Manpower Inc, 4.500%, 22/06/18 EUR 200,000 217,466 220,666 0.03McDonald's Corp, 4.250%, 10/06/16 EUR 100,000 102,433 111,726 0.01McDonald's Corp, 4.000%, 17/02/21 EUR 400,000 447,266 466,356 0.06McDonald's Corp, 2.375%, 27/11/24 EUR 300,000 298,682 298,974 0.04Merck & Co Inc, 5.375%, 01/10/14 EUR 1,000,000 1,068,618 1,083,710 0.14Merrill Lynch & Co Inc, 4.450%, 31/01/14 EUR 100,000 101,030 103,503 0.01Merrill Lynch & Co Inc, 4.875%, 30/05/14 EUR 800,000 822,379 841,112 0.11Merrill Lynch & Co Inc, 4.625%, 14/09/18 EUR 600,000 600,525 633,000 0.08Metropolitan Life Global Funding I, 4.625%, 16/05/17 EUR 550,000 596,421 632,373 0.08Metropolitan Life Global Funding I, 2.375%, 30/09/19 EUR 250,000 249,218 262,393 0.03Mondelez International Inc, 6.250%, 20/03/15 EUR 350,000 379,953 390,194 0.05Morgan Stanley, 4.500%, 29/10/14 EUR 800,000 830,262 844,480 0.11Morgan Stanley, 4.000%, 17/11/15 EUR 500,000 515,382 530,135 0.07Morgan Stanley, 4.500%, 23/02/16 EUR 1,000,000 1,009,022 1,073,440 0.14Morgan Stanley, 4.375%, 12/10/16 EUR 600,000 589,200 648,420 0.08Morgan Stanley, 3.750%, 21/09/17 EUR 1,000,000 1,057,229 1,064,570 0.14Morgan Stanley, 5.500%, 02/10/17 EUR 700,000 716,157 795,312 0.10Morgan Stanley, 6.500%, 28/12/18 EUR 550,000 560,761 659,593 0.08
40
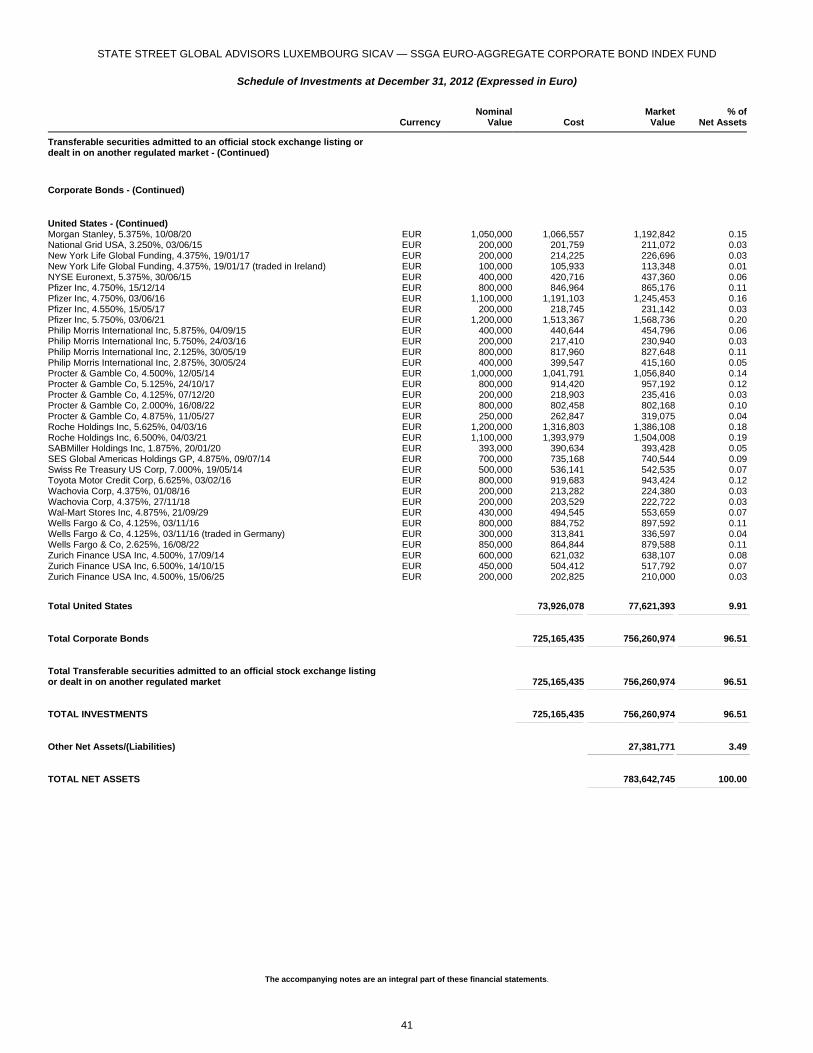
STATE STREET GLOBAL ADVISORS LUXEMBOURG SICAV — SSGA EURO-AGGREGATE CORPORATE BOND INDEX FUND
Schedule of Investments at December 31, 2012 (Expressed in Euro)
The accompanying notes are an integral part of these financial statements.
Currency
NominalValue Cost
MarketValue
% ofNet Assets
Transferable securities admitted to an official stock exchange listing or dealt in on another regulated market - (Continued)
Corporate Bonds - (Continued)
United States - (Continued) Morgan Stanley, 5.375%, 10/08/20 EUR 1,050,000 1,066,557 1,192,842 0.15National Grid USA, 3.250%, 03/06/15 EUR 200,000 201,759 211,072 0.03New York Life Global Funding, 4.375%, 19/01/17 EUR 200,000 214,225 226,696 0.03New York Life Global Funding, 4.375%, 19/01/17 (traded in Ireland) EUR 100,000 105,933 113,348 0.01NYSE Euronext, 5.375%, 30/06/15 EUR 400,000 420,716 437,360 0.06Pfizer Inc, 4.750%, 15/12/14 EUR 800,000 846,964 865,176 0.11Pfizer Inc, 4.750%, 03/06/16 EUR 1,100,000 1,191,103 1,245,453 0.16Pfizer Inc, 4.550%, 15/05/17 EUR 200,000 218,745 231,142 0.03Pfizer Inc, 5.750%, 03/06/21 EUR 1,200,000 1,513,367 1,568,736 0.20Philip Morris International Inc, 5.875%, 04/09/15 EUR 400,000 440,644 454,796 0.06Philip Morris International Inc, 5.750%, 24/03/16 EUR 200,000 217,410 230,940 0.03Philip Morris International Inc, 2.125%, 30/05/19 EUR 800,000 817,960 827,648 0.11Philip Morris International Inc, 2.875%, 30/05/24 EUR 400,000 399,547 415,160 0.05Procter & Gamble Co, 4.500%, 12/05/14 EUR 1,000,000 1,041,791 1,056,840 0.14Procter & Gamble Co, 5.125%, 24/10/17 EUR 800,000 914,420 957,192 0.12Procter & Gamble Co, 4.125%, 07/12/20 EUR 200,000 218,903 235,416 0.03Procter & Gamble Co, 2.000%, 16/08/22 EUR 800,000 802,458 802,168 0.10Procter & Gamble Co, 4.875%, 11/05/27 EUR 250,000 262,847 319,075 0.04Roche Holdings Inc, 5.625%, 04/03/16 EUR 1,200,000 1,316,803 1,386,108 0.18Roche Holdings Inc, 6.500%, 04/03/21 EUR 1,100,000 1,393,979 1,504,008 0.19SABMiller Holdings Inc, 1.875%, 20/01/20 EUR 393,000 390,634 393,428 0.05SES Global Americas Holdings GP, 4.875%, 09/07/14 EUR 700,000 735,168 740,544 0.09Swiss Re Treasury US Corp, 7.000%, 19/05/14 EUR 500,000 536,141 542,535 0.07Toyota Motor Credit Corp, 6.625%, 03/02/16 EUR 800,000 919,683 943,424 0.12Wachovia Corp, 4.375%, 01/08/16 EUR 200,000 213,282 224,380 0.03Wachovia Corp, 4.375%, 27/11/18 EUR 200,000 203,529 222,722 0.03Wal-Mart Stores Inc, 4.875%, 21/09/29 EUR 430,000 494,545 553,659 0.07Wells Fargo & Co, 4.125%, 03/11/16 EUR 800,000 884,752 897,592 0.11Wells Fargo & Co, 4.125%, 03/11/16 (traded in Germany) EUR 300,000 313,841 336,597 0.04Wells Fargo & Co, 2.625%, 16/08/22 EUR 850,000 864,844 879,588 0.11Zurich Finance USA Inc, 4.500%, 17/09/14 EUR 600,000 621,032 638,107 0.08Zurich Finance USA Inc, 6.500%, 14/10/15 EUR 450,000 504,412 517,792 0.07Zurich Finance USA Inc, 4.500%, 15/06/25 EUR 200,000 202,825 210,000 0.03
Total United States 73,926,078 77,621,393 9.91 _______________________________________________ ____________________________________________________________ __________________________________________________
Total Corporate Bonds 725,165,435 756,260,974 96.51 _______________________________________________ ____________________________________________________________ __________________________________________________
Total Transferable securities admitted to an official stock exchange listing or dealt in on another regulated market 725,165,435 756,260,974 96.51 _______________________________________________ ____________________________________________________________ __________________________________________________
TOTAL INVESTMENTS 725,165,435 756,260,974 96.51 _______________________________________________ ____________________________________________________________ __________________________________________________
Other Net Assets/(Liabilities) 27,381,771 3.49 ____________________________________________________________ ___________________________________________________
TOTAL NET ASSETS 783,642,745 100.00 ____________________________________________________________ ___________________________________________________
41
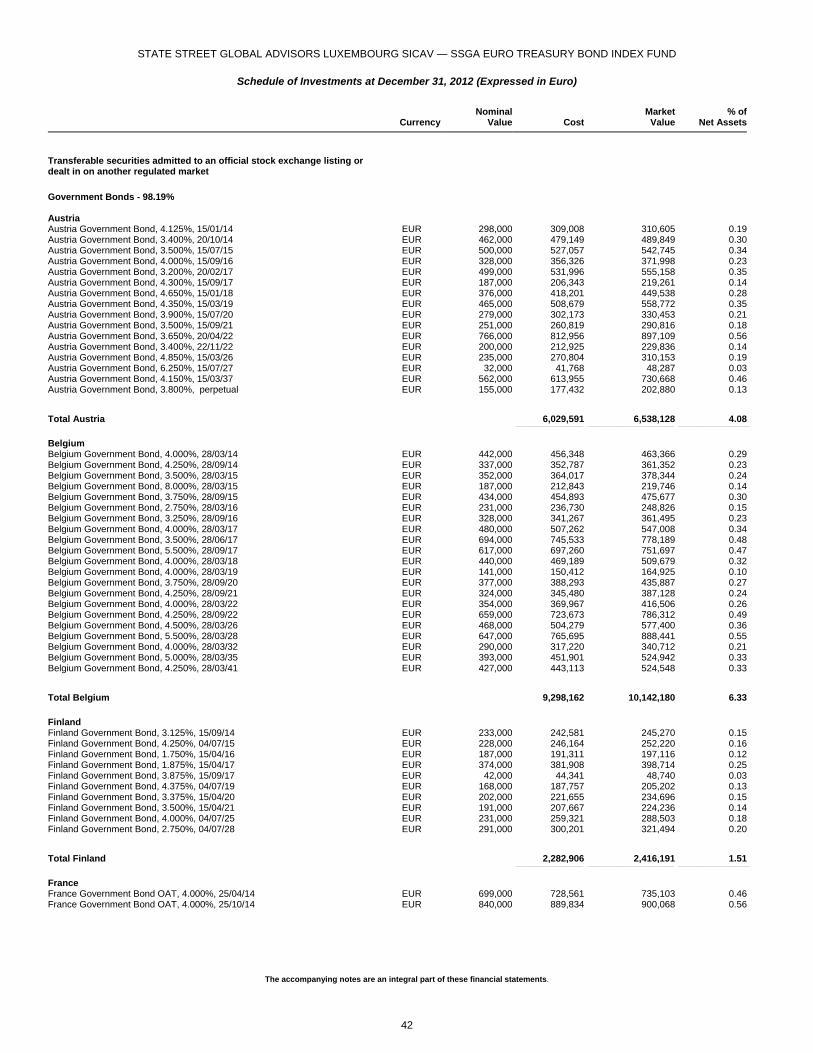
STATE STREET GLOBAL ADVISORS LUXEMBOURG SICAV — SSGA EURO TREASURY BOND INDEX FUND
Schedule of Investments at December 31, 2012 (Expressed in Euro)
The accompanying notes are an integral part of these financial statements.
Currency
NominalValue Cost
MarketValue
% ofNet Assets
Transferable securities admitted to an official stock exchange listing or dealt in on another regulated market
Government Bonds - 98.19% Austria Austria Government Bond, 4.125%, 15/01/14 EUR 298,000 309,008 310,605 0.19Austria Government Bond, 3.400%, 20/10/14 EUR 462,000 479,149 489,849 0.30Austria Government Bond, 3.500%, 15/07/15 EUR 500,000 527,057 542,745 0.34Austria Government Bond, 4.000%, 15/09/16 EUR 328,000 356,326 371,998 0.23Austria Government Bond, 3.200%, 20/02/17 EUR 499,000 531,996 555,158 0.35Austria Government Bond, 4.300%, 15/09/17 EUR 187,000 206,343 219,261 0.14Austria Government Bond, 4.650%, 15/01/18 EUR 376,000 418,201 449,538 0.28Austria Government Bond, 4.350%, 15/03/19 EUR 465,000 508,679 558,772 0.35Austria Government Bond, 3.900%, 15/07/20 EUR 279,000 302,173 330,453 0.21Austria Government Bond, 3.500%, 15/09/21 EUR 251,000 260,819 290,816 0.18Austria Government Bond, 3.650%, 20/04/22 EUR 766,000 812,956 897,109 0.56Austria Government Bond, 3.400%, 22/11/22 EUR 200,000 212,925 229,836 0.14Austria Government Bond, 4.850%, 15/03/26 EUR 235,000 270,804 310,153 0.19Austria Government Bond, 6.250%, 15/07/27 EUR 32,000 41,768 48,287 0.03Austria Government Bond, 4.150%, 15/03/37 EUR 562,000 613,955 730,668 0.46Austria Government Bond, 3.800%, perpetual EUR 155,000 177,432 202,880 0.13
Total Austria 6,029,591 6,538,128 4.08 _______________________________________________ ____________________________________________________________ __________________________________________________
Belgium Belgium Government Bond, 4.000%, 28/03/14 EUR 442,000 456,348 463,366 0.29Belgium Government Bond, 4.250%, 28/09/14 EUR 337,000 352,787 361,352 0.23Belgium Government Bond, 3.500%, 28/03/15 EUR 352,000 364,017 378,344 0.24Belgium Government Bond, 8.000%, 28/03/15 EUR 187,000 212,843 219,746 0.14Belgium Government Bond, 3.750%, 28/09/15 EUR 434,000 454,893 475,677 0.30Belgium Government Bond, 2.750%, 28/03/16 EUR 231,000 236,730 248,826 0.15Belgium Government Bond, 3.250%, 28/09/16 EUR 328,000 341,267 361,495 0.23Belgium Government Bond, 4.000%, 28/03/17 EUR 480,000 507,262 547,008 0.34Belgium Government Bond, 3.500%, 28/06/17 EUR 694,000 745,533 778,189 0.48Belgium Government Bond, 5.500%, 28/09/17 EUR 617,000 697,260 751,697 0.47Belgium Government Bond, 4.000%, 28/03/18 EUR 440,000 469,189 509,679 0.32Belgium Government Bond, 4.000%, 28/03/19 EUR 141,000 150,412 164,925 0.10Belgium Government Bond, 3.750%, 28/09/20 EUR 377,000 388,293 435,887 0.27Belgium Government Bond, 4.250%, 28/09/21 EUR 324,000 345,480 387,128 0.24Belgium Government Bond, 4.000%, 28/03/22 EUR 354,000 369,967 416,506 0.26Belgium Government Bond, 4.250%, 28/09/22 EUR 659,000 723,673 786,312 0.49Belgium Government Bond, 4.500%, 28/03/26 EUR 468,000 504,279 577,400 0.36Belgium Government Bond, 5.500%, 28/03/28 EUR 647,000 765,695 888,441 0.55Belgium Government Bond, 4.000%, 28/03/32 EUR 290,000 317,220 340,712 0.21Belgium Government Bond, 5.000%, 28/03/35 EUR 393,000 451,901 524,942 0.33Belgium Government Bond, 4.250%, 28/03/41 EUR 427,000 443,113 524,548 0.33
Total Belgium 9,298,162 10,142,180 6.33 _______________________________________________ ____________________________________________________________ __________________________________________________
Finland Finland Government Bond, 3.125%, 15/09/14 EUR 233,000 242,581 245,270 0.15Finland Government Bond, 4.250%, 04/07/15 EUR 228,000 246,164 252,220 0.16Finland Government Bond, 1.750%, 15/04/16 EUR 187,000 191,311 197,116 0.12Finland Government Bond, 1.875%, 15/04/17 EUR 374,000 381,908 398,714 0.25Finland Government Bond, 3.875%, 15/09/17 EUR 42,000 44,341 48,740 0.03Finland Government Bond, 4.375%, 04/07/19 EUR 168,000 187,757 205,202 0.13Finland Government Bond, 3.375%, 15/04/20 EUR 202,000 221,655 234,696 0.15Finland Government Bond, 3.500%, 15/04/21 EUR 191,000 207,667 224,236 0.14Finland Government Bond, 4.000%, 04/07/25 EUR 231,000 259,321 288,503 0.18Finland Government Bond, 2.750%, 04/07/28 EUR 291,000 300,201 321,494 0.20
Total Finland 2,282,906 2,416,191 1.51 _______________________________________________ ____________________________________________________________ __________________________________________________
France France Government Bond OAT, 4.000%, 25/04/14 EUR 699,000 728,561 735,103 0.46France Government Bond OAT, 4.000%, 25/10/14 EUR 840,000 889,834 900,068 0.56
42

STATE STREET GLOBAL ADVISORS LUXEMBOURG SICAV — SSGA EURO TREASURY BOND INDEX FUND
Schedule of Investments at December 31, 2012 (Expressed in Euro)
The accompanying notes are an integral part of these financial statements.
Currency
NominalValue Cost
MarketValue
% ofNet Assets
Transferable securities admitted to an official stock exchange listing or dealt in on another regulated market - (Continued)
Government Bonds - (Continued)
France - (Continued) France Government Bond OAT, 3.500%, 25/04/15 EUR 574,000 603,539 618,778 0.39France Government Bond OAT, 3.000%, 25/10/15 EUR 1,171,000 1,218,264 1,263,685 0.79France Government Bond OAT, 3.250%, 25/04/16 EUR 574,000 614,631 630,017 0.39France Government Bond OAT, 5.000%, 25/10/16 EUR 1,068,000 1,194,683 1,253,020 0.78France Government Bond OAT, 3.750%, 25/04/17 EUR 1,183,000 1,275,400 1,344,846 0.84France Government Bond OAT, 4.250%, 25/10/17 EUR 816,000 899,204 953,341 0.59France Government Bond OAT, 4.000%, 25/04/18 EUR 701,000 793,908 816,427 0.51France Government Bond OAT, 4.250%, 25/10/18 EUR 877,000 962,961 1,039,552 0.65France Government Bond OAT, 4.250%, 25/04/19 EUR 664,000 725,772 791,309 0.49France Government Bond OAT, 8.500%, 25/10/19 EUR 361,000 493,701 533,100 0.33France Government Bond OAT, 3.750%, 25/10/19 EUR 1,223,000 1,336,418 1,422,936 0.89France Government Bond OAT, 3.500%, 25/04/20 EUR 919,000 966,424 1,054,727 0.66France Government Bond OAT, 2.500%, 25/10/20 EUR 795,000 780,071 853,091 0.53France Government Bond OAT, 3.750%, 25/04/21 EUR 793,000 836,575 922,838 0.58France Government Bond OAT, 3.250%, 25/10/21 EUR 968,000 1,030,116 1,085,457 0.68France Government Bond OAT, 3.000%, 25/04/22 EUR 1,255,000 1,260,659 1,374,965 0.86France Government Bond OAT, 8.250%, 25/04/22 EUR 975,000 1,401,129 1,515,657 0.94France Government Bond OAT, 8.500%, 25/04/23 EUR 558,000 814,901 894,669 0.56France Government Bond OAT, 4.250%, 25/10/23 EUR 902,000 1,023,231 1,086,621 0.68France Government Bond OAT, 6.000%, 25/10/25 EUR 599,000 758,151 845,441 0.53France Government Bond OAT, 3.500%, 25/04/26 EUR 95,000 95,896 106,999 0.07France Government Bond OAT, 3.500%, 25/04/26 EUR 653,000 683,221 735,474 0.46France Government Bond OAT, 5.500%, 25/04/29 EUR 982,000 1,205,713 1,364,410 0.85France Government Bond OAT, 5.750%, 25/10/32 EUR 906,000 1,165,296 1,328,169 0.83France Government Bond OAT, 4.750%, 25/04/35 EUR 848,000 994,989 1,113,772 0.69France Government Bond OAT, 4.000%, 25/10/38 EUR 573,000 603,247 683,663 0.43France Government Bond OAT, 4.500%, 25/04/41 EUR 578,000 650,475 747,169 0.47France Government Bond OAT, 4.000%, perpetual EUR 527,000 550,396 632,621 0.39France Government Bond OAT, 4.000%, perpetual EUR 477,000 512,008 573,788 0.36French Treasury Note BTAN, 2.500%, 12/01/14 EUR 1,149,000 1,170,455 1,177,966 0.73French Treasury Note BTAN, 3.000%, 12/07/14 EUR 1,363,000 1,411,370 1,424,212 0.89French Treasury Note BTAN, 2.500%, 15/01/15 EUR 728,000 746,277 763,898 0.48French Treasury Note BTAN, 2.000%, 12/07/15 EUR 1,029,000 1,049,280 1,076,910 0.67French Treasury Note BTAN, 2.250%, 25/02/16 EUR 1,049,000 1,075,069 1,114,762 0.69French Treasury Note BTAN, 2.500%, 25/07/16 EUR 374,000 385,702 402,488 0.25French Treasury Note BTAN, 1.750%, 25/02/17 EUR 2,153,000 2,163,502 2,263,513 1.41
Total France 35,071,029 37,445,462 23.36 _______________________________________________ ____________________________________________________________ __________________________________________________
Germany Bundesobligation, 2.250%, 11/04/14 EUR 1,172,000 1,197,580 1,205,965 0.75Bundesobligation, 2.500%, 10/10/14 EUR 1,540,000 1,602,920 1,609,100 1.00Bundesobligation, 2.500%, 27/02/15 EUR 334,000 349,735 352,310 0.22Bundesobligation, 2.250%, 10/04/15 EUR 449,000 461,784 472,339 0.29Bundesobligation, 1.750%, 09/10/15 EUR 279,000 288,050 292,704 0.18Bundesobligation, 2.000%, 26/02/16 EUR 374,000 386,330 397,543 0.25Bundesobligation, 2.750%, 08/04/16 EUR 879,000 949,248 957,451 0.60Bundesobligation, 1.250%, 14/10/16 EUR 515,000 522,626 537,351 0.34Bundesobligation, 0.750%, 24/02/17 EUR 655,000 649,705 670,648 0.42Bundesrepublik Deutschland, 4.250%, 04/01/14 EUR 935,000 972,657 974,971 0.61Bundesrepublik Deutschland, 4.250%, 04/07/14 EUR 915,000 964,121 973,743 0.61Bundesrepublik Deutschland, 3.750%, 04/01/15 EUR 470,000 492,858 505,715 0.32Bundesrepublik Deutschland, 3.250%, 04/07/15 EUR 349,000 369,017 377,642 0.24Bundesrepublik Deutschland, 3.500%, 04/01/16 EUR 529,000 574,210 584,630 0.36Bundesrepublik Deutschland, 6.000%, 20/06/16 EUR 279,000 327,883 335,871 0.21Bundesrepublik Deutschland, 4.000%, 04/07/16 EUR 772,000 848,389 878,027 0.55Bundesrepublik Deutschland, 5.625%, 20/09/16 EUR 561,000 657,957 676,095 0.42Bundesrepublik Deutschland, 3.750%, 04/01/17 EUR 801,000 879,886 916,488 0.57Bundesrepublik Deutschland, 4.250%, 04/07/17 EUR 468,000 533,525 552,362 0.34Bundesrepublik Deutschland, 4.000%, 04/01/18 EUR 833,000 947,059 984,814 0.61Bundesrepublik Deutschland, 4.250%, 04/07/18 EUR 811,000 948,915 979,599 0.61Bundesrepublik Deutschland, 3.750%, 04/01/19 EUR 718,000 800,165 854,348 0.53Bundesrepublik Deutschland, 3.500%, 04/07/19 EUR 835,000 918,334 986,561 0.62Bundesrepublik Deutschland, 3.250%, 04/01/20 EUR 1,207,000 1,338,279 1,411,864 0.88Bundesrepublik Deutschland, 3.000%, 04/07/20 EUR 796,000 874,180 918,990 0.57Bundesrepublik Deutschland, 2.250%, 04/09/20 EUR 518,000 530,871 569,494 0.36Bundesrepublik Deutschland, 2.500%, 04/01/21 EUR 679,000 734,868 758,362 0.47
43
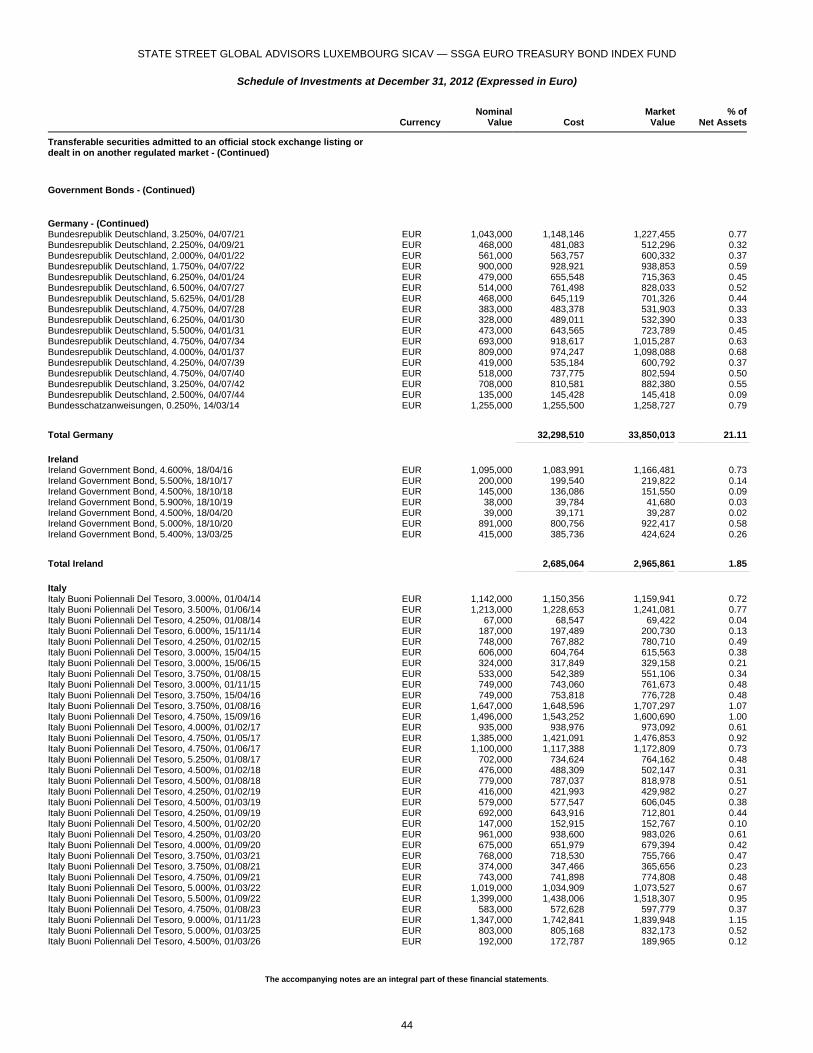
STATE STREET GLOBAL ADVISORS LUXEMBOURG SICAV — SSGA EURO TREASURY BOND INDEX FUND
Schedule of Investments at December 31, 2012 (Expressed in Euro)
The accompanying notes are an integral part of these financial statements.
Currency
NominalValue Cost
MarketValue
% ofNet Assets
Transferable securities admitted to an official stock exchange listing or dealt in on another regulated market - (Continued)
Government Bonds - (Continued)
Germany - (Continued) Bundesrepublik Deutschland, 3.250%, 04/07/21 EUR 1,043,000 1,148,146 1,227,455 0.77Bundesrepublik Deutschland, 2.250%, 04/09/21 EUR 468,000 481,083 512,296 0.32Bundesrepublik Deutschland, 2.000%, 04/01/22 EUR 561,000 563,757 600,332 0.37Bundesrepublik Deutschland, 1.750%, 04/07/22 EUR 900,000 928,921 938,853 0.59Bundesrepublik Deutschland, 6.250%, 04/01/24 EUR 479,000 655,548 715,363 0.45Bundesrepublik Deutschland, 6.500%, 04/07/27 EUR 514,000 761,498 828,033 0.52Bundesrepublik Deutschland, 5.625%, 04/01/28 EUR 468,000 645,119 701,326 0.44Bundesrepublik Deutschland, 4.750%, 04/07/28 EUR 383,000 483,378 531,903 0.33Bundesrepublik Deutschland, 6.250%, 04/01/30 EUR 328,000 489,011 532,390 0.33Bundesrepublik Deutschland, 5.500%, 04/01/31 EUR 473,000 643,565 723,789 0.45Bundesrepublik Deutschland, 4.750%, 04/07/34 EUR 693,000 918,617 1,015,287 0.63Bundesrepublik Deutschland, 4.000%, 04/01/37 EUR 809,000 974,247 1,098,088 0.68Bundesrepublik Deutschland, 4.250%, 04/07/39 EUR 419,000 535,184 600,792 0.37Bundesrepublik Deutschland, 4.750%, 04/07/40 EUR 518,000 737,775 802,594 0.50Bundesrepublik Deutschland, 3.250%, 04/07/42 EUR 708,000 810,581 882,380 0.55Bundesrepublik Deutschland, 2.500%, 04/07/44 EUR 135,000 145,428 145,418 0.09Bundesschatzanweisungen, 0.250%, 14/03/14 EUR 1,255,000 1,255,500 1,258,727 0.79
Total Germany 32,298,510 33,850,013 21.11 _______________________________________________ ____________________________________________________________ __________________________________________________
Ireland Ireland Government Bond, 4.600%, 18/04/16 EUR 1,095,000 1,083,991 1,166,481 0.73Ireland Government Bond, 5.500%, 18/10/17 EUR 200,000 199,540 219,822 0.14Ireland Government Bond, 4.500%, 18/10/18 EUR 145,000 136,086 151,550 0.09Ireland Government Bond, 5.900%, 18/10/19 EUR 38,000 39,784 41,680 0.03Ireland Government Bond, 4.500%, 18/04/20 EUR 39,000 39,171 39,287 0.02Ireland Government Bond, 5.000%, 18/10/20 EUR 891,000 800,756 922,417 0.58Ireland Government Bond, 5.400%, 13/03/25 EUR 415,000 385,736 424,624 0.26
Total Ireland 2,685,064 2,965,861 1.85 _______________________________________________ ____________________________________________________________ __________________________________________________
Italy Italy Buoni Poliennali Del Tesoro, 3.000%, 01/04/14 EUR 1,142,000 1,150,356 1,159,941 0.72Italy Buoni Poliennali Del Tesoro, 3.500%, 01/06/14 EUR 1,213,000 1,228,653 1,241,081 0.77Italy Buoni Poliennali Del Tesoro, 4.250%, 01/08/14 EUR 67,000 68,547 69,422 0.04Italy Buoni Poliennali Del Tesoro, 6.000%, 15/11/14 EUR 187,000 197,489 200,730 0.13Italy Buoni Poliennali Del Tesoro, 4.250%, 01/02/15 EUR 748,000 767,882 780,710 0.49Italy Buoni Poliennali Del Tesoro, 3.000%, 15/04/15 EUR 606,000 604,764 615,563 0.38Italy Buoni Poliennali Del Tesoro, 3.000%, 15/06/15 EUR 324,000 317,849 329,158 0.21Italy Buoni Poliennali Del Tesoro, 3.750%, 01/08/15 EUR 533,000 542,389 551,106 0.34Italy Buoni Poliennali Del Tesoro, 3.000%, 01/11/15 EUR 749,000 743,060 761,673 0.48Italy Buoni Poliennali Del Tesoro, 3.750%, 15/04/16 EUR 749,000 753,818 776,728 0.48Italy Buoni Poliennali Del Tesoro, 3.750%, 01/08/16 EUR 1,647,000 1,648,596 1,707,297 1.07Italy Buoni Poliennali Del Tesoro, 4.750%, 15/09/16 EUR 1,496,000 1,543,252 1,600,690 1.00Italy Buoni Poliennali Del Tesoro, 4.000%, 01/02/17 EUR 935,000 938,976 973,092 0.61Italy Buoni Poliennali Del Tesoro, 4.750%, 01/05/17 EUR 1,385,000 1,421,091 1,476,853 0.92Italy Buoni Poliennali Del Tesoro, 4.750%, 01/06/17 EUR 1,100,000 1,117,388 1,172,809 0.73Italy Buoni Poliennali Del Tesoro, 5.250%, 01/08/17 EUR 702,000 734,624 764,162 0.48Italy Buoni Poliennali Del Tesoro, 4.500%, 01/02/18 EUR 476,000 488,309 502,147 0.31Italy Buoni Poliennali Del Tesoro, 4.500%, 01/08/18 EUR 779,000 787,037 818,978 0.51Italy Buoni Poliennali Del Tesoro, 4.250%, 01/02/19 EUR 416,000 421,993 429,982 0.27Italy Buoni Poliennali Del Tesoro, 4.500%, 01/03/19 EUR 579,000 577,547 606,045 0.38Italy Buoni Poliennali Del Tesoro, 4.250%, 01/09/19 EUR 692,000 643,916 712,801 0.44Italy Buoni Poliennali Del Tesoro, 4.500%, 01/02/20 EUR 147,000 152,915 152,767 0.10Italy Buoni Poliennali Del Tesoro, 4.250%, 01/03/20 EUR 961,000 938,600 983,026 0.61Italy Buoni Poliennali Del Tesoro, 4.000%, 01/09/20 EUR 675,000 651,979 679,394 0.42Italy Buoni Poliennali Del Tesoro, 3.750%, 01/03/21 EUR 768,000 718,530 755,766 0.47Italy Buoni Poliennali Del Tesoro, 3.750%, 01/08/21 EUR 374,000 347,466 365,656 0.23Italy Buoni Poliennali Del Tesoro, 4.750%, 01/09/21 EUR 743,000 741,898 774,808 0.48Italy Buoni Poliennali Del Tesoro, 5.000%, 01/03/22 EUR 1,019,000 1,034,909 1,073,527 0.67Italy Buoni Poliennali Del Tesoro, 5.500%, 01/09/22 EUR 1,399,000 1,438,006 1,518,307 0.95Italy Buoni Poliennali Del Tesoro, 4.750%, 01/08/23 EUR 583,000 572,628 597,779 0.37Italy Buoni Poliennali Del Tesoro, 9.000%, 01/11/23 EUR 1,347,000 1,742,841 1,839,948 1.15Italy Buoni Poliennali Del Tesoro, 5.000%, 01/03/25 EUR 803,000 805,168 832,173 0.52Italy Buoni Poliennali Del Tesoro, 4.500%, 01/03/26 EUR 192,000 172,787 189,965 0.12
44
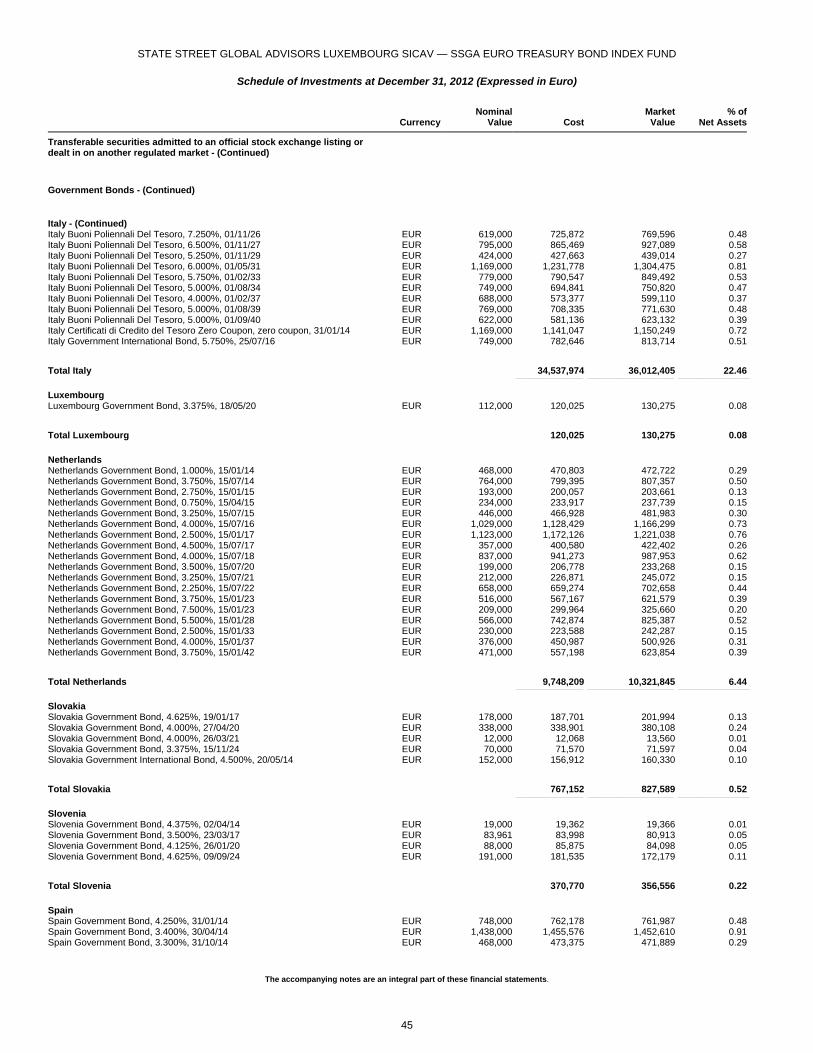
STATE STREET GLOBAL ADVISORS LUXEMBOURG SICAV — SSGA EURO TREASURY BOND INDEX FUND
Schedule of Investments at December 31, 2012 (Expressed in Euro)
The accompanying notes are an integral part of these financial statements.
Currency
NominalValue Cost
MarketValue
% ofNet Assets
Transferable securities admitted to an official stock exchange listing or dealt in on another regulated market - (Continued)
Government Bonds - (Continued)
Italy - (Continued) Italy Buoni Poliennali Del Tesoro, 7.250%, 01/11/26 EUR 619,000 725,872 769,596 0.48Italy Buoni Poliennali Del Tesoro, 6.500%, 01/11/27 EUR 795,000 865,469 927,089 0.58Italy Buoni Poliennali Del Tesoro, 5.250%, 01/11/29 EUR 424,000 427,663 439,014 0.27Italy Buoni Poliennali Del Tesoro, 6.000%, 01/05/31 EUR 1,169,000 1,231,778 1,304,475 0.81Italy Buoni Poliennali Del Tesoro, 5.750%, 01/02/33 EUR 779,000 790,547 849,492 0.53Italy Buoni Poliennali Del Tesoro, 5.000%, 01/08/34 EUR 749,000 694,841 750,820 0.47Italy Buoni Poliennali Del Tesoro, 4.000%, 01/02/37 EUR 688,000 573,377 599,110 0.37Italy Buoni Poliennali Del Tesoro, 5.000%, 01/08/39 EUR 769,000 708,335 771,630 0.48Italy Buoni Poliennali Del Tesoro, 5.000%, 01/09/40 EUR 622,000 581,136 623,132 0.39Italy Certificati di Credito del Tesoro Zero Coupon, zero coupon, 31/01/14 EUR 1,169,000 1,141,047 1,150,249 0.72Italy Government International Bond, 5.750%, 25/07/16 EUR 749,000 782,646 813,714 0.51
Total Italy 34,537,974 36,012,405 22.46 _______________________________________________ ____________________________________________________________ __________________________________________________
Luxembourg Luxembourg Government Bond, 3.375%, 18/05/20 EUR 112,000 120,025 130,275 0.08
Total Luxembourg 120,025 130,275 0.08 _______________________________________________ ____________________________________________________________ __________________________________________________
Netherlands Netherlands Government Bond, 1.000%, 15/01/14 EUR 468,000 470,803 472,722 0.29Netherlands Government Bond, 3.750%, 15/07/14 EUR 764,000 799,395 807,357 0.50Netherlands Government Bond, 2.750%, 15/01/15 EUR 193,000 200,057 203,661 0.13Netherlands Government Bond, 0.750%, 15/04/15 EUR 234,000 233,917 237,739 0.15Netherlands Government Bond, 3.250%, 15/07/15 EUR 446,000 466,928 481,983 0.30Netherlands Government Bond, 4.000%, 15/07/16 EUR 1,029,000 1,128,429 1,166,299 0.73Netherlands Government Bond, 2.500%, 15/01/17 EUR 1,123,000 1,172,126 1,221,038 0.76Netherlands Government Bond, 4.500%, 15/07/17 EUR 357,000 400,580 422,402 0.26Netherlands Government Bond, 4.000%, 15/07/18 EUR 837,000 941,273 987,953 0.62Netherlands Government Bond, 3.500%, 15/07/20 EUR 199,000 206,778 233,268 0.15Netherlands Government Bond, 3.250%, 15/07/21 EUR 212,000 226,871 245,072 0.15Netherlands Government Bond, 2.250%, 15/07/22 EUR 658,000 659,274 702,658 0.44Netherlands Government Bond, 3.750%, 15/01/23 EUR 516,000 567,167 621,579 0.39Netherlands Government Bond, 7.500%, 15/01/23 EUR 209,000 299,964 325,660 0.20Netherlands Government Bond, 5.500%, 15/01/28 EUR 566,000 742,874 825,387 0.52Netherlands Government Bond, 2.500%, 15/01/33 EUR 230,000 223,588 242,287 0.15Netherlands Government Bond, 4.000%, 15/01/37 EUR 376,000 450,987 500,926 0.31Netherlands Government Bond, 3.750%, 15/01/42 EUR 471,000 557,198 623,854 0.39
Total Netherlands 9,748,209 10,321,845 6.44 _______________________________________________ ____________________________________________________________ __________________________________________________
Slovakia Slovakia Government Bond, 4.625%, 19/01/17 EUR 178,000 187,701 201,994 0.13Slovakia Government Bond, 4.000%, 27/04/20 EUR 338,000 338,901 380,108 0.24Slovakia Government Bond, 4.000%, 26/03/21 EUR 12,000 12,068 13,560 0.01Slovakia Government Bond, 3.375%, 15/11/24 EUR 70,000 71,570 71,597 0.04Slovakia Government International Bond, 4.500%, 20/05/14 EUR 152,000 156,912 160,330 0.10
Total Slovakia 767,152 827,589 0.52 _______________________________________________ ____________________________________________________________ __________________________________________________
Slovenia Slovenia Government Bond, 4.375%, 02/04/14 EUR 19,000 19,362 19,366 0.01Slovenia Government Bond, 3.500%, 23/03/17 EUR 83,961 83,998 80,913 0.05Slovenia Government Bond, 4.125%, 26/01/20 EUR 88,000 85,875 84,098 0.05Slovenia Government Bond, 4.625%, 09/09/24 EUR 191,000 181,535 172,179 0.11
Total Slovenia 370,770 356,556 0.22 _______________________________________________ ____________________________________________________________ __________________________________________________
Spain Spain Government Bond, 4.250%, 31/01/14 EUR 748,000 762,178 761,987 0.48Spain Government Bond, 3.400%, 30/04/14 EUR 1,438,000 1,455,576 1,452,610 0.91Spain Government Bond, 3.300%, 31/10/14 EUR 468,000 473,375 471,889 0.29
45
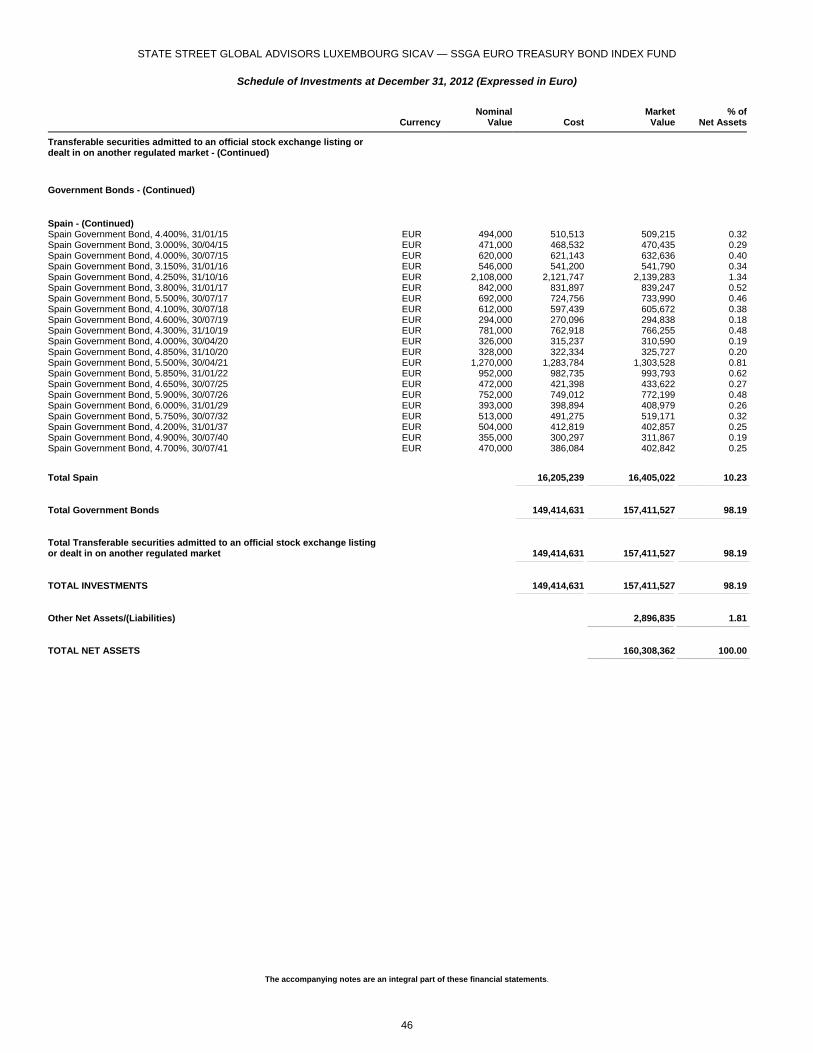
STATE STREET GLOBAL ADVISORS LUXEMBOURG SICAV — SSGA EURO TREASURY BOND INDEX FUND
Schedule of Investments at December 31, 2012 (Expressed in Euro)
The accompanying notes are an integral part of these financial statements.
Currency
NominalValue Cost
MarketValue
% ofNet Assets
Transferable securities admitted to an official stock exchange listing or dealt in on another regulated market - (Continued)
Government Bonds - (Continued)
Spain - (Continued) Spain Government Bond, 4.400%, 31/01/15 EUR 494,000 510,513 509,215 0.32Spain Government Bond, 3.000%, 30/04/15 EUR 471,000 468,532 470,435 0.29Spain Government Bond, 4.000%, 30/07/15 EUR 620,000 621,143 632,636 0.40Spain Government Bond, 3.150%, 31/01/16 EUR 546,000 541,200 541,790 0.34Spain Government Bond, 4.250%, 31/10/16 EUR 2,108,000 2,121,747 2,139,283 1.34Spain Government Bond, 3.800%, 31/01/17 EUR 842,000 831,897 839,247 0.52Spain Government Bond, 5.500%, 30/07/17 EUR 692,000 724,756 733,990 0.46Spain Government Bond, 4.100%, 30/07/18 EUR 612,000 597,439 605,672 0.38Spain Government Bond, 4.600%, 30/07/19 EUR 294,000 270,096 294,838 0.18Spain Government Bond, 4.300%, 31/10/19 EUR 781,000 762,918 766,255 0.48Spain Government Bond, 4.000%, 30/04/20 EUR 326,000 315,237 310,590 0.19Spain Government Bond, 4.850%, 31/10/20 EUR 328,000 322,334 325,727 0.20Spain Government Bond, 5.500%, 30/04/21 EUR 1,270,000 1,283,784 1,303,528 0.81Spain Government Bond, 5.850%, 31/01/22 EUR 952,000 982,735 993,793 0.62Spain Government Bond, 4.650%, 30/07/25 EUR 472,000 421,398 433,622 0.27Spain Government Bond, 5.900%, 30/07/26 EUR 752,000 749,012 772,199 0.48Spain Government Bond, 6.000%, 31/01/29 EUR 393,000 398,894 408,979 0.26Spain Government Bond, 5.750%, 30/07/32 EUR 513,000 491,275 519,171 0.32Spain Government Bond, 4.200%, 31/01/37 EUR 504,000 412,819 402,857 0.25Spain Government Bond, 4.900%, 30/07/40 EUR 355,000 300,297 311,867 0.19Spain Government Bond, 4.700%, 30/07/41 EUR 470,000 386,084 402,842 0.25
Total Spain 16,205,239 16,405,022 10.23 _______________________________________________ ____________________________________________________________ __________________________________________________
Total Government Bonds 149,414,631 157,411,527 98.19 _______________________________________________ ____________________________________________________________ __________________________________________________
Total Transferable securities admitted to an official stock exchange listing or dealt in on another regulated market 149,414,631 157,411,527 98.19 _______________________________________________ ____________________________________________________________ __________________________________________________
TOTAL INVESTMENTS 149,414,631 157,411,527 98.19 _______________________________________________ ____________________________________________________________ __________________________________________________
Other Net Assets/(Liabilities) 2,896,835 1.81 ____________________________________________________________ ___________________________________________________
TOTAL NET ASSETS 160,308,362 100.00 ____________________________________________________________ ___________________________________________________
46
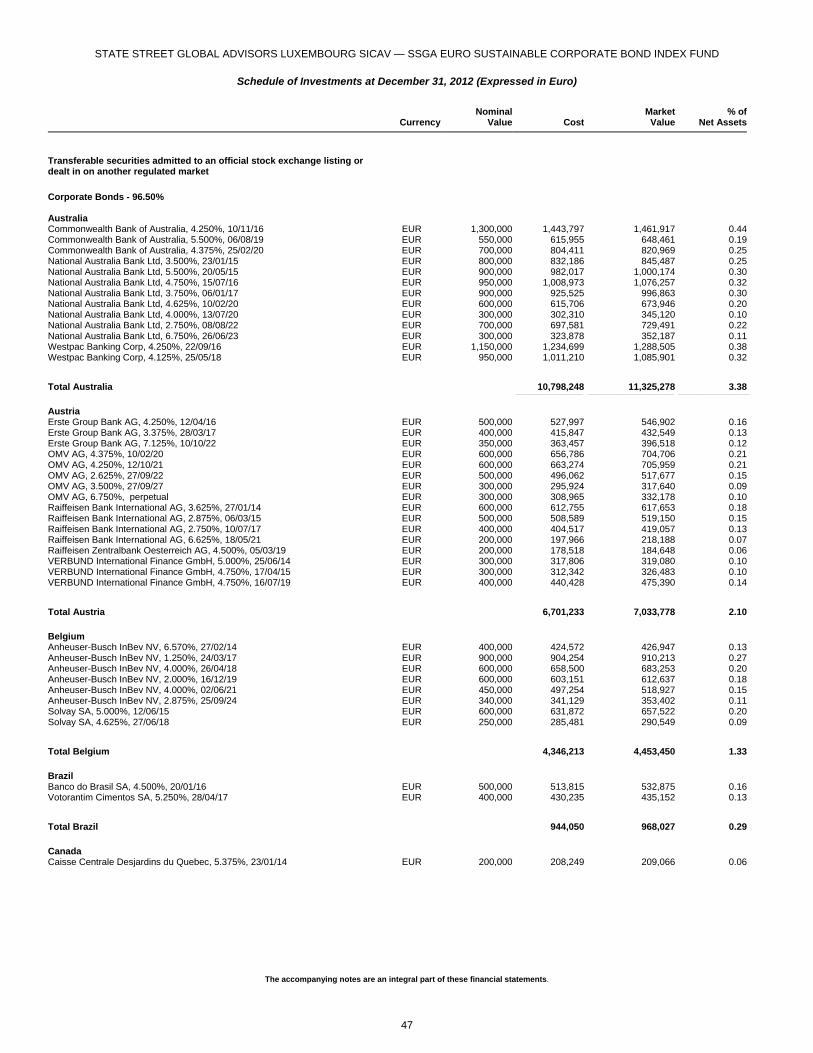
STATE STREET GLOBAL ADVISORS LUXEMBOURG SICAV — SSGA EURO SUSTAINABLE CORPORATE BOND INDEX FUND
Schedule of Investments at December 31, 2012 (Expressed in Euro)
The accompanying notes are an integral part of these financial statements.
Currency
NominalValue Cost
MarketValue
% ofNet Assets
Transferable securities admitted to an official stock exchange listing or dealt in on another regulated market
Corporate Bonds - 96.50% Australia Commonwealth Bank of Australia, 4.250%, 10/11/16 EUR 1,300,000 1,443,797 1,461,917 0.44Commonwealth Bank of Australia, 5.500%, 06/08/19 EUR 550,000 615,955 648,461 0.19Commonwealth Bank of Australia, 4.375%, 25/02/20 EUR 700,000 804,411 820,969 0.25National Australia Bank Ltd, 3.500%, 23/01/15 EUR 800,000 832,186 845,487 0.25National Australia Bank Ltd, 5.500%, 20/05/15 EUR 900,000 982,017 1,000,174 0.30National Australia Bank Ltd, 4.750%, 15/07/16 EUR 950,000 1,008,973 1,076,257 0.32National Australia Bank Ltd, 3.750%, 06/01/17 EUR 900,000 925,525 996,863 0.30National Australia Bank Ltd, 4.625%, 10/02/20 EUR 600,000 615,706 673,946 0.20National Australia Bank Ltd, 4.000%, 13/07/20 EUR 300,000 302,310 345,120 0.10National Australia Bank Ltd, 2.750%, 08/08/22 EUR 700,000 697,581 729,491 0.22National Australia Bank Ltd, 6.750%, 26/06/23 EUR 300,000 323,878 352,187 0.11Westpac Banking Corp, 4.250%, 22/09/16 EUR 1,150,000 1,234,699 1,288,505 0.38Westpac Banking Corp, 4.125%, 25/05/18 EUR 950,000 1,011,210 1,085,901 0.32
Total Australia 10,798,248 11,325,278 3.38 _______________________________________________ ____________________________________________________________ __________________________________________________
Austria Erste Group Bank AG, 4.250%, 12/04/16 EUR 500,000 527,997 546,902 0.16Erste Group Bank AG, 3.375%, 28/03/17 EUR 400,000 415,847 432,549 0.13Erste Group Bank AG, 7.125%, 10/10/22 EUR 350,000 363,457 396,518 0.12OMV AG, 4.375%, 10/02/20 EUR 600,000 656,786 704,706 0.21OMV AG, 4.250%, 12/10/21 EUR 600,000 663,274 705,959 0.21OMV AG, 2.625%, 27/09/22 EUR 500,000 496,062 517,677 0.15OMV AG, 3.500%, 27/09/27 EUR 300,000 295,924 317,640 0.09OMV AG, 6.750%, perpetual EUR 300,000 308,965 332,178 0.10Raiffeisen Bank International AG, 3.625%, 27/01/14 EUR 600,000 612,755 617,653 0.18Raiffeisen Bank International AG, 2.875%, 06/03/15 EUR 500,000 508,589 519,150 0.15Raiffeisen Bank International AG, 2.750%, 10/07/17 EUR 400,000 404,517 419,057 0.13Raiffeisen Bank International AG, 6.625%, 18/05/21 EUR 200,000 197,966 218,188 0.07Raiffeisen Zentralbank Oesterreich AG, 4.500%, 05/03/19 EUR 200,000 178,518 184,648 0.06VERBUND International Finance GmbH, 5.000%, 25/06/14 EUR 300,000 317,806 319,080 0.10VERBUND International Finance GmbH, 4.750%, 17/04/15 EUR 300,000 312,342 326,483 0.10VERBUND International Finance GmbH, 4.750%, 16/07/19 EUR 400,000 440,428 475,390 0.14
Total Austria 6,701,233 7,033,778 2.10 _______________________________________________ ____________________________________________________________ __________________________________________________
Belgium Anheuser-Busch InBev NV, 6.570%, 27/02/14 EUR 400,000 424,572 426,947 0.13Anheuser-Busch InBev NV, 1.250%, 24/03/17 EUR 900,000 904,254 910,213 0.27Anheuser-Busch InBev NV, 4.000%, 26/04/18 EUR 600,000 658,500 683,253 0.20Anheuser-Busch InBev NV, 2.000%, 16/12/19 EUR 600,000 603,151 612,637 0.18Anheuser-Busch InBev NV, 4.000%, 02/06/21 EUR 450,000 497,254 518,927 0.15Anheuser-Busch InBev NV, 2.875%, 25/09/24 EUR 340,000 341,129 353,402 0.11Solvay SA, 5.000%, 12/06/15 EUR 600,000 631,872 657,522 0.20Solvay SA, 4.625%, 27/06/18 EUR 250,000 285,481 290,549 0.09
Total Belgium 4,346,213 4,453,450 1.33 _______________________________________________ ____________________________________________________________ __________________________________________________
Brazil Banco do Brasil SA, 4.500%, 20/01/16 EUR 500,000 513,815 532,875 0.16Votorantim Cimentos SA, 5.250%, 28/04/17 EUR 400,000 430,235 435,152 0.13
Total Brazil 944,050 968,027 0.29 _______________________________________________ ____________________________________________________________ __________________________________________________
Canada Caisse Centrale Desjardins du Quebec, 5.375%, 23/01/14 EUR 200,000 208,249 209,066 0.06
47
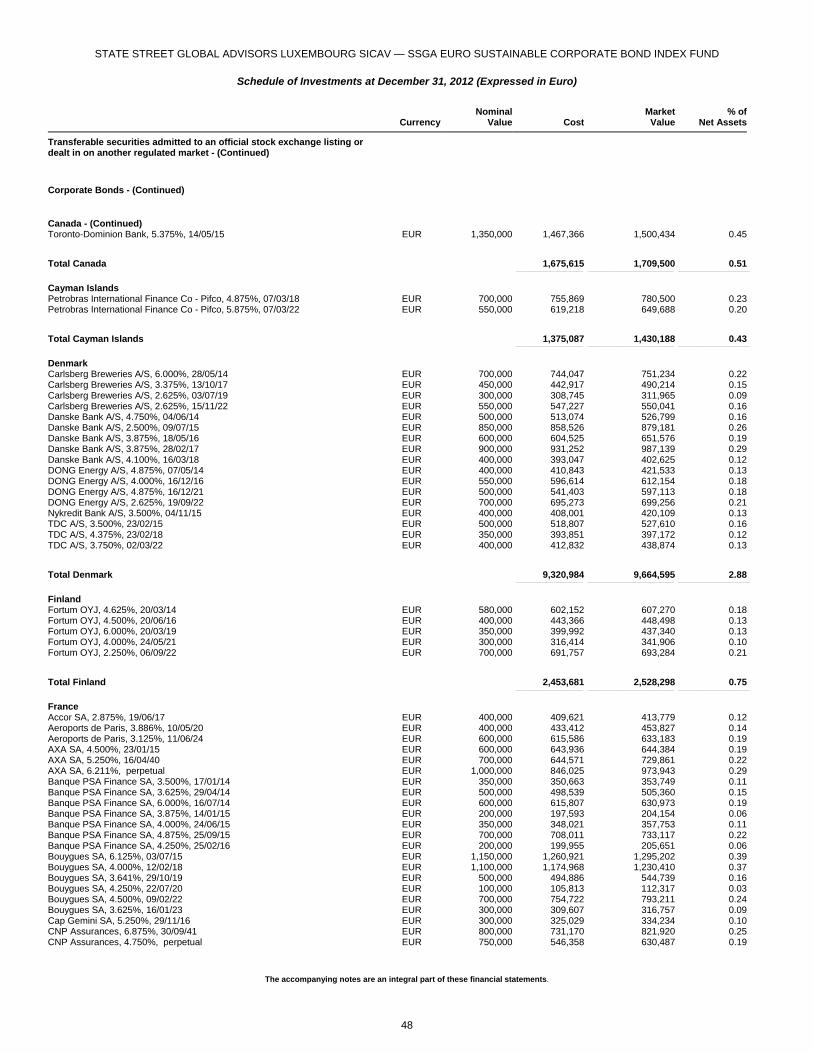
STATE STREET GLOBAL ADVISORS LUXEMBOURG SICAV — SSGA EURO SUSTAINABLE CORPORATE BOND INDEX FUND
Schedule of Investments at December 31, 2012 (Expressed in Euro)
The accompanying notes are an integral part of these financial statements.
Currency
NominalValue Cost
MarketValue
% ofNet Assets
Transferable securities admitted to an official stock exchange listing or dealt in on another regulated market - (Continued)
Corporate Bonds - (Continued)
Canada - (Continued) Toronto-Dominion Bank, 5.375%, 14/05/15 EUR 1,350,000 1,467,366 1,500,434 0.45
Total Canada 1,675,615 1,709,500 0.51 _______________________________________________ ____________________________________________________________ __________________________________________________
Cayman Islands Petrobras International Finance Co - Pifco, 4.875%, 07/03/18 EUR 700,000 755,869 780,500 0.23Petrobras International Finance Co - Pifco, 5.875%, 07/03/22 EUR 550,000 619,218 649,688 0.20
Total Cayman Islands 1,375,087 1,430,188 0.43 _______________________________________________ ____________________________________________________________ __________________________________________________
Denmark Carlsberg Breweries A/S, 6.000%, 28/05/14 EUR 700,000 744,047 751,234 0.22Carlsberg Breweries A/S, 3.375%, 13/10/17 EUR 450,000 442,917 490,214 0.15Carlsberg Breweries A/S, 2.625%, 03/07/19 EUR 300,000 308,745 311,965 0.09Carlsberg Breweries A/S, 2.625%, 15/11/22 EUR 550,000 547,227 550,041 0.16Danske Bank A/S, 4.750%, 04/06/14 EUR 500,000 513,074 526,799 0.16Danske Bank A/S, 2.500%, 09/07/15 EUR 850,000 858,526 879,181 0.26Danske Bank A/S, 3.875%, 18/05/16 EUR 600,000 604,525 651,576 0.19Danske Bank A/S, 3.875%, 28/02/17 EUR 900,000 931,252 987,139 0.29Danske Bank A/S, 4.100%, 16/03/18 EUR 400,000 393,047 402,625 0.12DONG Energy A/S, 4.875%, 07/05/14 EUR 400,000 410,843 421,533 0.13DONG Energy A/S, 4.000%, 16/12/16 EUR 550,000 596,614 612,154 0.18DONG Energy A/S, 4.875%, 16/12/21 EUR 500,000 541,403 597,113 0.18DONG Energy A/S, 2.625%, 19/09/22 EUR 700,000 695,273 699,256 0.21Nykredit Bank A/S, 3.500%, 04/11/15 EUR 400,000 408,001 420,109 0.13TDC A/S, 3.500%, 23/02/15 EUR 500,000 518,807 527,610 0.16TDC A/S, 4.375%, 23/02/18 EUR 350,000 393,851 397,172 0.12TDC A/S, 3.750%, 02/03/22 EUR 400,000 412,832 438,874 0.13
Total Denmark 9,320,984 9,664,595 2.88 _______________________________________________ ____________________________________________________________ __________________________________________________
Finland Fortum OYJ, 4.625%, 20/03/14 EUR 580,000 602,152 607,270 0.18Fortum OYJ, 4.500%, 20/06/16 EUR 400,000 443,366 448,498 0.13Fortum OYJ, 6.000%, 20/03/19 EUR 350,000 399,992 437,340 0.13Fortum OYJ, 4.000%, 24/05/21 EUR 300,000 316,414 341,906 0.10Fortum OYJ, 2.250%, 06/09/22 EUR 700,000 691,757 693,284 0.21
Total Finland 2,453,681 2,528,298 0.75 _______________________________________________ ____________________________________________________________ __________________________________________________
France Accor SA, 2.875%, 19/06/17 EUR 400,000 409,621 413,779 0.12Aeroports de Paris, 3.886%, 10/05/20 EUR 400,000 433,412 453,827 0.14Aeroports de Paris, 3.125%, 11/06/24 EUR 600,000 615,586 633,183 0.19AXA SA, 4.500%, 23/01/15 EUR 600,000 643,936 644,384 0.19AXA SA, 5.250%, 16/04/40 EUR 700,000 644,571 729,861 0.22AXA SA, 6.211%, perpetual EUR 1,000,000 846,025 973,943 0.29Banque PSA Finance SA, 3.500%, 17/01/14 EUR 350,000 350,663 353,749 0.11Banque PSA Finance SA, 3.625%, 29/04/14 EUR 500,000 498,539 505,360 0.15Banque PSA Finance SA, 6.000%, 16/07/14 EUR 600,000 615,807 630,973 0.19Banque PSA Finance SA, 3.875%, 14/01/15 EUR 200,000 197,593 204,154 0.06Banque PSA Finance SA, 4.000%, 24/06/15 EUR 350,000 348,021 357,753 0.11Banque PSA Finance SA, 4.875%, 25/09/15 EUR 700,000 708,011 733,117 0.22Banque PSA Finance SA, 4.250%, 25/02/16 EUR 200,000 199,955 205,651 0.06Bouygues SA, 6.125%, 03/07/15 EUR 1,150,000 1,260,921 1,295,202 0.39Bouygues SA, 4.000%, 12/02/18 EUR 1,100,000 1,174,968 1,230,410 0.37Bouygues SA, 3.641%, 29/10/19 EUR 500,000 494,886 544,739 0.16Bouygues SA, 4.250%, 22/07/20 EUR 100,000 105,813 112,317 0.03Bouygues SA, 4.500%, 09/02/22 EUR 700,000 754,722 793,211 0.24Bouygues SA, 3.625%, 16/01/23 EUR 300,000 309,607 316,757 0.09Cap Gemini SA, 5.250%, 29/11/16 EUR 300,000 325,029 334,234 0.10CNP Assurances, 6.875%, 30/09/41 EUR 800,000 731,170 821,920 0.25CNP Assurances, 4.750%, perpetual EUR 750,000 546,358 630,487 0.19
48

STATE STREET GLOBAL ADVISORS LUXEMBOURG SICAV — SSGA EURO SUSTAINABLE CORPORATE BOND INDEX FUND
Schedule of Investments at December 31, 2012 (Expressed in Euro)
The accompanying notes are an integral part of these financial statements.
Currency
NominalValue Cost
MarketValue
% ofNet Assets
Transferable securities admitted to an official stock exchange listing or dealt in on another regulated market - (Continued)
Corporate Bonds - (Continued)
France - (Continued) Danone SA, 6.375%, 04/02/14 EUR 500,000 526,269 531,342 0.16Danone SA, 5.500%, 06/05/15 EUR 400,000 443,287 444,907 0.13Danone SA, 2.500%, 29/09/16 EUR 100,000 100,604 105,866 0.03Danone SA, 1.125%, 27/11/17 EUR 600,000 599,176 602,505 0.18Danone SA, 3.600%, 23/11/20 EUR 200,000 206,554 227,925 0.07Imerys SA, 5.000%, 18/04/17 EUR 250,000 262,204 280,505 0.08Klepierre, 4.250%, 16/03/16 EUR 200,000 217,701 216,689 0.06Klepierre, 4.000%, 13/04/17 EUR 900,000 972,752 982,202 0.29Klepierre, 4.750%, 14/03/21 EUR 600,000 671,646 676,500 0.20Pernod-Ricard SA, 4.625%, 06/12/13 EUR 300,000 308,071 309,593 0.09Pernod-Ricard SA, 7.000%, 15/01/15 EUR 800,000 886,490 894,411 0.27Pernod-Ricard SA, 4.875%, 18/03/16 EUR 600,000 639,923 666,408 0.20Pernod-Ricard SA, 5.000%, 15/03/17 EUR 600,000 661,721 686,414 0.20RCI Banque SA, 4.000%, 02/12/13 EUR 250,000 250,041 255,463 0.08RCI Banque SA, 3.250%, 17/01/14 EUR 450,000 450,332 458,623 0.14RCI Banque SA, 3.750%, 07/07/14 EUR 600,000 603,828 619,737 0.19RCI Banque SA, 2.125%, 24/11/14 EUR 600,000 603,904 607,716 0.18RCI Banque SA, 4.375%, 27/01/15 EUR 400,000 410,194 422,092 0.13RCI Banque SA, 5.625%, 13/03/15 EUR 200,000 207,898 216,968 0.06RCI Banque SA, 5.625%, 05/10/15 EUR 450,000 473,516 494,781 0.15RCI Banque SA, 4.000%, 25/01/16 EUR 400,000 400,694 424,170 0.13RCI Banque SA, 4.000%, 16/03/16 EUR 350,000 352,752 372,208 0.11RCI Banque SA, 4.250%, 27/04/17 EUR 560,000 566,957 604,050 0.18Sanofi, 3.125%, 10/10/14 EUR 600,000 617,547 627,832 0.19Sanofi, 4.500%, 18/05/16 EUR 950,000 1,037,023 1,069,125 0.32Sanofi, 1.000%, 14/11/17 EUR 511,000 510,273 513,261 0.15Sanofi, 4.125%, 11/10/19 EUR 470,000 510,018 553,315 0.17Societe Des Autoroutes Paris-Rhin-Rhone, 4.375%, 25/01/16 EUR 1,000,000 1,063,382 1,080,113 0.32Societe Des Autoroutes Paris-Rhin-Rhone, 5.125%, 18/01/18 EUR 800,000 889,768 913,898 0.27Societe Des Autoroutes Paris-Rhin-Rhone, 4.875%, 21/01/19 EUR 200,000 219,041 227,593 0.07Sodexo, 4.500%, 28/03/14 EUR 100,000 103,908 104,476 0.03Sodexo, 6.250%, 30/01/15 EUR 700,000 755,814 776,692 0.23Solvay Finance SA, 6.375%, perpetual EUR 240,000 247,888 259,024 0.08Suez Environnement Co, 4.875%, 08/04/14 EUR 450,000 464,006 472,081 0.14Suez Environnement Co, 6.250%, 08/04/19 EUR 650,000 805,614 822,251 0.25Suez Environnement Co, 4.078%, 17/05/21 EUR 700,000 752,186 801,448 0.24Suez Environnement Co, 5.500%, 22/07/24 EUR 300,000 348,725 384,073 0.11Suez Environnement Co, 4.820%, perpetual EUR 500,000 502,282 508,787 0.15TPSA Eurofinance France SA, 6.000%, 22/05/14 EUR 400,000 421,805 426,675 0.13Unibail-Rodamco SE, 3.375%, 11/03/15 EUR 520,000 533,751 547,179 0.16Unibail-Rodamco SE, 3.500%, 06/04/16 EUR 700,000 729,655 752,861 0.22Unibail-Rodamco SE, 1.625%, 26/06/17 EUR 337,000 335,815 340,373 0.10Unibail-Rodamco SE, 3.875%, 13/12/17 EUR 300,000 304,499 334,064 0.10Unibail-Rodamco SE, 2.250%, 01/08/18 EUR 500,000 506,795 515,399 0.15Unibail-Rodamco SE, 3.000%, 22/03/19 EUR 600,000 611,436 641,796 0.19Unibail-Rodamco SE, 3.875%, 05/11/20 EUR 450,000 487,687 511,389 0.15Valeo SA, 5.750%, 19/01/17 EUR 400,000 430,694 451,452 0.13Valeo SA, 4.875%, 11/05/18 EUR 200,000 198,254 222,333 0.07WPP Finance SA, 5.250%, 30/01/15 EUR 580,000 609,998 629,753 0.19
Total France 37,029,592 38,507,329 11.49 _______________________________________________ ____________________________________________________________ __________________________________________________
Germany Allianz SE, 5.625%, 17/10/42 EUR 800,000 828,562 903,311 0.27Allianz SE, 5.500%, perpetual EUR 1,000,000 1,009,697 1,025,638 0.31Bertelsmann SE & Co KGaA, 7.875%, 16/01/14 EUR 600,000 633,803 643,734 0.19Bertelsmann SE & Co KGaA, 3.625%, 06/10/15 EUR 50,000 50,827 53,738 0.02Bertelsmann SE & Co KGaA, 4.750%, 26/09/16 EUR 800,000 880,997 902,309 0.27Bertelsmann SE & Co KGaA, 2.625%, 02/08/22 EUR 500,000 492,359 503,575 0.15DVB Bank SE, 2.500%, 15/05/15 EUR 600,000 614,890 619,672 0.19Linde AG, 1.750%, 17/09/20 EUR 700,000 696,708 702,718 0.21MAN SE, 1.000%, 21/09/15 EUR 600,000 601,485 605,540 0.18MAN SE, 2.125%, 13/03/17 EUR 500,000 516,307 519,518 0.16Merck Financial Services GmbH, 3.375%, 24/03/15 EUR 900,000 937,620 952,013 0.28Merck Financial Services GmbH, 4.500%, 24/03/20 EUR 800,000 880,879 944,884 0.28Metro AG, 5.750%, 14/07/14 EUR 400,000 426,863 427,672 0.13Metro AG, 7.625%, 05/03/15 EUR 350,000 383,669 395,850 0.12
49
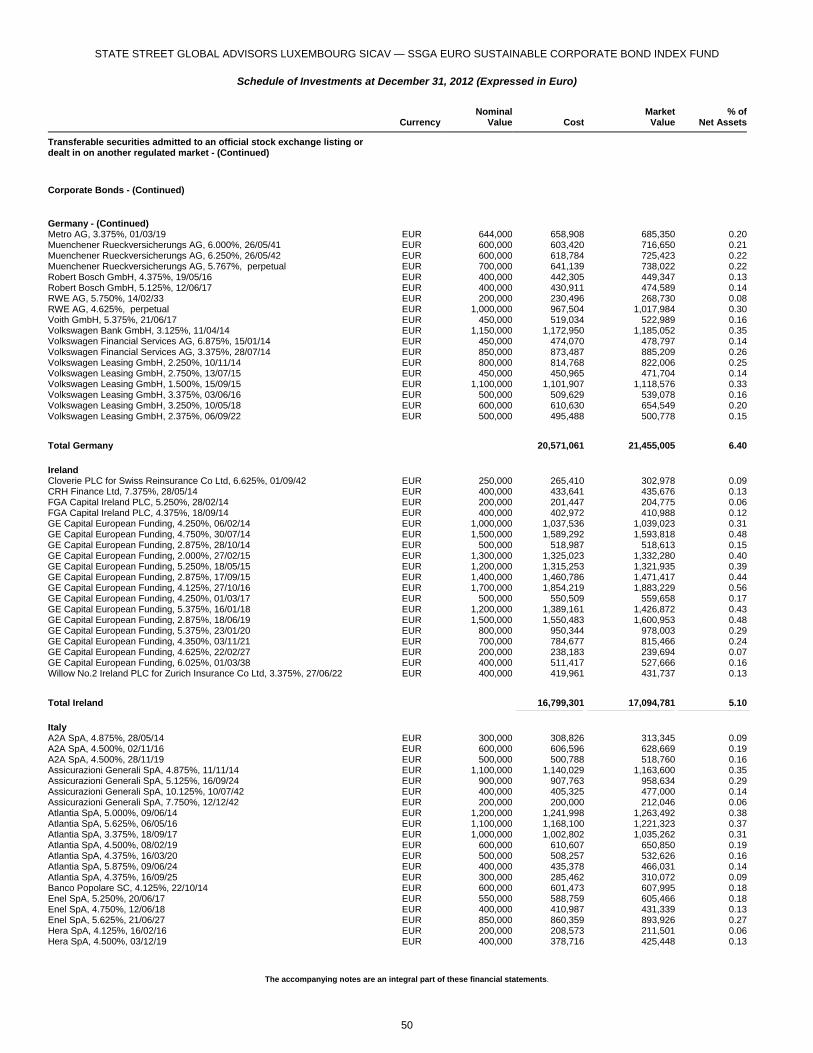
STATE STREET GLOBAL ADVISORS LUXEMBOURG SICAV — SSGA EURO SUSTAINABLE CORPORATE BOND INDEX FUND
Schedule of Investments at December 31, 2012 (Expressed in Euro)
The accompanying notes are an integral part of these financial statements.
Currency
NominalValue Cost
MarketValue
% ofNet Assets
Transferable securities admitted to an official stock exchange listing or dealt in on another regulated market - (Continued)
Corporate Bonds - (Continued)
Germany - (Continued) Metro AG, 3.375%, 01/03/19 EUR 644,000 658,908 685,350 0.20Muenchener Rueckversicherungs AG, 6.000%, 26/05/41 EUR 600,000 603,420 716,650 0.21Muenchener Rueckversicherungs AG, 6.250%, 26/05/42 EUR 600,000 618,784 725,423 0.22Muenchener Rueckversicherungs AG, 5.767%, perpetual EUR 700,000 641,139 738,022 0.22Robert Bosch GmbH, 4.375%, 19/05/16 EUR 400,000 442,305 449,347 0.13Robert Bosch GmbH, 5.125%, 12/06/17 EUR 400,000 430,911 474,589 0.14RWE AG, 5.750%, 14/02/33 EUR 200,000 230,496 268,730 0.08RWE AG, 4.625%, perpetual EUR 1,000,000 967,504 1,017,984 0.30Voith GmbH, 5.375%, 21/06/17 EUR 450,000 519,034 522,989 0.16Volkswagen Bank GmbH, 3.125%, 11/04/14 EUR 1,150,000 1,172,950 1,185,052 0.35Volkswagen Financial Services AG, 6.875%, 15/01/14 EUR 450,000 474,070 478,797 0.14Volkswagen Financial Services AG, 3.375%, 28/07/14 EUR 850,000 873,487 885,209 0.26Volkswagen Leasing GmbH, 2.250%, 10/11/14 EUR 800,000 814,768 822,006 0.25Volkswagen Leasing GmbH, 2.750%, 13/07/15 EUR 450,000 450,965 471,704 0.14Volkswagen Leasing GmbH, 1.500%, 15/09/15 EUR 1,100,000 1,101,907 1,118,576 0.33Volkswagen Leasing GmbH, 3.375%, 03/06/16 EUR 500,000 509,629 539,078 0.16Volkswagen Leasing GmbH, 3.250%, 10/05/18 EUR 600,000 610,630 654,549 0.20Volkswagen Leasing GmbH, 2.375%, 06/09/22 EUR 500,000 495,488 500,778 0.15
Total Germany 20,571,061 21,455,005 6.40 _______________________________________________ ____________________________________________________________ __________________________________________________
Ireland Cloverie PLC for Swiss Reinsurance Co Ltd, 6.625%, 01/09/42 EUR 250,000 265,410 302,978 0.09CRH Finance Ltd, 7.375%, 28/05/14 EUR 400,000 433,641 435,676 0.13FGA Capital Ireland PLC, 5.250%, 28/02/14 EUR 200,000 201,447 204,775 0.06FGA Capital Ireland PLC, 4.375%, 18/09/14 EUR 400,000 402,972 410,988 0.12GE Capital European Funding, 4.250%, 06/02/14 EUR 1,000,000 1,037,536 1,039,023 0.31GE Capital European Funding, 4.750%, 30/07/14 EUR 1,500,000 1,589,292 1,593,818 0.48GE Capital European Funding, 2.875%, 28/10/14 EUR 500,000 518,987 518,613 0.15GE Capital European Funding, 2.000%, 27/02/15 EUR 1,300,000 1,325,023 1,332,280 0.40GE Capital European Funding, 5.250%, 18/05/15 EUR 1,200,000 1,315,253 1,321,935 0.39GE Capital European Funding, 2.875%, 17/09/15 EUR 1,400,000 1,460,786 1,471,417 0.44GE Capital European Funding, 4.125%, 27/10/16 EUR 1,700,000 1,854,219 1,883,229 0.56GE Capital European Funding, 4.250%, 01/03/17 EUR 500,000 550,509 559,658 0.17GE Capital European Funding, 5.375%, 16/01/18 EUR 1,200,000 1,389,161 1,426,872 0.43GE Capital European Funding, 2.875%, 18/06/19 EUR 1,500,000 1,550,483 1,600,953 0.48GE Capital European Funding, 5.375%, 23/01/20 EUR 800,000 950,344 978,003 0.29GE Capital European Funding, 4.350%, 03/11/21 EUR 700,000 784,677 815,466 0.24GE Capital European Funding, 4.625%, 22/02/27 EUR 200,000 238,183 239,694 0.07GE Capital European Funding, 6.025%, 01/03/38 EUR 400,000 511,417 527,666 0.16Willow No.2 Ireland PLC for Zurich Insurance Co Ltd, 3.375%, 27/06/22 EUR 400,000 419,961 431,737 0.13
Total Ireland 16,799,301 17,094,781 5.10 _______________________________________________ ____________________________________________________________ __________________________________________________
Italy A2A SpA, 4.875%, 28/05/14 EUR 300,000 308,826 313,345 0.09A2A SpA, 4.500%, 02/11/16 EUR 600,000 606,596 628,669 0.19A2A SpA, 4.500%, 28/11/19 EUR 500,000 500,788 518,760 0.16Assicurazioni Generali SpA, 4.875%, 11/11/14 EUR 1,100,000 1,140,029 1,163,600 0.35Assicurazioni Generali SpA, 5.125%, 16/09/24 EUR 900,000 907,763 958,634 0.29Assicurazioni Generali SpA, 10.125%, 10/07/42 EUR 400,000 405,325 477,000 0.14Assicurazioni Generali SpA, 7.750%, 12/12/42 EUR 200,000 200,000 212,046 0.06Atlantia SpA, 5.000%, 09/06/14 EUR 1,200,000 1,241,998 1,263,492 0.38Atlantia SpA, 5.625%, 06/05/16 EUR 1,100,000 1,168,100 1,221,323 0.37Atlantia SpA, 3.375%, 18/09/17 EUR 1,000,000 1,002,802 1,035,262 0.31Atlantia SpA, 4.500%, 08/02/19 EUR 600,000 610,607 650,850 0.19Atlantia SpA, 4.375%, 16/03/20 EUR 500,000 508,257 532,626 0.16Atlantia SpA, 5.875%, 09/06/24 EUR 400,000 435,378 466,031 0.14Atlantia SpA, 4.375%, 16/09/25 EUR 300,000 285,462 310,072 0.09Banco Popolare SC, 4.125%, 22/10/14 EUR 600,000 601,473 607,995 0.18Enel SpA, 5.250%, 20/06/17 EUR 550,000 588,759 605,466 0.18Enel SpA, 4.750%, 12/06/18 EUR 400,000 410,987 431,339 0.13Enel SpA, 5.625%, 21/06/27 EUR 850,000 860,359 893,926 0.27Hera SpA, 4.125%, 16/02/16 EUR 200,000 208,573 211,501 0.06Hera SpA, 4.500%, 03/12/19 EUR 400,000 378,716 425,448 0.13
50
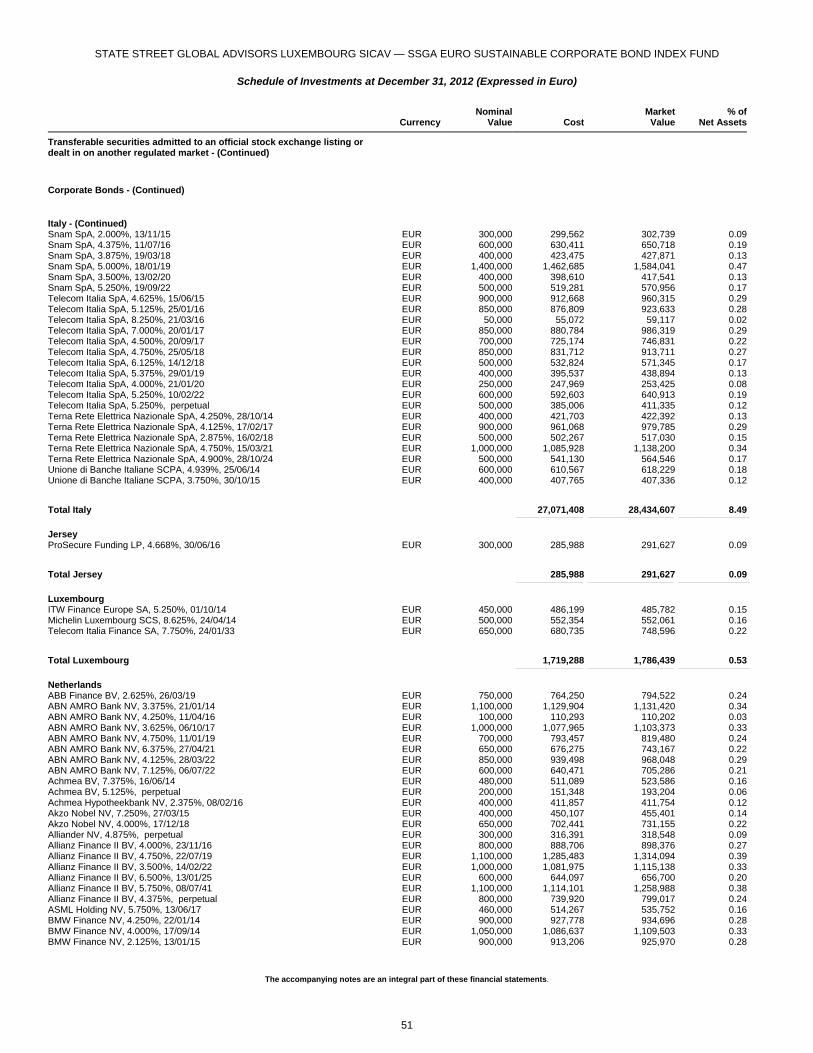
STATE STREET GLOBAL ADVISORS LUXEMBOURG SICAV — SSGA EURO SUSTAINABLE CORPORATE BOND INDEX FUND
Schedule of Investments at December 31, 2012 (Expressed in Euro)
The accompanying notes are an integral part of these financial statements.
Currency
NominalValue Cost
MarketValue
% ofNet Assets
Transferable securities admitted to an official stock exchange listing or dealt in on another regulated market - (Continued)
Corporate Bonds - (Continued)
Italy - (Continued) Snam SpA, 2.000%, 13/11/15 EUR 300,000 299,562 302,739 0.09Snam SpA, 4.375%, 11/07/16 EUR 600,000 630,411 650,718 0.19Snam SpA, 3.875%, 19/03/18 EUR 400,000 423,475 427,871 0.13Snam SpA, 5.000%, 18/01/19 EUR 1,400,000 1,462,685 1,584,041 0.47Snam SpA, 3.500%, 13/02/20 EUR 400,000 398,610 417,541 0.13Snam SpA, 5.250%, 19/09/22 EUR 500,000 519,281 570,956 0.17Telecom Italia SpA, 4.625%, 15/06/15 EUR 900,000 912,668 960,315 0.29Telecom Italia SpA, 5.125%, 25/01/16 EUR 850,000 876,809 923,633 0.28Telecom Italia SpA, 8.250%, 21/03/16 EUR 50,000 55,072 59,117 0.02Telecom Italia SpA, 7.000%, 20/01/17 EUR 850,000 880,784 986,319 0.29Telecom Italia SpA, 4.500%, 20/09/17 EUR 700,000 725,174 746,831 0.22Telecom Italia SpA, 4.750%, 25/05/18 EUR 850,000 831,712 913,711 0.27Telecom Italia SpA, 6.125%, 14/12/18 EUR 500,000 532,824 571,345 0.17Telecom Italia SpA, 5.375%, 29/01/19 EUR 400,000 395,537 438,894 0.13Telecom Italia SpA, 4.000%, 21/01/20 EUR 250,000 247,969 253,425 0.08Telecom Italia SpA, 5.250%, 10/02/22 EUR 600,000 592,603 640,913 0.19Telecom Italia SpA, 5.250%, perpetual EUR 500,000 385,006 411,335 0.12Terna Rete Elettrica Nazionale SpA, 4.250%, 28/10/14 EUR 400,000 421,703 422,392 0.13Terna Rete Elettrica Nazionale SpA, 4.125%, 17/02/17 EUR 900,000 961,068 979,785 0.29Terna Rete Elettrica Nazionale SpA, 2.875%, 16/02/18 EUR 500,000 502,267 517,030 0.15Terna Rete Elettrica Nazionale SpA, 4.750%, 15/03/21 EUR 1,000,000 1,085,928 1,138,200 0.34Terna Rete Elettrica Nazionale SpA, 4.900%, 28/10/24 EUR 500,000 541,130 564,546 0.17Unione di Banche Italiane SCPA, 4.939%, 25/06/14 EUR 600,000 610,567 618,229 0.18Unione di Banche Italiane SCPA, 3.750%, 30/10/15 EUR 400,000 407,765 407,336 0.12
Total Italy 27,071,408 28,434,607 8.49 _______________________________________________ ____________________________________________________________ __________________________________________________
Jersey ProSecure Funding LP, 4.668%, 30/06/16 EUR 300,000 285,988 291,627 0.09
Total Jersey 285,988 291,627 0.09 _______________________________________________ ____________________________________________________________ __________________________________________________
Luxembourg ITW Finance Europe SA, 5.250%, 01/10/14 EUR 450,000 486,199 485,782 0.15Michelin Luxembourg SCS, 8.625%, 24/04/14 EUR 500,000 552,354 552,061 0.16Telecom Italia Finance SA, 7.750%, 24/01/33 EUR 650,000 680,735 748,596 0.22
Total Luxembourg 1,719,288 1,786,439 0.53 _______________________________________________ ____________________________________________________________ __________________________________________________
Netherlands ABB Finance BV, 2.625%, 26/03/19 EUR 750,000 764,250 794,522 0.24ABN AMRO Bank NV, 3.375%, 21/01/14 EUR 1,100,000 1,129,904 1,131,420 0.34ABN AMRO Bank NV, 4.250%, 11/04/16 EUR 100,000 110,293 110,202 0.03ABN AMRO Bank NV, 3.625%, 06/10/17 EUR 1,000,000 1,077,965 1,103,373 0.33ABN AMRO Bank NV, 4.750%, 11/01/19 EUR 700,000 793,457 819,480 0.24ABN AMRO Bank NV, 6.375%, 27/04/21 EUR 650,000 676,275 743,167 0.22ABN AMRO Bank NV, 4.125%, 28/03/22 EUR 850,000 939,498 968,048 0.29ABN AMRO Bank NV, 7.125%, 06/07/22 EUR 600,000 640,471 705,286 0.21Achmea BV, 7.375%, 16/06/14 EUR 480,000 511,089 523,586 0.16Achmea BV, 5.125%, perpetual EUR 200,000 151,348 193,204 0.06Achmea Hypotheekbank NV, 2.375%, 08/02/16 EUR 400,000 411,857 411,754 0.12Akzo Nobel NV, 7.250%, 27/03/15 EUR 400,000 450,107 455,401 0.14Akzo Nobel NV, 4.000%, 17/12/18 EUR 650,000 702,441 731,155 0.22Alliander NV, 4.875%, perpetual EUR 300,000 316,391 318,548 0.09Allianz Finance II BV, 4.000%, 23/11/16 EUR 800,000 888,706 898,376 0.27Allianz Finance II BV, 4.750%, 22/07/19 EUR 1,100,000 1,285,483 1,314,094 0.39Allianz Finance II BV, 3.500%, 14/02/22 EUR 1,000,000 1,081,975 1,115,138 0.33Allianz Finance II BV, 6.500%, 13/01/25 EUR 600,000 644,097 656,700 0.20Allianz Finance II BV, 5.750%, 08/07/41 EUR 1,100,000 1,114,101 1,258,988 0.38Allianz Finance II BV, 4.375%, perpetual EUR 800,000 739,920 799,017 0.24ASML Holding NV, 5.750%, 13/06/17 EUR 460,000 514,267 535,752 0.16BMW Finance NV, 4.250%, 22/01/14 EUR 900,000 927,778 934,696 0.28BMW Finance NV, 4.000%, 17/09/14 EUR 1,050,000 1,086,637 1,109,503 0.33BMW Finance NV, 2.125%, 13/01/15 EUR 900,000 913,206 925,970 0.28
51
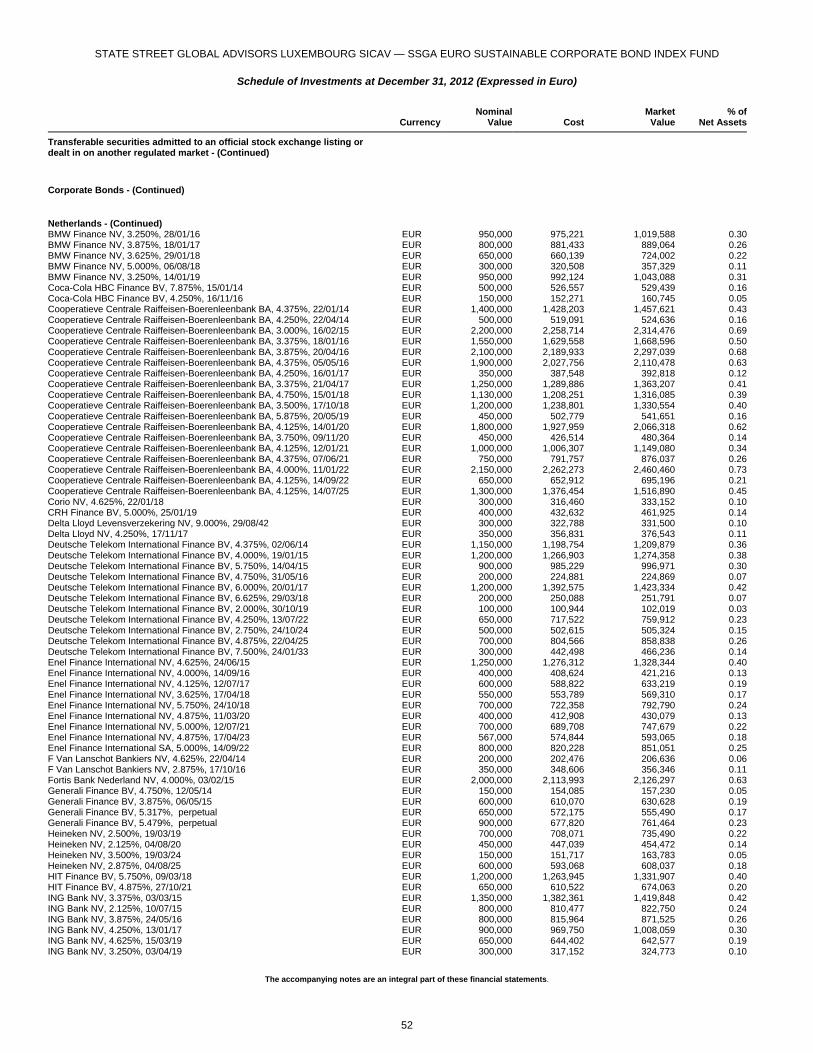
STATE STREET GLOBAL ADVISORS LUXEMBOURG SICAV — SSGA EURO SUSTAINABLE CORPORATE BOND INDEX FUND
Schedule of Investments at December 31, 2012 (Expressed in Euro)
The accompanying notes are an integral part of these financial statements.
Currency
NominalValue Cost
MarketValue
% ofNet Assets
Transferable securities admitted to an official stock exchange listing or dealt in on another regulated market - (Continued)
Corporate Bonds - (Continued)
Netherlands - (Continued) BMW Finance NV, 3.250%, 28/01/16 EUR 950,000 975,221 1,019,588 0.30BMW Finance NV, 3.875%, 18/01/17 EUR 800,000 881,433 889,064 0.26BMW Finance NV, 3.625%, 29/01/18 EUR 650,000 660,139 724,002 0.22BMW Finance NV, 5.000%, 06/08/18 EUR 300,000 320,508 357,329 0.11BMW Finance NV, 3.250%, 14/01/19 EUR 950,000 992,124 1,043,088 0.31Coca-Cola HBC Finance BV, 7.875%, 15/01/14 EUR 500,000 526,557 529,439 0.16Coca-Cola HBC Finance BV, 4.250%, 16/11/16 EUR 150,000 152,271 160,745 0.05Cooperatieve Centrale Raiffeisen-Boerenleenbank BA, 4.375%, 22/01/14 EUR 1,400,000 1,428,203 1,457,621 0.43Cooperatieve Centrale Raiffeisen-Boerenleenbank BA, 4.250%, 22/04/14 EUR 500,000 519,091 524,636 0.16Cooperatieve Centrale Raiffeisen-Boerenleenbank BA, 3.000%, 16/02/15 EUR 2,200,000 2,258,714 2,314,476 0.69Cooperatieve Centrale Raiffeisen-Boerenleenbank BA, 3.375%, 18/01/16 EUR 1,550,000 1,629,558 1,668,596 0.50Cooperatieve Centrale Raiffeisen-Boerenleenbank BA, 3.875%, 20/04/16 EUR 2,100,000 2,189,933 2,297,039 0.68Cooperatieve Centrale Raiffeisen-Boerenleenbank BA, 4.375%, 05/05/16 EUR 1,900,000 2,027,756 2,110,478 0.63Cooperatieve Centrale Raiffeisen-Boerenleenbank BA, 4.250%, 16/01/17 EUR 350,000 387,548 392,818 0.12Cooperatieve Centrale Raiffeisen-Boerenleenbank BA, 3.375%, 21/04/17 EUR 1,250,000 1,289,886 1,363,207 0.41Cooperatieve Centrale Raiffeisen-Boerenleenbank BA, 4.750%, 15/01/18 EUR 1,130,000 1,208,251 1,316,085 0.39Cooperatieve Centrale Raiffeisen-Boerenleenbank BA, 3.500%, 17/10/18 EUR 1,200,000 1,238,801 1,330,554 0.40Cooperatieve Centrale Raiffeisen-Boerenleenbank BA, 5.875%, 20/05/19 EUR 450,000 502,779 541,651 0.16Cooperatieve Centrale Raiffeisen-Boerenleenbank BA, 4.125%, 14/01/20 EUR 1,800,000 1,927,959 2,066,318 0.62Cooperatieve Centrale Raiffeisen-Boerenleenbank BA, 3.750%, 09/11/20 EUR 450,000 426,514 480,364 0.14Cooperatieve Centrale Raiffeisen-Boerenleenbank BA, 4.125%, 12/01/21 EUR 1,000,000 1,006,307 1,149,080 0.34Cooperatieve Centrale Raiffeisen-Boerenleenbank BA, 4.375%, 07/06/21 EUR 750,000 791,757 876,037 0.26Cooperatieve Centrale Raiffeisen-Boerenleenbank BA, 4.000%, 11/01/22 EUR 2,150,000 2,262,273 2,460,460 0.73Cooperatieve Centrale Raiffeisen-Boerenleenbank BA, 4.125%, 14/09/22 EUR 650,000 652,912 695,196 0.21Cooperatieve Centrale Raiffeisen-Boerenleenbank BA, 4.125%, 14/07/25 EUR 1,300,000 1,376,454 1,516,890 0.45Corio NV, 4.625%, 22/01/18 EUR 300,000 316,460 333,152 0.10CRH Finance BV, 5.000%, 25/01/19 EUR 400,000 432,632 461,925 0.14Delta Lloyd Levensverzekering NV, 9.000%, 29/08/42 EUR 300,000 322,788 331,500 0.10Delta Lloyd NV, 4.250%, 17/11/17 EUR 350,000 356,831 376,543 0.11Deutsche Telekom International Finance BV, 4.375%, 02/06/14 EUR 1,150,000 1,198,754 1,209,879 0.36Deutsche Telekom International Finance BV, 4.000%, 19/01/15 EUR 1,200,000 1,266,903 1,274,358 0.38Deutsche Telekom International Finance BV, 5.750%, 14/04/15 EUR 900,000 985,229 996,971 0.30Deutsche Telekom International Finance BV, 4.750%, 31/05/16 EUR 200,000 224,881 224,869 0.07Deutsche Telekom International Finance BV, 6.000%, 20/01/17 EUR 1,200,000 1,392,575 1,423,334 0.42Deutsche Telekom International Finance BV, 6.625%, 29/03/18 EUR 200,000 250,088 251,791 0.07Deutsche Telekom International Finance BV, 2.000%, 30/10/19 EUR 100,000 100,944 102,019 0.03Deutsche Telekom International Finance BV, 4.250%, 13/07/22 EUR 650,000 717,522 759,912 0.23Deutsche Telekom International Finance BV, 2.750%, 24/10/24 EUR 500,000 502,615 505,324 0.15Deutsche Telekom International Finance BV, 4.875%, 22/04/25 EUR 700,000 804,566 858,838 0.26Deutsche Telekom International Finance BV, 7.500%, 24/01/33 EUR 300,000 442,498 466,236 0.14Enel Finance International NV, 4.625%, 24/06/15 EUR 1,250,000 1,276,312 1,328,344 0.40Enel Finance International NV, 4.000%, 14/09/16 EUR 400,000 408,624 421,216 0.13Enel Finance International NV, 4.125%, 12/07/17 EUR 600,000 588,822 633,219 0.19Enel Finance International NV, 3.625%, 17/04/18 EUR 550,000 553,789 569,310 0.17Enel Finance International NV, 5.750%, 24/10/18 EUR 700,000 722,358 792,790 0.24Enel Finance International NV, 4.875%, 11/03/20 EUR 400,000 412,908 430,079 0.13Enel Finance International NV, 5.000%, 12/07/21 EUR 700,000 689,708 747,679 0.22Enel Finance International NV, 4.875%, 17/04/23 EUR 567,000 574,844 593,065 0.18Enel Finance International SA, 5.000%, 14/09/22 EUR 800,000 820,228 851,051 0.25F Van Lanschot Bankiers NV, 4.625%, 22/04/14 EUR 200,000 202,476 206,636 0.06F Van Lanschot Bankiers NV, 2.875%, 17/10/16 EUR 350,000 348,606 356,346 0.11Fortis Bank Nederland NV, 4.000%, 03/02/15 EUR 2,000,000 2,113,993 2,126,297 0.63Generali Finance BV, 4.750%, 12/05/14 EUR 150,000 154,085 157,230 0.05Generali Finance BV, 3.875%, 06/05/15 EUR 600,000 610,070 630,628 0.19Generali Finance BV, 5.317%, perpetual EUR 650,000 572,175 555,490 0.17Generali Finance BV, 5.479%, perpetual EUR 900,000 677,820 761,464 0.23Heineken NV, 2.500%, 19/03/19 EUR 700,000 708,071 735,490 0.22Heineken NV, 2.125%, 04/08/20 EUR 450,000 447,039 454,472 0.14Heineken NV, 3.500%, 19/03/24 EUR 150,000 151,717 163,783 0.05Heineken NV, 2.875%, 04/08/25 EUR 600,000 593,068 608,037 0.18HIT Finance BV, 5.750%, 09/03/18 EUR 1,200,000 1,263,945 1,331,907 0.40HIT Finance BV, 4.875%, 27/10/21 EUR 650,000 610,522 674,063 0.20ING Bank NV, 3.375%, 03/03/15 EUR 1,350,000 1,382,361 1,419,848 0.42ING Bank NV, 2.125%, 10/07/15 EUR 800,000 810,477 822,750 0.24ING Bank NV, 3.875%, 24/05/16 EUR 800,000 815,964 871,525 0.26ING Bank NV, 4.250%, 13/01/17 EUR 900,000 969,750 1,008,059 0.30ING Bank NV, 4.625%, 15/03/19 EUR 650,000 644,402 642,577 0.19ING Bank NV, 3.250%, 03/04/19 EUR 300,000 317,152 324,773 0.10
52
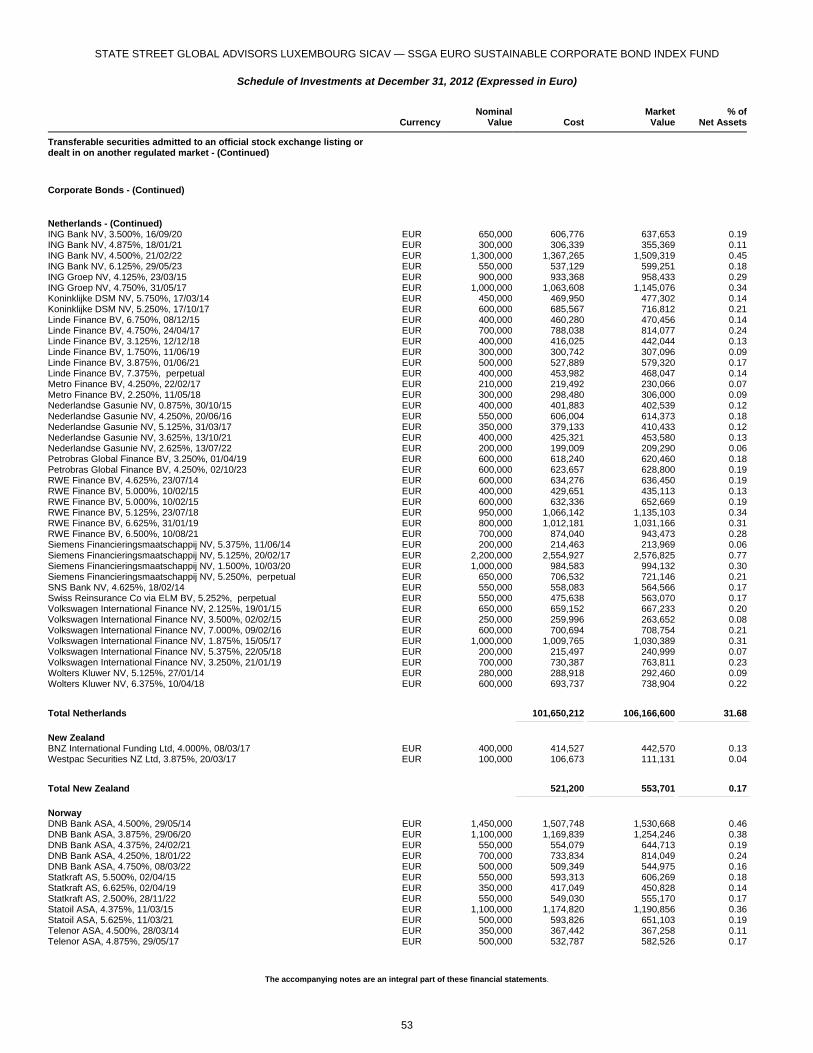
STATE STREET GLOBAL ADVISORS LUXEMBOURG SICAV — SSGA EURO SUSTAINABLE CORPORATE BOND INDEX FUND
Schedule of Investments at December 31, 2012 (Expressed in Euro)
The accompanying notes are an integral part of these financial statements.
Currency
NominalValue Cost
MarketValue
% ofNet Assets
Transferable securities admitted to an official stock exchange listing or dealt in on another regulated market - (Continued)
Corporate Bonds - (Continued)
Netherlands - (Continued) ING Bank NV, 3.500%, 16/09/20 EUR 650,000 606,776 637,653 0.19ING Bank NV, 4.875%, 18/01/21 EUR 300,000 306,339 355,369 0.11ING Bank NV, 4.500%, 21/02/22 EUR 1,300,000 1,367,265 1,509,319 0.45ING Bank NV, 6.125%, 29/05/23 EUR 550,000 537,129 599,251 0.18ING Groep NV, 4.125%, 23/03/15 EUR 900,000 933,368 958,433 0.29ING Groep NV, 4.750%, 31/05/17 EUR 1,000,000 1,063,608 1,145,076 0.34Koninklijke DSM NV, 5.750%, 17/03/14 EUR 450,000 469,950 477,302 0.14Koninklijke DSM NV, 5.250%, 17/10/17 EUR 600,000 685,567 716,812 0.21Linde Finance BV, 6.750%, 08/12/15 EUR 400,000 460,280 470,456 0.14Linde Finance BV, 4.750%, 24/04/17 EUR 700,000 788,038 814,077 0.24Linde Finance BV, 3.125%, 12/12/18 EUR 400,000 416,025 442,044 0.13Linde Finance BV, 1.750%, 11/06/19 EUR 300,000 300,742 307,096 0.09Linde Finance BV, 3.875%, 01/06/21 EUR 500,000 527,889 579,320 0.17Linde Finance BV, 7.375%, perpetual EUR 400,000 453,982 468,047 0.14Metro Finance BV, 4.250%, 22/02/17 EUR 210,000 219,492 230,066 0.07Metro Finance BV, 2.250%, 11/05/18 EUR 300,000 298,480 306,000 0.09Nederlandse Gasunie NV, 0.875%, 30/10/15 EUR 400,000 401,883 402,539 0.12Nederlandse Gasunie NV, 4.250%, 20/06/16 EUR 550,000 606,004 614,373 0.18Nederlandse Gasunie NV, 5.125%, 31/03/17 EUR 350,000 379,133 410,433 0.12Nederlandse Gasunie NV, 3.625%, 13/10/21 EUR 400,000 425,321 453,580 0.13Nederlandse Gasunie NV, 2.625%, 13/07/22 EUR 200,000 199,009 209,290 0.06Petrobras Global Finance BV, 3.250%, 01/04/19 EUR 600,000 618,240 620,460 0.18Petrobras Global Finance BV, 4.250%, 02/10/23 EUR 600,000 623,657 628,800 0.19RWE Finance BV, 4.625%, 23/07/14 EUR 600,000 634,276 636,450 0.19RWE Finance BV, 5.000%, 10/02/15 EUR 400,000 429,651 435,113 0.13RWE Finance BV, 5.000%, 10/02/15 EUR 600,000 632,336 652,669 0.19RWE Finance BV, 5.125%, 23/07/18 EUR 950,000 1,066,142 1,135,103 0.34RWE Finance BV, 6.625%, 31/01/19 EUR 800,000 1,012,181 1,031,166 0.31RWE Finance BV, 6.500%, 10/08/21 EUR 700,000 874,040 943,473 0.28Siemens Financieringsmaatschappij NV, 5.375%, 11/06/14 EUR 200,000 214,463 213,969 0.06Siemens Financieringsmaatschappij NV, 5.125%, 20/02/17 EUR 2,200,000 2,554,927 2,576,825 0.77Siemens Financieringsmaatschappij NV, 1.500%, 10/03/20 EUR 1,000,000 984,583 994,132 0.30Siemens Financieringsmaatschappij NV, 5.250%, perpetual EUR 650,000 706,532 721,146 0.21SNS Bank NV, 4.625%, 18/02/14 EUR 550,000 558,083 564,566 0.17Swiss Reinsurance Co via ELM BV, 5.252%, perpetual EUR 550,000 475,638 563,070 0.17Volkswagen International Finance NV, 2.125%, 19/01/15 EUR 650,000 659,152 667,233 0.20Volkswagen International Finance NV, 3.500%, 02/02/15 EUR 250,000 259,996 263,652 0.08Volkswagen International Finance NV, 7.000%, 09/02/16 EUR 600,000 700,694 708,754 0.21Volkswagen International Finance NV, 1.875%, 15/05/17 EUR 1,000,000 1,009,765 1,030,389 0.31Volkswagen International Finance NV, 5.375%, 22/05/18 EUR 200,000 215,497 240,999 0.07Volkswagen International Finance NV, 3.250%, 21/01/19 EUR 700,000 730,387 763,811 0.23Wolters Kluwer NV, 5.125%, 27/01/14 EUR 280,000 288,918 292,460 0.09Wolters Kluwer NV, 6.375%, 10/04/18 EUR 600,000 693,737 738,904 0.22
Total Netherlands 101,650,212 106,166,600 31.68 _______________________________________________ ____________________________________________________________ __________________________________________________
New Zealand BNZ International Funding Ltd, 4.000%, 08/03/17 EUR 400,000 414,527 442,570 0.13Westpac Securities NZ Ltd, 3.875%, 20/03/17 EUR 100,000 106,673 111,131 0.04
Total New Zealand 521,200 553,701 0.17 _______________________________________________ ____________________________________________________________ __________________________________________________
Norway DNB Bank ASA, 4.500%, 29/05/14 EUR 1,450,000 1,507,748 1,530,668 0.46DNB Bank ASA, 3.875%, 29/06/20 EUR 1,100,000 1,169,839 1,254,246 0.38DNB Bank ASA, 4.375%, 24/02/21 EUR 550,000 554,079 644,713 0.19DNB Bank ASA, 4.250%, 18/01/22 EUR 700,000 733,834 814,049 0.24DNB Bank ASA, 4.750%, 08/03/22 EUR 500,000 509,349 544,975 0.16Statkraft AS, 5.500%, 02/04/15 EUR 550,000 593,313 606,269 0.18Statkraft AS, 6.625%, 02/04/19 EUR 350,000 417,049 450,828 0.14Statkraft AS, 2.500%, 28/11/22 EUR 550,000 549,030 555,170 0.17Statoil ASA, 4.375%, 11/03/15 EUR 1,100,000 1,174,820 1,190,856 0.36Statoil ASA, 5.625%, 11/03/21 EUR 500,000 593,826 651,103 0.19Telenor ASA, 4.500%, 28/03/14 EUR 350,000 367,442 367,258 0.11Telenor ASA, 4.875%, 29/05/17 EUR 500,000 532,787 582,526 0.17
53

STATE STREET GLOBAL ADVISORS LUXEMBOURG SICAV — SSGA EURO SUSTAINABLE CORPORATE BOND INDEX FUND
Schedule of Investments at December 31, 2012 (Expressed in Euro)
The accompanying notes are an integral part of these financial statements.
Currency
NominalValue Cost
MarketValue
% ofNet Assets
Transferable securities admitted to an official stock exchange listing or dealt in on another regulated market - (Continued)
Corporate Bonds - (Continued)
Norway - (Continued) Telenor ASA, 1.750%, 15/01/18 EUR 400,000 401,424 410,547 0.12Telenor ASA, 4.125%, 26/03/20 EUR 400,000 428,242 462,266 0.14Telenor ASA, 2.750%, 27/06/22 EUR 400,000 406,935 415,802 0.12
Total Norway 9,939,717 10,481,276 3.13 _______________________________________________ ____________________________________________________________ __________________________________________________
Spain Abertis Infraestructuras SA, 4.625%, 14/10/16 EUR 650,000 641,181 686,001 0.21Abertis Infraestructuras SA, 5.125%, 12/06/17 EUR 200,000 194,917 215,886 0.06Abertis Infraestructuras SA, 5.125%, 12/06/17 EUR 300,000 312,391 323,829 0.10Abertis Infraestructuras SA, 4.750%, 25/10/19 EUR 300,000 306,827 315,169 0.09Abertis Infraestructuras SA, 4.375%, 30/03/20 EUR 700,000 658,650 709,402 0.21CaixaBank, 4.125%, 20/11/14 EUR 600,000 596,405 603,214 0.18Enagas Financiaciones SAU, 4.250%, 05/10/17 EUR 400,000 410,821 419,375 0.13Enagas SA, 4.375%, 06/07/15 EUR 200,000 206,797 211,079 0.06Gas Natural Capital Markets SA, 5.250%, 09/07/14 EUR 1,200,000 1,238,354 1,265,549 0.38Gas Natural Capital Markets SA, 3.375%, 27/01/15 EUR 500,000 502,791 516,962 0.15Gas Natural Capital Markets SA, 4.375%, 02/11/16 EUR 700,000 695,354 749,766 0.22Gas Natural Capital Markets SA, 5.625%, 09/02/17 EUR 500,000 511,137 560,100 0.17Gas Natural Capital Markets SA, 4.125%, 24/04/17 EUR 300,000 299,342 319,410 0.10Gas Natural Capital Markets SA, 4.125%, 26/01/18 EUR 550,000 519,882 581,978 0.17Gas Natural Capital Markets SA, 5.000%, 13/02/18 EUR 800,000 810,990 878,740 0.26Gas Natural Capital Markets SA, 5.375%, 24/05/19 EUR 400,000 395,565 444,518 0.13Gas Natural Capital Markets SA, 6.000%, 27/01/20 EUR 400,000 400,689 455,353 0.14Gas Natural Capital Markets SA, 4.500%, 27/01/20 EUR 350,000 328,069 367,229 0.11Gas Natural Capital Markets SA, 5.125%, 02/11/21 EUR 300,000 298,187 324,659 0.10Red Electrica Financiaciones SA Unipersonal, 3.500%, 07/10/16 EUR 400,000 394,025 416,293 0.12Red Electrica Financiaciones SA Unipersonal, 4.750%, 16/02/18 EUR 300,000 314,226 326,206 0.10Red Electrica Financiaciones SA Unipersonal, 4.875%, 29/04/20 EUR 300,000 299,990 323,130 0.10
Total Spain 10,336,590 11,013,848 3.29 _______________________________________________ ____________________________________________________________ __________________________________________________
Sweden Akzo Nobel Sweden Finance AB, 7.750%, 31/01/14 EUR 400,000 420,426 428,938 0.13Akzo Nobel Sweden Finance AB, 2.625%, 27/07/22 EUR 500,000 498,029 501,607 0.15Nordea Bank AB, 4.500%, 12/05/14 EUR 900,000 928,525 949,098 0.28Nordea Bank AB, 2.750%, 11/08/15 EUR 900,000 923,691 945,946 0.28Nordea Bank AB, 3.625%, 11/02/16 EUR 880,000 904,117 953,381 0.28Nordea Bank AB, 3.750%, 24/02/17 EUR 800,000 846,161 884,907 0.26Nordea Bank AB, 2.250%, 05/10/17 EUR 900,000 923,627 942,089 0.28Nordea Bank AB, 4.000%, 11/07/19 EUR 1,050,000 1,148,309 1,197,688 0.36Nordea Bank AB, 4.500%, 26/03/20 EUR 400,000 392,869 440,609 0.13Nordea Bank AB, 4.000%, 29/06/20 EUR 600,000 622,191 688,299 0.21Nordea Bank AB, 4.000%, 29/03/21 EUR 700,000 698,996 753,935 0.23Nordea Bank AB, 4.625%, 15/02/22 EUR 500,000 514,022 540,357 0.16Nordea Bank AB, 3.250%, 05/07/22 EUR 500,000 519,842 541,567 0.16Sandvik AB, 6.875%, 25/02/14 EUR 350,000 369,878 374,542 0.11Skandinaviska Enskilda Banken AB, 5.500%, 06/05/14 EUR 420,000 435,765 447,766 0.13Skandinaviska Enskilda Banken AB, 2.500%, 01/09/15 EUR 50,000 50,866 52,171 0.02Skandinaviska Enskilda Banken AB, 3.750%, 19/05/16 EUR 700,000 727,523 762,161 0.23Skandinaviska Enskilda Banken AB, 3.875%, 12/04/17 EUR 950,000 1,023,531 1,054,580 0.32Skandinaviska Enskilda Banken AB, 4.250%, 21/02/18 EUR 300,000 313,314 341,430 0.10Skandinaviska Enskilda Banken AB, 1.875%, 14/11/19 EUR 600,000 598,411 604,017 0.18Skandinaviska Enskilda Banken AB, 4.000%, 12/09/22 EUR 400,000 405,500 422,955 0.13Skandinaviska Enskilda Banken AB, 9.250%, perpetual EUR 500,000 538,242 544,000 0.16Skandinaviska Enskilda Banken AB, 7.092%, perpetual EUR 300,000 320,444 324,300 0.10Svenska Cellulosa AB, 3.625%, 26/08/16 EUR 400,000 421,471 437,050 0.13Svenska Handelsbanken AB, 4.875%, 25/03/14 EUR 450,000 461,994 474,223 0.14Svenska Handelsbanken AB, 1.500%, 06/07/15 EUR 1,100,000 1,113,732 1,120,135 0.33Svenska Handelsbanken AB, 3.625%, 16/02/16 EUR 750,000 779,711 814,425 0.24Svenska Handelsbanken AB, 3.750%, 24/02/17 EUR 700,000 744,394 775,832 0.23Svenska Handelsbanken AB, 3.375%, 17/07/17 EUR 900,000 943,681 988,790 0.30Svenska Handelsbanken AB, 2.250%, 14/06/18 EUR 1,050,000 1,060,082 1,099,598 0.33Svenska Handelsbanken AB, 4.375%, 20/10/21 EUR 500,000 524,491 589,807 0.18Svenska Handelsbanken AB, 2.625%, 23/08/22 EUR 700,000 698,828 721,378 0.22
54
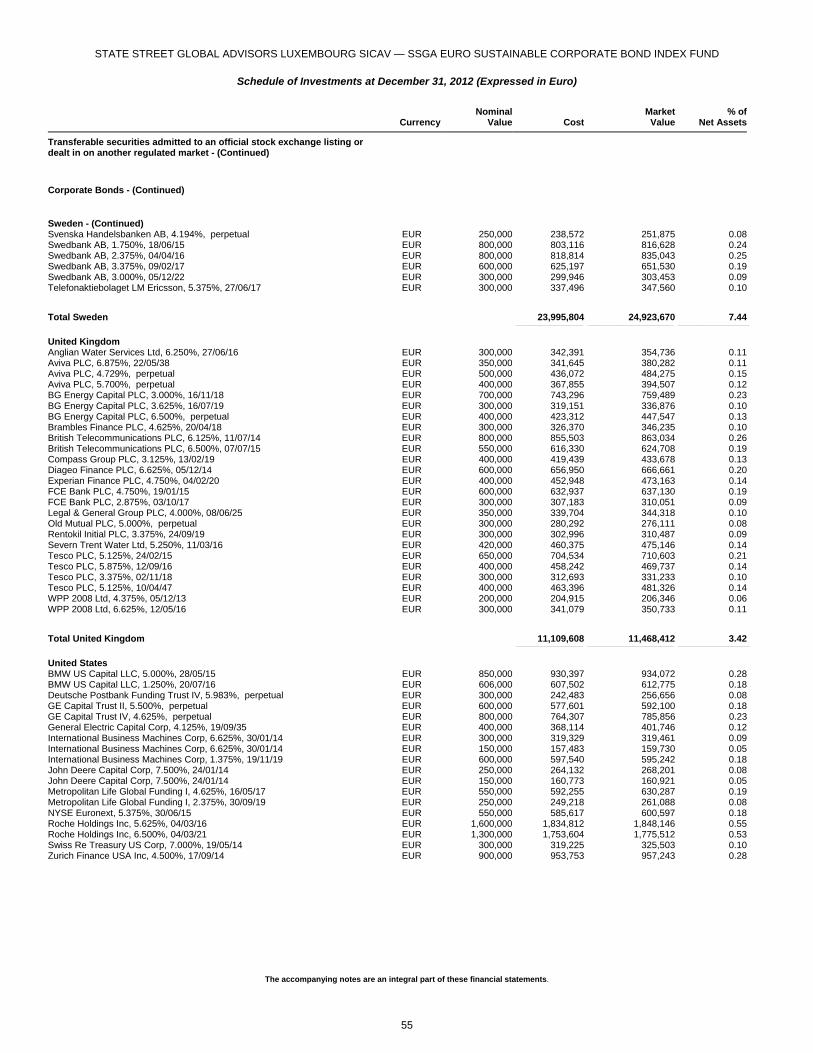
STATE STREET GLOBAL ADVISORS LUXEMBOURG SICAV — SSGA EURO SUSTAINABLE CORPORATE BOND INDEX FUND
Schedule of Investments at December 31, 2012 (Expressed in Euro)
The accompanying notes are an integral part of these financial statements.
Currency
NominalValue Cost
MarketValue
% ofNet Assets
Transferable securities admitted to an official stock exchange listing or dealt in on another regulated market - (Continued)
Corporate Bonds - (Continued)
Sweden - (Continued) Svenska Handelsbanken AB, 4.194%, perpetual EUR 250,000 238,572 251,875 0.08Swedbank AB, 1.750%, 18/06/15 EUR 800,000 803,116 816,628 0.24Swedbank AB, 2.375%, 04/04/16 EUR 800,000 818,814 835,043 0.25Swedbank AB, 3.375%, 09/02/17 EUR 600,000 625,197 651,530 0.19Swedbank AB, 3.000%, 05/12/22 EUR 300,000 299,946 303,453 0.09Telefonaktiebolaget LM Ericsson, 5.375%, 27/06/17 EUR 300,000 337,496 347,560 0.10
Total Sweden 23,995,804 24,923,670 7.44 _______________________________________________ ____________________________________________________________ __________________________________________________
United Kingdom Anglian Water Services Ltd, 6.250%, 27/06/16 EUR 300,000 342,391 354,736 0.11Aviva PLC, 6.875%, 22/05/38 EUR 350,000 341,645 380,282 0.11Aviva PLC, 4.729%, perpetual EUR 500,000 436,072 484,275 0.15Aviva PLC, 5.700%, perpetual EUR 400,000 367,855 394,507 0.12BG Energy Capital PLC, 3.000%, 16/11/18 EUR 700,000 743,296 759,489 0.23BG Energy Capital PLC, 3.625%, 16/07/19 EUR 300,000 319,151 336,876 0.10BG Energy Capital PLC, 6.500%, perpetual EUR 400,000 423,312 447,547 0.13Brambles Finance PLC, 4.625%, 20/04/18 EUR 300,000 326,370 346,235 0.10British Telecommunications PLC, 6.125%, 11/07/14 EUR 800,000 855,503 863,034 0.26British Telecommunications PLC, 6.500%, 07/07/15 EUR 550,000 616,330 624,708 0.19Compass Group PLC, 3.125%, 13/02/19 EUR 400,000 419,439 433,678 0.13Diageo Finance PLC, 6.625%, 05/12/14 EUR 600,000 656,950 666,661 0.20Experian Finance PLC, 4.750%, 04/02/20 EUR 400,000 452,948 473,163 0.14FCE Bank PLC, 4.750%, 19/01/15 EUR 600,000 632,937 637,130 0.19FCE Bank PLC, 2.875%, 03/10/17 EUR 300,000 307,183 310,051 0.09Legal & General Group PLC, 4.000%, 08/06/25 EUR 350,000 339,704 344,318 0.10Old Mutual PLC, 5.000%, perpetual EUR 300,000 280,292 276,111 0.08Rentokil Initial PLC, 3.375%, 24/09/19 EUR 300,000 302,996 310,487 0.09Severn Trent Water Ltd, 5.250%, 11/03/16 EUR 420,000 460,375 475,146 0.14Tesco PLC, 5.125%, 24/02/15 EUR 650,000 704,534 710,603 0.21Tesco PLC, 5.875%, 12/09/16 EUR 400,000 458,242 469,737 0.14Tesco PLC, 3.375%, 02/11/18 EUR 300,000 312,693 331,233 0.10Tesco PLC, 5.125%, 10/04/47 EUR 400,000 463,396 481,326 0.14WPP 2008 Ltd, 4.375%, 05/12/13 EUR 200,000 204,915 206,346 0.06WPP 2008 Ltd, 6.625%, 12/05/16 EUR 300,000 341,079 350,733 0.11
Total United Kingdom 11,109,608 11,468,412 3.42 _______________________________________________ ____________________________________________________________ __________________________________________________
United States BMW US Capital LLC, 5.000%, 28/05/15 EUR 850,000 930,397 934,072 0.28BMW US Capital LLC, 1.250%, 20/07/16 EUR 606,000 607,502 612,775 0.18Deutsche Postbank Funding Trust IV, 5.983%, perpetual EUR 300,000 242,483 256,656 0.08GE Capital Trust II, 5.500%, perpetual EUR 600,000 577,601 592,100 0.18GE Capital Trust IV, 4.625%, perpetual EUR 800,000 764,307 785,856 0.23General Electric Capital Corp, 4.125%, 19/09/35 EUR 400,000 368,114 401,746 0.12International Business Machines Corp, 6.625%, 30/01/14 EUR 300,000 319,329 319,461 0.09International Business Machines Corp, 6.625%, 30/01/14 EUR 150,000 157,483 159,730 0.05International Business Machines Corp, 1.375%, 19/11/19 EUR 600,000 597,540 595,242 0.18John Deere Capital Corp, 7.500%, 24/01/14 EUR 250,000 264,132 268,201 0.08John Deere Capital Corp, 7.500%, 24/01/14 EUR 150,000 160,773 160,921 0.05Metropolitan Life Global Funding I, 4.625%, 16/05/17 EUR 550,000 592,255 630,287 0.19Metropolitan Life Global Funding I, 2.375%, 30/09/19 EUR 250,000 249,218 261,088 0.08NYSE Euronext, 5.375%, 30/06/15 EUR 550,000 585,617 600,597 0.18Roche Holdings Inc, 5.625%, 04/03/16 EUR 1,600,000 1,834,812 1,848,146 0.55Roche Holdings Inc, 6.500%, 04/03/21 EUR 1,300,000 1,753,604 1,775,512 0.53Swiss Re Treasury US Corp, 7.000%, 19/05/14 EUR 300,000 319,225 325,503 0.10Zurich Finance USA Inc, 4.500%, 17/09/14 EUR 900,000 953,753 957,243 0.28
55
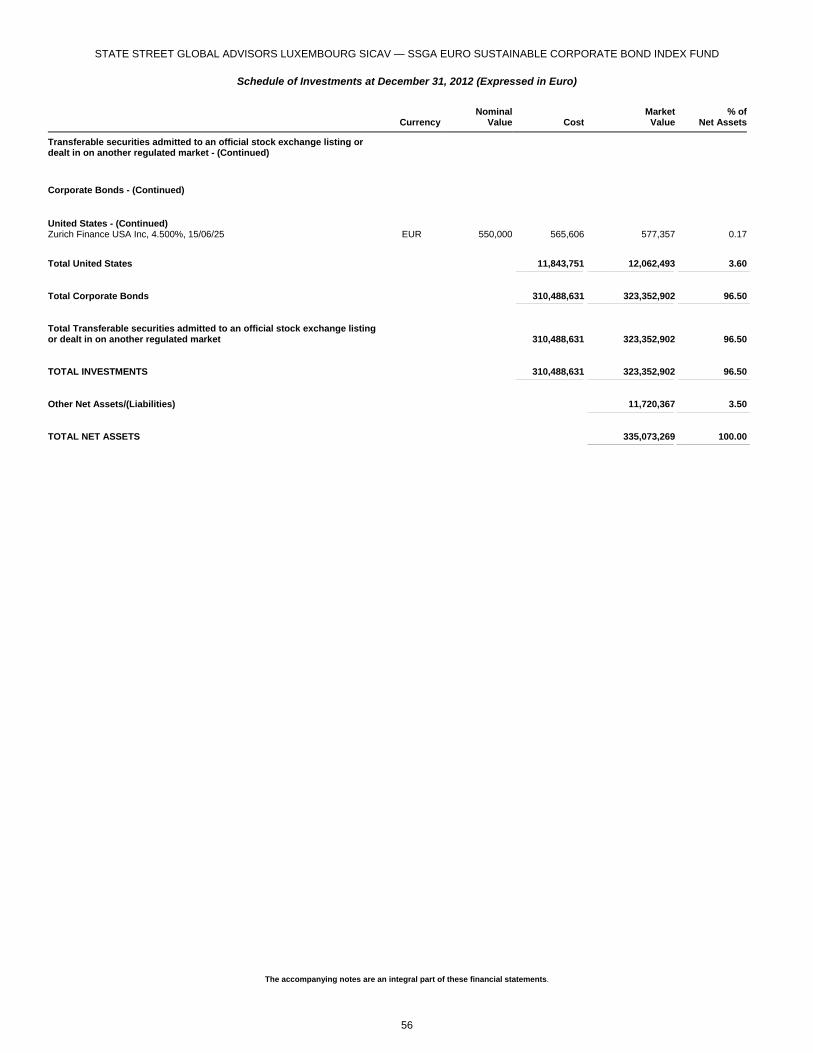
STATE STREET GLOBAL ADVISORS LUXEMBOURG SICAV — SSGA EURO SUSTAINABLE CORPORATE BOND INDEX FUND
Schedule of Investments at December 31, 2012 (Expressed in Euro)
The accompanying notes are an integral part of these financial statements.
Currency
NominalValue Cost
MarketValue
% ofNet Assets
Transferable securities admitted to an official stock exchange listing or dealt in on another regulated market - (Continued)
Corporate Bonds - (Continued)
United States - (Continued) Zurich Finance USA Inc, 4.500%, 15/06/25 EUR 550,000 565,606 577,357 0.17
Total United States 11,843,751 12,062,493 3.60 _______________________________________________ ____________________________________________________________ __________________________________________________
Total Corporate Bonds 310,488,631 323,352,902 96.50 _______________________________________________ ____________________________________________________________ __________________________________________________
Total Transferable securities admitted to an official stock exchange listing or dealt in on another regulated market 310,488,631 323,352,902 96.50 _______________________________________________ ____________________________________________________________ __________________________________________________
TOTAL INVESTMENTS 310,488,631 323,352,902 96.50 _______________________________________________ ____________________________________________________________ __________________________________________________
Other Net Assets/(Liabilities) 11,720,367 3.50 ____________________________________________________________ ___________________________________________________
TOTAL NET ASSETS 335,073,269 100.00 ____________________________________________________________ ___________________________________________________
56
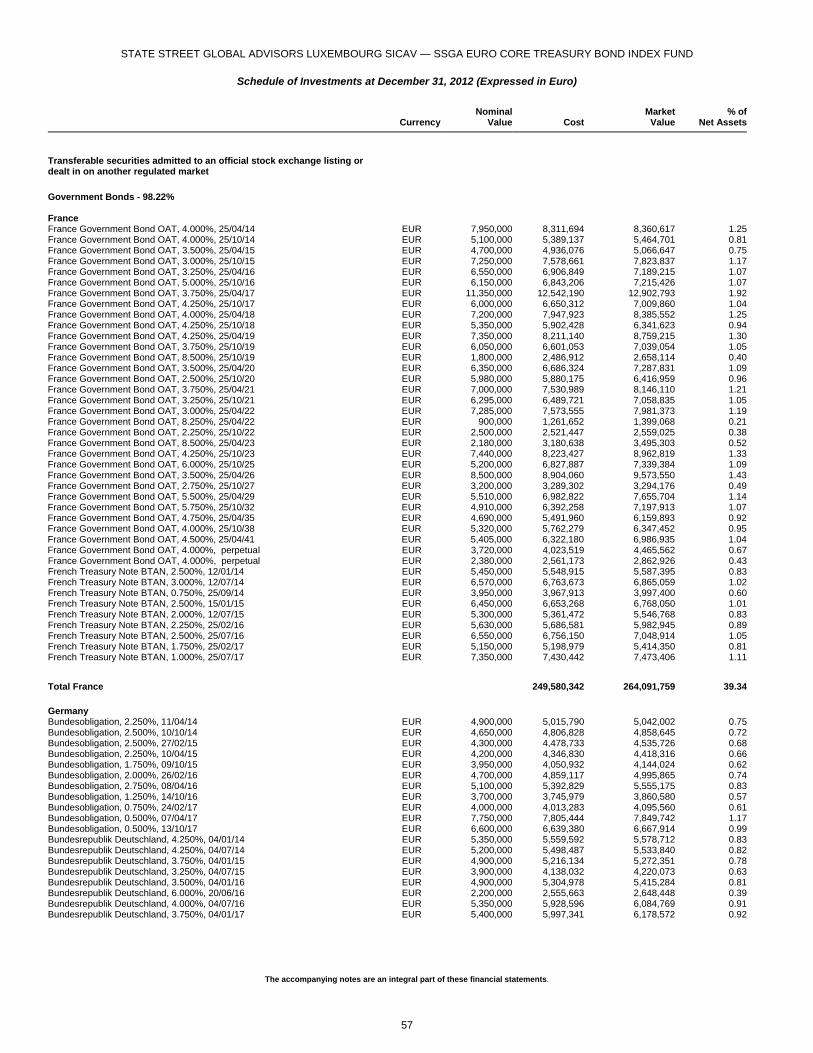
STATE STREET GLOBAL ADVISORS LUXEMBOURG SICAV — SSGA EURO CORE TREASURY BOND INDEX FUND
Schedule of Investments at December 31, 2012 (Expressed in Euro)
The accompanying notes are an integral part of these financial statements.
Currency
NominalValue Cost
MarketValue
% ofNet Assets
Transferable securities admitted to an official stock exchange listing or dealt in on another regulated market
Government Bonds - 98.22% France France Government Bond OAT, 4.000%, 25/04/14 EUR 7,950,000 8,311,694 8,360,617 1.25France Government Bond OAT, 4.000%, 25/10/14 EUR 5,100,000 5,389,137 5,464,701 0.81France Government Bond OAT, 3.500%, 25/04/15 EUR 4,700,000 4,936,076 5,066,647 0.75France Government Bond OAT, 3.000%, 25/10/15 EUR 7,250,000 7,578,661 7,823,837 1.17France Government Bond OAT, 3.250%, 25/04/16 EUR 6,550,000 6,906,849 7,189,215 1.07France Government Bond OAT, 5.000%, 25/10/16 EUR 6,150,000 6,843,206 7,215,426 1.07France Government Bond OAT, 3.750%, 25/04/17 EUR 11,350,000 12,542,190 12,902,793 1.92France Government Bond OAT, 4.250%, 25/10/17 EUR 6,000,000 6,650,312 7,009,860 1.04France Government Bond OAT, 4.000%, 25/04/18 EUR 7,200,000 7,947,923 8,385,552 1.25France Government Bond OAT, 4.250%, 25/10/18 EUR 5,350,000 5,902,428 6,341,623 0.94France Government Bond OAT, 4.250%, 25/04/19 EUR 7,350,000 8,211,140 8,759,215 1.30France Government Bond OAT, 3.750%, 25/10/19 EUR 6,050,000 6,601,053 7,039,054 1.05France Government Bond OAT, 8.500%, 25/10/19 EUR 1,800,000 2,486,912 2,658,114 0.40France Government Bond OAT, 3.500%, 25/04/20 EUR 6,350,000 6,686,324 7,287,831 1.09France Government Bond OAT, 2.500%, 25/10/20 EUR 5,980,000 5,880,175 6,416,959 0.96France Government Bond OAT, 3.750%, 25/04/21 EUR 7,000,000 7,530,989 8,146,110 1.21France Government Bond OAT, 3.250%, 25/10/21 EUR 6,295,000 6,489,721 7,058,835 1.05France Government Bond OAT, 3.000%, 25/04/22 EUR 7,285,000 7,573,555 7,981,373 1.19France Government Bond OAT, 8.250%, 25/04/22 EUR 900,000 1,261,652 1,399,068 0.21France Government Bond OAT, 2.250%, 25/10/22 EUR 2,500,000 2,521,447 2,559,025 0.38France Government Bond OAT, 8.500%, 25/04/23 EUR 2,180,000 3,180,638 3,495,303 0.52France Government Bond OAT, 4.250%, 25/10/23 EUR 7,440,000 8,223,427 8,962,819 1.33France Government Bond OAT, 6.000%, 25/10/25 EUR 5,200,000 6,827,887 7,339,384 1.09France Government Bond OAT, 3.500%, 25/04/26 EUR 8,500,000 8,904,060 9,573,550 1.43France Government Bond OAT, 2.750%, 25/10/27 EUR 3,200,000 3,289,302 3,294,176 0.49France Government Bond OAT, 5.500%, 25/04/29 EUR 5,510,000 6,982,822 7,655,704 1.14France Government Bond OAT, 5.750%, 25/10/32 EUR 4,910,000 6,392,258 7,197,913 1.07France Government Bond OAT, 4.750%, 25/04/35 EUR 4,690,000 5,491,960 6,159,893 0.92France Government Bond OAT, 4.000%, 25/10/38 EUR 5,320,000 5,762,279 6,347,452 0.95France Government Bond OAT, 4.500%, 25/04/41 EUR 5,405,000 6,322,180 6,986,935 1.04France Government Bond OAT, 4.000%, perpetual EUR 3,720,000 4,023,519 4,465,562 0.67France Government Bond OAT, 4.000%, perpetual EUR 2,380,000 2,561,173 2,862,926 0.43French Treasury Note BTAN, 2.500%, 12/01/14 EUR 5,450,000 5,548,915 5,587,395 0.83French Treasury Note BTAN, 3.000%, 12/07/14 EUR 6,570,000 6,763,673 6,865,059 1.02French Treasury Note BTAN, 0.750%, 25/09/14 EUR 3,950,000 3,967,913 3,997,400 0.60French Treasury Note BTAN, 2.500%, 15/01/15 EUR 6,450,000 6,653,268 6,768,050 1.01French Treasury Note BTAN, 2.000%, 12/07/15 EUR 5,300,000 5,361,472 5,546,768 0.83French Treasury Note BTAN, 2.250%, 25/02/16 EUR 5,630,000 5,686,581 5,982,945 0.89French Treasury Note BTAN, 2.500%, 25/07/16 EUR 6,550,000 6,756,150 7,048,914 1.05French Treasury Note BTAN, 1.750%, 25/02/17 EUR 5,150,000 5,198,979 5,414,350 0.81French Treasury Note BTAN, 1.000%, 25/07/17 EUR 7,350,000 7,430,442 7,473,406 1.11
Total France 249,580,342 264,091,759 39.34 _______________________________________________ ____________________________________________________________ __________________________________________________
Germany Bundesobligation, 2.250%, 11/04/14 EUR 4,900,000 5,015,790 5,042,002 0.75Bundesobligation, 2.500%, 10/10/14 EUR 4,650,000 4,806,828 4,858,645 0.72Bundesobligation, 2.500%, 27/02/15 EUR 4,300,000 4,478,733 4,535,726 0.68Bundesobligation, 2.250%, 10/04/15 EUR 4,200,000 4,346,830 4,418,316 0.66Bundesobligation, 1.750%, 09/10/15 EUR 3,950,000 4,050,932 4,144,024 0.62Bundesobligation, 2.000%, 26/02/16 EUR 4,700,000 4,859,117 4,995,865 0.74Bundesobligation, 2.750%, 08/04/16 EUR 5,100,000 5,392,829 5,555,175 0.83Bundesobligation, 1.250%, 14/10/16 EUR 3,700,000 3,745,979 3,860,580 0.57Bundesobligation, 0.750%, 24/02/17 EUR 4,000,000 4,013,283 4,095,560 0.61Bundesobligation, 0.500%, 07/04/17 EUR 7,750,000 7,805,444 7,849,742 1.17Bundesobligation, 0.500%, 13/10/17 EUR 6,600,000 6,639,380 6,667,914 0.99Bundesrepublik Deutschland, 4.250%, 04/01/14 EUR 5,350,000 5,559,592 5,578,712 0.83Bundesrepublik Deutschland, 4.250%, 04/07/14 EUR 5,200,000 5,498,487 5,533,840 0.82Bundesrepublik Deutschland, 3.750%, 04/01/15 EUR 4,900,000 5,216,134 5,272,351 0.78Bundesrepublik Deutschland, 3.250%, 04/07/15 EUR 3,900,000 4,138,032 4,220,073 0.63Bundesrepublik Deutschland, 3.500%, 04/01/16 EUR 4,900,000 5,304,978 5,415,284 0.81Bundesrepublik Deutschland, 6.000%, 20/06/16 EUR 2,200,000 2,555,663 2,648,448 0.39Bundesrepublik Deutschland, 4.000%, 04/07/16 EUR 5,350,000 5,928,596 6,084,769 0.91Bundesrepublik Deutschland, 3.750%, 04/01/17 EUR 5,400,000 5,997,341 6,178,572 0.92
57
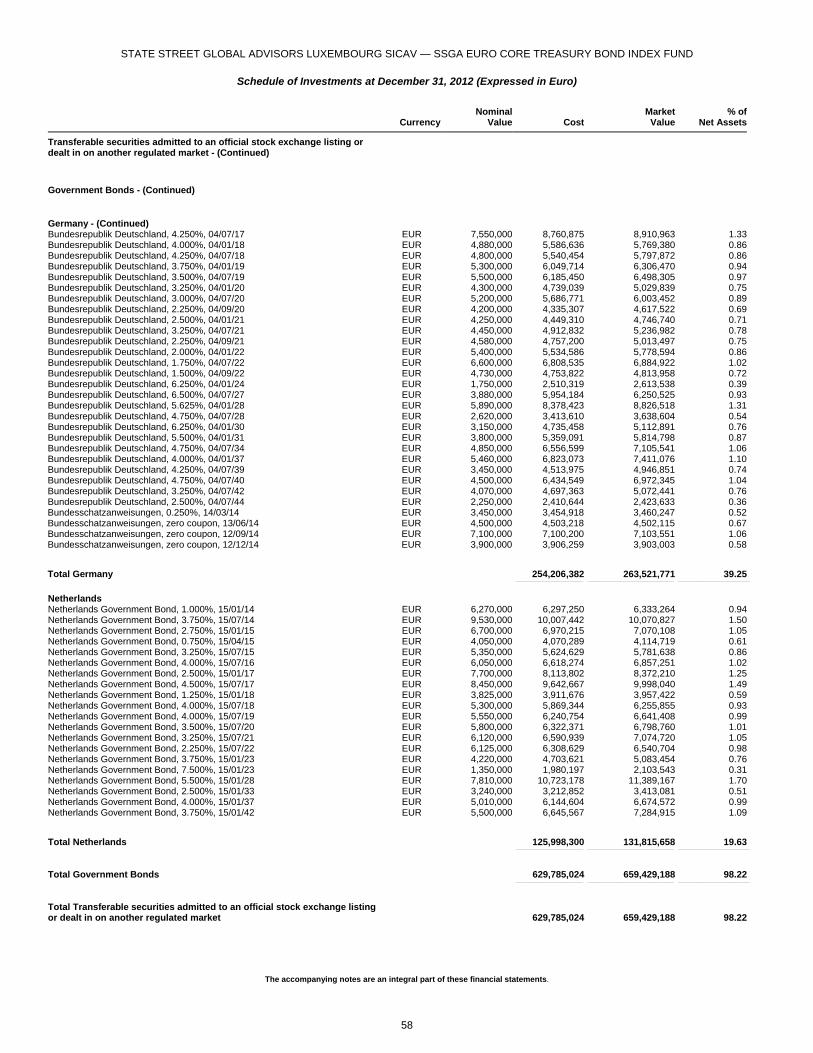
STATE STREET GLOBAL ADVISORS LUXEMBOURG SICAV — SSGA EURO CORE TREASURY BOND INDEX FUND
Schedule of Investments at December 31, 2012 (Expressed in Euro)
The accompanying notes are an integral part of these financial statements.
Currency
NominalValue Cost
MarketValue
% ofNet Assets
Transferable securities admitted to an official stock exchange listing or dealt in on another regulated market - (Continued)
Government Bonds - (Continued)
Germany - (Continued) Bundesrepublik Deutschland, 4.250%, 04/07/17 EUR 7,550,000 8,760,875 8,910,963 1.33Bundesrepublik Deutschland, 4.000%, 04/01/18 EUR 4,880,000 5,586,636 5,769,380 0.86Bundesrepublik Deutschland, 4.250%, 04/07/18 EUR 4,800,000 5,540,454 5,797,872 0.86Bundesrepublik Deutschland, 3.750%, 04/01/19 EUR 5,300,000 6,049,714 6,306,470 0.94Bundesrepublik Deutschland, 3.500%, 04/07/19 EUR 5,500,000 6,185,450 6,498,305 0.97Bundesrepublik Deutschland, 3.250%, 04/01/20 EUR 4,300,000 4,739,039 5,029,839 0.75Bundesrepublik Deutschland, 3.000%, 04/07/20 EUR 5,200,000 5,686,771 6,003,452 0.89Bundesrepublik Deutschland, 2.250%, 04/09/20 EUR 4,200,000 4,335,307 4,617,522 0.69Bundesrepublik Deutschland, 2.500%, 04/01/21 EUR 4,250,000 4,449,310 4,746,740 0.71Bundesrepublik Deutschland, 3.250%, 04/07/21 EUR 4,450,000 4,912,832 5,236,982 0.78Bundesrepublik Deutschland, 2.250%, 04/09/21 EUR 4,580,000 4,757,200 5,013,497 0.75Bundesrepublik Deutschland, 2.000%, 04/01/22 EUR 5,400,000 5,534,586 5,778,594 0.86Bundesrepublik Deutschland, 1.750%, 04/07/22 EUR 6,600,000 6,808,535 6,884,922 1.02Bundesrepublik Deutschland, 1.500%, 04/09/22 EUR 4,730,000 4,753,822 4,813,958 0.72Bundesrepublik Deutschland, 6.250%, 04/01/24 EUR 1,750,000 2,510,319 2,613,538 0.39Bundesrepublik Deutschland, 6.500%, 04/07/27 EUR 3,880,000 5,954,184 6,250,525 0.93Bundesrepublik Deutschland, 5.625%, 04/01/28 EUR 5,890,000 8,378,423 8,826,518 1.31Bundesrepublik Deutschland, 4.750%, 04/07/28 EUR 2,620,000 3,413,610 3,638,604 0.54Bundesrepublik Deutschland, 6.250%, 04/01/30 EUR 3,150,000 4,735,458 5,112,891 0.76Bundesrepublik Deutschland, 5.500%, 04/01/31 EUR 3,800,000 5,359,091 5,814,798 0.87Bundesrepublik Deutschland, 4.750%, 04/07/34 EUR 4,850,000 6,556,599 7,105,541 1.06Bundesrepublik Deutschland, 4.000%, 04/01/37 EUR 5,460,000 6,823,073 7,411,076 1.10Bundesrepublik Deutschland, 4.250%, 04/07/39 EUR 3,450,000 4,513,975 4,946,851 0.74Bundesrepublik Deutschland, 4.750%, 04/07/40 EUR 4,500,000 6,434,549 6,972,345 1.04Bundesrepublik Deutschland, 3.250%, 04/07/42 EUR 4,070,000 4,697,363 5,072,441 0.76Bundesrepublik Deutschland, 2.500%, 04/07/44 EUR 2,250,000 2,410,644 2,423,633 0.36Bundesschatzanweisungen, 0.250%, 14/03/14 EUR 3,450,000 3,454,918 3,460,247 0.52Bundesschatzanweisungen, zero coupon, 13/06/14 EUR 4,500,000 4,503,218 4,502,115 0.67Bundesschatzanweisungen, zero coupon, 12/09/14 EUR 7,100,000 7,100,200 7,103,551 1.06Bundesschatzanweisungen, zero coupon, 12/12/14 EUR 3,900,000 3,906,259 3,903,003 0.58
Total Germany 254,206,382 263,521,771 39.25 _______________________________________________ ____________________________________________________________ __________________________________________________
Netherlands Netherlands Government Bond, 1.000%, 15/01/14 EUR 6,270,000 6,297,250 6,333,264 0.94Netherlands Government Bond, 3.750%, 15/07/14 EUR 9,530,000 10,007,442 10,070,827 1.50Netherlands Government Bond, 2.750%, 15/01/15 EUR 6,700,000 6,970,215 7,070,108 1.05Netherlands Government Bond, 0.750%, 15/04/15 EUR 4,050,000 4,070,289 4,114,719 0.61Netherlands Government Bond, 3.250%, 15/07/15 EUR 5,350,000 5,624,629 5,781,638 0.86Netherlands Government Bond, 4.000%, 15/07/16 EUR 6,050,000 6,618,274 6,857,251 1.02Netherlands Government Bond, 2.500%, 15/01/17 EUR 7,700,000 8,113,802 8,372,210 1.25Netherlands Government Bond, 4.500%, 15/07/17 EUR 8,450,000 9,642,667 9,998,040 1.49Netherlands Government Bond, 1.250%, 15/01/18 EUR 3,825,000 3,911,676 3,957,422 0.59Netherlands Government Bond, 4.000%, 15/07/18 EUR 5,300,000 5,869,344 6,255,855 0.93Netherlands Government Bond, 4.000%, 15/07/19 EUR 5,550,000 6,240,754 6,641,408 0.99Netherlands Government Bond, 3.500%, 15/07/20 EUR 5,800,000 6,322,371 6,798,760 1.01Netherlands Government Bond, 3.250%, 15/07/21 EUR 6,120,000 6,590,939 7,074,720 1.05Netherlands Government Bond, 2.250%, 15/07/22 EUR 6,125,000 6,308,629 6,540,704 0.98Netherlands Government Bond, 3.750%, 15/01/23 EUR 4,220,000 4,703,621 5,083,454 0.76Netherlands Government Bond, 7.500%, 15/01/23 EUR 1,350,000 1,980,197 2,103,543 0.31Netherlands Government Bond, 5.500%, 15/01/28 EUR 7,810,000 10,723,178 11,389,167 1.70Netherlands Government Bond, 2.500%, 15/01/33 EUR 3,240,000 3,212,852 3,413,081 0.51Netherlands Government Bond, 4.000%, 15/01/37 EUR 5,010,000 6,144,604 6,674,572 0.99Netherlands Government Bond, 3.750%, 15/01/42 EUR 5,500,000 6,645,567 7,284,915 1.09
Total Netherlands 125,998,300 131,815,658 19.63 _______________________________________________ ____________________________________________________________ __________________________________________________
Total Government Bonds 629,785,024 659,429,188 98.22 _______________________________________________ ____________________________________________________________ __________________________________________________
Total Transferable securities admitted to an official stock exchange listing or dealt in on another regulated market 629,785,024 659,429,188 98.22 _______________________________________________ ____________________________________________________________ __________________________________________________
58
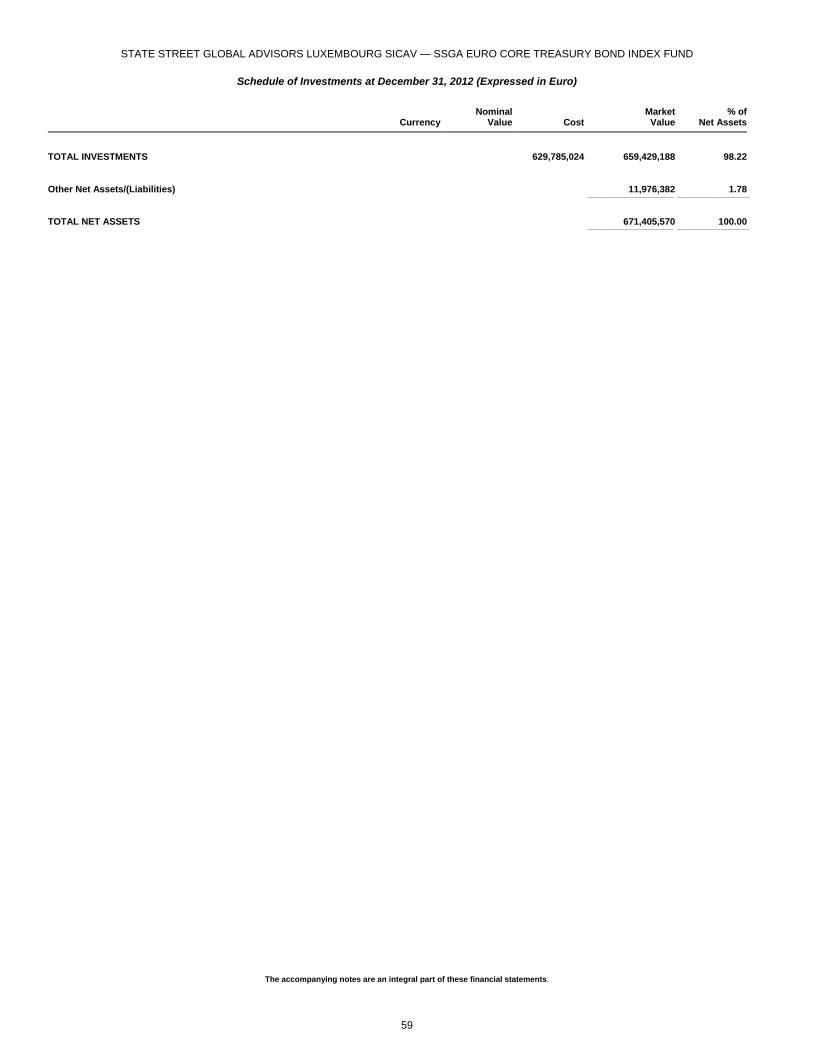
STATE STREET GLOBAL ADVISORS LUXEMBOURG SICAV — SSGA EURO CORE TREASURY BOND INDEX FUND
Schedule of Investments at December 31, 2012 (Expressed in Euro)
The accompanying notes are an integral part of these financial statements.
Currency
NominalValue Cost
MarketValue
% ofNet Assets
TOTAL INVESTMENTS 629,785,024 659,429,188 98.22 _______________________________________________ ____________________________________________________________ __________________________________________________
Other Net Assets/(Liabilities) 11,976,382 1.78 ____________________________________________________________ ___________________________________________________
TOTAL NET ASSETS 671,405,570 100.00 ____________________________________________________________ ___________________________________________________
59
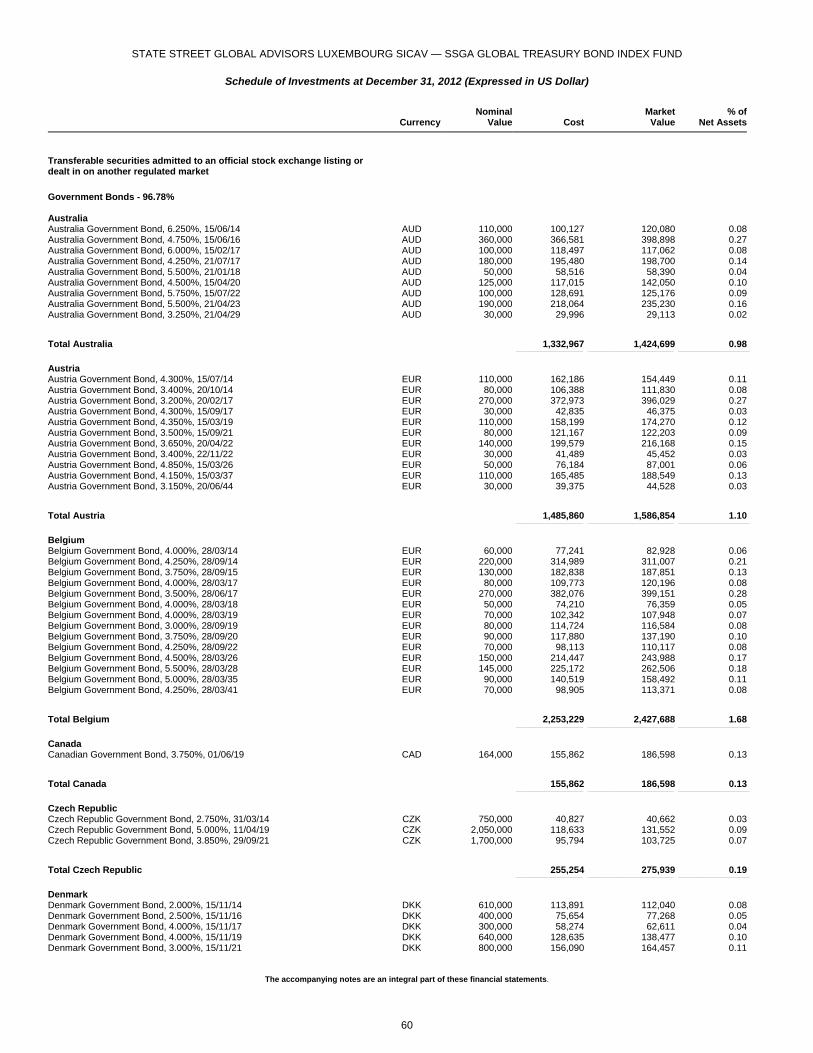
STATE STREET GLOBAL ADVISORS LUXEMBOURG SICAV — SSGA GLOBAL TREASURY BOND INDEX FUND
Schedule of Investments at December 31, 2012 (Expressed in US Dollar)
The accompanying notes are an integral part of these financial statements.
Currency
NominalValue Cost
MarketValue
% ofNet Assets
Transferable securities admitted to an official stock exchange listing or dealt in on another regulated market
Government Bonds - 96.78% Australia Australia Government Bond, 6.250%, 15/06/14 AUD 110,000 100,127 120,080 0.08Australia Government Bond, 4.750%, 15/06/16 AUD 360,000 366,581 398,898 0.27Australia Government Bond, 6.000%, 15/02/17 AUD 100,000 118,497 117,062 0.08Australia Government Bond, 4.250%, 21/07/17 AUD 180,000 195,480 198,700 0.14Australia Government Bond, 5.500%, 21/01/18 AUD 50,000 58,516 58,390 0.04Australia Government Bond, 4.500%, 15/04/20 AUD 125,000 117,015 142,050 0.10Australia Government Bond, 5.750%, 15/07/22 AUD 100,000 128,691 125,176 0.09Australia Government Bond, 5.500%, 21/04/23 AUD 190,000 218,064 235,230 0.16Australia Government Bond, 3.250%, 21/04/29 AUD 30,000 29,996 29,113 0.02
Total Australia 1,332,967 1,424,699 0.98 _______________________________________________ ____________________________________________________________ __________________________________________________
Austria Austria Government Bond, 4.300%, 15/07/14 EUR 110,000 162,186 154,449 0.11Austria Government Bond, 3.400%, 20/10/14 EUR 80,000 106,388 111,830 0.08Austria Government Bond, 3.200%, 20/02/17 EUR 270,000 372,973 396,029 0.27Austria Government Bond, 4.300%, 15/09/17 EUR 30,000 42,835 46,375 0.03Austria Government Bond, 4.350%, 15/03/19 EUR 110,000 158,199 174,270 0.12Austria Government Bond, 3.500%, 15/09/21 EUR 80,000 121,167 122,203 0.09Austria Government Bond, 3.650%, 20/04/22 EUR 140,000 199,579 216,168 0.15Austria Government Bond, 3.400%, 22/11/22 EUR 30,000 41,489 45,452 0.03Austria Government Bond, 4.850%, 15/03/26 EUR 50,000 76,184 87,001 0.06Austria Government Bond, 4.150%, 15/03/37 EUR 110,000 165,485 188,549 0.13Austria Government Bond, 3.150%, 20/06/44 EUR 30,000 39,375 44,528 0.03
Total Austria 1,485,860 1,586,854 1.10 _______________________________________________ ____________________________________________________________ __________________________________________________
Belgium Belgium Government Bond, 4.000%, 28/03/14 EUR 60,000 77,241 82,928 0.06Belgium Government Bond, 4.250%, 28/09/14 EUR 220,000 314,989 311,007 0.21Belgium Government Bond, 3.750%, 28/09/15 EUR 130,000 182,838 187,851 0.13Belgium Government Bond, 4.000%, 28/03/17 EUR 80,000 109,773 120,196 0.08Belgium Government Bond, 3.500%, 28/06/17 EUR 270,000 382,076 399,151 0.28Belgium Government Bond, 4.000%, 28/03/18 EUR 50,000 74,210 76,359 0.05Belgium Government Bond, 4.000%, 28/03/19 EUR 70,000 102,342 107,948 0.07Belgium Government Bond, 3.000%, 28/09/19 EUR 80,000 114,724 116,584 0.08Belgium Government Bond, 3.750%, 28/09/20 EUR 90,000 117,880 137,190 0.10Belgium Government Bond, 4.250%, 28/09/22 EUR 70,000 98,113 110,117 0.08Belgium Government Bond, 4.500%, 28/03/26 EUR 150,000 214,447 243,988 0.17Belgium Government Bond, 5.500%, 28/03/28 EUR 145,000 225,172 262,506 0.18Belgium Government Bond, 5.000%, 28/03/35 EUR 90,000 140,519 158,492 0.11Belgium Government Bond, 4.250%, 28/03/41 EUR 70,000 98,905 113,371 0.08
Total Belgium 2,253,229 2,427,688 1.68 _______________________________________________ ____________________________________________________________ __________________________________________________
Canada Canadian Government Bond, 3.750%, 01/06/19 CAD 164,000 155,862 186,598 0.13
Total Canada 155,862 186,598 0.13 _______________________________________________ ____________________________________________________________ __________________________________________________
Czech Republic Czech Republic Government Bond, 2.750%, 31/03/14 CZK 750,000 40,827 40,662 0.03Czech Republic Government Bond, 5.000%, 11/04/19 CZK 2,050,000 118,633 131,552 0.09Czech Republic Government Bond, 3.850%, 29/09/21 CZK 1,700,000 95,794 103,725 0.07
Total Czech Republic 255,254 275,939 0.19 _______________________________________________ ____________________________________________________________ __________________________________________________
Denmark Denmark Government Bond, 2.000%, 15/11/14 DKK 610,000 113,891 112,040 0.08Denmark Government Bond, 2.500%, 15/11/16 DKK 400,000 75,654 77,268 0.05Denmark Government Bond, 4.000%, 15/11/17 DKK 300,000 58,274 62,611 0.04Denmark Government Bond, 4.000%, 15/11/19 DKK 640,000 128,635 138,477 0.10Denmark Government Bond, 3.000%, 15/11/21 DKK 800,000 156,090 164,457 0.11
60
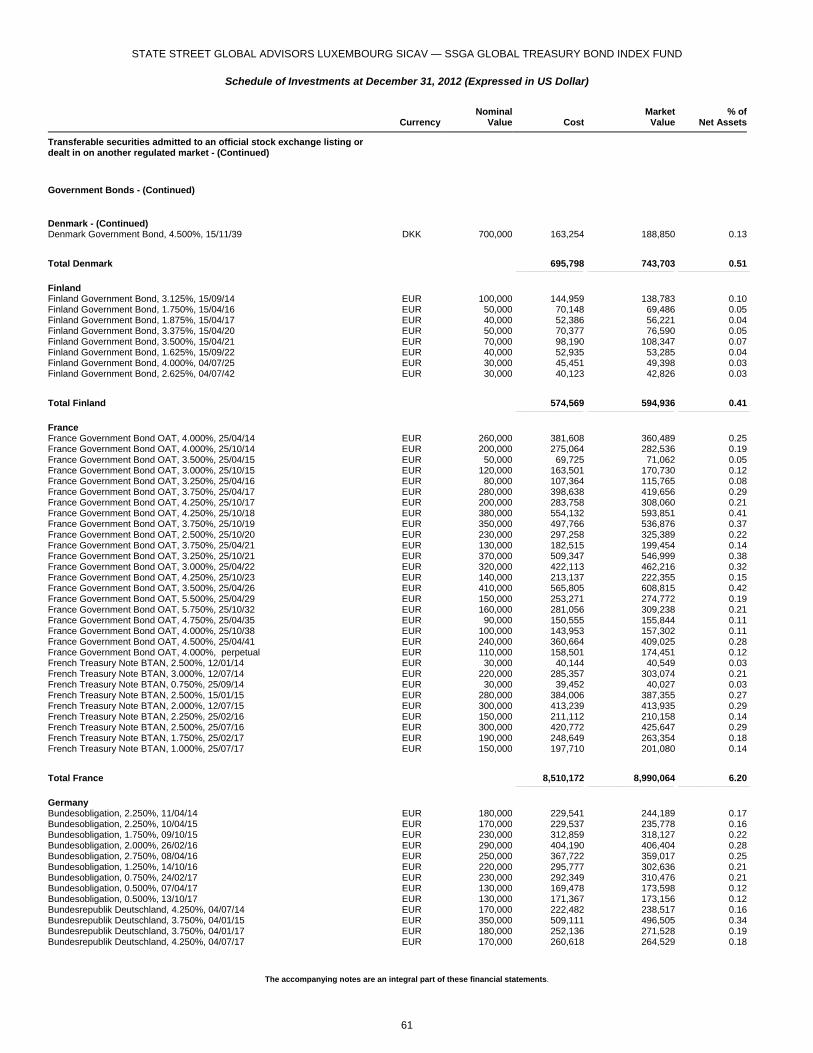
STATE STREET GLOBAL ADVISORS LUXEMBOURG SICAV — SSGA GLOBAL TREASURY BOND INDEX FUND
Schedule of Investments at December 31, 2012 (Expressed in US Dollar)
The accompanying notes are an integral part of these financial statements.
Currency
NominalValue Cost
MarketValue
% ofNet Assets
Transferable securities admitted to an official stock exchange listing or dealt in on another regulated market - (Continued)
Government Bonds - (Continued)
Denmark - (Continued) Denmark Government Bond, 4.500%, 15/11/39 DKK 700,000 163,254 188,850 0.13
Total Denmark 695,798 743,703 0.51 _______________________________________________ ____________________________________________________________ __________________________________________________
Finland Finland Government Bond, 3.125%, 15/09/14 EUR 100,000 144,959 138,783 0.10Finland Government Bond, 1.750%, 15/04/16 EUR 50,000 70,148 69,486 0.05Finland Government Bond, 1.875%, 15/04/17 EUR 40,000 52,386 56,221 0.04Finland Government Bond, 3.375%, 15/04/20 EUR 50,000 70,377 76,590 0.05Finland Government Bond, 3.500%, 15/04/21 EUR 70,000 98,190 108,347 0.07Finland Government Bond, 1.625%, 15/09/22 EUR 40,000 52,935 53,285 0.04Finland Government Bond, 4.000%, 04/07/25 EUR 30,000 45,451 49,398 0.03Finland Government Bond, 2.625%, 04/07/42 EUR 30,000 40,123 42,826 0.03
Total Finland 574,569 594,936 0.41 _______________________________________________ ____________________________________________________________ __________________________________________________
France France Government Bond OAT, 4.000%, 25/04/14 EUR 260,000 381,608 360,489 0.25France Government Bond OAT, 4.000%, 25/10/14 EUR 200,000 275,064 282,536 0.19France Government Bond OAT, 3.500%, 25/04/15 EUR 50,000 69,725 71,062 0.05France Government Bond OAT, 3.000%, 25/10/15 EUR 120,000 163,501 170,730 0.12France Government Bond OAT, 3.250%, 25/04/16 EUR 80,000 107,364 115,765 0.08France Government Bond OAT, 3.750%, 25/04/17 EUR 280,000 398,638 419,656 0.29France Government Bond OAT, 4.250%, 25/10/17 EUR 200,000 283,758 308,060 0.21France Government Bond OAT, 4.250%, 25/10/18 EUR 380,000 554,132 593,851 0.41France Government Bond OAT, 3.750%, 25/10/19 EUR 350,000 497,766 536,876 0.37France Government Bond OAT, 2.500%, 25/10/20 EUR 230,000 297,258 325,389 0.22France Government Bond OAT, 3.750%, 25/04/21 EUR 130,000 182,515 199,454 0.14France Government Bond OAT, 3.250%, 25/10/21 EUR 370,000 509,347 546,999 0.38France Government Bond OAT, 3.000%, 25/04/22 EUR 320,000 422,113 462,216 0.32France Government Bond OAT, 4.250%, 25/10/23 EUR 140,000 213,137 222,355 0.15France Government Bond OAT, 3.500%, 25/04/26 EUR 410,000 565,805 608,815 0.42France Government Bond OAT, 5.500%, 25/04/29 EUR 150,000 253,271 274,772 0.19France Government Bond OAT, 5.750%, 25/10/32 EUR 160,000 281,056 309,238 0.21France Government Bond OAT, 4.750%, 25/04/35 EUR 90,000 150,555 155,844 0.11France Government Bond OAT, 4.000%, 25/10/38 EUR 100,000 143,953 157,302 0.11France Government Bond OAT, 4.500%, 25/04/41 EUR 240,000 360,664 409,025 0.28France Government Bond OAT, 4.000%, perpetual EUR 110,000 158,501 174,451 0.12French Treasury Note BTAN, 2.500%, 12/01/14 EUR 30,000 40,144 40,549 0.03French Treasury Note BTAN, 3.000%, 12/07/14 EUR 220,000 285,357 303,074 0.21French Treasury Note BTAN, 0.750%, 25/09/14 EUR 30,000 39,452 40,027 0.03French Treasury Note BTAN, 2.500%, 15/01/15 EUR 280,000 384,006 387,355 0.27French Treasury Note BTAN, 2.000%, 12/07/15 EUR 300,000 413,239 413,935 0.29French Treasury Note BTAN, 2.250%, 25/02/16 EUR 150,000 211,112 210,158 0.14French Treasury Note BTAN, 2.500%, 25/07/16 EUR 300,000 420,772 425,647 0.29French Treasury Note BTAN, 1.750%, 25/02/17 EUR 190,000 248,649 263,354 0.18French Treasury Note BTAN, 1.000%, 25/07/17 EUR 150,000 197,710 201,080 0.14
Total France 8,510,172 8,990,064 6.20 _______________________________________________ ____________________________________________________________ __________________________________________________
Germany Bundesobligation, 2.250%, 11/04/14 EUR 180,000 229,541 244,189 0.17Bundesobligation, 2.250%, 10/04/15 EUR 170,000 229,537 235,778 0.16Bundesobligation, 1.750%, 09/10/15 EUR 230,000 312,859 318,127 0.22Bundesobligation, 2.000%, 26/02/16 EUR 290,000 404,190 406,404 0.28Bundesobligation, 2.750%, 08/04/16 EUR 250,000 367,722 359,017 0.25Bundesobligation, 1.250%, 14/10/16 EUR 220,000 295,777 302,636 0.21Bundesobligation, 0.750%, 24/02/17 EUR 230,000 292,349 310,476 0.21Bundesobligation, 0.500%, 07/04/17 EUR 130,000 169,478 173,598 0.12Bundesobligation, 0.500%, 13/10/17 EUR 130,000 171,367 173,156 0.12Bundesrepublik Deutschland, 4.250%, 04/07/14 EUR 170,000 222,482 238,517 0.16Bundesrepublik Deutschland, 3.750%, 04/01/15 EUR 350,000 509,111 496,505 0.34Bundesrepublik Deutschland, 3.750%, 04/01/17 EUR 180,000 252,136 271,528 0.19Bundesrepublik Deutschland, 4.250%, 04/07/17 EUR 170,000 260,618 264,529 0.18
61
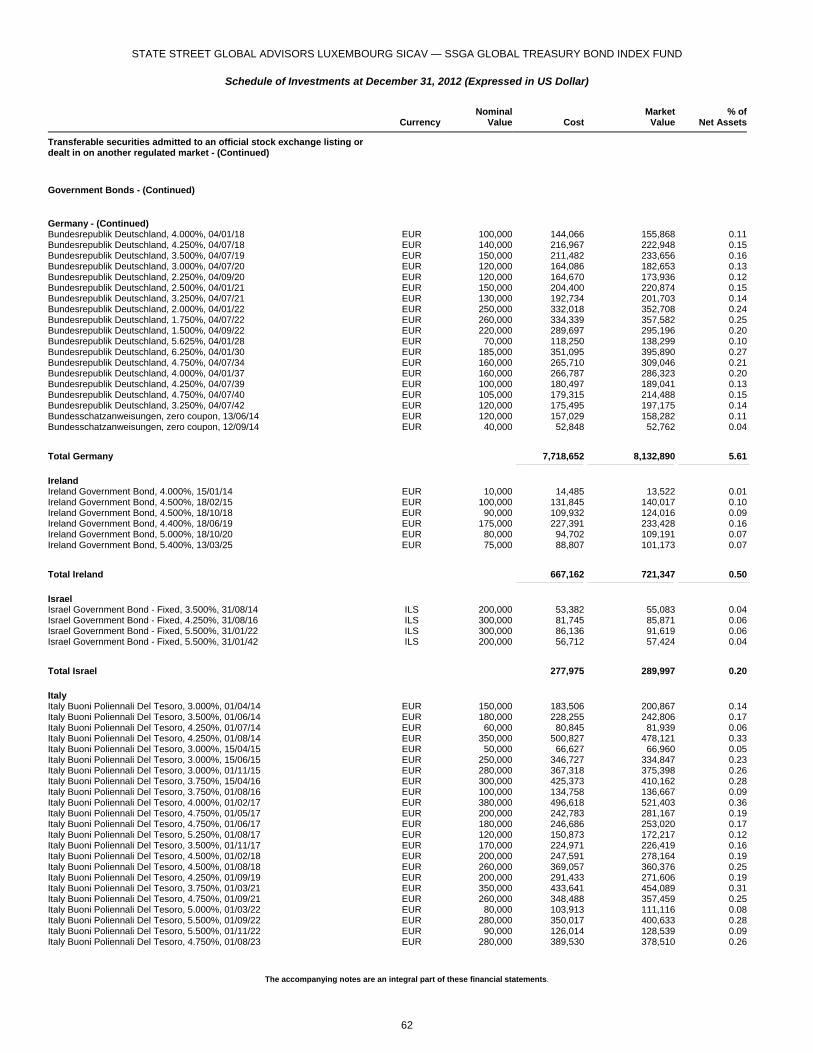
STATE STREET GLOBAL ADVISORS LUXEMBOURG SICAV — SSGA GLOBAL TREASURY BOND INDEX FUND
Schedule of Investments at December 31, 2012 (Expressed in US Dollar)
The accompanying notes are an integral part of these financial statements.
Currency
NominalValue Cost
MarketValue
% ofNet Assets
Transferable securities admitted to an official stock exchange listing or dealt in on another regulated market - (Continued)
Government Bonds - (Continued)
Germany - (Continued) Bundesrepublik Deutschland, 4.000%, 04/01/18 EUR 100,000 144,066 155,868 0.11Bundesrepublik Deutschland, 4.250%, 04/07/18 EUR 140,000 216,967 222,948 0.15Bundesrepublik Deutschland, 3.500%, 04/07/19 EUR 150,000 211,482 233,656 0.16Bundesrepublik Deutschland, 3.000%, 04/07/20 EUR 120,000 164,086 182,653 0.13Bundesrepublik Deutschland, 2.250%, 04/09/20 EUR 120,000 164,670 173,936 0.12Bundesrepublik Deutschland, 2.500%, 04/01/21 EUR 150,000 204,400 220,874 0.15Bundesrepublik Deutschland, 3.250%, 04/07/21 EUR 130,000 192,734 201,703 0.14Bundesrepublik Deutschland, 2.000%, 04/01/22 EUR 250,000 332,018 352,708 0.24Bundesrepublik Deutschland, 1.750%, 04/07/22 EUR 260,000 334,339 357,582 0.25Bundesrepublik Deutschland, 1.500%, 04/09/22 EUR 220,000 289,697 295,196 0.20Bundesrepublik Deutschland, 5.625%, 04/01/28 EUR 70,000 118,250 138,299 0.10Bundesrepublik Deutschland, 6.250%, 04/01/30 EUR 185,000 351,095 395,890 0.27Bundesrepublik Deutschland, 4.750%, 04/07/34 EUR 160,000 265,710 309,046 0.21Bundesrepublik Deutschland, 4.000%, 04/01/37 EUR 160,000 266,787 286,323 0.20Bundesrepublik Deutschland, 4.250%, 04/07/39 EUR 100,000 180,497 189,041 0.13Bundesrepublik Deutschland, 4.750%, 04/07/40 EUR 105,000 179,315 214,488 0.15Bundesrepublik Deutschland, 3.250%, 04/07/42 EUR 120,000 175,495 197,175 0.14Bundesschatzanweisungen, zero coupon, 13/06/14 EUR 120,000 157,029 158,282 0.11Bundesschatzanweisungen, zero coupon, 12/09/14 EUR 40,000 52,848 52,762 0.04
Total Germany 7,718,652 8,132,890 5.61 _______________________________________________ ____________________________________________________________ __________________________________________________
Ireland Ireland Government Bond, 4.000%, 15/01/14 EUR 10,000 14,485 13,522 0.01Ireland Government Bond, 4.500%, 18/02/15 EUR 100,000 131,845 140,017 0.10Ireland Government Bond, 4.500%, 18/10/18 EUR 90,000 109,932 124,016 0.09Ireland Government Bond, 4.400%, 18/06/19 EUR 175,000 227,391 233,428 0.16Ireland Government Bond, 5.000%, 18/10/20 EUR 80,000 94,702 109,191 0.07Ireland Government Bond, 5.400%, 13/03/25 EUR 75,000 88,807 101,173 0.07
Total Ireland 667,162 721,347 0.50 _______________________________________________ ____________________________________________________________ __________________________________________________
Israel Israel Government Bond - Fixed, 3.500%, 31/08/14 ILS 200,000 53,382 55,083 0.04Israel Government Bond - Fixed, 4.250%, 31/08/16 ILS 300,000 81,745 85,871 0.06Israel Government Bond - Fixed, 5.500%, 31/01/22 ILS 300,000 86,136 91,619 0.06Israel Government Bond - Fixed, 5.500%, 31/01/42 ILS 200,000 56,712 57,424 0.04
Total Israel 277,975 289,997 0.20 _______________________________________________ ____________________________________________________________ __________________________________________________
Italy Italy Buoni Poliennali Del Tesoro, 3.000%, 01/04/14 EUR 150,000 183,506 200,867 0.14Italy Buoni Poliennali Del Tesoro, 3.500%, 01/06/14 EUR 180,000 228,255 242,806 0.17Italy Buoni Poliennali Del Tesoro, 4.250%, 01/07/14 EUR 60,000 80,845 81,939 0.06Italy Buoni Poliennali Del Tesoro, 4.250%, 01/08/14 EUR 350,000 500,827 478,121 0.33Italy Buoni Poliennali Del Tesoro, 3.000%, 15/04/15 EUR 50,000 66,627 66,960 0.05Italy Buoni Poliennali Del Tesoro, 3.000%, 15/06/15 EUR 250,000 346,727 334,847 0.23Italy Buoni Poliennali Del Tesoro, 3.000%, 01/11/15 EUR 280,000 367,318 375,398 0.26Italy Buoni Poliennali Del Tesoro, 3.750%, 15/04/16 EUR 300,000 425,373 410,162 0.28Italy Buoni Poliennali Del Tesoro, 3.750%, 01/08/16 EUR 100,000 134,758 136,667 0.09Italy Buoni Poliennali Del Tesoro, 4.000%, 01/02/17 EUR 380,000 496,618 521,403 0.36Italy Buoni Poliennali Del Tesoro, 4.750%, 01/05/17 EUR 200,000 242,783 281,167 0.19Italy Buoni Poliennali Del Tesoro, 4.750%, 01/06/17 EUR 180,000 246,686 253,020 0.17Italy Buoni Poliennali Del Tesoro, 5.250%, 01/08/17 EUR 120,000 150,873 172,217 0.12Italy Buoni Poliennali Del Tesoro, 3.500%, 01/11/17 EUR 170,000 224,971 226,419 0.16Italy Buoni Poliennali Del Tesoro, 4.500%, 01/02/18 EUR 200,000 247,591 278,164 0.19Italy Buoni Poliennali Del Tesoro, 4.500%, 01/08/18 EUR 260,000 369,057 360,376 0.25Italy Buoni Poliennali Del Tesoro, 4.250%, 01/09/19 EUR 200,000 291,433 271,606 0.19Italy Buoni Poliennali Del Tesoro, 3.750%, 01/03/21 EUR 350,000 433,641 454,089 0.31Italy Buoni Poliennali Del Tesoro, 4.750%, 01/09/21 EUR 260,000 348,488 357,459 0.25Italy Buoni Poliennali Del Tesoro, 5.000%, 01/03/22 EUR 80,000 103,913 111,116 0.08Italy Buoni Poliennali Del Tesoro, 5.500%, 01/09/22 EUR 280,000 350,017 400,633 0.28Italy Buoni Poliennali Del Tesoro, 5.500%, 01/11/22 EUR 90,000 126,014 128,539 0.09Italy Buoni Poliennali Del Tesoro, 4.750%, 01/08/23 EUR 280,000 389,530 378,510 0.26
62
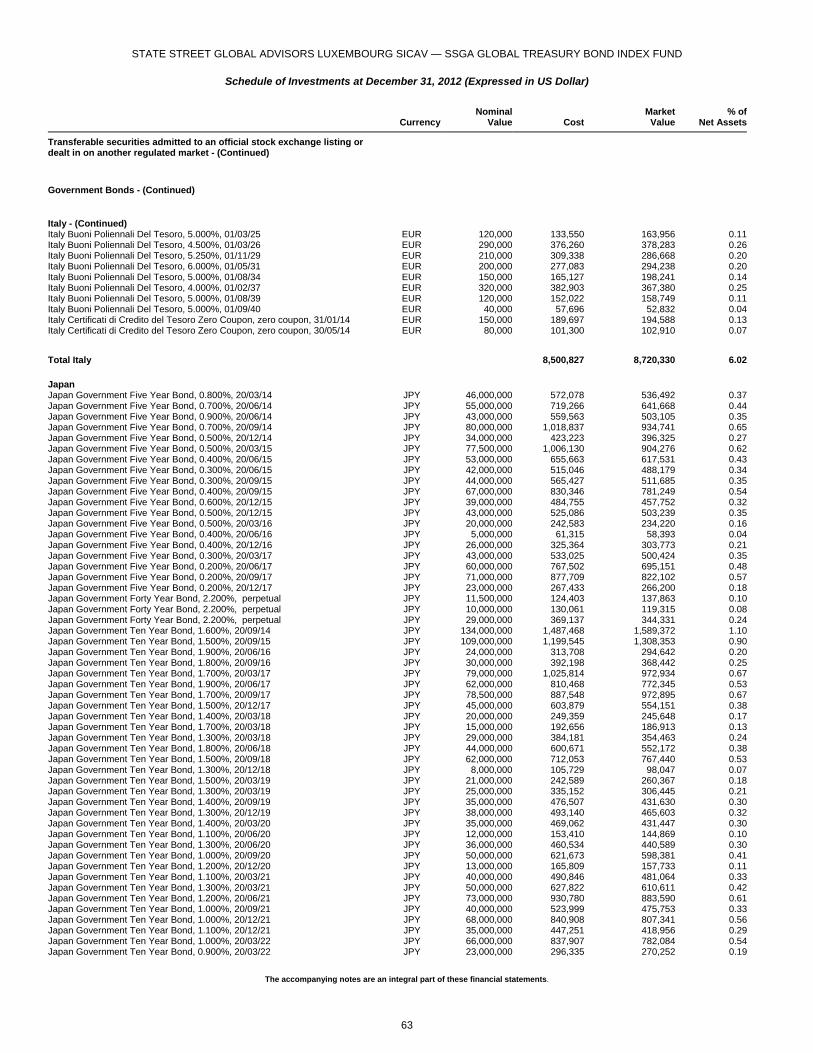
STATE STREET GLOBAL ADVISORS LUXEMBOURG SICAV — SSGA GLOBAL TREASURY BOND INDEX FUND
Schedule of Investments at December 31, 2012 (Expressed in US Dollar)
The accompanying notes are an integral part of these financial statements.
Currency
NominalValue Cost
MarketValue
% ofNet Assets
Transferable securities admitted to an official stock exchange listing or dealt in on another regulated market - (Continued)
Government Bonds - (Continued)
Italy - (Continued) Italy Buoni Poliennali Del Tesoro, 5.000%, 01/03/25 EUR 120,000 133,550 163,956 0.11Italy Buoni Poliennali Del Tesoro, 4.500%, 01/03/26 EUR 290,000 376,260 378,283 0.26Italy Buoni Poliennali Del Tesoro, 5.250%, 01/11/29 EUR 210,000 309,338 286,668 0.20Italy Buoni Poliennali Del Tesoro, 6.000%, 01/05/31 EUR 200,000 277,083 294,238 0.20Italy Buoni Poliennali Del Tesoro, 5.000%, 01/08/34 EUR 150,000 165,127 198,241 0.14Italy Buoni Poliennali Del Tesoro, 4.000%, 01/02/37 EUR 320,000 382,903 367,380 0.25Italy Buoni Poliennali Del Tesoro, 5.000%, 01/08/39 EUR 120,000 152,022 158,749 0.11Italy Buoni Poliennali Del Tesoro, 5.000%, 01/09/40 EUR 40,000 57,696 52,832 0.04Italy Certificati di Credito del Tesoro Zero Coupon, zero coupon, 31/01/14 EUR 150,000 189,697 194,588 0.13Italy Certificati di Credito del Tesoro Zero Coupon, zero coupon, 30/05/14 EUR 80,000 101,300 102,910 0.07
Total Italy 8,500,827 8,720,330 6.02 _______________________________________________ ____________________________________________________________ __________________________________________________
Japan Japan Government Five Year Bond, 0.800%, 20/03/14 JPY 46,000,000 572,078 536,492 0.37Japan Government Five Year Bond, 0.700%, 20/06/14 JPY 55,000,000 719,266 641,668 0.44Japan Government Five Year Bond, 0.900%, 20/06/14 JPY 43,000,000 559,563 503,105 0.35Japan Government Five Year Bond, 0.700%, 20/09/14 JPY 80,000,000 1,018,837 934,741 0.65Japan Government Five Year Bond, 0.500%, 20/12/14 JPY 34,000,000 423,223 396,325 0.27Japan Government Five Year Bond, 0.500%, 20/03/15 JPY 77,500,000 1,006,130 904,276 0.62Japan Government Five Year Bond, 0.400%, 20/06/15 JPY 53,000,000 655,663 617,531 0.43Japan Government Five Year Bond, 0.300%, 20/06/15 JPY 42,000,000 515,046 488,179 0.34Japan Government Five Year Bond, 0.300%, 20/09/15 JPY 44,000,000 565,427 511,685 0.35Japan Government Five Year Bond, 0.400%, 20/09/15 JPY 67,000,000 830,346 781,249 0.54Japan Government Five Year Bond, 0.600%, 20/12/15 JPY 39,000,000 484,755 457,752 0.32Japan Government Five Year Bond, 0.500%, 20/12/15 JPY 43,000,000 525,086 503,239 0.35Japan Government Five Year Bond, 0.500%, 20/03/16 JPY 20,000,000 242,583 234,220 0.16Japan Government Five Year Bond, 0.400%, 20/06/16 JPY 5,000,000 61,315 58,393 0.04Japan Government Five Year Bond, 0.400%, 20/12/16 JPY 26,000,000 325,364 303,773 0.21Japan Government Five Year Bond, 0.300%, 20/03/17 JPY 43,000,000 533,025 500,424 0.35Japan Government Five Year Bond, 0.200%, 20/06/17 JPY 60,000,000 767,502 695,151 0.48Japan Government Five Year Bond, 0.200%, 20/09/17 JPY 71,000,000 877,709 822,102 0.57Japan Government Five Year Bond, 0.200%, 20/12/17 JPY 23,000,000 267,433 266,200 0.18Japan Government Forty Year Bond, 2.200%, perpetual JPY 11,500,000 124,403 137,863 0.10Japan Government Forty Year Bond, 2.200%, perpetual JPY 10,000,000 130,061 119,315 0.08Japan Government Forty Year Bond, 2.200%, perpetual JPY 29,000,000 369,137 344,331 0.24Japan Government Ten Year Bond, 1.600%, 20/09/14 JPY 134,000,000 1,487,468 1,589,372 1.10Japan Government Ten Year Bond, 1.500%, 20/09/15 JPY 109,000,000 1,199,545 1,308,353 0.90Japan Government Ten Year Bond, 1.900%, 20/06/16 JPY 24,000,000 313,708 294,642 0.20Japan Government Ten Year Bond, 1.800%, 20/09/16 JPY 30,000,000 392,198 368,442 0.25Japan Government Ten Year Bond, 1.700%, 20/03/17 JPY 79,000,000 1,025,814 972,934 0.67Japan Government Ten Year Bond, 1.900%, 20/06/17 JPY 62,000,000 810,468 772,345 0.53Japan Government Ten Year Bond, 1.700%, 20/09/17 JPY 78,500,000 887,548 972,895 0.67Japan Government Ten Year Bond, 1.500%, 20/12/17 JPY 45,000,000 603,879 554,151 0.38Japan Government Ten Year Bond, 1.400%, 20/03/18 JPY 20,000,000 249,359 245,648 0.17Japan Government Ten Year Bond, 1.700%, 20/03/18 JPY 15,000,000 192,656 186,913 0.13Japan Government Ten Year Bond, 1.300%, 20/03/18 JPY 29,000,000 384,181 354,463 0.24Japan Government Ten Year Bond, 1.800%, 20/06/18 JPY 44,000,000 600,671 552,172 0.38Japan Government Ten Year Bond, 1.500%, 20/09/18 JPY 62,000,000 712,053 767,440 0.53Japan Government Ten Year Bond, 1.300%, 20/12/18 JPY 8,000,000 105,729 98,047 0.07Japan Government Ten Year Bond, 1.500%, 20/03/19 JPY 21,000,000 242,589 260,367 0.18Japan Government Ten Year Bond, 1.300%, 20/03/19 JPY 25,000,000 335,152 306,445 0.21Japan Government Ten Year Bond, 1.400%, 20/09/19 JPY 35,000,000 476,507 431,630 0.30Japan Government Ten Year Bond, 1.300%, 20/12/19 JPY 38,000,000 493,140 465,603 0.32Japan Government Ten Year Bond, 1.400%, 20/03/20 JPY 35,000,000 469,062 431,447 0.30Japan Government Ten Year Bond, 1.100%, 20/06/20 JPY 12,000,000 153,410 144,869 0.10Japan Government Ten Year Bond, 1.300%, 20/06/20 JPY 36,000,000 460,534 440,589 0.30Japan Government Ten Year Bond, 1.000%, 20/09/20 JPY 50,000,000 621,673 598,381 0.41Japan Government Ten Year Bond, 1.200%, 20/12/20 JPY 13,000,000 165,809 157,733 0.11Japan Government Ten Year Bond, 1.100%, 20/03/21 JPY 40,000,000 490,846 481,064 0.33Japan Government Ten Year Bond, 1.300%, 20/03/21 JPY 50,000,000 627,822 610,611 0.42Japan Government Ten Year Bond, 1.200%, 20/06/21 JPY 73,000,000 930,780 883,590 0.61Japan Government Ten Year Bond, 1.000%, 20/09/21 JPY 40,000,000 523,999 475,753 0.33Japan Government Ten Year Bond, 1.000%, 20/12/21 JPY 68,000,000 840,908 807,341 0.56Japan Government Ten Year Bond, 1.100%, 20/12/21 JPY 35,000,000 447,251 418,956 0.29Japan Government Ten Year Bond, 1.000%, 20/03/22 JPY 66,000,000 837,907 782,084 0.54Japan Government Ten Year Bond, 0.900%, 20/03/22 JPY 23,000,000 296,335 270,252 0.19
63
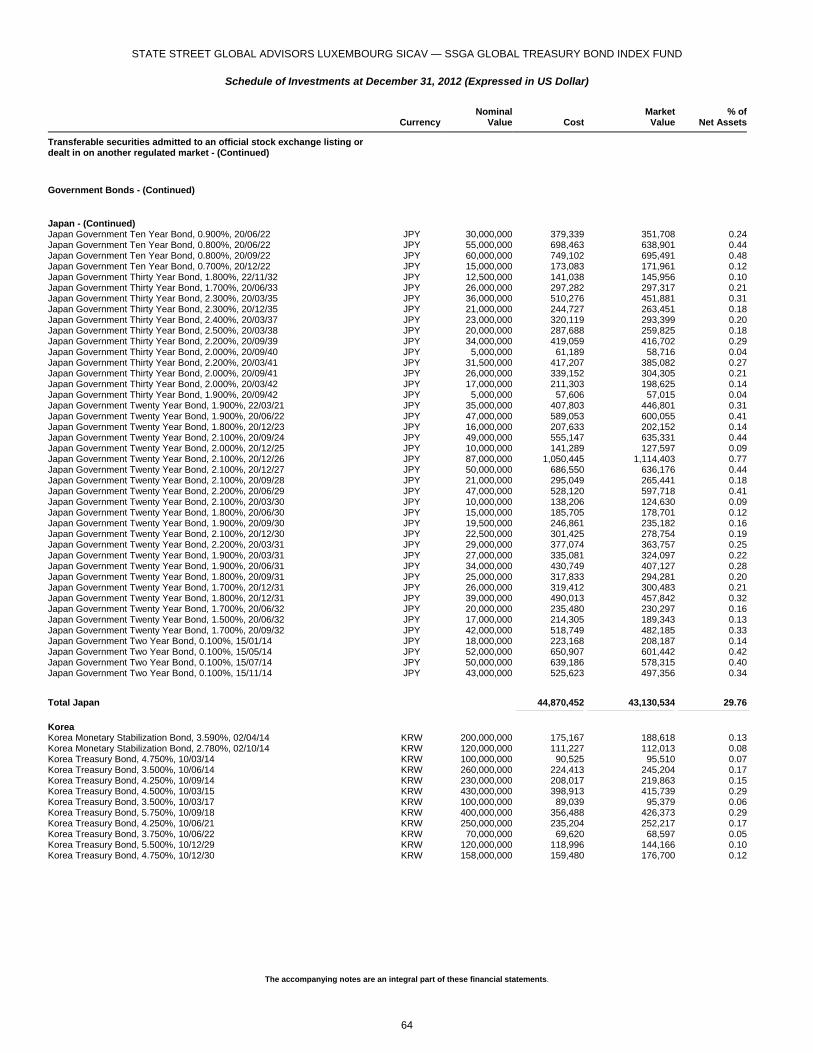
STATE STREET GLOBAL ADVISORS LUXEMBOURG SICAV — SSGA GLOBAL TREASURY BOND INDEX FUND
Schedule of Investments at December 31, 2012 (Expressed in US Dollar)
The accompanying notes are an integral part of these financial statements.
Currency
NominalValue Cost
MarketValue
% ofNet Assets
Transferable securities admitted to an official stock exchange listing or dealt in on another regulated market - (Continued)
Government Bonds - (Continued)
Japan - (Continued) Japan Government Ten Year Bond, 0.900%, 20/06/22 JPY 30,000,000 379,339 351,708 0.24Japan Government Ten Year Bond, 0.800%, 20/06/22 JPY 55,000,000 698,463 638,901 0.44Japan Government Ten Year Bond, 0.800%, 20/09/22 JPY 60,000,000 749,102 695,491 0.48Japan Government Ten Year Bond, 0.700%, 20/12/22 JPY 15,000,000 173,083 171,961 0.12Japan Government Thirty Year Bond, 1.800%, 22/11/32 JPY 12,500,000 141,038 145,956 0.10Japan Government Thirty Year Bond, 1.700%, 20/06/33 JPY 26,000,000 297,282 297,317 0.21Japan Government Thirty Year Bond, 2.300%, 20/03/35 JPY 36,000,000 510,276 451,881 0.31Japan Government Thirty Year Bond, 2.300%, 20/12/35 JPY 21,000,000 244,727 263,451 0.18Japan Government Thirty Year Bond, 2.400%, 20/03/37 JPY 23,000,000 320,119 293,399 0.20Japan Government Thirty Year Bond, 2.500%, 20/03/38 JPY 20,000,000 287,688 259,825 0.18Japan Government Thirty Year Bond, 2.200%, 20/09/39 JPY 34,000,000 419,059 416,702 0.29Japan Government Thirty Year Bond, 2.000%, 20/09/40 JPY 5,000,000 61,189 58,716 0.04Japan Government Thirty Year Bond, 2.200%, 20/03/41 JPY 31,500,000 417,207 385,082 0.27Japan Government Thirty Year Bond, 2.000%, 20/09/41 JPY 26,000,000 339,152 304,305 0.21Japan Government Thirty Year Bond, 2.000%, 20/03/42 JPY 17,000,000 211,303 198,625 0.14Japan Government Thirty Year Bond, 1.900%, 20/09/42 JPY 5,000,000 57,606 57,015 0.04Japan Government Twenty Year Bond, 1.900%, 22/03/21 JPY 35,000,000 407,803 446,801 0.31Japan Government Twenty Year Bond, 1.900%, 20/06/22 JPY 47,000,000 589,053 600,055 0.41Japan Government Twenty Year Bond, 1.800%, 20/12/23 JPY 16,000,000 207,633 202,152 0.14Japan Government Twenty Year Bond, 2.100%, 20/09/24 JPY 49,000,000 555,147 635,331 0.44Japan Government Twenty Year Bond, 2.000%, 20/12/25 JPY 10,000,000 141,289 127,597 0.09Japan Government Twenty Year Bond, 2.100%, 20/12/26 JPY 87,000,000 1,050,445 1,114,403 0.77Japan Government Twenty Year Bond, 2.100%, 20/12/27 JPY 50,000,000 686,550 636,176 0.44Japan Government Twenty Year Bond, 2.100%, 20/09/28 JPY 21,000,000 295,049 265,441 0.18Japan Government Twenty Year Bond, 2.200%, 20/06/29 JPY 47,000,000 528,120 597,718 0.41Japan Government Twenty Year Bond, 2.100%, 20/03/30 JPY 10,000,000 138,206 124,630 0.09Japan Government Twenty Year Bond, 1.800%, 20/06/30 JPY 15,000,000 185,705 178,701 0.12Japan Government Twenty Year Bond, 1.900%, 20/09/30 JPY 19,500,000 246,861 235,182 0.16Japan Government Twenty Year Bond, 2.100%, 20/12/30 JPY 22,500,000 301,425 278,754 0.19Japan Government Twenty Year Bond, 2.200%, 20/03/31 JPY 29,000,000 377,074 363,757 0.25Japan Government Twenty Year Bond, 1.900%, 20/03/31 JPY 27,000,000 335,081 324,097 0.22Japan Government Twenty Year Bond, 1.900%, 20/06/31 JPY 34,000,000 430,749 407,127 0.28Japan Government Twenty Year Bond, 1.800%, 20/09/31 JPY 25,000,000 317,833 294,281 0.20Japan Government Twenty Year Bond, 1.700%, 20/12/31 JPY 26,000,000 319,412 300,483 0.21Japan Government Twenty Year Bond, 1.800%, 20/12/31 JPY 39,000,000 490,013 457,842 0.32Japan Government Twenty Year Bond, 1.700%, 20/06/32 JPY 20,000,000 235,480 230,297 0.16Japan Government Twenty Year Bond, 1.500%, 20/06/32 JPY 17,000,000 214,305 189,343 0.13Japan Government Twenty Year Bond, 1.700%, 20/09/32 JPY 42,000,000 518,749 482,185 0.33Japan Government Two Year Bond, 0.100%, 15/01/14 JPY 18,000,000 223,168 208,187 0.14Japan Government Two Year Bond, 0.100%, 15/05/14 JPY 52,000,000 650,907 601,442 0.42Japan Government Two Year Bond, 0.100%, 15/07/14 JPY 50,000,000 639,186 578,315 0.40Japan Government Two Year Bond, 0.100%, 15/11/14 JPY 43,000,000 525,623 497,356 0.34
Total Japan 44,870,452 43,130,534 29.76 _______________________________________________ ____________________________________________________________ __________________________________________________
Korea Korea Monetary Stabilization Bond, 3.590%, 02/04/14 KRW 200,000,000 175,167 188,618 0.13Korea Monetary Stabilization Bond, 2.780%, 02/10/14 KRW 120,000,000 111,227 112,013 0.08Korea Treasury Bond, 4.750%, 10/03/14 KRW 100,000,000 90,525 95,510 0.07Korea Treasury Bond, 3.500%, 10/06/14 KRW 260,000,000 224,413 245,204 0.17Korea Treasury Bond, 4.250%, 10/09/14 KRW 230,000,000 208,017 219,863 0.15Korea Treasury Bond, 4.500%, 10/03/15 KRW 430,000,000 398,913 415,739 0.29Korea Treasury Bond, 3.500%, 10/03/17 KRW 100,000,000 89,039 95,379 0.06Korea Treasury Bond, 5.750%, 10/09/18 KRW 400,000,000 356,488 426,373 0.29Korea Treasury Bond, 4.250%, 10/06/21 KRW 250,000,000 235,204 252,217 0.17Korea Treasury Bond, 3.750%, 10/06/22 KRW 70,000,000 69,620 68,597 0.05Korea Treasury Bond, 5.500%, 10/12/29 KRW 120,000,000 118,996 144,166 0.10Korea Treasury Bond, 4.750%, 10/12/30 KRW 158,000,000 159,480 176,700 0.12
64
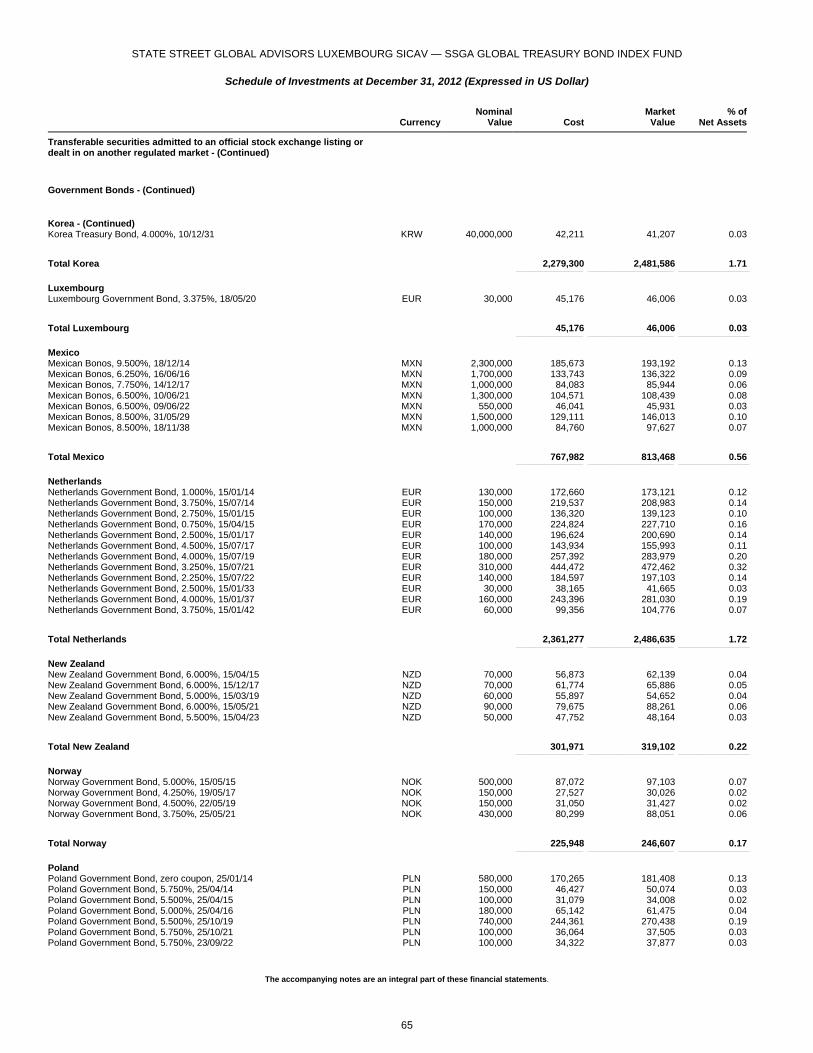
STATE STREET GLOBAL ADVISORS LUXEMBOURG SICAV — SSGA GLOBAL TREASURY BOND INDEX FUND
Schedule of Investments at December 31, 2012 (Expressed in US Dollar)
The accompanying notes are an integral part of these financial statements.
Currency
NominalValue Cost
MarketValue
% ofNet Assets
Transferable securities admitted to an official stock exchange listing or dealt in on another regulated market - (Continued)
Government Bonds - (Continued)
Korea - (Continued) Korea Treasury Bond, 4.000%, 10/12/31 KRW 40,000,000 42,211 41,207 0.03
Total Korea 2,279,300 2,481,586 1.71 _______________________________________________ ____________________________________________________________ __________________________________________________
Luxembourg Luxembourg Government Bond, 3.375%, 18/05/20 EUR 30,000 45,176 46,006 0.03
Total Luxembourg 45,176 46,006 0.03 _______________________________________________ ____________________________________________________________ __________________________________________________
Mexico Mexican Bonos, 9.500%, 18/12/14 MXN 2,300,000 185,673 193,192 0.13Mexican Bonos, 6.250%, 16/06/16 MXN 1,700,000 133,743 136,322 0.09Mexican Bonos, 7.750%, 14/12/17 MXN 1,000,000 84,083 85,944 0.06Mexican Bonos, 6.500%, 10/06/21 MXN 1,300,000 104,571 108,439 0.08Mexican Bonos, 6.500%, 09/06/22 MXN 550,000 46,041 45,931 0.03Mexican Bonos, 8.500%, 31/05/29 MXN 1,500,000 129,111 146,013 0.10Mexican Bonos, 8.500%, 18/11/38 MXN 1,000,000 84,760 97,627 0.07
Total Mexico 767,982 813,468 0.56 _______________________________________________ ____________________________________________________________ __________________________________________________
Netherlands Netherlands Government Bond, 1.000%, 15/01/14 EUR 130,000 172,660 173,121 0.12Netherlands Government Bond, 3.750%, 15/07/14 EUR 150,000 219,537 208,983 0.14Netherlands Government Bond, 2.750%, 15/01/15 EUR 100,000 136,320 139,123 0.10Netherlands Government Bond, 0.750%, 15/04/15 EUR 170,000 224,824 227,710 0.16Netherlands Government Bond, 2.500%, 15/01/17 EUR 140,000 196,624 200,690 0.14Netherlands Government Bond, 4.500%, 15/07/17 EUR 100,000 143,934 155,993 0.11Netherlands Government Bond, 4.000%, 15/07/19 EUR 180,000 257,392 283,979 0.20Netherlands Government Bond, 3.250%, 15/07/21 EUR 310,000 444,472 472,462 0.32Netherlands Government Bond, 2.250%, 15/07/22 EUR 140,000 184,597 197,103 0.14Netherlands Government Bond, 2.500%, 15/01/33 EUR 30,000 38,165 41,665 0.03Netherlands Government Bond, 4.000%, 15/01/37 EUR 160,000 243,396 281,030 0.19Netherlands Government Bond, 3.750%, 15/01/42 EUR 60,000 99,356 104,776 0.07
Total Netherlands 2,361,277 2,486,635 1.72 _______________________________________________ ____________________________________________________________ __________________________________________________
New Zealand New Zealand Government Bond, 6.000%, 15/04/15 NZD 70,000 56,873 62,139 0.04New Zealand Government Bond, 6.000%, 15/12/17 NZD 70,000 61,774 65,886 0.05New Zealand Government Bond, 5.000%, 15/03/19 NZD 60,000 55,897 54,652 0.04New Zealand Government Bond, 6.000%, 15/05/21 NZD 90,000 79,675 88,261 0.06New Zealand Government Bond, 5.500%, 15/04/23 NZD 50,000 47,752 48,164 0.03
Total New Zealand 301,971 319,102 0.22 _______________________________________________ ____________________________________________________________ __________________________________________________
Norway Norway Government Bond, 5.000%, 15/05/15 NOK 500,000 87,072 97,103 0.07Norway Government Bond, 4.250%, 19/05/17 NOK 150,000 27,527 30,026 0.02Norway Government Bond, 4.500%, 22/05/19 NOK 150,000 31,050 31,427 0.02Norway Government Bond, 3.750%, 25/05/21 NOK 430,000 80,299 88,051 0.06
Total Norway 225,948 246,607 0.17 _______________________________________________ ____________________________________________________________ __________________________________________________
Poland Poland Government Bond, zero coupon, 25/01/14 PLN 580,000 170,265 181,408 0.13Poland Government Bond, 5.750%, 25/04/14 PLN 150,000 46,427 50,074 0.03Poland Government Bond, 5.500%, 25/04/15 PLN 100,000 31,079 34,008 0.02Poland Government Bond, 5.000%, 25/04/16 PLN 180,000 65,142 61,475 0.04Poland Government Bond, 5.500%, 25/10/19 PLN 740,000 244,361 270,438 0.19Poland Government Bond, 5.750%, 25/10/21 PLN 100,000 36,064 37,505 0.03Poland Government Bond, 5.750%, 23/09/22 PLN 100,000 34,322 37,877 0.03
65
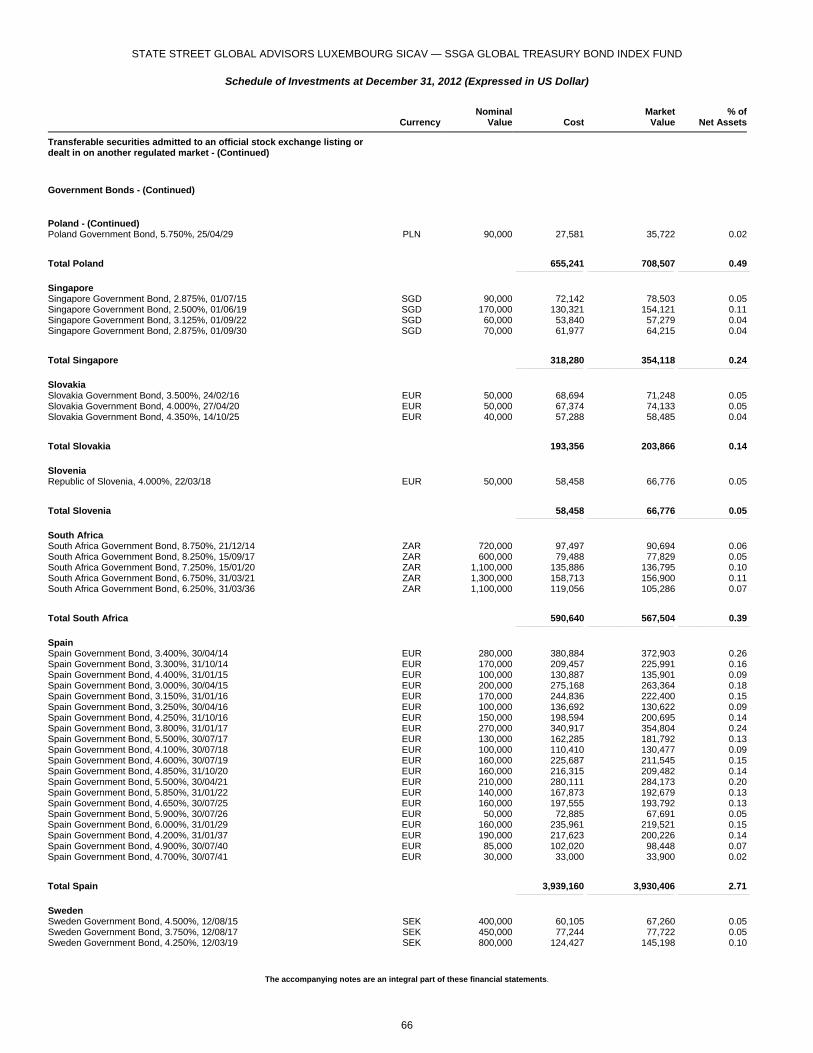
STATE STREET GLOBAL ADVISORS LUXEMBOURG SICAV — SSGA GLOBAL TREASURY BOND INDEX FUND
Schedule of Investments at December 31, 2012 (Expressed in US Dollar)
The accompanying notes are an integral part of these financial statements.
Currency
NominalValue Cost
MarketValue
% ofNet Assets
Transferable securities admitted to an official stock exchange listing or dealt in on another regulated market - (Continued)
Government Bonds - (Continued)
Poland - (Continued) Poland Government Bond, 5.750%, 25/04/29 PLN 90,000 27,581 35,722 0.02
Total Poland 655,241 708,507 0.49 _______________________________________________ ____________________________________________________________ __________________________________________________
Singapore Singapore Government Bond, 2.875%, 01/07/15 SGD 90,000 72,142 78,503 0.05Singapore Government Bond, 2.500%, 01/06/19 SGD 170,000 130,321 154,121 0.11Singapore Government Bond, 3.125%, 01/09/22 SGD 60,000 53,840 57,279 0.04Singapore Government Bond, 2.875%, 01/09/30 SGD 70,000 61,977 64,215 0.04
Total Singapore 318,280 354,118 0.24 _______________________________________________ ____________________________________________________________ __________________________________________________
Slovakia Slovakia Government Bond, 3.500%, 24/02/16 EUR 50,000 68,694 71,248 0.05Slovakia Government Bond, 4.000%, 27/04/20 EUR 50,000 67,374 74,133 0.05Slovakia Government Bond, 4.350%, 14/10/25 EUR 40,000 57,288 58,485 0.04
Total Slovakia 193,356 203,866 0.14 _______________________________________________ ____________________________________________________________ __________________________________________________
Slovenia Republic of Slovenia, 4.000%, 22/03/18 EUR 50,000 58,458 66,776 0.05
Total Slovenia 58,458 66,776 0.05 _______________________________________________ ____________________________________________________________ __________________________________________________
South Africa South Africa Government Bond, 8.750%, 21/12/14 ZAR 720,000 97,497 90,694 0.06South Africa Government Bond, 8.250%, 15/09/17 ZAR 600,000 79,488 77,829 0.05South Africa Government Bond, 7.250%, 15/01/20 ZAR 1,100,000 135,886 136,795 0.10South Africa Government Bond, 6.750%, 31/03/21 ZAR 1,300,000 158,713 156,900 0.11South Africa Government Bond, 6.250%, 31/03/36 ZAR 1,100,000 119,056 105,286 0.07
Total South Africa 590,640 567,504 0.39 _______________________________________________ ____________________________________________________________ __________________________________________________
Spain Spain Government Bond, 3.400%, 30/04/14 EUR 280,000 380,884 372,903 0.26Spain Government Bond, 3.300%, 31/10/14 EUR 170,000 209,457 225,991 0.16Spain Government Bond, 4.400%, 31/01/15 EUR 100,000 130,887 135,901 0.09Spain Government Bond, 3.000%, 30/04/15 EUR 200,000 275,168 263,364 0.18Spain Government Bond, 3.150%, 31/01/16 EUR 170,000 244,836 222,400 0.15Spain Government Bond, 3.250%, 30/04/16 EUR 100,000 136,692 130,622 0.09Spain Government Bond, 4.250%, 31/10/16 EUR 150,000 198,594 200,695 0.14Spain Government Bond, 3.800%, 31/01/17 EUR 270,000 340,917 354,804 0.24Spain Government Bond, 5.500%, 30/07/17 EUR 130,000 162,285 181,792 0.13Spain Government Bond, 4.100%, 30/07/18 EUR 100,000 110,410 130,477 0.09Spain Government Bond, 4.600%, 30/07/19 EUR 160,000 225,687 211,545 0.15Spain Government Bond, 4.850%, 31/10/20 EUR 160,000 216,315 209,482 0.14Spain Government Bond, 5.500%, 30/04/21 EUR 210,000 280,111 284,173 0.20Spain Government Bond, 5.850%, 31/01/22 EUR 140,000 167,873 192,679 0.13Spain Government Bond, 4.650%, 30/07/25 EUR 160,000 197,555 193,792 0.13Spain Government Bond, 5.900%, 30/07/26 EUR 50,000 72,885 67,691 0.05Spain Government Bond, 6.000%, 31/01/29 EUR 160,000 235,961 219,521 0.15Spain Government Bond, 4.200%, 31/01/37 EUR 190,000 217,623 200,226 0.14Spain Government Bond, 4.900%, 30/07/40 EUR 85,000 102,020 98,448 0.07Spain Government Bond, 4.700%, 30/07/41 EUR 30,000 33,000 33,900 0.02
Total Spain 3,939,160 3,930,406 2.71 _______________________________________________ ____________________________________________________________ __________________________________________________
Sweden Sweden Government Bond, 4.500%, 12/08/15 SEK 400,000 60,105 67,260 0.05Sweden Government Bond, 3.750%, 12/08/17 SEK 450,000 77,244 77,722 0.05Sweden Government Bond, 4.250%, 12/03/19 SEK 800,000 124,427 145,198 0.10
66
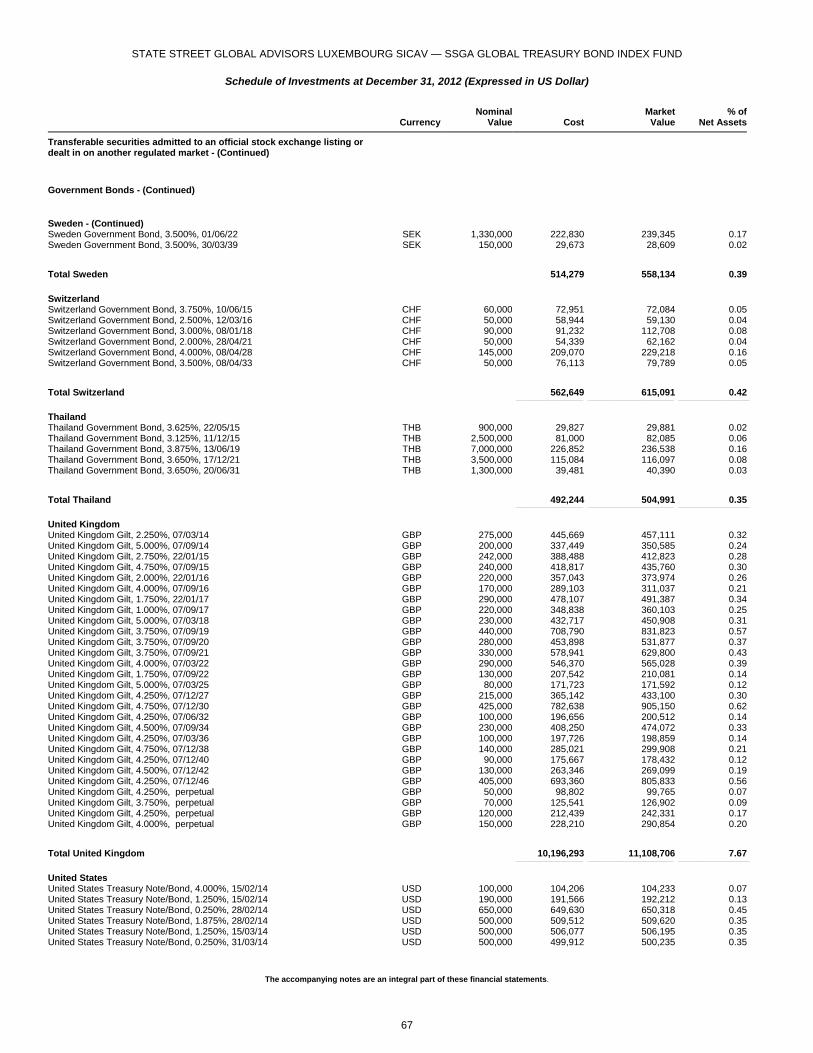
STATE STREET GLOBAL ADVISORS LUXEMBOURG SICAV — SSGA GLOBAL TREASURY BOND INDEX FUND
Schedule of Investments at December 31, 2012 (Expressed in US Dollar)
The accompanying notes are an integral part of these financial statements.
Currency
NominalValue Cost
MarketValue
% ofNet Assets
Transferable securities admitted to an official stock exchange listing or dealt in on another regulated market - (Continued)
Government Bonds - (Continued)
Sweden - (Continued) Sweden Government Bond, 3.500%, 01/06/22 SEK 1,330,000 222,830 239,345 0.17Sweden Government Bond, 3.500%, 30/03/39 SEK 150,000 29,673 28,609 0.02
Total Sweden 514,279 558,134 0.39 _______________________________________________ ____________________________________________________________ __________________________________________________
Switzerland Switzerland Government Bond, 3.750%, 10/06/15 CHF 60,000 72,951 72,084 0.05Switzerland Government Bond, 2.500%, 12/03/16 CHF 50,000 58,944 59,130 0.04Switzerland Government Bond, 3.000%, 08/01/18 CHF 90,000 91,232 112,708 0.08Switzerland Government Bond, 2.000%, 28/04/21 CHF 50,000 54,339 62,162 0.04Switzerland Government Bond, 4.000%, 08/04/28 CHF 145,000 209,070 229,218 0.16Switzerland Government Bond, 3.500%, 08/04/33 CHF 50,000 76,113 79,789 0.05
Total Switzerland 562,649 615,091 0.42 _______________________________________________ ____________________________________________________________ __________________________________________________
Thailand Thailand Government Bond, 3.625%, 22/05/15 THB 900,000 29,827 29,881 0.02Thailand Government Bond, 3.125%, 11/12/15 THB 2,500,000 81,000 82,085 0.06Thailand Government Bond, 3.875%, 13/06/19 THB 7,000,000 226,852 236,538 0.16Thailand Government Bond, 3.650%, 17/12/21 THB 3,500,000 115,084 116,097 0.08Thailand Government Bond, 3.650%, 20/06/31 THB 1,300,000 39,481 40,390 0.03
Total Thailand 492,244 504,991 0.35 _______________________________________________ ____________________________________________________________ __________________________________________________
United Kingdom United Kingdom Gilt, 2.250%, 07/03/14 GBP 275,000 445,669 457,111 0.32United Kingdom Gilt, 5.000%, 07/09/14 GBP 200,000 337,449 350,585 0.24United Kingdom Gilt, 2.750%, 22/01/15 GBP 242,000 388,488 412,823 0.28United Kingdom Gilt, 4.750%, 07/09/15 GBP 240,000 418,817 435,760 0.30United Kingdom Gilt, 2.000%, 22/01/16 GBP 220,000 357,043 373,974 0.26United Kingdom Gilt, 4.000%, 07/09/16 GBP 170,000 289,103 311,037 0.21United Kingdom Gilt, 1.750%, 22/01/17 GBP 290,000 478,107 491,387 0.34United Kingdom Gilt, 1.000%, 07/09/17 GBP 220,000 348,838 360,103 0.25United Kingdom Gilt, 5.000%, 07/03/18 GBP 230,000 432,717 450,908 0.31United Kingdom Gilt, 3.750%, 07/09/19 GBP 440,000 708,790 831,823 0.57United Kingdom Gilt, 3.750%, 07/09/20 GBP 280,000 453,898 531,877 0.37United Kingdom Gilt, 3.750%, 07/09/21 GBP 330,000 578,941 629,800 0.43United Kingdom Gilt, 4.000%, 07/03/22 GBP 290,000 546,370 565,028 0.39United Kingdom Gilt, 1.750%, 07/09/22 GBP 130,000 207,542 210,081 0.14United Kingdom Gilt, 5.000%, 07/03/25 GBP 80,000 171,723 171,592 0.12United Kingdom Gilt, 4.250%, 07/12/27 GBP 215,000 365,142 433,100 0.30United Kingdom Gilt, 4.750%, 07/12/30 GBP 425,000 782,638 905,150 0.62United Kingdom Gilt, 4.250%, 07/06/32 GBP 100,000 196,656 200,512 0.14United Kingdom Gilt, 4.500%, 07/09/34 GBP 230,000 408,250 474,072 0.33United Kingdom Gilt, 4.250%, 07/03/36 GBP 100,000 197,726 198,859 0.14United Kingdom Gilt, 4.750%, 07/12/38 GBP 140,000 285,021 299,908 0.21United Kingdom Gilt, 4.250%, 07/12/40 GBP 90,000 175,667 178,432 0.12United Kingdom Gilt, 4.500%, 07/12/42 GBP 130,000 263,346 269,099 0.19United Kingdom Gilt, 4.250%, 07/12/46 GBP 405,000 693,360 805,833 0.56United Kingdom Gilt, 4.250%, perpetual GBP 50,000 98,802 99,765 0.07United Kingdom Gilt, 3.750%, perpetual GBP 70,000 125,541 126,902 0.09United Kingdom Gilt, 4.250%, perpetual GBP 120,000 212,439 242,331 0.17United Kingdom Gilt, 4.000%, perpetual GBP 150,000 228,210 290,854 0.20
Total United Kingdom 10,196,293 11,108,706 7.67 _______________________________________________ ____________________________________________________________ __________________________________________________
United States United States Treasury Note/Bond, 4.000%, 15/02/14 USD 100,000 104,206 104,233 0.07United States Treasury Note/Bond, 1.250%, 15/02/14 USD 190,000 191,566 192,212 0.13United States Treasury Note/Bond, 0.250%, 28/02/14 USD 650,000 649,630 650,318 0.45United States Treasury Note/Bond, 1.875%, 28/02/14 USD 500,000 509,512 509,620 0.35United States Treasury Note/Bond, 1.250%, 15/03/14 USD 500,000 506,077 506,195 0.35United States Treasury Note/Bond, 0.250%, 31/03/14 USD 500,000 499,912 500,235 0.35
67
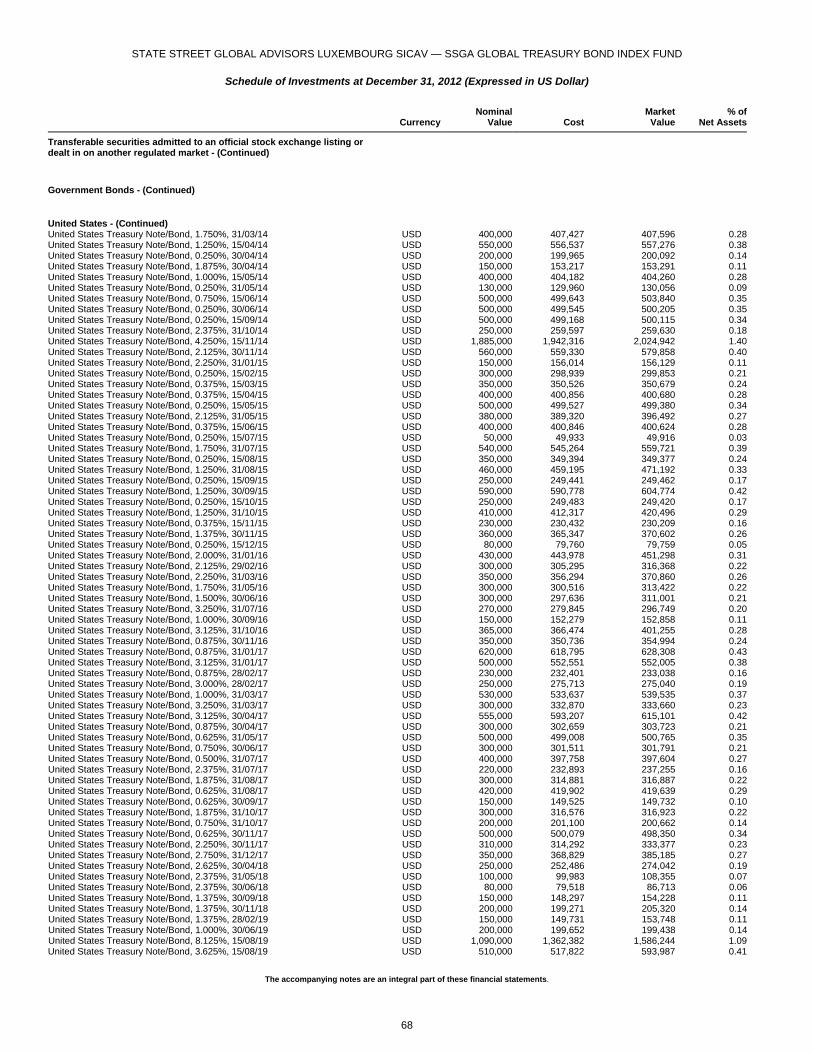
STATE STREET GLOBAL ADVISORS LUXEMBOURG SICAV — SSGA GLOBAL TREASURY BOND INDEX FUND
Schedule of Investments at December 31, 2012 (Expressed in US Dollar)
The accompanying notes are an integral part of these financial statements.
Currency
NominalValue Cost
MarketValue
% ofNet Assets
Transferable securities admitted to an official stock exchange listing or dealt in on another regulated market - (Continued)
Government Bonds - (Continued)
United States - (Continued) United States Treasury Note/Bond, 1.750%, 31/03/14 USD 400,000 407,427 407,596 0.28United States Treasury Note/Bond, 1.250%, 15/04/14 USD 550,000 556,537 557,276 0.38United States Treasury Note/Bond, 0.250%, 30/04/14 USD 200,000 199,965 200,092 0.14United States Treasury Note/Bond, 1.875%, 30/04/14 USD 150,000 153,217 153,291 0.11United States Treasury Note/Bond, 1.000%, 15/05/14 USD 400,000 404,182 404,260 0.28United States Treasury Note/Bond, 0.250%, 31/05/14 USD 130,000 129,960 130,056 0.09United States Treasury Note/Bond, 0.750%, 15/06/14 USD 500,000 499,643 503,840 0.35United States Treasury Note/Bond, 0.250%, 30/06/14 USD 500,000 499,545 500,205 0.35United States Treasury Note/Bond, 0.250%, 15/09/14 USD 500,000 499,168 500,115 0.34United States Treasury Note/Bond, 2.375%, 31/10/14 USD 250,000 259,597 259,630 0.18United States Treasury Note/Bond, 4.250%, 15/11/14 USD 1,885,000 1,942,316 2,024,942 1.40United States Treasury Note/Bond, 2.125%, 30/11/14 USD 560,000 559,330 579,858 0.40United States Treasury Note/Bond, 2.250%, 31/01/15 USD 150,000 156,014 156,129 0.11United States Treasury Note/Bond, 0.250%, 15/02/15 USD 300,000 298,939 299,853 0.21United States Treasury Note/Bond, 0.375%, 15/03/15 USD 350,000 350,526 350,679 0.24United States Treasury Note/Bond, 0.375%, 15/04/15 USD 400,000 400,856 400,680 0.28United States Treasury Note/Bond, 0.250%, 15/05/15 USD 500,000 499,527 499,380 0.34United States Treasury Note/Bond, 2.125%, 31/05/15 USD 380,000 389,320 396,492 0.27United States Treasury Note/Bond, 0.375%, 15/06/15 USD 400,000 400,846 400,624 0.28United States Treasury Note/Bond, 0.250%, 15/07/15 USD 50,000 49,933 49,916 0.03United States Treasury Note/Bond, 1.750%, 31/07/15 USD 540,000 545,264 559,721 0.39United States Treasury Note/Bond, 0.250%, 15/08/15 USD 350,000 349,394 349,377 0.24United States Treasury Note/Bond, 1.250%, 31/08/15 USD 460,000 459,195 471,192 0.33United States Treasury Note/Bond, 0.250%, 15/09/15 USD 250,000 249,441 249,462 0.17United States Treasury Note/Bond, 1.250%, 30/09/15 USD 590,000 590,778 604,774 0.42United States Treasury Note/Bond, 0.250%, 15/10/15 USD 250,000 249,483 249,420 0.17United States Treasury Note/Bond, 1.250%, 31/10/15 USD 410,000 412,317 420,496 0.29United States Treasury Note/Bond, 0.375%, 15/11/15 USD 230,000 230,432 230,209 0.16United States Treasury Note/Bond, 1.375%, 30/11/15 USD 360,000 365,347 370,602 0.26United States Treasury Note/Bond, 0.250%, 15/12/15 USD 80,000 79,760 79,759 0.05United States Treasury Note/Bond, 2.000%, 31/01/16 USD 430,000 443,978 451,298 0.31United States Treasury Note/Bond, 2.125%, 29/02/16 USD 300,000 305,295 316,368 0.22United States Treasury Note/Bond, 2.250%, 31/03/16 USD 350,000 356,294 370,860 0.26United States Treasury Note/Bond, 1.750%, 31/05/16 USD 300,000 300,516 313,422 0.22United States Treasury Note/Bond, 1.500%, 30/06/16 USD 300,000 297,636 311,001 0.21United States Treasury Note/Bond, 3.250%, 31/07/16 USD 270,000 279,845 296,749 0.20United States Treasury Note/Bond, 1.000%, 30/09/16 USD 150,000 152,279 152,858 0.11United States Treasury Note/Bond, 3.125%, 31/10/16 USD 365,000 366,474 401,255 0.28United States Treasury Note/Bond, 0.875%, 30/11/16 USD 350,000 350,736 354,994 0.24United States Treasury Note/Bond, 0.875%, 31/01/17 USD 620,000 618,795 628,308 0.43United States Treasury Note/Bond, 3.125%, 31/01/17 USD 500,000 552,551 552,005 0.38United States Treasury Note/Bond, 0.875%, 28/02/17 USD 230,000 232,401 233,038 0.16United States Treasury Note/Bond, 3.000%, 28/02/17 USD 250,000 275,713 275,040 0.19United States Treasury Note/Bond, 1.000%, 31/03/17 USD 530,000 533,637 539,535 0.37United States Treasury Note/Bond, 3.250%, 31/03/17 USD 300,000 332,870 333,660 0.23United States Treasury Note/Bond, 3.125%, 30/04/17 USD 555,000 593,207 615,101 0.42United States Treasury Note/Bond, 0.875%, 30/04/17 USD 300,000 302,659 303,723 0.21United States Treasury Note/Bond, 0.625%, 31/05/17 USD 500,000 499,008 500,765 0.35United States Treasury Note/Bond, 0.750%, 30/06/17 USD 300,000 301,511 301,791 0.21United States Treasury Note/Bond, 0.500%, 31/07/17 USD 400,000 397,758 397,604 0.27United States Treasury Note/Bond, 2.375%, 31/07/17 USD 220,000 232,893 237,255 0.16United States Treasury Note/Bond, 1.875%, 31/08/17 USD 300,000 314,881 316,887 0.22United States Treasury Note/Bond, 0.625%, 31/08/17 USD 420,000 419,902 419,639 0.29United States Treasury Note/Bond, 0.625%, 30/09/17 USD 150,000 149,525 149,732 0.10United States Treasury Note/Bond, 1.875%, 31/10/17 USD 300,000 316,576 316,923 0.22United States Treasury Note/Bond, 0.750%, 31/10/17 USD 200,000 201,100 200,662 0.14United States Treasury Note/Bond, 0.625%, 30/11/17 USD 500,000 500,079 498,350 0.34United States Treasury Note/Bond, 2.250%, 30/11/17 USD 310,000 314,292 333,377 0.23United States Treasury Note/Bond, 2.750%, 31/12/17 USD 350,000 368,829 385,185 0.27United States Treasury Note/Bond, 2.625%, 30/04/18 USD 250,000 252,486 274,042 0.19United States Treasury Note/Bond, 2.375%, 31/05/18 USD 100,000 99,983 108,355 0.07United States Treasury Note/Bond, 2.375%, 30/06/18 USD 80,000 79,518 86,713 0.06United States Treasury Note/Bond, 1.375%, 30/09/18 USD 150,000 148,297 154,228 0.11United States Treasury Note/Bond, 1.375%, 30/11/18 USD 200,000 199,271 205,320 0.14United States Treasury Note/Bond, 1.375%, 28/02/19 USD 150,000 149,731 153,748 0.11United States Treasury Note/Bond, 1.000%, 30/06/19 USD 200,000 199,652 199,438 0.14United States Treasury Note/Bond, 8.125%, 15/08/19 USD 1,090,000 1,362,382 1,586,244 1.09United States Treasury Note/Bond, 3.625%, 15/08/19 USD 510,000 517,822 593,987 0.41
68
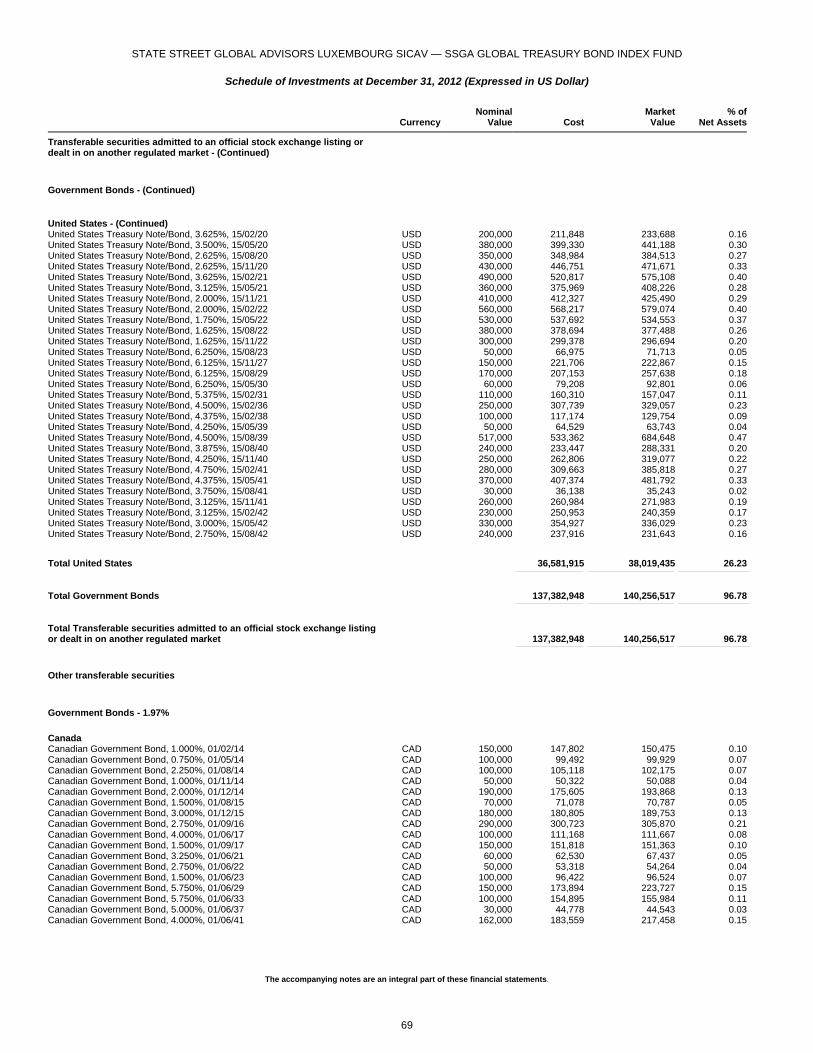
STATE STREET GLOBAL ADVISORS LUXEMBOURG SICAV — SSGA GLOBAL TREASURY BOND INDEX FUND
Schedule of Investments at December 31, 2012 (Expressed in US Dollar)
The accompanying notes are an integral part of these financial statements.
Currency
NominalValue Cost
MarketValue
% ofNet Assets
Transferable securities admitted to an official stock exchange listing or dealt in on another regulated market - (Continued)
Government Bonds - (Continued)
United States - (Continued) United States Treasury Note/Bond, 3.625%, 15/02/20 USD 200,000 211,848 233,688 0.16United States Treasury Note/Bond, 3.500%, 15/05/20 USD 380,000 399,330 441,188 0.30United States Treasury Note/Bond, 2.625%, 15/08/20 USD 350,000 348,984 384,513 0.27United States Treasury Note/Bond, 2.625%, 15/11/20 USD 430,000 446,751 471,671 0.33United States Treasury Note/Bond, 3.625%, 15/02/21 USD 490,000 520,817 575,108 0.40United States Treasury Note/Bond, 3.125%, 15/05/21 USD 360,000 375,969 408,226 0.28United States Treasury Note/Bond, 2.000%, 15/11/21 USD 410,000 412,327 425,490 0.29United States Treasury Note/Bond, 2.000%, 15/02/22 USD 560,000 568,217 579,074 0.40United States Treasury Note/Bond, 1.750%, 15/05/22 USD 530,000 537,692 534,553 0.37United States Treasury Note/Bond, 1.625%, 15/08/22 USD 380,000 378,694 377,488 0.26United States Treasury Note/Bond, 1.625%, 15/11/22 USD 300,000 299,378 296,694 0.20United States Treasury Note/Bond, 6.250%, 15/08/23 USD 50,000 66,975 71,713 0.05United States Treasury Note/Bond, 6.125%, 15/11/27 USD 150,000 221,706 222,867 0.15United States Treasury Note/Bond, 6.125%, 15/08/29 USD 170,000 207,153 257,638 0.18United States Treasury Note/Bond, 6.250%, 15/05/30 USD 60,000 79,208 92,801 0.06United States Treasury Note/Bond, 5.375%, 15/02/31 USD 110,000 160,310 157,047 0.11United States Treasury Note/Bond, 4.500%, 15/02/36 USD 250,000 307,739 329,057 0.23United States Treasury Note/Bond, 4.375%, 15/02/38 USD 100,000 117,174 129,754 0.09United States Treasury Note/Bond, 4.250%, 15/05/39 USD 50,000 64,529 63,743 0.04United States Treasury Note/Bond, 4.500%, 15/08/39 USD 517,000 533,362 684,648 0.47United States Treasury Note/Bond, 3.875%, 15/08/40 USD 240,000 233,447 288,331 0.20United States Treasury Note/Bond, 4.250%, 15/11/40 USD 250,000 262,806 319,077 0.22United States Treasury Note/Bond, 4.750%, 15/02/41 USD 280,000 309,663 385,818 0.27United States Treasury Note/Bond, 4.375%, 15/05/41 USD 370,000 407,374 481,792 0.33United States Treasury Note/Bond, 3.750%, 15/08/41 USD 30,000 36,138 35,243 0.02United States Treasury Note/Bond, 3.125%, 15/11/41 USD 260,000 260,984 271,983 0.19United States Treasury Note/Bond, 3.125%, 15/02/42 USD 230,000 250,953 240,359 0.17United States Treasury Note/Bond, 3.000%, 15/05/42 USD 330,000 354,927 336,029 0.23United States Treasury Note/Bond, 2.750%, 15/08/42 USD 240,000 237,916 231,643 0.16
Total United States 36,581,915 38,019,435 26.23 _______________________________________________ ____________________________________________________________ __________________________________________________
Total Government Bonds 137,382,948 140,256,517 96.78 _______________________________________________ ____________________________________________________________ __________________________________________________
Total Transferable securities admitted to an official stock exchange listing or dealt in on another regulated market 137,382,948 140,256,517 96.78 _______________________________________________ ____________________________________________________________ __________________________________________________
Other transferable securities
Government Bonds - 1.97%
Canada Canadian Government Bond, 1.000%, 01/02/14 CAD 150,000 147,802 150,475 0.10Canadian Government Bond, 0.750%, 01/05/14 CAD 100,000 99,492 99,929 0.07Canadian Government Bond, 2.250%, 01/08/14 CAD 100,000 105,118 102,175 0.07Canadian Government Bond, 1.000%, 01/11/14 CAD 50,000 50,322 50,088 0.04Canadian Government Bond, 2.000%, 01/12/14 CAD 190,000 175,605 193,868 0.13Canadian Government Bond, 1.500%, 01/08/15 CAD 70,000 71,078 70,787 0.05Canadian Government Bond, 3.000%, 01/12/15 CAD 180,000 180,805 189,753 0.13Canadian Government Bond, 2.750%, 01/09/16 CAD 290,000 300,723 305,870 0.21Canadian Government Bond, 4.000%, 01/06/17 CAD 100,000 111,168 111,667 0.08Canadian Government Bond, 1.500%, 01/09/17 CAD 150,000 151,818 151,363 0.10Canadian Government Bond, 3.250%, 01/06/21 CAD 60,000 62,530 67,437 0.05Canadian Government Bond, 2.750%, 01/06/22 CAD 50,000 53,318 54,264 0.04Canadian Government Bond, 1.500%, 01/06/23 CAD 100,000 96,422 96,524 0.07Canadian Government Bond, 5.750%, 01/06/29 CAD 150,000 173,894 223,727 0.15Canadian Government Bond, 5.750%, 01/06/33 CAD 100,000 154,895 155,984 0.11Canadian Government Bond, 5.000%, 01/06/37 CAD 30,000 44,778 44,543 0.03Canadian Government Bond, 4.000%, 01/06/41 CAD 162,000 183,559 217,458 0.15
69
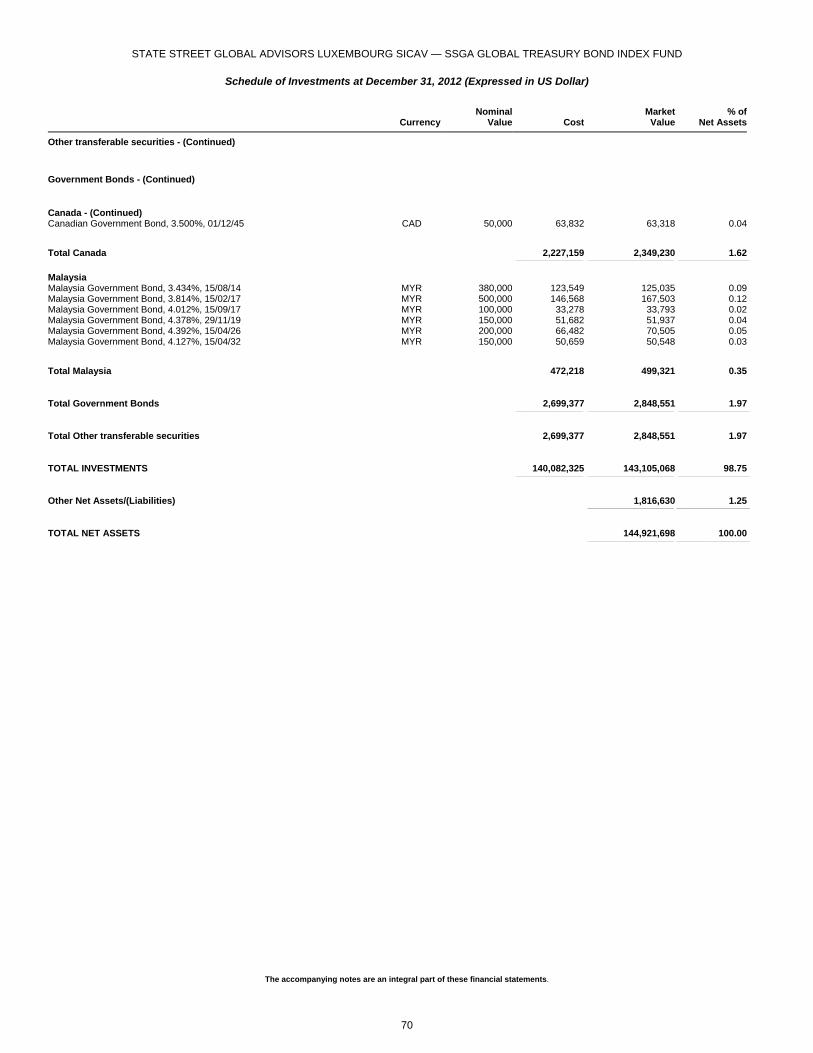
STATE STREET GLOBAL ADVISORS LUXEMBOURG SICAV — SSGA GLOBAL TREASURY BOND INDEX FUND
Schedule of Investments at December 31, 2012 (Expressed in US Dollar)
The accompanying notes are an integral part of these financial statements.
Currency
NominalValue Cost
MarketValue
% ofNet Assets
Other transferable securities - (Continued)
Government Bonds - (Continued)
Canada - (Continued) Canadian Government Bond, 3.500%, 01/12/45 CAD 50,000 63,832 63,318 0.04
Total Canada 2,227,159 2,349,230 1.62 _______________________________________________ ____________________________________________________________ __________________________________________________
Malaysia Malaysia Government Bond, 3.434%, 15/08/14 MYR 380,000 123,549 125,035 0.09Malaysia Government Bond, 3.814%, 15/02/17 MYR 500,000 146,568 167,503 0.12Malaysia Government Bond, 4.012%, 15/09/17 MYR 100,000 33,278 33,793 0.02Malaysia Government Bond, 4.378%, 29/11/19 MYR 150,000 51,682 51,937 0.04Malaysia Government Bond, 4.392%, 15/04/26 MYR 200,000 66,482 70,505 0.05Malaysia Government Bond, 4.127%, 15/04/32 MYR 150,000 50,659 50,548 0.03
Total Malaysia 472,218 499,321 0.35 _______________________________________________ ____________________________________________________________ __________________________________________________
Total Government Bonds 2,699,377 2,848,551 1.97 _______________________________________________ ____________________________________________________________ __________________________________________________
Total Other transferable securities 2,699,377 2,848,551 1.97 _______________________________________________ ____________________________________________________________ __________________________________________________
TOTAL INVESTMENTS 140,082,325 143,105,068 98.75 _______________________________________________ ____________________________________________________________ __________________________________________________
Other Net Assets/(Liabilities) 1,816,630 1.25 ____________________________________________________________ ___________________________________________________
TOTAL NET ASSETS 144,921,698 100.00 ____________________________________________________________ ___________________________________________________
70
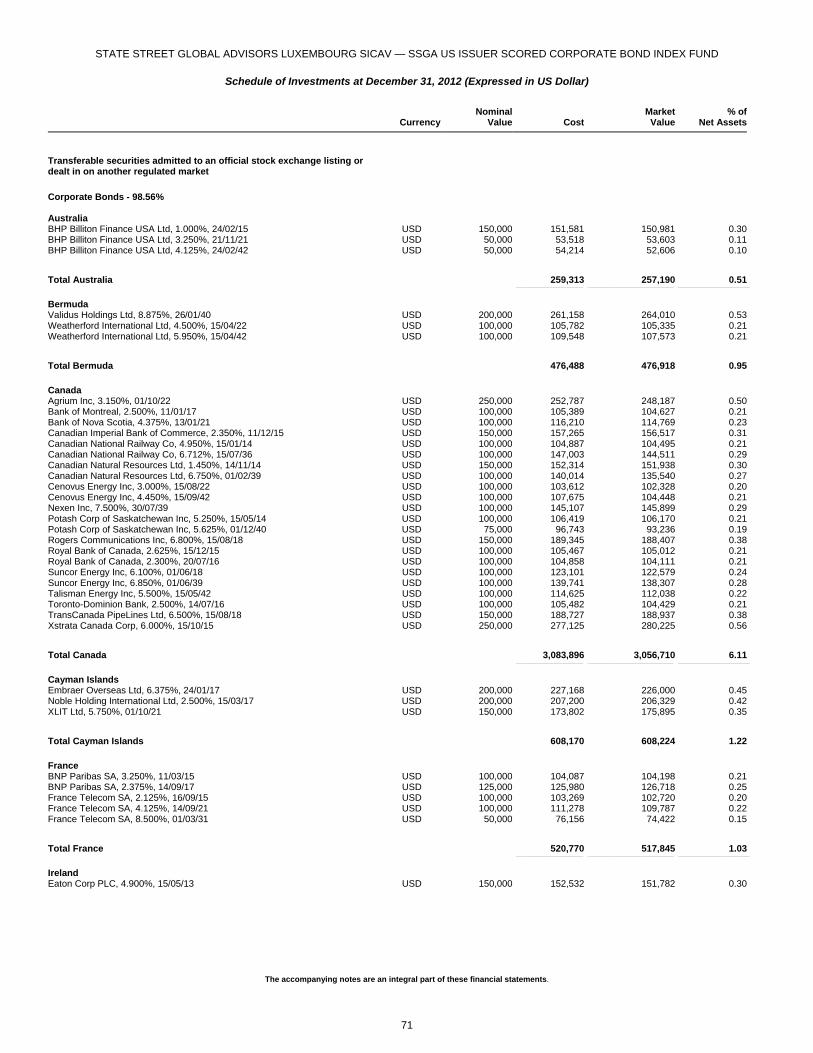
STATE STREET GLOBAL ADVISORS LUXEMBOURG SICAV — SSGA US ISSUER SCORED CORPORATE BOND INDEX FUND
Schedule of Investments at December 31, 2012 (Expressed in US Dollar)
The accompanying notes are an integral part of these financial statements.
Currency
NominalValue Cost
MarketValue
% ofNet Assets
Transferable securities admitted to an official stock exchange listing or dealt in on another regulated market
Corporate Bonds - 98.56% Australia BHP Billiton Finance USA Ltd, 1.000%, 24/02/15 USD 150,000 151,581 150,981 0.30BHP Billiton Finance USA Ltd, 3.250%, 21/11/21 USD 50,000 53,518 53,603 0.11BHP Billiton Finance USA Ltd, 4.125%, 24/02/42 USD 50,000 54,214 52,606 0.10
Total Australia 259,313 257,190 0.51 _______________________________________________ ____________________________________________________________ __________________________________________________
Bermuda Validus Holdings Ltd, 8.875%, 26/01/40 USD 200,000 261,158 264,010 0.53Weatherford International Ltd, 4.500%, 15/04/22 USD 100,000 105,782 105,335 0.21Weatherford International Ltd, 5.950%, 15/04/42 USD 100,000 109,548 107,573 0.21
Total Bermuda 476,488 476,918 0.95 _______________________________________________ ____________________________________________________________ __________________________________________________
Canada Agrium Inc, 3.150%, 01/10/22 USD 250,000 252,787 248,187 0.50Bank of Montreal, 2.500%, 11/01/17 USD 100,000 105,389 104,627 0.21Bank of Nova Scotia, 4.375%, 13/01/21 USD 100,000 116,210 114,769 0.23Canadian Imperial Bank of Commerce, 2.350%, 11/12/15 USD 150,000 157,265 156,517 0.31Canadian National Railway Co, 4.950%, 15/01/14 USD 100,000 104,887 104,495 0.21Canadian National Railway Co, 6.712%, 15/07/36 USD 100,000 147,003 144,511 0.29Canadian Natural Resources Ltd, 1.450%, 14/11/14 USD 150,000 152,314 151,938 0.30Canadian Natural Resources Ltd, 6.750%, 01/02/39 USD 100,000 140,014 135,540 0.27Cenovus Energy Inc, 3.000%, 15/08/22 USD 100,000 103,612 102,328 0.20Cenovus Energy Inc, 4.450%, 15/09/42 USD 100,000 107,675 104,448 0.21Nexen Inc, 7.500%, 30/07/39 USD 100,000 145,107 145,899 0.29Potash Corp of Saskatchewan Inc, 5.250%, 15/05/14 USD 100,000 106,419 106,170 0.21Potash Corp of Saskatchewan Inc, 5.625%, 01/12/40 USD 75,000 96,743 93,236 0.19Rogers Communications Inc, 6.800%, 15/08/18 USD 150,000 189,345 188,407 0.38Royal Bank of Canada, 2.625%, 15/12/15 USD 100,000 105,467 105,012 0.21Royal Bank of Canada, 2.300%, 20/07/16 USD 100,000 104,858 104,111 0.21Suncor Energy Inc, 6.100%, 01/06/18 USD 100,000 123,101 122,579 0.24Suncor Energy Inc, 6.850%, 01/06/39 USD 100,000 139,741 138,307 0.28Talisman Energy Inc, 5.500%, 15/05/42 USD 100,000 114,625 112,038 0.22Toronto-Dominion Bank, 2.500%, 14/07/16 USD 100,000 105,482 104,429 0.21TransCanada PipeLines Ltd, 6.500%, 15/08/18 USD 150,000 188,727 188,937 0.38Xstrata Canada Corp, 6.000%, 15/10/15 USD 250,000 277,125 280,225 0.56
Total Canada 3,083,896 3,056,710 6.11 _______________________________________________ ____________________________________________________________ __________________________________________________
Cayman Islands Embraer Overseas Ltd, 6.375%, 24/01/17 USD 200,000 227,168 226,000 0.45Noble Holding International Ltd, 2.500%, 15/03/17 USD 200,000 207,200 206,329 0.42XLIT Ltd, 5.750%, 01/10/21 USD 150,000 173,802 175,895 0.35
Total Cayman Islands 608,170 608,224 1.22 _______________________________________________ ____________________________________________________________ __________________________________________________
France BNP Paribas SA, 3.250%, 11/03/15 USD 100,000 104,087 104,198 0.21BNP Paribas SA, 2.375%, 14/09/17 USD 125,000 125,980 126,718 0.25France Telecom SA, 2.125%, 16/09/15 USD 100,000 103,269 102,720 0.20France Telecom SA, 4.125%, 14/09/21 USD 100,000 111,278 109,787 0.22France Telecom SA, 8.500%, 01/03/31 USD 50,000 76,156 74,422 0.15
Total France 520,770 517,845 1.03 _______________________________________________ ____________________________________________________________ __________________________________________________
Ireland Eaton Corp PLC, 4.900%, 15/05/13 USD 150,000 152,532 151,782 0.30
71

STATE STREET GLOBAL ADVISORS LUXEMBOURG SICAV — SSGA US ISSUER SCORED CORPORATE BOND INDEX FUND
Schedule of Investments at December 31, 2012 (Expressed in US Dollar)
The accompanying notes are an integral part of these financial statements.
Currency
NominalValue Cost
MarketValue
% ofNet Assets
Transferable securities admitted to an official stock exchange listing or dealt in on another regulated market - (Continued)
Corporate Bonds - (Continued)
Ireland - (Continued) Willis Group Holdings PLC, 5.750%, 15/03/21 USD 150,000 171,100 167,122 0.34
Total Ireland 323,632 318,904 0.64 _______________________________________________ ____________________________________________________________ __________________________________________________
Isle Of Man AngloGold Ashanti Holdings PLC, 5.125%, 01/08/22 USD 200,000 206,203 202,683 0.41
Total Isle Of Man 206,203 202,683 0.41 _______________________________________________ ____________________________________________________________ __________________________________________________
Japan ORIX Corp, 5.000%, 12/01/16 USD 200,000 217,988 216,841 0.43
Total Japan 217,988 216,841 0.43 _______________________________________________ ____________________________________________________________ __________________________________________________
Luxembourg Covidien International Finance SA, 6.000%, 15/10/17 USD 100,000 122,071 120,632 0.24Covidien International Finance SA, 3.200%, 15/06/22 USD 50,000 53,560 52,665 0.10Telecom Italia Capital SA, 6.175%, 18/06/14 USD 150,000 157,732 158,250 0.32
Total Luxembourg 333,363 331,547 0.66 _______________________________________________ ____________________________________________________________ __________________________________________________
Netherlands Coca-Cola HBC Finance BV, 5.125%, 17/09/13 USD 250,000 255,369 255,625 0.51Shell International Finance BV, 1.125%, 21/08/17 USD 200,000 201,744 200,708 0.40
Total Netherlands 457,113 456,333 0.91 _______________________________________________ ____________________________________________________________ __________________________________________________
Spain BBVA US Senior SAU, 4.664%, 09/10/15 USD 200,000 200,000 204,218 0.41
Total Spain 200,000 204,218 0.41 _______________________________________________ ____________________________________________________________ __________________________________________________
Sweden Telefonaktiebolaget LM Ericsson, 4.125%, 15/05/22 USD 100,000 104,270 104,328 0.21
Total Sweden 104,270 104,328 0.21 _______________________________________________ ____________________________________________________________ __________________________________________________
United Kingdom AstraZeneca PLC, 6.450%, 15/09/37 USD 100,000 138,369 135,773 0.27Barclays Bank PLC, 5.200%, 10/07/14 USD 150,000 159,054 159,504 0.32BP Capital Markets PLC, 2.248%, 01/11/16 USD 150,000 157,022 155,948 0.31BP Capital Markets PLC, 3.245%, 06/05/22 USD 125,000 133,479 131,152 0.26British Telecommunications PLC, 5.950%, 15/01/18 USD 100,000 119,098 120,083 0.24British Telecommunications PLC, 9.625%, 15/12/30 USD 100,000 164,409 158,012 0.32GlaxoSmithKline Capital PLC, 0.750%, 08/05/15 USD 100,000 100,822 100,320 0.20GlaxoSmithKline Capital PLC, 2.850%, 08/05/22 USD 50,000 52,192 51,887 0.10HSBC Holdings PLC, 4.000%, 30/03/22 USD 150,000 162,584 163,333 0.33Lloyds TSB Bank PLC, 4.200%, 28/03/17 USD 50,000 55,032 55,166 0.11National Grid PLC, 6.300%, 01/08/16 USD 200,000 233,590 232,632 0.47Rio Tinto Finance USA PLC, 1.625%, 21/08/17 USD 200,000 201,130 202,541 0.40Royal Bank of Scotland PLC, 4.375%, 16/03/16 USD 150,000 161,468 162,883 0.33Royal Bank of Scotland PLC, 5.625%, 24/08/20 USD 100,000 114,535 116,132 0.23WPP Finance 2010, 3.625%, 07/09/22 USD 100,000 101,176 100,061 0.20WPP Finance 2010, 5.125%, 07/09/42 USD 75,000 74,355 74,412 0.15
Total United Kingdom 2,128,315 2,119,839 4.24 _______________________________________________ ____________________________________________________________ __________________________________________________
United States 3M Co, 2.000%, 26/06/22 USD 200,000 201,427 196,981 0.39
72
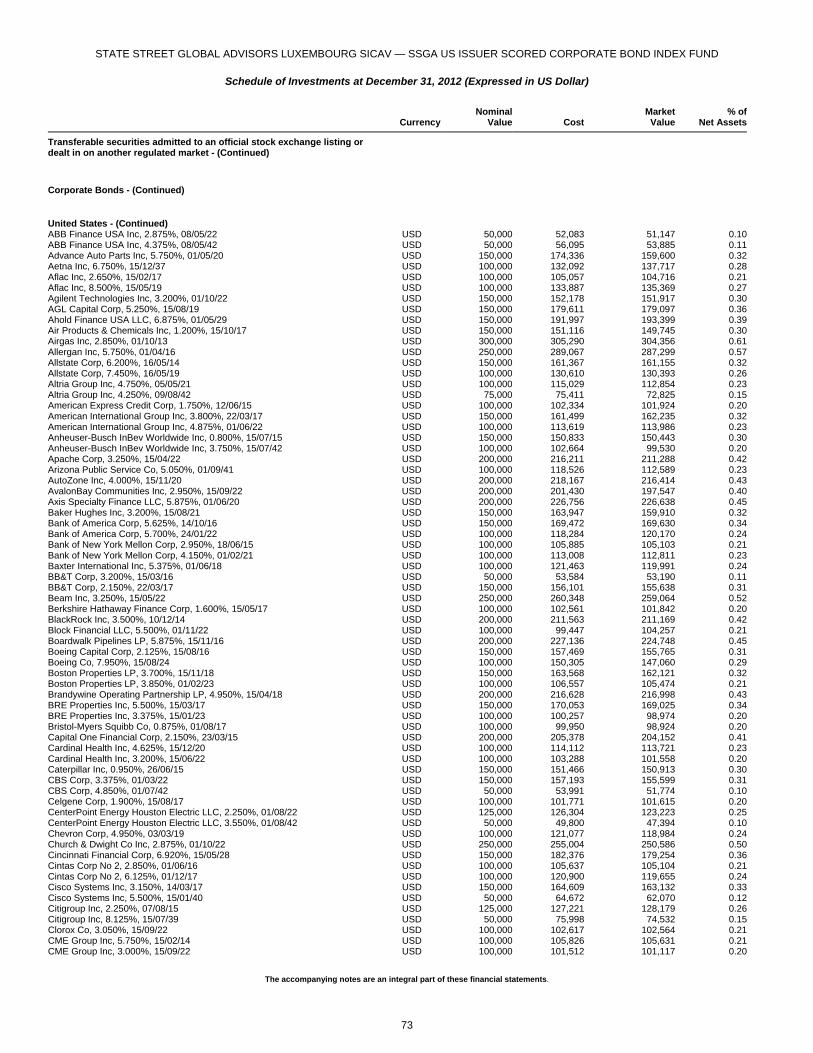
STATE STREET GLOBAL ADVISORS LUXEMBOURG SICAV — SSGA US ISSUER SCORED CORPORATE BOND INDEX FUND
Schedule of Investments at December 31, 2012 (Expressed in US Dollar)
The accompanying notes are an integral part of these financial statements.
Currency
NominalValue Cost
MarketValue
% ofNet Assets
Transferable securities admitted to an official stock exchange listing or dealt in on another regulated market - (Continued)
Corporate Bonds - (Continued)
United States - (Continued) ABB Finance USA Inc, 2.875%, 08/05/22 USD 50,000 52,083 51,147 0.10ABB Finance USA Inc, 4.375%, 08/05/42 USD 50,000 56,095 53,885 0.11Advance Auto Parts Inc, 5.750%, 01/05/20 USD 150,000 174,336 159,600 0.32Aetna Inc, 6.750%, 15/12/37 USD 100,000 132,092 137,717 0.28Aflac Inc, 2.650%, 15/02/17 USD 100,000 105,057 104,716 0.21Aflac Inc, 8.500%, 15/05/19 USD 100,000 133,887 135,369 0.27Agilent Technologies Inc, 3.200%, 01/10/22 USD 150,000 152,178 151,917 0.30AGL Capital Corp, 5.250%, 15/08/19 USD 150,000 179,611 179,097 0.36Ahold Finance USA LLC, 6.875%, 01/05/29 USD 150,000 191,997 193,399 0.39Air Products & Chemicals Inc, 1.200%, 15/10/17 USD 150,000 151,116 149,745 0.30Airgas Inc, 2.850%, 01/10/13 USD 300,000 305,290 304,356 0.61Allergan Inc, 5.750%, 01/04/16 USD 250,000 289,067 287,299 0.57Allstate Corp, 6.200%, 16/05/14 USD 150,000 161,367 161,155 0.32Allstate Corp, 7.450%, 16/05/19 USD 100,000 130,610 130,393 0.26Altria Group Inc, 4.750%, 05/05/21 USD 100,000 115,029 112,854 0.23Altria Group Inc, 4.250%, 09/08/42 USD 75,000 75,411 72,825 0.15American Express Credit Corp, 1.750%, 12/06/15 USD 100,000 102,334 101,924 0.20American International Group Inc, 3.800%, 22/03/17 USD 150,000 161,499 162,235 0.32American International Group Inc, 4.875%, 01/06/22 USD 100,000 113,619 113,986 0.23Anheuser-Busch InBev Worldwide Inc, 0.800%, 15/07/15 USD 150,000 150,833 150,443 0.30Anheuser-Busch InBev Worldwide Inc, 3.750%, 15/07/42 USD 100,000 102,664 99,530 0.20Apache Corp, 3.250%, 15/04/22 USD 200,000 216,211 211,288 0.42Arizona Public Service Co, 5.050%, 01/09/41 USD 100,000 118,526 112,589 0.23AutoZone Inc, 4.000%, 15/11/20 USD 200,000 218,167 216,414 0.43AvalonBay Communities Inc, 2.950%, 15/09/22 USD 200,000 201,430 197,547 0.40Axis Specialty Finance LLC, 5.875%, 01/06/20 USD 200,000 226,756 226,638 0.45Baker Hughes Inc, 3.200%, 15/08/21 USD 150,000 163,947 159,910 0.32Bank of America Corp, 5.625%, 14/10/16 USD 150,000 169,472 169,630 0.34Bank of America Corp, 5.700%, 24/01/22 USD 100,000 118,284 120,170 0.24Bank of New York Mellon Corp, 2.950%, 18/06/15 USD 100,000 105,885 105,103 0.21Bank of New York Mellon Corp, 4.150%, 01/02/21 USD 100,000 113,008 112,811 0.23Baxter International Inc, 5.375%, 01/06/18 USD 100,000 121,463 119,991 0.24BB&T Corp, 3.200%, 15/03/16 USD 50,000 53,584 53,190 0.11BB&T Corp, 2.150%, 22/03/17 USD 150,000 156,101 155,638 0.31Beam Inc, 3.250%, 15/05/22 USD 250,000 260,348 259,064 0.52Berkshire Hathaway Finance Corp, 1.600%, 15/05/17 USD 100,000 102,561 101,842 0.20BlackRock Inc, 3.500%, 10/12/14 USD 200,000 211,563 211,169 0.42Block Financial LLC, 5.500%, 01/11/22 USD 100,000 99,447 104,257 0.21Boardwalk Pipelines LP, 5.875%, 15/11/16 USD 200,000 227,136 224,748 0.45Boeing Capital Corp, 2.125%, 15/08/16 USD 150,000 157,469 155,765 0.31Boeing Co, 7.950%, 15/08/24 USD 100,000 150,305 147,060 0.29Boston Properties LP, 3.700%, 15/11/18 USD 150,000 163,568 162,121 0.32Boston Properties LP, 3.850%, 01/02/23 USD 100,000 106,557 105,474 0.21Brandywine Operating Partnership LP, 4.950%, 15/04/18 USD 200,000 216,628 216,998 0.43BRE Properties Inc, 5.500%, 15/03/17 USD 150,000 170,053 169,025 0.34BRE Properties Inc, 3.375%, 15/01/23 USD 100,000 100,257 98,974 0.20Bristol-Myers Squibb Co, 0.875%, 01/08/17 USD 100,000 99,950 98,924 0.20Capital One Financial Corp, 2.150%, 23/03/15 USD 200,000 205,378 204,152 0.41Cardinal Health Inc, 4.625%, 15/12/20 USD 100,000 114,112 113,721 0.23Cardinal Health Inc, 3.200%, 15/06/22 USD 100,000 103,288 101,558 0.20Caterpillar Inc, 0.950%, 26/06/15 USD 150,000 151,466 150,913 0.30CBS Corp, 3.375%, 01/03/22 USD 150,000 157,193 155,599 0.31CBS Corp, 4.850%, 01/07/42 USD 50,000 53,991 51,774 0.10Celgene Corp, 1.900%, 15/08/17 USD 100,000 101,771 101,615 0.20CenterPoint Energy Houston Electric LLC, 2.250%, 01/08/22 USD 125,000 126,304 123,223 0.25CenterPoint Energy Houston Electric LLC, 3.550%, 01/08/42 USD 50,000 49,800 47,394 0.10Chevron Corp, 4.950%, 03/03/19 USD 100,000 121,077 118,984 0.24Church & Dwight Co Inc, 2.875%, 01/10/22 USD 250,000 255,004 250,586 0.50Cincinnati Financial Corp, 6.920%, 15/05/28 USD 150,000 182,376 179,254 0.36Cintas Corp No 2, 2.850%, 01/06/16 USD 100,000 105,637 105,104 0.21Cintas Corp No 2, 6.125%, 01/12/17 USD 100,000 120,900 119,655 0.24Cisco Systems Inc, 3.150%, 14/03/17 USD 150,000 164,609 163,132 0.33Cisco Systems Inc, 5.500%, 15/01/40 USD 50,000 64,672 62,070 0.12Citigroup Inc, 2.250%, 07/08/15 USD 125,000 127,221 128,179 0.26Citigroup Inc, 8.125%, 15/07/39 USD 50,000 75,998 74,532 0.15Clorox Co, 3.050%, 15/09/22 USD 100,000 102,617 102,564 0.21CME Group Inc, 5.750%, 15/02/14 USD 100,000 105,826 105,631 0.21CME Group Inc, 3.000%, 15/09/22 USD 100,000 101,512 101,117 0.20
73
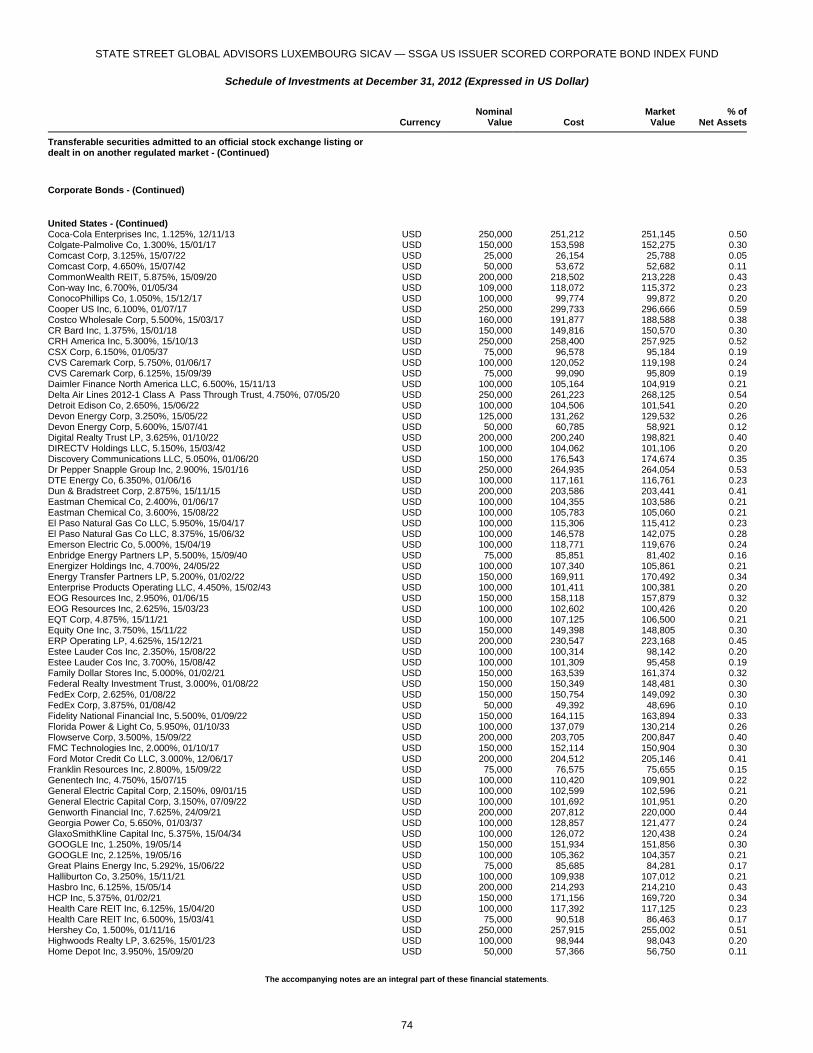
STATE STREET GLOBAL ADVISORS LUXEMBOURG SICAV — SSGA US ISSUER SCORED CORPORATE BOND INDEX FUND
Schedule of Investments at December 31, 2012 (Expressed in US Dollar)
The accompanying notes are an integral part of these financial statements.
Currency
NominalValue Cost
MarketValue
% ofNet Assets
Transferable securities admitted to an official stock exchange listing or dealt in on another regulated market - (Continued)
Corporate Bonds - (Continued)
United States - (Continued) Coca-Cola Enterprises Inc, 1.125%, 12/11/13 USD 250,000 251,212 251,145 0.50Colgate-Palmolive Co, 1.300%, 15/01/17 USD 150,000 153,598 152,275 0.30Comcast Corp, 3.125%, 15/07/22 USD 25,000 26,154 25,788 0.05Comcast Corp, 4.650%, 15/07/42 USD 50,000 53,672 52,682 0.11CommonWealth REIT, 5.875%, 15/09/20 USD 200,000 218,502 213,228 0.43Con-way Inc, 6.700%, 01/05/34 USD 109,000 118,072 115,372 0.23ConocoPhillips Co, 1.050%, 15/12/17 USD 100,000 99,774 99,872 0.20Cooper US Inc, 6.100%, 01/07/17 USD 250,000 299,733 296,666 0.59Costco Wholesale Corp, 5.500%, 15/03/17 USD 160,000 191,877 188,588 0.38CR Bard Inc, 1.375%, 15/01/18 USD 150,000 149,816 150,570 0.30CRH America Inc, 5.300%, 15/10/13 USD 250,000 258,400 257,925 0.52CSX Corp, 6.150%, 01/05/37 USD 75,000 96,578 95,184 0.19CVS Caremark Corp, 5.750%, 01/06/17 USD 100,000 120,052 119,198 0.24CVS Caremark Corp, 6.125%, 15/09/39 USD 75,000 99,090 95,809 0.19Daimler Finance North America LLC, 6.500%, 15/11/13 USD 100,000 105,164 104,919 0.21Delta Air Lines 2012-1 Class A Pass Through Trust, 4.750%, 07/05/20 USD 250,000 261,223 268,125 0.54Detroit Edison Co, 2.650%, 15/06/22 USD 100,000 104,506 101,541 0.20Devon Energy Corp, 3.250%, 15/05/22 USD 125,000 131,262 129,532 0.26Devon Energy Corp, 5.600%, 15/07/41 USD 50,000 60,785 58,921 0.12Digital Realty Trust LP, 3.625%, 01/10/22 USD 200,000 200,240 198,821 0.40DIRECTV Holdings LLC, 5.150%, 15/03/42 USD 100,000 104,062 101,106 0.20Discovery Communications LLC, 5.050%, 01/06/20 USD 150,000 176,543 174,674 0.35Dr Pepper Snapple Group Inc, 2.900%, 15/01/16 USD 250,000 264,935 264,054 0.53DTE Energy Co, 6.350%, 01/06/16 USD 100,000 117,161 116,761 0.23Dun & Bradstreet Corp, 2.875%, 15/11/15 USD 200,000 203,586 203,441 0.41Eastman Chemical Co, 2.400%, 01/06/17 USD 100,000 104,355 103,586 0.21Eastman Chemical Co, 3.600%, 15/08/22 USD 100,000 105,783 105,060 0.21El Paso Natural Gas Co LLC, 5.950%, 15/04/17 USD 100,000 115,306 115,412 0.23El Paso Natural Gas Co LLC, 8.375%, 15/06/32 USD 100,000 146,578 142,075 0.28Emerson Electric Co, 5.000%, 15/04/19 USD 100,000 118,771 119,676 0.24Enbridge Energy Partners LP, 5.500%, 15/09/40 USD 75,000 85,851 81,402 0.16Energizer Holdings Inc, 4.700%, 24/05/22 USD 100,000 107,340 105,861 0.21Energy Transfer Partners LP, 5.200%, 01/02/22 USD 150,000 169,911 170,492 0.34Enterprise Products Operating LLC, 4.450%, 15/02/43 USD 100,000 101,411 100,381 0.20EOG Resources Inc, 2.950%, 01/06/15 USD 150,000 158,118 157,879 0.32EOG Resources Inc, 2.625%, 15/03/23 USD 100,000 102,602 100,426 0.20EQT Corp, 4.875%, 15/11/21 USD 100,000 107,125 106,500 0.21Equity One Inc, 3.750%, 15/11/22 USD 150,000 149,398 148,805 0.30ERP Operating LP, 4.625%, 15/12/21 USD 200,000 230,547 223,168 0.45Estee Lauder Cos Inc, 2.350%, 15/08/22 USD 100,000 100,314 98,142 0.20Estee Lauder Cos Inc, 3.700%, 15/08/42 USD 100,000 101,309 95,458 0.19Family Dollar Stores Inc, 5.000%, 01/02/21 USD 150,000 163,539 161,374 0.32Federal Realty Investment Trust, 3.000%, 01/08/22 USD 150,000 150,349 148,481 0.30FedEx Corp, 2.625%, 01/08/22 USD 150,000 150,754 149,092 0.30FedEx Corp, 3.875%, 01/08/42 USD 50,000 49,392 48,696 0.10Fidelity National Financial Inc, 5.500%, 01/09/22 USD 150,000 164,115 163,894 0.33Florida Power & Light Co, 5.950%, 01/10/33 USD 100,000 137,079 130,214 0.26Flowserve Corp, 3.500%, 15/09/22 USD 200,000 203,705 200,847 0.40FMC Technologies Inc, 2.000%, 01/10/17 USD 150,000 152,114 150,904 0.30Ford Motor Credit Co LLC, 3.000%, 12/06/17 USD 200,000 204,512 205,146 0.41Franklin Resources Inc, 2.800%, 15/09/22 USD 75,000 76,575 75,655 0.15Genentech Inc, 4.750%, 15/07/15 USD 100,000 110,420 109,901 0.22General Electric Capital Corp, 2.150%, 09/01/15 USD 100,000 102,599 102,596 0.21General Electric Capital Corp, 3.150%, 07/09/22 USD 100,000 101,692 101,951 0.20Genworth Financial Inc, 7.625%, 24/09/21 USD 200,000 207,812 220,000 0.44Georgia Power Co, 5.650%, 01/03/37 USD 100,000 128,857 121,477 0.24GlaxoSmithKline Capital Inc, 5.375%, 15/04/34 USD 100,000 126,072 120,438 0.24GOOGLE Inc, 1.250%, 19/05/14 USD 150,000 151,934 151,856 0.30GOOGLE Inc, 2.125%, 19/05/16 USD 100,000 105,362 104,357 0.21Great Plains Energy Inc, 5.292%, 15/06/22 USD 75,000 85,685 84,281 0.17Halliburton Co, 3.250%, 15/11/21 USD 100,000 109,938 107,012 0.21Hasbro Inc, 6.125%, 15/05/14 USD 200,000 214,293 214,210 0.43HCP Inc, 5.375%, 01/02/21 USD 150,000 171,156 169,720 0.34Health Care REIT Inc, 6.125%, 15/04/20 USD 100,000 117,392 117,125 0.23Health Care REIT Inc, 6.500%, 15/03/41 USD 75,000 90,518 86,463 0.17Hershey Co, 1.500%, 01/11/16 USD 250,000 257,915 255,002 0.51Highwoods Realty LP, 3.625%, 15/01/23 USD 100,000 98,944 98,043 0.20Home Depot Inc, 3.950%, 15/09/20 USD 50,000 57,366 56,750 0.11
74

STATE STREET GLOBAL ADVISORS LUXEMBOURG SICAV — SSGA US ISSUER SCORED CORPORATE BOND INDEX FUND
Schedule of Investments at December 31, 2012 (Expressed in US Dollar)
The accompanying notes are an integral part of these financial statements.
Currency
NominalValue Cost
MarketValue
% ofNet Assets
Transferable securities admitted to an official stock exchange listing or dealt in on another regulated market - (Continued)
Corporate Bonds - (Continued)
United States - (Continued) Home Depot Inc, 5.950%, 01/04/41 USD 50,000 68,763 67,701 0.14Humana Inc, 6.300%, 01/08/18 USD 150,000 176,193 178,096 0.36Ingram Micro Inc, 5.000%, 10/08/22 USD 100,000 103,126 101,479 0.20Ingredion Inc, 1.800%, 25/09/17 USD 100,000 100,806 100,150 0.20International Business Machines Corp, 1.250%, 06/02/17 USD 100,000 102,027 101,015 0.20Jefferies Group Inc, 3.875%, 09/11/15 USD 200,000 204,563 206,500 0.41John Deere Capital Corp, 2.800%, 27/01/23 USD 100,000 104,274 101,344 0.20Kansas City Power & Light Co, 6.050%, 15/11/35 USD 90,000 113,191 107,711 0.22Kellogg Co, 1.125%, 15/05/15 USD 100,000 101,001 100,897 0.20Kellogg Co, 3.125%, 17/05/22 USD 75,000 78,961 78,276 0.16Kennametal Inc, 2.650%, 01/11/19 USD 150,000 149,805 149,386 0.30KeyCorp, 3.750%, 13/08/15 USD 50,000 53,740 53,539 0.11KeyCorp, 5.100%, 24/03/21 USD 100,000 118,195 116,423 0.23Kimberly-Clark Corp, 5.000%, 15/08/13 USD 250,000 257,294 256,415 0.51Kimco Realty Corp, 5.700%, 01/05/17 USD 250,000 288,091 286,672 0.57Kinder Morgan Energy Partners LP, 6.375%, 01/03/41 USD 50,000 63,696 62,031 0.12L-3 Communications Corp, 4.750%, 15/07/20 USD 100,000 110,640 111,893 0.22L-3 Communications Corp, 4.950%, 15/02/21 USD 100,000 111,786 113,007 0.23Life Technologies Corp, 6.000%, 01/03/20 USD 100,000 118,493 117,472 0.24Life Technologies Corp, 5.000%, 15/01/21 USD 100,000 112,690 110,893 0.22Lockheed Martin Corp, 5.500%, 15/11/39 USD 100,000 121,839 117,646 0.24Lorillard Tobacco Co, 3.500%, 04/08/16 USD 150,000 159,494 159,278 0.32Mack-Cali Realty LP, 7.750%, 15/08/19 USD 200,000 248,792 246,480 0.49Macy's Retail Holdings Inc, 3.875%, 15/01/22 USD 100,000 108,693 106,344 0.21Macy's Retail Holdings Inc, 6.375%, 15/03/37 USD 100,000 122,266 121,960 0.24Magellan Midstream Partners LP, 6.550%, 15/07/19 USD 150,000 184,003 185,956 0.37Marathon Petroleum Corp, 5.125%, 01/03/21 USD 100,000 116,082 117,287 0.23Marriott International Inc, 3.000%, 01/03/19 USD 150,000 155,554 153,555 0.31Marsh & McLennan Cos Inc, 4.800%, 15/07/21 USD 200,000 227,273 225,204 0.45Mattel Inc, 2.500%, 01/11/16 USD 125,000 130,430 130,273 0.26McDonald's Corp, 5.350%, 01/03/18 USD 150,000 182,233 180,955 0.36McGraw-Hill Cos Inc, 6.550%, 15/11/37 USD 125,000 154,138 144,982 0.29McKesson Corp, 5.700%, 01/03/17 USD 150,000 178,325 175,905 0.35Medtronic Inc, 5.600%, 15/03/19 USD 100,000 122,032 120,928 0.24Medtronic Inc, 3.125%, 15/03/22 USD 50,000 53,608 53,126 0.11Medtronic Inc, 4.500%, 15/03/42 USD 50,000 57,729 56,115 0.11Merck & Co Inc, 2.250%, 15/01/16 USD 150,000 157,440 156,994 0.31MetLife Inc, 6.750%, 01/06/16 USD 150,000 177,951 177,416 0.35Mondelez International Inc, 4.125%, 09/02/16 USD 100,000 109,472 108,933 0.22Monsanto Co, 2.200%, 15/07/22 USD 200,000 201,155 194,788 0.39Morgan Stanley, 4.750%, 22/03/17 USD 100,000 107,616 109,105 0.22Morgan Stanley, 6.375%, 24/07/42 USD 50,000 56,471 58,175 0.12Motorola Solutions Inc, 3.750%, 15/05/22 USD 100,000 104,503 102,407 0.21Nabors Industries Inc, 4.625%, 15/09/21 USD 100,000 108,563 107,234 0.21NASDAQ OMX Group Inc, 4.000%, 15/01/15 USD 150,000 156,468 156,569 0.31NASDAQ OMX Group Inc, 5.550%, 15/01/20 USD 100,000 109,269 108,171 0.22National Retail Properties Inc, 3.800%, 15/10/22 USD 200,000 206,337 203,304 0.41NBCUniversal Media LLC, 5.150%, 30/04/20 USD 150,000 178,248 175,954 0.35NBCUniversal Media LLC, 5.950%, 01/04/41 USD 50,000 61,471 60,823 0.12Nevada Power Co, 7.125%, 15/03/19 USD 50,000 65,149 64,219 0.13Nevada Power Co, 5.450%, 15/05/41 USD 50,000 63,372 61,216 0.12Newell Rubbermaid Inc, 4.700%, 15/08/20 USD 150,000 165,189 167,288 0.33Nisource Finance Corp, 5.250%, 15/02/43 USD 88,000 98,932 93,152 0.19Norfolk Southern Corp, 3.000%, 01/04/22 USD 150,000 156,759 154,215 0.31Norfolk Southern Corp, 4.837%, 01/10/41 USD 50,000 58,045 56,401 0.11Northern Trust Corp, 2.375%, 02/08/22 USD 200,000 200,252 197,089 0.39Northrop Grumman Corp, 1.850%, 15/11/15 USD 250,000 257,902 255,982 0.51Nucor Corp, 4.125%, 15/09/22 USD 100,000 112,932 110,768 0.22O'Reilly Automotive Inc, 4.625%, 15/09/21 USD 150,000 164,982 165,559 0.33Occidental Petroleum Corp, 2.700%, 15/02/23 USD 100,000 103,737 101,803 0.20Ohio Power Co, 5.750%, 01/09/13 USD 250,000 258,745 258,507 0.52ONEOK Partners LP, 2.000%, 01/10/17 USD 150,000 153,152 151,508 0.30ONEOK Partners LP, 3.375%, 01/10/22 USD 100,000 102,290 101,858 0.20Oracle Corp, 5.750%, 15/04/18 USD 125,000 153,930 152,363 0.30Oracle Corp, 5.375%, 15/07/40 USD 50,000 65,003 62,123 0.12Owens Corning, 4.200%, 15/12/22 USD 100,000 100,834 101,231 0.20PACCAR Financial Corp, 1.050%, 05/06/15 USD 150,000 151,651 150,278 0.30Pacific Gas & Electric Co, 6.050%, 01/03/34 USD 75,000 99,346 96,225 0.19
75

STATE STREET GLOBAL ADVISORS LUXEMBOURG SICAV — SSGA US ISSUER SCORED CORPORATE BOND INDEX FUND
Schedule of Investments at December 31, 2012 (Expressed in US Dollar)
The accompanying notes are an integral part of these financial statements.
Currency
NominalValue Cost
MarketValue
% ofNet Assets
Transferable securities admitted to an official stock exchange listing or dealt in on another regulated market - (Continued)
Corporate Bonds - (Continued)
United States - (Continued) Parker Hannifin Corp, 3.500%, 15/09/22 USD 200,000 216,677 217,191 0.43Philip Morris International Inc, 4.500%, 26/03/20 USD 100,000 117,465 116,418 0.23Philip Morris International Inc, 3.875%, 21/08/42 USD 75,000 76,378 74,978 0.15Pioneer Natural Resources Co, 6.875%, 01/05/18 USD 150,000 181,568 182,432 0.36Pitney Bowes Inc, 5.000%, 15/03/15 USD 200,000 212,426 209,547 0.42Plains All American Pipeline LP, 2.850%, 31/01/23 USD 100,000 99,753 98,982 0.20Plum Creek Timberlands LP, 3.250%, 15/03/23 USD 200,000 198,396 195,793 0.39PNC Funding Corp, 5.125%, 08/02/20 USD 100,000 120,763 118,434 0.24PNC Funding Corp, 3.300%, 08/03/22 USD 75,000 80,790 78,626 0.16Praxair Inc, 2.450%, 15/02/22 USD 100,000 101,597 100,422 0.20Praxair Inc, 2.200%, 15/08/22 USD 50,000 49,537 48,946 0.10Primerica Inc, 4.750%, 15/07/22 USD 200,000 220,158 218,986 0.44Procter & Gamble Co, 3.150%, 01/09/15 USD 150,000 161,132 160,093 0.32Prudential Financial Inc, 4.500%, 16/11/21 USD 100,000 111,166 112,048 0.22PSEG Power LLC, 4.150%, 15/09/21 USD 200,000 217,690 219,158 0.44Quest Diagnostics Inc, 4.750%, 30/01/20 USD 175,000 196,104 195,028 0.39Raytheon Co, 4.700%, 15/12/41 USD 50,000 58,575 55,726 0.11Reliance Steel & Aluminum Co, 6.200%, 15/11/16 USD 250,000 282,773 284,756 0.57Republic Services Inc, 4.750%, 15/05/23 USD 250,000 288,547 286,414 0.57Reynolds American Inc, 1.050%, 30/10/15 USD 50,000 49,934 49,982 0.10Reynolds American Inc, 3.250%, 01/11/22 USD 50,000 49,933 50,431 0.10Reynolds American Inc, 4.750%, 01/11/42 USD 50,000 49,552 50,585 0.10RPM International Inc, 3.450%, 15/11/22 USD 200,000 199,515 197,237 0.39Ryder System Inc, 3.600%, 01/03/16 USD 200,000 212,378 209,664 0.42Ryder System Inc, 2.500%, 01/03/18 USD 50,000 50,834 50,443 0.10Sherwin-Williams Co, 1.350%, 15/12/17 USD 250,000 249,677 250,040 0.50Simon Property Group LP, 2.800%, 30/01/17 USD 150,000 159,555 157,711 0.32Simon Property Group LP, 3.375%, 15/03/22 USD 100,000 106,183 105,362 0.21SLM Corp, 3.875%, 10/09/15 USD 125,000 129,506 128,125 0.26SLM Corp, 7.250%, 25/01/22 USD 100,000 112,127 110,000 0.22South Carolina Electric & Gas Co, 6.500%, 01/11/18 USD 100,000 126,883 124,429 0.25South Carolina Electric & Gas Co, 4.350%, 01/02/42 USD 50,000 54,741 52,556 0.11Southern California Edison Co, 4.050%, 15/03/42 USD 100,000 107,331 103,869 0.21Southwest Gas Corp, 3.875%, 01/04/22 USD 200,000 222,623 220,738 0.44Staples Inc, 9.750%, 15/01/14 USD 250,000 271,529 271,993 0.54Starbucks Corp, 6.250%, 15/08/17 USD 150,000 182,668 177,887 0.36Sunoco Logistics Partners Operations LP, 6.850%, 15/02/40 USD 100,000 122,042 120,610 0.24Symantec Corp, 4.200%, 15/09/20 USD 300,000 318,434 315,161 0.63Tech Data Corp, 3.750%, 21/09/17 USD 100,000 102,286 101,221 0.20Textron Inc, 7.250%, 01/10/19 USD 150,000 182,128 183,711 0.37Time Warner Cable Inc, 8.750%, 14/02/19 USD 150,000 204,315 201,399 0.40Time Warner Inc, 5.875%, 15/11/16 USD 200,000 235,663 234,139 0.47Torchmark Corp, 3.800%, 15/09/22 USD 100,000 103,621 102,307 0.20Toyota Motor Credit Corp, 0.875%, 17/07/15 USD 150,000 150,840 150,575 0.30Toyota Motor Credit Corp, 1.750%, 22/05/17 USD 100,000 102,739 102,188 0.20Transatlantic Holdings Inc, 5.750%, 14/12/15 USD 200,000 221,944 221,383 0.44Transcontinental Gas Pipe Line Co LLC, 5.400%, 15/08/41 USD 50,000 61,336 58,681 0.12Unilever Capital Corp, 0.450%, 30/07/15 USD 100,000 99,928 99,483 0.20Unilever Capital Corp, 4.250%, 10/02/21 USD 100,000 117,703 115,170 0.23Union Pacific Corp, 4.750%, 15/09/41 USD 50,000 57,532 55,938 0.11UnionBanCal Corp, 3.500%, 18/06/22 USD 200,000 212,756 209,075 0.42United States Cellular Corp, 6.700%, 15/12/33 USD 150,000 155,054 155,562 0.31United Technologies Corp, 1.800%, 01/06/17 USD 100,000 104,059 102,632 0.21United Technologies Corp, 5.700%, 15/04/40 USD 50,000 65,858 64,765 0.13UnitedHealth Group Inc, 6.000%, 15/06/17 USD 150,000 181,844 179,943 0.36US Bancorp, 1.375%, 13/09/13 USD 150,000 150,996 150,961 0.30Valero Energy Corp, 6.125%, 15/06/17 USD 100,000 120,648 118,831 0.24Valero Energy Corp, 6.625%, 15/06/37 USD 100,000 122,576 123,167 0.25Valspar Corp, 4.200%, 15/01/22 USD 150,000 163,305 162,049 0.32Ventas Realty LP, 4.000%, 30/04/19 USD 200,000 214,871 214,888 0.43VF Corp, 3.500%, 01/09/21 USD 75,000 82,231 80,416 0.16Viacom Inc, 6.250%, 30/04/16 USD 100,000 117,044 116,022 0.23Viacom Inc, 6.875%, 30/04/36 USD 100,000 134,382 134,498 0.27Wal-Mart Stores Inc, 4.250%, 15/04/21 USD 100,000 117,926 115,888 0.23Walgreen Co, 1.000%, 13/03/15 USD 100,000 100,491 100,320 0.20Walgreen Co, 3.100%, 15/09/22 USD 75,000 76,421 75,644 0.15Walgreen Co, 4.400%, 15/09/42 USD 50,000 52,078 50,191 0.10Walt Disney Co, 1.350%, 16/08/16 USD 100,000 102,616 101,542 0.20
76
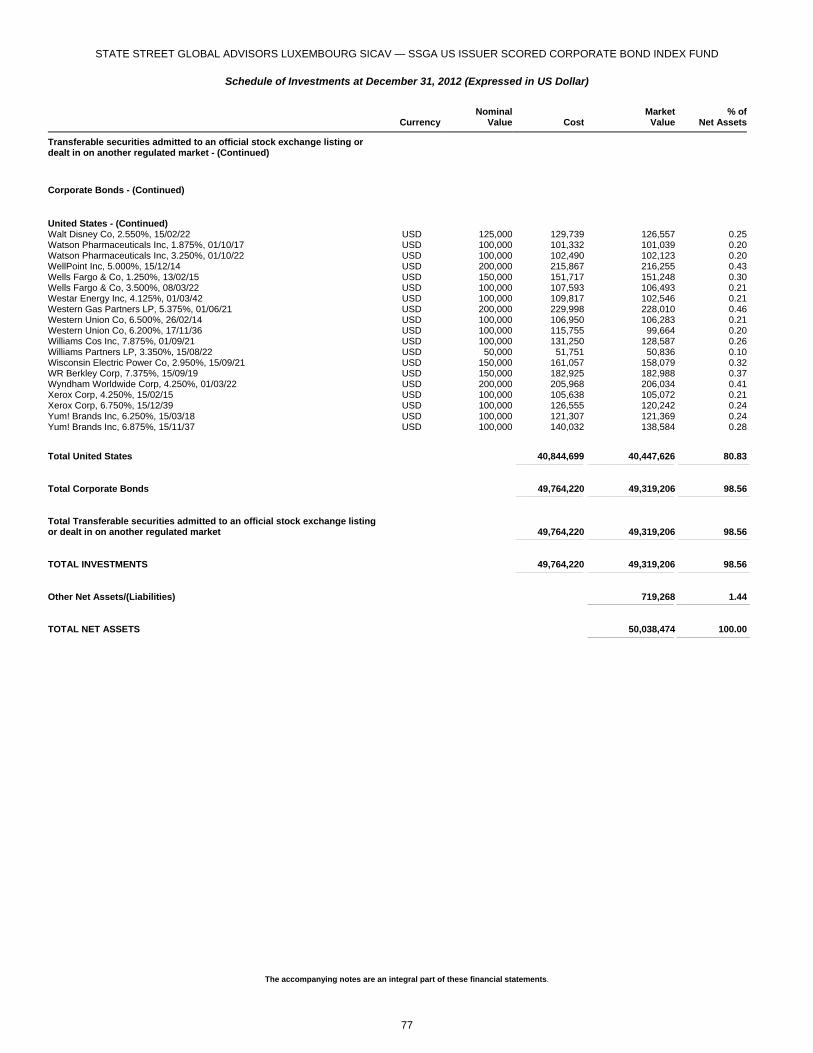
STATE STREET GLOBAL ADVISORS LUXEMBOURG SICAV — SSGA US ISSUER SCORED CORPORATE BOND INDEX FUND
Schedule of Investments at December 31, 2012 (Expressed in US Dollar)
The accompanying notes are an integral part of these financial statements.
Currency
NominalValue Cost
MarketValue
% ofNet Assets
Transferable securities admitted to an official stock exchange listing or dealt in on another regulated market - (Continued)
Corporate Bonds - (Continued)
United States - (Continued) Walt Disney Co, 2.550%, 15/02/22 USD 125,000 129,739 126,557 0.25Watson Pharmaceuticals Inc, 1.875%, 01/10/17 USD 100,000 101,332 101,039 0.20Watson Pharmaceuticals Inc, 3.250%, 01/10/22 USD 100,000 102,490 102,123 0.20WellPoint Inc, 5.000%, 15/12/14 USD 200,000 215,867 216,255 0.43Wells Fargo & Co, 1.250%, 13/02/15 USD 150,000 151,717 151,248 0.30Wells Fargo & Co, 3.500%, 08/03/22 USD 100,000 107,593 106,493 0.21Westar Energy Inc, 4.125%, 01/03/42 USD 100,000 109,817 102,546 0.21Western Gas Partners LP, 5.375%, 01/06/21 USD 200,000 229,998 228,010 0.46Western Union Co, 6.500%, 26/02/14 USD 100,000 106,950 106,283 0.21Western Union Co, 6.200%, 17/11/36 USD 100,000 115,755 99,664 0.20Williams Cos Inc, 7.875%, 01/09/21 USD 100,000 131,250 128,587 0.26Williams Partners LP, 3.350%, 15/08/22 USD 50,000 51,751 50,836 0.10Wisconsin Electric Power Co, 2.950%, 15/09/21 USD 150,000 161,057 158,079 0.32WR Berkley Corp, 7.375%, 15/09/19 USD 150,000 182,925 182,988 0.37Wyndham Worldwide Corp, 4.250%, 01/03/22 USD 200,000 205,968 206,034 0.41Xerox Corp, 4.250%, 15/02/15 USD 100,000 105,638 105,072 0.21Xerox Corp, 6.750%, 15/12/39 USD 100,000 126,555 120,242 0.24Yum! Brands Inc, 6.250%, 15/03/18 USD 100,000 121,307 121,369 0.24Yum! Brands Inc, 6.875%, 15/11/37 USD 100,000 140,032 138,584 0.28
Total United States 40,844,699 40,447,626 80.83 _______________________________________________ ____________________________________________________________ __________________________________________________
Total Corporate Bonds 49,764,220 49,319,206 98.56 _______________________________________________ ____________________________________________________________ __________________________________________________
Total Transferable securities admitted to an official stock exchange listing or dealt in on another regulated market 49,764,220 49,319,206 98.56 _______________________________________________ ____________________________________________________________ __________________________________________________
TOTAL INVESTMENTS 49,764,220 49,319,206 98.56 _______________________________________________ ____________________________________________________________ __________________________________________________
Other Net Assets/(Liabilities) 719,268 1.44 ____________________________________________________________ ___________________________________________________
TOTAL NET ASSETS 50,038,474 100.00 ____________________________________________________________ ___________________________________________________
77
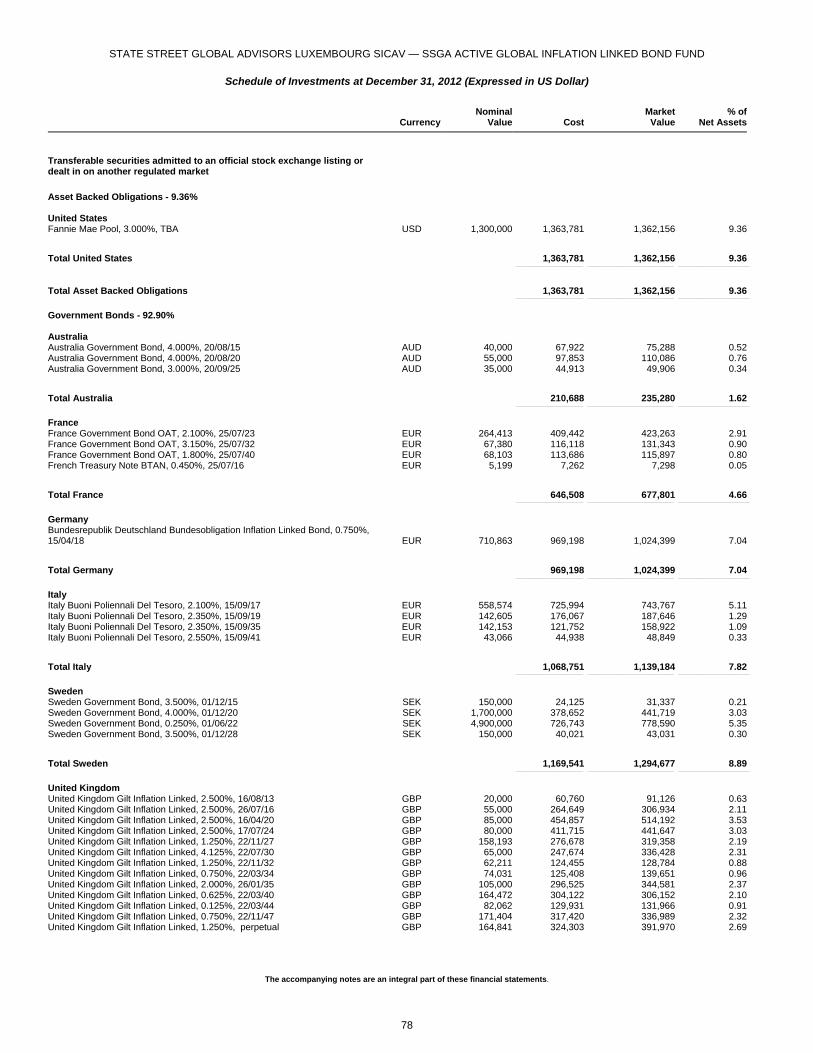
STATE STREET GLOBAL ADVISORS LUXEMBOURG SICAV — SSGA ACTIVE GLOBAL INFLATION LINKED BOND FUND
Schedule of Investments at December 31, 2012 (Expressed in US Dollar)
The accompanying notes are an integral part of these financial statements.
Currency
NominalValue Cost
MarketValue
% ofNet Assets
Transferable securities admitted to an official stock exchange listing or dealt in on another regulated market
Asset Backed Obligations - 9.36% United States Fannie Mae Pool, 3.000%, TBA USD 1,300,000 1,363,781 1,362,156 9.36
Total United States 1,363,781 1,362,156 9.36 _______________________________________________ ____________________________________________________________ __________________________________________________
Total Asset Backed Obligations 1,363,781 1,362,156 9.36 _______________________________________________ ____________________________________________________________ __________________________________________________
Government Bonds - 92.90% Australia Australia Government Bond, 4.000%, 20/08/15 AUD 40,000 67,922 75,288 0.52Australia Government Bond, 4.000%, 20/08/20 AUD 55,000 97,853 110,086 0.76Australia Government Bond, 3.000%, 20/09/25 AUD 35,000 44,913 49,906 0.34
Total Australia 210,688 235,280 1.62 _______________________________________________ ____________________________________________________________ __________________________________________________
France France Government Bond OAT, 2.100%, 25/07/23 EUR 264,413 409,442 423,263 2.91France Government Bond OAT, 3.150%, 25/07/32 EUR 67,380 116,118 131,343 0.90France Government Bond OAT, 1.800%, 25/07/40 EUR 68,103 113,686 115,897 0.80French Treasury Note BTAN, 0.450%, 25/07/16 EUR 5,199 7,262 7,298 0.05
Total France 646,508 677,801 4.66 _______________________________________________ ____________________________________________________________ __________________________________________________
Germany Bundesrepublik Deutschland Bundesobligation Inflation Linked Bond, 0.750%, 15/04/18 EUR 710,863 969,198 1,024,399 7.04
Total Germany 969,198 1,024,399 7.04 _______________________________________________ ____________________________________________________________ __________________________________________________
Italy Italy Buoni Poliennali Del Tesoro, 2.100%, 15/09/17 EUR 558,574 725,994 743,767 5.11Italy Buoni Poliennali Del Tesoro, 2.350%, 15/09/19 EUR 142,605 176,067 187,646 1.29Italy Buoni Poliennali Del Tesoro, 2.350%, 15/09/35 EUR 142,153 121,752 158,922 1.09Italy Buoni Poliennali Del Tesoro, 2.550%, 15/09/41 EUR 43,066 44,938 48,849 0.33
Total Italy 1,068,751 1,139,184 7.82 _______________________________________________ ____________________________________________________________ __________________________________________________
Sweden Sweden Government Bond, 3.500%, 01/12/15 SEK 150,000 24,125 31,337 0.21Sweden Government Bond, 4.000%, 01/12/20 SEK 1,700,000 378,652 441,719 3.03Sweden Government Bond, 0.250%, 01/06/22 SEK 4,900,000 726,743 778,590 5.35Sweden Government Bond, 3.500%, 01/12/28 SEK 150,000 40,021 43,031 0.30
Total Sweden 1,169,541 1,294,677 8.89 _______________________________________________ ____________________________________________________________ __________________________________________________
United Kingdom United Kingdom Gilt Inflation Linked, 2.500%, 16/08/13 GBP 20,000 60,760 91,126 0.63United Kingdom Gilt Inflation Linked, 2.500%, 26/07/16 GBP 55,000 264,649 306,934 2.11United Kingdom Gilt Inflation Linked, 2.500%, 16/04/20 GBP 85,000 454,857 514,192 3.53United Kingdom Gilt Inflation Linked, 2.500%, 17/07/24 GBP 80,000 411,715 441,647 3.03United Kingdom Gilt Inflation Linked, 1.250%, 22/11/27 GBP 158,193 276,678 319,358 2.19United Kingdom Gilt Inflation Linked, 4.125%, 22/07/30 GBP 65,000 247,674 336,428 2.31United Kingdom Gilt Inflation Linked, 1.250%, 22/11/32 GBP 62,211 124,455 128,784 0.88United Kingdom Gilt Inflation Linked, 0.750%, 22/03/34 GBP 74,031 125,408 139,651 0.96United Kingdom Gilt Inflation Linked, 2.000%, 26/01/35 GBP 105,000 296,525 344,581 2.37United Kingdom Gilt Inflation Linked, 0.625%, 22/03/40 GBP 164,472 304,122 306,152 2.10United Kingdom Gilt Inflation Linked, 0.125%, 22/03/44 GBP 82,062 129,931 131,966 0.91United Kingdom Gilt Inflation Linked, 0.750%, 22/11/47 GBP 171,404 317,420 336,989 2.32United Kingdom Gilt Inflation Linked, 1.250%, perpetual GBP 164,841 324,303 391,970 2.69
78
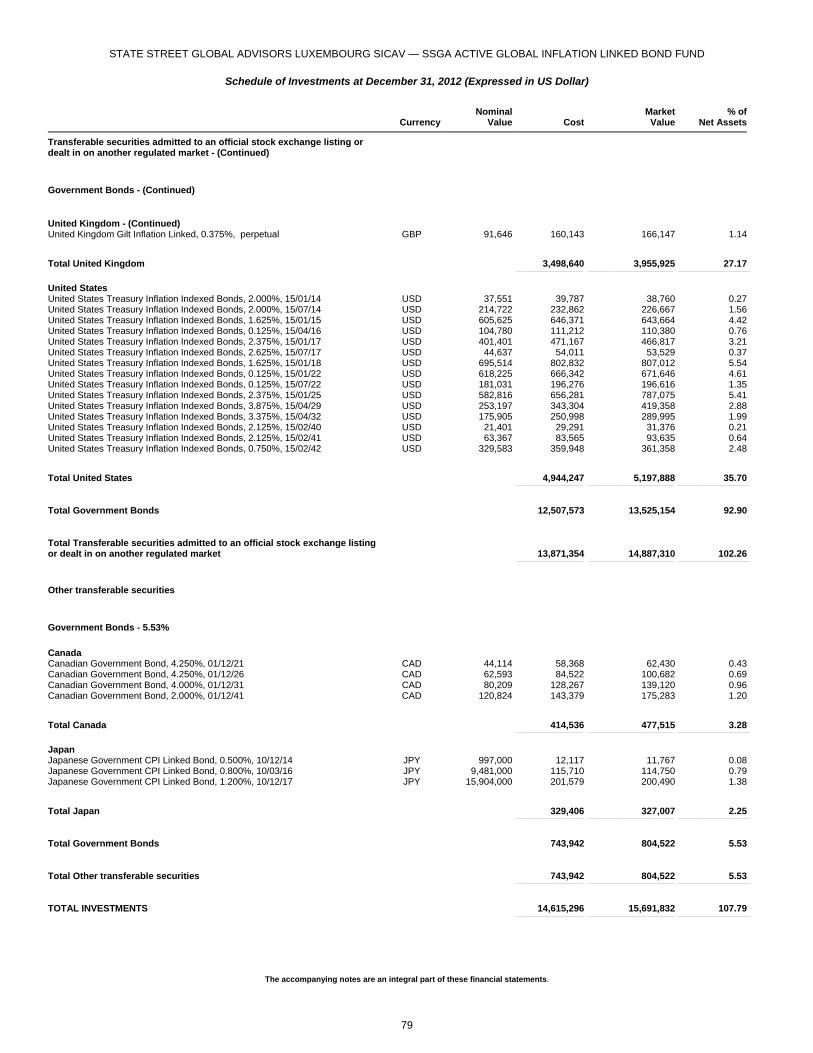
STATE STREET GLOBAL ADVISORS LUXEMBOURG SICAV — SSGA ACTIVE GLOBAL INFLATION LINKED BOND FUND
Schedule of Investments at December 31, 2012 (Expressed in US Dollar)
The accompanying notes are an integral part of these financial statements.
Currency
NominalValue Cost
MarketValue
% ofNet Assets
Transferable securities admitted to an official stock exchange listing or dealt in on another regulated market - (Continued)
Government Bonds - (Continued)
United Kingdom - (Continued) United Kingdom Gilt Inflation Linked, 0.375%, perpetual GBP 91,646 160,143 166,147 1.14
Total United Kingdom 3,498,640 3,955,925 27.17 _______________________________________________ ____________________________________________________________ __________________________________________________
United States United States Treasury Inflation Indexed Bonds, 2.000%, 15/01/14 USD 37,551 39,787 38,760 0.27United States Treasury Inflation Indexed Bonds, 2.000%, 15/07/14 USD 214,722 232,862 226,667 1.56United States Treasury Inflation Indexed Bonds, 1.625%, 15/01/15 USD 605,625 646,371 643,664 4.42United States Treasury Inflation Indexed Bonds, 0.125%, 15/04/16 USD 104,780 111,212 110,380 0.76United States Treasury Inflation Indexed Bonds, 2.375%, 15/01/17 USD 401,401 471,167 466,817 3.21United States Treasury Inflation Indexed Bonds, 2.625%, 15/07/17 USD 44,637 54,011 53,529 0.37United States Treasury Inflation Indexed Bonds, 1.625%, 15/01/18 USD 695,514 802,832 807,012 5.54United States Treasury Inflation Indexed Bonds, 0.125%, 15/01/22 USD 618,225 666,342 671,646 4.61United States Treasury Inflation Indexed Bonds, 0.125%, 15/07/22 USD 181,031 196,276 196,616 1.35United States Treasury Inflation Indexed Bonds, 2.375%, 15/01/25 USD 582,816 656,281 787,075 5.41United States Treasury Inflation Indexed Bonds, 3.875%, 15/04/29 USD 253,197 343,304 419,358 2.88United States Treasury Inflation Indexed Bonds, 3.375%, 15/04/32 USD 175,905 250,998 289,995 1.99United States Treasury Inflation Indexed Bonds, 2.125%, 15/02/40 USD 21,401 29,291 31,376 0.21United States Treasury Inflation Indexed Bonds, 2.125%, 15/02/41 USD 63,367 83,565 93,635 0.64United States Treasury Inflation Indexed Bonds, 0.750%, 15/02/42 USD 329,583 359,948 361,358 2.48
Total United States 4,944,247 5,197,888 35.70 _______________________________________________ ____________________________________________________________ __________________________________________________
Total Government Bonds 12,507,573 13,525,154 92.90 _______________________________________________ ____________________________________________________________ __________________________________________________
Total Transferable securities admitted to an official stock exchange listing or dealt in on another regulated market 13,871,354 14,887,310 102.26 _______________________________________________ ____________________________________________________________ __________________________________________________
Other transferable securities
Government Bonds - 5.53%
Canada Canadian Government Bond, 4.250%, 01/12/21 CAD 44,114 58,368 62,430 0.43Canadian Government Bond, 4.250%, 01/12/26 CAD 62,593 84,522 100,682 0.69Canadian Government Bond, 4.000%, 01/12/31 CAD 80,209 128,267 139,120 0.96Canadian Government Bond, 2.000%, 01/12/41 CAD 120,824 143,379 175,283 1.20
Total Canada 414,536 477,515 3.28 _______________________________________________ ____________________________________________________________ __________________________________________________
Japan Japanese Government CPI Linked Bond, 0.500%, 10/12/14 JPY 997,000 12,117 11,767 0.08Japanese Government CPI Linked Bond, 0.800%, 10/03/16 JPY 9,481,000 115,710 114,750 0.79Japanese Government CPI Linked Bond, 1.200%, 10/12/17 JPY 15,904,000 201,579 200,490 1.38
Total Japan 329,406 327,007 2.25 _______________________________________________ ____________________________________________________________ __________________________________________________
Total Government Bonds 743,942 804,522 5.53 _______________________________________________ ____________________________________________________________ __________________________________________________
Total Other transferable securities 743,942 804,522 5.53 _______________________________________________ ____________________________________________________________ __________________________________________________
TOTAL INVESTMENTS 14,615,296 15,691,832 107.79 _______________________________________________ ____________________________________________________________ __________________________________________________
79
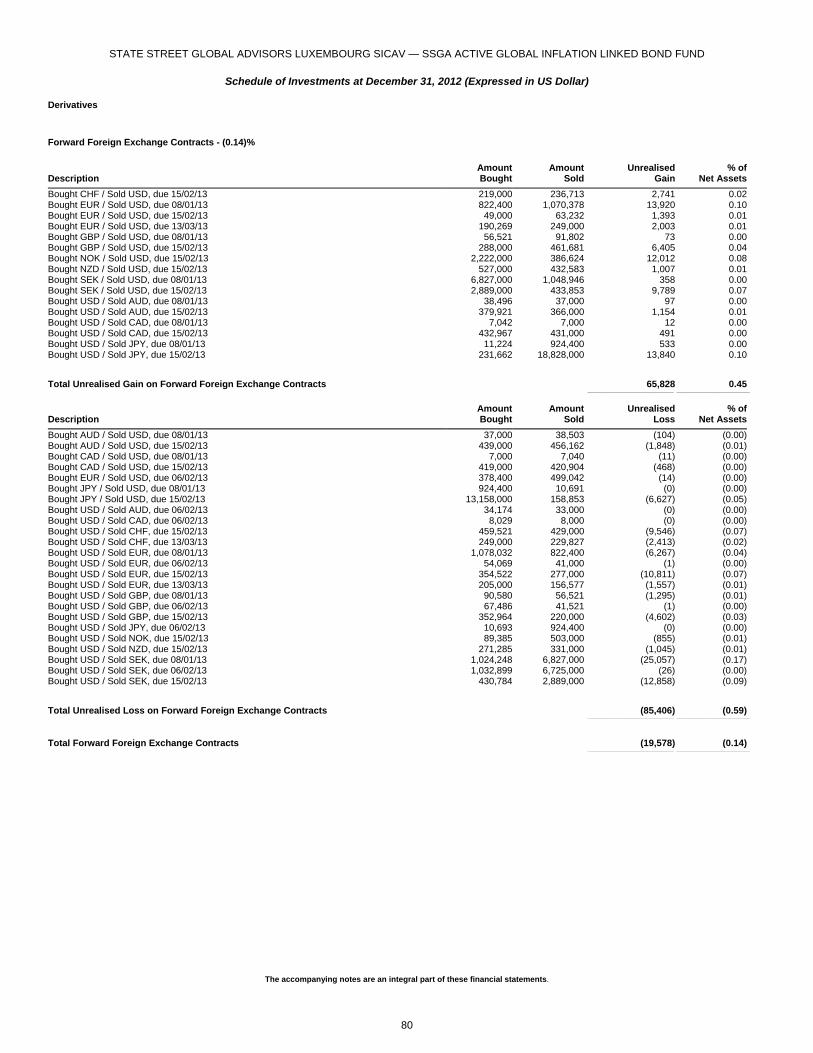
STATE STREET GLOBAL ADVISORS LUXEMBOURG SICAV — SSGA ACTIVE GLOBAL INFLATION LINKED BOND FUND
Schedule of Investments at December 31, 2012 (Expressed in US Dollar)
The accompanying notes are an integral part of these financial statements.
Derivatives
Forward Foreign Exchange Contracts - (0.14)%
Description
AmountBought
AmountSold
UnrealisedGain
% ofNet Assets
Bought CHF / Sold USD, due 15/02/13 219,000 236,713 2,741 0.02Bought EUR / Sold USD, due 08/01/13 822,400 1,070,378 13,920 0.10Bought EUR / Sold USD, due 15/02/13 49,000 63,232 1,393 0.01Bought EUR / Sold USD, due 13/03/13 190,269 249,000 2,003 0.01Bought GBP / Sold USD, due 08/01/13 56,521 91,802 73 0.00Bought GBP / Sold USD, due 15/02/13 288,000 461,681 6,405 0.04Bought NOK / Sold USD, due 15/02/13 2,222,000 386,624 12,012 0.08Bought NZD / Sold USD, due 15/02/13 527,000 432,583 1,007 0.01Bought SEK / Sold USD, due 08/01/13 6,827,000 1,048,946 358 0.00Bought SEK / Sold USD, due 15/02/13 2,889,000 433,853 9,789 0.07Bought USD / Sold AUD, due 08/01/13 38,496 37,000 97 0.00Bought USD / Sold AUD, due 15/02/13 379,921 366,000 1,154 0.01Bought USD / Sold CAD, due 08/01/13 7,042 7,000 12 0.00Bought USD / Sold CAD, due 15/02/13 432,967 431,000 491 0.00Bought USD / Sold JPY, due 08/01/13 11,224 924,400 533 0.00Bought USD / Sold JPY, due 15/02/13 231,662 18,828,000 13,840 0.10
Total Unrealised Gain on Forward Foreign Exchange Contracts 65,828 0.45 ____________________________________________________________ ___________________________________________________
Description
AmountBought
AmountSold
UnrealisedLoss
% ofNet Assets
Bought AUD / Sold USD, due 08/01/13 37,000 38,503 (104) (0.00)Bought AUD / Sold USD, due 15/02/13 439,000 456,162 (1,848) (0.01)Bought CAD / Sold USD, due 08/01/13 7,000 7,040 (11) (0.00)Bought CAD / Sold USD, due 15/02/13 419,000 420,904 (468) (0.00)Bought EUR / Sold USD, due 06/02/13 378,400 499,042 (14) (0.00)Bought JPY / Sold USD, due 08/01/13 924,400 10,691 (0) (0.00)Bought JPY / Sold USD, due 15/02/13 13,158,000 158,853 (6,627) (0.05)Bought USD / Sold AUD, due 06/02/13 34,174 33,000 (0) (0.00)Bought USD / Sold CAD, due 06/02/13 8,029 8,000 (0) (0.00)Bought USD / Sold CHF, due 15/02/13 459,521 429,000 (9,546) (0.07)Bought USD / Sold CHF, due 13/03/13 249,000 229,827 (2,413) (0.02)Bought USD / Sold EUR, due 08/01/13 1,078,032 822,400 (6,267) (0.04)Bought USD / Sold EUR, due 06/02/13 54,069 41,000 (1) (0.00)Bought USD / Sold EUR, due 15/02/13 354,522 277,000 (10,811) (0.07)Bought USD / Sold EUR, due 13/03/13 205,000 156,577 (1,557) (0.01)Bought USD / Sold GBP, due 08/01/13 90,580 56,521 (1,295) (0.01)Bought USD / Sold GBP, due 06/02/13 67,486 41,521 (1) (0.00)Bought USD / Sold GBP, due 15/02/13 352,964 220,000 (4,602) (0.03)Bought USD / Sold JPY, due 06/02/13 10,693 924,400 (0) (0.00)Bought USD / Sold NOK, due 15/02/13 89,385 503,000 (855) (0.01)Bought USD / Sold NZD, due 15/02/13 271,285 331,000 (1,045) (0.01)Bought USD / Sold SEK, due 08/01/13 1,024,248 6,827,000 (25,057) (0.17)Bought USD / Sold SEK, due 06/02/13 1,032,899 6,725,000 (26) (0.00)Bought USD / Sold SEK, due 15/02/13 430,784 2,889,000 (12,858) (0.09)
Total Unrealised Loss on Forward Foreign Exchange Contracts (85,406) (0.59) ____________________________________________________________ ___________________________________________________
Total Forward Foreign Exchange Contracts (19,578) (0.14) ____________________________________________________________ ___________________________________________________
80
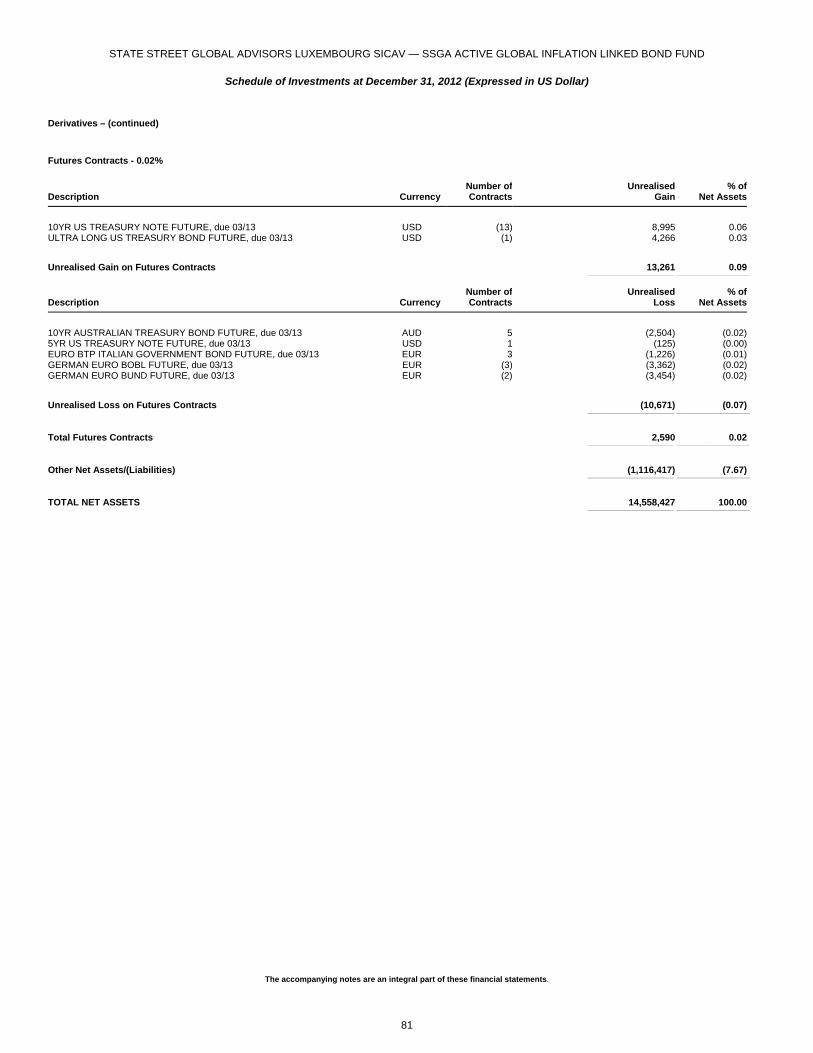
STATE STREET GLOBAL ADVISORS LUXEMBOURG SICAV — SSGA ACTIVE GLOBAL INFLATION LINKED BOND FUND
Schedule of Investments at December 31, 2012 (Expressed in US Dollar)
The accompanying notes are an integral part of these financial statements.
Derivatives – (continued)
Futures Contracts - 0.02%
Description Currency
Number ofContracts
UnrealisedGain
% ofNet Assets
10YR US TREASURY NOTE FUTURE, due 03/13 USD (13) 8,995 0.06ULTRA LONG US TREASURY BOND FUTURE, due 03/13 USD (1) 4,266 0.03
Unrealised Gain on Futures Contracts 13,261 0.09 ____________________________________________________________ ___________________________________________________
Description Currency
Number ofContracts
UnrealisedLoss
% ofNet Assets
10YR AUSTRALIAN TREASURY BOND FUTURE, due 03/13 AUD 5 (2,504) (0.02)5YR US TREASURY NOTE FUTURE, due 03/13 USD 1 (125) (0.00)EURO BTP ITALIAN GOVERNMENT BOND FUTURE, due 03/13 EUR 3 (1,226) (0.01)GERMAN EURO BOBL FUTURE, due 03/13 EUR (3) (3,362) (0.02)GERMAN EURO BUND FUTURE, due 03/13 EUR (2) (3,454) (0.02)
Unrealised Loss on Futures Contracts (10,671) (0.07) ____________________________________________________________ ___________________________________________________
Total Futures Contracts 2,590 0.02 ____________________________________________________________ ___________________________________________________
Other Net Assets/(Liabilities) (1,116,417) (7.67) ____________________________________________________________ ___________________________________________________
TOTAL NET ASSETS 14,558,427 100.00 ____________________________________________________________ ___________________________________________________
81
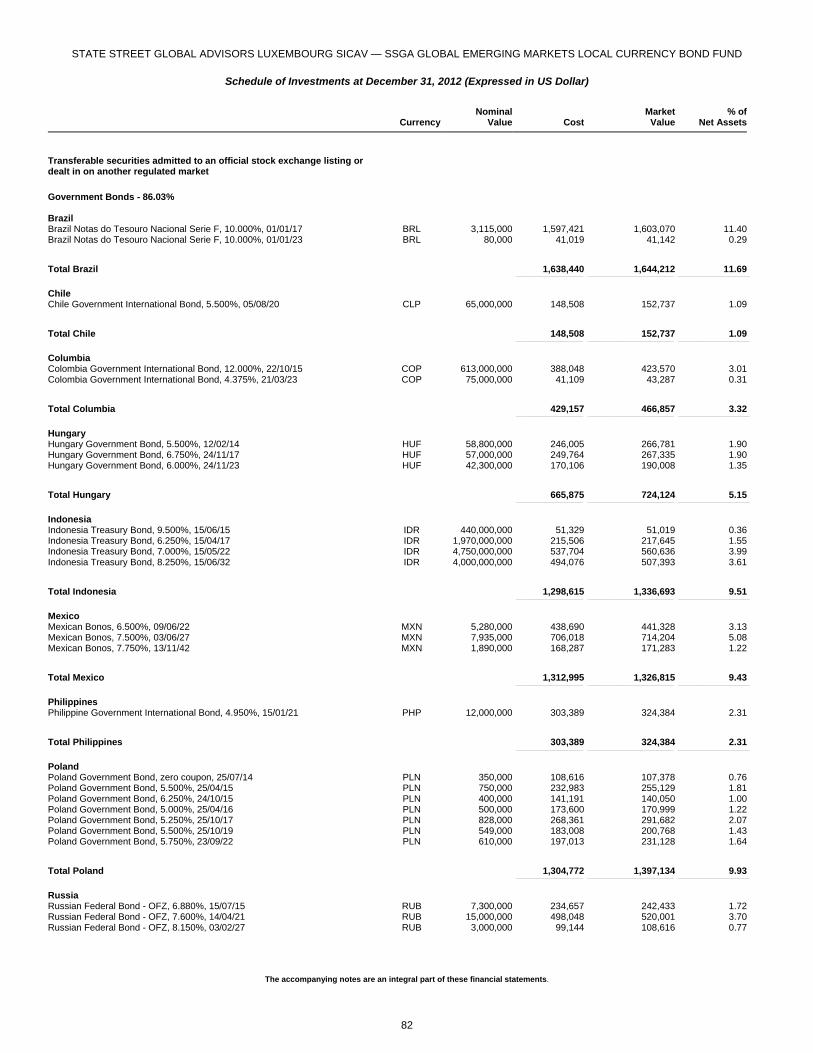
STATE STREET GLOBAL ADVISORS LUXEMBOURG SICAV — SSGA GLOBAL EMERGING MARKETS LOCAL CURRENCY BOND FUND
Schedule of Investments at December 31, 2012 (Expressed in US Dollar)
The accompanying notes are an integral part of these financial statements.
Currency
NominalValue Cost
MarketValue
% ofNet Assets
Transferable securities admitted to an official stock exchange listing or dealt in on another regulated market
Government Bonds - 86.03% Brazil Brazil Notas do Tesouro Nacional Serie F, 10.000%, 01/01/17 BRL 3,115,000 1,597,421 1,603,070 11.40Brazil Notas do Tesouro Nacional Serie F, 10.000%, 01/01/23 BRL 80,000 41,019 41,142 0.29
Total Brazil 1,638,440 1,644,212 11.69 _______________________________________________ ____________________________________________________________ __________________________________________________
Chile Chile Government International Bond, 5.500%, 05/08/20 CLP 65,000,000 148,508 152,737 1.09
Total Chile 148,508 152,737 1.09 _______________________________________________ ____________________________________________________________ __________________________________________________
Columbia Colombia Government International Bond, 12.000%, 22/10/15 COP 613,000,000 388,048 423,570 3.01Colombia Government International Bond, 4.375%, 21/03/23 COP 75,000,000 41,109 43,287 0.31
Total Columbia 429,157 466,857 3.32 _______________________________________________ ____________________________________________________________ __________________________________________________
Hungary Hungary Government Bond, 5.500%, 12/02/14 HUF 58,800,000 246,005 266,781 1.90Hungary Government Bond, 6.750%, 24/11/17 HUF 57,000,000 249,764 267,335 1.90Hungary Government Bond, 6.000%, 24/11/23 HUF 42,300,000 170,106 190,008 1.35
Total Hungary 665,875 724,124 5.15 _______________________________________________ ____________________________________________________________ __________________________________________________
Indonesia Indonesia Treasury Bond, 9.500%, 15/06/15 IDR 440,000,000 51,329 51,019 0.36Indonesia Treasury Bond, 6.250%, 15/04/17 IDR 1,970,000,000 215,506 217,645 1.55Indonesia Treasury Bond, 7.000%, 15/05/22 IDR 4,750,000,000 537,704 560,636 3.99Indonesia Treasury Bond, 8.250%, 15/06/32 IDR 4,000,000,000 494,076 507,393 3.61
Total Indonesia 1,298,615 1,336,693 9.51 _______________________________________________ ____________________________________________________________ __________________________________________________
Mexico Mexican Bonos, 6.500%, 09/06/22 MXN 5,280,000 438,690 441,328 3.13Mexican Bonos, 7.500%, 03/06/27 MXN 7,935,000 706,018 714,204 5.08Mexican Bonos, 7.750%, 13/11/42 MXN 1,890,000 168,287 171,283 1.22
Total Mexico 1,312,995 1,326,815 9.43 _______________________________________________ ____________________________________________________________ __________________________________________________
Philippines Philippine Government International Bond, 4.950%, 15/01/21 PHP 12,000,000 303,389 324,384 2.31
Total Philippines 303,389 324,384 2.31 _______________________________________________ ____________________________________________________________ __________________________________________________
Poland Poland Government Bond, zero coupon, 25/07/14 PLN 350,000 108,616 107,378 0.76Poland Government Bond, 5.500%, 25/04/15 PLN 750,000 232,983 255,129 1.81Poland Government Bond, 6.250%, 24/10/15 PLN 400,000 141,191 140,050 1.00Poland Government Bond, 5.000%, 25/04/16 PLN 500,000 173,600 170,999 1.22Poland Government Bond, 5.250%, 25/10/17 PLN 828,000 268,361 291,682 2.07Poland Government Bond, 5.500%, 25/10/19 PLN 549,000 183,008 200,768 1.43Poland Government Bond, 5.750%, 23/09/22 PLN 610,000 197,013 231,128 1.64
Total Poland 1,304,772 1,397,134 9.93 _______________________________________________ ____________________________________________________________ __________________________________________________
Russia Russian Federal Bond - OFZ, 6.880%, 15/07/15 RUB 7,300,000 234,657 242,433 1.72Russian Federal Bond - OFZ, 7.600%, 14/04/21 RUB 15,000,000 498,048 520,001 3.70Russian Federal Bond - OFZ, 8.150%, 03/02/27 RUB 3,000,000 99,144 108,616 0.77
82
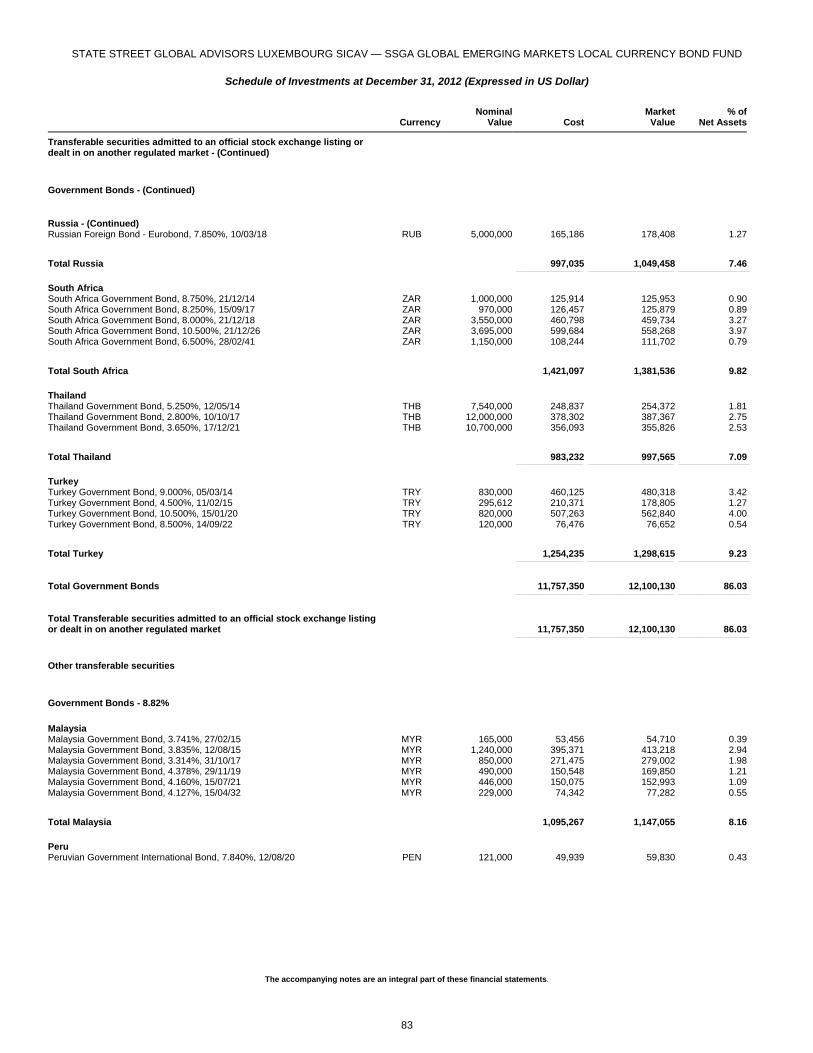
STATE STREET GLOBAL ADVISORS LUXEMBOURG SICAV — SSGA GLOBAL EMERGING MARKETS LOCAL CURRENCY BOND FUND
Schedule of Investments at December 31, 2012 (Expressed in US Dollar)
The accompanying notes are an integral part of these financial statements.
Currency
NominalValue Cost
MarketValue
% ofNet Assets
Transferable securities admitted to an official stock exchange listing or dealt in on another regulated market - (Continued)
Government Bonds - (Continued)
Russia - (Continued) Russian Foreign Bond - Eurobond, 7.850%, 10/03/18 RUB 5,000,000 165,186 178,408 1.27
Total Russia 997,035 1,049,458 7.46 _______________________________________________ ____________________________________________________________ __________________________________________________
South Africa South Africa Government Bond, 8.750%, 21/12/14 ZAR 1,000,000 125,914 125,953 0.90South Africa Government Bond, 8.250%, 15/09/17 ZAR 970,000 126,457 125,879 0.89South Africa Government Bond, 8.000%, 21/12/18 ZAR 3,550,000 460,798 459,734 3.27South Africa Government Bond, 10.500%, 21/12/26 ZAR 3,695,000 599,684 558,268 3.97South Africa Government Bond, 6.500%, 28/02/41 ZAR 1,150,000 108,244 111,702 0.79
Total South Africa 1,421,097 1,381,536 9.82 _______________________________________________ ____________________________________________________________ __________________________________________________
Thailand Thailand Government Bond, 5.250%, 12/05/14 THB 7,540,000 248,837 254,372 1.81Thailand Government Bond, 2.800%, 10/10/17 THB 12,000,000 378,302 387,367 2.75Thailand Government Bond, 3.650%, 17/12/21 THB 10,700,000 356,093 355,826 2.53
Total Thailand 983,232 997,565 7.09 _______________________________________________ ____________________________________________________________ __________________________________________________
Turkey Turkey Government Bond, 9.000%, 05/03/14 TRY 830,000 460,125 480,318 3.42Turkey Government Bond, 4.500%, 11/02/15 TRY 295,612 210,371 178,805 1.27Turkey Government Bond, 10.500%, 15/01/20 TRY 820,000 507,263 562,840 4.00Turkey Government Bond, 8.500%, 14/09/22 TRY 120,000 76,476 76,652 0.54
Total Turkey 1,254,235 1,298,615 9.23 _______________________________________________ ____________________________________________________________ __________________________________________________
Total Government Bonds 11,757,350 12,100,130 86.03 _______________________________________________ ____________________________________________________________ __________________________________________________
Total Transferable securities admitted to an official stock exchange listing or dealt in on another regulated market 11,757,350 12,100,130 86.03 _______________________________________________ ____________________________________________________________ __________________________________________________
Other transferable securities
Government Bonds - 8.82%
Malaysia Malaysia Government Bond, 3.741%, 27/02/15 MYR 165,000 53,456 54,710 0.39Malaysia Government Bond, 3.835%, 12/08/15 MYR 1,240,000 395,371 413,218 2.94Malaysia Government Bond, 3.314%, 31/10/17 MYR 850,000 271,475 279,002 1.98Malaysia Government Bond, 4.378%, 29/11/19 MYR 490,000 150,548 169,850 1.21Malaysia Government Bond, 4.160%, 15/07/21 MYR 446,000 150,075 152,993 1.09Malaysia Government Bond, 4.127%, 15/04/32 MYR 229,000 74,342 77,282 0.55
Total Malaysia 1,095,267 1,147,055 8.16 _______________________________________________ ____________________________________________________________ __________________________________________________
Peru Peruvian Government International Bond, 7.840%, 12/08/20 PEN 121,000 49,939 59,830 0.43
83
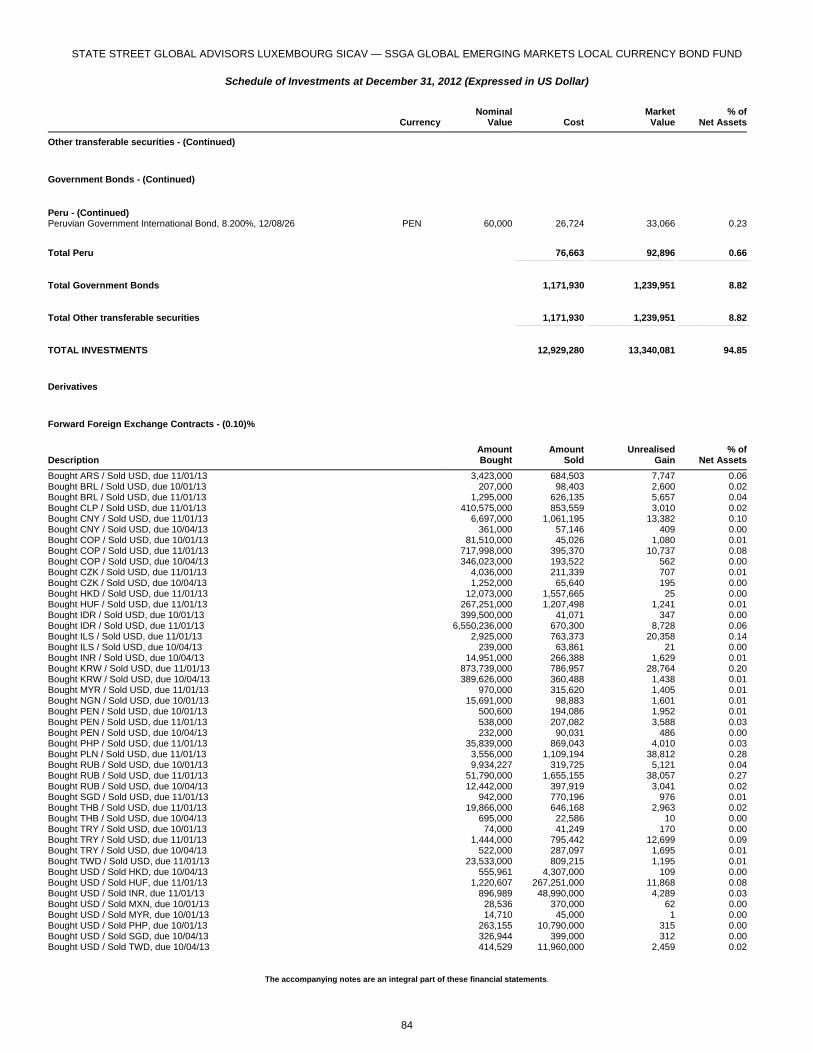
STATE STREET GLOBAL ADVISORS LUXEMBOURG SICAV — SSGA GLOBAL EMERGING MARKETS LOCAL CURRENCY BOND FUND
Schedule of Investments at December 31, 2012 (Expressed in US Dollar)
The accompanying notes are an integral part of these financial statements.
Currency
NominalValue Cost
MarketValue
% ofNet Assets
Other transferable securities - (Continued)
Government Bonds - (Continued)
Peru - (Continued) Peruvian Government International Bond, 8.200%, 12/08/26 PEN 60,000 26,724 33,066 0.23
Total Peru 76,663 92,896 0.66 _______________________________________________ ____________________________________________________________ __________________________________________________
Total Government Bonds 1,171,930 1,239,951 8.82 _______________________________________________ ____________________________________________________________ __________________________________________________
Total Other transferable securities 1,171,930 1,239,951 8.82 _______________________________________________ ____________________________________________________________ __________________________________________________
TOTAL INVESTMENTS 12,929,280 13,340,081 94.85 _______________________________________________ ____________________________________________________________ __________________________________________________
Derivatives
Forward Foreign Exchange Contracts - (0.10)%
Description
AmountBought
AmountSold
UnrealisedGain
% ofNet Assets
Bought ARS / Sold USD, due 11/01/13 3,423,000 684,503 7,747 0.06Bought BRL / Sold USD, due 10/01/13 207,000 98,403 2,600 0.02Bought BRL / Sold USD, due 11/01/13 1,295,000 626,135 5,657 0.04Bought CLP / Sold USD, due 11/01/13 410,575,000 853,559 3,010 0.02Bought CNY / Sold USD, due 11/01/13 6,697,000 1,061,195 13,382 0.10Bought CNY / Sold USD, due 10/04/13 361,000 57,146 409 0.00Bought COP / Sold USD, due 10/01/13 81,510,000 45,026 1,080 0.01Bought COP / Sold USD, due 11/01/13 717,998,000 395,370 10,737 0.08Bought COP / Sold USD, due 10/04/13 346,023,000 193,522 562 0.00Bought CZK / Sold USD, due 11/01/13 4,036,000 211,339 707 0.01Bought CZK / Sold USD, due 10/04/13 1,252,000 65,640 195 0.00Bought HKD / Sold USD, due 11/01/13 12,073,000 1,557,665 25 0.00Bought HUF / Sold USD, due 11/01/13 267,251,000 1,207,498 1,241 0.01Bought IDR / Sold USD, due 10/01/13 399,500,000 41,071 347 0.00Bought IDR / Sold USD, due 11/01/13 6,550,236,000 670,300 8,728 0.06Bought ILS / Sold USD, due 11/01/13 2,925,000 763,373 20,358 0.14Bought ILS / Sold USD, due 10/04/13 239,000 63,861 21 0.00Bought INR / Sold USD, due 10/04/13 14,951,000 266,388 1,629 0.01Bought KRW / Sold USD, due 11/01/13 873,739,000 786,957 28,764 0.20Bought KRW / Sold USD, due 10/04/13 389,626,000 360,488 1,438 0.01Bought MYR / Sold USD, due 11/01/13 970,000 315,620 1,405 0.01Bought NGN / Sold USD, due 10/01/13 15,691,000 98,883 1,601 0.01Bought PEN / Sold USD, due 10/01/13 500,600 194,086 1,952 0.01Bought PEN / Sold USD, due 11/01/13 538,000 207,082 3,588 0.03Bought PEN / Sold USD, due 10/04/13 232,000 90,031 486 0.00Bought PHP / Sold USD, due 11/01/13 35,839,000 869,043 4,010 0.03Bought PLN / Sold USD, due 11/01/13 3,556,000 1,109,194 38,812 0.28Bought RUB / Sold USD, due 10/01/13 9,934,227 319,725 5,121 0.04Bought RUB / Sold USD, due 11/01/13 51,790,000 1,655,155 38,057 0.27Bought RUB / Sold USD, due 10/04/13 12,442,000 397,919 3,041 0.02Bought SGD / Sold USD, due 11/01/13 942,000 770,196 976 0.01Bought THB / Sold USD, due 11/01/13 19,866,000 646,168 2,963 0.02Bought THB / Sold USD, due 10/04/13 695,000 22,586 10 0.00Bought TRY / Sold USD, due 10/01/13 74,000 41,249 170 0.00Bought TRY / Sold USD, due 11/01/13 1,444,000 795,442 12,699 0.09Bought TRY / Sold USD, due 10/04/13 522,000 287,097 1,695 0.01Bought TWD / Sold USD, due 11/01/13 23,533,000 809,215 1,195 0.01Bought USD / Sold HKD, due 10/04/13 555,961 4,307,000 109 0.00Bought USD / Sold HUF, due 11/01/13 1,220,607 267,251,000 11,868 0.08Bought USD / Sold INR, due 11/01/13 896,989 48,990,000 4,289 0.03Bought USD / Sold MXN, due 10/01/13 28,536 370,000 62 0.00Bought USD / Sold MYR, due 10/01/13 14,710 45,000 1 0.00Bought USD / Sold PHP, due 10/01/13 263,155 10,790,000 315 0.00Bought USD / Sold SGD, due 10/04/13 326,944 399,000 312 0.00Bought USD / Sold TWD, due 10/04/13 414,529 11,960,000 2,459 0.02
84
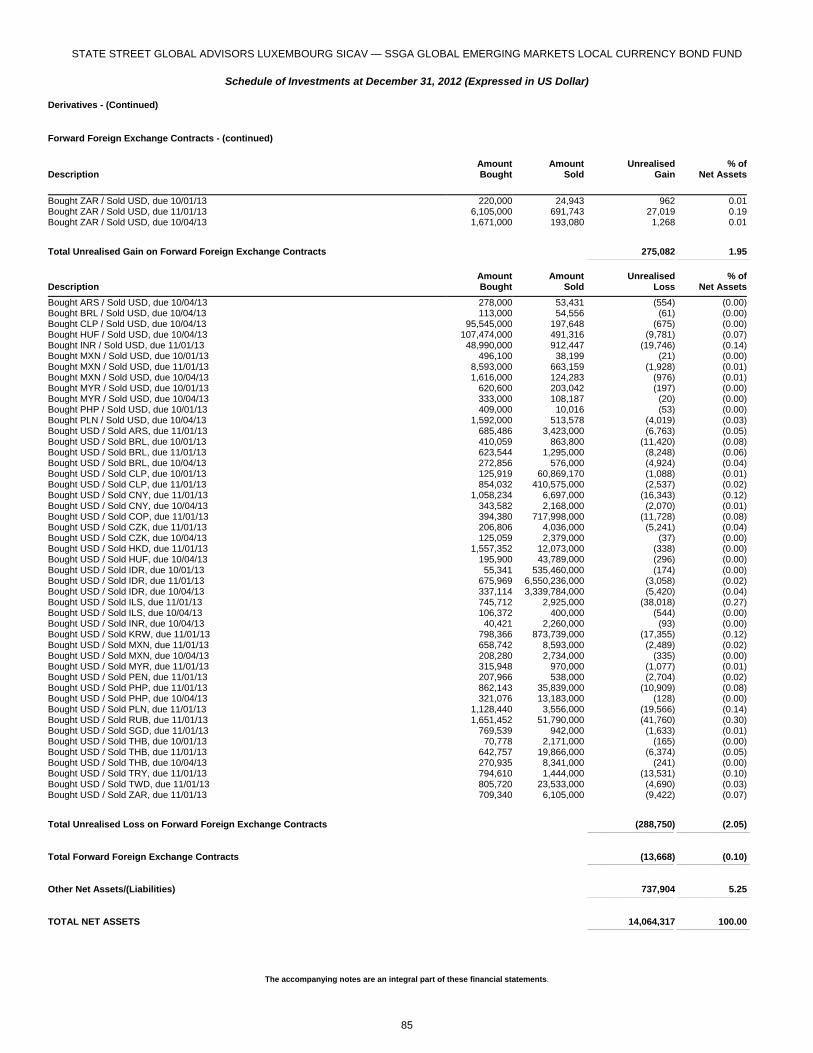
STATE STREET GLOBAL ADVISORS LUXEMBOURG SICAV — SSGA GLOBAL EMERGING MARKETS LOCAL CURRENCY BOND FUND
Schedule of Investments at December 31, 2012 (Expressed in US Dollar)
The accompanying notes are an integral part of these financial statements.
Derivatives - (Continued)
Forward Foreign Exchange Contracts - (continued)
Description
AmountBought
AmountSold
UnrealisedGain
% ofNet Assets
Bought ZAR / Sold USD, due 10/01/13 220,000 24,943 962 0.01Bought ZAR / Sold USD, due 11/01/13 6,105,000 691,743 27,019 0.19Bought ZAR / Sold USD, due 10/04/13 1,671,000 193,080 1,268 0.01
Total Unrealised Gain on Forward Foreign Exchange Contracts 275,082 1.95 ____________________________________________________________ ___________________________________________________
Description
AmountBought
AmountSold
UnrealisedLoss
% ofNet Assets
Bought ARS / Sold USD, due 10/04/13 278,000 53,431 (554) (0.00)Bought BRL / Sold USD, due 10/04/13 113,000 54,556 (61) (0.00)Bought CLP / Sold USD, due 10/04/13 95,545,000 197,648 (675) (0.00)Bought HUF / Sold USD, due 10/04/13 107,474,000 491,316 (9,781) (0.07)Bought INR / Sold USD, due 11/01/13 48,990,000 912,447 (19,746) (0.14)Bought MXN / Sold USD, due 10/01/13 496,100 38,199 (21) (0.00)Bought MXN / Sold USD, due 11/01/13 8,593,000 663,159 (1,928) (0.01)Bought MXN / Sold USD, due 10/04/13 1,616,000 124,283 (976) (0.01)Bought MYR / Sold USD, due 10/01/13 620,600 203,042 (197) (0.00)Bought MYR / Sold USD, due 10/04/13 333,000 108,187 (20) (0.00)Bought PHP / Sold USD, due 10/01/13 409,000 10,016 (53) (0.00)Bought PLN / Sold USD, due 10/04/13 1,592,000 513,578 (4,019) (0.03)Bought USD / Sold ARS, due 11/01/13 685,486 3,423,000 (6,763) (0.05)Bought USD / Sold BRL, due 10/01/13 410,059 863,800 (11,420) (0.08)Bought USD / Sold BRL, due 11/01/13 623,544 1,295,000 (8,248) (0.06)Bought USD / Sold BRL, due 10/04/13 272,856 576,000 (4,924) (0.04)Bought USD / Sold CLP, due 10/01/13 125,919 60,869,170 (1,088) (0.01)Bought USD / Sold CLP, due 11/01/13 854,032 410,575,000 (2,537) (0.02)Bought USD / Sold CNY, due 11/01/13 1,058,234 6,697,000 (16,343) (0.12)Bought USD / Sold CNY, due 10/04/13 343,582 2,168,000 (2,070) (0.01)Bought USD / Sold COP, due 11/01/13 394,380 717,998,000 (11,728) (0.08)Bought USD / Sold CZK, due 11/01/13 206,806 4,036,000 (5,241) (0.04)Bought USD / Sold CZK, due 10/04/13 125,059 2,379,000 (37) (0.00)Bought USD / Sold HKD, due 11/01/13 1,557,352 12,073,000 (338) (0.00)Bought USD / Sold HUF, due 10/04/13 195,900 43,789,000 (296) (0.00)Bought USD / Sold IDR, due 10/01/13 55,341 535,460,000 (174) (0.00)Bought USD / Sold IDR, due 11/01/13 675,969 6,550,236,000 (3,058) (0.02)Bought USD / Sold IDR, due 10/04/13 337,114 3,339,784,000 (5,420) (0.04)Bought USD / Sold ILS, due 11/01/13 745,712 2,925,000 (38,018) (0.27)Bought USD / Sold ILS, due 10/04/13 106,372 400,000 (544) (0.00)Bought USD / Sold INR, due 10/04/13 40,421 2,260,000 (93) (0.00)Bought USD / Sold KRW, due 11/01/13 798,366 873,739,000 (17,355) (0.12)Bought USD / Sold MXN, due 11/01/13 658,742 8,593,000 (2,489) (0.02)Bought USD / Sold MXN, due 10/04/13 208,280 2,734,000 (335) (0.00)Bought USD / Sold MYR, due 11/01/13 315,948 970,000 (1,077) (0.01)Bought USD / Sold PEN, due 11/01/13 207,966 538,000 (2,704) (0.02)Bought USD / Sold PHP, due 11/01/13 862,143 35,839,000 (10,909) (0.08)Bought USD / Sold PHP, due 10/04/13 321,076 13,183,000 (128) (0.00)Bought USD / Sold PLN, due 11/01/13 1,128,440 3,556,000 (19,566) (0.14)Bought USD / Sold RUB, due 11/01/13 1,651,452 51,790,000 (41,760) (0.30)Bought USD / Sold SGD, due 11/01/13 769,539 942,000 (1,633) (0.01)Bought USD / Sold THB, due 10/01/13 70,778 2,171,000 (165) (0.00)Bought USD / Sold THB, due 11/01/13 642,757 19,866,000 (6,374) (0.05)Bought USD / Sold THB, due 10/04/13 270,935 8,341,000 (241) (0.00)Bought USD / Sold TRY, due 11/01/13 794,610 1,444,000 (13,531) (0.10)Bought USD / Sold TWD, due 11/01/13 805,720 23,533,000 (4,690) (0.03)Bought USD / Sold ZAR, due 11/01/13 709,340 6,105,000 (9,422) (0.07)
Total Unrealised Loss on Forward Foreign Exchange Contracts (288,750) (2.05) ____________________________________________________________ ___________________________________________________
Total Forward Foreign Exchange Contracts (13,668) (0.10) ____________________________________________________________ ___________________________________________________
Other Net Assets/(Liabilities) 737,904 5.25 ____________________________________________________________ ___________________________________________________
TOTAL NET ASSETS 14,064,317 100.00 ____________________________________________________________ ___________________________________________________
85

STATE STREET GLOBAL ADVISORS LUXEMBOURG SICAV — SSGA EUROPE MANAGED VOLATILITY EQUITY FUND
Schedule of Investments at December 31, 2012 (Expressed in Euro)
The accompanying notes are an integral part of these financial statements.
Currency Quantity Cost
MarketValue
% ofNet Assets
Transferable securities admitted to an official stock exchange listing or dealt in on another regulated market
Common and Preferred Stocks - 99.43% Austria Telekom Austria AG EUR 5,820 49,906 33,407 0.07
Total Austria 49,906 33,407 0.07 _______________________________________________ ____________________________________________________________ __________________________________________________
Belgium Belgacom SA EUR 8,418 201,298 186,922 0.38Colruyt SA EUR 19,125 704,575 717,187 1.48UCB SA EUR 7,316 195,171 316,198 0.65
Total Belgium 1,101,044 1,220,307 2.51 _______________________________________________ ____________________________________________________________ __________________________________________________
Denmark Coloplast A/S DKK 25,965 510,141 962,252 1.98TDC A/S DKK 157,500 944,217 845,240 1.74Tryg A/S DKK 3,910 166,914 223,512 0.46William Demant Holding A/S DKK 5,281 350,583 342,513 0.70
Total Denmark 1,971,855 2,373,517 4.88 _______________________________________________ ____________________________________________________________ __________________________________________________
Finland Elisa OYJ EUR 14,219 245,802 237,884 0.49Orion OYJ EUR 34,778 584,087 771,376 1.59
Total Finland 829,889 1,009,260 2.08 _______________________________________________ ____________________________________________________________ __________________________________________________
France Cie Generale d'Optique Essilor International SA EUR 15,781 823,918 1,199,672 2.47Eutelsat Communications SA EUR 12,865 388,680 322,911 0.67Fonciere Des Regions REIT EUR 676 49,429 42,791 0.09ICADE REIT EUR 3,806 321,733 254,697 0.52Iliad SA EUR 8,931 809,373 1,161,477 2.39Klepierre REIT EUR 10,279 297,589 308,576 0.64SCOR SE EUR 7,386 124,564 150,748 0.31Societe BIC SA EUR 4,906 296,512 443,110 0.91Sodexo EUR 16,038 846,465 1,021,941 2.10
Total France 3,958,263 4,905,923 10.10 _______________________________________________ ____________________________________________________________ __________________________________________________
Germany Axel Springer AG EUR 5,387 206,934 173,919 0.36Beiersdorf AG EUR 19,770 863,094 1,223,368 2.52Deutsche Telekom AG EUR 29,998 284,524 257,833 0.53Fresenius Medical Care AG & Co KGaA EUR 15,458 767,994 808,608 1.66Fresenius SE & Co KGaA EUR 4,658 316,218 405,712 0.83Hannover Rueckversicherung AG EUR 650 26,560 38,324 0.08Henkel AG & Co KGaA EUR 13,943 522,038 724,060 1.49Merck KGaA EUR 3,245 209,068 323,948 0.67Suedzucker AG EUR 17,391 426,091 538,947 1.11
Total Germany 3,622,521 4,494,719 9.25 _______________________________________________ ____________________________________________________________ __________________________________________________
Greece Coca Cola Hellenic Bottling Co SA EUR 30,684 516,412 543,107 1.12OPAP SA EUR 35,522 162,217 191,819 0.39
Total Greece 678,629 734,926 1.51 _______________________________________________ ____________________________________________________________ __________________________________________________
Ireland Kerry Group PLC EUR 14,377 410,073 575,871 1.19
86
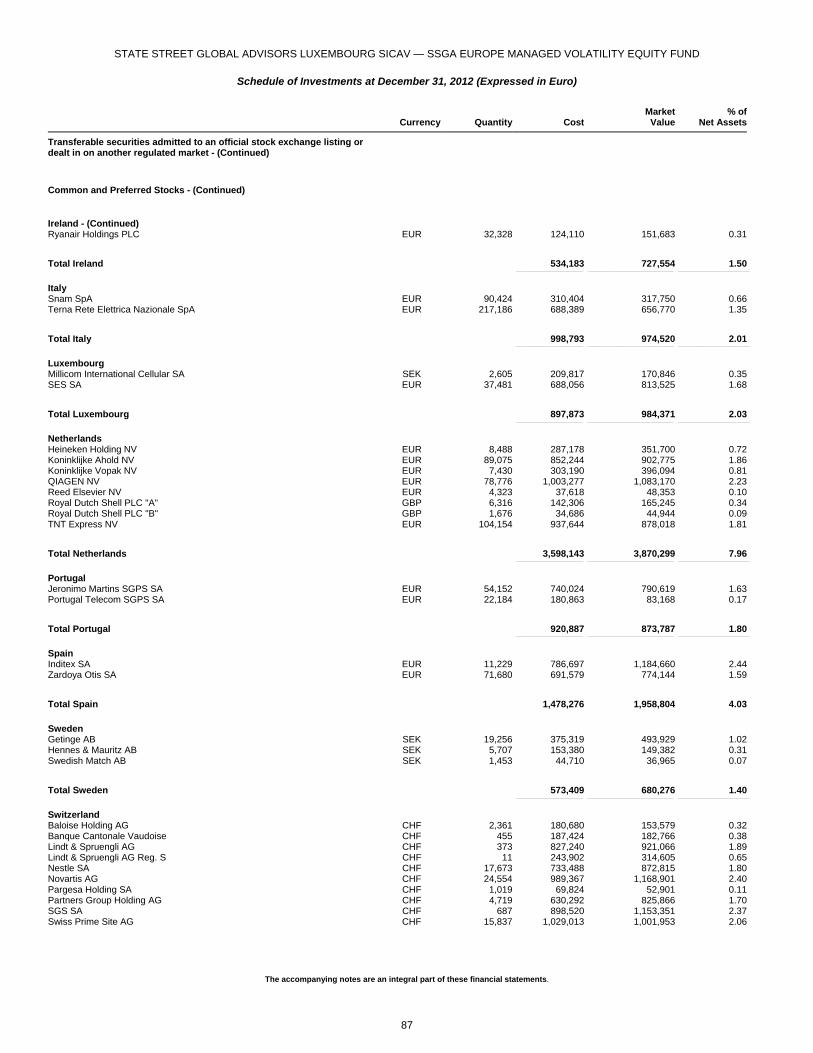
STATE STREET GLOBAL ADVISORS LUXEMBOURG SICAV — SSGA EUROPE MANAGED VOLATILITY EQUITY FUND
Schedule of Investments at December 31, 2012 (Expressed in Euro)
The accompanying notes are an integral part of these financial statements.
Currency Quantity Cost
MarketValue
% ofNet Assets
Transferable securities admitted to an official stock exchange listing or dealt in on another regulated market - (Continued)
Common and Preferred Stocks - (Continued)
Ireland - (Continued) Ryanair Holdings PLC EUR 32,328 124,110 151,683 0.31
Total Ireland 534,183 727,554 1.50 _______________________________________________ ____________________________________________________________ __________________________________________________
Italy Snam SpA EUR 90,424 310,404 317,750 0.66Terna Rete Elettrica Nazionale SpA EUR 217,186 688,389 656,770 1.35
Total Italy 998,793 974,520 2.01 _______________________________________________ ____________________________________________________________ __________________________________________________
Luxembourg Millicom International Cellular SA SEK 2,605 209,817 170,846 0.35SES SA EUR 37,481 688,056 813,525 1.68
Total Luxembourg 897,873 984,371 2.03 _______________________________________________ ____________________________________________________________ __________________________________________________
Netherlands Heineken Holding NV EUR 8,488 287,178 351,700 0.72Koninklijke Ahold NV EUR 89,075 852,244 902,775 1.86Koninklijke Vopak NV EUR 7,430 303,190 396,094 0.81QIAGEN NV EUR 78,776 1,003,277 1,083,170 2.23Reed Elsevier NV EUR 4,323 37,618 48,353 0.10Royal Dutch Shell PLC "A" GBP 6,316 142,306 165,245 0.34Royal Dutch Shell PLC "B" GBP 1,676 34,686 44,944 0.09TNT Express NV EUR 104,154 937,644 878,018 1.81
Total Netherlands 3,598,143 3,870,299 7.96 _______________________________________________ ____________________________________________________________ __________________________________________________
Portugal Jeronimo Martins SGPS SA EUR 54,152 740,024 790,619 1.63Portugal Telecom SGPS SA EUR 22,184 180,863 83,168 0.17
Total Portugal 920,887 873,787 1.80 _______________________________________________ ____________________________________________________________ __________________________________________________
Spain Inditex SA EUR 11,229 786,697 1,184,660 2.44Zardoya Otis SA EUR 71,680 691,579 774,144 1.59
Total Spain 1,478,276 1,958,804 4.03 _______________________________________________ ____________________________________________________________ __________________________________________________
Sweden Getinge AB SEK 19,256 375,319 493,929 1.02Hennes & Mauritz AB SEK 5,707 153,380 149,382 0.31Swedish Match AB SEK 1,453 44,710 36,965 0.07
Total Sweden 573,409 680,276 1.40 _______________________________________________ ____________________________________________________________ __________________________________________________
Switzerland Baloise Holding AG CHF 2,361 180,680 153,579 0.32Banque Cantonale Vaudoise CHF 455 187,424 182,766 0.38Lindt & Spruengli AG CHF 373 827,240 921,066 1.89Lindt & Spruengli AG Reg. S CHF 11 243,902 314,605 0.65Nestle SA CHF 17,673 733,488 872,815 1.80Novartis AG CHF 24,554 989,367 1,168,901 2.40Pargesa Holding SA CHF 1,019 69,824 52,901 0.11Partners Group Holding AG CHF 4,719 630,292 825,866 1.70SGS SA CHF 687 898,520 1,153,351 2.37Swiss Prime Site AG CHF 15,837 1,029,013 1,001,953 2.06
87
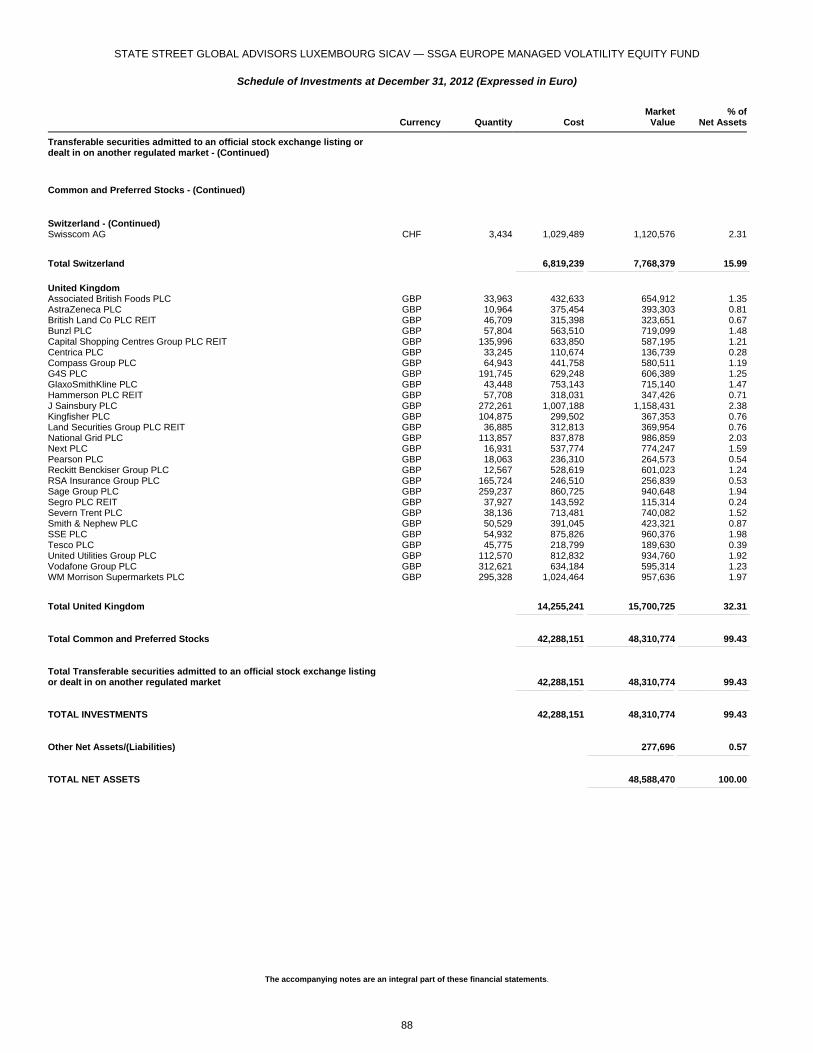
STATE STREET GLOBAL ADVISORS LUXEMBOURG SICAV — SSGA EUROPE MANAGED VOLATILITY EQUITY FUND
Schedule of Investments at December 31, 2012 (Expressed in Euro)
The accompanying notes are an integral part of these financial statements.
Currency Quantity Cost
MarketValue
% ofNet Assets
Transferable securities admitted to an official stock exchange listing or dealt in on another regulated market - (Continued)
Common and Preferred Stocks - (Continued)
Switzerland - (Continued) Swisscom AG CHF 3,434 1,029,489 1,120,576 2.31
Total Switzerland 6,819,239 7,768,379 15.99 _______________________________________________ ____________________________________________________________ __________________________________________________
United Kingdom Associated British Foods PLC GBP 33,963 432,633 654,912 1.35AstraZeneca PLC GBP 10,964 375,454 393,303 0.81British Land Co PLC REIT GBP 46,709 315,398 323,651 0.67Bunzl PLC GBP 57,804 563,510 719,099 1.48Capital Shopping Centres Group PLC REIT GBP 135,996 633,850 587,195 1.21Centrica PLC GBP 33,245 110,674 136,739 0.28Compass Group PLC GBP 64,943 441,758 580,511 1.19G4S PLC GBP 191,745 629,248 606,389 1.25GlaxoSmithKline PLC GBP 43,448 753,143 715,140 1.47Hammerson PLC REIT GBP 57,708 318,031 347,426 0.71J Sainsbury PLC GBP 272,261 1,007,188 1,158,431 2.38Kingfisher PLC GBP 104,875 299,502 367,353 0.76Land Securities Group PLC REIT GBP 36,885 312,813 369,954 0.76National Grid PLC GBP 113,857 837,878 986,859 2.03Next PLC GBP 16,931 537,774 774,247 1.59Pearson PLC GBP 18,063 236,310 264,573 0.54Reckitt Benckiser Group PLC GBP 12,567 528,619 601,023 1.24RSA Insurance Group PLC GBP 165,724 246,510 256,839 0.53Sage Group PLC GBP 259,237 860,725 940,648 1.94Segro PLC REIT GBP 37,927 143,592 115,314 0.24Severn Trent PLC GBP 38,136 713,481 740,082 1.52Smith & Nephew PLC GBP 50,529 391,045 423,321 0.87SSE PLC GBP 54,932 875,826 960,376 1.98Tesco PLC GBP 45,775 218,799 189,630 0.39United Utilities Group PLC GBP 112,570 812,832 934,760 1.92Vodafone Group PLC GBP 312,621 634,184 595,314 1.23WM Morrison Supermarkets PLC GBP 295,328 1,024,464 957,636 1.97
Total United Kingdom 14,255,241 15,700,725 32.31 _______________________________________________ ____________________________________________________________ __________________________________________________
Total Common and Preferred Stocks 42,288,151 48,310,774 99.43 _______________________________________________ ____________________________________________________________ __________________________________________________
Total Transferable securities admitted to an official stock exchange listing or dealt in on another regulated market 42,288,151 48,310,774 99.43 _______________________________________________ ____________________________________________________________ __________________________________________________
TOTAL INVESTMENTS 42,288,151 48,310,774 99.43 _______________________________________________ ____________________________________________________________ __________________________________________________
Other Net Assets/(Liabilities) 277,696 0.57 ____________________________________________________________ ___________________________________________________
TOTAL NET ASSETS 48,588,470 100.00 ____________________________________________________________ ___________________________________________________
88

STATE STREET GLOBAL ADVISORS LUXEMBOURG SICAV — SSGA GLOBAL MANAGED VOLATILITY EQUITY FUND
Schedule of Investments at December 31, 2012 (Expressed in US Dollar)
The accompanying notes are an integral part of these financial statements.
Currency Quantity Cost
MarketValue
% ofNet Assets
Transferable securities admitted to an official stock exchange listing or dealt in on another regulated market
Common and Preferred Stocks - 99.14% Australia AGL Energy Ltd AUD 8,447 126,480 134,878 0.12Centro Retail Australia REIT AUD 181,057 359,689 426,699 0.38Ramsay Health Care Ltd AUD 9,718 269,082 275,234 0.24Telstra Corp Ltd AUD 25,985 87,313 117,892 0.10
Total Australia 842,564 954,703 0.84 _______________________________________________ ____________________________________________________________ __________________________________________________
Bermuda Axis Capital Holdings Ltd USD 429 14,276 14,861 0.01Everest Re Group Ltd USD 55 5,081 6,047 0.01RenaissanceRe Holdings Ltd USD 2,277 158,966 185,029 0.16
Total Bermuda 178,323 205,937 0.18 _______________________________________________ ____________________________________________________________ __________________________________________________
Canada Bank of Montreal CAD 7,300 444,791 446,197 0.39BCE Inc CAD 28,118 1,130,166 1,203,847 1.06Bell Aliant Inc CAD 41,664 1,132,250 1,101,332 0.97Canadian Utilities Ltd CAD 4,224 281,816 305,187 0.27Empire Co Ltd CAD 3,487 199,453 206,446 0.18Fortis Inc CAD 9,700 331,584 333,368 0.29George Weston Ltd CAD 2,070 146,713 146,939 0.13Intact Financial Corp CAD 386 21,070 25,109 0.02Loblaw Cos Ltd CAD 22,538 723,400 949,099 0.84Metro Inc CAD 20,105 1,064,807 1,278,748 1.13RioCan Real Estate Investment Trust CAD 15,867 422,739 439,183 0.39TELUS Corp - Non Voting Shares CAD 20,023 1,112,443 1,300,681 1.14TMX Group Ltd CAD 1,287 56,432 65,559 0.06TransCanada Corp CAD 324 14,059 15,300 0.01
Total Canada 7,081,723 7,816,995 6.88 _______________________________________________ ____________________________________________________________ __________________________________________________
Denmark Coloplast A/S DKK 30,295 998,536 1,480,194 1.30TDC A/S DKK 122,829 938,141 869,056 0.77
Total Denmark 1,936,677 2,349,250 2.07 _______________________________________________ ____________________________________________________________ __________________________________________________
France Iliad SA EUR 4,689 628,134 803,967 0.71Klepierre REIT EUR 11,296 426,799 447,077 0.39
Total France 1,054,933 1,251,044 1.10 _______________________________________________ ____________________________________________________________ __________________________________________________
Germany Deutsche Telekom AG EUR 7,657 94,126 86,766 0.08Fresenius Medical Care AG & Co KGaA EUR 4,800 344,000 331,035 0.29Fresenius SE & Co KGaA EUR 3,669 414,174 421,321 0.37
Total Germany 852,300 839,122 0.74 _______________________________________________ ____________________________________________________________ __________________________________________________
Hong Kong CLP Holdings Ltd HKD 127,418 1,086,123 1,066,084 0.94Hong Kong & China Gas Co Ltd HKD 494,507 1,092,721 1,349,378 1.19Hongkong Electric Holdings Ltd HKD 125,892 947,722 1,075,243 0.94Hopewell Holdings Ltd HKD 126,349 365,462 542,018 0.48Link REIT HKD 138,866 502,307 693,358 0.61
89
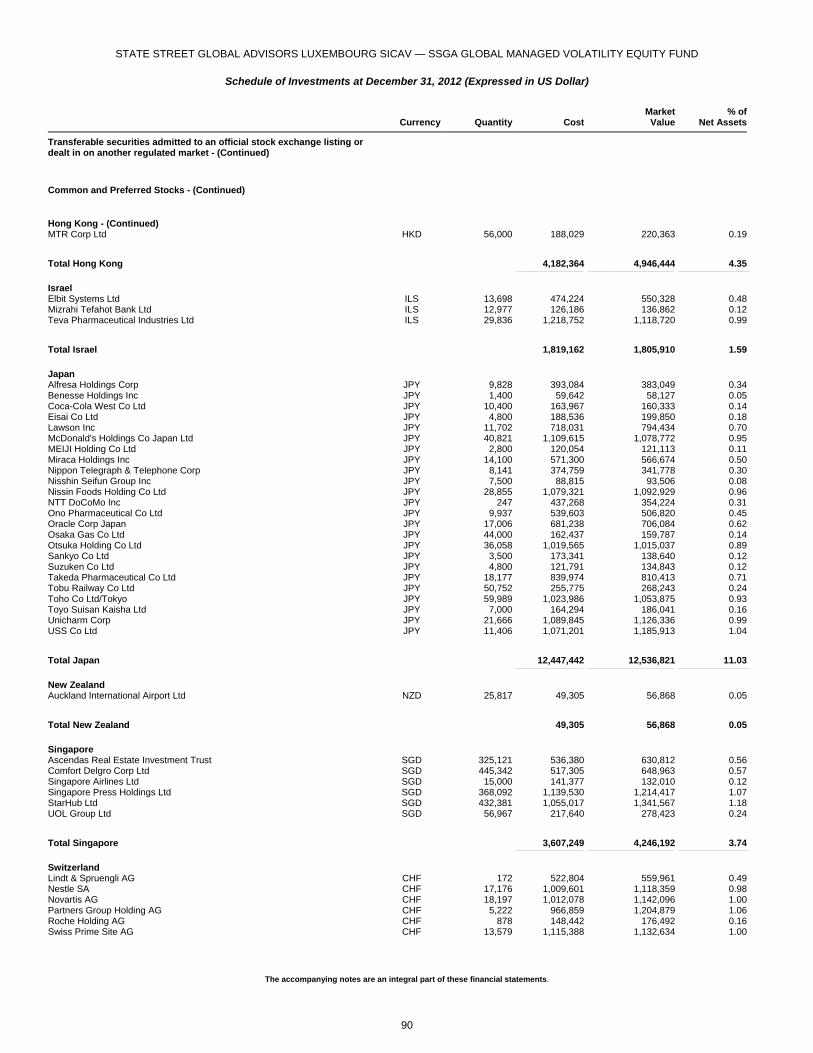
STATE STREET GLOBAL ADVISORS LUXEMBOURG SICAV — SSGA GLOBAL MANAGED VOLATILITY EQUITY FUND
Schedule of Investments at December 31, 2012 (Expressed in US Dollar)
The accompanying notes are an integral part of these financial statements.
Currency Quantity Cost
MarketValue
% ofNet Assets
Transferable securities admitted to an official stock exchange listing or dealt in on another regulated market - (Continued)
Common and Preferred Stocks - (Continued)
Hong Kong - (Continued) MTR Corp Ltd HKD 56,000 188,029 220,363 0.19
Total Hong Kong 4,182,364 4,946,444 4.35 _______________________________________________ ____________________________________________________________ __________________________________________________
Israel Elbit Systems Ltd ILS 13,698 474,224 550,328 0.48Mizrahi Tefahot Bank Ltd ILS 12,977 126,186 136,862 0.12Teva Pharmaceutical Industries Ltd ILS 29,836 1,218,752 1,118,720 0.99
Total Israel 1,819,162 1,805,910 1.59 _______________________________________________ ____________________________________________________________ __________________________________________________
Japan Alfresa Holdings Corp JPY 9,828 393,084 383,049 0.34Benesse Holdings Inc JPY 1,400 59,642 58,127 0.05Coca-Cola West Co Ltd JPY 10,400 163,967 160,333 0.14Eisai Co Ltd JPY 4,800 188,536 199,850 0.18Lawson Inc JPY 11,702 718,031 794,434 0.70McDonald's Holdings Co Japan Ltd JPY 40,821 1,109,615 1,078,772 0.95MEIJI Holding Co Ltd JPY 2,800 120,054 121,113 0.11Miraca Holdings Inc JPY 14,100 571,300 566,674 0.50Nippon Telegraph & Telephone Corp JPY 8,141 374,759 341,778 0.30Nisshin Seifun Group Inc JPY 7,500 88,815 93,506 0.08Nissin Foods Holding Co Ltd JPY 28,855 1,079,321 1,092,929 0.96NTT DoCoMo Inc JPY 247 437,268 354,224 0.31Ono Pharmaceutical Co Ltd JPY 9,937 539,603 506,820 0.45Oracle Corp Japan JPY 17,006 681,238 706,084 0.62Osaka Gas Co Ltd JPY 44,000 162,437 159,787 0.14Otsuka Holding Co Ltd JPY 36,058 1,019,565 1,015,037 0.89Sankyo Co Ltd JPY 3,500 173,341 138,640 0.12Suzuken Co Ltd JPY 4,800 121,791 134,843 0.12Takeda Pharmaceutical Co Ltd JPY 18,177 839,974 810,413 0.71Tobu Railway Co Ltd JPY 50,752 255,775 268,243 0.24Toho Co Ltd/Tokyo JPY 59,989 1,023,986 1,053,875 0.93Toyo Suisan Kaisha Ltd JPY 7,000 164,294 186,041 0.16Unicharm Corp JPY 21,666 1,089,845 1,126,336 0.99USS Co Ltd JPY 11,406 1,071,201 1,185,913 1.04
Total Japan 12,447,442 12,536,821 11.03 _______________________________________________ ____________________________________________________________ __________________________________________________
New Zealand Auckland International Airport Ltd NZD 25,817 49,305 56,868 0.05
Total New Zealand 49,305 56,868 0.05 _______________________________________________ ____________________________________________________________ __________________________________________________
Singapore Ascendas Real Estate Investment Trust SGD 325,121 536,380 630,812 0.56Comfort Delgro Corp Ltd SGD 445,342 517,305 648,963 0.57Singapore Airlines Ltd SGD 15,000 141,377 132,010 0.12Singapore Press Holdings Ltd SGD 368,092 1,139,530 1,214,417 1.07StarHub Ltd SGD 432,381 1,055,017 1,341,567 1.18UOL Group Ltd SGD 56,967 217,640 278,423 0.24
Total Singapore 3,607,249 4,246,192 3.74 _______________________________________________ ____________________________________________________________ __________________________________________________
Switzerland Lindt & Spruengli AG CHF 172 522,804 559,961 0.49Nestle SA CHF 17,176 1,009,601 1,118,359 0.98Novartis AG CHF 18,197 1,012,078 1,142,096 1.00Partners Group Holding AG CHF 5,222 966,859 1,204,879 1.06Roche Holding AG CHF 878 148,442 176,492 0.16Swiss Prime Site AG CHF 13,579 1,115,388 1,132,634 1.00
90
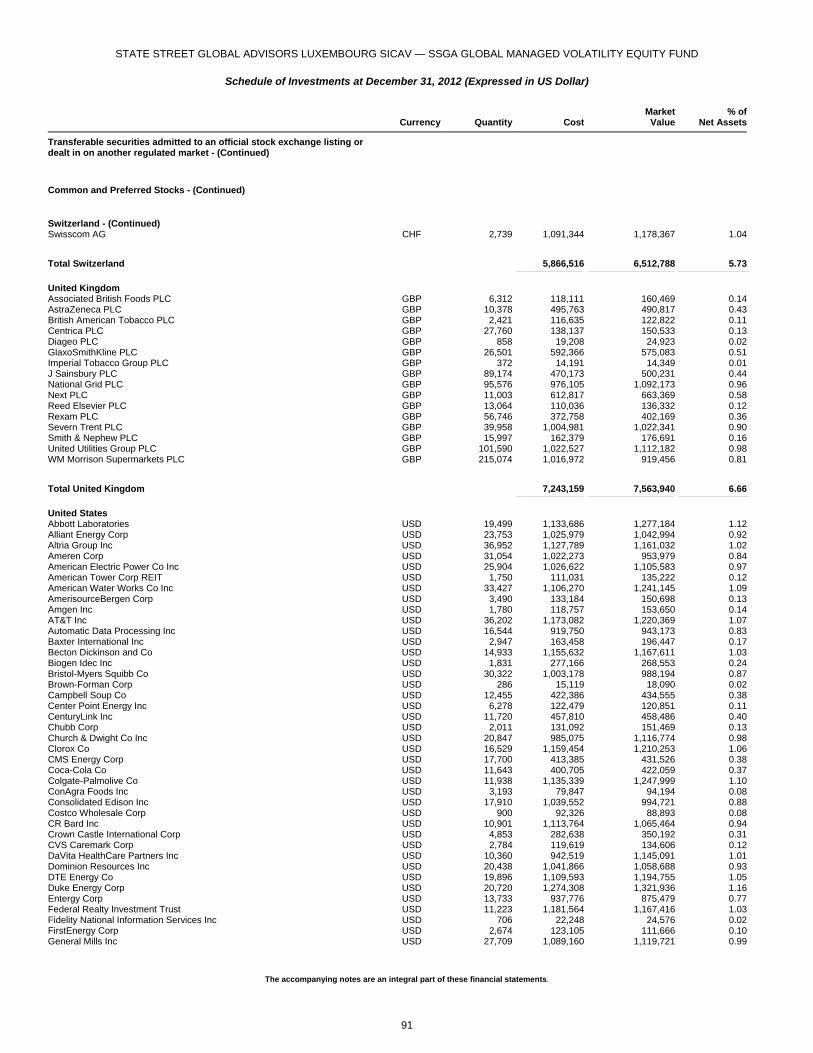
STATE STREET GLOBAL ADVISORS LUXEMBOURG SICAV — SSGA GLOBAL MANAGED VOLATILITY EQUITY FUND
Schedule of Investments at December 31, 2012 (Expressed in US Dollar)
The accompanying notes are an integral part of these financial statements.
Currency Quantity Cost
MarketValue
% ofNet Assets
Transferable securities admitted to an official stock exchange listing or dealt in on another regulated market - (Continued)
Common and Preferred Stocks - (Continued)
Switzerland - (Continued) Swisscom AG CHF 2,739 1,091,344 1,178,367 1.04
Total Switzerland 5,866,516 6,512,788 5.73 _______________________________________________ ____________________________________________________________ __________________________________________________
United Kingdom Associated British Foods PLC GBP 6,312 118,111 160,469 0.14AstraZeneca PLC GBP 10,378 495,763 490,817 0.43British American Tobacco PLC GBP 2,421 116,635 122,822 0.11Centrica PLC GBP 27,760 138,137 150,533 0.13Diageo PLC GBP 858 19,208 24,923 0.02GlaxoSmithKline PLC GBP 26,501 592,366 575,083 0.51Imperial Tobacco Group PLC GBP 372 14,191 14,349 0.01J Sainsbury PLC GBP 89,174 470,173 500,231 0.44National Grid PLC GBP 95,576 976,105 1,092,173 0.96Next PLC GBP 11,003 612,817 663,369 0.58Reed Elsevier PLC GBP 13,064 110,036 136,332 0.12Rexam PLC GBP 56,746 372,758 402,169 0.36Severn Trent PLC GBP 39,958 1,004,981 1,022,341 0.90Smith & Nephew PLC GBP 15,997 162,379 176,691 0.16United Utilities Group PLC GBP 101,590 1,022,527 1,112,182 0.98WM Morrison Supermarkets PLC GBP 215,074 1,016,972 919,456 0.81
Total United Kingdom 7,243,159 7,563,940 6.66 _______________________________________________ ____________________________________________________________ __________________________________________________
United States Abbott Laboratories USD 19,499 1,133,686 1,277,184 1.12Alliant Energy Corp USD 23,753 1,025,979 1,042,994 0.92Altria Group Inc USD 36,952 1,127,789 1,161,032 1.02Ameren Corp USD 31,054 1,022,273 953,979 0.84American Electric Power Co Inc USD 25,904 1,026,622 1,105,583 0.97American Tower Corp REIT USD 1,750 111,031 135,222 0.12American Water Works Co Inc USD 33,427 1,106,270 1,241,145 1.09AmerisourceBergen Corp USD 3,490 133,184 150,698 0.13Amgen Inc USD 1,780 118,757 153,650 0.14AT&T Inc USD 36,202 1,173,082 1,220,369 1.07Automatic Data Processing Inc USD 16,544 919,750 943,173 0.83Baxter International Inc USD 2,947 163,458 196,447 0.17Becton Dickinson and Co USD 14,933 1,155,632 1,167,611 1.03Biogen Idec Inc USD 1,831 277,166 268,553 0.24Bristol-Myers Squibb Co USD 30,322 1,003,178 988,194 0.87Brown-Forman Corp USD 286 15,119 18,090 0.02Campbell Soup Co USD 12,455 422,386 434,555 0.38Center Point Energy Inc USD 6,278 122,479 120,851 0.11CenturyLink Inc USD 11,720 457,810 458,486 0.40Chubb Corp USD 2,011 131,092 151,469 0.13Church & Dwight Co Inc USD 20,847 985,075 1,116,774 0.98Clorox Co USD 16,529 1,159,454 1,210,253 1.06CMS Energy Corp USD 17,700 413,385 431,526 0.38Coca-Cola Co USD 11,643 400,705 422,059 0.37Colgate-Palmolive Co USD 11,938 1,135,339 1,247,999 1.10ConAgra Foods Inc USD 3,193 79,847 94,194 0.08Consolidated Edison Inc USD 17,910 1,039,552 994,721 0.88Costco Wholesale Corp USD 900 92,326 88,893 0.08CR Bard Inc USD 10,901 1,113,764 1,065,464 0.94Crown Castle International Corp USD 4,853 282,638 350,192 0.31CVS Caremark Corp USD 2,784 119,619 134,606 0.12DaVita HealthCare Partners Inc USD 10,360 942,519 1,145,091 1.01Dominion Resources Inc USD 20,438 1,041,866 1,058,688 0.93DTE Energy Co USD 19,896 1,109,593 1,194,755 1.05Duke Energy Corp USD 20,720 1,274,308 1,321,936 1.16Entergy Corp USD 13,733 937,776 875,479 0.77Federal Realty Investment Trust USD 11,223 1,181,564 1,167,416 1.03Fidelity National Information Services Inc USD 706 22,248 24,576 0.02FirstEnergy Corp USD 2,674 123,105 111,666 0.10General Mills Inc USD 27,709 1,089,160 1,119,721 0.99
91
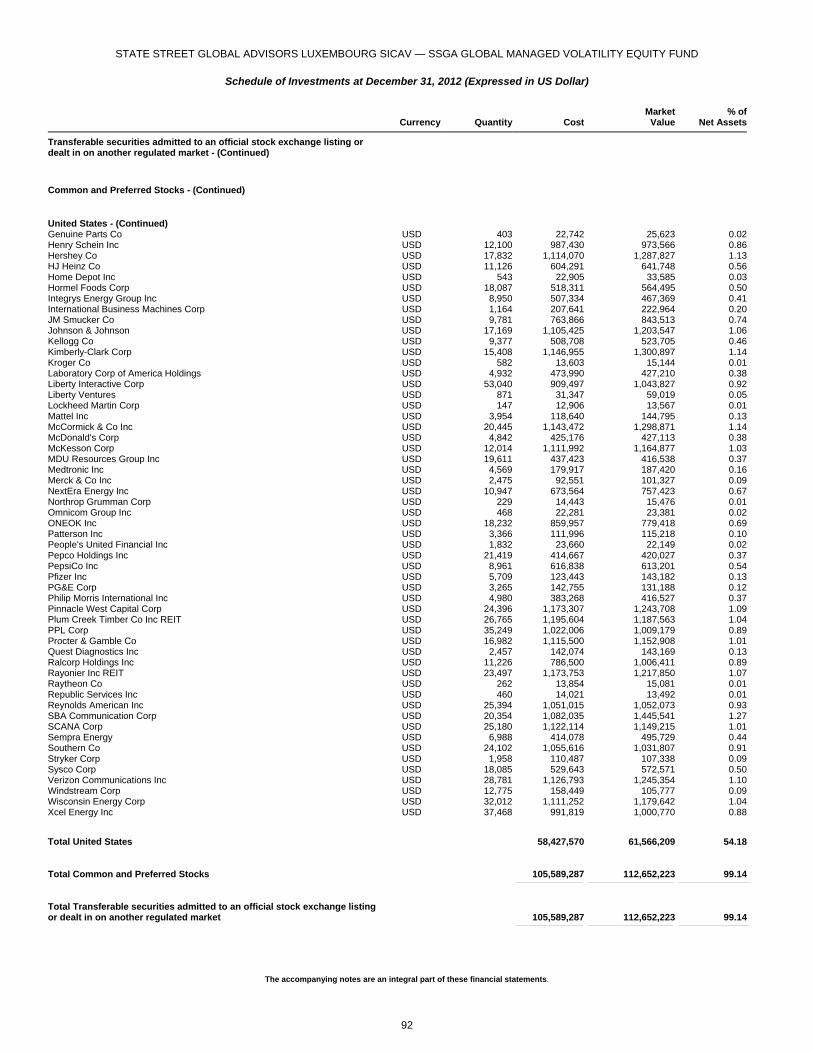
STATE STREET GLOBAL ADVISORS LUXEMBOURG SICAV — SSGA GLOBAL MANAGED VOLATILITY EQUITY FUND
Schedule of Investments at December 31, 2012 (Expressed in US Dollar)
The accompanying notes are an integral part of these financial statements.
Currency Quantity Cost
MarketValue
% ofNet Assets
Transferable securities admitted to an official stock exchange listing or dealt in on another regulated market - (Continued)
Common and Preferred Stocks - (Continued)
United States - (Continued) Genuine Parts Co USD 403 22,742 25,623 0.02Henry Schein Inc USD 12,100 987,430 973,566 0.86Hershey Co USD 17,832 1,114,070 1,287,827 1.13HJ Heinz Co USD 11,126 604,291 641,748 0.56Home Depot Inc USD 543 22,905 33,585 0.03Hormel Foods Corp USD 18,087 518,311 564,495 0.50Integrys Energy Group Inc USD 8,950 507,334 467,369 0.41International Business Machines Corp USD 1,164 207,641 222,964 0.20JM Smucker Co USD 9,781 763,866 843,513 0.74Johnson & Johnson USD 17,169 1,105,425 1,203,547 1.06Kellogg Co USD 9,377 508,708 523,705 0.46Kimberly-Clark Corp USD 15,408 1,146,955 1,300,897 1.14Kroger Co USD 582 13,603 15,144 0.01Laboratory Corp of America Holdings USD 4,932 473,990 427,210 0.38Liberty Interactive Corp USD 53,040 909,497 1,043,827 0.92Liberty Ventures USD 871 31,347 59,019 0.05Lockheed Martin Corp USD 147 12,906 13,567 0.01Mattel Inc USD 3,954 118,640 144,795 0.13McCormick & Co Inc USD 20,445 1,143,472 1,298,871 1.14McDonald's Corp USD 4,842 425,176 427,113 0.38McKesson Corp USD 12,014 1,111,992 1,164,877 1.03MDU Resources Group Inc USD 19,611 437,423 416,538 0.37Medtronic Inc USD 4,569 179,917 187,420 0.16Merck & Co Inc USD 2,475 92,551 101,327 0.09NextEra Energy Inc USD 10,947 673,564 757,423 0.67Northrop Grumman Corp USD 229 14,443 15,476 0.01Omnicom Group Inc USD 468 22,281 23,381 0.02ONEOK Inc USD 18,232 859,957 779,418 0.69Patterson Inc USD 3,366 111,996 115,218 0.10People's United Financial Inc USD 1,832 23,660 22,149 0.02Pepco Holdings Inc USD 21,419 414,667 420,027 0.37PepsiCo Inc USD 8,961 616,838 613,201 0.54Pfizer Inc USD 5,709 123,443 143,182 0.13PG&E Corp USD 3,265 142,755 131,188 0.12Philip Morris International Inc USD 4,980 383,268 416,527 0.37Pinnacle West Capital Corp USD 24,396 1,173,307 1,243,708 1.09Plum Creek Timber Co Inc REIT USD 26,765 1,195,604 1,187,563 1.04PPL Corp USD 35,249 1,022,006 1,009,179 0.89Procter & Gamble Co USD 16,982 1,115,500 1,152,908 1.01Quest Diagnostics Inc USD 2,457 142,074 143,169 0.13Ralcorp Holdings Inc USD 11,226 786,500 1,006,411 0.89Rayonier Inc REIT USD 23,497 1,173,753 1,217,850 1.07Raytheon Co USD 262 13,854 15,081 0.01Republic Services Inc USD 460 14,021 13,492 0.01Reynolds American Inc USD 25,394 1,051,015 1,052,073 0.93SBA Communication Corp USD 20,354 1,082,035 1,445,541 1.27SCANA Corp USD 25,180 1,122,114 1,149,215 1.01Sempra Energy USD 6,988 414,078 495,729 0.44Southern Co USD 24,102 1,055,616 1,031,807 0.91Stryker Corp USD 1,958 110,487 107,338 0.09Sysco Corp USD 18,085 529,643 572,571 0.50Verizon Communications Inc USD 28,781 1,126,793 1,245,354 1.10Windstream Corp USD 12,775 158,449 105,777 0.09Wisconsin Energy Corp USD 32,012 1,111,252 1,179,642 1.04Xcel Energy Inc USD 37,468 991,819 1,000,770 0.88
Total United States 58,427,570 61,566,209 54.18 _______________________________________________ ____________________________________________________________ __________________________________________________
Total Common and Preferred Stocks 105,589,287 112,652,223 99.14 _______________________________________________ ____________________________________________________________ __________________________________________________
Total Transferable securities admitted to an official stock exchange listing or dealt in on another regulated market 105,589,287 112,652,223 99.14 _______________________________________________ ____________________________________________________________ __________________________________________________
92

STATE STREET GLOBAL ADVISORS LUXEMBOURG SICAV — SSGA GLOBAL MANAGED VOLATILITY EQUITY FUND
Schedule of Investments at December 31, 2012 (Expressed in US Dollar)
The accompanying notes are an integral part of these financial statements.
Currency Quantity Cost
MarketValue
% ofNet Assets
TOTAL INVESTMENTS 105,589,287 112,652,223 99.14 _______________________________________________ ____________________________________________________________ __________________________________________________
Other Net Assets/(Liabilities) 978,423 0.86 ____________________________________________________________ ___________________________________________________
TOTAL NET ASSETS 113,630,646 100.00 ____________________________________________________________ ___________________________________________________
93
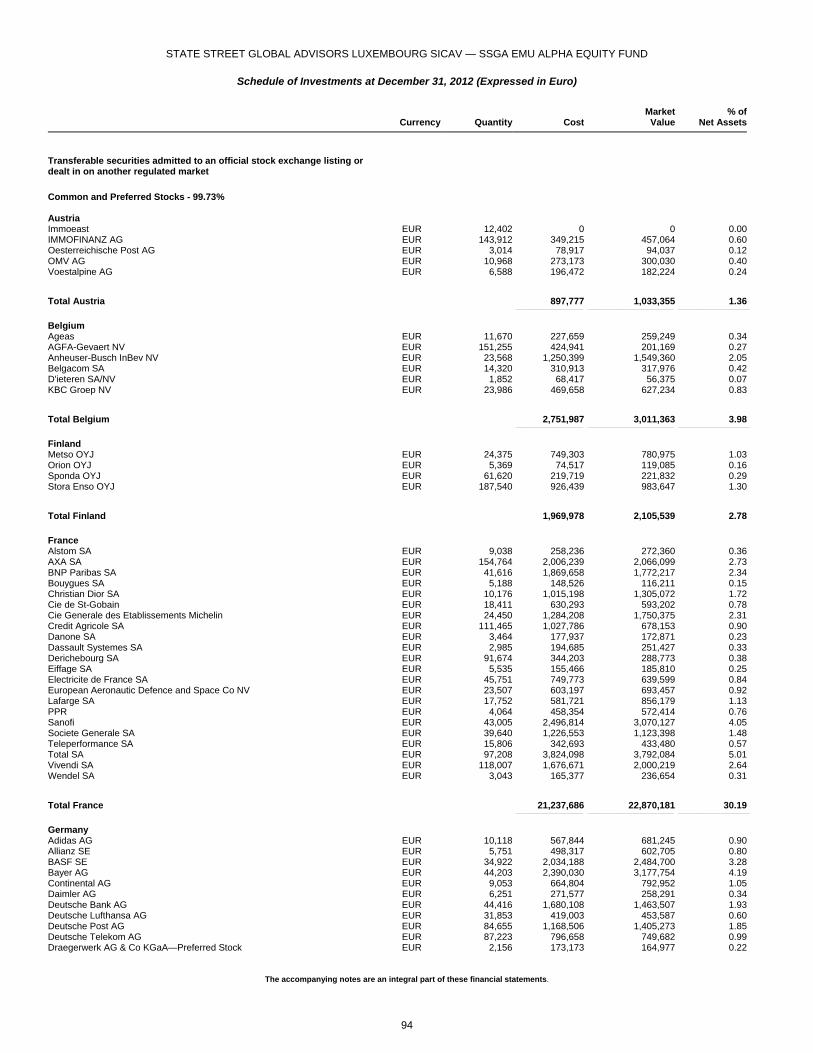
STATE STREET GLOBAL ADVISORS LUXEMBOURG SICAV — SSGA EMU ALPHA EQUITY FUND
Schedule of Investments at December 31, 2012 (Expressed in Euro)
The accompanying notes are an integral part of these financial statements.
Currency Quantity Cost
MarketValue
% ofNet Assets
Transferable securities admitted to an official stock exchange listing or dealt in on another regulated market
Common and Preferred Stocks - 99.73% Austria Immoeast EUR 12,402 0 0 0.00IMMOFINANZ AG EUR 143,912 349,215 457,064 0.60Oesterreichische Post AG EUR 3,014 78,917 94,037 0.12OMV AG EUR 10,968 273,173 300,030 0.40Voestalpine AG EUR 6,588 196,472 182,224 0.24
Total Austria 897,777 1,033,355 1.36 _______________________________________________ ____________________________________________________________ __________________________________________________
Belgium Ageas EUR 11,670 227,659 259,249 0.34AGFA-Gevaert NV EUR 151,255 424,941 201,169 0.27Anheuser-Busch InBev NV EUR 23,568 1,250,399 1,549,360 2.05Belgacom SA EUR 14,320 310,913 317,976 0.42D'ieteren SA/NV EUR 1,852 68,417 56,375 0.07KBC Groep NV EUR 23,986 469,658 627,234 0.83
Total Belgium 2,751,987 3,011,363 3.98 _______________________________________________ ____________________________________________________________ __________________________________________________
Finland Metso OYJ EUR 24,375 749,303 780,975 1.03Orion OYJ EUR 5,369 74,517 119,085 0.16Sponda OYJ EUR 61,620 219,719 221,832 0.29Stora Enso OYJ EUR 187,540 926,439 983,647 1.30
Total Finland 1,969,978 2,105,539 2.78 _______________________________________________ ____________________________________________________________ __________________________________________________
France Alstom SA EUR 9,038 258,236 272,360 0.36AXA SA EUR 154,764 2,006,239 2,066,099 2.73BNP Paribas SA EUR 41,616 1,869,658 1,772,217 2.34Bouygues SA EUR 5,188 148,526 116,211 0.15Christian Dior SA EUR 10,176 1,015,198 1,305,072 1.72Cie de St-Gobain EUR 18,411 630,293 593,202 0.78Cie Generale des Etablissements Michelin EUR 24,450 1,284,208 1,750,375 2.31Credit Agricole SA EUR 111,465 1,027,786 678,153 0.90Danone SA EUR 3,464 177,937 172,871 0.23Dassault Systemes SA EUR 2,985 194,685 251,427 0.33Derichebourg SA EUR 91,674 344,203 288,773 0.38Eiffage SA EUR 5,535 155,466 185,810 0.25Electricite de France SA EUR 45,751 749,773 639,599 0.84European Aeronautic Defence and Space Co NV EUR 23,507 603,197 693,457 0.92Lafarge SA EUR 17,752 581,721 856,179 1.13PPR EUR 4,064 458,354 572,414 0.76Sanofi EUR 43,005 2,496,814 3,070,127 4.05Societe Generale SA EUR 39,640 1,226,553 1,123,398 1.48Teleperformance SA EUR 15,806 342,693 433,480 0.57Total SA EUR 97,208 3,824,098 3,792,084 5.01Vivendi SA EUR 118,007 1,676,671 2,000,219 2.64Wendel SA EUR 3,043 165,377 236,654 0.31
Total France 21,237,686 22,870,181 30.19 _______________________________________________ ____________________________________________________________ __________________________________________________
Germany Adidas AG EUR 10,118 567,844 681,245 0.90Allianz SE EUR 5,751 498,317 602,705 0.80BASF SE EUR 34,922 2,034,188 2,484,700 3.28Bayer AG EUR 44,203 2,390,030 3,177,754 4.19Continental AG EUR 9,053 664,804 792,952 1.05Daimler AG EUR 6,251 271,577 258,291 0.34Deutsche Bank AG EUR 44,416 1,680,108 1,463,507 1.93Deutsche Lufthansa AG EUR 31,853 419,003 453,587 0.60Deutsche Post AG EUR 84,655 1,168,506 1,405,273 1.85Deutsche Telekom AG EUR 87,223 796,658 749,682 0.99Draegerwerk AG & Co KGaA—Preferred Stock EUR 2,156 173,173 164,977 0.22
94
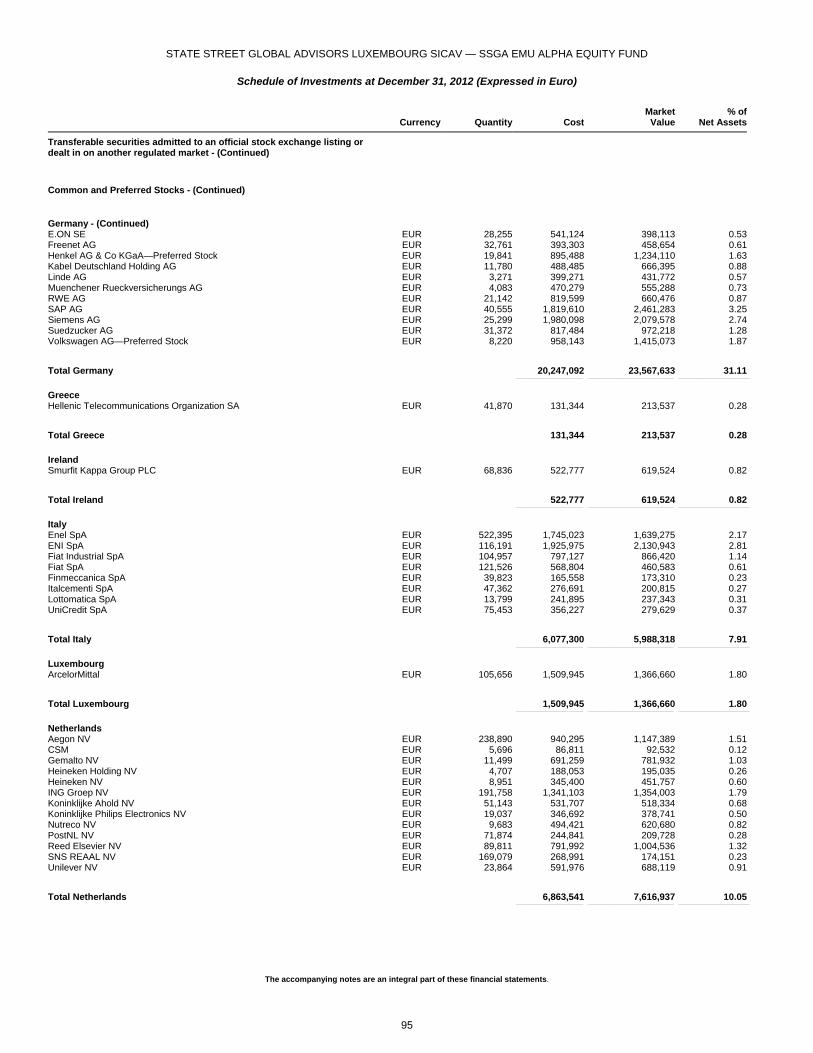
STATE STREET GLOBAL ADVISORS LUXEMBOURG SICAV — SSGA EMU ALPHA EQUITY FUND
Schedule of Investments at December 31, 2012 (Expressed in Euro)
The accompanying notes are an integral part of these financial statements.
Currency Quantity Cost
MarketValue
% ofNet Assets
Transferable securities admitted to an official stock exchange listing or dealt in on another regulated market - (Continued)
Common and Preferred Stocks - (Continued)
Germany - (Continued) E.ON SE EUR 28,255 541,124 398,113 0.53Freenet AG EUR 32,761 393,303 458,654 0.61Henkel AG & Co KGaA—Preferred Stock EUR 19,841 895,488 1,234,110 1.63Kabel Deutschland Holding AG EUR 11,780 488,485 666,395 0.88Linde AG EUR 3,271 399,271 431,772 0.57Muenchener Rueckversicherungs AG EUR 4,083 470,279 555,288 0.73RWE AG EUR 21,142 819,599 660,476 0.87SAP AG EUR 40,555 1,819,610 2,461,283 3.25Siemens AG EUR 25,299 1,980,098 2,079,578 2.74Suedzucker AG EUR 31,372 817,484 972,218 1.28Volkswagen AG—Preferred Stock EUR 8,220 958,143 1,415,073 1.87
Total Germany 20,247,092 23,567,633 31.11 _______________________________________________ ____________________________________________________________ __________________________________________________
Greece Hellenic Telecommunications Organization SA EUR 41,870 131,344 213,537 0.28
Total Greece 131,344 213,537 0.28 _______________________________________________ ____________________________________________________________ __________________________________________________
Ireland Smurfit Kappa Group PLC EUR 68,836 522,777 619,524 0.82
Total Ireland 522,777 619,524 0.82 _______________________________________________ ____________________________________________________________ __________________________________________________
Italy Enel SpA EUR 522,395 1,745,023 1,639,275 2.17ENI SpA EUR 116,191 1,925,975 2,130,943 2.81Fiat Industrial SpA EUR 104,957 797,127 866,420 1.14Fiat SpA EUR 121,526 568,804 460,583 0.61Finmeccanica SpA EUR 39,823 165,558 173,310 0.23Italcementi SpA EUR 47,362 276,691 200,815 0.27Lottomatica SpA EUR 13,799 241,895 237,343 0.31UniCredit SpA EUR 75,453 356,227 279,629 0.37
Total Italy 6,077,300 5,988,318 7.91 _______________________________________________ ____________________________________________________________ __________________________________________________
Luxembourg ArcelorMittal EUR 105,656 1,509,945 1,366,660 1.80
Total Luxembourg 1,509,945 1,366,660 1.80 _______________________________________________ ____________________________________________________________ __________________________________________________
Netherlands Aegon NV EUR 238,890 940,295 1,147,389 1.51CSM EUR 5,696 86,811 92,532 0.12Gemalto NV EUR 11,499 691,259 781,932 1.03Heineken Holding NV EUR 4,707 188,053 195,035 0.26Heineken NV EUR 8,951 345,400 451,757 0.60ING Groep NV EUR 191,758 1,341,103 1,354,003 1.79Koninklijke Ahold NV EUR 51,143 531,707 518,334 0.68Koninklijke Philips Electronics NV EUR 19,037 346,692 378,741 0.50Nutreco NV EUR 9,683 494,421 620,680 0.82PostNL NV EUR 71,874 244,841 209,728 0.28Reed Elsevier NV EUR 89,811 791,992 1,004,536 1.32SNS REAAL NV EUR 169,079 268,991 174,151 0.23Unilever NV EUR 23,864 591,976 688,119 0.91
Total Netherlands 6,863,541 7,616,937 10.05 _______________________________________________ ____________________________________________________________ __________________________________________________
95

STATE STREET GLOBAL ADVISORS LUXEMBOURG SICAV — SSGA EMU ALPHA EQUITY FUND
Schedule of Investments at December 31, 2012 (Expressed in Euro)
The accompanying notes are an integral part of these financial statements.
Currency Quantity Cost
MarketValue
% ofNet Assets
Transferable securities admitted to an official stock exchange listing or dealt in on another regulated market - (Continued)
Common and Preferred Stocks - (Continued)
Portugal EDP - Energias de Portugal SA EUR 192,287 478,631 440,337 0.58
Total Portugal 478,631 440,337 0.58 _______________________________________________ ____________________________________________________________ __________________________________________________
Spain ACS Actividades de Construccion y Servicios SA EUR 21,222 374,290 404,067 0.53Amadeus IT Holding SA EUR 12,468 196,794 237,515 0.31Banco Bilbao Vizcaya Argentaria SA EUR 71,076 581,897 494,689 0.65Banco Santander SA EUR 179,488 1,448,308 1,094,877 1.44Distribuidora Internacional de Alimentacion SA EUR 265,773 1,074,530 1,278,368 1.69Gas Natural SDG SA EUR 31,586 389,062 428,938 0.57Inditex SA EUR 2,253 143,056 237,692 0.31Obrascon Huarte Lain SA EUR 11,095 215,047 243,535 0.32Red Electrica Corp SA EUR 6,404 222,770 238,869 0.32Repsol SA EUR 60,765 1,106,018 931,831 1.23Repsol SA - Rights EUR 60,765 — 28,074 0.04Telefonica SA EUR 62,169 949,045 633,502 0.84Viscofan SA EUR 10,986 271,582 470,311 0.62
Total Spain 6,972,399 6,722,268 8.87 _______________________________________________ ____________________________________________________________ __________________________________________________
Total Common and Preferred Stocks 69,660,457 75,555,652 99.73 _______________________________________________ ____________________________________________________________ __________________________________________________
Total Transferable securities admitted to an official stock exchange listing or dealt in on another regulated market 69,660,457 75,555,652 99.73 _______________________________________________ ____________________________________________________________ __________________________________________________
TOTAL INVESTMENTS 69,660,457 75,555,652 99.73 _______________________________________________ ____________________________________________________________ __________________________________________________
Other Net Assets/(Liabilities) 201,678 0.27 ____________________________________________________________ ___________________________________________________
TOTAL NET ASSETS 75,757,330 100.00 ____________________________________________________________ ___________________________________________________
96
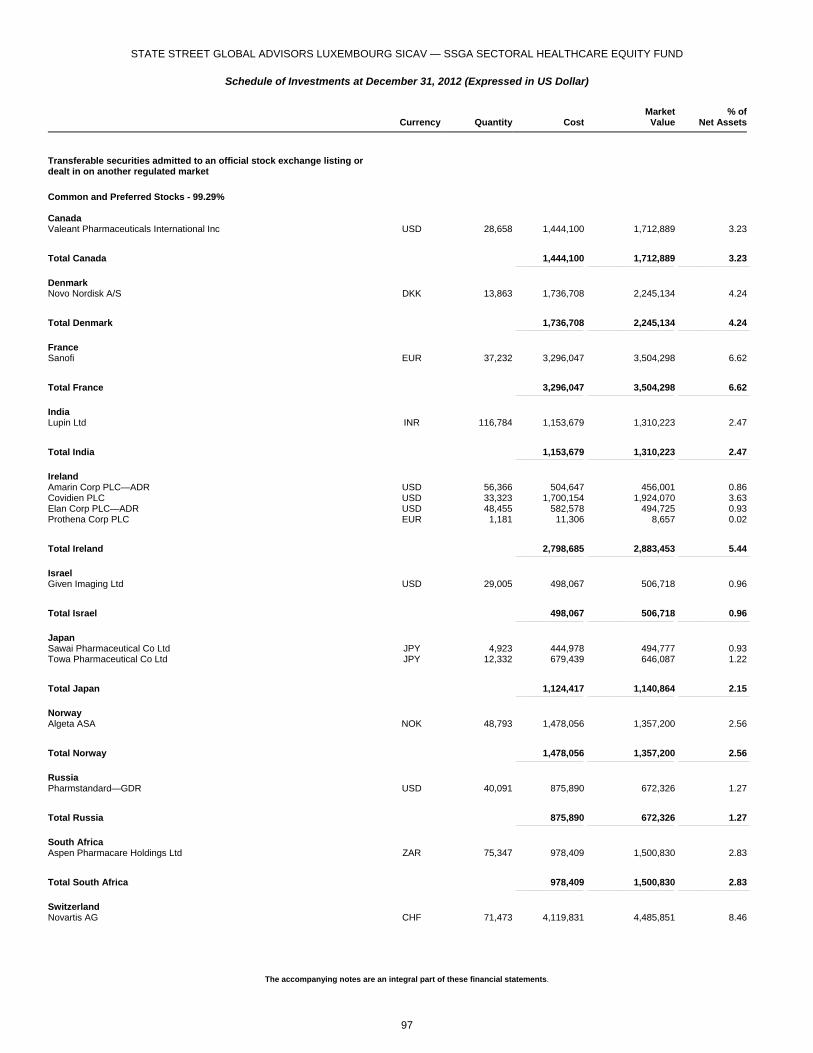
STATE STREET GLOBAL ADVISORS LUXEMBOURG SICAV — SSGA SECTORAL HEALTHCARE EQUITY FUND
Schedule of Investments at December 31, 2012 (Expressed in US Dollar)
The accompanying notes are an integral part of these financial statements.
Currency Quantity Cost
MarketValue
% ofNet Assets
Transferable securities admitted to an official stock exchange listing or dealt in on another regulated market
Common and Preferred Stocks - 99.29% Canada Valeant Pharmaceuticals International Inc USD 28,658 1,444,100 1,712,889 3.23
Total Canada 1,444,100 1,712,889 3.23 _______________________________________________ ____________________________________________________________ __________________________________________________
Denmark Novo Nordisk A/S DKK 13,863 1,736,708 2,245,134 4.24
Total Denmark 1,736,708 2,245,134 4.24 _______________________________________________ ____________________________________________________________ __________________________________________________
France Sanofi EUR 37,232 3,296,047 3,504,298 6.62
Total France 3,296,047 3,504,298 6.62 _______________________________________________ ____________________________________________________________ __________________________________________________
India Lupin Ltd INR 116,784 1,153,679 1,310,223 2.47
Total India 1,153,679 1,310,223 2.47 _______________________________________________ ____________________________________________________________ __________________________________________________
Ireland Amarin Corp PLC—ADR USD 56,366 504,647 456,001 0.86Covidien PLC USD 33,323 1,700,154 1,924,070 3.63Elan Corp PLC—ADR USD 48,455 582,578 494,725 0.93Prothena Corp PLC EUR 1,181 11,306 8,657 0.02
Total Ireland 2,798,685 2,883,453 5.44 _______________________________________________ ____________________________________________________________ __________________________________________________
Israel Given Imaging Ltd USD 29,005 498,067 506,718 0.96
Total Israel 498,067 506,718 0.96 _______________________________________________ ____________________________________________________________ __________________________________________________
Japan Sawai Pharmaceutical Co Ltd JPY 4,923 444,978 494,777 0.93Towa Pharmaceutical Co Ltd JPY 12,332 679,439 646,087 1.22
Total Japan 1,124,417 1,140,864 2.15 _______________________________________________ ____________________________________________________________ __________________________________________________
Norway Algeta ASA NOK 48,793 1,478,056 1,357,200 2.56
Total Norway 1,478,056 1,357,200 2.56 _______________________________________________ ____________________________________________________________ __________________________________________________
Russia Pharmstandard—GDR USD 40,091 875,890 672,326 1.27
Total Russia 875,890 672,326 1.27 _______________________________________________ ____________________________________________________________ __________________________________________________
South Africa Aspen Pharmacare Holdings Ltd ZAR 75,347 978,409 1,500,830 2.83
Total South Africa 978,409 1,500,830 2.83 _______________________________________________ ____________________________________________________________ __________________________________________________
Switzerland Novartis AG CHF 71,473 4,119,831 4,485,851 8.46
97
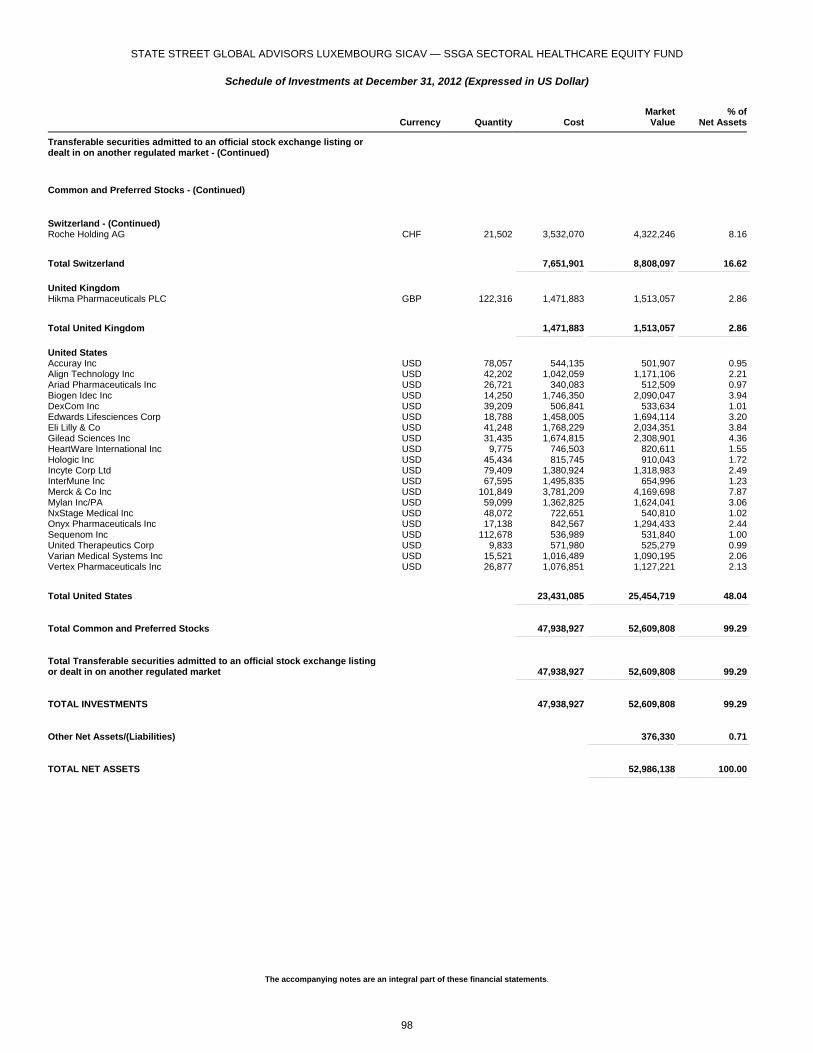
STATE STREET GLOBAL ADVISORS LUXEMBOURG SICAV — SSGA SECTORAL HEALTHCARE EQUITY FUND
Schedule of Investments at December 31, 2012 (Expressed in US Dollar)
The accompanying notes are an integral part of these financial statements.
Currency Quantity Cost
MarketValue
% ofNet Assets
Transferable securities admitted to an official stock exchange listing or dealt in on another regulated market - (Continued)
Common and Preferred Stocks - (Continued)
Switzerland - (Continued) Roche Holding AG CHF 21,502 3,532,070 4,322,246 8.16
Total Switzerland 7,651,901 8,808,097 16.62 _______________________________________________ ____________________________________________________________ __________________________________________________
United Kingdom Hikma Pharmaceuticals PLC GBP 122,316 1,471,883 1,513,057 2.86
Total United Kingdom 1,471,883 1,513,057 2.86 _______________________________________________ ____________________________________________________________ __________________________________________________
United States Accuray Inc USD 78,057 544,135 501,907 0.95Align Technology Inc USD 42,202 1,042,059 1,171,106 2.21Ariad Pharmaceuticals Inc USD 26,721 340,083 512,509 0.97Biogen Idec Inc USD 14,250 1,746,350 2,090,047 3.94DexCom Inc USD 39,209 506,841 533,634 1.01Edwards Lifesciences Corp USD 18,788 1,458,005 1,694,114 3.20Eli Lilly & Co USD 41,248 1,768,229 2,034,351 3.84Gilead Sciences Inc USD 31,435 1,674,815 2,308,901 4.36HeartWare International Inc USD 9,775 746,503 820,611 1.55Hologic Inc USD 45,434 815,745 910,043 1.72Incyte Corp Ltd USD 79,409 1,380,924 1,318,983 2.49InterMune Inc USD 67,595 1,495,835 654,996 1.23Merck & Co Inc USD 101,849 3,781,209 4,169,698 7.87Mylan Inc/PA USD 59,099 1,362,825 1,624,041 3.06NxStage Medical Inc USD 48,072 722,651 540,810 1.02Onyx Pharmaceuticals Inc USD 17,138 842,567 1,294,433 2.44Sequenom Inc USD 112,678 536,989 531,840 1.00United Therapeutics Corp USD 9,833 571,980 525,279 0.99Varian Medical Systems Inc USD 15,521 1,016,489 1,090,195 2.06Vertex Pharmaceuticals Inc USD 26,877 1,076,851 1,127,221 2.13
Total United States 23,431,085 25,454,719 48.04 _______________________________________________ ____________________________________________________________ __________________________________________________
Total Common and Preferred Stocks 47,938,927 52,609,808 99.29 _______________________________________________ ____________________________________________________________ __________________________________________________
Total Transferable securities admitted to an official stock exchange listing or dealt in on another regulated market 47,938,927 52,609,808 99.29 _______________________________________________ ____________________________________________________________ __________________________________________________
TOTAL INVESTMENTS 47,938,927 52,609,808 99.29 _______________________________________________ ____________________________________________________________ __________________________________________________
Other Net Assets/(Liabilities) 376,330 0.71 ____________________________________________________________ ___________________________________________________
TOTAL NET ASSETS 52,986,138 100.00 ____________________________________________________________ ___________________________________________________
98
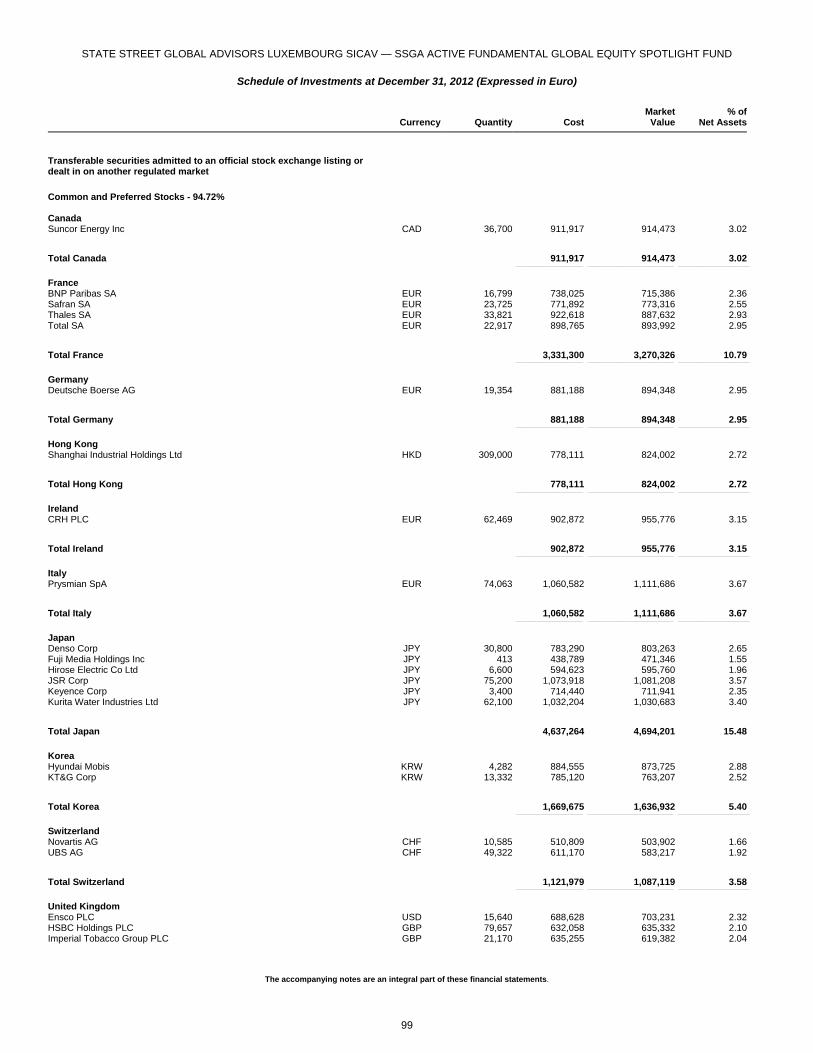
STATE STREET GLOBAL ADVISORS LUXEMBOURG SICAV — SSGA ACTIVE FUNDAMENTAL GLOBAL EQUITY SPOTLIGHT FUND
Schedule of Investments at December 31, 2012 (Expressed in Euro)
The accompanying notes are an integral part of these financial statements.
Currency Quantity Cost
MarketValue
% ofNet Assets
Transferable securities admitted to an official stock exchange listing or dealt in on another regulated market
Common and Preferred Stocks - 94.72% Canada Suncor Energy Inc CAD 36,700 911,917 914,473 3.02
Total Canada 911,917 914,473 3.02 _______________________________________________ ____________________________________________________________ __________________________________________________
France BNP Paribas SA EUR 16,799 738,025 715,386 2.36Safran SA EUR 23,725 771,892 773,316 2.55Thales SA EUR 33,821 922,618 887,632 2.93Total SA EUR 22,917 898,765 893,992 2.95
Total France 3,331,300 3,270,326 10.79 _______________________________________________ ____________________________________________________________ __________________________________________________
Germany Deutsche Boerse AG EUR 19,354 881,188 894,348 2.95
Total Germany 881,188 894,348 2.95 _______________________________________________ ____________________________________________________________ __________________________________________________
Hong Kong Shanghai Industrial Holdings Ltd HKD 309,000 778,111 824,002 2.72
Total Hong Kong 778,111 824,002 2.72 _______________________________________________ ____________________________________________________________ __________________________________________________
Ireland CRH PLC EUR 62,469 902,872 955,776 3.15
Total Ireland 902,872 955,776 3.15 _______________________________________________ ____________________________________________________________ __________________________________________________
Italy Prysmian SpA EUR 74,063 1,060,582 1,111,686 3.67
Total Italy 1,060,582 1,111,686 3.67 _______________________________________________ ____________________________________________________________ __________________________________________________
Japan Denso Corp JPY 30,800 783,290 803,263 2.65Fuji Media Holdings Inc JPY 413 438,789 471,346 1.55Hirose Electric Co Ltd JPY 6,600 594,623 595,760 1.96JSR Corp JPY 75,200 1,073,918 1,081,208 3.57Keyence Corp JPY 3,400 714,440 711,941 2.35Kurita Water Industries Ltd JPY 62,100 1,032,204 1,030,683 3.40
Total Japan 4,637,264 4,694,201 15.48 _______________________________________________ ____________________________________________________________ __________________________________________________
Korea Hyundai Mobis KRW 4,282 884,555 873,725 2.88KT&G Corp KRW 13,332 785,120 763,207 2.52
Total Korea 1,669,675 1,636,932 5.40 _______________________________________________ ____________________________________________________________ __________________________________________________
Switzerland Novartis AG CHF 10,585 510,809 503,902 1.66UBS AG CHF 49,322 611,170 583,217 1.92
Total Switzerland 1,121,979 1,087,119 3.58 _______________________________________________ ____________________________________________________________ __________________________________________________
United Kingdom Ensco PLC USD 15,640 688,628 703,231 2.32HSBC Holdings PLC GBP 79,657 632,058 635,332 2.10Imperial Tobacco Group PLC GBP 21,170 635,255 619,382 2.04
99
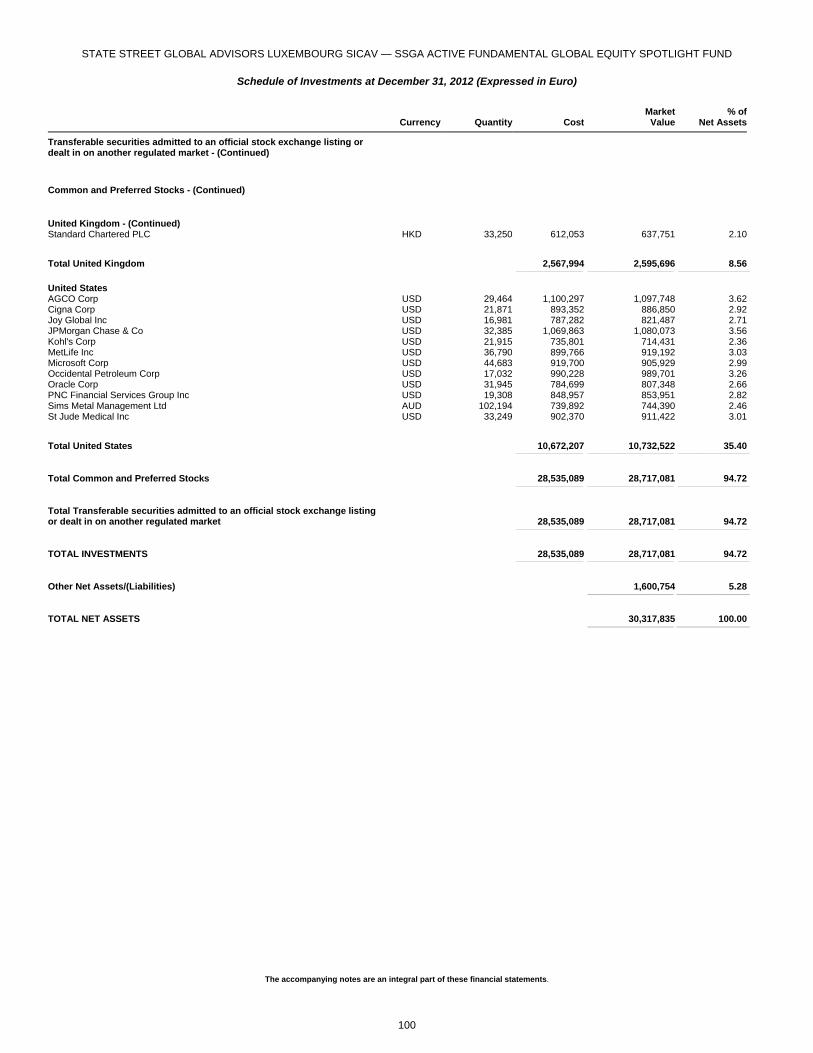
STATE STREET GLOBAL ADVISORS LUXEMBOURG SICAV — SSGA ACTIVE FUNDAMENTAL GLOBAL EQUITY SPOTLIGHT FUND
Schedule of Investments at December 31, 2012 (Expressed in Euro)
The accompanying notes are an integral part of these financial statements.
Currency Quantity Cost
MarketValue
% ofNet Assets
Transferable securities admitted to an official stock exchange listing or dealt in on another regulated market - (Continued)
Common and Preferred Stocks - (Continued)
United Kingdom - (Continued) Standard Chartered PLC HKD 33,250 612,053 637,751 2.10
Total United Kingdom 2,567,994 2,595,696 8.56 _______________________________________________ ____________________________________________________________ __________________________________________________
United States AGCO Corp USD 29,464 1,100,297 1,097,748 3.62Cigna Corp USD 21,871 893,352 886,850 2.92Joy Global Inc USD 16,981 787,282 821,487 2.71JPMorgan Chase & Co USD 32,385 1,069,863 1,080,073 3.56Kohl's Corp USD 21,915 735,801 714,431 2.36MetLife Inc USD 36,790 899,766 919,192 3.03Microsoft Corp USD 44,683 919,700 905,929 2.99Occidental Petroleum Corp USD 17,032 990,228 989,701 3.26Oracle Corp USD 31,945 784,699 807,348 2.66PNC Financial Services Group Inc USD 19,308 848,957 853,951 2.82Sims Metal Management Ltd AUD 102,194 739,892 744,390 2.46St Jude Medical Inc USD 33,249 902,370 911,422 3.01
Total United States 10,672,207 10,732,522 35.40 _______________________________________________ ____________________________________________________________ __________________________________________________
Total Common and Preferred Stocks 28,535,089 28,717,081 94.72 _______________________________________________ ____________________________________________________________ __________________________________________________
Total Transferable securities admitted to an official stock exchange listing or dealt in on another regulated market 28,535,089 28,717,081 94.72 _______________________________________________ ____________________________________________________________ __________________________________________________
TOTAL INVESTMENTS 28,535,089 28,717,081 94.72 _______________________________________________ ____________________________________________________________ __________________________________________________
Other Net Assets/(Liabilities) 1,600,754 5.28 ____________________________________________________________ ___________________________________________________
TOTAL NET ASSETS 30,317,835 100.00 ____________________________________________________________ ___________________________________________________
100
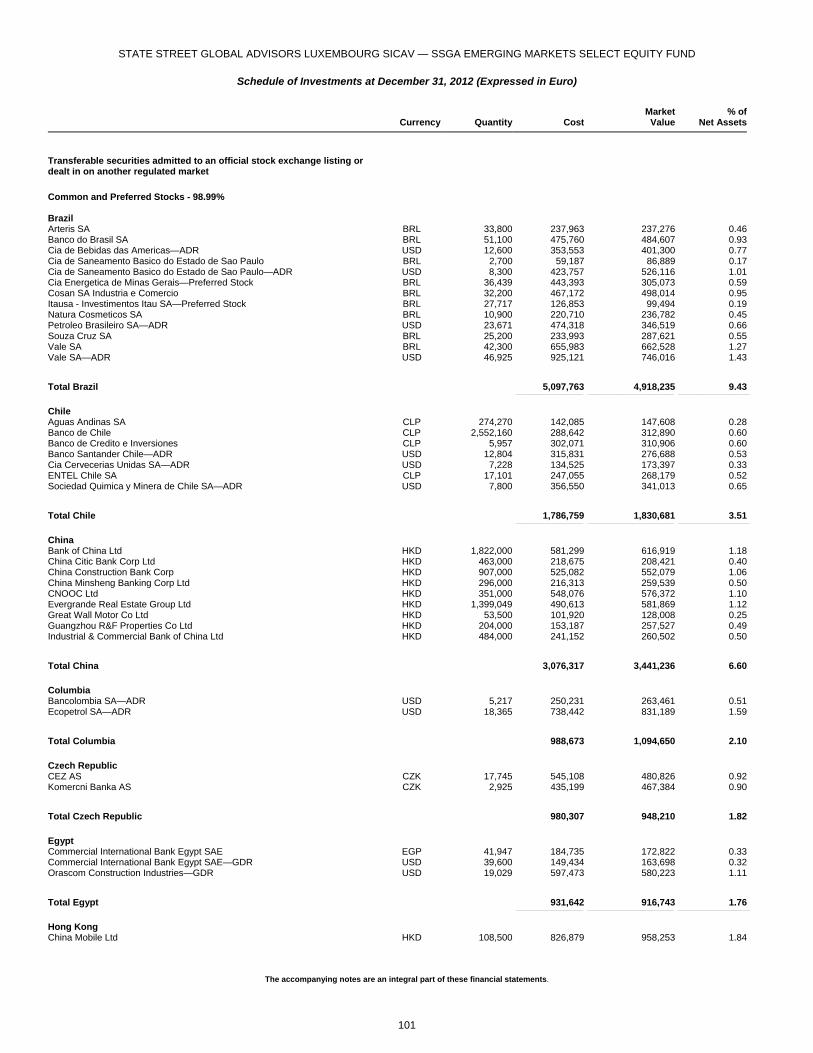
STATE STREET GLOBAL ADVISORS LUXEMBOURG SICAV — SSGA EMERGING MARKETS SELECT EQUITY FUND
Schedule of Investments at December 31, 2012 (Expressed in Euro)
The accompanying notes are an integral part of these financial statements.
Currency Quantity Cost
MarketValue
% ofNet Assets
Transferable securities admitted to an official stock exchange listing or dealt in on another regulated market
Common and Preferred Stocks - 98.99% Brazil Arteris SA BRL 33,800 237,963 237,276 0.46Banco do Brasil SA BRL 51,100 475,760 484,607 0.93Cia de Bebidas das Americas—ADR USD 12,600 353,553 401,300 0.77Cia de Saneamento Basico do Estado de Sao Paulo BRL 2,700 59,187 86,889 0.17Cia de Saneamento Basico do Estado de Sao Paulo—ADR USD 8,300 423,757 526,116 1.01Cia Energetica de Minas Gerais—Preferred Stock BRL 36,439 443,393 305,073 0.59Cosan SA Industria e Comercio BRL 32,200 467,172 498,014 0.95Itausa - Investimentos Itau SA—Preferred Stock BRL 27,717 126,853 99,494 0.19Natura Cosmeticos SA BRL 10,900 220,710 236,782 0.45Petroleo Brasileiro SA—ADR USD 23,671 474,318 346,519 0.66Souza Cruz SA BRL 25,200 233,993 287,621 0.55Vale SA BRL 42,300 655,983 662,528 1.27Vale SA—ADR USD 46,925 925,121 746,016 1.43
Total Brazil 5,097,763 4,918,235 9.43 _______________________________________________ ____________________________________________________________ __________________________________________________
Chile Aguas Andinas SA CLP 274,270 142,085 147,608 0.28Banco de Chile CLP 2,552,160 288,642 312,890 0.60Banco de Credito e Inversiones CLP 5,957 302,071 310,906 0.60Banco Santander Chile—ADR USD 12,804 315,831 276,688 0.53Cia Cervecerias Unidas SA—ADR USD 7,228 134,525 173,397 0.33ENTEL Chile SA CLP 17,101 247,055 268,179 0.52Sociedad Quimica y Minera de Chile SA—ADR USD 7,800 356,550 341,013 0.65
Total Chile 1,786,759 1,830,681 3.51 _______________________________________________ ____________________________________________________________ __________________________________________________
China Bank of China Ltd HKD 1,822,000 581,299 616,919 1.18China Citic Bank Corp Ltd HKD 463,000 218,675 208,421 0.40China Construction Bank Corp HKD 907,000 525,082 552,079 1.06China Minsheng Banking Corp Ltd HKD 296,000 216,313 259,539 0.50CNOOC Ltd HKD 351,000 548,076 576,372 1.10Evergrande Real Estate Group Ltd HKD 1,399,049 490,613 581,869 1.12Great Wall Motor Co Ltd HKD 53,500 101,920 128,008 0.25Guangzhou R&F Properties Co Ltd HKD 204,000 153,187 257,527 0.49Industrial & Commercial Bank of China Ltd HKD 484,000 241,152 260,502 0.50
Total China 3,076,317 3,441,236 6.60 _______________________________________________ ____________________________________________________________ __________________________________________________
Columbia Bancolombia SA—ADR USD 5,217 250,231 263,461 0.51Ecopetrol SA—ADR USD 18,365 738,442 831,189 1.59
Total Columbia 988,673 1,094,650 2.10 _______________________________________________ ____________________________________________________________ __________________________________________________
Czech Republic CEZ AS CZK 17,745 545,108 480,826 0.92Komercni Banka AS CZK 2,925 435,199 467,384 0.90
Total Czech Republic 980,307 948,210 1.82 _______________________________________________ ____________________________________________________________ __________________________________________________
Egypt Commercial International Bank Egypt SAE EGP 41,947 184,735 172,822 0.33Commercial International Bank Egypt SAE—GDR USD 39,600 149,434 163,698 0.32Orascom Construction Industries—GDR USD 19,029 597,473 580,223 1.11
Total Egypt 931,642 916,743 1.76 _______________________________________________ ____________________________________________________________ __________________________________________________
Hong Kong China Mobile Ltd HKD 108,500 826,879 958,253 1.84
101

STATE STREET GLOBAL ADVISORS LUXEMBOURG SICAV — SSGA EMERGING MARKETS SELECT EQUITY FUND
Schedule of Investments at December 31, 2012 (Expressed in Euro)
The accompanying notes are an integral part of these financial statements.
Currency Quantity Cost
MarketValue
% ofNet Assets
Transferable securities admitted to an official stock exchange listing or dealt in on another regulated market - (Continued)
Common and Preferred Stocks - (Continued)
Hong Kong - (Continued) Shimao Property Holdings Ltd HKD 189,500 150,153 271,119 0.52
Total Hong Kong 977,032 1,229,372 2.36 _______________________________________________ ____________________________________________________________ __________________________________________________
Hungary MOL Hungarian Oil and Gas PLC HUF 4,590 287,736 279,846 0.53OTP Bank PLC HUF 48,949 683,023 697,554 1.34
Total Hungary 970,759 977,400 1.87 _______________________________________________ ____________________________________________________________ __________________________________________________
India Godrej Consumer Products Ltd INR 22,968 207,626 230,236 0.44Hindustan Unilever Ltd INR 149,423 949,706 1,097,580 2.10ICICI Bank Ltd INR 7,891 116,290 126,549 0.24ITC Ltd INR 205,694 755,480 817,962 1.57Power Finance Corp Ltd INR 46,464 105,235 133,342 0.26Rural Electrification Corp Ltd INR 65,457 174,029 227,085 0.44Sun Pharmaceutical Industries Ltd INR 24,448 237,725 250,284 0.48Tata Consultancy Services Ltd INR 22,711 399,908 397,453 0.76Tata Motors Ltd—ADR USD 39,553 782,459 861,622 1.65Ultratech Cement Ltd INR 23,075 453,298 646,169 1.24
Total India 4,181,756 4,788,282 9.18 _______________________________________________ ____________________________________________________________ __________________________________________________
Indonesia Astra International Tbk PT IDR 723,000 405,590 432,454 0.83Bank Rakyat Indonesia Persero Tbk PT IDR 806,000 433,116 440,868 0.85Indo Tambangraya Megah Tbk PT IDR 80,000 256,717 261,607 0.50Indofood Sukses Makmur Tbk PT IDR 208,000 82,789 95,765 0.18Telekomunikasi Indonesia Persero Tbk PT IDR 757,500 598,282 539,535 1.03
Total Indonesia 1,776,494 1,770,229 3.39 _______________________________________________ ____________________________________________________________ __________________________________________________
Korea Hyundai Motor Co KRW 2,969 441,110 459,618 0.88Samsung Electronics Co Ltd KRW 3,078 2,306,967 3,319,089 6.37SK Holdings Co Ltd KRW 4,198 443,224 532,392 1.02SK Telecom Co Ltd KRW 860 84,962 92,919 0.18Woori Finance Holdings Co Ltd KRW 40,720 336,947 340,428 0.65
Total Korea 3,613,210 4,744,446 9.10 _______________________________________________ ____________________________________________________________ __________________________________________________
Malaysia Alliance Financial Group Bhd MYR 65,000 62,661 70,938 0.14DiGi.Com Bhd MYR 187,600 162,629 246,152 0.47Hong Leong Financial Group Bhd MYR 32,200 87,938 105,425 0.20Malayan Banking Bhd MYR 381,100 799,435 869,645 1.67UMW Holdings Bhd MYR 73,000 140,315 216,194 0.41YTL Corp Bhd MYR 610,373 258,045 287,650 0.55
Total Malaysia 1,511,023 1,796,004 3.44 _______________________________________________ ____________________________________________________________ __________________________________________________
Mexico America Movil SAB de CV—ADR USD 17,790 331,852 312,243 0.60Coca-Cola Femsa SAB de CV—ADR USD 2,300 174,469 260,006 0.50Grupo Mexico SAB de CV MXN 433,749 1,015,655 1,184,397 2.27
Total Mexico 1,521,976 1,756,646 3.37 _______________________________________________ ____________________________________________________________ __________________________________________________
102

STATE STREET GLOBAL ADVISORS LUXEMBOURG SICAV — SSGA EMERGING MARKETS SELECT EQUITY FUND
Schedule of Investments at December 31, 2012 (Expressed in Euro)
The accompanying notes are an integral part of these financial statements.
Currency Quantity Cost
MarketValue
% ofNet Assets
Transferable securities admitted to an official stock exchange listing or dealt in on another regulated market - (Continued)
Common and Preferred Stocks - (Continued)
Morocco Attijariwafa Bank MAD 3,162 105,158 88,736 0.17Douja Promotion Groupe Addoha SA MAD 27,318 174,542 154,307 0.30Maroc Telecom SA MAD 23,309 290,782 221,526 0.42
Total Morocco 570,482 464,569 0.89 _______________________________________________ ____________________________________________________________ __________________________________________________
Peru Cia de Minas Buenaventura SA—ADR USD 2,100 56,266 57,263 0.11Credicorp Ltd USD 6,983 609,698 776,265 1.49Volcan Cia Minera SAA PEN 252,614 231,095 194,421 0.37
Total Peru 897,059 1,027,949 1.97 _______________________________________________ ____________________________________________________________ __________________________________________________
Philippines Aboitiz Power Corp PHP 168,400 107,795 114,938 0.22Alliance Global Group Inc PHP 666,800 141,479 206,432 0.40DMCI Holdings Inc PHP 71,640 78,258 71,393 0.14Globe Telecom Inc PHP 11,190 229,197 225,715 0.43Philippine Long Distance Telephone Co—ADR USD 8,900 377,422 413,879 0.79SM Investments Corp PHP 7,790 74,280 126,915 0.24
Total Philippines 1,008,431 1,159,272 2.22 _______________________________________________ ____________________________________________________________ __________________________________________________
Poland KGHM Polska Miedz SA PLN 15,973 574,726 743,783 1.43Synthos SA PLN 63,026 84,256 83,565 0.16
Total Poland 658,982 827,348 1.59 _______________________________________________ ____________________________________________________________ __________________________________________________
Russia AK Transneft OAO—Preferred Stock USD 216 262,447 368,419 0.71Gazprom Neft OAO—ADR USD 4,668 84,501 82,072 0.16Gazprom OAO—ADR USD 131,100 1,255,196 940,690 1.80Lukoil OAO—ADR USD 27,196 1,199,433 1,392,392 2.67Rosneft OAO—GDR USD 54,528 254,280 368,511 0.71Sberbank of Russia USD 174,539 412,165 405,766 0.78Sberbank of Russia—ADR USD 48,167 442,753 449,374 0.86Uralkali OJSC—GDR USD 15,942 476,943 462,033 0.88
Total Russia 4,387,718 4,469,257 8.57 _______________________________________________ ____________________________________________________________ __________________________________________________
South Africa FirstRand Ltd ZAR 29,577 73,667 81,969 0.16Growthpoint Properties Ltd ZAR 90,756 175,594 198,780 0.38Imperial Holdings Ltd ZAR 25,880 408,961 459,906 0.88Kumba Iron Ore Ltd ZAR 13,758 704,926 699,693 1.34Liberty Holdings Ltd ZAR 31,163 272,718 309,712 0.60MTN Group Ltd ZAR 20,082 271,565 318,846 0.61Redefine Properties Ltd ZAR 650,604 532,761 546,734 1.05Reunert Ltd ZAR 36,598 250,633 246,531 0.47Sanlam Ltd ZAR 66,583 227,570 266,491 0.51Sasol Ltd ZAR 7,901 290,133 256,260 0.49Vodacom Group Ltd ZAR 50,542 462,903 560,281 1.08Woolworths Holdings Ltd ZAR 148,016 631,818 939,504 1.80
Total South Africa 4,303,249 4,884,707 9.37 _______________________________________________ ____________________________________________________________ __________________________________________________
103
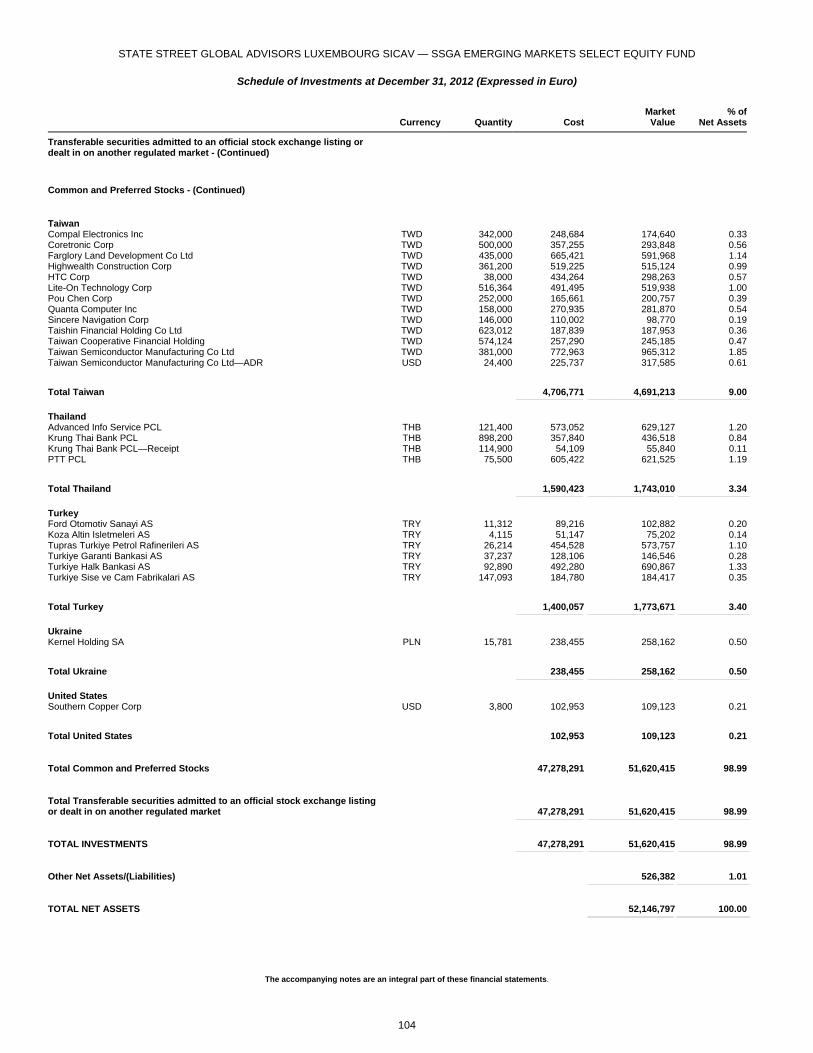
STATE STREET GLOBAL ADVISORS LUXEMBOURG SICAV — SSGA EMERGING MARKETS SELECT EQUITY FUND
Schedule of Investments at December 31, 2012 (Expressed in Euro)
The accompanying notes are an integral part of these financial statements.
Currency Quantity Cost
MarketValue
% ofNet Assets
Transferable securities admitted to an official stock exchange listing or dealt in on another regulated market - (Continued)
Common and Preferred Stocks - (Continued)
Taiwan Compal Electronics Inc TWD 342,000 248,684 174,640 0.33Coretronic Corp TWD 500,000 357,255 293,848 0.56Farglory Land Development Co Ltd TWD 435,000 665,421 591,968 1.14Highwealth Construction Corp TWD 361,200 519,225 515,124 0.99HTC Corp TWD 38,000 434,264 298,263 0.57Lite-On Technology Corp TWD 516,364 491,495 519,938 1.00Pou Chen Corp TWD 252,000 165,661 200,757 0.39Quanta Computer Inc TWD 158,000 270,935 281,870 0.54Sincere Navigation Corp TWD 146,000 110,002 98,770 0.19Taishin Financial Holding Co Ltd TWD 623,012 187,839 187,953 0.36Taiwan Cooperative Financial Holding TWD 574,124 257,290 245,185 0.47Taiwan Semiconductor Manufacturing Co Ltd TWD 381,000 772,963 965,312 1.85Taiwan Semiconductor Manufacturing Co Ltd—ADR USD 24,400 225,737 317,585 0.61
Total Taiwan 4,706,771 4,691,213 9.00 _______________________________________________ ____________________________________________________________ __________________________________________________
Thailand Advanced Info Service PCL THB 121,400 573,052 629,127 1.20Krung Thai Bank PCL THB 898,200 357,840 436,518 0.84Krung Thai Bank PCL—Receipt THB 114,900 54,109 55,840 0.11PTT PCL THB 75,500 605,422 621,525 1.19
Total Thailand 1,590,423 1,743,010 3.34 _______________________________________________ ____________________________________________________________ __________________________________________________
Turkey Ford Otomotiv Sanayi AS TRY 11,312 89,216 102,882 0.20Koza Altin Isletmeleri AS TRY 4,115 51,147 75,202 0.14Tupras Turkiye Petrol Rafinerileri AS TRY 26,214 454,528 573,757 1.10Turkiye Garanti Bankasi AS TRY 37,237 128,106 146,546 0.28Turkiye Halk Bankasi AS TRY 92,890 492,280 690,867 1.33Turkiye Sise ve Cam Fabrikalari AS TRY 147,093 184,780 184,417 0.35
Total Turkey 1,400,057 1,773,671 3.40 _______________________________________________ ____________________________________________________________ __________________________________________________
Ukraine Kernel Holding SA PLN 15,781 238,455 258,162 0.50
Total Ukraine 238,455 258,162 0.50 _______________________________________________ ____________________________________________________________ __________________________________________________
United States Southern Copper Corp USD 3,800 102,953 109,123 0.21
Total United States 102,953 109,123 0.21 _______________________________________________ ____________________________________________________________ __________________________________________________
Total Common and Preferred Stocks 47,278,291 51,620,415 98.99 _______________________________________________ ____________________________________________________________ __________________________________________________
Total Transferable securities admitted to an official stock exchange listing or dealt in on another regulated market 47,278,291 51,620,415 98.99 _______________________________________________ ____________________________________________________________ __________________________________________________
TOTAL INVESTMENTS 47,278,291 51,620,415 98.99 _______________________________________________ ____________________________________________________________ __________________________________________________
Other Net Assets/(Liabilities) 526,382 1.01 ____________________________________________________________ ___________________________________________________
TOTAL NET ASSETS 52,146,797 100.00 ____________________________________________________________ ___________________________________________________
104
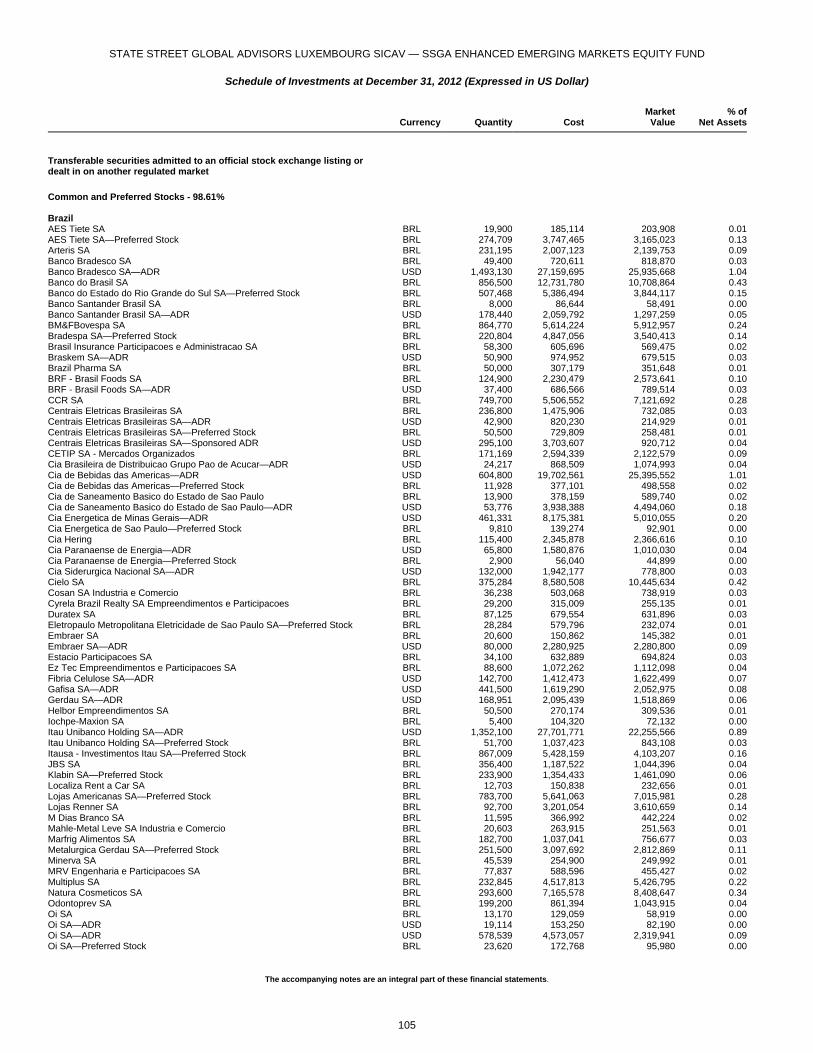
STATE STREET GLOBAL ADVISORS LUXEMBOURG SICAV — SSGA ENHANCED EMERGING MARKETS EQUITY FUND
Schedule of Investments at December 31, 2012 (Expressed in US Dollar)
The accompanying notes are an integral part of these financial statements.
Currency Quantity Cost
MarketValue
% ofNet Assets
Transferable securities admitted to an official stock exchange listing or dealt in on another regulated market
Common and Preferred Stocks - 98.61% Brazil AES Tiete SA BRL 19,900 185,114 203,908 0.01AES Tiete SA—Preferred Stock BRL 274,709 3,747,465 3,165,023 0.13Arteris SA BRL 231,195 2,007,123 2,139,753 0.09Banco Bradesco SA BRL 49,400 720,611 818,870 0.03Banco Bradesco SA—ADR USD 1,493,130 27,159,695 25,935,668 1.04Banco do Brasil SA BRL 856,500 12,731,780 10,708,864 0.43Banco do Estado do Rio Grande do Sul SA—Preferred Stock BRL 507,468 5,386,494 3,844,117 0.15Banco Santander Brasil SA BRL 8,000 86,644 58,491 0.00Banco Santander Brasil SA—ADR USD 178,440 2,059,792 1,297,259 0.05BM&FBovespa SA BRL 864,770 5,614,224 5,912,957 0.24Bradespa SA—Preferred Stock BRL 220,804 4,847,056 3,540,413 0.14Brasil Insurance Participacoes e Administracao SA BRL 58,300 605,696 569,475 0.02Braskem SA—ADR USD 50,900 974,952 679,515 0.03Brazil Pharma SA BRL 50,000 307,179 351,648 0.01BRF - Brasil Foods SA BRL 124,900 2,230,479 2,573,641 0.10BRF - Brasil Foods SA—ADR USD 37,400 686,566 789,514 0.03CCR SA BRL 749,700 5,506,552 7,121,692 0.28Centrais Eletricas Brasileiras SA BRL 236,800 1,475,906 732,085 0.03Centrais Eletricas Brasileiras SA—ADR USD 42,900 820,230 214,929 0.01Centrais Eletricas Brasileiras SA—Preferred Stock BRL 50,500 729,809 258,481 0.01Centrais Eletricas Brasileiras SA—Sponsored ADR USD 295,100 3,703,607 920,712 0.04CETIP SA - Mercados Organizados BRL 171,169 2,594,339 2,122,579 0.09Cia Brasileira de Distribuicao Grupo Pao de Acucar—ADR USD 24,217 868,509 1,074,993 0.04Cia de Bebidas das Americas—ADR USD 604,800 19,702,561 25,395,552 1.01Cia de Bebidas das Americas—Preferred Stock BRL 11,928 377,101 498,558 0.02Cia de Saneamento Basico do Estado de Sao Paulo BRL 13,900 378,159 589,740 0.02Cia de Saneamento Basico do Estado de Sao Paulo—ADR USD 53,776 3,938,388 4,494,060 0.18Cia Energetica de Minas Gerais—ADR USD 461,331 8,175,381 5,010,055 0.20Cia Energetica de Sao Paulo—Preferred Stock BRL 9,810 139,274 92,901 0.00Cia Hering BRL 115,400 2,345,878 2,366,616 0.10Cia Paranaense de Energia—ADR USD 65,800 1,580,876 1,010,030 0.04Cia Paranaense de Energia—Preferred Stock BRL 2,900 56,040 44,899 0.00Cia Siderurgica Nacional SA—ADR USD 132,000 1,942,177 778,800 0.03Cielo SA BRL 375,284 8,580,508 10,445,634 0.42Cosan SA Industria e Comercio BRL 36,238 503,068 738,919 0.03Cyrela Brazil Realty SA Empreendimentos e Participacoes BRL 29,200 315,009 255,135 0.01Duratex SA BRL 87,125 679,554 631,896 0.03Eletropaulo Metropolitana Eletricidade de Sao Paulo SA—Preferred Stock BRL 28,284 579,796 232,074 0.01Embraer SA BRL 20,600 150,862 145,382 0.01Embraer SA—ADR USD 80,000 2,280,925 2,280,800 0.09Estacio Participacoes SA BRL 34,100 632,889 694,824 0.03Ez Tec Empreendimentos e Participacoes SA BRL 88,600 1,072,262 1,112,098 0.04Fibria Celulose SA—ADR USD 142,700 1,412,473 1,622,499 0.07Gafisa SA—ADR USD 441,500 1,619,290 2,052,975 0.08Gerdau SA—ADR USD 168,951 2,095,439 1,518,869 0.06Helbor Empreendimentos SA BRL 50,500 270,174 309,536 0.01Iochpe-Maxion SA BRL 5,400 104,320 72,132 0.00Itau Unibanco Holding SA—ADR USD 1,352,100 27,701,771 22,255,566 0.89Itau Unibanco Holding SA—Preferred Stock BRL 51,700 1,037,423 843,108 0.03Itausa - Investimentos Itau SA—Preferred Stock BRL 867,009 5,428,159 4,103,207 0.16JBS SA BRL 356,400 1,187,522 1,044,396 0.04Klabin SA—Preferred Stock BRL 233,900 1,354,433 1,461,090 0.06Localiza Rent a Car SA BRL 12,703 150,838 232,656 0.01Lojas Americanas SA—Preferred Stock BRL 783,700 5,641,063 7,015,981 0.28Lojas Renner SA BRL 92,700 3,201,054 3,610,659 0.14M Dias Branco SA BRL 11,595 366,992 442,224 0.02Mahle-Metal Leve SA Industria e Comercio BRL 20,603 263,915 251,563 0.01Marfrig Alimentos SA BRL 182,700 1,037,041 756,677 0.03Metalurgica Gerdau SA—Preferred Stock BRL 251,500 3,097,692 2,812,869 0.11Minerva SA BRL 45,539 254,900 249,992 0.01MRV Engenharia e Participacoes SA BRL 77,837 588,596 455,427 0.02Multiplus SA BRL 232,845 4,517,813 5,426,795 0.22Natura Cosmeticos SA BRL 293,600 7,165,578 8,408,647 0.34Odontoprev SA BRL 199,200 861,394 1,043,915 0.04Oi SA BRL 13,170 129,059 58,919 0.00Oi SA—ADR USD 19,114 153,250 82,190 0.00Oi SA—ADR USD 578,539 4,573,057 2,319,941 0.09Oi SA—Preferred Stock BRL 23,620 172,768 95,980 0.00
105

STATE STREET GLOBAL ADVISORS LUXEMBOURG SICAV — SSGA ENHANCED EMERGING MARKETS EQUITY FUND
Schedule of Investments at December 31, 2012 (Expressed in US Dollar)
The accompanying notes are an integral part of these financial statements.
Currency Quantity Cost
MarketValue
% ofNet Assets
Transferable securities admitted to an official stock exchange listing or dealt in on another regulated market - (Continued)
Common and Preferred Stocks - (Continued)
Brazil - (Continued) OSX Brasil SA BRL 32,975 390,923 171,518 0.01PDG Realty SA Empreendimentos e Participacoes BRL 194,224 1,079,424 313,984 0.01Petroleo Brasileiro SA—ADR USD 2,158,200 68,722,058 42,020,154 1.68Petroleo Brasileiro SA—Preferred Stock BRL 37,100 632,698 353,696 0.01Porto Seguro SA BRL 205,164 2,843,989 2,353,750 0.09SLC Agricola SA BRL 11,516 142,729 111,645 0.01Souza Cruz SA BRL 616,900 7,647,614 9,282,876 0.37Sul America SA BRL 99,252 850,544 858,003 0.03Tecnisa SA BRL 64 426 252 0.00Telefonica Brasil SA—ADR USD 353,726 8,993,652 8,510,648 0.34Totvs SA BRL 33,000 614,122 650,974 0.03Tractebel Energia SA BRL 9,200 120,088 149,851 0.01Usinas Siderurgicas de Minas Gerais SA—Preferred Stock BRL 43,400 234,470 271,316 0.01Vale SA—ADR USD 2,187,600 59,661,411 45,852,096 1.83Valid Solucoes e Servicos de Seguranca em Meios de Pagamento e Identificacao SA BRL 35,100 431,837 780,000 0.03
Total Brazil 365,232,529 312,081,136 12.45 _______________________________________________ ____________________________________________________________ __________________________________________________
Chile Administradora de Fondos de Pensiones Provida SA CLP 131,011 756,430 889,277 0.04AES Gener SA CLP 277,302 159,094 178,063 0.01Aguas Andinas SA CLP 1,108,847 680,191 786,776 0.03Banco de Chile CLP 468,775 63,168 69,406 0.00Banco de Chile CLP 10,475,963 1,459,797 1,693,264 0.07Banco de Credito e Inversiones CLP 25,727 1,489,767 1,770,263 0.07Banco Santander Chile—ADR USD 99,338 2,956,362 2,830,140 0.11CAP SA CLP 170,072 7,463,199 5,702,811 0.23Cencosud SA CLP 135,972 990,194 737,083 0.03Cia Cervecerias Unidas SA CLP 44,550 382,957 701,355 0.03Cia Cervecerias Unidas SA—ADR USD 40,380 1,009,831 1,277,219 0.05Embotelladora Andina SA—Preferred Stock CLP 61,644 392,323 387,747 0.02Empresa Nacional de Electricidad SA CLP 45,589 69,569 74,088 0.00Empresa Nacional de Electricidad SA—ADR USD 104,384 5,494,469 5,094,983 0.20Empresas CMPC SA CLP 369,059 1,584,827 1,362,697 0.05Enersis SA—ADR USD 75,162 1,529,786 1,369,452 0.06ENTEL Chile SA CLP 145,389 2,650,439 3,005,951 0.12Inversiones Aguas Metropolitanas SA CLP 57,772 103,795 116,417 0.00Latam Airlines Group SA—ADR USD 105,671 2,483,279 2,489,609 0.10Sigdo Koppers SA CLP 116,818 268,948 281,603 0.01Sociedad Matriz SAAM SA CLP 1,112,584 121,168 133,380 0.01Sociedad Quimica y Minera de Chile SA—ADR USD 147,554 8,428,477 8,505,012 0.34Socovesa SA CLP 184,334 93,113 87,355 0.00
Total Chile 40,631,183 39,543,951 1.58 _______________________________________________ ____________________________________________________________ __________________________________________________
China AAC Technologies Holdings Inc HKD 258,000 803,147 902,069 0.04Agile Property Holdings Ltd HKD 1,145,900 1,653,080 1,611,476 0.06Agricultural Bank of China Ltd HKD 25,326,000 12,451,007 12,514,573 0.50Air China Ltd HKD 1,190,600 1,189,389 1,006,139 0.04Anhui Conch Cement Co Ltd HKD 329,000 1,183,211 1,197,004 0.05Anhui Expressway Co HKD 458,000 387,152 259,406 0.01Bank of China Ltd HKD 61,545,800 27,635,302 27,474,208 1.10Bank of Communications Co Ltd HKD 2,324,300 1,981,987 1,751,280 0.07BBMG Corp HKD 1,899,300 2,526,024 1,725,110 0.07Beijing Capital International Airport Co Ltd HKD 2,178,000 1,169,156 1,559,558 0.06Beijing Capital Land Ltd HKD 492,000 118,977 204,396 0.01Biostime International Holdings Ltd HKD 182,000 474,113 568,247 0.02Chaowei Power Holdings Ltd HKD 1,178,000 571,055 609,453 0.02China BlueChemical Ltd HKD 196,000 131,057 131,495 0.01China Citic Bank Corp Ltd HKD 13,782,520 8,373,353 8,179,695 0.33China Communications Construction Co Ltd HKD 6,802,200 5,928,110 6,564,500 0.26China Communications Services Corp Ltd HKD 754,000 464,184 435,813 0.02China Construction Bank Corp HKD 50,205,070 40,297,537 40,289,199 1.61
106

STATE STREET GLOBAL ADVISORS LUXEMBOURG SICAV — SSGA ENHANCED EMERGING MARKETS EQUITY FUND
Schedule of Investments at December 31, 2012 (Expressed in US Dollar)
The accompanying notes are an integral part of these financial statements.
Currency Quantity Cost
MarketValue
% ofNet Assets
Transferable securities admitted to an official stock exchange listing or dealt in on another regulated market - (Continued)
Common and Preferred Stocks - (Continued)
China - (Continued) China Eastern Airlines Corp Ltd HKD 9,492,000 4,132,834 3,784,137 0.15China Liansu Group Holdings Ltd HKD 3,908,000 2,816,458 2,677,317 0.11China Life Insurance Co Ltd HKD 4,381,000 14,430,693 14,300,277 0.57China Lilang Ltd HKD 115,000 137,365 68,102 0.00China Merchants Bank Co Ltd HKD 4,295,200 8,977,867 9,476,112 0.38China Minsheng Banking Corp Ltd HKD 8,665,900 7,839,992 10,017,800 0.40China National Building Material Co Ltd HKD 4,252,600 6,074,087 6,221,832 0.25China Oilfield Services Ltd HKD 386,000 508,022 795,820 0.03China Petroleum & Chemical Corp HKD 16,212,000 16,450,665 18,364,613 0.73China Railway Construction Corp Ltd HKD 2,715,700 2,675,084 3,086,799 0.12China Railway Group Ltd HKD 1,194,000 458,350 697,836 0.03China Shanshui Cement Group Ltd HKD 4,480,000 4,209,301 3,277,266 0.13China Shenhua Energy Co Ltd HKD 3,180,500 13,728,823 13,931,114 0.56China Shipping Container Lines Co Ltd HKD 1,514,000 614,395 435,593 0.02China Southern Airlines Co Ltd HKD 2,780,000 1,533,860 1,402,401 0.06China Telecom Corp Ltd HKD 2,048,000 1,134,900 1,138,827 0.05China Vanke Co Ltd HKD 1,478,815 1,815,582 2,384,924 0.10Chongqing Rural Commercial Bank HKD 3,866,000 1,587,071 2,114,844 0.08CNOOC Ltd HKD 14,131,000 30,180,048 30,592,539 1.22Country Garden Holdings Co Ltd HKD 1,433,082 509,191 750,668 0.03Datang International Power Generation Co Ltd HKD 1,164,000 402,191 444,524 0.02Dongfeng Motor Group Co Ltd HKD 1,398,000 2,445,592 2,157,193 0.09ENN Energy Holdings Ltd HKD 246,000 830,567 1,071,173 0.04Evergrande Real Estate Group Ltd HKD 11,448,935 6,157,352 6,277,760 0.25Great Wall Motor Co Ltd HKD 386,000 642,188 1,217,634 0.05Greentown China Holdings Ltd HKD 974,500 925,050 1,785,340 0.07Guangshen Railway Co Ltd HKD 3,894,000 1,531,355 1,547,381 0.06Guangzhou R&F Properties Co Ltd HKD 2,343,600 3,098,466 3,900,532 0.16Haitian International Holdings Ltd HKD 220,000 206,956 262,552 0.01Harbin Electric Co Ltd HKD 110,000 113,984 94,519 0.00Huadian Power International Co HKD 928,000 218,890 325,662 0.01Huaneng Power International Inc HKD 4,032,000 2,942,918 3,729,841 0.15Hunan Nonferrous Metal Corp Ltd HKD 468,000 140,866 181,141 0.01Industrial & Commercial Bank of China Ltd HKD 47,492,000 34,669,293 33,700,304 1.34Inner Mongolia Yitai Coal Co Ltd USD 19,000 110,061 108,091 0.00Jiangsu Expressway Co Ltd HKD 902,000 950,137 929,831 0.04Jiangsu Future Land Co Ltd USD 260,102 162,285 221,087 0.01Jiangxi Copper Co Ltd HKD 221,000 565,914 581,665 0.02Kingsoft Corp Ltd HKD 318,000 186,450 224,012 0.01Lenovo Group Ltd HKD 7,392,000 5,695,420 6,694,987 0.27Lianhua Supermarket Holdings Co Ltd HKD 624,800 1,479,208 598,130 0.02Metallurgical Corp of China Ltd HKD 2,137,000 921,014 416,325 0.02MIE Holdings Corp HKD 3,996,000 1,328,919 1,252,802 0.05NetEase Inc—ADR USD 29,000 1,268,669 1,233,950 0.05PetroChina Co Ltd HKD 13,870,000 18,901,350 19,648,503 0.78PICC Property & Casualty Co Ltd HKD 5,362,000 7,046,474 7,512,895 0.30Ping An Insurance Group Co of China Ltd HKD 538,000 4,893,239 4,504,822 0.18Real Gold Mining Ltd HKD 1,256,500 2,040,034 359,076 0.01Renhe Commercial Holdings Co Ltd HKD 9,812,000 1,577,219 1,025,400 0.04Shandong Chenming Paper Holdings Ltd "H" HKD 30,500 25,501 11,923 0.00Shenguan Holdings Group Ltd HKD 1,292,000 739,646 698,437 0.03Shenzhen Expressway Co Ltd HKD 164,000 95,254 63,265 0.00Shenzhou International Group Holdings Ltd HKD 237,000 422,421 535,103 0.02Sino-Ocean Land Holdings Ltd HKD 489,447 328,149 365,624 0.01Sinotrans Ltd HKD 572,000 148,102 92,248 0.00SOHO China Ltd HKD 39,800 20,791 31,939 0.00Sunac China Holdings Ltd HKD 2,785,000 1,204,222 2,155,893 0.09Tech Pro Technology Development Ltd HKD 576,000 224,334 211,053 0.01Tencent Holdings Ltd HKD 809,900 20,549,456 26,018,450 1.04Trony Solar Holding Co Ltd HKD 639,000 327,207 0.00 0.00Want Want China Holdings Ltd HKD 4,722,000 5,223,668 6,506,507 0.26Weichai Power Co Ltd HKD 393,600 1,883,359 1,746,884 0.07Wumart Stores Inc HKD 223,700 502,916 481,407 0.02Yangzijiang Shipbuilding Holdings Ltd SGD 2,815,000 2,186,319 2,212,362 0.09Yantai Changyu Pioneer Wine Co Ltd HKD 20,800 181,874 122,586 0.00Yuanda China Holdings Ltd HKD 1,986,000 274,291 235,732 0.01Zhaojin Mining Industry Co Ltd HKD 843,600 1,686,809 1,316,960 0.05Zhuzhou CSR Times Electric Co Ltd HKD 362,000 1,377,356 1,340,421 0.05
107

STATE STREET GLOBAL ADVISORS LUXEMBOURG SICAV — SSGA ENHANCED EMERGING MARKETS EQUITY FUND
Schedule of Investments at December 31, 2012 (Expressed in US Dollar)
The accompanying notes are an integral part of these financial statements.
Currency Quantity Cost
MarketValue
% ofNet Assets
Transferable securities admitted to an official stock exchange listing or dealt in on another regulated market - (Continued)
Common and Preferred Stocks - (Continued)
China - (Continued) Zijin Mining Group Co Ltd HKD 3,451,000 1,620,395 1,357,987 0.05Zoomlion Heavy Industry Science and Technology Co Ltd HKD 151,840 281,319 223,719 0.01
Total China 367,907,879 380,238,074 15.17 _______________________________________________ ____________________________________________________________ __________________________________________________
Columbia Almacenes Exito SA COP 33,994 536,428 682,958 0.03Bancolombia SA—ADR USD 165,740 10,066,728 11,034,969 0.44Cementos Argos SA COP 114,319 507,065 653,436 0.02Corp Financiera Colombiana SA COP 13,688 256,861 282,591 0.01Ecopetrol SA COP 4,696,806 11,258,102 14,513,051 0.58Ecopetrol SA—ADR USD 6,998 387,331 417,571 0.02Grupo Argos SA COP 18,639 170,341 221,516 0.01Grupo de Inversiones Suramericana SA COP 55,813 1,049,466 1,200,280 0.05Grupo Nutresa SA COP 28,819 383,776 414,589 0.01Isagen SA ESP COP 155,977 209,244 221,122 0.01
Total Columbia 24,825,342 29,642,083 1.18 _______________________________________________ ____________________________________________________________ __________________________________________________
Czech Republic CEZ AS CZK 232,544 10,219,137 8,307,390 0.33Komercni Banka AS CZK 15,251 3,265,591 3,212,871 0.13Pegas Nonwovens SA CZK 3,290 77,986 85,210 0.00Philip Morris CR AS CZK 158 98,108 88,816 0.01
Total Czech Republic 13,660,822 11,694,287 0.47 _______________________________________________ ____________________________________________________________ __________________________________________________
Egypt Alexandria Mineral Oils Co EGP 6,764 102,030 77,786 0.00Commercial International Bank Egypt SAE EGP 72,029 309,377 391,249 0.02Egyptian Financial Group-Hermes Holding EGP 5,553 26,757 9,606 0.00Egyptian Kuwaiti Holding Co SAE USD 39,623 53,321 50,718 0.00National Societe Generale Bank SAE EGP 48,086 288,319 266,030 0.01Orascom Construction Industries EGP 48,390 1,985,254 1,918,766 0.08Orascom Telecom Holding SAE EGP 1,309,973 815,701 817,144 0.03Orascom Telecom Media And Technology Holding SAE EGP 688,092 160,375 59,464 0.00Sidi Kerir Petrochemcials Co EGP 76,889 175,948 160,076 0.01Talaat Moustafa Group EGP 1,539,168 1,189,188 1,071,361 0.04
Total Egypt 5,106,270 4,822,200 0.19 _______________________________________________ ____________________________________________________________ __________________________________________________
Hong Kong 361 Degrees International Ltd HKD 1,428,200 1,082,238 409,065 0.02Anxin-China Holdings Ltd HKD 4,888,000 1,006,137 1,198,217 0.05Apollo Solar Energy Technology Holdings Ltd HKD 9,540,000 380,295 430,791 0.02Asian Citrus Holdings Ltd HKD 251,000 163,553 119,171 0.00Beijing Enterprises Holdings Ltd HKD 67,500 389,169 439,790 0.02Belle International Holdings Ltd HKD 462,000 868,570 1,002,579 0.04China Agri-Industries Holdings Ltd HKD 342,600 407,466 191,835 0.01China Everbright Ltd HKD 430,000 968,213 828,838 0.03China Lumena New Materials Corp HKD 6,817,700 2,591,794 1,477,739 0.06China Metal Recycling Holdings Ltd HKD 1,608,600 1,626,967 1,664,459 0.07China Mobile Ltd HKD 3,879,000 38,419,926 45,166,627 1.80China Ocean Resources Co Ltd KRW 99,830 690,575 230,325 0.01China Overseas Grand Oceans Group Ltd HKD 309,000 321,916 371,557 0.01China Overseas Land & Investment Ltd HKD 1,310,000 2,743,994 3,904,217 0.16China Power International Development Ltd HKD 1,056,000 283,137 335,158 0.01China Resources Gas Group Ltd HKD 626,000 876,474 1,292,245 0.05China Resources Power Holdings Co Ltd HKD 694,000 1,522,944 1,771,073 0.07China State Construction International Holdings Ltd HKD 1,872,800 1,729,901 2,247,114 0.09China Unicom Hong Kong Ltd HKD 1,436,000 2,641,316 2,301,053 0.09Citic Pacific Ltd HKD 431,000 1,066,716 642,815 0.03Citic Resources Holdings Ltd HKD 1,814,000 266,519 278,506 0.01
108
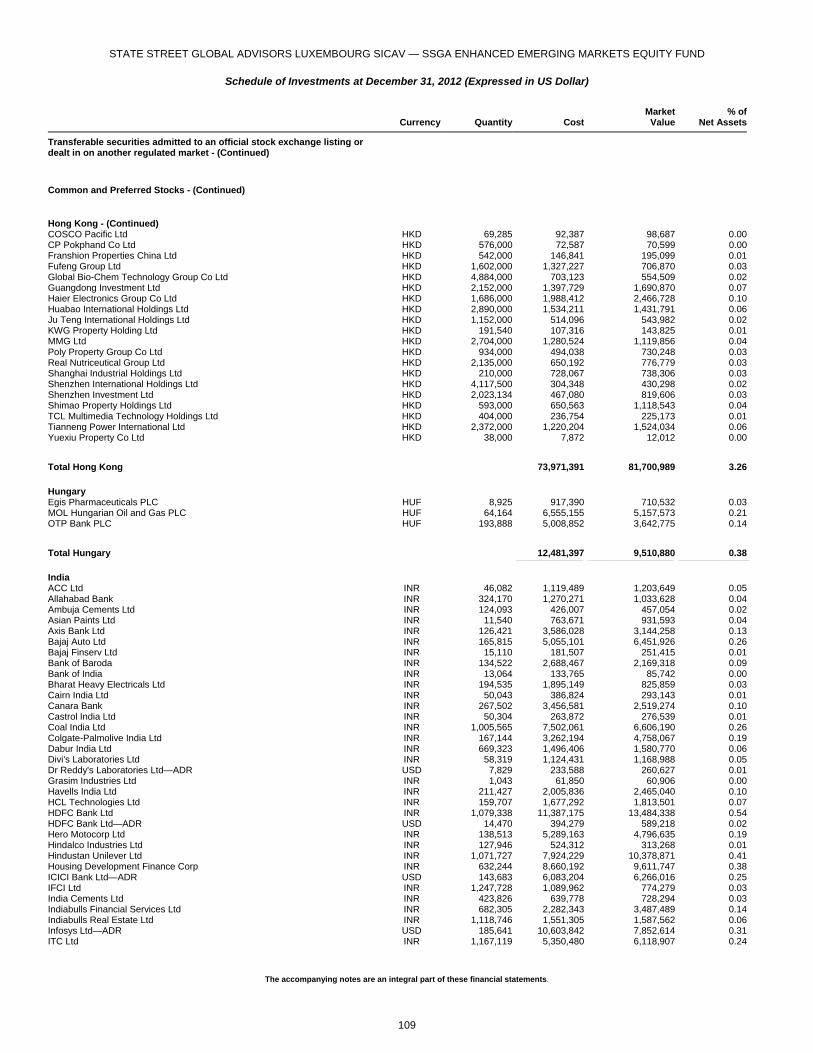
STATE STREET GLOBAL ADVISORS LUXEMBOURG SICAV — SSGA ENHANCED EMERGING MARKETS EQUITY FUND
Schedule of Investments at December 31, 2012 (Expressed in US Dollar)
The accompanying notes are an integral part of these financial statements.
Currency Quantity Cost
MarketValue
% ofNet Assets
Transferable securities admitted to an official stock exchange listing or dealt in on another regulated market - (Continued)
Common and Preferred Stocks - (Continued)
Hong Kong - (Continued) COSCO Pacific Ltd HKD 69,285 92,387 98,687 0.00CP Pokphand Co Ltd HKD 576,000 72,587 70,599 0.00Franshion Properties China Ltd HKD 542,000 146,841 195,099 0.01Fufeng Group Ltd HKD 1,602,000 1,327,227 706,870 0.03Global Bio-Chem Technology Group Co Ltd HKD 4,884,000 703,123 554,509 0.02Guangdong Investment Ltd HKD 2,152,000 1,397,729 1,690,870 0.07Haier Electronics Group Co Ltd HKD 1,686,000 1,988,412 2,466,728 0.10Huabao International Holdings Ltd HKD 2,890,000 1,534,211 1,431,791 0.06Ju Teng International Holdings Ltd HKD 1,152,000 514,096 543,982 0.02KWG Property Holding Ltd HKD 191,540 107,316 143,825 0.01MMG Ltd HKD 2,704,000 1,280,524 1,119,856 0.04Poly Property Group Co Ltd HKD 934,000 494,038 730,248 0.03Real Nutriceutical Group Ltd HKD 2,135,000 650,192 776,779 0.03Shanghai Industrial Holdings Ltd HKD 210,000 728,067 738,306 0.03Shenzhen International Holdings Ltd HKD 4,117,500 304,348 430,298 0.02Shenzhen Investment Ltd HKD 2,023,134 467,080 819,606 0.03Shimao Property Holdings Ltd HKD 593,000 650,563 1,118,543 0.04TCL Multimedia Technology Holdings Ltd HKD 404,000 236,754 225,173 0.01Tianneng Power International Ltd HKD 2,372,000 1,220,204 1,524,034 0.06Yuexiu Property Co Ltd HKD 38,000 7,872 12,012 0.00
Total Hong Kong 73,971,391 81,700,989 3.26 _______________________________________________ ____________________________________________________________ __________________________________________________
Hungary Egis Pharmaceuticals PLC HUF 8,925 917,390 710,532 0.03MOL Hungarian Oil and Gas PLC HUF 64,164 6,555,155 5,157,573 0.21OTP Bank PLC HUF 193,888 5,008,852 3,642,775 0.14
Total Hungary 12,481,397 9,510,880 0.38 _______________________________________________ ____________________________________________________________ __________________________________________________
India ACC Ltd INR 46,082 1,119,489 1,203,649 0.05Allahabad Bank INR 324,170 1,270,271 1,033,628 0.04Ambuja Cements Ltd INR 124,093 426,007 457,054 0.02Asian Paints Ltd INR 11,540 763,671 931,593 0.04Axis Bank Ltd INR 126,421 3,586,028 3,144,258 0.13Bajaj Auto Ltd INR 165,815 5,055,101 6,451,926 0.26Bajaj Finserv Ltd INR 15,110 181,507 251,415 0.01Bank of Baroda INR 134,522 2,688,467 2,169,318 0.09Bank of India INR 13,064 133,765 85,742 0.00Bharat Heavy Electricals Ltd INR 194,535 1,895,149 825,859 0.03Cairn India Ltd INR 50,043 386,824 293,143 0.01Canara Bank INR 267,502 3,456,581 2,519,274 0.10Castrol India Ltd INR 50,304 263,872 276,539 0.01Coal India Ltd INR 1,005,565 7,502,061 6,606,190 0.26Colgate-Palmolive India Ltd INR 167,144 3,262,194 4,758,067 0.19Dabur India Ltd INR 669,323 1,496,406 1,580,770 0.06Divi's Laboratories Ltd INR 58,319 1,124,431 1,168,988 0.05Dr Reddy's Laboratories Ltd—ADR USD 7,829 233,588 260,627 0.01Grasim Industries Ltd INR 1,043 61,850 60,906 0.00Havells India Ltd INR 211,427 2,005,836 2,465,040 0.10HCL Technologies Ltd INR 159,707 1,677,292 1,813,501 0.07HDFC Bank Ltd INR 1,079,338 11,387,175 13,484,338 0.54HDFC Bank Ltd—ADR USD 14,470 394,279 589,218 0.02Hero Motocorp Ltd INR 138,513 5,289,163 4,796,635 0.19Hindalco Industries Ltd INR 127,946 524,312 313,268 0.01Hindustan Unilever Ltd INR 1,071,727 7,924,229 10,378,871 0.41Housing Development Finance Corp INR 632,244 8,660,192 9,611,747 0.38ICICI Bank Ltd—ADR USD 143,683 6,083,204 6,266,016 0.25IFCI Ltd INR 1,247,728 1,089,962 774,279 0.03India Cements Ltd INR 423,826 639,778 728,294 0.03Indiabulls Financial Services Ltd INR 682,305 2,282,343 3,487,489 0.14Indiabulls Real Estate Ltd INR 1,118,746 1,551,305 1,587,562 0.06Infosys Ltd—ADR USD 185,641 10,603,842 7,852,614 0.31ITC Ltd INR 1,167,119 5,350,480 6,118,907 0.24
109
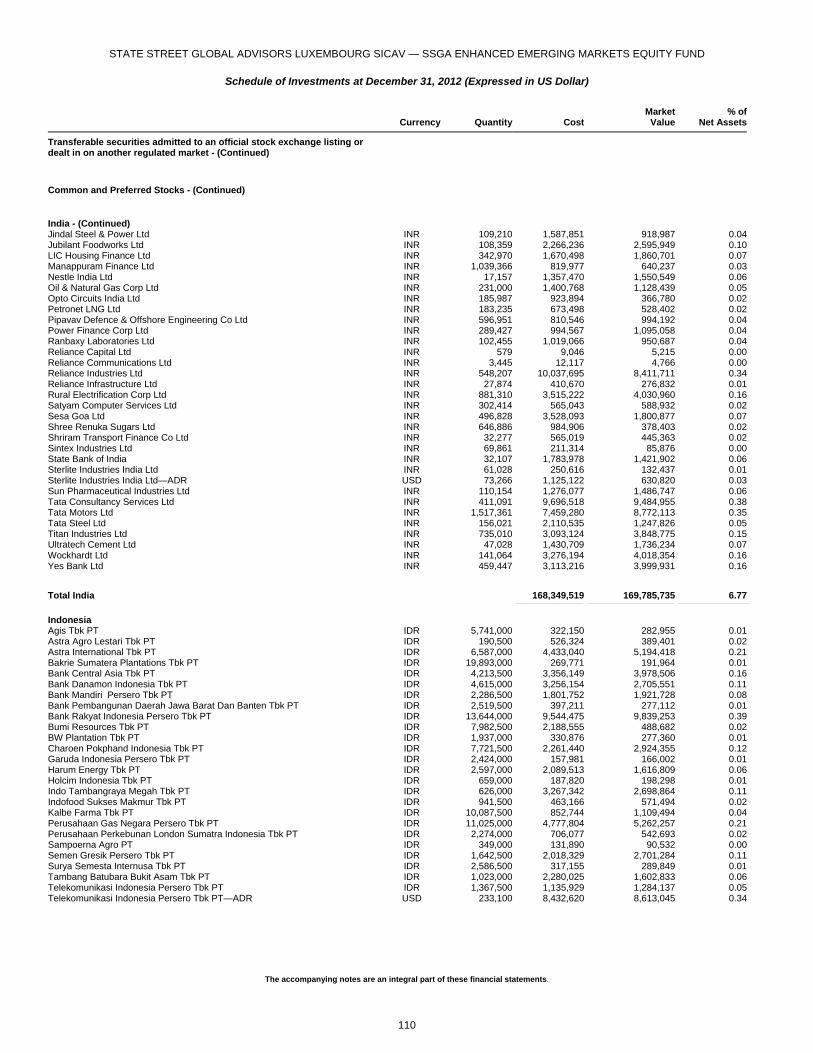
STATE STREET GLOBAL ADVISORS LUXEMBOURG SICAV — SSGA ENHANCED EMERGING MARKETS EQUITY FUND
Schedule of Investments at December 31, 2012 (Expressed in US Dollar)
The accompanying notes are an integral part of these financial statements.
Currency Quantity Cost
MarketValue
% ofNet Assets
Transferable securities admitted to an official stock exchange listing or dealt in on another regulated market - (Continued)
Common and Preferred Stocks - (Continued)
India - (Continued) Jindal Steel & Power Ltd INR 109,210 1,587,851 918,987 0.04Jubilant Foodworks Ltd INR 108,359 2,266,236 2,595,949 0.10LIC Housing Finance Ltd INR 342,970 1,670,498 1,860,701 0.07Manappuram Finance Ltd INR 1,039,366 819,977 640,237 0.03Nestle India Ltd INR 17,157 1,357,470 1,550,549 0.06Oil & Natural Gas Corp Ltd INR 231,000 1,400,768 1,128,439 0.05Opto Circuits India Ltd INR 185,987 923,894 366,780 0.02Petronet LNG Ltd INR 183,235 673,498 528,402 0.02Pipavav Defence & Offshore Engineering Co Ltd INR 596,951 810,546 994,192 0.04Power Finance Corp Ltd INR 289,427 994,567 1,095,058 0.04Ranbaxy Laboratories Ltd INR 102,455 1,019,066 950,687 0.04Reliance Capital Ltd INR 579 9,046 5,215 0.00Reliance Communications Ltd INR 3,445 12,117 4,766 0.00Reliance Industries Ltd INR 548,207 10,037,695 8,411,711 0.34Reliance Infrastructure Ltd INR 27,874 410,670 276,832 0.01Rural Electrification Corp Ltd INR 881,310 3,515,222 4,030,960 0.16Satyam Computer Services Ltd INR 302,414 565,043 588,932 0.02Sesa Goa Ltd INR 496,828 3,528,093 1,800,877 0.07Shree Renuka Sugars Ltd INR 646,886 984,906 378,403 0.02Shriram Transport Finance Co Ltd INR 32,277 565,019 445,363 0.02Sintex Industries Ltd INR 69,861 211,314 85,876 0.00State Bank of India INR 32,107 1,783,978 1,421,902 0.06Sterlite Industries India Ltd INR 61,028 250,616 132,437 0.01Sterlite Industries India Ltd—ADR USD 73,266 1,125,122 630,820 0.03Sun Pharmaceutical Industries Ltd INR 110,154 1,276,077 1,486,747 0.06Tata Consultancy Services Ltd INR 411,091 9,696,518 9,484,955 0.38Tata Motors Ltd INR 1,517,361 7,459,280 8,772,113 0.35Tata Steel Ltd INR 156,021 2,110,535 1,247,826 0.05Titan Industries Ltd INR 735,010 3,093,124 3,848,775 0.15Ultratech Cement Ltd INR 47,028 1,430,709 1,736,234 0.07Wockhardt Ltd INR 141,064 3,276,194 4,018,354 0.16Yes Bank Ltd INR 459,447 3,113,216 3,999,931 0.16
Total India 168,349,519 169,785,735 6.77 _______________________________________________ ____________________________________________________________ __________________________________________________
Indonesia Agis Tbk PT IDR 5,741,000 322,150 282,955 0.01Astra Agro Lestari Tbk PT IDR 190,500 526,324 389,401 0.02Astra International Tbk PT IDR 6,587,000 4,433,040 5,194,418 0.21Bakrie Sumatera Plantations Tbk PT IDR 19,893,000 269,771 191,964 0.01Bank Central Asia Tbk PT IDR 4,213,500 3,356,149 3,978,506 0.16Bank Danamon Indonesia Tbk PT IDR 4,615,000 3,256,154 2,705,551 0.11Bank Mandiri Persero Tbk PT IDR 2,286,500 1,801,752 1,921,728 0.08Bank Pembangunan Daerah Jawa Barat Dan Banten Tbk PT IDR 2,519,500 397,211 277,112 0.01Bank Rakyat Indonesia Persero Tbk PT IDR 13,644,000 9,544,475 9,839,253 0.39Bumi Resources Tbk PT IDR 7,982,500 2,188,555 488,682 0.02BW Plantation Tbk PT IDR 1,937,000 330,876 277,360 0.01Charoen Pokphand Indonesia Tbk PT IDR 7,721,500 2,261,440 2,924,355 0.12Garuda Indonesia Persero Tbk PT IDR 2,424,000 157,981 166,002 0.01Harum Energy Tbk PT IDR 2,597,000 2,089,513 1,616,809 0.06Holcim Indonesia Tbk PT IDR 659,000 187,820 198,298 0.01Indo Tambangraya Megah Tbk PT IDR 626,000 3,267,342 2,698,864 0.11Indofood Sukses Makmur Tbk PT IDR 941,500 463,166 571,494 0.02Kalbe Farma Tbk PT IDR 10,087,500 852,744 1,109,494 0.04Perusahaan Gas Negara Persero Tbk PT IDR 11,025,000 4,777,804 5,262,257 0.21Perusahaan Perkebunan London Sumatra Indonesia Tbk PT IDR 2,274,000 706,077 542,693 0.02Sampoerna Agro PT IDR 349,000 131,890 90,532 0.00Semen Gresik Persero Tbk PT IDR 1,642,500 2,018,329 2,701,284 0.11Surya Semesta Internusa Tbk PT IDR 2,586,500 317,155 289,849 0.01Tambang Batubara Bukit Asam Tbk PT IDR 1,023,000 2,280,025 1,602,833 0.06Telekomunikasi Indonesia Persero Tbk PT IDR 1,367,500 1,135,929 1,284,137 0.05Telekomunikasi Indonesia Persero Tbk PT—ADR USD 233,100 8,432,620 8,613,045 0.34
110
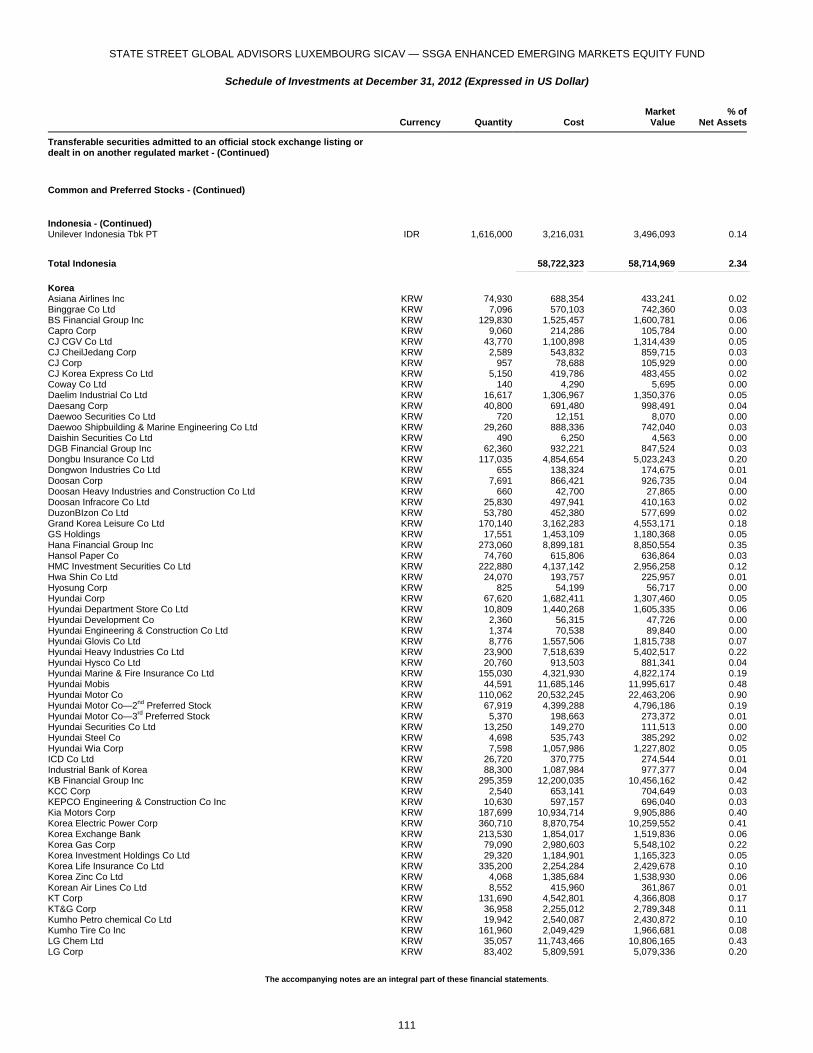
STATE STREET GLOBAL ADVISORS LUXEMBOURG SICAV — SSGA ENHANCED EMERGING MARKETS EQUITY FUND
Schedule of Investments at December 31, 2012 (Expressed in US Dollar)
The accompanying notes are an integral part of these financial statements.
Currency Quantity Cost
MarketValue
% ofNet Assets
Transferable securities admitted to an official stock exchange listing or dealt in on another regulated market - (Continued)
Common and Preferred Stocks - (Continued)
Indonesia - (Continued) Unilever Indonesia Tbk PT IDR 1,616,000 3,216,031 3,496,093 0.14
Total Indonesia 58,722,323 58,714,969 2.34 _______________________________________________ ____________________________________________________________ __________________________________________________
Korea Asiana Airlines Inc KRW 74,930 688,354 433,241 0.02Binggrae Co Ltd KRW 7,096 570,103 742,360 0.03BS Financial Group Inc KRW 129,830 1,525,457 1,600,781 0.06Capro Corp KRW 9,060 214,286 105,784 0.00CJ CGV Co Ltd KRW 43,770 1,100,898 1,314,439 0.05CJ CheilJedang Corp KRW 2,589 543,832 859,715 0.03CJ Corp KRW 957 78,688 105,929 0.00CJ Korea Express Co Ltd KRW 5,150 419,786 483,455 0.02Coway Co Ltd KRW 140 4,290 5,695 0.00Daelim Industrial Co Ltd KRW 16,617 1,306,967 1,350,376 0.05Daesang Corp KRW 40,800 691,480 998,491 0.04Daewoo Securities Co Ltd KRW 720 12,151 8,070 0.00Daewoo Shipbuilding & Marine Engineering Co Ltd KRW 29,260 888,336 742,040 0.03Daishin Securities Co Ltd KRW 490 6,250 4,563 0.00DGB Financial Group Inc KRW 62,360 932,221 847,524 0.03Dongbu Insurance Co Ltd KRW 117,035 4,854,654 5,023,243 0.20Dongwon Industries Co Ltd KRW 655 138,324 174,675 0.01Doosan Corp KRW 7,691 866,421 926,735 0.04Doosan Heavy Industries and Construction Co Ltd KRW 660 42,700 27,865 0.00Doosan Infracore Co Ltd KRW 25,830 497,941 410,163 0.02DuzonBIzon Co Ltd KRW 53,780 452,380 577,699 0.02Grand Korea Leisure Co Ltd KRW 170,140 3,162,283 4,553,171 0.18GS Holdings KRW 17,551 1,453,109 1,180,368 0.05Hana Financial Group Inc KRW 273,060 8,899,181 8,850,554 0.35Hansol Paper Co KRW 74,760 615,806 636,864 0.03HMC Investment Securities Co Ltd KRW 222,880 4,137,142 2,956,258 0.12Hwa Shin Co Ltd KRW 24,070 193,757 225,957 0.01Hyosung Corp KRW 825 54,199 56,717 0.00Hyundai Corp KRW 67,620 1,682,411 1,307,460 0.05Hyundai Department Store Co Ltd KRW 10,809 1,440,268 1,605,335 0.06Hyundai Development Co KRW 2,360 56,315 47,726 0.00Hyundai Engineering & Construction Co Ltd KRW 1,374 70,538 89,840 0.00Hyundai Glovis Co Ltd KRW 8,776 1,557,506 1,815,738 0.07Hyundai Heavy Industries Co Ltd KRW 23,900 7,518,639 5,402,517 0.22Hyundai Hysco Co Ltd KRW 20,760 913,503 881,341 0.04Hyundai Marine & Fire Insurance Co Ltd KRW 155,030 4,321,930 4,822,174 0.19Hyundai Mobis KRW 44,591 11,685,146 11,995,617 0.48Hyundai Motor Co KRW 110,062 20,532,245 22,463,206 0.90Hyundai Motor Co—2nd Preferred Stock KRW 67,919 4,399,288 4,796,186 0.19Hyundai Motor Co—3rd Preferred Stock KRW 5,370 198,663 273,372 0.01Hyundai Securities Co Ltd KRW 13,250 149,270 111,513 0.00Hyundai Steel Co KRW 4,698 535,743 385,292 0.02Hyundai Wia Corp KRW 7,598 1,057,986 1,227,802 0.05ICD Co Ltd KRW 26,720 370,775 274,544 0.01Industrial Bank of Korea KRW 88,300 1,087,984 977,377 0.04KB Financial Group Inc KRW 295,359 12,200,035 10,456,162 0.42KCC Corp KRW 2,540 653,141 704,649 0.03KEPCO Engineering & Construction Co Inc KRW 10,630 597,157 696,040 0.03Kia Motors Corp KRW 187,699 10,934,714 9,905,886 0.40Korea Electric Power Corp KRW 360,710 8,870,754 10,259,552 0.41Korea Exchange Bank KRW 213,530 1,854,017 1,519,836 0.06Korea Gas Corp KRW 79,090 2,980,603 5,548,102 0.22Korea Investment Holdings Co Ltd KRW 29,320 1,184,901 1,165,323 0.05Korea Life Insurance Co Ltd KRW 335,200 2,254,284 2,429,678 0.10Korea Zinc Co Ltd KRW 4,068 1,385,684 1,538,930 0.06Korean Air Lines Co Ltd KRW 8,552 415,960 361,867 0.01KT Corp KRW 131,690 4,542,801 4,366,808 0.17KT&G Corp KRW 36,958 2,255,012 2,789,348 0.11Kumho Petro chemical Co Ltd KRW 19,942 2,540,087 2,430,872 0.10Kumho Tire Co Inc KRW 161,960 2,049,429 1,966,681 0.08LG Chem Ltd KRW 35,057 11,743,466 10,806,165 0.43LG Corp KRW 83,402 5,809,591 5,079,336 0.20
111
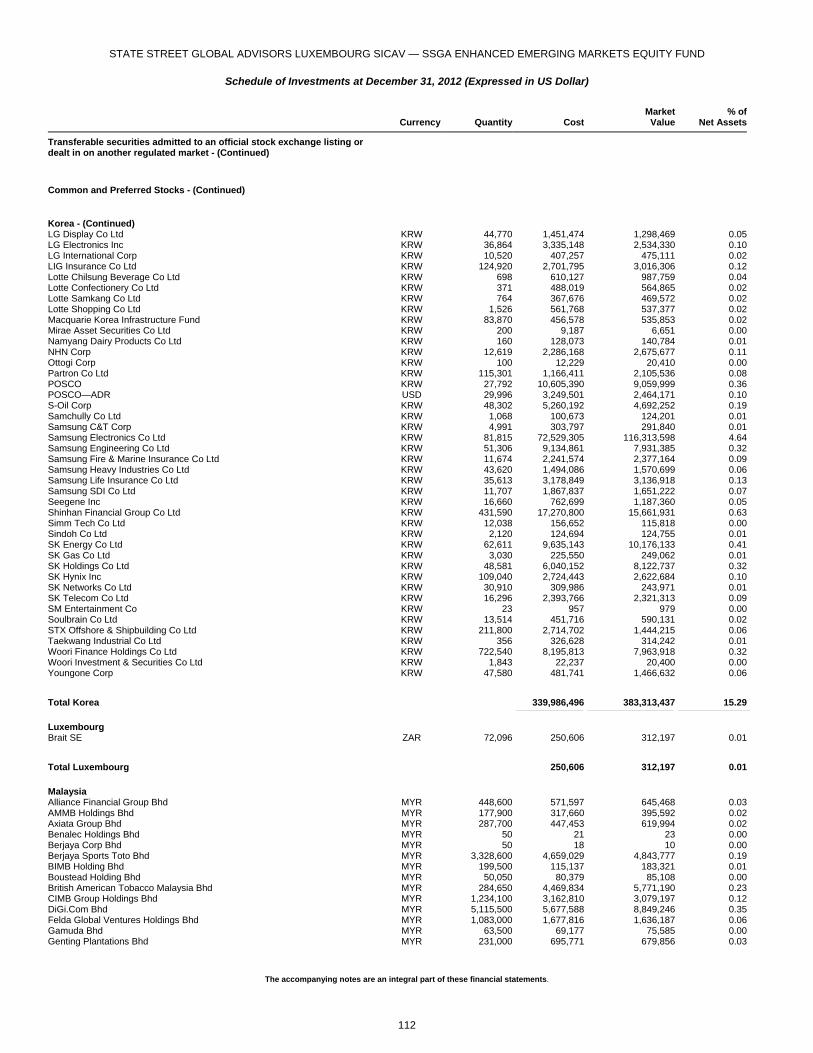
STATE STREET GLOBAL ADVISORS LUXEMBOURG SICAV — SSGA ENHANCED EMERGING MARKETS EQUITY FUND
Schedule of Investments at December 31, 2012 (Expressed in US Dollar)
The accompanying notes are an integral part of these financial statements.
Currency Quantity Cost
MarketValue
% ofNet Assets
Transferable securities admitted to an official stock exchange listing or dealt in on another regulated market - (Continued)
Common and Preferred Stocks - (Continued)
Korea - (Continued) LG Display Co Ltd KRW 44,770 1,451,474 1,298,469 0.05LG Electronics Inc KRW 36,864 3,335,148 2,534,330 0.10LG International Corp KRW 10,520 407,257 475,111 0.02LIG Insurance Co Ltd KRW 124,920 2,701,795 3,016,306 0.12Lotte Chilsung Beverage Co Ltd KRW 698 610,127 987,759 0.04Lotte Confectionery Co Ltd KRW 371 488,019 564,865 0.02Lotte Samkang Co Ltd KRW 764 367,676 469,572 0.02Lotte Shopping Co Ltd KRW 1,526 561,768 537,377 0.02Macquarie Korea Infrastructure Fund KRW 83,870 456,578 535,853 0.02Mirae Asset Securities Co Ltd KRW 200 9,187 6,651 0.00Namyang Dairy Products Co Ltd KRW 160 128,073 140,784 0.01NHN Corp KRW 12,619 2,286,168 2,675,677 0.11Ottogi Corp KRW 100 12,229 20,410 0.00Partron Co Ltd KRW 115,301 1,166,411 2,105,536 0.08POSCO KRW 27,792 10,605,390 9,059,999 0.36POSCO—ADR USD 29,996 3,249,501 2,464,171 0.10S-Oil Corp KRW 48,302 5,260,192 4,692,252 0.19Samchully Co Ltd KRW 1,068 100,673 124,201 0.01Samsung C&T Corp KRW 4,991 303,797 291,840 0.01Samsung Electronics Co Ltd KRW 81,815 72,529,305 116,313,598 4.64Samsung Engineering Co Ltd KRW 51,306 9,134,861 7,931,385 0.32Samsung Fire & Marine Insurance Co Ltd KRW 11,674 2,241,574 2,377,164 0.09Samsung Heavy Industries Co Ltd KRW 43,620 1,494,086 1,570,699 0.06Samsung Life Insurance Co Ltd KRW 35,613 3,178,849 3,136,918 0.13Samsung SDI Co Ltd KRW 11,707 1,867,837 1,651,222 0.07Seegene Inc KRW 16,660 762,699 1,187,360 0.05Shinhan Financial Group Co Ltd KRW 431,590 17,270,800 15,661,931 0.63Simm Tech Co Ltd KRW 12,038 156,652 115,818 0.00Sindoh Co Ltd KRW 2,120 124,694 124,755 0.01SK Energy Co Ltd KRW 62,611 9,635,143 10,176,133 0.41SK Gas Co Ltd KRW 3,030 225,550 249,062 0.01SK Holdings Co Ltd KRW 48,581 6,040,152 8,122,737 0.32SK Hynix Inc KRW 109,040 2,724,443 2,622,684 0.10SK Networks Co Ltd KRW 30,910 309,986 243,971 0.01SK Telecom Co Ltd KRW 16,296 2,393,766 2,321,313 0.09SM Entertainment Co KRW 23 957 979 0.00Soulbrain Co Ltd KRW 13,514 451,716 590,131 0.02STX Offshore & Shipbuilding Co Ltd KRW 211,800 2,714,702 1,444,215 0.06Taekwang Industrial Co Ltd KRW 356 326,628 314,242 0.01Woori Finance Holdings Co Ltd KRW 722,540 8,195,813 7,963,918 0.32Woori Investment & Securities Co Ltd KRW 1,843 22,237 20,400 0.00Youngone Corp KRW 47,580 481,741 1,466,632 0.06
Total Korea 339,986,496 383,313,437 15.29 _______________________________________________ ____________________________________________________________ __________________________________________________
Luxembourg Brait SE ZAR 72,096 250,606 312,197 0.01
Total Luxembourg 250,606 312,197 0.01 _______________________________________________ ____________________________________________________________ __________________________________________________
Malaysia Alliance Financial Group Bhd MYR 448,600 571,597 645,468 0.03AMMB Holdings Bhd MYR 177,900 317,660 395,592 0.02Axiata Group Bhd MYR 287,700 447,453 619,994 0.02Benalec Holdings Bhd MYR 50 21 23 0.00Berjaya Corp Bhd MYR 50 18 10 0.00Berjaya Sports Toto Bhd MYR 3,328,600 4,659,029 4,843,777 0.19BIMB Holding Bhd MYR 199,500 115,137 183,321 0.01Boustead Holding Bhd MYR 50,050 80,379 85,108 0.00British American Tobacco Malaysia Bhd MYR 284,650 4,469,834 5,771,190 0.23CIMB Group Holdings Bhd MYR 1,234,100 3,162,810 3,079,197 0.12DiGi.Com Bhd MYR 5,115,500 5,677,588 8,849,246 0.35Felda Global Ventures Holdings Bhd MYR 1,083,000 1,677,816 1,636,187 0.06Gamuda Bhd MYR 63,500 69,177 75,585 0.00Genting Plantations Bhd MYR 231,000 695,771 679,856 0.03
112
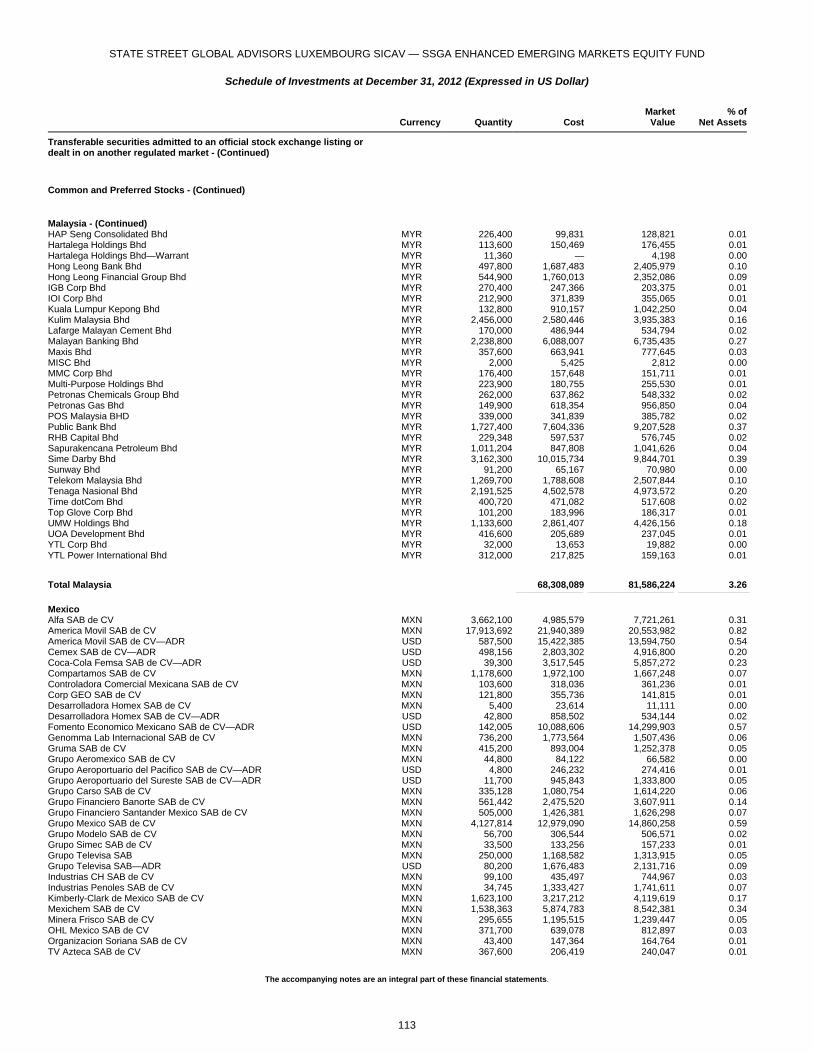
STATE STREET GLOBAL ADVISORS LUXEMBOURG SICAV — SSGA ENHANCED EMERGING MARKETS EQUITY FUND
Schedule of Investments at December 31, 2012 (Expressed in US Dollar)
The accompanying notes are an integral part of these financial statements.
Currency Quantity Cost
MarketValue
% ofNet Assets
Transferable securities admitted to an official stock exchange listing or dealt in on another regulated market - (Continued)
Common and Preferred Stocks - (Continued)
Malaysia - (Continued) HAP Seng Consolidated Bhd MYR 226,400 99,831 128,821 0.01Hartalega Holdings Bhd MYR 113,600 150,469 176,455 0.01Hartalega Holdings Bhd—Warrant MYR 11,360 — 4,198 0.00Hong Leong Bank Bhd MYR 497,800 1,687,483 2,405,979 0.10Hong Leong Financial Group Bhd MYR 544,900 1,760,013 2,352,086 0.09IGB Corp Bhd MYR 270,400 247,366 203,375 0.01IOI Corp Bhd MYR 212,900 371,839 355,065 0.01Kuala Lumpur Kepong Bhd MYR 132,800 910,157 1,042,250 0.04Kulim Malaysia Bhd MYR 2,456,000 2,580,446 3,935,383 0.16Lafarge Malayan Cement Bhd MYR 170,000 486,944 534,794 0.02Malayan Banking Bhd MYR 2,238,800 6,088,007 6,735,435 0.27Maxis Bhd MYR 357,600 663,941 777,645 0.03MISC Bhd MYR 2,000 5,425 2,812 0.00MMC Corp Bhd MYR 176,400 157,648 151,711 0.01Multi-Purpose Holdings Bhd MYR 223,900 180,755 255,530 0.01Petronas Chemicals Group Bhd MYR 262,000 637,862 548,332 0.02Petronas Gas Bhd MYR 149,900 618,354 956,850 0.04POS Malaysia BHD MYR 339,000 341,839 385,782 0.02Public Bank Bhd MYR 1,727,400 7,604,336 9,207,528 0.37RHB Capital Bhd MYR 229,348 597,537 576,745 0.02Sapurakencana Petroleum Bhd MYR 1,011,204 847,808 1,041,626 0.04Sime Darby Bhd MYR 3,162,300 10,015,734 9,844,701 0.39Sunway Bhd MYR 91,200 65,167 70,980 0.00Telekom Malaysia Bhd MYR 1,269,700 1,788,608 2,507,844 0.10Tenaga Nasional Bhd MYR 2,191,525 4,502,578 4,973,572 0.20Time dotCom Bhd MYR 400,720 471,082 517,608 0.02Top Glove Corp Bhd MYR 101,200 183,996 186,317 0.01UMW Holdings Bhd MYR 1,133,600 2,861,407 4,426,156 0.18UOA Development Bhd MYR 416,600 205,689 237,045 0.01YTL Corp Bhd MYR 32,000 13,653 19,882 0.00YTL Power International Bhd MYR 312,000 217,825 159,163 0.01
Total Malaysia 68,308,089 81,586,224 3.26 _______________________________________________ ____________________________________________________________ __________________________________________________
Mexico Alfa SAB de CV MXN 3,662,100 4,985,579 7,721,261 0.31America Movil SAB de CV MXN 17,913,692 21,940,389 20,553,982 0.82America Movil SAB de CV—ADR USD 587,500 15,422,385 13,594,750 0.54Cemex SAB de CV—ADR USD 498,156 2,803,302 4,916,800 0.20Coca-Cola Femsa SAB de CV—ADR USD 39,300 3,517,545 5,857,272 0.23Compartamos SAB de CV MXN 1,178,600 1,972,100 1,667,248 0.07Controladora Comercial Mexicana SAB de CV MXN 103,600 318,036 361,236 0.01Corp GEO SAB de CV MXN 121,800 355,736 141,815 0.01Desarrolladora Homex SAB de CV MXN 5,400 23,614 11,111 0.00Desarrolladora Homex SAB de CV—ADR USD 42,800 858,502 534,144 0.02Fomento Economico Mexicano SAB de CV—ADR USD 142,005 10,088,606 14,299,903 0.57Genomma Lab Internacional SAB de CV MXN 736,200 1,773,564 1,507,436 0.06Gruma SAB de CV MXN 415,200 893,004 1,252,378 0.05Grupo Aeromexico SAB de CV MXN 44,800 84,122 66,582 0.00Grupo Aeroportuario del Pacifico SAB de CV—ADR USD 4,800 246,232 274,416 0.01Grupo Aeroportuario del Sureste SAB de CV—ADR USD 11,700 945,843 1,333,800 0.05Grupo Carso SAB de CV MXN 335,128 1,080,754 1,614,220 0.06Grupo Financiero Banorte SAB de CV MXN 561,442 2,475,520 3,607,911 0.14Grupo Financiero Santander Mexico SAB de CV MXN 505,000 1,426,381 1,626,298 0.07Grupo Mexico SAB de CV MXN 4,127,814 12,979,090 14,860,258 0.59Grupo Modelo SAB de CV MXN 56,700 306,544 506,571 0.02Grupo Simec SAB de CV MXN 33,500 133,256 157,233 0.01Grupo Televisa SAB MXN 250,000 1,168,582 1,313,915 0.05Grupo Televisa SAB—ADR USD 80,200 1,676,483 2,131,716 0.09Industrias CH SAB de CV MXN 99,100 435,497 744,967 0.03Industrias Penoles SAB de CV MXN 34,745 1,333,427 1,741,611 0.07Kimberly-Clark de Mexico SAB de CV MXN 1,623,100 3,217,212 4,119,619 0.17Mexichem SAB de CV MXN 1,538,363 5,874,783 8,542,381 0.34Minera Frisco SAB de CV MXN 295,655 1,195,515 1,239,447 0.05OHL Mexico SAB de CV MXN 371,700 639,078 812,897 0.03Organizacion Soriana SAB de CV MXN 43,400 147,364 164,764 0.01TV Azteca SAB de CV MXN 367,600 206,419 240,047 0.01
113

STATE STREET GLOBAL ADVISORS LUXEMBOURG SICAV — SSGA ENHANCED EMERGING MARKETS EQUITY FUND
Schedule of Investments at December 31, 2012 (Expressed in US Dollar)
The accompanying notes are an integral part of these financial statements.
Currency Quantity Cost
MarketValue
% ofNet Assets
Transferable securities admitted to an official stock exchange listing or dealt in on another regulated market - (Continued)
Common and Preferred Stocks - (Continued)
Mexico - (Continued) Wal-Mart de Mexico SAB de CV MXN 1,717,500 4,893,067 5,598,473 0.22
Total Mexico 105,417,531 123,116,462 4.91 _______________________________________________ ____________________________________________________________ __________________________________________________
Morocco Attijariwafa Bank MAD 30,741 1,348,233 1,137,378 0.04Maroc Telecom SA EUR 91,186 1,773,506 1,203,399 0.05
Total Morocco 3,121,739 2,340,777 0.09 _______________________________________________ ____________________________________________________________ __________________________________________________
Peru Cia de Minas Buenaventura SA—ADR USD 66,962 2,525,233 2,407,284 0.10Credicorp Ltd USD 10,100 1,347,855 1,480,256 0.06Volcan Cia Minera SAA PEN 488,475 570,581 495,651 0.02
Total Peru 4,443,669 4,383,191 0.18 _______________________________________________ ____________________________________________________________ __________________________________________________
Philippines Aboitiz Equity Ventures Inc PHP 2,306,000 2,163,776 2,973,582 0.12Aboitiz Power Corp PHP 6,270,918 4,012,737 5,642,872 0.22Atlas Consolidated Mining & Development PHP 205,200 84,753 93,449 0.00Ayala Corp PHP 14,004 86,351 176,318 0.01DMCI Holdings Inc PHP 2,662,315 2,744,918 3,497,885 0.14Energy Development Corp PHP 1,654,200 275,326 271,923 0.01First Gen Corp PHP 598,000 266,064 324,758 0.01First Philippine Holdings Corp PHP 195,320 395,956 428,099 0.02Globe Telecom Inc PHP 3,880 76,839 103,183 0.00Manila Water Co Inc PHP 260,300 145,255 202,852 0.01Philippine Long Distance Telephone Co—ADR USD 35,766 2,017,797 2,192,813 0.09Semirara Mining Corp PHP 119,100 607,946 676,966 0.03SM Investments Corp PHP 114,434 1,246,021 2,457,980 0.10Universal Robina Corp PHP 6,947 3,559 14,186 0.00
Total Philippines 14,127,298 19,056,866 0.76 _______________________________________________ ____________________________________________________________ __________________________________________________
Poland BRE Bank SA PLN 7,734 937,619 814,658 0.03Ciech SA PLN 12,136 71,369 87,053 0.00Cyfrowy Polsat SA PLN 605,521 3,297,310 3,210,637 0.13Eurocash SA PLN 196,851 2,344,348 2,779,537 0.11Getin Noble Bank SA PLN 327,706 211,556 189,535 0.01Globe Trade Centre SA PLN 197,632 390,627 632,187 0.02Grupa Lotos SA PLN 40,189 386,845 535,005 0.02ING Bank Slaski SA PLN 302 6,944 8,880 0.00Jastrzebska Spolka Weglowa SA PLN 99,914 3,099,656 2,982,989 0.12KGHM Polska Miedz SA PLN 179,072 9,455,811 10,993,467 0.44PGE SA PLN 116,342 905,060 684,542 0.03Polski Koncern Naftowy Orlen SA PLN 152,843 2,143,681 2,444,579 0.10Powszechna Kasa Oszczednosci Bank Polski SA PLN 290,530 4,052,101 3,463,943 0.14Powszechny Zaklad Ubezpieczen SA PLN 17,977 2,123,592 2,538,353 0.10Synthos SA PLN 652,941 1,067,428 1,141,365 0.05Tauron Polska Energia SA PLN 1,110,094 2,336,524 1,703,753 0.07
Total Poland 32,830,471 34,210,483 1.37 _______________________________________________ ____________________________________________________________ __________________________________________________
Russia AK Transneft OAO—Preferred Stock USD 3,633 5,632,407 8,169,612 0.33Federal Grid Co Unified Energy System JSC USD 197,246,879 1,503,661 1,274,215 0.05Gazprom OAO USD 86,100 466,662 405,613 0.02Gazprom OAO—ADR USD 84,547 788,372 822,642 0.03Gazprom OAO—ADR (traded in United Kingdom) USD 3,733,431 46,086,505 35,318,257 1.41IDGC Holding JSC USD 8,058,410 490,062 517,302 0.02
114
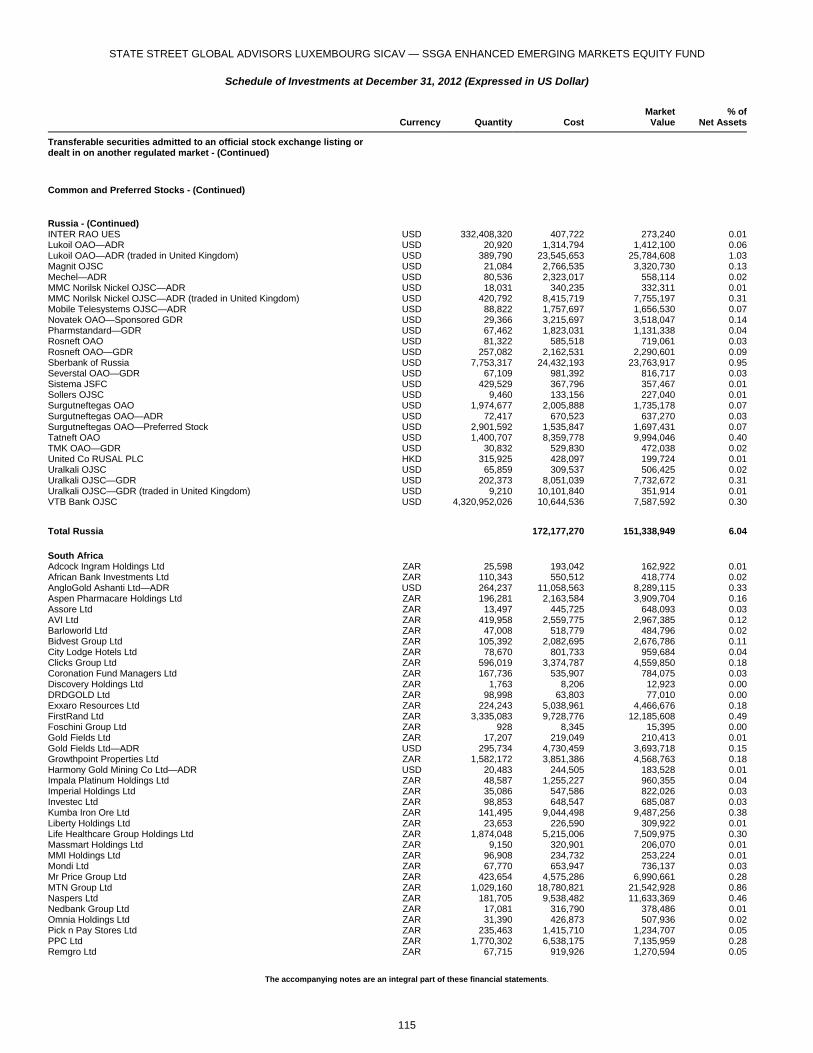
STATE STREET GLOBAL ADVISORS LUXEMBOURG SICAV — SSGA ENHANCED EMERGING MARKETS EQUITY FUND
Schedule of Investments at December 31, 2012 (Expressed in US Dollar)
The accompanying notes are an integral part of these financial statements.
Currency Quantity Cost
MarketValue
% ofNet Assets
Transferable securities admitted to an official stock exchange listing or dealt in on another regulated market - (Continued)
Common and Preferred Stocks - (Continued)
Russia - (Continued) INTER RAO UES USD 332,408,320 407,722 273,240 0.01Lukoil OAO—ADR USD 20,920 1,314,794 1,412,100 0.06Lukoil OAO—ADR (traded in United Kingdom) USD 389,790 23,545,653 25,784,608 1.03Magnit OJSC USD 21,084 2,766,535 3,320,730 0.13Mechel—ADR USD 80,536 2,323,017 558,114 0.02MMC Norilsk Nickel OJSC—ADR USD 18,031 340,235 332,311 0.01MMC Norilsk Nickel OJSC—ADR (traded in United Kingdom) USD 420,792 8,415,719 7,755,197 0.31Mobile Telesystems OJSC—ADR USD 88,822 1,757,697 1,656,530 0.07Novatek OAO—Sponsored GDR USD 29,366 3,215,697 3,518,047 0.14Pharmstandard—GDR USD 67,462 1,823,031 1,131,338 0.04Rosneft OAO USD 81,322 585,518 719,061 0.03Rosneft OAO—GDR USD 257,082 2,162,531 2,290,601 0.09Sberbank of Russia USD 7,753,317 24,432,193 23,763,917 0.95Severstal OAO—GDR USD 67,109 981,392 816,717 0.03Sistema JSFC USD 429,529 367,796 357,467 0.01Sollers OJSC USD 9,460 133,156 227,040 0.01Surgutneftegas OAO USD 1,974,677 2,005,888 1,735,178 0.07Surgutneftegas OAO—ADR USD 72,417 670,523 637,270 0.03Surgutneftegas OAO—Preferred Stock USD 2,901,592 1,535,847 1,697,431 0.07Tatneft OAO USD 1,400,707 8,359,778 9,994,046 0.40TMK OAO—GDR USD 30,832 529,830 472,038 0.02United Co RUSAL PLC HKD 315,925 428,097 199,724 0.01Uralkali OJSC USD 65,859 309,537 506,425 0.02Uralkali OJSC—GDR USD 202,373 8,051,039 7,732,672 0.31Uralkali OJSC—GDR (traded in United Kingdom) USD 9,210 10,101,840 351,914 0.01VTB Bank OJSC USD 4,320,952,026 10,644,536 7,587,592 0.30
Total Russia 172,177,270 151,338,949 6.04 _______________________________________________ ____________________________________________________________ __________________________________________________
South Africa Adcock Ingram Holdings Ltd ZAR 25,598 193,042 162,922 0.01African Bank Investments Ltd ZAR 110,343 550,512 418,774 0.02AngloGold Ashanti Ltd—ADR USD 264,237 11,058,563 8,289,115 0.33Aspen Pharmacare Holdings Ltd ZAR 196,281 2,163,584 3,909,704 0.16Assore Ltd ZAR 13,497 445,725 648,093 0.03AVI Ltd ZAR 419,958 2,559,775 2,967,385 0.12Barloworld Ltd ZAR 47,008 518,779 484,796 0.02Bidvest Group Ltd ZAR 105,392 2,082,695 2,676,786 0.11City Lodge Hotels Ltd ZAR 78,670 801,733 959,684 0.04Clicks Group Ltd ZAR 596,019 3,374,787 4,559,850 0.18Coronation Fund Managers Ltd ZAR 167,736 535,907 784,075 0.03Discovery Holdings Ltd ZAR 1,763 8,206 12,923 0.00DRDGOLD Ltd ZAR 98,998 63,803 77,010 0.00Exxaro Resources Ltd ZAR 224,243 5,038,961 4,466,676 0.18FirstRand Ltd ZAR 3,335,083 9,728,776 12,185,608 0.49Foschini Group Ltd ZAR 928 8,345 15,395 0.00Gold Fields Ltd ZAR 17,207 219,049 210,413 0.01Gold Fields Ltd—ADR USD 295,734 4,730,459 3,693,718 0.15Growthpoint Properties Ltd ZAR 1,582,172 3,851,386 4,568,763 0.18Harmony Gold Mining Co Ltd—ADR USD 20,483 244,505 183,528 0.01Impala Platinum Holdings Ltd ZAR 48,587 1,255,227 960,355 0.04Imperial Holdings Ltd ZAR 35,086 547,586 822,026 0.03Investec Ltd ZAR 98,853 648,547 685,087 0.03Kumba Iron Ore Ltd ZAR 141,495 9,044,498 9,487,256 0.38Liberty Holdings Ltd ZAR 23,653 226,590 309,922 0.01Life Healthcare Group Holdings Ltd ZAR 1,874,048 5,215,006 7,509,975 0.30Massmart Holdings Ltd ZAR 9,150 320,901 206,070 0.01MMI Holdings Ltd ZAR 96,908 234,732 253,224 0.01Mondi Ltd ZAR 67,770 653,947 736,137 0.03Mr Price Group Ltd ZAR 423,654 4,575,286 6,990,661 0.28MTN Group Ltd ZAR 1,029,160 18,780,821 21,542,928 0.86Naspers Ltd ZAR 181,705 9,538,482 11,633,369 0.46Nedbank Group Ltd ZAR 17,081 316,790 378,486 0.01Omnia Holdings Ltd ZAR 31,390 426,873 507,936 0.02Pick n Pay Stores Ltd ZAR 235,463 1,415,710 1,234,707 0.05PPC Ltd ZAR 1,770,302 6,538,175 7,135,959 0.28Remgro Ltd ZAR 67,715 919,926 1,270,594 0.05
115
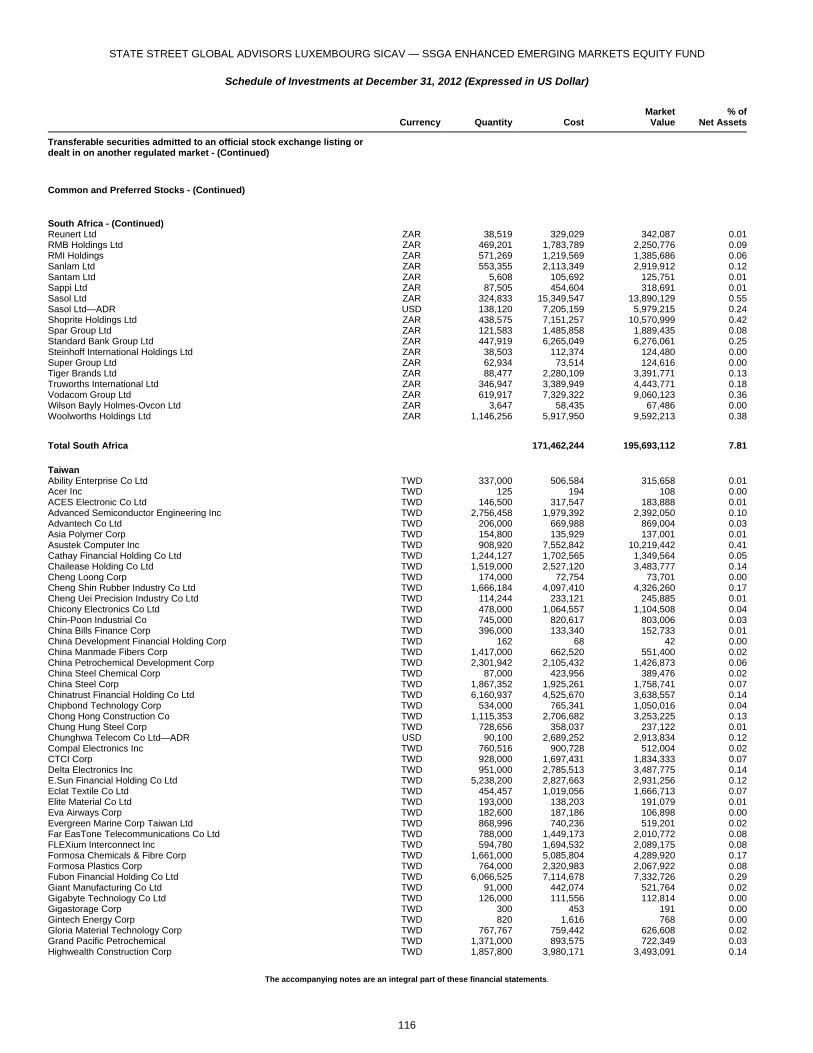
STATE STREET GLOBAL ADVISORS LUXEMBOURG SICAV — SSGA ENHANCED EMERGING MARKETS EQUITY FUND
Schedule of Investments at December 31, 2012 (Expressed in US Dollar)
The accompanying notes are an integral part of these financial statements.
Currency Quantity Cost
MarketValue
% ofNet Assets
Transferable securities admitted to an official stock exchange listing or dealt in on another regulated market - (Continued)
Common and Preferred Stocks - (Continued)
South Africa - (Continued) Reunert Ltd ZAR 38,519 329,029 342,087 0.01RMB Holdings Ltd ZAR 469,201 1,783,789 2,250,776 0.09RMI Holdings ZAR 571,269 1,219,569 1,385,686 0.06Sanlam Ltd ZAR 553,355 2,113,349 2,919,912 0.12Santam Ltd ZAR 5,608 105,692 125,751 0.01Sappi Ltd ZAR 87,505 454,604 318,691 0.01Sasol Ltd ZAR 324,833 15,349,547 13,890,129 0.55Sasol Ltd—ADR USD 138,120 7,205,159 5,979,215 0.24Shoprite Holdings Ltd ZAR 438,575 7,151,257 10,570,999 0.42Spar Group Ltd ZAR 121,583 1,485,858 1,889,435 0.08Standard Bank Group Ltd ZAR 447,919 6,265,049 6,276,061 0.25Steinhoff International Holdings Ltd ZAR 38,503 112,374 124,480 0.00Super Group Ltd ZAR 62,934 73,514 124,616 0.00Tiger Brands Ltd ZAR 88,477 2,280,109 3,391,771 0.13Truworths International Ltd ZAR 346,947 3,389,949 4,443,771 0.18Vodacom Group Ltd ZAR 619,917 7,329,322 9,060,123 0.36Wilson Bayly Holmes-Ovcon Ltd ZAR 3,647 58,435 67,486 0.00Woolworths Holdings Ltd ZAR 1,146,256 5,917,950 9,592,213 0.38
Total South Africa 171,462,244 195,693,112 7.81 _______________________________________________ ____________________________________________________________ __________________________________________________
Taiwan Ability Enterprise Co Ltd TWD 337,000 506,584 315,658 0.01Acer Inc TWD 125 194 108 0.00ACES Electronic Co Ltd TWD 146,500 317,547 183,888 0.01Advanced Semiconductor Engineering Inc TWD 2,756,458 1,979,392 2,392,050 0.10Advantech Co Ltd TWD 206,000 669,988 869,004 0.03Asia Polymer Corp TWD 154,800 135,929 137,001 0.01Asustek Computer Inc TWD 908,920 7,552,842 10,219,442 0.41Cathay Financial Holding Co Ltd TWD 1,244,127 1,702,565 1,349,564 0.05Chailease Holding Co Ltd TWD 1,519,000 2,527,120 3,483,777 0.14Cheng Loong Corp TWD 174,000 72,754 73,701 0.00Cheng Shin Rubber Industry Co Ltd TWD 1,666,184 4,097,410 4,326,260 0.17Cheng Uei Precision Industry Co Ltd TWD 114,244 233,121 245,885 0.01Chicony Electronics Co Ltd TWD 478,000 1,064,557 1,104,508 0.04Chin-Poon Industrial Co TWD 745,000 820,617 803,006 0.03China Bills Finance Corp TWD 396,000 133,340 152,733 0.01China Development Financial Holding Corp TWD 162 68 42 0.00China Manmade Fibers Corp TWD 1,417,000 662,520 551,400 0.02China Petrochemical Development Corp TWD 2,301,942 2,105,432 1,426,873 0.06China Steel Chemical Corp TWD 87,000 423,956 389,476 0.02China Steel Corp TWD 1,867,352 1,925,261 1,758,741 0.07Chinatrust Financial Holding Co Ltd TWD 6,160,937 4,525,670 3,638,557 0.14Chipbond Technology Corp TWD 534,000 765,341 1,050,016 0.04Chong Hong Construction Co TWD 1,115,353 2,706,682 3,253,225 0.13Chung Hung Steel Corp TWD 728,656 358,037 237,122 0.01Chunghwa Telecom Co Ltd—ADR USD 90,100 2,689,252 2,913,834 0.12Compal Electronics Inc TWD 760,516 900,728 512,004 0.02CTCI Corp TWD 928,000 1,697,431 1,834,333 0.07Delta Electronics Inc TWD 951,000 2,785,513 3,487,775 0.14E.Sun Financial Holding Co Ltd TWD 5,238,200 2,827,663 2,931,256 0.12Eclat Textile Co Ltd TWD 454,457 1,019,056 1,666,713 0.07Elite Material Co Ltd TWD 193,000 138,203 191,079 0.01Eva Airways Corp TWD 182,600 187,186 106,898 0.00Evergreen Marine Corp Taiwan Ltd TWD 868,996 740,236 519,201 0.02Far EasTone Telecommunications Co Ltd TWD 788,000 1,449,173 2,010,772 0.08FLEXium Interconnect Inc TWD 594,780 1,694,532 2,089,175 0.08Formosa Chemicals & Fibre Corp TWD 1,661,000 5,085,804 4,289,920 0.17Formosa Plastics Corp TWD 764,000 2,320,983 2,067,922 0.08Fubon Financial Holding Co Ltd TWD 6,066,525 7,114,678 7,332,726 0.29Giant Manufacturing Co Ltd TWD 91,000 442,074 521,764 0.02Gigabyte Technology Co Ltd TWD 126,000 111,556 112,814 0.00Gigastorage Corp TWD 300 453 191 0.00Gintech Energy Corp TWD 820 1,616 768 0.00Gloria Material Technology Corp TWD 767,767 759,442 626,608 0.02Grand Pacific Petrochemical TWD 1,371,000 893,575 722,349 0.03Highwealth Construction Corp TWD 1,857,800 3,980,171 3,493,091 0.14
116
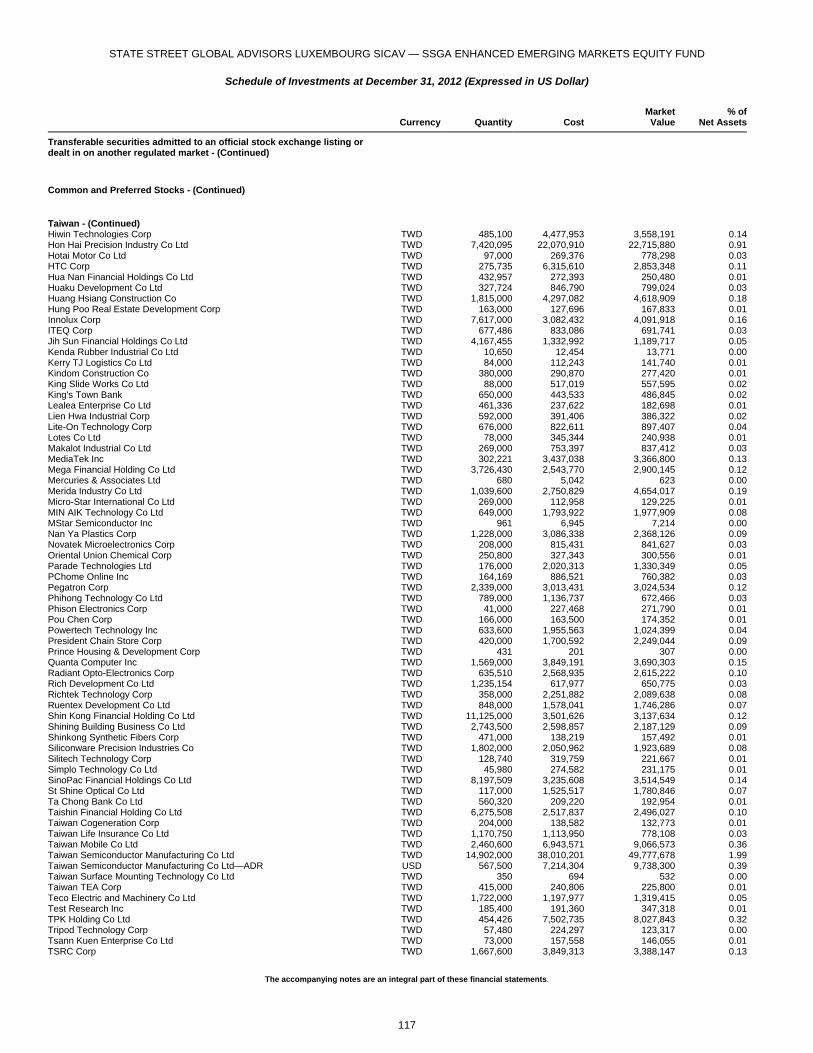
STATE STREET GLOBAL ADVISORS LUXEMBOURG SICAV — SSGA ENHANCED EMERGING MARKETS EQUITY FUND
Schedule of Investments at December 31, 2012 (Expressed in US Dollar)
The accompanying notes are an integral part of these financial statements.
Currency Quantity Cost
MarketValue
% ofNet Assets
Transferable securities admitted to an official stock exchange listing or dealt in on another regulated market - (Continued)
Common and Preferred Stocks - (Continued)
Taiwan - (Continued) Hiwin Technologies Corp TWD 485,100 4,477,953 3,558,191 0.14Hon Hai Precision Industry Co Ltd TWD 7,420,095 22,070,910 22,715,880 0.91Hotai Motor Co Ltd TWD 97,000 269,376 778,298 0.03HTC Corp TWD 275,735 6,315,610 2,853,348 0.11Hua Nan Financial Holdings Co Ltd TWD 432,957 272,393 250,480 0.01Huaku Development Co Ltd TWD 327,724 846,790 799,024 0.03Huang Hsiang Construction Co TWD 1,815,000 4,297,082 4,618,909 0.18Hung Poo Real Estate Development Corp TWD 163,000 127,696 167,833 0.01Innolux Corp TWD 7,617,000 3,082,432 4,091,918 0.16ITEQ Corp TWD 677,486 833,086 691,741 0.03Jih Sun Financial Holdings Co Ltd TWD 4,167,455 1,332,992 1,189,717 0.05Kenda Rubber Industrial Co Ltd TWD 10,650 12,454 13,771 0.00Kerry TJ Logistics Co Ltd TWD 84,000 112,243 141,740 0.01Kindom Construction Co TWD 380,000 290,870 277,420 0.01King Slide Works Co Ltd TWD 88,000 517,019 557,595 0.02King's Town Bank TWD 650,000 443,533 486,845 0.02Lealea Enterprise Co Ltd TWD 461,336 237,622 182,698 0.01Lien Hwa Industrial Corp TWD 592,000 391,406 386,322 0.02Lite-On Technology Corp TWD 676,000 822,611 897,407 0.04Lotes Co Ltd TWD 78,000 345,344 240,938 0.01Makalot Industrial Co Ltd TWD 269,000 753,397 837,412 0.03MediaTek Inc TWD 302,221 3,437,038 3,366,800 0.13Mega Financial Holding Co Ltd TWD 3,726,430 2,543,770 2,900,145 0.12Mercuries & Associates Ltd TWD 680 5,042 623 0.00Merida Industry Co Ltd TWD 1,039,600 2,750,829 4,654,017 0.19Micro-Star International Co Ltd TWD 269,000 112,958 129,225 0.01MIN AIK Technology Co Ltd TWD 649,000 1,793,922 1,977,909 0.08MStar Semiconductor Inc TWD 961 6,945 7,214 0.00Nan Ya Plastics Corp TWD 1,228,000 3,086,338 2,368,126 0.09Novatek Microelectronics Corp TWD 208,000 815,431 841,627 0.03Oriental Union Chemical Corp TWD 250,800 327,343 300,556 0.01Parade Technologies Ltd TWD 176,000 2,020,313 1,330,349 0.05PChome Online Inc TWD 164,169 886,521 760,382 0.03Pegatron Corp TWD 2,339,000 3,013,431 3,024,534 0.12Phihong Technology Co Ltd TWD 789,000 1,136,737 672,466 0.03Phison Electronics Corp TWD 41,000 227,468 271,790 0.01Pou Chen Corp TWD 166,000 163,500 174,352 0.01Powertech Technology Inc TWD 633,600 1,955,563 1,024,399 0.04President Chain Store Corp TWD 420,000 1,700,592 2,249,044 0.09Prince Housing & Development Corp TWD 431 201 307 0.00Quanta Computer Inc TWD 1,569,000 3,849,191 3,690,303 0.15Radiant Opto-Electronics Corp TWD 635,510 2,568,935 2,615,222 0.10Rich Development Co Ltd TWD 1,235,154 617,977 650,775 0.03Richtek Technology Corp TWD 358,000 2,251,882 2,089,638 0.08Ruentex Development Co Ltd TWD 848,000 1,578,041 1,746,286 0.07Shin Kong Financial Holding Co Ltd TWD 11,125,000 3,501,626 3,137,634 0.12Shining Building Business Co Ltd TWD 2,743,500 2,598,857 2,187,129 0.09Shinkong Synthetic Fibers Corp TWD 471,000 138,219 157,492 0.01Siliconware Precision Industries Co TWD 1,802,000 2,050,962 1,923,689 0.08Silitech Technology Corp TWD 128,740 319,759 221,667 0.01Simplo Technology Co Ltd TWD 45,980 274,582 231,175 0.01SinoPac Financial Holdings Co Ltd TWD 8,197,509 3,235,608 3,514,549 0.14St Shine Optical Co Ltd TWD 117,000 1,525,517 1,780,846 0.07Ta Chong Bank Co Ltd TWD 560,320 209,220 192,954 0.01Taishin Financial Holding Co Ltd TWD 6,275,508 2,517,837 2,496,027 0.10Taiwan Cogeneration Corp TWD 204,000 138,582 132,773 0.01Taiwan Life Insurance Co Ltd TWD 1,170,750 1,113,950 778,108 0.03Taiwan Mobile Co Ltd TWD 2,460,600 6,943,571 9,066,573 0.36Taiwan Semiconductor Manufacturing Co Ltd TWD 14,902,000 38,010,201 49,777,678 1.99Taiwan Semiconductor Manufacturing Co Ltd—ADR USD 567,500 7,214,304 9,738,300 0.39Taiwan Surface Mounting Technology Co Ltd TWD 350 694 532 0.00Taiwan TEA Corp TWD 415,000 240,806 225,800 0.01Teco Electric and Machinery Co Ltd TWD 1,722,000 1,197,977 1,319,415 0.05Test Research Inc TWD 185,400 191,360 347,318 0.01TPK Holding Co Ltd TWD 454,426 7,502,735 8,027,843 0.32Tripod Technology Corp TWD 57,480 224,297 123,317 0.00Tsann Kuen Enterprise Co Ltd TWD 73,000 157,558 146,055 0.01TSRC Corp TWD 1,667,600 3,849,313 3,388,147 0.13
117
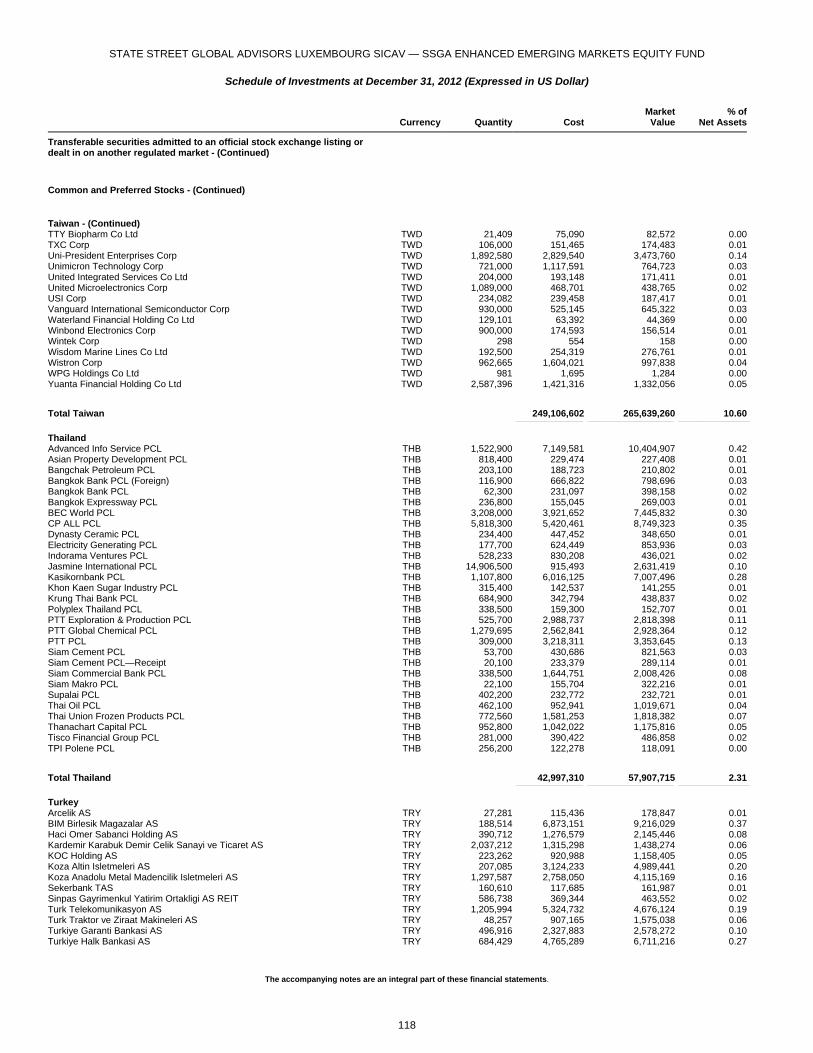
STATE STREET GLOBAL ADVISORS LUXEMBOURG SICAV — SSGA ENHANCED EMERGING MARKETS EQUITY FUND
Schedule of Investments at December 31, 2012 (Expressed in US Dollar)
The accompanying notes are an integral part of these financial statements.
Currency Quantity Cost
MarketValue
% ofNet Assets
Transferable securities admitted to an official stock exchange listing or dealt in on another regulated market - (Continued)
Common and Preferred Stocks - (Continued)
Taiwan - (Continued) TTY Biopharm Co Ltd TWD 21,409 75,090 82,572 0.00TXC Corp TWD 106,000 151,465 174,483 0.01Uni-President Enterprises Corp TWD 1,892,580 2,829,540 3,473,760 0.14Unimicron Technology Corp TWD 721,000 1,117,591 764,723 0.03United Integrated Services Co Ltd TWD 204,000 193,148 171,411 0.01United Microelectronics Corp TWD 1,089,000 468,701 438,765 0.02USI Corp TWD 234,082 239,458 187,417 0.01Vanguard International Semiconductor Corp TWD 930,000 525,145 645,322 0.03Waterland Financial Holding Co Ltd TWD 129,101 63,392 44,369 0.00Winbond Electronics Corp TWD 900,000 174,593 156,514 0.01Wintek Corp TWD 298 554 158 0.00Wisdom Marine Lines Co Ltd TWD 192,500 254,319 276,761 0.01Wistron Corp TWD 962,665 1,604,021 997,838 0.04WPG Holdings Co Ltd TWD 981 1,695 1,284 0.00Yuanta Financial Holding Co Ltd TWD 2,587,396 1,421,316 1,332,056 0.05
Total Taiwan 249,106,602 265,639,260 10.60 _______________________________________________ ____________________________________________________________ __________________________________________________
Thailand Advanced Info Service PCL THB 1,522,900 7,149,581 10,404,907 0.42Asian Property Development PCL THB 818,400 229,474 227,408 0.01Bangchak Petroleum PCL THB 203,100 188,723 210,802 0.01Bangkok Bank PCL (Foreign) THB 116,900 666,822 798,696 0.03Bangkok Bank PCL THB 62,300 231,097 398,158 0.02Bangkok Expressway PCL THB 236,800 155,045 269,003 0.01BEC World PCL THB 3,208,000 3,921,652 7,445,832 0.30CP ALL PCL THB 5,818,300 5,420,461 8,749,323 0.35Dynasty Ceramic PCL THB 234,400 447,452 348,650 0.01Electricity Generating PCL THB 177,700 624,449 853,936 0.03Indorama Ventures PCL THB 528,233 830,208 436,021 0.02Jasmine International PCL THB 14,906,500 915,493 2,631,419 0.10Kasikornbank PCL THB 1,107,800 6,016,125 7,007,496 0.28Khon Kaen Sugar Industry PCL THB 315,400 142,537 141,255 0.01Krung Thai Bank PCL THB 684,900 342,794 438,837 0.02Polyplex Thailand PCL THB 338,500 159,300 152,707 0.01PTT Exploration & Production PCL THB 525,700 2,988,737 2,818,398 0.11PTT Global Chemical PCL THB 1,279,695 2,562,841 2,928,364 0.12PTT PCL THB 309,000 3,218,311 3,353,645 0.13Siam Cement PCL THB 53,700 430,686 821,563 0.03Siam Cement PCL—Receipt THB 20,100 233,379 289,114 0.01Siam Commercial Bank PCL THB 338,500 1,644,751 2,008,426 0.08Siam Makro PCL THB 22,100 155,704 322,216 0.01Supalai PCL THB 402,200 232,772 232,721 0.01Thai Oil PCL THB 462,100 952,941 1,019,671 0.04Thai Union Frozen Products PCL THB 772,560 1,581,253 1,818,382 0.07Thanachart Capital PCL THB 952,800 1,042,022 1,175,816 0.05Tisco Financial Group PCL THB 281,000 390,422 486,858 0.02TPI Polene PCL THB 256,200 122,278 118,091 0.00
Total Thailand 42,997,310 57,907,715 2.31 _______________________________________________ ____________________________________________________________ __________________________________________________
Turkey Arcelik AS TRY 27,281 115,436 178,847 0.01BIM Birlesik Magazalar AS TRY 188,514 6,873,151 9,216,029 0.37Haci Omer Sabanci Holding AS TRY 390,712 1,276,579 2,145,446 0.08Kardemir Karabuk Demir Celik Sanayi ve Ticaret AS TRY 2,037,212 1,315,298 1,438,274 0.06KOC Holding AS TRY 223,262 920,988 1,158,405 0.05Koza Altin Isletmeleri AS TRY 207,085 3,124,233 4,989,441 0.20Koza Anadolu Metal Madencilik Isletmeleri AS TRY 1,297,587 2,758,050 4,115,169 0.16Sekerbank TAS TRY 160,610 117,685 161,987 0.01Sinpas Gayrimenkul Yatirim Ortakligi AS REIT TRY 586,738 369,344 463,552 0.02Turk Telekomunikasyon AS TRY 1,205,994 5,324,732 4,676,124 0.19Turk Traktor ve Ziraat Makineleri AS TRY 48,257 907,165 1,575,038 0.06Turkiye Garanti Bankasi AS TRY 496,916 2,327,883 2,578,272 0.10Turkiye Halk Bankasi AS TRY 684,429 4,765,289 6,711,216 0.27
118
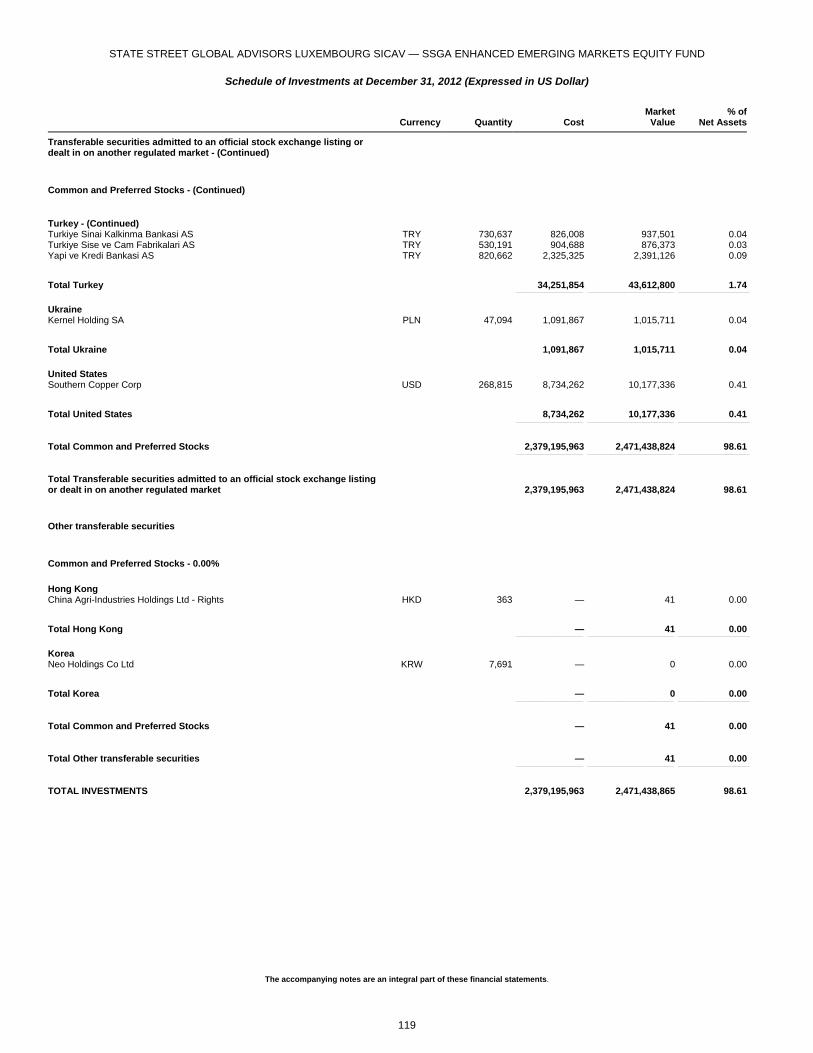
STATE STREET GLOBAL ADVISORS LUXEMBOURG SICAV — SSGA ENHANCED EMERGING MARKETS EQUITY FUND
Schedule of Investments at December 31, 2012 (Expressed in US Dollar)
The accompanying notes are an integral part of these financial statements.
Currency Quantity Cost
MarketValue
% ofNet Assets
Transferable securities admitted to an official stock exchange listing or dealt in on another regulated market - (Continued)
Common and Preferred Stocks - (Continued)
Turkey - (Continued) Turkiye Sinai Kalkinma Bankasi AS TRY 730,637 826,008 937,501 0.04Turkiye Sise ve Cam Fabrikalari AS TRY 530,191 904,688 876,373 0.03Yapi ve Kredi Bankasi AS TRY 820,662 2,325,325 2,391,126 0.09
Total Turkey 34,251,854 43,612,800 1.74 _______________________________________________ ____________________________________________________________ __________________________________________________
Ukraine Kernel Holding SA PLN 47,094 1,091,867 1,015,711 0.04
Total Ukraine 1,091,867 1,015,711 0.04 _______________________________________________ ____________________________________________________________ __________________________________________________
United States Southern Copper Corp USD 268,815 8,734,262 10,177,336 0.41
Total United States 8,734,262 10,177,336 0.41 _______________________________________________ ____________________________________________________________ __________________________________________________
Total Common and Preferred Stocks 2,379,195,963 2,471,438,824 98.61 _______________________________________________ ____________________________________________________________ __________________________________________________
Total Transferable securities admitted to an official stock exchange listing or dealt in on another regulated market 2,379,195,963 2,471,438,824 98.61 _______________________________________________ ____________________________________________________________ __________________________________________________
Other transferable securities
Common and Preferred Stocks - 0.00%
Hong Kong China Agri-Industries Holdings Ltd - Rights HKD 363 — 41 0.00
Total Hong Kong — 41 0.00 _______________________________________________ ____________________________________________________________ __________________________________________________
Korea Neo Holdings Co Ltd KRW 7,691 — 0 0.00
Total Korea — 0 0.00 _______________________________________________ ____________________________________________________________ __________________________________________________
Total Common and Preferred Stocks — 41 0.00 _______________________________________________ ____________________________________________________________ __________________________________________________
Total Other transferable securities — 41 0.00 _______________________________________________ ____________________________________________________________ __________________________________________________
TOTAL INVESTMENTS 2,379,195,963 2,471,438,865 98.61 _______________________________________________ ____________________________________________________________ __________________________________________________
119

STATE STREET GLOBAL ADVISORS LUXEMBOURG SICAV — SSGA ENHANCED EMERGING MARKETS EQUITY FUND
Schedule of Investments at December 31, 2012 (Expressed in US Dollar)
The accompanying notes are an integral part of these financial statements.
Derivatives
Futures Contracts - 0.02%
Description Currency
Number ofContracts
UnrealisedGain
% ofNet Assets
MSCI EMERGING MARKET MINI FUTURE, due 03/13 USD 344 509,159 0.02
Unrealised Gain on Futures 509,159 0.02 ____________________________________________________________ ___________________________________________________
Other Net Assets/(Liabilities) 34,420,421 1.37 ____________________________________________________________ ___________________________________________________
TOTAL NET ASSETS 2,506,368,445 100.00 ____________________________________________________________ ___________________________________________________
120

STATE STREET GLOBAL ADVISORS LUXEMBOURG SICAV — SSGA EMERGING MARKETS SRI ENHANCED EQUITY FUND
Schedule of Investments at December 31, 2012 (Expressed in US Dollar)
The accompanying notes are an integral part of these financial statements.
Currency Quantity Cost
MarketValue
% ofNet Assets
Transferable securities admitted to an official stock exchange listing or dealt in on another regulated market
Common and Preferred Stocks - 98.83% Brazil AES Tiete SA—Preferred Stock BRL 21,700 235,987 250,014 0.24Banco Bradesco SA BRL 2,100 32,204 34,810 0.03Banco Bradesco SA—ADR USD 51,500 859,200 894,555 0.85Banco do Brasil SA BRL 33,100 346,299 413,851 0.40Banco do Estado do Rio Grande do Sul SA—Preferred Stock BRL 11,900 84,637 90,144 0.09BM&FBovespa SA BRL 35,200 215,450 240,684 0.23Braskem SA—ADR USD 4,700 61,210 62,745 0.06BRF - Brasil Foods SA—ADR USD 27,900 517,643 588,969 0.56CCR SA BRL 32,400 283,940 307,780 0.29Cia Brasileira de Distribuicao Grupo Pao de Acucar—ADR USD 3,600 157,657 159,804 0.15Cia de Bebidas das Americas—ADR USD 24,500 1,008,996 1,028,755 0.98Cia de Saneamento Basico do Estado de Sao Paulo—ADR USD 1,800 147,066 150,426 0.14Cia Energetica de Sao Paulo—Preferred Stock BRL 15,200 134,865 143,945 0.14Cia Siderurgica Nacional SA—ADR USD 18,500 90,465 109,150 0.10Cielo SA BRL 15,200 393,561 423,076 0.40Cosan SA Industria e Comercio BRL 13,500 247,890 275,275 0.26Embraer SA—ADR USD 3,700 94,289 105,487 0.10Fibria Celulose SA—ADR USD 7,400 81,722 84,138 0.08Itau Unibanco Holding SA—ADR USD 48,200 736,665 793,372 0.76Itausa - Investimentos Itau SA—Preferred Stock BRL 24,000 110,458 113,582 0.11JBS SA BRL 79,900 213,816 234,139 0.22Klabin SA—Preferred Stock BRL 31,800 180,758 198,643 0.19Lojas Americanas SA—Preferred Stock BRL 35,300 303,659 316,019 0.30Lojas Renner SA BRL 6,400 236,858 249,280 0.24Marfrig Alimentos SA BRL 34,700 149,002 143,715 0.14Metalurgica Gerdau SA—Preferred Stock BRL 25,100 267,996 280,728 0.27Multiplus SA BRL 10,300 232,137 240,057 0.23Natura Cosmeticos SA BRL 11,900 321,216 340,814 0.33Oi SA—ADR USD 79,000 308,218 316,790 0.30Petroleo Brasileiro SA—ADR USD 85,600 1,544,524 1,666,632 1.59Porto Seguro SA BRL 21,200 225,273 243,217 0.23Sul America SA BRL 11,800 90,981 102,007 0.10Tim Participacoes SA—ADR USD 1,100 18,858 21,802 0.02Totvs SA BRL 13,600 266,181 268,280 0.26Tractebel Energia SA BRL 10,900 178,375 177,541 0.17Usinas Siderurgicas de Minas Gerais SA—Preferred Stock BRL 22,800 140,526 142,535 0.14Vale SA—ADR USD 93,500 1,609,462 1,959,760 1.87
Total Brazil 12,128,044 13,172,521 12.57 _______________________________________________ ____________________________________________________________ __________________________________________________
Chile Aguas Andinas SA CLP 81,791 58,470 58,034 0.06Banco de Chile CLP 2,850,000 453,712 460,655 0.44Banco de Credito e Inversiones CLP 3,940 275,184 271,109 0.26Banco Santander Chile—ADR USD 3,400 92,254 96,866 0.09Cencosud SA CLP 6,180 33,871 33,501 0.03Cia Cervecerias Unidas SA—ADR USD 8,425 248,219 266,483 0.26Corpbanca SA CLP 7,950,800 105,201 106,941 0.10Enersis SA—ADR USD 8,300 142,789 151,226 0.14ENTEL Chile SA CLP 12,950 271,201 267,744 0.26Sociedad Quimica y Minera de Chile SA—ADR USD 6,000 333,441 345,840 0.33
Total Chile 2,014,342 2,058,399 1.97 _______________________________________________ ____________________________________________________________ __________________________________________________
China Agricultural Bank of China Ltd HKD 1,027,000 444,066 507,481 0.48Bank of China Ltd HKD 2,499,000 1,047,058 1,115,560 1.07Bank of Communications Co Ltd HKD 426,000 305,917 320,976 0.31Chaowei Power Holdings Ltd HKD 381,000 180,899 197,115 0.19China BlueChemical Ltd HKD 196,000 123,472 131,495 0.13China Citic Bank Corp Ltd HKD 582,000 299,386 345,407 0.33China Coal Energy Co Ltd HKD 148,000 143,819 160,777 0.15China Communications Services Corp Ltd HKD 416,000 231,680 240,448 0.23China Construction Bank Corp HKD 2,199,000 1,668,020 1,764,681 1.68China Life Insurance Co Ltd HKD 133,000 386,401 434,133 0.41China Merchants Bank Co Ltd HKD 210,000 401,634 463,304 0.44
121
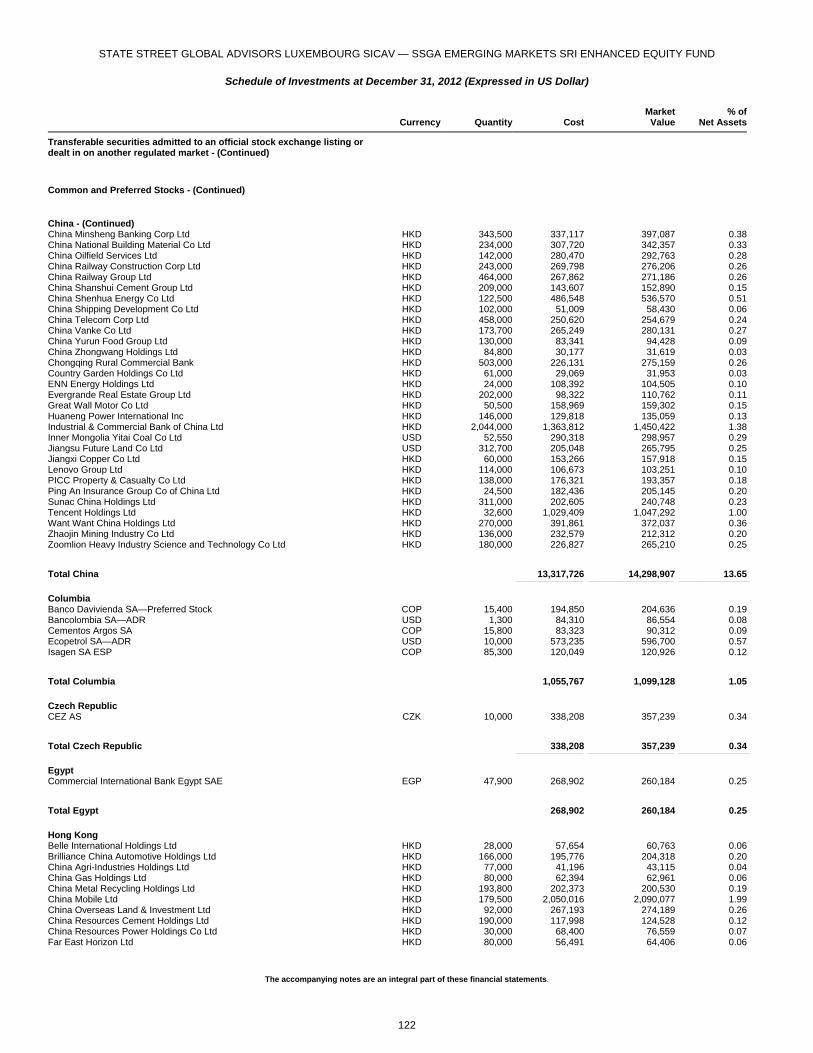
STATE STREET GLOBAL ADVISORS LUXEMBOURG SICAV — SSGA EMERGING MARKETS SRI ENHANCED EQUITY FUND
Schedule of Investments at December 31, 2012 (Expressed in US Dollar)
The accompanying notes are an integral part of these financial statements.
Currency Quantity Cost
MarketValue
% ofNet Assets
Transferable securities admitted to an official stock exchange listing or dealt in on another regulated market - (Continued)
Common and Preferred Stocks - (Continued)
China - (Continued) China Minsheng Banking Corp Ltd HKD 343,500 337,117 397,087 0.38China National Building Material Co Ltd HKD 234,000 307,720 342,357 0.33China Oilfield Services Ltd HKD 142,000 280,470 292,763 0.28China Railway Construction Corp Ltd HKD 243,000 269,798 276,206 0.26China Railway Group Ltd HKD 464,000 267,862 271,186 0.26China Shanshui Cement Group Ltd HKD 209,000 143,607 152,890 0.15China Shenhua Energy Co Ltd HKD 122,500 486,548 536,570 0.51China Shipping Development Co Ltd HKD 102,000 51,009 58,430 0.06China Telecom Corp Ltd HKD 458,000 250,620 254,679 0.24China Vanke Co Ltd HKD 173,700 265,249 280,131 0.27China Yurun Food Group Ltd HKD 130,000 83,341 94,428 0.09China Zhongwang Holdings Ltd HKD 84,800 30,177 31,619 0.03Chongqing Rural Commercial Bank HKD 503,000 226,131 275,159 0.26Country Garden Holdings Co Ltd HKD 61,000 29,069 31,953 0.03ENN Energy Holdings Ltd HKD 24,000 108,392 104,505 0.10Evergrande Real Estate Group Ltd HKD 202,000 98,322 110,762 0.11Great Wall Motor Co Ltd HKD 50,500 158,969 159,302 0.15Huaneng Power International Inc HKD 146,000 129,818 135,059 0.13Industrial & Commercial Bank of China Ltd HKD 2,044,000 1,363,812 1,450,422 1.38Inner Mongolia Yitai Coal Co Ltd USD 52,550 290,318 298,957 0.29Jiangsu Future Land Co Ltd USD 312,700 205,048 265,795 0.25Jiangxi Copper Co Ltd HKD 60,000 153,266 157,918 0.15Lenovo Group Ltd HKD 114,000 106,673 103,251 0.10PICC Property & Casualty Co Ltd HKD 138,000 176,321 193,357 0.18Ping An Insurance Group Co of China Ltd HKD 24,500 182,436 205,145 0.20Sunac China Holdings Ltd HKD 311,000 202,605 240,748 0.23Tencent Holdings Ltd HKD 32,600 1,029,409 1,047,292 1.00Want Want China Holdings Ltd HKD 270,000 391,861 372,037 0.36Zhaojin Mining Industry Co Ltd HKD 136,000 232,579 212,312 0.20Zoomlion Heavy Industry Science and Technology Co Ltd HKD 180,000 226,827 265,210 0.25
Total China 13,317,726 14,298,907 13.65 _______________________________________________ ____________________________________________________________ __________________________________________________
Columbia Banco Davivienda SA—Preferred Stock COP 15,400 194,850 204,636 0.19Bancolombia SA—ADR USD 1,300 84,310 86,554 0.08Cementos Argos SA COP 15,800 83,323 90,312 0.09Ecopetrol SA—ADR USD 10,000 573,235 596,700 0.57Isagen SA ESP COP 85,300 120,049 120,926 0.12
Total Columbia 1,055,767 1,099,128 1.05 _______________________________________________ ____________________________________________________________ __________________________________________________
Czech Republic CEZ AS CZK 10,000 338,208 357,239 0.34
Total Czech Republic 338,208 357,239 0.34 _______________________________________________ ____________________________________________________________ __________________________________________________
Egypt Commercial International Bank Egypt SAE EGP 47,900 268,902 260,184 0.25
Total Egypt 268,902 260,184 0.25 _______________________________________________ ____________________________________________________________ __________________________________________________
Hong Kong Belle International Holdings Ltd HKD 28,000 57,654 60,763 0.06Brilliance China Automotive Holdings Ltd HKD 166,000 195,776 204,318 0.20China Agri-Industries Holdings Ltd HKD 77,000 41,196 43,115 0.04China Gas Holdings Ltd HKD 80,000 62,394 62,961 0.06China Metal Recycling Holdings Ltd HKD 193,800 202,373 200,530 0.19China Mobile Ltd HKD 179,500 2,050,016 2,090,077 1.99China Overseas Land & Investment Ltd HKD 92,000 267,193 274,189 0.26China Resources Cement Holdings Ltd HKD 190,000 117,998 124,528 0.12China Resources Power Holdings Co Ltd HKD 30,000 68,400 76,559 0.07Far East Horizon Ltd HKD 80,000 56,491 64,406 0.06
122

STATE STREET GLOBAL ADVISORS LUXEMBOURG SICAV — SSGA EMERGING MARKETS SRI ENHANCED EQUITY FUND
Schedule of Investments at December 31, 2012 (Expressed in US Dollar)
The accompanying notes are an integral part of these financial statements.
Currency Quantity Cost
MarketValue
% ofNet Assets
Transferable securities admitted to an official stock exchange listing or dealt in on another regulated market - (Continued)
Common and Preferred Stocks - (Continued)
Hong Kong - (Continued) Franshion Properties China Ltd HKD 428,000 148,699 154,063 0.15Guangdong Investment Ltd HKD 314,000 255,624 246,716 0.24Haier Electronics Group Co Ltd HKD 79,000 107,921 115,582 0.11Kunlun Energy Co Ltd HKD 28,000 57,003 58,450 0.06MMG Ltd HKD 544,000 211,432 225,297 0.21Real Nutriceutical Group Ltd HKD 578,000 214,459 210,294 0.20Shougang Fushan Resources Group Ltd HKD 346,000 129,233 127,225 0.12Yingde Gases HKD 32,500 32,068 33,042 0.03Yuexiu Property Co Ltd HKD 528,000 164,679 166,898 0.16
Total Hong Kong 4,440,609 4,539,013 4.33 _______________________________________________ ____________________________________________________________ __________________________________________________
Hungary OTP Bank PLC HUF 11,100 207,043 208,547 0.20
Total Hungary 207,043 208,547 0.20 _______________________________________________ ____________________________________________________________ __________________________________________________
India Axis Bank Ltd—GDR USD 8,500 211,671 208,590 0.20HDFC Bank Ltd—ADR USD 34,600 1,438,654 1,408,912 1.35ICICI Bank Ltd—ADR USD 26,500 1,101,433 1,155,665 1.10Infosys Ltd—ADR USD 29,500 1,299,283 1,247,850 1.19Reliance Industries Ltd—GDR USD 51,944 1,578,848 1,585,331 1.51Tata Motors Ltd—ADR USD 41,560 1,073,164 1,193,603 1.14Tata Steel Ltd—GDR USD 35,429 279,929 281,661 0.27
Total India 6,982,982 7,081,612 6.76 _______________________________________________ ____________________________________________________________ __________________________________________________
Indonesia Astra Agro Lestari Tbk PT IDR 62,400 119,464 127,552 0.12Astra International Tbk PT IDR 291,400 209,716 229,794 0.22Bank Central Asia Tbk PT IDR 117,400 107,614 110,852 0.11Bank Mandiri Tbk PT IDR 192,100 163,895 161,454 0.15Bank Rakyat Indonesia Persero Tbk PT IDR 515,000 379,503 371,388 0.36Charoen Pokphand Indonesia Tbk PT IDR 779,400 277,781 295,181 0.28Indo Tambangraya Megah Tbk PT IDR 57,900 232,807 249,623 0.24Perusahaan Gas Negara Persero Tbk PT IDR 706,200 339,715 337,071 0.32Semen Gresik Persero Tbk PT IDR 84,500 132,203 138,970 0.13Surya Semesta Internusa Tbk PT IDR 1,669,900 198,558 187,133 0.18Telekomunikasi Indonesia Persero Tbk PT—ADR USD 11,700 428,890 432,315 0.41Unilever Indonesia Tbk PT IDR 114,000 311,456 246,630 0.24
Total Indonesia 2,901,602 2,887,963 2.76 _______________________________________________ ____________________________________________________________ __________________________________________________
Korea BS Financial Group Inc KRW 22,510 252,608 277,544 0.26CJ Corp KRW 2,160 228,431 239,086 0.23Daelim Industrial Co Ltd KRW 2,180 155,442 177,157 0.17Daewoo Engineering & Construction Co Ltd KRW 9,080 78,246 84,390 0.08Daewoo Shipbuilding & Marine Engineering Co Ltd KRW 3,600 79,801 91,297 0.09Dongbu Insurance Co Ltd KRW 5,720 241,439 245,507 0.23Dongkuk Steel Mill Co Ltd KRW 16,300 194,963 208,589 0.20E-Mart Co Ltd KRW 870 178,790 193,410 0.18Grand Korea Leisure Co Ltd KRW 7,120 212,740 190,541 0.18GS Holdings KRW 2,250 148,380 151,321 0.14Hana Financial Group Inc KRW 6,500 196,316 210,681 0.20Hankook Tire Worldwide Co Ltd KRW 14,200 197,388 262,625 0.25Hansol Paper Co KRW 22,890 196,704 194,995 0.19Honam Petrochemical Corp KRW 1,117 214,410 256,146 0.24Hyosung Corp KRW 3,780 234,266 259,868 0.25Hyundai Heavy Industries Co Ltd KRW 1,120 217,754 253,172 0.24Hyundai Hysco Co Ltd KRW 3,290 137,046 139,673 0.13Hyundai Marine & Fire Insurance Co Ltd KRW 8,030 239,559 249,771 0.24
123
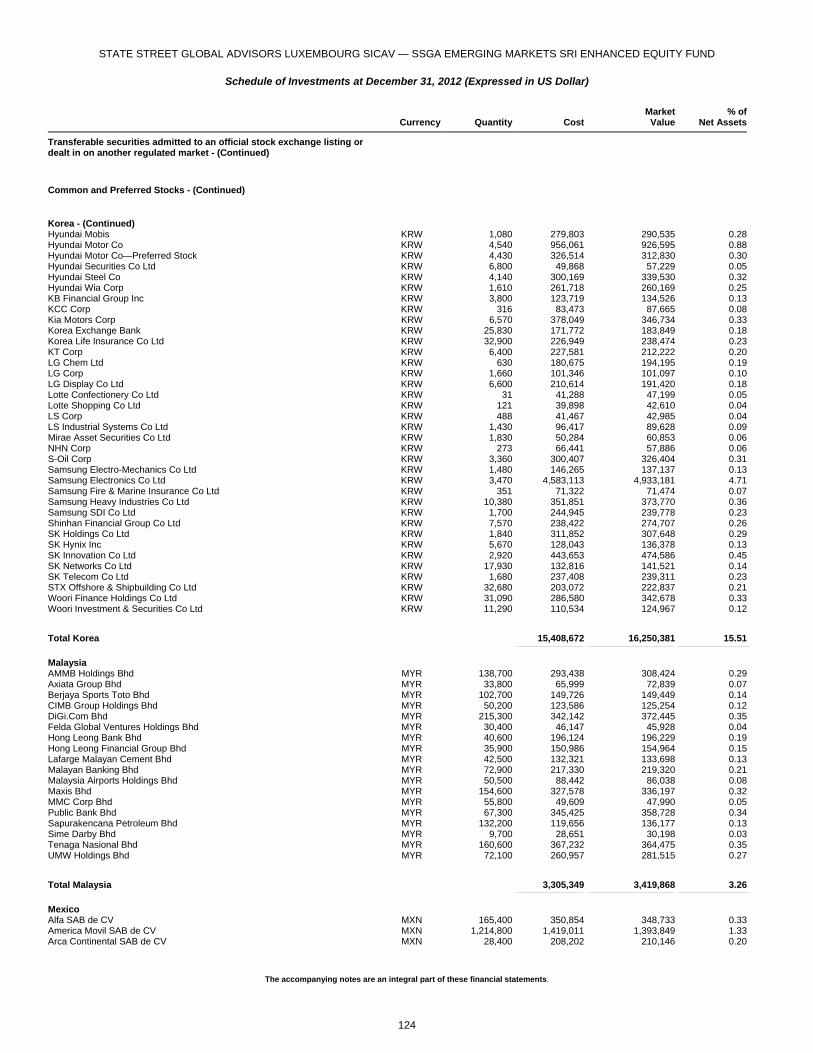
STATE STREET GLOBAL ADVISORS LUXEMBOURG SICAV — SSGA EMERGING MARKETS SRI ENHANCED EQUITY FUND
Schedule of Investments at December 31, 2012 (Expressed in US Dollar)
The accompanying notes are an integral part of these financial statements.
Currency Quantity Cost
MarketValue
% ofNet Assets
Transferable securities admitted to an official stock exchange listing or dealt in on another regulated market - (Continued)
Common and Preferred Stocks - (Continued)
Korea - (Continued) Hyundai Mobis KRW 1,080 279,803 290,535 0.28Hyundai Motor Co KRW 4,540 956,061 926,595 0.88Hyundai Motor Co—Preferred Stock KRW 4,430 326,514 312,830 0.30Hyundai Securities Co Ltd KRW 6,800 49,868 57,229 0.05Hyundai Steel Co KRW 4,140 300,169 339,530 0.32Hyundai Wia Corp KRW 1,610 261,718 260,169 0.25KB Financial Group Inc KRW 3,800 123,719 134,526 0.13KCC Corp KRW 316 83,473 87,665 0.08Kia Motors Corp KRW 6,570 378,049 346,734 0.33Korea Exchange Bank KRW 25,830 171,772 183,849 0.18Korea Life Insurance Co Ltd KRW 32,900 226,949 238,474 0.23KT Corp KRW 6,400 227,581 212,222 0.20LG Chem Ltd KRW 630 180,675 194,195 0.19LG Corp KRW 1,660 101,346 101,097 0.10LG Display Co Ltd KRW 6,600 210,614 191,420 0.18Lotte Confectionery Co Ltd KRW 31 41,288 47,199 0.05Lotte Shopping Co Ltd KRW 121 39,898 42,610 0.04LS Corp KRW 488 41,467 42,985 0.04LS Industrial Systems Co Ltd KRW 1,430 96,417 89,628 0.09Mirae Asset Securities Co Ltd KRW 1,830 50,284 60,853 0.06NHN Corp KRW 273 66,441 57,886 0.06S-Oil Corp KRW 3,360 300,407 326,404 0.31Samsung Electro-Mechanics Co Ltd KRW 1,480 146,265 137,137 0.13Samsung Electronics Co Ltd KRW 3,470 4,583,113 4,933,181 4.71Samsung Fire & Marine Insurance Co Ltd KRW 351 71,322 71,474 0.07Samsung Heavy Industries Co Ltd KRW 10,380 351,851 373,770 0.36Samsung SDI Co Ltd KRW 1,700 244,945 239,778 0.23Shinhan Financial Group Co Ltd KRW 7,570 238,422 274,707 0.26SK Holdings Co Ltd KRW 1,840 311,852 307,648 0.29SK Hynix Inc KRW 5,670 128,043 136,378 0.13SK Innovation Co Ltd KRW 2,920 443,653 474,586 0.45SK Networks Co Ltd KRW 17,930 132,816 141,521 0.14SK Telecom Co Ltd KRW 1,680 237,408 239,311 0.23STX Offshore & Shipbuilding Co Ltd KRW 32,680 203,072 222,837 0.21Woori Finance Holdings Co Ltd KRW 31,090 286,580 342,678 0.33Woori Investment & Securities Co Ltd KRW 11,290 110,534 124,967 0.12
Total Korea 15,408,672 16,250,381 15.51 _______________________________________________ ____________________________________________________________ __________________________________________________
Malaysia AMMB Holdings Bhd MYR 138,700 293,438 308,424 0.29Axiata Group Bhd MYR 33,800 65,999 72,839 0.07Berjaya Sports Toto Bhd MYR 102,700 149,726 149,449 0.14CIMB Group Holdings Bhd MYR 50,200 123,586 125,254 0.12DiGi.Com Bhd MYR 215,300 342,142 372,445 0.35Felda Global Ventures Holdings Bhd MYR 30,400 46,147 45,928 0.04Hong Leong Bank Bhd MYR 40,600 196,124 196,229 0.19Hong Leong Financial Group Bhd MYR 35,900 150,986 154,964 0.15Lafarge Malayan Cement Bhd MYR 42,500 132,321 133,698 0.13Malayan Banking Bhd MYR 72,900 217,330 219,320 0.21Malaysia Airports Holdings Bhd MYR 50,500 88,442 86,038 0.08Maxis Bhd MYR 154,600 327,578 336,197 0.32MMC Corp Bhd MYR 55,800 49,609 47,990 0.05Public Bank Bhd MYR 67,300 345,425 358,728 0.34Sapurakencana Petroleum Bhd MYR 132,200 119,656 136,177 0.13Sime Darby Bhd MYR 9,700 28,651 30,198 0.03Tenaga Nasional Bhd MYR 160,600 367,232 364,475 0.35UMW Holdings Bhd MYR 72,100 260,957 281,515 0.27
Total Malaysia 3,305,349 3,419,868 3.26 _______________________________________________ ____________________________________________________________ __________________________________________________
Mexico Alfa SAB de CV MXN 165,400 350,854 348,733 0.33America Movil SAB de CV MXN 1,214,800 1,419,011 1,393,849 1.33Arca Continental SAB de CV MXN 28,400 208,202 210,146 0.20
124
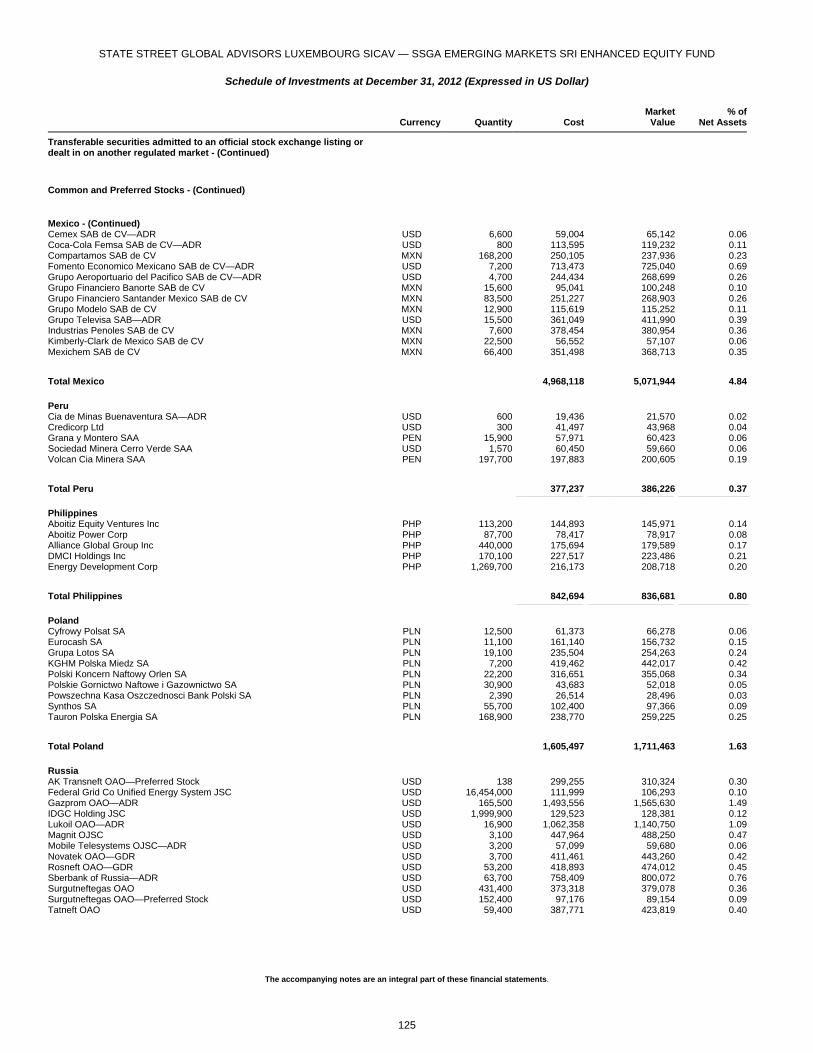
STATE STREET GLOBAL ADVISORS LUXEMBOURG SICAV — SSGA EMERGING MARKETS SRI ENHANCED EQUITY FUND
Schedule of Investments at December 31, 2012 (Expressed in US Dollar)
The accompanying notes are an integral part of these financial statements.
Currency Quantity Cost
MarketValue
% ofNet Assets
Transferable securities admitted to an official stock exchange listing or dealt in on another regulated market - (Continued)
Common and Preferred Stocks - (Continued)
Mexico - (Continued) Cemex SAB de CV—ADR USD 6,600 59,004 65,142 0.06Coca-Cola Femsa SAB de CV—ADR USD 800 113,595 119,232 0.11Compartamos SAB de CV MXN 168,200 250,105 237,936 0.23Fomento Economico Mexicano SAB de CV—ADR USD 7,200 713,473 725,040 0.69Grupo Aeroportuario del Pacifico SAB de CV—ADR USD 4,700 244,434 268,699 0.26Grupo Financiero Banorte SAB de CV MXN 15,600 95,041 100,248 0.10Grupo Financiero Santander Mexico SAB de CV MXN 83,500 251,227 268,903 0.26Grupo Modelo SAB de CV MXN 12,900 115,619 115,252 0.11Grupo Televisa SAB—ADR USD 15,500 361,049 411,990 0.39Industrias Penoles SAB de CV MXN 7,600 378,454 380,954 0.36Kimberly-Clark de Mexico SAB de CV MXN 22,500 56,552 57,107 0.06Mexichem SAB de CV MXN 66,400 351,498 368,713 0.35
Total Mexico 4,968,118 5,071,944 4.84 _______________________________________________ ____________________________________________________________ __________________________________________________
Peru Cia de Minas Buenaventura SA—ADR USD 600 19,436 21,570 0.02Credicorp Ltd USD 300 41,497 43,968 0.04Grana y Montero SAA PEN 15,900 57,971 60,423 0.06Sociedad Minera Cerro Verde SAA USD 1,570 60,450 59,660 0.06Volcan Cia Minera SAA PEN 197,700 197,883 200,605 0.19
Total Peru 377,237 386,226 0.37 _______________________________________________ ____________________________________________________________ __________________________________________________
Philippines Aboitiz Equity Ventures Inc PHP 113,200 144,893 145,971 0.14Aboitiz Power Corp PHP 87,700 78,417 78,917 0.08Alliance Global Group Inc PHP 440,000 175,694 179,589 0.17DMCI Holdings Inc PHP 170,100 227,517 223,486 0.21Energy Development Corp PHP 1,269,700 216,173 208,718 0.20
Total Philippines 842,694 836,681 0.80 _______________________________________________ ____________________________________________________________ __________________________________________________
Poland Cyfrowy Polsat SA PLN 12,500 61,373 66,278 0.06Eurocash SA PLN 11,100 161,140 156,732 0.15Grupa Lotos SA PLN 19,100 235,504 254,263 0.24KGHM Polska Miedz SA PLN 7,200 419,462 442,017 0.42Polski Koncern Naftowy Orlen SA PLN 22,200 316,651 355,068 0.34Polskie Gornictwo Naftowe i Gazownictwo SA PLN 30,900 43,683 52,018 0.05Powszechna Kasa Oszczednosci Bank Polski SA PLN 2,390 26,514 28,496 0.03Synthos SA PLN 55,700 102,400 97,366 0.09Tauron Polska Energia SA PLN 168,900 238,770 259,225 0.25
Total Poland 1,605,497 1,711,463 1.63 _______________________________________________ ____________________________________________________________ __________________________________________________
Russia AK Transneft OAO—Preferred Stock USD 138 299,255 310,324 0.30Federal Grid Co Unified Energy System JSC USD 16,454,000 111,999 106,293 0.10Gazprom OAO—ADR USD 165,500 1,493,556 1,565,630 1.49IDGC Holding JSC USD 1,999,900 129,523 128,381 0.12Lukoil OAO—ADR USD 16,900 1,062,358 1,140,750 1.09Magnit OJSC USD 3,100 447,964 488,250 0.47Mobile Telesystems OJSC—ADR USD 3,200 57,099 59,680 0.06Novatek OAO—GDR USD 3,700 411,461 443,260 0.42Rosneft OAO—GDR USD 53,200 418,893 474,012 0.45Sberbank of Russia—ADR USD 63,700 758,409 800,072 0.76Surgutneftegas OAO USD 431,400 373,318 379,078 0.36Surgutneftegas OAO—Preferred Stock USD 152,400 97,176 89,154 0.09Tatneft OAO USD 59,400 387,771 423,819 0.40
125

STATE STREET GLOBAL ADVISORS LUXEMBOURG SICAV — SSGA EMERGING MARKETS SRI ENHANCED EQUITY FUND
Schedule of Investments at December 31, 2012 (Expressed in US Dollar)
The accompanying notes are an integral part of these financial statements.
Currency Quantity Cost
MarketValue
% ofNet Assets
Transferable securities admitted to an official stock exchange listing or dealt in on another regulated market - (Continued)
Common and Preferred Stocks - (Continued)
Russia - (Continued) Uralkali OJSC—GDR USD 1,800 66,813 68,778 0.07
Total Russia 6,115,595 6,477,481 6.18 _______________________________________________ ____________________________________________________________ __________________________________________________
South Africa AngloGold Ashanti Ltd—ADR USD 16,700 510,744 523,879 0.50Assore Ltd ZAR 3,400 148,201 163,260 0.16Bidvest Group Ltd ZAR 9,400 225,044 238,745 0.23Clicks Group Ltd ZAR 28,800 214,279 220,335 0.21FirstRand Ltd ZAR 125,800 426,280 459,644 0.44Gold Fields Ltd—ADR USD 4,500 52,756 56,205 0.05Harmony Gold Mining Co Ltd—ADR USD 10,000 76,800 89,600 0.09Impala Platinum Holdings Ltd ZAR 2,900 47,251 57,320 0.05Investec Ltd ZAR 26,200 163,291 181,576 0.17Kumba Iron Ore Ltd ZAR 5,300 326,094 355,366 0.34Liberty Holdings Ltd ZAR 20,000 249,322 262,057 0.25Life Healthcare Group Holdings Ltd ZAR 80,400 294,975 322,191 0.31MMI Holdings Ltd ZAR 106,300 252,654 277,765 0.26Mr Price Group Ltd ZAR 19,200 290,517 316,817 0.30Naspers Ltd ZAR 7,300 452,475 467,371 0.45Netcare Ltd ZAR 98,600 200,085 228,359 0.22PPC Ltd ZAR 72,600 243,378 292,645 0.28Reunert Ltd ZAR 28,600 239,438 253,997 0.24RMI Holdings ZAR 21,900 55,944 53,121 0.05Sanlam Ltd ZAR 5,500 26,213 29,022 0.03Sasol Ltd—ADR USD 17,300 724,040 748,917 0.71Shoprite Holdings Ltd ZAR 18,200 396,905 438,676 0.42Spar Group Ltd ZAR 18,700 260,133 290,603 0.28Standard Bank Group Ltd ZAR 15,600 187,859 218,581 0.21Steinhoff International Holdings Ltd ZAR 95,100 290,719 307,457 0.29Tiger Brands Ltd ZAR 5,100 175,082 195,509 0.19Truworths International Ltd ZAR 29,300 327,131 375,281 0.36Vodacom Group Ltd ZAR 25,200 336,168 368,299 0.35Woolworths Holdings Ltd ZAR 45,100 364,845 377,410 0.36
Total South Africa 7,558,623 8,170,008 7.80 _______________________________________________ ____________________________________________________________ __________________________________________________
Taiwan Asustek Computer Inc TWD 36,000 396,136 404,766 0.39Chang Hwa Commercial Bank TWD 487,000 267,998 267,490 0.25Cheng Shin Rubber Industry Co Ltd TWD 106,000 279,760 275,230 0.26Chicony Electronics Co Ltd TWD 99,000 225,089 228,758 0.22China Steel Corp TWD 86,000 78,031 80,998 0.08Chinatrust Financial Holding Co Ltd TWD 396,000 239,261 233,872 0.22Chunghwa Telecom Co Ltd—ADR USD 3,900 124,970 126,126 0.12CTCI Corp TWD 36,000 68,869 71,160 0.07E.Sun Financial Holding Co Ltd TWD 470,000 267,479 263,008 0.25Farglory Land Development Co Ltd TWD 104,000 188,901 186,591 0.18First Financial Holding Co Ltd TWD 502,000 310,618 305,982 0.29Formosa International Hotels Corp TWD 17,000 209,006 228,021 0.22Formosa Plastics Corp TWD 29,000 77,682 78,495 0.07Fubon Financial Holding Co Ltd TWD 330,000 382,969 398,877 0.38Highwealth Construction Corp TWD 119,000 225,004 223,747 0.21Hon Hai Precision Industry Co Ltd TWD 317,000 1,048,154 970,464 0.93Huang Hsiang Construction Co TWD 79,000 197,574 201,043 0.19Innolux Corp TWD 627,000 315,090 336,830 0.32Inventec Corp TWD 398,000 152,381 152,819 0.15Largan Precision Co Ltd TWD 4,000 119,451 107,166 0.10MediaTek Inc TWD 12,000 137,703 133,682 0.13Mega Financial Holding Co Ltd TWD 470,000 367,915 365,784 0.35Nan Ya Plastics Corp TWD 14,000 25,550 26,998 0.03Novatek Microelectronics Corp TWD 63,000 262,295 254,916 0.24Pegatron Corp TWD 27,000 34,733 34,913 0.03Phison Electronics Corp TWD 20,000 133,065 132,580 0.13Pou Chen Corp TWD 96,000 103,584 100,830 0.10
126
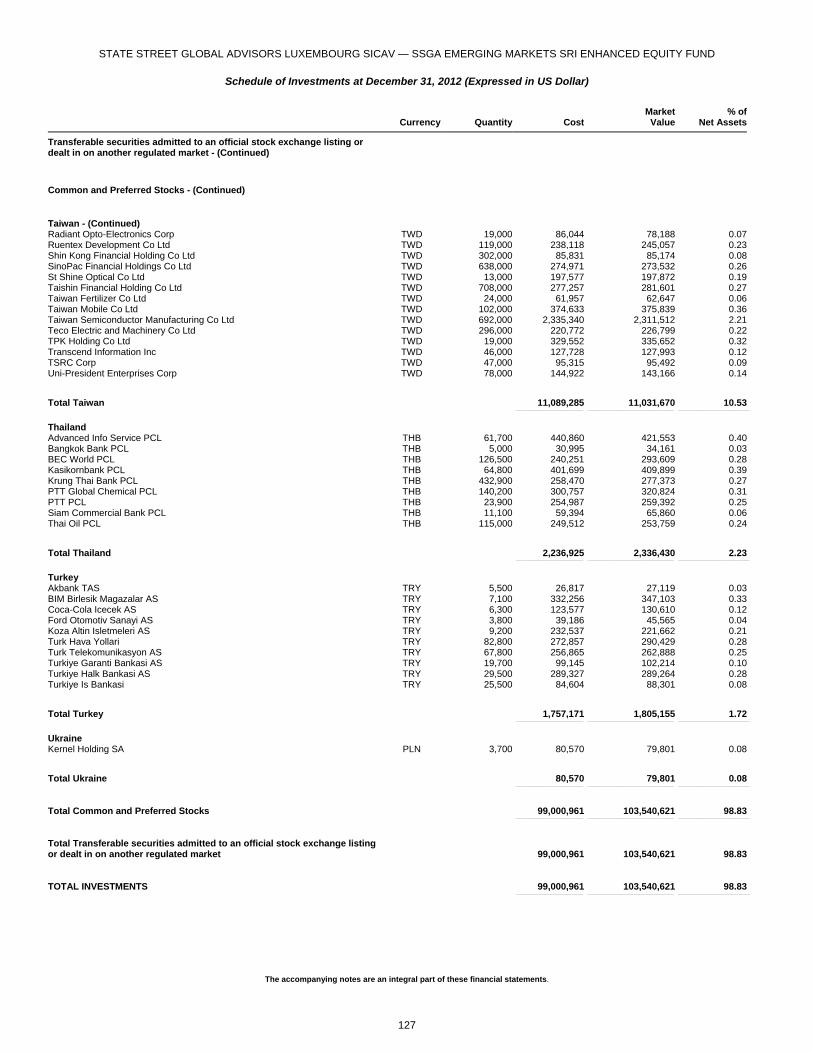
STATE STREET GLOBAL ADVISORS LUXEMBOURG SICAV — SSGA EMERGING MARKETS SRI ENHANCED EQUITY FUND
Schedule of Investments at December 31, 2012 (Expressed in US Dollar)
The accompanying notes are an integral part of these financial statements.
Currency Quantity Cost
MarketValue
% ofNet Assets
Transferable securities admitted to an official stock exchange listing or dealt in on another regulated market - (Continued)
Common and Preferred Stocks - (Continued)
Taiwan - (Continued) Radiant Opto-Electronics Corp TWD 19,000 86,044 78,188 0.07Ruentex Development Co Ltd TWD 119,000 238,118 245,057 0.23Shin Kong Financial Holding Co Ltd TWD 302,000 85,831 85,174 0.08SinoPac Financial Holdings Co Ltd TWD 638,000 274,971 273,532 0.26St Shine Optical Co Ltd TWD 13,000 197,577 197,872 0.19Taishin Financial Holding Co Ltd TWD 708,000 277,257 281,601 0.27Taiwan Fertilizer Co Ltd TWD 24,000 61,957 62,647 0.06Taiwan Mobile Co Ltd TWD 102,000 374,633 375,839 0.36Taiwan Semiconductor Manufacturing Co Ltd TWD 692,000 2,335,340 2,311,512 2.21Teco Electric and Machinery Co Ltd TWD 296,000 220,772 226,799 0.22TPK Holding Co Ltd TWD 19,000 329,552 335,652 0.32Transcend Information Inc TWD 46,000 127,728 127,993 0.12TSRC Corp TWD 47,000 95,315 95,492 0.09Uni-President Enterprises Corp TWD 78,000 144,922 143,166 0.14
Total Taiwan 11,089,285 11,031,670 10.53 _______________________________________________ ____________________________________________________________ __________________________________________________
Thailand Advanced Info Service PCL THB 61,700 440,860 421,553 0.40Bangkok Bank PCL THB 5,000 30,995 34,161 0.03BEC World PCL THB 126,500 240,251 293,609 0.28Kasikornbank PCL THB 64,800 401,699 409,899 0.39Krung Thai Bank PCL THB 432,900 258,470 277,373 0.27PTT Global Chemical PCL THB 140,200 300,757 320,824 0.31PTT PCL THB 23,900 254,987 259,392 0.25Siam Commercial Bank PCL THB 11,100 59,394 65,860 0.06Thai Oil PCL THB 115,000 249,512 253,759 0.24
Total Thailand 2,236,925 2,336,430 2.23 _______________________________________________ ____________________________________________________________ __________________________________________________
Turkey Akbank TAS TRY 5,500 26,817 27,119 0.03BIM Birlesik Magazalar AS TRY 7,100 332,256 347,103 0.33Coca-Cola Icecek AS TRY 6,300 123,577 130,610 0.12Ford Otomotiv Sanayi AS TRY 3,800 39,186 45,565 0.04Koza Altin Isletmeleri AS TRY 9,200 232,537 221,662 0.21Turk Hava Yollari TRY 82,800 272,857 290,429 0.28Turk Telekomunikasyon AS TRY 67,800 256,865 262,888 0.25Turkiye Garanti Bankasi AS TRY 19,700 99,145 102,214 0.10Turkiye Halk Bankasi AS TRY 29,500 289,327 289,264 0.28Turkiye Is Bankasi TRY 25,500 84,604 88,301 0.08
Total Turkey 1,757,171 1,805,155 1.72 _______________________________________________ ____________________________________________________________ __________________________________________________
Ukraine Kernel Holding SA PLN 3,700 80,570 79,801 0.08
Total Ukraine 80,570 79,801 0.08 _______________________________________________ ____________________________________________________________ __________________________________________________
Total Common and Preferred Stocks 99,000,961 103,540,621 98.83 _______________________________________________ ____________________________________________________________ __________________________________________________
Total Transferable securities admitted to an official stock exchange listing or dealt in on another regulated market 99,000,961 103,540,621 98.83 _______________________________________________ ____________________________________________________________ __________________________________________________
TOTAL INVESTMENTS 99,000,961 103,540,621 98.83 _______________________________________________ ____________________________________________________________ __________________________________________________
127

STATE STREET GLOBAL ADVISORS LUXEMBOURG SICAV — SSGA EMERGING MARKETS SRI ENHANCED EQUITY FUND
Schedule of Investments at December 31, 2012 (Expressed in US Dollar)
The accompanying notes are an integral part of these financial statements.
Derivatives
Futures Contracts - 0.01%
Description Currency
Number ofContracts
UnrealisedGain
% ofNet Assets
MSCI TAIWAN INDEX FUTURE, due 01/13 USD 14 5,250 0.01
Total Unrealised Gain on Futures Contracts 5,250 0.01 ____________________________________________________________ ___________________________________________________
Total Futures Contracts 5,250 0.01 ____________________________________________________________ ___________________________________________________
Other Net Assets/(Liabilities) 1,219,275 1.16 ____________________________________________________________ ___________________________________________________
TOTAL NET ASSETS 104,765,146 100.00 ____________________________________________________________ ___________________________________________________
128
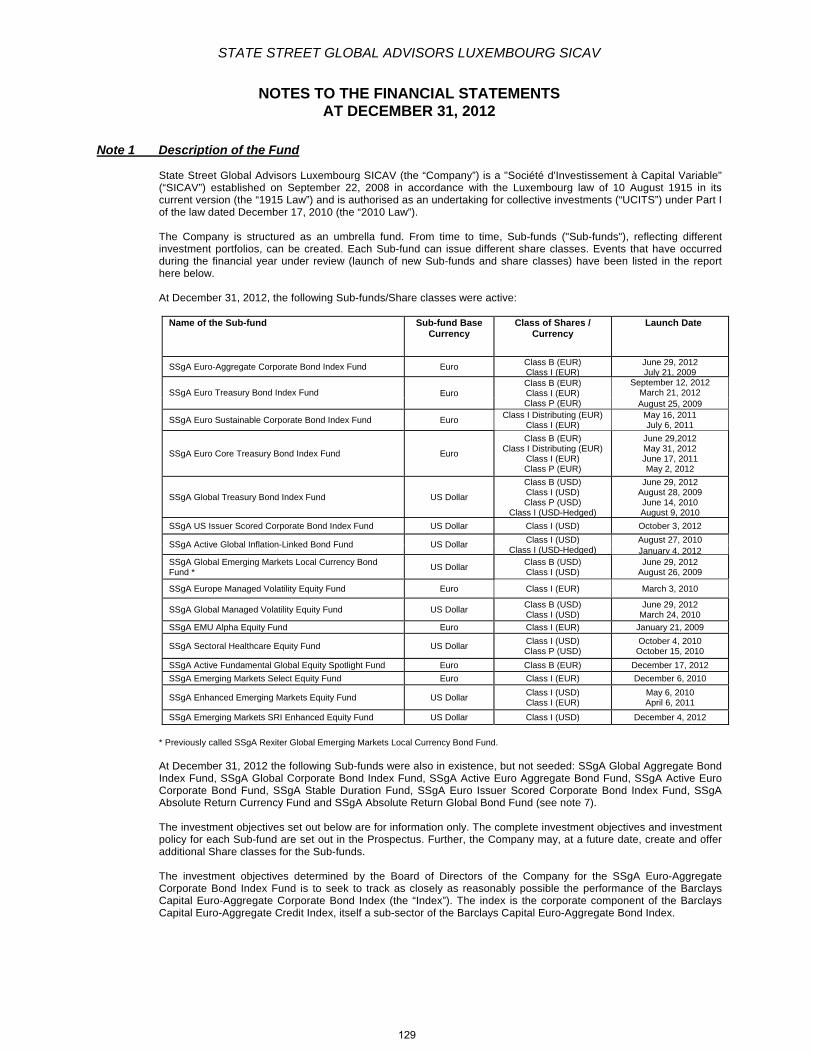
STATE STREET GLOBAL ADVISORS LUXEMBOURG SICAV
NOTES TO THE FINANCIAL STATEMENTS AT DECEMBER 31, 2012
Note 1 Description of the Fund State Street Global Advisors Luxembourg SICAV (the “Company”) is a "Société d'Investissement à Capital Variable" (“SICAV”) established on September 22, 2008 in accordance with the Luxembourg law of 10 August 1915 in its current version (the “1915 Law”) and is authorised as an undertaking for collective investments (“UCITS”) under Part I of the law dated December 17, 2010 (the “2010 Law”). The Company is structured as an umbrella fund. From time to time, Sub-funds ("Sub-funds"), reflecting different investment portfolios, can be created. Each Sub-fund can issue different share classes. Events that have occurred during the financial year under review (launch of new Sub-funds and share classes) have been listed in the report here below. At December 31, 2012, the following Sub-funds/Share classes were active:
Name of the Sub-fund Sub-fund Base Currency
Class of Shares / Currency
Launch Date
SSgA Euro-Aggregate Corporate Bond Index Fund Euro Class B (EUR) Class I (EUR)
June 29, 2012 July 21, 2009
SSgA Euro Treasury Bond Index Fund Euro
Class B (EUR) Class I (EUR) Class P (EUR)
September 12, 2012 March 21, 2012 August 25, 2009
SSgA Euro Sustainable Corporate Bond Index Fund Euro Class I Distributing (EUR)
Class I (EUR) May 16, 2011 July 6, 2011
SSgA Euro Core Treasury Bond Index Fund Euro
Class B (EUR) Class I Distributing (EUR)
Class I (EUR) Class P (EUR)
June 29,2012 May 31, 2012 June 17, 2011 May 2, 2012
SSgA Global Treasury Bond Index Fund US Dollar
Class B (USD) Class I (USD) Class P (USD)
Class I (USD-Hedged)
June 29, 2012 August 28, 2009 June 14, 2010 August 9, 2010
SSgA US Issuer Scored Corporate Bond Index Fund US Dollar Class I (USD) October 3, 2012
SSgA Active Global Inflation-Linked Bond Fund US Dollar Class I (USD) Class I (USD-Hedged)
August 27, 2010 January 4, 2012
SSgA Global Emerging Markets Local Currency Bond Fund *
US Dollar Class B (USD) Class I (USD)
June 29, 2012 August 26, 2009
SSgA Europe Managed Volatility Equity Fund Euro Class I (EUR) March 3, 2010
SSgA Global Managed Volatility Equity Fund US Dollar Class B (USD) Class I (USD)
June 29, 2012 March 24, 2010
SSgA EMU Alpha Equity Fund Euro Class I (EUR) January 21, 2009
SSgA Sectoral Healthcare Equity Fund US Dollar Class I (USD) Class P (USD)
October 4, 2010 October 15, 2010
SSgA Active Fundamental Global Equity Spotlight Fund Euro Class B (EUR) December 17, 2012
SSgA Emerging Markets Select Equity Fund Euro Class I (EUR) December 6, 2010
SSgA Enhanced Emerging Markets Equity Fund US Dollar Class I (USD) Class I (EUR)
May 6, 2010 April 6, 2011
SSgA Emerging Markets SRI Enhanced Equity Fund US Dollar Class I (USD) December 4, 2012
* Previously called SSgA Rexiter Global Emerging Markets Local Currency Bond Fund. At December 31, 2012 the following Sub-funds were also in existence, but not seeded: SSgA Global Aggregate Bond Index Fund, SSgA Global Corporate Bond Index Fund, SSgA Active Euro Aggregate Bond Fund, SSgA Active Euro Corporate Bond Fund, SSgA Stable Duration Fund, SSgA Euro Issuer Scored Corporate Bond Index Fund, SSgA Absolute Return Currency Fund and SSgA Absolute Return Global Bond Fund (see note 7). The investment objectives set out below are for information only. The complete investment objectives and investment policy for each Sub-fund are set out in the Prospectus. Further, the Company may, at a future date, create and offer additional Share classes for the Sub-funds. The investment objectives determined by the Board of Directors of the Company for the SSgA Euro-Aggregate Corporate Bond Index Fund is to seek to track as closely as reasonably possible the performance of the Barclays Capital Euro-Aggregate Corporate Bond Index (the “Index”). The index is the corporate component of the Barclays Capital Euro-Aggregate Credit Index, itself a sub-sector of the Barclays Capital Euro-Aggregate Bond Index.
129
STATE STREET GLOBAL ADVISORS LUXEMBOURG SICAV
NOTES TO THE FINANCIAL STATEMENTS AT DECEMBER 31, 2012 (continued)
The investment objectives determined by the Board of Directors of the Company for the SSgA Euro Treasury Bond Index Fund is to seek to track as closely as reasonably possible the performance of the Barclays Capital Euro Treasury Bond Index (the “Index”). The index is the Treasury component of the Barclays Capital Euro Government Bond Index, itself a sub-sector of the Barclays Capital Euro-Aggregate Bond Index. The investment objective determined by the Board of Directors of the Company for the SSgA Euro Sustainable Corporate Bond Index Fund is to seek to track as closely as reasonably possible the performance of the Markit iBoxx Euro Sustainable Corporate Bond Custom Index. The investment objective determined by the Board of Directors of the Company for the SSgA Euro Core Treasury Bond Index Fund is to seek to track as closely as reasonably possible the performance of a customised subset of the Barclays Capital Global Treasury Bond Index (the “Index”). The Index is composed of the following weighted indices: 40% Barclays Capital Global Treasury Germany Bond Index, 40% Barclays Capital Global Treasury France Bond Index and 20% Barclays Capital Global Treasury Netherlands Bond Index. The weights are rebalanced once a month. The investment objective determined by the Board of Directors of the Company for the SSgA Global Treasury Bond Index Fund is to seek to track as closely as reasonably possible the performance of the Barclays Capital Global Treasury Bond Index (the “Index”), a sub-sector of the Barclays Capital Global Aggregate Bond Index. The index for the class I USD Hedged Shares is the Barclays Capital Global Treasury Bond Index hedged into USD. The investment objective determined by the Board of Directors of the Company for the SSgA US Issuer Scored Corporate Bond Index Fund is to seek to track as closely as reasonably possible the performance of the Barclays Capital US Issuer Scored Corporate Index. The investment objective determined by the Board of Directors of the Company for the SSgA Active Global Inflation-Linked Bond Fund is to seek to outperform the performance of the Barclays Capital Global Inflation-Linked Bond Index over the long term. The investment objectives determined by the Board of Directors of the Company for the SSgA Global Emerging Markets Local Currency Bond Fund is to seek to provide a total investment return in excess of the performance of the JP Morgan Government Bond Index – Emerging Markets Global Diversified (the “Index”) over the long term. The Index provides investors with a benchmark that tracks local currency government bonds issued by emerging markets. The Index is ‘diversified’ as this version of the benchmark limits the weights of those Index countries with larger debt stocks and redistributes those weights to the countries with smaller weights. The maximum weight to a country is capped at 10%. Benchmark construction within this asset class is still in its infancy and the opportunity set is changing rapidly. The Sub-Investment Manager recognises these Index limitations and, consequently, the investment and portfolio construction process is designed to take both non-benchmark positions and positioning away from benchmark weightings, within defined risk tolerances. The investment objective determined by the Board of Directors of the Company for the SSgA Europe Managed Volatility Equity Fund is to seek to provide competitive returns relative to the MSCI Europe Index (Net) over the long term, while maintaining relatively low volatility. The investment objective determined by the Board of Directors of the Company for the SSgA Global Managed Volatility Equity Fund is to seek to provide competitive returns relative to the MSCI World Index (Net) over the long term, while maintaining relatively low volatility. The investment objectives determined by the Board of Directors of the Company for the SSgA EMU Alpha Equity Fund is to seek to provide an investment return in excess of the performance of the MSCI EMU® Index over the long term. The investment objective determined by the Board of Directors of the Company for the SSgA Sectoral Healthcare Equity Fund is to seek to outperform the MSCI Daily TR World Net Health Care USD Index over the long term. The investment objective determined by the Board of Directors of the Company for the SSgA Active Fundamental Global Equity Spotlight Fund is to seek to outperform the MSCI World Index by 3-4% per annum over rolling three years period. The investment objective determined by the Board of Directors of the Company for the SSgA Emerging Markets Select Equity Fund is to seek to outperform the MSCI Emerging Markets Free IndexSM over the long term. The investment objective determined by the Board of Directors of the Company for the SSgA Enhanced Emerging Markets Equity Fund is to seek to provide competitive returns relative to the MSCI Emerging Markets IndexSM over the long term. The investment objective determined by the Board of Directors of the Company for the SSgA Emerging Markets SRI Enhanced Equity Fund is to seek to provide an investment return in excess of the performance of the MSCI Emerging Markets IndexSM over the long term.
130
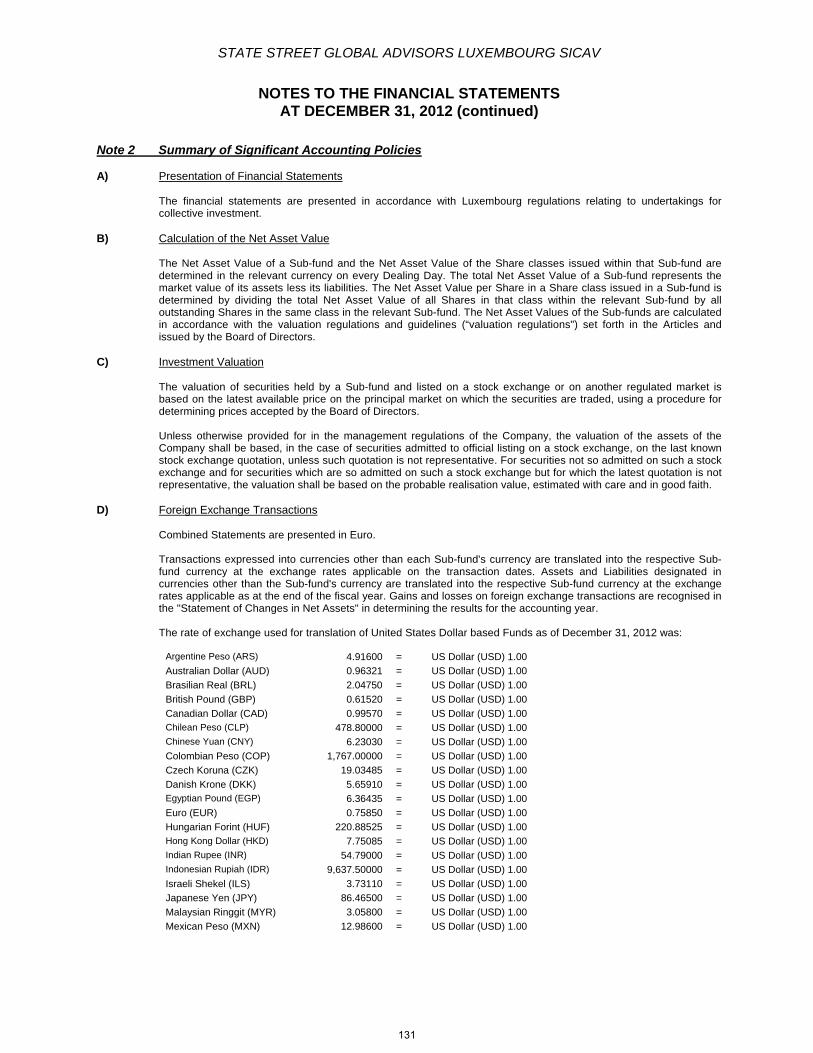
STATE STREET GLOBAL ADVISORS LUXEMBOURG SICAV
NOTES TO THE FINANCIAL STATEMENTS AT DECEMBER 31, 2012 (continued)
Note 2 Summary of Significant Accounting Policies
A) Presentation of Financial Statements The financial statements are presented in accordance with Luxembourg regulations relating to undertakings for collective investment.
B) Calculation of the Net Asset Value The Net Asset Value of a Sub-fund and the Net Asset Value of the Share classes issued within that Sub-fund are determined in the relevant currency on every Dealing Day. The total Net Asset Value of a Sub-fund represents the market value of its assets less its liabilities. The Net Asset Value per Share in a Share class issued in a Sub-fund is determined by dividing the total Net Asset Value of all Shares in that class within the relevant Sub-fund by all outstanding Shares in the same class in the relevant Sub-fund. The Net Asset Values of the Sub-funds are calculated in accordance with the valuation regulations and guidelines (“valuation regulations") set forth in the Articles and issued by the Board of Directors.
C) Investment Valuation The valuation of securities held by a Sub-fund and listed on a stock exchange or on another regulated market is based on the latest available price on the principal market on which the securities are traded, using a procedure for determining prices accepted by the Board of Directors. Unless otherwise provided for in the management regulations of the Company, the valuation of the assets of the Company shall be based, in the case of securities admitted to official listing on a stock exchange, on the last known stock exchange quotation, unless such quotation is not representative. For securities not so admitted on such a stock exchange and for securities which are so admitted on such a stock exchange but for which the latest quotation is not representative, the valuation shall be based on the probable realisation value, estimated with care and in good faith.
D) Foreign Exchange Transactions Combined Statements are presented in Euro. Transactions expressed into currencies other than each Sub-fund's currency are translated into the respective Sub-fund currency at the exchange rates applicable on the transaction dates. Assets and Liabilities designated in currencies other than the Sub-fund's currency are translated into the respective Sub-fund currency at the exchange rates applicable as at the end of the fiscal year. Gains and losses on foreign exchange transactions are recognised in the "Statement of Changes in Net Assets" in determining the results for the accounting year. The rate of exchange used for translation of United States Dollar based Funds as of December 31, 2012 was:
Argentine Peso (ARS) 4.91600 = US Dollar (USD) 1.00
Australian Dollar (AUD) 0.96321 = US Dollar (USD) 1.00
Brasilian Real (BRL) 2.04750 = US Dollar (USD) 1.00
British Pound (GBP) 0.61520 = US Dollar (USD) 1.00
Canadian Dollar (CAD) 0.99570 = US Dollar (USD) 1.00Chilean Peso (CLP) 478.80000 = US Dollar (USD) 1.00Chinese Yuan (CNY) 6.23030 = US Dollar (USD) 1.00
Colombian Peso (COP) 1,767.00000 = US Dollar (USD) 1.00
Czech Koruna (CZK) 19.03485 = US Dollar (USD) 1.00
Danish Krone (DKK) 5.65910 = US Dollar (USD) 1.00Egyptian Pound (EGP) 6.36435 = US Dollar (USD) 1.00
Euro (EUR) 0.75850 = US Dollar (USD) 1.00
Hungarian Forint (HUF) 220.88525 = US Dollar (USD) 1.00Hong Kong Dollar (HKD) 7.75085 = US Dollar (USD) 1.00Indian Rupee (INR) 54.79000 = US Dollar (USD) 1.00Indonesian Rupiah (IDR) 9,637.50000 = US Dollar (USD) 1.00
Israeli Shekel (ILS) 3.73110 = US Dollar (USD) 1.00
Japanese Yen (JPY) 86.46500 = US Dollar (USD) 1.00
Malaysian Ringgit (MYR) 3.05800 = US Dollar (USD) 1.00
Mexican Peso (MXN) 12.98600 = US Dollar (USD) 1.00
131
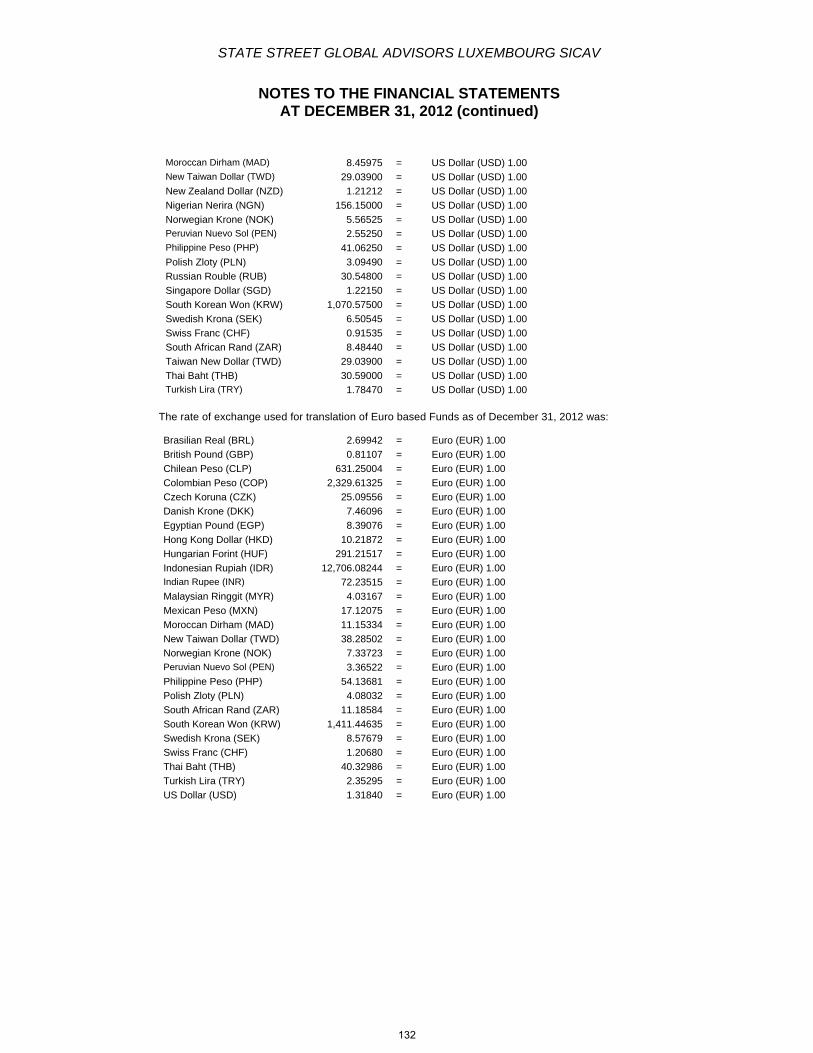
STATE STREET GLOBAL ADVISORS LUXEMBOURG SICAV
NOTES TO THE FINANCIAL STATEMENTS AT DECEMBER 31, 2012 (continued)
Moroccan Dirham (MAD) 8.45975 = US Dollar (USD) 1.00New Taiwan Dollar (TWD) 29.03900 = US Dollar (USD) 1.00
New Zealand Dollar (NZD) 1.21212 = US Dollar (USD) 1.00
Nigerian Nerira (NGN) 156.15000 = US Dollar (USD) 1.00
Norwegian Krone (NOK) 5.56525 = US Dollar (USD) 1.00Peruvian Nuevo Sol (PEN) 2.55250 = US Dollar (USD) 1.00Philippine Peso (PHP) 41.06250 = US Dollar (USD) 1.00
Polish Zloty (PLN) 3.09490 = US Dollar (USD) 1.00
Russian Rouble (RUB) 30.54800 = US Dollar (USD) 1.00
Singapore Dollar (SGD) 1.22150 = US Dollar (USD) 1.00
South Korean Won (KRW) 1,070.57500 = US Dollar (USD) 1.00
Swedish Krona (SEK) 6.50545 = US Dollar (USD) 1.00
Swiss Franc (CHF) 0.91535 = US Dollar (USD) 1.00
South African Rand (ZAR) 8.48440 = US Dollar (USD) 1.00
Taiwan New Dollar (TWD) 29.03900 = US Dollar (USD) 1.00
Thai Baht (THB) 30.59000 = US Dollar (USD) 1.00Turkish Lira (TRY) 1.78470 = US Dollar (USD) 1.00
The rate of exchange used for translation of Euro based Funds as of December 31, 2012 was: Brasilian Real (BRL) 2.69942 = Euro (EUR) 1.00
British Pound (GBP) 0.81107 = Euro (EUR) 1.00
Chilean Peso (CLP) 631.25004 = Euro (EUR) 1.00
Colombian Peso (COP) 2,329.61325 = Euro (EUR) 1.00
Czech Koruna (CZK) 25.09556 = Euro (EUR) 1.00
Danish Krone (DKK) 7.46096 = Euro (EUR) 1.00
Egyptian Pound (EGP) 8.39076 = Euro (EUR) 1.00
Hong Kong Dollar (HKD) 10.21872 = Euro (EUR) 1.00
Hungarian Forint (HUF) 291.21517 = Euro (EUR) 1.00
Indonesian Rupiah (IDR) 12,706.08244 = Euro (EUR) 1.00Indian Rupee (INR) 72.23515 = Euro (EUR) 1.00
Malaysian Ringgit (MYR) 4.03167 = Euro (EUR) 1.00
Mexican Peso (MXN) 17.12075 = Euro (EUR) 1.00
Moroccan Dirham (MAD) 11.15334 = Euro (EUR) 1.00
New Taiwan Dollar (TWD) 38.28502 = Euro (EUR) 1.00
Norwegian Krone (NOK) 7.33723 = Euro (EUR) 1.00Peruvian Nuevo Sol (PEN) 3.36522 = Euro (EUR) 1.00
Philippine Peso (PHP) 54.13681 = Euro (EUR) 1.00
Polish Zloty (PLN) 4.08032 = Euro (EUR) 1.00
South African Rand (ZAR) 11.18584 = Euro (EUR) 1.00
South Korean Won (KRW) 1,411.44635 = Euro (EUR) 1.00
Swedish Krona (SEK) 8.57679 = Euro (EUR) 1.00
Swiss Franc (CHF) 1.20680 = Euro (EUR) 1.00
Thai Baht (THB) 40.32986 = Euro (EUR) 1.00
Turkish Lira (TRY) 2.35295 = Euro (EUR) 1.00
US Dollar (USD) 1.31840 = Euro (EUR) 1.00
132

STATE STREET GLOBAL ADVISORS LUXEMBOURG SICAV
NOTES TO THE FINANCIAL STATEMENTS AT DECEMBER 31, 2012 (continued)
E) Options, Futures and Swaps Contracts Valuation of the derivatives and structured products used is performed at each valuation date by use of the mark-to-market principle. The value of futures contracts which are quoted or traded on any exchange is based on the last available price on that exchange on the applicable Valuation Day. The value of futures contracts traded on another market is based on the last available price on this market on the applicable Valuation Day. In the event that any of these assets on the Valuation Day is not quoted or traded on any exchange or other market or if the price is not representative of the fair value, the value of such an asset is determined prudently and in good faith on the basis of the estimated settlement or sales price. Futures contracts involve, to varying degrees, risk of loss in excess of the values reflected in the Sub-Fund’s Statement of Net Assets. The underlying face amount at value of any open futures contracts at the period-end is shown in the Schedule of Investments of the relevant Sub-funds. This amount reflects each contract’s exposure to the underlying instrument at the period-end. Losses may arise from changes in the value of the underlying instruments or if the counterparties do not perform under the contracts’ terms. Gains (losses) are realised upon expiration or closing of the futures contracts. Options are contracts entitling the holder to purchase or sell a specified number of shares or units of a particular security at a specified price at any time until the contract-stated expiration date. Options purchased are recorded as investments; options written (sold) are recorded as liabilities. When the exercise of an option results in a cash settlement, the difference between the premium (original option value) and the settlement proceeds is accounted for as a realised gain or loss. When securities are acquired or delivered upon exercise of an option, the acquisition cost or sale proceeds are adjusted by the amount of the premium. When an option is closed, the difference between the premium and the cost to close the position is accounted for as a realised gain or loss. When an option expires, the premium is accounted for as a realised gain or loss for options written or as a realised loss for options purchased. The risks include price movements in the underlying securities, the possibility there may be an illiquid options market, and/or the inability of the counterparties to fulfil their obligations under the contract. (a) Hedges against market risks and risks associated with stock market performance:
For the purpose of hedging against poor market performance, the Company may, for each Sub-fund, sell forward transactions and call options on share price indexes, bond market indexes or other indexes or financial instruments or buy put options on share price indexes, bond market indexes or other indexes or buy financial instruments or enter into swaps in which the payments between the Company and the counterparty depend on the development of certain share price indexes, bond market indexes or other indexes or financial instruments. As these call and put transactions are for hedging purposes, there must be a sufficient correlation between the structure of the securities portfolio to be hedged and the composition of the stock index employed.
(b) Hedges against interest rate risks: For the purpose of hedging against the risks associated with changes in interest rates the Company may sell interest rate futures and call options on interest rates, buy put options on interest rates and enter into interest rate swaps, forward rate agreements and options on interest rate swaps (swaptions) with highly rated financial institutions specialising in this kind of transactions as part of OTC transactions for each Sub-fund.
(c) Hedges against inflation risks: For the purpose of hedging against risks resulting from an unexpected acceleration of inflation, the Company may conclude so-called inflation swaps with highly rated financial institutions specialising in this type of transaction as part of OTC transactions or make use of other instruments to hedge against inflation for each Sub-fund.
(d) Hedges against credit default risk and the risk of a deterioration in a borrower's credit standing: For the purpose of hedging against credit default risk and the risk of losses owing to a deterioration in the borrower's credit standing, the Company may engage in credit options, credit spread swaps ("CSS"), credit default swaps ("CDS"), CDS (index) baskets, credit-linked total return swaps and similar credit derivatives with highly rated financial institutions specialising in this kind of transactions as part of OTC transactions for each Sub-fund. As at December 31, 2012, the Company had outstanding futures contracts that are detailed in the schedule of investments. There are no swaps or OTC contracts open at the year end.
133
STATE STREET GLOBAL ADVISORS LUXEMBOURG SICAV
NOTES TO THE FINANCIAL STATEMENTS AT DECEMBER 31, 2012 (continued)
F) Repurchase Agreements (Repos) The Company may as buyer or seller enter into repurchase agreements. A repurchase agreement is an agreement under which, on payment of the purchase price, the fund receives (purchases) securities from a seller who agrees to repurchase them at or within a specified time at a specified price. A repurchase agreement is similar in effect to a loan by the fund to the seller collateralised by the securities. The fund does not record the purchase of the securities received but does record the repurchase agreement as if it were a loan, and is disclosed in the Combined Statement of Net Assets under “Receivable for repurchase agreements”, including any interest receivable on such transaction. Because a repurchase agreement between the two specific parties involved is generally for a relatively short time and is not transferable, it is not readily marketable. The fund carries repurchase agreements at cost, which, combined with accrued interest, approximates market value. The interest received is recorded in the Combined Statement of Operations and Changes in Net Assets under “Interest income”. There was no outstanding repurchase agreement made by the Company as at December 31, 2012.
G) Forward Foreign Exchange Contracts Each Sub-fund may buy and sell forward currency contracts, which are agreements between two parties to buy and sell currencies at a set price on a future date. These contracts are used to protect against a decline in value relative to the sub fund’s currency as compared to the currencies in which its portfolio securities are denominated or for other investment purposes. The value of forward currency contracts is determined using current forward currency exchange rates supplied by a quotation service. The market value of the contract will fluctuate with changes in currency exchange rates. The contract is marked to market daily and the change in market value is recorded as an unrealised gain or loss. When the contract is closed, the fund records a realised gain or loss equal to the difference between the value of the contract at the time it was opened and the value at the time it was closed. The fund could be exposed to risk if the value of the currency changes unfavourably, if the counterparties to the contracts are unable to meet the terms of their contracts or if the fund is unable to enter into a closing position. Risks may exceed amounts recognised on the Combined Statement of Net Assets. Forward currency contracts outstanding at period end, if any, are listed in the Schedule of Investments of the relevant Sub-funds.
H) Security transactions and related investment income Security transactions are recorded on the trade date (the date the order to buy or sell is executed). Gains or losses on securities are determined on the average cost basis. Interest income is recorded on the accrual basis. Dividend income, net of applicable withholding taxes, is recognised on the ex-dividend date or as soon as the fund is informed of the ex-dividend date. Non-cash dividends, if any, are recorded at the fair market value of the securities received. All premiums/discounts are amortised/accreted on a yield-to maturity basis.
I) Organisation Costs The organisation costs and expenses of the Company or individual Sub-funds and the initial issue of its shares have been capitalised and are amortised on a straight-line basis over a period of five years from the date of commencement of the Company or individual Sub-funds.
J) To be announced securities The Company may invest in mortgage-backed securities To Be Announced (“TBA”) commitments. These commitments reflect future dated purchases and sales of agency Mortgage Backed Securities (“MBS”).
Note 3 Fees and Expenses
A) Custodian, Central Administrator, Registrar and Transfer Agent and Paying Agent Fees The fees payable to the Custodian and to the Central Administrator, Registrar and Transfer Agent and Paying Agent are at such rates and/or amounts as may be agreed from time to time with the Company in accordance with customary banking practice in Luxembourg. The maximum fee payable to the Custodian is 0.50% per annum and to the Central Administrator, Registrar and Transfer Agent and Paying Agent is 0.025% per annum (excluding specific fees payable for the processing of multiple Share Classes), in each case based on the Net Asset Value of the relevant Sub-fund. In addition, the Custodian and the Central Administrator, Paying Agent, Registrar and Transfer Agent are entitled, as the case may be, to a charge per transaction, a flat fee for certain services or products, reimbursements by the Company for out-of-pocket expenses and disbursements and for charges of any correspondents.
134

STATE STREET GLOBAL ADVISORS LUXEMBOURG SICAV
NOTES TO THE FINANCIAL STATEMENTS AT DECEMBER 31, 2012 (continued)
B) Investment Management Fees The Sub-funds listed in this report, funded as at December 31, 2012 paid the following management fees:
Name of the Sub-fund Share Classes Management Fee in %
SSgA Euro-Aggregate Corporate Bond Index Fund Class B (EUR) 0.00%
Class I (EUR) 0.15%
SSgA Euro Treasury Bond Index Fund
Class B (EUR) 0.00%
Class I (EUR) 0.15%
Class P (EUR) 0.30%
SSgA Euro Sustainable Corporate Bond index Fund Class I Distributing (EUR) 0.20%
Class I (EUR) 0.20%
SSgA Euro Core Treasury Bond Index Fund
Class B (EUR) 0.00%
Class I Distributing (EUR) 0.15%
Class I (EUR) 0.15%
Class P (EUR) 0.30%
SSgA Global Treasury Bond Index Fund
Class B (USD) 0.00%
Class I (USD) 0.15%
Class P (USD) 0.30%
Class I (USD-Hedged) 0.18%
SSgA US Issuer Scored Corporate Bond Index Fund Class I (USD) 0.20%
SSgA Active Global Inflation-Linked Bond Fund Class I (USD) 0.35%
Class I (USD-Hedged) 0.38%
SSgA Global Emerging Markets Local Currency Bond Fund * Class B (USD) 0.00%
Class I (USD) 0.85%
SSgA Europe Managed Volatility Equity Fund Class I (EUR) 0.20%
SSgA Global Managed Volatility Equity Fund Class B (USD) 0.00%
Class I (USD) 0.20%
SSgA EMU Alpha Equity Fund Class I (EUR) 0.50%
SSgA Sectoral Healthcare Equity Fund Class I (USD) 0.75%
Class P (USD) 1.50%
SSgA Active Fundamental Global Equity Spotlight Fund Class B (EUR) 0.00%
SSgA Emerging Markets Select Equity Fund Class I (EUR) 0.98%
SSgA Enhanced Emerging Markets Equity Fund Class I (USD) 0.45%
Class I (EUR) 0.45%
SSgA Emerging Markets SRI Enhanced Equity Fund Class I (USD) 0.48%
* Previously called SSgA Rexiter Global Emerging Markets Local Currency Bond Fund. These management fees will be accrued daily based on the Net Asset Value of the Sub-funds as of the relevant Dealing Day and will be paid monthly in arrears. The total expense ratios (“TER”) attributable to the Share classes of the Sub-funds, as set out below, incorporate the fees and expenses of the Investment Manager, Central Administrator, Custodian, any distribution fee not covered by the Subscription Fee where appropriate, and certain other expenses of the relevant Sub-fund set forth in the Prospectus. The Investment Manager has voluntarily agreed to reimburse such portions of its fees as is necessary to ensure that the total expense ratio attributable to all Shares shall currently not exceed the following rates set forth below. The Investment Manager reserves the right, at a future date, to cease any such reimbursements. The below table discloses the applicable rates as at December 31, 2012.
Name of the Sub-fund Share Classes Maximum TER in %
SSgA Euro-Aggregate Corporate Bond Index Fund Class B (EUR) 0.10%
Class I (EUR) 0.25%
SSgA Euro Treasury Bond Index Fund
Class B (EUR) 0.10%
Class I (EUR) 0.25%
Class P (EUR) 0.40%
SSgA Euro Sustainable Corporate Bond Index Fund Class I Distributing (EUR) 0.32%
Class I (EUR) 0.32%
SSgA Euro Core Treasury Bond Index Fund
Class B (EUR) 0.10%
Class I Distributing (EUR) 0.25%
Class I (EUR) 0.25%
Class P (EUR) 0.40%
SSgA Global Treasury Bond Index Fund Class B (USD) 0.10%
Class I (USD) 0.25%
135
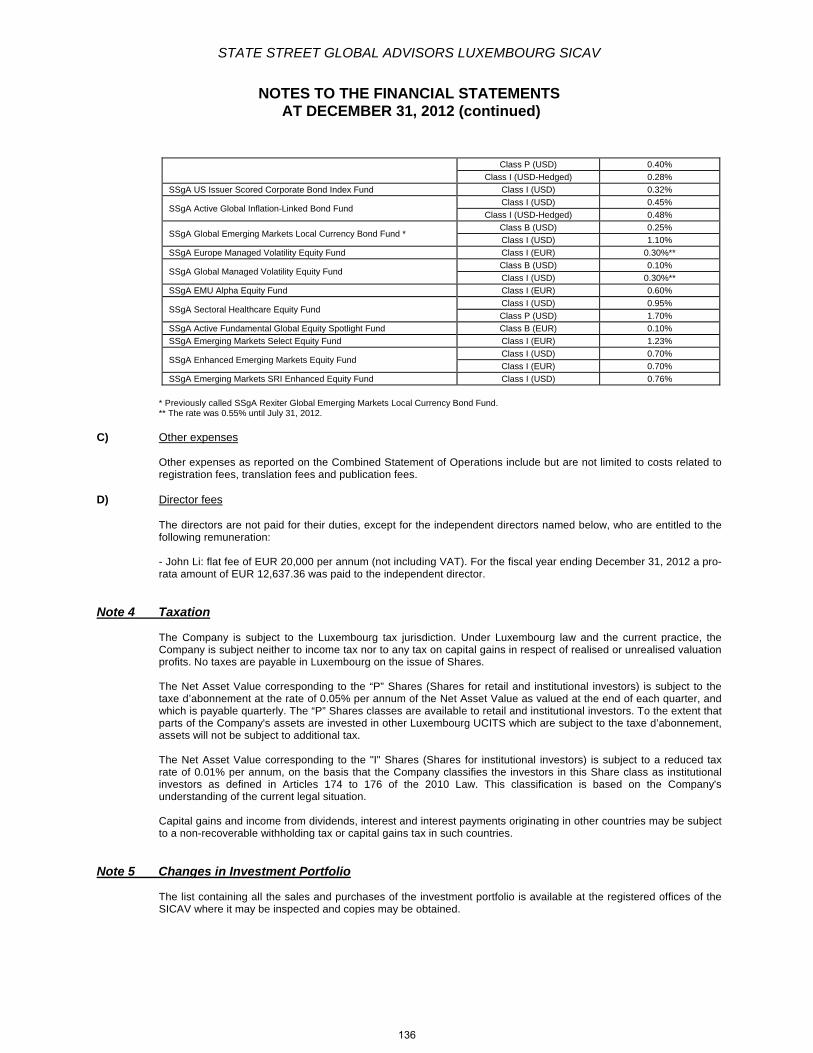
STATE STREET GLOBAL ADVISORS LUXEMBOURG SICAV
NOTES TO THE FINANCIAL STATEMENTS AT DECEMBER 31, 2012 (continued)
Class P (USD) 0.40%
Class I (USD-Hedged) 0.28%
SSgA US Issuer Scored Corporate Bond Index Fund Class I (USD) 0.32%
SSgA Active Global Inflation-Linked Bond Fund Class I (USD) 0.45%
Class I (USD-Hedged) 0.48%
SSgA Global Emerging Markets Local Currency Bond Fund * Class B (USD) 0.25%
Class I (USD) 1.10%
SSgA Europe Managed Volatility Equity Fund Class I (EUR) 0.30%**
SSgA Global Managed Volatility Equity Fund Class B (USD) 0.10%
Class I (USD) 0.30%**
SSgA EMU Alpha Equity Fund Class I (EUR) 0.60%
SSgA Sectoral Healthcare Equity Fund Class I (USD) 0.95%
Class P (USD) 1.70%
SSgA Active Fundamental Global Equity Spotlight Fund Class B (EUR) 0.10%
SSgA Emerging Markets Select Equity Fund Class I (EUR) 1.23%
SSgA Enhanced Emerging Markets Equity Fund Class I (USD) 0.70%
Class I (EUR) 0.70%
SSgA Emerging Markets SRI Enhanced Equity Fund Class I (USD) 0.76%
* Previously called SSgA Rexiter Global Emerging Markets Local Currency Bond Fund. ** The rate was 0.55% until July 31, 2012.
C) Other expenses Other expenses as reported on the Combined Statement of Operations include but are not limited to costs related to registration fees, translation fees and publication fees.
D) Director fees The directors are not paid for their duties, except for the independent directors named below, who are entitled to the following remuneration: - John Li: flat fee of EUR 20,000 per annum (not including VAT). For the fiscal year ending December 31, 2012 a pro-rata amount of EUR 12,637.36 was paid to the independent director.
Note 4 Taxation The Company is subject to the Luxembourg tax jurisdiction. Under Luxembourg law and the current practice, the Company is subject neither to income tax nor to any tax on capital gains in respect of realised or unrealised valuation profits. No taxes are payable in Luxembourg on the issue of Shares. The Net Asset Value corresponding to the “P” Shares (Shares for retail and institutional investors) is subject to the taxe d’abonnement at the rate of 0.05% per annum of the Net Asset Value as valued at the end of each quarter, and which is payable quarterly. The “P” Shares classes are available to retail and institutional investors. To the extent that parts of the Company's assets are invested in other Luxembourg UCITS which are subject to the taxe d’abonnement, assets will not be subject to additional tax. The Net Asset Value corresponding to the "I" Shares (Shares for institutional investors) is subject to a reduced tax rate of 0.01% per annum, on the basis that the Company classifies the investors in this Share class as institutional investors as defined in Articles 174 to 176 of the 2010 Law. This classification is based on the Company's understanding of the current legal situation. Capital gains and income from dividends, interest and interest payments originating in other countries may be subject to a non-recoverable withholding tax or capital gains tax in such countries.
Note 5 Changes in Investment Portfolio The list containing all the sales and purchases of the investment portfolio is available at the registered offices of the SICAV where it may be inspected and copies may be obtained.
136
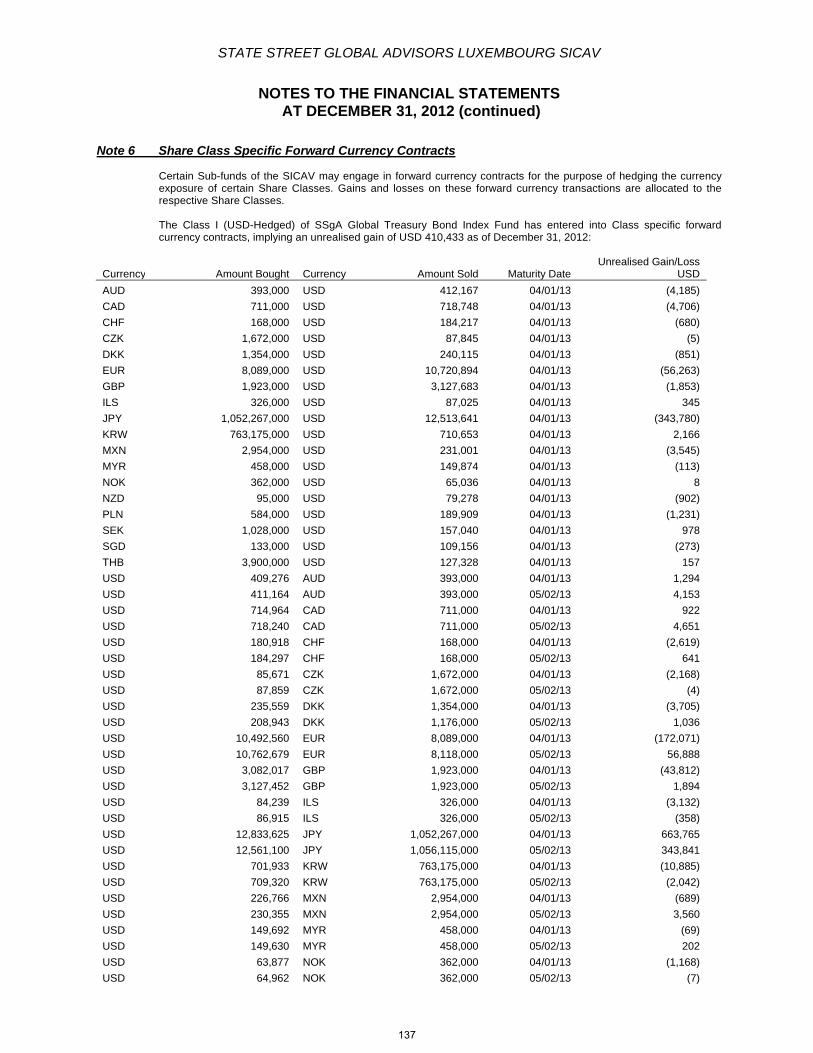
STATE STREET GLOBAL ADVISORS LUXEMBOURG SICAV
NOTES TO THE FINANCIAL STATEMENTS AT DECEMBER 31, 2012 (continued)
Note 6 Share Class Specific Forward Currency Contracts Certain Sub-funds of the SICAV may engage in forward currency contracts for the purpose of hedging the currency exposure of certain Share Classes. Gains and losses on these forward currency transactions are allocated to the respective Share Classes. The Class I (USD-Hedged) of SSgA Global Treasury Bond Index Fund has entered into Class specific forward currency contracts, implying an unrealised gain of USD 410,433 as of December 31, 2012:
Currency Amount Bought Currency Amount Sold Maturity Date Unrealised Gain/Loss
USD
AUD 393,000 USD 412,167 04/01/13 (4,185)
CAD 711,000 USD 718,748 04/01/13 (4,706)
CHF 168,000 USD 184,217 04/01/13 (680)
CZK 1,672,000 USD 87,845 04/01/13 (5)
DKK 1,354,000 USD 240,115 04/01/13 (851)
EUR 8,089,000 USD 10,720,894 04/01/13 (56,263)
GBP 1,923,000 USD 3,127,683 04/01/13 (1,853)
ILS 326,000 USD 87,025 04/01/13 345
JPY 1,052,267,000 USD 12,513,641 04/01/13 (343,780)
KRW 763,175,000 USD 710,653 04/01/13 2,166
MXN 2,954,000 USD 231,001 04/01/13 (3,545)
MYR 458,000 USD 149,874 04/01/13 (113)
NOK 362,000 USD 65,036 04/01/13 8
NZD 95,000 USD 79,278 04/01/13 (902)
PLN 584,000 USD 189,909 04/01/13 (1,231)
SEK 1,028,000 USD 157,040 04/01/13 978
SGD 133,000 USD 109,156 04/01/13 (273)
THB 3,900,000 USD 127,328 04/01/13 157
USD 409,276 AUD 393,000 04/01/13 1,294
USD 411,164 AUD 393,000 05/02/13 4,153
USD 714,964 CAD 711,000 04/01/13 922
USD 718,240 CAD 711,000 05/02/13 4,651
USD 180,918 CHF 168,000 04/01/13 (2,619)
USD 184,297 CHF 168,000 05/02/13 641
USD 85,671 CZK 1,672,000 04/01/13 (2,168)
USD 87,859 CZK 1,672,000 05/02/13 (4)
USD 235,559 DKK 1,354,000 04/01/13 (3,705)
USD 208,943 DKK 1,176,000 05/02/13 1,036
USD 10,492,560 EUR 8,089,000 04/01/13 (172,071)
USD 10,762,679 EUR 8,118,000 05/02/13 56,888
USD 3,082,017 GBP 1,923,000 04/01/13 (43,812)
USD 3,127,452 GBP 1,923,000 05/02/13 1,894
USD 84,239 ILS 326,000 04/01/13 (3,132)
USD 86,915 ILS 326,000 05/02/13 (358)
USD 12,833,625 JPY 1,052,267,000 04/01/13 663,765
USD 12,561,100 JPY 1,056,115,000 05/02/13 343,841
USD 701,933 KRW 763,175,000 04/01/13 (10,885)
USD 709,320 KRW 763,175,000 05/02/13 (2,042)
USD 226,766 MXN 2,954,000 04/01/13 (689)
USD 230,355 MXN 2,954,000 05/02/13 3,560
USD 149,692 MYR 458,000 04/01/13 (69)
USD 149,630 MYR 458,000 05/02/13 202
USD 63,877 NOK 362,000 04/01/13 (1,168)
USD 64,962 NOK 362,000 05/02/13 (7)
137
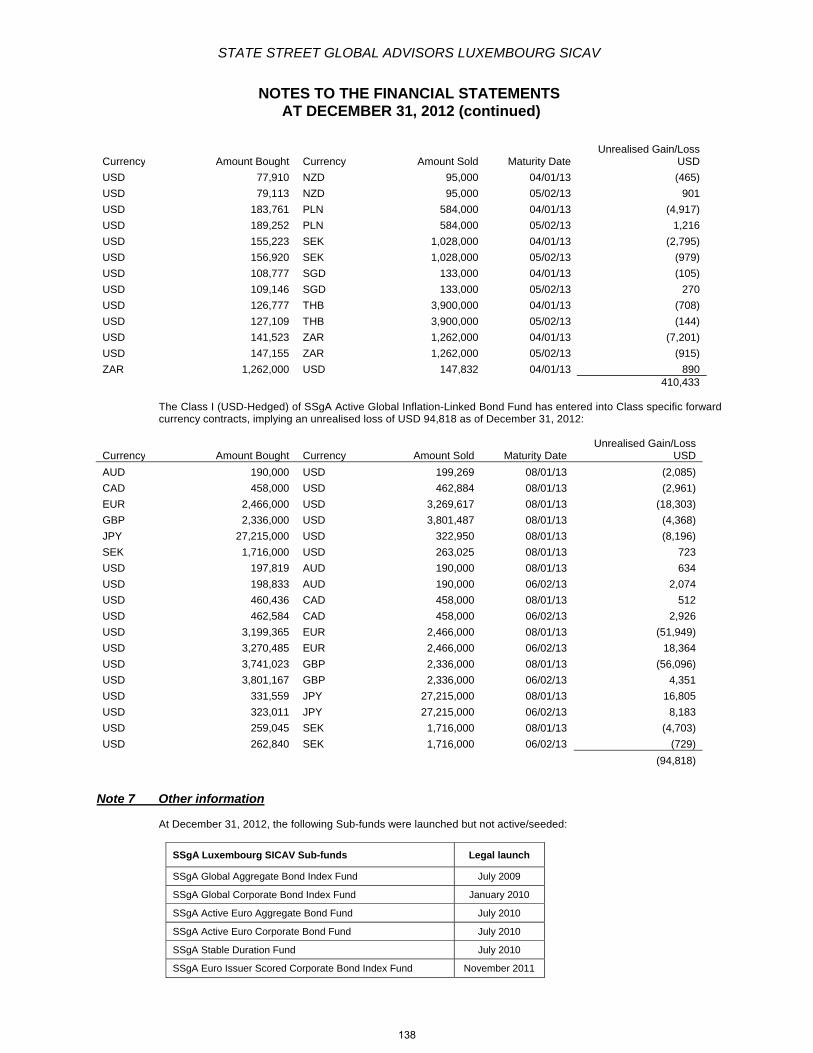
STATE STREET GLOBAL ADVISORS LUXEMBOURG SICAV
NOTES TO THE FINANCIAL STATEMENTS AT DECEMBER 31, 2012 (continued)
Currency Amount Bought Currency Amount Sold Maturity Date Unrealised Gain/Loss
USD
USD 77,910 NZD 95,000 04/01/13 (465)
USD 79,113 NZD 95,000 05/02/13 901
USD 183,761 PLN 584,000 04/01/13 (4,917)
USD 189,252 PLN 584,000 05/02/13 1,216
USD 155,223 SEK 1,028,000 04/01/13 (2,795)
USD 156,920 SEK 1,028,000 05/02/13 (979)
USD 108,777 SGD 133,000 04/01/13 (105)
USD 109,146 SGD 133,000 05/02/13 270
USD 126,777 THB 3,900,000 04/01/13 (708)
USD 127,109 THB 3,900,000 05/02/13 (144)
USD 141,523 ZAR 1,262,000 04/01/13 (7,201)
USD 147,155 ZAR 1,262,000 05/02/13 (915)
ZAR 1,262,000 USD 147,832 04/01/13 890410,433
The Class I (USD-Hedged) of SSgA Active Global Inflation-Linked Bond Fund has entered into Class specific forward currency contracts, implying an unrealised loss of USD 94,818 as of December 31, 2012:
Currency Amount Bought Currency Amount Sold Maturity Date Unrealised Gain/Loss
USD
AUD 190,000 USD 199,269 08/01/13 (2,085)
CAD 458,000 USD 462,884 08/01/13 (2,961)
EUR 2,466,000 USD 3,269,617 08/01/13 (18,303)
GBP 2,336,000 USD 3,801,487 08/01/13 (4,368)
JPY 27,215,000 USD 322,950 08/01/13 (8,196)
SEK 1,716,000 USD 263,025 08/01/13 723
USD 197,819 AUD 190,000 08/01/13 634
USD 198,833 AUD 190,000 06/02/13 2,074
USD 460,436 CAD 458,000 08/01/13 512
USD 462,584 CAD 458,000 06/02/13 2,926
USD 3,199,365 EUR 2,466,000 08/01/13 (51,949)
USD 3,270,485 EUR 2,466,000 06/02/13 18,364
USD 3,741,023 GBP 2,336,000 08/01/13 (56,096)
USD 3,801,167 GBP 2,336,000 06/02/13 4,351
USD 331,559 JPY 27,215,000 08/01/13 16,805
USD 323,011 JPY 27,215,000 06/02/13 8,183
USD 259,045 SEK 1,716,000 08/01/13 (4,703)
USD 262,840 SEK 1,716,000 06/02/13 (729)
(94,818)
Note 7 Other information At December 31, 2012, the following Sub-funds were launched but not active/seeded:
SSgA Luxembourg SICAV Sub-funds
Legal launch
SSgA Global Aggregate Bond Index Fund July 2009
SSgA Global Corporate Bond Index Fund January 2010
SSgA Active Euro Aggregate Bond Fund July 2010
SSgA Active Euro Corporate Bond Fund July 2010
SSgA Stable Duration Fund July 2010
SSgA Euro Issuer Scored Corporate Bond Index Fund November 2011
138
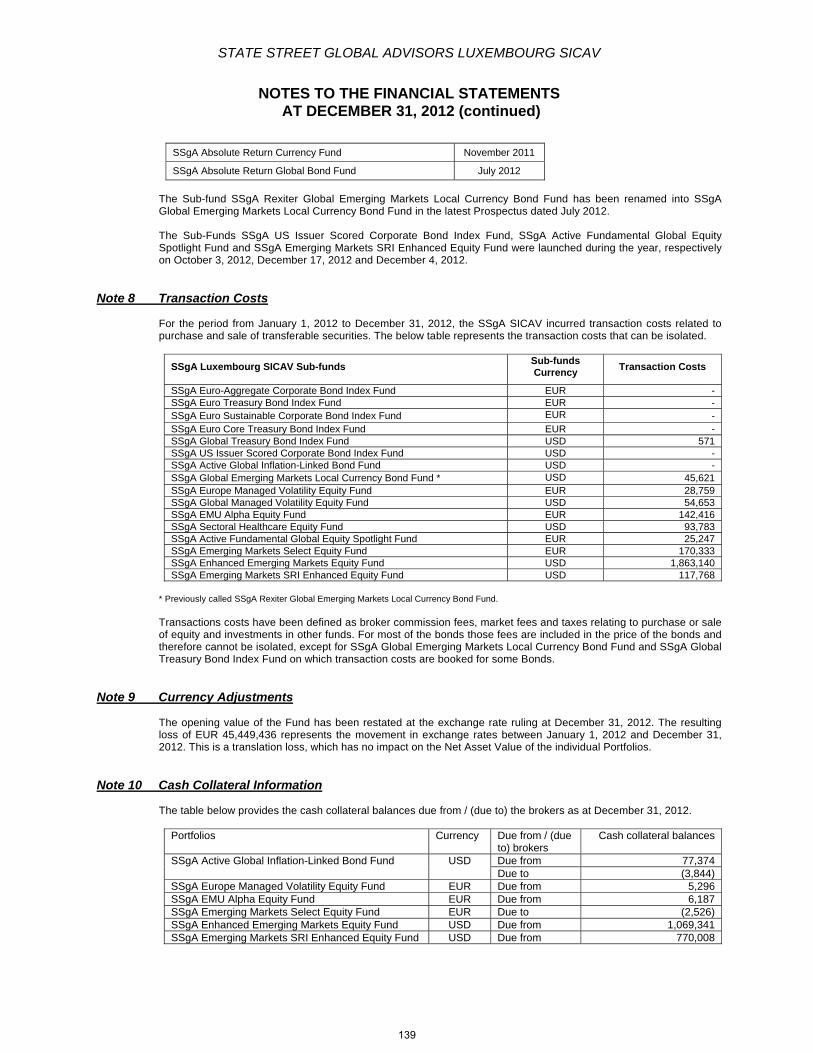
STATE STREET GLOBAL ADVISORS LUXEMBOURG SICAV
NOTES TO THE FINANCIAL STATEMENTS AT DECEMBER 31, 2012 (continued)
SSgA Absolute Return Currency Fund November 2011
SSgA Absolute Return Global Bond Fund July 2012
The Sub-fund SSgA Rexiter Global Emerging Markets Local Currency Bond Fund has been renamed into SSgA Global Emerging Markets Local Currency Bond Fund in the latest Prospectus dated July 2012. The Sub-Funds SSgA US Issuer Scored Corporate Bond Index Fund, SSgA Active Fundamental Global Equity Spotlight Fund and SSgA Emerging Markets SRI Enhanced Equity Fund were launched during the year, respectively on October 3, 2012, December 17, 2012 and December 4, 2012.
Note 8 Transaction Costs For the period from January 1, 2012 to December 31, 2012, the SSgA SICAV incurred transaction costs related to purchase and sale of transferable securities. The below table represents the transaction costs that can be isolated.
SSgA Luxembourg SICAV Sub-funds
Sub-funds Currency
Transaction Costs
SSgA Euro-Aggregate Corporate Bond Index Fund EUR - SSgA Euro Treasury Bond Index Fund EUR - SSgA Euro Sustainable Corporate Bond Index Fund EUR - SSgA Euro Core Treasury Bond Index Fund EUR - SSgA Global Treasury Bond Index Fund USD 571 SSgA US Issuer Scored Corporate Bond Index Fund USD - SSgA Active Global Inflation-Linked Bond Fund USD - SSgA Global Emerging Markets Local Currency Bond Fund * USD 45,621 SSgA Europe Managed Volatility Equity Fund EUR 28,759 SSgA Global Managed Volatility Equity Fund USD 54,653 SSgA EMU Alpha Equity Fund EUR 142,416 SSgA Sectoral Healthcare Equity Fund USD 93,783 SSgA Active Fundamental Global Equity Spotlight Fund EUR 25,247 SSgA Emerging Markets Select Equity Fund EUR 170,333 SSgA Enhanced Emerging Markets Equity Fund USD 1,863,140 SSgA Emerging Markets SRI Enhanced Equity Fund USD 117,768
* Previously called SSgA Rexiter Global Emerging Markets Local Currency Bond Fund. Transactions costs have been defined as broker commission fees, market fees and taxes relating to purchase or sale of equity and investments in other funds. For most of the bonds those fees are included in the price of the bonds and therefore cannot be isolated, except for SSgA Global Emerging Markets Local Currency Bond Fund and SSgA Global Treasury Bond Index Fund on which transaction costs are booked for some Bonds.
Note 9 Currency Adjustments The opening value of the Fund has been restated at the exchange rate ruling at December 31, 2012. The resulting loss of EUR 45,449,436 represents the movement in exchange rates between January 1, 2012 and December 31, 2012. This is a translation loss, which has no impact on the Net Asset Value of the individual Portfolios.
Note 10 Cash Collateral Information The table below provides the cash collateral balances due from / (due to) the brokers as at December 31, 2012.
Portfolios Currency Due from / (due to) brokers
Cash collateral balances
SSgA Active Global Inflation-Linked Bond Fund USD Due from 77,374Due to (3,844)
SSgA Europe Managed Volatility Equity Fund EUR Due from 5,296 SSgA EMU Alpha Equity Fund EUR Due from 6,187 SSgA Emerging Markets Select Equity Fund EUR Due to (2,526)SSgA Enhanced Emerging Markets Equity Fund USD Due from 1,069,341SSgA Emerging Markets SRI Enhanced Equity Fund USD Due from 770,008
139

STATE STREET GLOBAL ADVISORS LUXEMBOURG SICAV
RISK DISCLOSURE INFORMATION (Unaudited)
The below table shows the Risk Management Process as per the CSSF circular 11/512.
*Previously called SSgA Rexiter Global Emerging Markets Local Currency Bond Fund.
Sub-fund Name Market Risk Limit
Maximum usage of reg limit
Minimum usage of reg limit
Benchmark Model
Confidence Interval
Holding period
Effective observation period
Max Leverage (sum of notional)
SSgA Euro-Aggregate Corporate Bond Index Fund Commitment N/A N/A N/A N/A N/A N/A N/A N/A N/A
SSgA Euro Treasury Bond Index Fund Commitment N/A N/A N/A N/A N/A N/A N/A N/A N/A SSgA Euro Sustainable Corporate Bond Index Fund Commitment N/A N/A N/A N/A N/A N/A N/A N/A N/A
SSgA Euro Core Treasury Bond Index Fund Commitment N/A N/A N/A N/A N/A N/A N/A N/A N/A
SSgA Global Treasury Bond Index Fund Commitment N/A N/A N/A N/A N/A N/A N/A N/A N/A SSgA US Issuer Scored Corporate Bond Index Fund Commitment N/A N/A N/A N/A N/A N/A N/A N/A N/A
SSgA Active Global Inflation-Linked Bond Fund Relative VaR 2x 1.02x 0.92x Barclays Capital Global Inflation-Linked Bond Index
Semi-Parametric 99% 1 Month > 1 Year 0.55x
SSgA Global Emerging Markets Local Currency Bond Fund* Relative VaR 2x 1.10x 0.90x
JP Morgan Government Bond Index – Emerging Markets Global Diversified
Semi-Parametric 99% 1 Month > 1 Year 0.65x
SSgA Europe Managed Volatility Equity Fund Commitment N/A N/A N/A N/A N/A N/A N/A N/A N/A
SSgA Global Managed Volatility Equity Fund Commitment N/A N/A N/A N/A N/A N/A N/A N/A N/A
SSgA EMU Alpha Equity Fund Commitment N/A N/A N/A N/A N/A N/A N/A N/A N/A
SSgA Sectoral Healthcare Equity Fund Commitment N/A N/A N/A N/A N/A N/A N/A N/A N/A SSgA Active Fundamental Global Equity Spotlight Fund Commitment N/A N/A N/A N/A N/A N/A N/A N/A N/A
SSgA Emerging Markets Select Equity Fund Commitment N/A N/A N/A N/A N/A N/A N/A N/A N/A SSgA Enhanced Emerging Markets Equity Fund Commitment N/A N/A N/A N/A N/A N/A N/A N/A N/A SSgA Emerging Markets SRI Enhanced Equity Fund Commitment N/A N/A N/A N/A N/A N/A N/A N/A N/A
140
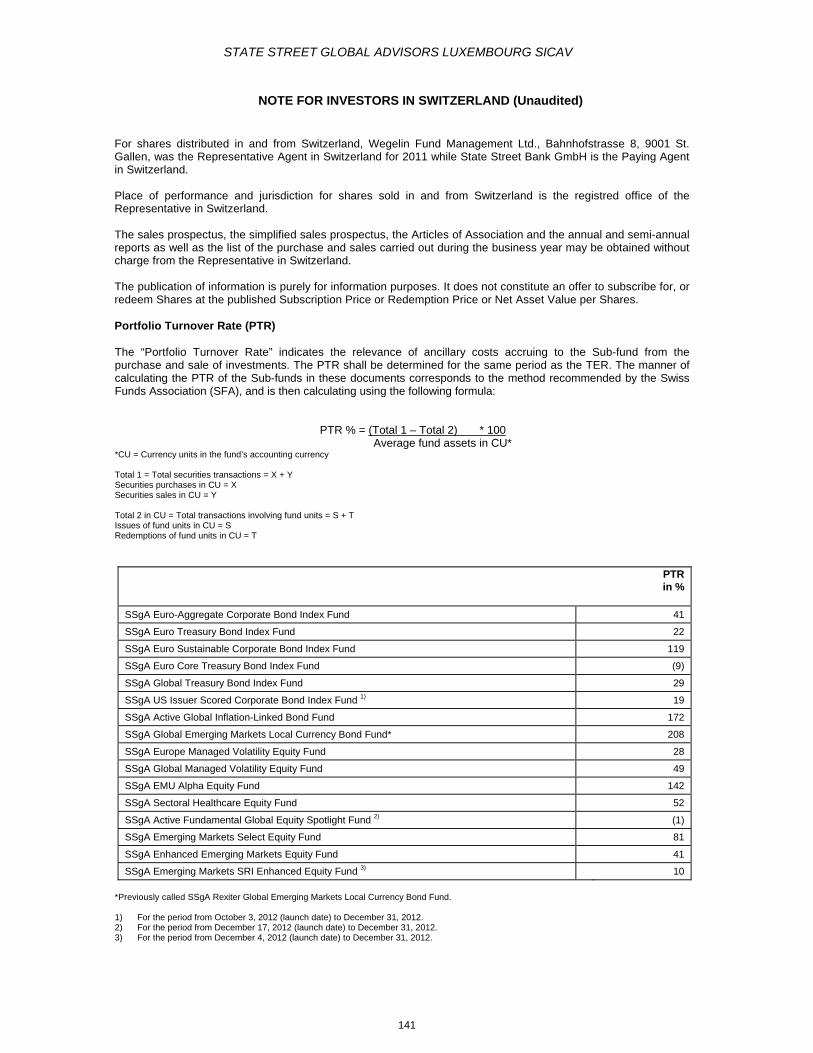
STATE STREET GLOBAL ADVISORS LUXEMBOURG SICAV
NOTE FOR INVESTORS IN SWITZERLAND (Unaudited)
For shares distributed in and from Switzerland, Wegelin Fund Management Ltd., Bahnhofstrasse 8, 9001 St. Gallen, was the Representative Agent in Switzerland for 2011 while State Street Bank GmbH is the Paying Agent in Switzerland. Place of performance and jurisdiction for shares sold in and from Switzerland is the registred office of the Representative in Switzerland. The sales prospectus, the simplified sales prospectus, the Articles of Association and the annual and semi-annual reports as well as the list of the purchase and sales carried out during the business year may be obtained without charge from the Representative in Switzerland. The publication of information is purely for information purposes. It does not constitute an offer to subscribe for, or redeem Shares at the published Subscription Price or Redemption Price or Net Asset Value per Shares. Portfolio Turnover Rate (PTR) The “Portfolio Turnover Rate” indicates the relevance of ancillary costs accruing to the Sub-fund from the purchase and sale of investments. The PTR shall be determined for the same period as the TER. The manner of calculating the PTR of the Sub-funds in these documents corresponds to the method recommended by the Swiss Funds Association (SFA), and is then calculating using the following formula: PTR % = (Total 1 – Total 2) * 100 Average fund assets in CU* *CU = Currency units in the fund’s accounting currency Total 1 = Total securities transactions = X + Y Securities purchases in CU = X Securities sales in CU = Y Total 2 in CU = Total transactions involving fund units = S + T Issues of fund units in CU = S Redemptions of fund units in CU = T
PTR in %
SSgA Euro-Aggregate Corporate Bond Index Fund 41
SSgA Euro Treasury Bond Index Fund 22
SSgA Euro Sustainable Corporate Bond Index Fund 119
SSgA Euro Core Treasury Bond Index Fund (9)
SSgA Global Treasury Bond Index Fund 29
SSgA US Issuer Scored Corporate Bond Index Fund 1) 19
SSgA Active Global Inflation-Linked Bond Fund 172
SSgA Global Emerging Markets Local Currency Bond Fund* 208
SSgA Europe Managed Volatility Equity Fund 28
SSgA Global Managed Volatility Equity Fund 49
SSgA EMU Alpha Equity Fund 142
SSgA Sectoral Healthcare Equity Fund 52
SSgA Active Fundamental Global Equity Spotlight Fund 2) (1)
SSgA Emerging Markets Select Equity Fund 81
SSgA Enhanced Emerging Markets Equity Fund 41
SSgA Emerging Markets SRI Enhanced Equity Fund 3) 10
*Previously called SSgA Rexiter Global Emerging Markets Local Currency Bond Fund. 1) For the period from October 3, 2012 (launch date) to December 31, 2012. 2) For the period from December 17, 2012 (launch date) to December 31, 2012. 3) For the period from December 4, 2012 (launch date) to December 31, 2012.
141

STATE STREET GLOBAL ADVISORS LUXEMBOURG SICAV
NOTE FOR INVESTORS IN SWITZERLAND (Unaudited) (continued)
Total Expense Ratio (TER) In Switzerland the “total expense ratio” (TER) taking account of Swiss requirements is reported and explained in each of the annual and semi-annual reports as well as in the simplified sales prospectus. The manner of calculating the TER and the performance of the Sub-fund in these documents corresponds to the method recommended by the Swiss Funds Association (SFA), and is then calculating using the following formula: TER % = Total operating expenses in CU* Average fund assets in CU* *CU = Currency units in the fund’s accounting currency
Name of the Sub-fund Share class
TER in%
SSgA Euro-Aggregate Corporate Bond Index Fund B (EUR) 1) 0.08% I (EUR) 0.23%
SSgA Euro Treasury Bond Index Fund B (EUR) 2) 0.10% I (EUR) 3) 0.25% P (EUR) 0.33%
SSgA Euro Sustainable Corporate Bond Index Fund I (EUR) 0.31%
I (EUR Distributing) 0.32%
SSgA Euro Core Treasury Bond Index Fund
B (EUR) 4) 0.10% I (EUR) 0.23%
P (EUR) 5) 0.40% I (EUR Distributing) 6) 0.23%
SSgA Global Treasury Bond Index Fund
B (USD) 7) 0.10% I (USD) 0.25% P (USD) 0.40%
I (USD-Hedged) 0.28% SSgA US Issuer Scored Corporate Bond Index Fund I (USD) 8) 0.32%
SSgA Active Global Inflation-Linked Bond Fund I (USD) 0.45%
I (USD-Hedged) 9) 0.48%
SSgA Global Emerging Markets Local Currency Bond Fund* B (USD) 10) 0.25% I (USD) 1.10%
SSgA Europe Managed Volatility Equity Fund I (EUR) 0.44%
SSgA Global Managed Volatility Equity Fund B (USD) 11) 0.10%
I (USD) 0.45% SSgA EMU Alpha Equity Fund I (EUR) 0.60%
SSgA Sectoral Healthcare Equity Fund I (USD) 0.95% P (USD) 1.70%
SSgA Active Fundamental Global Equity Spotlight Fund B (EUR) 12) 0.10% SSgA Emerging Markets Select Equity Fund I (EUR) 1.23%
SSgA Enhanced Emerging Markets Equity Fund I (USD) 0.60% I (EUR) 0.60%
SSgA Emerging Markets SRI Enhanced Equity Fund I (USD) 13) 0.62% *Previously called SSgA Rexiter Global Emerging Markets Local Currency Bond Fund.
1) For the period from June 29, 2012 (launch date) to December 31, 2012. 2) For the period from September 12, 2012 (launch date) to December 31, 2012. 3) For the period from March 21, 2012 (launch date) to December 31, 2012. 4) For the period from June 29, 2012 (launch date) to December 31, 2012. 5) For the period from May 2, 2012 (launch date) to December 31, 2012. 6) For the period from May 31, 2012 (launch date) to December 31, 2012. 7) For the period from June 29, 2012 (launch date) to December 31, 2012. 8) For the period from October 3, 2012 (launch date) to December 31, 2012. 9) For the period from January 4, 2012 (launch date) to December 31, 2012. 10) For the period from June 29, 2012 (launch date) to December 31, 2012. 11) For the period from June 29, 2012 (launch date) to December 31, 2012. 12) For the period from December 17, 2012 (launch date) to December 31, 2012. 13) For the period from December 4, 2012 (launch date) to December 31, 2012.
142
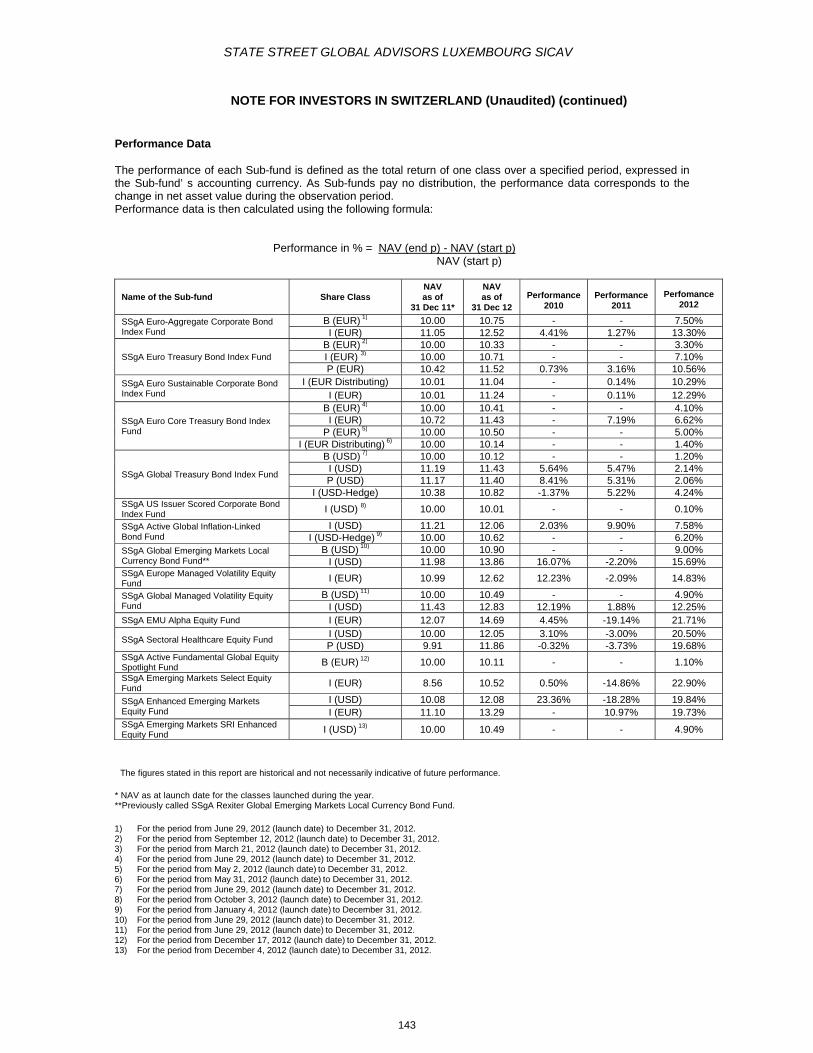
STATE STREET GLOBAL ADVISORS LUXEMBOURG SICAV
NOTE FOR INVESTORS IN SWITZERLAND (Unaudited) (continued)
Performance Data The performance of each Sub-fund is defined as the total return of one class over a specified period, expressed in the Sub-fund’ s accounting currency. As Sub-funds pay no distribution, the performance data corresponds to the change in net asset value during the observation period. Performance data is then calculated using the following formula: Performance in % = NAV (end p) - NAV (start p) NAV (start p)
Name of the Sub-fund Share Class NAV as of
31 Dec 11*
NAV as of
31 Dec 12
Performance
2010
Performance
2011
Perfomance2012
SSgA Euro-Aggregate Corporate Bond Index Fund
B (EUR) 1) 10.00 10.75 - - 7.50% I (EUR) 11.05 12.52 4.41% 1.27% 13.30%
SSgA Euro Treasury Bond Index Fund B (EUR) 2) 10.00 10.33 - - 3.30% I (EUR) 3) 10.00 10.71 - - 7.10% P (EUR) 10.42 11.52 0.73% 3.16% 10.56%
SSgA Euro Sustainable Corporate Bond Index Fund
I (EUR Distributing) 10.01 11.04 - 0.14% 10.29% I (EUR) 10.01 11.24 - 0.11% 12.29%
SSgA Euro Core Treasury Bond Index Fund
B (EUR) 4) 10.00 10.41 - - 4.10% I (EUR) 10.72 11.43 - 7.19% 6.62%
P (EUR) 5) 10.00 10.50 - - 5.00% I (EUR Distributing) 6) 10.00 10.14 - - 1.40%
SSgA Global Treasury Bond Index Fund
B (USD) 7) 10.00 10.12 - - 1.20% I (USD) 11.19 11.43 5.64% 5.47% 2.14% P (USD) 11.17 11.40 8.41% 5.31% 2.06%
I (USD-Hedge) 10.38 10.82 -1.37% 5.22% 4.24% SSgA US Issuer Scored Corporate Bond Index Fund I (USD) 8) 10.00 10.01 - - 0.10%
SSgA Active Global Inflation-Linked Bond Fund
I (USD) 11.21 12.06 2.03% 9.90% 7.58% I (USD-Hedge) 9) 10.00 10.62 - - 6.20%
SSgA Global Emerging Markets Local Currency Bond Fund**
B (USD) 10) 10.00 10.90 - - 9.00% I (USD) 11.98 13.86 16.07% -2.20% 15.69%
SSgA Europe Managed Volatility Equity Fund I (EUR) 10.99 12.62 12.23% -2.09% 14.83%
SSgA Global Managed Volatility Equity Fund
B (USD) 11) 10.00 10.49 - - 4.90% I (USD) 11.43 12.83 12.19% 1.88% 12.25%
SSgA EMU Alpha Equity Fund I (EUR) 12.07 14.69 4.45% -19.14% 21.71%
SSgA Sectoral Healthcare Equity Fund I (USD) 10.00 12.05 3.10% -3.00% 20.50% P (USD) 9.91 11.86 -0.32% -3.73% 19.68%
SSgA Active Fundamental Global Equity Spotlight Fund B (EUR) 12) 10.00 10.11 - - 1.10%
SSgA Emerging Markets Select Equity Fund I (EUR) 8.56 10.52 0.50% -14.86% 22.90%
SSgA Enhanced Emerging Markets Equity Fund
I (USD) 10.08 12.08 23.36% -18.28% 19.84% I (EUR) 11.10 13.29 - 10.97% 19.73%
SSgA Emerging Markets SRI Enhanced Equity Fund I (USD) 13) 10.00 10.49 - - 4.90%
The figures stated in this report are historical and not necessarily indicative of future performance. * NAV as at launch date for the classes launched during the year. **Previously called SSgA Rexiter Global Emerging Markets Local Currency Bond Fund.
1) For the period from June 29, 2012 (launch date) to December 31, 2012. 2) For the period from September 12, 2012 (launch date) to December 31, 2012. 3) For the period from March 21, 2012 (launch date) to December 31, 2012. 4) For the period from June 29, 2012 (launch date) to December 31, 2012. 5) For the period from May 2, 2012 (launch date) to December 31, 2012. 6) For the period from May 31, 2012 (launch date) to December 31, 2012. 7) For the period from June 29, 2012 (launch date) to December 31, 2012. 8) For the period from October 3, 2012 (launch date) to December 31, 2012. 9) For the period from January 4, 2012 (launch date) to December 31, 2012. 10) For the period from June 29, 2012 (launch date) to December 31, 2012. 11) For the period from June 29, 2012 (launch date) to December 31, 2012. 12) For the period from December 17, 2012 (launch date) to December 31, 2012. 13) For the period from December 4, 2012 (launch date) to December 31, 2012.
143
STATE STREET GLOBAL ADVISORS LUXEMBOURG SICAV
NOTE FOR INVESTORS IN SWITZERLAND (Unaudited) (continued)
Statements of Operations The Statement of Operations of each Sub-funds is shown on pages 13 to 15 of this report.
144
Related Documents