State Roles in Providing Affordable Mass Transport Services for Low- Income Residents 17 Discussion Paper 2011 • 17 Robert CERVERO University of California, Berkeley

Welcome message from author
This document is posted to help you gain knowledge. Please leave a comment to let me know what you think about it! Share it to your friends and learn new things together.
Transcript

State Roles in Providing Affordable Mass Transport Services for Low-Income Residents
17Discussion Paper 2011 • 17
Robert CeRveRoUniversity of California, Berkeley

This document was produced as background for the 2011 International Transport Forum, on 25-27 May in Leipzig, Germany, on Transport for Society. The views expressed in this document do not necessarily reflect those of the member countries of the International Transport Forum.
Further information about the International Transport Forum is available at www.internationaltransportforum.org
State Roles in Providing Affordable
Mass Transport Services for Low-Income Residents
Discussion Paper No. 2011-17
Robert Cervero University of California, Berkeley, USA
May 2011
State Roles in Providing Affordable Mass Transport Services for Low-Income Residents
2 Discussion Paper 2011-17: Robert Cervero – © OECD/ITF 2011
INTERNATIONAL TRANSPORT FORUM
The International Transport Forum at the OECD is an intergovernmental organisation with 52 member countries. It acts as a strategic think tank with the objective of helping shape the transport policy agenda on a global level and ensuring that it contributes to economic growth, environmental protection, social inclusion and the preservation of human life and well-being. The International Transport Forum organizes an annual summit of Ministers along with leading representatives from industry, civil society and academia.
The International Transport Forum was created under a Declaration issued by the Council of Ministers of the ECMT (European Conference of Ministers of Transport) at its Ministerial Session in May 2006 under the legal authority of the Protocol of the ECMT, signed in Brussels on 17 October 1953, and legal instruments of the OECD.
The Members of the Forum are: Albania, Armenia, Australia, Austria, Azerbaijan, Belarus, Belgium, Bosnia-Herzegovina, Bulgaria, Canada, Croatia, the Czech Republic, Denmark, Estonia, Finland, France, FYROM, Georgia, Germany, Greece, Hungary, Iceland, India, Ireland, Italy, Japan, Korea, Latvia, Liechtenstein, Lithuania, Luxembourg, Malta, Mexico, Moldova, Montenegro, Netherlands, New Zealand, Norway, Poland, Portugal, Romania, Russia, Serbia, Slovakia, Slovenia, Spain, Sweden, Switzerland, Turkey, Ukraine, the United Kingdom and the United States.
The International Transport Forum‘s Research Centre gathers statistics and conducts co-operative research programmes addressing all modes of transport. Its findings are widely disseminated and support policymaking in Member countries as well as contributing to the annual summit.
DISCUSSION PAPERS
The International Transport Forum‘s Discussion Paper Series makes economic research, commissioned or carried out at its Research Centre, available to researchers and practitioners. The aim is to contribute to the understanding of the transport sector and to provide inputs to transport policy design. The Discussion Papers are not edited by the International Transport Forum and they reflect the author's opinions alone.
The Discussion Papers can be downloaded from: www.internationaltransportforum.org/jtrc/DiscussionPapers/jtrcpapers.html
The International Transport Forum‘s website is at: www.internationaltransportforum.org or further information on the Discussion Papers and other JTRC activities, please email: [email protected]

State Roles in Providing Affordable Mass Transport Services for Low-Income Residents
Discussion Paper 2011-17: Robert Cervero – ©OECD/ITF 2011 3
TABLE OF CONTENTS
1. INTRODUCTION ..................................................................................................................... 4
2. JUSTIFICATION FOR PUBLIC SUPPORT OF MASS TRANSPORT ...................................... 4
3. INEQUITIES IN MOBILITY ...................................................................................................... 5
4. COST OF INACCESSIBILITY ................................................................................................. 7
5. PUBLIC TRANSPORT, SUBSIDIES, AND FARES ................................................................. 8
6. MODERATING TRANSIT OPERATING SUBSIDIES ............................................................ 11
7. INFORMAL TRANSPORT OPERATORS .............................................................................. 13
8. METROVIVIENDA ................................................................................................................ 14
9. EVALUATION: TOWARD A MORE BALANCED FRAMEWORK .......................................... 16
10. ALTERNATIVE EVALUATION METRIC .............................................................................. 17
11. CLOSE ................................................................................................................................ 19
REFERENCES .......................................................................................................................... 20
State Roles in Providing Affordable Mass Transport Services for Low-Income Residents
4 Discussion Paper 2011-17: Robert Cervero – ©OECD/ITF 2011
1. INTRODUCTION
Governments support urban mass transport services worldwide under the guise of helping the poor and improving the environment. With more and more governments cash-strapped and facing budgetary shortfalls in other vital areas, the fiscal burdens of underwriting public transport have prompted some observers to question such rationales.
This paper reviews the role of states in ensuring affordable mass transport services are available to low-income residents. The heavy financial burdens that the poor sometime face in moving about the city and possible ways of reducing these impacts are discussed. Examples of keeping transit fares affordable while also ensuring reasonably cost-effective mass transport services are cited. Because public policy choices that shape mass transport services are informed by technical evaluations, this paper also examines conventional practices regarding how transport proposals are reviewed and assessed. It argues that moving toward a framework that focuses on enhancing accessibility rather than principally mobility would better represent the long-term impacts of capital investments while also promoting the interests of mobility-disadvantaged populations.
2. JUSTIFICATION FOR PUBLIC SUPPORT OF MASS TRANSPORT
Justification for government subsidizing mass transport services are rooted in both economic and social arguments (Peskin, 1973; Cervero, 1983). The principal economic justifications are that mass transport produces positive spillovers and is the most efficient user of road space and energy resources. More than any motorized mode, buses and trains maximize passenger throughputs along travel corridors. And they do so with the least amount of pollution emissions per passenger-km traveled. Such benefits, however, only accrue if mass transit users are former single-occupant motorists. If transit riders formerly did not take the trip or are former car passengers or transit users (e.g., they switched from bus transit to rail), economic and environmental benefits will be minimal. Other economic justifications for subsidies include: (1) a countervailing subsidy to offset the historical under-pricing of transit‘s chief competitor, the private car (e.g., failure of most motorists to internalize external costs, like air pollution and congestion during peak periods, or to pay for on-street parking); (2) efficient pricing – e.g., efficiency principles call for setting the price at the marginal costs of new trips, which at low-to-modest demand levels where economies of scale exist will mean prices fall below average costs, thereby incurring a deficit (Oi, 1973; Hilton, 1975; Cervero, 1983).
As important are the social justifications for government sponsorship of mass transit services. Public transport is a form of social investment, providing needy and mobility-disadvantaged residents with vital access to jobs, medical care, schools, retail outlets, and other essential destinations. Use of the term ―investment‖, versus ―subsidy‖, is important. Public expenditure of financial resources on roads, wherein studies suggest motorists fail to cover the full costs of building and maintaining them (Murphy and Delucchi, 1998), is commonly referred to as an ―investment‖. Why then are public outlays to mass transport not similarly considered an investment? Devoting a portion of the public largesse to transit is a form of investment in human capital, not unlike road investments are a form of building physical capital.

State Roles in Providing Affordable Mass Transport Services for Low-Income Residents
Discussion Paper 2011-17: Robert Cervero – ©OECD/ITF 2011 5
For many urbanites, especially in the developing world, the availability of good, reliable, and affordable bus and rail services can be the difference between being integrated into the economic and social life of a city or not. The share of marginalized city-dwellers with poor access to essential facilities and services continues to increase worldwide (Kaltheier, 2002). Isolation from job opportunities and health care is particularly acute among those living on the urban periphery. Even in the world‘s most car-dependent country, the United States, over a third of the population is transit-dependent -- i.e., too old, young, poor, disabled, or infirmed to drive a car. In very low-income countries, the share of urban-dwellers who are captive is larger – as high as 80 percent in countries like Bangladesh. To the poor and powerless, low-cost and affordable public transport becomes an essential lifeline to participation in society‘s economic, social, cultural, and religious offerings.
To some, public support of mass transport for the poor is a moral issue. Such arguments are rooted in the notion that mobility is a basic human need, not unlike clean, potable water or sanitation. An even stronger stance is that availability of affordable public transport is an entitlement, just as safety and protection from criminal elements and potential harm-doers. Transit provides minimum mobility services to the most needy who otherwise could not afford to pay for market-based transport services. Fixed-route buses and rail services provide connections to those whom the market (e.g., private taxis, informal transit operators) would ignore. Since the industrialization and modernization of cities, spread-out growth patterns have created trip origins and destinations that are well beyond walking distance for many. Even if a bicycle can be afforded, the lack of cycle-ways combined with the safety risks from chaotic and poorly regulated traffic make the poor dependent on buses and trains to move about the city. The need to carry groceries, goods, and sometimes toddlers, especially among women, make walking and cycling impractical. Thus the need for mechanized forms of mobility becomes absolutely essential – a basic right for all. For those too poor, old, young, or infirmed to own or drive a car, publicly sponsored buses and trains are all that is left.
While moral and social equity arguments in support of transit subsidies can be found in the academic literature, explicit commitments to such purposes by public transit agencies are not that common. A recent survey of 50 transit agencies in the U.S., for instance, found that just four (8 percent) explicitly identified serving the needs of the poor or mobility-impaired as agency goals and objectives (Taylor and Breiland, 2011). By contrast, 22 percent identified the fostering of economic development as a goal for supporting transit and over a third embraced transit for its potential contributions to traffic congestion relief.
3. INEQUITIES IN MOBILITY
Where governments are too poor or unable to underwrite public transport services, one often finds large, sometimes exorbitant, shares of travelers‘ incomes going to private, often informal, paratransit operators. When public transport services are absent, private and sometimes illegal service-providers – in the form of micro-buses, motorcycle-taxis, and motorized rickshaws – will often fill the mobility gap (Cervero, 2000). Setting prices at whatever the market will bear, private paratransit operators invariably charge more per kilometre traveled than publicly supported ones. In the poor informal housing settlements on the outskirts of Mexico City, outside the service jurisdiction of the city‘s 201-km metro, barrio residents sometimes must take 2 to 3 separate collectivos to reach a metro terminal (which provides low-cost connections to the core city) (Cervero, 1998). This form of informality – dwellers of informal housing using informal para-transit to reach transient, informal job opportunities in the core city (e.g., street hawkers) – can consume 25% or more of daily wages (Vasconcellos, 2001; Kaltheier, 2002). Time costs can also be
State Roles in Providing Affordable Mass Transport Services for Low-Income Residents
6 Discussion Paper 2011-17: Robert Cervero – ©OECD/ITF 2011
exorbitant: 20 percent of workers in Mexico City spend more than 3 hours traveling to and from work each day (World Bank, 2009). Even higher shares of the poor spend more than 3 hours daily traveling in Bogotá (Kaltheier, 2002). Studies in Nairobi, Kenya estimate that non-integrated fares charged by private transit operators can consume anywhere from 14% to 30% of daily wages (Gwilliam, 2002; Cervero, 2000). Taking a series of informal minibuses and motorized tricycles to and from work can cost 20% to 25% of daily wages in rapidly growing cities like Delhi, Buenos Aires, and Manila and is estimated to be as high as 30% in the suburbs of Dar Es Salaam (Ferrarazzo and Arauz, 2000; Kaltheier, 2002; Cervero, 2000).
The disproportionate financial burden felt by the poor in reaching job opportunities is not limited to developing countries. Even in the U.S., the working poor spend twice the share of earnings – 6.1 percent versus 3.8 for the non-poor – reaching their jobs (Roberto, 2008). Adding the cost of reaching non-work destinations like schools, shopping, and health care can raise this figure to over 20 percent of wages.
What is a reasonable share of a household‘s income that should go to transport? In the United States, around 15% of annual income goes to metropolitan transport – in the form of car ownership, maintenance, and fuelling as well as public transport expenditures and the like. However part of this expenditure goes toward an asset, namely the private car, that has re-sale value and in a car-oriented country like the U.S. becomes a form of ―subscription fee‖ to fully participate in American society. In poor countries of the world, fare payments are lost income in the sense there is no direct asset accumulation from the expenditure. While there is no all-encompassing benchmark or norm set for appropriate levels of transport outlays, one rule-of-thumb has been advanced by Armstrong-Wright (1986). The Armstrong-Wright maxim holds that no more than 10% of households should spend more than 15% of household income on journeys to work. Otherwise, public transport fares are considered ―unfair‖ and discriminatory. According to the Cities on the Move report of the World Bank, this is a ―reasonable rule for determining the level of a politically administered price‖ (Gwilliam, 2002, p. 35).
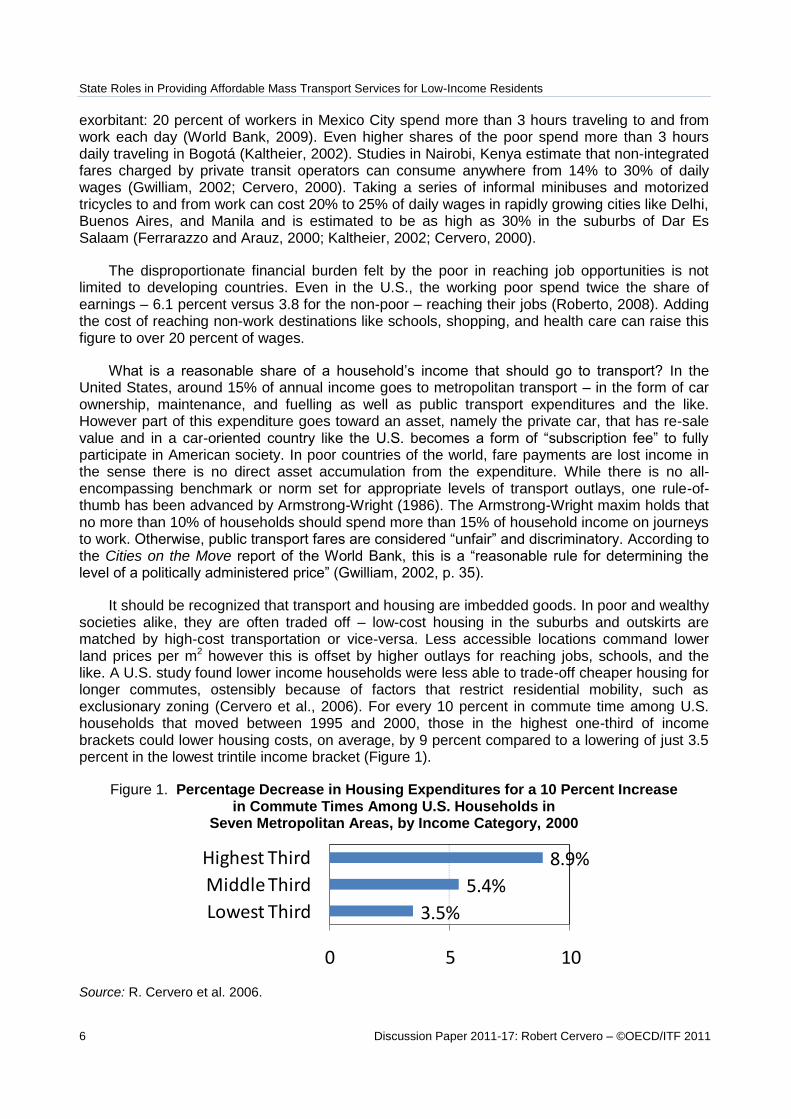
It should be recognized that transport and housing are imbedded goods. In poor and wealthy societies alike, they are often traded off – low-cost housing in the suburbs and outskirts are matched by high-cost transportation or vice-versa. Less accessible locations command lower land prices per m2 however this is offset by higher outlays for reaching jobs, schools, and the like. A U.S. study found lower income households were less able to trade-off cheaper housing for longer commutes, ostensibly because of factors that restrict residential mobility, such as exclusionary zoning (Cervero et al., 2006). For every 10 percent in commute time among U.S. households that moved between 1995 and 2000, those in the highest one-third of income brackets could lower housing costs, on average, by 9 percent compared to a lowering of just 3.5 percent in the lowest trintile income bracket (Figure 1).
Figure 1. Percentage Decrease in Housing Expenditures for a 10 Percent Increase in Commute Times Among U.S. Households in
Seven Metropolitan Areas, by Income Category, 2000
3.5%
5.4%
8.9%
0 5 10
Lowest Third
Middle Third
Highest Third
Source: R. Cervero et al. 2006.

State Roles in Providing Affordable Mass Transport Services for Low-Income Residents
Discussion Paper 2011-17: Robert Cervero – ©OECD/ITF 2011 7
In the developing world, relationships between transport and housing outlays are much the same. For the very poor, whatever savings that accrue from illegally squatting on land and living in squalor (e.g., lack of piped water or indoor plumbing) often evaporate from the high expenses incurred in reaching income-earning opportunities in the city as well as essential medical, educational, and retail destinations. The co-dependent nature of housing and transport expenditures is a core notion of Bogotá Colombia‘s Metrovevienda program, discussed later in this paper.
Few countries have sought to set a threshold on worker expenditures for commuting. One that has is Brazil, under the Vale Transport program which sets the maximum amount of earnings that workers can devote to commuting at 7%. Any share above this amount must be paid by the employer. This program, however, only applies to those with jobs in the formal economy. In 2002, an estimated 55 percent of Brazil‘s workers had jobs in the informal economy (Capp et al., 2005), thus the majority were unaffected by Vale Transport.
4. COST OF INACCESSIBILITY
The costs of poor access are cause for concern. Inaccessibility is isolating. It shrinks one‘s job search area and information network. It restricts laborsheds, tradesheds, and communication channels. An extensive literature in the U.S. has shown a strong link between social and economic needs of the urban poor and their residential locations (Kain and Persky, 1969; Wilson, 1996; Ihlanfeldt, 1999). Poor job accessibility has also been associated with poor economic outcomes in the U.S., including joblessness, low wages, and restricted upward mobility (Raphael, 1998; Thakuriah and Metaxatos, 2000; Cervero et al. 2002).
In the developing world, the burdens of physical isolation are even more stark and debilitating. When 700,000 squatters were resettled on periphery of Delhi, female employment fell 27%; travel time increased 3-fold (Badami et al., 2004). Other costs associated with low levels of access among the urban poor in Delhi include: high rates of traffic fatalities (Thakuriah, 2009); high exposure to air pollution (Badami et al., 2004); and slum residences near temporary or seasonal employment opportunities (Thakuriah, 2009).
Most of the empirical evidence on the impacts of improved job access on employment outcomes comes from the United States. There, increased job access has been shown to increase the probability of welfare recipients and unemployed adults finding gainful employment and staying off public assistance (Sandoval et al., 2010). One study found that improved access to jobs by public transit increased the likelihood of eligible low-skilled workers in San Francisco and Los Angeles being employed and working 30 hours or more per week (Kawabata, 2003). Relationships were strongest for individuals who had no access to private automobiles. Other studies of California, however, reveal that car ownership and road access were stronger predictors of welfare-to-work transitions than access via public transit (Cervero et al., 2002).
There is also an important longitudinal dimension to access and economic well-being. Recent research suggests providing good mobility and access at formative years of one‘s life can have longer term economic pay-offs. A life-cycle analysis of U.S. consumers showed good transportation conditions during adolescence and young adulthood lasts as individuals move into adulthood (Thakuriah and Tang, 2008). The authors estimated that those facing transportation problems suffered an annual social welfare loss of around $2,500 compared to those without mobility problems. They conclude that ―governmental subsidies should target transportation services for carless individuals in disadvantaged neighborhoods, because of the long-term

State Roles in Providing Affordable Mass Transport Services for Low-Income Residents
8 Discussion Paper 2011-17: Robert Cervero – ©OECD/ITF 2011
earnings potential and the long-term societal benefit that accrues from these services. These economic benefits will also enable these individuals without the means for personal mobility to avoid dependence on public assistance, unemployment benefits and other forms of governmental assistance in the long run.‖
5. PUBLIC TRANSPORT, SUBSIDIES, AND FARES
Notwithstanding social arguments, the public outlays needed to underwrite the costs of buses and rail services can be financially burdensome. UITP data for 42 global cities suggests that annual transit operating subsidies in 2001 were appreciable and in some instances astonishingly high. Across these 42 cities, the average non-farebox revenue per capita – which includes government subsidies but also other income such as from advertising, land leases, joint development, etc. – was estimated at 1.56 billion Euros, with a sizable standard deviation of 2.4 billion Euros. On a per capita basis, this worked out to annual non-farebox income (including operating subsidies) that ranged from a low of 47 Euros per resident in Moscow to nearly 1,000 Euros per resident in Chicago, London, Glasgow, Manchester, and Oslo (Figure 2). and as the automobile continues to gain ascendancy, grabbing larger shares of the travel market, transit subsidies show no sign of abating. In the U.S., inflation-adjusted subsidies of public transit per urban resident rose 19 percent between 1998 and 2008 (Taylor and Breiland, 2011).
As a percentage of total operating costs, user fares constituted on average around half the total among global cities. As national incomes and motorization rates rise and public transport service options become more formalized, the amount of income that comes from non-farebox sources – including government subsidies -- also increases. On a per capita basis, Figure 3 shows a fairly strong positive relationship between non-farebox revenue and GDP. Non-fare revenues per rider similarly tended to rise with per capita income (Figure 4).
Figure 2. Annual Transit Non-Fare Revenues (including Operating Subsidies) per Capita Among 42 Global Cities, Cumulative Distribution in 2001, in Euros
Source: UITP Mobility in Cities Database, 2006

State Roles in Providing Affordable Mass Transport Services for Low-Income Residents
Discussion Paper 2011-17: Robert Cervero – ©OECD/ITF 2011 9
Figure 3. Non-Fare Revenues (including Operating Subsidies) per Capita by GDP per Capita (Euros) Among 42 Global Cities, 2001
Source: UITP Mobility in Cities Database, 2006.
Figure 4. Non-Fare Revenues (including Operating Subsidies) per Rider by GDP per Capita (Euros) Among 42 Global Cities, 2001
Source: UITP Mobility in Cities Database, 2006.
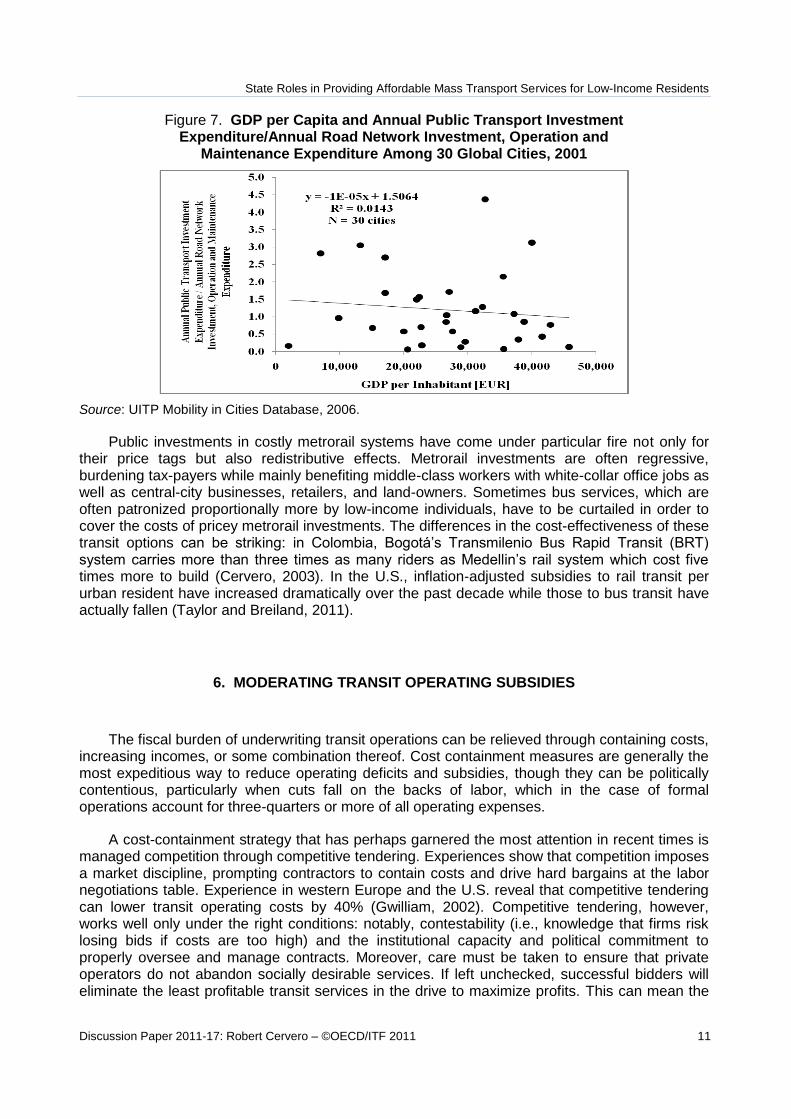
Globally, there is little relationship between farebox recovery rates and per capita income, as revealed by Figure 5. As GDP increases, the ability to recoup costs through fare revenue tends to weakly decline, thus prompting governments to underwrite some of the losses. Predictably, achieving higher farebox recovery rates does not translate into ridership productivity. Figure 6 reveals that among 48 global cities, riders per vehicle km of service tended to fall as the share of costs recovered by fares increased – reflecting a negative transit fare elasticity.
Lastly, global statistics reveal that public outlays for transit versus its chief competitor – highways – generally decline as per capita income rises (Figure 7). Clearly this reflects the positive association of income and automobile ownership rates (or negative association of income and transit modal splits). As cities get wealthier, the share of the transportation sector‘s largesse that goes to cars gets higher while the share that goes to transit shrinks. This no doubt reflects the diminution of social equity in general and transit affordability, more specifically, as an explicit goal of public transport services.

State Roles in Providing Affordable Mass Transport Services for Low-Income Residents
10 Discussion Paper 2011-17: Robert Cervero – ©OECD/ITF 2011
Figure 5. Farebox Recovery Rates (Fare Revenues/Operating Costs) by GDP per Capita (Euros) Among 42 Global Cities, 2001
Source: UITP Mobility in Cities Database, 2006.
Figure 6. Ridership Productivity and Farebox Recovery Rates Among 45 Global Cities, 2001
Source: UITP Mobility in Cities Database, 2006.
The most detailed statistics on government financial support of public transport come from higher income countries where transit tends to capture a relatively low share of total trips. In the United states, financial assistance from local, state, and federal governments to support transit operations skyrocketed from $7.6 billion in 1991 to $22.8 billion in 2009, an average annual increase of $844 million (Federal Transit Administration, 2011). During the same period, the share of operating costs covered by fares fell from 42.4 percent to 34 percent. Public subsidies to U.S. transit users have reached as high as $25 for specialized door-to-door services for the elderly, similar to what many would pay for an exclusive-ride taxi. It cannot be ignored that such public expenditures have opportunity costs – money could go to other pressing needs like health care, education, and nutrition. Some argue other mechanisms to redistributing incomes, such as negative income taxes, are preferable to sector-specific subsidies because they have less distortive effects (Peskin, 1973). Subsidies, moreover, are not always progressive. Studies show they can induce more and longer trips, especially among the non-poor. A study in Salvador, Brazil showed that the lowest income groups made, on average, one trip per person per day compared with 3 trips per day for the highest income groups (Thompson, 1993).
State Roles in Providing Affordable Mass Transport Services for Low-Income Residents
Discussion Paper 2011-17: Robert Cervero – ©OECD/ITF 2011 11
Figure 7. GDP per Capita and Annual Public Transport Investment Expenditure/Annual Road Network Investment, Operation and
Maintenance Expenditure Among 30 Global Cities, 2001
Source: UITP Mobility in Cities Database, 2006.
Public investments in costly metrorail systems have come under particular fire not only for their price tags but also redistributive effects. Metrorail investments are often regressive, burdening tax-payers while mainly benefiting middle-class workers with white-collar office jobs as well as central-city businesses, retailers, and land-owners. Sometimes bus services, which are often patronized proportionally more by low-income individuals, have to be curtailed in order to cover the costs of pricey metrorail investments. The differences in the cost-effectiveness of these transit options can be striking: in Colombia, Bogotá‘s Transmilenio Bus Rapid Transit (BRT) system carries more than three times as many riders as Medellin‘s rail system which cost five times more to build (Cervero, 2003). In the U.S., inflation-adjusted subsidies to rail transit per urban resident have increased dramatically over the past decade while those to bus transit have actually fallen (Taylor and Breiland, 2011).
6. MODERATING TRANSIT OPERATING SUBSIDIES
The fiscal burden of underwriting transit operations can be relieved through containing costs, increasing incomes, or some combination thereof. Cost containment measures are generally the most expeditious way to reduce operating deficits and subsidies, though they can be politically contentious, particularly when cuts fall on the backs of labor, which in the case of formal operations account for three-quarters or more of all operating expenses.
A cost-containment strategy that has perhaps garnered the most attention in recent times is managed competition through competitive tendering. Experiences show that competition imposes a market discipline, prompting contractors to contain costs and drive hard bargains at the labor negotiations table. Experience in western Europe and the U.S. reveal that competitive tendering can lower transit operating costs by 40% (Gwilliam, 2002). Competitive tendering, however, works well only under the right conditions: notably, contestability (i.e., knowledge that firms risk losing bids if costs are too high) and the institutional capacity and political commitment to properly oversee and manage contracts. Moreover, care must be taken to ensure that private operators do not abandon socially desirable services. If left unchecked, successful bidders will eliminate the least profitable transit services in the drive to maximize profits. This can mean the

State Roles in Providing Affordable Mass Transport Services for Low-Income Residents
12 Discussion Paper 2011-17: Robert Cervero – ©OECD/ITF 2011
axing of bus services in the urban periphery (where the poor of the developing world often dwell) as well as during the off-peak and on weekends (times when low-skilled, low-salaried workers with odd-hour, split-shift jobs often need to get to and from work).
Better revenue management can also reduce transit subsidies. Fares, for instance, can be restricted to a certain class of users. This is often on the basis of age, with fare concessions typically assigned to the elderly and school-age children. In practice, this can create horizontal inequities, with some lower-income riders cross-subsidizing other lower-income riders, and at worst a regressive form of cross-subsidies, with the poor subsidizing the rich. Not all senior citizens nor all school children are from low income households. Such horizontal inequities can mean poor middle-age transit riders are helping to cover the fares of wealthy elderly riders. The global trend toward societal aging is likely to exacerbate such inequities.
Gomez-Ibanez (1975) has argued for a somewhat coarser targeting of subsidies. Because the poor constitute a larger share of riders in smaller metropolitan areas and for shorter-distance, off-peak services in bigger ones, he suggests these kinds of services might be more heavily subsidized. Service-based targeting of subsidies does not eliminate internal cross-subsidization, however, and in the case of the U.S., will not bring benefits to the larger number of poor people who do not regularly use mass transportation. An alternative is geographic targeting. In Lima, Peru, reduced public transit tickets are sold at kiosks in urban districts with high concentrations of poverty. Private paratransit operators are paid the difference between regular fares and discounted tickets, plus an administration fee.
All subsidies are income transfers thus an argument can be made that ability-to-pay should be the only grounds for underwriting transit‘s costs and thus transferring wealth from non-users (e.g., taxpayers in general) and non-eligible users (e.g., adult, non-concession-fare riders) to targeted populations (e.g., seniors with fare subsidies). For this reason, the financial burden of fare reductions should shift from transit operators and governments in general to specific social and human services agencies responsible for the welfare of specific client groups. Shifting subsidies from general public treasures to special-purpose groups can promote horizontal equity.
Another revenue-based policy option would be to focus on user-side versus provider-side subsidies. This could be in the form of vouchers issued by social service agencies to their clients – e.g., chits to seniors and the unemployed. Such vouchers work best in a fairly open marketplace that enriches transit service offerings and increases the number of price points -- provided, of course, that operators meet safety, fitness, and operating standards. Another rationale for user-side subsidies is they can reduce waste and inefficiencies that are often encountered when one group (e.g., taxpayers) cover some of the costs of others (e.g., transit riders). Experiences shows many provider-side subsidies get leaked away in the form of higher worker compensation and benefit packages without commensurate improvements in transit services or productivity gains. In the U.K. and the U.S., studies show that as much as one-half of transit operating subsidies are leaked away (Oi, 1973; Cervero, 1984; Pickrell, 1985; Gwilliam, 2002).
A focus on keeping fares low and thus affordable to the poor through public subsidies can backfire in other ways. A vast literature reveals that transit riders tend to be more service-than price- sensitive, and that this sometimes holds even among low income travelers. In the U.S., the elasticity between transit service frequency and ridership is roughly twice as large (in absolute terms) as between average fare and ridership (Cervero, 1990). And as a force toward inducing modal shifts, relationships are virtually nil – the cross-elasticities between transit fares and car travel has been shown to be nearly zero in the United States (Moses and Williamson, 1963; Cervero, 1990). Besides subsidies shielding operators from rising costs and rewarding inefficiencies, reduced income means that transit services are often reduced to the lowest common denominator – i.e., routine, fixed route, and relatively infrequent services. This prompts

State Roles in Providing Affordable Mass Transport Services for Low-Income Residents
Discussion Paper 2011-17: Robert Cervero – ©OECD/ITF 2011 13
most middle-income, choice consumers with a car available to drive, thus reducing the environmental benefits of transit investments. Evidence from social surveys of public transport users in Uzbekistan, the Kyrgyz Republic, and several Brazilian cities suggest that the poor may be willing to pay more for better services offered by informal carriers (Gwilliam, 2002). In Cairo, many of the poor take higher priced Metro over conventional fixed-route buses because of higher quality services.
Another fare-based option with potential high pay-off is to modify fare systems. This can be in the form of more differentiated fares that reflect the higher marginal costs of peak-period and longer distance services. Washington D.C. metro levies peak-period surcharges and many bus operators have distanced-based fares. Technologies like smart cards enable more efficient pricing. In Seoul, GPS and smart-card technologies are used to levy a unified distance-based fare for those making integrated bus and rail trips. GPS tracks the precise location where a passenger boards and leaves a bus, assigning a ―tentative fare‖, and at the end of the connected subway journey, a final and precise distance-based fare is levied against the user‘s stored-value smart card.
Efficient transit pricing is more likely to take root when a receptive institutional environment exists that creates integrated and unified tariff systems and that rewards cost-effectiveness. An exemplary model is Germany‘s Verkehrsverbund, or transportation federation (Pucher and Kurth, 1996). As practiced in city-regions like Munich and Hamburg, an executive board is formed to set regional service and fare policies, in addition to approving budgets for capital investments and operating assistance. A particularly important role of the board is to allocate sufficient operating assistance across operators to ensure that efficient and socially equitable fares can be charged while also rewarding operators who are productive. Day-to-day matters – e.g., making sure timetables of trains and buses are synchronized, setting boundaries for zonal tariffs – are left to a management board, whose members are mainly bosses and department heads of rail and bus companies that deliver services. The coordination of services and integration of tariffs means a high-quality regional network of transit services is available, one that allows seamless transfers and that minimizes fare penalties from switching between transit modes or routes. High service quality translates into high ridership and thus high cost recovery rates.
Many rail transit agencies are also in a position to generate revenues through value capture. No city has more successfully recaptured the increase in land values created by the opening of new metrorail stations than Hong Kong. Under Hong Kong MTR‘s R+P (Rail+Property) program, MTR sells the long-term development rights of building atop subway stations to private real-estate companies. Between 2001 and 2005, 62 percent of MTR‘s income came from property-related activities, more than twice as much as generated by farebox revenues. In addition to helping cover the costs of railway investments and operations, such schemes promote more sustainable patterns of urbanism, like transit-oriented development (Cervero and Murakami, 2009).
7. INFORMAL TRANSPORT OPERATORS
Still another way to relieve governments of the financial burdens of public transportation is to partially or fully deregulate the urban transport sector and in the case of the poorest countries, largely hand over the provision of collective-ride mobility to informal operators. In the developing world, informal services remain the chief option available for collective-ride transport (Cervero and Golub, 2007). In much of Africa and in smaller Asian cities where municipal budgets are stretched thin and technical capacities for planning, administration and regulation are insufficient, almost by default informal transport are the only dependable services available. On the one

State Roles in Providing Affordable Mass Transport Services for Low-Income Residents
14 Discussion Paper 2011-17: Robert Cervero – ©OECD/ITF 2011
hand, these ‗small vehicle‘ modes provide important benefits, particularly to the poor, such as on-demand access to medical clinics, jobs for low-skilled in-migrants, and service coverage in areas devoid of formal transit. On the other hand, they contribute to traffic congestion, air and noise pollution, and traffic accidents.
Besides being more market responsive and economically productive, informal paratransit operators often do a better job of containing costs than their public-sector counterparts. This is often due to the profit-maximizing motives of owner-operators who avoid the kinds of overhead and administrative costs found with larger organizations. Often the same person who drives a minibus maintains it as well. In addition, lack of union representation tempers wage escalation. Moreover, most informal operators belong to route associations which, among other things, help keep costs down through group purchase of liability insurance, spare parts, and fuels. Even where public financial support is involved, private operators are more efficient. Karlaftis and Sinha (1997) found that privately operated systems have been better able to use public subsidies to improve performance, in contrast to experiences with subsidies to heavily unionized public transit agencies.
A recent study examined the impacts of eleven different policies aimed at improving the quality and cost of collective-ride services available to the poor of Rio de Janeiro (Cervero and Golub, 2007). Among the policies investigated included upgrading bus and train services, regulating and legalizing private van services (that are currently informal), investing in busway infrastructure, and competitive concessions of bus and van services. Competitive tendering was estimated to benefit the poor the most by lowering fares but also creating higher quality services, such as a higher likelihood of getting a seat. Other initiatives were less beneficial to low-income residents because they carried higher costs and thus higher user fares.
8. METROVIVIENDA
Bogotá, the Andean capital of Colombia and home to more than 7 million inhabitants, is widely recognized for having mounted one of the most sustainable urban transport programs anywhere. In 2000, the city introduced a high-speed, high-capacity bus system, called TransMilenio, building upon Curitiba, Brazil‘s much-celebrated success with dedicated busways. Bogotá‘s leaders went one step further, giving investment priority to pedestrians, followed by bicycle facilities, then public transit, and lastly cars (i.e., inversely to travel speeds).
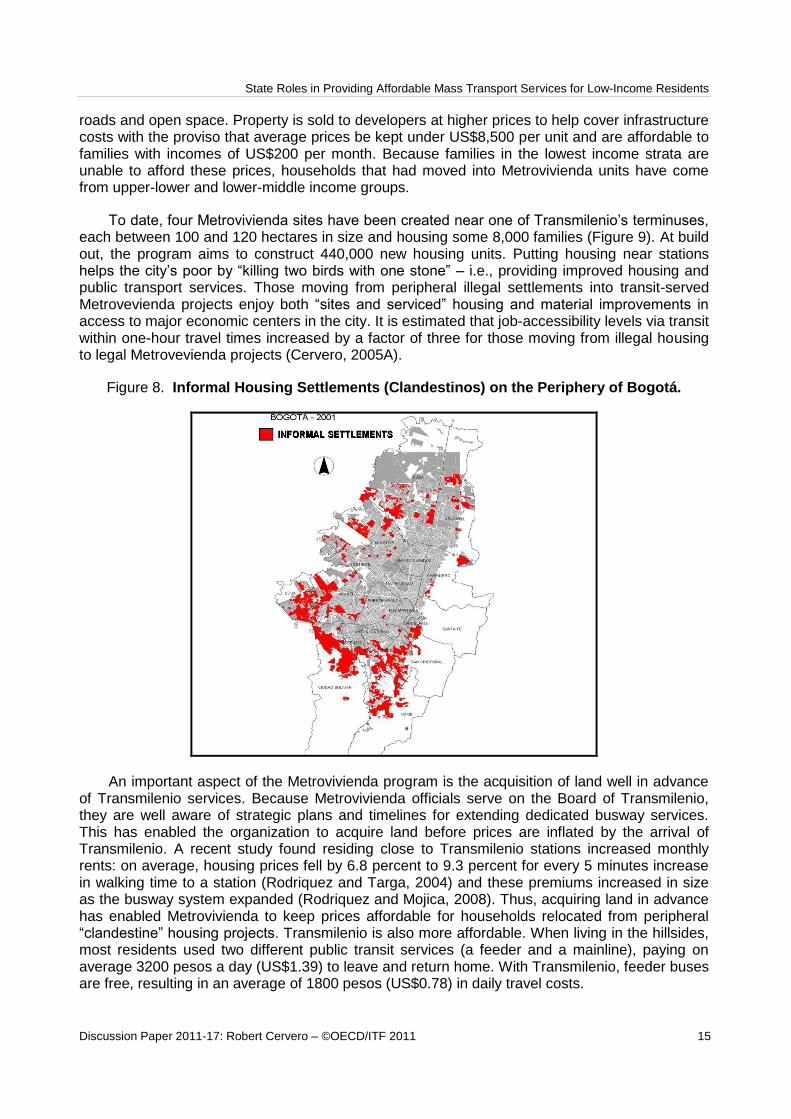
As in many Latin American cities, Bogotá is dotted with informal housing clusters, some which snake up the hillsides to hard-to-reach locations. Figure 8 shows the location of informal settlements which in 2001 housed 22% of the city‘s population on 18% of its land area (6500 hectares in total). As of 2004, 375,000 slum-residences had been illegally built in 1,433 different
―clandestinos‖, or clandestine neighborhoods (Cervero, 2005B). Relatively few public services
(sewerage lines, piped water, paved roads) reach these areas. Because of the peripheral locations and limited availability of public transport (partly because of steep terrains and rutted roads), the average daily commute of ―clandestine‖ residents was 2 ½ hours in 2001. Many unskilled workers seeking day jobs are forced to pay multiple fares for informal paratransit connections to the city, consuming as much as 15% of daily wages.
In response to these acute problems, an innovative land-banking/poverty-alleviation program, called Metrovivienda, was introduced in 1999. Under Metrovivienda, transportation and housing are treated as bundled goods. The city acquires plots when they are in open agricultural uses at relatively cheap prices and proceeds to plan and title the land and provide public utilities,
State Roles in Providing Affordable Mass Transport Services for Low-Income Residents
Discussion Paper 2011-17: Robert Cervero – ©OECD/ITF 2011 15
roads and open space. Property is sold to developers at higher prices to help cover infrastructure costs with the proviso that average prices be kept under US$8,500 per unit and are affordable to families with incomes of US$200 per month. Because families in the lowest income strata are unable to afford these prices, households that had moved into Metrovivienda units have come from upper-lower and lower-middle income groups.
To date, four Metrovivienda sites have been created near one of Transmilenio‘s terminuses, each between 100 and 120 hectares in size and housing some 8,000 families (Figure 9). At build out, the program aims to construct 440,000 new housing units. Putting housing near stations helps the city‘s poor by ―killing two birds with one stone‖ – i.e., providing improved housing and public transport services. Those moving from peripheral illegal settlements into transit-served Metrovevienda projects enjoy both ―sites and serviced‖ housing and material improvements in access to major economic centers in the city. It is estimated that job-accessibility levels via transit within one-hour travel times increased by a factor of three for those moving from illegal housing to legal Metrovevienda projects (Cervero, 2005A).
Figure 8. Informal Housing Settlements (Clandestinos) on the Periphery of Bogotá.
An important aspect of the Metrovivienda program is the acquisition of land well in advance of Transmilenio services. Because Metrovivienda officials serve on the Board of Transmilenio, they are well aware of strategic plans and timelines for extending dedicated busway services. This has enabled the organization to acquire land before prices are inflated by the arrival of Transmilenio. A recent study found residing close to Transmilenio stations increased monthly rents: on average, housing prices fell by 6.8 percent to 9.3 percent for every 5 minutes increase in walking time to a station (Rodriquez and Targa, 2004) and these premiums increased in size as the busway system expanded (Rodriquez and Mojica, 2008). Thus, acquiring land in advance has enabled Metrovivienda to keep prices affordable for households relocated from peripheral ―clandestine‖ housing projects. Transmilenio is also more affordable. When living in the hillsides, most residents used two different public transit services (a feeder and a mainline), paying on average 3200 pesos a day (US$1.39) to leave and return home. With Transmilenio, feeder buses are free, resulting in an average of 1800 pesos (US$0.78) in daily travel costs.

State Roles in Providing Affordable Mass Transport Services for Low-Income Residents
16 Discussion Paper 2011-17: Robert Cervero – ©OECD/ITF 2011
Figure 9. Bogota’s Metrovivienda Program: Bundling Low-Cost Housing and Public Transport
Metrovivienda is an exemplar of accessibility-based planning in a developing country. By coupling affordable housing with affordable transport, Bogotá leaders have improved access to jobs, shops, and services while reducing the joint costs of what often consumes two-thirds of the poor‘s income: housing and transport. Whether Metrovivienda makes a serious dent in the city‘s housing shortages and traffic woes remains to be seen, however most observers agree that it is a significant and positive step forward.
9. EVALUATION: TOWARD A MORE BALANCED FRAMEWORK
One factor that likely impedes the emergence of transportation services catered to the mobility needs of the poor and that as a consequence likely keeps prices higher than they need be is how transportation projects are evaluated. Rarely, if ever, are accessibility and affordability explicit and quantified criteria used in evaluating urban transportation projects. Rather, travel-time savings are the principal economic benefit assigned to urban transport projects. According to Mackie et al. (2001), travel-time savings capture 80% of the quantified benefits for transportation Cost-Benefit Analyses (CBA) in the United Kingdom. In a recent evaluation of proposed bus-way improvements in Lima, Peru, travel-time savings represented 75% of the project‘s total estimated benefits (World Bank, Latin American and the Caribbean Region, 2003).
History shows that major improvements to roads and public transit do not reduce the amount of time per day urbanites devote to getting around a city. More often, they increase the number and length of trips (Metz, 2008). Despite dramatic gains in the average speed of travel conferred by modern technology over the past century — faster cars, super-highways, limited-access/grade-separated freeways — the amount of time urbanites spend traveling has remained largely unchanged over many decades, if not centuries. Scholars call this constancy in travel-time expenditures ―time budgets‖ (Zahavi and Talvitie, 1980, Tanner, 1981). As transport systems become speedier and cheaper, urban dwellers take advantage of these improvements by traveling more and over greater distances as opposed to saving time or money. If conditions allow, users prefer to broaden their range of options rather than reduce general costs of travel.
State Roles in Providing Affordable Mass Transport Services for Low-Income Residents
Discussion Paper 2011-17: Robert Cervero – ©OECD/ITF 2011 17
Thus, the benefit of a new road or bus-way gets expressed more in terms of expansion of trade-sheds, labor-sheds, market-sheds, and social networks than spending less on physical movement. Stated another way, the chief benefit is increased ―accessibility‖ — i.e., the ability to get to destinations and activities people want to reach — not less total time traveling. It follows that any assessment of prospective transport investment projects should give at least as much attention to estimated impacts on accessibility as to travel-time savings.
Reliance on travel-time metrics to gauge benefits also raises equity concerns. Travel-time savings accrue mainly to motorists, yet many poor in the developing world do not own a car or drive. Their values of time might also be substantially less than those of the middle and professional classes. For them, enhanced access opportunities might be a bigger benefit – and contribute more to poverty alleviation — than reduced travel-time expenditures. The ability to widen the territorial sphere for job searching, save on food purchases, reach medical clinics fairly quickly, and seek out better educational opportunities is likely to benefit the poor more than saving a few minutes of time moving along an expanded roadway.
Experiences also show that the poor are willing to trade-off travel-time delays for lower transit fares, parking rates, or fuel prices — i.e., they tend to be more price-sensitive and less time-sensitive than the non-poor. More popular uprisings have been sparked by increases in fuel prices and bus fares than by delays in travel times. For such reasons, the use of travel-time savings as a singular metric of benefits is all the more questionable from an equity point-of-view.
10. ALTERNATIVE EVALUATION METRIC
Accessibility needs to be elevated in the toolkit of metrics used to evaluate transportation proposals. Accessibility is a product of mobility and proximity, enhanced by either increasing the speed of getting between point A and point B (mobility), or by bringing points A and B closer together (proximity), or some combination thereof. Since accessibility is a product of both travel time and the geographic location of urban activities, it captures not only the temporal but also spatial dimension of travel. Thus accessibility measures give legitimacy to land-use initiatives and urban management tools in addition to supply-side, mobility-enhancing measures.
Accessibility is typically handled qualitatively in economic appraisals of transportation proposals. The appraisal of a proposed BRT investment in Lagos, Nigeria, for example, offered a simple qualitative statement in support of the project on social grounds, noting ―the proposed project would benefit women, the elderly, and the physically challenged by responding to their needs and providing them with better access to basic social services (health, school, administration), jobs, and markets, at a lower cost than currently available‖ (World Bank, Africa Regional Office, 2009, p. 26).
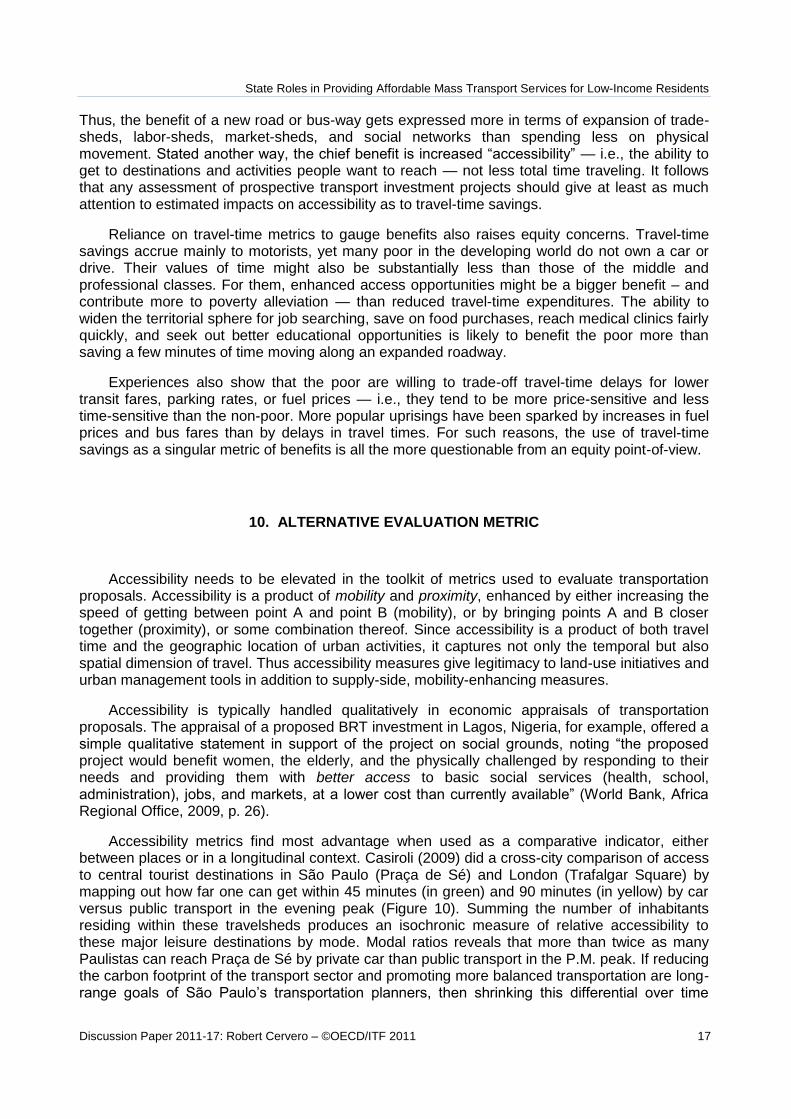
Accessibility metrics find most advantage when used as a comparative indicator, either between places or in a longitudinal context. Casiroli (2009) did a cross-city comparison of access to central tourist destinations in São Paulo (Praça de Sé) and London (Trafalgar Square) by mapping out how far one can get within 45 minutes (in green) and 90 minutes (in yellow) by car versus public transport in the evening peak (Figure 10). Summing the number of inhabitants residing within these travelsheds produces an isochronic measure of relative accessibility to these major leisure destinations by mode. Modal ratios reveals that more than twice as many Paulistas can reach Praça de Sé by private car than public transport in the P.M. peak. If reducing the carbon footprint of the transport sector and promoting more balanced transportation are long-range goals of São Paulo‘s transportation planners, then shrinking this differential over time

State Roles in Providing Affordable Mass Transport Services for Low-Income Residents
18 Discussion Paper 2011-17: Robert Cervero – ©OECD/ITF 2011
would signal progress. A smaller ratio would also better reflect benefits accrued from improving metrorail and metrobus services than would an estimate of transit travel-time savings.
In car-oriented cities, such as the U.S., even larger accessibility advantages have been recorded for automobile over mass-transit travel (Cervero, 2005A). In transit-oriented cities, the obverse holds. A recent study revealed that Hong Kong residents were far more accessible to jobs via the city‘s highly integrated network of public and private bus, metro-rail, tramway, ferry, and even funicular than via private car (Kwok and Yeh, 2004).
Figure 10. Comparison of how far one can travel by car versus public transport within 45 and 90 minutes in evening peak, London and São Paulo.
While accessibility indicators are useful metrics for inter-modal comparisons and for assessing likely impacts of transportation and land-use plans over time, they need to be expressed in monetary terms if they are to be of much use in economic appraisals. One approach to valuing access is to measure willingness-to-pay, applying stated preference techniques (Metz, 2008). Another approach is to impute land-price capitalization impacts using techniques like hedonic price modelling. A recent study of BRT in Seoul, South Korea found commercial land parcels within 300m of a BRT stop were upwards of 25 percent more valuable per square meter than otherwise comparable parcels more than 300 m from a stop (Cervero and Kang, 2011). A study of access to rail lines in Bangkok found similar results, with the premium of transit accessibility estimated to be $10 for every meter that a property lies closer to a station (Chalermpong, 2007).
Rather than attaching a monetary value to transportation improvements, cost-effectiveness measures might be used instead. A cost-effectiveness metric might express the number of additional jobs that can be reached within one-half hour travel time per million dollar expenditure. Thus instead of attempting to assign a monetary value to benefits (e.g., increased access to jobs), only financial costs for project outlays are monetized. Combining data on financial expenditures with isochronic indices of accessibility can yield a reasonable performance measure that is free of such problems as valuing time or obtaining land valuation data.
Cost-effectiveness measures are likely better suited to many developing countries where reliable data are limited and outcomes are difficult to measure. Cost-benefit analysis is not used in evaluating public works projects — like a school building upgrade — when inputs cannot be

State Roles in Providing Affordable Mass Transport Services for Low-Income Residents
Discussion Paper 2011-17: Robert Cervero – ©OECD/ITF 2011 19
easily translated to outcomes (e.g., higher student scores). Similar challenges in attributing transportation investments to accessibility outcomes argue for cost-effective measures as a second-best alternative in some instances.
Elevating the importance of accessibility and other performance measures like sustainability and affordability in project appraisals need to be done with equity concerns in mind. If improved access to jobs, shops, and hospital services are limited to car-owning households, little progress will be made in alleviating urban poverty. It is thus important that all performance metrics stratify results in ways that allow the likely distributional equity impacts of a project to be assessed. Besides accessibility and mobility (e.g., speeds), a more robust and inclusionary framework for measuring performance might also weigh factors like sustainability (e.g., VKT and emissions per capital), livability (e.g., community ratings or commute delays per capita), safety (e.g., road fatalities per 100,000 inhabitants), and affordability (e.g., percent wages spend on commuting) in judging proposals.
11. CLOSE
Public transport is likely to gain prominence as a mobility-provider as energy prices rise, urbanization pressures and motorization increase traffic congestion, and public mandates call for significant reductions in Greenhouse Gas emissions. The costs of delivering services that appeal to choice consumers who have the option of driving will no doubt increase as well. Finding ways of keeping fares affordable without overly taxing the public largesse to underwrite deficits remains a daunting public policy challenge.
Transit subsidies can be managed and contained in a number of ways, some working on the cost side, others on the revenue side, and others on the program design and administrative side. Competitive tendering is a proven method of reducing transit operating costs though only under conducive conditions. Expanding the private-sector role, however, does not mean public relinquishment of its role, particularly with regard to promoting the interests of the mobility-disadvantaged and ensuring affordable services. Among the initiatives that could serve to temper subsidies while better targeting public assistance to the needy are user-side subsidies, concession fares administered by client-based agencies, and time-of-day pricing. In poorer countries, private paratransit and informal operators must often be relied upon to ensure low-income households have reasonable mobility options. To reduce the chance of collectively damaging behavior that often comes from over-competition, the public sector must be prepared to initiate and enforce regulations related to safety, service standards, and if need be, affordable fares. Institutional innovations can even extend into the co-management of affordable housing and transport programs, as underscored by the Bogotá‘s Metrovevienda program.
Regardless how much progress is made in containing current-day transit operating costs and stimulating revenues, reforms are needed that guide long-term investment decisions in ways that promote efficiencies but that are also pro-poor. Moving away from the standard-bearer of evaluating proposed transport projects principally on the basis of travel-time savings to a more balanced perspective that weighs impacts on accessibility, affordability, and sustainability as well would be a positive step forward. Ultimately, the aims of public policies that help the poor and keep costs affordable are not to serve movements as a goal in and of itself, but rather to enhance opportunities to reach the places people want to go, be they employment destinations, medical services, or retail outlets – in short, to create more accessible cities and regions.

State Roles in Providing Affordable Mass Transport Services for Low-Income Residents
20 Discussion Paper 2011-17: Robert Cervero – ©OECD/ITF 2011
REFERENCES
Armstrong-Wright, A. 1986. Urban Transport Systems: Guidelines for Examining Options‖. Washington, D.C.: World Bank Technical Paper, Urban Series No. 52.
Badami, M., Tiwari, G. and Mohan, D. 2004. Access and Mobility for the Urban Poor in India: Bridging the Gap Between Policy and Needs. Paper presented at the Forum on Urban Infrastructure and Public Service Delivery for the Urban Poor. New Delhi: National Institute of Urban Affairs.
Capp, J., Elstrodt, H., Jones, W. 2005. Reining in Brazil‘s Informal Economy. The McKinsey Quarterly, January, pp. 1-6.
Casiroli, F. 2009. The Mobility DNA of Cities. Urban Age, December issue, pp. 1-3.
Cervero, R. 1983. Intergovernmental Responsibilities for Financing Public Transit Services. Washington, D.C.: Urban Mass Transportation Administration, U.S. Department of Transportation, Report DOT-I-83-30.
Cervero, R. 1984. Effects of Operating Subsidies and Dedicated Funding on Transit Costs and Performance, Journal of Urban Analysis and Public Management, Vol. 8, No. 1 pp. 37-53.
Cervero, R. 1990. Transit Pricing Research: A Review and Synthesis, Transportation, Vol. 17, No. 2, pp. 117-140.
Cervero, R. 1998. The Transit Metropolis: A Global Inquiry. Washington, D.C.: Island Press.
Cervero, R. 2000. Informal Transport in the Developing World. Nairobi: United Nations Centre for Human Settlements (Habitat).
Cervero, R. 2003. Green Connectors: Off-Shore Examples, Planning, May, 2003, pp. 25-29.
Cervero, R. 2005A. Accessible Cities and Regions: A Framework for Sustainable Transport and Urbanism in the 2st Century. Berkeley: UC Berkeley Center for Future Urban Transport, Working Paper, UCB-ITS-VWP-2005-3. http://www.its.berkeley.edu/publications/UCB/2005/VWP/UCB-ITS-VWP-2005-3.pdf
Cervero, R. 2005B. Progressive Transport and the Poor: Bogotá's Bold Steps Forward. Access, No. 27, 2005, pp. 24-30.
Cervero, R., Sandoval, O., and Landis, J. 2002. Transportation as a Stimulus to Welfare-to-Work: Private Versus Public Mobility, Journal of Planning Education and Research, Vol. 22, pp. 50-63.
Cervero, R., et al. 2006. Making Do: How Working Families in Seven U.S. Metropolitan Areas Trade Off Housing and Commuting Times. Berkeley, CA: Institute of Transportation Studies, University of California, Berkeley.

State Roles in Providing Affordable Mass Transport Services for Low-Income Residents
Discussion Paper 2011-17: Robert Cervero – ©OECD/ITF 2011 21
Cervero, R. and Golub, A. 2007. Informal Transport: A Global Perspective. Transport Policy, Vol. 14, pp. 445-457.
Cervero, R. and Murakami, J. 2009. Rail + Property Development in Hong Kong: Experiences and Extensions, Urban Studies, Vol. 46, No. 10, 2009, pp. 2019-2043.
Cervero, R., Sarmiento, O., Jacoby, E., Gomez, L. and Neiman, A. 2009. Influences of Built Environments on Walking and Cycling: Lessons from Bogotá, International Journal of Sustainable Transport, Vol. 3, 2009, pp. 203-226.
Cervero, R. and Kang, C. 2011. Bus Rapid Transit Impacts on Land Uses and Land Values in Seoul, Korea. Transport Policy, Vol. 18, pp. 102-116.
Chalermpong, S. 2007. Rail Transit and Residential Land Use in Developing Countries: Hedonic Study of Residential Property Prices in Bangkok, Thailand. Transportation Research Record 2038, pp. 111-119.
Federal Transit Administration. 2011. National Transit Database. Washington, D.C.: Federal Transit Administration, U.S. Department of Transportation. www.ntdprogram.gov/ntdprogram.
Ferrarazzo, A. and Arauz, M. 2000. Pobreza y Transporte. Buenos Aires. Consultacion con Grupos de Foco en Buenos Aires: World Bank Urban Transport Strategic Review.
Gomez-Ibanez, J. 1975. Assessing the Arguments for Mass Transportation Operating Subsidies. Cambridge: Department of City and Regional Planning, Harvard University, Discussion Paper D 75-1.
Gwilliam, K. 2002. Cities on the Move. Washington, D.C.: The International Bank for Reconstruction and Development/The World Bank, A World Bank Transport Strategy Review.
Hilton, G. 1975. The Urban Mass Transportation Assistance Program. Perspectives on Federal Transportation Policy, J. Miller, ed. Washington, D.C.: American Enterprise Institute for Public Policy Research.
Ihlanfeldt, K. 1999. The Geography of Economic and Social Opportunity in Metropolitan Areas. Governance and Opportunity in Metropolitan America. Washington, D.C.: National Academy Press, pp. 213-252.
Kain, J. and Persky. 1969. Alternatives to Gilded Ghetto. The Public Interest, Winter, pp. 77-91.
Kaltheier, R. 2002. Urban Transport and Poverty in Developing Countries: Analysis and Options for Transport Policy and Planning. Eschborn, Germany: Deutsche Gesellschaft für Technische Zusammenarbeit (GTZ) GmbH.
Karlaftis, M. and Sinha, K. 1997. Performance Impacts of Operating Subsidies in the Paratransit Sector, Transportation Research Record 1571, pp.. 75-80.
Kawabata, M. 2003. Job Access and Employment Among Low-Skilled Workers in U.S. Metropolitan Areas. Environment and Planning A, Vol. 35, No. 9, pp. 1651-1668.
Kwok, R. and A. Yeh, 2004, The Use of Modal Accessibility Gap as an Indicator for Sustainable Transport Development, Environment and Planning A, Vol. 36: 91-936.

State Roles in Providing Affordable Mass Transport Services for Low-Income Residents
22 Discussion Paper 2011-17: Robert Cervero – ©OECD/ITF 2011
World Bank, Latin American and the Caribbean Region. 2003. Project Appraisal Document on a Proposed Loan for the Lima Transport Project, Report No: 27253-PE.
Metz, D. 2008. The Myth of Travel Time Savings. Transport Reviews, Vol. 28, No. 3, pp. 321-336.
Moses, L. and Williamson, J. 1963. Value of Time, Mode Choice and the Subsidy Issue in Urban Transportation. Journal of Political Economy, Vol. 71, pp. 247-264.
Murphy, J. and Delucchi, M. 1998. A Review of the Literature on the Social Cost of Motor-Vehicle Use in the United States. Journal of Transportation and Statistics, Vol. 1, No. 1, pp. 15-42.
Oi, W. 1973. Alternative Formulas for Federal Operating Subsidy Programs for Transit. Arglington, Virginia: Institute for Defense Analysis.
Peskin, H. 1973. An Analysis of Urban Mass Transit Subsidies. Washington DC: Institute for Defense Analysis, National Technical Information Service.
Pickrell, D. 1985. Rising Deficits and the Uses of Transit Subsidies in the United States. Journal of Transport Economics and Policy. Vol. 19, No. 3, pp. 281-298.
Pucher, J. and Kurth, S. 1996. Verkehrsverbund: The Success of Regional Public Transport in Germany, Austria, and Switzerland. Transport Policy, Vol. 2, No. 4, pp. 279-291.
Raphael, S. 1998. Spatial Mismatch Hypothesis and Black Youth Joblessness: Evidence from the San Francisco Bay Area. Journal of Urban Economics, Vol. 43, pp. 78-111.
Roberto, E. 2008. Commuting to Opportunity: The Working Poor and Commuting in America. Washington, D.C.: Brookings, Metropolitan Policy Program.
Rodriquez, D. and Targa, F., 2004. Value of Accessibility to Bogota‘s Bus Rapid Transit System. Transport Reviews, Vol. 24, No. 5, pp. 587–610.
Rodriquez, D. and Mojica, C., 2008. The Land Value Benefits of Bus Rapid Transit: The Case of Bogota ‘s Transmilenio. Landlines, Vol. 24, pp. 2–6.
Sandoval, O., Cervero, R., and Landis, J. 2010. The Transition from Welfare-to-Work: How Cars and Human Capital Facilitate Employment for Welfare Recipients. Applied Geography, Vol. 31, 2010, pp. 352-262.
Tanner, J. 1981. Expenditure of Time and Money on Travel. Transportation Research A, Vol. 15, No. 1, pp. 25-38.
Taylor, B. and Breiland, K. 2011. Transit‘s Dirty Little Secret: The Divergence of Public Policy and Transit Use by the Poor. Washington, D.C.: Transportation Research Board Annual Meeting 2011, Paper # 11-1282.
Thankuriah, P. and Metaxatos, P. 2000. Effect of Residential Location and Transportation on Employment Opportunities. Transportation Research Record 1726, pp. 24-32.
Thakuriah, P. and Tang, L. 2008. Longitudinal Analysis of Effect of Transportation Difficulties on Earnings Among Young Adults from Disadvantaged Families, Transportation Research Board Annual Meeting 2008 Paper #08-2592

State Roles in Providing Affordable Mass Transport Services for Low-Income Residents
Discussion Paper 2011-17: Robert Cervero – ©OECD/ITF 2011 23
Thakuriah, P. 2009. Transportation and Employment Accessibility in a Changing Context of Metropolitan Decentralization: The Case of Delhi, India. Cambridge: MIT Journal of Planning, Vol. 9, pp. 23-40.
Thompson, I. 1993. Improving Urban Transport for the Poor. CEPAL Review, Vol. 49, pp. 5-9.
UITP. 2006. Mobility in Cities Database. Paris: UITP.
Vasconcellos, E. 2001. Urban Transport, Environment and Equity: The Case for Developing Countries. London: Earthscan.
Wilson, W. 1996. When Work Disappears. New York: Knopf.
World Bank. 1996. Sustainable Transport: Priorities for Policy Reform, Washington, D.C.
World Bank, Latin American and the Caribbean Region. 2003. Project Appraisal Document on a Proposed Loan for the Lima Transport Project, Report No: 27253-PE.
World Bank, Africa Region. 2007. Project Appraisal Document on a Proposed Loan for the Republic of Ghana Urban Transport Project, Report No: 39750-GH.
World Bank. 2009. World Development Report: Reshaping Economic Geography. Washington, D.C.: The International Bank for Reconstruction and Development/The World Bank.
Zahavi, Y. and Talavitie, A. 1980. Regularities in Travel Time and Money Expenditures. Transportation Research Record 750, Transportation Research Board, pp. 13-19.
International Transport Forum2 rue André Pascal 75775 Paris Cedex [email protected]
Related Documents