STATE PRESCHOOL YEARBOOK The National Institute for Early Education Research

Welcome message from author
This document is posted to help you gain knowledge. Please leave a comment to let me know what you think about it! Share it to your friends and learn new things together.
Transcript

STATE PRESCHOOL YEARBOOK
The National Institute for Early Education Research

1
THE STATE OF PRESCHOOL 2017
STATE PRESCHOOL YEARBOOK
© 2018 National Institute for Early Education Research
By Allison H. Friedman-Krauss, Ph.D. W. Steven Barnett, Ph.D.G.G. Weisenfeld, Ed.D.Richard Kasmin, M.A.Nicole DiCrecchio, Ed.D.Michelle Horowitz, B.A.
ACKNOWLEDGEMENTS—The opinions expressed in this report are solely those of the authors. We wish to thank the Heising-Simons Foundation for supporting the development, production, and dissemination of this publication. Established in 2007 by husband and wife Mark Heising and Elizabeth (Liz) Simons, The Heising-Simons Foundation is dedicated to advancing sustainable solutions in the environment, supporting groundbreaking research in science, and enhancing the education of the nation’s youngest learners. In addition, we wish to thank the Bill and Melinda Gates Foundation for their support of our work on the Dual Language Learners section of the Yearbook. Finally, the authors would like to extend our thanks to Sandy Ogilvie, Michelle Ruess, Ellen Frede, Jim Squires, and Andrew Barnett for their assistance on this report.
The primary data source for this report is the 2017 State of Preschool Survey conducted by NIEER that was funded by the National Center for Education Statistics (NCES). NCES publications related to the survey are available on-line at http://nces.ed.gov/pubsearch/. The 2017 and earlier data sets also are available from NIEER by request.
Additional information for this report was obtained from a 2017 survey of state policies related to dual language learners conducted by NIEER with support from the Bill and Melinda Gates Foundation.
This publication is a product of the National Institute for Early Education Research (NIEER), a unit of the Graduate School of Education at Rutgers, The State University of New Jersey. NIEER supports early childhood education policy by providing objective, nonpartisan information based on research.
NATIONAL INSTITUTE FOREARLY EDUCATION RESEARCH
Design: Sandy Ogilvie Graphic Design [email protected]
Executive Summary .................................................................................................................................................. 5
National Overview ........................................................................................................................................... 15
Enrollment .................................................................................................................................................. 15
Quality Standards ....................................................................................................................................... 16
Resources ................................................................................................................................................... 21
Six States to Watch .......................................................................................................................................... 23
Special Report: Supporting Dual Language Learners in State-Funded Preschool ................................................. 31
What Qualifies as a State Preschool Program? ...................................................................................................... 37
Roadmap to the State Profile Pages ...................................................................................................................... 38
Guide to State Profiles ..................................................................................................................................... 42
Glossary of Abbreviations ................................................................................................................................ 43
State Profiles .......................................................................................................................................................... 44
Alabama ........................................................................................................................................................... 45
Alaska .............................................................................................................................................................. 47
Arizona ............................................................................................................................................................. 49
Arkansas ........................................................................................................................................................... 51
California ......................................................................................................................................................... 53
Colorado .......................................................................................................................................................... 57
Connecticut...................................................................................................................................................... 59
Delaware .......................................................................................................................................................... 64
District of Columbia ......................................................................................................................................... 66
Florida .............................................................................................................................................................. 68
Georgia ............................................................................................................................................................ 70
Hawaii .............................................................................................................................................................. 72
Idaho ................................................................................................................................................................ 74
Illinois ............................................................................................................................................................... 76
Indiana ............................................................................................................................................................. 78
Iowa ................................................................................................................................................................. 80
Kansas .............................................................................................................................................................. 84
Kentucky .......................................................................................................................................................... 88
Louisiana .......................................................................................................................................................... 90
Maine ............................................................................................................................................................... 95
Maryland .......................................................................................................................................................... 97
Massachusetts .................................................................................................................................................. 99
Michigan ........................................................................................................................................................ 103
Minnesota ...................................................................................................................................................... 105
Mississippi ...................................................................................................................................................... 109
Missouri ......................................................................................................................................................... 111
Montana ......................................................................................................................................................... 113
Nebraska ........................................................................................................................................................ 115
Nevada .......................................................................................................................................................... 117
New Hampshire ............................................................................................................................................. 119
New Jersey .................................................................................................................................................... 121
New Mexico ................................................................................................................................................... 126
New York ........................................................................................................................................................ 128
North Carolina ............................................................................................................................................... 130
North Dakota ................................................................................................................................................. 132
Ohio ............................................................................................................................................................... 134
Oklahoma ...................................................................................................................................................... 136
Oregon .......................................................................................................................................................... 138
Pennsylvania .................................................................................................................................................. 142
Rhode Island .................................................................................................................................................. 148
South Carolina ............................................................................................................................................... 150
South Dakota ................................................................................................................................................. 152
Tennessee ...................................................................................................................................................... 154
Texas .............................................................................................................................................................. 156
Utah ............................................................................................................................................................... 158
Vermont ......................................................................................................................................................... 160
Virginia ........................................................................................................................................................... 162
Washington .................................................................................................................................................... 164
West Virginia .................................................................................................................................................. 166
Wisconsin ....................................................................................................................................................... 168
Wyoming ....................................................................................................................................................... 172
American Samoa ............................................................................................................................................ 174
Guam ............................................................................................................................................................. 176
Northern Mariana Islands ............................................................................................................................... 178
Palau .............................................................................................................................................................. 180
Puerto Rico .................................................................................................................................................... 182
Virgin Islands .................................................................................................................................................. 184
Methodology ........................................................................................................................................................ 186
Appendices Table of Contents .............................................................................................................................. 189
Footnotes
VISIT OUR WEBSITE FOR ACCESS TO ALL DATA WWW.NIEER.ORG/YEARBOOK
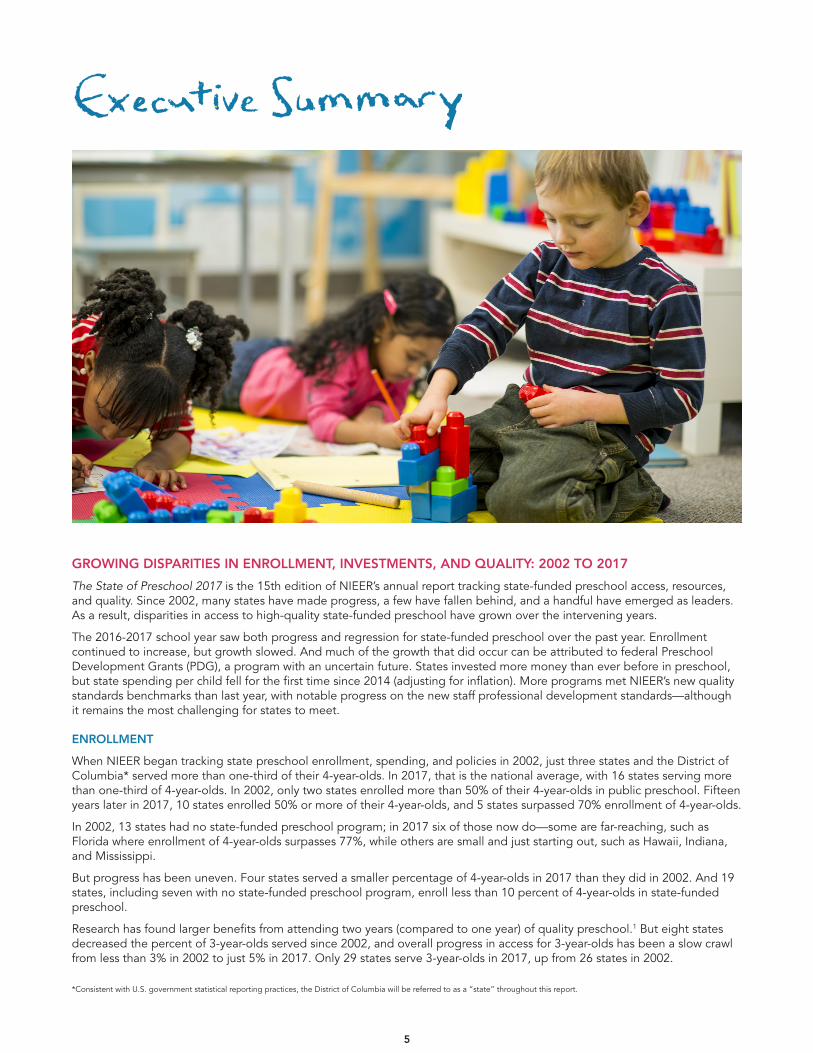
GROWING DISPARITIES IN ENROLLMENT, INVESTMENTS, AND QUALITY: 2002 TO 2017
The State of Preschool 2017 is the 15th edition of NIEER’s annual report tracking state-funded preschool access, resources, and quality. Since 2002, many states have made progress, a few have fallen behind, and a handful have emerged as leaders. As a result, disparities in access to high-quality state-funded preschool have grown over the intervening years.
The 2016-2017 school year saw both progress and regression for state-funded preschool over the past year. Enrollment continued to increase, but growth slowed. And much of the growth that did occur can be attributed to federal Preschool Development Grants (PDG), a program with an uncertain future. States invested more money than ever before in preschool, but state spending per child fell for the first time since 2014 (adjusting for inflation). More programs met NIEER’s new quality standards benchmarks than last year, with notable progress on the new staff professional development standards—although it remains the most challenging for states to meet.
ENROLLMENT
When NIEER began tracking state preschool enrollment, spending, and policies in 2002, just three states and the District of Columbia* served more than one-third of their 4-year-olds. In 2017, that is the national average, with 16 states serving more than one-third of 4-year-olds. In 2002, only two states enrolled more than 50% of their 4-year-olds in public preschool. Fifteen years later in 2017, 10 states enrolled 50% or more of their 4-year-olds, and 5 states surpassed 70% enrollment of 4-year-olds.
In 2002, 13 states had no state-funded preschool program; in 2017 six of those now do—some are far-reaching, such as Florida where enrollment of 4-year-olds surpasses 77%, while others are small and just starting out, such as Hawaii, Indiana, and Mississippi.
But progress has been uneven. Four states served a smaller percentage of 4-year-olds in 2017 than they did in 2002. And 19 states, including seven with no state-funded preschool program, enroll less than 10 percent of 4-year-olds in state-funded preschool.
Research has found larger benefits from attending two years (compared to one year) of quality preschool.1 But eight states decreased the percent of 3-year-olds served since 2002, and overall progress in access for 3-year-olds has been a slow crawl from less than 3% in 2002 to just 5% in 2017. Only 29 states serve 3-year-olds in 2017, up from 26 states in 2002.
5
*Consistent with U.S. government statistical reporting practices, the District of Columbia will be referred to as a “state” throughout this report.
RESOURCES
States did spend more on preschool in 2017 than in 2002: state spending on preschool surged from just $2.4 billion in 2002 to over $7.6 billion in 2017. Adjusting for inflation, this represents an increase of almost $4 billion, far more than doubling states’ investments. California alone increased spending by more than $1.1 billion. At the other extreme, five states decreased their spending on preschool over this time, adjusting for inflation.
Despite the overall increase in funding, data on states’ preschool investment per child paint a very different, much more negative, picture. In 2002, states spent an average of $3,458 per child, the equivalent of $5,395 in 2017 dollars. In 2017, average state preschool spending per child was $5,008, a substantial decrease in real dollars. Most states have failed to keep pace with inflation, and five states actually decreased their spending per child when considering unadjusted dollars. Spending per child is directly related to program quality, as it determines what resources are available, including the likelihood of retaining qualified teachers.
Interstate inequality in spending per child is extreme in 2017. New Jersey spends more than $12,000 per child, and seven states spend at least $7,000 per child. Local contributions raise some of these figures even higher. At the same time, seven states now spend less than $3,000 per child, and some of these require no local share. As a result, some state programs spend three or four times (or more) what others spend per child. This inequality has only gotten worse since 2002.
QUALITY
Regarding policies to support program quality, states have made progress—albeit uneven—on adopting policies that support high-quality classroom practices. In 2002, no state met all ten of NIEER’s minimum quality standards benchmarks and only three programs met nine (Arkansas, New Jersey Abbott, and North Carolina). Ten programs met fewer than half. In 2017, five programs met all ten of NIEER’s original quality standards benchmarks (Alabama, Louisiana NSECD, Mississippi, Rhode Island, and West Virginia). An additional 15 programs met nine benchmarks. Nine programs met less than half. Unfortunately, some of the programs that still meet few quality standards benchmarks are those serving large numbers of children (e.g., California TK, Florida, and Texas).
Not every state improved their policies for quality standards over the last 15 years. Four states met nine or ten benchmarks in 2002 and remained the same in 2017. Six states who met eight or fewer benchmarks in 2002 made no gains against the benchmarks by 2017. Six other programs made policy changes that led them to meet fewer benchmarks.
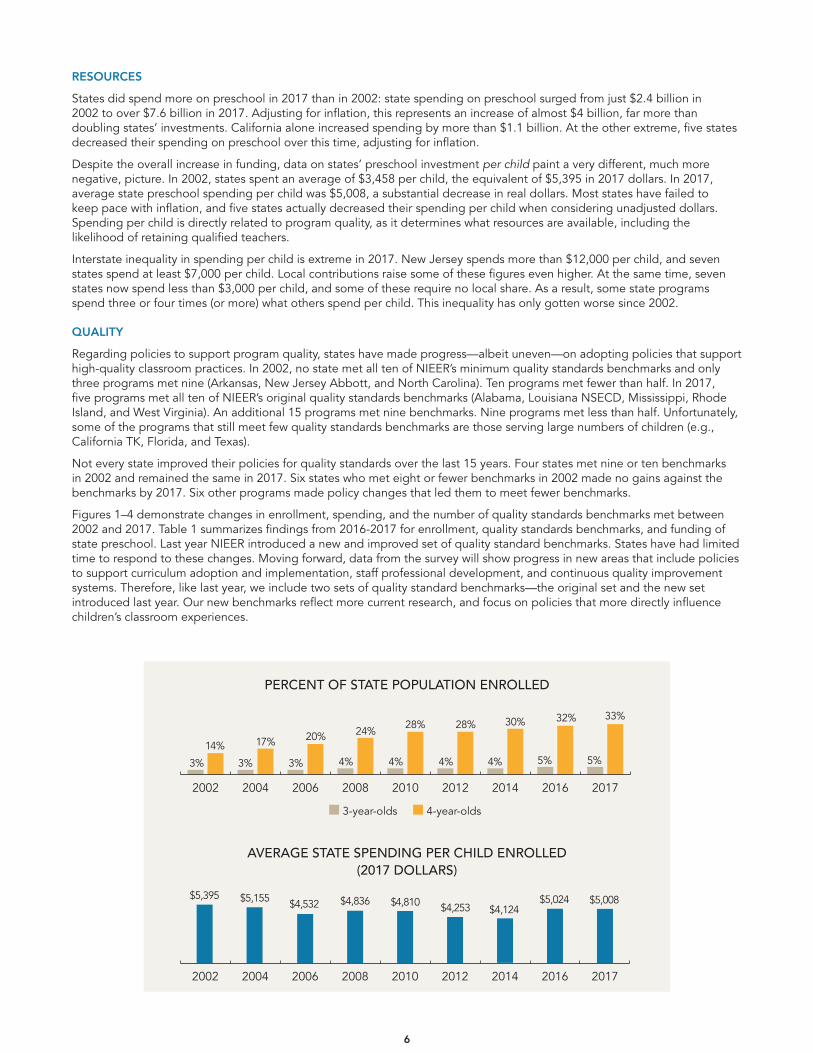
Figures 1–4 demonstrate changes in enrollment, spending, and the number of quality standards benchmarks met between 2002 and 2017. Table 1 summarizes findings from 2016-2017 for enrollment, quality standards benchmarks, and funding of state preschool. Last year NIEER introduced a new and improved set of quality standard benchmarks. States have had limited time to respond to these changes. Moving forward, data from the survey will show progress in new areas that include policies to support curriculum adoption and implementation, staff professional development, and continuous quality improvement systems. Therefore, like last year, we include two sets of quality standard benchmarks—the original set and the new set introduced last year. Our new benchmarks reflect more current research, and focus on policies that more directly influence children’s classroom experiences.
6
201720162014201220102008200620042002
201720162014201220102008200620042002
3% 3% 3% 4% 4% 4% 4% 5% 5%14% 17% 20% 24%
28% 28% 30% 32% 33%
$5,395 $5,155 $4,532 $4,836 $4,810 $4,253 $4,124$5,024 $5,008
■ 3-year-olds ■ 4-year-olds
PERCENT OF STATE POPULATION ENROLLED
AVERAGE STATE SPENDING PER CHILD ENROLLED(2017 DOLLARS)
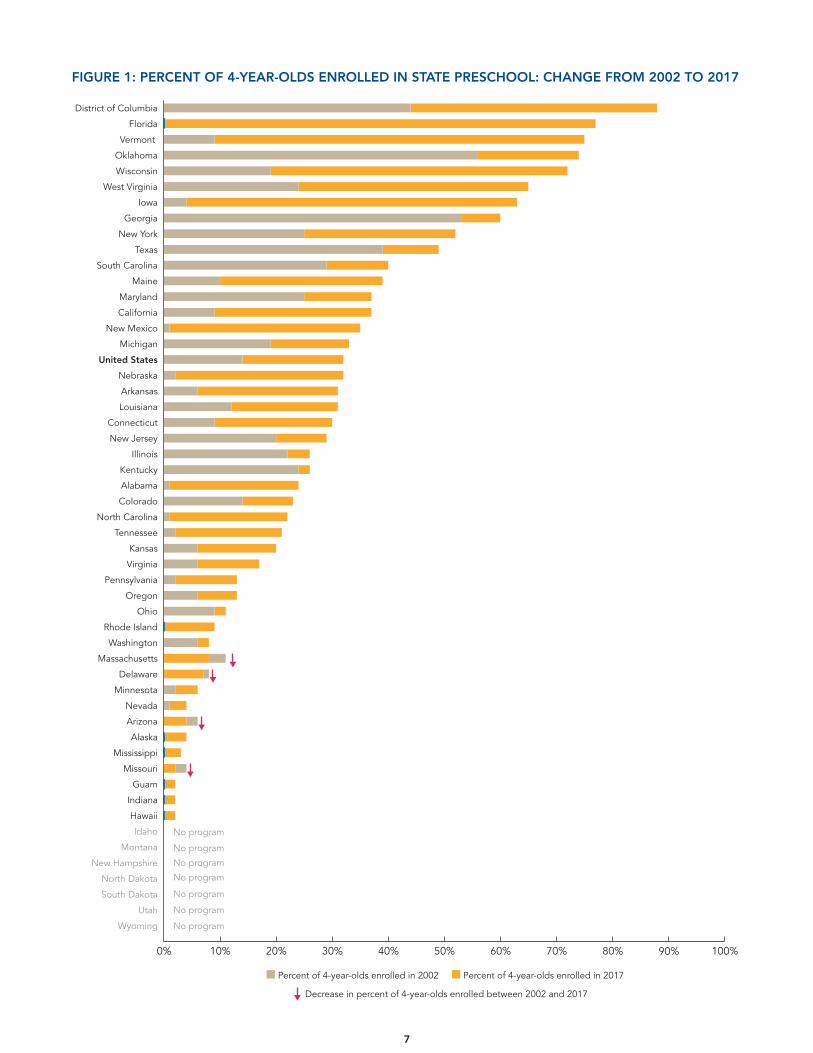
FIGURE 1: PERCENT OF 4-YEAR-OLDS ENROLLED IN STATE PRESCHOOL: CHANGE FROM 2002 TO 2017
7
Wyoming
Utah
South Dakota
North Dakota
New Hampshire
Montana
Idaho
Hawaii
Indiana
Guam
Missouri
Mississippi
Alaska
Arizona
Nevada
Minnesota
Delaware
Massachusetts
Washington
Rhode Island
Ohio
Oregon
Pennsylvania
Virginia
Kansas
Tennessee
North Carolina
Colorado
Alabama
Kentucky
Illinois
New Jersey
Connecticut
Louisiana
Arkansas
Nebraska
United States
Michigan
New Mexico
California
Maryland
Maine
South Carolina
Texas
New York
Georgia
Iowa
West Virginia
Wisconsin
Oklahoma
Vermont
Florida
District of Columbia
■ Percent of 4-year-olds enrolled in 2002 ■ Percent of 4-year-olds enrolled in 2017
Decrease in percent of 4-year-olds enrolled between 2002 and 2017
0% 60%40% 50%30%10% 20% 70% 80% 90% 100%
No program
No program
No program
No program
No program
No program
No program
3.59%
3.64%
3.81%
3.91%
3.92%
4.04%
4.09%
4.20%
4.24%
4.28%
4.29%
4.29%
4.35%
4.38%
4.44%
4.75%
4.85%
4.91%
4.93%
4.96%
4.98%
5.04%
5.15%
5.48%
5.31%
5.51%
5.51%
5.54%
5.80%
6.03%
6.10%
6.16%
6.80%
7.21%
7.27%
8.34%
8.51%
8.52%
9.09%
9.87%
10.06%
11.05%
12.77%
13.07%
4.10%
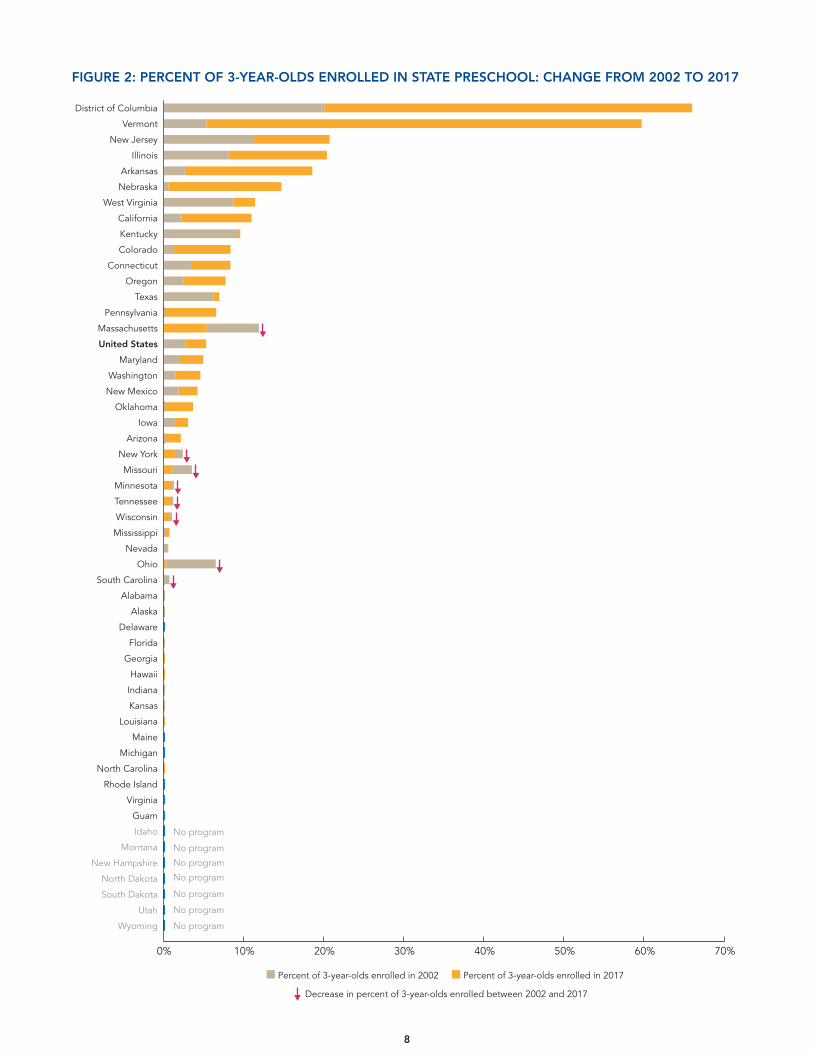
FIGURE 2: PERCENT OF 3-YEAR-OLDS ENROLLED IN STATE PRESCHOOL: CHANGE FROM 2002 TO 2017
8
Wyoming
Utah
South Dakota
North Dakota
New Hampshire
Montana
Idaho
Guam
Virginia
Rhode Island
North Carolina
Michigan
Maine
Louisiana
Kansas
Indiana
Hawaii
Georgia
Florida
Delaware
Alaska
Alabama
South Carolina
Ohio
Nevada
Mississippi
Wisconsin
Tennessee
Minnesota
Missouri
New York
Arizona
Iowa
Oklahoma
New Mexico
Washington
Maryland
United States
Massachusetts
Pennsylvania
Texas
Oregon
Connecticut
Colorado
Kentucky
California
West Virginia
Nebraska
Arkansas
Illinois
New Jersey
Vermont
District of Columbia
■ Percent of 3-year-olds enrolled in 2002 ■ Percent of 3-year-olds enrolled in 2017
Decrease in percent of 3-year-olds enrolled between 2002 and 2017
0% 50%30% 40%20%10% 60% 70%
No program
No program
No program
No program
No program
No program
No program
3.59%
3.64%
3.81%
3.91%
3.92%
4.04%
4.09%
4.20%
4.24%
4.28%
4.29%
4.29%
4.35%
4.38%
4.44%
4.75%
4.85%
4.91%
4.93%
4.96%
4.98%
5.04%
5.15%
5.48%
5.31%
5.51%
5.51%
5.54%
5.80%
6.03%
6.10%
6.16%
6.80%
7.21%
7.27%
8.34%
8.51%
8.52%
9.09%
9.87%
10.06%
11.05%
12.77%
13.07%
4.10%
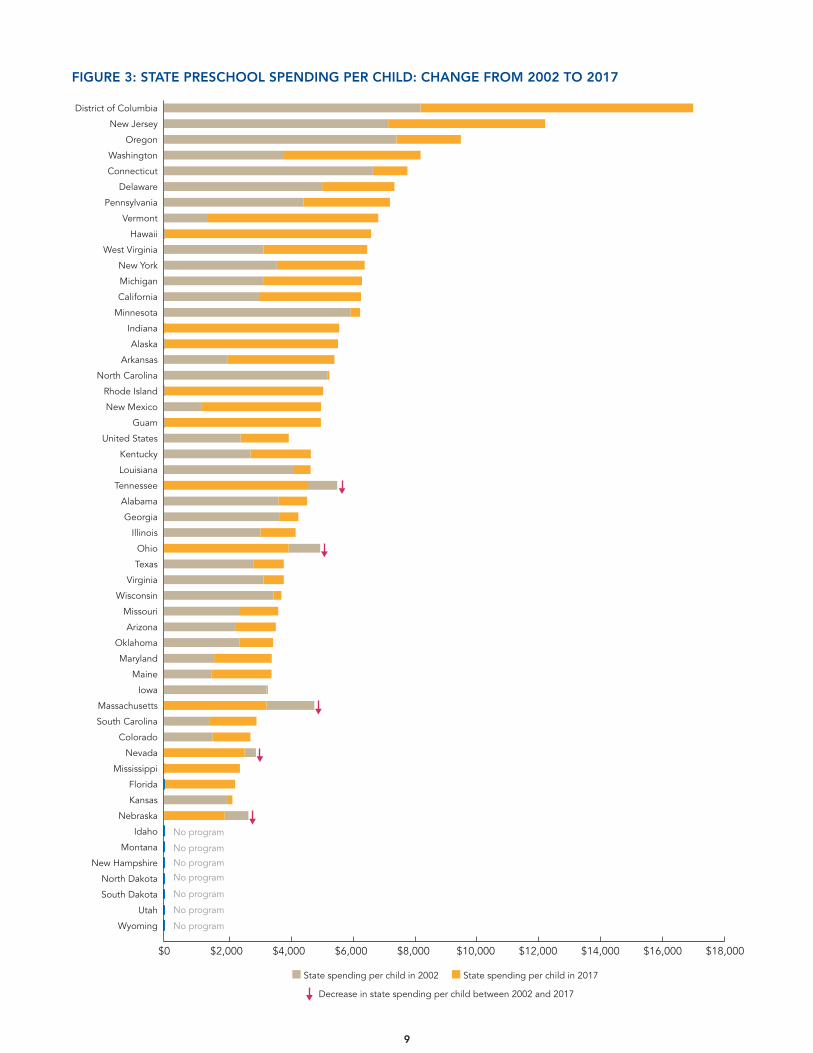
FIGURE 3: STATE PRESCHOOL SPENDING PER CHILD: CHANGE FROM 2002 TO 2017
9
Wyoming
Utah
South Dakota
North Dakota
New Hampshire
Montana
Idaho
Nebraska
Kansas
Florida
Mississippi
Nevada
Colorado
South Carolina
Massachusetts
Iowa
Maine
Maryland
Oklahoma
Arizona
Missouri
Wisconsin
Virginia
Texas
Ohio
Illinois
Georgia
Alabama
Tennessee
Louisiana
Kentucky
United States
Guam
New Mexico
Rhode Island
North Carolina
Arkansas
Alaska
Indiana
Minnesota
California
Michigan
New York
West Virginia
Hawaii
Vermont
Pennsylvania
Delaware
Connecticut
Washington
Oregon
New Jersey
District of Columbia
■ State spending per child in 2002 ■ State spending per child in 2017
Decrease in state spending per child between 2002 and 2017
$0 $14,000$10,000 $12,000$8,000$2,000 $4,000 $6,000 $16,000 $18,000
No program
No program
No program
No program
No program
No program
No program
3.59%
3.64%
3.81%
3.91%
3.92%
4.04%
4.09%
4.20%
4.24%
4.28%
4.29%
4.29%
4.35%
4.38%
4.44%
4.75%
4.85%
4.91%
4.93%
4.96%
4.98%
5.04%
5.15%
5.48%
5.31%
5.51%
5.51%
5.54%
5.80%
6.03%
6.10%
6.16%
6.80%
7.21%
7.27%
8.34%
8.51%
8.52%
9.09%
9.87%
10.06%
11.05%
12.77%
13.07%
4.10%
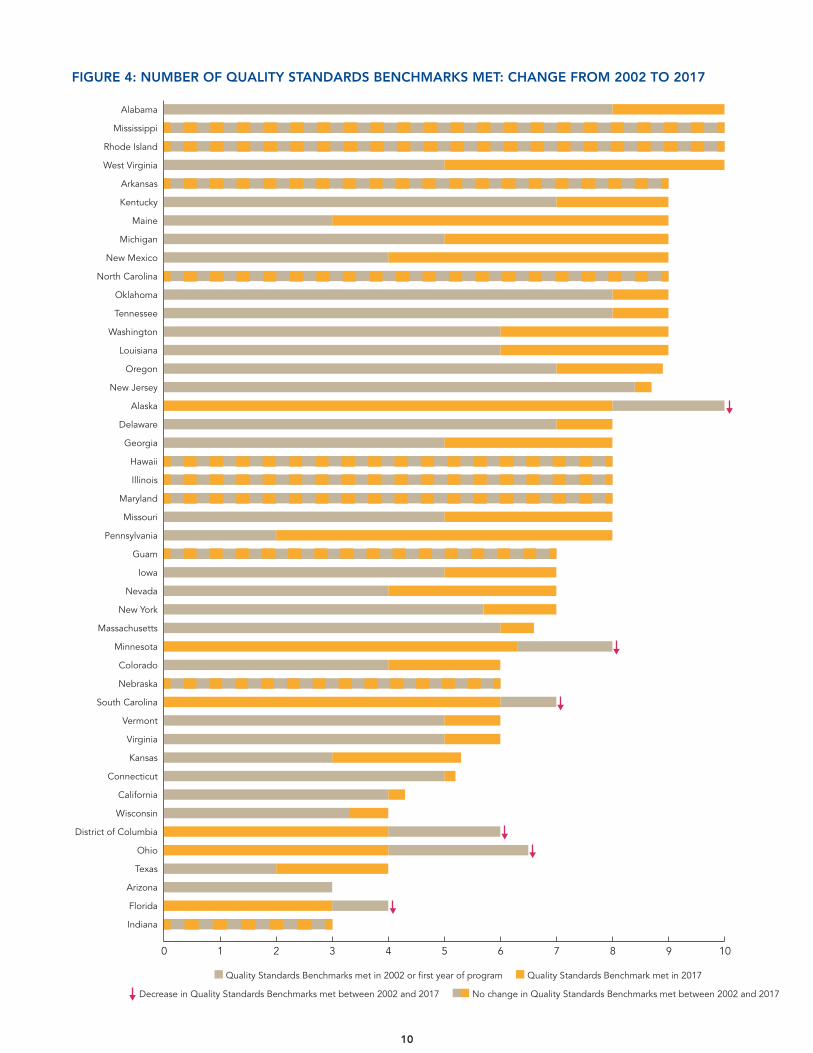
FIGURE 4: NUMBER OF QUALITY STANDARDS BENCHMARKS MET: CHANGE FROM 2002 TO 2017
10
Indiana
Florida
Arizona
Texas
Ohio
District of Columbia
Wisconsin
California
Connecticut
Kansas
Virginia
Vermont
South Carolina
Nebraska
Colorado
Minnesota
Massachusetts
New York
Nevada
Iowa
Guam
Pennsylvania
Missouri
Maryland
Illinois
Hawaii
Georgia
Delaware
Alaska
New Jersey
Oregon
Louisiana
Washington
Tennessee
Oklahoma
North Carolina
New Mexico
Michigan
Maine
Kentucky
Arkansas
West Virginia
Rhode Island
Mississippi
Alabama
■ Quality Standards Benchmarks met in 2002 or first year of program ■ Quality Standards Benchmark met in 2017
Decrease in Quality Standards Benchmarks met between 2002 and 2017 ■■ No change in Quality Standards Benchmarks met between 2002 and 2017
0 64 531 2 7 8 9 10
3.59%
3.64%
3.81%
3.91%
3.92%
4.04%
4.09%
4.20%
4.24%
4.28%
4.29%
4.29%
4.35%
4.38%
4.44%
4.75%
4.85%
4.91%
4.93%
4.96%
4.98%
5.04%
5.15%
5.48%
5.31%
5.51%
5.51%
5.54%
5.80%
6.03%
6.10%
6.16%
6.80%
7.21%
7.27%
8.34%
8.51%
8.52%
9.09%
9.87%
10.06%
11.05%
12.77%
13.07%
4.10%
WHAT’S NEW?
Resources
• Total state funding for preschool programs exceeded $7.6 billion, an inflation-adjusted two percent increase of almost $155 million across the 43 states and D.C.* that offered preschool during the 2016-2017 school year. This increase in state funding for preschool is less than one-third the size of the prior year’s increase.
• State preschool funding per child was $5,008 in 2016-2017. Although there was a small increase ($33) in nominal spending per child, spending per child decreased by $16 after adjusting for inflation.
• Seven states reported an increase in total state preschool spending (inflation-adjusted) of more than $10 million. Eighteen states increased spending per child.
• Eighteen states received competitive federal Preschool Development Grants (PDG) that provided more than $230 million in 2016-2017. Approximately $91 million of the federal PDG supported increased enrollment or quality enhancement in state preschool, while the remaining funds supported children in preschool programs outside state-funded preschool.
Enrollment
• State-funded preschool enrollment topped 1.5 million children, including more than 1.3 million 4-year-olds—nearly one-third of all 4-year-olds in the country. Enrollment of 3-year-olds surpassed 5 percent, just under 210,000 children.
• Nearly 31,000 of these 4-year-old children were enrolled in state-funded preschool and supported either entirely or partially by federal PDG, an increase of almost 12,000 children from last year.
• Enrollment in state-funded preschool nationwide increased by only 26,603 four-year-olds and 14,258 three-year-olds from 2015-2016. Approximately one-third of the increase in 4-year-olds enrolled can be attributed to additional seats funded by federal PDG. Eleven states reduced enrollment of 3- and 4-year-olds.
• Ten states served nearly 50% or more of 4-year-olds in their states. Five states served more than 70%. Only D.C. and Vermont served more than 50% of 3-year-olds.
• Across all public programs—preschool general and special education enrollment plus federal and state-funded Head Start—nearly 44% of 4-year-olds and 16% of 3-year-olds were served. Since NIEER began tracking enrollment in 2002, enrollment of 4-year-olds across these programs has increased by 13 percentage points, and enrollment of 3-year-olds has increased by only 2 percentage points.
11
* Consistent with U.S. government statistical reporting practices, the District of Columbia will be referred to as a “state” throughout this report. Hence, there is a total of 44 states providing state-funded preschool.
Quality
• For the second year, NIEER assessed state preschool policies using an updated set of minimum quality standards benchmarks focusing on process quality and reflecting recent research on effective early childhood education.
• We made one change this year to the Continuous Quality Improvement System (CQIS) benchmark to better capture using data for systematic improvement at the state and local levels. As a result, 34 programs were found to meet the CQIS quality standard benchmark, compared to 22 last year.
• Three states (Alabama, Michigan, and Rhode Island) met all 10 of NIEER’s new benchmarks for minimum state preschool quality standards. These three programs have led on quality standards while also expanding enrollment.
• As a result of policy changes, four additional programs met the new Professional Development quality standards benchmark this year (Georgia, Michigan, Minnesota Head Start, and Oregon Head Start). New Jersey’s three programs no longer meet this benchmark.
• Ten programs met fewer than half of the new quality standards benchmarks, including states with the largest numbers of children in poverty.
Important Developments
• Minnesota and Oregon each began a second state-funded preschool program in 2016-2017 in addition to existing state programs supplementing federal Head Start.
• Minnesota’s Voluntary Pre-Kindergarten served 3,106 four-year-olds (4.5% of Minnesota’s 4-year-old population) in 2016-2017 and met six quality standards benchmarks.
• Oregon’s Preschool Promise funded slots for 1,300 children in 2016-2017. The program met six quality standards benchmarks during its first year of operation.
• For the second time, NIEER included a supplemental survey about preschool policies to support Dual Language Learners (DLLs). Responses showed little progress since 2015 and the lack of state support for preschool DLLs continues to be a serious concern.
• Only 26 state-funded preschool programs (including Guam) can report the home languages of children enrolled, but this list includes Texas and one program in California, two states with large DLL populations.
• Thirty-five programs reported having some state policies to regulate services for preschool DLLs. However, only six programs require lead teachers to have qualifications or training related to educating preschool DLLs, and no programs have similar requirements for assistant teachers.
• Eighteen states received federal PDG funding to support enrollment of low-income 4-year-olds in high-quality preschool. More than $230 million was used to support about 48,600 four-year-olds and to raise quality. About 40% of that funding was used to support more than 30,000 four-year-olds enrolled in state-funded preschool programs. PDG contributed to the progress in enrollment of 4-year-olds this year.
12
13
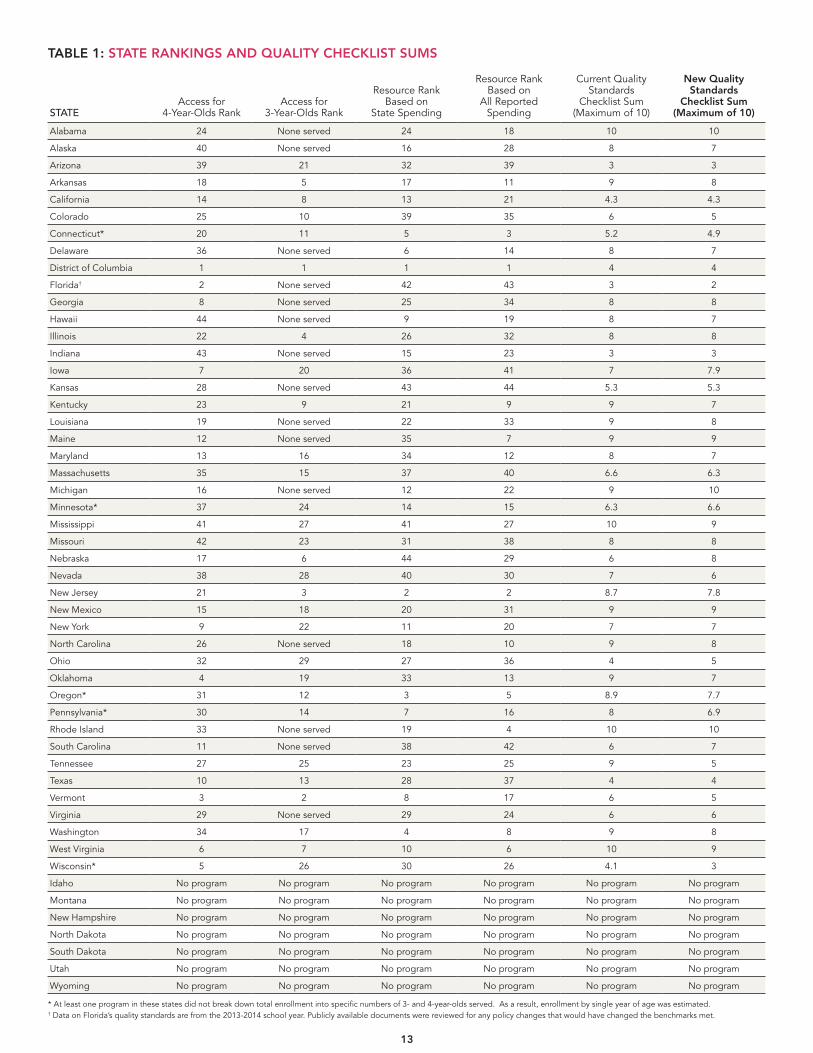
TABLE 1: STATE RANKINGS AND QUALITY CHECKLIST SUMS
STATEAccess for
4-Year-Olds RankAccess for
3-Year-Olds Rank
Resource Rank Based on
State Spending
Resource Rank Based on
All Reported Spending
Current Quality Standards
Checklist Sum (Maximum of 10)
New Quality Standards
Checklist Sum (Maximum of 10)
Alabama 24 None served 24 18 10 10
Alaska 40 None served 16 28 8 7
Arizona 39 21 32 39 3 3
Arkansas 18 5 17 11 9 8
California 14 8 13 21 4.3 4.3
Colorado 25 10 39 35 6 5
Connecticut* 20 11 5 3 5.2 4.9
Delaware 36 None served 6 14 8 7
District of Columbia 1 1 1 1 4 4
Florida† 2 None served 42 43 3 2
Georgia 8 None served 25 34 8 8
Hawaii 44 None served 9 19 8 7
Illinois 22 4 26 32 8 8
Indiana 43 None served 15 23 3 3
Iowa 7 20 36 41 7 7.9
Kansas 28 None served 43 44 5.3 5.3
Kentucky 23 9 21 9 9 7
Louisiana 19 None served 22 33 9 8
Maine 12 None served 35 7 9 9
Maryland 13 16 34 12 8 7
Massachusetts 35 15 37 40 6.6 6.3
Michigan 16 None served 12 22 9 10
Minnesota* 37 24 14 15 6.3 6.6
Mississippi 41 27 41 27 10 9
Missouri 42 23 31 38 8 8
Nebraska 17 6 44 29 6 8
Nevada 38 28 40 30 7 6
New Jersey 21 3 2 2 8.7 7.8
New Mexico 15 18 20 31 9 9
New York 9 22 11 20 7 7
North Carolina 26 None served 18 10 9 8
Ohio 32 29 27 36 4 5
Oklahoma 4 19 33 13 9 7
Oregon* 31 12 3 5 8.9 7.7
Pennsylvania* 30 14 7 16 8 6.9
Rhode Island 33 None served 19 4 10 10
South Carolina 11 None served 38 42 6 7
Tennessee 27 25 23 25 9 5
Texas 10 13 28 37 4 4
Vermont 3 2 8 17 6 5
Virginia 29 None served 29 24 6 6
Washington 34 17 4 8 9 8
West Virginia 6 7 10 6 10 9
Wisconsin* 5 26 30 26 4.1 3
Idaho No program No program No program No program No program No program
Montana No program No program No program No program No program No program
New Hampshire No program No program No program No program No program No program
North Dakota No program No program No program No program No program No program
South Dakota No program No program No program No program No program No program
Utah No program No program No program No program No program No program
Wyoming No program No program No program No program No program No program
* At least one program in these states did not break down total enrollment into specific numbers of 3- and 4-year-olds served. As a result, enrollment by single year of age was estimated. † Data on Florida’s quality standards are from the 2013-2014 school year. Publicly available documents were reviewed for any policy changes that would have changed the benchmarks met.
14
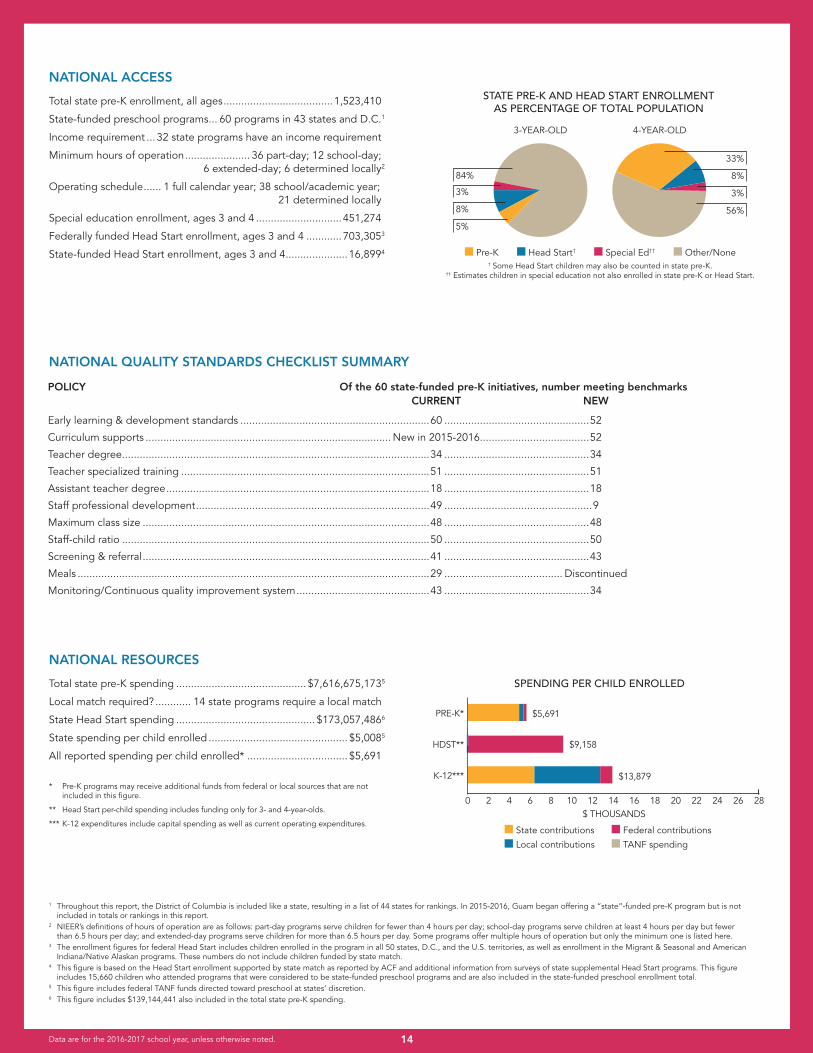
NATIONAL ACCESS
Total state pre-K enrollment, all ages .....................................1,523,410
State-funded preschool programs ... 60 programs in 43 states and D.C. 1
Income requirement ... 32 state programs have an income requirement
Minimum hours of operation ...................... 36 part-day; 12 school-day; 6 extended-day; 6 determined locally 2
Operating schedule ...... 1 full calendar year; 38 school/academic year; 21 determined locally
Special education enrollment, ages 3 and 4 .............................451,274
Federally funded Head Start enrollment, ages 3 and 4 ............703,305 3
State-funded Head Start enrollment, ages 3 and 4 .....................16,899 4
NATIONAL QUALITY STANDARDS CHECKLIST SUMMARY
National
3-YEAR-OLD 4-YEAR-OLD
3%
84%
8%
5%
3%
56%
8%
33%
■ Pre-K ■ Head Start† ■ Special Ed†† ■ Other/None† Some Head Start children may also be counted in state pre-K.
†† Estimates children in special education not also enrolled in state pre-K or Head Start.
NATIONAL RESOURCES
Total state pre-K spending ............................................ $7,616,675,173 5
Local match required? ............ 14 state programs require a local match
State Head Start spending ............................................... $173,057,486 6
State spending per child enrolled ............................................... $5,008 5
All reported spending per child enrolled* .................................. $5,691
* Pre-K programs may receive additional funds from federal or local sources that are not included in this figure.
** Head Start per-child spending includes funding only for 3- and 4-year-olds.
*** K-12 expenditures include capital spending as well as current operating expenditures.
SPENDING PER CHILD ENROLLED
$5,691
$9,158
$13,879
0 42 6 8 10 12 14 16 18 20 22 24 2826
K-12***
HDST**
PRE-K*
$ THOUSANDS
■ State contributions
■ Local contributions
■ Federal contributions
■ TANF spending
Data are for the 2016-2017 school year, unless otherwise noted.
POLICY Of the 60 state-funded pre-K initiatives, number meeting benchmarks CURRENT NEW
Early learning & development standards ................................................................60 .................................................52
Curriculum supports ................................................................................... New in 2015-2016.....................................52
Teacher degree ........................................................................................................34 .................................................34
Teacher specialized training ....................................................................................51 .................................................51
Assistant teacher degree .........................................................................................18 .................................................18
Staff professional development ...............................................................................49 ..................................................9
Maximum class size .................................................................................................48 .................................................48
Staff-child ratio ........................................................................................................50 .................................................50
Screening & referral .................................................................................................41 .................................................43
Meals .......................................................................................................................29 ........................................ Discontinued
Monitoring/Continuous quality improvement system .............................................43 .................................................34
1 Throughout this report, the District of Columbia is included like a state, resulting in a list of 44 states for rankings. In 2015-2016, Guam began offering a “state”-funded pre-K program but is not included in totals or rankings in this report.
2 NIEER’s definitions of hours of operation are as follows: part-day programs serve children for fewer than 4 hours per day; school-day programs serve children at least 4 hours per day but fewer than 6.5 hours per day; and extended-day programs serve children for more than 6.5 hours per day. Some programs offer multiple hours of operation but only the minimum one is listed here.
3 The enrollment figures for federal Head Start includes children enrolled in the program in all 50 states, D.C., and the U.S. territories, as well as enrollment in the Migrant & Seasonal and American Indiana/Native Alaskan programs. These numbers do not include children funded by state match.
4 This figure is based on the Head Start enrollment supported by state match as reported by ACF and additional information from surveys of state supplemental Head Start programs. This figure includes 15,660 children who attended programs that were considered to be state-funded preschool programs and are also included in the state-funded preschool enrollment total.
5 This figure includes federal TANF funds directed toward preschool at states’ discretion.6 This figure includes $139,144,441 also included in the total state pre-K spending.
STATE PRE-K AND HEAD START ENROLLMENTAS PERCENTAGE OF TOTAL POPULATION
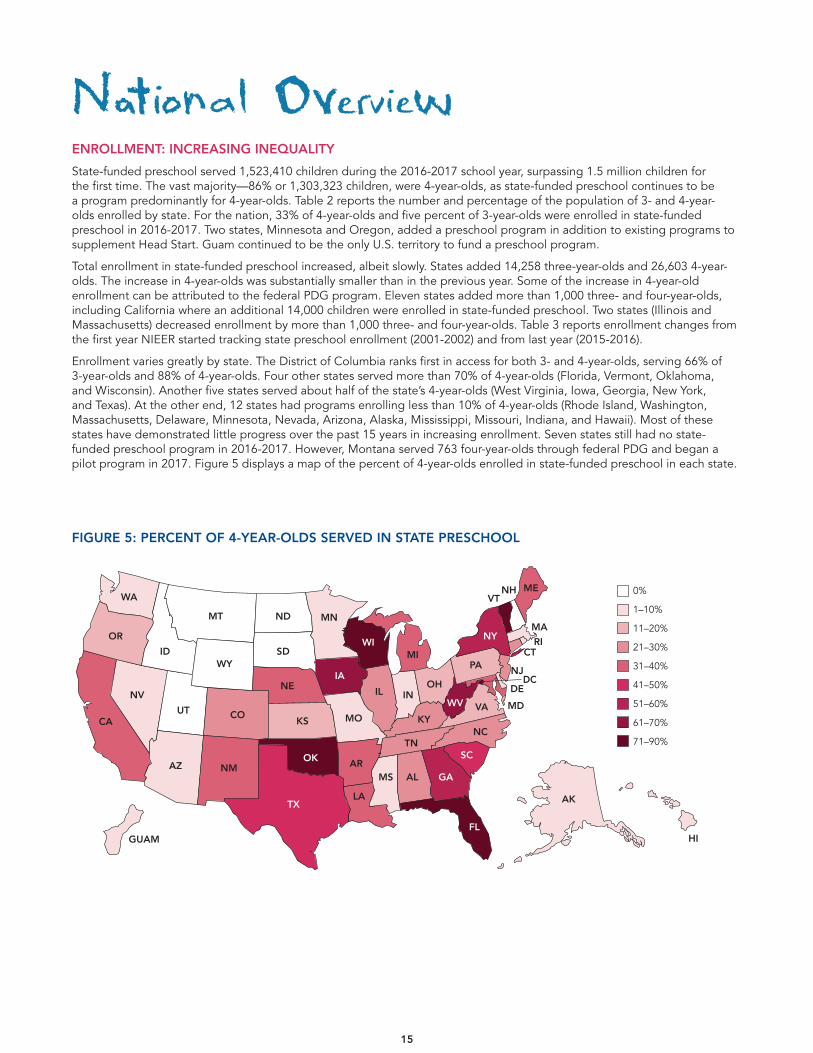
ENROLLMENT: INCREASING INEQUALITY
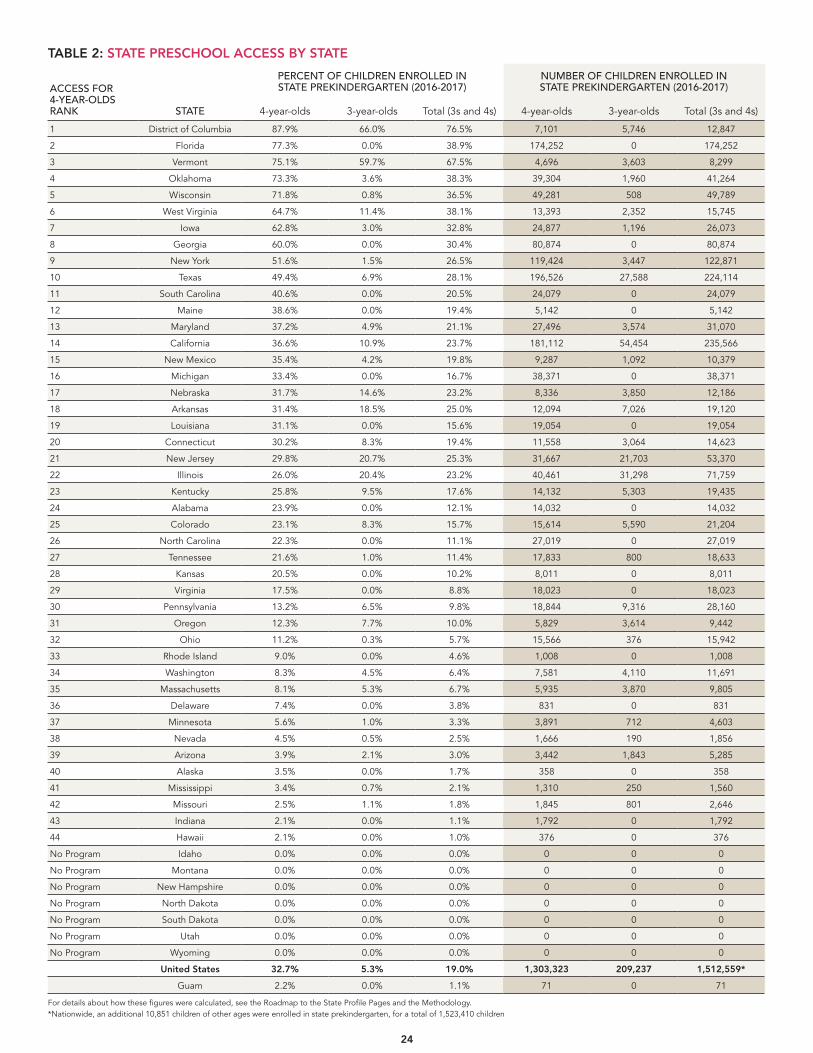
State-funded preschool served 1,523,410 children during the 2016-2017 school year, surpassing 1.5 million children for the first time. The vast majority—86% or 1,303,323 children, were 4-year-olds, as state-funded preschool continues to be a program predominantly for 4-year-olds. Table 2 reports the number and percentage of the population of 3- and 4-year-olds enrolled by state. For the nation, 33% of 4-year-olds and five percent of 3-year-olds were enrolled in state-funded preschool in 2016-2017. Two states, Minnesota and Oregon, added a preschool program in addition to existing programs to supplement Head Start. Guam continued to be the only U.S. territory to fund a preschool program.
Total enrollment in state-funded preschool increased, albeit slowly. States added 14,258 three-year-olds and 26,603 4-year-olds. The increase in 4-year-olds was substantially smaller than in the previous year. Some of the increase in 4-year-old enrollment can be attributed to the federal PDG program. Eleven states added more than 1,000 three- and four-year-olds, including California where an additional 14,000 children were enrolled in state-funded preschool. Two states (Illinois and Massachusetts) decreased enrollment by more than 1,000 three- and four-year-olds. Table 3 reports enrollment changes from the first year NIEER started tracking state preschool enrollment (2001-2002) and from last year (2015-2016).
Enrollment varies greatly by state. The District of Columbia ranks first in access for both 3- and 4-year-olds, serving 66% of 3-year-olds and 88% of 4-year-olds. Four other states served more than 70% of 4-year-olds (Florida, Vermont, Oklahoma, and Wisconsin). Another five states served about half of the state’s 4-year-olds (West Virginia, Iowa, Georgia, New York, and Texas). At the other end, 12 states had programs enrolling less than 10% of 4-year-olds (Rhode Island, Washington, Massachusetts, Delaware, Minnesota, Nevada, Arizona, Alaska, Mississippi, Missouri, Indiana, and Hawaii). Most of these states have demonstrated little progress over the past 15 years in increasing enrollment. Seven states still had no state-funded preschool program in 2016-2017. However, Montana served 763 four-year-olds through federal PDG and began a pilot program in 2017. Figure 5 displays a map of the percent of 4-year-olds enrolled in state-funded preschool in each state.
15
FIGURE 5: PERCENT OF 4-YEAR-OLDS SERVED IN STATE PRESCHOOL
DC
MT
WA
OR
CA
AK
GUAM
NV
IDWY
CO
NM
TX
OK
KS
NE
SD
ND MN
WI
IL
MI
OH
KY
TN
MS AL GA
SC
NC
VA
NJ
VTNH
MA
CT
DE
RI
MDWV
FL
PA
NY
ME
IN
IA
MO
AR
LA
UT
AZ
HI
0%
1–10%
11–20%
21–30%
31–40%
41–50%
51–60%
61–70%
71–90%
16
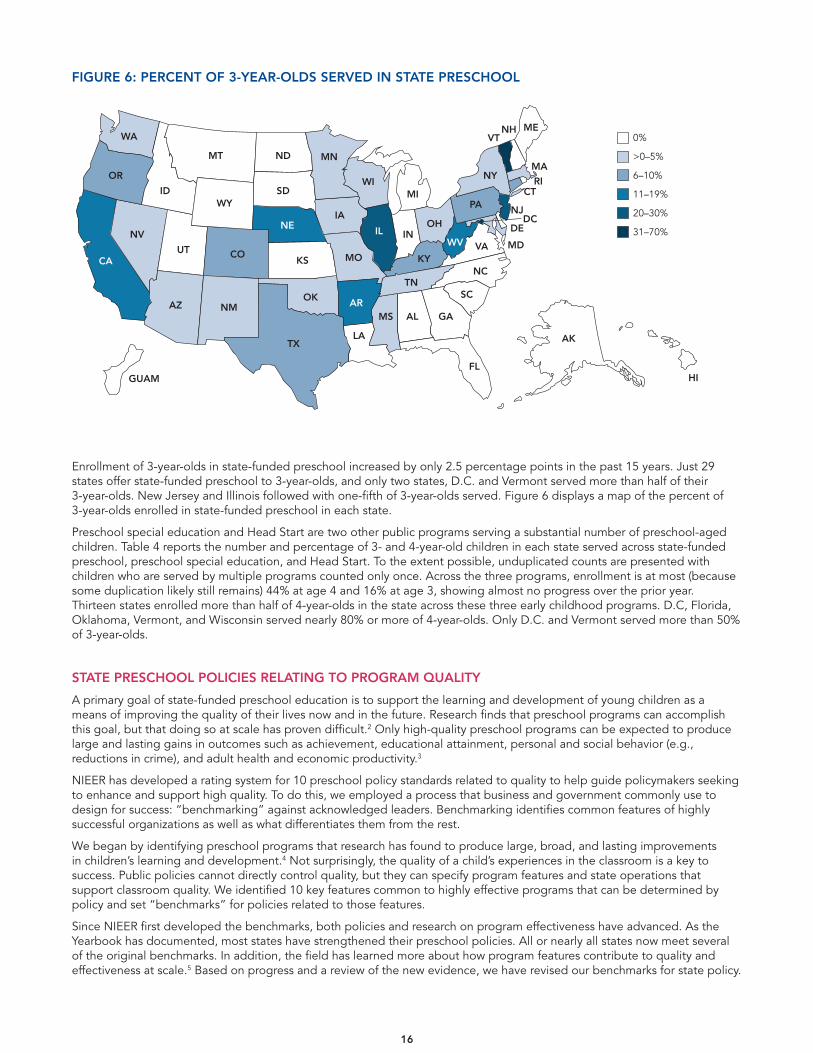
FIGURE 6: PERCENT OF 3-YEAR-OLDS SERVED IN STATE PRESCHOOL
DC
MT
WA
OR
CA
AK
GUAM
NV
IDWY
CO
NM
TX
OK
KS
NE
SD
ND MN
WI
IL
MI
OH
KY
TN
MS AL GA
SC
NC
VA
NJ
VTNH
MA
CT
DE
RI
MDWV
FL
PA
NY
ME
IN
IA
MO
AR
LA
UT
AZ
HI
0%
>0–5%
6–10%
11–19%
20–30%
31–70%
Enrollment of 3-year-olds in state-funded preschool increased by only 2.5 percentage points in the past 15 years. Just 29 states offer state-funded preschool to 3-year-olds, and only two states, D.C. and Vermont served more than half of their 3-year-olds. New Jersey and Illinois followed with one-fifth of 3-year-olds served. Figure 6 displays a map of the percent of 3-year-olds enrolled in state-funded preschool in each state.
Preschool special education and Head Start are two other public programs serving a substantial number of preschool-aged children. Table 4 reports the number and percentage of 3- and 4-year-old children in each state served across state-funded preschool, preschool special education, and Head Start. To the extent possible, unduplicated counts are presented with children who are served by multiple programs counted only once. Across the three programs, enrollment is at most (because some duplication likely still remains) 44% at age 4 and 16% at age 3, showing almost no progress over the prior year. Thirteen states enrolled more than half of 4-year-olds in the state across these three early childhood programs. D.C, Florida, Oklahoma, Vermont, and Wisconsin served nearly 80% or more of 4-year-olds. Only D.C. and Vermont served more than 50% of 3-year-olds.
STATE PRESCHOOL POLICIES RELATING TO PROGRAM QUALITY
A primary goal of state-funded preschool education is to support the learning and development of young children as a means of improving the quality of their lives now and in the future. Research finds that preschool programs can accomplish this goal, but that doing so at scale has proven difficult.2 Only high-quality preschool programs can be expected to produce large and lasting gains in outcomes such as achievement, educational attainment, personal and social behavior (e.g., reductions in crime), and adult health and economic productivity.3
NIEER has developed a rating system for 10 preschool policy standards related to quality to help guide policymakers seeking to enhance and support high quality. To do this, we employed a process that business and government commonly use to design for success: “benchmarking” against acknowledged leaders. Benchmarking identifies common features of highly successful organizations as well as what differentiates them from the rest.
We began by identifying preschool programs that research has found to produce large, broad, and lasting improvements in children’s learning and development.4 Not surprisingly, the quality of a child’s experiences in the classroom is a key to success. Public policies cannot directly control quality, but they can specify program features and state operations that support classroom quality. We identified 10 key features common to highly effective programs that can be determined by policy and set “benchmarks” for policies related to those features.
Since NIEER first developed the benchmarks, both policies and research on program effectiveness have advanced. As the Yearbook has documented, most states have strengthened their preschool policies. All or nearly all states now meet several of the original benchmarks. In addition, the field has learned more about how program features contribute to quality and effectiveness at scale.5 Based on progress and a review of the new evidence, we have revised our benchmarks for state policy.
The revised benchmarks place less emphasis on structural quality and monitoring, and more emphasis on a coherent system of continuous improvement for process quality. We believe these revisions are a shift in favor of policies better able to shape classroom experiences in ways that can strongly enhance learning and development.
The benchmarks provide a coherent set of minimum policies to support meaningful, persistent gains in learning and development that can enhance later educational and adult life achievement. Programs supported by these policies will be more likely to achieve their goals. However, the benchmarks cannot guarantee success, which depends on other factors including adequate funding and strong implementation of both policy and practice. Even the best policies can be undermined by lack of funding or inattention to full implementation.
Below, we explain each benchmark, along with the evidence and reasoning behind it. We hope this will increase understanding of the benchmarks and why they matter.
Benchmark 1. Early Learning and Development Standards (ELDS). A state’s ELDS specify a program’s goals. Clear and appropriate expectations for learning and development across multiple domains are an essential starting place for quality.6 States should have comprehensive ELDS covering all areas identified as fundamental by the National Education Goals Panel7—children’s physical well-being and motor development, social/emotional development, approaches toward learning, language development, and cognition and general knowledge. Neglecting any of these development domains could weaken both short- and long-term effectiveness.8
To meet the benchmark, ELDS should be specific to preschool-aged children and vertically aligned with state standards for younger and older children so that children’s experiences at each stage build on what has gone before.9 ELDS also should be aligned with any required child assessments, and sensitive to children’s diverse cultural and language backgrounds.10 Finally, the state must provide some support for those charged with implementing the ELDS so they understand them, such as professional development and additional resources.
Benchmark 2. Curriculum supports. A strong curriculum that is well-implemented increases support for learning and development broadly, and includes specificity regarding key domains of language, literacy, mathematics, and social-emotional development.11 To meet the benchmark for curriculum support, states must provide (a) guidance or an approval process for selecting curricula, and (b) training or ongoing technical assistance to facilitate adequate implementation of the curriculum.
17
Benchmark 3. Teacher degree. To meet the benchmark, state policy must require lead teachers in every classroom to have at least a bachelor’s degree. This follows recommendations from multiple studies by the Institute of Medicine (IOM) and National Research Council (NRC) of the National Academy of Science recommending that preschool teachers have a BA with specialized knowledge and training in early childhood education.12 Their conclusions are supported by an analysis of what teachers are expected to know and do in order to be highly effective. Also, a comprehensive review finds that teachers with higher educational levels generally provide higher quality educational environments for young children.13
Much of the research has approached the question of teacher degree requirements incorrectly by assuming that teacher qualifications and other program features act independently, are unconstrained by regulation, and are independent of unmeasured contexts that affect outcomes.14 When multiple program features are interdependent, benchmarking is a more appropriate approach for identifying the features associated with success.15 We found no examples of programs that have produced large persistent gains in achievement without well-qualified teachers.
It also follows that teacher qualifications should not be expected to have an effect in isolation. Compensation must be adequate to attract and retain strong teachers, regardless of qualifications requirements.16 We have not made this part of the benchmark due to the difficulty of ascertaining exactly what “adequate compensation” is for each state—but that does not lessen its importance.
Benchmark 4. Teacher specialized training. IOM/NRC reports also have emphasized that preschool lead teachers should have specialized preparation that includes knowledge of learning, development, and pedagogy specific to preschool-age children.17 To meet the benchmark, policy must require specialized training in early childhood education and/or child development. We recognize that early childhood teacher preparation programs are variable. States may wish to consider supports to improve programs offered by their state institutions of higher education and alignment with the state ELDS.18
Benchmark 5. Assistant teacher degree. All members of a teaching team benefit from preservice preparation. The Child Development Associate (CDA) was developed as the entry-level qualification for the field.19 Other certifications or coursework can provide similar preparation. There has been limited research specific to the qualifications of assistant teachers, but evidence indicates that assistant teacher qualifications are associated with teaching quality. To meet the benchmark, policy must require that assistant teachers hold a CDA or have equivalent preparation.
Benchmark 6. Staff professional development. To meet this benchmark both teachers and assistant teachers must be required to have at least 15 hours of annual in-service training. In addition, some professional development must be provided through coaching or similar ongoing classroom-embedded support. Lead and assistant teachers are also required to have annual written individualized professional development plans. Research indicates regular professional learning, including coaching, supports teaching practices related to high-quality experiences for children.20 Individualized professional development focused on helping teachers improve in their own classrooms has been found more effective than traditional workshops and general professional development.21 Good teachers actively engage in learning and regular professional development, and there is some evidence for a 15-hour threshold.22
Benchmarks 7 and 8. Maximum class size (20) and staff-child ratio (1:10). We address these two benchmarks together as they are highly linked in policy and practice. To meet benchmark 7, class size should be limited to at most 20 children. To meet benchmark 8, classes should be permitted to have no more than 10 children per classroom teaching staff member. Small class size and corresponding teacher-child ratios characterize the most effective programs, even though many studies find weak or no association between these features and effectiveness.23 Yet, it seems clear that smaller classes and fewer children per teacher enable teachers to interact with each child more frequently, to work with smaller groups, and offer each child more individualized attention, which results in better outcomes. The smaller the class, the easier it is for a teacher to develop a good understanding of each child’s interests, needs, and capabilities.
What may be the best designed large-scale randomized trial of class size for young children to date found substantive and lasting impacts on achievement and educational success for smaller class sizes in kindergarten.24 Subsequent efforts to reproduce these results through policy changes elsewhere have been far less successful. Again, we note that key policies regarding program features are not independent of other policies, context, and implementation.
A staff-child ratio of 1:10 is lower than in programs found to have the largest persistent effects, but it is generally accepted by professional opinion. A recent meta-analysis suggests an even lower threshold, below 1 to 7.5 (class size of 15), would be better, and that finding is consistent with experimental evidence for kindergarten.25 On the other hand, at least one program has produced large short-term gains with a maximum class size of 22 and 1:11 staff to child ratio, just outside the benchmarks.26
Benchmark 9. Screenings and referrals. To meet the benchmark, policies should require that preschool programs ensure children receive vision, hearing, and other health screenings and referrals.27 This benchmark recognizes that children’s overall well-being and educational success involve not only cognitive development but also physical and mental health.28
Benchmark 10. Continuous Quality Improvement System (CQIS). An effective CQIS operates at local and state levels to ensure that information is gathered regularly on processes and outcomes, and that this information is used to guide program improvement. To meet this benchmark, policy must at a minimum require that (1) data on classroom quality is systematically collected at least annually, and (2) local programs and the state both use information from the CQIS to help improve policy or practice. The use of a cycle of planning, observation, and feedback has characterized highly effective programs.29
18
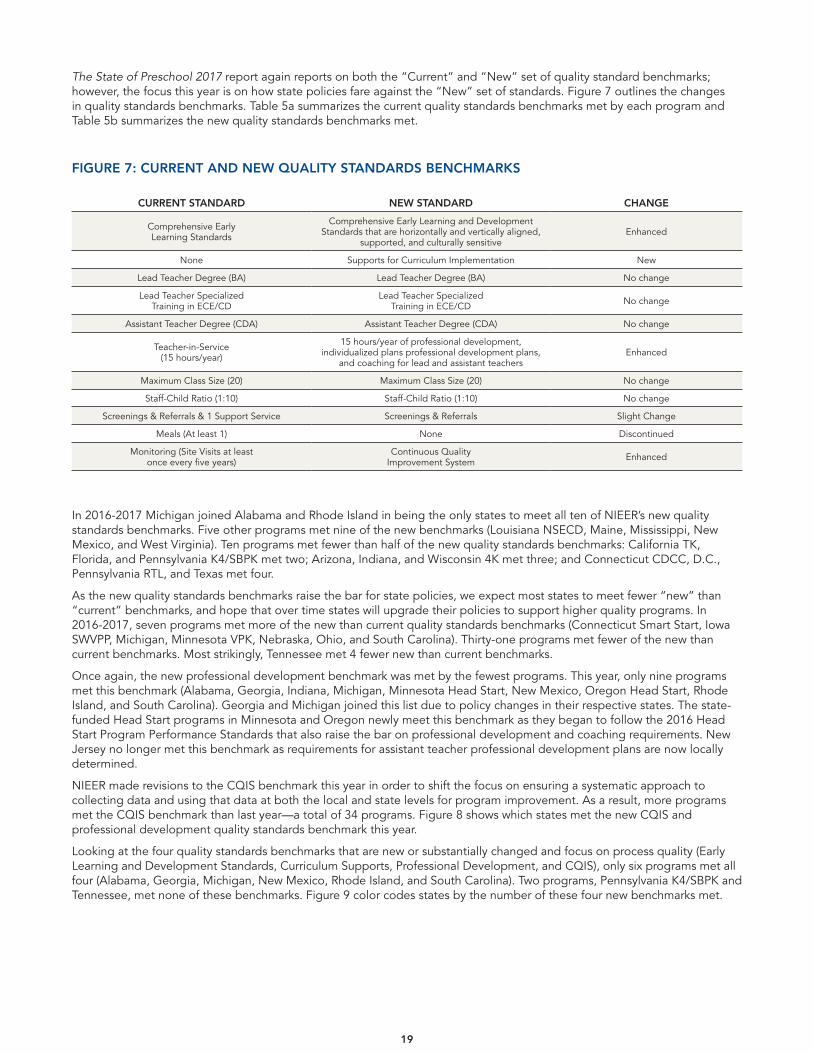
The State of Preschool 2017 report again reports on both the “Current” and “New” set of quality standard benchmarks; however, the focus this year is on how state policies fare against the “New” set of standards. Figure 7 outlines the changes in quality standards benchmarks. Table 5a summarizes the current quality standards benchmarks met by each program and Table 5b summarizes the new quality standards benchmarks met.
19
FIGURE 7: CURRENT AND NEW QUALITY STANDARDS BENCHMARKS
CURRENT STANDARD NEW STANDARD CHANGE
Comprehensive Early Learning Standards
Comprehensive Early Learning and Development Standards that are horizontally and vertically aligned,
supported, and culturally sensitiveEnhanced
None Supports for Curriculum Implementation New
Lead Teacher Degree (BA) Lead Teacher Degree (BA) No change
Lead Teacher Specialized Training in ECE/CD
Lead Teacher Specialized Training in ECE/CD No change
Assistant Teacher Degree (CDA) Assistant Teacher Degree (CDA) No change
Teacher-in-Service (15 hours/year)
15 hours/year of professional development, individualized plans professional development plans,
and coaching for lead and assistant teachersEnhanced
Maximum Class Size (20) Maximum Class Size (20) No change
Staff-Child Ratio (1:10) Staff-Child Ratio (1:10) No change
Screenings & Referrals & 1 Support Service Screenings & Referrals Slight Change
Meals (At least 1) None Discontinued
Monitoring (Site Visits at least once every five years)
Continuous Quality Improvement System Enhanced
In 2016-2017 Michigan joined Alabama and Rhode Island in being the only states to meet all ten of NIEER’s new quality standards benchmarks. Five other programs met nine of the new benchmarks (Louisiana NSECD, Maine, Mississippi, New Mexico, and West Virginia). Ten programs met fewer than half of the new quality standards benchmarks: California TK, Florida, and Pennsylvania K4/SBPK met two; Arizona, Indiana, and Wisconsin 4K met three; and Connecticut CDCC, D.C., Pennsylvania RTL, and Texas met four.
As the new quality standards benchmarks raise the bar for state policies, we expect most states to meet fewer “new” than “current” benchmarks, and hope that over time states will upgrade their policies to support higher quality programs. In 2016-2017, seven programs met more of the new than current quality standards benchmarks (Connecticut Smart Start, Iowa SWVPP, Michigan, Minnesota VPK, Nebraska, Ohio, and South Carolina). Thirty-one programs met fewer of the new than current benchmarks. Most strikingly, Tennessee met 4 fewer new than current benchmarks.
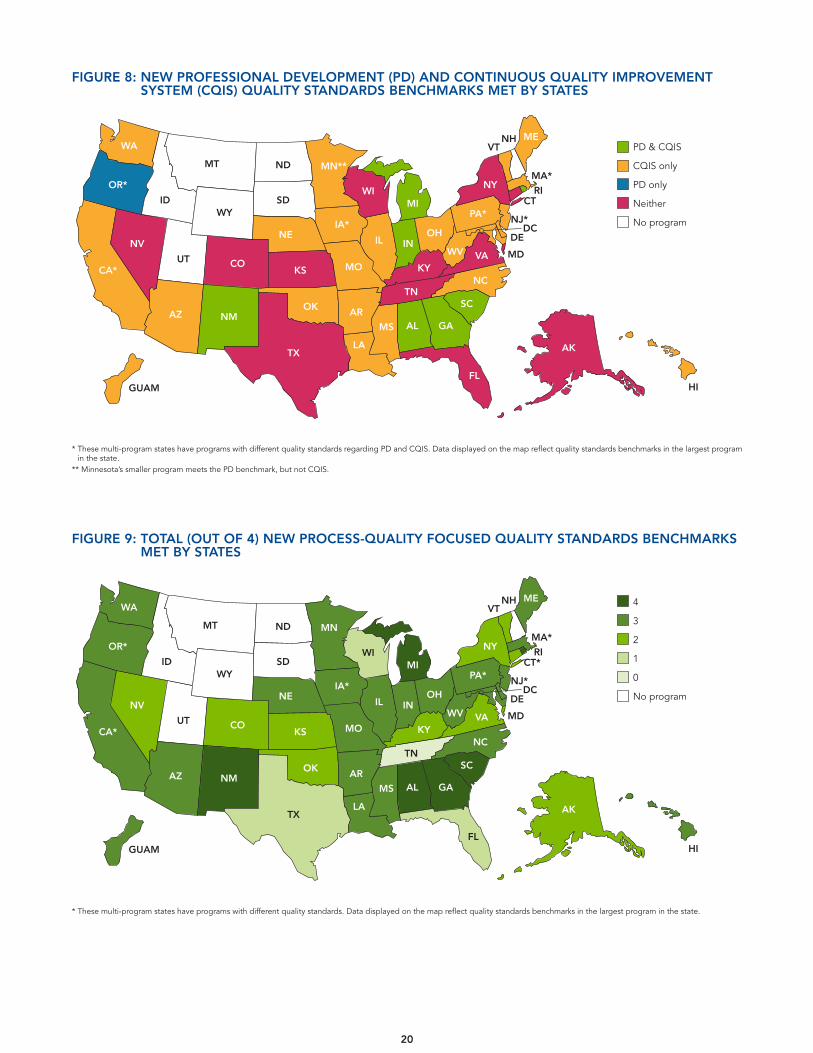
Once again, the new professional development benchmark was met by the fewest programs. This year, only nine programs met this benchmark (Alabama, Georgia, Indiana, Michigan, Minnesota Head Start, New Mexico, Oregon Head Start, Rhode Island, and South Carolina). Georgia and Michigan joined this list due to policy changes in their respective states. The state-funded Head Start programs in Minnesota and Oregon newly meet this benchmark as they began to follow the 2016 Head Start Program Performance Standards that also raise the bar on professional development and coaching requirements. New Jersey no longer met this benchmark as requirements for assistant teacher professional development plans are now locally determined.
NIEER made revisions to the CQIS benchmark this year in order to shift the focus on ensuring a systematic approach to collecting data and using that data at both the local and state levels for program improvement. As a result, more programs met the CQIS benchmark than last year—a total of 34 programs. Figure 8 shows which states met the new CQIS and professional development quality standards benchmark this year.
Looking at the four quality standards benchmarks that are new or substantially changed and focus on process quality (Early Learning and Development Standards, Curriculum Supports, Professional Development, and CQIS), only six programs met all four (Alabama, Georgia, Michigan, New Mexico, Rhode Island, and South Carolina). Two programs, Pennsylvania K4/SBPK and Tennessee, met none of these benchmarks. Figure 9 color codes states by the number of these four new benchmarks met.
20
FIGURE 8: NEW PROFESSIONAL DEVELOPMENT (PD) AND CONTINUOUS QUALITY IMPROVEMENT SYSTEM (CQIS) QUALITY STANDARDS BENCHMARKS MET BY STATES
DC
MT
WA
OR*
CA*
AK
GUAM
NV
IDWY
CO
NM
TX
OK
KS
NE
SD
ND MN**
WI
IL
MI
OH
KY
TN
MS AL GA
SC
NC
VA
NJ*
VTNH
MA*
CT
DE
RI
MDWV
FL
PA*
NY
ME
IN
IA*
MO
AR
LA
UT
AZ
HI
PD & CQIS
CQIS only
PD only
Neither
No program
* These multi-program states have programs with different quality standards regarding PD and CQIS. Data displayed on the map reflect quality standards benchmarks in the largest program in the state.
** Minnesota’s smaller program meets the PD benchmark, but not CQIS.
FIGURE 9: TOTAL (OUT OF 4) NEW PROCESS-QUALITY FOCUSED QUALITY STANDARDS BENCHMARKS MET BY STATES
DC
MT
WA
OR*
CA*
AK
GUAM
NV
IDWY
CO
NM
TX
OK
KS
NE
SD
ND MN
WI
IL
MI
OH
KY
TN
MS AL GA
SC
NC
VA
NJ*
VTNH
MA*
CT*
DE
RI
MDWV
FL
PA*
NY
ME
IN
IA*
MO
AR
LA
UT
AZ
HI
4
3
2
1
0
No program
* These multi-program states have programs with different quality standards. Data displayed on the map reflect quality standards benchmarks in the largest program in the state.
RESOURCES: LARGER STATE INVESTMENTS NEEDED
In 2016-2017, 43 states and the District of Columbia spent slightly more than $7.6 billion on preschool. California alone spent nearly $1.5 billion. Total state funding for preschool rose by almost $155 million in 2016-2017, adjusted for inflation, a two percent increase in spending from 2015-2016. This increase is substantially smaller than the previous year’s increase of $564 million (an eight percent increase). Table 6 reports state spending per child and in total, as well as changes in spending from the previous year.
State spending per child was $5,008 per child, reaching $5,000 in unadjusted dollars for the first time. However, after adjusting for inflation, state spending per child decreased by $16 in 2016-2017 from the previous year, marking the first time since 2014 that state spending per child declined.
State spending per child varied considerably across the states—indeed the gap between the highest and lowest ranking states continued to grow. The District of Columbia spent $16,996 per child while Nebraska spent less than $2,000 per child and six other states spent less than $3,000 per child.
Many states rely on federal and local sources to provide additional funds for their preschool programs. Federal PDG dollars helped support preschool in 18 states, contributing a total of $230 million, including $91 million that supported either new or enhanced seats in state-funded preschool. Some states provide for local education agencies to share preschool costs through a formula, just as they do for K–12 education. Funding from all sources is a better indicator of the total resources available to support preschool (though not a better indicator of a state’s financial commitment). Unfortunately, not all states can fully, or even partially, report spending from local and federal sources. As a result, the “all-reported” spending per child numbers in Table 6 may underestimate total spending by an unknown amount, and comparisons across states can be distorted by differences in reporting.
Local and federal funds added more than $1 billion to state preschool during the 2016-2017 school year, with $683 per child in additional funding reported. Approximately $91 million, or 9%, was from the federal PDG. Spending from all-reported sources totaled more than $8.65 billion in 2016-2017, an increase of over $114 million from the previous year, adjusted for inflation, an all-time high. Non-state funds reported include almost $553 million in required local funds, more than $79 million in non-required local funds, and more than $407 million in non-TANF federal funds (including PDG). All reported spending per child was $5,691, a decrease of $61 from the previous year, adjusted for inflation. All reported spending was more than $18,000 in D.C. but just over $2,000 in Kansas.
21
22
FEDERAL PRESCHOOL DEVELOPMENT GRANTS (PDG)
Preschool Development Grants are competitive federal grants awarded to 18 states to (1) build the state’s capacity to provide high-quality preschool or (2) to expand access to high-quality preschool for high-need communities. The PDG program was part of the Preschool for All initiative jointly administered by the Department of Education and the Department of Health and Human Services (HHS). The recent Every Student Succeeds Act moved PDG administration solely to HHS. In December 2014, 18 states were awarded federal PDG grants. These states received four years of funding and 2016-2017 was the second full school year during which PDG funding was utilized by states.
In 2016-2017, states used more than $230 million in federal PDG funding. In some states, all PDG funding was used to create new seats in state-funded preschool and/or enhance the quality of (including extending the length of the day) existing state-funded preschool seats. In other states, PDG funding supported enrollment of children in preschool programs outside of state-funded preschool, or in a combination of state preschool and other programs. PDG-funded seats were required to meet 12 quality standards including the provision of a full school day. Many of the required PDG standards align with NIEER’s current and new quality standards benchmarks.
In 2016-2017, 40% of PDG funding (approximately $91 million) was used to serve children in state-funded preschool (either through the creation of new seats or enhancing the quality of existing seats). The remainder of the $230 million was used to support children outside of state-funded preschool. Montana is the only PDG state that did not have a state-funded preschool program as defined by this report, serving 763 children in 2016-2017.
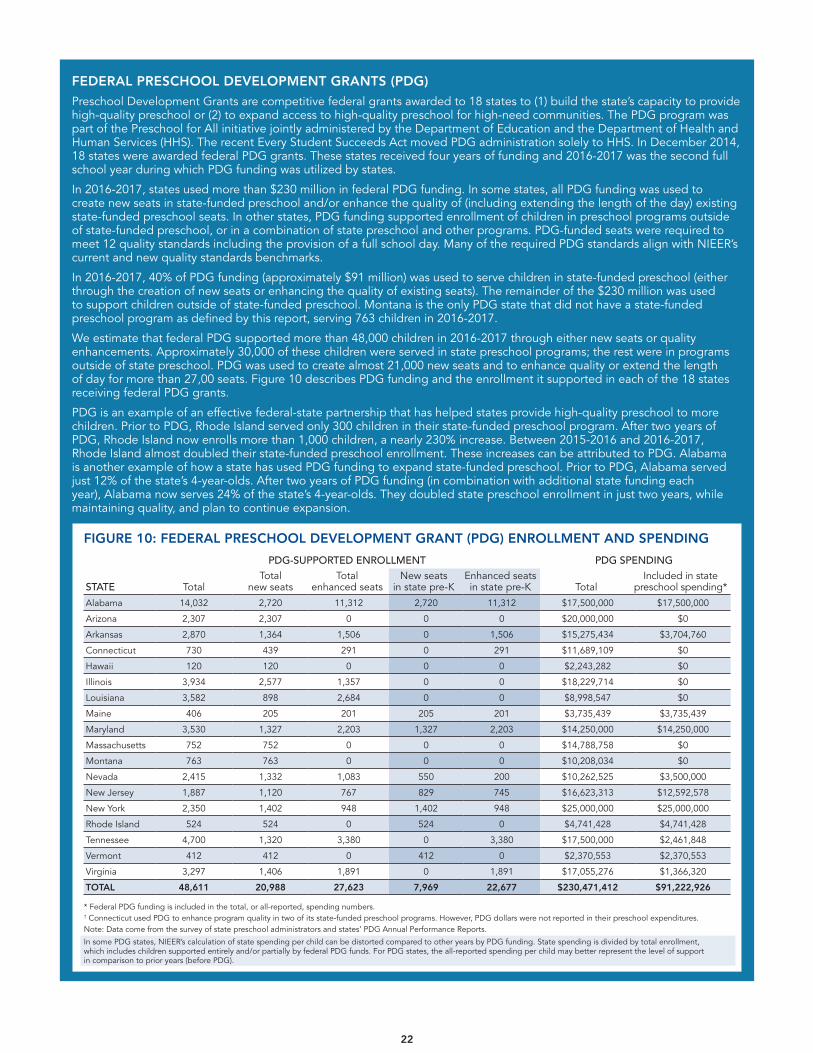
We estimate that federal PDG supported more than 48,000 children in 2016-2017 through either new seats or quality enhancements. Approximately 30,000 of these children were served in state preschool programs; the rest were in programs outside of state preschool. PDG was used to create almost 21,000 new seats and to enhance quality or extend the length of day for more than 27,00 seats. Figure 10 describes PDG funding and the enrollment it supported in each of the 18 states receiving federal PDG grants.
PDG is an example of an effective federal-state partnership that has helped states provide high-quality preschool to more children. Prior to PDG, Rhode Island served only 300 children in their state-funded preschool program. After two years of PDG, Rhode Island now enrolls more than 1,000 children, a nearly 230% increase. Between 2015-2016 and 2016-2017, Rhode Island almost doubled their state-funded preschool enrollment. These increases can be attributed to PDG. Alabama is another example of how a state has used PDG funding to expand state-funded preschool. Prior to PDG, Alabama served just 12% of the state’s 4-year-olds. After two years of PDG funding (in combination with additional state funding each year), Alabama now serves 24% of the state’s 4-year-olds. They doubled state preschool enrollment in just two years, while maintaining quality, and plan to continue expansion.
FIGURE 10: FEDERAL PRESCHOOL DEVELOPMENT GRANT (PDG) ENROLLMENT AND SPENDING
Alabama 14,032 2,720 11,312 2,720 11,312 $17,500,000 $17,500,000
Arizona 2,307 2,307 0 0 0 $20,000,000 $0
Arkansas 2,870 1,364 1,506 0 1,506 $15,275,434 $3,704,760
Connecticut 730 439 291 0 291 $11,689,109 $0
Hawaii 120 120 0 0 0 $2,243,282 $0
Illinois 3,934 2,577 1,357 0 0 $18,229,714 $0
Louisiana 3,582 898 2,684 0 0 $8,998,547 $0
Maine 406 205 201 205 201 $3,735,439 $3,735,439
Maryland 3,530 1,327 2,203 1,327 2,203 $14,250,000 $14,250,000
Massachusetts 752 752 0 0 0 $14,788,758 $0
Montana 763 763 0 0 0 $10,208,034 $0
Nevada 2,415 1,332 1,083 550 200 $10,262,525 $3,500,000
New Jersey 1,887 1,120 767 829 745 $16,623,313 $12,592,578
New York 2,350 1,402 948 1,402 948 $25,000,000 $25,000,000
Rhode Island 524 524 0 524 0 $4,741,428 $4,741,428
Tennessee 4,700 1,320 3,380 0 3,380 $17,500,000 $2,461,848
Vermont 412 412 0 412 0 $2,370,553 $2,370,553
Virginia 3,297 1,406 1,891 0 1,891 $17,055,276 $1,366,320
TOTAL 48,611 20,988 27,623 7,969 22,677 $230,471,412 $91,222,926
STATE
PDG-SUPPORTED ENROLLMENT PDG SPENDING
TotalTotal
new seatsTotal
enhanced seatsNew seats
in state pre-KEnhanced seats in state pre-K Total
Included in state preschool spending*
* Federal PDG funding is included in the total, or all-reported, spending numbers.† Connecticut used PDG to enhance program quality in two of its state-funded preschool programs. However, PDG dollars were not reported in their preschool expenditures.Note: Data come from the survey of state preschool administrators and states’ PDG Annual Performance Reports.
In some PDG states, NIEER’s calculation of state spending per child can be distorted compared to other years by PDG funding. State spending is divided by total enrollment, which includes children supported entirely and/or partially by federal PDG funds. For PDG states, the all-reported spending per child may better represent the level of support in comparison to prior years (before PDG).
23
SIX STATES TO WATCH
One goal of the State of Preschool report is to enable policy makers and the public to learn from all the states, not just their own. With that in mind we have identified six states to watch. All have expressed the intention to provide universal pre-K. Three have largely achieved that goal—West Virginia, Vermont, and Wisconsin—but each illustrates a different approach. Two are on their way up—Alabama and New York—both demonstrate how states can rapidly raise both quality and enrollment. One—Illinois—demonstrates how elusive progress can be when political will ebbs and flows.
1. West Virginia has enrolled about two-thirds of 4-year-olds and ten percent of 3-year-olds for several years. Quality standards are relatively high, as is funding, and the state has gradually increased the number of hours of preschool each year. West Virginia achieved this through an unusually strong and well-coordinated collaboration among education, child care, and Head Start agencies. State pre-K is not dependent on public education funding and expertise alone, utilizing resources and expertise across sectors. A recent evaluation documented that participation translated into improved kindergarten readiness for children. West Virginia could serve as a model for other states looking to make the best use of all available resources to provide consistent, high-quality pre-K to all children as part of the public education system.
2. Vermont quickly expanded its preschool program to reach not just 75% of 4-year-olds, but 60% of 3-year-olds, as well. It has in place key elements of state guidance and a statewide continuous improvement system. However, Vermont does not require a teacher with a BA in early childhood in every classroom, and programs may offer as little as 10 hours per week. With so much local latitude, it is difficult to know how program quality and effectiveness have evolved as the program expanded, though funding levels have been relatively high.
3. Wisconsin achieved pre-K for all through steady increases over nearly two decades. Growth was driven by local demand, state start-up grants, and the state constitution’s provision for 4-year-old kindergarten. State regulations leave most decisions about program design—including hours per week and class size—to local discretion. A key exception is that all teachers must have a 4-year degree and specialized training in early childhood. In 2016, Wisconsin exceeded 70% participation of 4-year-olds. Its approach to slow, steady growth could be a model for other states willing to add pre-K to the state K–12 funding formula.
4. Alabama’s “First Class” Pre-K served just six percent of 4-year-olds in 2012. By 2016-2017, participation had risen to 24%. Preliminary data indicate that 28% of 4-year-olds enrolled in 2017-2018. Based on 2018 appropriations, we project 34% for the 2018-2019 school year. This growth has been achieved while maintaining high standards related to program quality. Alabama is one of the few states to meet all 10 new benchmarks for quality standards, including a continuous quality improvement system. Alabama had help from a federal Preschool Development Grant (PDG), but the most important force has been the state political leadership’s consistent commitment to both high quality and expansion to reach all children and families (a key reason it received the federal grant). Alabama demonstrates what can be accomplished when leadership maintains high-quality preschool as a priority over the long-term.
5. New York serves more than half of its 4-year-olds—up from less than one-third a decade ago—and funding per child has risen dramatically in the past several years. New York is another state that benefitted from the federal PDG. However, much of the state’s recent progress has been propelled by a push to expand full-day Pre-K for All in New York City, though state leadership played a key role, as well. Increased attention has turned to 3-year-olds, as well. New York seems poised for continued progress, but it has in times past seen growth stall. New York illustrates how rapidly a state can increase access to quality full-day programs, while also pointing to the need for persistent commitment to progress statewide over many years.
6. Illinois “Preschool for All” served 32% of 4-year-olds in 2010. Since then the program has faltered, and enrollment declined so that just 26% of 4-year-olds were enrolled in 2016-2017. Adjusted for inflation, funding per child also fell, though it rebounded substantially this year. The nearly $800 per child increase in spending this year signals renewed support for quality not seen for more than a decade. Another bright spot is that Illinois has continued to enroll 20% of 3-year-olds, allowing many children to attend for two years. Illinois demonstrates the fragility of public preschool and the need to prioritize both quality and expansion when pursuing preschool for all.
24
TABLE 2: STATE PRESCHOOL ACCESS BY STATE
ACCESS FOR 4-YEAR-OLDSRANK STATE
PERCENT OF CHILDREN ENROLLED IN STATE PREKINDERGARTEN (2016-2017)
NUMBER OF CHILDREN ENROLLED IN STATE PREKINDERGARTEN (2016-2017)
4-year-olds 3-year-olds Total (3s and 4s) 4-year-olds 3-year-olds Total (3s and 4s)
1 District of Columbia 87.9% 66.0% 76.5% 7,101 5,746 12,847
2 Florida 77.3% 0.0% 38.9% 174,252 0 174,252
3 Vermont 75.1% 59.7% 67.5% 4,696 3,603 8,299
4 Oklahoma 73.3% 3.6% 38.3% 39,304 1,960 41,264
5 Wisconsin 71.8% 0.8% 36.5% 49,281 508 49,789
6 West Virginia 64.7% 11.4% 38.1% 13,393 2,352 15,745
7 Iowa 62.8% 3.0% 32.8% 24,877 1,196 26,073
8 Georgia 60.0% 0.0% 30.4% 80,874 0 80,874
9 New York 51.6% 1.5% 26.5% 119,424 3,447 122,871
10 Texas 49.4% 6.9% 28.1% 196,526 27,588 224,114
11 South Carolina 40.6% 0.0% 20.5% 24,079 0 24,079
12 Maine 38.6% 0.0% 19.4% 5,142 0 5,142
13 Maryland 37.2% 4.9% 21.1% 27,496 3,574 31,070
14 California 36.6% 10.9% 23.7% 181,112 54,454 235,566
15 New Mexico 35.4% 4.2% 19.8% 9,287 1,092 10,379
16 Michigan 33.4% 0.0% 16.7% 38,371 0 38,371
17 Nebraska 31.7% 14.6% 23.2% 8,336 3,850 12,186
18 Arkansas 31.4% 18.5% 25.0% 12,094 7,026 19,120
19 Louisiana 31.1% 0.0% 15.6% 19,054 0 19,054
20 Connecticut 30.2% 8.3% 19.4% 11,558 3,064 14,623
21 New Jersey 29.8% 20.7% 25.3% 31,667 21,703 53,370
22 Illinois 26.0% 20.4% 23.2% 40,461 31,298 71,759
23 Kentucky 25.8% 9.5% 17.6% 14,132 5,303 19,435
24 Alabama 23.9% 0.0% 12.1% 14,032 0 14,032
25 Colorado 23.1% 8.3% 15.7% 15,614 5,590 21,204
26 North Carolina 22.3% 0.0% 11.1% 27,019 0 27,019
27 Tennessee 21.6% 1.0% 11.4% 17,833 800 18,633
28 Kansas 20.5% 0.0% 10.2% 8,011 0 8,011
29 Virginia 17.5% 0.0% 8.8% 18,023 0 18,023
30 Pennsylvania 13.2% 6.5% 9.8% 18,844 9,316 28,160
31 Oregon 12.3% 7.7% 10.0% 5,829 3,614 9,442
32 Ohio 11.2% 0.3% 5.7% 15,566 376 15,942
33 Rhode Island 9.0% 0.0% 4.6% 1,008 0 1,008
34 Washington 8.3% 4.5% 6.4% 7,581 4,110 11,691
35 Massachusetts 8.1% 5.3% 6.7% 5,935 3,870 9,805
36 Delaware 7.4% 0.0% 3.8% 831 0 831
37 Minnesota 5.6% 1.0% 3.3% 3,891 712 4,603
38 Nevada 4.5% 0.5% 2.5% 1,666 190 1,856
39 Arizona 3.9% 2.1% 3.0% 3,442 1,843 5,285
40 Alaska 3.5% 0.0% 1.7% 358 0 358
41 Mississippi 3.4% 0.7% 2.1% 1,310 250 1,560
42 Missouri 2.5% 1.1% 1.8% 1,845 801 2,646
43 Indiana 2.1% 0.0% 1.1% 1,792 0 1,792
44 Hawaii 2.1% 0.0% 1.0% 376 0 376
No Program Idaho 0.0% 0.0% 0.0% 0 0 0
No Program Montana 0.0% 0.0% 0.0% 0 0 0
No Program New Hampshire 0.0% 0.0% 0.0% 0 0 0
No Program North Dakota 0.0% 0.0% 0.0% 0 0 0
No Program South Dakota 0.0% 0.0% 0.0% 0 0 0
No Program Utah 0.0% 0.0% 0.0% 0 0 0
No Program Wyoming 0.0% 0.0% 0.0% 0 0 0
United States 32.7% 5.3% 19.0% 1,303,323 209,237 1,512,559*
Guam 2.2% 0.0% 1.1% 71 0 71
For details about how these figures were calculated, see the Roadmap to the State Profile Pages and the Methodology.*Nationwide, an additional 10,851 children of other ages were enrolled in state prekindergarten, for a total of 1,523,410 children
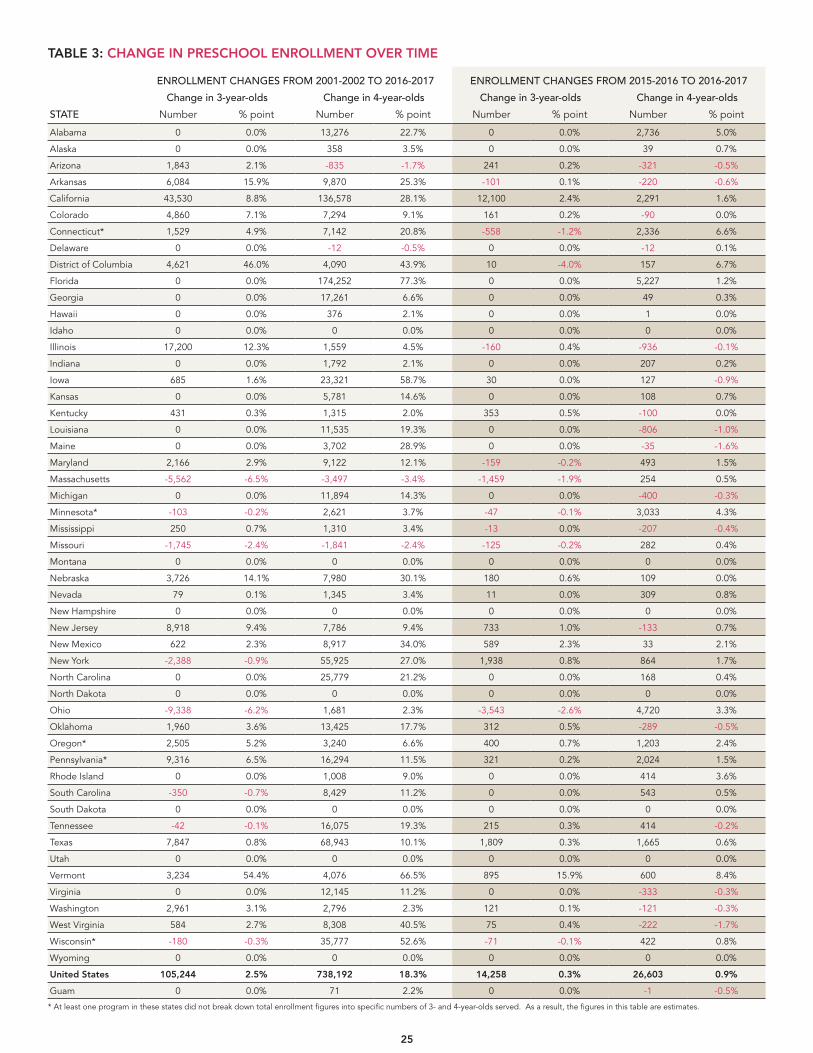
25
TABLE 3: CHANGE IN PRESCHOOL ENROLLMENT OVER TIME
ENROLLMENT CHANGES FROM 2001-2002 TO 2016-2017 ENROLLMENT CHANGES FROM 2015-2016 TO 2016-2017
Change in 3-year-olds Change in 4-year-olds Change in 3-year-olds Change in 4-year-olds
STATE Number % point Number % point Number % point Number % point
Alabama 0 0.0% 13,276 22.7% 0 0.0% 2,736 5.0%
Alaska 0 0.0% 358 3.5% 0 0.0% 39 0.7%
Arizona 1,843 2.1% -835 -1.7% 241 0.2% -321 -0.5%
Arkansas 6,084 15.9% 9,870 25.3% -101 0.1% -220 -0.6%
California 43,530 8.8% 136,578 28.1% 12,100 2.4% 2,291 1.6%
Colorado 4,860 7.1% 7,294 9.1% 161 0.2% -90 0.0%
Connecticut* 1,529 4.9% 7,142 20.8% -558 -1.2% 2,336 6.6%
Delaware 0 0.0% -12 -0.5% 0 0.0% -12 0.1%
District of Columbia 4,621 46.0% 4,090 43.9% 10 -4.0% 157 6.7%
Florida 0 0.0% 174,252 77.3% 0 0.0% 5,227 1.2%
Georgia 0 0.0% 17,261 6.6% 0 0.0% 49 0.3%
Hawaii 0 0.0% 376 2.1% 0 0.0% 1 0.0%
Idaho 0 0.0% 0 0.0% 0 0.0% 0 0.0%
Illinois 17,200 12.3% 1,559 4.5% -160 0.4% -936 -0.1%
Indiana 0 0.0% 1,792 2.1% 0 0.0% 207 0.2%
Iowa 685 1.6% 23,321 58.7% 30 0.0% 127 -0.9%
Kansas 0 0.0% 5,781 14.6% 0 0.0% 108 0.7%
Kentucky 431 0.3% 1,315 2.0% 353 0.5% -100 0.0%
Louisiana 0 0.0% 11,535 19.3% 0 0.0% -806 -1.0%
Maine 0 0.0% 3,702 28.9% 0 0.0% -35 -1.6%
Maryland 2,166 2.9% 9,122 12.1% -159 -0.2% 493 1.5%
Massachusetts -5,562 -6.5% -3,497 -3.4% -1,459 -1.9% 254 0.5%
Michigan 0 0.0% 11,894 14.3% 0 0.0% -400 -0.3%
Minnesota* -103 -0.2% 2,621 3.7% -47 -0.1% 3,033 4.3%
Mississippi 250 0.7% 1,310 3.4% -13 0.0% -207 -0.4%
Missouri -1,745 -2.4% -1,841 -2.4% -125 -0.2% 282 0.4%
Montana 0 0.0% 0 0.0% 0 0.0% 0 0.0%
Nebraska 3,726 14.1% 7,980 30.1% 180 0.6% 109 0.0%
Nevada 79 0.1% 1,345 3.4% 11 0.0% 309 0.8%
New Hampshire 0 0.0% 0 0.0% 0 0.0% 0 0.0%
New Jersey 8,918 9.4% 7,786 9.4% 733 1.0% -133 0.7%
New Mexico 622 2.3% 8,917 34.0% 589 2.3% 33 2.1%
New York -2,388 -0.9% 55,925 27.0% 1,938 0.8% 864 1.7%
North Carolina 0 0.0% 25,779 21.2% 0 0.0% 168 0.4%
North Dakota 0 0.0% 0 0.0% 0 0.0% 0 0.0%
Ohio -9,338 -6.2% 1,681 2.3% -3,543 -2.6% 4,720 3.3%
Oklahoma 1,960 3.6% 13,425 17.7% 312 0.5% -289 -0.5%
Oregon* 2,505 5.2% 3,240 6.6% 400 0.7% 1,203 2.4%
Pennsylvania* 9,316 6.5% 16,294 11.5% 321 0.2% 2,024 1.5%
Rhode Island 0 0.0% 1,008 9.0% 0 0.0% 414 3.6%
South Carolina -350 -0.7% 8,429 11.2% 0 0.0% 543 0.5%
South Dakota 0 0.0% 0 0.0% 0 0.0% 0 0.0%
Tennessee -42 -0.1% 16,075 19.3% 215 0.3% 414 -0.2%
Texas 7,847 0.8% 68,943 10.1% 1,809 0.3% 1,665 0.6%
Utah 0 0.0% 0 0.0% 0 0.0% 0 0.0%
Vermont 3,234 54.4% 4,076 66.5% 895 15.9% 600 8.4%
Virginia 0 0.0% 12,145 11.2% 0 0.0% -333 -0.3%
Washington 2,961 3.1% 2,796 2.3% 121 0.1% -121 -0.3%
West Virginia 584 2.7% 8,308 40.5% 75 0.4% -222 -1.7%
Wisconsin* -180 -0.3% 35,777 52.6% -71 -0.1% 422 0.8%
Wyoming 0 0.0% 0 0.0% 0 0.0% 0 0.0%
United States 105,244 2.5% 738,192 18.3% 14,258 0.3% 26,603 0.9%
Guam 0 0.0% 71 2.2% 0 0.0% -1 -0.5%
* At least one program in these states did not break down total enrollment figures into specific numbers of 3- and 4-year-olds served. As a result, the figures in this table are estimates.
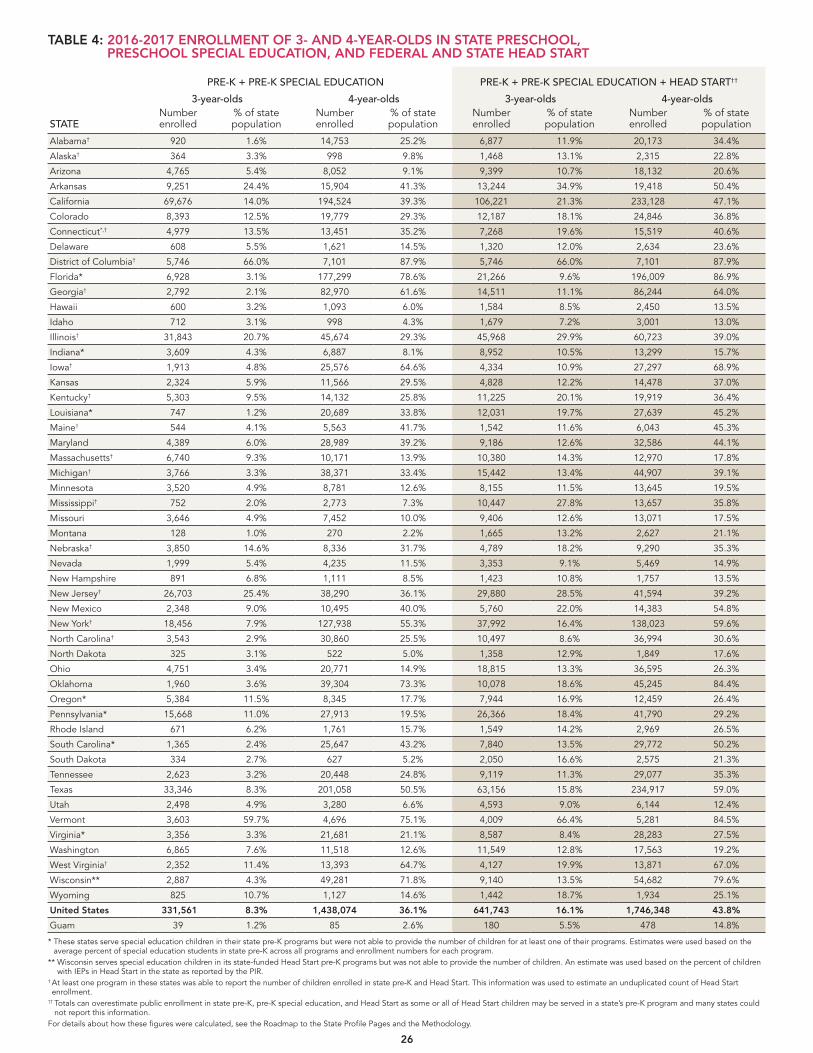
26
TABLE 4: 2016-2017 ENROLLMENT OF 3- AND 4-YEAR-OLDS IN STATE PRESCHOOL, PRESCHOOL SPECIAL EDUCATION, AND FEDERAL AND STATE HEAD START
PRE-K + PRE-K SPECIAL EDUCATION PRE-K + PRE-K SPECIAL EDUCATION + HEAD START††
3-year-olds 4-year-olds 3-year-olds 4-year-olds
STATENumber enrolled
% of state population
Number enrolled
% of state population
Number enrolled
% of state population
Number enrolled
% of state population
Alabama† 920 1.6% 14,753 25.2% 6,877 11.9% 20,173 34.4%
Alaska† 364 3.3% 998 9.8% 1,468 13.1% 2,315 22.8%
Arizona 4,765 5.4% 8,052 9.1% 9,399 10.7% 18,132 20.6%
Arkansas 9,251 24.4% 15,904 41.3% 13,244 34.9% 19,418 50.4%
California 69,676 14.0% 194,524 39.3% 106,221 21.3% 233,128 47.1%
Colorado 8,393 12.5% 19,779 29.3% 12,187 18.1% 24,846 36.8%
Connecticut*,† 4,979 13.5% 13,451 35.2% 7,268 19.6% 15,519 40.6%
Delaware 608 5.5% 1,621 14.5% 1,320 12.0% 2,634 23.6%
District of Columbia† 5,746 66.0% 7,101 87.9% 5,746 66.0% 7,101 87.9%
Florida* 6,928 3.1% 177,299 78.6% 21,266 9.6% 196,009 86.9%
Georgia† 2,792 2.1% 82,970 61.6% 14,511 11.1% 86,244 64.0%
Hawaii 600 3.2% 1,093 6.0% 1,584 8.5% 2,450 13.5%
Idaho 712 3.1% 998 4.3% 1,679 7.2% 3,001 13.0%
Illinois† 31,843 20.7% 45,674 29.3% 45,968 29.9% 60,723 39.0%
Indiana* 3,609 4.3% 6,887 8.1% 8,952 10.5% 13,299 15.7%
Iowa† 1,913 4.8% 25,576 64.6% 4,334 10.9% 27,297 68.9%
Kansas 2,324 5.9% 11,566 29.5% 4,828 12.2% 14,478 37.0%
Kentucky† 5,303 9.5% 14,132 25.8% 11,225 20.1% 19,919 36.4%
Louisiana* 747 1.2% 20,689 33.8% 12,031 19.7% 27,639 45.2%
Maine† 544 4.1% 5,563 41.7% 1,542 11.6% 6,043 45.3%
Maryland 4,389 6.0% 28,989 39.2% 9,186 12.6% 32,586 44.1%
Massachusetts† 6,740 9.3% 10,171 13.9% 10,380 14.3% 12,970 17.8%
Michigan† 3,766 3.3% 38,371 33.4% 15,442 13.4% 44,907 39.1%
Minnesota 3,520 4.9% 8,781 12.6% 8,155 11.5% 13,645 19.5%
Mississippi† 752 2.0% 2,773 7.3% 10,447 27.8% 13,657 35.8%
Missouri 3,646 4.9% 7,452 10.0% 9,406 12.6% 13,071 17.5%
Montana 128 1.0% 270 2.2% 1,665 13.2% 2,627 21.1%
Nebraska† 3,850 14.6% 8,336 31.7% 4,789 18.2% 9,290 35.3%
Nevada 1,999 5.4% 4,235 11.5% 3,353 9.1% 5,469 14.9%
New Hampshire 891 6.8% 1,111 8.5% 1,423 10.8% 1,757 13.5%
New Jersey† 26,703 25.4% 38,290 36.1% 29,880 28.5% 41,594 39.2%
New Mexico 2,348 9.0% 10,495 40.0% 5,760 22.0% 14,383 54.8%
New York† 18,456 7.9% 127,938 55.3% 37,992 16.4% 138,023 59.6%
North Carolina† 3,543 2.9% 30,860 25.5% 10,497 8.6% 36,994 30.6%
North Dakota 325 3.1% 522 5.0% 1,358 12.9% 1,849 17.6%
Ohio 4,751 3.4% 20,771 14.9% 18,815 13.3% 36,595 26.3%
Oklahoma 1,960 3.6% 39,304 73.3% 10,078 18.6% 45,245 84.4%
Oregon* 5,384 11.5% 8,345 17.7% 7,944 16.9% 12,459 26.4%
Pennsylvania* 15,668 11.0% 27,913 19.5% 26,366 18.4% 41,790 29.2%
Rhode Island 671 6.2% 1,761 15.7% 1,549 14.2% 2,969 26.5%
South Carolina* 1,365 2.4% 25,647 43.2% 7,840 13.5% 29,772 50.2%
South Dakota 334 2.7% 627 5.2% 2,050 16.6% 2,575 21.3%
Tennessee 2,623 3.2% 20,448 24.8% 9,119 11.3% 29,077 35.3%
Texas 33,346 8.3% 201,058 50.5% 63,156 15.8% 234,917 59.0%
Utah 2,498 4.9% 3,280 6.6% 4,593 9.0% 6,144 12.4%
Vermont 3,603 59.7% 4,696 75.1% 4,009 66.4% 5,281 84.5%
Virginia* 3,356 3.3% 21,681 21.1% 8,587 8.4% 28,283 27.5%
Washington 6,865 7.6% 11,518 12.6% 11,549 12.8% 17,563 19.2%
West Virginia† 2,352 11.4% 13,393 64.7% 4,127 19.9% 13,871 67.0%
Wisconsin** 2,887 4.3% 49,281 71.8% 9,140 13.5% 54,682 79.6%
Wyoming 825 10.7% 1,127 14.6% 1,442 18.7% 1,934 25.1%
United States 331,561 8.3% 1,438,074 36.1% 641,743 16.1% 1,746,348 43.8%
Guam 39 1.2% 85 2.6% 180 5.5% 478 14.8%
* These states serve special education children in their state pre-K programs but were not able to provide the number of children for at least one of their programs. Estimates were used based on the average percent of special education students in state pre-K across all programs and enrollment numbers for each program.
** Wisconsin serves special education children in its state-funded Head Start pre-K programs but was not able to provide the number of children. An estimate was used based on the percent of children with IEPs in Head Start in the state as reported by the PIR.
† At least one program in these states was able to report the number of children enrolled in state pre-K and Head Start. This information was used to estimate an unduplicated count of Head Start enrollment.
†† Totals can overestimate public enrollment in state pre-K, pre-K special education, and Head Start as some or all of Head Start children may be served in a state’s pre-K program and many states could not report this information.
For details about how these figures were calculated, see the Roadmap to the State Profile Pages and the Methodology.

27
TABLE 5A: 2016-2017 STATE PRESCHOOL QUALITY STANDARDS (CURRENT)
STATE/ PROGRAM
Comprehensiveearly learning
standardsTeacher has BA
Specializedtraining in pre-K
Assistant teacher
has CDA or equiv.
At least 15 hrs/yr in-service
(for teachers)
Class size 20
or lower
Staff-child ratio 1:10 or better
Vision, hearing, health& one
support service
At leastone meal
Site visits
Current Quality
Standards Checklist
Sum 2016-2017
Alabama 4 4 4 4 4 4 4 4 4 4 10
Alaska 4 4 4 4 4 4 4 4 8
Arizona 4 4 4 3
Arkansas 4 4 4 4 4 4 4 4 4 9
California SPP 4 4 4 4 4 4 6
California TK 4 4 2
Colorado 4 4 4 4 4 4 6
Connecticut CDCC 4 4 4 4 4 4 6
Connecticut SR 4 4 4 4 4 5
Connecticut Smart Start 4 4 4 4 4 5
Delaware 4 4 4 4 4 4 4 4 8
District of Columbia 4 4 4 4 4
Florida† 4 4 4 3
Georgia 4 4 4 4 4 4 4 4 8
Hawaii 4 4 4 4 4 4 4 4 8
Illinois 4 4 4 4 4 4 4 4 8
Indiana 4 4 4 3
Iowa Shared Visions 4 4 4 4 4 4 4 7
Iowa SWVPP 4 4 4 4 4 4 4 7
Kansas Preschool 4 4 4 4 4 4 4 7
Kansas State Pre-K 4 4 4 4 4 5
Kentucky 4 4 4 4 4 4 4 4 4 9
Louisiana 8(g) 4 4 4 4 4 4 4 4 8
Louisiana LA 4 4 4 4 4 4 4 4 4 4 9
Louisiana NSECD 4 4 4 4 4 4 4 4 4 4 10
Maine 4 4 4 4 4 4 4 4 4 9
Maryland 4 4 4 4 4 4 4 4 8
Massachusetts 391 4 4 4 4 4 4 6
Massachusetts UPK 4 4 4 4 4 4 4 7
Michigan 4 4 4 4 4 4 4 4 4 9
Minnesota HdSt 4 4 4 4 4 4 4 4 4 9
Minnesota VPK 4 4 4 4 4 5
Mississippi 4 4 4 4 4 4 4 4 4 4 10
Missouri 4 4 4 4 4 4 4 4 8
Nebraska 4 4 4 4 4 4 6
Nevada 4 4 4 4 4 4 4 7
New Jersey Abbott 4 4 4 4 4 4 4 4 4 9
New Jersey ECPA 4 4 4 4 4 4 4 7
New Jersey ELLI 4 4 4 4 4 4 4 7
New Mexico 4 4 4 4 4 4 4 4 4 9
New York 4 4 4 4 4 4 4 7
North Carolina 4 4 4 4 4 4 4 4 4 9
Ohio 4 4 4 4 4
Oklahoma 4 4 4 4 4 4 4 4 4 9
Oregon HdSt 4 4 4 4 4 4 4 4 4 9
Oregon Preschool Promise 4 4 4 4 4 4 4 4 8
Pennsylvania RTL 4 4 4 4 4 5
Pennsylvania HSSAP 4 4 4 4 4 4 4 4 4 9
Pennsylvania K4 & SBPK 4 4 2
Pennsylvania PKC 4 4 4 4 4 4 4 4 4 9
Rhode Island 4 4 4 4 4 4 4 4 4 4 10
South Carolina 4 4 4 4 4 4 6
Tennessee 4 4 4 4 4 4 4 4 4 9
Texas 4 4 4 4 4
Vermont 4 4 4 4 4 4 6
Virginia 4 4 4 4 4 4 6
Washington 4 4 4 4 4 4 4 4 4 9
West Virginia 4 4 4 4 4 4 4 4 4 4 10
Wisconsin 4K 4 4 4 4 4
Wisconsin HdSt 4 4 4 4 4 4 4 4 8
TOTAL 60 34 51 18 49 48 50 41 29 43
Guam 4 4 4 4 4 4 4 7
† Data on Florida’s quality standards are from the 2013-2014 school year. Publicly available documents were reviewed for any policy changes that would have changed the benchmarks met.
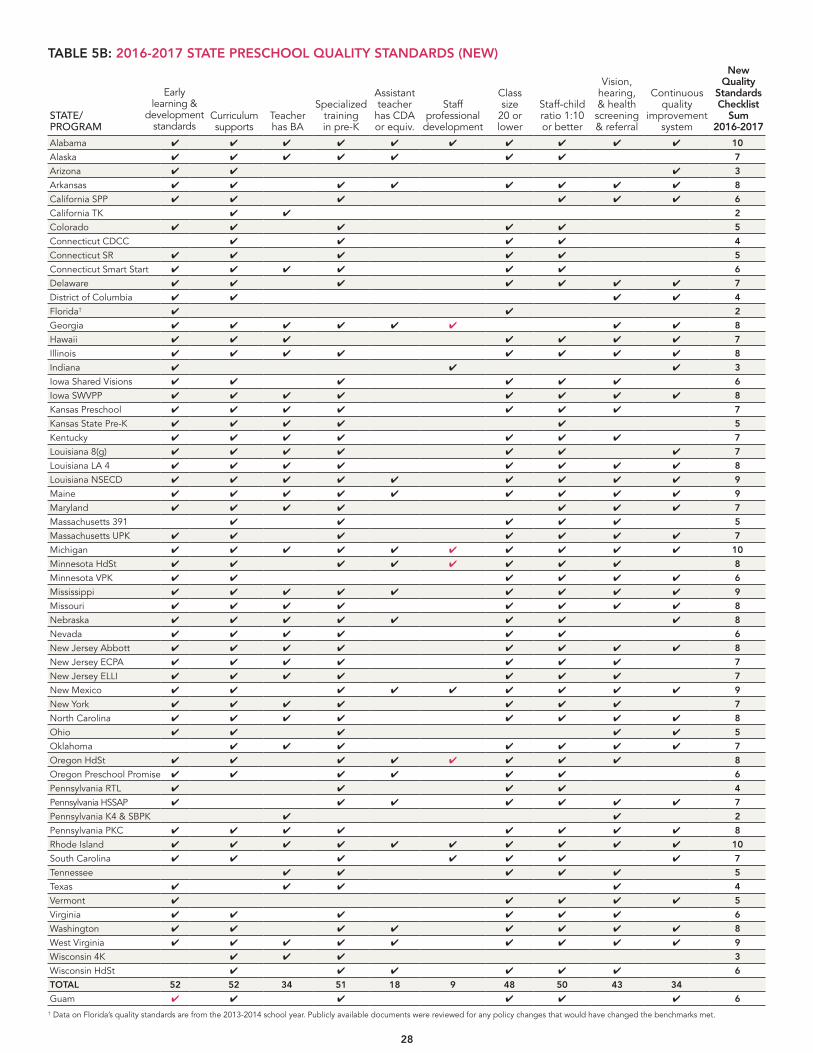
28
TABLE 5B: 2016-2017 STATE PRESCHOOL QUALITY STANDARDS (NEW)
STATE/ PROGRAM
Curriculum supports
Teacherhas BA
Specializedtraining in pre-K
Assistant teacher
has CDA or equiv.
Staffprofessional
development
Class size
20 or lower
Staff-child ratio 1:10 or better
Vision, hearing, & health
screening & referral
Continuousquality
improvementsystem
New Quality
Standards Checklist
Sum 2016-2017
Alabama 4 4 4 4 4 4 4 4 4 4 10
Alaska 4 4 4 4 4 4 4 7
Arizona 4 4 4 3
Arkansas 4 4 4 4 4 4 4 4 8
California SPP 4 4 4 4 4 4 6
California TK 4 4 2
Colorado 4 4 4 4 4 5
Connecticut CDCC 4 4 4 4 4
Connecticut SR 4 4 4 4 4 5
Connecticut Smart Start 4 4 4 4 4 4 6
Delaware 4 4 4 4 4 4 4 7
District of Columbia 4 4 4 4 4
Florida† 4 4 2
Georgia 4 4 4 4 4 4 4 4 8
Hawaii 4 4 4 4 4 4 4 7
Illinois 4 4 4 4 4 4 4 4 8
Indiana 4 4 4 3
Iowa Shared Visions 4 4 4 4 4 4 6
Iowa SWVPP 4 4 4 4 4 4 4 4 8
Kansas Preschool 4 4 4 4 4 4 4 7
Kansas State Pre-K 4 4 4 4 4 5
Kentucky 4 4 4 4 4 4 4 7
Louisiana 8(g) 4 4 4 4 4 4 4 7
Louisiana LA 4 4 4 4 4 4 4 4 4 8
Louisiana NSECD 4 4 4 4 4 4 4 4 4 9
Maine 4 4 4 4 4 4 4 4 4 9
Maryland 4 4 4 4 4 4 4 7
Massachusetts 391 4 4 4 4 4 5
Massachusetts UPK 4 4 4 4 4 4 4 7
Michigan 4 4 4 4 4 4 4 4 4 4 10
Minnesota HdSt 4 4 4 4 4 4 4 4 8
Minnesota VPK 4 4 4 4 4 4 6
Mississippi 4 4 4 4 4 4 4 4 4 9
Missouri 4 4 4 4 4 4 4 4 8
Nebraska 4 4 4 4 4 4 4 4 8
Nevada 4 4 4 4 4 4 6
New Jersey Abbott 4 4 4 4 4 4 4 4 8
New Jersey ECPA 4 4 4 4 4 4 4 7
New Jersey ELLI 4 4 4 4 4 4 4 7
New Mexico 4 4 4 4 4 4 4 4 4 9
New York 4 4 4 4 4 4 4 7
North Carolina 4 4 4 4 4 4 4 4 8
Ohio 4 4 4 4 4 5
Oklahoma 4 4 4 4 4 4 4 7
Oregon HdSt 4 4 4 4 4 4 4 4 8
Oregon Preschool Promise 4 4 4 4 4 4 6
Pennsylvania RTL 4 4 4 4 4
Pennsylvania HSSAP 4 4 4 4 4 4 4 7
Pennsylvania K4 & SBPK 4 4 2
Pennsylvania PKC 4 4 4 4 4 4 4 4 8
Rhode Island 4 4 4 4 4 4 4 4 4 4 10
South Carolina 4 4 4 4 4 4 4 7
Tennessee 4 4 4 4 4 5
Texas 4 4 4 4 4
Vermont 4 4 4 4 4 5
Virginia 4 4 4 4 4 4 6
Washington 4 4 4 4 4 4 4 4 8
West Virginia 4 4 4 4 4 4 4 4 4 9
Wisconsin 4K 4 4 4 3
Wisconsin HdSt 4 4 4 4 4 4 6
TOTAL 52 52 34 51 18 9 48 50 43 34
Guam 4 4 4 4 4 4 6† Data on Florida’s quality standards are from the 2013-2014 school year. Publicly available documents were reviewed for any policy changes that would have changed the benchmarks met.
Early learning &
developmentstandards
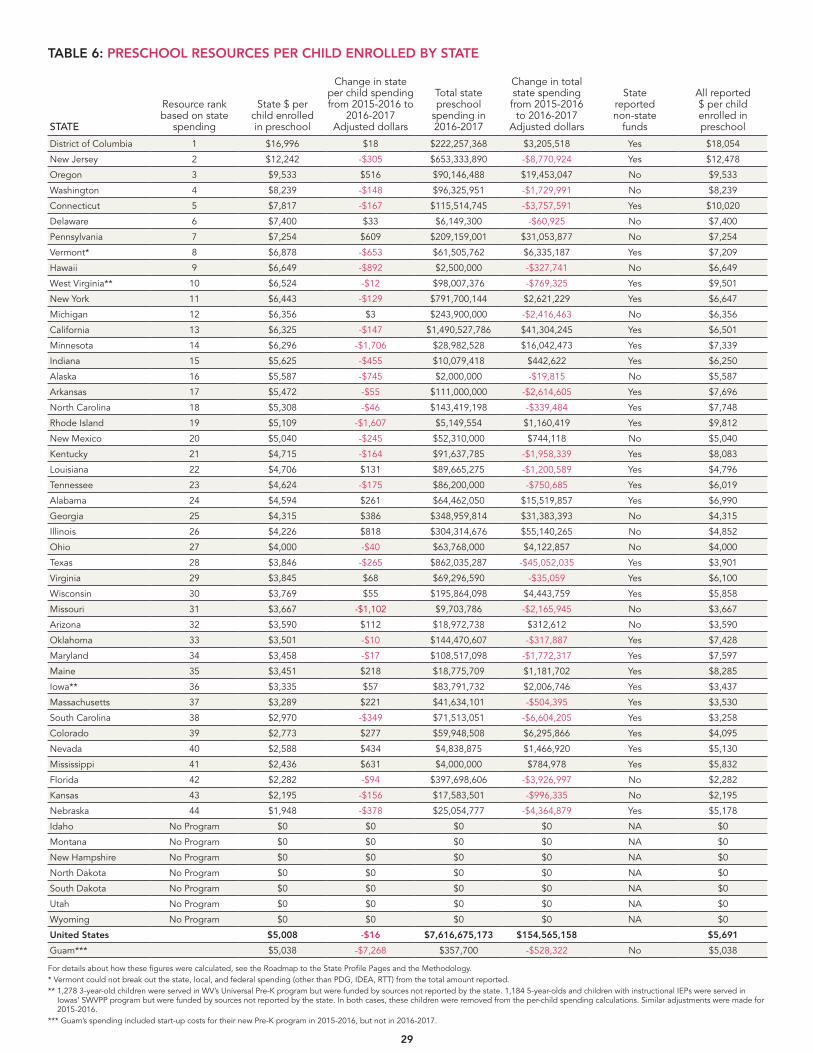
29
TABLE 6: PRESCHOOL RESOURCES PER CHILD ENROLLED BY STATE
STATE
Resource rank based on state
spending
State $ per child enrolled in preschool
Change in state per child spending from 2015-2016 to
2016-2017 Adjusted dollars
Total state preschool
spending in 2016-2017
Change in total state spending from 2015-2016
to 2016-2017 Adjusted dollars
State reported non-state
funds
All reported $ per child enrolled in preschool
District of Columbia 1 $16,996 $18 $222,257,368 $3,205,518 Yes $18,054
New Jersey 2 $12,242 -$305 $653,333,890 -$8,770,924 Yes $12,478
Oregon 3 $9,533 $516 $90,146,488 $19,453,047 No $9,533
Washington 4 $8,239 -$148 $96,325,951 -$1,729,991 No $8,239
Connecticut 5 $7,817 -$167 $115,514,745 -$3,757,591 Yes $10,020
Delaware 6 $7,400 $33 $6,149,300 -$60,925 No $7,400
Pennsylvania 7 $7,254 $609 $209,159,001 $31,053,877 No $7,254
Vermont* 8 $6,878 -$653 $61,505,762 $6,335,187 Yes $7,209
Hawaii 9 $6,649 -$892 $2,500,000 -$327,741 No $6,649
West Virginia** 10 $6,524 -$12 $98,007,376 -$769,325 Yes $9,501
New York 11 $6,443 -$129 $791,700,144 $2,621,229 Yes $6,647
Michigan 12 $6,356 $3 $243,900,000 -$2,416,463 No $6,356
California 13 $6,325 -$147 $1,490,527,786 $41,304,245 Yes $6,501
Minnesota 14 $6,296 -$1,706 $28,982,528 $16,042,473 Yes $7,339
Indiana 15 $5,625 -$455 $10,079,418 $442,622 Yes $6,250
Alaska 16 $5,587 -$745 $2,000,000 -$19,815 No $5,587
Arkansas 17 $5,472 -$55 $111,000,000 -$2,614,605 Yes $7,696
North Carolina 18 $5,308 -$46 $143,419,198 -$339,484 Yes $7,748
Rhode Island 19 $5,109 -$1,607 $5,149,554 $1,160,419 Yes $9,812
New Mexico 20 $5,040 -$245 $52,310,000 $744,118 No $5,040
Kentucky 21 $4,715 -$164 $91,637,785 -$1,958,339 Yes $8,083
Louisiana 22 $4,706 $131 $89,665,275 -$1,200,589 Yes $4,796
Tennessee 23 $4,624 -$175 $86,200,000 -$750,685 Yes $6,019
Alabama 24 $4,594 $261 $64,462,050 $15,519,857 Yes $6,990
Georgia 25 $4,315 $386 $348,959,814 $31,383,393 No $4,315
Illinois 26 $4,226 $818 $304,314,676 $55,140,265 No $4,852
Ohio 27 $4,000 -$40 $63,768,000 $4,122,857 No $4,000
Texas 28 $3,846 -$265 $862,035,287 -$45,052,035 Yes $3,901
Virginia 29 $3,845 $68 $69,296,590 -$35,059 Yes $6,100
Wisconsin 30 $3,769 $55 $195,864,098 $4,443,759 Yes $5,858
Missouri 31 $3,667 -$1,102 $9,703,786 -$2,165,945 No $3,667
Arizona 32 $3,590 $112 $18,972,738 $312,612 No $3,590
Oklahoma 33 $3,501 -$10 $144,470,607 -$317,887 Yes $7,428
Maryland 34 $3,458 -$17 $108,517,098 -$1,772,317 Yes $7,597
Maine 35 $3,451 $218 $18,775,709 $1,181,702 Yes $8,285
Iowa** 36 $3,335 $57 $83,791,732 $2,006,746 Yes $3,437
Massachusetts 37 $3,289 $221 $41,634,101 -$504,395 Yes $3,530
South Carolina 38 $2,970 -$349 $71,513,051 -$6,604,205 Yes $3,258
Colorado 39 $2,773 $277 $59,948,508 $6,295,866 Yes $4,095
Nevada 40 $2,588 $434 $4,838,875 $1,466,920 Yes $5,130
Mississippi 41 $2,436 $631 $4,000,000 $784,978 Yes $5,832
Florida 42 $2,282 -$94 $397,698,606 -$3,926,997 No $2,282
Kansas 43 $2,195 -$156 $17,583,501 -$996,335 No $2,195
Nebraska 44 $1,948 -$378 $25,054,777 -$4,364,879 Yes $5,178
Idaho No Program $0 $0 $0 $0 NA $0
Montana No Program $0 $0 $0 $0 NA $0
New Hampshire No Program $0 $0 $0 $0 NA $0
North Dakota No Program $0 $0 $0 $0 NA $0
South Dakota No Program $0 $0 $0 $0 NA $0
Utah No Program $0 $0 $0 $0 NA $0
Wyoming No Program $0 $0 $0 $0 NA $0
United States $5,008 -$16 $7,616,675,173 $154,565,158 $5,691
Guam*** $5,038 -$7,268 $357,700 -$528,322 No $5,038
For details about how these figures were calculated, see the Roadmap to the State Profile Pages and the Methodology.* Vermont could not break out the state, local, and federal spending (other than PDG, IDEA, RTT) from the total amount reported. ** 1,278 3-year-old children were served in WV’s Universal Pre-K program but were funded by sources not reported by the state. 1,184 5-year-olds and children with instructional IEPs were served in
Iowas’ SWVPP program but were funded by sources not reported by the state. In both cases, these children were removed from the per-child spending calculations. Similar adjustments were made for 2015-2016.
*** Guam’s spending included start-up costs for their new Pre-K program in 2015-2016, but not in 2016-2017.
1 Arteaga, I., Humpage, S., Reynolds, A. J., & Temple, J. A. (2014). One year of preschool or two: Is it important for adult outcomes?. Economics of education review, 40, 221-237. Domitrovich, C. E., Morgan, N. R., Moore, J. E., Cooper, B. R., Shah, H. K., Jacobson, L., & Greenberg, M. T. (2013). One versus two years: Does length of exposure to an enhanced preschool program impact the academic functioning of disadvantaged children in kindergarten?. Early Childhood Research Quarterly, 28(4), 704-713.
2 Barnett, W. S. (2011). Effectiveness of early educational intervention. Science, 333, 975–78. Yoshikawa, H., Weiland, C., & Brooks-Gunn, J. (2016). When does preschool matter? The Future of Children, 26(2), 21-35.
3 Phillips, D.A., Lipsey, M.W., Dodge, K.A., Haskins, R., Bassok, D., Burchinal, M.R.,…Weiland, C. (2017). Puzzling it out: The current state of scientific knowledge on pre-kindergarten effects, a consensus statement. Washington, DC: Brookings Institution. Downloaded July 24, 2017 from https://www.brookings.edu/wp-content/uploads/2017/04/consensus-statement_final.pdf . Yoshikawa, H., Weiland, C., Brooks-Gunn, J., Burchinal, M., Espinosa, L. M., Gormley, W. T.,…Zaslow, M. (2013). Investing in our future: The evidence base on preschool education. Ann Arbor, MI: Society for Research in Child Development.
4 Barnett, W. S. (1998). Long-term cognitive and academic effects of early childhood education on children in poverty. Preventive Medicine, 27(2), 204-207. Frede, E.C. (1998). Preschool program quality in programs for children in poverty. In Barnett, W.S., Boocock, S.S. (Eds.), Early care and education for children in poverty (pp. 77–98). Albany, NY: SUNY Press. More recently: Camilli, G., Vargas, S., Ryan, S., & Barnett, W. S. (2010). Meta-analysis of the effects of early education interventions on cognitive and social development. Teachers College Record, 112(3), 579-620.
5 Minervino, J. (2014). Lessons from research and the classroom. Seattle, WA: Bill & Melinda Gates Foundation. Phillips et al. (2017). Pianta, R. C., Barnett, W. S., Burchinal, M., & Thornburg, K. R. (2009). The effects of preschool education: What we know, how public policy is or is not aligned with the evidence base, and what we need to know. Psychological Science in the Public Interest, 10(2), 49-88. Weiland, C. (2016). Launching Preschool 2.0: A road map to high-quality public programs at scale. Behavioral Science & Policy, 2(1), 37-46.
6 Bornfreund, L. A., McCann, C., Williams, C., & Guernsey, L. (2014). Beyond subprime learning: Accelerating progress in early education. Washington, DC: New America Foundation. Bowman, B. T., Donovan, M. S., & Burns, M. S. (Eds.). (2001). Eager to learn: Educating our preschoolers. Washington, DC: National Academy Press.
7 National Education Goals Panel (1991). The Goal 1 Technical Planning Subgroup report on school readiness. Washington, DC: Author. National Association for the Education of Young Children (2009).
8 Shonkoff, J. P., & Phillips, D. A. (Eds.). (2000). From neurons to neighborhoods: The science of early childhood development. Washington, DC: National Academy Press.9 Kauerz, K., & Coffman, J. (2013). Framework for planning, implementing, and evaluating preK-3rd grade approaches. Seattle: University of Washington, College of Education. Minervino
(2014). Tout, K., Halle, T., Daily, S., Albertson-Junkans, L., & Moodie, S. (2013). The research base for a birth through age eight state policy framework. Washington, DC: Alliance for Early Success and Child Trends.
10 Espinosa, L. M. (2010). Getting it right for young children from diverse backgrounds: Applying research to improve practice. Upper Saddle River, NJ: Pearson Education, Inc.11 Burchinal, M. (2018). Measuring Early Care and Education Quality. Child Development Perspectives, 12(1), 3-9. Clements, D. H., & Sarama, J. (2008). Experimental evaluation of the
effects of a research-based preschool mathematics curriculum. American Educational Research Journal, 45, 443-494. Frede, 1998. Minervino (2014). Phillips et al. (2017). Weiland (2016). Yoshikawa et al. (2013).
12 Bowman et al. (2001). Institute of Medicine and National Research Council (2015). Transforming the workforce for children, youth through age 8. Washington, D.C.: The National Academies Press.
13 Manning, M., Garvis, S., Fleming, C., & Wong, G. T. (2017). The Relationship between Teacher Qualification and the Quality of the Early Childhood Care and Learning Environment: A Systematic Review. Campbell collaboration. Downloaded August 15, 2017 from https://www.campbellcollaboration.org/library/teacher-qualification-and-quality-of-early-childhood-care-and-learning.html
14 Bogard, K., Traylor, F., & Takanishi, R. (2008). Teacher education and PK outcomes: Are we asking the right questions?. Early Childhood Research Quarterly, 23(1), 1-6. Falenchuk, O., Perlman, M., McMullen, E., Fletcher, B., & Shah, P. S. (2017). Education of staff in preschool aged classrooms in child care centers and child outcomes: A meta-analysis and systematic review. PloS one, 12(8), e0183673. Lin, Y. C., & Magnuson, K. A. (2018). Classroom quality and children’s academic skills in child care centers: Understanding the role of teacher qualifications. Early Childhood Research Quarterly, 42, 215-227.
15 Bassok, D., Fitzpatrick, M., Greenberg, E., & Loeb, S. (2016). Within- and between-sector quality differences in early childhood education and care. Child Development, 87(5), 1627-1645.16 King, E. K., Johnson, A. V., Cassidy, D. J., Wang, Y. C., Lower, J. K., & Kintner-Duffy, V. L. (2016). Preschool teachers’ financial well-being and work time supports: Associations with
children’s emotional expressions and behaviors in classrooms. Early Childhood Education Journal, 44(6), 545-553. Whitebook, M., Phillips, D., & Howes, C. (2014). Worthy work, STILL unlivable wages: The early childhood workforce 25 years after the National Child Care Staffing Study. Berkeley, CA: Center for the Study of Child Care Employment.
17 Institute of Medicine and National Research Council (2015). Also: Bowman et al. (2001). Fukkink, R. G., & Lont, A. (2007). Does training matter? A meta-analysis and review of caregiver training studies. Early childhood research quarterly, 22(3), 294-311.
18 Early, D. M., & Winton, P. J. (2001). Preparing the workforce: Early childhood teacher preparation at 2-and 4-year institutions of higher education. Early Childhood Research Quarterly, 16(3), 285-306. Whitebook, M., & Ryan, S. (2011). Degrees in Context: Asking the Right Questions about Preparing Skilled and Effective Teachers of Young Children. Preschool Policy Brief. Issue 22. New Brunswick, NJ: National Institute for Early Education Research.
19 Bowman et al. (2001). Institute of Medicine and National Research Council (2015). Han, J., & Neuharth-Pritchett, S. (2010). Beliefs about classroom practices and teachers’ education level: An examination of developmentally appropriate and inappropriate beliefs in early childhood classrooms. Journal of Early Childhood Teacher Education, 31(4), 307-321. Heisner, M. J., & Lederberg, A. R. (2011). The impact of Child Development Associate training on the beliefs and practices of preschool teachers. Early Childhood Research Quarterly, 26(2), 227-236. Kagan, S. L., & Cohen, N. E. (1997). Not by chance: Creating an early care and education system for America’s children [Abridged report]. New Haven, CT: Bush Center in Child Development and Social Policy, Yale University.
20 Biancarosa, G., Bryk, A. S., & Dexter, E. R. (2010). Assessing the value-added effects of literacy collaborative professional development on student learning. The Elementary School Journal, 111(1), 7-34. Clements, D. H., & Sarama, J. (2008). Experimental evaluation of the effects of a research-based preschool mathematics curriculum. American Educational Research Journal, 45, 443-494. Hawley, W. & Valli, L. (1999). The essentials of effective professional development: A new consensus in L. Darling-Hammond & G. Sykes (Eds.). Teaching as the Learning Profession. Handbook of Policy and Practice, Jossey-Bass Publishers, San Francisco. Institute of Medicine and National Research Council (2015). Minervino (2014). Phillips et al. (2017). Pianta et al. (2009). Weber, R. & Trauten, M. (2008). A review of the research literature: Effective investments in child care and early education profession. Oregon State University, Family Policy Program, Oregon Childcare Research Partnership. Whitebook, M., & Bellm, D. (2013). Supporting teachers as learners: A guide for mentors and coaches in early care and education. Washington, DC: American Federation of Teachers. Weiland (2016). Yoshikawa et al. (2013).
21 Pianta, R., Downer, J., & Hamre, B. (2016). Quality in early education classrooms: Definitions, gaps, and systems. Future of Children, 26, 119-137. Weiland (2016). Yoshikawa et al. (2013).22 Bowman et al. (2001). Frede (1998). Egert, F., Fukkink, R. G., & Eckhardt, A. G. (2018). Impact of In-Service Professional Development Programs for Early Childhood Teachers on
Quality Ratings and Child Outcomes: A Meta-Analysis. Review of Educational Research, 0034654317751918. Frede (1998). Kraft, M. A., Blazar, D., & Hogan, D. (2016). The effect of teacher coaching on instruction and achievement: A meta-analysis of the causal evidence. Review of Educational Research. Landry, S. H., Anthony, J. L., Swank, P. R., & Monseque-Bailey, P. (2009). Effectiveness of comprehensive professional development for teachers of at-risk preschoolers. Journal of Educational Psychology, 101(2), 448. Rudd, L. C., Lambert, M. C., Satterwhite, M., & Smith, C. H. (2009). Professional development + coaching = enhanced teaching: Increasing usage of math mediated language in preschool classrooms. Early Childhood Education Journal, 37(1), 63-69. Whitebook, Howes, & Phillips (1989) found that teachers receiving more than 15 hours of training were more appropriate, positive, and engaged with children in their teaching practices.
23 Bowman et al. (2001). National Association for the Education of Young Children (2005). NAEYC early childhood program standards and accreditation criteria. Washington, DC: Author. NICHD Early Child Care Research Network (1999). Child outcomes when child care center classes meet recommended standards for quality. American Journal of Public Health, 89, 1072-1077. Perlman, M., Falenchuk, O., Fletcher, B., McMullen, E., Beyene, J., & Shah, P. S. (2016). A systematic review and meta-analysis of a measure of staff/child interaction quality (the classroom assessment scoring system) in early childhood education and care settings and child outcomes. PloS One, 11(12), e0167660. Reynolds, A. J., Hayakawa, M., Ou, S. R., Mondi, C. F., Englund, M. M., Candee, A. J., & Smerillo, N. E. (2017). Scaling and sustaining effective early childhood programs through school–family–university collaboration. Child Development, 88(5), 1453-1465.
24 Nye, B., Hedges, L. V., & Konstantopoulos, S. (1999). The long-term effects of small classes: A five-year follow-up of the Tennessee class size experiment. Educational Evaluation and Policy Analysis, 21(2), 127-142.
25 Evidence suggesting value to lower thresholds comes from Bowne, J., Magnuson, K. A., Schindler, H. S, Duncan, G. J., & Yoshikawa, H. (2017). A meta-analysis of class sizes and ratios in early childhood education programs: Are thresholds of quality associated with greater impacts on cognitive, achievement, and socioemotional outcomes? Education Evaluation and Policy Analysis. 39(3), 407-428.
26 Weiland, C., & Yoshikawa, H. (2013). Impacts of a prekindergarten program on children’s mathematics, language, literacy, executive function, and emotional skills. Child Development, 84(6), 2112-2130.
27 For some children, preschool provides the first opportunity to detect vision, hearing, and health problems that may impair a child’s learning and development. This opportunity should not be missed. Meisels, S. J., & Atkins-Burnett, S. (2000). The elements of early childhood assessment. In J. P. Shonkoff & S. J. Meisels (Eds.). Handbook of early childhood intervention (pp. 231-257). New York: Cambridge University Press. Tout et al. (2013).
28 Blair (2002). School readiness: Integrating cognition and emotion in a neurobiological conceptualization of children’s functioning at school entry. American Psychologist, 57, 111-127. Janus, M., & Duku, E. (2010). The school entry gap: Socioeconomic, family, and health factors associated with children’s school readiness to learn. Early Education and Development, 18, 375-403.
29 Barnett, W. S., Frede, E. C. (2017). Long-term effects of a system of high-quality universal preschool education in the United States. In Blossfeld, H.-P., Kulic, N., Skopek, J., Triventi, M. (Eds.), Childcare, early education and social inequality: An international perspective (pp. 152–172). Cheltenham, UK: Edward Elgar. Bowman et al. (2001). Derrick-Mills, T., Sandstrom, H., Pettijohn, S., Fyffe, S., & Koulish, J. (2014). Data use for continuous quality improvement: What the Head Start field can learn from other disciplines, a literature review and conceptual framework (OPRE Report 2014-77). Washington, DC: Office of Planning, Research and Evaluation, Administration for Children and Families. U.S. Department of Health and Human Services. Egert et al. (2018). Institute of Medicine and National Research Council (2015). Minervino (2014). Weiland (2016).
30
REFERENCES
Related Documents