STATE STATE the of NSW Property Report

Welcome message from author
This document is posted to help you gain knowledge. Please leave a comment to let me know what you think about it! Share it to your friends and learn new things together.
Transcript

STATESTATEtheof
N S W P r o p e r t y R e p o r t

State of the State NSW Property Report p.1
Executive Summary
St.George Bank has commissioned RP Data to undertake an analysis of the New South Wales residential property market, specifically analysing the performance of houses and units. The analysis highlights the 12 Statistical Divisions (SD) throughout the state and looks at the market performance both recently and during the last decade.
The report looks at the broad national property market trends and then moves from this macro view into a more micro view within the specific markets of New South Wales.
During the past ten years, the national property market has seen a little bit of everything: strong growth, moderate growth, flat conditions and value declines. Nationally property values have increased at an average annual rate of 9.5 percent and in comparison, Sydney property values have underperformed recording growth of 6.4 percent annually. The relatively poor performance of Sydney is related to affordability pressures and the fact that it is a much more mature property market than most other Australian capital cities.
The national property market is moving out of a strong growth phase since the beginning of 2009 and Sydney has been one of the few capital city markets to still record growth in property values over the three months to August 2010. The expectation for the remainder of 2010 is that the rate of value growth will be quite flat in the capital cities and it is anticipated that this will result in flat growth for regional areas also. Sydney property values underperformed for five and a half years and only eclipsed their January 2004 peak in May 2009. As at August 2010, Sydney property values are 12.5 percent higher than the January 2004 peak.
Typically, the regional markets have recorded greater growth in prices than the Sydney market over the last decade, however, most have come from a much lower price base and in comparison to their counterparts in other states, they have under performed.
In many instances, the regional markets of New South Wales recorded a larger slump in prices during the Global Financial Crisis (GFC) than that recorded in Sydney. Subsequently, many regions have only recently witnessed median prices returning to their pre‐GFC peaks. Median prices of both houses and units have shown some easing in recent months suggesting that the slowdown in capital city markets coupled with a higher interest rate environment is impacting these regions.
In most instances, the average number of days it takes to sell a house (days on market) and the average level of vendor discount is at, or close to, historic low levels currently. With the property price growth now slowing, it is anticipated that these lead indicators will once again begin to increase.
The higher interest rate environment and fewer active buyers is likely to swing market conditions away from sellers and more in favour of the buyers. Buyers are likely to have more purchase options and less competition for stock, as a result they are likely to have greater scope for price negotiation.
Despite the slowing market conditions, New South Wales has a growing population and an insufficient supply of new dwellings to cater demand. Over time, unless this situation can be rectified there is likely to be intensifying upward pressure on property prices.
Although the next year is likely to be characterised as having fairly flat market conditions, certain areas and regions are likely to have stronger prospects for capital growth. In Sydney, well located properties close to the CBD and working nodes with quality amenities including: shops, schools, restaurants, major roads and public transport will likely have the strongest growth prospects. In regional areas, purchasers should look for similar features however, those regions closer to Sydney such as Hunter and Illawarra are likely to have the strongest potential for growth in median prices.
State of the State NSW Property Report
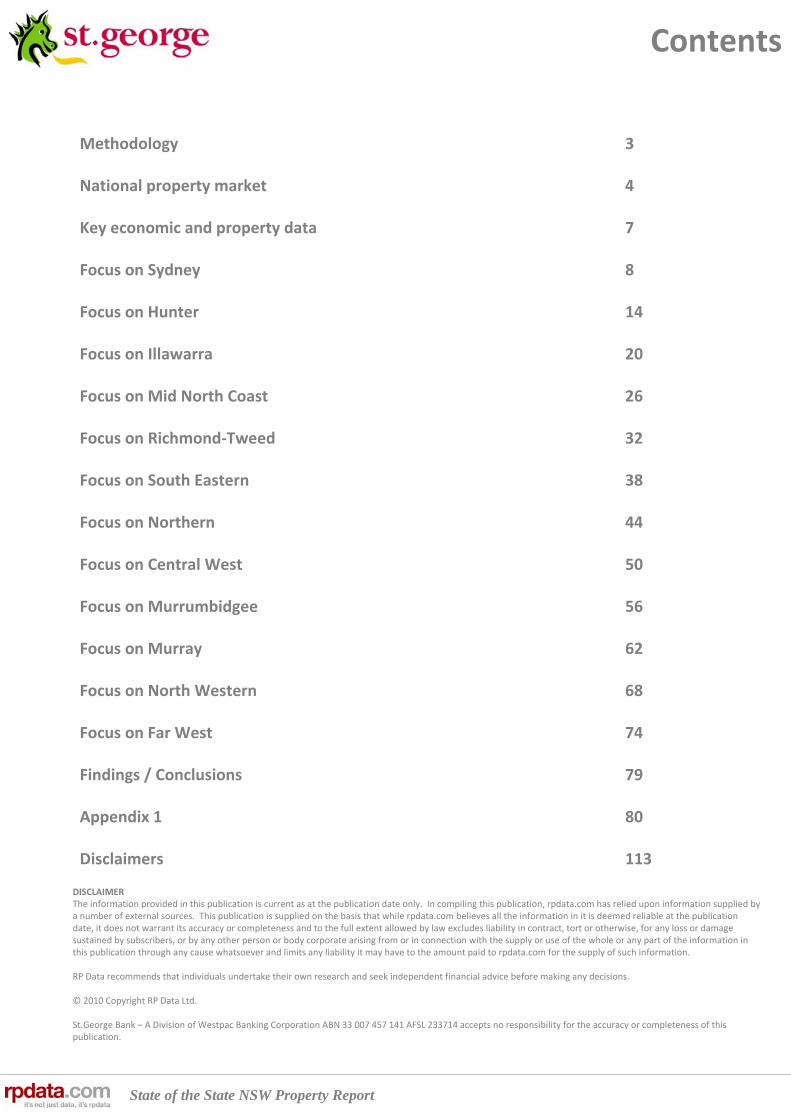
Contents
DISCLAIMERThe information provided in this publication is current as at the publication date only. In compiling this publication, rpdata.com has relied upon information supplied by a number of external sources. This publication is supplied on the basis that while rpdata.com believes all the information in it is deemed reliable at the publication date, it does not warrant its accuracy or completeness and to the full extent allowed by law excludes liability in contract, tort or otherwise, for any loss or damage sustained by subscribers, or by any other person or body corporate arising from or in connection with the supply or use of the whole or any part of the information in this publication through any cause whatsoever and limits any liability it may have to the amount paid to rpdata.com for the supply of such information.
RP Data recommends that individuals undertake their own research and seek independent financial advice before making any decisions.
© 2010 Copyright RP Data Ltd.
St.George Bank – A Division of Westpac Banking Corporation ABN 33 007 457 141 AFSL 233714 accepts no responsibility for the accuracy or completeness of this publication.
Methodology 3
National property market 4
Key economic and property data 7
Focus on Sydney 8
Focus on Hunter 14
Focus on Illawarra 20
Focus on Mid North Coast 26
Focus on Richmond‐Tweed 32
Focus on South Eastern 38
Focus on Northern 44
Focus on Central West 50
Focus on Murrumbidgee 56
Focus on Murray 62
Focus on North Western 68
Focus on Far West 74
Findings / Conclusions 79
Appendix 1 80
Disclaimers 113

State of the State NSW Property Report p.3
Methodology
1. National data is based on the RP Data‐Rismark Home Value Index. Movements in property values, sales volumes, vendor discounting and time on market are calculated on a month‐by month basis. The national results are calculated across the combined capital cities of the country and are weighted based on the total stock within each of the capital cities.
2. Sydney data is based on the RP Data‐Rismark Home Value Index. Movements in property values, sales volumes, vendor discounting and time on market are calculated on a month‐by month basis.
3. All Statistical Division (SD) median prices and sales volumes are calculated on a three month rolling basis. Other calculations such as; time on market, vendor discounting, median weekly advertised rent and indicative gross rental yield are calculated on a rolling 12 month basis.
4. All Local Government Area (LGA) and suburb based data is calculated using a rolling 12 month calculation.
5. Where there are less than 10 results for any statistic during the calculation period, the statistic is deemed to be unreliable and is therefore not reported.
State of the State NSW Property Report
Source: rpdata.com, RP Data–Rismark Stratified Hedonic Home Value Index
p.4
National property market
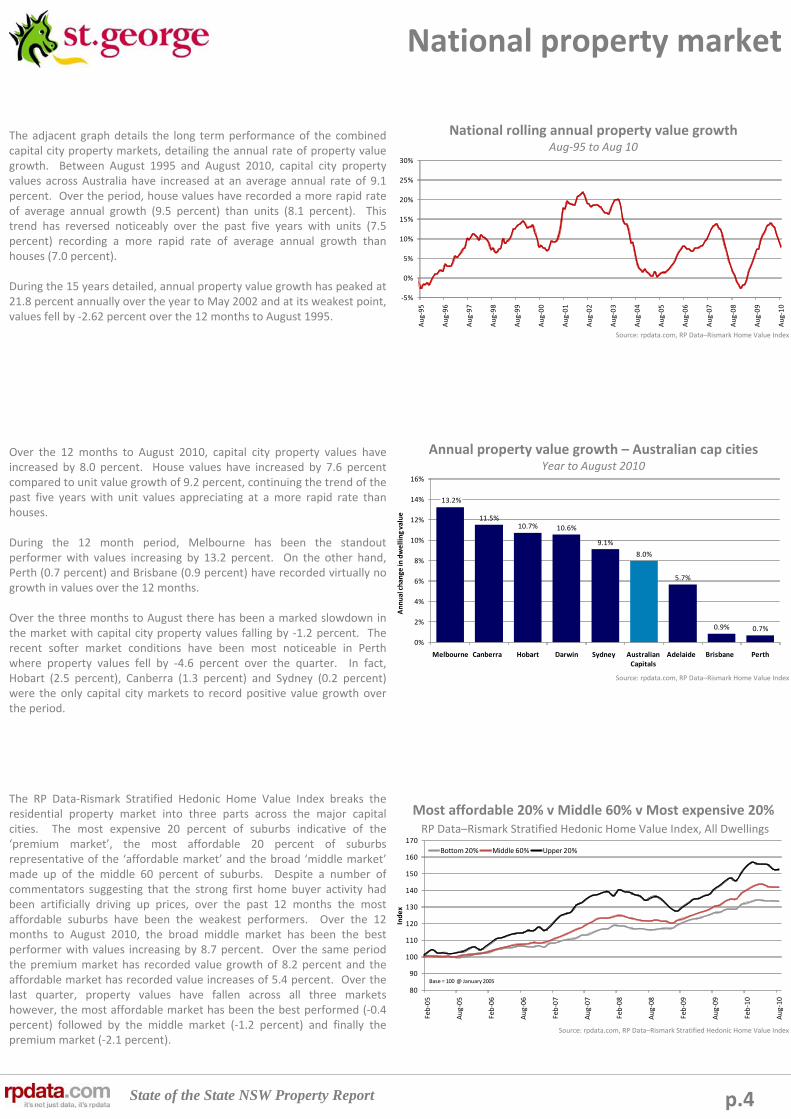
The adjacent graph details the long term performance of the combined capital city property markets, detailing the annual rate of property value growth. Between August 1995 and August 2010, capital city property values across Australia have increased at an average annual rate of 9.1 percent. Over the period, house values have recorded a more rapid rate of average annual growth (9.5 percent) than units (8.1 percent). This trend has reversed noticeably over the past five years with units (7.5 percent) recording a more rapid rate of average annual growth than houses (7.0 percent).
During the 15 years detailed, annual property value growth has peaked at 21.8 percent annually over the year to May 2002 and at its weakest point, values fell by ‐2.62 percent over the 12 months to August 1995.
Over the 12 months to August 2010, capital city property values have increased by 8.0 percent. House values have increased by 7.6 percent compared to unit value growth of 9.2 percent, continuing the trend of the past five years with unit values appreciating at a more rapid rate than houses.
During the 12 month period, Melbourne has been the standout performer with values increasing by 13.2 percent. On the other hand, Perth (0.7 percent) and Brisbane (0.9 percent) have recorded virtually no growth in values over the 12 months.
Over the three months to August there has been a marked slowdown in the market with capital city property values falling by ‐1.2 percent. The recent softer market conditions have been most noticeable in Perth where property values fell by ‐4.6 percent over the quarter. In fact, Hobart (2.5 percent), Canberra (1.3 percent) and Sydney (0.2 percent) were the only capital city markets to record positive value growth over the period.
The RP Data‐Rismark Stratified Hedonic Home Value Index breaks the residential property market into three parts across the major capital cities. The most expensive 20 percent of suburbs indicative of the ‘premium market’, the most affordable 20 percent of suburbs representative of the ‘affordable market’ and the broad ‘middle market’made up of the middle 60 percent of suburbs. Despite a number of commentators suggesting that the strong first home buyer activity had been artificially driving up prices, over the past 12 months the most affordable suburbs have been the weakest performers. Over the 12 months to August 2010, the broad middle market has been the bestperformer with values increasing by 8.7 percent. Over the same period the premium market has recorded value growth of 8.2 percent and the affordable market has recorded value increases of 5.4 percent. Over the last quarter, property values have fallen across all three markets however, the most affordable market has been the best performed (‐0.4 percent) followed by the middle market (‐1.2 percent) and finally the premium market (‐2.1 percent).
‐5%
0%
5%
10%
15%
20%
25%
30%
Aug‐95
Aug‐96
Aug‐97
Aug‐98
Aug‐99
Aug‐00
Aug‐01
Aug‐02
Aug‐03
Aug‐04
Aug‐05
Aug‐06
Aug‐07
Aug‐08
Aug‐09
Aug‐10
National rolling annual property value growthAug‐95 to Aug 10
13.2%
11.5%10.7% 10.6%
9.1%
8.0%
5.7%
0.9% 0.7%
0%
2%
4%
6%
8%
10%
12%
14%
16%
Melbourne Canberra Hobart Darwin Sydney Australian Capitals
Adelaide Brisbane Perth
Annual change
in dwelling value
Annual property value growth – Australian cap citiesYear to August 2010
80
90
100
110
120
130
140
150
160
170
Feb‐05
Aug‐05
Feb‐06
Aug‐06
Feb‐07
Aug‐07
Feb‐08
Aug‐08
Feb‐09
Aug‐09
Feb‐10
Aug‐10
Index
Bottom 20% Middle 60% Upper 20%
Base = 100 @ January 2005
Most affordable 20% v Middle 60% v Most expensive 20%RP Data–Rismark Stratified Hedonic Home Value Index, All Dwellings
Source: rpdata.com, RP Data–Rismark Home Value Index
Source: rpdata.com, RP Data–Rismark Home Value Index
State of the State NSW Property Report
0.0% 10.0% 20.0% 30.0% 40.0% 50.0%
Less than $300,000
$300,000 to $500,000
$500,000 to $700,000
$700,000 to $1m
Greater than $1mQ2 2010Q4 2008
‐10%
‐5%
0%
5%
10%
15%
20%
25%
30%
Aug‐95
Aug‐96
Aug‐97
Aug‐98
Aug‐99
Aug‐00
Aug‐01
Aug‐02
Aug‐03
Aug‐04
Aug‐05
Aug‐06
Aug‐07
Aug‐08
Aug‐09
Aug‐10
Houses Units
0
10,000
20,000
30,000
40,000
50,000
60,000
$0
$100,000
$200,000
$300,000
$400,000
$500,000
$600,000
Aug‐00
Feb‐01
Aug‐01
Feb‐02
Aug‐02
Feb‐03
Aug‐03
Feb‐04
Aug‐04
Feb‐05
Aug‐05
Feb‐06
Aug‐06
Feb‐07
Aug‐07
Feb‐08
Aug‐08
Feb‐09
Aug‐09
Feb‐10
Aug‐10
Volume of sales
RP Data‐Rismark Hedonic Index Rebased at Median Value
Month
Total sales volumes Houses Units
Note: The most recent five months worthof sales volumes are modelled based on historic levels of revision
p.5
National property market
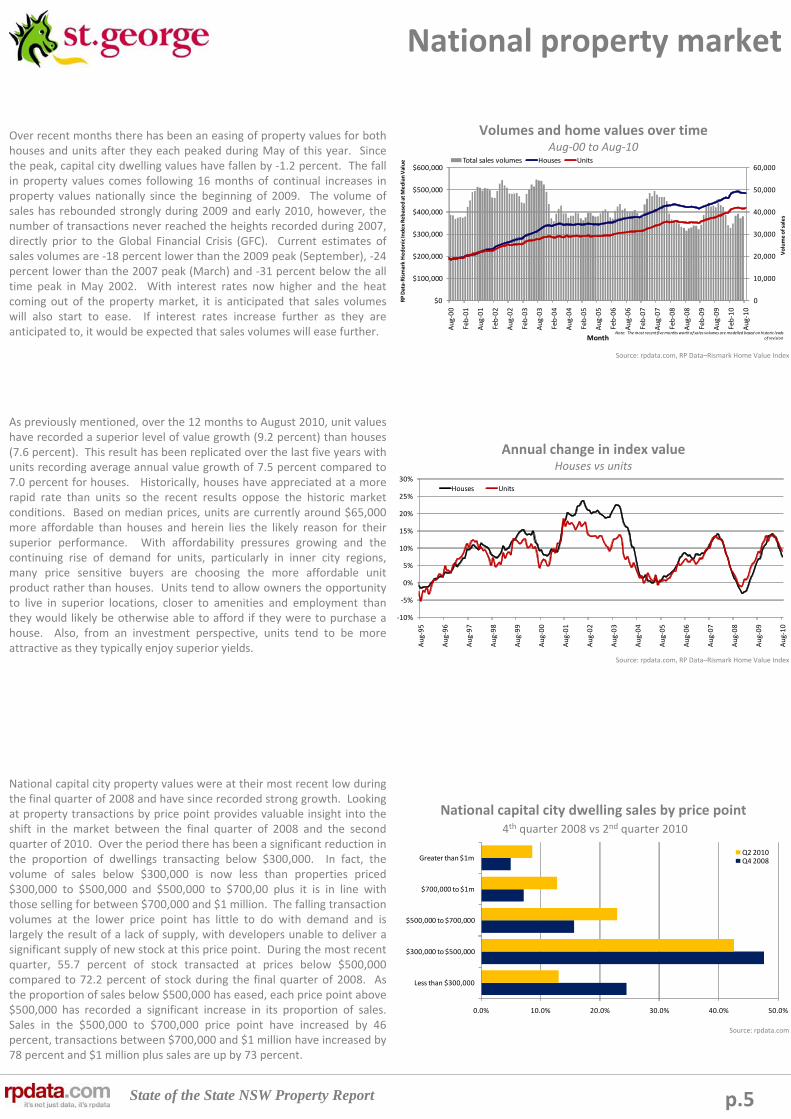
Over recent months there has been an easing of property values for both houses and units after they each peaked during May of this year. Since the peak, capital city dwelling values have fallen by ‐1.2 percent. The fall in property values comes following 16 months of continual increases in property values nationally since the beginning of 2009. The volume of sales has rebounded strongly during 2009 and early 2010, however, the number of transactions never reached the heights recorded during 2007, directly prior to the Global Financial Crisis (GFC). Current estimates of sales volumes are ‐18 percent lower than the 2009 peak (September), ‐24 percent lower than the 2007 peak (March) and ‐31 percent below the all time peak in May 2002. With interest rates now higher and the heat coming out of the property market, it is anticipated that sales volumes will also start to ease. If interest rates increase further as they are anticipated to, it would be expected that sales volumes will ease further.
As previously mentioned, over the 12 months to August 2010, unit values have recorded a superior level of value growth (9.2 percent) than houses (7.6 percent). This result has been replicated over the last five years with units recording average annual value growth of 7.5 percent compared to 7.0 percent for houses. Historically, houses have appreciated at a more rapid rate than units so the recent results oppose the historic market conditions. Based on median prices, units are currently around $65,000 more affordable than houses and herein lies the likely reason for their superior performance. With affordability pressures growing and the continuing rise of demand for units, particularly in inner city regions, many price sensitive buyers are choosing the more affordable unit product rather than houses. Units tend to allow owners the opportunity to live in superior locations, closer to amenities and employment than they would likely be otherwise able to afford if they were to purchase a house. Also, from an investment perspective, units tend to be more attractive as they typically enjoy superior yields.
National capital city property values were at their most recent low during the final quarter of 2008 and have since recorded strong growth. Looking at property transactions by price point provides valuable insight into the shift in the market between the final quarter of 2008 and the second quarter of 2010. Over the period there has been a significant reduction in the proportion of dwellings transacting below $300,000. In fact, the volume of sales below $300,000 is now less than properties priced $300,000 to $500,000 and $500,000 to $700,00 plus it is in line with those selling for between $700,000 and $1 million. The falling transaction volumes at the lower price point has little to do with demand and is largely the result of a lack of supply, with developers unable to deliver a significant supply of new stock at this price point. During the most recent quarter, 55.7 percent of stock transacted at prices below $500,000 compared to 72.2 percent of stock during the final quarter of 2008. As the proportion of sales below $500,000 has eased, each price point above $500,000 has recorded a significant increase in its proportion of sales. Sales in the $500,000 to $700,000 price point have increased by 46 percent, transactions between $700,000 and $1 million have increased by 78 percent and $1 million plus sales are up by 73 percent.
Volumes and home values over timeAug‐00 to Aug‐10
Annual change in index valueHouses vs units
National capital city dwelling sales by price point4th quarter 2008 vs 2nd quarter 2010
Source: rpdata.com
Source: rpdata.com, RP Data–Rismark Home Value Index
Source: rpdata.com, RP Data–Rismark Home Value Index

State of the State NSW Property Report
0
10
20
30
40
50
60
70
Aug‐05
Oct‐05
Dec‐05
Feb‐06
Apr‐06
Jun‐06
Aug‐06
Oct‐06
Dec‐06
Feb‐07
Apr‐07
Jun‐07
Aug‐07
Oct‐07
Dec‐07
Feb‐08
Apr‐08
Jun‐08
Aug‐08
Oct‐08
Dec‐08
Feb‐09
Apr‐09
Jun‐09
Aug‐09
Oct‐09
Dec‐09
Feb‐10
Apr‐10
Jun‐10
Aug‐10
‐8.0%
‐7.0%
‐6.0%
‐5.0%
‐4.0%
‐3.0%
‐2.0%
‐1.0%
0.0%
Aug‐05
Oct‐05
Dec‐05
Feb‐06
Apr‐06
Jun‐06
Aug‐06
Oct‐06
Dec‐06
Feb‐07
Apr‐07
Jun‐07
Aug‐07
Oct‐07
Dec‐07
Feb‐08
Apr‐08
Jun‐08
Aug‐08
Oct‐08
Dec‐08
Feb‐09
Apr‐09
Jun‐09
Aug‐09
Oct‐09
Dec‐09
Feb‐10
Apr‐10
Jun‐10
Aug‐10
3.5%
3.7%
3.9%
4.1%
4.3%
4.5%
4.7%
4.9%
5.1%
5.3%
5.5%
$260
$280
$300
$320
$340
$360
$380
$400
$420
$440
Aug‐05
Feb‐06
Aug‐06
Feb‐07
Aug‐07
Feb‐08
Aug‐08
Feb‐09
Aug‐09
Feb‐10
Aug‐10
Avg gross rental yield
Average rental rate ‐dwellings
Avg rental rate ‐ all dwellings
Avg gross yield ‐ Houses
Avg gross yield ‐ Units
p.6
National property market
Between August 2005 and December 2008, capital city median weekly rents have increased by $114/week. Since December 2008, just asproperty values once again began to increase, rental growth in the market has been virtually non existent. An extremely active first time buyer market thanks to Government incentives coupled with the lowest interest rates in almost 50 years, saw the first time buyer market record its greatest level of activity ever during 2009. As a result, upward pressure on rental rates eased and they fell or remained flat in most areas. Since September 2009 the First Home Owners Grant Boost has been rolled back and completely removed and official interest rates have been increased by 150 basis points, as a result the first home buyer market has slowed markedly. This slowdown is resulting in increasing levels of demand for rental properties and with the scepter of higher interest rates persisting, it will be even more difficult for those in the rental market to enter into home ownership. Given these prevailing market conditions it is expected that rental rates will increase over the coming 12 months.
The level of vendor discount measures the average difference between the price at which a property is initially listed and the ultimate price it sells for. Across the combined capital cities, the average vendor discount for houses is recorded at ‐5.6 percent currently and has been trending higher in recent months. The level of discounting for units has also been trending higher of late and is recorded at ‐5.5 percent. During the five years detailed, vendor discounting has been recorded at an average of ‐6.0 percent for houses and ‐5.6 percent for units. Discounting for houses has been as high as ‐7.1 percent and as low as ‐4.8 percent. For units, discounting levels peaked at ‐6.8 percent and have been as low as ‐4.1 percent. The recent increase in vendor discounting is in keeping with the slowdown in the residential property market. Typically, as the rate of value growth in the market slows, vendors take some time to adjust and vendor discounting will increase as a result. In comparison to the same time last year (when the property market was powering ahead) vendor discounting was recorded at ‐5.4 percent for houses and units. In the coming months as the market continues to slow, the level of vendor discounting may increase further.
The level of time on market measures the average period of time from when a property is first advertised for until a contract (which it ultimately sells for) is signed for that property. The figure provides a good benchmark and for potential sellers and purchasers if a property has been on the market significantly longer than these benchmarks, it may indicate that it is not appropriately priced. The average time on market is currently recorded at 45 days for houses and 38 days for units. During the five years detailed, the average time on market has been recorded at an average of 46 days for houses and 42 days for units. Over the period it has taken as much as an average of 59 days to sell a house and 53 days to sell a unit. Meanwhile, houses have sold in as short a timeframe as 39 days and 35 days for units. As with the vendor discounting figure, as the rate of property value growth in the market slows, time on market also tends to increase. Over the coming months we may also see the average time on market increase further as conditions transition. In comparison to the same time last year, the average time on market was recorded at 46 days for houses and 42 days for units.
National rental rates and gross yieldsAug‐05 to Aug‐10
Average vendor discount – capital city housesAug‐05 to Aug‐10
Average time on market – capital city housesAug‐05 to Aug‐10
Source: rpdata.com, RP Data–Rismark Home Value Index
Source: rpdata.com, RP Data–Rismark Home Value Index
Source: rpdata.com, RP Data–Rismark Home Value Index
State of the State NSW Property Report
0
5,000
10,000
15,000
20,000
25,000
Aug‐1976
Aug‐1977
Aug‐1978
Aug‐1979
Aug‐1980
Aug‐1981
Aug‐1982
Aug‐1983
Aug‐1984
Aug‐1985
Aug‐1986
Aug‐1987
Aug‐1988
Aug‐1989
Aug‐1990
Aug‐1991
Aug‐1992
Aug‐1993
Aug‐1994
Aug‐1995
Aug‐1996
Aug‐1997
Aug‐1998
Aug‐1999
Aug‐2000
Aug‐2001
Aug‐2002
Aug‐2003
Aug‐2004
Aug‐2005
Aug‐2006
Aug‐2007
Aug‐2008
Aug‐2009
Aug‐2010
Number of approvals
Total owner occupier finance commitments Rolling 6 month average
0
1,000
2,000
3,000
4,000
5,000
6,000
Aug‐1985
Jun‐1986
Apr‐1987
Feb‐1988
Dec‐1988
Oct‐1989
Aug‐1990
Jun‐1991
Apr‐1992
Feb‐1993
Dec‐1993
Oct‐1994
Aug‐1995
Jun‐1996
Apr‐1997
Feb‐1998
Dec‐1998
Oct‐1999
Aug‐2000
Jun‐2001
Apr‐2002
Feb‐2003
Dec‐2003
Oct‐2004
Aug‐2005
Jun‐2006
Apr‐2007
Feb‐2008
Dec‐2008
Oct‐2009
Aug‐2010
Total approvals
Total builing approvals Rolling 6 month average
‐5,000
0
5,000
10,000
15,000
20,000
Mar‐1982
Mar‐1983
Mar‐1984
Mar‐1985
Mar‐1986
Mar‐1987
Mar‐1988
Mar‐1989
Mar‐1990
Mar‐1991
Mar‐1992
Mar‐1993
Mar‐1994
Mar‐1995
Mar‐1996
Mar‐1997
Mar‐1998
Mar‐1999
Mar‐2000
Mar‐2001
Mar‐2002
Mar‐2003
Mar‐2004
Mar‐2005
Mar‐2006
Mar‐2007
Mar‐2008
Mar‐2009
Mar‐2010
Quarterly population growth
Natural Increase Total migration
p.7
Key economic and property data
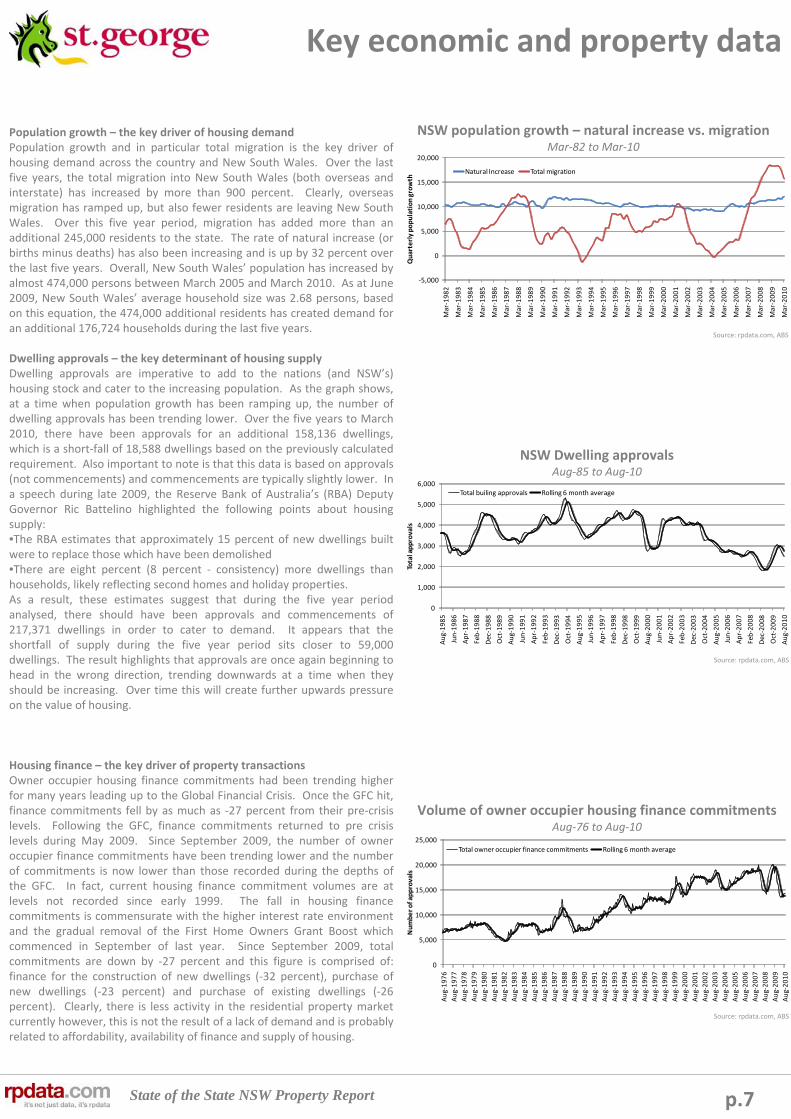
Population growth – the key driver of housing demandPopulation growth and in particular total migration is the key driver of housing demand across the country and New South Wales. Over the last five years, the total migration into New South Wales (both overseas and interstate) has increased by more than 900 percent. Clearly, overseas migration has ramped up, but also fewer residents are leaving New South Wales. Over this five year period, migration has added more than an additional 245,000 residents to the state. The rate of natural increase (or births minus deaths) has also been increasing and is up by 32 percent over the last five years. Overall, New South Wales’ population has increased by almost 474,000 persons between March 2005 and March 2010. As at June 2009, New South Wales’ average household size was 2.68 persons, based on this equation, the 474,000 additional residents has created demand for an additional 176,724 households during the last five years.
Dwelling approvals – the key determinant of housing supplyDwelling approvals are imperative to add to the nations (and NSW’s) housing stock and cater to the increasing population. As the graph shows, at a time when population growth has been ramping up, the number of dwelling approvals has been trending lower. Over the five years to March 2010, there have been approvals for an additional 158,136 dwellings, which is a short‐fall of 18,588 dwellings based on the previously calculated requirement. Also important to note is that this data is based on approvals (not commencements) and commencements are typically slightly lower. In a speech during late 2009, the Reserve Bank of Australia’s (RBA) Deputy Governor Ric Battelino highlighted the following points about housing supply:•The RBA estimates that approximately 15 percent of new dwellings built were to replace those which have been demolished •There are eight percent (8 percent ‐ consistency) more dwellings than households, likely reflecting second homes and holiday properties. As a result, these estimates suggest that during the five year periodanalysed, there should have been approvals and commencements of 217,371 dwellings in order to cater to demand. It appears that the shortfall of supply during the five year period sits closer to 59,000 dwellings. The result highlights that approvals are once again beginning to head in the wrong direction, trending downwards at a time when they should be increasing. Over time this will create further upwards pressure on the value of housing.
Housing finance – the key driver of property transactionsOwner occupier housing finance commitments had been trending higher for many years leading up to the Global Financial Crisis. Once the GFC hit, finance commitments fell by as much as ‐27 percent from their pre‐crisis levels. Following the GFC, finance commitments returned to pre crisis levels during May 2009. Since September 2009, the number of owner occupier finance commitments have been trending lower and the number of commitments is now lower than those recorded during the depths of the GFC. In fact, current housing finance commitment volumes are at levels not recorded since early 1999. The fall in housing finance commitments is commensurate with the higher interest rate environment and the gradual removal of the First Home Owners Grant Boost which commenced in September of last year. Since September 2009, total commitments are down by ‐27 percent and this figure is comprised of: finance for the construction of new dwellings (‐32 percent), purchase of new dwellings (‐23 percent) and purchase of existing dwellings (‐26 percent). Clearly, there is less activity in the residential property market currently however, this is not the result of a lack of demand and is probably related to affordability, availability of finance and supply of housing.
NSW population growth – natural increase vs. migrationMar‐82 to Mar‐10
NSW Dwelling approvalsAug‐85 to Aug‐10
Volume of owner occupier housing finance commitments Aug‐76 to Aug‐10
Source: rpdata.com, ABS
Source: rpdata.com, ABS
Source: rpdata.com, ABS
State of the State NSW Property Report
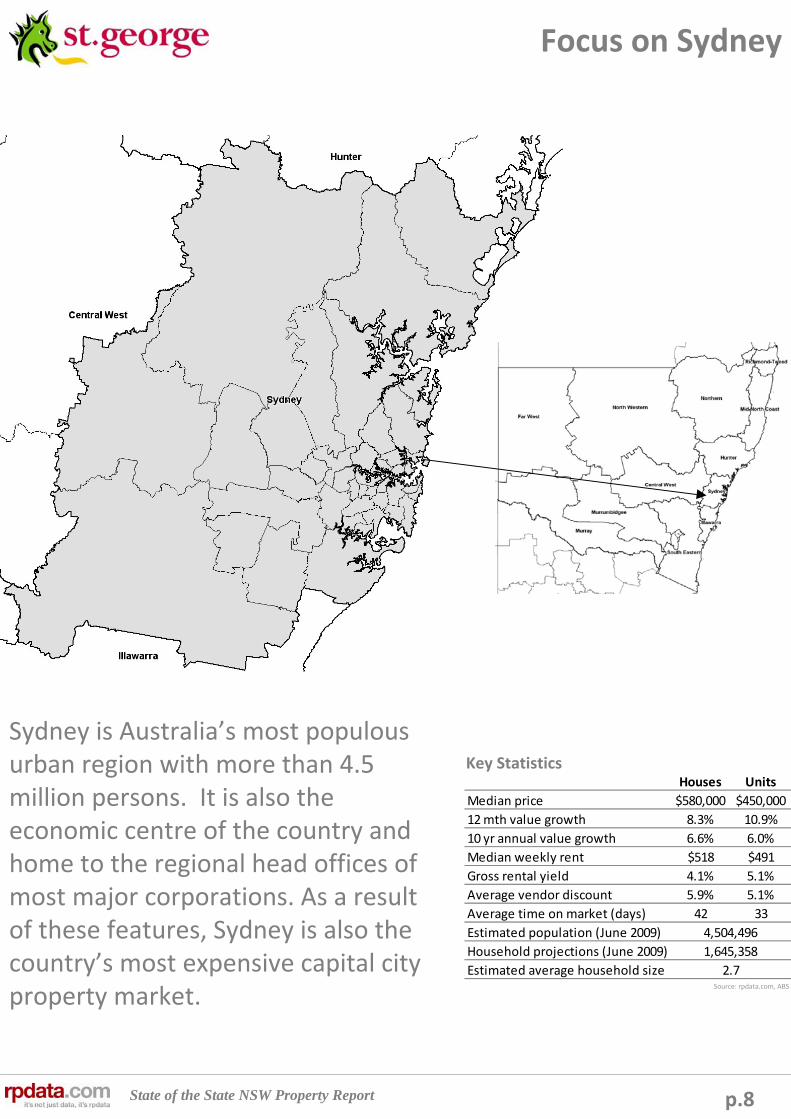
Houses Units
Median price $580,000 $450,000
12 mth value growth 8.3% 10.9%
10 yr annual value growth 6.6% 6.0%
Median weekly rent $518 $491
Gross rental yield 4.1% 5.1%
Average vendor discount 5.9% 5.1%
Average time on market (days) 42 33
Estimated population (June 2009)
Household projections (June 2009)
Estimated average household size
4,504,496
1,645,358
2.7
p.8
Focus on Sydney
Key Statistics
Sydney is Australia’s most populous urban region with more than 4.5 million persons. It is also the economic centre of the country and home to the regional head offices of most major corporations. As a result of these features, Sydney is also the country’s most expensive capital city property market.
Source: rpdata.com, ABS

State of the State NSW Property Report
80
90
100
110
120
130
140
Feb‐05
Aug‐05
Feb‐06
Aug‐06
Feb‐07
Aug‐07
Feb‐08
Aug‐08
Feb‐09
Aug‐09
Feb‐10
Aug‐10
Index
Bottom 20% Middle 60% Upper 20%
Base = 100 @ January 2005
‐10%
‐5%
0%
5%
10%
15%
20%
25%
30%
Aug‐95
Aug‐96
Aug‐97
Aug‐98
Aug‐99
Aug‐00
Aug‐01
Aug‐02
Aug‐03
Aug‐04
Aug‐05
Aug‐06
Aug‐07
Aug‐08
Aug‐09
Aug‐10
p.9
Sydney property market
The report previously detailed that the average annual rate of property value growth between August 1995 and August 2010 was 9.1 percentnationally. Sydney’s property market has underperformed the nation over that length of time, recording average annual value growth of 7.7 percent. It is important to recognise that the Sydney property market is much more mature than most of the other capital city markets. As a result, the level of value growth may not be as impressive as that of other cities where prices have typically moved from a much lower base.
Over the 15 year period highlighted, Sydney dwelling values recorded peak annual growth of 25.5 percent over the twelve months to May 2002. Meanwhile, property values fell by as much as ‐6.3 percent over the 12 months to February 2005.
Over the three months to August 2010, the rate of property value growth has shown a marked slowdown. Property values have increased by just 0.2 percent over the quarter. Putting this result in context, between the beginning of 2009 and August 2010, Sydney dwelling values have increased by a total of 18.4 percent. The result highlights that the upward pressure on property values in the market appears to be easing. This occurrence is not exclusive to Sydney, in fact, over the last quarter Sydney is one of just three capital city markets to have recorded growth in property values. The relatively strong performance of the Sydney market is due to the fact that for five and a half years there was no movement in Sydney property values and it wasn’t until mid 2009 that property values once again eclipsed their record high recorded in February 2004. From this February 2004 peak, property values fell by as much as ‐9.6 percent again highlighting the poor performance of the market between 2004 and 2009. Currently, Sydney property values are 12.5 percent higher than they were during the peak on 2004.
With value growth in all markets including Sydney slowing, it is interesting to look at the performance of individual sectors of the market. Over the 12 months to August 2010, the premium residential property market has been the best performed with values increasing by 11.3 percent. In comparison, values have increased by 10.0 percent in the middle market and by 4.8 percent in affordable suburbs. The results have been quite different over the last three months. During this period, the affordable and middle markets have recorded value growth of 0.3 percent whilst the premium market has recorded a softening in value growth of ‐0.2 percent. The premium market has tended to be a high risk high reward market over the years. For the remainder of 2010, the more affordable markets are likely to be the best performed. With the anticipation of higher interest rates next year, this will likely dampen growth at the more affordable end of the market.
Rolling annual property value growth – Sydney vs NationalAug‐95 to Aug 10
Rolling quarterly change in Sydney dwelling valuesAug‐05 to Aug‐10
‐4.0%
‐2.0%
0.0%
2.0%
4.0%
6.0%
8.0%
10.0%
Aug‐05
Oct‐05
Dec‐05
Feb‐06
Apr‐06
Jun‐06
Aug‐06
Oct‐06
Dec‐06
Feb‐07
Apr‐07
Jun‐07
Aug‐07
Oct‐07
Dec‐07
Feb‐08
Apr‐08
Jun‐08
Aug‐08
Oct‐08
Dec‐08
Feb‐09
Apr‐09
Jun‐09
Aug‐09
Oct‐09
Dec‐09
Feb‐10
Apr‐10
Jun‐10
Aug‐10
Most affordable 20% v Middle 60% v Most expensive 20%RP Data–Rismark Stratified Hedonic Home Value Index, All Dwellings
Source: rpdata.com, RP Data–Rismark Home Value Index
Source: rpdata.com, RP Data–Rismark Home Value Index
Source: rpdata.com, RP Data–Rismark Stratified Hedonic Home Value Index
State of the State NSW Property Report
0
2,000
4,000
6,000
8,000
10,000
12,000
14,000
$0
$100,000
$200,000
$300,000
$400,000
$500,000
$600,000
$700,000
Aug‐00
Feb‐01
Aug‐01
Feb‐02
Aug‐02
Feb‐03
Aug‐03
Feb‐04
Aug‐04
Feb‐05
Aug‐05
Feb‐06
Aug‐06
Feb‐07
Aug‐07
Feb‐08
Aug‐08
Feb‐09
Aug‐09
Feb‐10
Aug‐10
Volume of sales
RP Data‐Rismark Hedonic Index Rebased at Median Value
Month
Total sales volumes Houses Units
Note: The most recent five months worthof sales volumes are modelled based on historic levels of revision
0.0% 10.0% 20.0% 30.0% 40.0% 50.0%
Less than $300,000
$300,000 to $500,000
$500,000 to $700,000
$700,000 to $1m
Greater than $1mQ4 2008Q2 2010
‐10%
‐5%
0%
5%
10%
15%
20%
25%
30%
Aug‐95
Aug‐96
Aug‐97
Aug‐98
Aug‐99
Aug‐00
Aug‐01
Aug‐02
Aug‐03
Aug‐04
Aug‐05
Aug‐06
Aug‐07
Aug‐08
Aug‐09
Aug‐10
Houses Units
p.10
Sydney property market
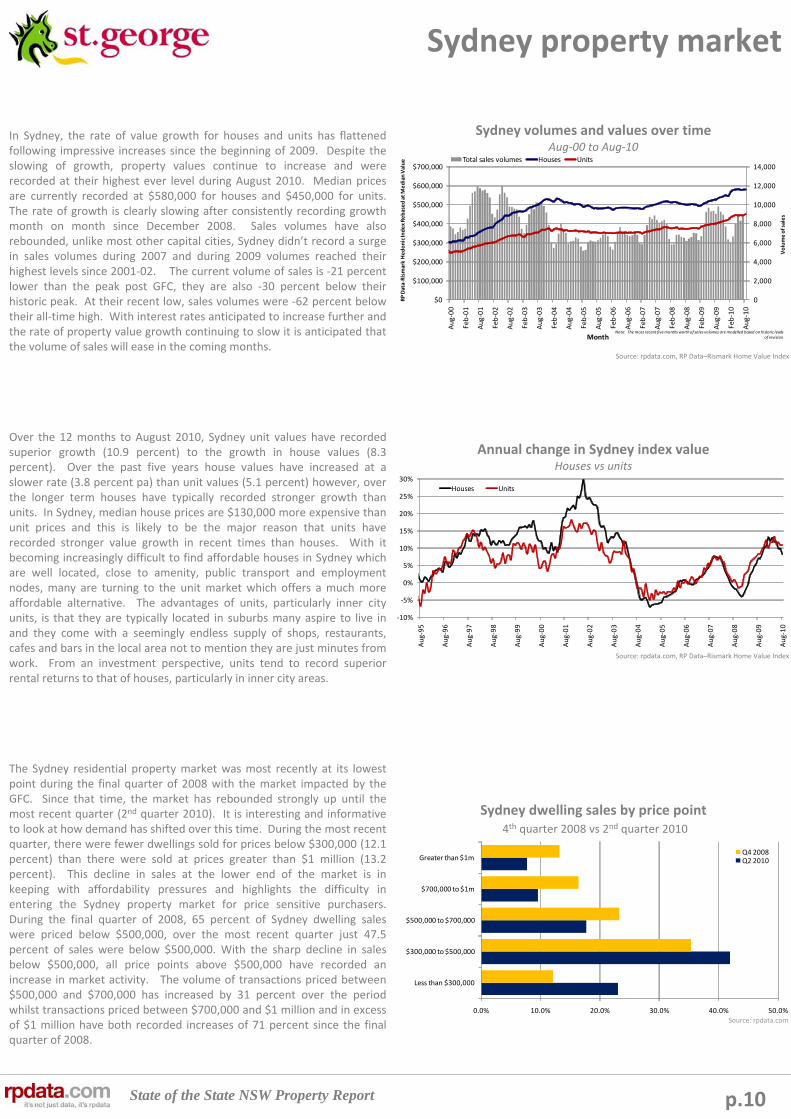
In Sydney, the rate of value growth for houses and units has flattened following impressive increases since the beginning of 2009. Despite the slowing of growth, property values continue to increase and wererecorded at their highest ever level during August 2010. Median prices are currently recorded at $580,000 for houses and $450,000 for units. The rate of growth is clearly slowing after consistently recording growth month on month since December 2008. Sales volumes have also rebounded, unlike most other capital cities, Sydney didn’t record a surge in sales volumes during 2007 and during 2009 volumes reached their highest levels since 2001‐02. The current volume of sales is ‐21 percent lower than the peak post GFC, they are also ‐30 percent below their historic peak. At their recent low, sales volumes were ‐62 percent below their all‐time high. With interest rates anticipated to increase further and the rate of property value growth continuing to slow it is anticipated that the volume of sales will ease in the coming months.
Over the 12 months to August 2010, Sydney unit values have recorded superior growth (10.9 percent) to the growth in house values (8.3 percent). Over the past five years house values have increased at a slower rate (3.8 percent pa) than unit values (5.1 percent) however, over the longer term houses have typically recorded stronger growth than units. In Sydney, median house prices are $130,000 more expensive than unit prices and this is likely to be the major reason that units have recorded stronger value growth in recent times than houses. With it becoming increasingly difficult to find affordable houses in Sydney which are well located, close to amenity, public transport and employment nodes, many are turning to the unit market which offers a much more affordable alternative. The advantages of units, particularly inner city units, is that they are typically located in suburbs many aspire to live in and they come with a seemingly endless supply of shops, restaurants, cafes and bars in the local area not to mention they are just minutes from work. From an investment perspective, units tend to record superior rental returns to that of houses, particularly in inner city areas.
The Sydney residential property market was most recently at its lowest point during the final quarter of 2008 with the market impacted by the GFC. Since that time, the market has rebounded strongly up until the most recent quarter (2nd quarter 2010). It is interesting and informative to look at how demand has shifted over this time. During the most recent quarter, there were fewer dwellings sold for prices below $300,000 (12.1 percent) than there were sold at prices greater than $1 million (13.2 percent). This decline in sales at the lower end of the market is in keeping with affordability pressures and highlights the difficulty in entering the Sydney property market for price sensitive purchasers. During the final quarter of 2008, 65 percent of Sydney dwelling sales were priced below $500,000, over the most recent quarter just 47.5 percent of sales were below $500,000. With the sharp decline in sales below $500,000, all price points above $500,000 have recorded anincrease in market activity. The volume of transactions priced between $500,000 and $700,000 has increased by 31 percent over the period whilst transactions priced between $700,000 and $1 million and in excess of $1 million have both recorded increases of 71 percent since the final quarter of 2008.
Sydney volumes and values over timeAug‐00 to Aug‐10
Annual change in Sydney index valueHouses vs units
Sydney dwelling sales by price point4th quarter 2008 vs 2nd quarter 2010
Source: rpdata.com
Source: rpdata.com, RP Data–Rismark Home Value Index
Source: rpdata.com, RP Data–Rismark Home Value Index

State of the State NSW Property Report
0
10
20
30
40
50
60
70
Aug‐05
Oct‐05
Dec‐05
Feb‐06
Apr‐06
Jun‐06
Aug‐06
Oct‐06
Dec‐06
Feb‐07
Apr‐07
Jun‐07
Aug‐07
Oct‐07
Dec‐07
Feb‐08
Apr‐08
Jun‐08
Aug‐08
Oct‐08
Dec‐08
Feb‐09
Apr‐09
Jun‐09
Aug‐09
Oct‐09
Dec‐09
Feb‐10
Apr‐10
Jun‐10
Aug‐10
‐10.0%
‐9.0%
‐8.0%
‐7.0%
‐6.0%
‐5.0%
‐4.0%
‐3.0%
‐2.0%
‐1.0%
0.0%
Aug‐05
Oct‐05
Dec‐05
Feb‐06
Apr‐06
Jun‐06
Aug‐06
Oct‐06
Dec‐06
Feb‐07
Apr‐07
Jun‐07
Aug‐07
Oct‐07
Dec‐07
Feb‐08
Apr‐08
Jun‐08
Aug‐08
Oct‐08
Dec‐08
Feb‐09
Apr‐09
Jun‐09
Aug‐09
Oct‐09
Dec‐09
Feb‐10
Apr‐10
Jun‐10
Aug‐10
3.7%
4.2%
4.7%
5.2%
5.7%
6.2%
$350
$370
$390
$410
$430
$450
$470
$490
$510
$530
Aug‐05
Feb‐06
Aug‐06
Feb‐07
Aug‐07
Feb‐08
Aug‐08
Feb‐09
Aug‐09
Feb‐10
Aug‐10
Avg gross rental yield
Average rental rate ‐dwellings
Avg rental rate ‐ all dwellings
Avg gross yield ‐ Houses
Avg gross yield ‐ Units
p.11
Sydney property market
Between August 2005 and February 2009, Sydney’s median weekly rents increased by $143. Since rents reached $520/week in February 2010 they have not risen any higher and there have been some falls in rental rates. Similar to the national market, low interest rates, an active first home buyer market and property value falls during 2008 made property purchase quite attractive through 2009 with the greatest number of first home buyers in history. As a result, the upward pressure on rental rates eased. Now that official interest rates have increased by 150 basis points and are anticipated to increase further and the additional stimulus for first home buyers has been removed, the expectation is that there will be increased pressure on rental markets with fewer renters able to enter into home ownership. Given this, we expect to see increases in rental rates over the coming months which will be welcome news for landlords but not so for those in the rental market. With rental growth returning and property value growth flat, we expect to also see rental yields improve over the coming months after recording steep declines asproperty values have increased at a faster pace than rental markets in recent times.
Throughout Greater Sydney, the level of vendor discounting remains at levels well below the historic norm between 2005 and 2008, a time when the Sydney property market was well and truly underperforming in terms of value growth. Over recent months there has been a slight increase in the level of vendor discounting for houses, however, unit discounts have shown minimal change. Currently, the average level of vendor discounting for houses is recorded at ‐5.9 percent and units are at a much lower ‐5.1 percent. At the same time last year, the level of vendor discounting was recorded at ‐5.7 percent for houses and ‐4.9 percent for units. Over the five years analysed, vendor discounting has been recorded at an average of ‐6.8 percent for houses and ‐6.0 percent for units. With the market’s rate of property value growth slowing, albeit at not as significant a level in Sydney, the market will likely record some further increases to the level of vendor discounting, especially if interest rates are increased further.
Across Sydney, like vendor discounting levels, the average time on market is well below those levels typically recorded over the period between 2005 and 2008, indicating just how poorly the market was performing during this time. Also like vendor discounting, there has been a slight increase in the average time on market in recent month (for houses and units this time). The current average time on market for houses is recorded at 42 days for houses and 33 days for units. At the same time last year when the market was arguably stronger, the average time on market for houses was 45 days and for units it was 39 days. Over the period highlighted, time on market has recorded an average of 51 days for houses and 46 days for units. As with vendor discounting, with the heat coming out of the residential property market and expectations of higher interest rates, in coming months we anticipate that the average time on market will increase further.
Sydney rental rates and gross yieldsAug‐05 to Aug‐10
Average vendor discount – Sydney housesAug‐05 to Aug‐10
Average time on market – Sydney housesAug‐05 to Aug‐10
Source: rpdata.com, RP Data–Rismark Home Value Index
Source: rpdata.com, RP Data–Rismark Home Value Index
Source: rpdata.com, RP Data–Rismark Home Value Index

State of the State NSW Property Report
Suburb Median price Median rent Rental yield
North St Marys $273,000 $350 6.7%
Warragamba $249,000 $318 6.6%
Willmot $220,000 $280 6.6%
Miller $275,000 $350 6.6%
Chain Valley Bay $269,000 $340 6.6%
Lethbridge Park $225,000 $283 6.5%
Tregear $225,000 $280 6.5%
Bidwill $241,250 $300 6.5%
Tuggerawong $286,000 $355 6.5%
Whalan $242,000 $300 6.4%
Suburb Number sold Median price 12 month growth
Willmot 35 $220,000 9.5%
Tregear 46 $225,000 7.1%
Lethbridge Park 55 $225,000 4.7%
Emerton 23 $234,000 7.1%
Blackett 38 $239,500 8.9%
Bidwill 26 $241,250 0.5%
Whalan 68 $242,000 10.0%
Warragamba 38 $249,000 ‐0.4%
San Remo 87 $260,000 11.8%
Gorokan 168 $260,000 6.1%
Suburb Number sold Median price 12 month growth
Woolwich 12 $4,230,000 0.0%
Bellevue Hill 84 $3,910,000 25.2%
Vaucluse 97 $3,800,000 16.3%
Dover Heights 42 $2,650,000 9.4%
Tamarama 12 $2,575,000 17.0%
Palm Beach 50 $2,550,000 8.5%
Rose Bay 65 $2,400,000 49.5%
Clontarf 30 $2,312,500 ‐5.6%
Double Bay 32 $2,300,000 ‐12.9%
Kangaroo Point 12 $2,297,500 0.0%
Suburb Number sold Median price 12 month growth
Rose Bay 65 $2,400,000 49.5%
Kensington 52 $1,715,000 42.9%
Malabar 45 $1,290,000 36.5%
Bondi Junction 85 $1,226,000 36.2%
South Coogee 42 $1,695,000 35.6%
Darlington 41 $735,000 35.6%
Balmain 181 $1,180,000 34.4%
Queens Park 52 $1,750,000 33.6%
Woolloomooloo 13 $814,000 33.4%
Wollstonecraft 13 $1,800,000 33.3%
p.12
Top performing suburbs ‐ houses
Suburb Median Price Median Rent Rental Growth
St Huberts Island $745,000 $528 50.7%
Middle Cove $1,142,000 $1,050 50.0%
Yowie Bay $946,500 $860 43.3%
Waverton $1,610,000 $975 42.3%
Wyongah $300,000 $300 39.5%
Tuggerawong $286,000 $355 36.5%
Macmasters Beach $600,000 $435 35.9%
Bullaburra $315,000 $310 34.8%
Potts Point $784,000 $575 32.2%
Charmhaven $308,000 $290 31.8%
Greatest annual growth in median prices Greatest median prices
Most affordable median prices Highest indicative gross rental yields
Greatest growth in median rents

State of the State NSW Property Report
Suburb Median price Median rent Rental growth
Condell Park $385,000 $435 52.6%
Glenfield $238,500 $295 40.5%
Dural $455,000 $450 36.4%
Carramar $197,000 $260 30.0%
West Pennant Hills $585,000 $450 28.6%
Beecroft $525,000 $460 24.3%
Lavender Bay $600,000 $588 23.7%
Moorebank $325,000 $370 23.3%
Cambridge Park $275,500 $340 21.4%
Glenmore Park $365,000 $375 21.0%
Suburb Median price Median rent Rental yield
Ultimo $302,500 $468 8.0%
Bradbury $202,250 $273 7.0%
Carramar $197,000 $260 6.9%
Lakemba $228,250 $300 6.8%
Punchbowl $245,000 $320 6.8%
Wetherill Park $302,500 $390 6.7%
Mount Druitt $225,000 $290 6.7%
Werrington $225,000 $290 6.7%
Fairfield $245,000 $310 6.6%
The Entrance North $245,100 $310 6.6%
Suburb Number sold Median price 12 month growth
Vineyard 14 $136,500 n.a.
Carramar 53 $197,000 23.1%
Berkeley Vale 41 $198,000 ‐10.0%
Bradbury 28 $202,250 ‐23.5%
Warwick Farm 114 $210,000 18.6%
Minto 37 $210,000 1.9%
Leumeah 59 $210,000 ‐22.2%
Gorokan 31 $211,000 3.9%
Cabramatta 253 $220,000 14.6%
Ambarvale 22 $220,000 12.8%
Suburb Number sold Median price 12 month growth
Dawes Point 17 $1,750,000 29.6%
Point Piper 24 $1,640,000 n.a.
Milsons Point 72 $1,217,500 n.a.
Tamarama 23 $1,000,000 46.5%
Darling Point 71 $985,000 ‐33.2%
Cremorne Point 48 $960,000 34.7%
Little Bay 24 $949,500 31.9%
Millers Point 69 $875,000 11.1%
Huntleys Cove 35 $870,000 38.6%
Cabarita 19 $870,000 10.4%
Suburb Number sold Median price 12 month growth
Enmore 21 $445,000 48.3%
Tamarama 23 $1,000,000 46.5%
Huntleys Cove 35 $870,000 38.6%
Rushcutters Bay 109 $487,000 38.2%
Ramsgate Beach 33 $490,000 36.5%
Bateau Bay 22 $300,000 36.4%
Cremorne Point 48 $960,000 34.7%
Bondi Junction 171 $615,000 32.3%
Little Bay 24 $949,500 31.9%
Darlington 12 $427,500 31.0%
p.13
Top performing suburbs – units
Greatest annual growth in median prices Greatest median prices
Most affordable median prices Highest indicative gross rental yields
Greatest growth in median rents
State of the State NSW Property Report
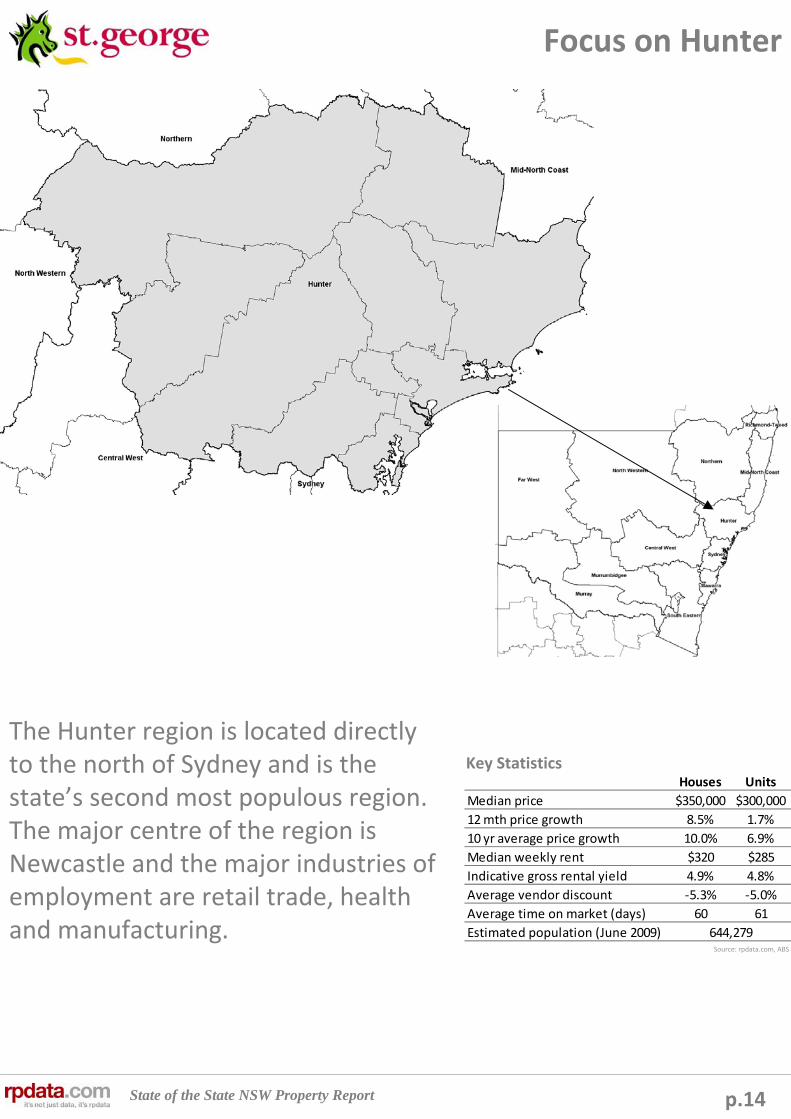
Houses Units
Median price $350,000 $300,000
12 mth price growth 8.5% 1.7%
10 yr average price growth 10.0% 6.9%
Median weekly rent $320 $285
Indicative gross rental yield 4.9% 4.8%
Average vendor discount ‐5.3% ‐5.0%
Average time on market (days) 60 61
Estimated population (June 2009) 644,279
p.14
Focus on Hunter
Key Statistics
The Hunter region is located directly to the north of Sydney and is the state’s second most populous region. The major centre of the region is Newcastle and the major industries of employment are retail trade, health and manufacturing.
Source: rpdata.com, ABS

State of the State NSW Property Report
3.5%
3.7%
3.9%
4.1%
4.3%
4.5%
4.7%
4.9%
5.1%
Sep‐05
Nov‐05
Jan‐06
Mar‐06
May‐06
Jul‐06
Sep‐06
Nov‐06
Jan‐07
Mar‐07
May‐07
Jul‐07
Sep‐07
Nov‐07
Jan‐08
Mar‐08
May‐08
Jul‐08
Sep‐08
Nov‐08
Jan‐09
Mar‐09
May‐09
Jul‐09
Sep‐09
Nov‐09
Jan‐10
Mar‐10
May‐10
Jul‐10
Houses Units
0
1,000
2,000
3,000
4,000
5,000
6,000
$0
$50,000
$100,000
$150,000
$200,000
$250,000
$300,000
$350,000
$400,000
Jul‐00
Jan‐01
Jul‐01
Jan‐02
Jul‐02
Jan‐03
Jul‐03
Jan‐04
Jul‐04
Jan‐05
Jul‐05
Jan‐06
Jul‐06
Jan‐07
Jul‐07
Jan‐08
Jul‐08
Jan‐09
Jul‐09
Jan‐10
Jul‐10
Rolling quarterly volume of sales
Median price
Quarterly volume of sales Houses Units
p.15
Hunter property market
Throughout the Hunter region, house prices have increased at an average annual rate of 10.0 percent during the last decade compared with unit growth of 6.9 percent annually. During the last 12 months, median price growth has been at below average levels with houses increasing by 8.5 percent and units by just 1.7 percent. The current median house price throughout the region is recorded at $350,000 and the median unit price is recorded at $300,000. Median house prices are currently at their historic high whilst median unit prices are ‐6.3 percent below their peak of $320,000. Sales volumes across the Hunter region have been below their all‐time peak since mid 2002, however, there was an improvement during 2009. Evidence suggests that sales volumes are softening once more and we expect that the easing will continue for the remainder of the year. Like most regional areas of the country, the Hunter region’s rebound out of the GFC has not been as strong as that recorded in the capital city markets with property price growth improving, it is still lagging that of Sydney.
Unlike most regions across Australia, median weekly rents in the Hunter region have continued to increase since the post GFC recovery. Between September 2005 and July 2010, median weekly rents have increased by a total of $100 for houses and $75 for units. Currently, median weekly rents are recorded at $320 for houses and $285 for units. Over the last 12 months, median weekly rents have increased by 8.5 percent forhouses and 5.6 percent for units indicating that rental demand is still quite strong within the region. The Hunter region takes in quite a vast area and includes coastal tourism areas, mining and resource regions and farming and agricultural. Across the region, rents have continued to increase but this doesn’t necessarily reflect the performance within individual markets. Moving forward, major regional centres such as Newcastle and mining regions are likely to be best positioned for further increases to rental rates.
With the rate of property price growth across the region quite sluggish over the past year, indicative gross rental yields have been flat over the period. Indicative gross rental yields are recorded at 4.9 percent for houses and 4.8 percent for units. At the same time last year, yields were at the same levels for houses and units. The indicative gross rental yield for houses is quite high potentially making investment attractive whereas unit yields sit below that of houses. Over the last couple of months, yields have been improving at a time when there has been minimalgrowth in property prices. Over the next year, the best prospects for a quality investment return are likely to be those properties in mining areas of the region or those well located, close to the centre of major population centres such as Newcastle. Also look to areas which attract strong rental demand due to their location close to working nodes or close to universities.
Hunter sales volumes and median prices over timeJul‐00 to Jul‐10
Hunter region median weekly advertised rentsSep‐05 to Jul‐10
Hunter indicative gross rental yieldsSep‐05 to Jul‐10
$200
$220
$240
$260
$280
$300
$320
$340
Sep‐05
Nov‐05
Jan‐06
Mar‐06
May‐06
Jul‐06
Sep‐06
Nov‐06
Jan‐07
Mar‐07
May‐07
Jul‐07
Sep‐07
Nov‐07
Jan‐08
Mar‐08
May‐08
Jul‐08
Sep‐08
Nov‐08
Jan‐09
Mar‐09
May‐09
Jul‐09
Sep‐09
Nov‐09
Jan‐10
Mar‐10
May‐10
Jul‐10
Median weekly advertised rent
Houses Units
Source: rpdata.com
Source: rpdata.com
Source: rpdata.com

State of the State NSW Property Report
‐9.0%
‐8.0%
‐7.0%
‐6.0%
‐5.0%
‐4.0%
‐3.0%
‐2.0%
‐1.0%
0.0%
Jul‐04
Oct‐04
Jan‐05
Apr‐05
Jul‐05
Oct‐05
Jan‐06
Apr‐06
Jul‐06
Oct‐06
Jan‐07
Apr‐07
Jul‐07
Oct‐07
Jan‐08
Apr‐08
Jul‐08
Oct‐08
Jan‐09
Apr‐09
Jul‐09
Oct‐09
Jan‐10
Apr‐10
Jul‐10
‐9.0%
‐8.0%
‐7.0%
‐6.0%
‐5.0%
‐4.0%
‐3.0%
‐2.0%
‐1.0%
0.0%
Jul‐04
Oct‐04
Jan‐05
Apr‐05
Jul‐05
Oct‐05
Jan‐06
Apr‐06
Jul‐06
Oct‐06
Jan‐07
Apr‐07
Jul‐07
Oct‐07
Jan‐08
Apr‐08
Jul‐08
Oct‐08
Jan‐09
Apr‐09
Jul‐09
Oct‐09
Jan‐10
Apr‐10
Jul‐10
0102030405060708090
100
Jul‐04
Oct‐04
Jan‐05
Apr‐05
Jul‐05
Oct‐05
Jan‐06
Apr‐06
Jul‐06
Oct‐06
Jan‐07
Apr‐07
Jul‐07
Oct‐07
Jan‐08
Apr‐08
Jul‐08
Oct‐08
Jan‐09
Apr‐09
Jul‐09
Oct‐09
Jan‐10
Apr‐10
Jul‐10
0
10
20
30
40
50
60
70
80
90
Jul‐04
Oct‐04
Jan‐05
Apr‐05
Jul‐05
Oct‐05
Jan‐06
Apr‐06
Jul‐06
Oct‐06
Jan‐07
Apr‐07
Jul‐07
Oct‐07
Jan‐08
Apr‐08
Jul‐08
Oct‐08
Jan‐09
Apr‐09
Jul‐09
Oct‐09
Jan‐10
Apr‐10
Jul‐10
p.16
Hunter property market
The adjacent graphs detail the level of vendor discounting across the Hunter region for houses (blue) and units (grey).
The level of vendor discounting for houses within the Hunter region is currently recorded at it’s lowest level between July 2004 and July 2010. Vendor discounting is recorded at ‐5.2 percent and in comparison to 12 months previous when discounting was recorded at ‐6.4 percent, the level of negotiation required by those selling houses has declined markedly over the last 12 months. Vendor discounting for housesreached its highest level of ‐8.4 percent during early 2005. Over the six year period vendor discounting has been recorded at an average of ‐7.0 percent.
Unit discounting levels are also recorded at their lowest level over the period analysed. Currently, the average level of vendor discounting sits at ‐4.5 percent and 12 months ago it was recorded at ‐6.0 percent, again indicating that the level of price negotiation has declined during the last year as market conditions have improved. At its peak, the level of vendor discounting for units was recorded at ‐8.1 percent during late 2005. The average vendor discounting during the last six years has been recorded at ‐6.4 percent, much lower than the long‐term average for houses.
The adjacent graphs detail the average time on market for property sales across the Hunter region for houses (blue) and units (grey).
The average time on market for houses across the Hunter region has recorded a noticeable easing in recent times and is currently recorded at its historic low level. Currently, it takes an average of 60 days to sell a house across the region and in comparison, it took an average of 73 days to sell just 12 months ago. The average time on market was recorded at as much as 85 days back in 2005, in recent times the average time on market was as high as 83 days in November of 2008. Over the period houses have taken an average of 77 days to sell.
Throughout the Hunter region the unit market has recorded a similar decline in the average time on market over recent times to that of houses. Units are selling quicker than any other time throughout the period. Units are currently selling after an average of 61 days and at the same time last year it was taking 78 days. At their peak, units took an average of 90 days to sell in June 2006 more recently, the average time on market for units reached as high as 85 days during late 2008. Units have recorded an average time on market of 81 days over the six year period.
The results for vendor discounting and time on market indicate that the residential property market’s performance has been improving which is confirmed by the growth in property prices over the past year. With capital city property value growth slowing in recent months and the likelihood of higher interest rates over the coming months we would expect that there is likely to be an increase in both lead indicators over the coming months.
Hunter region level of vendor discountingJul‐04 to Jul‐10
Hunter region average time on marketJul‐04 to Jul‐10
Source: rpdata.com
Source: rpdata.com
Houses
Units
Houses
Units
State of the State NSW Property Report p.17
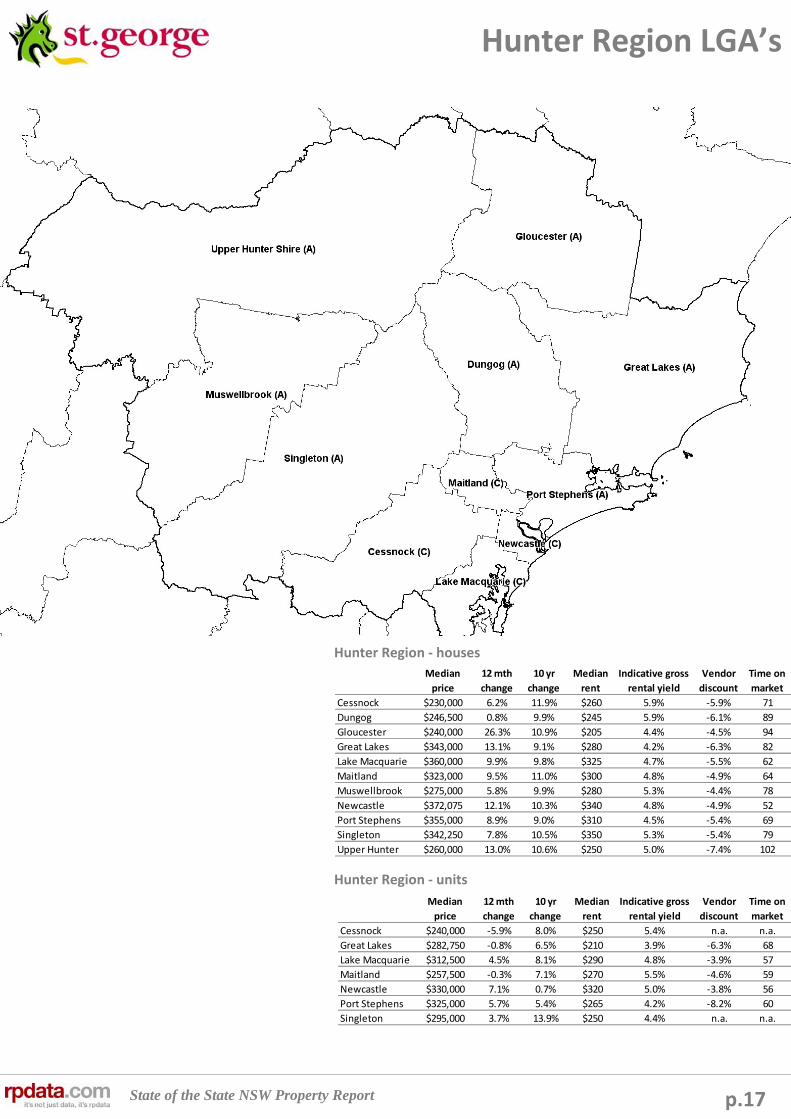
Hunter Region LGA’s
Median
price
12 mth
change
10 yr
change
Median
rent
Indicative gross
rental yield
Vendor
discount
Time on
market
Cessnock $240,000 ‐5.9% 8.0% $250 5.4% n.a. n.a.
Great Lakes $282,750 ‐0.8% 6.5% $210 3.9% ‐6.3% 68
Lake Macquarie $312,500 4.5% 8.1% $290 4.8% ‐3.9% 57
Maitland $257,500 ‐0.3% 7.1% $270 5.5% ‐4.6% 59
Newcastle $330,000 7.1% 0.7% $320 5.0% ‐3.8% 56
Port Stephens $325,000 5.7% 5.4% $265 4.2% ‐8.2% 60
Singleton $295,000 3.7% 13.9% $250 4.4% n.a. n.a.
Hunter Region ‐ houses
Hunter Region ‐ units
Median
price
12 mth
change
10 yr
change
Median
rent
Indicative gross
rental yield
Vendor
discount
Time on
market
Cessnock $230,000 6.2% 11.9% $260 5.9% ‐5.9% 71
Dungog $246,500 0.8% 9.9% $245 5.9% ‐6.1% 89
Gloucester $240,000 26.3% 10.9% $205 4.4% ‐4.5% 94
Great Lakes $343,000 13.1% 9.1% $280 4.2% ‐6.3% 82
Lake Macquarie $360,000 9.9% 9.8% $325 4.7% ‐5.5% 62
Maitland $323,000 9.5% 11.0% $300 4.8% ‐4.9% 64
Muswellbrook $275,000 5.8% 9.9% $280 5.3% ‐4.4% 78
Newcastle $372,075 12.1% 10.3% $340 4.8% ‐4.9% 52
Port Stephens $355,000 8.9% 9.0% $310 4.5% ‐5.4% 69
Singleton $342,250 7.8% 10.5% $350 5.3% ‐5.4% 79
Upper Hunter $260,000 13.0% 10.6% $250 5.0% ‐7.4% 102

State of the State NSW Property Report
Suburb Median price Median rent Rental growth
Denman $271,500 $350 37.3%
Abermain $195,000 $250 35.1%
The Junction $565,000 $418 30.5%
Greta $266,000 $330 26.9%
Mallabula $299,000 $330 26.9%
Hamilton North $350,000 $380 24.6%
Lorn $487,500 $368 24.6%
Shortland $277,500 $305 22.0%
Warabrook $440,000 $365 21.7%
Bellbird $220,000 $268 21.6%
Suburb Median price Median rent Rental yield
Windale $210,500 $285 7.0%
Denman $271,500 $350 6.7%
Abermain $195,000 $250 6.7%
Branxton $270,000 $345 6.6%
Greta $266,000 $330 6.5%
Kurri Kurri $220,000 $270 6.4%
Bellbird $220,000 $268 6.3%
West Wallsend $268,000 $310 6.0%
Cessnock $217,000 $250 6.0%
Weston $225,000 $258 6.0%
Suburb Number sold Median price 12 month growth
Murrurundi 11 $130,000 ‐7.8%
Coomba Park 14 $170,500 ‐14.5%
Merriwa 17 $177,000 14.2%
Stanford Merthyr 11 $190,000 0.0%
Abermain 34 $195,000 ‐7.1%
Bulahdelah 17 $210,000 5.0%
Windale 40 $210,500 13.8%
Kearsley 12 $212,500 13.3%
Cessnock 235 $217,000 0.9%
Kurri Kurri 92 $220,000 3.8%
Suburb Number sold Median price 12 month growth
Bar Beach 13 $1,250,000 0.0%
The Hill 14 $880,750 1.7%
Newcastle East 10 $725,000 0.0%
Hamilton East 17 $720,000 12.1%
Merewether 202 $681,186 6.2%
Rothbury 12 $646,000 0.0%
Hamilton South 45 $632,000 18.7%
Newcastle 14 $600,000 3.6%
Redhead 45 $580,000 6.7%
Merewether Heights 22 $578,750 16.3%
Suburb Number sold Median price 12 month growth
Lorn 18 $487,500 43.4%
Dudley 26 $527,500 36.3%
Maitland 37 $300,000 33.3%
Morpeth 22 $400,000 32.5%
Mallabula 15 $299,000 32.3%
Karuah 22 $288,750 31.3%
Morisset Park 25 $458,000 30.3%
Millfield 11 $225,000 28.6%
Garden Suburb 33 $510,000 27.5%
Balmoral 17 $378,000 26.4%
p.18
Top performing suburbs – houses
Greatest annual growth in median prices Greatest median prices
Most affordable median prices Highest indicative gross rental yields
Greatest growth in median rents
State of the State NSW Property Report
Suburb Median price Median rent Rental growth
Toronto $290,000 $363 34.3%
Tea Gardens $315,000 $330 32.0%
Corlette $340,000 $343 22.3%
Fingal Bay $357,000 $295 19.2%
Mayfield $258,000 $305 17.3%
Singleton $197,750 $250 13.6%
Charlestown $320,000 $305 13.0%
Maryville $535,000 $450 12.5%
Marks Point $241,250 $280 12.0%
Elermore Vale $320,000 $285 11.8%
Suburb Median price Median rent Rental yield
Singleton $197,750 $250 6.6%
Toronto $290,000 $363 6.5%
Raymond Terrace $200,000 $240 6.2%
Mayfield $258,000 $305 6.1%
Bar Beach $290,000 $340 6.1%
Marks Point $241,250 $280 6.0%
Metford $225,000 $255 5.9%
Cardiff $229,975 $260 5.9%
Cessnock $212,500 $240 5.9%
Rutherford $254,000 $283 5.8%
Suburb Number sold Median price 12 month growth
Singleton 10 $197,750 ‐4.8%
Raymond Terrace 38 $200,000 5.3%
Cessnock 17 $212,500 ‐19.8%
Singleton Heights 12 $224,000 ‐6.7%
Metford 13 $225,000 n.a.
Cardiff 12 $229,975 1.3%
East Maitland 46 $238,000 3.5%
Marks Point 14 $241,250 4.0%
Georgetown 11 $244,500 n.a.
Kurri Kurri 28 $245,000 ‐3.9%
Suburb Number sold Median price 12 month growth
Newcastle East 21 $670,000 ‐3.7%
Maryville 23 $535,000 3.8%
Soldiers Point 30 $480,500 38.5%
Newcastle 156 $452,500 14.6%
Warners Bay 64 $420,000 15.5%
Newcastle West 28 $403,750 29.4%
Carrington 24 $399,500 n.a.
Hamilton 22 $387,500 5.3%
Speers Point 11 $378,000 n.a.
Belmont 28 $372,500 4.9%
Suburb Number sold Median price 12 month growth
Soldiers Point 30 $480,500 38.5%
Waratah 24 $320,000 30.9%
Newcastle West 28 $403,750 29.4%
Jesmond 21 $269,950 21.1%
Islington 23 $364,000 17.4%
Merewether 97 $340,000 15.7%
Warners Bay 64 $420,000 15.5%
Newcastle 156 $452,500 14.6%
Cooks Hill 52 $370,000 14.0%
Charlestown 96 $320,000 13.9%
p.19
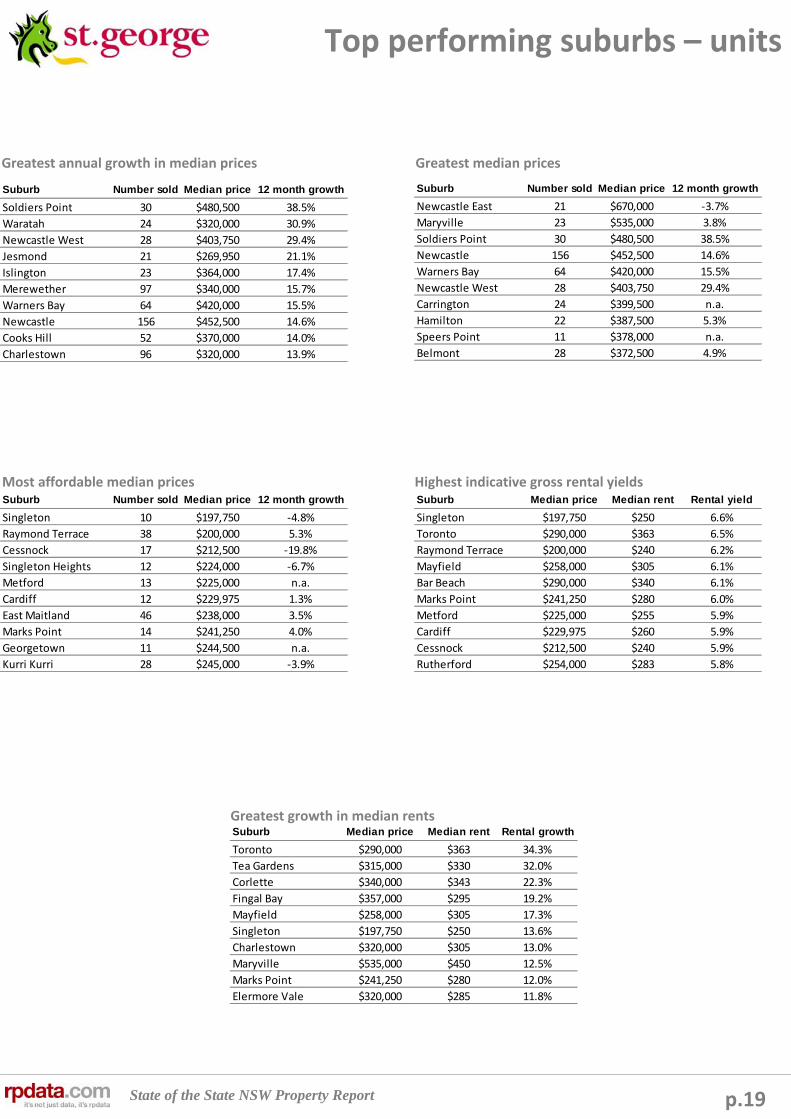
Top performing suburbs – units
Greatest annual growth in median prices Greatest median prices
Most affordable median prices Highest indicative gross rental yields
Greatest growth in median rents
State of the State NSW Property Report
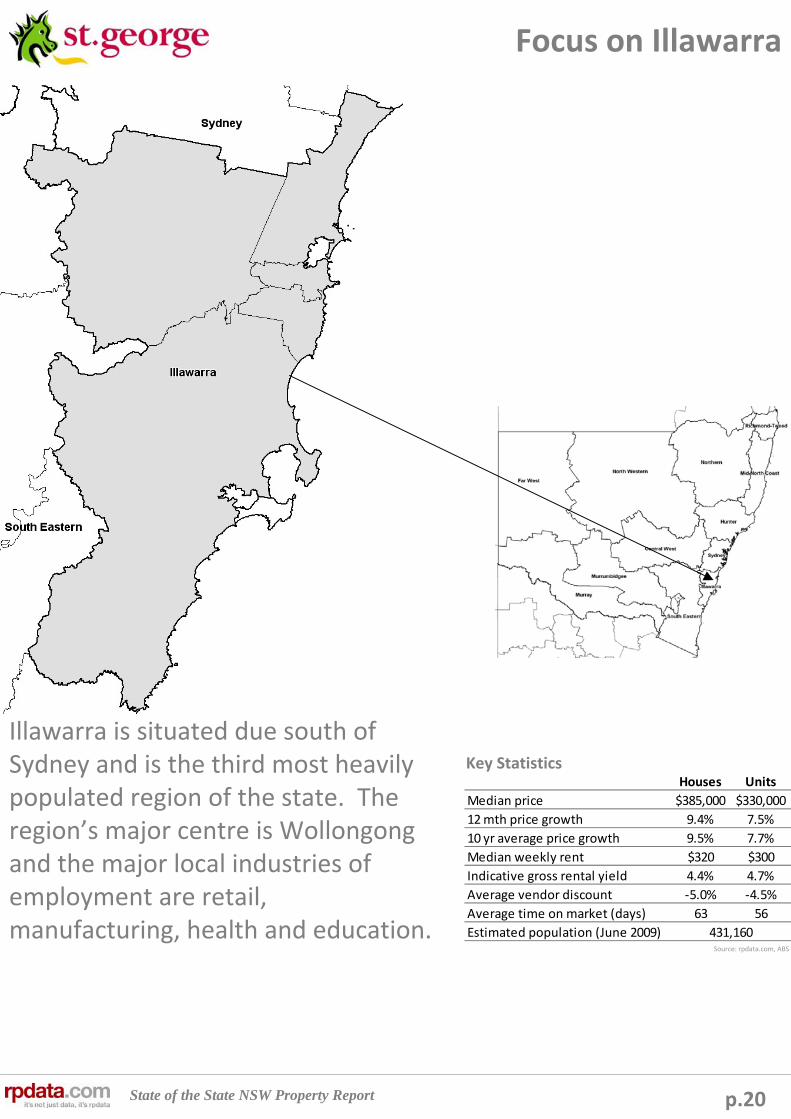
Houses Units
Median price $385,000 $330,000
12 mth price growth 9.4% 7.5%
10 yr average price growth 9.5% 7.7%
Median weekly rent $320 $300
Indicative gross rental yield 4.4% 4.7%
Average vendor discount ‐5.0% ‐4.5%
Average time on market (days) 63 56
Estimated population (June 2009) 431,160
p.20
Focus on Illawarra
Key Statistics
Illawarra is situated due south of Sydney and is the third most heavily populated region of the state. The region’s major centre is Wollongong and the major local industries of employment are retail, manufacturing, health and education.
Source: rpdata.com, ABS

State of the State NSW Property Report
3.5%
3.7%
3.9%
4.1%
4.3%
4.5%
4.7%
4.9%
5.1%
Sep‐05
Nov‐05
Jan‐06
Mar‐06
May‐06
Jul‐06
Sep‐06
Nov‐06
Jan‐07
Mar‐07
May‐07
Jul‐07
Sep‐07
Nov‐07
Jan‐08
Mar‐08
May‐08
Jul‐08
Sep‐08
Nov‐08
Jan‐09
Mar‐09
May‐09
Jul‐09
Sep‐09
Nov‐09
Jan‐10
Mar‐10
May‐10
Jul‐10
Houses Units
$200
$220
$240
$260
$280
$300
$320
$340
Sep‐05
Nov‐05
Jan‐06
Mar‐06
May‐06
Jul‐06
Sep‐06
Nov‐06
Jan‐07
Mar‐07
May‐07
Jul‐07
Sep‐07
Nov‐07
Jan‐08
Mar‐08
May‐08
Jul‐08
Sep‐08
Nov‐08
Jan‐09
Mar‐09
May‐09
Jul‐09
Sep‐09
Nov‐09
Jan‐10
Mar‐10
May‐10
Jul‐10
Median weekly advertised rent
Houses Units
0
500
1,000
1,500
2,000
2,500
3,000
3,500
$0
$50,000
$100,000
$150,000
$200,000
$250,000
$300,000
$350,000
$400,000
$450,000
Jul‐00
Jan‐01
Jul‐01
Jan‐02
Jul‐02
Jan‐03
Jul‐03
Jan‐04
Jul‐04
Jan‐05
Jul‐05
Jan‐06
Jul‐06
Jan‐07
Jul‐07
Jan‐08
Jul‐08
Jan‐09
Jul‐09
Jan‐10
Jul‐10
Rolling quarterly volume of sales
Median price
Quarterly volume of sales Houses Units
p.21
Illawarra property market
The Illawarra region has recorded average annual house price growth of 9.5 percent over the last decade and units have recorded average growth levels of 7.7 percent during the same period. During the last year, median prices have increased at rates in line with the 10 year average with house prices up by 9.4 percent and unit prices increasing 7.5 percent. Across the Illawarra region, the median house price was recorded at $385,000 over the three months to July 2010 and the median unit price sat at $330,000. Both house and unit prices are slightly below their peaks which were recorded at $389,000 for houses and $345,000 for units. Sales volumes across the region reached their historic highs during the three months to May 2002. Since that time, volumes have typically been well below the peak, however, there was a strong resurgence in market activity during early 2009. Current sales volumes are relatively flat but with the slower market conditions we expect some tapering of volumes during the remainder of 2010.
Illawarra median rents have continued to increase steadily over recent times whereas many regional and capital city regions have seen minimal growth in rents. Over the period highlighted, median house rents in the region have increased by a total of $80/week and unit rents haveincreased by $70/week which is a moderate level of growth compared with other regions. Median advertised rents for the region are currently recorded at $320/week for houses and $300/week for units indicating little difference in price between renting a house or unit. During the last 12 months, median rents have increased by 10.3 percent and unit rents have increased by 11.1 percent. The growth in rents over the past 12 months has been quite impressive and highlights that there is ongoing demand for housing within this region of the state. With price growth anticipated to be fairly minimal over the next year, the prospect for strong rental growth is more subdued, however, well located properties in major areas of the region will likely have the best prospect for further rental rate growth.
With rental rates and property prices increasing during the last 12 months, there has been a softening of rental yields recorded across the region. Indicative gross rental yields for houses are recorded at 4.4 percent and units at 4.7 percent. During July 2009 indicative gross rental yields were recorded at 4.4 percent for houses and 4.8 percent for units, however, they have been at higher levels during the year. In recent months yields have eased, however more recently there has been a slight improvement in house yields whilst unit yields have been quite flat. During the next 12 months it is anticipated that there will be minimal overall change to rental yields due to the expectation of softer capital growth and rental growth conditions during the period. Stronger rental yields are likely to be afforded to those properties with superior locations in areas which are most attractive to renters – close to water, close to town centres and close to education and working nodes.
Illawarra sales volumes and median prices over timeJul‐00 to Jul‐10
Illawarra region median weekly advertised rentsSep‐05 to Jul‐10
Illawarra indicative gross rental yieldsSep‐05 to Jul‐10
Source: rpdata.com
Source: rpdata.com
Source: rpdata.com

State of the State NSW Property Report
‐9.0%
‐8.0%
‐7.0%
‐6.0%
‐5.0%
‐4.0%
‐3.0%
‐2.0%
‐1.0%
0.0%
Jul‐04
Oct‐04
Jan‐05
Apr‐05
Jul‐05
Oct‐05
Jan‐06
Apr‐06
Jul‐06
Oct‐06
Jan‐07
Apr‐07
Jul‐07
Oct‐07
Jan‐08
Apr‐08
Jul‐08
Oct‐08
Jan‐09
Apr‐09
Jul‐09
Oct‐09
Jan‐10
Apr‐10
Jul‐10
‐9.0%
‐8.0%
‐7.0%
‐6.0%
‐5.0%
‐4.0%
‐3.0%
‐2.0%
‐1.0%
0.0%
Jul‐04
Oct‐04
Jan‐05
Apr‐05
Jul‐05
Oct‐05
Jan‐06
Apr‐06
Jul‐06
Oct‐06
Jan‐07
Apr‐07
Jul‐07
Oct‐07
Jan‐08
Apr‐08
Jul‐08
Oct‐08
Jan‐09
Apr‐09
Jul‐09
Oct‐09
Jan‐10
Apr‐10
Jul‐10
0102030405060708090
100
Jul‐04
Oct‐04
Jan‐05
Apr‐05
Jul‐05
Oct‐05
Jan‐06
Apr‐06
Jul‐06
Oct‐06
Jan‐07
Apr‐07
Jul‐07
Oct‐07
Jan‐08
Apr‐08
Jul‐08
Oct‐08
Jan‐09
Apr‐09
Jul‐09
Oct‐09
Jan‐10
Apr‐10
Jul‐10
0102030405060708090
100
Jul‐04
Oct‐04
Jan‐05
Apr‐05
Jul‐05
Oct‐05
Jan‐06
Apr‐06
Jul‐06
Oct‐06
Jan‐07
Apr‐07
Jul‐07
Oct‐07
Jan‐08
Apr‐08
Jul‐08
Oct‐08
Jan‐09
Apr‐09
Jul‐09
Oct‐09
Jan‐10
Apr‐10
Jul‐10
p.22
Illawarra property market
The adjacent graphs detail the level of vendor discounting across theIllawarra region for houses (blue) and units (grey).
Average levels of vendor discounting throughout the Illawarra region are currently at their lowest ever level for houses. The current level of vendor discounting for houses is recorded at ‐5.0 percent. At the same time last year, the average level of vendor discounting was recorded at ‐6.3 percent indicating that over the last 12 months conditions for sellers have improved markedly. At their highest level, vendor discounting was recorded at ‐8.2 percent during April 2005. Over the six years highlighted, the average vendor discount has been recorded at ‐7.1 percent.
Unit discounting levels are currently recorded at levels above their historic low of ‐3.9 percent and have increased in recent months. Average vendor discount levels are recorded at ‐4.5 percent. Over the last 12 months, the average vendor discount has actually increased having been recorded at ‐4.4 percent during July 2009. At its highest level during 2005, the average vendor discount was recorded at ‐7.7 percent. Over the last six years, discounting levels for units have typically been lower than that for houses, recorded at an average of ‐6.3 percent.
The adjacent graphs detail the average time on market for property sales across the Illawarra region for houses (blue) and units (grey).
On average, houses throughout the Illawarra region have recorded a decline in the time it takes to sell and are currently at their lowest level during the last six years. On average it took 63 days to sell a house within the region during July 2010 in comparison, 12 months prior it was taking an average of 75 days to sell a house. The average selling time recorded its historic high level of 88 days in late 2005 / early 2006 and for much of the last six years it has taken more than 80 days to sell a house in the region.
Units within the Illawarra region of the state have seen a similar decline in the average time it takes to sell a property as has been recorded for houses and are at their lowest level of any time during the last six years. Currently, units are taking an average of 56 days to sell and at the same time last July, units were taking an average of 71 days to sell. The average time to sell across the region peaked at 88 days in 2005 and typically, the average time on market has been longer than 70 days over the six year period.
The results for vendor discounting and time on market indicate that the residential property markets performance has been improving and is arguably in the best condition for some time, as a result properties have been selling quicker and have been recording lower discount levels. Although conditions have improved, higher interest rates and fewer buyers are likely to result in some increase to these lead indicators during the coming months.
Illawarra region level of vendor discountingJul‐04 to Jul‐10
Illawarra region average time on marketJan‐04 to Jul‐10
Source: rpdata.com
Source: rpdata.com
Houses
Units
Houses
Units
State of the State NSW Property Report p.23
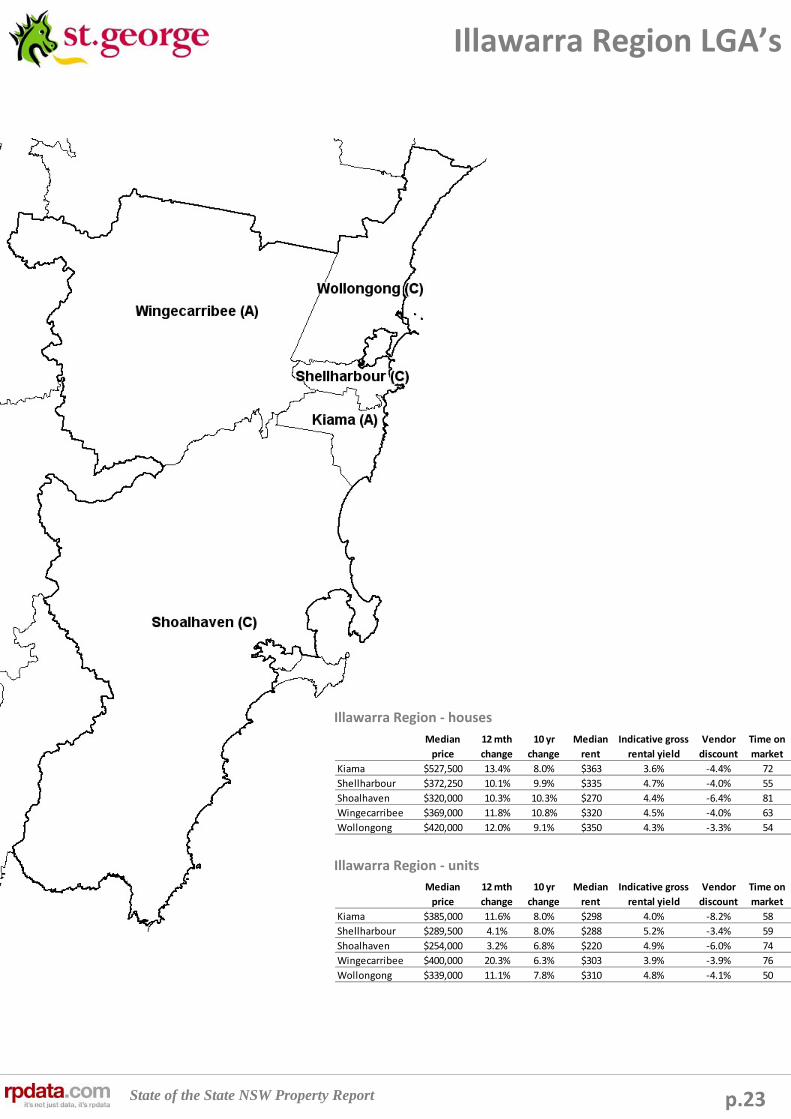
Illawarra Region LGA’s
Illawarra Region ‐ houses
Illawarra Region ‐ units
Median
price
12 mth
change
10 yr
change
Median
rent
Indicative gross
rental yield
Vendor
discount
Time on
market
Kiama $527,500 13.4% 8.0% $363 3.6% ‐4.4% 72
Shellharbour $372,250 10.1% 9.9% $335 4.7% ‐4.0% 55
Shoalhaven $320,000 10.3% 10.3% $270 4.4% ‐6.4% 81
Wingcarribee $369,000 11.8% 10.8% $320 4.5% ‐4.0% 63
Wollongong $420,000 12.0% 9.1% $350 4.3% ‐3.3% 54
Median
price
12 mth
change
10 yr
change
Median
rent
Indicative gross
rental yield
Vendor
discount
Time on
market
Kiama $385,000 11.6% 8.0% $298 4.0% ‐8.2% 58
Shellharbour $289,500 4.1% 8.0% $288 5.2% ‐3.4% 59
Shoalhaven $254,000 3.2% 6.8% $220 4.9% ‐6.0% 74
Wingcarribee $400,000 20.3% 6.3% $303 3.9% ‐3.9% 76
Wollongong $339,000 11.1% 7.8% $310 4.8% ‐4.1% 50
Median
price
12 mth
change
10 yr
change
Median
rent
Indicative gross
rental yield
Vendor
discount
Time on
market
Kiama $527,500 13.4% 8.0% $363 3.6% ‐4.4% 72
Shellharbour $372,250 10.1% 9.9% $335 4.7% ‐4.0% 55
Shoalhaven $320,000 10.3% 10.3% $270 4.4% ‐6.4% 81
Wingecarribee $369,000 11.8% 10.8% $320 4.5% ‐4.0% 63
Wollongong $420,000 12.0% 9.1% $350 4.3% ‐3.3% 54
Median
price
12 mth
change
10 yr
change
Median
rent
Indicative gross
rental yield
Vendor
discount
Time on
market
Kiama $385,000 11.6% 8.0% $298 4.0% ‐8.2% 58
Shellharbour $289,500 4.1% 8.0% $288 5.2% ‐3.4% 59
Shoalhaven $254,000 3.2% 6.8% $220 4.9% ‐6.0% 74
Wingecarribee $400,000 20.3% 6.3% $303 3.9% ‐3.9% 76
Wollongong $339,000 11.1% 7.8% $310 4.8% ‐4.1% 50
State of the State NSW Property Report
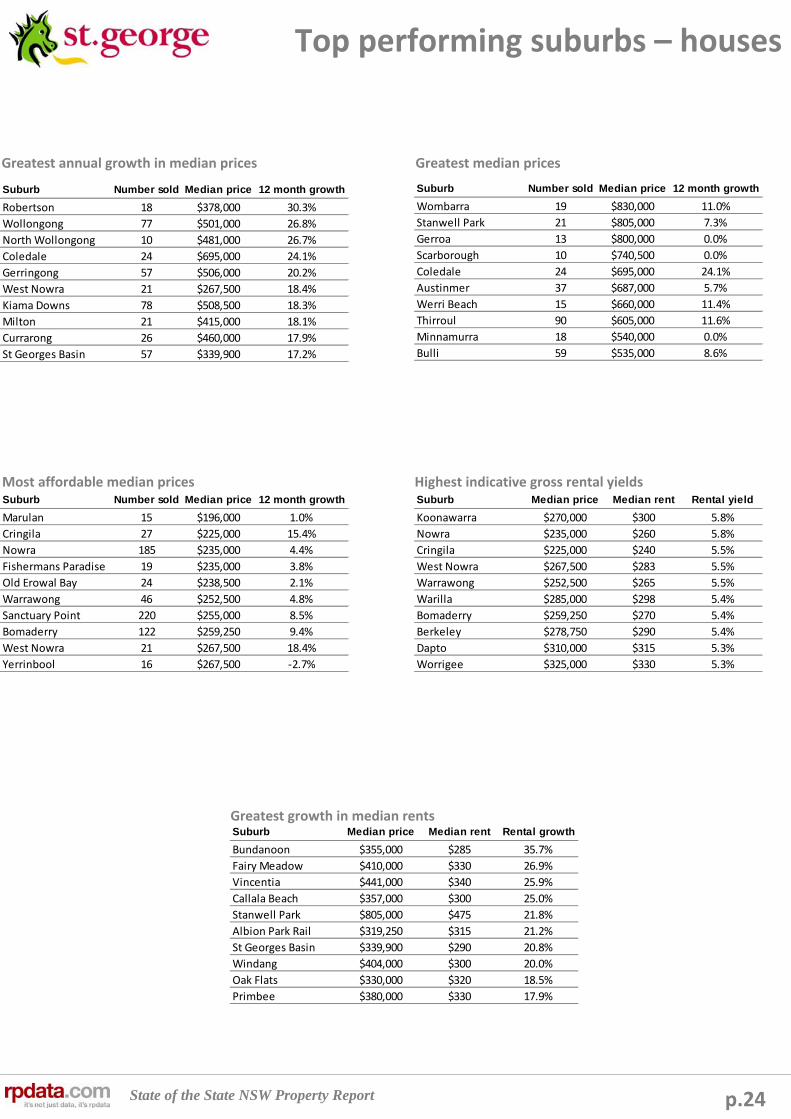
Suburb Median price Median rent Rental growth
Bundanoon $355,000 $285 35.7%
Fairy Meadow $410,000 $330 26.9%
Vincentia $441,000 $340 25.9%
Callala Beach $357,000 $300 25.0%
Stanwell Park $805,000 $475 21.8%
Albion Park Rail $319,250 $315 21.2%
St Georges Basin $339,900 $290 20.8%
Windang $404,000 $300 20.0%
Oak Flats $330,000 $320 18.5%
Primbee $380,000 $330 17.9%
Suburb Median price Median rent Rental yield
Koonawarra $270,000 $300 5.8%
Nowra $235,000 $260 5.8%
Cringila $225,000 $240 5.5%
West Nowra $267,500 $283 5.5%
Warrawong $252,500 $265 5.5%
Warilla $285,000 $298 5.4%
Bomaderry $259,250 $270 5.4%
Berkeley $278,750 $290 5.4%
Dapto $310,000 $315 5.3%
Worrigee $325,000 $330 5.3%
Suburb Number sold Median price 12 month growth
Marulan 15 $196,000 1.0%
Cringila 27 $225,000 15.4%
Nowra 185 $235,000 4.4%
Fishermans Paradise 19 $235,000 3.8%
Old Erowal Bay 24 $238,500 2.1%
Warrawong 46 $252,500 4.8%
Sanctuary Point 220 $255,000 8.5%
Bomaderry 122 $259,250 9.4%
West Nowra 21 $267,500 18.4%
Yerrinbool 16 $267,500 ‐2.7%
Suburb Number sold Median price 12 month growth
Wombarra 19 $830,000 11.0%
Stanwell Park 21 $805,000 7.3%
Gerroa 13 $800,000 0.0%
Scarborough 10 $740,500 0.0%
Coledale 24 $695,000 24.1%
Austinmer 37 $687,000 5.7%
Werri Beach 15 $660,000 11.4%
Thirroul 90 $605,000 11.6%
Minnamurra 18 $540,000 0.0%
Bulli 59 $535,000 8.6%
Suburb Number sold Median price 12 month growth
Robertson 18 $378,000 30.3%
Wollongong 77 $501,000 26.8%
North Wollongong 10 $481,000 26.7%
Coledale 24 $695,000 24.1%
Gerringong 57 $506,000 20.2%
West Nowra 21 $267,500 18.4%
Kiama Downs 78 $508,500 18.3%
Milton 21 $415,000 18.1%
Currarong 26 $460,000 17.9%
St Georges Basin 57 $339,900 17.2%
p.24
Top performing suburbs – houses
Greatest annual growth in median prices Greatest median prices
Most affordable median prices Highest indicative gross rental yields
Greatest growth in median rents
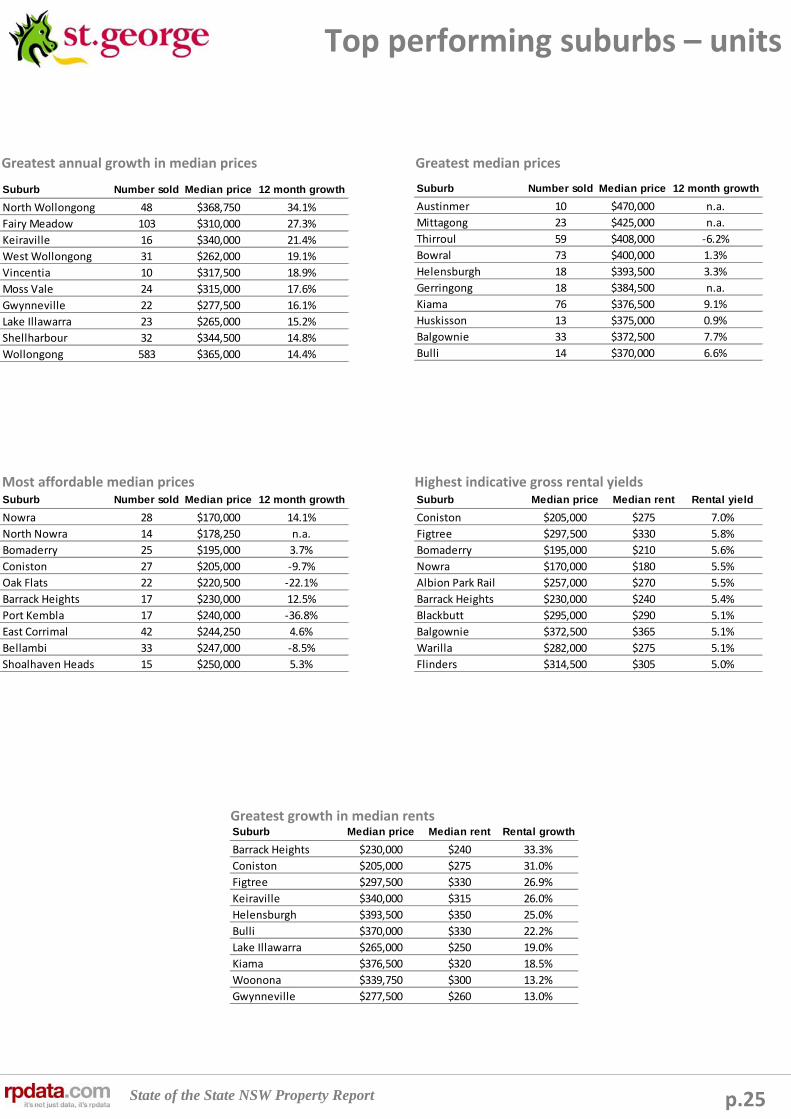
State of the State NSW Property Report
Suburb Median price Median rent Rental growth
Barrack Heights $230,000 $240 33.3%
Coniston $205,000 $275 31.0%
Figtree $297,500 $330 26.9%
Keiraville $340,000 $315 26.0%
Helensburgh $393,500 $350 25.0%
Bulli $370,000 $330 22.2%
Lake Illawarra $265,000 $250 19.0%
Kiama $376,500 $320 18.5%
Woonona $339,750 $300 13.2%
Gwynneville $277,500 $260 13.0%
Suburb Median price Median rent Rental yield
Coniston $205,000 $275 7.0%
Figtree $297,500 $330 5.8%
Bomaderry $195,000 $210 5.6%
Nowra $170,000 $180 5.5%
Albion Park Rail $257,000 $270 5.5%
Barrack Heights $230,000 $240 5.4%
Blackbutt $295,000 $290 5.1%
Balgownie $372,500 $365 5.1%
Warilla $282,000 $275 5.1%
Flinders $314,500 $305 5.0%
Suburb Number sold Median price 12 month growth
Nowra 28 $170,000 14.1%
North Nowra 14 $178,250 n.a.
Bomaderry 25 $195,000 3.7%
Coniston 27 $205,000 ‐9.7%
Oak Flats 22 $220,500 ‐22.1%
Barrack Heights 17 $230,000 12.5%
Port Kembla 17 $240,000 ‐36.8%
East Corrimal 42 $244,250 4.6%
Bellambi 33 $247,000 ‐8.5%
Shoalhaven Heads 15 $250,000 5.3%
Suburb Number sold Median price 12 month growth
Austinmer 10 $470,000 n.a.
Mittagong 23 $425,000 n.a.
Thirroul 59 $408,000 ‐6.2%
Bowral 73 $400,000 1.3%
Helensburgh 18 $393,500 3.3%
Gerringong 18 $384,500 n.a.
Kiama 76 $376,500 9.1%
Huskisson 13 $375,000 0.9%
Balgownie 33 $372,500 7.7%
Bulli 14 $370,000 6.6%
Suburb Number sold Median price 12 month growth
North Wollongong 48 $368,750 34.1%
Fairy Meadow 103 $310,000 27.3%
Keiraville 16 $340,000 21.4%
West Wollongong 31 $262,000 19.1%
Vincentia 10 $317,500 18.9%
Moss Vale 24 $315,000 17.6%
Gwynneville 22 $277,500 16.1%
Lake Illawarra 23 $265,000 15.2%
Shellharbour 32 $344,500 14.8%
Wollongong 583 $365,000 14.4%
p.25
Top performing suburbs – units
Greatest annual growth in median prices Greatest median prices
Most affordable median prices Highest indicative gross rental yields
Greatest growth in median rents

State of the State NSW Property Report
Houses Units
Median price $325,000 $269,000
12 mth price growth 8.3% 7.6%
10 yr average price growth 9.9% 7.9%
Median weekly rent $300 $285
Indicative gross rental yield 4.8% 5.2%
Average vendor discount ‐5.1% ‐4.3%
Average time on market (days) 63 56
Estimated population (June 2009) 309,588
p.26
Focus on Mid North Coast
Key StatisticsThe Mid North Coast lies along the coastal strip between the Hunter and Richmond‐Tweed Regions. The region is very popular with retirees and retail, health care and tourism are the largest employers locally.
Source: rpdata.com, ABS

State of the State NSW Property Report
3.7%
3.9%
4.1%
4.3%
4.5%
4.7%
4.9%
5.1%
5.3%
Sep‐05
Nov‐05
Jan‐06
Mar‐06
May‐06
Jul‐06
Sep‐06
Nov‐06
Jan‐07
Mar‐07
May‐07
Jul‐07
Sep‐07
Nov‐07
Jan‐08
Mar‐08
May‐08
Jul‐08
Sep‐08
Nov‐08
Jan‐09
Mar‐09
May‐09
Jul‐09
Sep‐09
Nov‐09
Jan‐10
Mar‐10
May‐10
Jul‐10
Houses Units
$190
$210
$230
$250
$270
$290
$310
Sep‐05
Nov‐05
Jan‐06
Mar‐06
May‐06
Jul‐06
Sep‐06
Nov‐06
Jan‐07
Mar‐07
May‐07
Jul‐07
Sep‐07
Nov‐07
Jan‐08
Mar‐08
May‐08
Jul‐08
Sep‐08
Nov‐08
Jan‐09
Mar‐09
May‐09
Jul‐09
Sep‐09
Nov‐09
Jan‐10
Mar‐10
May‐10
Jul‐10
Median weekly advertised rent
Houses Units
0
500
1,000
1,500
2,000
2,500
3,000
$0
$50,000
$100,000
$150,000
$200,000
$250,000
$300,000
$350,000
$400,000
Jul‐00
Jan‐01
Jul‐01
Jan‐02
Jul‐02
Jan‐03
Jul‐03
Jan‐04
Jul‐04
Jan‐05
Jul‐05
Jan‐06
Jul‐06
Jan‐07
Jul‐07
Jan‐08
Jul‐08
Jan‐09
Jul‐09
Jan‐10
Jul‐10
Rolling quarterly volume of sales
Median price
Quarterly volume of sales Houses Units
p.27
Mid North Coast property market
During the past decade, median house prices across the Mid North Coast region have recorded average annual growth of 9.9 percent and units have recorded growth of 7.9 percent. During the past 12 months, median prices have recorded an increase of 8.3 percent for houses and 7.6 percent for units. Median house prices are currently recorded at $325,000 and median unit prices sit at $269,000. Median house prices are currently ‐3.0 percent below their peak whilst unit prices are recorded at their highest ever level currently. Sales volumes within the region are currently not particularly buoyant and have been trending lower since September 2009 when they recorded their most recent peak of 1,693 sales for the quarter. Throughout the past 10 years, the quarterly volume of sales peaked at 2,744 sales over the three months to May 2002. In recent months, the volume of sales has been trending lower and the lower volumes are likely to persist for at least the remainder of 2010.
Between September 2005 and July 2010, median weekly advertised rents across the Mid North Coast Region have shown some improvement, however, it has been only moderate growth. Over the period, median house rents have increased by a total of $50/week and median unit rents increased by $75/week. Median weekly advertised rents for houses are currently recorded at $300 and unit rents at $285, indicating little difference in rental costs between houses and units. Over the past year, median house rents have increased by 3.4 percent and units have recorded a superior rate of growth at 5.6 percent. The growth in rents over the past year has been quite subdued, however, this trend is not unique to the region. Across the country rental growth has typically been quite minimal over the past year and regional coastal markets have been some of the most affected rental markets. A poorly performing tourism sector, a slow down in ‘sea changers’, under performance of the share market and high Australian dollar are all dampening the rental growth prospects within coastal and regional markets.
With rental rates recording a lower level of growth than that recorded across house and unit prices over the past year, there has been some recent easing of indicative gross rental yields recorded. Current indicative gross rental yields for houses are recorded at 4.8 percent and units are recorded at 5.2 percent. At the same time last year, rental yields were recorded at 5.0 percent for houses and 5.1 percent for units. Recently, yields for houses and units have been recording some easing, however, it has been much more pronounced for houses than it has been for units. For the next 12 months we don’t anticipate significant changes to yields with the stronger yielding properties likely to remain as units and these are most likely to be within major population centres such as Port Macquarie and Coffs Harbour.
Mid North Coast sales volumes and median prices over timeJul‐00 to Jul‐10
Mid North Coast region median weekly advertised rentsSep‐05 to Jul‐10
Mid North Coast indicative gross rental yieldsSep‐05 to Jul‐10
Source: rpdata.com
Source: rpdata.com
Source: rpdata.com

State of the State NSW Property Report
‐10.0%‐9.0%‐8.0%‐7.0%‐6.0%‐5.0%‐4.0%‐3.0%‐2.0%‐1.0%0.0%
Jul‐04
Sep‐04
Nov‐04
Jan‐05
Mar‐05
May‐05
Jul‐05
Sep‐05
Nov‐05
Jan‐06
Mar‐06
May‐06
Jul‐06
Sep‐06
Nov‐06
Jan‐07
Mar‐07
May‐07
Jul‐07
Sep‐07
Nov‐07
Jan‐08
Mar‐08
May‐08
Jul‐08
Sep‐08
Nov‐08
Jan‐09
Mar‐09
May‐09
Jul‐09
Sep‐09
Nov‐09
Jan‐ 10
Mar‐10
May‐10
Jul‐10
0102030405060708090
100
Jul‐04
Sep‐04
Nov‐04
Jan‐05
Mar‐05
May‐05
Jul‐05
Sep‐05
Nov‐05
Jan‐06
Mar‐06
May‐06
Jul‐06
Sep‐06
Nov‐06
Jan‐07
Mar‐07
May‐07
Jul‐07
Sep‐07
Nov‐07
Jan‐08
Mar‐08
May‐08
Jul‐08
Sep‐08
Nov‐08
Jan‐09
Mar‐09
May‐09
Jul‐09
Sep‐09
Nov‐09
Jan‐ 10
Mar‐10
May‐10
Jul‐10
0102030405060708090
100
Jul‐04
Sep‐04
Nov‐04
Jan‐05
Mar‐05
May‐05
Jul‐05
Sep‐05
Nov‐05
Jan‐06
Mar‐06
May‐06
Jul‐06
Sep‐06
Nov‐06
Jan‐07
Mar‐07
May‐07
Jul‐07
Sep‐07
Nov‐07
Jan‐08
Mar‐08
May‐08
Jul‐08
Sep‐08
Nov‐08
Jan‐09
Mar‐09
May‐09
Jul‐09
Sep‐09
Nov‐09
Jan‐ 10
Mar‐10
May‐10
Jul‐10
p.28
Mid North Coast property market
The adjacent graphs detail the level of vendor discounting across the Mid North Coast region for houses (blue) and units (grey).
Throughout the Mid North Coast region, the average level of vendor discounting is at low levels compared to the historic level of the past six years. Vendor discount is currently recorded at ‐5.1 percent which is the lowest level of the past six years. Twelve months previous during July 2009, the average vendor discount was ‐5.8 percent, indicating the improving market conditions over the past year. The average vendor discount for houses peaked at ‐8.5 percent in December 2005 and over the six years has been recorded at an average of ‐6.6 percent.
The average level of discounting for vendors of units within the local area has increased slightly in recent months, however, on a historical basis they remain at quite low levels. The average vendor discount is recorded at ‐4.3 percent, slightly above the recent low of ‐4.2 percent. The unit market has recorded a decline in discounting over the past year, falling from ‐5.0 percent during July 2010. During the six years highlighted the average vendor discount for units has been recorded at ‐6.3 percent, indicating that current levels are well below average.
The adjacent graphs detail the average time on market for property sales across the Mid North Coast region for houses (blue) and units (grey).
On average, houses throughout the local area have recorded a significant fall in the average time on market over the last year and they are currently selling quicker than any time over the past six years. As at July 2010, it was taking an average of 63 days to sell a house and incomparison, 12 months prior it was taking an average of 75 days. This result highlights the significant improvement to market conditions during the last 12 months. The average time on market recorded its peak at 88 days and for the vast majority of the period highlighted, it has taken an average of more than 80 days to sell a house in the region.
Units have similarly seen a substantial decline in their average time on market in recent times and are now recording their lowest average time on market for the period. During July 2010, it was taking an average of 56 days to sell a unit in the region, much lower than the peak of 88 days recorded in early 2005. Over the same period 12 months prior to July 2010, units sat on the market for an average of 71 days. Across the period detailed, units have recorded an average time on market of 80 days.
The results highlight that the market during the first half of 2010 the year has been in its healthiest state for a number of years. Despite the significant improvement in conditions, with the market slowing nationwide, it is anticipated that these lead indicators will begin to increase in the coming months particularly if interest rates increase as expected.
Mid North Coast region level of vendor discountingJul‐04 to Jul‐10
Mid North Coast region average time on marketJul‐04 to Jul‐10
Source: rpdata.com
Source: rpdata.com
Houses
Units
Houses
Units

State of the State NSW Property Report p.29
Mid North Coast Region LGA’s
Mid North Coast Region ‐ houses
Mid North Coast Region ‐ units
Median
price
12 mth
change
10 yr
change
Median
rent
Indicative gross
rental yield
Vendor
discount
Time on
market
Bellingen $324,021 9.7% 10.9% $295 4.7% ‐4.9% 72
Clarence Valley $285,000 7.5% 9.8% $280 5.1% ‐5.0% 66
Coffs Harbour $360,000 10.8% 11.1% $330 4.8% ‐4.6% 67
Greater Taree $255,000 5.4% 9.4% $260 5.3% ‐6.3% 90
Kempsey $240,000 9.1% 10.9% $240 5.2% ‐7.0% 92
Nambucca $285,000 3.6% 9.7% $250 4.6% ‐7.6% 98
Port Macquarie Hastings $371,500 9.3% 9.6% $330 4.6% ‐5.3% 63
Median
price
12 mth
change
10 yr
change
Median
rent
Indicative gross
rental yield
Vendor
discount
Time on
market
Clarence Valley $270,000 3.8% 8.0% $235 4.5% ‐5.6% 91
Coffs Harbour $252,464 4.0% 8.7% $260 5.4% ‐4.1% 62
Greater Taree $190,000 2.7% 6.2% $195 5.3% ‐6.9% 76
Kempsey $227,500 ‐9.2% 7.8% $200 4.6% ‐6.1% 59
Nambucca $260,000 30.7% 10.6% $220 4.4% ‐6.3% 106
Port Macquarie Hastings $270,000 4.5% 7.2% $250 4.8% ‐4.2% 57

State of the State NSW Property Report
Suburb Median price Median rent Rental growth
Nambucca Heads $298,000 $250 25.0%
Taree $225,000 $250 13.6%
Sandy Beach $305,000 $315 13.5%
Sapphire Beach $555,000 $420 13.5%
Old Bar $300,000 $270 12.5%
Junction Hill $291,000 $320 12.3%
Boambee East $338,000 $343 10.5%
West Kempsey $180,000 $215 10.3%
Grafton $265,000 $285 9.6%
Port Macquarie $389,000 $350 9.4%
Suburb Median price Median rent Rental yield
Diamond Beach $290,000 $650 11.7%
South Grafton $195,000 $258 6.9%
West Kempsey $180,000 $215 6.2%
Taree $225,000 $250 5.8%
Junction Hill $291,000 $320 5.7%
Grafton $265,000 $285 5.6%
Sandy Beach $305,000 $315 5.4%
Boambee East $338,000 $343 5.3%
Toormina $320,000 $318 5.2%
Bellingen $339,500 $330 5.1%
Suburb Number sold Median price 12 month growth
South Kempsey 23 $170,000 16.4%
Bowraville 12 $170,000 4.3%
West Kempsey 81 $180,000 ‐4.8%
Frederickton 12 $192,500 0.0%
South Grafton 110 $195,000 ‐0.8%
Wingham 68 $220,000 2.3%
Taree 257 $225,000 4.7%
Cundletown 27 $238,500 ‐1.4%
East Kempsey 32 $243,000 20.0%
Tinonee 17 $245,900 10.2%
Suburb Number sold Median price 12 month growth
Sapphire Beach 25 $555,000 0.5%
Korora 39 $455,000 19.7%
Dunbogan 22 $439,500 18.8%
Wooli 14 $437,500 16.7%
Black Head 10 $425,000 ‐3.4%
Valla Beach 19 $420,000 35.5%
Crescent Head 21 $420,000 8.4%
Bonny Hills 63 $419,000 12.5%
Sawtell 59 $415,000 1.2%
Wallabi Point 10 $395,000 0.0%
Suburb Number sold Median price 12 month growth
Valla Beach 19 $420,000 35.5%
East Kempsey 32 $243,000 20.0%
Korora 39 $455,000 19.7%
Dunbogan 22 $439,500 18.8%
Wooli 14 $437,500 16.7%
South Kempsey 23 $170,000 16.4%
Coutts Crossing 10 $266,000 16.4%
Junction Hill 28 $291,000 15.2%
Scotts Head 22 $350,000 14.4%
Coffs Harbour 325 $370,000 13.8%
p.30
Top performing suburbs – houses
Greatest annual growth in median prices Greatest median prices
Most affordable median prices Highest indicative gross rental yields
Greatest growth in median rents

State of the State NSW Property Report
Suburb Median price Median rent Rental growth
Old Bar $229,505 $205 20.6%
Sawtell $332,500 $280 13.1%
Sapphire Beach $175,000 $315 12.5%
Toormina $213,000 $225 12.5%
Coffs Harbour $252,464 $258 7.3%
Port Macquarie $273,000 $255 6.3%
Taree $156,000 $180 5.9%
Grafton $223,500 $230 4.5%
Woolgoolga $282,000 $255 4.1%
Suburb Median price Median rent Rental yield
Sapphire Beach $175,000 $315 9.4%
Korora $278,000 $330 6.2%
Taree $156,000 $180 6.0%
Toormina $213,000 $225 5.5%
Grafton $223,500 $230 5.4%
Coffs Harbour $252,464 $258 5.3%
Port Macquarie $273,000 $255 4.9%
Woolgoolga $282,000 $255 4.7%
Old Bar $229,505 $205 4.6%
South West Rocks $228,250 $200 4.6%
Suburb Number sold Median price 12 month growth
Taree 74 $156,000 4.7%
Sapphire Beach 31 $175,000 ‐31.1%
Toormina 41 $213,000 ‐2.1%
Grafton 34 $223,500 13.9%
South West Rocks 26 $228,250 ‐11.5%
Old Bar 25 $229,505 ‐6.3%
Iluka 17 $247,500 ‐8.8%
Coffs Harbour 302 $252,464 3.3%
Wauchope 14 $256,500 n.a.
Boambee East 11 $272,500 16.0%
Suburb Number sold Median price 12 month growth
Sawtell 41 $332,500 9.0%
Yamba 63 $329,000 7.5%
Laurieton 12 $296,000 11.1%
Woolgoolga 21 $282,000 n.a.
Nambucca Heads 43 $280,000 40.0%
Korora 15 $278,000 0.2%
Port Macquarie 417 $273,000 5.0%
Boambee East 11 $272,500 16.0%
Wauchope 14 $256,500 n.a.
Coffs Harbour 302 $252,464 3.3%
Suburb Number sold Median price 12 month growth
Nambucca Heads 43 $280,000 40.0%
Boambee East 11 $272,500 16.0%
Grafton 34 $223,500 13.9%
Laurieton 12 $296,000 11.1%
Sawtell 41 $332,500 9.0%
Yamba 63 $329,000 7.5%
Port Macquarie 417 $273,000 5.0%
Taree 74 $156,000 4.7%
Coffs Harbour 302 $252,464 3.3%
Korora 15 $278,000 0.2%
p.31
Top performing suburbs – units
Greatest annual growth in median prices Greatest median prices
Most affordable median prices Highest indicative gross rental yields
Greatest growth in median rents
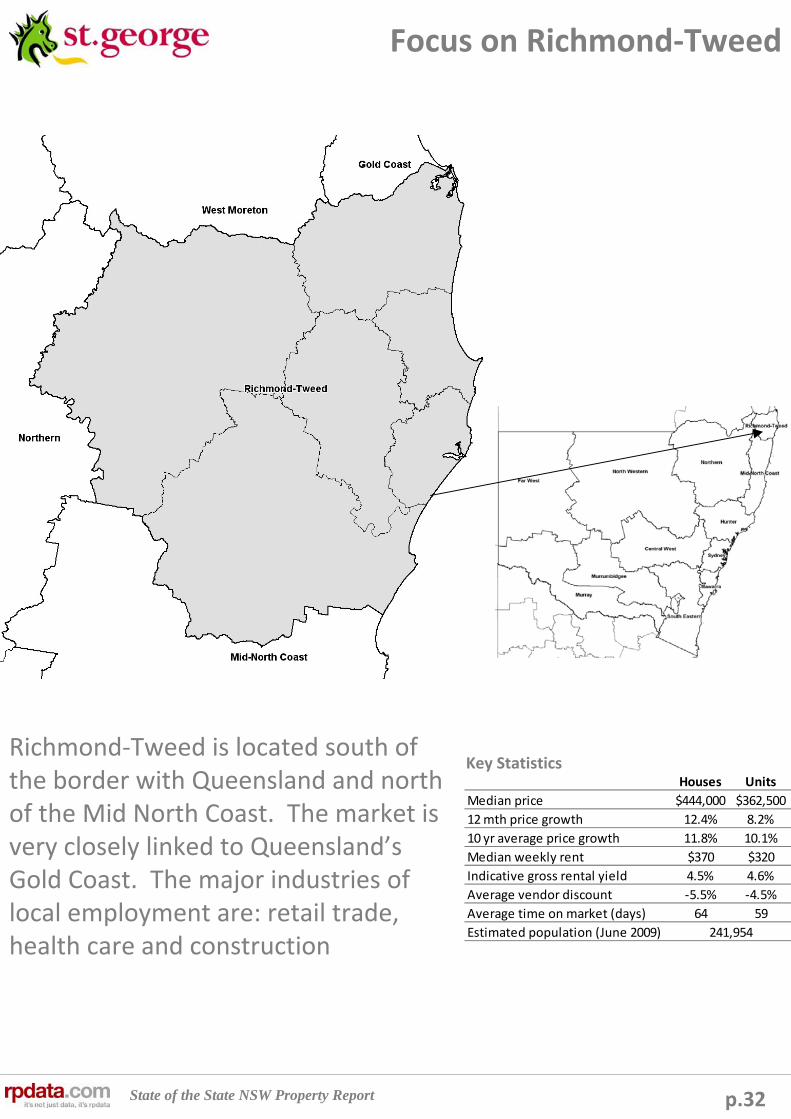
State of the State NSW Property Report
Houses Units
Median price $444,000 $362,500
12 mth price growth 12.4% 8.2%
10 yr average price growth 11.8% 10.1%
Median weekly rent $370 $320
Indicative gross rental yield 4.5% 4.6%
Average vendor discount ‐5.5% ‐4.5%
Average time on market (days) 64 59
Estimated population (June 2009) 241,954
p.32
Focus on Richmond‐Tweed
Key StatisticsRichmond‐Tweed is located south of the border with Queensland and north of the Mid North Coast. The market is very closely linked to Queensland’s Gold Coast. The major industries of local employment are: retail trade, health care and construction

State of the State NSW Property Report
4.0%
4.2%
4.4%
4.6%
4.8%
5.0%
5.2%
May‐05
Jul‐05
Sep‐05
Nov‐05
Jan‐06
Mar‐06
May‐06
Jul‐06
Sep‐06
Nov‐06
Jan‐07
Mar‐07
May‐07
Jul‐07
Sep‐07
Nov‐07
Jan‐08
Mar‐08
May‐08
Jul‐08
Sep‐08
Nov‐08
Jan‐09
Mar‐09
May‐09
Jul‐09
Sep‐09
Nov‐09
Jan‐10
Mar‐10
May‐10
Jul‐10
Houses Units
$200
$220
$240
$260
$280
$300
$320
$340
$360
$380
May‐05
Jul‐05
Sep‐05
Nov‐05
Jan‐06
Mar‐06
May‐06
Jul‐06
Sep‐06
Nov‐06
Jan‐07
Mar‐07
May‐07
Jul‐07
Sep‐07
Nov‐07
Jan‐08
Mar‐08
May‐08
Jul‐08
Sep‐08
Nov‐08
Jan‐09
Mar‐09
May‐09
Jul‐09
Sep‐09
Nov‐09
Jan‐10
Mar‐10
May‐10
Jul‐10
Median weekly advertised rent
Houses Units
0
500
1,000
1,500
2,000
2,500
$0
$50,000
$100,000
$150,000
$200,000
$250,000
$300,000
$350,000
$400,000
$450,000
$500,000
Jul‐00
Jan‐01
Jul‐01
Jan‐02
Jul‐02
Jan‐03
Jul‐03
Jan‐04
Jul‐04
Jan‐05
Jul‐05
Jan‐06
Jul‐06
Jan‐07
Jul‐07
Jan‐08
Jul‐08
Jan‐09
Jul‐09
Jan‐10
Jul‐10
Rolling quarterly volume of sales
Median price
Quarterly volume of sales Houses Units
p.33
Richmond‐Tweed property market
The Richmond‐Tweed Region of NSW has recorded above average price growth over the past 10 years with median house prices recordingaverage annual growth of 11.8 percent and units 10.1 percent. This market tends to be more heavily influenced by conditions in South‐East Queensland rather than Sydney. Over the year to July 2010, median house prices have increased by 12.4 percent and unit prices are up by 8.2 percent. It’s important to note that both house and unit prices recorded deterioration in recent years and have only recently returned to peak levels. The current median house price is $440,000 and the median unit price is recorded at $362,000. Although median house prices are now at their peak, unit prices have eased in recent months and are ‐3.3 percent below their peak. Sales volumes have been deteriorating since November 2009, and we expect sales volumes to remain at below average levels during the coming months.
During the period between May 2005 and July 2010, median weekly advertised rents across the Richmond Tweed Region have increased by $90/week for houses and $85/week for units. The rate of growth in rents is quite strong, however, there has been minimal rental growth since the beginning of 2009. Median weekly rents throughout the region are recorded at $370 for houses and $320 for units. During the 12 months to July 2010 median rents have recorded no change for either houses or units indicating that there is minimal upwards pressure on rental rates currently. As has been continually stated, there has been minimal upward pressure on rents during the past 12 to 18 months and this is clearly evident within the Richmond‐Tweed region. We would expect that over the coming year there will continue to be limited prospects for rental growth as the market slows and demand for rental accommodation in coastal areas of the country remains quite limited.
The Richmond‐Tweed region has recorded a swift decline in indicative gross rental yields over recent months. The decline has come about due to the improving property prices and the negligible growth in rental rates. Currently, indicative gross rental yields for houses are recorded at 4.5 percent and units are at 4.6 percent. Twelve months ago yields were recorded at 4.9 percent for houses and 5.0 percent for units. The recent easing of yields has been much more significant for houses and this is due to houses recording superior price growth compared to that of units. During the coming months, we anticipate that the rental yields won’t decline too much further as we expect the rate of capital growth to slow. Although we don’t anticipate strong rental growth, these conditions will likely be favourable to stemming the declines in yields. From an investment perspective, areas with higher rental demand are likely to record stronger demand, these are likely to be areas such as Tweed Heads, Byron Bay and Ballina.
Richmond‐Tweed sales volumes and median prices over timeJul‐00 to Jul‐10
Richmond‐Tweed region median weekly advertised rentsMay‐05 to Jul‐10
Richmond‐Tweed indicative gross rental yieldsMay‐05 to Jul‐10
Source: rpdata.com
Source: rpdata.com
Source: rpdata.com

State of the State NSW Property Report
‐7.0%
‐6.0%
‐5.0%
‐4.0%
‐3.0%
‐2.0%
‐1.0%
0.0%
Jul‐04
Oct‐04
Jan‐05
Apr‐05
Jul‐05
Oct‐05
Jan‐06
Apr‐06
Jul‐06
Oct‐06
Jan‐07
Apr‐07
Jul‐07
Oct‐07
Jan‐08
Apr‐08
Jul‐08
Oct‐08
Jan‐09
Apr‐09
Jul‐09
Oct‐09
Jan‐10
Apr‐10
Jul‐10
‐10.0%‐9.0%‐8.0%‐7.0%‐6.0%‐5.0%‐4.0%‐3.0%‐2.0%‐1.0%0.0%
Jul‐04
Oct‐04
Jan‐05
Apr‐05
Jul‐05
Oct‐05
Jan‐06
Apr‐06
Jul‐06
Oct‐06
Jan‐07
Apr‐07
Jul‐07
Oct‐07
Jan‐08
Apr‐08
Jul‐08
Oct‐08
Jan‐09
Apr‐09
Jul‐09
Oct‐09
Jan‐10
Apr‐10
Jul‐10
0
10
20
30
40
50
60
70
80
90
Jul‐04
Oct‐04
Jan‐05
Apr‐05
Jul‐05
Oct‐05
Jan‐06
Apr‐06
Jul‐06
Oct‐06
Jan‐07
Apr‐07
Jul‐07
Oct‐07
Jan‐08
Apr‐08
Jul‐08
Oct‐08
Jan‐09
Apr‐09
Jul‐09
Oct‐09
Jan‐10
Apr‐10
Jul‐10
0102030405060708090
100
Jul‐04
Oct‐04
Jan‐05
Apr‐05
Jul‐05
Oct‐05
Jan‐06
Apr‐06
Jul‐06
Oct‐06
Jan‐07
Apr‐07
Jul‐07
Oct‐07
Jan‐08
Apr‐08
Jul‐08
Oct‐08
Jan‐09
Apr‐09
Jul‐09
Oct‐09
Jan‐10
Apr‐10
Jul‐10
p.34
Richmond‐Tweed property market
The adjacent graphs detail the level of vendor discounting for houses (blue) and units (grey) within the Richmond‐Tweed region.
The average level of vendor discounting for houses throughout the Richmond‐Tweed region was recorded at ‐5.5 percent during July 2010, its lowest level since April 2008. The improving market conditions have resulted in an easing of vendor discounting over the past year with discounting recorded at ‐6.7 percent during July 2009. At its highest level, the average vendor discount was recorded at ‐8.1 percent during July 2004. Over the six years to July 2010, the average discount has been recorded at ‐6.3 percent, well above the current level.
Units have recorded an easing in their average level of vendor discounting during the past year and discounting is currently recorded at ‐4.5 percent, only slightly higher than its lowest level of the past six years, ‐4.3 percent. Twelve months ago the level of vendor discounting was recorded at ‐5.9 percent which indicates that conditions in the unit market have improved markedly over the year. At their peak, units were having to be discounted by an average of ‐6.4 percent (April 2004). Units have recorded an average discount of ‐5.4 percent during the past six years, well below that of the housing market.
The adjacent graphs detail the average time on market for property sales across the Richmond‐Tweed region for houses (blue) and units (grey).
Houses within the Richmond‐Tweed region have recorded a decline in their average time on market during 2010. As at July 2010, houses were taking an average of 64 days to sell and this timeframe represents the lowest average time on market for houses of any period between July 2004 and July 2010. During July 2009, houses were taking an average of 81 days to sell. Selling conditions for houses within the region have clearly improved dramatically in recent times and this is highlighted by the decline in average time on market. Over the past six years, houses have typically taken 78 days to sell.
As with houses, units have recorded a sharp decline in their average time on market during 2010. As at July, units were on average selling after 59 days on the market which was one of the quickest selling periods of any time since July 2004. At the same time last year, units in the local area took 75 days to sell. Over the six year period highlighted, units have recorded an average time on market of 73 days. At the peak, properties were taking an average of 83 days to sell and they have sold as quickly as 58 days.
Clearly the market has witnessed a significant improvement in conditions during recent months and this is highlighted by the growth in property prices and time on market and discount improvements. Although there has been such an improvement, it is expected that time on market and discounting will increase in coming months, affording purchasers greater leverage in negotiations.
Richmond‐Tweed region level of vendor discountingJul‐04 to Jul‐10
Richmond‐Tweed region average time on marketJul‐04 to Jul‐10
Source: rpdata.com
Source: rpdata.com
Houses
Units
Houses
Units
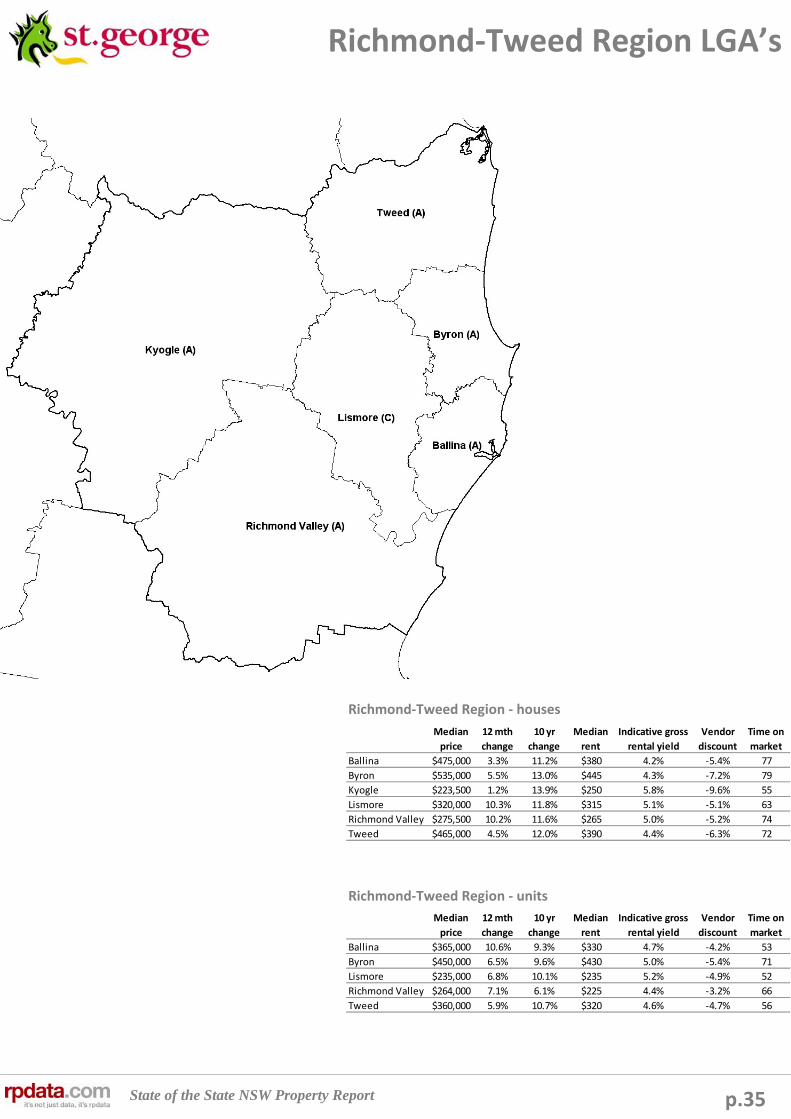
State of the State NSW Property Report p.35
Richmond‐Tweed Region LGA’s
Richmond‐Tweed Region ‐ houses
Richmond‐Tweed Region ‐ units
Median
price
12 mth
change
10 yr
change
Median
rent
Indicative gross
rental yield
Vendor
discount
Time on
market
Ballina $475,000 3.3% 11.2% $380 4.2% ‐5.4% 77
Byron $535,000 5.5% 13.0% $445 4.3% ‐7.2% 79
Kyogle $223,500 1.2% 13.9% $250 5.8% ‐9.6% 55
Lismore $320,000 10.3% 11.8% $315 5.1% ‐5.1% 63
Richmond Valley $275,500 10.2% 11.6% $265 5.0% ‐5.2% 74
Tweed $465,000 4.5% 12.0% $390 4.4% ‐6.3% 72
Median
price
12 mth
change
10 yr
change
Median
rent
Indicative gross
rental yield
Vendor
discount
Time on
market
Ballina $365,000 10.6% 9.3% $330 4.7% ‐4.2% 53
Byron $450,000 6.5% 9.6% $430 5.0% ‐5.4% 71
Lismore $235,000 6.8% 10.1% $235 5.2% ‐4.9% 52
Richmond Valley $264,000 7.1% 6.1% $225 4.4% ‐3.2% 66
Tweed $360,000 5.9% 10.7% $320 4.6% ‐4.7% 56
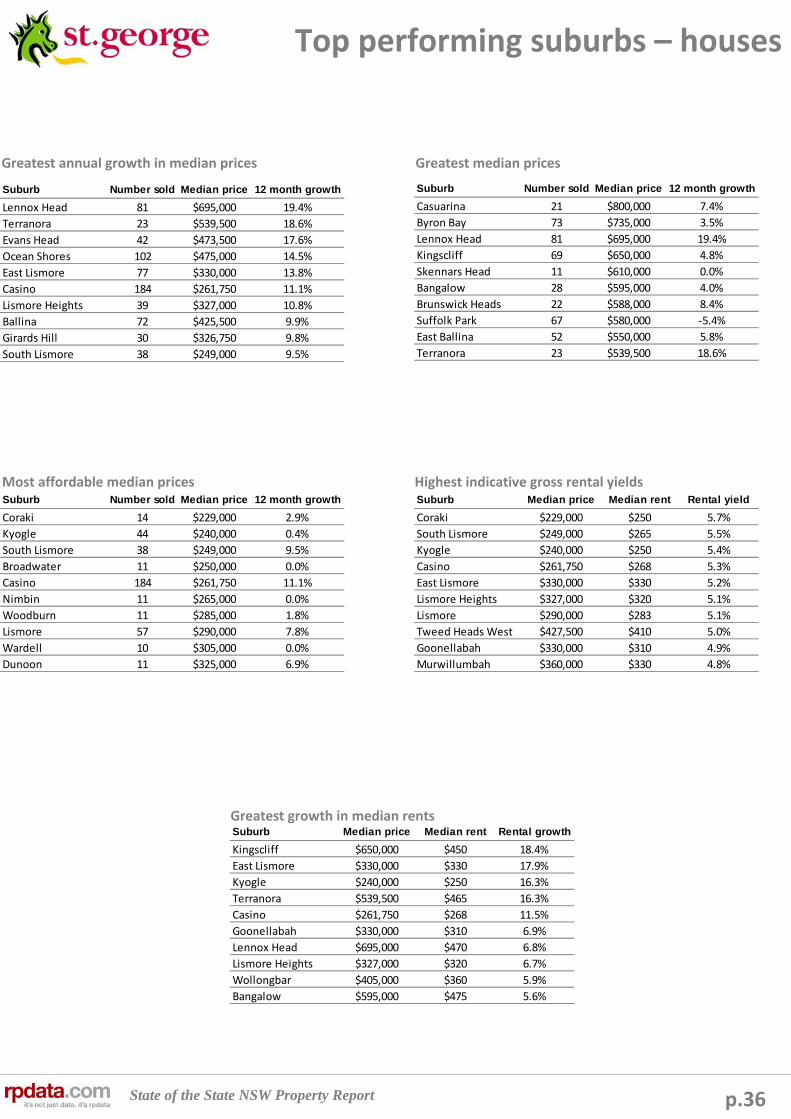
State of the State NSW Property Report
Suburb Median price Median rent Rental growth
Kingscliff $650,000 $450 18.4%
East Lismore $330,000 $330 17.9%
Kyogle $240,000 $250 16.3%
Terranora $539,500 $465 16.3%
Casino $261,750 $268 11.5%
Goonellabah $330,000 $310 6.9%
Lennox Head $695,000 $470 6.8%
Lismore Heights $327,000 $320 6.7%
Wollongbar $405,000 $360 5.9%
Bangalow $595,000 $475 5.6%
Suburb Median price Median rent Rental yield
Coraki $229,000 $250 5.7%
South Lismore $249,000 $265 5.5%
Kyogle $240,000 $250 5.4%
Casino $261,750 $268 5.3%
East Lismore $330,000 $330 5.2%
Lismore Heights $327,000 $320 5.1%
Lismore $290,000 $283 5.1%
Tweed Heads West $427,500 $410 5.0%
Goonellabah $330,000 $310 4.9%
Murwillumbah $360,000 $330 4.8%
Suburb Number sold Median price 12 month growth
Coraki 14 $229,000 2.9%
Kyogle 44 $240,000 0.4%
South Lismore 38 $249,000 9.5%
Broadwater 11 $250,000 0.0%
Casino 184 $261,750 11.1%
Nimbin 11 $265,000 0.0%
Woodburn 11 $285,000 1.8%
Lismore 57 $290,000 7.8%
Wardell 10 $305,000 0.0%
Dunoon 11 $325,000 6.9%
Suburb Number sold Median price 12 month growth
Casuarina 21 $800,000 7.4%
Byron Bay 73 $735,000 3.5%
Lennox Head 81 $695,000 19.4%
Kingscliff 69 $650,000 4.8%
Skennars Head 11 $610,000 0.0%
Bangalow 28 $595,000 4.0%
Brunswick Heads 22 $588,000 8.4%
Suffolk Park 67 $580,000 ‐5.4%
East Ballina 52 $550,000 5.8%
Terranora 23 $539,500 18.6%
Suburb Number sold Median price 12 month growth
Lennox Head 81 $695,000 19.4%
Terranora 23 $539,500 18.6%
Evans Head 42 $473,500 17.6%
Ocean Shores 102 $475,000 14.5%
East Lismore 77 $330,000 13.8%
Casino 184 $261,750 11.1%
Lismore Heights 39 $327,000 10.8%
Ballina 72 $425,500 9.9%
Girards Hill 30 $326,750 9.8%
South Lismore 38 $249,000 9.5%
p.36
Top performing suburbs – houses
Greatest annual growth in median prices Greatest median prices
Most affordable median prices Highest indicative gross rental yields
Greatest growth in median rents
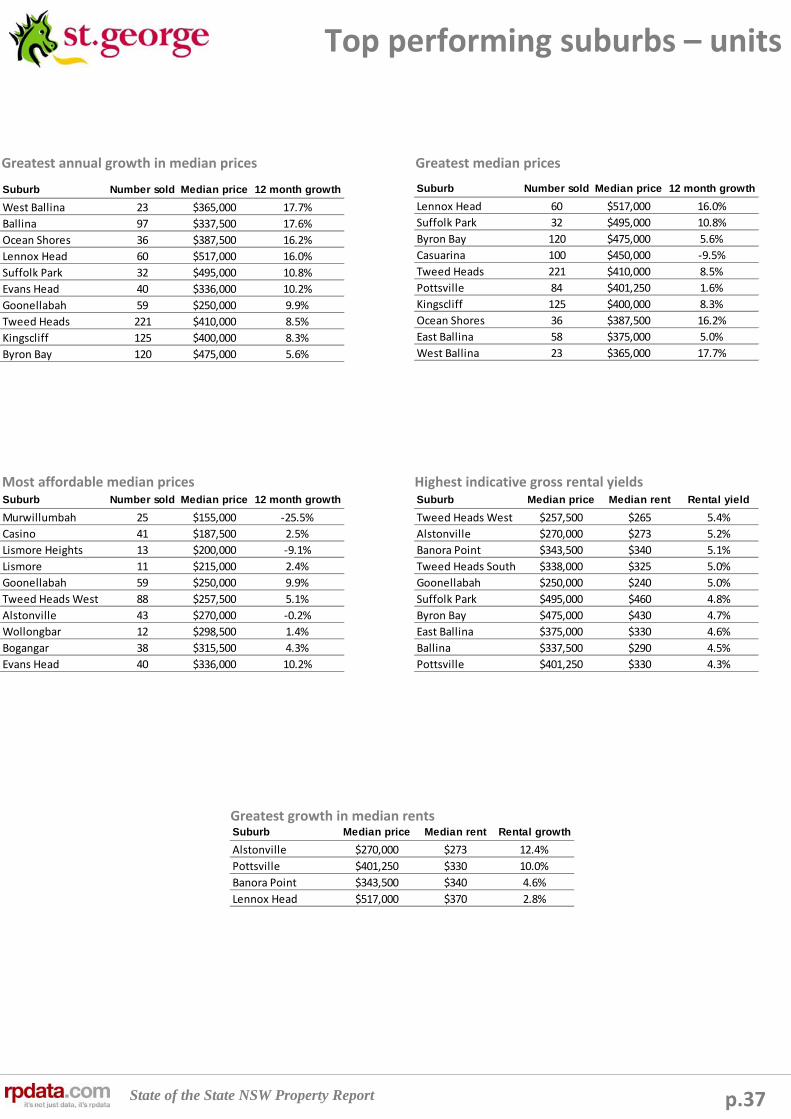
State of the State NSW Property Report
Suburb Median price Median rent Rental yield
Tweed Heads West $257,500 $265 5.4%
Alstonville $270,000 $273 5.2%
Banora Point $343,500 $340 5.1%
Tweed Heads South $338,000 $325 5.0%
Goonellabah $250,000 $240 5.0%
Suffolk Park $495,000 $460 4.8%
Byron Bay $475,000 $430 4.7%
East Ballina $375,000 $330 4.6%
Ballina $337,500 $290 4.5%
Pottsville $401,250 $330 4.3%
Suburb Number sold Median price 12 month growth
Murwillumbah 25 $155,000 ‐25.5%
Casino 41 $187,500 2.5%
Lismore Heights 13 $200,000 ‐9.1%
Lismore 11 $215,000 2.4%
Goonellabah 59 $250,000 9.9%
Tweed Heads West 88 $257,500 5.1%
Alstonville 43 $270,000 ‐0.2%
Wollongbar 12 $298,500 1.4%
Bogangar 38 $315,500 4.3%
Evans Head 40 $336,000 10.2%
Suburb Number sold Median price 12 month growth
Lennox Head 60 $517,000 16.0%
Suffolk Park 32 $495,000 10.8%
Byron Bay 120 $475,000 5.6%
Casuarina 100 $450,000 ‐9.5%
Tweed Heads 221 $410,000 8.5%
Pottsville 84 $401,250 1.6%
Kingscliff 125 $400,000 8.3%
Ocean Shores 36 $387,500 16.2%
East Ballina 58 $375,000 5.0%
West Ballina 23 $365,000 17.7%
Suburb Number sold Median price 12 month growth
West Ballina 23 $365,000 17.7%
Ballina 97 $337,500 17.6%
Ocean Shores 36 $387,500 16.2%
Lennox Head 60 $517,000 16.0%
Suffolk Park 32 $495,000 10.8%
Evans Head 40 $336,000 10.2%
Goonellabah 59 $250,000 9.9%
Tweed Heads 221 $410,000 8.5%
Kingscliff 125 $400,000 8.3%
Byron Bay 120 $475,000 5.6%
p.37
Top performing suburbs – units
Greatest annual growth in median prices Greatest median prices
Most affordable median prices Highest indicative gross rental yields
Greatest growth in median rentsSuburb Median price Median rent Rental growth
Alstonville $270,000 $273 12.4%
Pottsville $401,250 $330 10.0%
Banora Point $343,500 $340 4.6%
Lennox Head $517,000 $370 2.8%
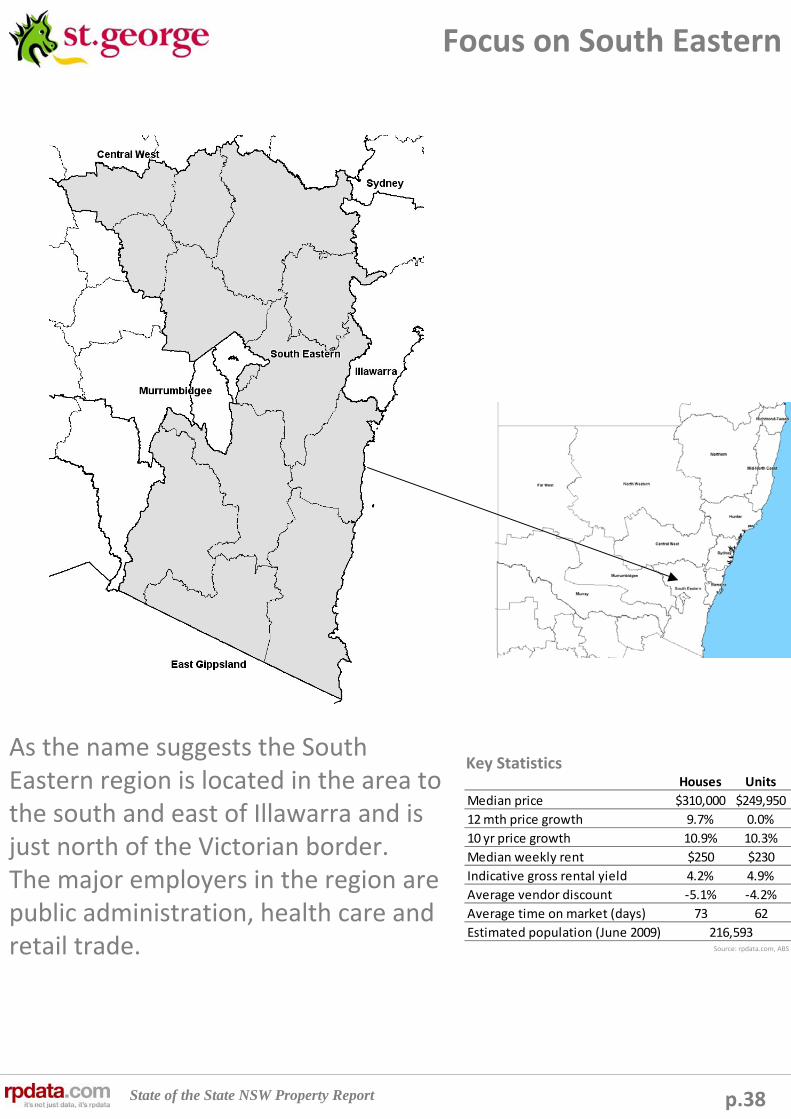
State of the State NSW Property Report
Houses Units
Median price $310,000 $249,950
12 mth price growth 9.7% 0.0%
10 yr price growth 10.9% 10.3%
Median weekly rent $250 $230
Indicative gross rental yield 4.2% 4.9%
Average vendor discount ‐5.1% ‐4.2%
Average time on market (days) 73 62
Estimated population (June 2009) 216,593
p.38
Focus on South Eastern
Key StatisticsAs the name suggests the South Eastern region is located in the area to the south and east of Illawarra and is just north of the Victorian border. The major employers in the region are public administration, health care and retail trade. Source: rpdata.com, ABS
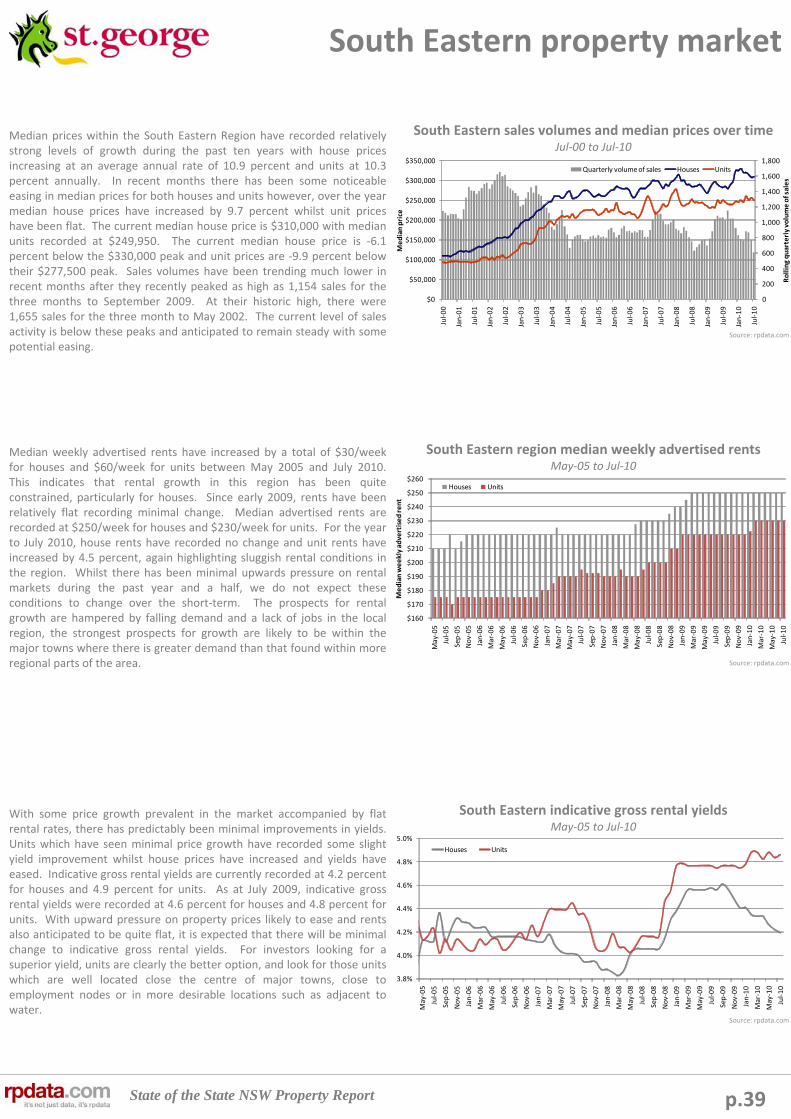
State of the State NSW Property Report
3.8%
4.0%
4.2%
4.4%
4.6%
4.8%
5.0%
May‐05
Jul‐05
Sep‐05
Nov‐05
Jan‐06
Mar‐06
May‐06
Jul‐06
Sep‐06
Nov‐06
Jan‐07
Mar‐07
May‐07
Jul‐07
Sep‐07
Nov‐07
Jan‐08
Mar‐08
May‐08
Jul‐08
Sep‐08
Nov‐08
Jan‐09
Mar‐09
May‐09
Jul‐09
Sep‐09
Nov‐09
Jan‐10
Mar‐10
May‐10
Jul‐10
Houses Units
$160
$170
$180
$190
$200
$210
$220
$230
$240
$250
$260
May‐05
Jul‐05
Sep‐05
Nov‐05
Jan‐06
Mar‐06
May‐06
Jul‐06
Sep‐06
Nov‐06
Jan‐07
Mar‐07
May‐07
Jul‐07
Sep‐07
Nov‐07
Jan‐08
Mar‐08
May‐08
Jul‐08
Sep‐08
Nov‐08
Jan‐09
Mar‐09
May‐09
Jul‐09
Sep‐09
Nov‐09
Jan‐10
Mar‐10
May‐10
Jul‐10
Median weekly advertised rent
Houses Units
0
200
400
600
800
1,000
1,200
1,400
1,600
1,800
$0
$50,000
$100,000
$150,000
$200,000
$250,000
$300,000
$350,000
Jul‐00
Jan‐01
Jul‐01
Jan‐02
Jul‐02
Jan‐03
Jul‐03
Jan‐04
Jul‐04
Jan‐05
Jul‐05
Jan‐06
Jul‐06
Jan‐07
Jul‐07
Jan‐08
Jul‐08
Jan‐09
Jul‐09
Jan‐10
Jul‐10
Rolling quarterly volume of sales
Median price
Quarterly volume of sales Houses Units
p.39
South Eastern property market
Median prices within the South Eastern Region have recorded relatively strong levels of growth during the past ten years with house prices increasing at an average annual rate of 10.9 percent and units at 10.3 percent annually. In recent months there has been some noticeable easing in median prices for both houses and units however, over the year median house prices have increased by 9.7 percent whilst unit prices have been flat. The current median house price is $310,000 with median units recorded at $249,950. The current median house price is ‐6.1 percent below the $330,000 peak and unit prices are ‐9.9 percent below their $277,500 peak. Sales volumes have been trending much lower in recent months after they recently peaked as high as 1,154 sales for the three months to September 2009. At their historic high, there were 1,655 sales for the three month to May 2002. The current level of sales activity is below these peaks and anticipated to remain steady with some potential easing.
Median weekly advertised rents have increased by a total of $30/week for houses and $60/week for units between May 2005 and July 2010. This indicates that rental growth in this region has been quite constrained, particularly for houses. Since early 2009, rents have been relatively flat recording minimal change. Median advertised rents are recorded at $250/week for houses and $230/week for units. For the year to July 2010, house rents have recorded no change and unit rents have increased by 4.5 percent, again highlighting sluggish rental conditions in the region. Whilst there has been minimal upwards pressure on rental markets during the past year and a half, we do not expect these conditions to change over the short‐term. The prospects for rental growth are hampered by falling demand and a lack of jobs in the local region, the strongest prospects for growth are likely to be within the major towns where there is greater demand than that found within more regional parts of the area.
With some price growth prevalent in the market accompanied by flat rental rates, there has predictably been minimal improvements in yields. Units which have seen minimal price growth have recorded some slight yield improvement whilst house prices have increased and yields have eased. Indicative gross rental yields are currently recorded at 4.2 percent for houses and 4.9 percent for units. As at July 2009, indicative gross rental yields were recorded at 4.6 percent for houses and 4.8 percent for units. With upward pressure on property prices likely to ease and rents also anticipated to be quite flat, it is expected that there will be minimal change to indicative gross rental yields. For investors looking for a superior yield, units are clearly the better option, and look for those units which are well located close the centre of major towns, close toemployment nodes or in more desirable locations such as adjacent to water.
South Eastern sales volumes and median prices over timeJul‐00 to Jul‐10
South Eastern region median weekly advertised rentsMay‐05 to Jul‐10
South Eastern indicative gross rental yieldsMay‐05 to Jul‐10
Source: rpdata.com
Source: rpdata.com
Source: rpdata.com

State of the State NSW Property Report
0102030405060708090
100
Jul‐04
Oct‐04
Jan‐05
Apr‐05
Jul‐05
Oct‐05
Jan‐06
Apr‐06
Jul‐06
Oct‐06
Jan‐07
Apr‐07
Jul‐07
Oct‐07
Jan‐08
Apr‐08
Jul‐08
Oct‐08
Jan‐09
Apr‐09
Jul‐09
Oct‐09
Jan‐10
Apr‐10
Jul‐10
0
20
40
60
80
100
120
Jul‐04
Oct‐04
Jan‐05
Apr‐05
Jul‐05
Oct‐05
Jan‐06
Apr‐06
Jul‐06
Oct‐06
Jan‐07
Apr‐07
Jul‐07
Oct‐07
Jan‐08
Apr‐08
Jul‐08
Oct‐08
Jan‐09
Apr‐09
Jul‐09
Oct‐09
Jan‐10
Apr‐10
Jul‐10
‐10.0%‐9.0%‐8.0%‐7.0%‐6.0%‐5.0%‐4.0%‐3.0%‐2.0%‐1.0%0.0%
Jul‐04
Oct‐04
Jan‐05
Apr‐05
Jul‐05
Oct‐05
Jan‐06
Apr‐06
Jul‐06
Oct‐06
Jan‐07
Apr‐07
Jul‐07
Oct‐07
Jan‐08
Apr‐08
Jul‐08
Oct‐08
Jan‐09
Apr‐09
Jul‐09
Oct‐09
Jan‐10
Apr‐10
Jul‐10
‐12.0%
‐10.0%
‐8.0%
‐6.0%
‐4.0%
‐2.0%
0.0%
Jul‐04
Oct‐04
Jan‐05
Apr‐05
Jul‐05
Oct‐05
Jan‐06
Apr‐06
Jul‐06
Oct‐06
Jan‐07
Apr‐07
Jul‐07
Oct‐07
Jan‐08
Apr‐08
Jul‐08
Oct‐08
Jan‐09
Apr‐09
Jul‐09
Oct‐09
Jan‐10
Apr‐10
Jul‐10
p.40
South Eastern property market
The adjacent graphs detail the level of vendor discounting for houses (blue) and units (grey) within the South Eastern region.
Vendor discounting across the South Eastern region of the state was recorded at ‐5.1 percent for houses during July 2010 which represents its lowest level of the past six years. At the same time last year, the average vendor discount within the region was recorded at ‐6.6 percent, indicating a significant improvement in selling conditions during the 12 months. The average vendor discount has been recorded at levels as high as ‐9.8 percent, (June 2005) and over the past six years the average level of discounting has been ‐7.3 percent.
For units within the South Eastern region, the average level of vendor discounting was ‐4.2 percent during July 2010 which was the lowest level of discounting over the six years analysed. During July 2009, vendor discounting was recorded at an average of ‐7.8 percent, this indicates that the market has improved dramatically and rapidly over the past 12 months. Vendor discounting has been recorded at an average of ‐6.0 percent during the past six years and the peak in discounting occurred during April 2009 at 8.7 percent.
The adjacent graphs detail the average time on market for property sales across the South Eastern region for houses (blue) and units (grey).
Houses within the South Eastern region have recorded an average time on the market of 87 days during the six years to July 2010. As at July 2010, it was taking an average of 73 days to sell a house in the local area. In comparison, during July 2009 it took an average of 83 days to sell. The current average time on market of 73 days represents the shortest time on market of any period during the past six years. At its peak, it was taking an average of 99 days to sell a house within the region during November 2005.
Units have recorded a much more noticeable decline in their average time on market than houses with the average time falling from 77 days during July 2009 to 62 days during July 2010. This decline supports the significant fall in vendor discounting that occurred over the same time frame . The current average time on market is the shortest average time on market of any month during the past six years. The average time on market for a unit in the region peaked at 88 days in August 2004 and over the six year period detailed the time on market has been recorded at an average of 80 days. The result indicates that currently, units are selling much quicker than they typically have over the past six years.
The local market and in particular the unit market has recorded a rapid and significant improvement in selling conditions during the past year affording buyers much less leverage. With the growth in the market slowing, it is anticipated that conditions will improve for buyers over the coming months albeit that there is likely to be fewer active buyers.
South Eastern region level of vendor discountingJul‐04 to Jul‐10
South Eastern region average time on marketJul‐04 to Jul‐10
Source: rpdata.com
Source: rpdata.com
Houses
Units
Houses
Units
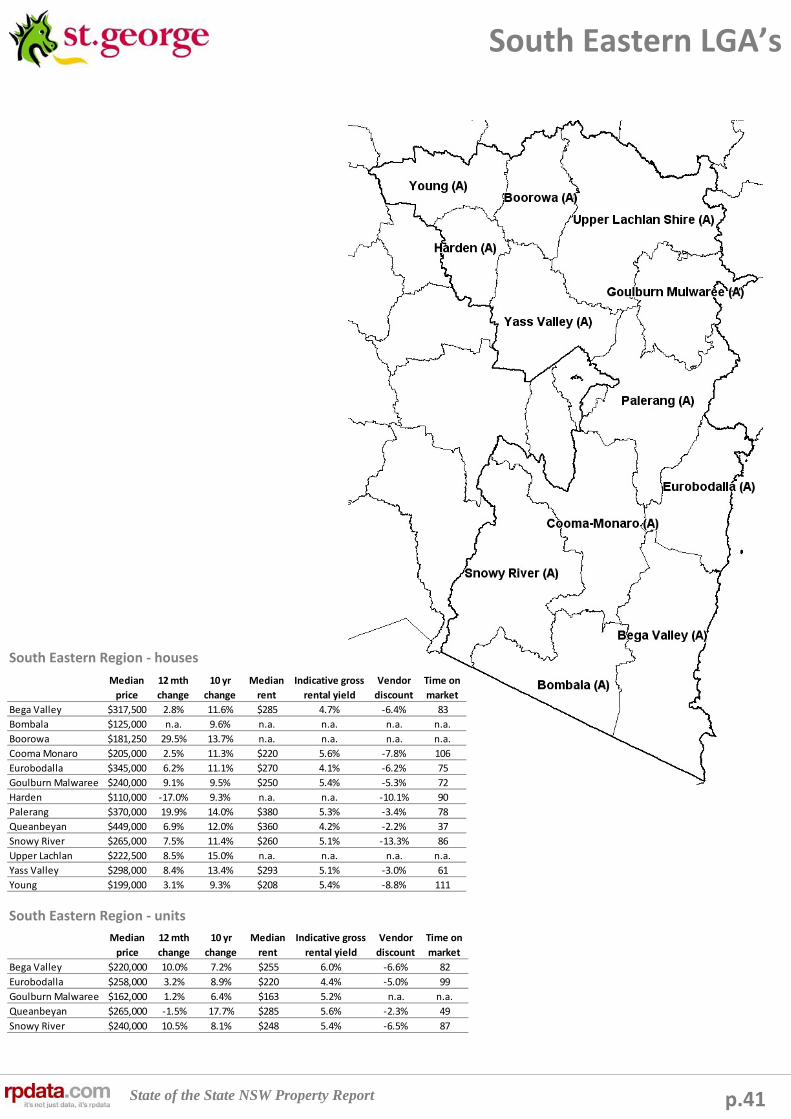
State of the State NSW Property Report p.41
South Eastern LGA’s
South Eastern Region ‐ units
South Eastern Region ‐ houses
Median
price
12 mth
change
10 yr
change
Median
rent
Indicative gross
rental yield
Vendor
discount
Time on
market
Bega Valley $317,500 2.8% 11.6% $285 4.7% ‐6.4% 83
Bombala $125,000 n.a. 9.6% n.a. n.a. n.a. n.a.
Boorowa $181,250 29.5% 13.7% n.a. n.a. n.a. n.a.
Cooma Monaro $205,000 2.5% 11.3% $220 5.6% ‐7.8% 106
Eurobodalla $345,000 6.2% 11.1% $270 4.1% ‐6.2% 75
Goulburn Malwaree $240,000 9.1% 9.5% $250 5.4% ‐5.3% 72
Harden $110,000 ‐17.0% 9.3% n.a. n.a. ‐10.1% 90
Palerang $370,000 19.9% 14.0% $380 5.3% ‐3.4% 78
Queanbeyan $449,000 6.9% 12.0% $360 4.2% ‐2.2% 37
Snowy River $265,000 7.5% 11.4% $260 5.1% ‐13.3% 86
Upper Lachlan $222,500 8.5% 15.0% n.a. n.a. n.a. n.a.
Yass Valley $298,000 8.4% 13.4% $293 5.1% ‐3.0% 61
Young $199,000 3.1% 9.3% $208 5.4% ‐8.8% 111
Median
price
12 mth
change
10 yr
change
Median
rent
Indicative gross
rental yield
Vendor
discount
Time on
market
Bega Valley $220,000 10.0% 7.2% $255 6.0% ‐6.6% 82
Eurobodalla $258,000 3.2% 8.9% $220 4.4% ‐5.0% 99
Goulburn Malwaree $162,000 1.2% 6.4% $163 5.2% n.a. n.a.
Queanbeyan $265,000 ‐1.5% 17.7% $285 5.6% ‐2.3% 49
Snowy River $240,000 10.5% 8.1% $248 5.4% ‐6.5% 87
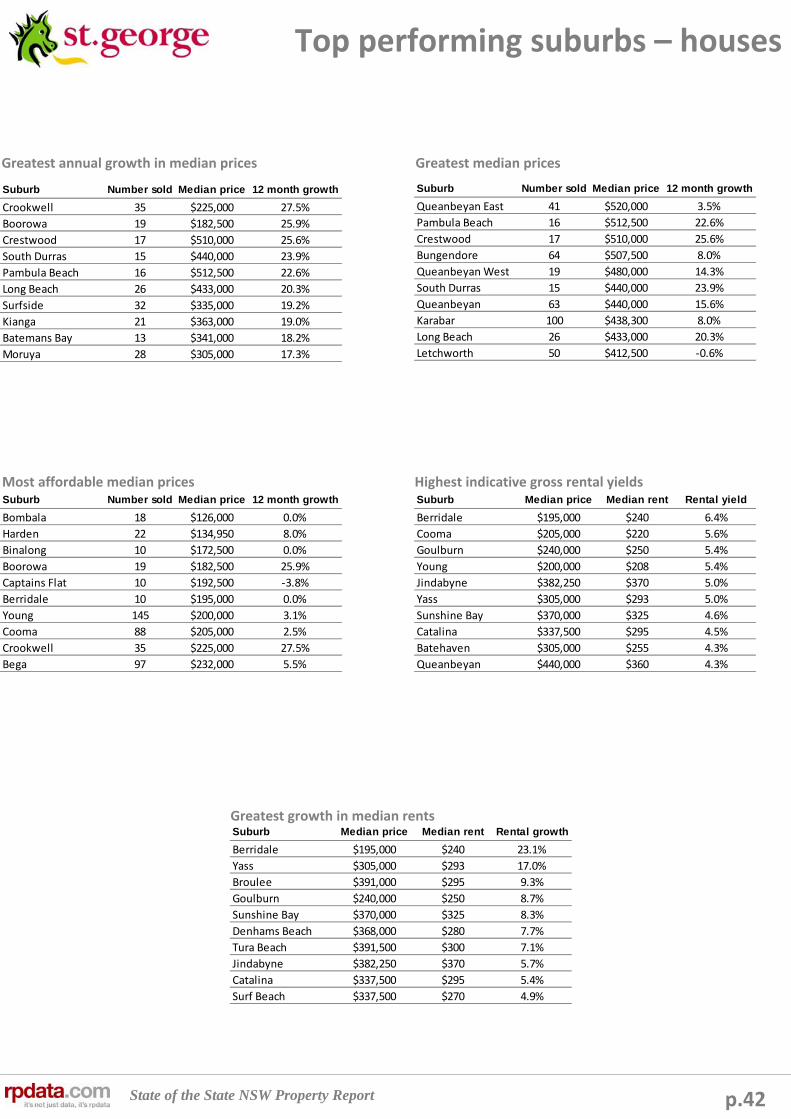
State of the State NSW Property Report
Suburb Median price Median rent Rental growth
Berridale $195,000 $240 23.1%
Yass $305,000 $293 17.0%
Broulee $391,000 $295 9.3%
Goulburn $240,000 $250 8.7%
Sunshine Bay $370,000 $325 8.3%
Denhams Beach $368,000 $280 7.7%
Tura Beach $391,500 $300 7.1%
Jindabyne $382,250 $370 5.7%
Catalina $337,500 $295 5.4%
Surf Beach $337,500 $270 4.9%
Suburb Median price Median rent Rental yield
Berridale $195,000 $240 6.4%
Cooma $205,000 $220 5.6%
Goulburn $240,000 $250 5.4%
Young $200,000 $208 5.4%
Jindabyne $382,250 $370 5.0%
Yass $305,000 $293 5.0%
Sunshine Bay $370,000 $325 4.6%
Catalina $337,500 $295 4.5%
Batehaven $305,000 $255 4.3%
Queanbeyan $440,000 $360 4.3%
Suburb Number sold Median price 12 month growth
Bombala 18 $126,000 0.0%
Harden 22 $134,950 8.0%
Binalong 10 $172,500 0.0%
Boorowa 19 $182,500 25.9%
Captains Flat 10 $192,500 ‐3.8%
Berridale 10 $195,000 0.0%
Young 145 $200,000 3.1%
Cooma 88 $205,000 2.5%
Crookwell 35 $225,000 27.5%
Bega 97 $232,000 5.5%
Suburb Number sold Median price 12 month growth
Queanbeyan East 41 $520,000 3.5%
Pambula Beach 16 $512,500 22.6%
Crestwood 17 $510,000 25.6%
Bungendore 64 $507,500 8.0%
Queanbeyan West 19 $480,000 14.3%
South Durras 15 $440,000 23.9%
Queanbeyan 63 $440,000 15.6%
Karabar 100 $438,300 8.0%
Long Beach 26 $433,000 20.3%
Letchworth 50 $412,500 ‐0.6%
Suburb Number sold Median price 12 month growth
Crookwell 35 $225,000 27.5%
Boorowa 19 $182,500 25.9%
Crestwood 17 $510,000 25.6%
South Durras 15 $440,000 23.9%
Pambula Beach 16 $512,500 22.6%
Long Beach 26 $433,000 20.3%
Surfside 32 $335,000 19.2%
Kianga 21 $363,000 19.0%
Batemans Bay 13 $341,000 18.2%
Moruya 28 $305,000 17.3%
p.42
Top performing suburbs – houses
Greatest annual growth in median prices Greatest median prices
Most affordable median prices Highest indicative gross rental yields
Greatest growth in median rents
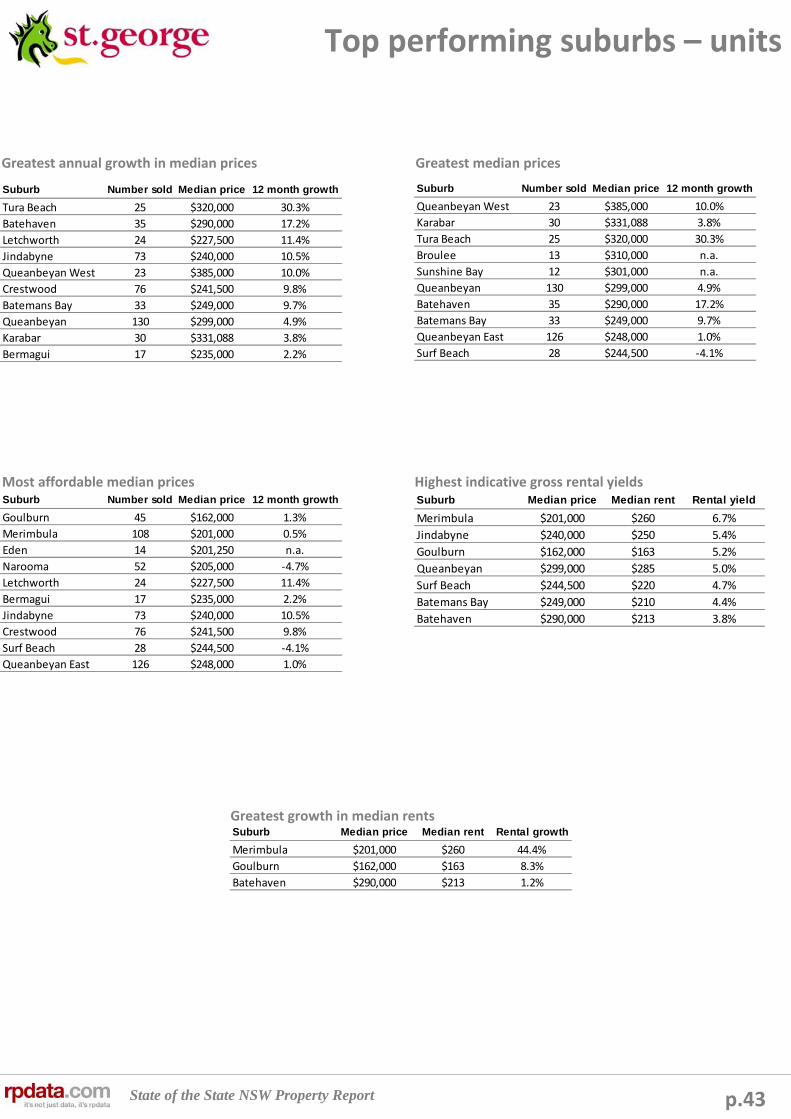
State of the State NSW Property Report
Suburb Number sold Median price 12 month growth
Goulburn 45 $162,000 1.3%
Merimbula 108 $201,000 0.5%
Eden 14 $201,250 n.a.
Narooma 52 $205,000 ‐4.7%
Letchworth 24 $227,500 11.4%
Bermagui 17 $235,000 2.2%
Jindabyne 73 $240,000 10.5%
Crestwood 76 $241,500 9.8%
Surf Beach 28 $244,500 ‐4.1%
Queanbeyan East 126 $248,000 1.0%
Suburb Number sold Median price 12 month growth
Queanbeyan West 23 $385,000 10.0%
Karabar 30 $331,088 3.8%
Tura Beach 25 $320,000 30.3%
Broulee 13 $310,000 n.a.
Sunshine Bay 12 $301,000 n.a.
Queanbeyan 130 $299,000 4.9%
Batehaven 35 $290,000 17.2%
Batemans Bay 33 $249,000 9.7%
Queanbeyan East 126 $248,000 1.0%
Surf Beach 28 $244,500 ‐4.1%
Suburb Number sold Median price 12 month growth
Tura Beach 25 $320,000 30.3%
Batehaven 35 $290,000 17.2%
Letchworth 24 $227,500 11.4%
Jindabyne 73 $240,000 10.5%
Queanbeyan West 23 $385,000 10.0%
Crestwood 76 $241,500 9.8%
Batemans Bay 33 $249,000 9.7%
Queanbeyan 130 $299,000 4.9%
Karabar 30 $331,088 3.8%
Bermagui 17 $235,000 2.2%
p.43
Top performing suburbs – units
Greatest annual growth in median prices Greatest median prices
Most affordable median prices Highest indicative gross rental yields
Greatest growth in median rents
Suburb Median price Median rent Rental yield
Merimbula $201,000 $260 6.7%
Jindabyne $240,000 $250 5.4%
Goulburn $162,000 $163 5.2%
Queanbeyan $299,000 $285 5.0%
Surf Beach $244,500 $220 4.7%
Batemans Bay $249,000 $210 4.4%
Batehaven $290,000 $213 3.8%
Suburb Median price Median rent Rental growth
Merimbula $201,000 $260 44.4%
Goulburn $162,000 $163 8.3%
Batehaven $290,000 $213 1.2%
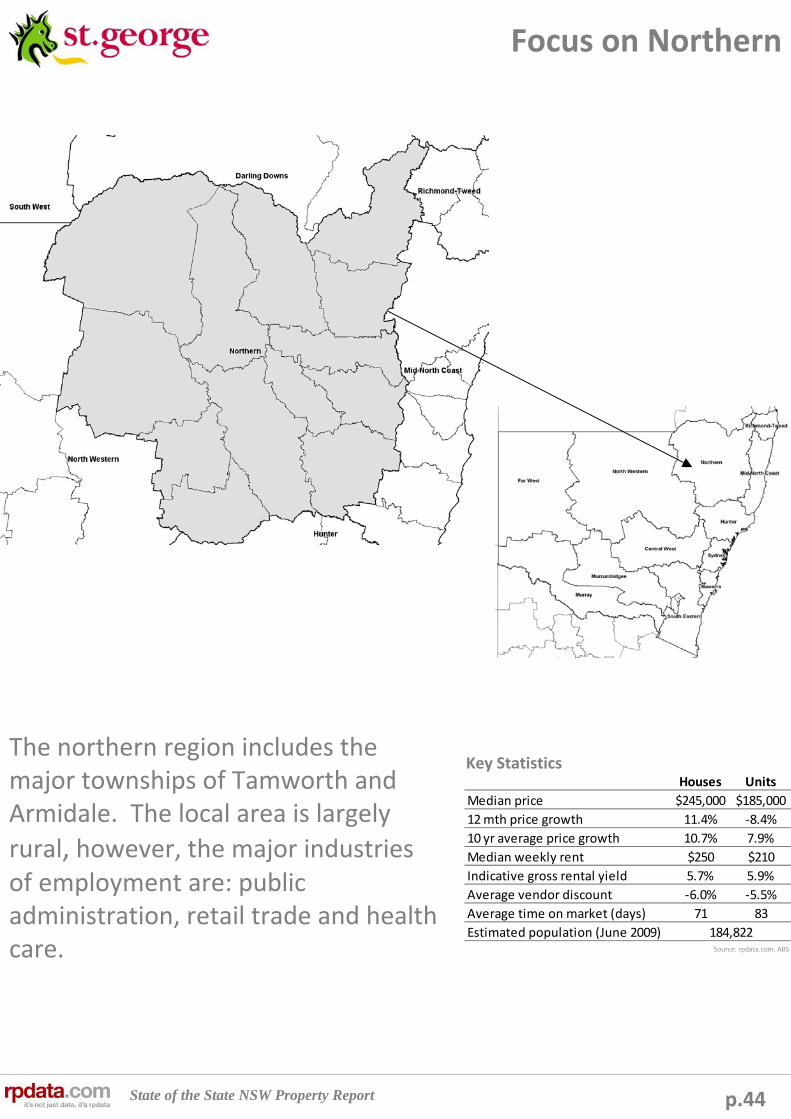
State of the State NSW Property Report
Houses Units
Median price $245,000 $185,000
12 mth price growth 11.4% ‐8.4%
10 yr average price growth 10.7% 7.9%
Median weekly rent $250 $210
Indicative gross rental yield 5.7% 5.9%
Average vendor discount ‐6.0% ‐5.5%
Average time on market (days) 71 83
Estimated population (June 2009) 184,822
p.44
Focus on Northern
Key StatisticsThe northern region includes the major townships of Tamworth and Armidale. The local area is largely
rural, however, the major industries of employment are: public administration, retail trade and health care. Source: rpdata.com, ABS

State of the State NSW Property Report
4.2%
4.7%
5.2%
5.7%
6.2%
6.7%
7.2%
May‐05
Jul‐05
Sep‐05
Nov‐05
Jan‐06
Mar‐06
May‐06
Jul‐06
Sep‐06
Nov‐06
Jan‐07
Mar‐07
May‐07
Jul‐07
Sep‐07
Nov‐07
Jan‐08
Mar‐08
May‐08
Jul‐08
Sep‐08
Nov‐08
Jan‐09
Mar‐09
May‐09
Jul‐09
Sep‐09
Nov‐09
Jan‐10
Mar‐10
May‐10
Jul‐10
Houses Units
$130
$150
$170
$190
$210
$230
$250
$270
May‐05
Jul‐05
Sep‐05
Nov‐05
Jan‐06
Mar‐06
May‐06
Jul‐06
Sep‐06
Nov‐06
Jan‐07
Mar‐07
May‐07
Jul‐07
Sep‐07
Nov‐07
Jan‐08
Mar‐08
May‐08
Jul‐08
Sep‐08
Nov‐08
Jan‐09
Mar‐09
May‐09
Jul‐09
Sep‐09
Nov‐09
Jan‐10
Mar‐10
May‐10
Jul‐10
Median weekly advertised rent
Houses Units
0
200
400
600
800
1,000
1,200
1,400
$0
$50,000
$100,000
$150,000
$200,000
$250,000
$300,000
Jul‐00
Jan‐01
Jul‐01
Jan‐02
Jul‐02
Jan‐03
Jul‐03
Jan‐04
Jul‐04
Jan‐05
Jul‐05
Jan‐06
Jul‐06
Jan‐07
Jul‐07
Jan‐08
Jul‐08
Jan‐09
Jul‐09
Jan‐10
Jul‐10
Rolling quarterly volume of sales
Median price
Quarterly volume of sales Houses Units
p.45
Northern property market
The Northern region of New South Wales has recorded quite strongaverage annual growth in median house prices over the past decade (10.4 percent) whilst unit median prices have grown at a much more moderate average annual rate of 7.9 percent. Current median prices are recorded at $245,000 for houses and $185,000 for units. Over the past 12 months median house prices have increased by 11.4 percent and median unit prices have fallen by ‐8.4 percent. Median house prices are recorded at their historic high currently whilst median unit prices are ‐19.6 percent below their historic high of $230,000 which suggest that there is limited demand for units in the region. Like many other regions across the state, the volume of sales is beginning to trend lower. Sales volume actually reached their highest levels since 2004 during 2009 with a peak of 808 sales for the three months to May 2009. Despite this increase in sales activity, volumes remained well below the peak of 1,173 sales during the September quarter. Currently sales activity is trending lower.
Rental growth within the Northern region has typically been well below average over the period highlighted. Median weekly advertised rents for houses has increased by a total of $30/week and unit rents are up by $55/week. Median rents for houses are currently recorded at $250/week and units at $210/week. Over the past year, median house rents have increased by 4.2 percent and unit rents have recorded a very strong level of growth at 13.5 percent. The strong growth in unit rents is likely due to the continuing emergence of unit product in the larger regional centressuch as Tamworth and Armidale, particularly close to the major university within Armidale. Growth in house rents has been quite subdued and this is largely due to a region such as this not having a particularly well established rental market. The best prospects of rental growth are probably going to be within the major regional centres and those mining townships scattered across the region.
Unlike most other regions analysed, the Northern Region has typically recorded superior indicative gross rental yields for houses to that of units. For houses, strong growth in prices and sluggish rental growth has resulted in an easing of indicative gross rental yields over the past year. Meanwhile, the fall in median prices and moderate growth in rents for units has boosted that product’s yields. Indicative gross rental yields are currently recorded at 5.7 percent for houses and 5.9 percent for units. Interestingly, June of this year was the first time over the period that yields for units eclipsed that of houses. Current market conditions do not appear to be particularly conducive to significant changes in rental yields and we would expect they will remain at their quite healthy levels. Similar to the rental market, major regional centres and mining towns with a short supply of housing are likely to have the strongest prospects for yield improvement.
Northern sales volumes and median prices over timeJul‐00 to Jul‐10
Northern region median weekly advertised rentsMay‐05 to Jul‐10
Northern region indicative gross rental yieldsMay‐05 to Jul‐10
Source: rpdata.com
Source: rpdata.com
Source: rpdata.com
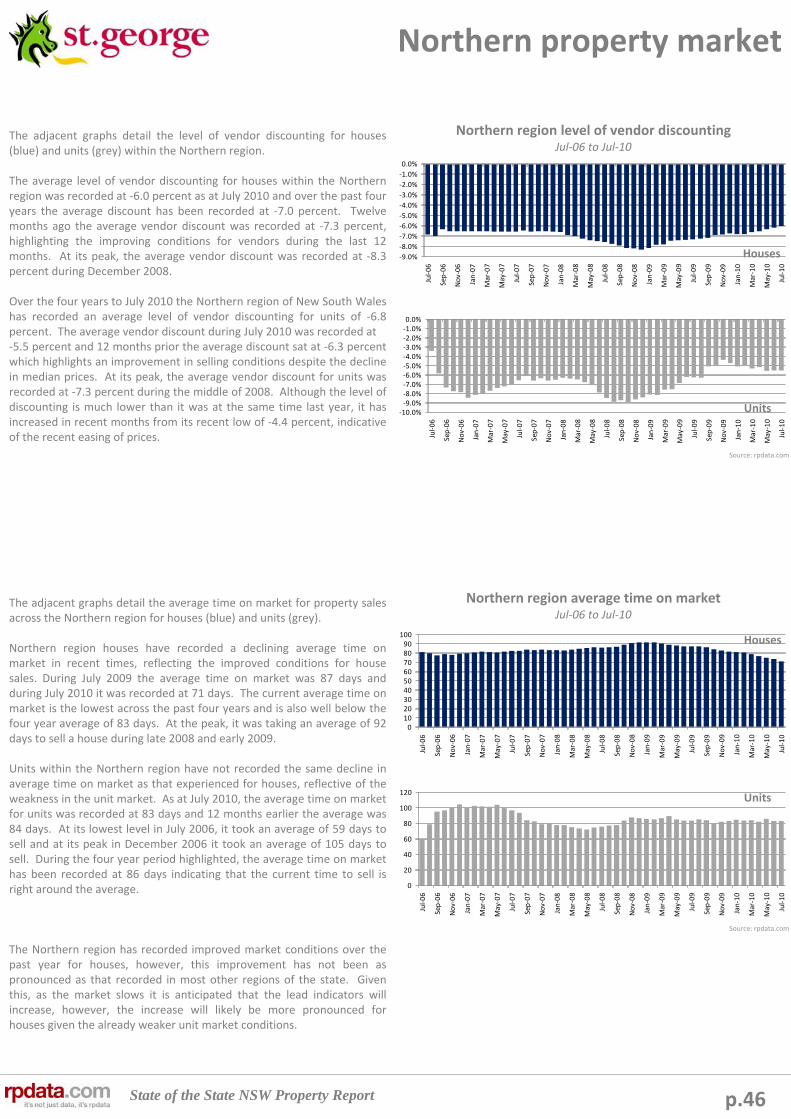
State of the State NSW Property Report
0
20
40
60
80
100
120
Jul‐06
Sep‐06
Nov‐06
Jan‐07
Mar‐07
May‐07
Jul‐07
Sep‐07
Nov‐07
Jan‐08
Mar‐08
May‐08
Jul‐08
Sep‐08
Nov‐08
Jan‐09
Mar‐09
May‐09
Jul‐09
Sep‐09
Nov‐09
Jan‐10
Mar‐10
May‐10
Jul‐10
0102030405060708090
100
Jul‐06
Sep‐06
Nov‐06
Jan‐07
Mar‐07
May‐07
Jul‐07
Sep‐07
Nov‐07
Jan‐08
Mar‐08
May‐08
Jul‐08
Sep‐08
Nov‐08
Jan‐09
Mar‐09
May‐09
Jul‐09
Sep‐09
Nov‐09
Jan‐10
Mar‐10
May‐10
Jul‐10
‐10.0%‐9.0%‐8.0%‐7.0%‐6.0%‐5.0%‐4.0%‐3.0%‐2.0%‐1.0%0.0%
Jul‐06
Sep‐06
Nov‐06
Jan‐07
Mar‐07
May‐07
Jul‐07
Sep‐07
Nov‐07
Jan‐08
Mar‐08
May‐08
Jul‐08
Sep‐08
Nov‐08
Jan‐09
Mar‐09
May‐09
Jul‐09
Sep‐09
Nov‐09
Jan‐10
Mar‐10
May‐10
Jul‐10
‐9.0%
‐8.0%
‐7.0%
‐6.0%
‐5.0%
‐4.0%
‐3.0%
‐2.0%
‐1.0%
0.0%
Jul‐06
Sep‐06
Nov‐06
Jan‐07
Mar‐07
May‐07
Jul‐07
Sep‐07
Nov‐07
Jan‐08
Mar‐08
May‐08
Jul‐08
Sep‐08
Nov‐08
Jan‐09
Mar‐09
May‐09
Jul‐09
Sep‐09
Nov‐09
Jan‐10
Mar‐10
May‐10
Jul‐10
p.46
Northern property market
The adjacent graphs detail the level of vendor discounting for houses (blue) and units (grey) within the Northern region.
The average level of vendor discounting for houses within the Northern region was recorded at ‐6.0 percent as at July 2010 and over the past four years the average discount has been recorded at ‐7.0 percent. Twelve months ago the average vendor discount was recorded at ‐7.3 percent, highlighting the improving conditions for vendors during the last 12 months. At its peak, the average vendor discount was recorded at ‐8.3 percent during December 2008.
Over the four years to July 2010 the Northern region of New South Wales has recorded an average level of vendor discounting for units of ‐6.8 percent. The average vendor discount during July 2010 was recorded at ‐5.5 percent and 12 months prior the average discount sat at ‐6.3 percent which highlights an improvement in selling conditions despite the decline in median prices. At its peak, the average vendor discount for units was recorded at ‐7.3 percent during the middle of 2008. Although the level of discounting is much lower than it was at the same time last year, it has increased in recent months from its recent low of ‐4.4 percent, indicative of the recent easing of prices.
The adjacent graphs detail the average time on market for property sales across the Northern region for houses (blue) and units (grey).
Northern region houses have recorded a declining average time onmarket in recent times, reflecting the improved conditions for house sales. During July 2009 the average time on market was 87 days and during July 2010 it was recorded at 71 days. The current average time on market is the lowest across the past four years and is also well below the four year average of 83 days. At the peak, it was taking an average of 92 days to sell a house during late 2008 and early 2009.
Units within the Northern region have not recorded the same decline in average time on market as that experienced for houses, reflective of the weakness in the unit market. As at July 2010, the average time on market for units was recorded at 83 days and 12 months earlier the average was 84 days. At its lowest level in July 2006, it took an average of 59 days to sell and at its peak in December 2006 it took an average of 105 days to sell. During the four year period highlighted, the average time on market has been recorded at 86 days indicating that the current time to sell is right around the average.
The Northern region has recorded improved market conditions over the past year for houses, however, this improvement has not been as pronounced as that recorded in most other regions of the state. Given this, as the market slows it is anticipated that the lead indicators will increase, however, the increase will likely be more pronounced for houses given the already weaker unit market conditions.
Northern region level of vendor discountingJul‐06 to Jul‐10
Northern region average time on marketJul‐06 to Jul‐10
Source: rpdata.com
Source: rpdata.com
Houses
Units
Houses
Units
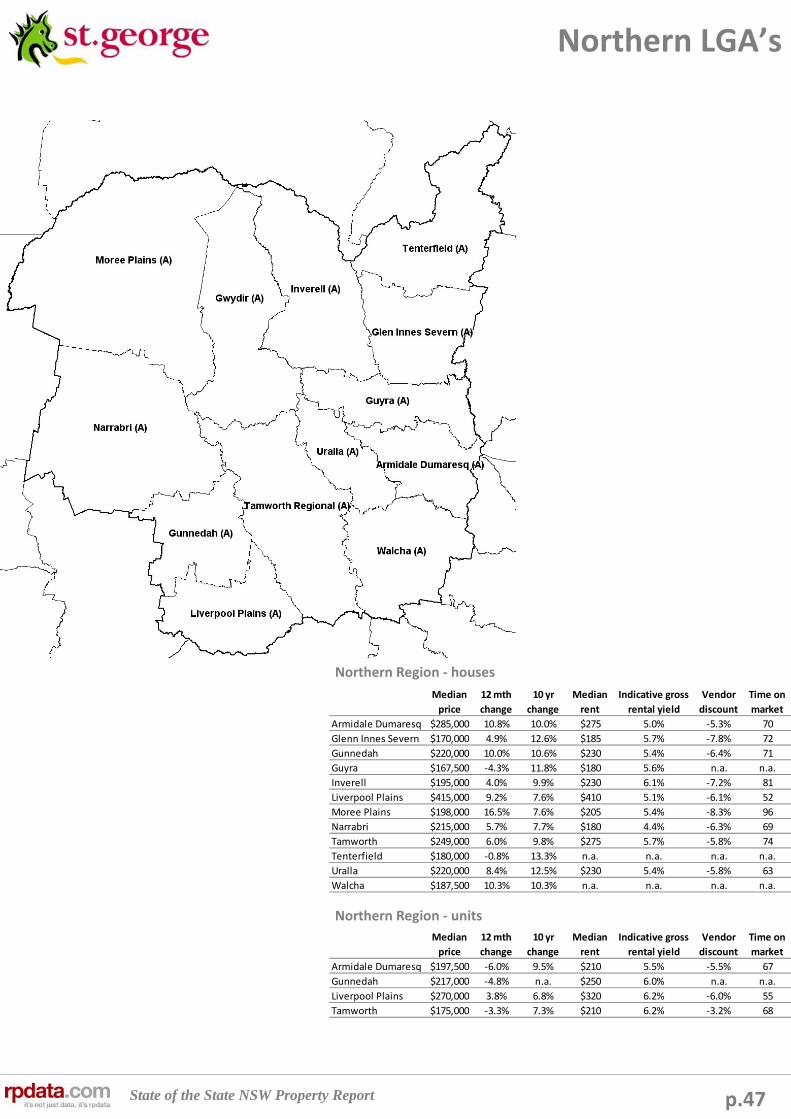
State of the State NSW Property Report p.47
Northern LGA’s
Northern Region ‐ units
Northern Region ‐ houses
Median
price
12 mth
change
10 yr
change
Median
rent
Indicative gross
rental yield
Vendor
discount
Time on
market
Armidale Dumaresq $285,000 10.8% 10.0% $275 5.0% ‐5.3% 70
Glenn Innes Severn $170,000 4.9% 12.6% $185 5.7% ‐7.8% 72
Gunnedah $220,000 10.0% 10.6% $230 5.4% ‐6.4% 71
Guyra $167,500 ‐4.3% 11.8% $180 5.6% n.a. n.a.
Inverell $195,000 4.0% 9.9% $230 6.1% ‐7.2% 81
Liverpool Plains $415,000 9.2% 7.6% $410 5.1% ‐6.1% 52
Moree Plains $198,000 16.5% 7.6% $205 5.4% ‐8.3% 96
Narrabri $215,000 5.7% 7.7% $180 4.4% ‐6.3% 69
Tamworth $249,000 6.0% 9.8% $275 5.7% ‐5.8% 74
Tenterfield $180,000 ‐0.8% 13.3% n.a. n.a. n.a. n.a.
Uralla $220,000 8.4% 12.5% $230 5.4% ‐5.8% 63
Walcha $187,500 10.3% 10.3% n.a. n.a. n.a. n.a.
Median
price
12 mth
change
10 yr
change
Median
rent
Indicative gross
rental yield
Vendor
discount
Time on
market
Armidale Dumaresq $197,500 ‐6.0% 9.5% $210 5.5% ‐5.5% 67
Gunnedah $217,000 ‐4.8% n.a. $250 6.0% n.a. n.a.
Liverpool Plains $270,000 3.8% 6.8% $320 6.2% ‐6.0% 55
Tamworth $175,000 ‐3.3% 7.3% $210 6.2% ‐3.2% 68

State of the State NSW Property Report
Suburb Median price Median rent Rental growth
Kootingal $220,000 $270 17.4%
Armidale $285,000 $280 14.3%
Oxley Vale $271,000 $290 11.5%
Calala $315,000 $300 11.1%
Inverell $199,000 $235 9.3%
Werris Creek $136,000 $180 9.1%
Guyra $185,000 $180 9.1%
South Tamworth $212,000 $250 8.7%
North Tamworth $250,000 $280 7.7%
East Tamworth $305,000 $300 7.1%
Suburb Median price Median rent Rental yield
Werris Creek $136,000 $180 6.9%
Kootingal $220,000 $270 6.4%
Inverell $199,000 $235 6.1%
South Tamworth $212,000 $250 6.1%
West Tamworth $208,000 $240 6.0%
Westdale $240,000 $270 5.9%
North Tamworth $250,000 $280 5.8%
Glen Innes $175,000 $190 5.6%
Oxley Vale $271,000 $290 5.6%
Gunnedah $220,000 $235 5.6%
Suburb Number sold Median price 12 month growth
Barraba 19 $95,000 ‐17.4%
Wee Waa 25 $135,000 ‐6.9%
Werris Creek 25 $136,000 26.5%
Boggabri 14 $137,250 0.0%
Bingara 15 $152,000 38.2%
Manilla 36 $156,250 ‐5.3%
Quirindi 20 $169,000 12.7%
Glen Innes 110 $175,000 4.3%
Walcha 17 $180,000 5.3%
Guyra 19 $185,000 3.9%
Suburb Number sold Median price 12 month growth
Hillvue 127 $325,000 1.9%
Calala 43 $315,000 20.6%
East Tamworth 118 $305,000 7.0%
Armidale 352 $285,000 10.5%
Oxley Vale 72 $271,000 1.5%
Narrabri 90 $256,250 12.0%
North Tamworth 59 $250,000 9.8%
Westdale 39 $240,000 4.3%
Uralla 36 $222,500 8.5%
Gunnedah 169 $220,000 8.9%
Suburb Number sold Median price 12 month growth
Bingara 15 $152,000 38.2%
Werris Creek 25 $136,000 26.5%
West Tamworth 109 $208,000 21.3%
Calala 43 $315,000 20.6%
Quirindi 20 $169,000 12.7%
Narrabri 90 $256,250 12.0%
Moree 127 $205,000 11.9%
Armidale 352 $285,000 10.5%
North Tamworth 59 $250,000 9.8%
Gunnedah 169 $220,000 8.9%
p.48
Top performing suburbs – houses
Greatest annual growth in median prices Greatest median prices
Most affordable median prices Highest indicative gross rental yields
Greatest growth in median rents

State of the State NSW Property Report p.49
Top performing suburbs – units
Suburb Number sold Median price 12 month growth Median rent Rental yield Rental growth
Gunnedah 16 $217,000 ‐4.8% $250 6.0% 38.9%
East Tamworth 21 $200,000 2.8% $230 6.0% 9.5%
Armidale 64 $197,500 ‐4.8% $210 5.5% 20.0%
North Tamworth 24 $189,000 6.2% $230 6.3% 15.0%
West Tamworth 11 $157,000 n.a. $210 7.0% n.a
South Tamworth 23 $143,000 ‐7.7% $190 6.9% 5.6%

State of the State NSW Property Report
Houses Units
Median price $236,500 $212,500
12 mth price growth 7.5% 11.8%
10 yr annual price growth 9.2% 5.9%
Median weekly rent $240 $200
Indicative gross rental yield 5.4% 5.2%
Average vendor discount ‐6.2% ‐4.3%
Average time on market (days) 77 67
Estimated population (June 2009) 183,157
p.50
Focus on Central West
Key StatisticsThe Central West region is west of Sydney and Hunter and includes the major townships of Bathurst, Lithgow and Orange. The rural regions main industries of employment are: agriculture, retail trade and health care. Source: rpdata.com, ABS

State of the State NSW Property Report
4.2%
4.4%
4.6%
4.8%
5.0%
5.2%
5.4%
5.6%
5.8%
May‐05
Jul‐05
Sep‐05
Nov‐05
Jan‐06
Mar‐06
May‐06
Jul‐06
Sep‐06
Nov‐06
Jan‐07
Mar‐07
May‐07
Jul‐07
Sep‐07
Nov‐07
Jan‐08
Mar‐08
May‐08
Jul‐08
Sep‐08
Nov‐08
Jan‐09
Mar‐09
May‐09
Jul‐09
Sep‐09
Nov‐09
Jan‐10
Mar‐10
May‐10
Jul‐10
Houses Units
$150
$160
$170
$180
$190
$200
$210
$220
$230
$240
$250
May‐05
Jul‐05
Sep‐05
Nov‐05
Jan‐06
Mar‐06
May‐06
Jul‐06
Sep‐06
Nov‐06
Jan‐07
Mar‐07
May‐07
Jul‐07
Sep‐07
Nov‐07
Jan‐08
Mar‐08
May‐08
Jul‐08
Sep‐08
Nov‐08
Jan‐09
Mar‐09
May‐09
Jul‐09
Sep‐09
Nov‐09
Jan‐10
Mar‐10
May‐10
Jul‐10
Median weekly advertised rent
Houses Units
0
200
400
600
800
1,000
1,200
1,400
$0
$50,000
$100,000
$150,000
$200,000
$250,000
$300,000
Jul‐00
Jan‐01
Jul‐01
Jan‐02
Jul‐02
Jan‐03
Jul‐03
Jan‐04
Jul‐04
Jan‐05
Jul‐05
Jan‐06
Jul‐06
Jan‐07
Jul‐07
Jan‐08
Jul‐08
Jan‐09
Jul‐09
Jan‐10
Jul‐10
Rolling quarterly volume of sales
Median price
Quarterly volume of sales Houses Units
p.51
Central West property market
The average annual rate of property price growth within the Central West region has been quite moderate over the past decade with house prices increasing by 9.2 percent and units by 5.9 percent. The current median house price is recorded at $236,500 whilst the median unit price is $212,500, indicating minimal differentiation in prices. Over the past year, median house prices have increased by 7.5 percent and median unit prices are up by 11.8 percent. Despite the reasonably strong growth in house and unit prices over the past year, median house prices are ‐5.1 percent below their peak of $249,250 and unit prices are ‐1.2 percent below their $215,000 peak. Sales volumes in the region have begun to ease in recent months and are at levels similar to those experienced during the GFC. On a quarterly basis, sales volumes peaked at 1,236 over the three months to May 2003. Sales volumes rebounded well during 2009 and at one point reached their highest levels since 2004.
Rental growth in the Central West Region has not been particularly strong over the period detailed. Between May 2005 and July 2010, median house rents have increased by a total of $45/week and units haveincreased by $30/week. The current median weekly advertised rent for a house is $240 and for units it is $200. During the past 12 months rental growth has actually been relatively strong at 6.7 percent for houses and 5.3 percent for units. Although this region doesn’t typically have a very significant rental market, areas in the major townships of Orange, Bathurst and Lithgow are most likely to have the strongest prospects for further rental growth. In a region such as this, we would also expect that houses will have significantly greater rental demand than that for units.
Between May 2005 and July 2010, indicative gross rental yields for houses within the Central West region have generally been superior to those of units, however, units are not widely located across the region. Indicative gross rental yields are currently recorded at 5.4 percent for houses and 5.2 percent for units. During July 2009 indicative rental yields were recorded at 5.3 percent for houses and 4.9 percent for units. The growth in prices and rents has resulted in some yield improvement during the past 12 months. In regional areas such as Central West, units are typically in short supply and for investors and renters there is usually a preference for houses from renters. As a result, it is expected that houses will continue to enjoy superior rental yields over the coming years.
Central West sales volumes and median prices over timeJul‐00 to Jul‐10
Central West region median weekly advertised rentsMay‐05 to Jul‐10
Central West indicative gross rental yieldsMay‐05 to Jul‐10
Source: rpdata.com
Source: rpdata.com
Source: rpdata.com
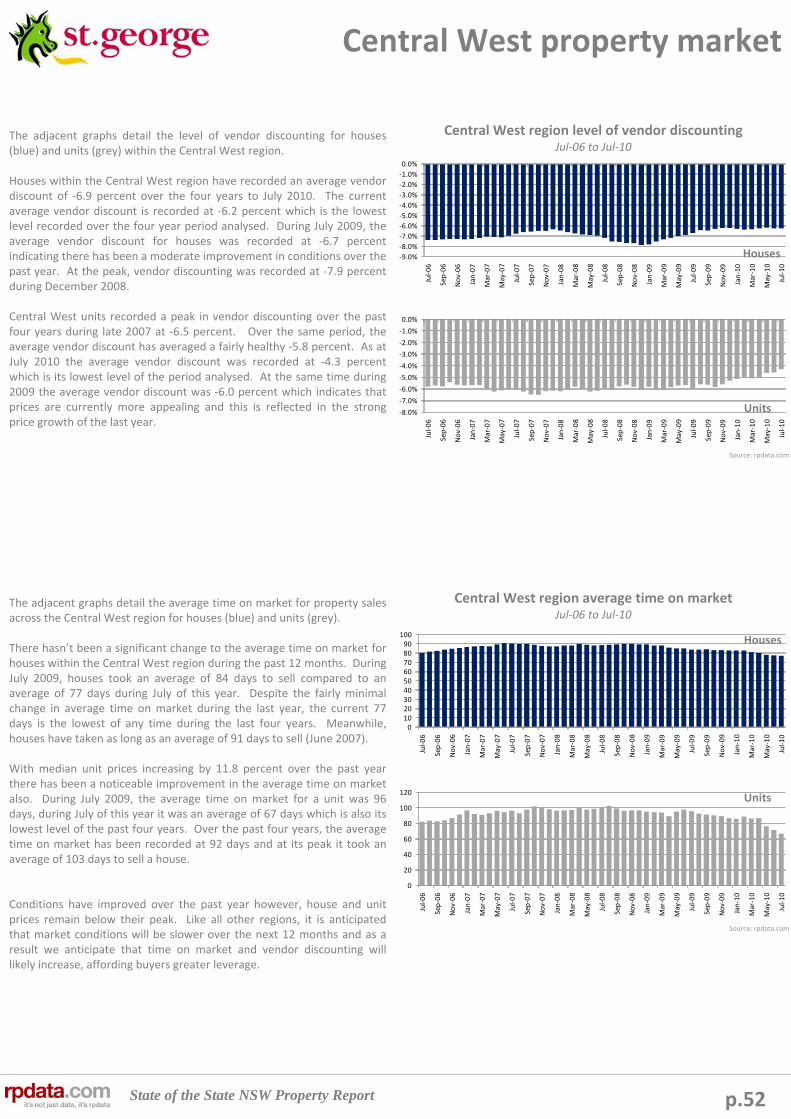
State of the State NSW Property Report
0
20
40
60
80
100
120
Jul‐06
Sep‐06
Nov‐06
Jan‐07
Mar‐07
May‐07
Jul‐07
Sep‐07
Nov‐07
Jan‐08
Mar‐08
May‐08
Jul‐08
Sep‐08
Nov‐08
Jan‐09
Mar‐09
May‐09
Jul‐09
Sep‐09
Nov‐09
Jan‐10
Mar‐10
May‐10
Jul‐10
0102030405060708090
100
Jul‐06
Sep‐06
Nov‐06
Jan‐07
Mar‐07
May‐07
Jul‐07
Sep‐07
Nov‐07
Jan‐08
Mar‐08
May‐08
Jul‐08
Sep‐08
Nov‐08
Jan‐09
Mar‐09
May‐09
Jul‐09
Sep‐09
Nov‐09
Jan‐10
Mar‐10
May‐10
Jul‐10
‐8.0%
‐7.0%
‐6.0%
‐5.0%
‐4.0%
‐3.0%
‐2.0%
‐1.0%
0.0%
Jul‐06
Sep‐06
Nov‐06
Jan‐07
Mar‐07
May‐07
Jul‐07
Sep‐07
Nov‐07
Jan‐08
Mar‐08
May‐08
Jul‐08
Sep‐08
Nov‐08
Jan‐09
Mar‐09
May‐09
Jul‐09
Sep‐09
Nov‐09
Jan‐10
Mar‐10
May‐10
Jul‐10
‐9.0%
‐8.0%
‐7.0%
‐6.0%
‐5.0%
‐4.0%
‐3.0%
‐2.0%
‐1.0%
0.0%
Jul‐06
Sep‐06
Nov‐06
Jan‐07
Mar‐07
May‐07
Jul‐07
Sep‐07
Nov‐07
Jan‐08
Mar‐08
May‐08
Jul‐08
Sep‐08
Nov‐08
Jan‐09
Mar‐09
May‐09
Jul‐09
Sep‐09
Nov‐09
Jan‐10
Mar‐10
May‐10
Jul‐10
p.52
Central West property market
The adjacent graphs detail the level of vendor discounting for houses (blue) and units (grey) within the Central West region.
Houses within the Central West region have recorded an average vendor discount of ‐6.9 percent over the four years to July 2010. The current average vendor discount is recorded at ‐6.2 percent which is the lowest level recorded over the four year period analysed. During July 2009, the average vendor discount for houses was recorded at ‐6.7 percent indicating there has been a moderate improvement in conditions over the past year. At the peak, vendor discounting was recorded at ‐7.9 percent during December 2008.
Central West units recorded a peak in vendor discounting over the past four years during late 2007 at ‐6.5 percent. Over the same period, the average vendor discount has averaged a fairly healthy ‐5.8 percent. As at July 2010 the average vendor discount was recorded at ‐4.3 percent which is its lowest level of the period analysed. At the same time during 2009 the average vendor discount was ‐6.0 percent which indicates that prices are currently more appealing and this is reflected in the strong price growth of the last year.
The adjacent graphs detail the average time on market for property sales across the Central West region for houses (blue) and units (grey).
There hasn’t been a significant change to the average time on market for houses within the Central West region during the past 12 months. During July 2009, houses took an average of 84 days to sell compared to an average of 77 days during July of this year. Despite the fairly minimal change in average time on market during the last year, the current 77 days is the lowest of any time during the last four years. Meanwhile, houses have taken as long as an average of 91 days to sell (June 2007).
With median unit prices increasing by 11.8 percent over the past year there has been a noticeable improvement in the average time on market also. During July 2009, the average time on market for a unit was 96 days, during July of this year it was an average of 67 days which is also its lowest level of the past four years. Over the past four years, the average time on market has been recorded at 92 days and at its peak it took an average of 103 days to sell a house.
Conditions have improved over the past year however, house and unit prices remain below their peak. Like all other regions, it is anticipated that market conditions will be slower over the next 12 months and as a result we anticipate that time on market and vendor discounting will likely increase, affording buyers greater leverage.
Central West region level of vendor discountingJul‐06 to Jul‐10
Central West region average time on marketJul‐06 to Jul‐10
Source: rpdata.com
Source: rpdata.com
Houses
Units
Houses
Units
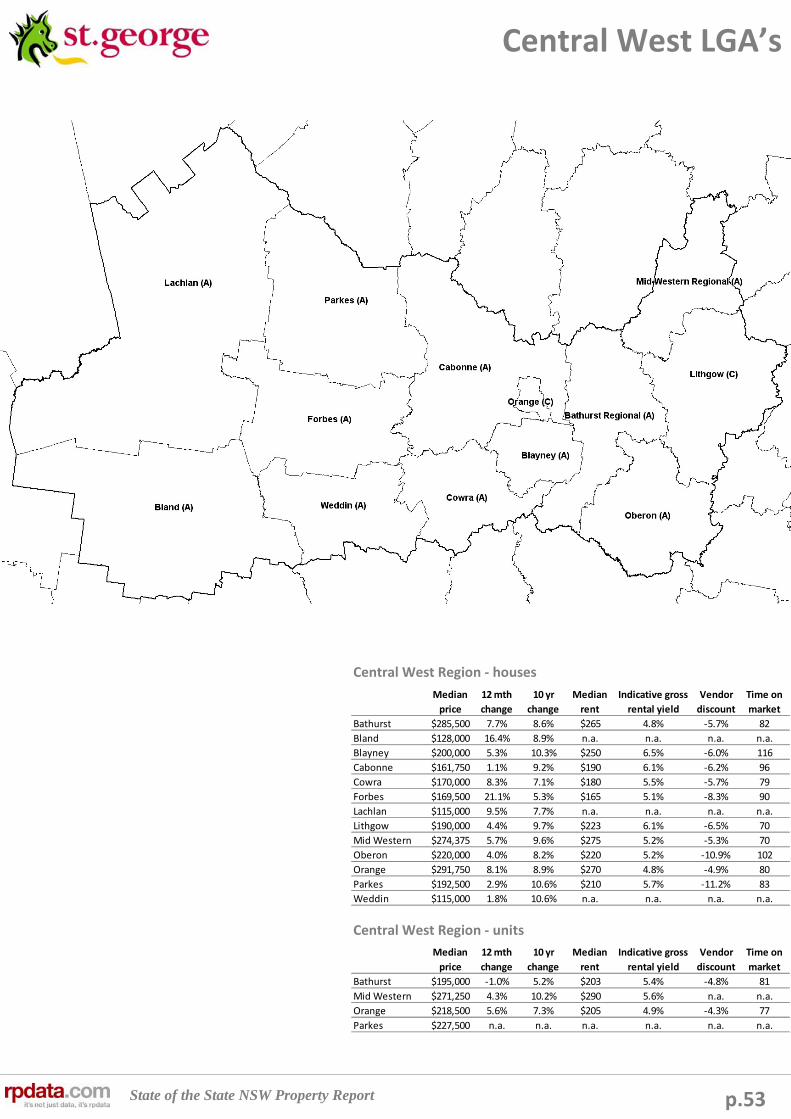
State of the State NSW Property Report
Median
price
12 mth
change
10 yr
change
Median
rent
Indicative gross
rental yield
Vendor
discount
Time on
market
Bathurst $285,500 7.7% 8.6% $265 4.8% ‐5.7% 82
Bland $128,000 16.4% 8.9% n.a. n.a. n.a. n.a.
Blayney $200,000 5.3% 10.3% $250 6.5% ‐6.0% 116
Cabonne $161,750 1.1% 9.2% $190 6.1% ‐6.2% 96
Cowra $170,000 8.3% 7.1% $180 5.5% ‐5.7% 79
Forbes $169,500 21.1% 5.3% $165 5.1% ‐8.3% 90
Lachlan $115,000 9.5% 7.7% n.a. n.a. n.a. n.a.
Lithgow $190,000 4.4% 9.7% $223 6.1% ‐6.5% 70
Mid Western $274,375 5.7% 9.6% $275 5.2% ‐5.3% 70
Oberon $220,000 4.0% 8.2% $220 5.2% ‐10.9% 102
Orange $291,750 8.1% 8.9% $270 4.8% ‐4.9% 80
Parkes $192,500 2.9% 10.6% $210 5.7% ‐11.2% 83
Weddin $115,000 1.8% 10.6% n.a. n.a. n.a. n.a.
p.53
Central West LGA’s
Central West Region ‐ units
Central West Region ‐ houses
Median
price
12 mth
change
10 yr
change
Median
rent
Indicative gross
rental yield
Vendor
discount
Time on
market
Bathurst $195,000 ‐1.0% 5.2% $203 5.4% ‐4.8% 81
Mid Western $271,250 4.3% 10.2% $290 5.6% n.a. n.a.
Orange $218,500 5.6% 7.3% $205 4.9% ‐4.3% 77
Parkes $227,500 n.a. n.a. n.a. n.a. n.a. n.a.
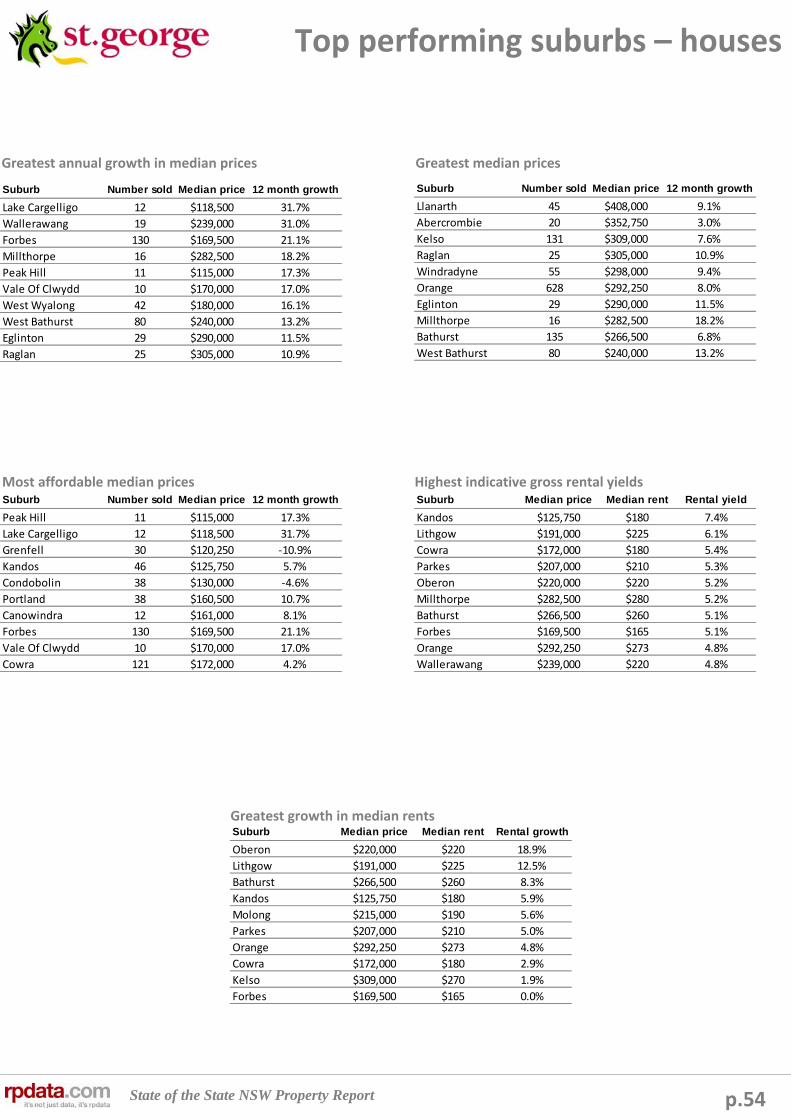
State of the State NSW Property Report
Suburb Median price Median rent Rental growth
Oberon $220,000 $220 18.9%
Lithgow $191,000 $225 12.5%
Bathurst $266,500 $260 8.3%
Kandos $125,750 $180 5.9%
Molong $215,000 $190 5.6%
Parkes $207,000 $210 5.0%
Orange $292,250 $273 4.8%
Cowra $172,000 $180 2.9%
Kelso $309,000 $270 1.9%
Forbes $169,500 $165 0.0%
Suburb Median price Median rent Rental yield
Kandos $125,750 $180 7.4%
Lithgow $191,000 $225 6.1%
Cowra $172,000 $180 5.4%
Parkes $207,000 $210 5.3%
Oberon $220,000 $220 5.2%
Millthorpe $282,500 $280 5.2%
Bathurst $266,500 $260 5.1%
Forbes $169,500 $165 5.1%
Orange $292,250 $273 4.8%
Wallerawang $239,000 $220 4.8%
Suburb Number sold Median price 12 month growth
Peak Hill 11 $115,000 17.3%
Lake Cargelligo 12 $118,500 31.7%
Grenfell 30 $120,250 ‐10.9%
Kandos 46 $125,750 5.7%
Condobolin 38 $130,000 ‐4.6%
Portland 38 $160,500 10.7%
Canowindra 12 $161,000 8.1%
Forbes 130 $169,500 21.1%
Vale Of Clwydd 10 $170,000 17.0%
Cowra 121 $172,000 4.2%
Suburb Number sold Median price 12 month growth
Llanarth 45 $408,000 9.1%
Abercrombie 20 $352,750 3.0%
Kelso 131 $309,000 7.6%
Raglan 25 $305,000 10.9%
Windradyne 55 $298,000 9.4%
Orange 628 $292,250 8.0%
Eglinton 29 $290,000 11.5%
Millthorpe 16 $282,500 18.2%
Bathurst 135 $266,500 6.8%
West Bathurst 80 $240,000 13.2%
Suburb Number sold Median price 12 month growth
Lake Cargelligo 12 $118,500 31.7%
Wallerawang 19 $239,000 31.0%
Forbes 130 $169,500 21.1%
Millthorpe 16 $282,500 18.2%
Peak Hill 11 $115,000 17.3%
Vale Of Clwydd 10 $170,000 17.0%
West Wyalong 42 $180,000 16.1%
West Bathurst 80 $240,000 13.2%
Eglinton 29 $290,000 11.5%
Raglan 25 $305,000 10.9%
p.54
Top performing suburbs – houses
Greatest annual growth in median prices Greatest median prices
Most affordable median prices Highest indicative gross rental yields
Greatest growth in median rents

State of the State NSW Property Report p.55
Top performing suburbs – units
Suburb Number sold Median price 12 month growth Median rent Rental yield Rental growth
Parkes 13 $227,500 n.a. n.a. n.a. n.a.
Orange 85 $218,500 5.6% $205 4.9% 2.5%
Bathurst 87 $199,000 1.5% $203 5.3% 9.5%
Kelso 16 $130,750 ‐24.2% n.a. n.a. n.a.

State of the State NSW Property Report
Houses Units
Median price $250,000 $213,000
12 mth price growth 8.7% 10.9%
10 yr average price growth 9.6% 7.9%
Median weekly rent $275 $230
Indicative gross rental yield 5.7% 5.4%
Average vendor discount ‐5.8% ‐3.8%
Average time on market (days) 66 58
Estimated population (June 2009) 158,593
p.56
Focus on Murrumbidgee
Key StatisticsThe Murrumbidgee region takes in the major population areas of Wagga Wagga and Griffith and is north of the Murray region and south of the Central West. The major local industries of employment are: agriculture, retail trade and manufacturing
Source: rpdata.com, ABS

State of the State NSW Property Report
4.0%
4.2%
4.4%
4.6%
4.8%
5.0%
5.2%
5.4%
5.6%
5.8%
6.0%
Sep‐05
Dec‐05
Mar‐06
Jun‐06
Sep‐06
Dec‐06
Mar‐07
Jun‐07
Sep‐07
Dec‐07
Mar‐08
Jun‐08
Sep‐08
Dec‐08
Mar‐09
Jun‐09
Sep‐09
Dec‐09
Mar‐10
Jun‐10
Houses Units
$140
$160
$180
$200
$220
$240
$260
$280
$300
Sep‐05
Nov‐05
Jan‐06
Mar‐06
May‐06
Jul‐06
Sep‐06
Nov‐06
Jan‐07
Mar‐07
May‐07
Jul‐07
Sep‐07
Nov‐07
Jan‐08
Mar‐08
May‐08
Jul‐08
Sep‐08
Nov‐08
Jan‐09
Mar‐09
May‐09
Jul‐09
Sep‐09
Nov‐09
Jan‐10
Mar‐10
May‐10
Jul‐10
Median weekly advertised rent
Houses Units
0
100
200
300
400
500
600
700
800
900
1,000
$0
$50,000
$100,000
$150,000
$200,000
$250,000
$300,000
Jul‐00
Jan‐01
Jul‐01
Jan‐02
Jul‐02
Jan‐03
Jul‐03
Jan‐04
Jul‐04
Jan‐05
Jul‐05
Jan‐06
Jul‐06
Jan‐07
Jul‐07
Jan‐08
Jul‐08
Jan‐09
Jul‐09
Jan‐10
Jul‐10
Rolling quarterly volume of sales
Median price
Quarterly volume of sales Houses Units
p.57
Murrumbidgee property market
Across the Murrumbidgee region, median home prices have recorded moderate growth over the past 10 years, house prices have increased at an above average annual rate of 9.6 percent and units have recorded lower growth of 7.9 percent pa. As at July 2010, the median house price was recorded at $250,000 and the median unit price at $213,000. During the 12 months to July 2010, median house prices have recorded below average growth of 8.7 percent and median unit prices have recorded above average growth of 10.9 percent. Despite the fact that prices have grown over the past year, there has been some easing in recent months. Median house prices are currently ‐4.9 percent below their peak and unit prices are ‐11.3 percent below the peak. Like most of the areas detailed in recent months, the volume of sales has been easing quite noticeably. At the peak of sales activity, the quarterly volume of sales was recorded at 919 sales for the three months to November 2003. There was a spike in sales activity during 2009 with 788 sales during the July quarter.
Rental growth for houses in the Murrumbidgee region has been quite strong between September 2005 and July 2010, whilst unit rents have recorded much more moderate rental growth conditions. Over the period, house rents have increased by a total of $105/week and unit rents have recorded an increase of $55/week. Median advertised rents for houses across the region are currently recorded at $275/week and unit rents are $230/week. Over the last year, rental growth has actually been moderate for houses (5.8 percent) whilst unit rents have recorded comparatively strong growth of 9.5 percent. The size of the region’s rental market has been growing in recent years and it is expected that the major townships are likely to have strongest demand for rental properties, in particular those properties which are located in the more desirable areas close to shops, schools and employment nodes.
Indicative gross rental yields within the Murrumbidgee region are quite strong due to relatively affordable dwelling prices coupled with high rents in comparison to property prices. Current indicative gross rental yields for houses are recorded at 5.7 percent and for units they are 5.4 percent. Twelve months ago, yields were recorded at slightly higher levels of 5.8 percent for houses and 5.6 percent for units, The growth in both rents and prices over the last 12 months has resulted in an easing of rental yields, however, they remain at quite appealing levels. Like a number of rural markets, Murrumbidgee houses are recording superior yields to that of units. As is the case with rents, we expect the strongest yields to be afforded to those properties which are both relatively affordable and well located close to the centre of major townships.
Murrumbidgee sales volumes and median prices over timeJul‐00 to Jul‐10
Murrumbidgee region median weekly advertised rentsSep‐05 to Jul‐10
Murrumbidgee indicative gross rental yieldsMay‐05 to Jul‐10
Source: rpdata.com
Source: rpdata.com
Source: rpdata.com
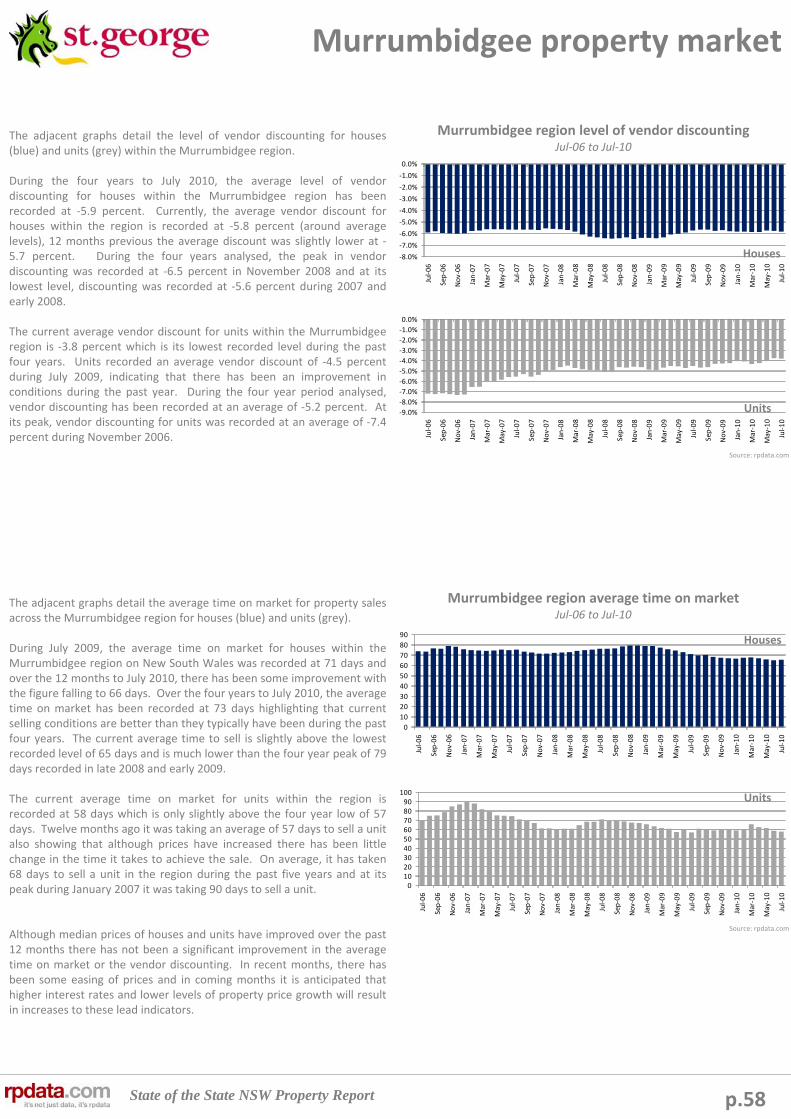
State of the State NSW Property Report
0102030405060708090
100
Jul‐06
Sep‐06
Nov‐06
Jan‐07
Mar‐07
May‐07
Jul‐07
Sep‐07
Nov‐07
Jan‐08
Mar‐08
May‐08
Jul‐08
Sep‐08
Nov‐08
Jan‐09
Mar‐09
May‐09
Jul‐09
Sep‐09
Nov‐09
Jan‐10
Mar‐10
May‐10
Jul‐10
0
10
20
30
40
50
60
70
80
90
Jul‐06
Sep‐06
Nov‐06
Jan‐07
Mar‐07
May‐07
Jul‐07
Sep‐07
Nov‐07
Jan‐08
Mar‐08
May‐08
Jul‐08
Sep‐08
Nov‐08
Jan‐09
Mar‐09
May‐09
Jul‐09
Sep‐09
Nov‐09
Jan‐10
Mar‐10
May‐10
Jul‐10
‐9.0%
‐8.0%
‐7.0%
‐6.0%
‐5.0%
‐4.0%
‐3.0%
‐2.0%
‐1.0%
0.0%
Jul‐06
Sep‐06
Nov‐06
Jan‐07
Mar‐07
May‐07
Jul‐07
Sep‐07
Nov‐07
Jan‐08
Mar‐08
May‐08
Jul‐08
Sep‐08
Nov‐08
Jan‐09
Mar‐09
May‐09
Jul‐09
Sep‐09
Nov‐09
Jan‐10
Mar‐10
May‐10
Jul‐10
‐8.0%
‐7.0%
‐6.0%
‐5.0%
‐4.0%
‐3.0%
‐2.0%
‐1.0%
0.0%
Jul‐06
Sep‐06
Nov‐06
Jan‐07
Mar‐07
May‐07
Jul‐07
Sep‐07
Nov‐07
Jan‐08
Mar‐08
May‐08
Jul‐08
Sep‐08
Nov‐08
Jan‐09
Mar‐09
May‐09
Jul‐09
Sep‐09
Nov‐09
Jan‐10
Mar‐10
May‐10
Jul‐10
p.58
Murrumbidgee property market
The adjacent graphs detail the level of vendor discounting for houses (blue) and units (grey) within the Murrumbidgee region.
During the four years to July 2010, the average level of vendor discounting for houses within the Murrumbidgee region has been recorded at ‐5.9 percent. Currently, the average vendor discount for houses within the region is recorded at ‐5.8 percent (around average levels), 12 months previous the average discount was slightly lower at ‐5.7 percent. During the four years analysed, the peak in vendor discounting was recorded at ‐6.5 percent in November 2008 and at its lowest level, discounting was recorded at ‐5.6 percent during 2007 and early 2008.
The current average vendor discount for units within the Murrumbidgeeregion is ‐3.8 percent which is its lowest recorded level during the past four years. Units recorded an average vendor discount of ‐4.5 percent during July 2009, indicating that there has been an improvement in conditions during the past year. During the four year period analysed, vendor discounting has been recorded at an average of ‐5.2 percent. At its peak, vendor discounting for units was recorded at an average of ‐7.4 percent during November 2006.
The adjacent graphs detail the average time on market for property sales across the Murrumbidgee region for houses (blue) and units (grey).
During July 2009, the average time on market for houses within theMurrumbidgee region on New South Wales was recorded at 71 days and over the 12 months to July 2010, there has been some improvement with the figure falling to 66 days. Over the four years to July 2010, the average time on market has been recorded at 73 days highlighting that current selling conditions are better than they typically have been during the past four years. The current average time to sell is slightly above the lowest recorded level of 65 days and is much lower than the four year peak of 79 days recorded in late 2008 and early 2009.
The current average time on market for units within the region is recorded at 58 days which is only slightly above the four year low of 57 days. Twelve months ago it was taking an average of 57 days to sell a unit also showing that although prices have increased there has been little change in the time it takes to achieve the sale. On average, it has taken 68 days to sell a unit in the region during the past five years and at its peak during January 2007 it was taking 90 days to sell a unit.
Although median prices of houses and units have improved over the past 12 months there has not been a significant improvement in the average time on market or the vendor discounting. In recent months, there has been some easing of prices and in coming months it is anticipated that higher interest rates and lower levels of property price growth will result in increases to these lead indicators.
Murrumbidgee region level of vendor discountingJul‐06 to Jul‐10
Murrumbidgee region average time on marketJul‐06 to Jul‐10
Source: rpdata.com
Source: rpdata.com
Houses
Units
Houses
Units
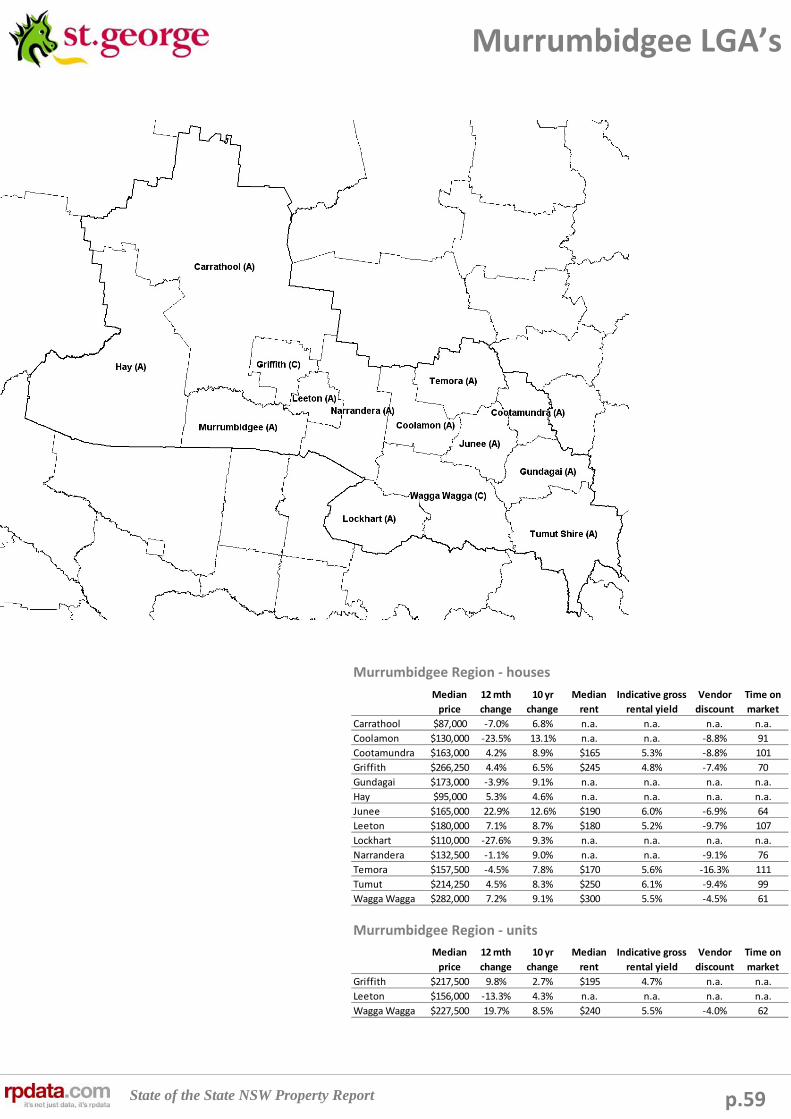
State of the State NSW Property Report
Median
price
12 mth
change
10 yr
change
Median
rent
Indicative gross
rental yield
Vendor
discount
Time on
market
Carrathool $87,000 ‐7.0% 6.8% n.a. n.a. n.a. n.a.
Coolamon $130,000 ‐23.5% 13.1% n.a. n.a. ‐8.8% 91
Cootamundra $163,000 4.2% 8.9% $165 5.3% ‐8.8% 101
Griffith $266,250 4.4% 6.5% $245 4.8% ‐7.4% 70
Gundagai $173,000 ‐3.9% 9.1% n.a. n.a. n.a. n.a.
Hay $95,000 5.3% 4.6% n.a. n.a. n.a. n.a.
Junee $165,000 22.9% 12.6% $190 6.0% ‐6.9% 64
Leeton $180,000 7.1% 8.7% $180 5.2% ‐9.7% 107
Lockhart $110,000 ‐27.6% 9.3% n.a. n.a. n.a. n.a.
Narrandera $132,500 ‐1.1% 9.0% n.a. n.a. ‐9.1% 76
Temora $157,500 ‐4.5% 7.8% $170 5.6% ‐16.3% 111
Tumut $214,250 4.5% 8.3% $250 6.1% ‐9.4% 99
Wagga Wagga $282,000 7.2% 9.1% $300 5.5% ‐4.5% 61
p.59
Murrumbidgee LGA’s
Murrumbidgee Region ‐ units
Murrumbidgee Region ‐ houses
Median
price
12 mth
change
10 yr
change
Median
rent
Indicative gross
rental yield
Vendor
discount
Time on
market
Griffith $217,500 9.8% 2.7% $195 4.7% n.a. n.a.
Leeton $156,000 ‐13.3% 4.3% n.a. n.a. n.a. n.a.
Wagga Wagga $227,500 19.7% 8.5% $240 5.5% ‐4.0% 62

State of the State NSW Property Report
Suburb Median price Median rent Rental growth
Tolland $260,000 $260 36.8%
Gundagai $186,500 $200 25.0%
Bourkelands $377,500 $410 22.4%
Ashmont $188,000 $240 20.0%
Estella $303,500 $340 13.3%
Kooringal $265,000 $310 12.7%
Lake Albert $291,500 $320 10.3%
Forest Hill $256,000 $270 10.2%
Glenfield Park $314,000 $320 6.7%
Griffith $270,000 $245 6.5%
Suburb Median price Median rent Rental yield
Hillston $87,000 $265 6.7%
Hay $95,000 $240 6.6%
Lockhart $110,000 $310 6.1%
Ganmain $113,000 $190 6.0%
Batlow $135,000 $225 6.0%
Coolamon $150,000 $260 5.9%
Narrandera $156,000 $340 5.8%
Temora $157,500 $320 5.7%
Cootamundra $164,750 $410 5.6%
Junee $165,000 $170 5.6%
Suburb Number sold Median price 12 month growth
Hillston 10 $87,000 ‐7.0%
Hay 37 $95,000 5.0%
Lockhart 11 $110,000 ‐27.6%
Ganmain 10 $113,000 0.0%
Batlow 13 $135,000 3.8%
Coolamon 15 $150,000 ‐16.7%
Narrandera 66 $156,000 2.6%
Temora 79 $157,500 ‐5.1%
Cootamundra 134 $164,750 5.3%
Junee 71 $165,000 22.9%
Suburb Number sold Median price 12 month growth
Tatton 48 $405,500 1.4%
Bourkelands 71 $377,500 4.2%
Lloyd 17 $330,000 17.2%
Turvey Park 80 $320,000 20.8%
Glenfield Park 137 $314,000 10.2%
Wagga Wagga 124 $310,000 3.1%
Estella 38 $303,500 ‐4.6%
Lake Albert 78 $291,500 8.9%
Griffith 220 $270,000 3.5%
Kooringal 138 $265,000 10.3%
Suburb Number sold Median price 12 month growth
Junee 71 $165,000 22.9%
Turvey Park 80 $320,000 20.8%
Lloyd 17 $330,000 17.2%
Forest Hill 37 $256,000 14.2%
Tolland 77 $260,000 13.0%
Kooringal 138 $265,000 10.3%
Glenfield Park 137 $314,000 10.2%
Adelong 10 $196,500 9.9%
Lake Albert 78 $291,500 8.9%
Leeton 89 $190,000 8.6%
p.60
Top performing suburbs – houses
Greatest annual growth in median prices Greatest median prices
Most affordable median prices Highest indicative gross rental yields
Greatest growth in median rents
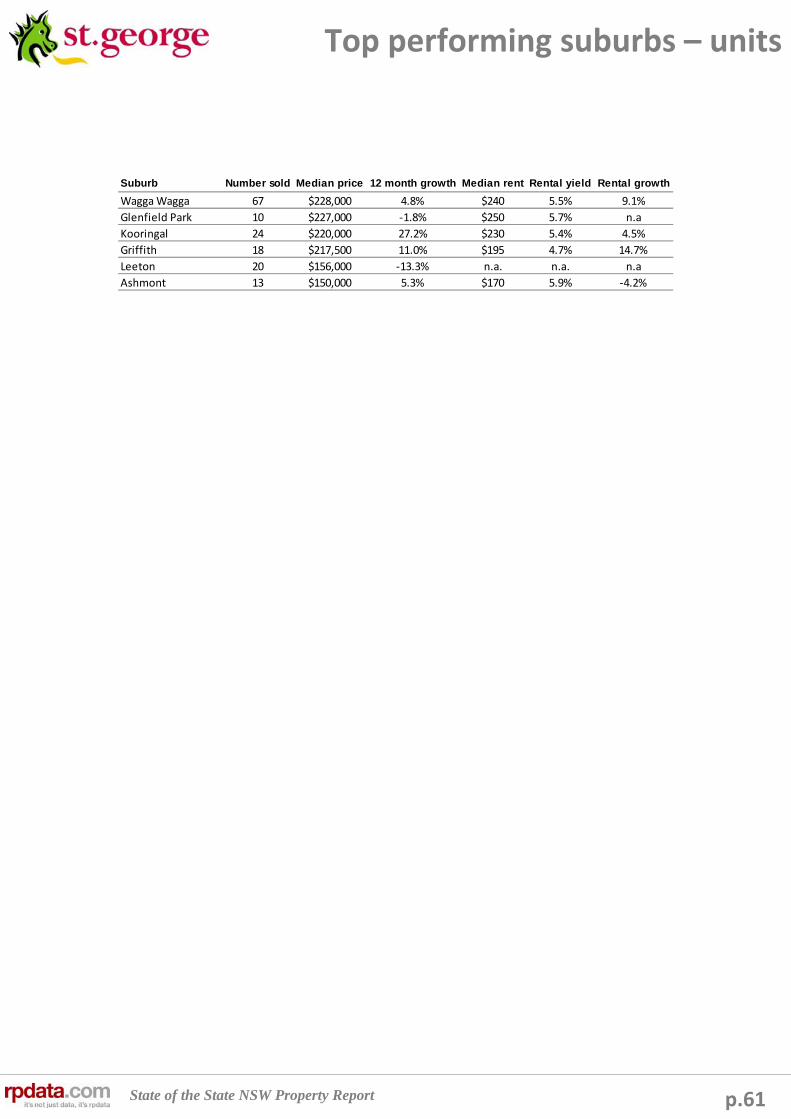
State of the State NSW Property Report p.61
Top performing suburbs – units
Suburb Number sold Median price 12 month growth Median rent Rental yield Rental growth
Wagga Wagga 67 $228,000 4.8% $240 5.5% 9.1%
Glenfield Park 10 $227,000 ‐1.8% $250 5.7% n.a
Kooringal 24 $220,000 27.2% $230 5.4% 4.5%
Griffith 18 $217,500 11.0% $195 4.7% 14.7%
Leeton 20 $156,000 ‐13.3% n.a. n.a. n.a
Ashmont 13 $150,000 5.3% $170 5.9% ‐4.2%
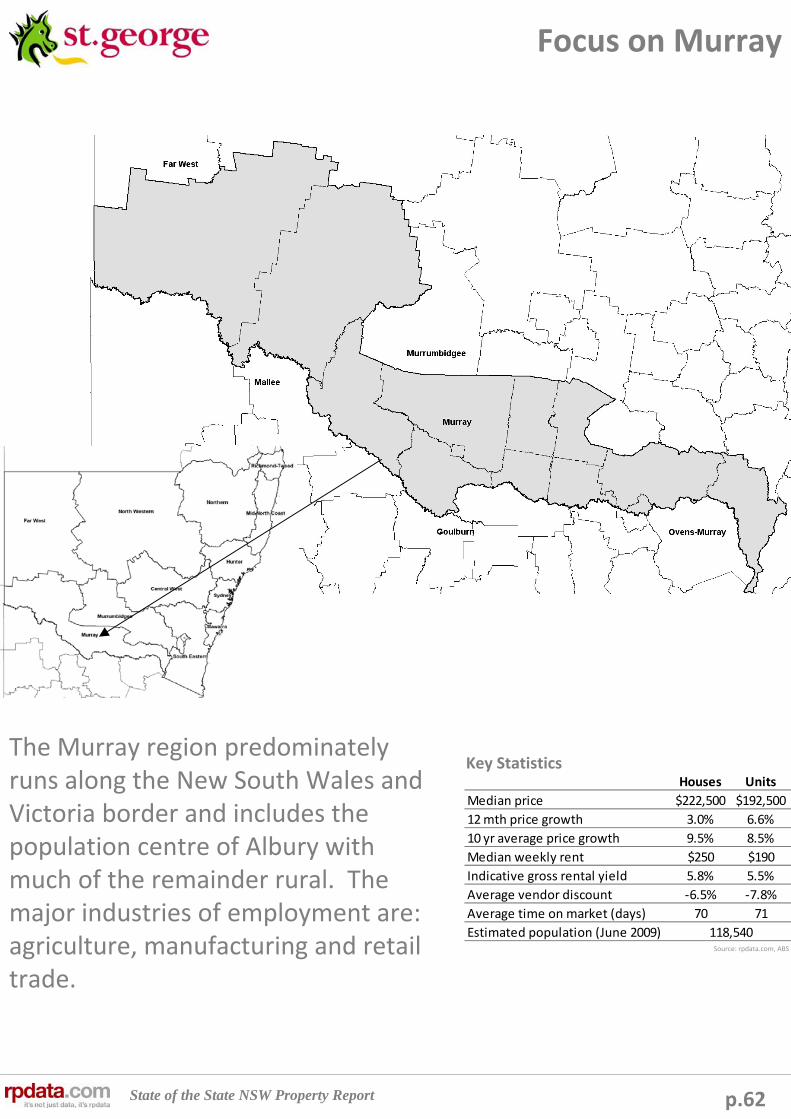
State of the State NSW Property Report
Houses Units
Median price $222,500 $192,500
12 mth price growth 3.0% 6.6%
10 yr average price growth 9.5% 8.5%
Median weekly rent $250 $190
Indicative gross rental yield 5.8% 5.5%
Average vendor discount ‐6.5% ‐7.8%
Average time on market (days) 70 71
Estimated population (June 2009) 118,540
p.62
Focus on Murray
Key StatisticsThe Murray region predominately runs along the New South Wales andVictoria border and includes the population centre of Albury with much of the remainder rural. The major industries of employment are: agriculture, manufacturing and retail trade.
Source: rpdata.com, ABS

State of the State NSW Property Report
4.7%
4.9%
5.1%
5.3%
5.5%
5.7%
5.9%
May‐05
Jul‐05
Sep‐05
Nov‐05
Jan‐06
Mar‐06
May‐06
Jul‐06
Sep‐06
Nov‐06
Jan‐07
Mar‐07
May‐07
Jul‐07
Sep‐07
Nov‐07
Jan‐08
Mar‐08
May‐08
Jul‐08
Sep‐08
Nov‐08
Jan‐09
Mar‐09
May‐09
Jul‐09
Sep‐09
Nov‐09
Jan‐10
Mar‐10
May‐10
Jul‐10
Houses Units
$140
$160
$180
$200
$220
$240
$260
May‐05
Jul‐05
Sep‐05
Nov‐05
Jan‐06
Mar‐06
May‐06
Jul‐06
Sep‐06
Nov‐06
Jan‐07
Mar‐07
May‐07
Jul‐07
Sep‐07
Nov‐07
Jan‐08
Mar‐08
May‐08
Jul‐08
Sep‐08
Nov‐08
Jan‐09
Mar‐09
May‐09
Jul‐09
Sep‐09
Nov‐09
Jan‐10
Mar‐10
May‐10
Jul‐10
Median weekly advertised rent
Houses Units
0
100
200
300
400
500
600
700
800
900
$0
$50,000
$100,000
$150,000
$200,000
$250,000
Jul‐00
Jan‐01
Jul‐01
Jan‐02
Jul‐02
Jan‐03
Jul‐03
Jan‐04
Jul‐04
Jan‐05
Jul‐05
Jan‐06
Jul‐06
Jan‐07
Jul‐07
Jan‐08
Jul‐08
Jan‐09
Jul‐09
Jan‐10
Jul‐10
Rolling quarterly volume of sales
Median price
Quarterly volume of sales Houses Units
p.63
Murray property market
Home prices within the Murray region of the state have recorded moderate levels of growth during the past decade. Houses have recorded average annual growth of 9.5 percent which is a superior level of growth to the 8.5 percent for units. Currently, median house prices are recorded at $222,500 and median unit prices are $192,500. Over the last year, median prices have increased at below average rates with median house prices increasing by 3.0 percent and units by 6.6 percent. Importantly, the graph highlights that there has been some tapering of prices in recent months with median house prices ‐5.3 percent below their $235,000 peak and units ‐1.5 percent below the $195,500 peak. In recent months, the volume of sales has been easing within the local area. At the peak in dwelling sales activity there was 809 sales over the three months to April 2002. Although sales volumes rebounded following the GFC they did not return to pre crisis levels. The current level of sales activity is well below the historic highs and below last year’s peak.
Over the period May 2005 to July 2010, the Murray region has recorded quite sluggish growth in rental rates which is reflective of limited demand for rental properties within this region. During the timeframe, median advertised rents have increased by a total of $50/week for houses and $40/week for units. The result indicates a preference for rental houses rather than units. Over the 12 months to July 2010, the trend has been somewhat different, with houses recording an inferior rate of rental growth (4.2 percent ) to that of units (5.6 percent). The size of the unit rental market has remained quite flat over the period, however, there has been a growing number of advertisements for house rentals duringrecent years. Like most rural areas, the large townships are likely to have the greatest demand for rental properties and as a result the strongest growth prospects.
The Murray region has quite strong indicative gross rental yields which is apparent when considering the rentals which are achieved in comparison to the median price of houses and units. Currently, indicative gross rental yields for houses are recorded at 5.8 percent, whilst unit yields sit at 5.5 percent. During each period analysed houses have recorded a superior indicative gross rental yield to that of units and this highlights the attraction to rental houses within the region. House yields have recorded some easing during recent months whilst the yields for units have continued to improve. Over the coming months, the declining demand for property sales is unlikely to result in a significant increase in rents. It is anticipated that there won't be significant changes to gross rental yields during the coming months. The strongest yields are likely to be found for houses within the major townships.
Murray sales volumes and median prices over timeJul‐00 to Jul‐10
Murray region median weekly advertised rentsMay‐05 to Jul‐10
Murray indicative gross rental yieldsMay‐05 to Jul‐10
Source: rpdata.com
Source: rpdata.com
Source: rpdata.com

State of the State NSW Property Report
0102030405060708090
100
Jul‐05
Sep‐05
Nov‐05
Jan‐06
Mar‐06
May‐06
Jul‐06
Sep‐06
Nov‐06
Jan‐07
Mar‐07
May‐07
Jul‐07
Sep‐07
Nov‐07
Jan‐08
Mar‐08
May‐08
Jul‐08
Sep‐08
Nov‐08
Jan‐09
Mar‐09
May‐09
Jul‐09
Sep‐09
Nov‐09
Jan‐10
Mar‐10
May‐10
Jul‐10
0
10
20
30
40
50
60
70
80
90
Jul‐05
Sep‐05
Nov‐05
Jan‐06
Mar‐06
May‐06
Jul‐06
Sep‐06
Nov‐06
Jan‐07
Mar‐07
May‐07
Jul‐07
Sep‐07
Nov‐07
Jan‐08
Mar‐08
May‐08
Jul‐08
Sep‐08
Nov‐08
Jan‐09
Mar‐09
May‐09
Jul‐09
Sep‐09
Nov‐09
Jan‐10
Mar‐10
May‐10
Jul‐10
‐10.0%‐9.0%‐8.0%‐7.0%‐6.0%‐5.0%‐4.0%‐3.0%‐2.0%‐1.0%0.0%
Jul‐05
Sep‐05
Nov‐05
Jan‐06
Mar‐06
May‐06
Jul‐06
Sep‐06
Nov‐06
Jan‐07
Mar‐07
May‐07
Jul‐07
Sep‐07
Nov‐07
Jan‐08
Mar‐08
May‐08
Jul‐08
Sep‐08
Nov‐08
Jan‐09
Mar‐09
May‐09
Jul‐09
Sep‐09
Nov‐09
Jan‐10
Mar‐10
May‐10
Jul‐10
‐9.0%
‐8.0%
‐7.0%
‐6.0%
‐5.0%
‐4.0%
‐3.0%
‐2.0%
‐1.0%
0.0%
Jul‐05
Sep‐05
Nov‐05
Jan‐06
Mar‐06
May‐06
Jul‐06
Sep‐06
Nov‐06
Jan‐07
Mar‐07
May‐07
Jul‐07
Sep‐07
Nov‐07
Jan‐08
Mar‐08
May‐08
Jul‐08
Sep‐08
Nov‐08
Jan‐09
Mar‐09
May‐09
Jul‐09
Sep‐09
Nov‐09
Jan‐10
Mar‐10
May‐10
Jul‐10
p.64
Murray property market
The adjacent graphs detail the level of vendor discounting for houses (blue) and units (grey) within the Murray region.
Vendor discounting for houses throughout the Murray region is currently recorded at ‐6.5 percent and at the same time during 2009 the average discount was slightly lower at ‐6.4 percent. Over the five year period highlighted, the average vendor discount has been recorded at ‐6.7 percent. At its highest level of the past five years, vendor discounting was recorded at ‐7.8 percent during late 2008 and at the lowest level during the five years, vendor discounting was recorded at ‐5.9 percent during October 2009.
Across the five years to July 2010, the average level of vendor discounting has been recorded at ‐6.9 percent, slightly higher than the average for houses. Over the five years, vendor discounting has peaked as high as ‐8.9 percent during July 2005 and has been as low as ‐5.4 percent (July 2006). Currently, the average vendor discount is recorded at ‐7.8 percent indicating that units are recording significantly greater discount levels compared to houses. During July 2009, the average vendor discount was reported as ‐6.5 percent, indicating that vendor discounting has worsened over the year and that vendors may need to more carefully consider their list prices.
The adjacent graphs detail the average time on market for property sales across the Murray region for houses (blue) and units (grey).
Currently, the average time on market for a house within the Murray region is recorded at 70 days. In comparison, during July 2009 a house for sale remained on the market for an average of 76 days, indicating that there has been only a slight improvement over the year. Over the past five years, the average time on market has been recorded at 77 days indicating that current market conditions are superior for sellers. At its peak, it was taking an average of 85 days to sell in late 2008 / early 2009 and the 70 days which it currently takes to sell is the fastest timeframe over the past five years.
Murray units have taken an average of 75 days to sell over the five years to July 2010. At their weakest level it took 90 days to sell during September 2008 and it has taken as little as 55 days to sell a unit over the period (September 2005). It is currently taking 71 days on average to sell a unit in the region. The data shows that selling conditions have improved during the last year with it taking an average of 85 days to sell during July 2009.
The recent easing in house and unit prices coupled with the falling volume of sales suggests that moving forward market conditions are likely to be softer and favour buyers. As a result, it is anticipated that time on market and vendor discounting will increase in the coming months which will afford purchasers greater leverage for negotiation on price.
Murray region level of vendor discountingJul‐05 to Jul‐10
Murray region average time on marketJul‐05 to Jul‐10
Source: rpdata.com
Source: rpdata.com
Houses
Units
Houses
Units

State of the State NSW Property Report
Median
price
12 mth
change
10 yr
change
Median
rent
Indicative gross
rental yield
Vendor
discount
Time on
market
Albury $176,000 0.9% 7.4% $190 5.6% ‐7.2% 66
Corowa $200,000 0.0% 9.8% $240 6.2% ‐5.1% 78
Murray $200,000 ‐7.0% 6.3% $208 5.4% n.a. n.a.
Wentworth $136,500 n.a. n.a. $140 5.3% n.a. n.a.
p.65
Murray LGA’s
Murray Region ‐ units
Murray Region ‐ houses
Median
price
12 mth
change
10 yr
change
Median
rent
Indicative gross
rental yield
Vendor
discount
Time on
market
Albury $262,500 5.0% 9.9% $260 5.2% ‐5.8% 66
Balranald $150,000 15.4% 10.6% n.a. n.a. n.a. n.a.
Berrigan $152,500 ‐7.3% 9.2% $150 5.1% ‐9.0% 93
Corowa $220,000 14.6% 9.3% $235 5.6% ‐6.2% 78
Greater Hume $155,000 0.0% 10.9% $153 5.1% ‐9.3% 67
Jerilderie $97,100 ‐17.4% 16.4% n.a. n.a. n.a. n.a.
Murray $280,000 0.9% 11.2% $250 4.6% ‐7.8% 70
Tumbarumba $149,500 ‐3.2% 10.9% $173 6.0% n.a. n.a.
Wakool $145,000 5.8% 8.9% n.a. n.a. n.a. n.a.
Wentworth $197,500 12.9% 15.7% $190 5.0% ‐5.6% 92
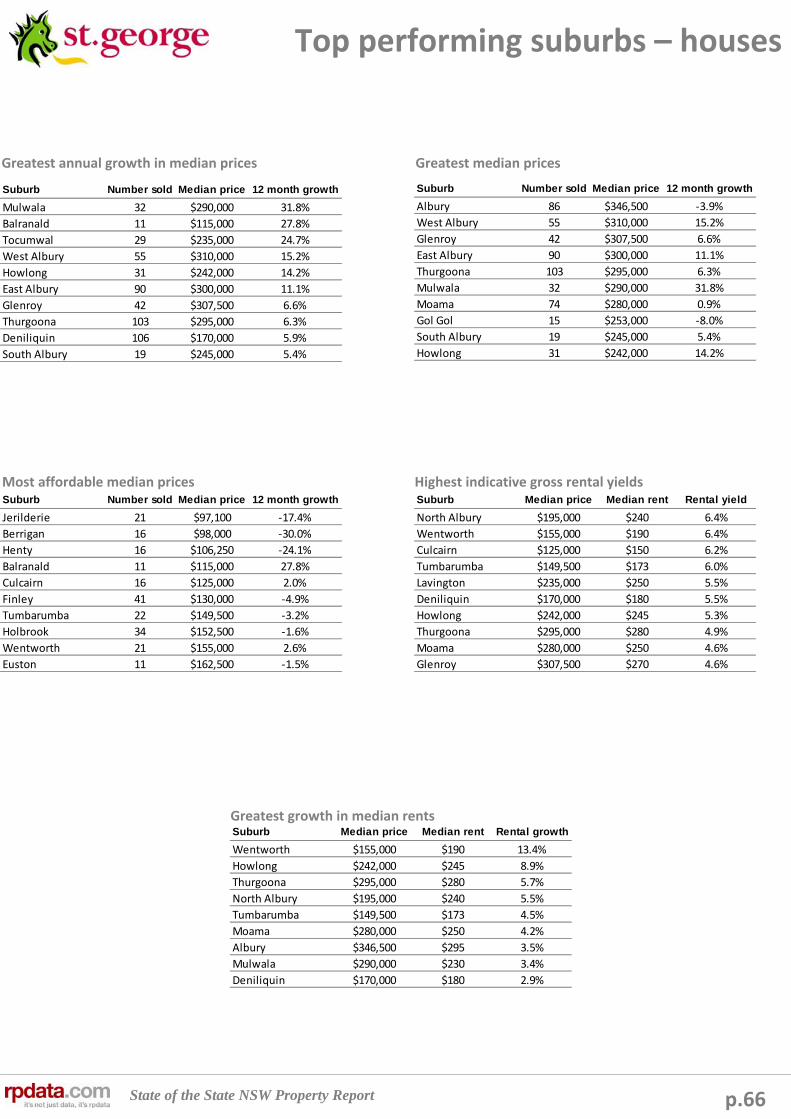
State of the State NSW Property Report
Suburb Median price Median rent Rental growth
Wentworth $155,000 $190 13.4%
Howlong $242,000 $245 8.9%
Thurgoona $295,000 $280 5.7%
North Albury $195,000 $240 5.5%
Tumbarumba $149,500 $173 4.5%
Moama $280,000 $250 4.2%
Albury $346,500 $295 3.5%
Mulwala $290,000 $230 3.4%
Deniliquin $170,000 $180 2.9%
Suburb Median price Median rent Rental yield
North Albury $195,000 $240 6.4%
Wentworth $155,000 $190 6.4%
Culcairn $125,000 $150 6.2%
Tumbarumba $149,500 $173 6.0%
Lavington $235,000 $250 5.5%
Deniliquin $170,000 $180 5.5%
Howlong $242,000 $245 5.3%
Thurgoona $295,000 $280 4.9%
Moama $280,000 $250 4.6%
Glenroy $307,500 $270 4.6%
Suburb Number sold Median price 12 month growth
Jerilderie 21 $97,100 ‐17.4%
Berrigan 16 $98,000 ‐30.0%
Henty 16 $106,250 ‐24.1%
Balranald 11 $115,000 27.8%
Culcairn 16 $125,000 2.0%
Finley 41 $130,000 ‐4.9%
Tumbarumba 22 $149,500 ‐3.2%
Holbrook 34 $152,500 ‐1.6%
Wentworth 21 $155,000 2.6%
Euston 11 $162,500 ‐1.5%
Suburb Number sold Median price 12 month growth
Albury 86 $346,500 ‐3.9%
West Albury 55 $310,000 15.2%
Glenroy 42 $307,500 6.6%
East Albury 90 $300,000 11.1%
Thurgoona 103 $295,000 6.3%
Mulwala 32 $290,000 31.8%
Moama 74 $280,000 0.9%
Gol Gol 15 $253,000 ‐8.0%
South Albury 19 $245,000 5.4%
Howlong 31 $242,000 14.2%
Suburb Number sold Median price 12 month growth
Mulwala 32 $290,000 31.8%
Balranald 11 $115,000 27.8%
Tocumwal 29 $235,000 24.7%
West Albury 55 $310,000 15.2%
Howlong 31 $242,000 14.2%
East Albury 90 $300,000 11.1%
Glenroy 42 $307,500 6.6%
Thurgoona 103 $295,000 6.3%
Deniliquin 106 $170,000 5.9%
South Albury 19 $245,000 5.4%
p.66
Top performing suburbs – houses
Greatest annual growth in median prices Greatest median prices
Most affordable median prices Highest indicative gross rental yields
Greatest growth in median rents

State of the State NSW Property Report
Suburb Number sold Median price 12 month growth Median rent Rental yield Rental growth
Mulwala 18 $255,000 9.0% n.a. n.a. n.a
West Albury 20 $224,000 14.9% $210 4.9% n.a
Albury 40 $210,500 4.6% $210 5.2% 2.4%
Moama 30 $200,000 ‐7.0% $208 5.4% 9.2%
East Albury 33 $156,000 ‐1.3% $180 6.0% 5.9%
Lavington 85 $155,000 ‐3.4% $175 5.9% 6.1%
Corowa 30 $145,000 ‐4.9% n.a. n.a. n.a
North Albury 11 $105,000 ‐29.8% $155 7.7% 1.6%
p.67
Top performing suburbs – units
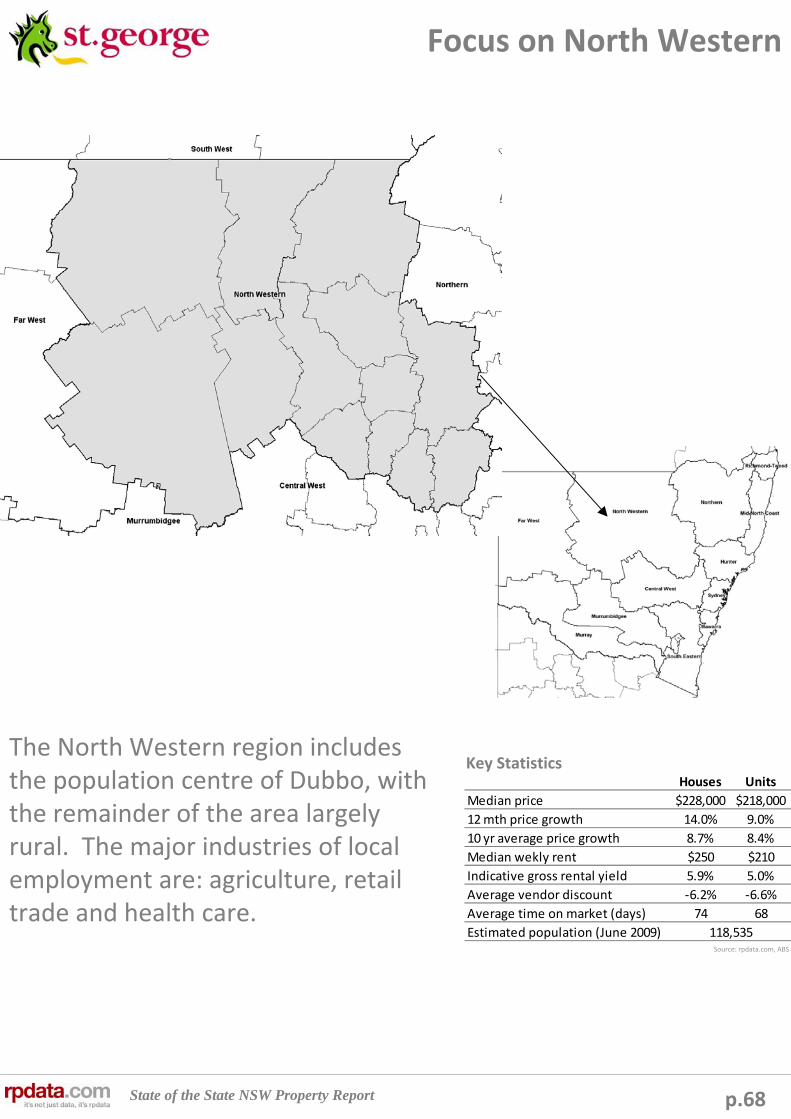
State of the State NSW Property Report
Houses Units
Median price $228,000 $218,000
12 mth price growth 14.0% 9.0%
10 yr average price growth 8.7% 8.4%
Median wekly rent $250 $210
Indicative gross rental yield 5.9% 5.0%
Average vendor discount ‐6.2% ‐6.6%
Average time on market (days) 74 68
Estimated population (June 2009) 118,535
p.68
Focus on North Western
Key StatisticsThe North Western region includes the population centre of Dubbo, with the remainder of the area largely rural. The major industries of local employment are: agriculture, retail trade and health care.
Source: rpdata.com, ABS
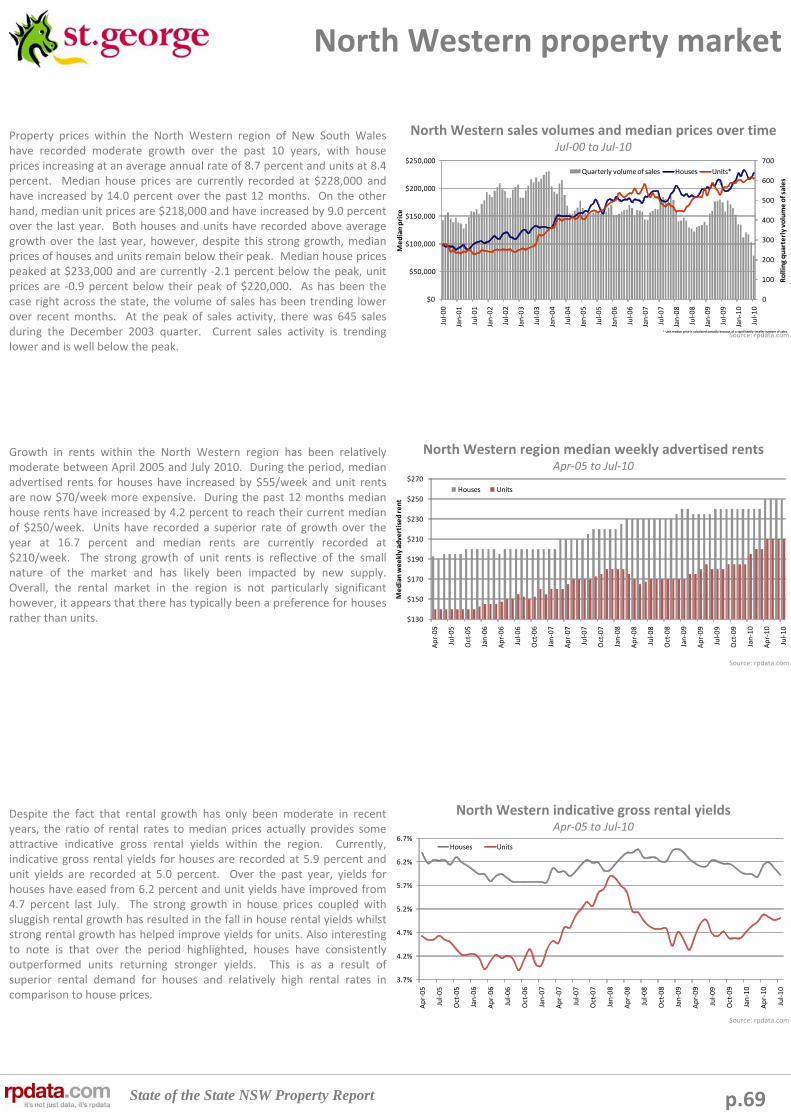
State of the State NSW Property Report
3.7%
4.2%
4.7%
5.2%
5.7%
6.2%
6.7%
Apr‐05
Jul‐05
Oct‐05
Jan‐06
Apr‐06
Jul‐06
Oct‐06
Jan‐07
Apr‐07
Jul‐07
Oct‐07
Jan‐08
Apr‐08
Jul‐08
Oct‐08
Jan‐09
Apr‐09
Jul‐09
Oct‐09
Jan‐10
Apr‐10
Jul‐10
Houses Units
$130
$150
$170
$190
$210
$230
$250
$270
Apr‐05
Jul‐05
Oct‐05
Jan‐06
Apr‐06
Jul‐06
Oct‐06
Jan‐07
Apr‐07
Jul‐07
Oct‐07
Jan‐08
Apr‐08
Jul‐08
Oct‐08
Jan‐09
Apr‐09
Jul‐09
Oct‐09
Jan‐10
Apr‐10
Jul‐10
Median weekly advertised rent
Houses Units
0
100
200
300
400
500
600
700
$0
$50,000
$100,000
$150,000
$200,000
$250,000
Jul‐00
Jan‐01
Jul‐01
Jan‐02
Jul‐02
Jan‐03
Jul‐03
Jan‐04
Jul‐04
Jan‐05
Jul‐05
Jan‐06
Jul‐06
Jan‐07
Jul‐07
Jan‐08
Jul‐08
Jan‐09
Jul‐09
Jan‐10
Jul‐10
Rolling quarterly volume of sales
Median price
Quarterly volume of sales Houses Units*
* Unit median price is calculated annually because of a significantly smaller number of sales.
p.69
North Western property market
Property prices within the North Western region of New South Wales have recorded moderate growth over the past 10 years, with houseprices increasing at an average annual rate of 8.7 percent and units at 8.4 percent. Median house prices are currently recorded at $228,000 and have increased by 14.0 percent over the past 12 months. On the other hand, median unit prices are $218,000 and have increased by 9.0 percent over the last year. Both houses and units have recorded above average growth over the last year, however, despite this strong growth, median prices of houses and units remain below their peak. Median house prices peaked at $233,000 and are currently ‐2.1 percent below the peak, unit prices are ‐0.9 percent below their peak of $220,000. As has been the case right across the state, the volume of sales has been trending lower over recent months. At the peak of sales activity, there was 645 sales during the December 2003 quarter. Current sales activity is trending lower and is well below the peak.
Growth in rents within the North Western region has been relatively moderate between April 2005 and July 2010. During the period, median advertised rents for houses have increased by $55/week and unit rents are now $70/week more expensive. During the past 12 months median house rents have increased by 4.2 percent to reach their current median of $250/week. Units have recorded a superior rate of growth over the year at 16.7 percent and median rents are currently recorded at $210/week. The strong growth of unit rents is reflective of the small nature of the market and has likely been impacted by new supply.Overall, the rental market in the region is not particularly significant however, it appears that there has typically been a preference for houses rather than units.
Despite the fact that rental growth has only been moderate in recent years, the ratio of rental rates to median prices actually provides some attractive indicative gross rental yields within the region. Currently, indicative gross rental yields for houses are recorded at 5.9 percent and unit yields are recorded at 5.0 percent. Over the past year, yields for houses have eased from 6.2 percent and unit yields have improved from 4.7 percent last July. The strong growth in house prices coupled with sluggish rental growth has resulted in the fall in house rental yields whilst strong rental growth has helped improve yields for units. Also interesting to note is that over the period highlighted, houses have consistently outperformed units returning stronger yields. This is as a result of superior rental demand for houses and relatively high rental rates in comparison to house prices.
North Western sales volumes and median prices over timeJul‐00 to Jul‐10
North Western region median weekly advertised rentsApr‐05 to Jul‐10
North Western indicative gross rental yieldsApr‐05 to Jul‐10
Source: rpdata.com
Source: rpdata.com
Source: rpdata.com
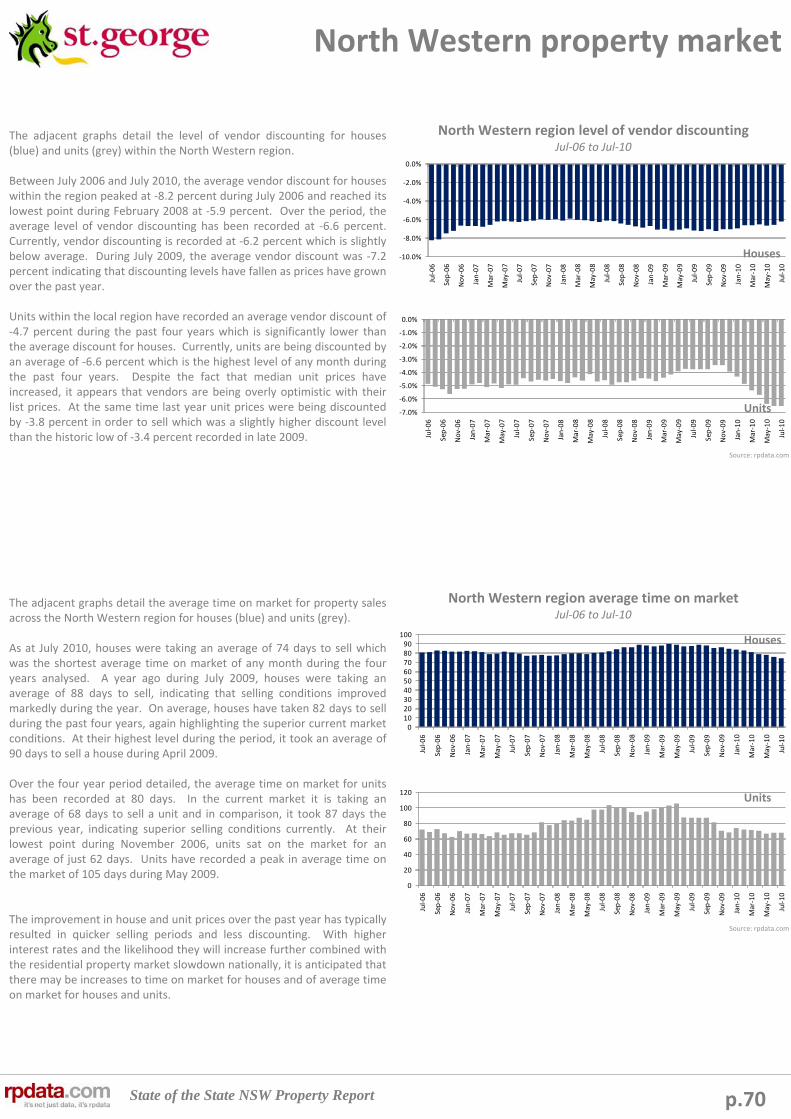
State of the State NSW Property Report
0
20
40
60
80
100
120
Jul‐06
Sep‐06
Nov‐06
Jan‐07
Mar‐07
May‐07
Jul‐07
Sep‐07
Nov‐07
Jan‐08
Mar‐08
May‐08
Jul‐08
Sep‐08
Nov‐08
Jan‐09
Mar‐09
May‐09
Jul‐09
Sep‐09
Nov‐09
Jan‐10
Mar‐10
May‐10
Jul‐10
0102030405060708090
100
Jul‐06
Sep‐06
Nov‐06
Jan‐07
Mar‐07
May‐07
Jul‐07
Sep‐07
Nov‐07
Jan‐08
Mar‐08
May‐08
Jul‐08
Sep‐08
Nov‐08
Jan‐09
Mar‐09
May‐09
Jul‐09
Sep‐09
Nov‐09
Jan‐10
Mar‐10
May‐10
Jul‐10
‐7.0%
‐6.0%
‐5.0%
‐4.0%
‐3.0%
‐2.0%
‐1.0%
0.0%
Jul‐06
Sep‐06
Nov‐06
Jan‐07
Mar‐07
May‐07
Jul‐07
Sep‐07
Nov‐07
Jan‐08
Mar‐08
May‐08
Jul‐08
Sep‐08
Nov‐08
Jan‐09
Mar‐09
May‐09
Jul‐09
Sep‐09
Nov‐09
Jan‐10
Mar‐10
May‐10
Jul‐10
‐10.0%
‐8.0%
‐6.0%
‐4.0%
‐2.0%
0.0%
Jul‐06
Sep‐06
Nov‐06
Jan‐07
Mar‐07
May‐07
Jul‐07
Sep‐07
Nov‐07
Jan‐08
Mar‐08
May‐08
Jul‐08
Sep‐08
Nov‐08
Jan‐09
Mar‐09
May‐09
Jul‐09
Sep‐09
Nov‐09
Jan‐10
Mar‐10
May‐10
Jul‐10
p.70
North Western property market
The adjacent graphs detail the level of vendor discounting for houses (blue) and units (grey) within the North Western region.
Between July 2006 and July 2010, the average vendor discount for houses within the region peaked at ‐8.2 percent during July 2006 and reached its lowest point during February 2008 at ‐5.9 percent. Over the period, the average level of vendor discounting has been recorded at ‐6.6 percent. Currently, vendor discounting is recorded at ‐6.2 percent which is slightly below average. During July 2009, the average vendor discount was ‐7.2 percent indicating that discounting levels have fallen as prices have grown over the past year.
Units within the local region have recorded an average vendor discount of ‐4.7 percent during the past four years which is significantly lower than the average discount for houses. Currently, units are being discounted by an average of ‐6.6 percent which is the highest level of any month during the past four years. Despite the fact that median unit prices have increased, it appears that vendors are being overly optimistic with their list prices. At the same time last year unit prices were being discounted by ‐3.8 percent in order to sell which was a slightly higher discount level than the historic low of ‐3.4 percent recorded in late 2009.
The adjacent graphs detail the average time on market for property sales across the North Western region for houses (blue) and units (grey).
As at July 2010, houses were taking an average of 74 days to sell which was the shortest average time on market of any month during the four years analysed. A year ago during July 2009, houses were taking an average of 88 days to sell, indicating that selling conditions improved markedly during the year. On average, houses have taken 82 days to sell during the past four years, again highlighting the superior current market conditions. At their highest level during the period, it took an average of 90 days to sell a house during April 2009.
Over the four year period detailed, the average time on market for units has been recorded at 80 days. In the current market it is taking an average of 68 days to sell a unit and in comparison, it took 87 days the previous year, indicating superior selling conditions currently. At their lowest point during November 2006, units sat on the market for an average of just 62 days. Units have recorded a peak in average time on the market of 105 days during May 2009.
The improvement in house and unit prices over the past year has typically resulted in quicker selling periods and less discounting. With higher interest rates and the likelihood they will increase further combined with the residential property market slowdown nationally, it is anticipated that there may be increases to time on market for houses and of average time on market for houses and units.
North Western region level of vendor discountingJul‐06 to Jul‐10
North Western region average time on marketJul‐06 to Jul‐10
Source: rpdata.com
Source: rpdata.com
Houses
Units
Houses
Units

State of the State NSW Property Report
Median
price
12 mth
change
10 yr
change
Median
rent
Indicative gross
rental yield
Vendor
discount
Time on
market
Bogan $171,250 55.7% 17.2% n.a. n.a. n.a. n.a.
Bourke $92,000 23.9% 6.6% n.a. n.a. n.a. n.a.
Brewarrina $47,250 26.0% n.a. n.a. n.a. n.a. n.a.
Cobar $199,000 9.6% 12.3% $218 5.7% ‐10.0% 83
Coonamble $77,000 ‐8.3% 5.0% n.a. n.a. ‐12.0% 97
Dubbo $245,000 4.3% 8.1% $255 5.4% ‐5.4% 72
Gilgandra $119,000 ‐16.2% 13.0% n.a. n.a. n.a. n.a.
Mid‐western $274,375 5.7% 9.6% $275 5.2% ‐5.3% 70
Narromine $175,750 6.5% 9.3% $200 5.9% ‐10.6% 85
Walgett $125,000 27.6% 7.6% n.a. n.a. n.a. n.a.
Warren $110,000 ‐3.9% 3.4% n.a. n.a. n.a. n.a.
Warrumbungle $125,000 0.0% 9.6% $165 6.9% ‐8.4% 81
Wellington $120,000 ‐2.4% 10.3% $170 7.4% ‐11.7% 117
p.71
North Western LGA’s
North Western Region ‐ units
North Western Region ‐ houses
Median
price
12 mth
change
10 yr
change
Median
rent
Indicative gross
rental yield
Vendor
discount
Time on
market
Dubbo $177,500 ‐6.6% 6.9% $193 5.6% ‐6.0% 77
Mid‐Western $271,250 4.3% 10.2% $290 5.6% n.a. n.a.
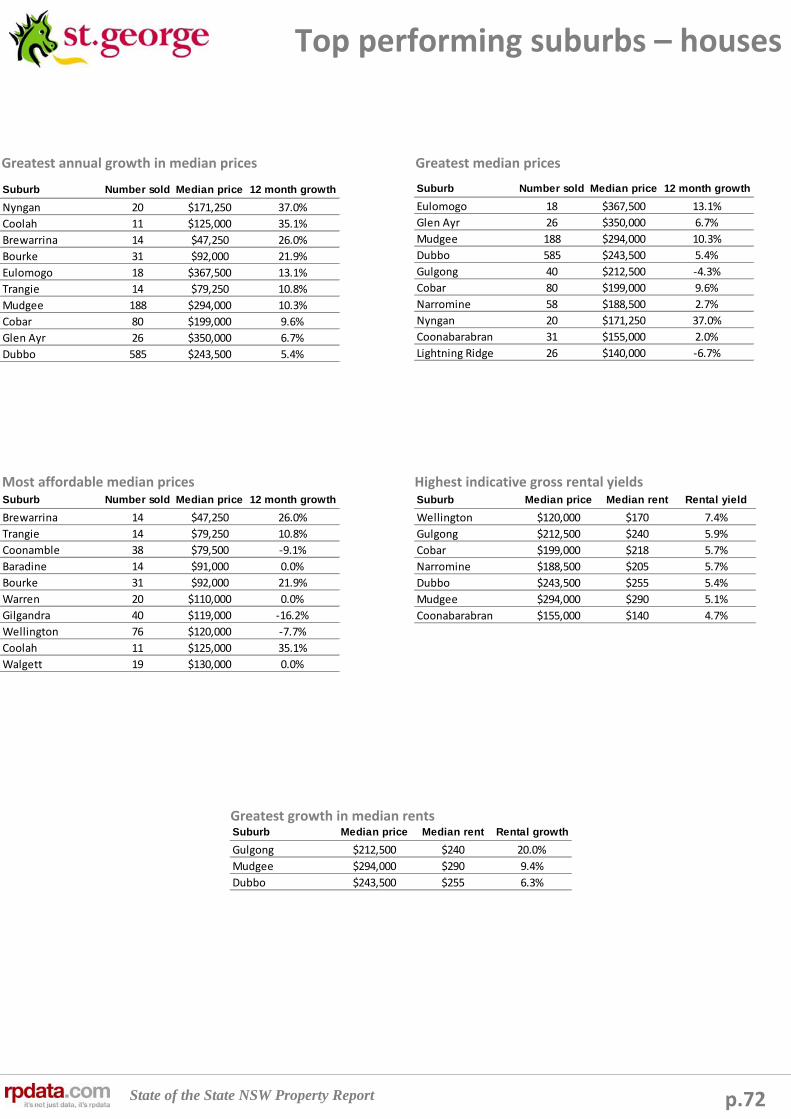
State of the State NSW Property Report
Suburb Number sold Median price 12 month growth
Brewarrina 14 $47,250 26.0%
Trangie 14 $79,250 10.8%
Coonamble 38 $79,500 ‐9.1%
Baradine 14 $91,000 0.0%
Bourke 31 $92,000 21.9%
Warren 20 $110,000 0.0%
Gilgandra 40 $119,000 ‐16.2%
Wellington 76 $120,000 ‐7.7%
Coolah 11 $125,000 35.1%
Walgett 19 $130,000 0.0%
Suburb Number sold Median price 12 month growth
Eulomogo 18 $367,500 13.1%
Glen Ayr 26 $350,000 6.7%
Mudgee 188 $294,000 10.3%
Dubbo 585 $243,500 5.4%
Gulgong 40 $212,500 ‐4.3%
Cobar 80 $199,000 9.6%
Narromine 58 $188,500 2.7%
Nyngan 20 $171,250 37.0%
Coonabarabran 31 $155,000 2.0%
Lightning Ridge 26 $140,000 ‐6.7%
Suburb Number sold Median price 12 month growth
Nyngan 20 $171,250 37.0%
Coolah 11 $125,000 35.1%
Brewarrina 14 $47,250 26.0%
Bourke 31 $92,000 21.9%
Eulomogo 18 $367,500 13.1%
Trangie 14 $79,250 10.8%
Mudgee 188 $294,000 10.3%
Cobar 80 $199,000 9.6%
Glen Ayr 26 $350,000 6.7%
Dubbo 585 $243,500 5.4%
p.72
Top performing suburbs – houses
Greatest annual growth in median prices Greatest median prices
Most affordable median prices Highest indicative gross rental yields
Greatest growth in median rents
Suburb Median price Median rent Rental yield
Wellington $120,000 $170 7.4%
Gulgong $212,500 $240 5.9%
Cobar $199,000 $218 5.7%
Narromine $188,500 $205 5.7%
Dubbo $243,500 $255 5.4%
Mudgee $294,000 $290 5.1%
Coonabarabran $155,000 $140 4.7%
Suburb Median price Median rent Rental growth
Gulgong $212,500 $240 20.0%
Mudgee $294,000 $290 9.4%
Dubbo $243,500 $255 6.3%
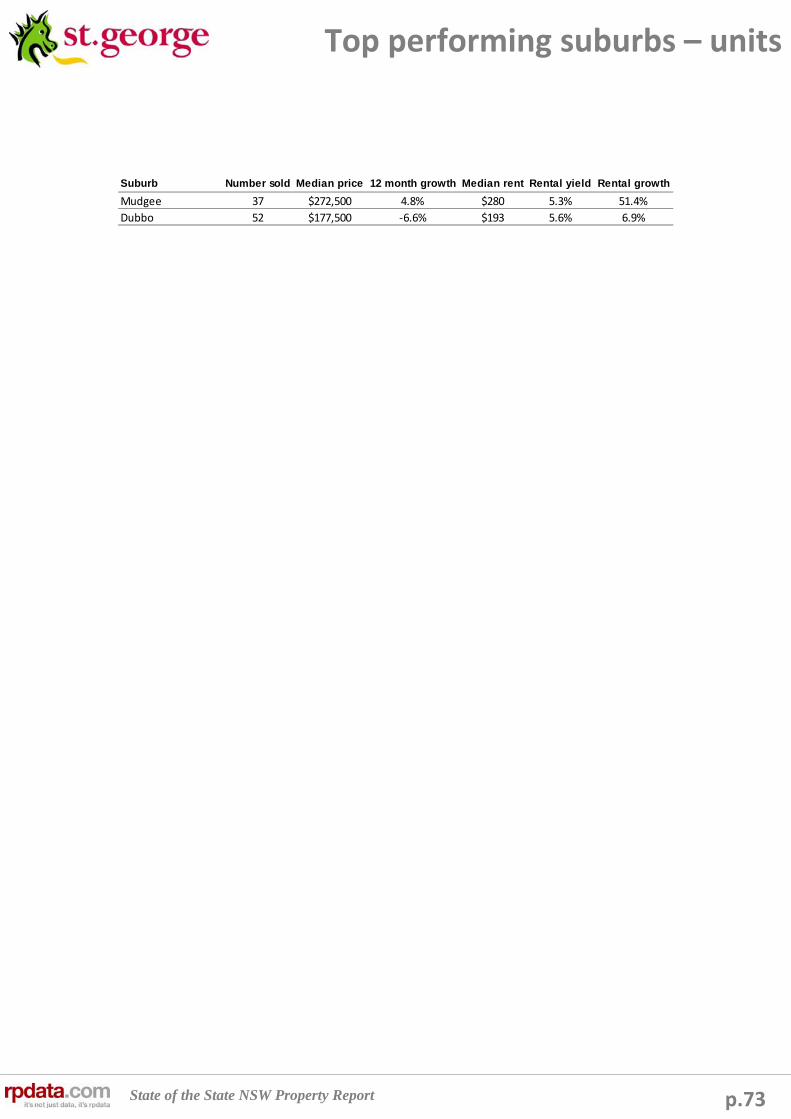
State of the State NSW Property Report p.73
Top performing suburbs – units
Suburb Number sold Median price 12 month growth Median rent Rental yield Rental growth
Mudgee 37 $272,500 4.8% $280 5.3% 51.4%
Dubbo 52 $177,500 ‐6.6% $193 5.6% 6.9%
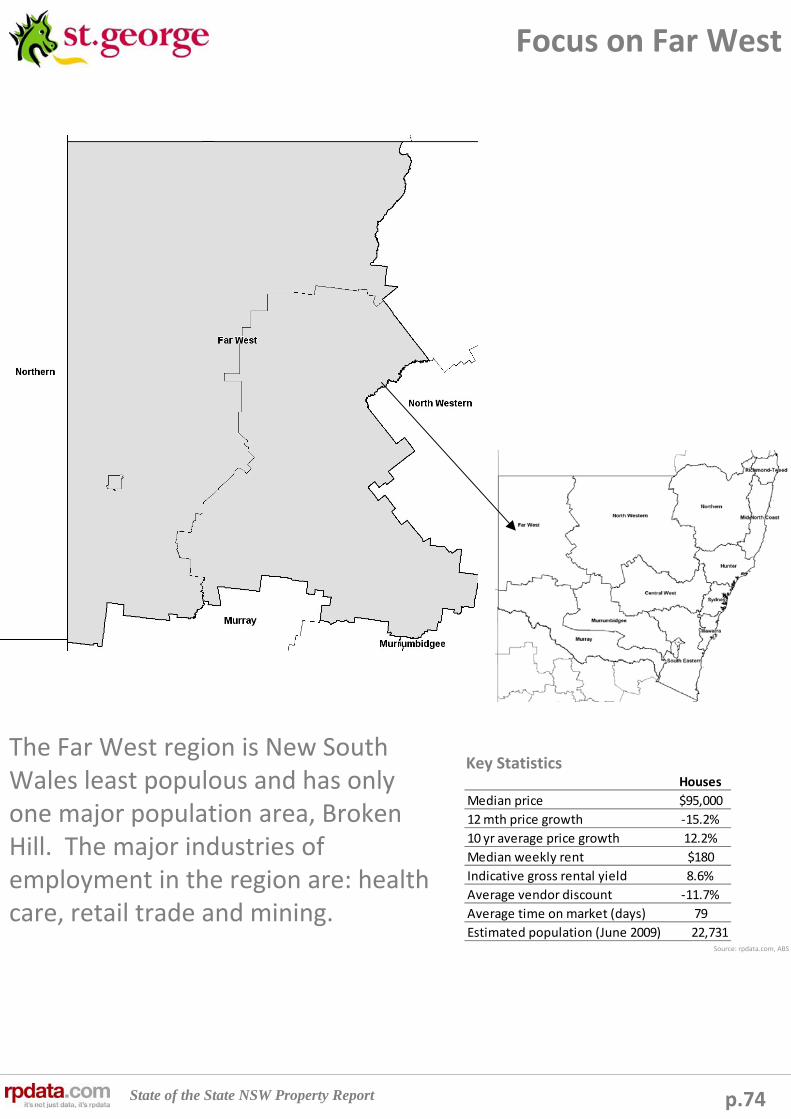
State of the State NSW Property Report
Houses
Median price $95,000
12 mth price growth ‐15.2%
10 yr average price growth 12.2%
Median weekly rent $180
Indicative gross rental yield 8.6%
Average vendor discount ‐11.7%
Average time on market (days) 79
Estimated population (June 2009) 22,731
p.74
Focus on Far West
Key StatisticsThe Far West region is New South Wales least populous and has only one major population area, Broken Hill. The major industries of employment in the region are: health care, retail trade and mining.
Source: rpdata.com, ABS
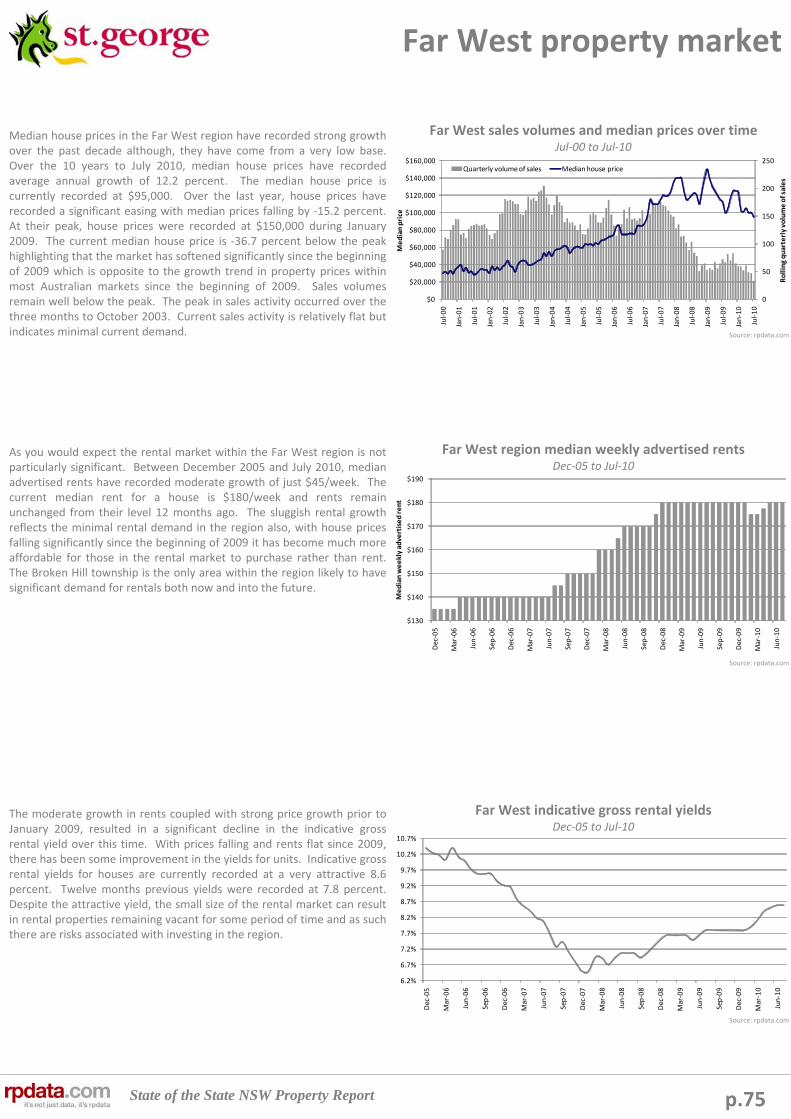
State of the State NSW Property Report
6.2%
6.7%
7.2%
7.7%
8.2%
8.7%
9.2%
9.7%
10.2%
10.7%
Dec‐05
Mar‐06
Jun‐06
Sep‐06
Dec‐06
Mar‐07
Jun‐07
Sep‐07
Dec‐07
Mar‐08
Jun‐08
Sep‐08
Dec‐08
Mar‐09
Jun‐09
Sep‐09
Dec‐09
Mar‐10
Jun‐10
$130
$140
$150
$160
$170
$180
$190
Dec‐05
Mar‐06
Jun‐06
Sep‐06
Dec‐06
Mar‐07
Jun‐07
Sep‐07
Dec‐07
Mar‐08
Jun‐08
Sep‐08
Dec‐08
Mar‐09
Jun‐09
Sep‐09
Dec‐09
Mar‐10
Jun‐10
Median weekly advertised rent
0
50
100
150
200
250
$0
$20,000
$40,000
$60,000
$80,000
$100,000
$120,000
$140,000
$160,000
Jul‐00
Jan‐01
Jul‐01
Jan‐02
Jul‐02
Jan‐03
Jul‐03
Jan‐04
Jul‐04
Jan‐05
Jul‐05
Jan‐06
Jul‐06
Jan‐07
Jul‐07
Jan‐08
Jul‐08
Jan‐09
Jul‐09
Jan‐10
Jul‐10
Rolling quarterly volume of sales
Median price
Quarterly volume of sales Median house price
p.75
Far West property market
Median house prices in the Far West region have recorded strong growth over the past decade although, they have come from a very low base. Over the 10 years to July 2010, median house prices have recorded average annual growth of 12.2 percent. The median house price is currently recorded at $95,000. Over the last year, house prices have recorded a significant easing with median prices falling by ‐15.2 percent. At their peak, house prices were recorded at $150,000 during January 2009. The current median house price is ‐36.7 percent below the peak highlighting that the market has softened significantly since the beginning of 2009 which is opposite to the growth trend in property prices within most Australian markets since the beginning of 2009. Sales volumes remain well below the peak. The peak in sales activity occurred over the three months to October 2003. Current sales activity is relatively flat but indicates minimal current demand.
As you would expect the rental market within the Far West region is not particularly significant. Between December 2005 and July 2010, median advertised rents have recorded moderate growth of just $45/week. The current median rent for a house is $180/week and rents remain unchanged from their level 12 months ago. The sluggish rental growth reflects the minimal rental demand in the region also, with house prices falling significantly since the beginning of 2009 it has become much more affordable for those in the rental market to purchase rather than rent. The Broken Hill township is the only area within the region likely to have significant demand for rentals both now and into the future.
The moderate growth in rents coupled with strong price growth prior to January 2009, resulted in a significant decline in the indicative gross rental yield over this time. With prices falling and rents flat since 2009, there has been some improvement in the yields for units. Indicative gross rental yields for houses are currently recorded at a very attractive 8.6 percent. Twelve months previous yields were recorded at 7.8 percent. Despite the attractive yield, the small size of the rental market can result in rental properties remaining vacant for some period of time and as such there are risks associated with investing in the region.
Far West sales volumes and median prices over timeJul‐00 to Jul‐10
Far West region median weekly advertised rentsDec‐05 to Jul‐10
Far West indicative gross rental yieldsDec‐05 to Jul‐10
Source: rpdata.com
Source: rpdata.com
Source: rpdata.com

State of the State NSW Property Report
0
20
40
60
80
100
120
Jul‐06
Sep‐06
Nov‐06
Jan‐07
Mar‐07
May‐07
Jul‐07
Sep‐07
Nov‐07
Jan‐08
Mar‐08
May‐08
Jul‐08
Sep‐08
Nov‐08
Jan‐09
Mar‐09
May‐09
Jul‐09
Sep‐09
Nov‐09
Jan‐10
Mar‐10
May‐10
Jul‐10
‐14.0%
‐12.0%
‐10.0%
‐8.0%
‐6.0%
‐4.0%
‐2.0%
0.0%
Jul‐06
Sep‐06
Nov‐06
Jan‐07
Mar‐07
May‐07
Jul‐07
Sep‐07
Nov‐07
Jan‐08
Mar‐08
May‐08
Jul‐08
Sep‐08
Nov‐08
Jan‐09
Mar‐09
May‐09
Jul‐09
Sep‐09
Nov‐09
Jan‐10
Mar‐10
May‐10
Jul‐10
p.76
Far West property market
During the period July 2006 to July 2010 the average vendor discount has been recorded at ‐8.9 percent. With the easing in house prices since January 2009 the level of vendor discounting has increased markedly, it is currently recorded at ‐11.7 percent. At the peak during 2009, vendors were having to discount their houses by ‐12.2 percent in order to achieve a sale. Prior to the beginning 2009, vendors were having to discount their properties by as little as ‐5.9 percent during April 2007. In recent months, the vendor discount has begun to increase again as prices have started trending downwards once more. Results highlight significant volatility in the market and that currently vendors may be setting unrealistic prices given the soft market conditions.
Although the average level of vendor discounting is very high within the region currently, the average time on market has actually eased. This would suggest that although vendors are having to discount house prices heavily they are doing this relatively quickly in order to sell. Houses are currently taking an average of 79 days to sell and 12 months ago they were taking 100 days to sell which indicates vendors are dropping prices to get quicker sales. Over the past four years, it has taken 88 days on average to sell a house. At its peak it took 104 days to sell during December 2009 and houses were selling as quickly as 75 days during May 2007.
With low volumes of sales and the anticipation of softer overall market condition, it is anticipated that time on market and vendor discounting will increase in coming months providing greater leverage for buyers.
Far West region level of vendor discountingJul‐06 to Jul‐10
Far West region average time on marketJul‐06 to Jul‐10
Source: rpdata.com
Source: rpdata.com
Houses
Houses

State of the State NSW Property Report p.77
Far West LGA’s
Far West Region ‐ houses
Median
price
12 mth
change
10 yr
change
Median
rent
Indicative gross
rental yield
Vendor
discount
Time on
market
Broken Hill $110,000 ‐12.0% 13.9% $180 8.5% ‐11.7% 79
Central Darling $32,000 ‐13.5% 5.9% n.a. n.a. n.a. n.a.
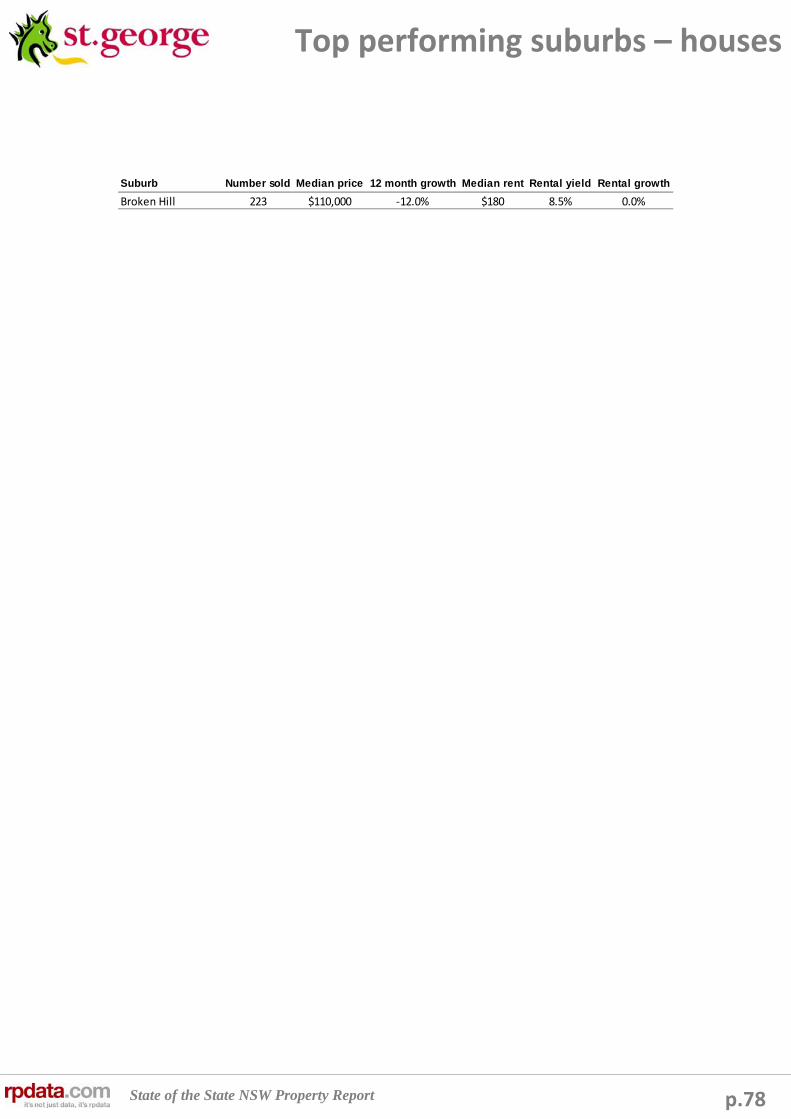
State of the State NSW Property Report p.78
Top performing suburbs – houses
Suburb Number sold Median price 12 month growth Median rent Rental yield Rental growth
Broken Hill 223 $110,000 ‐12.0% $180 8.5% 0.0%

State of the State NSW Property Report p.79
Findings / Conclusions
• Over the past 10 years, property value growth in Sydney has underperformed the nation, however, this is due largely to five and a half years of virtually no growth in values.
• Although capital city property value growth is slowing, Sydney is one of the few cities which has continued to grow values during the last quarter.
• Whilst Sydney’s property value growth has lagged, the nation’s certain areas have still performed strongly, specifically those closer to the city centre and close to desirable amenities including but not limited to: public transport, schools, employment nodes, retail, dining and major roads.
• Fundamentally, Sydney still has strong prospects: a housing undersupply, a significant and growing population and low unemployment.
• Typically, regional areas of the state have recorded superior growth in median prices over the last 10 years to the growth in values within Sydney, however, all have come off a much lower base and also recorded negligible growth between 2004 and 2009.
• Over the last year, it has been some of the smaller regions of the state which have recorded superior price growth, although in a number of instances, the median prices within these regions remain below their peak and have tapered in recent months.
• Typically, the rate of price appreciation across all New South Wales markets is now slowing and with the likelihood of higher interest rates accompanied by falling housing finance commitments and lower sales volumes, it is expected that over the coming 12 months price growth across most markets will be relatively flat. This is not to say that particular areas will record a superior performance.
• The result of limited growth and higher interest rates will be fewer active buyers (and potentially more willing sellers). Given this, it is anticipated that the level of vendor discounting and time on the market will increase initially as vendors have to re‐establish current market values.
• For purchasers, less competition and potentially greater purchase options will provide increased scope for price negotiation, less competition and more favourable purchase conditions.
• With fewer active buyers, there is likely to be increasing demand for rental properties, specifically within larger established population centres. This may create upwards pressure on rental rates and improvements to investment yields. In particular, this is forecast to occur within the Sydney market during the coming year.
• Smaller regional markets also tend to record superior rental yields to that of the larger population centres, however, it is important to remember that these areas are usually not particularly significant rental markets and as a result carry greater vacancy risk than investment properties within well established regions.
• Regional areas which are heavily reliant on the tourism sector or ‘sea changers’ / retirees, are still underperforming due to a lack of demand, the high Australian dollar is doing little to assist in a recovery within these regions.
• It is anticipated that the stronger performing regional markets during the coming 12 months will be those larger regional areas,specifically those closer to Sydney (Hunter and Illawarra). These regions have much greater diversity in their economies than most other regional areas and are still relatively close to Sydney. As a result, we expect that this will result in greater demand and a comparatively stronger market performance.
State of the State NSW Property Report p.80
Appendix 1 – Individual suburb performances

State of the State NSW Property Report p.81
Suburb LGAProperty
typeNumber
soldMedian
price12 month growth
Average annual growth (10 years)
Median weekly rent
Indicative gross rental yield
Vendor discount
Time on market
Abbotsbury Fairfield House 33 $630,000 21.8% 7.5% $550 4.5% n.a. n.a.
Abbotsford Canada Bay House 27 $1,310,000 14.2% 9.3% $700 2.8% n.a. n.a.
Abbotsford Canada Bay Unit 74 $650,000 10.2% 5.1% $473 3.8% ‐4.6% 48
Acacia Gardens Blacktown House 79 $480,000 8.6% 6.0% $460 5.0% ‐4.4% 46
Alexandria Sydney House 118 $758,500 6.7% 7.8% $610 4.2% n.a. n.a.
Alexandria Sydney Unit 265 $420,000 5.8% 2.6% $460 5.7% ‐8.5% 60
Alfords Point Sutherland Shire House 39 $730,000 11.9% 4.8% n.a. n.a. n.a. n.a.
Allambie Heights Warringah House 93 $905,000 13.1% 7.0% $700 4.0% ‐4.5% 47
Allawah Kogarah House 25 $715,000 13.5% 7.1% n.a. n.a. n.a. n.a.
Allawah Kogarah Unit 96 $400,000 8.1% 5.8% $380 4.9% ‐4.5% 25
Ambarvale Campbelltown House 82 $289,000 3.0% 7.1% $330 5.9% ‐4.8% 75
Ambarvale Campbelltown Unit 22 $220,000 12.8% 8.2% $270 6.4% n.a. n.a.
Annandale Leichhardt House 156 $950,500 21.9% 8.3% $625 3.4% n.a. n.a.
Annandale Leichhardt Unit 57 $535,000 28.9% 4.8% $430 4.2% n.a. n.a.
Appin Campbelltown House 25 $365,000 ‐12.0% 5.7% n.a. n.a. n.a. n.a.
Arncliffe Rockdale House 92 $625,000 16.1% 6.6% $490 4.1% ‐8.5% 61
Arncliffe Rockdale Unit 56 $380,000 14.3% 4.8% $360 4.9% ‐3.9% 77
Artarmon Willoughby House 39 $1,430,000 4.5% 7.8% $583 2.1% n.a. n.a.
Artarmon Willoughby Unit 145 $555,000 8.8% 5.8% $470 4.4% ‐3.6% 54
Ashbury Canterbury House 39 $799,000 16.9% 7.5% $520 3.4% n.a. n.a.
Ashcroft Liverpool House 45 $299,250 6.9% 6.6% $350 6.1% ‐7.0% 50
Ashfield Ashfield House 116 $788,000 16.4% 7.0% $400 2.6% ‐4.7% 43
Ashfield Ashfield Unit 257 $418,000 13.0% 6.9% $380 4.7% ‐4.7% 40
Asquith Hornsby House 33 $578,000 7.2% 5.6% $500 4.5% n.a. n.a.
Asquith Hornsby Unit 11 $535,000 15.9% n.a. $420 4.1% n.a. n.a.
Auburn Auburn House 256 $450,000 10.3% 6.3% $400 4.6% ‐5.5% 68
Auburn Auburn Unit 371 $297,000 4.2% 7.1% $350 6.1% ‐5.4% 58
Avalon Pittwater House 210 $1,052,500 5.3% 6.6% $740 3.7% ‐8.4% 70
Avalon Pittwater Unit 77 $460,000 5.7% 4.4% $395 4.5% ‐4.6% 66
Avoca Beach Gosford House 75 $530,000 1.4% 6.7% $400 3.9% ‐8.4% 91
Avoca Beach Gosford Unit 23 $590,000 10.3% 8.5% $345 3.0% n.a. n.a.
Balgowlah Manly House 90 $1,312,500 13.6% 7.8% $850 3.4% n.a. n.a.
Balgowlah Manly Unit 166 $677,500 19.4% 5.8% $480 3.7% ‐3.0% 69
Balgowlah Heights Manly House 60 $1,688,750 12.6% 8.7% $1,338 4.1% n.a. n.a.
Balmain Leichhardt House 181 $1,180,000 34.4% 8.3% $683 3.0% ‐3.8% 34
Balmain Leichhardt Unit 119 $670,000 15.0% 5.7% $500 3.9% ‐1.9% 32
Balmain East Leichhardt House 22 $1,730,000 8.1% 8.0% $710 2.1% n.a. n.a.
Balmain East Leichhardt Unit 27 $616,000 18.5% 5.6% $450 3.8% n.a. n.a.
Bangor Sutherland Shire House 61 $645,000 12.5% 5.4% $570 4.6% n.a. n.a.
Bangor Sutherland Shire Unit 25 $530,000 12.8% n.a. n.a. n.a. n.a. n.a.
Banksia Rockdale House 36 $601,750 20.4% 7.5% $450 3.9% n.a. n.a.
Banksia Rockdale Unit 11 $310,000 ‐17.3% n.a. n.a. n.a. n.a. n.a.
Bankstown Bankstown House 187 $500,000 13.6% 6.4% $420 4.4% ‐7.2% 34
Bankstown Bankstown Unit 482 $288,750 9.6% 4.4% $350 6.3% ‐5.2% 38
Barden Ridge Sutherland Shire House 50 $705,500 12.4% 5.8% $625 4.6% n.a. n.a.
Bardwell Park Rockdale House 32 $735,000 4.4% 5.8% $450 3.2% n.a. n.a.
Bardwell Valley Rockdale House 26 $721,250 26.0% 6.5% n.a. n.a. n.a. n.a.
Bargo Wollondilly House 34 $342,500 3.8% 7.8% $380 5.8% ‐7.3% 74
Bass Hill Bankstown House 114 $447,500 9.8% 5.7% $433 5.0% ‐7.2% 53
Bass Hill Bankstown Unit 18 $380,000 6.7% 4.9% $420 5.7% ‐4.6% 50
Bateau Bay Wyong House 208 $371,250 6.2% 6.1% $330 4.6% ‐7.1% 65
Bateau Bay Wyong Unit 22 $300,000 36.4% 8.7% $260 4.5% n.a. n.a.
Baulkham Hills Baulkham Hills House 440 $592,944 12.9% 6.3% $480 4.2% ‐4.1% 45
Baulkham Hills Baulkham Hills Unit 234 $450,000 9.2% 4.3% $410 4.7% ‐4.1% 47
Bayview Pittwater House 36 $1,247,500 11.4% 6.7% $835 3.5% n.a. n.a.
Beacon Hill Warringah House 110 $835,000 12.8% 6.2% $695 4.3% ‐4.4% 58
Beaconsfield Sydney House 22 $709,500 31.4% n.a. $520 3.8% n.a. n.a.
Beaconsfield Sydney Unit 17 $552,000 22.0% n.a. $510 4.8% n.a. n.a.
Beaumont Hills Baulkham Hills House 166 $646,500 12.4% 12.7% $570 4.6% ‐3.8% 43
Beecroft Hornsby House 126 $887,500 14.0% 6.8% $588 3.4% ‐10.8% 65
Beecroft Hornsby Unit 23 $525,000 3.2% n.a. $460 4.6% n.a. n.a.
Belfield Canterbury House 74 $655,000 19.1% 7.6% $450 3.6% n.a. n.a.
Belfield Canterbury Unit 35 $428,000 1.8% 5.7% $438 5.3% n.a. n.a.
Bella Vista Baulkham Hills House 111 $871,000 17.3% 7.7% $750 4.5% ‐7.4% 67
Bella Vista Baulkham Hills Unit 15 $503,800 9.3% 4.3% n.a. n.a. n.a. n.a.
Bellevue Hill Woollahra House 84 $3,910,000 25.2% 10.1% $1,600 2.1% ‐7.1% 75
Bellevue Hill Woollahra Unit 171 $665,000 10.8% 5.4% $550 4.3% ‐6.8% 53
Belmore Canterbury House 112 $562,500 19.7% 6.5% $420 3.9% ‐7.0% 51
Belmore Canterbury Unit 93 $297,000 19.3% 7.2% $320 5.6% ‐5.8% 43
Sydney suburbs

State of the State NSW Property Report p.82
Sydney suburbs
Suburb LGAProperty
typeNumber
soldMedian
price12 month growth
Average annual growth (10 years)
Median weekly rent
Indicative gross rental yield
Vendor discount
Time on market
Belrose Warringah House 121 $860,000 10.0% 6.2% $750 4.5% ‐4.2% 43
Belrose Warringah Unit 15 $407,500 n.a. 4.6% n.a. n.a. n.a. n.a.
Bensville Gosford House 47 $439,000 5.5% 9.6% $380 4.5% ‐4.5% 66
Berala Auburn House 83 $457,000 10.1% 5.7% $400 4.6% ‐5.5% 38
Berala Auburn Unit 64 $281,500 19.8% 8.5% $320 5.9% ‐4.5% 58
Berkeley Vale Wyong House 141 $320,000 7.0% 6.5% $325 5.3% ‐5.1% 52
Berkeley Vale Wyong Unit 41 $198,000 ‐10.0% 3.0% n.a. n.a. ‐8.1% 98
Berowra Hornsby House 56 $615,000 17.1% 6.9% $495 4.2% n.a. n.a.
Berowra Heights Hornsby House 67 $575,000 8.5% 6.4% $493 4.5% ‐3.0% 53
Beverley Park Rockdale House 32 $867,500 22.2% 6.3% n.a. n.a. n.a. n.a.
Beverly Hills Hurstville House 114 $641,500 14.6% 6.2% $450 3.6% ‐5.1% 26
Beverly Hills Hurstville Unit 62 $412,500 12.7% 4.4% $370 4.7% n.a. n.a.
Bexley Rockdale House 178 $670,000 25.2% 7.2% $470 3.6% ‐5.8% 54
Bexley Rockdale Unit 142 $432,500 13.8% 6.3% $390 4.7% ‐4.0% 34
Bexley North Rockdale House 43 $757,500 24.4% 7.1% $500 3.4% n.a. n.a.
Bidwill Blacktown House 26 $241,250 0.5% 7.5% $300 6.5% ‐8.4% 67
Bilgola Pittwater House 71 $960,000 9.1% 6.1% $800 4.3% ‐3.5% 56
Birchgrove Leichhardt House 57 $1,260,000 9.8% 6.0% $820 3.4% n.a. n.a.
Birchgrove Leichhardt Unit 31 $764,000 15.8% 3.9% $535 3.6% n.a. n.a.
Birrong Auburn House 35 $440,000 16.4% 6.3% $420 5.0% n.a. n.a.
Blackett Blacktown House 38 $239,500 8.9% 9.7% $283 6.1% ‐7.7% 70
Blackheath Blue Mountains House 148 $327,500 5.6% 7.4% $255 4.0% ‐4.1% 60
Blacktown Blacktown House 503 $355,000 8.8% 7.1% $350 5.1% ‐6.2% 51
Blacktown Blacktown Unit 530 $285,000 6.3% 6.0% $330 6.0% ‐5.1% 56
Blackwall Gosford House 30 $362,500 0.7% 5.5% $280 4.0% n.a. n.a.
Blackwall Gosford Unit 15 $315,000 19.8% 5.3% n.a. n.a. n.a. n.a.
Blair Athol Campbelltown House 34 $421,000 12.4% 14.4% $395 4.9% n.a. n.a.
Blakehurst Kogarah House 91 $923,000 13.2% 5.3% $550 3.1% ‐4.3% 63
Blakehurst Kogarah Unit 15 $615,000 23.0% 5.7% n.a. n.a. n.a. n.a.
Blaxland Blue Mountains House 114 $410,000 7.9% 6.0% $380 4.8% ‐3.9% 50
Blaxland Blue Mountains Unit 15 $379,000 4.6% n.a. n.a. n.a. n.a. n.a.
Bligh Park Hawkesbury House 109 $370,000 5.7% 6.3% $360 5.1% ‐4.7% 47
Bligh Park Hawkesbury Unit 27 $296,000 3.9% 7.1% $318 5.6% n.a. n.a.
Blue Bay Wyong House 13 $450,000 5.9% 4.9% $255 2.9% n.a. n.a.
Blue Bay Wyong Unit 14 $326,000 ‐14.2% 1.9% n.a. n.a. n.a. n.a.
Blue Haven Wyong House 111 $310,000 9.3% 7.5% $325 5.5% ‐4.4% 73
Bondi Waverley House 69 $1,380,000 11.7% 8.6% $775 2.9% n.a. n.a.
Bondi Waverley Unit 203 $586,500 6.6% 5.5% $560 5.0% ‐5.6% 37
Bondi Beach Waverley House 52 $1,490,000 9.6% 8.9% $620 2.2% n.a. n.a.
Bondi Beach Waverley Unit 220 $612,500 24.1% 6.2% $500 4.2% n.a. n.a.
Bondi Junction Waverley House 85 $1,226,000 36.2% 9.1% $750 3.2% n.a. n.a.
Bondi Junction Waverley Unit 171 $615,000 32.3% 6.0% $525 4.4% ‐5.3% 48
Bonnet Bay Sutherland Shire House 36 $687,600 9.1% 4.1% n.a. n.a. n.a. n.a.
Bonnyrigg Fairfield House 69 $393,000 9.3% 7.2% $420 5.6% ‐5.5% 40
Bonnyrigg Heights Fairfield House 78 $430,000 13.5% 5.7% $460 5.6% ‐8.2% 77
Booker Bay Gosford House 27 $399,000 5.7% 4.6% $310 4.0% ‐11.2% 88
Booker Bay Gosford Unit 29 $315,000 ‐5.3% 4.4% $285 4.7% ‐4.9% 76
Bossley Park Fairfield House 145 $436,000 11.8% 6.8% $430 5.1% ‐6.5% 55
Bossley Park Fairfield Unit 13 $325,000 13.2% 4.5% n.a. n.a. n.a. n.a.
Botany Botany Bay House 81 $716,000 17.4% 6.3% $580 4.2% n.a. n.a.
Botany Botany Bay Unit 125 $540,000 1.4% 2.9% $430 4.1% ‐2.5% 50
Bow Bowing Campbelltown House 17 $333,000 0.9% 6.8% $360 5.6% n.a. n.a.
Bowen Mountain Hawkesbury House 28 $378,750 13.9% n.a. n.a. n.a. ‐5.4% 94
Bradbury Campbelltown House 121 $310,000 9.5% 7.9% $330 5.5% ‐6.6% 58
Bradbury Campbelltown Unit 28 $202,250 ‐23.5% 8.4% $273 7.0% n.a. n.a.
Breakfast Point Canada Bay House 16 $1,620,000 ‐16.5% n.a. n.a. n.a. n.a. n.a.
Breakfast Point Canada Bay Unit 159 $710,000 9.6% n.a. $660 4.8% ‐3.6% 67
Brighton‐Le‐Sands Rockdale House 50 $853,450 27.4% 6.2% $480 2.9% n.a. n.a.
Brighton‐Le‐Sands Rockdale Unit 110 $425,000 2.8% 4.6% $400 4.9% ‐2.8% 38
Bronte Waverley House 60 $1,775,000 ‐23.5% 8.5% $913 2.7% n.a. n.a.
Bronte Waverley Unit 55 $755,000 21.3% 8.1% $555 3.8% n.a. n.a.
Brooklyn Gosford House 14 $482,500 n.a. 5.2% n.a. n.a. n.a. n.a.
Brookvale Warringah House 10 $857,500 18.3% n.a. $375 2.3% n.a. n.a.
Brookvale Warringah Unit 75 $500,000 13.6% 5.3% $460 4.8% ‐4.6% 42
Budgewoi Wyong House 82 $297,500 8.2% 7.9% $250 4.4% ‐7.1% 82
Budgewoi Wyong Unit 10 $230,000 n.a. n.a. n.a. n.a. n.a. n.a.
Buff Point Wyong House 59 $283,000 2.5% 7.2% $290 5.3% ‐5.2% 62
Bullaburra Blue Mountains House 21 $315,000 18.9% 12.9% $310 5.1% n.a. n.a.
Bundeena Sutherland Shire House 36 $620,000 6.9% 6.3% $350 2.9% n.a. n.a.

State of the State NSW Property Report p.83
Sydney suburbs
Suburb LGAProperty
typeNumber
soldMedian
price12 month growth
Average annual growth (10 years)
Median weekly rent
Indicative gross rental yield
Vendor discount
Time on market
Burraneer Sutherland Shire House 27 $1,800,000 22.4% 8.0% n.a. n.a. n.a. n.a.
Burwood Burwood House 74 $1,012,500 24.2% 7.7% $475 2.4% n.a. n.a.
Burwood Burwood Unit 132 $485,000 6.1% 4.9% $450 4.8% ‐3.0% 45
Burwood Heights Burwood House 11 $980,000 16.7% n.a. n.a. n.a. n.a. n.a.
Busby Liverpool House 50 $313,750 18.4% 7.4% $335 5.6% ‐6.7% 58
Buxton Wollondilly House 31 $297,000 ‐1.0% 8.0% $278 4.9% ‐6.0% 72
Cabarita Canada Bay House 22 $1,235,000 6.2% 4.8% $800 3.4% n.a. n.a.
Cabarita Canada Bay Unit 19 $870,000 10.4% 3.7% $695 4.2% n.a. n.a.
Cabramatta Fairfield House 129 $420,000 16.7% 8.3% $320 4.0% ‐9.7% 71
Cabramatta Fairfield Unit 253 $220,000 14.6% 9.3% $250 5.9% ‐7.4% 46
Cabramatta West Fairfield House 70 $397,500 12.0% 7.6% $365 4.8% ‐7.9% 39
Cambridge Gardens Penrith House 25 $333,000 4.9% 7.5% n.a. n.a. n.a. n.a.
Cambridge Park Penrith House 87 $319,000 7.6% 8.2% $330 5.4% ‐4.8% 56
Cambridge Park Penrith Unit 28 $275,500 2.8% 6.1% $340 6.4% n.a. n.a.
Camden Camden House 49 $390,000 9.5% 6.6% $385 5.1% ‐4.1% 57
Camden Camden Unit 18 $261,000 ‐9.8% 5.0% $325 6.5% n.a. n.a.
Camden Park Camden House 26 $635,000 18.0% n.a. n.a. n.a. n.a. n.a.
Camden South Camden House 85 $376,000 7.4% 6.2% $390 5.4% ‐3.9% 42
Cammeray North Sydney House 60 $1,322,500 17.3% 7.7% $650 2.6% n.a. n.a.
Cammeray North Sydney Unit 160 $587,751 3.1% 5.6% $495 4.4% ‐4.2% 39
Campbelltown Campbelltown House 142 $308,975 11.5% 8.0% $320 5.4% ‐6.6% 82
Campbelltown Campbelltown Unit 170 $275,000 19.6% 12.8% $250 4.7% ‐7.4% 50
Camperdown Sydney House 55 $771,000 11.7% 7.6% $600 4.0% n.a. n.a.
Camperdown Sydney Unit 344 $545,000 14.5% 4.9% $483 4.6% ‐4.1% 65
Campsie Canterbury House 121 $650,000 20.4% 7.7% $430 3.4% ‐7.6% 50
Campsie Canterbury Unit 270 $335,000 9.8% 7.0% $340 5.3% ‐5.6% 32
Canada Bay Canada Bay House 14 $862,500 15.7% 7.5% $535 3.2% n.a. n.a.
Canley Heights Fairfield House 163 $381,000 10.4% 7.6% $380 5.2% ‐5.9% 44
Canley Vale Fairfield House 98 $380,000 10.9% 8.3% $335 4.6% ‐5.7% 67
Canley Vale Fairfield Unit 84 $221,000 3.3% 7.7% $275 6.5% ‐6.2% 31
Canterbury Canterbury House 38 $600,750 11.3% 6.6% $450 3.9% ‐11.9% 83
Canterbury Canterbury Unit 106 $408,250 7.1% 6.9% $360 4.6% ‐5.8% 30
Canton Beach Wyong House 16 $284,500 9.8% 6.1% n.a. n.a. n.a. n.a.
Caringbah Sutherland Shire House 239 $835,000 15.2% 6.4% $590 3.7% ‐6.9% 55
Caringbah Sutherland Shire Unit 358 $430,000 10.3% 3.0% $400 4.8% ‐4.2% 43
Carlingford Baulkham Hills House 230 $680,000 17.5% 6.0% $475 3.6% ‐4.5% 43
Carlingford Baulkham Hills Unit 141 $477,000 8.9% 6.2% $430 4.7% ‐5.4% 56
Carlton Kogarah House 86 $697,500 17.8% 6.7% $520 3.9% n.a. n.a.
Carlton Kogarah Unit 113 $395,000 6.8% 5.6% $380 5.0% ‐2.8% 46
Carramar Fairfield House 30 $330,000 13.8% 6.2% n.a. n.a. n.a. n.a.
Carramar Fairfield Unit 53 $197,000 23.1% 8.8% $260 6.9% ‐6.7% 52
Carss Park Kogarah House 24 $946,500 4.2% 6.5% n.a. n.a. n.a. n.a.
Cartwright Liverpool House 28 $290,000 16.0% 7.2% $350 6.3% ‐6.3% 64
Castle Cove Ku‐ring‐gai House 36 $1,445,000 3.2% 7.1% $975 3.5% n.a. n.a.
Castle Hill Baulkham Hills House 517 $715,000 9.2% 6.1% $580 4.2% ‐5.4% 50
Castle Hill Baulkham Hills Unit 279 $465,000 8.6% 4.1% $440 4.9% ‐3.7% 49
Castlecrag Willoughby House 49 $1,910,000 13.4% 9.7% $1,175 3.2% n.a. n.a.
Casula Liverpool House 173 $418,000 5.8% 8.2% $430 5.3% ‐6.5% 55
Casula Liverpool Unit 63 $336,000 0.0% 5.3% $370 5.7% ‐3.7% 71
Cecil Hills Liverpool House 83 $550,000 12.5% 11.2% $500 4.7% ‐6.4% 44
Centennial Park Woollahra Unit 60 $472,500 7.4% 4.7% $420 4.6% n.a. n.a.
Chain Valley Bay Wyong House 28 $269,000 ‐4.6% 8.9% $340 6.6% n.a. n.a.
Charmhaven Wyong House 53 $308,000 18.5% 8.6% $290 4.9% ‐6.7% 75
Chatswood Willoughby House 150 $1,121,500 9.4% 6.5% $725 3.4% ‐8.1% 53
Chatswood Willoughby Unit 361 $580,000 16.7% 5.2% $528 4.7% ‐4.4% 50
Chatswood West Willoughby House 12 $985,000 8.0% 6.7% n.a. n.a. n.a. n.a.
Cheltenham Hornsby House 27 $866,000 6.9% 6.0% $655 3.9% n.a. n.a.
Cherrybrook Hornsby House 238 $725,000 11.5% 5.6% $625 4.5% ‐4.0% 43
Cherrybrook Hornsby Unit 59 $505,000 7.0% 5.6% $530 5.5% ‐3.9% 36
Chester Hill Bankstown House 133 $420,000 10.5% 5.8% $400 5.0% ‐5.5% 55
Chester Hill Bankstown Unit 23 $280,000 3.7% 5.1% $340 6.3% n.a. n.a.
Chifley Randwick House 27 $850,000 20.6% 6.4% $675 4.1% n.a. n.a.
Chippendale Sydney House 17 $715,000 2.9% 7.1% $560 4.1% n.a. n.a.
Chippendale Sydney Unit 158 $393,500 ‐1.0% 5.7% $405 5.4% ‐5.1% 52
Chipping Norton Liverpool House 117 $535,000 12.6% 6.1% $460 4.5% ‐5.0% 46
Chipping Norton Liverpool Unit 47 $312,000 12.2% 5.0% $330 5.5% n.a. n.a.
Chiswick Canada Bay House 11 $1,610,000 n.a. 9.8% n.a. n.a. n.a. n.a.
Chiswick Canada Bay Unit 66 $538,000 11.0% 5.0% $450 4.3% n.a. n.a.
Chittaway Bay Wyong House 34 $358,250 10.6% 6.5% $305 4.4% n.a. n.a.
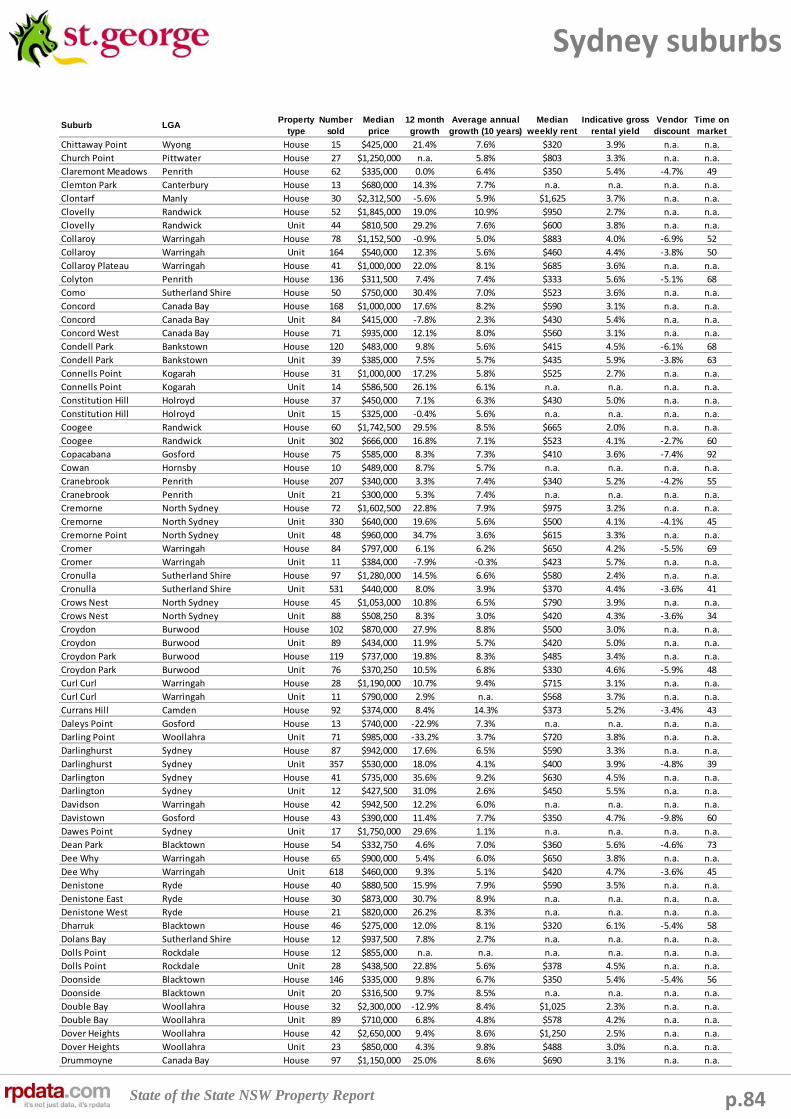
State of the State NSW Property Report p.84
Sydney suburbs
Suburb LGAProperty
typeNumber
soldMedian
price12 month growth
Average annual growth (10 years)
Median weekly rent
Indicative gross rental yield
Vendor discount
Time on market
Chittaway Point Wyong House 15 $425,000 21.4% 7.6% $320 3.9% n.a. n.a.
Church Point Pittwater House 27 $1,250,000 n.a. 5.8% $803 3.3% n.a. n.a.
Claremont Meadows Penrith House 62 $335,000 0.0% 6.4% $350 5.4% ‐4.7% 49
Clemton Park Canterbury House 13 $680,000 14.3% 7.7% n.a. n.a. n.a. n.a.
Clontarf Manly House 30 $2,312,500 ‐5.6% 5.9% $1,625 3.7% n.a. n.a.
Clovelly Randwick House 52 $1,845,000 19.0% 10.9% $950 2.7% n.a. n.a.
Clovelly Randwick Unit 44 $810,500 29.2% 7.6% $600 3.8% n.a. n.a.
Collaroy Warringah House 78 $1,152,500 ‐0.9% 5.0% $883 4.0% ‐6.9% 52
Collaroy Warringah Unit 164 $540,000 12.3% 5.6% $460 4.4% ‐3.8% 50
Collaroy Plateau Warringah House 41 $1,000,000 22.0% 8.1% $685 3.6% n.a. n.a.
Colyton Penrith House 136 $311,500 7.4% 7.4% $333 5.6% ‐5.1% 68
Como Sutherland Shire House 50 $750,000 30.4% 7.0% $523 3.6% n.a. n.a.
Concord Canada Bay House 168 $1,000,000 17.6% 8.2% $590 3.1% n.a. n.a.
Concord Canada Bay Unit 84 $415,000 ‐7.8% 2.3% $430 5.4% n.a. n.a.
Concord West Canada Bay House 71 $935,000 12.1% 8.0% $560 3.1% n.a. n.a.
Condell Park Bankstown House 120 $483,000 9.8% 5.6% $415 4.5% ‐6.1% 68
Condell Park Bankstown Unit 39 $385,000 7.5% 5.7% $435 5.9% ‐3.8% 63
Connells Point Kogarah House 31 $1,000,000 17.2% 5.8% $525 2.7% n.a. n.a.
Connells Point Kogarah Unit 14 $586,500 26.1% 6.1% n.a. n.a. n.a. n.a.
Constitution Hill Holroyd House 37 $450,000 7.1% 6.3% $430 5.0% n.a. n.a.
Constitution Hill Holroyd Unit 15 $325,000 ‐0.4% 5.6% n.a. n.a. n.a. n.a.
Coogee Randwick House 60 $1,742,500 29.5% 8.5% $665 2.0% n.a. n.a.
Coogee Randwick Unit 302 $666,000 16.8% 7.1% $523 4.1% ‐2.7% 60
Copacabana Gosford House 75 $585,000 8.3% 7.3% $410 3.6% ‐7.4% 92
Cowan Hornsby House 10 $489,000 8.7% 5.7% n.a. n.a. n.a. n.a.
Cranebrook Penrith House 207 $340,000 3.3% 7.4% $340 5.2% ‐4.2% 55
Cranebrook Penrith Unit 21 $300,000 5.3% 7.4% n.a. n.a. n.a. n.a.
Cremorne North Sydney House 72 $1,602,500 22.8% 7.9% $975 3.2% n.a. n.a.
Cremorne North Sydney Unit 330 $640,000 19.6% 5.6% $500 4.1% ‐4.1% 45
Cremorne Point North Sydney Unit 48 $960,000 34.7% 3.6% $615 3.3% n.a. n.a.
Cromer Warringah House 84 $797,000 6.1% 6.2% $650 4.2% ‐5.5% 69
Cromer Warringah Unit 11 $384,000 ‐7.9% ‐0.3% $423 5.7% n.a. n.a.
Cronulla Sutherland Shire House 97 $1,280,000 14.5% 6.6% $580 2.4% n.a. n.a.
Cronulla Sutherland Shire Unit 531 $440,000 8.0% 3.9% $370 4.4% ‐3.6% 41
Crows Nest North Sydney House 45 $1,053,000 10.8% 6.5% $790 3.9% n.a. n.a.
Crows Nest North Sydney Unit 88 $508,250 8.3% 3.0% $420 4.3% ‐3.6% 34
Croydon Burwood House 102 $870,000 27.9% 8.8% $500 3.0% n.a. n.a.
Croydon Burwood Unit 89 $434,000 11.9% 5.7% $420 5.0% n.a. n.a.
Croydon Park Burwood House 119 $737,000 19.8% 8.3% $485 3.4% n.a. n.a.
Croydon Park Burwood Unit 76 $370,250 10.5% 6.8% $330 4.6% ‐5.9% 48
Curl Curl Warringah House 28 $1,190,000 10.7% 9.4% $715 3.1% n.a. n.a.
Curl Curl Warringah Unit 11 $790,000 2.9% n.a. $568 3.7% n.a. n.a.
Currans Hill Camden House 92 $374,000 8.4% 14.3% $373 5.2% ‐3.4% 43
Daleys Point Gosford House 13 $740,000 ‐22.9% 7.3% n.a. n.a. n.a. n.a.
Darling Point Woollahra Unit 71 $985,000 ‐33.2% 3.7% $720 3.8% n.a. n.a.
Darlinghurst Sydney House 87 $942,000 17.6% 6.5% $590 3.3% n.a. n.a.
Darlinghurst Sydney Unit 357 $530,000 18.0% 4.1% $400 3.9% ‐4.8% 39
Darlington Sydney House 41 $735,000 35.6% 9.2% $630 4.5% n.a. n.a.
Darlington Sydney Unit 12 $427,500 31.0% 2.6% $450 5.5% n.a. n.a.
Davidson Warringah House 42 $942,500 12.2% 6.0% n.a. n.a. n.a. n.a.
Davistown Gosford House 43 $390,000 11.4% 7.7% $350 4.7% ‐9.8% 60
Dawes Point Sydney Unit 17 $1,750,000 29.6% 1.1% n.a. n.a. n.a. n.a.
Dean Park Blacktown House 54 $332,750 4.6% 7.0% $360 5.6% ‐4.6% 73
Dee Why Warringah House 65 $900,000 5.4% 6.0% $650 3.8% n.a. n.a.
Dee Why Warringah Unit 618 $460,000 9.3% 5.1% $420 4.7% ‐3.6% 45
Denistone Ryde House 40 $880,500 15.9% 7.9% $590 3.5% n.a. n.a.
Denistone East Ryde House 30 $873,000 30.7% 8.9% n.a. n.a. n.a. n.a.
Denistone West Ryde House 21 $820,000 26.2% 8.3% n.a. n.a. n.a. n.a.
Dharruk Blacktown House 46 $275,000 12.0% 8.1% $320 6.1% ‐5.4% 58
Dolans Bay Sutherland Shire House 12 $937,500 7.8% 2.7% n.a. n.a. n.a. n.a.
Dolls Point Rockdale House 12 $855,000 n.a. n.a. n.a. n.a. n.a. n.a.
Dolls Point Rockdale Unit 28 $438,500 22.8% 5.6% $378 4.5% n.a. n.a.
Doonside Blacktown House 146 $335,000 9.8% 6.7% $350 5.4% ‐5.4% 56
Doonside Blacktown Unit 20 $316,500 9.7% 8.5% n.a. n.a. n.a. n.a.
Double Bay Woollahra House 32 $2,300,000 ‐12.9% 8.4% $1,025 2.3% n.a. n.a.
Double Bay Woollahra Unit 89 $710,000 6.8% 4.8% $578 4.2% n.a. n.a.
Dover Heights Woollahra House 42 $2,650,000 9.4% 8.6% $1,250 2.5% n.a. n.a.
Dover Heights Woollahra Unit 23 $850,000 4.3% 9.8% $488 3.0% n.a. n.a.
Drummoyne Canada Bay House 97 $1,150,000 25.0% 8.6% $690 3.1% n.a. n.a.
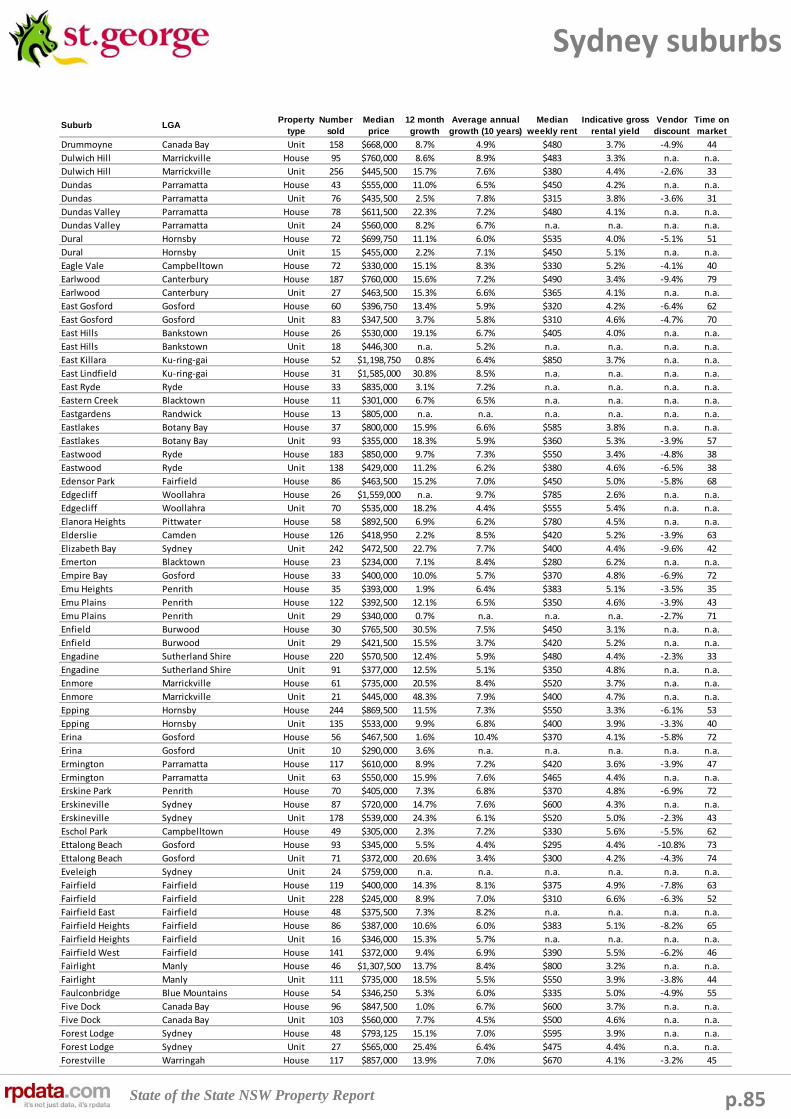
State of the State NSW Property Report p.85
Sydney suburbs
Suburb LGAProperty
typeNumber
soldMedian
price12 month growth
Average annual growth (10 years)
Median weekly rent
Indicative gross rental yield
Vendor discount
Time on market
Drummoyne Canada Bay Unit 158 $668,000 8.7% 4.9% $480 3.7% ‐4.9% 44
Dulwich Hill Marrickville House 95 $760,000 8.6% 8.9% $483 3.3% n.a. n.a.
Dulwich Hill Marrickville Unit 256 $445,500 15.7% 7.6% $380 4.4% ‐2.6% 33
Dundas Parramatta House 43 $555,000 11.0% 6.5% $450 4.2% n.a. n.a.
Dundas Parramatta Unit 76 $435,500 2.5% 7.8% $315 3.8% ‐3.6% 31
Dundas Valley Parramatta House 78 $611,500 22.3% 7.2% $480 4.1% n.a. n.a.
Dundas Valley Parramatta Unit 24 $560,000 8.2% 6.7% n.a. n.a. n.a. n.a.
Dural Hornsby House 72 $699,750 11.1% 6.0% $535 4.0% ‐5.1% 51
Dural Hornsby Unit 15 $455,000 2.2% 7.1% $450 5.1% n.a. n.a.
Eagle Vale Campbelltown House 72 $330,000 15.1% 8.3% $330 5.2% ‐4.1% 40
Earlwood Canterbury House 187 $760,000 15.6% 7.2% $490 3.4% ‐9.4% 79
Earlwood Canterbury Unit 27 $463,500 15.3% 6.6% $365 4.1% n.a. n.a.
East Gosford Gosford House 60 $396,750 13.4% 5.9% $320 4.2% ‐6.4% 62
East Gosford Gosford Unit 83 $347,500 3.7% 5.8% $310 4.6% ‐4.7% 70
East Hills Bankstown House 26 $530,000 19.1% 6.7% $405 4.0% n.a. n.a.
East Hills Bankstown Unit 18 $446,300 n.a. 5.2% n.a. n.a. n.a. n.a.
East Killara Ku‐ring‐gai House 52 $1,198,750 0.8% 6.4% $850 3.7% n.a. n.a.
East Lindfield Ku‐ring‐gai House 31 $1,585,000 30.8% 8.5% n.a. n.a. n.a. n.a.
East Ryde Ryde House 33 $835,000 3.1% 7.2% n.a. n.a. n.a. n.a.
Eastern Creek Blacktown House 11 $301,000 6.7% 6.5% n.a. n.a. n.a. n.a.
Eastgardens Randwick House 13 $805,000 n.a. n.a. n.a. n.a. n.a. n.a.
Eastlakes Botany Bay House 37 $800,000 15.9% 6.6% $585 3.8% n.a. n.a.
Eastlakes Botany Bay Unit 93 $355,000 18.3% 5.9% $360 5.3% ‐3.9% 57
Eastwood Ryde House 183 $850,000 9.7% 7.3% $550 3.4% ‐4.8% 38
Eastwood Ryde Unit 138 $429,000 11.2% 6.2% $380 4.6% ‐6.5% 38
Edensor Park Fairfield House 86 $463,500 15.2% 7.0% $450 5.0% ‐5.8% 68
Edgecliff Woollahra House 26 $1,559,000 n.a. 9.7% $785 2.6% n.a. n.a.
Edgecliff Woollahra Unit 70 $535,000 18.2% 4.4% $555 5.4% n.a. n.a.
Elanora Heights Pittwater House 58 $892,500 6.9% 6.2% $780 4.5% n.a. n.a.
Elderslie Camden House 126 $418,950 2.2% 8.5% $420 5.2% ‐3.9% 63
Elizabeth Bay Sydney Unit 242 $472,500 22.7% 7.7% $400 4.4% ‐9.6% 42
Emerton Blacktown House 23 $234,000 7.1% 8.4% $280 6.2% n.a. n.a.
Empire Bay Gosford House 33 $400,000 10.0% 5.7% $370 4.8% ‐6.9% 72
Emu Heights Penrith House 35 $393,000 1.9% 6.4% $383 5.1% ‐3.5% 35
Emu Plains Penrith House 122 $392,500 12.1% 6.5% $350 4.6% ‐3.9% 43
Emu Plains Penrith Unit 29 $340,000 0.7% n.a. n.a. n.a. ‐2.7% 71
Enfield Burwood House 30 $765,500 30.5% 7.5% $450 3.1% n.a. n.a.
Enfield Burwood Unit 29 $421,500 15.5% 3.7% $420 5.2% n.a. n.a.
Engadine Sutherland Shire House 220 $570,500 12.4% 5.9% $480 4.4% ‐2.3% 33
Engadine Sutherland Shire Unit 91 $377,000 12.5% 5.1% $350 4.8% n.a. n.a.
Enmore Marrickville House 61 $735,000 20.5% 8.4% $520 3.7% n.a. n.a.
Enmore Marrickville Unit 21 $445,000 48.3% 7.9% $400 4.7% n.a. n.a.
Epping Hornsby House 244 $869,500 11.5% 7.3% $550 3.3% ‐6.1% 53
Epping Hornsby Unit 135 $533,000 9.9% 6.8% $400 3.9% ‐3.3% 40
Erina Gosford House 56 $467,500 1.6% 10.4% $370 4.1% ‐5.8% 72
Erina Gosford Unit 10 $290,000 3.6% n.a. n.a. n.a. n.a. n.a.
Ermington Parramatta House 117 $610,000 8.9% 7.2% $420 3.6% ‐3.9% 47
Ermington Parramatta Unit 63 $550,000 15.9% 7.6% $465 4.4% n.a. n.a.
Erskine Park Penrith House 70 $405,000 7.3% 6.8% $370 4.8% ‐6.9% 72
Erskineville Sydney House 87 $720,000 14.7% 7.6% $600 4.3% n.a. n.a.
Erskineville Sydney Unit 178 $539,000 24.3% 6.1% $520 5.0% ‐2.3% 43
Eschol Park Campbelltown House 49 $305,000 2.3% 7.2% $330 5.6% ‐5.5% 62
Ettalong Beach Gosford House 93 $345,000 5.5% 4.4% $295 4.4% ‐10.8% 73
Ettalong Beach Gosford Unit 71 $372,000 20.6% 3.4% $300 4.2% ‐4.3% 74
Eveleigh Sydney Unit 24 $759,000 n.a. n.a. n.a. n.a. n.a. n.a.
Fairfield Fairfield House 119 $400,000 14.3% 8.1% $375 4.9% ‐7.8% 63
Fairfield Fairfield Unit 228 $245,000 8.9% 7.0% $310 6.6% ‐6.3% 52
Fairfield East Fairfield House 48 $375,500 7.3% 8.2% n.a. n.a. n.a. n.a.
Fairfield Heights Fairfield House 86 $387,000 10.6% 6.0% $383 5.1% ‐8.2% 65
Fairfield Heights Fairfield Unit 16 $346,000 15.3% 5.7% n.a. n.a. n.a. n.a.
Fairfield West Fairfield House 141 $372,000 9.4% 6.9% $390 5.5% ‐6.2% 46
Fairlight Manly House 46 $1,307,500 13.7% 8.4% $800 3.2% n.a. n.a.
Fairlight Manly Unit 111 $735,000 18.5% 5.5% $550 3.9% ‐3.8% 44
Faulconbridge Blue Mountains House 54 $346,250 5.3% 6.0% $335 5.0% ‐4.9% 55
Five Dock Canada Bay House 96 $847,500 1.0% 6.7% $600 3.7% n.a. n.a.
Five Dock Canada Bay Unit 103 $560,000 7.7% 4.5% $500 4.6% n.a. n.a.
Forest Lodge Sydney House 48 $793,125 15.1% 7.0% $595 3.9% n.a. n.a.
Forest Lodge Sydney Unit 27 $565,000 25.4% 6.4% $475 4.4% n.a. n.a.
Forestville Warringah House 117 $857,000 13.9% 7.0% $670 4.1% ‐3.2% 45

State of the State NSW Property Report p.86
Sydney suburbs
Suburb LGAProperty
typeNumber
soldMedian
price12 month growth
Average annual growth (10 years)
Median weekly rent
Indicative gross rental yield
Vendor discount
Time on market
Forestville Warringah Unit 25 $550,000 0.0% n.a. n.a. n.a. n.a. n.a.
Forresters Beach Gosford House 43 $535,000 21.9% 7.0% $440 4.3% ‐5.4% 68
Freemans Reach Hawkesbury House 19 $354,000 3.4% 6.6% n.a. n.a. ‐13.5% 79
Frenchs Forest Warringah House 221 $845,000 11.2% 6.7% $700 4.3% ‐4.3% 54
Freshwater Warringah House 88 $1,274,000 13.0% 8.9% $738 3.0% n.a. n.a.
Freshwater Warringah Unit 170 $489,500 17.1% 5.4% $425 4.5% ‐2.6% 31
Galston Hornsby House 24 $607,500 16.8% 6.8% n.a. n.a. ‐5.7% 73
Galston Hornsby Unit 28 $429,000 n.a. n.a. n.a. n.a. n.a. n.a.
Georges Hall Bankstown House 94 $501,750 13.0% 5.5% $450 4.7% ‐6.0% 47
Georges Hall Bankstown Unit 25 $385,000 11.8% 4.4% n.a. n.a. n.a. n.a.
Girraween Holroyd House 50 $475,000 10.7% 6.4% $380 4.2% n.a. n.a.
Girraween Holroyd Unit 63 $342,000 2.1% 5.3% $350 5.3% n.a. n.a.
Gladesville Ryde House 130 $980,000 20.2% 7.7% $580 3.1% ‐4.8% 39
Gladesville Ryde Unit 138 $422,500 10.3% 6.5% $350 4.3% ‐3.8% 29
Glebe Sydney House 79 $990,000 22.2% 7.8% $600 3.2% n.a. n.a.
Glebe Sydney Unit 124 $487,500 10.0% 5.8% $410 4.4% ‐4.6% 40
Glen Alpine Campbelltown House 61 $535,000 8.2% 12.7% $510 5.0% ‐5.1% 53
Glenbrook Blue Mountains House 56 $520,000 29.4% 8.2% $390 3.9% ‐4.5% 62
Glendenning Blacktown House 77 $350,500 7.8% 7.2% $370 5.5% ‐4.9% 57
Glenfield Campbelltown House 84 $387,500 6.5% 7.4% $380 5.1% ‐5.9% 45
Glenfield Campbelltown Unit 51 $238,500 3.7% 6.5% $295 6.4% n.a. n.a.
Glenhaven Baulkham Hills House 86 $814,000 13.2% 6.4% $700 4.5% ‐4.3% 54
Glenmore Park Penrith House 315 $442,000 11.9% 9.7% $380 4.5% ‐3.9% 55
Glenmore Park Penrith Unit 35 $365,000 ‐7.6% 7.2% $375 5.3% n.a. n.a.
Glenning Valley Wyong House 25 $375,000 7.1% 6.8% $375 5.2% n.a. n.a.
Glenwood Blacktown House 219 $530,000 6.2% 11.6% $520 5.1% ‐3.6% 45
Glossodia Hawkesbury House 33 $350,000 14.8% 7.1% $350 5.2% ‐3.5% 69
Gordon Ku‐ring‐gai House 72 $1,347,500 12.3% 7.0% $780 3.0% n.a. n.a.
Gordon Ku‐ring‐gai Unit 63 $695,000 3.7% 4.7% $465 3.5% n.a. n.a.
Gorokan Wyong House 168 $260,000 6.1% 6.8% $270 5.4% ‐6.9% 72
Gorokan Wyong Unit 31 $211,000 3.9% 4.8% n.a. n.a. n.a. n.a.
Gosford Gosford Unit 145 $273,000 7.1% 3.2% $290 5.5% ‐5.6% 64
Granville Parramatta House 192 $400,000 14.3% 6.3% $380 4.9% ‐14.4% 59
Granville Parramatta Unit 193 $292,000 2.5% 5.6% $330 5.9% ‐5.3% 55
Grays Point Sutherland Shire House 35 $745,000 14.6% 4.2% $570 4.0% n.a. n.a.
Green Point Gosford House 102 $464,500 9.4% 6.1% $420 4.7% ‐7.1% 76
Green Point Gosford Unit 11 $326,000 8.7% 5.9% n.a. n.a. n.a. n.a.
Green Valley Liverpool House 150 $400,000 5.3% 6.8% $398 5.2% ‐5.7% 42
Greenacre Bankstown House 288 $485,000 11.5% 6.1% $450 4.8% ‐4.9% 66
Greenacre Bankstown Unit 80 $346,000 4.8% 4.9% $360 5.4% ‐5.2% 62
Greenfield Park Fairfield House 38 $420,000 9.7% 6.4% $425 5.3% n.a. n.a.
Greenfield Park Fairfield Unit 10 $308,000 10.8% 4.9% n.a. n.a. n.a. n.a.
Greenwich North Sydney House 59 $1,611,000 23.0% 8.6% $763 2.5% n.a. n.a.
Greenwich North Sydney Unit 44 $535,000 25.5% 5.3% $450 4.4% n.a. n.a.
Greystanes Holroyd House 277 $455,000 8.2% 5.9% $410 4.7% ‐6.1% 55
Greystanes Holroyd Unit 36 $375,500 8.8% 6.0% n.a. n.a. ‐5.5% 53
Guildford Holroyd House 218 $400,000 8.5% 5.7% $380 4.9% ‐8.8% 62
Guildford Holroyd Unit 148 $293,000 2.6% 7.0% $340 6.0% ‐5.2% 55
Guildford West Holroyd House 68 $407,550 10.1% 6.9% $390 5.0% ‐5.2% 61
Gwandalan Wyong House 68 $285,000 7.5% 11.1% $290 5.3% ‐8.4% 80
Gymea Sutherland Shire House 47 $671,000 18.8% 5.7% $550 4.3% n.a. n.a.
Gymea Sutherland Shire Unit 143 $465,000 12.0% 5.6% $380 4.2% ‐3.8% 35
Gymea Bay Sutherland Shire House 93 $805,000 8.2% 6.3% $620 4.0% ‐5.0% 54
Haberfield Ashfield House 55 $1,300,000 20.9% 7.9% $598 2.4% n.a. n.a.
Halekulani Wyong House 29 $275,000 10.0% 7.0% n.a. n.a. n.a. n.a.
Hamlyn Terrace Wyong House 103 $385,000 0.7% 14.5% $380 5.1% ‐5.0% 75
Hammondville Liverpool House 54 $421,000 12.3% 7.8% $420 5.2% ‐4.4% 41
Hammondville Liverpool Unit 12 $289,500 11.6% 5.0% n.a. n.a. n.a. n.a.
Harrington Park Camden House 179 $520,000 14.3% 13.6% $480 4.8% ‐4.0% 60
Harris Park Parramatta House 24 $512,500 1.4% 7.2% $440 4.5% n.a. n.a.
Harris Park Parramatta Unit 138 $274,000 5.4% 6.3% $330 6.3% ‐5.1% 44
Hassall Grove Blacktown House 69 $345,000 11.3% 7.4% $360 5.4% ‐5.3% 48
Haymarket Sydney Unit 101 $596,000 20.4% 6.8% n.a. n.a. n.a. n.a.
Hazelbrook Blue Mountains House 104 $335,750 13.8% 7.3% $305 4.7% ‐4.4% 71
Heathcote Sutherland Shire House 51 $565,000 9.7% 5.9% $530 4.9% n.a. n.a.
Heathcote Sutherland Shire Unit 29 $462,000 9.1% 5.3% n.a. n.a. n.a. n.a.
Hebersham Blacktown House 65 $275,000 7.8% 8.6% $305 5.8% ‐5.9% 59
Heckenberg Liverpool House 35 $295,000 7.7% 6.3% $360 6.3% ‐4.9% 56
Hillsdale Randwick Unit 108 $350,000 12.9% 6.2% $350 5.2% ‐4.0% 40

State of the State NSW Property Report p.87
Sydney suburbs
Suburb LGAProperty
typeNumber
soldMedian
price12 month growth
Average annual growth (10 years)
Median weekly rent
Indicative gross rental yield
Vendor discount
Time on market
Hinchinbrook Liverpool House 141 $415,000 10.1% 6.0% $410 5.1% ‐6.2% 43
Hinchinbrook Liverpool Unit 12 $349,500 n.a. 6.0% n.a. n.a. n.a. n.a.
Hobartville Hawkesbury House 51 $337,500 6.2% 6.8% n.a. n.a. ‐4.6% 45
Holroyd Parramatta Unit 38 $402,500 7.3% n.a. $410 5.3% n.a. n.a.
Holsworthy Liverpool House 89 $431,000 15.5% 6.8% $390 4.7% ‐3.5% 53
Holsworthy Liverpool Unit 10 $414,750 3.9% n.a. n.a. n.a. n.a. n.a.
Homebush Strathfield House 25 $730,000 8.6% 6.8% $495 3.5% n.a. n.a.
Homebush Strathfield Unit 174 $416,251 9.3% 6.8% $430 5.4% ‐3.4% 41
Homebush Bay Auburn Unit 163 $525,000 5.2% 3.2% $495 4.9% ‐3.7% 73
Homebush West Strathfield House 11 $530,000 ‐14.3% 5.9% $435 4.3% n.a. n.a.
Homebush West Strathfield Unit 219 $365,000 7.4% 7.4% $410 5.8% ‐5.7% 49
Horningsea Park Liverpool House 72 $446,000 2.5% 7.1% $455 5.3% ‐5.5% 56
Hornsby Hornsby House 113 $650,000 13.0% 6.6% $473 3.8% ‐3.1% 44
Hornsby Hornsby Unit 392 $405,000 9.7% 5.0% $380 4.9% ‐3.3% 48
Hornsby Heights Hornsby House 79 $620,000 9.7% 6.2% $500 4.2% ‐4.4% 44
Horsfield Bay Gosford House 13 $495,000 n.a. 6.4% $395 4.1% n.a. n.a.
Hoxton Park Liverpool House 66 $400,000 3.9% 5.4% $450 5.9% ‐7.6% 47
Hunters Hill Hunter's Hill House 130 $1,398,000 5.9% 5.2% $675 2.5% n.a. n.a.
Hunters Hill Hunter's Hill Unit 43 $490,000 ‐19.7% 2.8% $420 4.5% n.a. n.a.
Huntleys Cove Ryde Unit 35 $870,000 38.6% 6.1% n.a. n.a. n.a. n.a.
Hurlstone Park Canterbury House 39 $730,000 9.0% 7.1% $495 3.5% n.a. n.a.
Hurlstone Park Canterbury Unit 20 $392,500 5.2% 7.6% $360 4.8% n.a. n.a.
Hurstville Hurstville House 186 $780,000 16.4% 7.5% $450 3.0% ‐6.5% 41
Hurstville Hurstville Unit 442 $450,500 9.9% 5.7% $420 4.8% ‐4.3% 52
Hurstville Grove Hurstville House 55 $870,500 12.7% 7.2% $580 3.5% n.a. n.a.
Illawong Sutherland Shire House 81 $752,000 9.8% 5.6% $620 4.3% ‐4.7% 119
Illawong Sutherland Shire Unit 13 $535,000 22.7% n.a. n.a. n.a. n.a. n.a.
Ingleburn Campbelltown House 191 $340,000 6.3% 6.7% $360 5.5% ‐5.4% 52
Ingleburn Campbelltown Unit 82 $250,000 8.7% 7.4% $290 6.0% ‐4.8% 51
Jamisontown Penrith House 53 $376,000 7.1% 7.4% $350 4.8% ‐4.0% 36
Jamisontown Penrith Unit 64 $255,750 ‐7.7% 8.3% $295 6.0% ‐4.1% 55
Jannali Sutherland Shire House 83 $560,000 10.9% 5.1% $450 4.2% ‐3.2% 30
Jannali Sutherland Shire Unit 51 $380,000 1.2% 5.0% $320 4.4% n.a. n.a.
Kangaroo Point Sutherland Shire House 12 $2,297,500 n.a. n.a. n.a. n.a. n.a. n.a.
Kanwal Wyong House 55 $291,500 2.3% 6.9% $300 5.4% ‐6.0% 67
Kareela Sutherland Shire House 42 $692,500 6.5% 3.4% $580 4.4% n.a. n.a.
Kareela Sutherland Shire Unit 10 $438,000 n.a. 5.6% n.a. n.a. n.a. n.a.
Kariong Gosford House 98 $380,000 5.6% 6.4% $370 5.1% ‐3.2% 60
Katoomba Blue Mountains House 212 $321,000 7.5% 7.5% $300 4.9% ‐5.7% 76
Katoomba Blue Mountains Unit 17 $231,000 17.6% 6.0% $255 5.7% n.a. n.a.
Kearns Campbelltown House 33 $398,440 23.5% 6.4% $320 4.2% ‐5.2% 49
Kellyville Baulkham Hills House 343 $642,500 12.7% 10.2% $565 4.6% ‐5.0% 67
Kellyville Baulkham Hills Unit 16 $451,505 n.a. 5.0% $453 5.2% n.a. n.a.
Kellyville Ridge Baulkham Hills House 172 $550,000 11.1% 13.7% $550 5.2% ‐4.3% 52
Kellyville Ridge Baulkham Hills Unit 25 $350,000 7.0% n.a. n.a. n.a. n.a. n.a.
Kensington Randwick House 52 $1,715,000 42.9% 8.6% $730 2.2% n.a. n.a.
Kensington Randwick Unit 209 $550,000 11.2% 5.4% $450 4.3% ‐6.1% 45
Killara Ku‐ring‐gai House 99 $1,475,000 16.5% 7.6% $925 3.3% n.a. n.a.
Killara Ku‐ring‐gai Unit 175 $855,000 22.5% 9.3% $510 3.1% ‐11.2% 43
Killarney Heights Warringah House 61 $1,005,000 15.5% 6.5% $900 4.7% n.a. n.a.
Killarney Vale Wyong House 160 $316,250 11.0% 6.4% $290 4.8% ‐6.7% 64
Killcare Gosford House 13 $855,000 25.7% 7.8% n.a. n.a. n.a. n.a.
Killcare Heights Gosford House 22 $603,500 9.7% 6.5% n.a. n.a. ‐11.0% 123
Kincumber Gosford House 102 $375,000 7.4% 6.0% $350 4.9% ‐3.5% 53
Kincumber Gosford Unit 10 $282,250 24.9% 5.8% n.a. n.a. n.a. n.a.
Kings Langley Blacktown House 127 $515,000 11.7% 6.3% $450 4.5% ‐3.1% 37
Kings Park Blacktown House 54 $404,500 3.7% 5.8% $360 4.6% ‐4.2% 45
Kingsford Randwick House 108 $1,152,500 19.6% 8.2% $620 2.8% n.a. n.a.
Kingsford Randwick Unit 129 $490,000 8.4% 5.0% $440 4.7% ‐4.9% 27
Kingsgrove Canterbury House 151 $665,000 15.7% 6.8% $500 3.9% ‐6.1% 42
Kingsgrove Canterbury Unit 15 $430,000 10.3% 6.9% $370 4.5% n.a. n.a.
Kingswood Penrith House 98 $330,000 11.9% 7.6% $310 4.9% ‐5.0% 56
Kingswood Penrith Unit 156 $245,000 0.0% 7.7% $253 5.4% ‐4.6% 49
Kirrawee Sutherland Shire House 91 $640,000 14.3% 5.4% $520 4.2% ‐2.8% 39
Kirrawee Sutherland Shire Unit 91 $452,500 16.8% 7.5% $380 4.4% ‐4.7% 57
Kirribilli North Sydney House 21 $2,220,000 n.a. 10.0% $600 1.4% n.a. n.a.
Kirribilli North Sydney Unit 89 $690,000 16.9% 2.9% $570 4.3% n.a. n.a.
Kogarah Rockdale House 70 $681,500 12.0% 5.9% $460 3.5% n.a. n.a.
Kogarah Rockdale Unit 267 $422,000 17.1% 7.2% $380 4.7% ‐4.7% 35

State of the State NSW Property Report p.88
Sydney suburbs
Suburb LGAProperty
typeNumber
soldMedian
price12 month growth
Average annual growth (10 years)
Median weekly rent
Indicative gross rental yield
Vendor discount
Time on market
Kogarah Bay Rockdale House 33 $880,000 18.8% 6.7% $545 3.2% n.a. n.a.
Koolewong Gosford House 20 $469,000 20.3% 7.9% $323 3.6% n.a. n.a.
Kurnell Sutherland Shire House 37 $555,000 15.1% 6.0% n.a. n.a. ‐3.2% 59
Kurrajong Hawkesbury House 18 $470,750 19.2% 5.6% n.a. n.a. n.a. n.a.
Kurrajong Heights Hawkesbury House 12 $464,500 19.1% 6.8% n.a. n.a. n.a. n.a.
Kyeemagh Rockdale House 13 $780,000 8.3% 6.5% n.a. n.a. n.a. n.a.
Kyle Bay Kogarah House 24 $1,221,000 11.0% 6.7% n.a. n.a. n.a. n.a.
Lake Haven Wyong House 61 $320,000 12.9% 7.1% $290 4.7% ‐6.1% 50
Lake Munmorah Wyong House 90 $299,000 15.0% 9.5% $300 5.2% ‐5.7% 67
Lakemba Canterbury House 70 $480,000 17.1% 6.7% $350 3.8% n.a. n.a.
Lakemba Canterbury Unit 198 $228,250 9.2% 6.8% $300 6.8% ‐8.5% 49
Lalor Park Blacktown House 116 $335,000 6.3% 6.7% $340 5.3% ‐4.5% 58
Lane Cove Lane Cove House 91 $1,290,000 32.3% 8.9% $700 2.8% n.a. n.a.
Lane Cove Lane Cove Unit 147 $520,000 16.1% 5.5% $410 4.1% ‐3.5% 40
Lane Cove North Lane Cove House 77 $996,000 19.2% 7.2% n.a. n.a. n.a. n.a.
Lane Cove North Lane Cove Unit 161 $462,000 8.5% 5.5% $363 4.1% n.a. n.a.
Lane Cove West Lane Cove House 33 $950,000 4.6% 6.6% n.a. n.a. n.a. n.a.
Lansvale Fairfield House 49 $389,000 8.8% 7.0% $400 5.3% ‐7.3% 53
Lapstone Blue Mountains House 17 $536,000 32.3% 7.1% n.a. n.a. n.a. n.a.
Lavender Bay North Sydney Unit 23 $600,000 23.7% 1.9% $588 5.1% n.a. n.a.
Lawson Blue Mountains House 37 $305,000 10.3% 7.3% $280 4.8% ‐6.3% 70
Leichhardt Leichhardt House 257 $800,000 19.1% 7.8% $600 3.9% ‐6.8% 79
Leichhardt Leichhardt Unit 102 $545,000 12.0% 4.5% $460 4.4% n.a. n.a.
Leonay Penrith House 35 $515,000 8.4% 5.8% $445 4.5% ‐4.3% 43
Lethbridge Park Blacktown House 55 $225,000 4.7% 8.5% $283 6.5% ‐4.0% 56
Leumeah Campbelltown House 145 $326,000 7.8% 7.1% $335 5.3% ‐6.2% 53
Leumeah Campbelltown Unit 59 $210,000 ‐22.2% 7.1% $230 5.7% ‐4.7% 35
Leura Blue Mountains House 105 $430,000 13.2% 6.1% $360 4.4% ‐5.7% 83
Leura Blue Mountains Unit 21 $343,000 n.a. n.a. n.a. n.a. n.a. n.a.
Lewisham Marrickville House 46 $768,500 15.3% 7.5% $565 3.8% n.a. n.a.
Lewisham Marrickville Unit 10 $422,500 6.8% 8.3% $385 4.7% n.a. n.a.
Liberty Grove Canada Bay House 20 $639,000 4.8% 3.9% $600 4.9% n.a. n.a.
Liberty Grove Canada Bay Unit 52 $477,500 7.3% 4.8% $480 5.2% n.a. n.a.
Lidcombe Auburn House 153 $550,000 11.8% 7.5% $430 4.1% n.a. n.a.
Lidcombe Auburn Unit 203 $370,000 2.8% 5.8% $400 5.6% ‐3.3% 39
Lilli Pilli Sutherland Shire House 39 $1,230,000 ‐9.2% 4.5% $850 3.6% n.a. n.a.
Lilyfield Leichhardt House 98 $915,250 8.4% 8.5% $630 3.6% n.a. n.a.
Lilyfield Leichhardt Unit 32 $602,500 1.3% 5.5% $430 3.7% n.a. n.a.
Lindfield Ku‐ring‐gai House 118 $1,430,000 10.0% 7.1% $815 3.0% ‐5.2% 56
Lindfield Ku‐ring‐gai Unit 106 $663,750 ‐3.5% 7.7% $450 3.5% n.a. n.a.
Lisarow Gosford House 60 $412,750 8.3% 10.7% $360 4.5% ‐5.4% 63
Lisarow Gosford Unit 15 $269,250 ‐0.6% 5.4% $310 6.0% n.a. n.a.
Little Bay Randwick House 32 $940,000 1.0% 7.1% n.a. n.a. n.a. n.a.
Little Bay Randwick Unit 24 $949,500 31.9% n.a. $750 4.1% n.a. n.a.
Liverpool Liverpool House 140 $370,000 6.6% 6.1% $350 4.9% ‐7.2% 64
Liverpool Liverpool Unit 471 $248,500 10.4% 7.4% $300 6.3% ‐6.6% 53
Loftus Sutherland Shire House 47 $560,000 7.7% 5.2% $580 5.4% ‐3.8% 50
Long Jetty Wyong House 114 $355,500 6.4% 5.4% $300 4.4% ‐7.4% 63
Long Jetty Wyong Unit 77 $305,000 19.6% 7.0% $285 4.9% ‐5.9% 67
Longueville Lane Cove House 38 $2,200,000 12.4% 6.2% $1,000 2.4% n.a. n.a.
Lower Macdonald Hawkesbury House 11 $280,000 n.a. n.a. n.a. n.a. n.a. n.a.
Lugarno Hurstville House 73 $765,000 17.2% 5.4% $555 3.8% ‐4.8% 56
Lugarno Hurstville Unit 16 $685,000 n.a. 3.4% n.a. n.a. n.a. n.a.
Lurnea Liverpool House 99 $340,000 9.7% 6.3% $360 5.5% ‐6.9% 58
Lurnea Liverpool Unit 32 $274,500 1.5% 5.9% n.a. n.a. ‐4.9% 33
Macmasters Beach Gosford House 36 $600,000 0.0% 5.8% $435 3.8% n.a. n.a.
Macquarie Fields Campbelltown House 145 $286,000 1.4% 5.4% $330 6.0% ‐6.0% 47
Macquarie Fields Campbelltown Unit 82 $227,000 3.2% 7.1% $285 6.5% ‐5.9% 60
Macquarie Links Campbelltown House 20 $606,000 15.4% 12.3% $510 4.4% n.a. n.a.
Macquarie Park Ryde Unit 125 $440,000 16.4% 6.7% $390 4.6% ‐2.8% 26
Magenta Wyong House 10 $918,220 n.a. n.a. n.a. n.a. n.a. n.a.
Malabar Randwick House 45 $1,290,000 36.5% 9.1% $700 2.8% n.a. n.a.
Manly Manly House 107 $1,525,000 7.4% 8.0% $850 2.9% ‐14.3% 71
Manly Manly Unit 398 $692,500 22.8% 5.5% $550 4.1% ‐4.7% 70
Manly Vale Manly House 28 $912,500 16.9% 7.1% $620 3.5% n.a. n.a.
Manly Vale Manly Unit 142 $470,000 4.4% 5.7% $430 4.8% ‐3.6% 35
Mannering Park Wyong House 44 $270,000 12.5% 7.7% $300 5.8% ‐4.6% 87
Marayong Blacktown House 89 $345,000 8.5% 6.7% $350 5.3% ‐9.5% 55
Marayong Blacktown Unit 15 $328,500 11.2% 5.4% n.a. n.a. n.a. n.a.

State of the State NSW Property Report p.89
Sydney suburbs
Suburb LGAProperty
typeNumber
soldMedian
price12 month growth
Average annual growth (10 years)
Median weekly rent
Indicative gross rental yield
Vendor discount
Time on market
Mardi Wyong House 54 $352,500 4.0% 5.4% $360 5.3% ‐3.0% 63
Mardi Wyong Unit 20 $236,000 8.8% 1.3% $290 6.4% n.a. n.a.
Maroubra Randwick House 258 $1,122,500 28.3% 8.6% $670 3.1% ‐6.5% 46
Maroubra Randwick Unit 406 $563,500 12.7% 5.6% $470 4.3% ‐4.5% 45
Marrickville Marrickville House 255 $712,000 18.1% 8.3% $500 3.7% ‐8.6% 70
Marrickville Marrickville Unit 197 $385,000 7.5% 7.4% $370 5.0% ‐5.0% 50
Marsfield Ryde House 57 $850,000 11.0% 7.6% $550 3.4% n.a. n.a.
Marsfield Ryde Unit 190 $499,600 9.3% 6.2% $410 4.3% ‐3.2% 38
Mascot Botany Bay House 90 $714,000 14.2% 7.0% $500 3.6% n.a. n.a.
Mascot Botany Bay Unit 163 $495,000 3.1% 8.5% $450 4.7% ‐3.1% 54
Matraville Randwick House 72 $900,000 15.4% 6.9% $573 3.3% n.a. n.a.
Matraville Randwick Unit 40 $455,500 1.2% 4.0% $420 4.8% n.a. n.a.
Mays Hill Holroyd House 10 $454,000 n.a. 5.5% n.a. n.a. n.a. n.a.
Mcgraths Hill Hawkesbury House 43 $425,000 9.0% 8.3% $375 4.6% ‐5.5% 54
Mcmahons Point North Sydney House 23 $1,605,000 25.9% n.a. n.a. n.a. n.a. n.a.
Mcmahons Point North Sydney Unit 51 $575,000 6.5% 3.7% $535 4.8% n.a. n.a.
Meadowbank Ryde Unit 145 $425,724 1.8% 9.3% $390 4.8% ‐3.5% 51
Medlow Bath Blue Mountains House 13 $335,000 4.7% 8.9% n.a. n.a. n.a. n.a.
Melrose Park Ryde House 17 $730,000 11.5% 7.7% $488 3.5% n.a. n.a.
Menai Sutherland Shire House 114 $655,000 12.0% 5.1% $550 4.4% ‐3.2% 49
Menai Sutherland Shire Unit 63 $460,000 8.6% 5.1% $410 4.6% n.a. n.a.
Merrylands Holroyd House 246 $461,000 15.3% 5.7% $380 4.3% ‐5.9% 53
Merrylands Holroyd Unit 236 $288,500 8.9% 4.8% $330 5.9% ‐5.2% 57
Merrylands West Holroyd House 49 $413,000 2.7% 6.3% $400 5.0% ‐6.2% 30
Merrylands West Holroyd Unit 61 $270,000 12.5% 5.3% n.a. n.a. n.a. n.a.
Middle Cove Willoughby House 23 $1,142,000 ‐11.1% 7.1% $1,050 4.8% n.a. n.a.
Middleton Grange Liverpool House 42 $389,000 0.0% n.a. n.a. n.a. n.a. n.a.
Miller Liverpool House 45 $275,000 5.4% 6.7% $350 6.6% ‐6.5% 45
Millers Point Sydney Unit 69 $875,000 11.1% 0.7% n.a. n.a. n.a. n.a.
Milperra Bankstown House 45 $520,000 15.6% 6.2% $430 4.3% ‐3.3% 45
Milsons Point North Sydney Unit 72 $1,217,500 n.a. 5.9% $735 3.1% n.a. n.a.
Minchinbury Blacktown House 54 $415,000 14.6% 7.3% $380 4.8% ‐6.0% 44
Minto Campbelltown House 117 $295,000 5.4% 6.9% $350 6.2% ‐6.1% 66
Minto Campbelltown Unit 37 $210,000 1.9% 5.8% $250 6.2% ‐5.2% 65
Miranda Sutherland Shire House 146 $650,000 14.0% 5.2% $500 4.0% ‐5.7% 49
Miranda Sutherland Shire Unit 246 $424,750 13.6% 4.7% $388 4.7% ‐4.9% 50
Mona Vale Pittwater House 133 $950,000 13.1% 6.3% $700 3.8% ‐5.0% 46
Mona Vale Pittwater Unit 183 $590,000 9.3% 6.1% $460 4.1% ‐4.2% 55
Monterey Rockdale House 35 $847,000 1.7% 5.1% $630 3.9% n.a. n.a.
Monterey Rockdale Unit 50 $431,000 14.9% 5.0% $400 4.8% ‐4.1% 54
Moorebank Liverpool House 104 $455,000 11.0% 5.9% $420 4.8% ‐5.2% 56
Moorebank Liverpool Unit 18 $325,000 16.5% 5.1% $370 5.9% n.a. n.a.
Mortdale Hurstville House 101 $645,000 16.2% 6.0% $473 3.8% ‐5.2% 45
Mortdale Hurstville Unit 140 $387,500 11.7% 6.6% $350 4.7% ‐7.9% 35
Mortlake Canada Bay Unit 26 $717,500 30.5% 5.6% $520 3.8% n.a. n.a.
Mosman Mosman House 329 $2,100,000 6.7% 6.4% $1,250 3.1% ‐11.4% 77
Mosman Mosman Unit 394 $603,500 6.3% 4.8% $475 4.1% ‐5.0% 47
Mount Annan Camden House 201 $450,000 15.4% 9.9% $410 4.7% ‐4.3% 54
Mount Annan Camden Unit 10 $311,250 n.a. n.a. n.a. n.a. n.a. n.a.
Mount Colah Hornsby House 85 $593,500 9.1% 5.7% $495 4.3% ‐3.5% 51
Mount Druitt Blacktown House 118 $331,000 8.2% 8.2% $335 5.3% ‐5.7% 50
Mount Druitt Blacktown Unit 241 $225,000 2.2% 7.0% $290 6.7% ‐5.8% 59
Mount Kuring‐Gai Hornsby House 30 $588,250 8.9% 5.9% n.a. n.a. n.a. n.a.
Mount Lewis Bankstown House 11 $492,500 10.3% n.a. n.a. n.a. n.a. n.a.
Mount Pritchard Liverpool House 140 $366,000 12.6% 7.6% $350 5.0% ‐6.6% 72
Mount Riverview Blue Mountains House 47 $420,000 10.5% 6.0% $380 4.7% ‐3.6% 49
Mount Victoria Blue Mountains House 34 $267,250 ‐2.5% 8.0% $240 4.7% ‐6.3% 73
Mulgoa Penrith House 13 $400,000 ‐7.0% 8.3% n.a. n.a. n.a. n.a.
Narara Gosford House 118 $326,000 3.5% 6.4% $340 5.4% ‐3.1% 59
Narara Gosford Unit 20 $274,000 8.7% 4.7% n.a. n.a. n.a. n.a.
Narellan Camden House 43 $357,000 6.1% 5.7% $350 5.1% ‐4.5% 74
Narellan Vale Camden House 128 $392,500 7.5% 7.0% $398 5.3% ‐2.8% 43
Naremburn North Sydney House 71 $1,200,000 14.0% 8.2% $850 3.7% n.a. n.a.
Naremburn North Sydney Unit 96 $621,500 11.1% 4.6% $570 4.8% n.a. n.a.
Narrabeen Pittwater House 44 $1,306,750 31.7% 6.9% $655 2.6% ‐5.8% 82
Narrabeen Pittwater Unit 188 $557,500 11.5% 6.4% $450 4.2% ‐3.1% 50
Narraweena Warringah House 77 $775,000 6.5% 6.1% $610 4.1% ‐2.9% 42
Narwee Hurstville House 49 $575,000 2.9% 6.0% $450 4.1% n.a. n.a.
Narwee Hurstville Unit 33 $300,000 8.1% 5.1% $320 5.5% ‐6.0% 62

State of the State NSW Property Report p.90
Sydney suburbs
Suburb LGAProperty
typeNumber
soldMedian
price12 month growth
Average annual growth (10 years)
Median weekly rent
Indicative gross rental yield
Vendor discount
Time on market
Neutral Bay North Sydney House 72 $1,200,000 5.8% 4.5% $700 3.0% n.a. n.a.
Neutral Bay North Sydney Unit 377 $599,000 15.2% 4.7% $480 4.2% ‐3.2% 34
Newington Auburn House 83 $655,000 4.2% 5.1% $590 4.7% ‐2.4% 35
Newington Auburn Unit 125 $500,000 19.0% 4.4% $455 4.7% n.a. n.a.
Newport Pittwater House 141 $1,010,000 11.0% 6.0% $650 3.3% ‐5.7% 70
Newport Pittwater Unit 96 $562,500 29.3% 5.7% $425 3.9% ‐4.3% 49
Newtown Marrickville House 185 $750,000 17.0% 7.9% $550 3.8% n.a. n.a.
Newtown Marrickville Unit 167 $415,000 13.7% 4.8% $380 4.8% n.a. n.a.
Niagara Park Gosford House 45 $332,000 7.1% 6.3% $330 5.2% ‐4.7% 91
Niagara Park Gosford Unit 33 $349,000 ‐3.5% n.a. $373 5.6% n.a. n.a.
Norah Head Wyong House 23 $485,000 n.a. 7.3% $285 3.1% ‐6.4% 74
Noraville Wyong House 62 $305,500 5.3% 6.7% $280 4.8% ‐9.3% 69
Normanhurst Ku‐ring‐gai House 63 $690,000 11.7% 6.3% $510 3.8% n.a. n.a.
Normanhurst Ku‐ring‐gai Unit 33 $550,000 16.4% 5.7% n.a. n.a. n.a. n.a.
North Avoca Gosford House 64 $613,750 ‐0.8% 7.4% $500 4.2% ‐8.6% 74
North Balgowlah Manly House 62 $1,101,000 19.7% 8.7% $715 3.4% n.a. n.a.
North Bondi Waverley House 87 $1,665,000 28.1% 10.4% $850 2.7% n.a. n.a.
North Bondi Waverley Unit 94 $588,250 5.5% 5.3% $550 4.9% n.a. n.a.
North Curl Curl Warringah House 75 $1,200,000 1.7% 7.9% $975 4.2% n.a. n.a.
North Epping Hornsby House 57 $830,000 15.6% 6.9% $600 3.8% n.a. n.a.
North Gosford Gosford House 54 $333,000 12.9% 6.6% $325 5.1% ‐4.5% 64
North Gosford Gosford Unit 40 $265,500 ‐1.3% 4.6% $305 6.0% ‐4.1% 76
North Manly Warringah House 43 $1,030,000 17.2% 8.0% $700 3.5% ‐5.3% 64
North Narrabeen Pittwater House 100 $803,500 8.6% 6.6% $580 3.8% ‐5.7% 65
North Parramatta Parramatta House 43 $580,000 20.8% 7.0% $400 3.6% n.a. n.a.
North Parramatta Parramatta Unit 224 $360,000 11.8% 3.3% $350 5.1% ‐3.5% 55
North Richmond Hawkesbury House 54 $404,000 7.7% 6.5% $370 4.8% ‐5.6% 74
North Richmond Hawkesbury Unit 23 $310,000 11.7% 4.7% $310 5.2% n.a. n.a.
North Rocks Parramatta House 114 $634,000 9.2% 6.2% $500 4.1% ‐5.7% 43
North Rocks Parramatta Unit 29 $502,000 13.4% n.a. n.a. n.a. n.a. n.a.
North Ryde Ryde House 134 $783,000 13.0% 7.9% $505 3.4% ‐4.2% 50
North Ryde Ryde Unit 20 $608,500 ‐3.1% 5.9% n.a. n.a. n.a. n.a.
North St Marys Penrith House 55 $273,000 9.2% 8.5% $350 6.7% ‐5.2% 46
North Strathfield Canada Bay House 21 $770,000 10.0% 8.1% $535 3.6% n.a. n.a.
North Strathfield Canada Bay Unit 83 $500,000 19.6% 5.8% $455 4.7% n.a. n.a.
North Sydney North Sydney House 32 $995,000 ‐7.4% 4.6% $650 3.4% n.a. n.a.
North Sydney North Sydney Unit 193 $520,000 11.8% 3.7% $460 4.6% ‐3.3% 47
North Turramurra Ku‐ring‐gai House 52 $950,000 12.4% 5.6% $775 4.2% n.a. n.a.
North Turramurra Ku‐ring‐gai Unit 22 $655,000 ‐15.1% 1.3% n.a. n.a. n.a. n.a.
North Wahroonga Ku‐ring‐gai House 35 $960,000 13.4% 6.2% n.a. n.a. n.a. n.a.
North Willoughby Willoughby House 54 $1,322,500 26.0% 8.6% n.a. n.a. n.a. n.a.
North Willoughby Willoughby Unit 15 $540,000 17.6% 4.3% n.a. n.a. n.a. n.a.
Northbridge Willoughby House 84 $1,765,000 7.1% 7.9% $895 2.6% n.a. n.a.
Northbridge Willoughby Unit 37 $640,000 18.5% 3.5% $490 4.0% n.a. n.a.
Northmead Parramatta House 106 $525,000 6.8% 6.3% $420 4.2% ‐4.1% 42
Northmead Parramatta Unit 158 $383,750 6.6% 3.1% $380 5.1% ‐4.9% 62
Oakdale Camden House 13 $355,000 19.3% 9.0% $375 5.5% n.a. n.a.
Oakhurst Blacktown House 75 $350,000 7.7% 6.8% $360 5.3% ‐4.2% 45
Oatlands Parramatta House 63 $790,000 33.2% 6.8% $475 3.1% ‐13.5% 71
Oatlands Parramatta Unit 47 $485,000 15.5% 5.5% $400 4.3% ‐2.8% 40
Oatley Hurstville House 114 $902,500 9.7% 6.1% $548 3.2% n.a. n.a.
Oatley Hurstville Unit 73 $455,000 3.4% 4.3% $370 4.2% ‐3.3% 39
Old Guildford Holroyd House 36 $420,000 19.1% 6.4% n.a. n.a. n.a. n.a.
Old Toongabbie Parramatta House 35 $450,000 5.9% 6.1% n.a. n.a. n.a. n.a.
Old Toongabbie Parramatta Unit 14 $352,500 11.3% 4.8% n.a. n.a. n.a. n.a.
Ourimbah Wyong House 43 $375,000 5.6% 8.1% $305 4.2% ‐3.5% 69
Ourimbah Wyong Unit 17 $275,000 20.6% 6.5% $270 5.1% n.a. n.a.
Oxley Park Penrith House 41 $315,000 6.8% 7.6% $350 5.8% ‐5.7% 80
Oxley Park Penrith Unit 39 $265,000 ‐1.9% 6.4% $330 6.5% n.a. n.a.
Oyster Bay Sutherland Shire House 82 $661,250 11.1% 5.0% $560 4.4% ‐6.9% 44
Oyster Bay Sutherland Shire Unit 10 $557,500 n.a. 5.1% n.a. n.a. n.a. n.a.
Paddington Woollahra House 277 $1,400,000 15.7% 8.0% $850 3.2% ‐9.6% 48
Paddington Woollahra Unit 107 $490,000 15.8% 3.7% $400 4.2% n.a. n.a.
Padstow Bankstown House 152 $535,750 14.0% 6.5% $440 4.3% ‐3.8% 55
Padstow Bankstown Unit 95 $400,000 5.3% 4.9% $368 4.8% ‐2.8% 44
Padstow Heights Bankstown House 49 $565,000 10.5% 5.8% $460 4.2% n.a. n.a.
Padstow Heights Bankstown Unit 14 $470,500 6.9% 5.8% n.a. n.a. n.a. n.a.
Pagewood Randwick House 44 $952,500 10.8% 7.4% $600 3.3% n.a. n.a.
Palm Beach Pittwater House 50 $2,550,000 8.5% 8.9% $765 1.6% ‐7.3% 60

State of the State NSW Property Report p.91
Sydney suburbs
Suburb LGAProperty
typeNumber
soldMedian
price12 month growth
Average annual growth (10 years)
Median weekly rent
Indicative gross rental yield
Vendor discount
Time on market
Panania Bankstown House 178 $530,000 15.2% 6.3% $420 4.1% ‐6.1% 40
Panania Bankstown Unit 27 $371,500 12.4% 4.8% $375 5.2% n.a. n.a.
Parklea Blacktown House 21 $507,500 8.4% n.a. $505 5.2% n.a. n.a.
Parklea Blacktown Unit 50 $377,000 ‐0.8% n.a. $420 5.8% n.a. n.a.
Parramatta Parramatta House 93 $550,000 12.9% 5.9% $420 4.0% ‐7.7% 73
Parramatta Parramatta Unit 654 $345,000 3.1% 5.6% $360 5.4% ‐4.8% 45
Peakhurst Hurstville House 143 $599,000 15.2% 6.6% $480 4.2% ‐7.5% 47
Peakhurst Hurstville Unit 51 $550,000 11.4% 5.4% $455 4.3% n.a. n.a.
Peakhurst Heights Hurstville House 39 $712,000 10.4% 5.6% n.a. n.a. n.a. n.a.
Pearl Beach Gosford House 31 $760,000 ‐2.6% 6.4% n.a. n.a. n.a. n.a.
Pemulwuy Holroyd House 67 $499,500 4.1% n.a. $520 5.4% ‐7.1% 78
Pemulwuy Holroyd Unit 18 $352,500 12.8% n.a. $380 5.6% n.a. n.a.
Pendle Hill Holroyd House 58 $470,000 17.5% 7.0% $370 4.1% ‐9.0% 92
Pendle Hill Holroyd Unit 118 $346,500 28.3% 6.5% $340 5.1% ‐3.1% 47
Pennant Hills Hornsby House 111 $750,000 7.1% 6.8% $500 3.5% ‐4.0% 49
Pennant Hills Hornsby Unit 69 $422,500 19.4% 0.0% $390 4.8% n.a. n.a.
Penrith Penrith House 126 $329,000 7.9% 7.2% $320 5.1% ‐7.1% 57
Penrith Penrith Unit 186 $250,000 10.3% 5.7% $265 5.5% ‐3.7% 46
Penshurst Hurstville House 79 $715,000 18.2% 6.7% $480 3.5% n.a. n.a.
Penshurst Hurstville Unit 169 $368,000 15.0% 6.0% $340 4.8% ‐5.3% 33
Petersham Marrickville House 86 $787,500 15.8% 7.8% $520 3.4% n.a. n.a.
Petersham Marrickville Unit 70 $455,000 15.9% 7.7% $400 4.6% ‐4.1% 42
Phegans Bay Gosford House 10 $382,500 11.2% 5.5% $335 4.6% n.a. n.a.
Picnic Point Bankstown House 85 $575,000 8.9% 5.2% $470 4.3% ‐3.2% 38
Picnic Point Bankstown Unit 21 $485,000 15.8% n.a. n.a. n.a. n.a. n.a.
Picton Wollondilly House 57 $369,000 2.5% 7.1% $345 4.9% ‐5.3% 80
Picton Wollondilly Unit 14 $277,500 2.8% n.a. $245 4.6% n.a. n.a.
Pitt Town Hawkesbury House 21 $383,000 ‐9.9% 5.1% n.a. n.a. n.a. n.a.
Plumpton Blacktown House 100 $360,000 10.1% 7.5% $370 5.3% ‐4.8% 62
Plumpton Blacktown Unit 14 $270,000 ‐10.0% 8.7% $315 6.1% n.a. n.a.
Point Clare Gosford House 78 $385,000 6.9% 4.5% $330 4.5% ‐5.3% 57
Point Clare Gosford Unit 15 $297,500 8.2% 5.8% n.a. n.a. n.a. n.a.
Point Frederick Gosford House 15 $708,000 ‐29.2% 4.2% $473 3.5% n.a. n.a.
Point Frederick Gosford Unit 39 $305,000 19.1% 6.6% $288 4.9% ‐4.5% 60
Point Piper Woollahra Unit 24 $1,640,000 n.a. 5.0% $1,000 3.2% n.a. n.a.
Potts Point Sydney House 12 $784,000 n.a. n.a. $575 3.8% n.a. n.a.
Potts Point Sydney Unit 349 $356,416 ‐3.9% 1.8% $388 5.7% ‐7.8% 49
Prairiewood Fairfield House 25 $430,000 4.0% 6.5% $430 5.2% n.a. n.a.
Prestons Liverpool House 207 $445,000 6.1% 10.4% $445 5.2% ‐6.6% 50
Prestons Liverpool Unit 24 $361,500 6.5% n.a. $425 6.1% n.a. n.a.
Prospect Blacktown House 61 $420,000 14.3% 6.5% $380 4.7% ‐4.2% 37
Punchbowl Canterbury House 189 $460,000 15.6% 6.1% $420 4.7% ‐7.2% 60
Punchbowl Canterbury Unit 125 $245,000 14.0% 6.1% $320 6.8% ‐6.7% 47
Putney Ryde House 63 $1,226,000 31.6% 8.3% $605 2.6% n.a. n.a.
Pymble Ku‐ring‐gai House 173 $1,330,000 18.2% 7.3% $793 3.1% ‐7.2% 87
Pymble Ku‐ring‐gai Unit 68 $600,000 8.1% 6.6% $550 4.8% n.a. n.a.
Pyrmont Sydney House 12 $781,250 1.8% 7.5% $560 3.7% n.a. n.a.
Pyrmont Sydney Unit 375 $660,000 17.9% 6.0% $598 4.7% ‐4.3% 48
Quakers Hill Blacktown House 359 $418,000 7.0% 6.6% $400 5.0% ‐5.3% 46
Quakers Hill Blacktown Unit 115 $355,000 8.2% 6.5% $370 5.4% ‐4.3% 40
Queens Park Waverley House 52 $1,750,000 33.6% 9.2% $1,048 3.1% n.a. n.a.
Queens Park Waverley Unit 17 $705,000 14.6% 6.8% $550 4.1% n.a. n.a.
Queenscliff Warringah House 19 $1,585,000 n.a. 9.1% $680 2.2% n.a. n.a.
Queenscliff Warringah Unit 145 $587,500 19.9% 6.5% $520 4.6% ‐3.7% 43
Raby Campbelltown House 69 $332,500 5.6% 6.3% $350 5.5% ‐4.7% 56
Ramsgate Rockdale House 14 $767,500 23.2% n.a. n.a. n.a. n.a. n.a.
Ramsgate Rockdale Unit 14 $477,500 29.1% n.a. n.a. n.a. n.a. n.a.
Ramsgate Beach Rockdale Unit 33 $490,000 36.5% 5.7% $390 4.1% n.a. n.a.
Randwick Randwick House 165 $1,406,000 18.8% 8.6% $650 2.4% n.a. n.a.
Randwick Randwick Unit 450 $565,500 13.1% 6.4% $480 4.4% ‐6.6% 37
Redfern Sydney House 101 $850,000 21.1% 9.6% $600 3.7% n.a. n.a.
Redfern Sydney Unit 200 $495,000 12.5% 4.6% $480 5.0% ‐4.5% 47
Regents Park Auburn House 44 $450,000 8.4% 5.9% $385 4.4% ‐3.4% 39
Regents Park Auburn Unit 36 $290,000 3.6% 8.9% $300 5.4% ‐5.1% 46
Revesby Bankstown House 205 $520,000 11.8% 6.1% $410 4.1% ‐4.8% 46
Revesby Bankstown Unit 54 $412,500 17.9% 4.7% $370 4.7% ‐3.7% 31
Revesby Heights Bankstown House 24 $536,000 17.5% 5.5% $425 4.1% n.a. n.a.
Rhodes Canada Bay Unit 447 $594,000 6.4% n.a. $550 4.8% n.a. n.a.
Richmond Hawkesbury House 65 $373,000 9.7% 7.4% $330 4.6% ‐5.4% 73
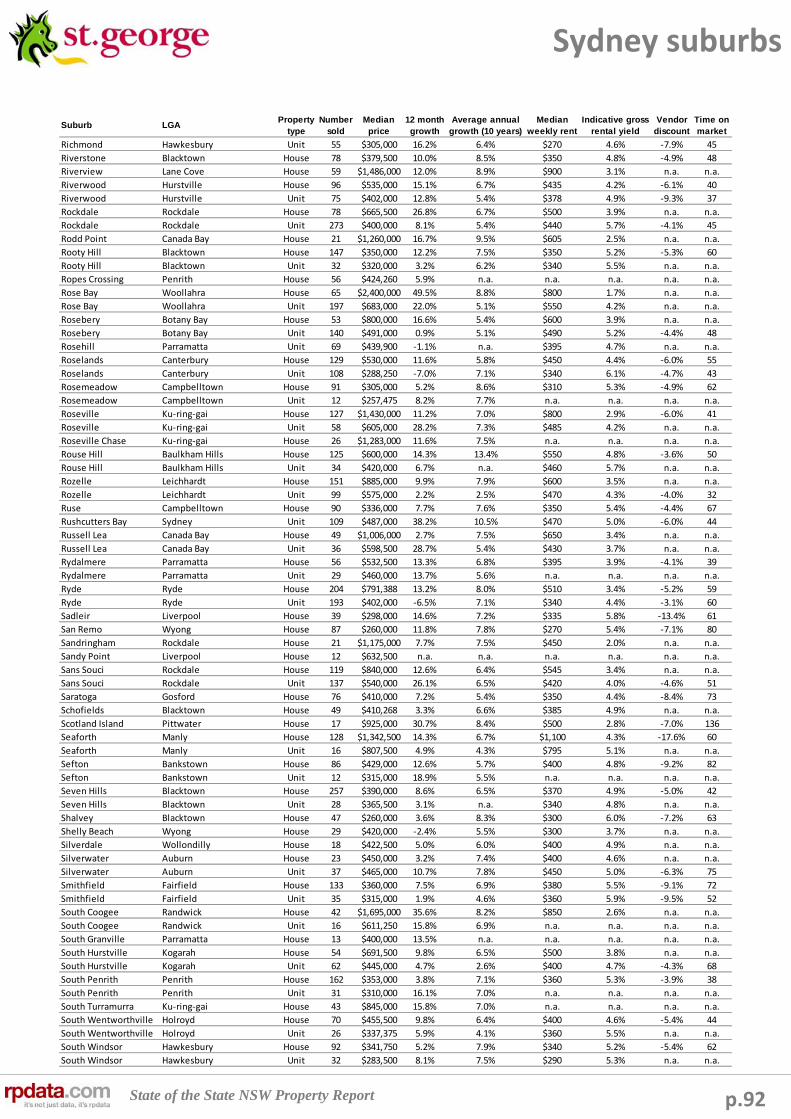
State of the State NSW Property Report p.92
Sydney suburbs
Suburb LGAProperty
typeNumber
soldMedian
price12 month growth
Average annual growth (10 years)
Median weekly rent
Indicative gross rental yield
Vendor discount
Time on market
Richmond Hawkesbury Unit 55 $305,000 16.2% 6.4% $270 4.6% ‐7.9% 45
Riverstone Blacktown House 78 $379,500 10.0% 8.5% $350 4.8% ‐4.9% 48
Riverview Lane Cove House 59 $1,486,000 12.0% 8.9% $900 3.1% n.a. n.a.
Riverwood Hurstville House 96 $535,000 15.1% 6.7% $435 4.2% ‐6.1% 40
Riverwood Hurstville Unit 75 $402,000 12.8% 5.4% $378 4.9% ‐9.3% 37
Rockdale Rockdale House 78 $665,500 26.8% 6.7% $500 3.9% n.a. n.a.
Rockdale Rockdale Unit 273 $400,000 8.1% 5.4% $440 5.7% ‐4.1% 45
Rodd Point Canada Bay House 21 $1,260,000 16.7% 9.5% $605 2.5% n.a. n.a.
Rooty Hill Blacktown House 147 $350,000 12.2% 7.5% $350 5.2% ‐5.3% 60
Rooty Hill Blacktown Unit 32 $320,000 3.2% 6.2% $340 5.5% n.a. n.a.
Ropes Crossing Penrith House 56 $424,260 5.9% n.a. n.a. n.a. n.a. n.a.
Rose Bay Woollahra House 65 $2,400,000 49.5% 8.8% $800 1.7% n.a. n.a.
Rose Bay Woollahra Unit 197 $683,000 22.0% 5.1% $550 4.2% n.a. n.a.
Rosebery Botany Bay House 53 $800,000 16.6% 5.4% $600 3.9% n.a. n.a.
Rosebery Botany Bay Unit 140 $491,000 0.9% 5.1% $490 5.2% ‐4.4% 48
Rosehill Parramatta Unit 69 $439,900 ‐1.1% n.a. $395 4.7% n.a. n.a.
Roselands Canterbury House 129 $530,000 11.6% 5.8% $450 4.4% ‐6.0% 55
Roselands Canterbury Unit 108 $288,250 ‐7.0% 7.1% $340 6.1% ‐4.7% 43
Rosemeadow Campbelltown House 91 $305,000 5.2% 8.6% $310 5.3% ‐4.9% 62
Rosemeadow Campbelltown Unit 12 $257,475 8.2% 7.7% n.a. n.a. n.a. n.a.
Roseville Ku‐ring‐gai House 127 $1,430,000 11.2% 7.0% $800 2.9% ‐6.0% 41
Roseville Ku‐ring‐gai Unit 58 $605,000 28.2% 7.3% $485 4.2% n.a. n.a.
Roseville Chase Ku‐ring‐gai House 26 $1,283,000 11.6% 7.5% n.a. n.a. n.a. n.a.
Rouse Hill Baulkham Hills House 125 $600,000 14.3% 13.4% $550 4.8% ‐3.6% 50
Rouse Hill Baulkham Hills Unit 34 $420,000 6.7% n.a. $460 5.7% n.a. n.a.
Rozelle Leichhardt House 151 $885,000 9.9% 7.9% $600 3.5% n.a. n.a.
Rozelle Leichhardt Unit 99 $575,000 2.2% 2.5% $470 4.3% ‐4.0% 32
Ruse Campbelltown House 90 $336,000 7.7% 7.6% $350 5.4% ‐4.4% 67
Rushcutters Bay Sydney Unit 109 $487,000 38.2% 10.5% $470 5.0% ‐6.0% 44
Russell Lea Canada Bay House 49 $1,006,000 2.7% 7.5% $650 3.4% n.a. n.a.
Russell Lea Canada Bay Unit 36 $598,500 28.7% 5.4% $430 3.7% n.a. n.a.
Rydalmere Parramatta House 56 $532,500 13.3% 6.8% $395 3.9% ‐4.1% 39
Rydalmere Parramatta Unit 29 $460,000 13.7% 5.6% n.a. n.a. n.a. n.a.
Ryde Ryde House 204 $791,388 13.2% 8.0% $510 3.4% ‐5.2% 59
Ryde Ryde Unit 193 $402,000 ‐6.5% 7.1% $340 4.4% ‐3.1% 60
Sadleir Liverpool House 39 $298,000 14.6% 7.2% $335 5.8% ‐13.4% 61
San Remo Wyong House 87 $260,000 11.8% 7.8% $270 5.4% ‐7.1% 80
Sandringham Rockdale House 21 $1,175,000 7.7% 7.5% $450 2.0% n.a. n.a.
Sandy Point Liverpool House 12 $632,500 n.a. n.a. n.a. n.a. n.a. n.a.
Sans Souci Rockdale House 119 $840,000 12.6% 6.4% $545 3.4% n.a. n.a.
Sans Souci Rockdale Unit 137 $540,000 26.1% 6.5% $420 4.0% ‐4.6% 51
Saratoga Gosford House 76 $410,000 7.2% 5.4% $350 4.4% ‐8.4% 73
Schofields Blacktown House 49 $410,268 3.3% 6.6% $385 4.9% n.a. n.a.
Scotland Island Pittwater House 17 $925,000 30.7% 8.4% $500 2.8% ‐7.0% 136
Seaforth Manly House 128 $1,342,500 14.3% 6.7% $1,100 4.3% ‐17.6% 60
Seaforth Manly Unit 16 $807,500 4.9% 4.3% $795 5.1% n.a. n.a.
Sefton Bankstown House 86 $429,000 12.6% 5.7% $400 4.8% ‐9.2% 82
Sefton Bankstown Unit 12 $315,000 18.9% 5.5% n.a. n.a. n.a. n.a.
Seven Hills Blacktown House 257 $390,000 8.6% 6.5% $370 4.9% ‐5.0% 42
Seven Hills Blacktown Unit 28 $365,500 3.1% n.a. $340 4.8% n.a. n.a.
Shalvey Blacktown House 47 $260,000 3.6% 8.3% $300 6.0% ‐7.2% 63
Shelly Beach Wyong House 29 $420,000 ‐2.4% 5.5% $300 3.7% n.a. n.a.
Silverdale Wollondilly House 18 $422,500 5.0% 6.0% $400 4.9% n.a. n.a.
Silverwater Auburn House 23 $450,000 3.2% 7.4% $400 4.6% n.a. n.a.
Silverwater Auburn Unit 37 $465,000 10.7% 7.8% $450 5.0% ‐6.3% 75
Smithfield Fairfield House 133 $360,000 7.5% 6.9% $380 5.5% ‐9.1% 72
Smithfield Fairfield Unit 35 $315,000 1.9% 4.6% $360 5.9% ‐9.5% 52
South Coogee Randwick House 42 $1,695,000 35.6% 8.2% $850 2.6% n.a. n.a.
South Coogee Randwick Unit 16 $611,250 15.8% 6.9% n.a. n.a. n.a. n.a.
South Granville Parramatta House 13 $400,000 13.5% n.a. n.a. n.a. n.a. n.a.
South Hurstville Kogarah House 54 $691,500 9.8% 6.5% $500 3.8% n.a. n.a.
South Hurstville Kogarah Unit 62 $445,000 4.7% 2.6% $400 4.7% ‐4.3% 68
South Penrith Penrith House 162 $353,000 3.8% 7.1% $360 5.3% ‐3.9% 38
South Penrith Penrith Unit 31 $310,000 16.1% 7.0% n.a. n.a. n.a. n.a.
South Turramurra Ku‐ring‐gai House 43 $845,000 15.8% 7.0% n.a. n.a. n.a. n.a.
South Wentworthville Holroyd House 70 $455,500 9.8% 6.4% $400 4.6% ‐5.4% 44
South Wentworthville Holroyd Unit 26 $337,375 5.9% 4.1% $360 5.5% n.a. n.a.
South Windsor Hawkesbury House 92 $341,750 5.2% 7.9% $340 5.2% ‐5.4% 62
South Windsor Hawkesbury Unit 32 $283,500 8.1% 7.5% $290 5.3% n.a. n.a.
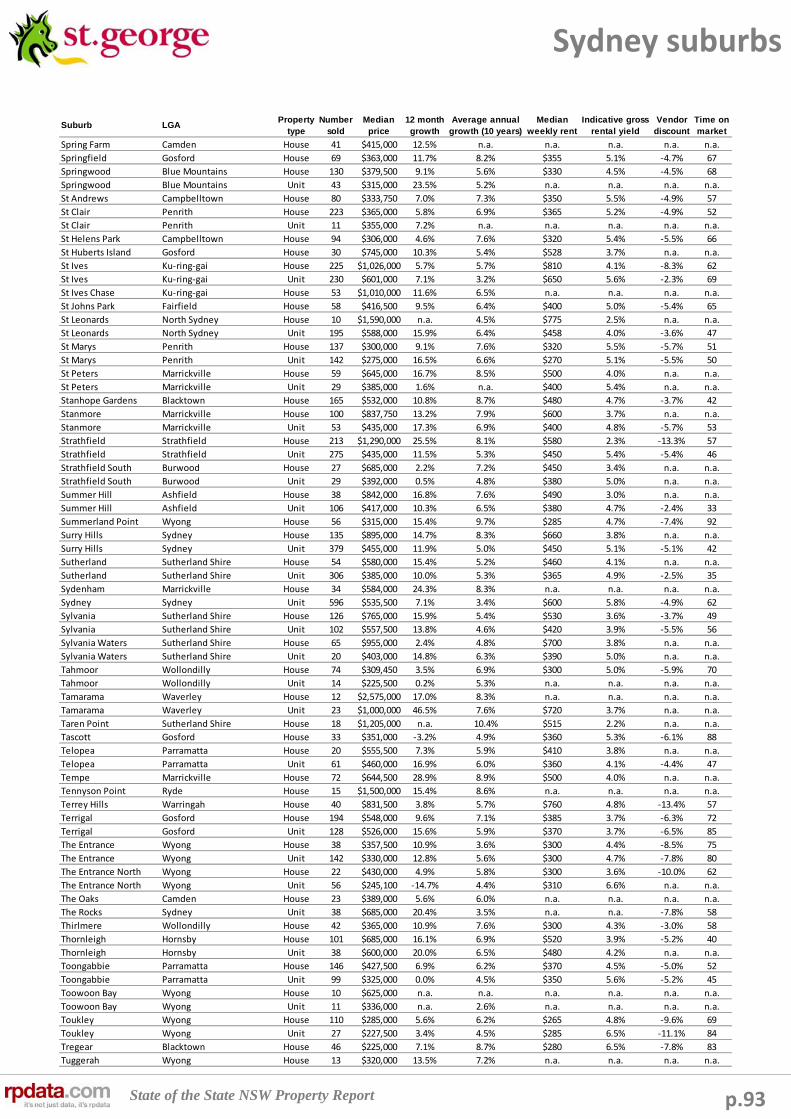
State of the State NSW Property Report p.93
Sydney suburbs
Suburb LGAProperty
typeNumber
soldMedian
price12 month growth
Average annual growth (10 years)
Median weekly rent
Indicative gross rental yield
Vendor discount
Time on market
Spring Farm Camden House 41 $415,000 12.5% n.a. n.a. n.a. n.a. n.a.
Springfield Gosford House 69 $363,000 11.7% 8.2% $355 5.1% ‐4.7% 67
Springwood Blue Mountains House 130 $379,500 9.1% 5.6% $330 4.5% ‐4.5% 68
Springwood Blue Mountains Unit 43 $315,000 23.5% 5.2% n.a. n.a. n.a. n.a.
St Andrews Campbelltown House 80 $333,750 7.0% 7.3% $350 5.5% ‐4.9% 57
St Clair Penrith House 223 $365,000 5.8% 6.9% $365 5.2% ‐4.9% 52
St Clair Penrith Unit 11 $355,000 7.2% n.a. n.a. n.a. n.a. n.a.
St Helens Park Campbelltown House 94 $306,000 4.6% 7.6% $320 5.4% ‐5.5% 66
St Huberts Island Gosford House 30 $745,000 10.3% 5.4% $528 3.7% n.a. n.a.
St Ives Ku‐ring‐gai House 225 $1,026,000 5.7% 5.7% $810 4.1% ‐8.3% 62
St Ives Ku‐ring‐gai Unit 230 $601,000 7.1% 3.2% $650 5.6% ‐2.3% 69
St Ives Chase Ku‐ring‐gai House 53 $1,010,000 11.6% 6.5% n.a. n.a. n.a. n.a.
St Johns Park Fairfield House 58 $416,500 9.5% 6.4% $400 5.0% ‐5.4% 65
St Leonards North Sydney House 10 $1,590,000 n.a. 4.5% $775 2.5% n.a. n.a.
St Leonards North Sydney Unit 195 $588,000 15.9% 6.4% $458 4.0% ‐3.6% 47
St Marys Penrith House 137 $300,000 9.1% 7.6% $320 5.5% ‐5.7% 51
St Marys Penrith Unit 142 $275,000 16.5% 6.6% $270 5.1% ‐5.5% 50
St Peters Marrickville House 59 $645,000 16.7% 8.5% $500 4.0% n.a. n.a.
St Peters Marrickville Unit 29 $385,000 1.6% n.a. $400 5.4% n.a. n.a.
Stanhope Gardens Blacktown House 165 $532,000 10.8% 8.7% $480 4.7% ‐3.7% 42
Stanmore Marrickville House 100 $837,750 13.2% 7.9% $600 3.7% n.a. n.a.
Stanmore Marrickville Unit 53 $435,000 17.3% 6.9% $400 4.8% ‐5.7% 53
Strathfield Strathfield House 213 $1,290,000 25.5% 8.1% $580 2.3% ‐13.3% 57
Strathfield Strathfield Unit 275 $435,000 11.5% 5.3% $450 5.4% ‐5.4% 46
Strathfield South Burwood House 27 $685,000 2.2% 7.2% $450 3.4% n.a. n.a.
Strathfield South Burwood Unit 29 $392,000 0.5% 4.8% $380 5.0% n.a. n.a.
Summer Hill Ashfield House 38 $842,000 16.8% 7.6% $490 3.0% n.a. n.a.
Summer Hill Ashfield Unit 106 $417,000 10.3% 6.5% $380 4.7% ‐2.4% 33
Summerland Point Wyong House 56 $315,000 15.4% 9.7% $285 4.7% ‐7.4% 92
Surry Hills Sydney House 135 $895,000 14.7% 8.3% $660 3.8% n.a. n.a.
Surry Hills Sydney Unit 379 $455,000 11.9% 5.0% $450 5.1% ‐5.1% 42
Sutherland Sutherland Shire House 54 $580,000 15.4% 5.2% $460 4.1% n.a. n.a.
Sutherland Sutherland Shire Unit 306 $385,000 10.0% 5.3% $365 4.9% ‐2.5% 35
Sydenham Marrickville House 34 $584,000 24.3% 8.3% n.a. n.a. n.a. n.a.
Sydney Sydney Unit 596 $535,500 7.1% 3.4% $600 5.8% ‐4.9% 62
Sylvania Sutherland Shire House 126 $765,000 15.9% 5.4% $530 3.6% ‐3.7% 49
Sylvania Sutherland Shire Unit 102 $557,500 13.8% 4.6% $420 3.9% ‐5.5% 56
Sylvania Waters Sutherland Shire House 65 $955,000 2.4% 4.8% $700 3.8% n.a. n.a.
Sylvania Waters Sutherland Shire Unit 20 $403,000 14.8% 6.3% $390 5.0% n.a. n.a.
Tahmoor Wollondilly House 74 $309,450 3.5% 6.9% $300 5.0% ‐5.9% 70
Tahmoor Wollondilly Unit 14 $225,500 0.2% 5.3% n.a. n.a. n.a. n.a.
Tamarama Waverley House 12 $2,575,000 17.0% 8.3% n.a. n.a. n.a. n.a.
Tamarama Waverley Unit 23 $1,000,000 46.5% 7.6% $720 3.7% n.a. n.a.
Taren Point Sutherland Shire House 18 $1,205,000 n.a. 10.4% $515 2.2% n.a. n.a.
Tascott Gosford House 33 $351,000 ‐3.2% 4.9% $360 5.3% ‐6.1% 88
Telopea Parramatta House 20 $555,500 7.3% 5.9% $410 3.8% n.a. n.a.
Telopea Parramatta Unit 61 $460,000 16.9% 6.0% $360 4.1% ‐4.4% 47
Tempe Marrickville House 72 $644,500 28.9% 8.9% $500 4.0% n.a. n.a.
Tennyson Point Ryde House 15 $1,500,000 15.4% 8.6% n.a. n.a. n.a. n.a.
Terrey Hills Warringah House 40 $831,500 3.8% 5.7% $760 4.8% ‐13.4% 57
Terrigal Gosford House 194 $548,000 9.6% 7.1% $385 3.7% ‐6.3% 72
Terrigal Gosford Unit 128 $526,000 15.6% 5.9% $370 3.7% ‐6.5% 85
The Entrance Wyong House 38 $357,500 10.9% 3.6% $300 4.4% ‐8.5% 75
The Entrance Wyong Unit 142 $330,000 12.8% 5.6% $300 4.7% ‐7.8% 80
The Entrance North Wyong House 22 $430,000 4.9% 5.8% $300 3.6% ‐10.0% 62
The Entrance North Wyong Unit 56 $245,100 ‐14.7% 4.4% $310 6.6% n.a. n.a.
The Oaks Camden House 23 $389,000 5.6% 6.0% n.a. n.a. n.a. n.a.
The Rocks Sydney Unit 38 $685,000 20.4% 3.5% n.a. n.a. ‐7.8% 58
Thirlmere Wollondilly House 42 $365,000 10.9% 7.6% $300 4.3% ‐3.0% 58
Thornleigh Hornsby House 101 $685,000 16.1% 6.9% $520 3.9% ‐5.2% 40
Thornleigh Hornsby Unit 38 $600,000 20.0% 6.5% $480 4.2% n.a. n.a.
Toongabbie Parramatta House 146 $427,500 6.9% 6.2% $370 4.5% ‐5.0% 52
Toongabbie Parramatta Unit 99 $325,000 0.0% 4.5% $350 5.6% ‐5.2% 45
Toowoon Bay Wyong House 10 $625,000 n.a. n.a. n.a. n.a. n.a. n.a.
Toowoon Bay Wyong Unit 11 $336,000 n.a. 2.6% n.a. n.a. n.a. n.a.
Toukley Wyong House 110 $285,000 5.6% 6.2% $265 4.8% ‐9.6% 69
Toukley Wyong Unit 27 $227,500 3.4% 4.5% $285 6.5% ‐11.1% 84
Tregear Blacktown House 46 $225,000 7.1% 8.7% $280 6.5% ‐7.8% 83
Tuggerah Wyong House 13 $320,000 13.5% 7.2% n.a. n.a. n.a. n.a.
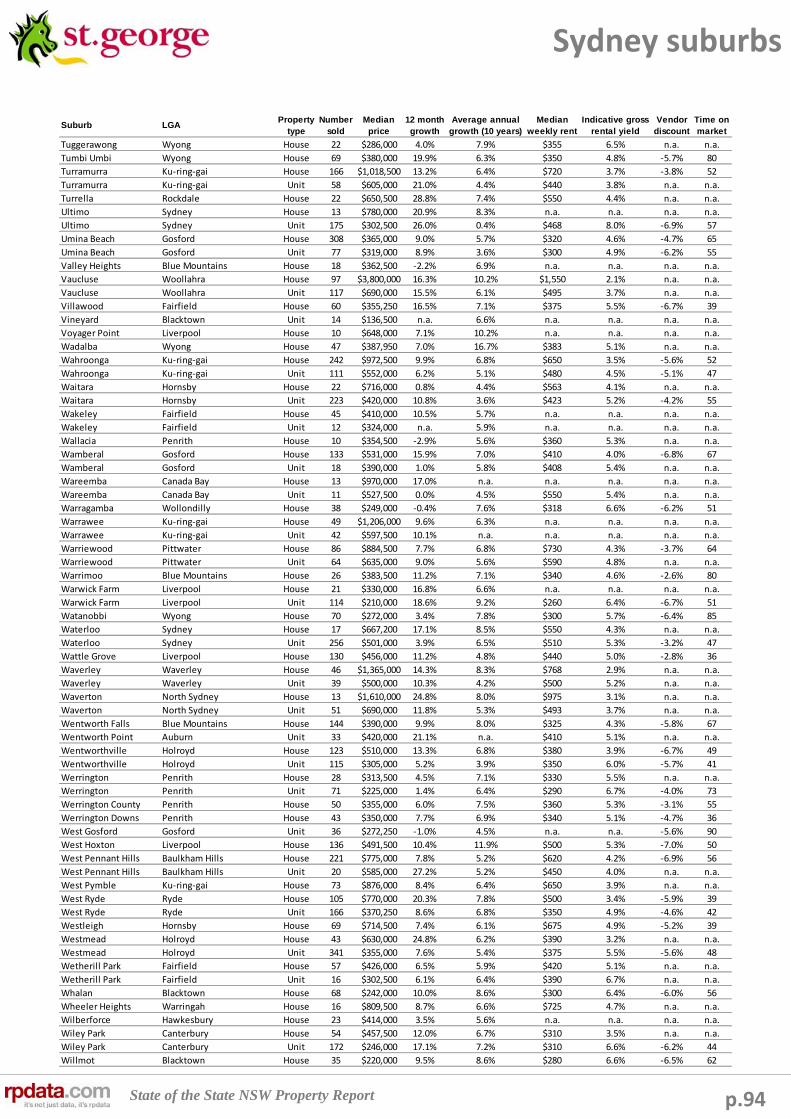
State of the State NSW Property Report p.94
Sydney suburbs
Suburb LGAProperty
typeNumber
soldMedian
price12 month growth
Average annual growth (10 years)
Median weekly rent
Indicative gross rental yield
Vendor discount
Time on market
Tuggerawong Wyong House 22 $286,000 4.0% 7.9% $355 6.5% n.a. n.a.
Tumbi Umbi Wyong House 69 $380,000 19.9% 6.3% $350 4.8% ‐5.7% 80
Turramurra Ku‐ring‐gai House 166 $1,018,500 13.2% 6.4% $720 3.7% ‐3.8% 52
Turramurra Ku‐ring‐gai Unit 58 $605,000 21.0% 4.4% $440 3.8% n.a. n.a.
Turrella Rockdale House 22 $650,500 28.8% 7.4% $550 4.4% n.a. n.a.
Ultimo Sydney House 13 $780,000 20.9% 8.3% n.a. n.a. n.a. n.a.
Ultimo Sydney Unit 175 $302,500 26.0% 0.4% $468 8.0% ‐6.9% 57
Umina Beach Gosford House 308 $365,000 9.0% 5.7% $320 4.6% ‐4.7% 65
Umina Beach Gosford Unit 77 $319,000 8.9% 3.6% $300 4.9% ‐6.2% 55
Valley Heights Blue Mountains House 18 $362,500 ‐2.2% 6.9% n.a. n.a. n.a. n.a.
Vaucluse Woollahra House 97 $3,800,000 16.3% 10.2% $1,550 2.1% n.a. n.a.
Vaucluse Woollahra Unit 117 $690,000 15.5% 6.1% $495 3.7% n.a. n.a.
Villawood Fairfield House 60 $355,250 16.5% 7.1% $375 5.5% ‐6.7% 39
Vineyard Blacktown Unit 14 $136,500 n.a. 6.6% n.a. n.a. n.a. n.a.
Voyager Point Liverpool House 10 $648,000 7.1% 10.2% n.a. n.a. n.a. n.a.
Wadalba Wyong House 47 $387,950 7.0% 16.7% $383 5.1% n.a. n.a.
Wahroonga Ku‐ring‐gai House 242 $972,500 9.9% 6.8% $650 3.5% ‐5.6% 52
Wahroonga Ku‐ring‐gai Unit 111 $552,000 6.2% 5.1% $480 4.5% ‐5.1% 47
Waitara Hornsby House 22 $716,000 0.8% 4.4% $563 4.1% n.a. n.a.
Waitara Hornsby Unit 223 $420,000 10.8% 3.6% $423 5.2% ‐4.2% 55
Wakeley Fairfield House 45 $410,000 10.5% 5.7% n.a. n.a. n.a. n.a.
Wakeley Fairfield Unit 12 $324,000 n.a. 5.9% n.a. n.a. n.a. n.a.
Wallacia Penrith House 10 $354,500 ‐2.9% 5.6% $360 5.3% n.a. n.a.
Wamberal Gosford House 133 $531,000 15.9% 7.0% $410 4.0% ‐6.8% 67
Wamberal Gosford Unit 18 $390,000 1.0% 5.8% $408 5.4% n.a. n.a.
Wareemba Canada Bay House 13 $970,000 17.0% n.a. n.a. n.a. n.a. n.a.
Wareemba Canada Bay Unit 11 $527,500 0.0% 4.5% $550 5.4% n.a. n.a.
Warragamba Wollondilly House 38 $249,000 ‐0.4% 7.6% $318 6.6% ‐6.2% 51
Warrawee Ku‐ring‐gai House 49 $1,206,000 9.6% 6.3% n.a. n.a. n.a. n.a.
Warrawee Ku‐ring‐gai Unit 42 $597,500 10.1% n.a. n.a. n.a. n.a. n.a.
Warriewood Pittwater House 86 $884,500 7.7% 6.8% $730 4.3% ‐3.7% 64
Warriewood Pittwater Unit 64 $635,000 9.0% 5.6% $590 4.8% n.a. n.a.
Warrimoo Blue Mountains House 26 $383,500 11.2% 7.1% $340 4.6% ‐2.6% 80
Warwick Farm Liverpool House 21 $330,000 16.8% 6.6% n.a. n.a. n.a. n.a.
Warwick Farm Liverpool Unit 114 $210,000 18.6% 9.2% $260 6.4% ‐6.7% 51
Watanobbi Wyong House 70 $272,000 3.4% 7.8% $300 5.7% ‐6.4% 85
Waterloo Sydney House 17 $667,200 17.1% 8.5% $550 4.3% n.a. n.a.
Waterloo Sydney Unit 256 $501,000 3.9% 6.5% $510 5.3% ‐3.2% 47
Wattle Grove Liverpool House 130 $456,000 11.2% 4.8% $440 5.0% ‐2.8% 36
Waverley Waverley House 46 $1,365,000 14.3% 8.3% $768 2.9% n.a. n.a.
Waverley Waverley Unit 39 $500,000 10.3% 4.2% $500 5.2% n.a. n.a.
Waverton North Sydney House 13 $1,610,000 24.8% 8.0% $975 3.1% n.a. n.a.
Waverton North Sydney Unit 51 $690,000 11.8% 5.3% $493 3.7% n.a. n.a.
Wentworth Falls Blue Mountains House 144 $390,000 9.9% 8.0% $325 4.3% ‐5.8% 67
Wentworth Point Auburn Unit 33 $420,000 21.1% n.a. $410 5.1% n.a. n.a.
Wentworthville Holroyd House 123 $510,000 13.3% 6.8% $380 3.9% ‐6.7% 49
Wentworthville Holroyd Unit 115 $305,000 5.2% 3.9% $350 6.0% ‐5.7% 41
Werrington Penrith House 28 $313,500 4.5% 7.1% $330 5.5% n.a. n.a.
Werrington Penrith Unit 71 $225,000 1.4% 6.4% $290 6.7% ‐4.0% 73
Werrington County Penrith House 50 $355,000 6.0% 7.5% $360 5.3% ‐3.1% 55
Werrington Downs Penrith House 43 $350,000 7.7% 6.9% $340 5.1% ‐4.7% 36
West Gosford Gosford Unit 36 $272,250 ‐1.0% 4.5% n.a. n.a. ‐5.6% 90
West Hoxton Liverpool House 136 $491,500 10.4% 11.9% $500 5.3% ‐7.0% 50
West Pennant Hills Baulkham Hills House 221 $775,000 7.8% 5.2% $620 4.2% ‐6.9% 56
West Pennant Hills Baulkham Hills Unit 20 $585,000 27.2% 5.2% $450 4.0% n.a. n.a.
West Pymble Ku‐ring‐gai House 73 $876,000 8.4% 6.4% $650 3.9% n.a. n.a.
West Ryde Ryde House 105 $770,000 20.3% 7.8% $500 3.4% ‐5.9% 39
West Ryde Ryde Unit 166 $370,250 8.6% 6.8% $350 4.9% ‐4.6% 42
Westleigh Hornsby House 69 $714,500 7.4% 6.1% $675 4.9% ‐5.2% 39
Westmead Holroyd House 43 $630,000 24.8% 6.2% $390 3.2% n.a. n.a.
Westmead Holroyd Unit 341 $355,000 7.6% 5.4% $375 5.5% ‐5.6% 48
Wetherill Park Fairfield House 57 $426,000 6.5% 5.9% $420 5.1% n.a. n.a.
Wetherill Park Fairfield Unit 16 $302,500 6.1% 6.4% $390 6.7% n.a. n.a.
Whalan Blacktown House 68 $242,000 10.0% 8.6% $300 6.4% ‐6.0% 56
Wheeler Heights Warringah House 16 $809,500 8.7% 6.6% $725 4.7% n.a. n.a.
Wilberforce Hawkesbury House 23 $414,000 3.5% 5.6% n.a. n.a. n.a. n.a.
Wiley Park Canterbury House 54 $457,500 12.0% 6.7% $310 3.5% n.a. n.a.
Wiley Park Canterbury Unit 172 $246,000 17.1% 7.2% $310 6.6% ‐6.2% 44
Willmot Blacktown House 35 $220,000 9.5% 8.6% $280 6.6% ‐6.5% 62
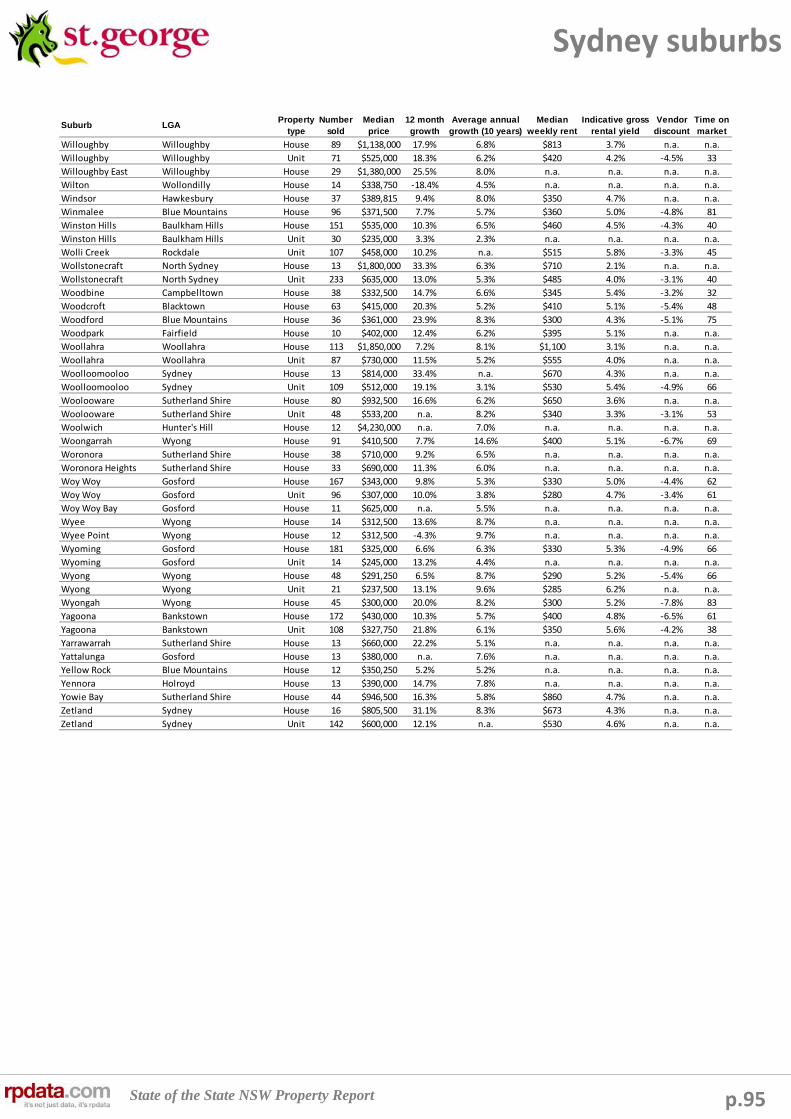
State of the State NSW Property Report p.95
Sydney suburbs
Suburb LGAProperty
typeNumber
soldMedian
price12 month growth
Average annual growth (10 years)
Median weekly rent
Indicative gross rental yield
Vendor discount
Time on market
Willoughby Willoughby House 89 $1,138,000 17.9% 6.8% $813 3.7% n.a. n.a.
Willoughby Willoughby Unit 71 $525,000 18.3% 6.2% $420 4.2% ‐4.5% 33
Willoughby East Willoughby House 29 $1,380,000 25.5% 8.0% n.a. n.a. n.a. n.a.
Wilton Wollondilly House 14 $338,750 ‐18.4% 4.5% n.a. n.a. n.a. n.a.
Windsor Hawkesbury House 37 $389,815 9.4% 8.0% $350 4.7% n.a. n.a.
Winmalee Blue Mountains House 96 $371,500 7.7% 5.7% $360 5.0% ‐4.8% 81
Winston Hills Baulkham Hills House 151 $535,000 10.3% 6.5% $460 4.5% ‐4.3% 40
Winston Hills Baulkham Hills Unit 30 $235,000 3.3% 2.3% n.a. n.a. n.a. n.a.
Wolli Creek Rockdale Unit 107 $458,000 10.2% n.a. $515 5.8% ‐3.3% 45
Wollstonecraft North Sydney House 13 $1,800,000 33.3% 6.3% $710 2.1% n.a. n.a.
Wollstonecraft North Sydney Unit 233 $635,000 13.0% 5.3% $485 4.0% ‐3.1% 40
Woodbine Campbelltown House 38 $332,500 14.7% 6.6% $345 5.4% ‐3.2% 32
Woodcroft Blacktown House 63 $415,000 20.3% 5.2% $410 5.1% ‐5.4% 48
Woodford Blue Mountains House 36 $361,000 23.9% 8.3% $300 4.3% ‐5.1% 75
Woodpark Fairfield House 10 $402,000 12.4% 6.2% $395 5.1% n.a. n.a.
Woollahra Woollahra House 113 $1,850,000 7.2% 8.1% $1,100 3.1% n.a. n.a.
Woollahra Woollahra Unit 87 $730,000 11.5% 5.2% $555 4.0% n.a. n.a.
Woolloomooloo Sydney House 13 $814,000 33.4% n.a. $670 4.3% n.a. n.a.
Woolloomooloo Sydney Unit 109 $512,000 19.1% 3.1% $530 5.4% ‐4.9% 66
Woolooware Sutherland Shire House 80 $932,500 16.6% 6.2% $650 3.6% n.a. n.a.
Woolooware Sutherland Shire Unit 48 $533,200 n.a. 8.2% $340 3.3% ‐3.1% 53
Woolwich Hunter's Hill House 12 $4,230,000 n.a. 7.0% n.a. n.a. n.a. n.a.
Woongarrah Wyong House 91 $410,500 7.7% 14.6% $400 5.1% ‐6.7% 69
Woronora Sutherland Shire House 38 $710,000 9.2% 6.5% n.a. n.a. n.a. n.a.
Woronora Heights Sutherland Shire House 33 $690,000 11.3% 6.0% n.a. n.a. n.a. n.a.
Woy Woy Gosford House 167 $343,000 9.8% 5.3% $330 5.0% ‐4.4% 62
Woy Woy Gosford Unit 96 $307,000 10.0% 3.8% $280 4.7% ‐3.4% 61
Woy Woy Bay Gosford House 11 $625,000 n.a. 5.5% n.a. n.a. n.a. n.a.
Wyee Wyong House 14 $312,500 13.6% 8.7% n.a. n.a. n.a. n.a.
Wyee Point Wyong House 12 $312,500 ‐4.3% 9.7% n.a. n.a. n.a. n.a.
Wyoming Gosford House 181 $325,000 6.6% 6.3% $330 5.3% ‐4.9% 66
Wyoming Gosford Unit 14 $245,000 13.2% 4.4% n.a. n.a. n.a. n.a.
Wyong Wyong House 48 $291,250 6.5% 8.7% $290 5.2% ‐5.4% 66
Wyong Wyong Unit 21 $237,500 13.1% 9.6% $285 6.2% n.a. n.a.
Wyongah Wyong House 45 $300,000 20.0% 8.2% $300 5.2% ‐7.8% 83
Yagoona Bankstown House 172 $430,000 10.3% 5.7% $400 4.8% ‐6.5% 61
Yagoona Bankstown Unit 108 $327,750 21.8% 6.1% $350 5.6% ‐4.2% 38
Yarrawarrah Sutherland Shire House 13 $660,000 22.2% 5.1% n.a. n.a. n.a. n.a.
Yattalunga Gosford House 13 $380,000 n.a. 7.6% n.a. n.a. n.a. n.a.
Yellow Rock Blue Mountains House 12 $350,250 5.2% 5.2% n.a. n.a. n.a. n.a.
Yennora Holroyd House 13 $390,000 14.7% 7.8% n.a. n.a. n.a. n.a.
Yowie Bay Sutherland Shire House 44 $946,500 16.3% 5.8% $860 4.7% n.a. n.a.
Zetland Sydney House 16 $805,500 31.1% 8.3% $673 4.3% n.a. n.a.
Zetland Sydney Unit 142 $600,000 12.1% n.a. $530 4.6% n.a. n.a.
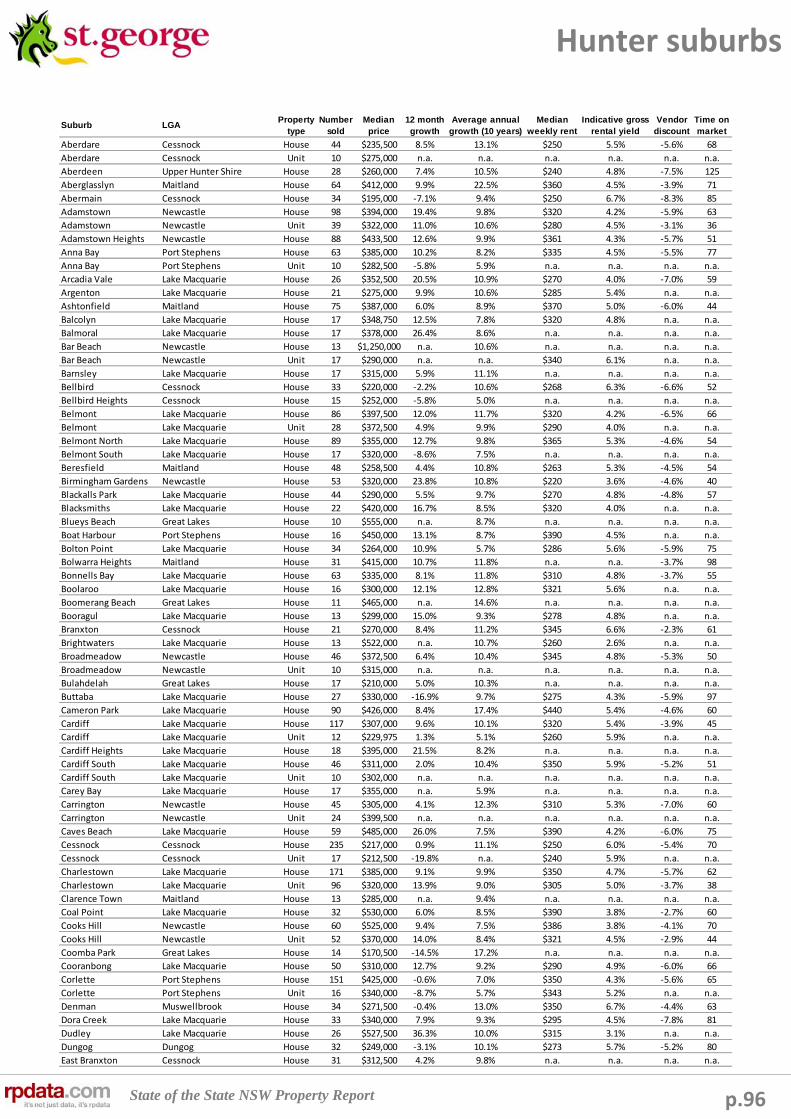
State of the State NSW Property Report p.96
Hunter suburbs
Suburb LGAProperty
typeNumber
soldMedian
price12 month growth
Average annual growth (10 years)
Median weekly rent
Indicative gross rental yield
Vendor discount
Time on market
Aberdare Cessnock House 44 $235,500 8.5% 13.1% $250 5.5% ‐5.6% 68
Aberdare Cessnock Unit 10 $275,000 n.a. n.a. n.a. n.a. n.a. n.a.
Aberdeen Upper Hunter Shire House 28 $260,000 7.4% 10.5% $240 4.8% ‐7.5% 125
Aberglasslyn Maitland House 64 $412,000 9.9% 22.5% $360 4.5% ‐3.9% 71
Abermain Cessnock House 34 $195,000 ‐7.1% 9.4% $250 6.7% ‐8.3% 85
Adamstown Newcastle House 98 $394,000 19.4% 9.8% $320 4.2% ‐5.9% 63
Adamstown Newcastle Unit 39 $322,000 11.0% 10.6% $280 4.5% ‐3.1% 36
Adamstown Heights Newcastle House 88 $433,500 12.6% 9.9% $361 4.3% ‐5.7% 51
Anna Bay Port Stephens House 63 $385,000 10.2% 8.2% $335 4.5% ‐5.5% 77
Anna Bay Port Stephens Unit 10 $282,500 ‐5.8% 5.9% n.a. n.a. n.a. n.a.
Arcadia Vale Lake Macquarie House 26 $352,500 20.5% 10.9% $270 4.0% ‐7.0% 59
Argenton Lake Macquarie House 21 $275,000 9.9% 10.6% $285 5.4% n.a. n.a.
Ashtonfield Maitland House 75 $387,000 6.0% 8.9% $370 5.0% ‐6.0% 44
Balcolyn Lake Macquarie House 17 $348,750 12.5% 7.8% $320 4.8% n.a. n.a.
Balmoral Lake Macquarie House 17 $378,000 26.4% 8.6% n.a. n.a. n.a. n.a.
Bar Beach Newcastle House 13 $1,250,000 n.a. 10.6% n.a. n.a. n.a. n.a.
Bar Beach Newcastle Unit 17 $290,000 n.a. n.a. $340 6.1% n.a. n.a.
Barnsley Lake Macquarie House 17 $315,000 5.9% 11.1% n.a. n.a. n.a. n.a.
Bellbird Cessnock House 33 $220,000 ‐2.2% 10.6% $268 6.3% ‐6.6% 52
Bellbird Heights Cessnock House 15 $252,000 ‐5.8% 5.0% n.a. n.a. n.a. n.a.
Belmont Lake Macquarie House 86 $397,500 12.0% 11.7% $320 4.2% ‐6.5% 66
Belmont Lake Macquarie Unit 28 $372,500 4.9% 9.9% $290 4.0% n.a. n.a.
Belmont North Lake Macquarie House 89 $355,000 12.7% 9.8% $365 5.3% ‐4.6% 54
Belmont South Lake Macquarie House 17 $320,000 ‐8.6% 7.5% n.a. n.a. n.a. n.a.
Beresfield Maitland House 48 $258,500 4.4% 10.8% $263 5.3% ‐4.5% 54
Birmingham Gardens Newcastle House 53 $320,000 23.8% 10.8% $220 3.6% ‐4.6% 40
Blackalls Park Lake Macquarie House 44 $290,000 5.5% 9.7% $270 4.8% ‐4.8% 57
Blacksmiths Lake Macquarie House 22 $420,000 16.7% 8.5% $320 4.0% n.a. n.a.
Blueys Beach Great Lakes House 10 $555,000 n.a. 8.7% n.a. n.a. n.a. n.a.
Boat Harbour Port Stephens House 16 $450,000 13.1% 8.7% $390 4.5% n.a. n.a.
Bolton Point Lake Macquarie House 34 $264,000 10.9% 5.7% $286 5.6% ‐5.9% 75
Bolwarra Heights Maitland House 31 $415,000 10.7% 11.8% n.a. n.a. ‐3.7% 98
Bonnells Bay Lake Macquarie House 63 $335,000 8.1% 11.8% $310 4.8% ‐3.7% 55
Boolaroo Lake Macquarie House 16 $300,000 12.1% 12.8% $321 5.6% n.a. n.a.
Boomerang Beach Great Lakes House 11 $465,000 n.a. 14.6% n.a. n.a. n.a. n.a.
Booragul Lake Macquarie House 13 $299,000 15.0% 9.3% $278 4.8% n.a. n.a.
Branxton Cessnock House 21 $270,000 8.4% 11.2% $345 6.6% ‐2.3% 61
Brightwaters Lake Macquarie House 13 $522,000 n.a. 10.7% $260 2.6% n.a. n.a.
Broadmeadow Newcastle House 46 $372,500 6.4% 10.4% $345 4.8% ‐5.3% 50
Broadmeadow Newcastle Unit 10 $315,000 n.a. n.a. n.a. n.a. n.a. n.a.
Bulahdelah Great Lakes House 17 $210,000 5.0% 10.3% n.a. n.a. n.a. n.a.
Buttaba Lake Macquarie House 27 $330,000 ‐16.9% 9.7% $275 4.3% ‐5.9% 97
Cameron Park Lake Macquarie House 90 $426,000 8.4% 17.4% $440 5.4% ‐4.6% 60
Cardiff Lake Macquarie House 117 $307,000 9.6% 10.1% $320 5.4% ‐3.9% 45
Cardiff Lake Macquarie Unit 12 $229,975 1.3% 5.1% $260 5.9% n.a. n.a.
Cardiff Heights Lake Macquarie House 18 $395,000 21.5% 8.2% n.a. n.a. n.a. n.a.
Cardiff South Lake Macquarie House 46 $311,000 2.0% 10.4% $350 5.9% ‐5.2% 51
Cardiff South Lake Macquarie Unit 10 $302,000 n.a. n.a. n.a. n.a. n.a. n.a.
Carey Bay Lake Macquarie House 17 $355,000 n.a. 5.9% n.a. n.a. n.a. n.a.
Carrington Newcastle House 45 $305,000 4.1% 12.3% $310 5.3% ‐7.0% 60
Carrington Newcastle Unit 24 $399,500 n.a. n.a. n.a. n.a. n.a. n.a.
Caves Beach Lake Macquarie House 59 $485,000 26.0% 7.5% $390 4.2% ‐6.0% 75
Cessnock Cessnock House 235 $217,000 0.9% 11.1% $250 6.0% ‐5.4% 70
Cessnock Cessnock Unit 17 $212,500 ‐19.8% n.a. $240 5.9% n.a. n.a.
Charlestown Lake Macquarie House 171 $385,000 9.1% 9.9% $350 4.7% ‐5.7% 62
Charlestown Lake Macquarie Unit 96 $320,000 13.9% 9.0% $305 5.0% ‐3.7% 38
Clarence Town Maitland House 13 $285,000 n.a. 9.4% n.a. n.a. n.a. n.a.
Coal Point Lake Macquarie House 32 $530,000 6.0% 8.5% $390 3.8% ‐2.7% 60
Cooks Hill Newcastle House 60 $525,000 9.4% 7.5% $386 3.8% ‐4.1% 70
Cooks Hill Newcastle Unit 52 $370,000 14.0% 8.4% $321 4.5% ‐2.9% 44
Coomba Park Great Lakes House 14 $170,500 ‐14.5% 17.2% n.a. n.a. n.a. n.a.
Cooranbong Lake Macquarie House 50 $310,000 12.7% 9.2% $290 4.9% ‐6.0% 66
Corlette Port Stephens House 151 $425,000 ‐0.6% 7.0% $350 4.3% ‐5.6% 65
Corlette Port Stephens Unit 16 $340,000 ‐8.7% 5.7% $343 5.2% n.a. n.a.
Denman Muswellbrook House 34 $271,500 ‐0.4% 13.0% $350 6.7% ‐4.4% 63
Dora Creek Lake Macquarie House 33 $340,000 7.9% 9.3% $295 4.5% ‐7.8% 81
Dudley Lake Macquarie House 26 $527,500 36.3% 10.0% $315 3.1% n.a. n.a.
Dungog Dungog House 32 $249,000 ‐3.1% 10.1% $273 5.7% ‐5.2% 80
East Branxton Cessnock House 31 $312,500 4.2% 9.8% n.a. n.a. n.a. n.a.
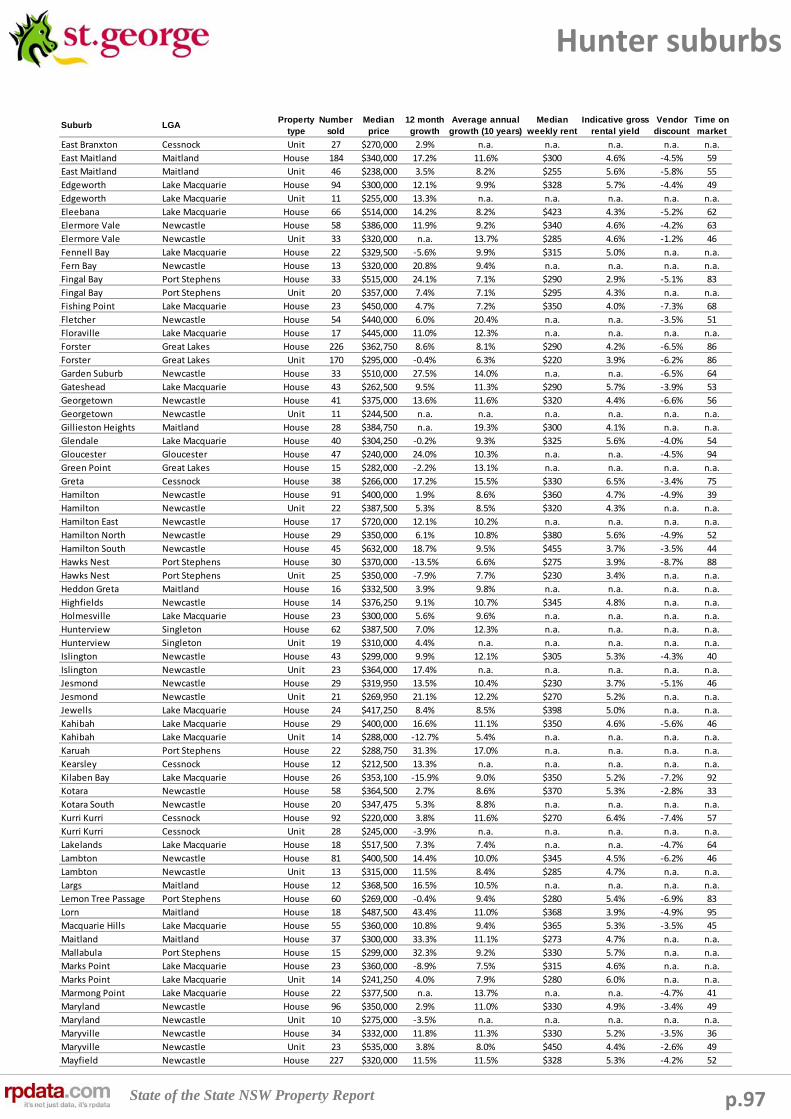
State of the State NSW Property Report p.97
Hunter suburbs
Suburb LGAProperty
typeNumber
soldMedian
price12 month growth
Average annual growth (10 years)
Median weekly rent
Indicative gross rental yield
Vendor discount
Time on market
East Branxton Cessnock Unit 27 $270,000 2.9% n.a. n.a. n.a. n.a. n.a.
East Maitland Maitland House 184 $340,000 17.2% 11.6% $300 4.6% ‐4.5% 59
East Maitland Maitland Unit 46 $238,000 3.5% 8.2% $255 5.6% ‐5.8% 55
Edgeworth Lake Macquarie House 94 $300,000 12.1% 9.9% $328 5.7% ‐4.4% 49
Edgeworth Lake Macquarie Unit 11 $255,000 13.3% n.a. n.a. n.a. n.a. n.a.
Eleebana Lake Macquarie House 66 $514,000 14.2% 8.2% $423 4.3% ‐5.2% 62
Elermore Vale Newcastle House 58 $386,000 11.9% 9.2% $340 4.6% ‐4.2% 63
Elermore Vale Newcastle Unit 33 $320,000 n.a. 13.7% $285 4.6% ‐1.2% 46
Fennell Bay Lake Macquarie House 22 $329,500 ‐5.6% 9.9% $315 5.0% n.a. n.a.
Fern Bay Newcastle House 13 $320,000 20.8% 9.4% n.a. n.a. n.a. n.a.
Fingal Bay Port Stephens House 33 $515,000 24.1% 7.1% $290 2.9% ‐5.1% 83
Fingal Bay Port Stephens Unit 20 $357,000 7.4% 7.1% $295 4.3% n.a. n.a.
Fishing Point Lake Macquarie House 23 $450,000 4.7% 7.2% $350 4.0% ‐7.3% 68
Fletcher Newcastle House 54 $440,000 6.0% 20.4% n.a. n.a. ‐3.5% 51
Floraville Lake Macquarie House 17 $445,000 11.0% 12.3% n.a. n.a. n.a. n.a.
Forster Great Lakes House 226 $362,750 8.6% 8.1% $290 4.2% ‐6.5% 86
Forster Great Lakes Unit 170 $295,000 ‐0.4% 6.3% $220 3.9% ‐6.2% 86
Garden Suburb Newcastle House 33 $510,000 27.5% 14.0% n.a. n.a. ‐6.5% 64
Gateshead Lake Macquarie House 43 $262,500 9.5% 11.3% $290 5.7% ‐3.9% 53
Georgetown Newcastle House 41 $375,000 13.6% 11.6% $320 4.4% ‐6.6% 56
Georgetown Newcastle Unit 11 $244,500 n.a. n.a. n.a. n.a. n.a. n.a.
Gillieston Heights Maitland House 28 $384,750 n.a. 19.3% $300 4.1% n.a. n.a.
Glendale Lake Macquarie House 40 $304,250 ‐0.2% 9.3% $325 5.6% ‐4.0% 54
Gloucester Gloucester House 47 $240,000 24.0% 10.3% n.a. n.a. ‐4.5% 94
Green Point Great Lakes House 15 $282,000 ‐2.2% 13.1% n.a. n.a. n.a. n.a.
Greta Cessnock House 38 $266,000 17.2% 15.5% $330 6.5% ‐3.4% 75
Hamilton Newcastle House 91 $400,000 1.9% 8.6% $360 4.7% ‐4.9% 39
Hamilton Newcastle Unit 22 $387,500 5.3% 8.5% $320 4.3% n.a. n.a.
Hamilton East Newcastle House 17 $720,000 12.1% 10.2% n.a. n.a. n.a. n.a.
Hamilton North Newcastle House 29 $350,000 6.1% 10.8% $380 5.6% ‐4.9% 52
Hamilton South Newcastle House 45 $632,000 18.7% 9.5% $455 3.7% ‐3.5% 44
Hawks Nest Port Stephens House 30 $370,000 ‐13.5% 6.6% $275 3.9% ‐8.7% 88
Hawks Nest Port Stephens Unit 25 $350,000 ‐7.9% 7.7% $230 3.4% n.a. n.a.
Heddon Greta Maitland House 16 $332,500 3.9% 9.8% n.a. n.a. n.a. n.a.
Highfields Newcastle House 14 $376,250 9.1% 10.7% $345 4.8% n.a. n.a.
Holmesville Lake Macquarie House 23 $300,000 5.6% 9.6% n.a. n.a. n.a. n.a.
Hunterview Singleton House 62 $387,500 7.0% 12.3% n.a. n.a. n.a. n.a.
Hunterview Singleton Unit 19 $310,000 4.4% n.a. n.a. n.a. n.a. n.a.
Islington Newcastle House 43 $299,000 9.9% 12.1% $305 5.3% ‐4.3% 40
Islington Newcastle Unit 23 $364,000 17.4% n.a. n.a. n.a. n.a. n.a.
Jesmond Newcastle House 29 $319,950 13.5% 10.4% $230 3.7% ‐5.1% 46
Jesmond Newcastle Unit 21 $269,950 21.1% 12.2% $270 5.2% n.a. n.a.
Jewells Lake Macquarie House 24 $417,250 8.4% 8.5% $398 5.0% n.a. n.a.
Kahibah Lake Macquarie House 29 $400,000 16.6% 11.1% $350 4.6% ‐5.6% 46
Kahibah Lake Macquarie Unit 14 $288,000 ‐12.7% 5.4% n.a. n.a. n.a. n.a.
Karuah Port Stephens House 22 $288,750 31.3% 17.0% n.a. n.a. n.a. n.a.
Kearsley Cessnock House 12 $212,500 13.3% n.a. n.a. n.a. n.a. n.a.
Kilaben Bay Lake Macquarie House 26 $353,100 ‐15.9% 9.0% $350 5.2% ‐7.2% 92
Kotara Newcastle House 58 $364,500 2.7% 8.6% $370 5.3% ‐2.8% 33
Kotara South Newcastle House 20 $347,475 5.3% 8.8% n.a. n.a. n.a. n.a.
Kurri Kurri Cessnock House 92 $220,000 3.8% 11.6% $270 6.4% ‐7.4% 57
Kurri Kurri Cessnock Unit 28 $245,000 ‐3.9% n.a. n.a. n.a. n.a. n.a.
Lakelands Lake Macquarie House 18 $517,500 7.3% 7.4% n.a. n.a. ‐4.7% 64
Lambton Newcastle House 81 $400,500 14.4% 10.0% $345 4.5% ‐6.2% 46
Lambton Newcastle Unit 13 $315,000 11.5% 8.4% $285 4.7% n.a. n.a.
Largs Maitland House 12 $368,500 16.5% 10.5% n.a. n.a. n.a. n.a.
Lemon Tree Passage Port Stephens House 60 $269,000 ‐0.4% 9.4% $280 5.4% ‐6.9% 83
Lorn Maitland House 18 $487,500 43.4% 11.0% $368 3.9% ‐4.9% 95
Macquarie Hills Lake Macquarie House 55 $360,000 10.8% 9.4% $365 5.3% ‐3.5% 45
Maitland Maitland House 37 $300,000 33.3% 11.1% $273 4.7% n.a. n.a.
Mallabula Port Stephens House 15 $299,000 32.3% 9.2% $330 5.7% n.a. n.a.
Marks Point Lake Macquarie House 23 $360,000 ‐8.9% 7.5% $315 4.6% n.a. n.a.
Marks Point Lake Macquarie Unit 14 $241,250 4.0% 7.9% $280 6.0% n.a. n.a.
Marmong Point Lake Macquarie House 22 $377,500 n.a. 13.7% n.a. n.a. ‐4.7% 41
Maryland Newcastle House 96 $350,000 2.9% 11.0% $330 4.9% ‐3.4% 49
Maryland Newcastle Unit 10 $275,000 ‐3.5% n.a. n.a. n.a. n.a. n.a.
Maryville Newcastle House 34 $332,000 11.8% 11.3% $330 5.2% ‐3.5% 36
Maryville Newcastle Unit 23 $535,000 3.8% 8.0% $450 4.4% ‐2.6% 49
Mayfield Newcastle House 227 $320,000 11.5% 11.5% $328 5.3% ‐4.2% 52

State of the State NSW Property Report p.98
Hunter suburbs
Suburb LGAProperty
typeNumber
soldMedian
price12 month growth
Average annual growth (10 years)
Median weekly rent
Indicative gross rental yield
Vendor discount
Time on market
Mayfield Newcastle Unit 23 $258,000 4.3% 8.5% $305 6.1% n.a. n.a.
Mayfield East Newcastle House 39 $292,000 2.5% 12.3% $308 5.5% ‐3.7% 47
Mayfield West Newcastle House 39 $305,000 9.3% 10.9% $330 5.6% ‐4.6% 42
Medowie Port Stephens House 136 $326,500 9.0% 10.8% $320 5.1% ‐3.1% 43
Merewether Newcastle House 202 $681,186 6.2% 9.8% $443 3.4% ‐5.8% 56
Merewether Newcastle Unit 97 $340,000 15.7% 8.0% $310 4.7% ‐3.7% 54
Merewether Heights Newcastle House 22 $578,750 16.3% 9.2% $420 3.8% ‐5.7% 57
Merriwa Upper Hunter Shire House 17 $177,000 14.2% n.a. n.a. n.a. ‐7.7% 148
Metford Maitland House 79 $315,000 7.1% 10.1% $298 4.9% ‐4.3% 60
Metford Maitland Unit 13 $225,000 n.a. n.a. $255 5.9% n.a. n.a.
Millfield Cessnock House 11 $225,000 28.6% 16.2% n.a. n.a. n.a. n.a.
Minmi Newcastle House 10 $415,000 18.6% 12.5% n.a. n.a. n.a. n.a.
Mirrabooka Lake Macquarie House 10 $317,500 7.6% 11.4% $243 4.0% n.a. n.a.
Morisset Lake Macquarie House 30 $307,500 9.0% 11.9% $285 4.8% ‐6.4% 80
Morisset Park Lake Macquarie House 25 $458,000 30.3% 12.3% $360 4.1% n.a. n.a.
Morpeth Maitland House 22 $400,000 32.5% 12.4% $290 3.8% n.a. n.a.
Mount Hutton Lake Macquarie House 36 $351,250 9.1% 9.9% $330 4.9% ‐4.3% 40
Mount Hutton Lake Macquarie Unit 37 $320,000 7.7% 9.2% $313 5.1% n.a. n.a.
Murrurundi Upper Hunter Shire House 11 $130,000 ‐7.8% 8.8% n.a. n.a. n.a. n.a.
Muswellbrook Muswellbrook House 252 $279,500 8.3% 9.9% $275 5.1% ‐4.4% 80
Muswellbrook Muswellbrook Unit 47 $290,000 n.a. n.a. $223 4.0% n.a. n.a.
Nabiac Great Lakes House 11 $279,500 1.6% 11.9% n.a. n.a. n.a. n.a.
Nelson Bay Port Stephens House 153 $415,000 7.8% 6.7% $300 3.8% ‐6.9% 66
Nelson Bay Port Stephens Unit 200 $345,000 1.5% 5.0% $268 4.0% ‐9.9% 97
New Lambton Newcastle House 171 $405,000 12.8% 9.5% $350 4.5% ‐5.0% 45
New Lambton Newcastle Unit 57 $285,000 0.4% 6.7% $285 5.2% ‐3.9% 57
New Lambton Heights Newcastle House 37 $477,000 ‐3.0% 8.3% $450 4.9% ‐4.3% 58
Newcastle Newcastle House 14 $600,000 3.6% n.a. $500 4.3% n.a. n.a.
Newcastle Newcastle Unit 156 $452,500 14.6% 5.5% $450 5.2% ‐5.7% 79
Newcastle East Newcastle House 10 $725,000 n.a. 10.2% n.a. n.a. n.a. n.a.
Newcastle East Newcastle Unit 21 $670,000 ‐3.7% 7.0% $490 3.8% n.a. n.a.
Newcastle West Newcastle Unit 28 $403,750 29.4% n.a. $356 4.6% n.a. n.a.
Nords Wharf Lake Macquarie House 16 $376,000 n.a. 6.5% $280 3.9% n.a. n.a.
North Lambton Newcastle House 59 $350,000 12.9% 10.2% $328 4.9% ‐5.6% 58
Paxton Cessnock House 12 $224,250 7.8% 14.5% n.a. n.a. n.a. n.a.
Pelaw Main Cessnock House 16 $245,750 12.7% 11.8% $270 5.7% n.a. n.a.
Pelican Lake Macquarie House 17 $442,000 26.3% 10.4% n.a. n.a. n.a. n.a.
Rankin Park Newcastle House 39 $400,000 14.3% 8.4% $395 5.1% ‐4.1% 62
Rathmines Lake Macquarie House 36 $320,000 0.0% 8.0% $300 4.9% ‐6.6% 76
Raworth Maitland House 24 $420,000 15.1% n.a. n.a. n.a. n.a. n.a.
Raymond Terrace Port Stephens House 183 $270,000 6.8% 9.6% $275 5.3% ‐3.5% 61
Raymond Terrace Port Stephens Unit 38 $200,000 5.3% 8.9% $240 6.2% ‐3.4% 41
Redhead Lake Macquarie House 45 $580,000 6.7% 12.1% $400 3.6% n.a. n.a.
Rothbury Maitland House 12 $646,000 n.a. n.a. n.a. n.a. n.a. n.a.
Rutherford Maitland House 186 $286,000 ‐3.9% 10.3% $300 5.5% ‐4.1% 64
Rutherford Maitland Unit 23 $254,000 ‐7.6% n.a. $283 5.8% n.a. n.a.
Salamander Bay Port Stephens House 90 $400,000 3.9% 6.4% $350 4.6% ‐5.8% 80
Salamander Bay Port Stephens Unit 67 $308,000 11.0% 6.8% $288 4.9% ‐10.4% 60
Scone Upper Hunter Shire House 80 $302,500 18.2% 9.9% $270 4.6% ‐6.7% 80
Shoal Bay Port Stephens House 30 $438,750 11.8% 8.1% $280 3.3% ‐4.8% 59
Shoal Bay Port Stephens Unit 40 $360,000 ‐2.0% 2.2% $215 3.1% ‐7.5% 63
Shortland Newcastle House 67 $277,500 ‐6.7% 9.5% $305 5.7% ‐4.3% 36
Singleton Singleton House 96 $317,000 3.4% 10.2% $340 5.6% ‐6.1% 83
Singleton Singleton Unit 10 $197,750 ‐4.8% 9.5% $250 6.6% n.a. n.a.
Singleton Heights Singleton House 89 $344,000 12.8% 10.2% $360 5.4% n.a. n.a.
Singleton Heights Singleton Unit 12 $224,000 ‐6.7% n.a. n.a. n.a. n.a. n.a.
Smiths Lake Great Lakes House 27 $317,500 20.9% 14.3% $258 4.2% ‐5.6% 71
Soldiers Point Port Stephens House 22 $555,000 14.4% 9.0% $378 3.5% n.a. n.a.
Soldiers Point Port Stephens Unit 30 $480,500 38.5% 8.0% $295 3.2% n.a. n.a.
Speers Point Lake Macquarie House 60 $441,000 22.5% 10.6% $360 4.2% ‐7.3% 58
Speers Point Lake Macquarie Unit 11 $378,000 n.a. n.a. n.a. n.a. n.a. n.a.
Stanford Merthyr Cessnock House 11 $190,000 n.a. n.a. n.a. n.a. n.a. n.a.
Stockton Newcastle House 61 $400,000 13.5% 10.3% $350 4.6% ‐5.2% 68
Stroud Great Lakes House 15 $265,000 n.a. n.a. n.a. n.a. n.a. n.a.
Sunshine Lake Macquarie House 11 $360,000 ‐14.3% 10.3% n.a. n.a. n.a. n.a.
Swansea Lake Macquarie House 67 $360,000 7.5% 8.5% $295 4.3% ‐6.1% 89
Swansea Lake Macquarie Unit 28 $283,275 ‐2.8% 6.1% $260 4.8% ‐2.9% 79
Swansea Heads Lake Macquarie House 12 $490,000 n.a. 5.9% n.a. n.a. n.a. n.a.
Tanilba Bay Port Stephens House 66 $280,000 3.7% 8.1% $300 5.6% ‐5.8% 98
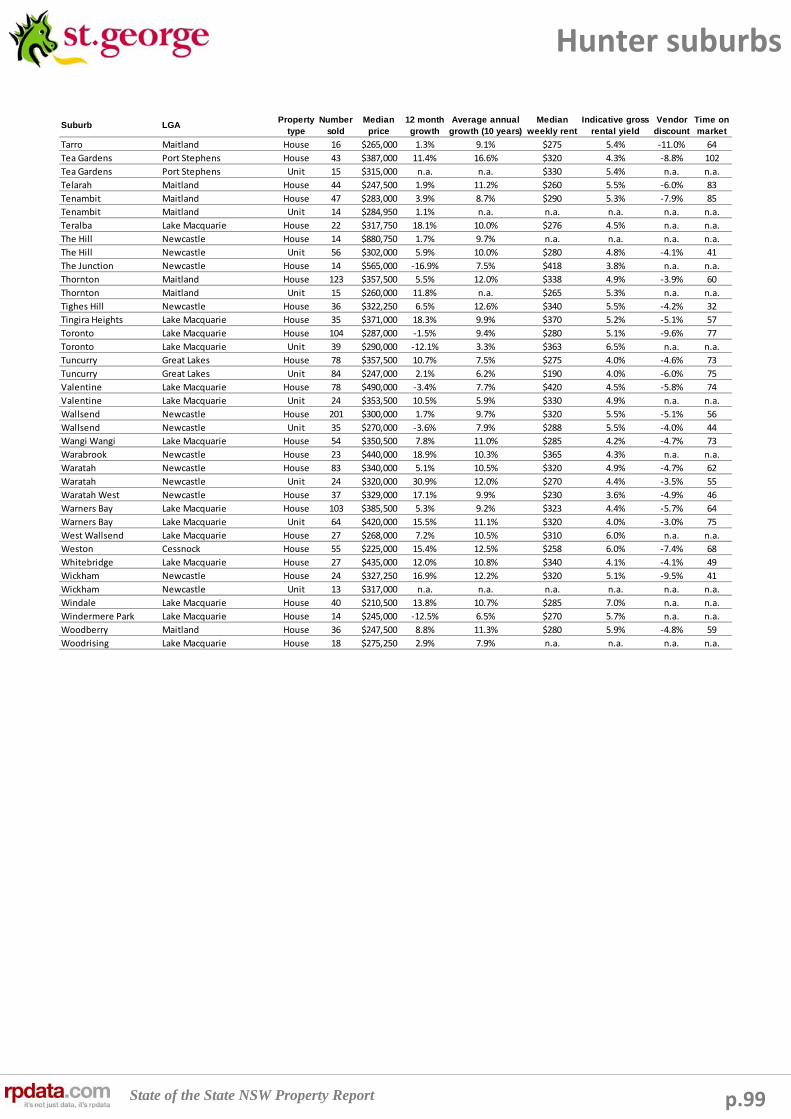
State of the State NSW Property Report p.99
Hunter suburbs
Suburb LGAProperty
typeNumber
soldMedian
price12 month growth
Average annual growth (10 years)
Median weekly rent
Indicative gross rental yield
Vendor discount
Time on market
Tarro Maitland House 16 $265,000 1.3% 9.1% $275 5.4% ‐11.0% 64
Tea Gardens Port Stephens House 43 $387,000 11.4% 16.6% $320 4.3% ‐8.8% 102
Tea Gardens Port Stephens Unit 15 $315,000 n.a. n.a. $330 5.4% n.a. n.a.
Telarah Maitland House 44 $247,500 1.9% 11.2% $260 5.5% ‐6.0% 83
Tenambit Maitland House 47 $283,000 3.9% 8.7% $290 5.3% ‐7.9% 85
Tenambit Maitland Unit 14 $284,950 1.1% n.a. n.a. n.a. n.a. n.a.
Teralba Lake Macquarie House 22 $317,750 18.1% 10.0% $276 4.5% n.a. n.a.
The Hill Newcastle House 14 $880,750 1.7% 9.7% n.a. n.a. n.a. n.a.
The Hill Newcastle Unit 56 $302,000 5.9% 10.0% $280 4.8% ‐4.1% 41
The Junction Newcastle House 14 $565,000 ‐16.9% 7.5% $418 3.8% n.a. n.a.
Thornton Maitland House 123 $357,500 5.5% 12.0% $338 4.9% ‐3.9% 60
Thornton Maitland Unit 15 $260,000 11.8% n.a. $265 5.3% n.a. n.a.
Tighes Hill Newcastle House 36 $322,250 6.5% 12.6% $340 5.5% ‐4.2% 32
Tingira Heights Lake Macquarie House 35 $371,000 18.3% 9.9% $370 5.2% ‐5.1% 57
Toronto Lake Macquarie House 104 $287,000 ‐1.5% 9.4% $280 5.1% ‐9.6% 77
Toronto Lake Macquarie Unit 39 $290,000 ‐12.1% 3.3% $363 6.5% n.a. n.a.
Tuncurry Great Lakes House 78 $357,500 10.7% 7.5% $275 4.0% ‐4.6% 73
Tuncurry Great Lakes Unit 84 $247,000 2.1% 6.2% $190 4.0% ‐6.0% 75
Valentine Lake Macquarie House 78 $490,000 ‐3.4% 7.7% $420 4.5% ‐5.8% 74
Valentine Lake Macquarie Unit 24 $353,500 10.5% 5.9% $330 4.9% n.a. n.a.
Wallsend Newcastle House 201 $300,000 1.7% 9.7% $320 5.5% ‐5.1% 56
Wallsend Newcastle Unit 35 $270,000 ‐3.6% 7.9% $288 5.5% ‐4.0% 44
Wangi Wangi Lake Macquarie House 54 $350,500 7.8% 11.0% $285 4.2% ‐4.7% 73
Warabrook Newcastle House 23 $440,000 18.9% 10.3% $365 4.3% n.a. n.a.
Waratah Newcastle House 83 $340,000 5.1% 10.5% $320 4.9% ‐4.7% 62
Waratah Newcastle Unit 24 $320,000 30.9% 12.0% $270 4.4% ‐3.5% 55
Waratah West Newcastle House 37 $329,000 17.1% 9.9% $230 3.6% ‐4.9% 46
Warners Bay Lake Macquarie House 103 $385,500 5.3% 9.2% $323 4.4% ‐5.7% 64
Warners Bay Lake Macquarie Unit 64 $420,000 15.5% 11.1% $320 4.0% ‐3.0% 75
West Wallsend Lake Macquarie House 27 $268,000 7.2% 10.5% $310 6.0% n.a. n.a.
Weston Cessnock House 55 $225,000 15.4% 12.5% $258 6.0% ‐7.4% 68
Whitebridge Lake Macquarie House 27 $435,000 12.0% 10.8% $340 4.1% ‐4.1% 49
Wickham Newcastle House 24 $327,250 16.9% 12.2% $320 5.1% ‐9.5% 41
Wickham Newcastle Unit 13 $317,000 n.a. n.a. n.a. n.a. n.a. n.a.
Windale Lake Macquarie House 40 $210,500 13.8% 10.7% $285 7.0% n.a. n.a.
Windermere Park Lake Macquarie House 14 $245,000 ‐12.5% 6.5% $270 5.7% n.a. n.a.
Woodberry Maitland House 36 $247,500 8.8% 11.3% $280 5.9% ‐4.8% 59
Woodrising Lake Macquarie House 18 $275,250 2.9% 7.9% n.a. n.a. n.a. n.a.
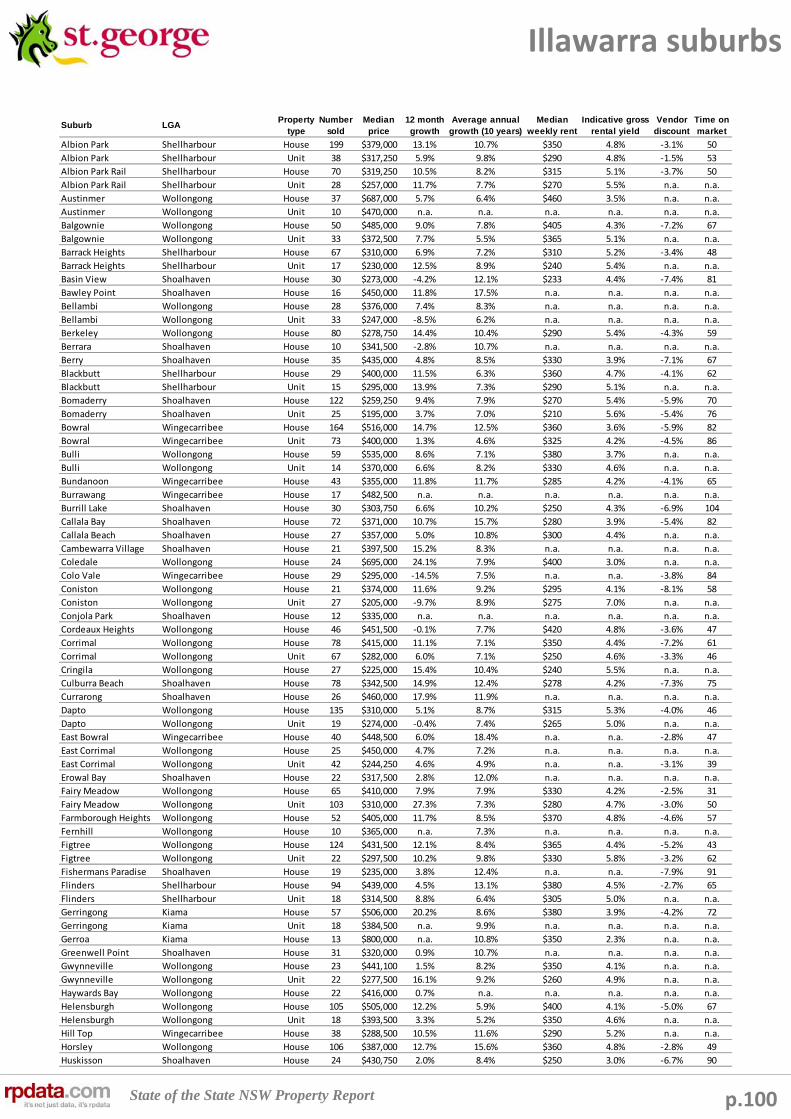
State of the State NSW Property Report p.100
Illawarra suburbs
Suburb LGAProperty
typeNumber
soldMedian
price12 month growth
Average annual growth (10 years)
Median weekly rent
Indicative gross rental yield
Vendor discount
Time on market
Albion Park Shellharbour House 199 $379,000 13.1% 10.7% $350 4.8% ‐3.1% 50
Albion Park Shellharbour Unit 38 $317,250 5.9% 9.8% $290 4.8% ‐1.5% 53
Albion Park Rail Shellharbour House 70 $319,250 10.5% 8.2% $315 5.1% ‐3.7% 50
Albion Park Rail Shellharbour Unit 28 $257,000 11.7% 7.7% $270 5.5% n.a. n.a.
Austinmer Wollongong House 37 $687,000 5.7% 6.4% $460 3.5% n.a. n.a.
Austinmer Wollongong Unit 10 $470,000 n.a. n.a. n.a. n.a. n.a. n.a.
Balgownie Wollongong House 50 $485,000 9.0% 7.8% $405 4.3% ‐7.2% 67
Balgownie Wollongong Unit 33 $372,500 7.7% 5.5% $365 5.1% n.a. n.a.
Barrack Heights Shellharbour House 67 $310,000 6.9% 7.2% $310 5.2% ‐3.4% 48
Barrack Heights Shellharbour Unit 17 $230,000 12.5% 8.9% $240 5.4% n.a. n.a.
Basin View Shoalhaven House 30 $273,000 ‐4.2% 12.1% $233 4.4% ‐7.4% 81
Bawley Point Shoalhaven House 16 $450,000 11.8% 17.5% n.a. n.a. n.a. n.a.
Bellambi Wollongong House 28 $376,000 7.4% 8.3% n.a. n.a. n.a. n.a.
Bellambi Wollongong Unit 33 $247,000 ‐8.5% 6.2% n.a. n.a. n.a. n.a.
Berkeley Wollongong House 80 $278,750 14.4% 10.4% $290 5.4% ‐4.3% 59
Berrara Shoalhaven House 10 $341,500 ‐2.8% 10.7% n.a. n.a. n.a. n.a.
Berry Shoalhaven House 35 $435,000 4.8% 8.5% $330 3.9% ‐7.1% 67
Blackbutt Shellharbour House 29 $400,000 11.5% 6.3% $360 4.7% ‐4.1% 62
Blackbutt Shellharbour Unit 15 $295,000 13.9% 7.3% $290 5.1% n.a. n.a.
Bomaderry Shoalhaven House 122 $259,250 9.4% 7.9% $270 5.4% ‐5.9% 70
Bomaderry Shoalhaven Unit 25 $195,000 3.7% 7.0% $210 5.6% ‐5.4% 76
Bowral Wingecarribee House 164 $516,000 14.7% 12.5% $360 3.6% ‐5.9% 82
Bowral Wingecarribee Unit 73 $400,000 1.3% 4.6% $325 4.2% ‐4.5% 86
Bulli Wollongong House 59 $535,000 8.6% 7.1% $380 3.7% n.a. n.a.
Bulli Wollongong Unit 14 $370,000 6.6% 8.2% $330 4.6% n.a. n.a.
Bundanoon Wingecarribee House 43 $355,000 11.8% 11.7% $285 4.2% ‐4.1% 65
Burrawang Wingecarribee House 17 $482,500 n.a. n.a. n.a. n.a. n.a. n.a.
Burrill Lake Shoalhaven House 30 $303,750 6.6% 10.2% $250 4.3% ‐6.9% 104
Callala Bay Shoalhaven House 72 $371,000 10.7% 15.7% $280 3.9% ‐5.4% 82
Callala Beach Shoalhaven House 27 $357,000 5.0% 10.8% $300 4.4% n.a. n.a.
Cambewarra Village Shoalhaven House 21 $397,500 15.2% 8.3% n.a. n.a. n.a. n.a.
Coledale Wollongong House 24 $695,000 24.1% 7.9% $400 3.0% n.a. n.a.
Colo Vale Wingecarribee House 29 $295,000 ‐14.5% 7.5% n.a. n.a. ‐3.8% 84
Coniston Wollongong House 21 $374,000 11.6% 9.2% $295 4.1% ‐8.1% 58
Coniston Wollongong Unit 27 $205,000 ‐9.7% 8.9% $275 7.0% n.a. n.a.
Conjola Park Shoalhaven House 12 $335,000 n.a. n.a. n.a. n.a. n.a. n.a.
Cordeaux Heights Wollongong House 46 $451,500 ‐0.1% 7.7% $420 4.8% ‐3.6% 47
Corrimal Wollongong House 78 $415,000 11.1% 7.1% $350 4.4% ‐7.2% 61
Corrimal Wollongong Unit 67 $282,000 6.0% 7.1% $250 4.6% ‐3.3% 46
Cringila Wollongong House 27 $225,000 15.4% 10.4% $240 5.5% n.a. n.a.
Culburra Beach Shoalhaven House 78 $342,500 14.9% 12.4% $278 4.2% ‐7.3% 75
Currarong Shoalhaven House 26 $460,000 17.9% 11.9% n.a. n.a. n.a. n.a.
Dapto Wollongong House 135 $310,000 5.1% 8.7% $315 5.3% ‐4.0% 46
Dapto Wollongong Unit 19 $274,000 ‐0.4% 7.4% $265 5.0% n.a. n.a.
East Bowral Wingecarribee House 40 $448,500 6.0% 18.4% n.a. n.a. ‐2.8% 47
East Corrimal Wollongong House 25 $450,000 4.7% 7.2% n.a. n.a. n.a. n.a.
East Corrimal Wollongong Unit 42 $244,250 4.6% 4.9% n.a. n.a. ‐3.1% 39
Erowal Bay Shoalhaven House 22 $317,500 2.8% 12.0% n.a. n.a. n.a. n.a.
Fairy Meadow Wollongong House 65 $410,000 7.9% 7.9% $330 4.2% ‐2.5% 31
Fairy Meadow Wollongong Unit 103 $310,000 27.3% 7.3% $280 4.7% ‐3.0% 50
Farmborough Heights Wollongong House 52 $405,000 11.7% 8.5% $370 4.8% ‐4.6% 57
Fernhill Wollongong House 10 $365,000 n.a. 7.3% n.a. n.a. n.a. n.a.
Figtree Wollongong House 124 $431,500 12.1% 8.4% $365 4.4% ‐5.2% 43
Figtree Wollongong Unit 22 $297,500 10.2% 9.8% $330 5.8% ‐3.2% 62
Fishermans Paradise Shoalhaven House 19 $235,000 3.8% 12.4% n.a. n.a. ‐7.9% 91
Flinders Shellharbour House 94 $439,000 4.5% 13.1% $380 4.5% ‐2.7% 65
Flinders Shellharbour Unit 18 $314,500 8.8% 6.4% $305 5.0% n.a. n.a.
Gerringong Kiama House 57 $506,000 20.2% 8.6% $380 3.9% ‐4.2% 72
Gerringong Kiama Unit 18 $384,500 n.a. 9.9% n.a. n.a. n.a. n.a.
Gerroa Kiama House 13 $800,000 n.a. 10.8% $350 2.3% n.a. n.a.
Greenwell Point Shoalhaven House 31 $320,000 0.9% 10.7% n.a. n.a. n.a. n.a.
Gwynneville Wollongong House 23 $441,100 1.5% 8.2% $350 4.1% n.a. n.a.
Gwynneville Wollongong Unit 22 $277,500 16.1% 9.2% $260 4.9% n.a. n.a.
Haywards Bay Wollongong House 22 $416,000 0.7% n.a. n.a. n.a. n.a. n.a.
Helensburgh Wollongong House 105 $505,000 12.2% 5.9% $400 4.1% ‐5.0% 67
Helensburgh Wollongong Unit 18 $393,500 3.3% 5.2% $350 4.6% n.a. n.a.
Hill Top Wingecarribee House 38 $288,500 10.5% 11.6% $290 5.2% n.a. n.a.
Horsley Wollongong House 106 $387,000 12.7% 15.6% $360 4.8% ‐2.8% 49
Huskisson Shoalhaven House 24 $430,750 2.0% 8.4% $250 3.0% ‐6.7% 90

State of the State NSW Property Report p.101
Illawarra suburbs
Suburb LGAProperty
typeNumber
soldMedian
price12 month growth
Average annual growth (10 years)
Median weekly rent
Indicative gross rental yield
Vendor discount
Time on market
Huskisson Shoalhaven Unit 13 $375,000 0.9% n.a. n.a. n.a. n.a. n.a.
Jamberoo Kiama House 16 $513,500 n.a. 7.6% n.a. n.a. n.a. n.a.
Kanahooka Wollongong House 65 $347,990 10.5% 8.8% $330 4.9% ‐4.0% 61
Kanahooka Wollongong Unit 12 $324,000 ‐1.8% n.a. n.a. n.a. n.a. n.a.
Keiraville Wollongong House 32 $475,000 1.4% 6.4% $380 4.2% ‐4.6% 47
Keiraville Wollongong Unit 16 $340,000 21.4% 7.8% $315 4.8% n.a. n.a.
Kiama Kiama House 116 $526,000 11.9% 8.4% $370 3.7% ‐5.0% 75
Kiama Kiama Unit 76 $376,500 9.1% 8.0% $320 4.4% ‐4.9% 61
Kiama Downs Kiama House 78 $508,500 18.3% 7.5% $370 3.8% ‐3.7% 55
Kiama Heights Kiama House 24 $495,000 5.3% 6.9% $398 4.2% n.a. n.a.
Kioloa Shoalhaven House 22 $311,500 n.a. 17.1% n.a. n.a. ‐10.4% 70
Koonawarra Wollongong House 40 $270,000 5.3% 9.9% $300 5.8% ‐3.6% 42
Lake Conjola Shoalhaven House 13 $300,000 n.a. 12.2% n.a. n.a. n.a. n.a.
Lake Heights Wollongong House 46 $306,000 9.7% 8.9% $293 5.0% ‐5.5% 73
Lake Illawarra Shellharbour House 46 $289,500 12.2% 8.4% $280 5.0% ‐4.3% 51
Lake Illawarra Shellharbour Unit 23 $265,000 15.2% 8.4% $250 4.9% ‐2.9% 81
Lake Tabourie Shoalhaven House 14 $286,000 6.9% 13.2% n.a. n.a. ‐5.5% 137
Mangerton Wollongong House 31 $482,000 8.4% 7.1% $420 4.5% ‐5.2% 91
Mangerton Wollongong Unit 15 $355,000 n.a. 11.9% $240 3.5% n.a. n.a.
Manyana Shoalhaven House 33 $320,000 12.3% 14.9% n.a. n.a. ‐8.6% 85
Marulan Wingecarribee House 15 $196,000 1.0% 15.3% n.a. n.a. n.a. n.a.
Meroo Meadow Shoalhaven House 10 $415,000 6.3% n.a. n.a. n.a. n.a. n.a.
Milton Shoalhaven House 21 $415,000 18.1% 12.2% n.a. n.a. ‐4.4% 54
Minnamurra Kiama House 18 $540,000 n.a. 7.5% n.a. n.a. n.a. n.a.
Mittagong Wingecarribee House 80 $361,500 4.8% 8.0% $350 5.0% ‐5.6% 81
Mittagong Wingecarribee Unit 23 $425,000 n.a. n.a. n.a. n.a. n.a. n.a.
Mollymook Shoalhaven House 18 $445,000 17.1% 11.3% $235 2.7% ‐7.5% 85
Mollymook Beach Shoalhaven House 82 $389,500 7.2% 10.8% $280 3.7% n.a. n.a.
Mollymook Beach Shoalhaven Unit 24 $267,000 ‐12.5% 8.4% n.a. n.a. n.a. n.a.
Moss Vale Wingecarribee House 104 $329,500 8.6% 8.7% $300 4.7% ‐5.6% 83
Moss Vale Wingecarribee Unit 24 $315,000 17.6% 5.6% n.a. n.a. n.a. n.a.
Mount Keira Wollongong House 29 $450,000 2.3% 6.9% n.a. n.a. ‐4.6% 41
Mount Ousley Wollongong House 22 $458,000 11.7% 6.3% n.a. n.a. n.a. n.a.
Mount Pleasant Wollongong House 22 $511,000 11.1% 7.0% $438 4.5% ‐3.5% 43
Mount Saint Thomas Wollongong House 18 $362,000 13.1% 9.7% n.a. n.a. ‐3.9% 27
Mount Warrigal Shellharbour House 71 $340,000 5.6% 7.5% $340 5.2% ‐4.5% 65
Narrawallee Shoalhaven House 41 $385,000 0.0% 10.9% $235 3.2% ‐5.8% 80
North Nowra Shoalhaven House 126 $285,000 6.3% 7.8% $280 5.1% ‐5.3% 68
North Nowra Shoalhaven Unit 14 $178,250 n.a. n.a. n.a. n.a. n.a. n.a.
North Wollongong Wollongong House 10 $481,000 26.7% 4.2% n.a. n.a. n.a. n.a.
North Wollongong Wollongong Unit 48 $368,750 34.1% 11.4% $300 4.2% ‐3.7% 40
Nowra Shoalhaven House 185 $235,000 4.4% 8.9% $260 5.8% ‐6.3% 83
Nowra Shoalhaven Unit 28 $170,000 14.1% 10.6% $180 5.5% n.a. n.a.
Oak Flats Shellharbour House 87 $330,000 6.5% 8.7% $320 5.0% ‐3.8% 48
Oak Flats Shellharbour Unit 22 $220,500 ‐22.1% 7.3% n.a. n.a. n.a. n.a.
Old Erowal Bay Shoalhaven House 24 $238,500 2.1% 13.9% $235 5.1% n.a. n.a.
Orient Point Shoalhaven House 10 $296,250 1.3% 9.5% n.a. n.a. n.a. n.a.
Penrose Wollongong House 16 $321,200 12.3% n.a. n.a. n.a. n.a. n.a.
Port Kembla Wollongong House 50 $305,000 5.2% 10.0% $290 4.9% ‐5.8% 75
Port Kembla Wollongong Unit 17 $240,000 ‐36.8% 11.1% $190 4.1% n.a. n.a.
Primbee Wollongong House 19 $380,000 5.6% 9.5% $330 4.5% n.a. n.a.
Robertson Wingecarribee House 18 $378,000 30.3% 11.5% n.a. n.a. n.a. n.a.
Russell Vale Wollongong House 20 $398,000 0.6% 7.0% n.a. n.a. n.a. n.a.
Russell Vale Wollongong Unit 11 $328,000 1.9% n.a. n.a. n.a. n.a. n.a.
Sanctuary Point Shoalhaven House 220 $255,000 8.5% 10.7% $240 4.9% ‐5.7% 77
Scarborough Wollongong House 10 $740,500 n.a. n.a. $650 4.6% n.a. n.a.
Shell Cove Shellharbour House 72 $527,000 12.2% 14.8% $455 4.5% ‐7.1% 62
Shellharbour Shellharbour House 35 $475,000 11.8% 9.2% $370 4.1% ‐5.3% 89
Shellharbour Shellharbour Unit 32 $344,500 14.8% 6.8% $310 4.7% ‐3.7% 46
Shoalhaven Heads Shoalhaven House 58 $372,500 8.0% 8.5% $280 3.9% ‐7.6% 96
Shoalhaven Heads Shoalhaven Unit 15 $250,000 5.3% 7.1% $195 4.1% n.a. n.a.
South Nowra Shoalhaven House 16 $326,000 6.4% n.a. n.a. n.a. n.a. n.a.
St Georges Basin Shoalhaven House 57 $339,900 17.2% 14.2% $290 4.4% ‐7.3% 90
Stanwell Park Wollongong House 21 $805,000 7.3% 7.5% $475 3.1% n.a. n.a.
Sussex Inlet Shoalhaven House 89 $290,000 1.0% 9.2% n.a. n.a. ‐7.9% 99
Tarrawanna Wollongong House 14 $445,000 16.3% 6.8% $355 4.1% n.a. n.a.
Thirroul Wollongong House 90 $605,000 11.6% 7.6% $440 3.8% ‐5.9% 72
Thirroul Wollongong Unit 59 $408,000 ‐6.2% 5.4% $320 4.1% n.a. n.a.
Towradgi Wollongong House 38 $425,000 3.7% 7.2% $330 4.0% n.a. n.a.

State of the State NSW Property Report p.102
Illawarra suburbs
Suburb LGAProperty
typeNumber
soldMedian
price12 month growth
Average annual growth (10 years)
Median weekly rent
Indicative gross rental yield
Vendor discount
Time on market
Ulladulla Shoalhaven House 121 $347,000 8.4% 10.7% $265 4.0% ‐6.3% 89
Ulladulla Shoalhaven Unit 23 $255,000 ‐8.9% 6.4% n.a. n.a. ‐4.5% 79
Unanderra Wollongong House 62 $321,500 14.8% 9.2% $300 4.9% ‐3.6% 57
Vincentia Shoalhaven House 97 $441,000 7.6% 9.3% $340 4.0% ‐6.5% 72
Vincentia Shoalhaven Unit 10 $317,500 18.9% 8.7% n.a. n.a. n.a. n.a.
Warilla Shellharbour House 77 $285,000 1.8% 8.2% $298 5.4% ‐5.9% 50
Warilla Shellharbour Unit 31 $282,000 13.9% 8.1% $275 5.1% n.a. n.a.
Warrawong Wollongong House 46 $252,500 4.8% 8.7% $265 5.5% ‐7.5% 74
Werri Beach Kiama House 15 $660,000 11.4% 10.0% n.a. n.a. n.a. n.a.
West Nowra Shoalhaven House 21 $267,500 18.4% 14.6% $283 5.5% ‐4.5% 57
West Wollongong Wollongong House 61 $412,000 15.2% 7.9% n.a. n.a. ‐3.7% 47
West Wollongong Wollongong Unit 31 $262,000 19.1% 5.2% n.a. n.a. ‐5.4% 48
Windang Shellharbour House 40 $404,000 15.4% 8.6% $300 3.9% n.a. n.a.
Wollongong Wollongong House 77 $501,000 26.8% 9.1% $350 3.6% ‐5.9% 66
Wollongong Wollongong Unit 583 $365,000 14.4% 8.1% $330 4.7% ‐4.4% 51
Wombarra Wollongong House 19 $830,000 11.0% 12.3% n.a. n.a. n.a. n.a.
Woonona Wollongong House 157 $494,000 12.3% 7.7% $390 4.1% ‐3.1% 45
Woonona Wollongong Unit 122 $339,750 13.3% 7.1% $300 4.6% ‐3.5% 41
Worrigee Shoalhaven House 111 $325,000 8.7% 8.6% $330 5.3% ‐4.4% 78
Yerrinbool Wingecarribee House 16 $267,500 ‐2.7% 7.5% n.a. n.a. ‐5.2% 67

State of the State NSW Property Report p.103
Mid North Coast suburbs
Suburb LGAProperty
typeNumber
soldMedian
price12 month growth
Average annual growth (10 years)
Median weekly rent
Indicative gross rental yield
Vendor discount
Time on market
Bellingen Bellingen House 60 $339,500 12.0% 12.8% $330 5.1% ‐3.9% 49
Black Head Greater Taree House 10 $425,000 ‐3.4% 10.2% n.a. n.a. n.a. n.a.
Boambee East Coffs Harbour House 107 $338,000 7.3% 10.5% $343 5.3% ‐3.5% 54
Boambee East Coffs Harbour Unit 11 $272,500 16.0% n.a. n.a. n.a. n.a. n.a.
Bonny Hills Hastings House 63 $419,000 12.5% 15.8% $330 4.1% ‐4.6% 68
Bowraville Nambucca House 12 $170,000 4.3% 12.4% n.a. n.a. n.a. n.a.
Coffs Harbour Coffs Harbour House 325 $370,000 13.8% 10.6% $330 4.6% ‐4.6% 66
Coffs Harbour Coffs Harbour Unit 302 $252,464 3.3% 9.2% $258 5.3% ‐3.9% 60
Corindi Beach Coffs Harbour House 23 $340,000 7.9% 16.0% $320 4.9% ‐3.5% 69
Coutts Crossing Clarence Valley House 10 $266,000 16.4% 11.4% n.a. n.a. n.a. n.a.
Crescent Head Kempsey House 21 $420,000 8.4% 11.1% n.a. n.a. n.a. n.a.
Crosslands Hastings House 15 $385,000 n.a. n.a. n.a. n.a. n.a. n.a.
Cundletown Greater Taree House 27 $238,500 ‐1.4% 10.1% n.a. n.a. ‐7.6% 60
Diamond Beach Greater Taree House 11 $290,000 n.a. 9.0% $650 11.7% n.a. n.a.
Dorrigo Bellingen House 26 $255,000 1.5% 13.6% n.a. n.a. ‐4.8% 61
Dunbogan Hastings House 22 $439,500 18.8% 13.0% n.a. n.a. ‐6.6% 75
East Kempsey Kempsey House 32 $243,000 20.0% 11.9% n.a. n.a. n.a. n.a.
Emerald Beach Coffs Harbour House 26 $388,500 3.3% 12.5% $320 4.3% ‐5.8% 74
Frederickton Kempsey House 12 $192,500 0.0% 11.3% n.a. n.a. n.a. n.a.
Gladstone Kempsey House 11 $270,000 ‐4.4% 9.7% n.a. n.a. n.a. n.a.
Grafton Clarence Valley House 208 $265,000 9.5% 9.9% $285 5.6% ‐4.9% 66
Grafton Clarence Valley Unit 34 $223,500 13.9% 9.5% $230 5.4% n.a. n.a.
Harrington Greater Taree House 63 $343,000 8.5% 15.0% $260 3.9% ‐6.7% 91
Hyland Park Nambucca House 10 $284,000 ‐16.8% 8.1% n.a. n.a. n.a. n.a.
Iluka Clarence Valley House 32 $379,500 0.5% 12.6% $263 3.6% n.a. n.a.
Iluka Clarence Valley Unit 17 $247,500 ‐8.8% 9.5% $210 4.4% n.a. n.a.
Junction Hill Clarence Valley House 28 $291,000 15.2% 8.8% $320 5.7% ‐2.5% 60
Kendall Hastings House 15 $275,000 n.a. 8.9% n.a. n.a. n.a. n.a.
Korora Coffs Harbour House 39 $455,000 19.7% 8.6% $400 4.6% ‐6.1% 73
Korora Coffs Harbour Unit 15 $278,000 0.2% 5.5% $330 6.2% n.a. n.a.
Lake Cathie Hastings House 47 $377,500 6.3% 13.7% $320 4.4% ‐4.0% 79
Lakewood Hastings House 28 $352,500 11.6% 9.5% n.a. n.a. n.a. n.a.
Laurieton Hastings House 29 $340,000 ‐0.4% 9.7% n.a. n.a. n.a. n.a.
Laurieton Hastings Unit 12 $296,000 11.1% 7.2% $240 4.2% n.a. n.a.
Lawrence Clarence Valley House 11 $260,000 7.9% n.a. n.a. n.a. n.a. n.a.
Macksville Nambucca House 38 $257,500 3.0% 8.7% n.a. n.a. ‐7.2% 120
Maclean Clarence Valley House 63 $290,000 0.0% 12.2% $260 4.7% ‐5.2% 64
Nambucca Heads Nambucca House 73 $298,000 6.8% 9.4% $250 4.4% ‐6.0% 99
Nambucca Heads Nambucca Unit 43 $280,000 40.0% 11.2% $230 4.3% ‐7.4% 117
North Boambee Valley Coffs Harbour House 20 $362,500 5.7% 11.8% n.a. n.a. n.a. n.a.
North Haven Hastings House 35 $320,000 ‐0.8% 7.5% $270 4.4% ‐6.7% 73
Old Bar Greater Taree House 65 $300,000 ‐0.8% 9.1% $270 4.7% ‐4.0% 96
Old Bar Greater Taree Unit 25 $229,505 ‐6.3% 7.1% $205 4.6% n.a. n.a.
Port Macquarie Hastings House 760 $389,000 9.6% 9.3% $350 4.7% ‐5.1% 59
Port Macquarie Hastings Unit 417 $273,000 5.0% 7.2% $255 4.9% ‐4.1% 55
Safety Beach Coffs Harbour House 12 $391,250 ‐18.9% 11.6% n.a. n.a. n.a. n.a.
Sandy Beach Coffs Harbour House 44 $305,000 1.7% 12.1% $315 5.4% ‐5.4% 74
Sapphire Beach Coffs Harbour House 25 $555,000 0.5% 14.8% $420 3.9% n.a. n.a.
Sapphire Beach Coffs Harbour Unit 31 $175,000 ‐31.1% 0.3% $315 9.4% n.a. n.a.
Sawtell Coffs Harbour House 59 $415,000 1.2% 10.7% $340 4.3% ‐5.5% 66
Sawtell Coffs Harbour Unit 41 $332,500 9.0% 9.9% $280 4.4% ‐5.0% 72
Scotts Head Nambucca House 22 $350,000 14.4% 12.1% n.a. n.a. n.a. n.a.
South Grafton Clarence Valley House 110 $195,000 ‐0.8% 8.8% $258 6.9% ‐4.3% 64
South Kempsey Kempsey House 23 $170,000 16.4% 13.4% n.a. n.a. n.a. n.a.
South West Rocks Kempsey House 73 $320,000 1.6% 10.2% $263 4.3% ‐7.5% 90
South West Rocks Kempsey Unit 26 $228,250 ‐11.5% 6.2% $200 4.6% n.a. n.a.
Stuarts Point Hastings House 20 $250,000 ‐3.1% 12.5% n.a. n.a. n.a. n.a.
Taree Greater Taree House 257 $225,000 4.7% 8.7% $250 5.8% ‐6.9% 91
Taree Greater Taree Unit 74 $156,000 4.7% 7.2% $180 6.0% ‐5.9% 67
Tinonee Greater Taree House 17 $245,900 10.2% n.a. n.a. n.a. n.a. n.a.
Toormina Coffs Harbour House 102 $320,000 10.7% 9.6% $318 5.2% ‐3.7% 58
Toormina Coffs Harbour Unit 41 $213,000 ‐2.1% 11.0% $225 5.5% ‐4.8% 70
Townsend Clarence Valley House 19 $264,000 ‐3.3% 8.9% n.a. n.a. n.a. n.a.
Urunga Bellingen House 47 $340,000 6.3% 9.5% $280 4.3% ‐6.3% 106
Valla Beach Nambucca House 19 $420,000 35.5% 15.7% $300 3.7% n.a. n.a.
Wallabi Point Greater Taree House 10 $395,000 n.a. 18.1% n.a. n.a. n.a. n.a.
Wauchope Hastings House 113 $285,000 1.8% 9.5% $273 5.0% ‐5.5% 75
Wauchope Hastings Unit 14 $256,500 n.a. n.a. n.a. n.a. n.a. n.a.
West Haven Hastings House 13 $368,000 4.0% 7.7% n.a. n.a. n.a. n.a.
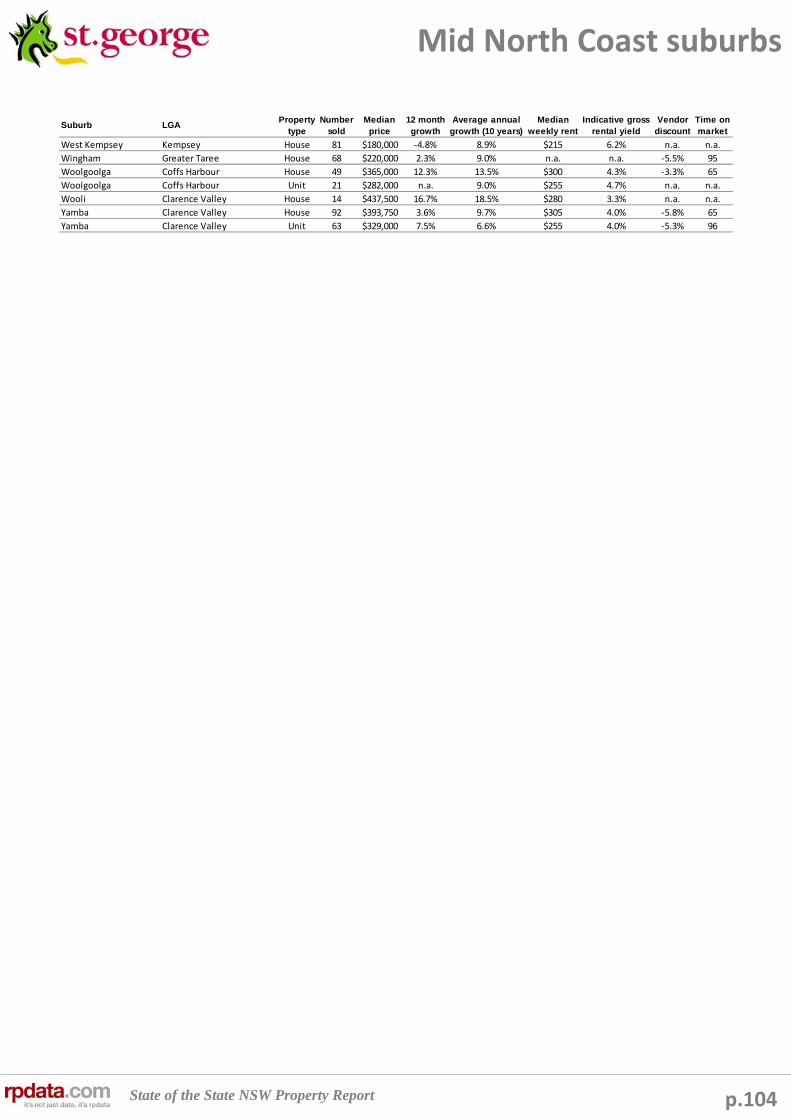
State of the State NSW Property Report p.104
Mid North Coast suburbs
Suburb LGAProperty
typeNumber
soldMedian
price12 month growth
Average annual growth (10 years)
Median weekly rent
Indicative gross rental yield
Vendor discount
Time on market
West Kempsey Kempsey House 81 $180,000 ‐4.8% 8.9% $215 6.2% n.a. n.a.
Wingham Greater Taree House 68 $220,000 2.3% 9.0% n.a. n.a. ‐5.5% 95
Woolgoolga Coffs Harbour House 49 $365,000 12.3% 13.5% $300 4.3% ‐3.3% 65
Woolgoolga Coffs Harbour Unit 21 $282,000 n.a. 9.0% $255 4.7% n.a. n.a.
Wooli Clarence Valley House 14 $437,500 16.7% 18.5% $280 3.3% n.a. n.a.
Yamba Clarence Valley House 92 $393,750 3.6% 9.7% $305 4.0% ‐5.8% 65
Yamba Clarence Valley Unit 63 $329,000 7.5% 6.6% $255 4.0% ‐5.3% 96
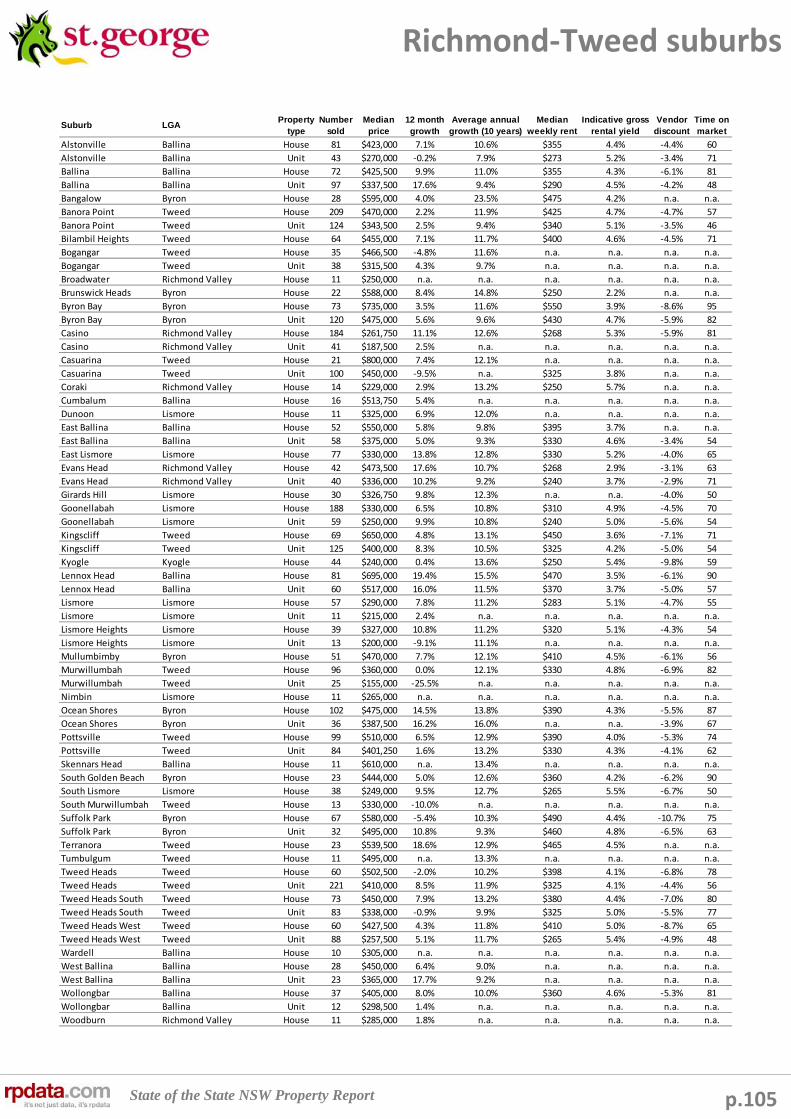
State of the State NSW Property Report p.105
Richmond‐Tweed suburbs
Suburb LGAProperty
typeNumber
soldMedian
price12 month growth
Average annual growth (10 years)
Median weekly rent
Indicative gross rental yield
Vendor discount
Time on market
Alstonville Ballina House 81 $423,000 7.1% 10.6% $355 4.4% ‐4.4% 60
Alstonville Ballina Unit 43 $270,000 ‐0.2% 7.9% $273 5.2% ‐3.4% 71
Ballina Ballina House 72 $425,500 9.9% 11.0% $355 4.3% ‐6.1% 81
Ballina Ballina Unit 97 $337,500 17.6% 9.4% $290 4.5% ‐4.2% 48
Bangalow Byron House 28 $595,000 4.0% 23.5% $475 4.2% n.a. n.a.
Banora Point Tweed House 209 $470,000 2.2% 11.9% $425 4.7% ‐4.7% 57
Banora Point Tweed Unit 124 $343,500 2.5% 9.4% $340 5.1% ‐3.5% 46
Bilambil Heights Tweed House 64 $455,000 7.1% 11.7% $400 4.6% ‐4.5% 71
Bogangar Tweed House 35 $466,500 ‐4.8% 11.6% n.a. n.a. n.a. n.a.
Bogangar Tweed Unit 38 $315,500 4.3% 9.7% n.a. n.a. n.a. n.a.
Broadwater Richmond Valley House 11 $250,000 n.a. n.a. n.a. n.a. n.a. n.a.
Brunswick Heads Byron House 22 $588,000 8.4% 14.8% $250 2.2% n.a. n.a.
Byron Bay Byron House 73 $735,000 3.5% 11.6% $550 3.9% ‐8.6% 95
Byron Bay Byron Unit 120 $475,000 5.6% 9.6% $430 4.7% ‐5.9% 82
Casino Richmond Valley House 184 $261,750 11.1% 12.6% $268 5.3% ‐5.9% 81
Casino Richmond Valley Unit 41 $187,500 2.5% n.a. n.a. n.a. n.a. n.a.
Casuarina Tweed House 21 $800,000 7.4% 12.1% n.a. n.a. n.a. n.a.
Casuarina Tweed Unit 100 $450,000 ‐9.5% n.a. $325 3.8% n.a. n.a.
Coraki Richmond Valley House 14 $229,000 2.9% 13.2% $250 5.7% n.a. n.a.
Cumbalum Ballina House 16 $513,750 5.4% n.a. n.a. n.a. n.a. n.a.
Dunoon Lismore House 11 $325,000 6.9% 12.0% n.a. n.a. n.a. n.a.
East Ballina Ballina House 52 $550,000 5.8% 9.8% $395 3.7% n.a. n.a.
East Ballina Ballina Unit 58 $375,000 5.0% 9.3% $330 4.6% ‐3.4% 54
East Lismore Lismore House 77 $330,000 13.8% 12.8% $330 5.2% ‐4.0% 65
Evans Head Richmond Valley House 42 $473,500 17.6% 10.7% $268 2.9% ‐3.1% 63
Evans Head Richmond Valley Unit 40 $336,000 10.2% 9.2% $240 3.7% ‐2.9% 71
Girards Hill Lismore House 30 $326,750 9.8% 12.3% n.a. n.a. ‐4.0% 50
Goonellabah Lismore House 188 $330,000 6.5% 10.8% $310 4.9% ‐4.5% 70
Goonellabah Lismore Unit 59 $250,000 9.9% 10.8% $240 5.0% ‐5.6% 54
Kingscliff Tweed House 69 $650,000 4.8% 13.1% $450 3.6% ‐7.1% 71
Kingscliff Tweed Unit 125 $400,000 8.3% 10.5% $325 4.2% ‐5.0% 54
Kyogle Kyogle House 44 $240,000 0.4% 13.6% $250 5.4% ‐9.8% 59
Lennox Head Ballina House 81 $695,000 19.4% 15.5% $470 3.5% ‐6.1% 90
Lennox Head Ballina Unit 60 $517,000 16.0% 11.5% $370 3.7% ‐5.0% 57
Lismore Lismore House 57 $290,000 7.8% 11.2% $283 5.1% ‐4.7% 55
Lismore Lismore Unit 11 $215,000 2.4% n.a. n.a. n.a. n.a. n.a.
Lismore Heights Lismore House 39 $327,000 10.8% 11.2% $320 5.1% ‐4.3% 54
Lismore Heights Lismore Unit 13 $200,000 ‐9.1% 11.1% n.a. n.a. n.a. n.a.
Mullumbimby Byron House 51 $470,000 7.7% 12.1% $410 4.5% ‐6.1% 56
Murwillumbah Tweed House 96 $360,000 0.0% 12.1% $330 4.8% ‐6.9% 82
Murwillumbah Tweed Unit 25 $155,000 ‐25.5% n.a. n.a. n.a. n.a. n.a.
Nimbin Lismore House 11 $265,000 n.a. n.a. n.a. n.a. n.a. n.a.
Ocean Shores Byron House 102 $475,000 14.5% 13.8% $390 4.3% ‐5.5% 87
Ocean Shores Byron Unit 36 $387,500 16.2% 16.0% n.a. n.a. ‐3.9% 67
Pottsville Tweed House 99 $510,000 6.5% 12.9% $390 4.0% ‐5.3% 74
Pottsville Tweed Unit 84 $401,250 1.6% 13.2% $330 4.3% ‐4.1% 62
Skennars Head Ballina House 11 $610,000 n.a. 13.4% n.a. n.a. n.a. n.a.
South Golden Beach Byron House 23 $444,000 5.0% 12.6% $360 4.2% ‐6.2% 90
South Lismore Lismore House 38 $249,000 9.5% 12.7% $265 5.5% ‐6.7% 50
South Murwillumbah Tweed House 13 $330,000 ‐10.0% n.a. n.a. n.a. n.a. n.a.
Suffolk Park Byron House 67 $580,000 ‐5.4% 10.3% $490 4.4% ‐10.7% 75
Suffolk Park Byron Unit 32 $495,000 10.8% 9.3% $460 4.8% ‐6.5% 63
Terranora Tweed House 23 $539,500 18.6% 12.9% $465 4.5% n.a. n.a.
Tumbulgum Tweed House 11 $495,000 n.a. 13.3% n.a. n.a. n.a. n.a.
Tweed Heads Tweed House 60 $502,500 ‐2.0% 10.2% $398 4.1% ‐6.8% 78
Tweed Heads Tweed Unit 221 $410,000 8.5% 11.9% $325 4.1% ‐4.4% 56
Tweed Heads South Tweed House 73 $450,000 7.9% 13.2% $380 4.4% ‐7.0% 80
Tweed Heads South Tweed Unit 83 $338,000 ‐0.9% 9.9% $325 5.0% ‐5.5% 77
Tweed Heads West Tweed House 60 $427,500 4.3% 11.8% $410 5.0% ‐8.7% 65
Tweed Heads West Tweed Unit 88 $257,500 5.1% 11.7% $265 5.4% ‐4.9% 48
Wardell Ballina House 10 $305,000 n.a. n.a. n.a. n.a. n.a. n.a.
West Ballina Ballina House 28 $450,000 6.4% 9.0% n.a. n.a. n.a. n.a.
West Ballina Ballina Unit 23 $365,000 17.7% 9.2% n.a. n.a. n.a. n.a.
Wollongbar Ballina House 37 $405,000 8.0% 10.0% $360 4.6% ‐5.3% 81
Wollongbar Ballina Unit 12 $298,500 1.4% n.a. n.a. n.a. n.a. n.a.
Woodburn Richmond Valley House 11 $285,000 1.8% n.a. n.a. n.a. n.a. n.a.

State of the State NSW Property Report p.106
South Eastern suburbs
Suburb LGAProperty
typeNumber
soldMedian
price12 month growth
Average annual growth (10 years)
Median weekly rent
Indicative gross rental yield
Vendor discount
Time on market
Batehaven Eurobodalla House 53 $305,000 ‐10.3% 8.2% $255 4.3% ‐7.5% 75
Batehaven Eurobodalla Unit 35 $290,000 17.2% 9.7% $213 3.8% n.a. n.a.
Batemans Bay Eurobodalla House 13 $341,000 18.2% 11.6% $240 3.7% n.a. n.a.
Batemans Bay Eurobodalla Unit 33 $249,000 9.7% 11.3% $210 4.4% ‐5.5% 114
Bega Bega Valley House 97 $232,000 5.5% 10.6% n.a. n.a. ‐6.5% 91
Bermagui Eurobodalla House 26 $330,000 ‐7.0% 12.1% $250 3.9% n.a. n.a.
Bermagui Eurobodalla Unit 17 $235,000 2.2% 9.7% n.a. n.a. n.a. n.a.
Berrambool Bega Valley House 10 $371,250 ‐7.2% 20.4% n.a. n.a. n.a. n.a.
Berridale Snowy River House 10 $195,000 0.0% 10.9% $240 6.4% n.a. n.a.
Binalong Yass Valley House 10 $172,500 n.a. n.a. n.a. n.a. n.a. n.a.
Bombala Bombala House 18 $126,000 n.a. 9.7% n.a. n.a. n.a. n.a.
Boorowa Boorowa House 19 $182,500 25.9% 12.7% n.a. n.a. n.a. n.a.
Braidwood Palerang House 32 $272,500 0.4% 11.3% n.a. n.a. ‐6.1% 87
Broulee Eurobodalla House 28 $391,000 6.3% 12.4% $295 3.9% ‐5.6% 88
Broulee Eurobodalla Unit 13 $310,000 n.a. 10.6% n.a. n.a. n.a. n.a.
Bungendore Palerang House 64 $507,500 8.0% 15.5% $400 4.1% ‐2.6% 76
Captains Flat Palerang House 10 $192,500 ‐3.8% 17.8% n.a. n.a. n.a. n.a.
Catalina Eurobodalla House 56 $337,500 9.9% 10.2% $295 4.5% ‐5.2% 84
Cooma Cooma‐Monaro House 88 $205,000 2.5% 11.2% $220 5.6% ‐7.8% 106
Crestwood Queanbeyan House 17 $510,000 25.6% 14.5% n.a. n.a. n.a. n.a.
Crestwood Queanbeyan Unit 76 $241,500 9.8% 18.3% n.a. n.a. ‐2.0% 39
Crookwell Upper Lachlan House 35 $225,000 27.5% 14.5% n.a. n.a. n.a. n.a.
Dalmeny Eurobodalla House 45 $325,000 16.7% 12.6% n.a. n.a. ‐3.8% 58
Denhams Beach Eurobodalla House 12 $368,000 n.a. 9.0% $280 4.0% n.a. n.a.
Eden Bega Valley House 54 $309,000 0.9% 9.0% n.a. n.a. ‐7.2% 89
Eden Bega Valley Unit 14 $201,250 n.a. 8.1% n.a. n.a. n.a. n.a.
Goulburn Goulburn Mulwaree House 444 $240,000 9.1% 9.4% $250 5.4% ‐5.3% 72
Goulburn Goulburn Mulwaree Unit 45 $162,000 1.3% 6.4% $163 5.2% n.a. n.a.
Harden Harden House 22 $134,950 8.0% 11.0% n.a. n.a. ‐10.1% 90
Jindabyne Snowy River House 26 $382,250 4.7% 11.4% $370 5.0% n.a. n.a.
Jindabyne Snowy River Unit 73 $240,000 10.5% 7.8% $250 5.4% ‐6.5% 87
Karabar Queanbeyan House 100 $438,300 8.0% 12.1% n.a. n.a. ‐1.7% 32
Karabar Queanbeyan Unit 30 $331,088 3.8% 13.3% n.a. n.a. n.a. n.a.
Kianga Eurobodalla House 21 $363,000 19.0% 12.7% n.a. n.a. n.a. n.a.
Letchworth Queanbeyan House 50 $412,500 ‐0.6% 11.0% n.a. n.a. n.a. n.a.
Letchworth Queanbeyan Unit 24 $227,500 11.4% 25.5% n.a. n.a. n.a. n.a.
Lilli Pilli Eurobodalla House 15 $395,000 7.0% 11.3% n.a. n.a. n.a. n.a.
Long Beach Eurobodalla House 26 $433,000 20.3% 14.2% n.a. n.a. n.a. n.a.
Malua Bay Eurobodalla House 55 $397,000 4.8% 10.5% $290 3.8% ‐4.3% 54
Merimbula Bega Valley House 55 $384,000 1.1% 10.6% $253 3.4% ‐6.6% 85
Merimbula Bega Valley Unit 108 $201,000 0.5% 6.2% $260 6.7% ‐7.4% 79
Moruya Eurobodalla House 28 $305,000 17.3% 12.4% n.a. n.a. n.a. n.a.
Mossy Point Eurobodalla House 18 $352,500 n.a. 8.6% n.a. n.a. n.a. n.a.
Narooma Eurobodalla House 41 $315,000 12.3% 9.9% $240 4.0% ‐3.5% 82
Narooma Eurobodalla Unit 52 $205,000 ‐4.7% 7.4% n.a. n.a. n.a. n.a.
North Narooma Eurobodalla House 17 $385,000 4.8% 13.3% n.a. n.a. n.a. n.a.
Pambula Bega Valley House 20 $291,000 2.1% 9.7% n.a. n.a. n.a. n.a.
Pambula Beach Bega Valley House 16 $512,500 22.6% 12.2% n.a. n.a. ‐6.0% 60
Queanbeyan Queanbeyan House 63 $440,000 15.6% 13.0% $360 4.3% n.a. n.a.
Queanbeyan Queanbeyan Unit 130 $299,000 4.9% 13.5% $285 5.0% ‐2.6% 57
Queanbeyan East Queanbeyan House 41 $520,000 3.5% 14.1% n.a. n.a. n.a. n.a.
Queanbeyan East Queanbeyan Unit 126 $248,000 1.0% 15.0% n.a. n.a. ‐1.2% 40
Queanbeyan West Queanbeyan House 19 $480,000 14.3% 11.1% n.a. n.a. n.a. n.a.
Queanbeyan West Queanbeyan Unit 23 $385,000 10.0% 15.9% n.a. n.a. n.a. n.a.
South Durras Eurobodalla House 15 $440,000 23.9% 11.9% n.a. n.a. n.a. n.a.
South Pambula Bega Valley House 11 $275,000 n.a. n.a. n.a. n.a. n.a. n.a.
Sunshine Bay Eurobodalla House 27 $370,000 ‐4.6% 12.5% $325 4.6% ‐5.2% 57
Sunshine Bay Eurobodalla Unit 12 $301,000 n.a. 8.8% n.a. n.a. n.a. n.a.
Surf Beach Eurobodalla House 42 $337,500 4.8% 8.9% $270 4.2% ‐4.9% 73
Surf Beach Eurobodalla Unit 28 $244,500 ‐4.1% 7.7% $220 4.7% ‐5.9% 101
Surfside Eurobodalla House 32 $335,000 19.2% 10.8% $250 3.9% ‐3.8% 54
Tathra Bega Valley House 28 $371,500 3.2% 10.7% n.a. n.a. n.a. n.a.
Tomakin Eurobodalla House 24 $297,500 ‐5.9% 11.4% n.a. n.a. n.a. n.a.
Tura Beach Bega Valley House 81 $391,500 9.5% 17.6% $300 4.0% ‐6.7% 81
Tura Beach Bega Valley Unit 25 $320,000 30.3% 9.4% n.a. n.a. ‐5.6% 98
Tuross Head Eurobodalla House 75 $305,000 ‐3.2% 12.4% n.a. n.a. n.a. n.a.
Wallaga Lake Eurobodalla House 17 $289,000 ‐19.2% 12.2% n.a. n.a. n.a. n.a.
Yass Yass Valley House 98 $305,000 10.9% 13.2% $293 5.0% ‐3.1% 63
Young Young House 145 $200,000 3.1% 9.0% $208 5.4% ‐8.9% 112
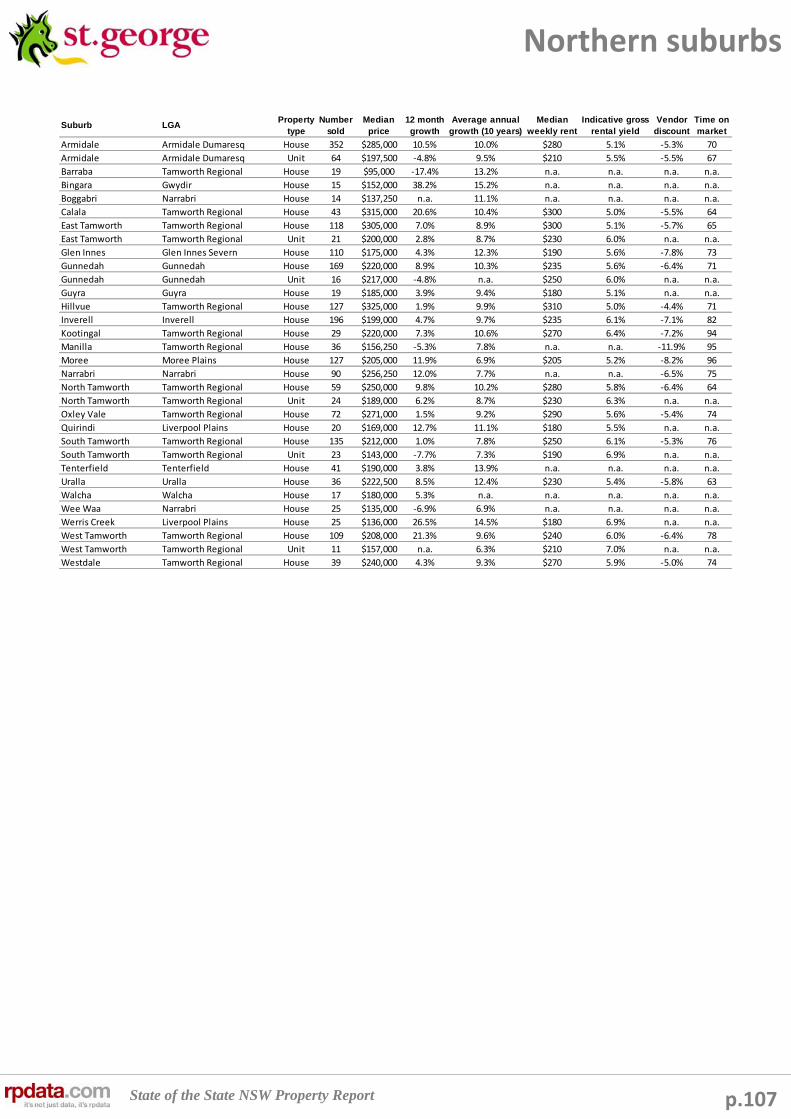
State of the State NSW Property Report p.107
Northern suburbs
Suburb LGAProperty
typeNumber
soldMedian
price12 month growth
Average annual growth (10 years)
Median weekly rent
Indicative gross rental yield
Vendor discount
Time on market
Armidale Armidale Dumaresq House 352 $285,000 10.5% 10.0% $280 5.1% ‐5.3% 70
Armidale Armidale Dumaresq Unit 64 $197,500 ‐4.8% 9.5% $210 5.5% ‐5.5% 67
Barraba Tamworth Regional House 19 $95,000 ‐17.4% 13.2% n.a. n.a. n.a. n.a.
Bingara Gwydir House 15 $152,000 38.2% 15.2% n.a. n.a. n.a. n.a.
Boggabri Narrabri House 14 $137,250 n.a. 11.1% n.a. n.a. n.a. n.a.
Calala Tamworth Regional House 43 $315,000 20.6% 10.4% $300 5.0% ‐5.5% 64
East Tamworth Tamworth Regional House 118 $305,000 7.0% 8.9% $300 5.1% ‐5.7% 65
East Tamworth Tamworth Regional Unit 21 $200,000 2.8% 8.7% $230 6.0% n.a. n.a.
Glen Innes Glen Innes Severn House 110 $175,000 4.3% 12.3% $190 5.6% ‐7.8% 73
Gunnedah Gunnedah House 169 $220,000 8.9% 10.3% $235 5.6% ‐6.4% 71
Gunnedah Gunnedah Unit 16 $217,000 ‐4.8% n.a. $250 6.0% n.a. n.a.
Guyra Guyra House 19 $185,000 3.9% 9.4% $180 5.1% n.a. n.a.
Hillvue Tamworth Regional House 127 $325,000 1.9% 9.9% $310 5.0% ‐4.4% 71
Inverell Inverell House 196 $199,000 4.7% 9.7% $235 6.1% ‐7.1% 82
Kootingal Tamworth Regional House 29 $220,000 7.3% 10.6% $270 6.4% ‐7.2% 94
Manilla Tamworth Regional House 36 $156,250 ‐5.3% 7.8% n.a. n.a. ‐11.9% 95
Moree Moree Plains House 127 $205,000 11.9% 6.9% $205 5.2% ‐8.2% 96
Narrabri Narrabri House 90 $256,250 12.0% 7.7% n.a. n.a. ‐6.5% 75
North Tamworth Tamworth Regional House 59 $250,000 9.8% 10.2% $280 5.8% ‐6.4% 64
North Tamworth Tamworth Regional Unit 24 $189,000 6.2% 8.7% $230 6.3% n.a. n.a.
Oxley Vale Tamworth Regional House 72 $271,000 1.5% 9.2% $290 5.6% ‐5.4% 74
Quirindi Liverpool Plains House 20 $169,000 12.7% 11.1% $180 5.5% n.a. n.a.
South Tamworth Tamworth Regional House 135 $212,000 1.0% 7.8% $250 6.1% ‐5.3% 76
South Tamworth Tamworth Regional Unit 23 $143,000 ‐7.7% 7.3% $190 6.9% n.a. n.a.
Tenterfield Tenterfield House 41 $190,000 3.8% 13.9% n.a. n.a. n.a. n.a.
Uralla Uralla House 36 $222,500 8.5% 12.4% $230 5.4% ‐5.8% 63
Walcha Walcha House 17 $180,000 5.3% n.a. n.a. n.a. n.a. n.a.
Wee Waa Narrabri House 25 $135,000 ‐6.9% 6.9% n.a. n.a. n.a. n.a.
Werris Creek Liverpool Plains House 25 $136,000 26.5% 14.5% $180 6.9% n.a. n.a.
West Tamworth Tamworth Regional House 109 $208,000 21.3% 9.6% $240 6.0% ‐6.4% 78
West Tamworth Tamworth Regional Unit 11 $157,000 n.a. 6.3% $210 7.0% n.a. n.a.
Westdale Tamworth Regional House 39 $240,000 4.3% 9.3% $270 5.9% ‐5.0% 74
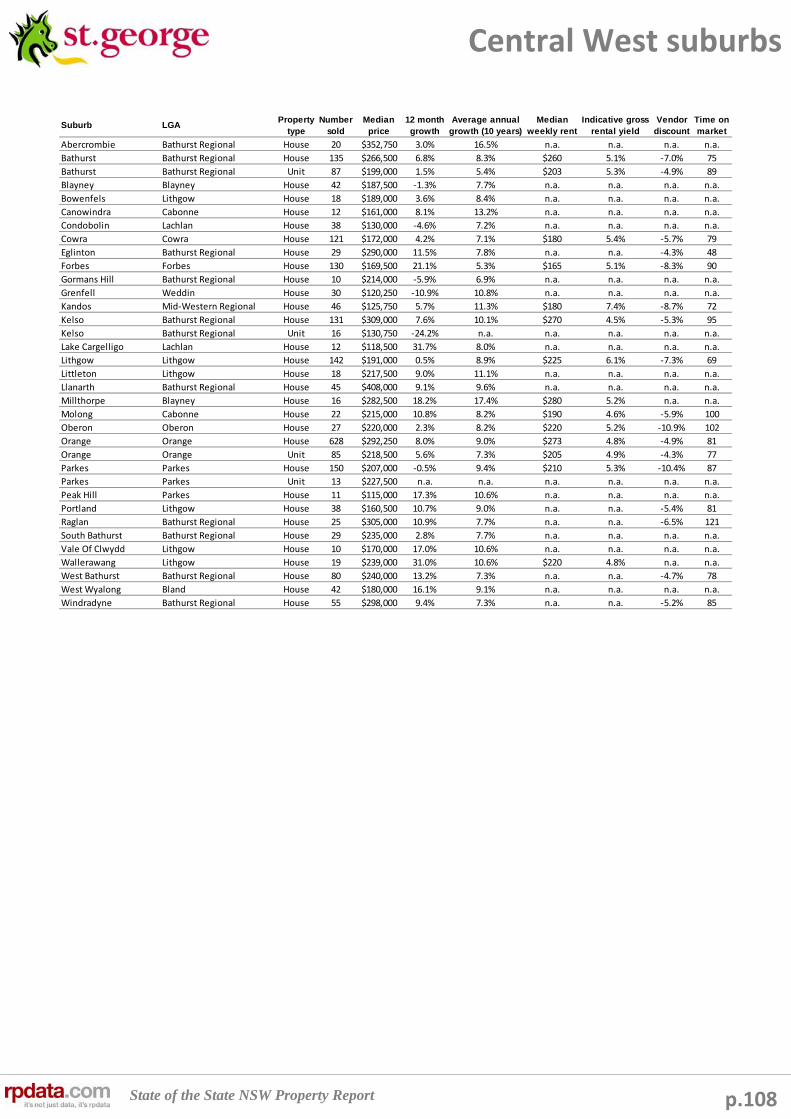
State of the State NSW Property Report p.108
Central West suburbs
Suburb LGAProperty
typeNumber
soldMedian
price12 month growth
Average annual growth (10 years)
Median weekly rent
Indicative gross rental yield
Vendor discount
Time on market
Abercrombie Bathurst Regional House 20 $352,750 3.0% 16.5% n.a. n.a. n.a. n.a.
Bathurst Bathurst Regional House 135 $266,500 6.8% 8.3% $260 5.1% ‐7.0% 75
Bathurst Bathurst Regional Unit 87 $199,000 1.5% 5.4% $203 5.3% ‐4.9% 89
Blayney Blayney House 42 $187,500 ‐1.3% 7.7% n.a. n.a. n.a. n.a.
Bowenfels Lithgow House 18 $189,000 3.6% 8.4% n.a. n.a. n.a. n.a.
Canowindra Cabonne House 12 $161,000 8.1% 13.2% n.a. n.a. n.a. n.a.
Condobolin Lachlan House 38 $130,000 ‐4.6% 7.2% n.a. n.a. n.a. n.a.
Cowra Cowra House 121 $172,000 4.2% 7.1% $180 5.4% ‐5.7% 79
Eglinton Bathurst Regional House 29 $290,000 11.5% 7.8% n.a. n.a. ‐4.3% 48
Forbes Forbes House 130 $169,500 21.1% 5.3% $165 5.1% ‐8.3% 90
Gormans Hill Bathurst Regional House 10 $214,000 ‐5.9% 6.9% n.a. n.a. n.a. n.a.
Grenfell Weddin House 30 $120,250 ‐10.9% 10.8% n.a. n.a. n.a. n.a.
Kandos Mid‐Western Regional House 46 $125,750 5.7% 11.3% $180 7.4% ‐8.7% 72
Kelso Bathurst Regional House 131 $309,000 7.6% 10.1% $270 4.5% ‐5.3% 95
Kelso Bathurst Regional Unit 16 $130,750 ‐24.2% n.a. n.a. n.a. n.a. n.a.
Lake Cargelligo Lachlan House 12 $118,500 31.7% 8.0% n.a. n.a. n.a. n.a.
Lithgow Lithgow House 142 $191,000 0.5% 8.9% $225 6.1% ‐7.3% 69
Littleton Lithgow House 18 $217,500 9.0% 11.1% n.a. n.a. n.a. n.a.
Llanarth Bathurst Regional House 45 $408,000 9.1% 9.6% n.a. n.a. n.a. n.a.
Millthorpe Blayney House 16 $282,500 18.2% 17.4% $280 5.2% n.a. n.a.
Molong Cabonne House 22 $215,000 10.8% 8.2% $190 4.6% ‐5.9% 100
Oberon Oberon House 27 $220,000 2.3% 8.2% $220 5.2% ‐10.9% 102
Orange Orange House 628 $292,250 8.0% 9.0% $273 4.8% ‐4.9% 81
Orange Orange Unit 85 $218,500 5.6% 7.3% $205 4.9% ‐4.3% 77
Parkes Parkes House 150 $207,000 ‐0.5% 9.4% $210 5.3% ‐10.4% 87
Parkes Parkes Unit 13 $227,500 n.a. n.a. n.a. n.a. n.a. n.a.
Peak Hill Parkes House 11 $115,000 17.3% 10.6% n.a. n.a. n.a. n.a.
Portland Lithgow House 38 $160,500 10.7% 9.0% n.a. n.a. ‐5.4% 81
Raglan Bathurst Regional House 25 $305,000 10.9% 7.7% n.a. n.a. ‐6.5% 121
South Bathurst Bathurst Regional House 29 $235,000 2.8% 7.7% n.a. n.a. n.a. n.a.
Vale Of Clwydd Lithgow House 10 $170,000 17.0% 10.6% n.a. n.a. n.a. n.a.
Wallerawang Lithgow House 19 $239,000 31.0% 10.6% $220 4.8% n.a. n.a.
West Bathurst Bathurst Regional House 80 $240,000 13.2% 7.3% n.a. n.a. ‐4.7% 78
West Wyalong Bland House 42 $180,000 16.1% 9.1% n.a. n.a. n.a. n.a.
Windradyne Bathurst Regional House 55 $298,000 9.4% 7.3% n.a. n.a. ‐5.2% 85

State of the State NSW Property Report p.109
Murumbidgee suburbs
Suburb LGAProperty
typeNumber
soldMedian
price12 month growth
Average annual growth (10 years)
Median weekly rent
Indicative gross rental yield
Vendor discount
Time on market
Adelong Tumut Shire House 10 $196,500 9.9% 11.7% $225 6.0% n.a. n.a.
Ashmont Wagga Wagga House 91 $188,000 ‐7.0% 6.6% $240 6.6% ‐8.0% 80
Ashmont Wagga Wagga Unit 13 $150,000 5.3% n.a. $170 5.9% n.a. n.a.
Batlow Tumut Shire House 13 $135,000 3.8% 15.1% n.a. n.a. n.a. n.a.
Bourkelands Wagga Wagga House 71 $377,500 4.2% 9.0% $410 5.6% ‐3.5% 58
Coolamon Coolamon House 15 $150,000 ‐16.7% 10.2% n.a. n.a. n.a. n.a.
Cootamundra Cootamundra House 134 $164,750 5.3% 8.9% $165 5.2% ‐8.7% 95
Estella Wagga Wagga House 38 $303,500 ‐4.6% 9.0% $340 5.8% ‐3.4% 45
Forest Hill Wagga Wagga House 37 $256,000 14.2% 11.9% $270 5.5% ‐2.8% 52
Ganmain Coolamon House 10 $113,000 n.a. n.a. n.a. n.a. n.a. n.a.
Glenfield Park Wagga Wagga House 137 $314,000 10.2% 9.7% $320 5.3% ‐2.9% 60
Glenfield Park Wagga Wagga Unit 10 $227,000 ‐1.8% 9.0% $250 5.7% n.a. n.a.
Griffith Griffith House 220 $270,000 3.5% 6.4% $245 4.7% ‐7.9% 76
Griffith Griffith Unit 18 $217,500 11.0% 2.7% $195 4.7% n.a. n.a.
Gundagai Gundagai House 12 $186,500 3.6% 7.0% $200 5.6% n.a. n.a.
Hay Hay House 37 $95,000 5.0% 4.4% n.a. n.a. n.a. n.a.
Hillston Carrathool House 10 $87,000 ‐7.0% 6.8% n.a. n.a. n.a. n.a.
Junee Junee House 71 $165,000 22.9% 12.6% $190 6.0% ‐6.9% 64
Kooringal Wagga Wagga House 138 $265,000 10.3% 8.6% $310 6.1% ‐5.2% 62
Kooringal Wagga Wagga Unit 24 $220,000 27.2% 6.7% $230 5.4% n.a. n.a.
Lake Albert Wagga Wagga House 78 $291,500 8.9% 7.7% $320 5.7% ‐4.9% 68
Leeton Leeton House 89 $190,000 8.6% 7.8% $180 4.9% ‐10.1% 109
Leeton Leeton Unit 20 $156,000 ‐13.3% 4.3% n.a. n.a. n.a. n.a.
Lloyd Wagga Wagga House 17 $330,000 17.2% 20.4% n.a. n.a. n.a. n.a.
Lockhart Lockhart House 11 $110,000 ‐27.6% 10.5% n.a. n.a. n.a. n.a.
Mount Austin Wagga Wagga House 76 $204,500 ‐2.6% 8.1% $265 6.7% ‐6.0% 62
Narrandera Narrandera House 66 $156,000 2.6% 8.6% n.a. n.a. ‐8.5% 76
Tatton Wagga Wagga House 48 $405,500 1.4% 8.2% $435 5.6% ‐3.1% 84
Temora Temora House 79 $157,500 ‐5.1% 7.8% $170 5.6% ‐16.3% 111
Tolland Wagga Wagga House 77 $260,000 13.0% 8.6% $260 5.2% ‐5.0% 69
Tumut Tumut Shire House 75 $230,000 ‐2.7% 6.9% $260 5.9% ‐8.6% 94
Turvey Park Wagga Wagga House 80 $320,000 20.8% 10.3% $300 4.9% ‐4.5% 51
Uranquinty Wagga Wagga House 10 $206,500 ‐2.1% n.a. n.a. n.a. n.a. n.a.
Wagga Wagga Wagga Wagga House 124 $310,000 3.1% 8.7% $315 5.3% ‐5.0% 47
Wagga Wagga Wagga Wagga Unit 67 $228,000 4.8% 8.5% $240 5.5% ‐4.1% 64
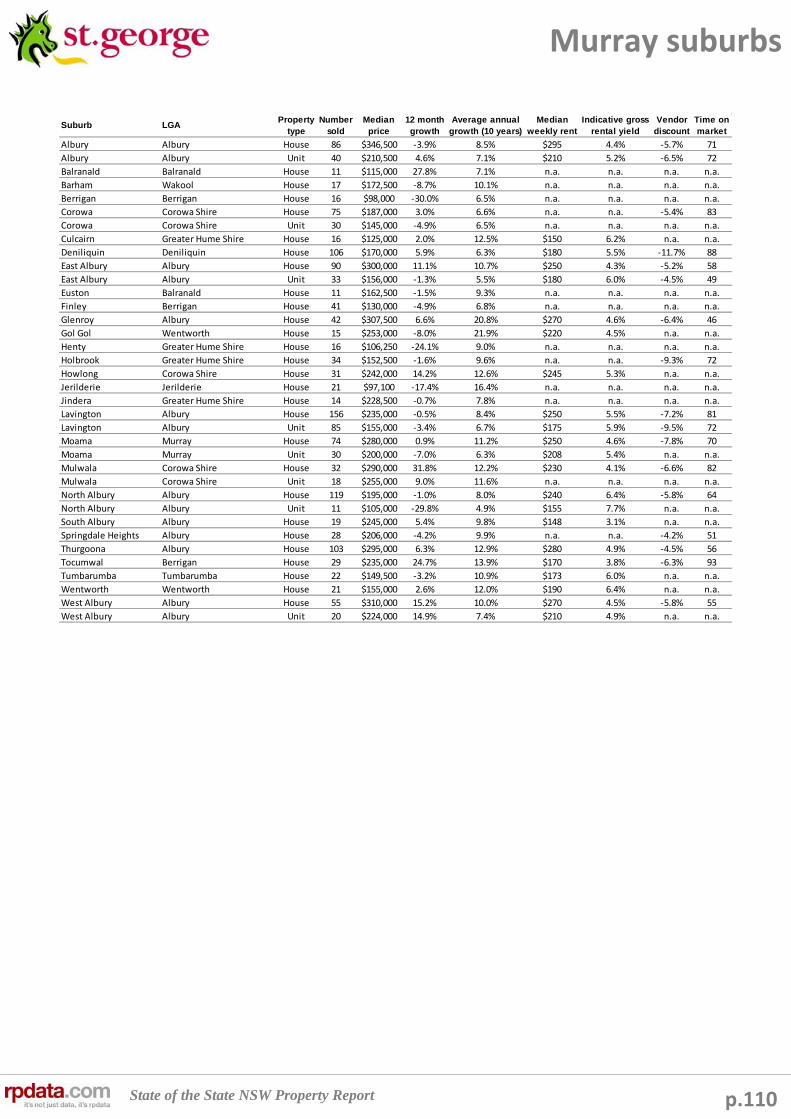
State of the State NSW Property Report p.110
Murray suburbs
Suburb LGAProperty
typeNumber
soldMedian
price12 month growth
Average annual growth (10 years)
Median weekly rent
Indicative gross rental yield
Vendor discount
Time on market
Albury Albury House 86 $346,500 ‐3.9% 8.5% $295 4.4% ‐5.7% 71
Albury Albury Unit 40 $210,500 4.6% 7.1% $210 5.2% ‐6.5% 72
Balranald Balranald House 11 $115,000 27.8% 7.1% n.a. n.a. n.a. n.a.
Barham Wakool House 17 $172,500 ‐8.7% 10.1% n.a. n.a. n.a. n.a.
Berrigan Berrigan House 16 $98,000 ‐30.0% 6.5% n.a. n.a. n.a. n.a.
Corowa Corowa Shire House 75 $187,000 3.0% 6.6% n.a. n.a. ‐5.4% 83
Corowa Corowa Shire Unit 30 $145,000 ‐4.9% 6.5% n.a. n.a. n.a. n.a.
Culcairn Greater Hume Shire House 16 $125,000 2.0% 12.5% $150 6.2% n.a. n.a.
Deniliquin Deniliquin House 106 $170,000 5.9% 6.3% $180 5.5% ‐11.7% 88
East Albury Albury House 90 $300,000 11.1% 10.7% $250 4.3% ‐5.2% 58
East Albury Albury Unit 33 $156,000 ‐1.3% 5.5% $180 6.0% ‐4.5% 49
Euston Balranald House 11 $162,500 ‐1.5% 9.3% n.a. n.a. n.a. n.a.
Finley Berrigan House 41 $130,000 ‐4.9% 6.8% n.a. n.a. n.a. n.a.
Glenroy Albury House 42 $307,500 6.6% 20.8% $270 4.6% ‐6.4% 46
Gol Gol Wentworth House 15 $253,000 ‐8.0% 21.9% $220 4.5% n.a. n.a.
Henty Greater Hume Shire House 16 $106,250 ‐24.1% 9.0% n.a. n.a. n.a. n.a.
Holbrook Greater Hume Shire House 34 $152,500 ‐1.6% 9.6% n.a. n.a. ‐9.3% 72
Howlong Corowa Shire House 31 $242,000 14.2% 12.6% $245 5.3% n.a. n.a.
Jerilderie Jerilderie House 21 $97,100 ‐17.4% 16.4% n.a. n.a. n.a. n.a.
Jindera Greater Hume Shire House 14 $228,500 ‐0.7% 7.8% n.a. n.a. n.a. n.a.
Lavington Albury House 156 $235,000 ‐0.5% 8.4% $250 5.5% ‐7.2% 81
Lavington Albury Unit 85 $155,000 ‐3.4% 6.7% $175 5.9% ‐9.5% 72
Moama Murray House 74 $280,000 0.9% 11.2% $250 4.6% ‐7.8% 70
Moama Murray Unit 30 $200,000 ‐7.0% 6.3% $208 5.4% n.a. n.a.
Mulwala Corowa Shire House 32 $290,000 31.8% 12.2% $230 4.1% ‐6.6% 82
Mulwala Corowa Shire Unit 18 $255,000 9.0% 11.6% n.a. n.a. n.a. n.a.
North Albury Albury House 119 $195,000 ‐1.0% 8.0% $240 6.4% ‐5.8% 64
North Albury Albury Unit 11 $105,000 ‐29.8% 4.9% $155 7.7% n.a. n.a.
South Albury Albury House 19 $245,000 5.4% 9.8% $148 3.1% n.a. n.a.
Springdale Heights Albury House 28 $206,000 ‐4.2% 9.9% n.a. n.a. ‐4.2% 51
Thurgoona Albury House 103 $295,000 6.3% 12.9% $280 4.9% ‐4.5% 56
Tocumwal Berrigan House 29 $235,000 24.7% 13.9% $170 3.8% ‐6.3% 93
Tumbarumba Tumbarumba House 22 $149,500 ‐3.2% 10.9% $173 6.0% n.a. n.a.
Wentworth Wentworth House 21 $155,000 2.6% 12.0% $190 6.4% n.a. n.a.
West Albury Albury House 55 $310,000 15.2% 10.0% $270 4.5% ‐5.8% 55
West Albury Albury Unit 20 $224,000 14.9% 7.4% $210 4.9% n.a. n.a.
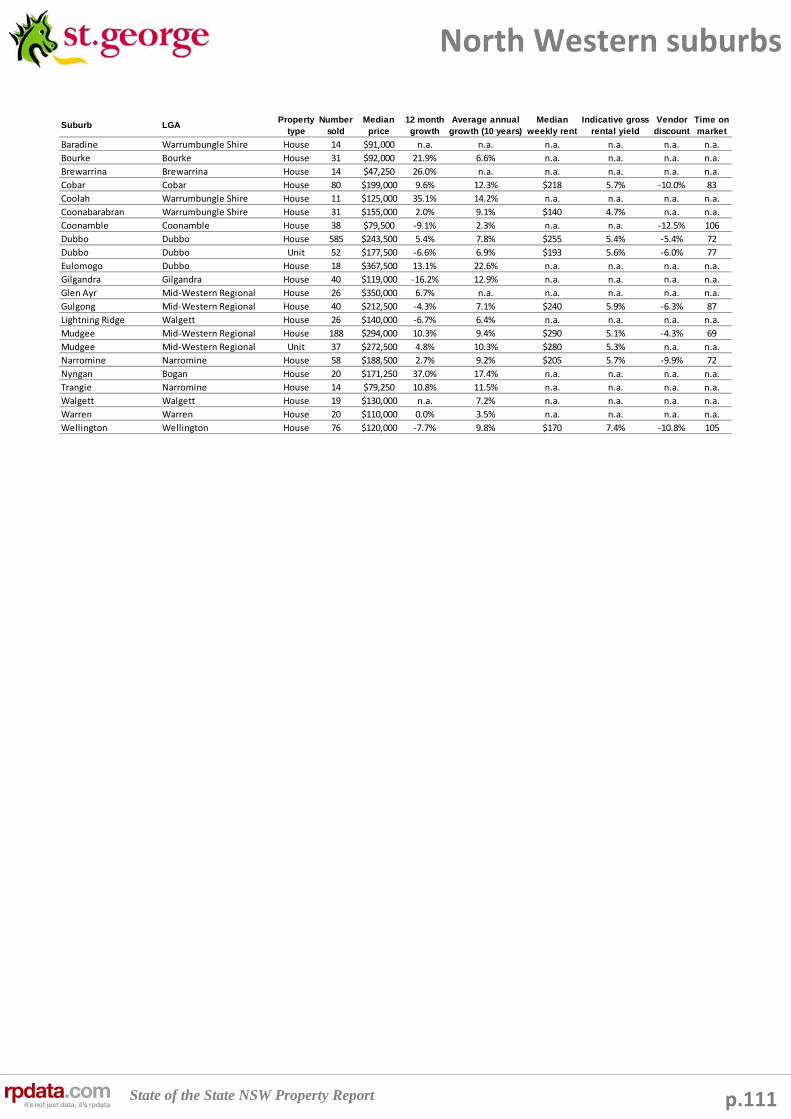
State of the State NSW Property Report p.111
North Western suburbs
Suburb LGAProperty
typeNumber
soldMedian
price12 month growth
Average annual growth (10 years)
Median weekly rent
Indicative gross rental yield
Vendor discount
Time on market
Baradine Warrumbungle Shire House 14 $91,000 n.a. n.a. n.a. n.a. n.a. n.a.
Bourke Bourke House 31 $92,000 21.9% 6.6% n.a. n.a. n.a. n.a.
Brewarrina Brewarrina House 14 $47,250 26.0% n.a. n.a. n.a. n.a. n.a.
Cobar Cobar House 80 $199,000 9.6% 12.3% $218 5.7% ‐10.0% 83
Coolah Warrumbungle Shire House 11 $125,000 35.1% 14.2% n.a. n.a. n.a. n.a.
Coonabarabran Warrumbungle Shire House 31 $155,000 2.0% 9.1% $140 4.7% n.a. n.a.
Coonamble Coonamble House 38 $79,500 ‐9.1% 2.3% n.a. n.a. ‐12.5% 106
Dubbo Dubbo House 585 $243,500 5.4% 7.8% $255 5.4% ‐5.4% 72
Dubbo Dubbo Unit 52 $177,500 ‐6.6% 6.9% $193 5.6% ‐6.0% 77
Eulomogo Dubbo House 18 $367,500 13.1% 22.6% n.a. n.a. n.a. n.a.
Gilgandra Gilgandra House 40 $119,000 ‐16.2% 12.9% n.a. n.a. n.a. n.a.
Glen Ayr Mid‐Western Regional House 26 $350,000 6.7% n.a. n.a. n.a. n.a. n.a.
Gulgong Mid‐Western Regional House 40 $212,500 ‐4.3% 7.1% $240 5.9% ‐6.3% 87
Lightning Ridge Walgett House 26 $140,000 ‐6.7% 6.4% n.a. n.a. n.a. n.a.
Mudgee Mid‐Western Regional House 188 $294,000 10.3% 9.4% $290 5.1% ‐4.3% 69
Mudgee Mid‐Western Regional Unit 37 $272,500 4.8% 10.3% $280 5.3% n.a. n.a.
Narromine Narromine House 58 $188,500 2.7% 9.2% $205 5.7% ‐9.9% 72
Nyngan Bogan House 20 $171,250 37.0% 17.4% n.a. n.a. n.a. n.a.
Trangie Narromine House 14 $79,250 10.8% 11.5% n.a. n.a. n.a. n.a.
Walgett Walgett House 19 $130,000 n.a. 7.2% n.a. n.a. n.a. n.a.
Warren Warren House 20 $110,000 0.0% 3.5% n.a. n.a. n.a. n.a.
Wellington Wellington House 76 $120,000 ‐7.7% 9.8% $170 7.4% ‐10.8% 105

State of the State NSW Property Report p.112
Far West suburbs
Suburb LGAProperty
typeNumber
soldMedian
price12 month growth
Average annual growth (10 years)
Median weekly rent
Indicative gross rental yield
Vendor discount
Time on market
Broken Hill Broken Hill House 223 $110,000 ‐12.0% 13.9% $180 8.5% ‐13.2% 98

State of the State NSW Property Report p.113
Disclaimers
Disclaimers
© 2010 Copyright RP Data Ltd, Local, State, and Commonwealth Governments. All rights reserved. No reproduction, distribution or transmission of the copyrighted materials in this publication is permitted whether in whole or in part.
The information provided in this publication is current as at the publication date only. This publication is supplied on the basis that while rpdata.com believes all the information in it is deemed reliable at the publication date, it does not warrant its accuracy or completeness and to the full extent allowed by law excludes liability in contract, tort or otherwise, for any loss or damage sustained by yourself, or by any other person or body corporate arising from or in connection with the supply or use of the whole or any part of the information in this publication through any cause whatsoever and limits any liability it may have to the amount paid to rpdata.com for the supply of such information.
This publication provides general information only – it is not intended as advice and should not be relied upon as such. The material has not been prepared by taking into account your investment objectives, financial situation or personal needs. You should make your own inquiries and if necessary take independent financial advice tailored to your specific circumstances before making any investment decisions.
Contains property sales information provided under licence from the Department of Lands NSW.
St.George Bank – A Division of Westpac Banking Corporation ABN 33 007 457 141 AFSL 233714 accepts no responsibility for the accuracy or completeness of this publication.
Related Documents


![Immunopathogenesis of SARS-CoV-2-induced pneumonia ...€¦ · infection followed by TNF-α and IL-8 peaked at PID 4 [7]. Similarly, serum IL-6 peaked at 2days after infection. Body](https://static.cupdf.com/doc/110x72/61429651d9e4dc11f47f24f2/immunopathogenesis-of-sars-cov-2-induced-pneumonia-infection-followed-by-tnf-.jpg)