TRANSPORTATION RESEARCH RECORD 1128 State of the Road Networks Countries and a o·u try ' • Ill p eveloping ogy of Response Meas res ASIF FAIZ, CLELL HARRAL, AND FRIDA JOHANSEN An overview of the status of the road networks in 85 develop- ing countries is presented. A broad-brush assessment of the condition of main roads in these countries is followed by an analysis of regional differences and the factors contributing to these differences. These factors have been grouped into coun- try typology consisting of six categories. Although it is not scientifically precise, this classification is useful in explaining the regional and country differences In road condition, under- standing the causes of the road deterioration problem in de- veloping countries, and formulating appropriate responses to the problem. This paper is the first of four papers In this Record on "Road Deterioration in Developing Countries." The road-building boom in developing countries during the 1960s and 1970s has not been matched by a comparable invest- ment in follow-up maintenance and restoration, and the de- bilitation as a result of neglect has been aggravated by increas- ing and heavier traffic use. Much too small a share of resources available for roads has been used for maintaining existing roads, and even that small share has seldom been applied effectively. The result today in many developing countries is a network of deteriorating roads, many of them beyond the stage at which normal maintenance measures can be effective, and rehabilitation or reconstruction is required at a cost three to five times what it would have been if preventive maintenance and strengthening had been done in time. A much larger mileage will soon reach that stage if not maintained better than in the past. For many countries, it may already be well beyond their financial means to correct the deficiencies in their road in- frastructure. The growing problems of road deterioration, func- tional obsolescence, and insufficient capacity to serve future growth have converged at a time when severe budgetary con- straints are forcing governments to reassess spending priorities and make difficult investment and expenditure choices from among the many competing claims on available resources. The increase in costs to the road authorities is only a fraction of the overall burden resulting from deteriorating roads. Vehi- cle operating costs on properly maintained roads account for some 80 to 90 percent of the total road transport cost except in extremely low traffic. On bad roads, vehicle operating costs (largely in foreign exchange) can easily double, imposing a heavy burden on road users. The higher road haulage costs can constrain the location of economic activities, hamper the integration of economic markets, limit the gains from special- Transportation Department, World Bank, 1818 H St., N.W., Wash- ington, D.C. 20433. Consequences of Road Neglect in Ghana Road deterioration can make an economic crisis worse. In Ghana a good road network was built before 1970, but it later suffered from serious neglect. By 1984, about 60 percent of the main paved roads were in a state of moderate to severe deterioration. Important sections have become almost im- passable, and access to some interior areas has been severely curtailed. Transporters refuse to go there because they do not want their vehicles to break down. Transport costs have increased in real terms by about SO percent on main roads and by more than 100 percent on rural roads that have suffered even greater neglect. In many areas, the market rate for transporting fertilizer is as high as a dollar per ton-mile. These high transport costs have cut deeply into farm returns, particularly for poor farmers in areas away from main roads: some villagers can no longer move their cocoa stocks to regional depots. During the 1982-1983 famine, poor roads prevented the transport of food from surplus areas to areas facing starvation. The high transport costs have also hit the timber industry. Logs moving from the Kumasi area for export through the Takoradi port are trucked over a 500- km route because the direct road, which is about half as long, is broken down and the rail services are unreliable. The detour adds $15 to $20 (U.S. dollars) for each ton of logs exported. The prospects are not encouraging. Road resurfacing and strengthening covers only about 20 percent of estimated an- nual needs of about $47 million, mainly for resealing 1100 km of paved roads and regraveling 1600 km of unpaved roads. Even with a recent road maintenance project supported by the World Bank, maintenance will increase to only about 30 percent of that needed by 1989. Unless more resources can be put into road maintenance--and applied effectively- deterioration will continue. Ultimately the network will re- quire far more costly rehabilitation, if financed, or result in an almost total collapse of road transport. ization, and render many transport-intensive activities nonvia- ble. Continued deterioration of road networks can lead to chronic transportation bottlenecks that inevitably erode the productive base of the economy and result in major economic dislocation (see box "Consequences of Road Neglect in Ghana"). Although neglect of maintenance may be commonplace in other sectors of the economy and in other transport modes, it is particularly acute for roads for at least three reasons: • Because of the large magnitude of the costs and financial requirements involved, the expenditures now needed to make

Welcome message from author
This document is posted to help you gain knowledge. Please leave a comment to let me know what you think about it! Share it to your friends and learn new things together.
Transcript

TRANSPORTATION RESEARCH RECORD 1128
State of the Road Networks Countries and a o·u try '
• Ill
p eveloping
ogy of Response Meas res
ASIF FAIZ, CLELL HARRAL, AND FRIDA JOHANSEN
An overview of the status of the road networks in 85 developing countries is presented. A broad-brush assessment of the condition of main roads in these countries is followed by an analysis of regional differences and the factors contributing to these differences. These factors have been grouped into country typology consisting of six categories. Although it is not scientifically precise, this classification is useful in explaining the regional and country differences In road condition, understanding the causes of the road deterioration problem in developing countries, and formulating appropriate responses to the problem. This paper is the first of four papers In this Record on "Road Deterioration in Developing Countries."
The road-building boom in developing countries during the 1960s and 1970s has not been matched by a comparable investment in follow-up maintenance and restoration, and the debilitation as a result of neglect has been aggravated by increasing and heavier traffic use. Much too small a share of resources available for roads has been used for maintaining existing roads, and even that small share has seldom been applied effectively. The result today in many developing countries is a network of deteriorating roads, many of them beyond the stage at which normal maintenance measures can be effective, and rehabilitation or reconstruction is required at a cost three to five times what it would have been if preventive maintenance and strengthening had been done in time. A much larger mileage will soon reach that stage if not maintained better than in the past. For many countries, it may already be well beyond their financial means to correct the deficiencies in their road infrastructure. The growing problems of road deterioration, functional obsolescence, and insufficient capacity to serve future growth have converged at a time when severe budgetary constraints are forcing governments to reassess spending priorities and make difficult investment and expenditure choices from among the many competing claims on available resources.
The increase in costs to the road authorities is only a fraction of the overall burden resulting from deteriorating roads. Vehicle operating costs on properly maintained roads account for some 80 to 90 percent of the total road transport cost except in extremely low traffic. On bad roads, vehicle operating costs (largely in foreign exchange) can easily double, imposing a heavy burden on road users. The higher road haulage costs can constrain the location of economic activities, hamper the integration of economic markets, limit the gains from special-
Transportation Department, World Bank, 1818 H St., N.W., Washington, D.C. 20433.
Consequences of Road Neglect in Ghana
Road deterioration can make an economic crisis worse. In Ghana a good road network was built before 1970, but it later suffered from serious neglect. By 1984, about 60 percent of the main paved roads were in a state of moderate to severe deterioration. Important sections have become almost impassable, and access to some interior areas has been severely curtailed. Transporters refuse to go there because they do not want their vehicles to break down.
Transport costs have increased in real terms by about SO percent on main roads and by more than 100 percent on rural roads that have suffered even greater neglect. In many areas, the market rate for transporting fertilizer is as high as a dollar per ton-mile. These high transport costs have cut deeply into farm returns, particularly for poor farmers in areas away from main roads: some villagers can no longer move their cocoa stocks to regional depots. During the 1982-1983 famine, poor roads prevented the transport of food from surplus areas to areas facing starvation. The high transport costs have also hit the timber industry. Logs moving from the Kumasi area for export through the Takoradi port are trucked over a 500-km route because the direct road, which is about half as long, is broken down and the rail services are unreliable. The detour adds $15 to $20 (U.S. dollars) for each ton of logs exported.
The prospects are not encouraging. Road resurfacing and strengthening covers only about 20 percent of estimated annual needs of about $47 million, mainly for resealing 1100 km of paved roads and regraveling 1600 km of unpaved roads. Even with a recent road maintenance project supported by the World Bank, maintenance will increase to only about 30 percent of that needed by 1989. Unless more resources can be put into road maintenance--and applied effectivelydeterioration will continue. Ultimately the network will require far more costly rehabilitation, if financed, or result in an almost total collapse of road transport.
ization, and render many transport-intensive activities nonviable. Continued deterioration of road networks can lead to chronic transportation bottlenecks that inevitably erode the productive base of the economy and result in major economic dislocation (see box "Consequences of Road Neglect in Ghana").
Although neglect of maintenance may be commonplace in other sectors of the economy and in other transport modes, it is particularly acute for roads for at least three reasons:
• Because of the large magnitude of the costs and financial requirements involved, the expenditures now needed to make

2
up for past orruss1ons of preventive maintenance in subSaharan Africa are at least 10 times as much as would be needed to provide a continuing supply of textbooks for all elementary school children in the region until year 2000.
• The nonlinear progression of deterioration on roads renders it difficult to recognize the need for preventive maintenance before it is too late to avoid more expensive corrective measures;
• The agency responsible for road maintenance is usually nol tlire1.:Lly exposed to, and hence is unlikely to be sensitive to, the economic consequences of undermaintenance of roads or organized pressure for better roads.
The purpose of this paper is to provide an overview of the status of roads in 85 developing countries that have received World Bank assistance for roads ($9.4 billion during 1974-1985). Following a discussion of the general characteristics of the road networks, regional differences in road condition are analyzed and factors contributing to these differences are grouped into a country typology to (a) help explain the differences in road condition across countries, (b) understand the causes of the road deterioration problem, and (c) identify appropriate responses to the problem as discussed by Bhandari et al., Smith and Harral, and Harral elsewhere in this Record.
ROAD NETWORKS
The main roads in the 85 developing countries comprise the primary and secondary road systems as defined or enumerated in government road classifications. The aggregate length of the main road systems in the 85 countries is about 1.8 million km. of which slightly more than 1.0 million km are paved. The main roads carry about 70 to 80 percent of the interurban traffic.
The tertiary network and all unclassified roads are not included, because road classification practices differ considerably from country to country and data on the geographical distribution and condition of these lower-order roads are Jess reliable. Much of the tertiary network in developing countries consists of unpaved roads with light, low-volume traffic. The ratio of maintenance to construction costs on these roads is fairly high, and neglect of maintenance has an immediate and more severe impact on service performance (user costs) than on the physical condition of the road. Urban road systems are also excluded because their traffic and maintenance characteristics and related deterioration problems are of a different nature.
Without detailed road inventories and country-specific construction costs, it is difficult to assess the value of the road stock with precision. Value assessments of national road stocks are not commonly available. In a report prepared by the U.K. National Development Office (1), the gross replacement value of the entire U.K. road stock in 1982, including the plant and equipment owned by central and local road authorities, was estimated at about £38 billion ($50 billion, U.S. dollars). The deficiencies in the system as compared with a brand new system were estimated at about £10 billion ($13 billion, U.S. dollars) or 26 percent of the replacement value.
The replacement value of the main roads in the 85 developing countries is estimated at about $300 billion, excluding the value of land, major earthworks, and bridges. (This estimate is based on generalized average costs per kilometer presented in
TRANSPORTATION RESEARCH RECORD 1128
Table A-1 in the Appendix). This is roughly the same asset base as that for electric power generation and distribution in these countries.
In addition, there are another 5 to 6 million km of mostly unpaved, low-volume local roads and tracks (the tertiary system) with a replacement value of perhaps $75 to $100 billion. This overview deals primarily with main road networks, partly because they comprise the most important and valuable roads, and partly because information on other roads is too fragmentary.
There are significant differences in the coverage and quality of the road networks across the 85 countries. To illustrate, the coverage of main roads ranges from some 250 000 km in China to 760 km in Comoros, and four countries-China, India, Brazil, and Mexico--account for 51 percent of the total road kilometerage, 40 percent of main roads and 45 percent of paved roads. The differences emerging from aggregating the country data by geographic regions are equally striking as summarized in Table 1. The regional classification used in this paper reflects the geographic grouping of countries by the six operational regions of the World Bank, namely Eastern and Southem Africa (ESA); Western Africa (WA); East Asia and Pacific (EAP); South Asia (SA); Europe, Middle East, and North Africa (EMENA); and Latin America and Caribbean (LAC). See Figure 1 for a geographical demarkation of the regions. More detailed regional data are presented in Table A-1 and countryspcci fic information is presented in Table A-2 in the Appendix.
Sub-Saharan Africa has the lowest area density km/100 km2
of roads-about one-half of the global average for developing countries-whereas road length per 1,000 persons is about twice that for Asia. The ratio of road kilometers per million dollars of gross national product (GNP) (the market value of the final output of goods and services claimed by the residents of a country in a year) is the highest of all regions. The World Bank uses estimates of GNP as the main yardstick of economic activity in a country (2, 3 ). These figures reflect the vast distances, the dispersed settlement patterns, and the smaller economic base of sub-Saharan Africa. Compared with other regions, a smaller proportion of main roads in sub-Saharan Africa is paved, but this is a reflection of lower traffic volumes on sub-Saharan road networks. In terms of the total road network, however, Latin America and Caribbean is observed to have a similar proportion of paved roads as Western Africa, suggesting that roads in sub-Saharan Africa may have been paved at lower traffic thresholds than in LAC. The Asian regions have the lowest road length per 1,000 population, reflecting the high population densities and spatial concentration of economic activity. These regions (except India) also have the lowest road density per million dollars of GNP, pointing to the hitherto Jess dominant role of modem road transport and the comparatively less developed state of roads relative to income levels. The Europe, Middle East, and North Africa region (which excludes all European countries except Hungary, Poland, Portugal, Romania, Turkey, and Yugoslavia) has the highest area density of main roads, a high ratio of road length per 1,000 population, a low road density per million dollars of GNP, and the highest percentage of paved roads, reflecting the relatively mature development of road networks relative to characteristics of the road networks in LAC are similar to their economies, in most countries of this region. The aggregate characteristics of the road networks in LAC are

Faiz el al. 3
TABLE 1 REGIONAL AND ROAD NElWORK CHARACTERISTICS, 1984
Sub-Saharan Africa Asia Other
Europe, Eastern and Southern Africa
Western Africa
East Asia and Pacific
South Asia
Middle East, and North Africa
Latin America and Caribbean
Population and Economic Activity No. of countries 19 20 Area (million km2
) 11.1 8.9 Population (million) 201 186 Population density (persons/km2
) 18 21 GNP (1984 billion U.S. dollars) 51 105 GNP/capita (1984 U.S. dollars) 310 290 Growth in GNP/capita (1975-1985), percent --0.1 -1.0
Road Network (thousand km) All roads 588 430 Main roads 191 145
Replacement Value of Main Roads (1984 billion U.S. dollars) 18 17 Percent of GNP 35 16
similar to those of EMENA, except for one major difference: about 11 percent of the total road network in LAC is paved compared with 29 percent in EMENA and 31 percent in South Asia (although much of the road network in the Indian subcontinent is not suitable for modem road transport).
The regional differences in road density also reflect other factors: evidence suggests that some roads in sub-Saharan Africa have been expanded for social and political reasons beyond the levels needed to sustain economic growth. In East Asia and Pacific, motorized road transport is only now beginning to emerge as a dominant transport mode, and the extensive South Asian networks represent a legacy of road building spanning centuries.
CONDITION OF THE MAIN ROAD NETWORKS
In this study the basic information on road networks and their condition was pieced together from more than 150 internal
TABLE 2 CONDITION OF MAIN ROADS
7 6 14 19 13.2 5.1 6.5 18.9 1,350 1,008 232 350 102 197 36 19 600 258 338 583 710 220 1,795 1,190 3.4 2.4 3.1 --0.03
1,540 1,681 1,051 2,212 451 217 304 512
90 33 66 76 15 13 20 13
World Bank documents (e.g., transport sector reviews, project appraisal reports, and consultant studies), which are classified and not available for general public distribution. This information was supplemented by data from standard references on road statistics (4-6). Although the assessment of road conditions is subject to considerable error because of lack of reliable data, available evidence is good enough to gauge the broad dimensions of the problem. On the basis of information from recent surveys (7, 8), supplemented as necessary by the judgment of World Bank highway engineers, the conditions of the main road of a country have been categorized as good, fair, and poor. A road in good condition requires only normal maintenance in the short term. Fair condition connotes the need for early resurfacing or strengthening. A road in poor condition has already deteriorated to the point that reconstruction, either partial or extensive, is required.
Road conditions in different countries (Table A-2) assessed in the preceding terms were combined into regional averages, weighted by network lengths. The regional figures (Table 2) are
Paved Unpaved
Region
Eastern Africa Western Africa East Asia South Asia Europe, Middle East, and North Africa Latin America and Caribbean Average
United States {federal-aid network, 1981 (10, pp. 20-2l)]a United Kingdom (trunk road system, 1983)b
Good Fair
42 32 52 23 20 59 18 45 40 35 44 32 32 42 31 57 85 12
Poor Good Fair Poor
26 42 30 28 25 20 36 44 21 41 34 25 36 6 39 55 25 30 46 24 24 24 43 33 26 31 36 32 12 3
NoTES: As reported in an intemol World Bank survey of 85 countries hosed os faros possible on published pavement condition information (60 countries) and supplemented where necessary by the judgment of bank highway engineers. Paved roads were assessed os follows: good-substantially free of defects and requiring only routine maintenance; fair--4;ignificant defects, requiring resurfacing or strengthening; and poor-extensive defects, requiring reconstruction or mojor rehabilitation. Gravel roads were ossessed as follows: good-needing only routine grading or spot regraveling; fair-needing regraveling or reshaping, and spot repair of drainage; and poor-needing reconstruction and major drainage worlcs.
"The condition dota are hosed on serviceability ratings and qualitative definitions used by the Federal Highway Administration. A poor road is one that requires immediate resurfacing or complete reconstruction, a road in fair condition suggests the need for resurfacing in the near future, and a good road is one that does not require immediate resurfacing or reconstruction.
/JllllSCd on residual llfo con<;!'pt- 15 percent with a residual life of Jess than 5 years (before strengthening is likely to be needed), 25 percent with a residual life of less than 10 years, and 60 percent with a residual life of more than 20 years (1, p. 9). Assuming a uniform age distribution, these data would roughly conform to 85 percent good, 12 percent fair, and, at most, 3 percent poor, using the qualitative definitions employed by the FHWA and ossmning that the near future is within the next 5 years.

~---~ .•
~~
·-:~~~~ - .;;r ~~·~-=-~~ ,,,~-~ ..-::--·, ~:~-~ ..... 1~~ ·_:.- , --~ _,.._ -, tS' = . -·- ··::--~ ~ ~ ( ~ "'""-::;)
v.~~J ~ ·--. z:,a?. _Jl .
~.
Jr 9
.1.: 1 .... ~ .. "' -
\_
'<_\\---·.\~'\., d\·- I ·. '!%· .. · v _, ~'!:', ' vl .. _,_.
" f'f,, . -- ....--!
~~{ ··~ "'i"'-- '"\ ·. '<.::.<.."· ' '
) ... (
, J
~\
~
'\.
r,.
'\
...........
"
~ "' ··~, ..
. ;~
.J..,__
' ·-,
~.:J .... ,,,._,:.:::,... ... --:
- •. ;; ,r~ t\ ~, , ~ ' I _, \
~., ·v--·~
(\ f
•
~- ';'"
"'. '' L .. ':\,.. ,..... ~
'
r-.}
"f'1
J·~.s ,h (""'.> { l
/'\ I'
.. ,
EAST AND SOUTH AFRICA ·:i SOUTH ASIA
~"' WEST AFRICA EAST ASIA At~D PACIFIC
~
:~;.:.:.~.{~~ EUROPE, MIDDLE EAST AND "lORTH AFRICA
LATIN AMERICA AND CARIBBEAN
FIGURE 1 Geographical demarkation of World Bank's operational regions.
.... ---.... "-l·
,1,..,_:,
j-,.. ·:: # .. ,, • -~ \
i..- ~- _,. . . ~~ \
,, ,, ~~
,,.., ...
? \
~
-=~~. k.~: ~ fll~t,
- .. ·':.ltrl, ..... ~!! --.:;:;.
~,.
,.;..
e..:
"'
v.:.
,, ,c '·
-~
~
. ..
)Jt ,2-
... "

Faiz et al.
alarming on two counts. First, more than one-fourth of paved roads (some 267 000 km) are already in poor condition and a majority of these need rehabilitation or reconstruction. Second, and of even greater concern, the heavy concentration (42 percent) of paved roads in the fair category (about 430 000 km) foreshadows a crisis of major proportions, unless concerted efforts are made soon to prevent the descent of these roads into poor condition. For comparison, less serious levels of deterioration on the federal-aid highway network in the United States during the 1970s (12 percent poor as opposed to 26 percent in developing countries) prompted widespread alarm, the introduction of new legislation, new user taxes, and a large infusion of federal and state resources in the 1980s to remedy the situation (9-11). In Maryland and Virginia at that time all road funds were required to be used for maintenance to the exclusion of new construction (see box "U.S. Experience During the 1970s").
The condition of unpaved roads in the main networks in developing countries is even worse (12). In terms of road authority finances, the timing of maintenance for unpaved roads is less critical because the costs of restoration are, within rather broad limits, less sensitive to the timing of intervention. However, the aggregate effect of deterioration on vehicle operating costs can be quite large. Although unpaved roads normally carry less traffic, the riding condition of an unpaved road that is not maintained deteriorates much faster than a paved road. Deferral of simple maintenance measures (e.g., routine blading) on unpaved roads results in a rapid increase (as much as 100 percent) in vehicle operating costs.
Considerable variation exists in the conditions of roads in different regions and countries, which is explained by differences in the past maintenance needs of individual networks on the one hand and in the countries' responses to those needs on the other. A regional overview of the road conditions is presented in the following section.
U.S. Experience During the 1970s
The consequences of neglecting road maintenance are demonstrated by the U.S. experience during the 1970s. Ne~ed maintenance on the federal-aid highway system was deferred or canceled by state agencies faced with budget constraints arising from the energy crisis and sharp recession beginning in 1974-1975. Because federal funds were not available for maintenance and rehabilitation, many states chose to let their roads, bridges, and highways deteriorate until they became eligible for capital federal aid for reconstruction. By 1982, the escalating deterioration of the federal aid highways, particularly the Interstate system, required a 44 percent increase in annual federal authorizations from $9 billion (in 1982) to $13 billion over the 1983-1990 period to help finance the repair and replacement of various components of the federal-aid system. The total cost of this restoration was estimated at $104.8 billion: Interstate highways, $19.6 billion; primary, secondary, and urban systems, $44.7 billion; and bridges, $40.5 billion. Although the United States may be able to mobilize such a massive level of resources to rehabilitate its road infrastructure, the less developed countries can ill afford this type of response.
5
Sub-Saharan Africa
At present, paved roads in Western Africa are generally found to be in better condition than in most other regions: 52 percent are considered good, 23 percent fair, and 25 percent poor. In Eastern and Southern Africa conditions are more typical: 42 percent good, 32 percent fair, and 26 percent poor. The relatively better condition of the paved roads in Western Africa is largely due to the rapid expansion of the paved networks during the last 10 years-about 50 percent of the paved road network in Western Africa was newly constructed, upgraded, or reconstructed during the last decade. Ivory Coast and Nigeria (see box "Nigeria's New Roads and the Risk of Massive Deterioration") substantially rebuilt their paved networks after 1975. Nigeria financed the effort by increased income from oil revenues. Even in less-endowed countries there has been a rapid improvement of road networks in the past decade financed by external-aid agencies. In Burundi, an Eastern African example, the length of the paved network has increased by more than 50 percent since 1979, whereas gravel roads have increased fourfold. Of 20 Western African countries for which information is available, 15 have networks with relatively new roads. The proportion at 10 out of 16 is not significantly lower for Eastern and Southern Africa. Many African countries are still enjoying an initial grace period during which maintenance requirements are minimal for much of their paved networks.
Nigeria's New Roads and the Risk of Massive Deterioration
The Nigerian Federal Trunk Road System, which has a total length of 29 000 km, has been largely rebuilt since 1975 in response to the explosive growth in road traffic following the economic expansion triggered by the increase in oil prices in 1973-1974. Traffic increases of 15 to 35 percent per annum were not uncommon on the federal network until 1978. Of the 21 000 km of paved roads, about 7600 km (36 percent) were constructed or rehabilitated during 1975-1980 and another 5000 km (24 percent) during 1981-1985. As a result, 62 percent of the paved network has been virtually abandoned because of ineffective maintenance, and an estimated 90 percent is in poor condition.
Despite the remarkable expansion and improvement of the Nigerian trunk road system during the last 10 years-at an estimated expenditure of about $8 billion-its condition is still precarious. The design standards used in road improvement and construction works have tended to encourage the use of generous geometric features but weak pavements, which require substantial strengthening within 3 to 4 years after initial construction to ensure continued use of the roads. In addition, a substantial part of the network has been improved under short-term emergency rehabilitation programs, which consist of a minimum of works necessary to make the roads serviceable. Without an extensive pavement strengthening program covering about 2000 to 3000 km a year at an estimated annual expenditure of $150 to $200 million and a concerted effort to improve maintenance, the Nigerian trunk road system may deteriorate rapidly, requiring massive rehabilitation and reconstruction in the next 10 to 15 years.

6
The continuous expansion and upgrading of the networks has masked serious weaknesses in road maintenance in many African countries; this holds serious portent. Gravel and earth roads deteriorate more quickly from maintenance neglect than paved roads; this is already reflected in the relatively poor condition of the main unpaved networks, particularly in Western Africa, with 20 percent good, 36 percent fair, and 44 percent poor.
East Asla and Pacific
The relatively poor state of East Asian paved networks (20 percent good, 59 percent fair, and 21 percent poor) primarily reflects conditions in three large countries: Indonesia, the Philippines, and China. China has not neglected maintenance; rather the existing 173 000-km paved network is woefully inadequate for the current demands placed on it, not only in terms of low spatial road density in the country's more densely populated regions, but also in terms of the structural and traffichandling capacity of the network. Because of the expansion of the network in the 1970s, and also because many roads were built with inferior materials as a result of earlier difficulties in obtaining good quality bitumen in China, currently 70 percent of the existing main paved network is in need of resurfacing or strengthening. A substantial portion of the network requires not only structural strengthening but also substantial geometric improvements to cope with anticipated traffic growth. Other countries in East Asia, particularly Korea, Thailand, and Malaysia, have also experience.cl high growth, and have invested heavily in the expansion and improvement of their road networks. They are still enjoying the initial period when paved road maintenance demands are minimal, but will require a substantial expansion of road maintenance capacity to cope with future needs. The unpaved main roads in East Asia are in relatively better condition (41 percent good, 34 percent fair, and 25 percent poor) compared with other regions, possibly because of the higher traffic on these roads and consequently more intensive levels of maintenance.
South Asia
Current road conditions are by far the worst in South Asia. Only 18 percent of the paved main network is rated in good condition whereas 36 percent is in poor condition. Unpaved roads are in worse shape: no more than 6 percent are in good condition, and fully 55 percent are in poor condition. The regional aggregates are dominated by the large Indian networks (federal and state) of some 127 000 km, but conditions are not too dissimilar in other countries in the region, except Nepal whose small network is still relatively new. The pronounced deterioration in the South Asian networks is a result of the sustained growth in road transport over the last decade (without a commensurate level of investments in road infrastructure) and a shift of passenger and goods traffic from other modes to roads. The road networks consist mainly of aging and obsolete roads that have neither the geometric capacity nor the structural strength to carry the increasing traffic and vehicle loads. Poor quality construction and outmoded maintenance methods have not helped the situation. The critical need at this time is not so much restoration and maintenance as it is replacement and upgrading of an antiquated road infrastructure. To sustain its
TRANSPORTATION RESEARCH RECORD 1128
Pakistan's Deficient Road Infrastructure
The main road network in Pakistan comprising the national and provincial highways amounted to some 45 000 km in 1983. Nearly 30 000 km are now paved compared with 8000 km at the time of independence in 1947. The main road network, together with about 49 000 km of district roads and 11 000 km of municipal roads, provides extensive coverage, but the quality of roads is deficient and in need of substantial improvement. Most of the paved road system has inadequate geometric characteristics, particularly road width, and only 1500 km of national and provincial highways have two lanes or more. The structural condition of the roads is no better. Nearly 32 percent of the paved main roads and 70 percent of unpaved roads were estimated to be in poor condition in 1984.
The rapid growth in traffic (averaging about 11 to 13 percent per annum during the past 10 years), the high proportion of heavy-laden trucks, inadequate planning and management of highway development, insufficient road maintenance, deficient design and construction standards, and obsolete construction technology have all contributed to the poor and deteriorating condition of roads in Pakistan.
To cater to the growing demand for road transport, which has now replaced rail as the dominant transport mode and accounts for 80 to 90 percent of nonurban passenger traffic and 70 percent of freight traffic, Pakistan now needs to undertake a major program of road modernization and upgrading. This will not be an easy task, because the domestic road-building capacity using modem road construction technology amounts to about 15 to 25 km of highway per month. Bad roads are likely to impede the introduction of efficient and economical road transport technology in Pakistan. Eventually they could seriously constrain the country's development and economic growth prospects.
recent rate of economic growth, South Asia now faces the need for a large road-building program (see box "Pakistan's Deficient Road Infrastructure").
Europe, Middle East, and North Africa
In this region the main networks are well developed and, for the most part, so are maintenance institutions. However, the mature age profile of the networks implies higher maintenance requirements, which, combined with budgetary constraints in some countries (e.g., Yugoslavia and Morocco), has resulted in a road condition mix of 40 percent good, 35 percent fair, and 25 percent poor, with corresponding values for the unpaved network of 30 percent good, 46 percent fair, and 24 percent poor, respectively. Although conditions have improved for the region as a whole, the situation in some countries has deteriorated over the past 5 years. Most conspicuous is Yugoslavia, whose paved network, formerly one of the better maintained of the developing countries, has slipped because of unusually severe budgetary constraints to 30 percent good condition, 41 percent fair, and 29 percent poor. In the Republic of Croatia, for example, the periodic maintenance backlog was estimated at 40 percent of the network in 1985-1986 and was growing at the rate of about 13 percent (700 km) annually. Morocco's paved

Faiz et al.
network is in even worse condition, with a current condition distribution of 20 percent good, 44 percent fair, and 36 percent poor. The need for immediate action is particularly striking in Yemen People's Democratic Republic where fully 69 percent of the paved network is now in fair condition.
Latin America and Caribbean
On average, current road conditions in the Latin American Region are still relatively good (44 percent good, 32 percent fair, and 24 percent poor for paved roads), but striking variations across countries and across time are concealed. Latin America contains two countries in which the condition of the paved networks approaches the condition distribution of wellmaintained networks: Paraguay (with an estimated 73 percent of roads in good condition, 22 percent fair and 5 percent poor), and, most important, the Mexican federal network of more than 40 000 km (85 percent good, 10 percent fair, and 5 percent poor). However, the region also has countries (Bolivia, Costa Rica, Guatemala, Haiti, Jamaica, and Peru) where only onefourth or less of main paved roads are in good condition. The condition of main paved roads are especially bad in Guatemala (7 percent in good condition. 50 percent fair, and 43 percent poor) and Jamaica (10 percent good, 75 percent fair, and 17 percent poor). Unpaved roads, which constitute about 51 percent of the main roads in Latin America, are worse than the average in Peru, Haiti, Belize, Bolivia, Jamaica, Argentina, and Costa Rica. Traffic levels on some of these roads, however, are quite low (10 to 20 vehicles per day) and substantial improvements in road conditions may not be warranted.
Road conditions in Latin America and the Caribbean as a whole have recently worsened quite rapidly, mirroring the general economic downturn and accompanying financial stringencies over the past 5 years-this illustrates how quickly roads can deteriorate once they reach the critical stage in their life cycle. Brazil with by far the largest network in Latin America has seen serious erosion despite substantial maintenance efforts. In 1984, 28 percent of the network was reported in poor condition compared with 18 percent in 1979 (see box "A Case of Undermaintenance: Brazil's Federal Highway Network"). In Honduras, which in the past had devoted an adequate level of effort and resources to road maintenance, the deterioration has been even more dramatic, with the percentage of the paved road network in good condition dropping from 82 percent in 1981 to 50 percent in 1984, largely because of financial constraints. The large decline in road condition may partly reflect differences in condition measurement and evaluation over the 2 years.
DETERMINANTS OF ROAD CONDITIONS
The condition of road networks, at both global and regional levels, point to a serious neglect of maintenance in all but a handful of countries. Most countries that currently enjoy relatively good road conditions-particularly within the subSaharan Africa, Latin America, and East Asia regions--do so largely because of recent large additions to their networks and because such roads have not yet reached the end of their design lives--older roads in their networks have already deteriorated.
A Case of Undermalntenance: Brazil's Federal Highway Network
A 1979 survey of Brazil's federal highway network showed the following distribution of road conditions:
Condition km %
Good 10 000 24 Fair 23 000 58 Poor 7 000 18 Total 40 000
Restoring all roads at that time would have cost $1.8 billion (1985 prices). A repeat survey in 1984 rated the network as follows:
Condition km %
Good 14 000 30 Fair 19 000 42 Poor 13 000 28 Total 46 000
The increase in the percentage of roads in good condition resulted from new construction not good maintenance: 6000 km of new paved roads were constructed, whereas 2000 km of those formerly in good condition declined to fair condition. Nor did the massive backlog of roads in fair condition receive the resurfacing and strengthening that was needed. Some 6000 km of that group deteriorated to poor condition, greatly increasing the number of kilometers and the percentage of roads needing rehabilitation rather than just maintenance. The cost of this rehabilitation is estimated at $1.7 billion, and the cost of preventive maintenance needed to save the roads in fair condition is estimated at about $750 million (1985 prices). Thus, the federal rehabilitation and maintenance backlog increased to $2.4 billion, a one-third increase in 6 years.
7
The portent is clear, as shown by the extremely high proportion of roads in fair condition--on a regional basis ranging from 23 to 59 percent for paved and 30 to 46 percent for unpaved main networks.
A multitude of factors explain why roads have been allowed to deteriorate to such an extent. The circumstances of every country are unique in one respect or another, so that generalizations are difficult and invariably subject to many exceptions. But there are common structural and response denominators that contribute to an understanding of the road deterioration problem across countries and the policy responses needed to deal with it. The structural parameters related to physical and economic conditions help to delineate the magnitude of the problem and the room for maneuvering in dealing with it. The response parameters related to financial, management, institutional, and political conditions provide a basis for gauging the efforts made to address the problem within a country's particular circumstances.
The more important of the structural parameters relate to
• Size of the country's road network and the percentage of paved roads;

8
• Age distribution of the paved network (which is, of course, closely associated with the level of recent investment);
• Volwne and rate of traffic growth; and • Financial capacity.
The length of the road network and the proportion paved are major determinants of overall maintenance requirements. The age distribution of the network is important because of the particular characteristics of paved road deterioration, with typically two-thirds of pavement deterioration (and an even higher percentage of maintenance costs) being concentrated in the final one-third of the pavement design life. Where a recent boom in road construction has occurred-as in many developing countries-a grace period of several years can be expected during which roads remain in good condition and maintenance demands are minimal, followed by a period in which maintenance requirements surge dramatically. Traffic growth is also an important determinant, because sustained demand for road transport can quickly render existing road networks obsolete. The size, quality, and age of networks and the growth of traffic can thus help to explain some of the differences in the level and character of maintenance requirements.
The capacity to fund road maintenance in a given country depends on the national resources. Gross national product per capita may be a good index of the fiscal capacity of the nation, although the governments of some countries are able to capture more of it than others. Out of a given total fiscal intake, allocation of funds to highways is a political decision, reflecting a judgment about national priorities. Variations in income growth (growth rate of GNP per capita) are also important: severe setbacks in income growth clearly help explain some important instances of underfunding of maintenance and consequent road deterioration, for example, in Latin America.
A broad idea of the economic burden that road maintenance imposes on a country is to be gained from the ratio of its network length to GNP (the income-density of roads), although an allowance has to be made for aging networks and heavy traffic loading that would increase the burden, whereas lower traffic volwnes in poorer countries would tend to lower the burden. Values of the ratio for main roads range from 0.3 km per million dollars of GNP for Korea and 0.4 for Nigeria to more than 8.0 for Zaire and Botswana and 14.8 for GuineaBissau. Of the 36 countries with the highest value of this ratio, 32 are in sub-Saharan Africa (Table A-2). Even with the best management, these countries would face the world's highest burden of road maintenance requirements relative to income.
GNP per head and its rate of change, together with network length, age distribution, and traffic do not fully explain the variations in road conditions that reflect the extent to which maintenance requirements have been met. Several higherincome developing countrie.s have poor roads, whereas some of the lowest income countries have better ones. The capacity of a country to deal with its maintenance needs depends on how effectively and efficiently it can translate available resources into protection and rehabilitation of road infrastructure.
The response parameters are intended to gauge the size and quality of a government's efforts to address its road maintenance needs and involve a number of managerial, institutional, and political factors, collectively known as absorptive capacity.
Absorptive capacity has a number of facets. One has to do with scale--the stock of machinery and the size of the labor
TRANSPORTATION RESEARCH RECORD 1128
force that can be applied to the activity. Another is the soundness of the maintenance strategy-type, level, and timing of intervention-and still others are the managerial and operational efficiency in executing the strategy. These depend, in turn, on such factors as the institutional structure, managerial ability, staff quality, accountability, incentives, and the extent to which objectives that conflict with efficiency (such as employment generation or other objects of political patronage) are imposed on the road authority.
All of these factors can in turn be related to the level of interest and quality of public leadership not only at the road authority level but also at the political level. Often political conviction is needed to accord priority in allocation of scarce resources (human as well as financial) to maintenance rather than to other politically more popular causes. The perceived interest of high government officials in road maintenance functions can also be an important determinant of the quality and motivation of staff attracted to the task, as demonstrated in several countries.
Experience with these aspects of absorptive capacity has often been remarkably disappointing. When limited absorptive capacity cannot readily be expanded, the prospects are poor for recovering infrastructure that has already suffered degradation or for preventing heavy losses of capital when the peak of maintenance needs is yet to come.
RESPONSE TO THE PROBLEMA COUNTRY TYPOLOGY
The countries subject to road maintenance problems are of several types. Some have backlogs of maintenance because their financial and institutional capacities have not expanded as fast as their networks. Some have built up backlogs by deferring needed maintenance during adverse economic conditions. Some do not appear to have backlogs at present, but their networks of relatively recent construction will soon greatly increase and will require systematic maintenance to prevent rapid deterioration. The road deterioration problem pervades the developing world. At the core of the problem are mainly the countries of sub-Saharan Africa and South Asia; at the hard core of the problem are sub-Saharan countries whose financial and institutional capacities are unequal to the task at hand or to the task they will soon have to face.
To differentiate responses to the road deterioration problem at the country level, a typology of cases is proposed in Table 3, for a variety of structural and response parameters influencing road conditions. The typology consists of six representative categories in which the main road networks of the 85 countries have been grouped (Table 4). The geographical distribution of the typological groups is shown in Figure 2. The quantification of response parameters in the proposed typology has been particularly difficult. Adequate data on road maintenance expenditures are available only for 18 countries. Assessing efficiency of resource utilization at either the planning or the operation level poses an even greater challenge as few developing countries possess adequate management information systems to monitor and evaluate use of resources applied to their road networks. Although no pretense to scientific precision is made, the purpose of the classification is to identify country groupings in terms of needed actions to improve the conditions of their respective main road networks.

TABLE 3 FRAMEWORK FOR A TYPOLOGY OF ROAD CONDITION DETERMINANTS
Determinants of Road Condition
Road Network Expansion, GNP per Capita Condition of Main Roads Median Values(%) Maintenance Backlog GNP per Capita Growth per Annum
No. of Paved Networks(%) Unpaved Networks(%) Paved Roads Unpaved Replacement Value (%) ($million) 1975-1985 ($)
Type Countries Good Fair Poor GOod Fair Poor 80-84 75-79 80-84 ($million) Range Median Range Median Range Median
Adequately maintained networks 11 74 19 7 34 44 22 12 15 24 1,357.1 2.7--8.9 5.7 180-2,290 1,240 -13-5.1 0.8
Recently expanded networks, middle and upper income 21 44 31 25 34 35 31 27 19 10.5 12,240.0 2.7-28.7 13.4 540--6,490 960 -3.3-7.9 2.2
Recently expanded networks, lower income 20 41 37 22 34 28 38 23 15 10 594.1 2.4-27.3 10.5 110-530 290 -3.7-3.7 --0.15
Aging networks, middle and upper income 16 32 38 30 19 50 31 8 4.5 11 10,751.9 7.6-34.4 15.6 660-4,340 1,420 -4-7 1.4
Aging networks, low income, low growth or decline 11 23 32 45 36 32 33 6 12.5 12 1,867.0 1.8-29.6 15.9 80-540 230 -7.7---0. -3.35
Obsolete or inadequate networks, low income, moderate or high growth 6 14 58 28 35 30 35 8 9 NA 13,053.7 8.9-33.3 23.6 130-380 285 1.6-6.8 3.25
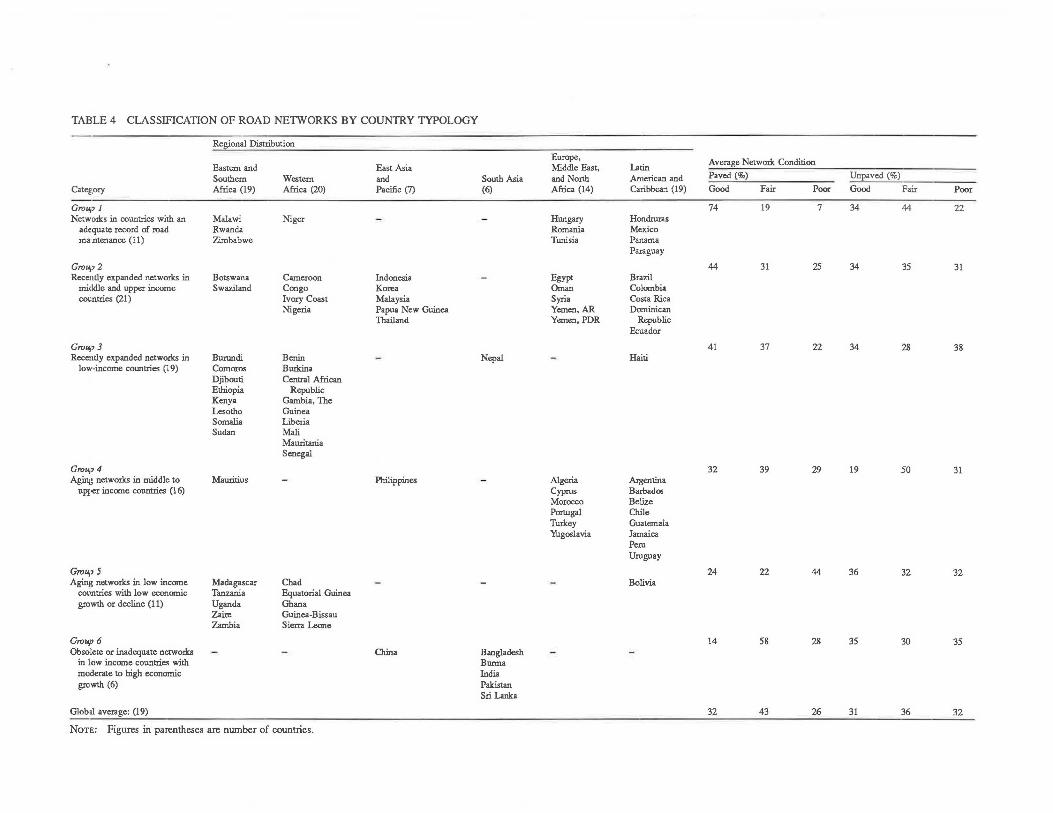
TABLE4 CLASSIFICATION OF ROAD NE1WORKS BY COUNTRY TYPOLOGY
Regional Distribution
Europe, Average Netwotk Condition
Eastern and East Asia Middle East, Latin Southern Western and South Asia and North American and Paved(%) Unpaved(%)
Cat"f!;ory Africa (19) Africa (20) Pacific (7) (6) Africa (14) Caribbea.., (19) Good Fair Poor Good Fair Poor
Group 1 74 19 7 34 44 22 Networlcs in countries with an Malawi Niger - - Hungary Hondrwas
adequate record of road Rwanda Romania Mexico ma:intenance (11) Zimbabwe Tunisia Panama
Paraguay
Group 2 44 31 25 34 35 31 Recently expanded networlcs in Botswana Cameroon Indonesia - Egypt Brazil
middle and upper income Swaziland Congo Korea Oman Colombia cm;ntries (21) Ivory Coast Malaysia Syria Costa Rica
Nigeria Papua New Guinea Yemen, AR Dominican Thailand Yemen,PDR Republic
Ecuador
Group 3 41 37 22 34 28 38 Recently expanded networl<s in Burundi Benin - Nepal - Haiti
low-income countries (19) Comoros Burkina Djibouti Central African Ethiopia Republic Kenya Gambia, The Lesotho Guinea Somalia Liberia Sudan Mali
Mauritania Senegal
Grou,1 4 32 39 29 19 50 31 Aging networlcs in middle to Mauritius - Philippines - Algeria Argentina
upper income countries (16) Cyprus Barba doe Morocco Belize Portugal Chile Turkey Guatemala Yugoslavia Jamaica
Peru Uruguay
Grou,1 5 24 22 44 36 32 32 Agin1~ networlcs in low income Madagascar Chad - - - Bolivia
comtries with low economic Tanzania Equatorial Guinea growth or decline (11) Uganda Ghana
Zaire Guinea-Bissau Zambia Sierra Leone
Group 6 14 58 28 35 30 35 Obsolete or inadequate networlcs - - China Bangladesh
in low income countries with Burma moderate to high economic India growth (6) Pakistan
Sri Lanka
Glob<Il average; (19) 32 43 26 31 36 32
NoTE: Figures in parentheses are number of countries.

_ ... -~--..... .;o~ ...... •""
.. ~=._ ,,, d '·
:~r ?
• • ..R
:;: -.{~-='-__,~-
g ')
_......,. . .r-:"?;;;"" ". ~p~.; --~~~
<: -
-.,.. \·.I\
} ......
\ ~·
"1\ \·r-.._ if \ "
'·"
I • ~· \ . . rr ~\ ~·· ~· '' l ~~ ~ ...
-'i;b
t v
?
FIGURE 2 Typology of road networks in developing countries.
; ,,,, - I
.-
<>·-r
~. ·' ... ~
r,
.. '] , '
Type of Road Ne!work,
~~ I: Adt'ciuotrf), Mr.m:to1i"led Netwcirk~,
!;".:_;:~ .. .J II: Rcccn!~y E.iµonJc•d Ncrw1;irk':>:
Midcl!c lllld Upper !ncomC'.
__ ~ tfl: Rcc.::ndy E ... pnoich•d Network~; la1.ve1 lrict:o:nr:
IV: Agmg Nl";:/worb.: Midd!r: 1o Upp~r incorn()
V: Aging Nelwo1 k<.;
low h!come • low G1 owfh or Dechnf':
; VI: Ob:;oi~te or Inadequate Ne-1wo1 ~s; Low Income - Modero1~ or HiiJh Growth
< I
~ .. "') ... ' 'j
~ /i \,t.1
•' ~
~..) ....... ,.... ..... ,
·'
, {,~ --- '.!\
-.;,..-./ .., -1 .... ~/-v

12
Group 1: Networks in Countries With an Adequate Record of Road Maintenance
This group encompasses a geographically disparate set of 11 countries (4 in sub-Saharan Africa, 1 in North Africa, 2 in Europe, and 4 in Latin America) that share the common characteristic that they have done a better job in preserving their road networks (particularly paved roads and to a lesser degree unpaved roads) than their otherwise comparable counterparts. On average 74 percent of paved roads are in good condition, 19 percent are fair, and only 7 percent are poor-not much different from the status of an optimally maintained network. Unpaved roads at 34 percent good, 44 percent fair, and 22 percent poor are well short of an optimal condition distribution, but still are generally better than in most other developing countries. The countries vary widely in economic circumstance (with per capita incomes ranging from $210 to $2,290) and in political and economic organization (from free-market to socialist). In these cases the primary advice for the future is to continue much as before with somewhat greater attention to institutional strengthening, technological improvements, and efficient operations, particularly on unpaved roads. In the two lowest income countries, Malawi and Niger, where a high proportion of the paved network is still relatively new, a swell in maintenance requirements will occur over the next several years, which might be difficult to meet without substantial external assistance.
Group 2: Rec .. ntly Expanded Networks in Mlddleand Higher-Income Countries
This group of 21 countries also covers a wide range of income, political and economic organization, and geographic location, although most countries in East Asia and Middle East regions are represented in this group. What they have in common is that a substantial proportion (often more than 50 percent) of their paved network has been constructed (or reconstructed) during the past 10 years, resulting in a relatively high proportion of the network being in good condition today with low current maintenance requirements but with the expectation of a surge in maintenance requirements in the future. These countries must prepare now for a major build-up in maintenanceinstitutionally as well as financially-well beyond their existing capabilities. A reallocation of resources from within the road sector (or from other sectors) will be needed to meet the skyrocketing road maintenance bill. Most of these countries are well placed from an absorptive capacity standpoint to institute major policy and institutional changes in their roads sector.
Group 3: Recently Expanded Networks In Lower-Income Countries
This group of 20 countries, all except 2 (Haiti and Nepal) in sub-Saharan Africa, share the characteristics of Group 2, except for the level and rate of growth of income and road networks that consist predominantly of unpaved surface. These countries, too, must prepare for the surge in road maintenance requirements ahead, but because of their low incomes, they will find it more difficult to sustain the level of expenditures needed to maintain all of their recently expanded networks to good
TRANSPORTATION RESEARCH RECORD 1128
standards. A selective road maintenance strategy that focuses on the economically and socially most important roads is indicated. Without a sustained level of continued external assistance-both financial and institutional-and improvements in the use of available resources, the maintenance requirements of their expanded road networks will heavily strain the limited financial and institutional capacities of these countries. A major shift in policy direction will be needed to deemphasize new construction and expansion of road networks in favor of maintaining existing roads.
Group 4: Aging Networks in Middle- to Higher-Income Countries
This group of 16 countries (all in LAC and EMENA regions, with the exception of Mauritius and the Philippines) shares the characteristic that there has been relatively little expansion to their networks recently (so that current maintenance requirements are a reasonably good indication of the future) and most have long-established maintenance capabilities. Maintenance needs have not been fully funded in the past, and the networks have been deteriorating. The primary constraint is additional finance. The institutional capabilities are reasonably wellestablished in most of these countries.
Group 5: Aging Networks in Low-Income, Low-Growth Countries
In this group of 10 sub-Saharan countries plus Bolivia, there has been relatively little expansion to the networks, but they are still struggling to establish effective road maintenance institutions, and the low incomes with either stagnant or declining economies make it difficult for these countries to maintain their existing networks, which consist mainly of unpaved roads. With future prospects even less encouraging for this group than for countries in Group 3, and on average 4 percent of paved roads in poor condition, a selective policy must be pursued to concentrate limited available resources on the most vital segments of the networks mainly for rehabilitation and periodic maintenance work. A massive dependence on external assistance is foreseen for these countries, and it is essential that appropriate, less capital-intensive road maintenance technologies be adopted by these countries to reduce this dependence locally and establish a sustainable level of maintenance.
Group 6: Obsolete or Inadequate Networks In Low-Income, and Moderate-to-High-Growth Countries
This group, composed of five South Asian countries plus China, shares the characteristic that existing networks are either largely outmoded or, in the case of China, simply not yet developed for current or readily foreseeable traffic demands. Roads in South Asia are mostly old and in an advanced state of disrepair. Because these roads do not have the traffic flow or structural capacity to meet the needs of growing economies in which the role of road transport is rapidly expanding, restoration and maintenance of the existing networks is not enough.

Faiz et al.
What is required is replacement and, like China, expansion to a modem network commensurate with the new role of road transport. A key requirement will be the adoption of modem road building and maintenance technologies in order to make the best use of available resources. The resistance to institutional and technological change is rather strong in South Asian countries despite the availability of abundant well-trained manpower. Finding innovative approaches of technology transfer and improving technical skills will prove to be a major challenge for the road administrations in these countries.
CONCLUSIONS
The developing countries are losing capital through massive deterioration of their roads. Large networks, built at great expense, have been undermaintained and more heavily usedand abused-than expected. If the decay is allowed to continue, it will accelerate, as old pavements crumble and younger ones outlive the period when neglect has little visible effect. The cost of restoring roads after they have disintegrated-three to five times the cost of preventive measures-is compounded by drastically increased vehicle operating costs. The cost in both forms would be a major drag on economic development. It is urgent to recognize the dimensions of the problem and to arrest the process while it can still be done at a reasonable cost.
The genesis of the problem lies in the rapid development of the road networks, which expanded much faster in the 1960s and 1970s than did maintenance budgets and institutional capacities. In many countries the need for expanding maintenance capacity has not been recognized or acted on early enough, further compounding the problem. The task now facing many developing countries is to salvage valuable infrastructure that has severely decayed while protecting newer vintages of roads from a similar fate. This task has major financial and institutional dimensions.
Arresting the deterioration process and repairing damage already suffered will require serious commitment by the countries concerned and by international development agencies. It will require improvements in institutions and management, good choices of technical options, and in some cases an increase in financial inputs to the roads sector. In others, the length of maintained networks may have to be reduced in order to concentrate available resources on road links with the highest social and economic priority.
In the 85 countries that receive World Bank assistance for roads, 26 percent of paved and 34 percent of unpaved main roads outside of urban areas have already decayed to the point of needing reconstruction. Of even greater concern is the large proportion (currently 42 percent) of paved roads that are now, or soon will be, in that critical phase when pavement strengthening is required if reconstruction is not also needed.
Although the circumstances of every country are unique in
13
one respect or another, an attempt has been made to identify broad parameters of policy responses needed to halt the deteri oration of roads. The recommended policy actions are differentiated by six country types identified from a common set of characteristics related to the condition of the road networks in the 85 developing countries.
ACKNOWLEDGMENTS
The research support provided for this paper by Rodrigo Archondo-Callao, John Mattai and Olivier Bottrie is gratefully acknowledged.
William Paterson assisted in the collection and analysis of the road conditions data and in defining the country typology.
REFERENCES
1. /n11estmenJ in the Public Sector Built Infrastructure-Report A: Roadr and Bridges, U.K. National Development Office, London, 1985.
2. A. Ray et al. The World Development Report, 1986. World Bank, Washington, D.C.
3. The World Bank Atlas, 1986. 19th edn. World Bank, Washington, D.C.
4. World Road Statistics, 1980-84. International Road Federation, Washington, D.C .. 1985.
5. Annual Bulletin of Transport Statistics for Europe. United Nations, New York, 1983.
6. World Transport Data. International Road Transport Union, Geneva, Switzerland, 1985.
7. M. Mason. Road MainJenance Survey for West and Central African Countries. Paper presented at West and Central Africa Seminar on Cost-Effective Road Maintenance, Abidjan, Ivory Coast, 1985.
8. M. Mason and S. Miquel. Results of Road Maintenance Survey for Latin American and Caribbean Countries. World Bank, Washington, D.C .. 1986.
9. M. Baker. Rebuilding America's lnfrastructure--Agenda for the 1980's. Duke Press Policy Studies, Durham, N.C .. 1984.
10. U.S. Congressional Budget Office. Public Works lnfrastructurePolicy Consideration for the 1980's, U.S. Congress, Washington, D.C., 1983.
11. P. Choate. Bad Roads-The Hidden Costs of Neglect. National Asphalt Association, Riverdale, Md., 1983.
12. F. Johansen. Deterioration of the Road Networlca--A.n Emerging Crisis. Transportation Department Paper, World Bank, Washington, D.C .. 1984.
The views and opinions expressed in this paper are those of the authors and do not necessarily reflect the policies of the World Bank.
Publication of this paper sponsored by Committee on Low-Volume Roads.

APPENDIX
TABLE A-1 BASIC CHARACTERISTICS OF REGIONAL ROAD NETWORKS : : : : :::: : :::: :: : :: : :::::: :: : : : :: : : : :: : : : : : : : : :: : : : : : : : : : : : : : : :: : : : : : : : : : : : : : :: : : : : : : : : : : :::::::: :: : : : : : :: :: :: : :::: : : : : : : : : : :: : :: : :: : : : : :: :: : : : ::: : : : : : : ::: : :..: : :: : : : : : : : :: : : : : : : : : : : : : : : : : : : :: : : :: : : : .::: : : : : .::. : :-: :-: : : : : : : : : : : : : :: : :::.:_:: : : : : : NUMBER : AREA GNP :POP. : GNP/CAPITA : TOTAL ROAD NETWORK HAIN ROADS HAIN PAVED ROADS : REPLACEMENT VALUE OF MAIN NmORK :: REGION : OF : KH2 : 1984 :1984 :mIAN : GROWTH :LENGTH % DENSm: KH PER : DENSITY: KH PE< : LENGTH 'DENsm:AVG.COST/KH IAVG.COST/KH : VALUE (UStBnJ :% OF:: :: :coUNTRIBS:('OOOJ : : 1~84 1p.a.(%1 : KH : PAVED: :um GNP: NEfWORK: % tum GNP: KH PER : PAVED t umVED :PAVED :uNPAVED:TOTAL: GNP:: : : : :1 us18nl :I Hn l :1uss1 '75-85 :1·0001 ' :1oom:1000P:IUS1Hn.l : l'OOOKHl:PAVED:1oom :1000P:IUSIHn.J : 1'0001 : IOOKH2: (USS) : !USS) : : : :: •• ··•---~ ---- - -"•• : .. ........... : ••• ....... • :--·· •• •: •••· • : •••• ·· l ···- ••• :-· ••••• : ••••- ·• : ••••• • ••• •• ! ••• •• ••• ! • • •• •••• : •·• • • : •••• •• I •• • •• 1••••• ••· : •• . .......... • • ... ... . · -•• : •• •• •-•""• •• !•• .. ., ... ., __ .. .. _.... .. : ... --·-- :--- · ...... : .. .......... :--··· ::
" " :smm AFRICA : 19 :1 1.051 : 51.2 : 201 : ilO t -0. 1: 58!.l' ~.1 • 5.3 z.9 11.5 ' 19U :iu: 1.1 'o.9 : J.1 : tu • 0.0 255,ooo: 40, 000 : iu: s.1 : 11.1 :3u :: I I I I I f I I I I I I I I I I I I I I I q I I I I I t I ' I • I I I I I 11
:mmw mm : 20 : 8,891 : 104.1 186' 290 ' -LO : m.9' 12.6 • u u ' 1.1 • HU :~: .i 1.s • o.s u : 53.9 • o. 9 ' 245,ooo: rn,ooo : 1u : 3.s: 1u :16. 1 :: :Brd uding Nigeria : 19 ' 1,967 , 31.3: 90' 270 -0.9 322.9 10.3 ' I. I U ' 9.1 ' lli . l :?1.8 ' I ( !.l ' J.( ' ~Z.l ' O.S' 245,000 : 40,000 ; 1.9: 3.3: 11.Z :Jz.s ::
: : : l : t t : : : I ! : i : : : :: :u:!T ASIA l PACIFIC : 1 ' 3,184 : 600. 1 !1350 ' 110 : l.l !1539.6 ' IB.l ' 11.1 : I.I ' u : 450.9 '61.1 : 3. 1 ' 0.3 ! 0.8 • 216.9 : n : 300 , 000 : 40,000 I 83.1 : u : 90.0 !15.0 : :
,:Brd uding China : 6 3,623 ' 281. 4 : 221 : 185 U: 571.Z' 15.9 ' 15 .S ' U ~.O ' 196.6 :s:..t SI: 0.9 : 0.1 : 103.8' U: 300,000' l0, 000: 31.1: 3d: JU !!LI :: f I I l l J I I t t I I I I I f t II •I f I I I I I I I I I 11
::som ASIA : 6 5,120 : m .s : 1000 220 • u :1600.i • JI.I : n.~ · 1.1 u : 211.1 :3-0.l • 1.? : u o.a 111.J • u 180,000: 40,000 : Jt. 4 : 1.1 : JJ.1 :1u ::Br~luding India : 5 l ,9Z2 ! 62 .7 I 259 ' ISO ' 1.8 : 180.i' 26 .1: ! .l , U 2.9 ! 89.6 :ss. O 4.1 'U ' !. 4 SU' U' 180,000: 40 ,000 !.O' J.6 ' 10.6 :16.9 :: •I I I I I I I I f I I I I f I I I I l Al II I I I I 1 I I I I ' I I I I 11
: : BURO PB, IHDDLB UST : : ! ~ ~ : : : : : ! ! ; : ! ::m NORTH AFRICA 14 s , m ! 338 .1 ~ 232: 1795 : ).I :1051.0 : 29.3 ' 16.1 . 1.5 ' l.! . 303.7 :7U 4.7 ' J.j : 0.9: 22U : 10. 6 ' 180,000: 40,000 63.! : l.l : 66.l :19.1 :: It r I • I ' f l l , I I • j I I I I+ • t l I I I I i I I I 11
: : LATIN AKIKICA AND ! ~ : : : : : t : : : : : ! : : : ::mmm 19 :1s, s59 : s0u : 350: mo : o.o :2212.1 1;.o 11.1 u :.a ' s1u :1u 2.1 ' u : o.9 ' 2su ~ u : 260,000 ' 10,000 su' 10 .1 : H.9 :13.0 :: ::Rrduding Brai:il : : : : ~ : : : : : :: ::ni Mexico 17 : 8,311 : 199 .1 : 141 ' 1160 : -0.1 ' 874.l 11.8 10.! : U : I.I 193.7 :tu Z.3 1.4 1.0' A5.8 2.0 : 260,000' 40,000 22.i : f.3: 26.6 !ll.I :: II I I I I I I i I I I I I I f t IJ It I j j I ! I I I J 11
H I t I ' l I I I I t I t I I I 11 14 I I I I ! I • • 1 1 I 1 ,,
:: TOTAL 85 !63.581 : 1935 . ~ 13321 : !1502.6 : 19.4 ' 11.s : u ' 3.9 i8 I8.4 :su : 2.s , o.5 o.9 , 1030.0 • 29.s : • :m. 4 : !1.5 :m .9 :u. s :: II I f I f T I t l I I I I I t I I I 11 II I I I I ; I I I I ii
: :- ............ __ ..................... .. ........................................................................................... ... ..... .. ........ . ................. ... ...... ... ...... ... ... -- ... -................................ .. ... -... ..... ..... ...... .... ..... ... ·- · ·- .. ........................ _ .. ··· -·-· ............ .. . .. ............................... . ·····--- .................................................... -::

TABLE A-2 ROAD NETWORKS BY GEOGRAPHIC REGION
mroN COUNTRY
BSA BOTSWANA BSA BURUNDI RSA COMOROS BSA DJIBOUTI BSA ETHIOPIA BSA KENYA BSA LESOTHO BSA HADAGASCAR RSA mm BSA MAURITIUS RSA RWANDA BSA SOMALIA BSA SUDAN BSA SWAZILAND BSA TANZANIA BSA UGANDA BSA ZAIRB BSA ZAHBIA BSA ZIMBABWE COUNTRIES : 19 SUH AVERAGE
WA BENIN WA BURKINA WA CAMEROON WA CHAD WA CONGO WA C.A.R. WA BQUAT. GUINEA WA GRANA VA GUINEA WA GUINEA-BISSAU WA IVORY COAST VA . LIBERIA VA HALI VA HAURITANIA WA NIGER WA NIGERIA WA SENEGAL WA SIERRA LEONE WA TUE GAMBIA VA TOGO COUNTRIBS : 20 SUH AVERAGE
( 1) 1973-83 (!) Not Available
---GNPICAPm----POP. ANNUAL
1984 AREA 1984 GROWTH i HI I' OOOKH2 I 1975-85
1.00 4.60 0. 38 0. 36
42. 20 I 9. 60 1.50 9.90 6. 80 1.10 5.80 5. 20
11.30 0.71
1I.50 15.00 19.70 6 .10 8 .10
101. 2
3. 90 6. 60 9. 90 I. 90 I. 80 2.50 0.37
lUO 5. 90 0. 88 9. 90 2.10 7. 30 I. 70 6.ZO
96. 50 6.40 3. 70 0.71 1. 90
186. 5
600 28 2
22 l,222
583 30
587 118
2 26
638 1, 506
17 945 236
2,m 753 391
11, 051
113 274 475
\,281 312 623
28 239 246
36 322 Ill
1, 210 !,OJI 1,267
924 196
72 II 57
8' 891
960 220 HO 358 I 10 310 530 260 180
I, 090 280 260 360 800 210 230 140 m 760
255
270 160 760
80 I, 140
260 180 350 330 180 610 170 110 450 190 730 480 310 260 250
562
m
7.9 0. 9 Ill Ill
-0. 9 O.l 3.7
-3.4 0.1 2.6 I. 0
-0.3 -0.1 -0. 2 I tJ -1. 7 -3.3 -3.9 -3.7 -1.3
-0 .1
0.6 0.9 3.9
-7. 7 fl l u
-I. I Ill
-1.9 0. 2 (I )
-2.1 II) -2.2 -3.7 0. 0
-0.4 -I. I -3. 3 -!. 3 -0. 3 -1. 7 -1.5
-I. 0
TOTAL ---------------TOTAL NETWORK----------- ----------HArN NETWORK-------GNP DENSITY DENSITY
1984 LENGTH -----------KH PER------- LENGTH ------KH PER-------1 SH. I I KH I 1 OOKH 1000 $HnGNP I KH I 1 OOKH2 I OOOP $HnGNP
960 1,012
129 129
!,642 6,076
795 2' 574 1,224 I, 199 I, 624 I, 3 52 7,668
568 C515 3' 450 4, 158 3,008 6,156
51,239
l, 053 I. 056 7.521
392 2.052
650 67
I, 305 1,947
158 6' 039
987 I, 022
765 1,178
70,445 3,072 1,117
185 725
101, 769
13' 000 5,100
850 2' 800
43' 200 55' 000 4 '000
50,000 13, Z80 2,795
10' 000 21,600 19,110 2' 821
53,600 17' 037
14 5' 000 35,000 85' 000
589,493
7.500 11,2 00 64,905 31,300 ] I, 000 12,600 I, 5 40
28' 100 I I, 000 4,010
17,880 7,560
13' 500 7' 500
19' 000 108,000 11, 700 9' 921 2' 388 7' 000
430,937
u )9.J
u.s IL l.S 9.l
IU 8.5
I 1.l 139 .8 lU l .l u
l&.6 5.1
11.S u u
it.
5.3
6.6 u
13.7 2.4 3.2 3.6 5.5
I 1.9 5.7
11.2 14.9 6.8 1.1 0.7 I. 5
11.7 6.0
13.8 21.7 JU
1.8
13.D Li Z.2 .8
J. O z.a 2 .1 5.1 ?.O u 1.1 u o. 9 1-0 u t .8 1-9 I.I
10. 5
2.9
1. ! )_?
6. 6 6. I 6.1 u !.2 u . !
Li u J, 6 I.! I.I ) .I 1.1 I. 2. 7 l.4 ?.I
1.3
13.5 5.3 6 .s
21. 1 u 9.1 5. 0
19.4 10 .s 2. l u
16 .0 2.s 5.0
11 .9 u
l!.9 11 .6 I!. 8
11.5
7.1 :o.5 8.6
79.8 5.4
31.8 23.! 6.6 7.2
25.5 7.9 7.7
13.2 9.8
16.1 1.5 3.8 8.7
12.9 9.7
4.1
8. 026 2,900
762 1,100
13,600 25,300 2,010
10,150 5,571 1,787 l,000 9,644 7 '000 2,721
17,700 5,691
40,900 20,653 11, 003
190,521
4 '926 6,300
13 . 500 3.800 7' 000 5, 250 I. 090
11.130 4.550 2.300
13.680 3, 945 5, 222 2' 480 6, 369
29 . 100 9, 700 7, 040 1, 209 2, 921
144,512
1.3 u IQ.I 0. 6 38. 1 u u ) .! 1. I 0. 3 4.3 J.3 6 .i J.3 1.1 1.0 u o.s
89.! u 15. I 0. 7 1.5 1.9 O.l O.l
16. 0 J. 8 u o. 2. 4 0. 4 1.7 1.4 uu u 1.4
].7 0.9
u l .l . l J. 0
2.a u u 0.8 uu 0.8 l. I 3.9 u U !.l J .8 0. 8 6.4 u U I.I 3.6 u 0. I 0.1 0.2 u 0.0 1.0 l.1 O. l 1.i U u 1.9
11.0 1.1 u 1.0
1.6 0. 8
8.4 1.9 5.9
l.9 u u J.9 l.6 1.5 u .I
D.9 1.8 3.9 1.6 9 .a u 1.3
3.7
4.1 6 .o 1.s 9. l.4 8 .1 ·
l.3 2.3
14.S u CD 5. 1 ). 2 5.1 0 .l l.Z &. I 5.5 4-0
l.l
----------HAIN PAVED NETWORK------------- . ------HAIN UNPAVED NETWORK-----CONDITION CONST. /IMPROVED IN CONDITION CONST./IMP.
LENGTH G. F. P. --80/84-- --75/79-- LENGTH G. F. P. --80/84--IKHI Ill Ill 1\1 IKHI Ill IKHI Ill IKH) Ill Ill Ill (KM) ISi
1,967 744 456 300
3' 800 6' 000
398 4,890 2' 001 I, 610
800 2,!60 2' 240
521 J,240 1,726 2' 100 5,502 5,595
46' 653
986 I, 4 00 2,900
163 I, l 00
112 485
5' 782 I, Jl5
185 3' 620
557 I, 890 I, 610 2,609
21, 100 3,762 I, 280
417 l, 712
53' 505
90 58 60 30 33 32 15 20 50
80 60 40 50 38 10 17 10 70
12
58 10 60 I
69 36 16 12 51 2
78 85 13 30 70 62 51 20 27 10
52
8 37 20 60 31 52 35 30 35
20 20 30 25 34 59 20 30 25
32
36 40 30 0
15 35 0
27 35 65 15 13 33 30 20 15 36 45 50 21
23
2 600 31 5 390 . 00 52
20 50 11 10 21 8 33 485 . 00 13 16 1, 400 23 40 50 300 6 15 270 13
0 300 38 20 30 790. 00 35 15 285 55 28 m 18 31 63 200 30 150 5
26
6 230 23 20 400 29 10 783 27 96 7.00 4 16 620 56 29 269 61 14 61 126 2 14 201 18 33 30. 00 6 7 955 26 2 110 20
14 510 29 10 l, 200 73 10 505 19 23 I, 980 24 11 m 12 35 2lO 19 23 210 17 36 427 25
25
400 zo 40. 00 5
21 5 0 0
1,600 27
150 9 913 16
60 8
80 15
110 6 400 17
l, 200 22
100 10 281 20 797 27
480 44 _65 15
80. 00 16
85 7 30. 00 6 1, 330 37
250 45 378 20 200 12 757 29
7' 588 36 7 40 20
30 7 235 JI
6,059 40 30 2' 156 60 25
306 20 20 800 10 10
9' 800 33 31 19' 300 66 17 I, 612 20 50 5,260 20 zo 3' 567 30 35
177 3,200 20 80 7' 181 30 30 4,760 20 20 2,203 25 25
II, l60 5 17 3' 965 52 26
38,500 61 25 15' 151 30 35 5' 108 50 30
113' 868 IZ 30
15 55 10 30
30 100 7 15 60 80 33 17 358 z 30 60 35 100 11
0 3000 94 40 60 50 48 • 1700 JZ 22 JI 35 Z50 2 20 2090 39
28
30 60
500 13 355 7
3' 910 I, 900
10' 600 l , 637 5,900 4 ,808
20 50 30
605 8,348 3' 405 1, 815
10, 060 3' 388 3' 332
810 3' 760
8 19 73 30 zo 50 68 16 16 0 0 100
17 48 35 13 22 65
30 60 15 75 11 0
30 8' 000 0
4 5
35 10 26 40 I? 45
10 10 85 95 35 90 10 30 28 25
5' 938 4 5' 760 30
762 30 1, 209 30
91, 007 20 36 H
1 DOD Z7 150 3 955 20
m zg
170 z 176 5
1340 40
m 18
400 7
310 41 86 7

TABLE A-2 continued
---GNP /CAPITA---- TOTAL ------ ---------TOTAL NETVORI----------- --- - ------HAIN NBTVORK------- ----------MAIN PAVRD NRTVORI------------- ----··KAIN UIPAVID RTVOll----- .
POP. ANNUAL GNP DRNS!TY DRNSITY CONDITION CONST./IHPl!OVBD IN CONDITION COUT./IIP. llGillV COUNTRY 1984 AREA 1984 GROWTH 1984 LRNGTR -----------IH PRR------- LRMGTH ------IH PRR------- LRNGTH G. F. P. --80/84-- --15/79-- LBNGTB G. P. P. --80/84-·
(M) ('OOOIMZ) 1975-85 ( SM . ) (IM) I OOIM I 000 IMnGNP I IM ) I OOKMZ I DOOP SMnGNP (IHl IS) (SJ Ill (IHl (S) (IH) (S) (IK) Ill Ill (I) (Ul (S) (S)
-·--·-.. ................ -- ........ -........... -· --.. --.......... ----- .. --- . --... .... -..... --- .... ·--- ...... .. ........ ---.. --------.. ...... .. ... . - ..... .. ............ ~--- .. - .. .. . -----.. -.......... ---- -------.. ........ -- .. -.... .,,., ........... .... - ..................... -- -- -- ........ ------------- ..... -- -- ---................... -· ..... .. m cam IAP IIDOMKSIA IAP IOiBA IAP KALAJSIA UP PAPUA N GUUBA IAP PBILIPPINIS m remm counms = T Sllll AVILIGI
1029.ZO 158. 90 40.10 15. 30 3. 40
53. 40 50 . 00
I, 350
SA BAICL!DISH 98 . l 0 SA BUlllA 36.10 U INDIA/NATIONAL 749. ZO SA INDIA/STATRS SA HPAL 16.10 SA Pmsm 9Z.40 SA Sl!ILANIA 15.90 COUN'rRIB9 : 6 Sllll I, 008 AVBl!IGB
BMRNA ALGRRIA RHRNA CYPRUS BHRNA RGYPT RHRNA HUNGARY BHRNA HOl!OCCO RHENA om BHRNA PORTUGAL BHRNA ROMANIA BHBNA SYRIA BHRNA TUNISIA BHRNA TURIBY RHRNA nm AR BHRNA nm PDR BHRNA YUGOSLAVIA COUNTR!RS : 14 SUH AVBRAGR
21. 20 0.67
45.90 10. 70 11. 40
1. 10 !D. 20 2!. 70 10 .10 7.00
U.40 1.80 2. 00
23. 00
232
LAC LAC LAC LAC LAC LAC LAC ~AC
ARGRNTINA 30. I 0 BARBADOS D.26 mm 0.16 BOLIVIA 6. 20 BRAZIL/PRDRRAL 132.60 BRAZIL/STITBS CHILR 11.80 COLOMBIA 28. 40
9 I 561 l I 919
98 330 462 300 514
13I184
144 677
3, 288
141 804
66
5,m
2' 382 9
I, 001 93
447 300
92 238 185 164 781 195 333 256
6,476
2,767 0
23 I , 099 8,512
757 1,139
310 540
Z, 110 1, 980
710 660 860
445
130 180 Z60
160 380 360
255
2' 410 3,590
72 0 Z, JOO
67 0 6,490 1,970 2,290 I I 620 1,270 I, 160
550 550
21120
I, 156
2' 230 4,340 I, 15 0
540 I I 720
I, 100 I I 390
s.a l .6 s .( I. I
-0.8 0. I J.9
3. 4
1.7 3.9 1.9
o. 3. 3 J. z
2. 4
l.2 1.0 4. 5.1 (I)
I. I 4 .~ (I) 1.6 II)
-U l.S I. 4 4 .o ). 2 u
3.1
-1.9 I. ii u (I )
-4 .o u
o. 9 J.V
319 I 052 85' 806 84 I 611 30 I 294
Z, 414 35,ZH 43 I 000
SOC.,4Zl
12 , 753 e,498
194,m
z,516 3!, I 12 ! I 724
257 , 455
51, 092 2, 405
33' 048 22,m 14,338 7,13 9
20 I 09 4 51, 983 16' 362 8 I 890
56' 144 4,290 I, JOO
43,760
33l,ll5
61,123 I, I 28
184 3,W
223,072
20 '060 39, 476
915 I I 00 201, 300
54 I 000 45' 000 18 I 545
155 I 669 150, 000
I, 539 I 614
15 I 000 27' 983
1, 500' 000
7' 150 I 01, 673
25 I 500
I ' 683 I 306
78' 190 6,831
30' 089 138, 185 57' 692 18, 12 3 52,031 73' 500 26' 200 78' 190
329,793 25 I 028 7,lOO
I JO I 000
I, 050 I 952
212 I 305 1,670 2' 000
39' 824 1,316' 313
79,000 77 'zoo
9 .6 I 0. 5 55.1 13.6
4. 0 51.9 z9 . 2
11.7
10 . 4 4.1
45.6
5.! 13.4 38.6
32.9
3.3 75.9 3 .0
l l8. 6 12.9 s.o
SU JU 11.Z 11.T 4U IU 2. I
60 . 8
16.2
7.7 3 BB.~
8. J .s
15.S
10. 4 6. 8
0. 9 !.3 1.3 2. 9 5.5 u 3 .0
I. I
o. 2 0. 8 2. 0
0. 4 1.2 1.6
1.1
3.1 I 0 .2 0. 7 IU 2.
16.5 5.1 u 2.6
11. 6 .8 u u 5.
u
.1 6.4 IU 5. 4 u
6.7 2.
u l.3 o. 6 I. 5
!.! . 5
2.6
!.Z u 7.7
2 .8 3.1 1.5
6.5
1.5 u o. 9 s.i u u
.5 l. 4 1.6 8 .8 5.9 u u z.
3.1
3.2 1.5
10. 9 11.9 5.8
u z.o
25!,300 45' 800 23' 481 25 I 324 3,652
53 ,864 41 , 534
450' 955
I 0,900 25' 400 32,000 95 '500 5,546
38' 830 8,900
217 ' 076
39,W 3' 031
28. 725 24 I 000 !9,080 8,474
19,031 14. 700 I 5, 100 16,900 60,953 3,028 I, 887
48' 880
303' 736
36,505 1,367 1,871 9, 382
64,642 162,596 22,831 24. 397
2. 7 0. 2 ?.! 0.3
?U O. 7. 7 I. o.a 1.1
18 .0 1.0 8. T 0. 9
3.4 0.3
1. 6 0. I 3.8 0.7 I. 0 0. 0
3.9 u u 0.4
13.5 D.6
l.Z 0. 2
J.1 u 33.i u U O.i
zu u u 0.9 u
zo . 7 j. 9 u o.& . 5 l. 6
lo.l 2.4 7.8 u 1.6 0. 1 0 .6 0. 9
IS. I Z. I
4. 7 1. 3
I. J 1.? 31U 5.3
8. I 11. u 1.5 0. j 0 .5
3. 0 1.9 Z.1 0. 9
0. 8 0. 5 o. 3 0.8 1.5 1.5 l.O
0. 8
0. 9 l . 9 n.2
u I. I u
0. 8
o. 8 J.3 0. 9 I. I 1.3 I. 2 o. 9 o. 3 1. 0 I. 9 !.I 0. 7 1.7 ! .O
0. 9
u u
10.Z ?.8 O.J
l. I 0. 6
173, JOO 27' 550 9,m
Z3,479 m
14I192 28, 000
276,875
6,ZIO 8 ,400
3 ! ,600 91,200 2,500
24 , H2 8,900
172,952
32, !BO 2,93B
15 '081 24 '000 14 ' 816 3 '292
I 7, 900 I 4,000 l l, 700 9' 140
JB, 449 Z.0 48 1, 650
36' 630
22 1 I 24
27 056 I 367
412 1 35 1
45291 55 887 8' 964 9.620
IO 70 20 22,000 13 59,000 3! 81, 300 18, Z50 13,553
30 30 40 5,530 20 5,000 18 10 ZS 5 3, 860 39 1,926 19
34 45 21 110 15 31 54 15 900 6 50 30 20 8,600 31
20 59 21
15 10 0 50
20 45 20 45 ID 35 18 50 10 10
I 9 45
40 5
39
20 66 50 69
55
10 27 JO
40
32 55 33
44 20 3u 21
36
zo 69 41
35
35 21
32 48 21 48 JO 42
JJ 56 42 37
15 1, 180 19 50 35 2,500 8 35 25 584 23 32 1,940 8 50 50 I
36
28 10 m 9 28
36 1,125 11 14 1, 950 59 20 I, 400 8 10 810 6
I, 000 11
10 150 22 4 637 39
29 l , 358 4
25
44
20 31 I 20 9 ZS 6, 570 15
e, noo 11 11 630 7 21 1, 730 18
109 15 500 4
s,mu
60
3 I 000 !
316 15 z 1 500 10
100 I
I, 010 3 400 II
55 0 900. 00 27 1,000 6 I I 670 12
900 IO
300 15 602 36 441 I
1,845 Z, 926
39,m 16 I 534
114,080
1,690 11, 000
400 4,300 3 I 046
II, 688 0
44 I IZ!
6 I 867 93
13,644 0
4, 264 51182 1,13 1
700 4 I 000 7 I 760
22 I 504 980 237
12 1 250
79 1 612
2,280 8 9,449 0
I ,4Z9 8, 031
19 I 351 8,000 11106,109
750 8 13 I 861 1,95 3 to 11,171
so Z5 ZS I
zz 4T ·31 3500 19 60 zo zo
Z3 Tl ZS 50 ZS 105S 3 t5 30 . ZS
41 34 ZS
10 40 50 0 50 50
zo 40 40 zo 40 40 15 15 40 5 Z5 TO 0 0 0
39 55
25 50 0 50
25 50
300 10
690 13 40 41) 20 200 18 39 37
30 40
40 30 33 33 30 50
30 "
24
30 mo Jo
30 m ZI 34 20
21
20 40 40
2 43 55 20 30 50 30 4Z 28
7 15 18 500 4 42 37 22 • 1150 8
...... H,.,..,,.,.,. •• •" •••••••••••-••••-• ••• •••••• • • "" " """ •• """ """ • • • "" " • • • • " •• " '" " "" ,. .. ,. "'" ,.._,.,.. ,. "• " '" """" •" • ·• "'"'" •• • "" • •" " " • ••" " """" • • " '" " " " ••"" " " - "••• • •" "" '" "" " •• •••" • "." •• • •• • •• •• ••• ,._. ,.. .. • • • -• • " "'""••• • ••••• ••• .... ..... ... ,.,..,..,.. ... ,.,.,.,. ,..., .,_,...,
(1) 19Tl-13 (I) lot haihble
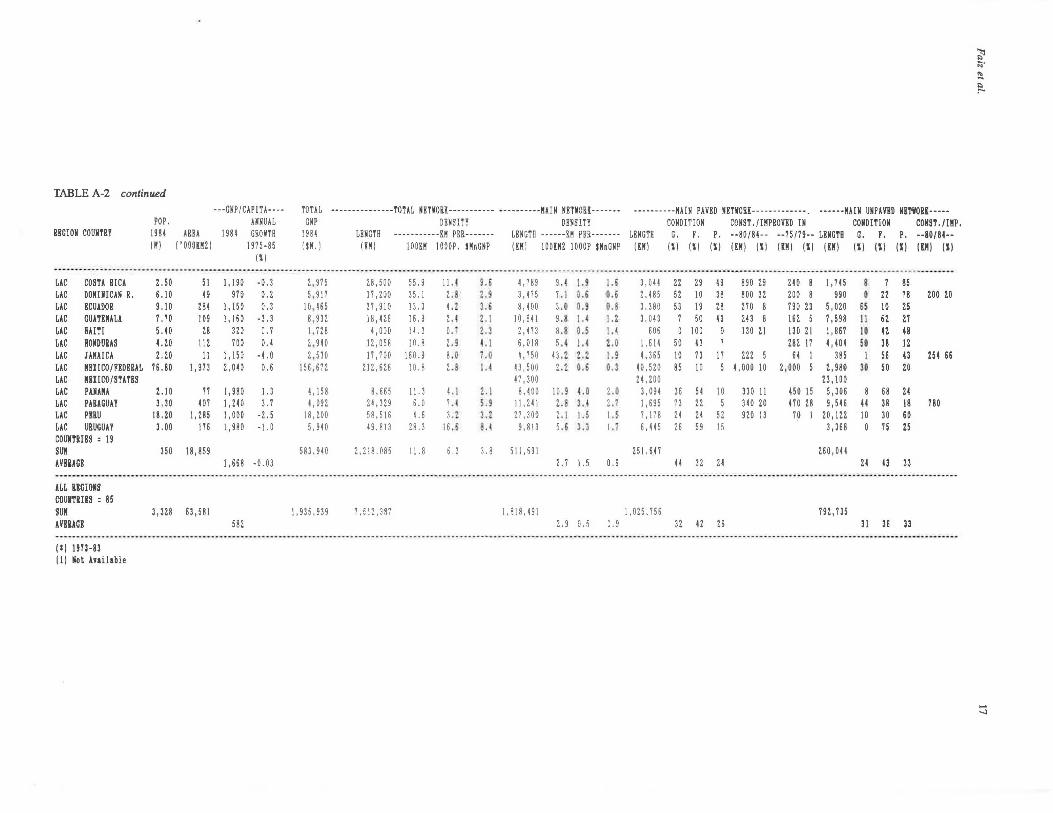
TABLE A-2 continued
---GNP /CA PIT A---- TOTAL ---------------TOTAL NETVORK----------- ----------HAIN NETVORK------- ----------HAIN PAVED NETVORK-------------. ------HHN UNPAVED NEHORI-----POP. ANNUAL GNP DENS !TY DENSITY CONDITION CONST. /IMPROVED IN CONDITION CONST. /!HP.
RRG!OM COUNTRY 1984 AREA 1981 GROWTR 1984 LRNGTH -----------KH PER------- LENGTH ------KH PER------- LENGTH G. F. P. --80/84-- --75/79-- LENGTH G. F. p. --80/84--(H) (I OOOINZ) 1975-85 (SH.) ( IH) I DOKH I DOOP. IHnGNP ( IH ) I OOKHZ I DOOP $HnGNP (KK) (l) (SI (l) IKH) (l) (IH) (l) (IM) (I) Ill (I) ll"I (SI
(S) -- _,.._ ... ,.. ______ ---. ---------- -------------- --- ·-- -·-- ••···-·· .... . .-·-· .. -- ..... .... . -- ......................................... -- -.... -..... --- .. -- .... - ---· --- ........ -.. -- ..... . --- . ----- ............. -- ---- ·--- -- . ------ -- ---- ···--~-- ___ __.,.. ___ __ ----LAC COSTA RICA 2. 50 51 1, 190 -0. 3 Z,975 28, 500 55.9 I I. I 9.i 1,789 9.4 1.9 !.& 3' 044 22 29 49 890 Z9 m 8 1,745 8 7 85 LAC DON!N[CAN R. 6 .10 49 970 0. z 5,917 17' 200 35.1 z.s u 3' 415 7. I 0.5 0.5 2' 485 5Z 10 38 800 3Z zoo 8 990 0 2Z 78 zoo zo LAC ECUADOR 9. JO Z84 l, 150 0. 3 ID. 465 3 7' 910 13.3 u 3.6 8,400 3. 0 u 0.8 3' 380 53 19 Z8 270 8 790 23 5 '020 &S 10 ZS LAC GUATEMALA 7. 70 109 1, 160 -3.3 8, 93Z 18' 426 16.9 2. 4 2. I 10,641 9 .8 I. I J. z 3' 043 7 50 43 213 8 162 5 7, 598 ll 62 27 LAC HArTI 5. 40 28 320 0.7 I , 728 4' 000 14.3 O.i 2.l 2,473 8 .8 o.s 1.4 606 0 100 0 130 21 130 21 1, 867 lO 42 48 LAC HONDURAS 4.20 112 700 0. 4 2,m 12' 058 10.8 z.g 4. 1 6,018 5.4 I. I 2. 0 1,614 50 13 7 282 17 4, 404 50 38 12 LAC JAMAICA 2.20 11 1, 150 -4.0 Z, 530 17' 700 160. 9 8. 0 7 .o 4,750 43.2 u 1.9 4,365 10 73 17 m 5 64 I 385 I 56 43 254 66 LAC MEl!CO/FEDERAL 7 6. 80 1,973 2' 040 0. 6 j 56, 672 212, 6Z6 1 D.8 z.a t. 4 13' 500 u 0.6 0.3 40' 520 85 10 5 4, ODO 10 2,000 5 2, 980 30 50 20 LAC MBIICO/STATES 47' 300 24.200 23, 100 LAC PUANA z .10 11 I, 980 1.3 4, 158 8, 665 11.3 4.1 t.1 8, 400 10.S 4. 0 2 .0 3' 09 4 36 54 10 330 11 450 15 5 ,306 8 68 24 LAC PARAGUAY 3. 30 401 1,m 3. 7
'' 092 Z4,3Z9 6.0 7. 1 s. 9 11.24 I Z.S 3 . I z .1 I, 695 73 Z2 5 340 zo 470 Z8 9, 546 44 38 18 730
LAC mu 18. zo I, 285 l, 000 -Z.5 18 'zoo 58, 516 4.6 u u Z7, 300 Z.I 1.5 u 7.178 ZI ZI 5Z 9ZO 13 70 I ZO, IZZ 10 30 60 LAC URUGUAY 3.00 176 I, 980 -1.0 5,910 49, 813 28. 3 16.6 s. 4 9' 813 5.6 u 1.1 6' 445 26 59 15 3 '368 0 75 ZS COUllTRIES : 19 SUH 350 18' 859 583. 940 z' 218' 085 l l.8 6.3 3.8 51l,691 251.617 Z60, 041 mm11 1, 668 -0. 03 Z.7 1.5 0.9 44 3Z 24 24 13 33 -·-...................... . ......... . .... .. .. . ............... --- ----·--.. --- .. -.. -...... -- ... --- ....... -.. -. ----- -. ----·. -... -... . --- .. -- .. ................ - ........ --- .... --- ........ -.... -- --- --- --- .... --- ................. ·- .. ---- ............................... .. .... ... . .... -........... . .... --.. ... -- ---·------------------ALL REGIONS coumm = 85 SUN 3, 328 63, 581 1,935.939 7,512,387 1,818,491 l. OZ5, 75 6 792,735 AVllRAGE 582 Z.9 0.5 0.9 32 42 Z6 31 36 33 ---.. ..... ... .. ....... .. .... ... .............. .. .......... .. ...................... ··---- .. -- ...... --- ............. ·- ................ -- .. -- .......... -.... --- -- ............... .. . -·-- ·- .. ·---- ... --- .. -.. --- ..... -.. - ................ -........... -- .. .. ...... -- .. -- .. -- --- --- .. ------ .. ------ .............................. -----· .............. .. -----·--(I) 1973-83 (1) Not Available
~ ;:;· ~
~
'.::;
Related Documents
![Untitled-1 [] · 2020. 10. 9. · Thi Ill I Il Ill Olli Ill Ill 1 Ill ill Ill Il Ill ill Ill 11 Ill](https://static.cupdf.com/doc/110x72/60d272307160da1c310a85a5/untitled-1-2020-10-9-thi-ill-i-il-ill-olli-ill-ill-1-ill-ill-ill-il-ill.jpg)