December 2018 STATE OF THE NATION’S HEALTH REPORT University of Ghana, School of Public Health state_of_the_nations_interior_new.indd 1 state_of_the_nations_interior_new.indd 1 05/02/19 11.06 05/02/19 11.06

Welcome message from author
This document is posted to help you gain knowledge. Please leave a comment to let me know what you think about it! Share it to your friends and learn new things together.
Transcript
December 2018
STATE OF THE NATION’S HEALTHREPORT
University of Ghana, School of Public Health
state_of_the_nations_interior_new.indd 1state_of_the_nations_interior_new.indd 1 05/02/19 11.0605/02/19 11.06
University of Ghana School of Public Health State of the Nation’s Health Report 20182
Contributors to the ReportThis report was authored by the following persons:
Chapter 1: OverviewDr. Justice Nonvignon, University of Ghana School of Public HealthDr. Richmond Aryeetey, University of Ghana School of Public Health
Chapter 2: Health Service Delivery and OutcomeDr. George Amofah, Ghana Health Service Dr. Mawuli Dzodzomenyo, University of Ghana School of Public Health Dr. Reginald Quansah, University of Ghana School of Public Health Professor Augustine Ankomah, University of Ghana School of Public Health
Chapter 3: Financing the Health SectorDr. Genevieve C. Aryeetey, University of Ghana School of Public Health Professor Moses Aikins, University of Ghana School of Public Health
Chapter 4: Human Resources for HealthDr. Abu Manu, University of Ghana School of Public HealthDr. Ernest Tei Maya, University of Ghana School of Public HealthDr. Adolphina Addo-Lartey, University of Ghana School of Public Health Dr. Aaron Abuosi, University of Ghana Business School
Chapter 5: Health Commodities and TechnologyDr. Kwabena Frimpong-Manso Opuni, University of Ghana School of PharmacyDr. Amos Laar, University of Ghana School of Public Health Dr. Kojo Arhinful, Noguchi Memorial Institute for Medical Research
Chapter 6: Health Management Information SystemDr. Patricia Akweongo, University of Ghana School of Public HealthDr. Bismark Sarfo, University of Ghana School of Public Health
Chapter 7: Leadership and GovernanceDr. Abdallah Ibrahim, University of Ghana School of Public Health Dr. Emmanuel Asampong, University of Ghana School of Public Health Dr. Samuel Sackey, University of Ghana School of Public Health
Chapter 8: Cross-cutting Issues (Health and Development)Dr. Phyllis Dako-Gyeke, University of Ghana School of Public HealthProfessor Philip Adongo, University of Ghana School of Public Health
state_of_the_nations_interior_new.indd 2state_of_the_nations_interior_new.indd 2 05/02/19 11.0605/02/19 11.06
Foreword 3
Foreword
This report serves as a physical representation of the long-standing collaboration between University of Ghana School of Public Health and the state agencies responsible for health delivery – Ministry of Health and Ghana Health Services. Staff from these three institutions have worked together to review varied publications and datasets related to the health of Ghanaians and have produced this comprehensive review on health in Ghana.
The state of health in Ghana is covered by many diff erent sources, including service reports from the Ghana Health Service, policy documents from the Ministry of Health, academic publications in peer-reviewed journals and reports from donor agencies. Even for experienced and established researchers, going through all this primary material in order to answer a question can be a daunting task. It is however important that all these sources be consulted and evaluated in order to have a clear picture of the current situation,
The State of the Nations Health Report will serve as a one stop destination for students, researchers, teachers and policy makers who want to obtain information about health service delivery and outputs without having to perform a review of all primary documents. The report also highlights the important issues and challenges related to diff erent aspects of the Ghanaian health system. In addition to this the report also provides historical information on the evolution of health service delivery in Ghana which is invaluable information for people involved in designing interventions to improve health in the country.
The incubation period between the idea to have such a report and the delivery of the report has been long and we are happy that the fi nal report is now out. The challenge that this publication now poses to the University of Ghana School of Public Health is to now ensure that there is regular and timely updating for the benefi t of all the diff erent groups who will make use of this fi rst edition.
Richard M.K. Adanu
state_of_the_nations_interior_new.indd 3state_of_the_nations_interior_new.indd 3 05/02/19 11.0605/02/19 11.06
University of Ghana School of Public Health State of the Nation’s Health Report 20184
List of Acronyms
Acronym Meaning
ACT Artemisinin-based Combination Therapy
ADR Adverse Drug Reaction
AEFI Adverse Event Following Immunization
AIDS Acquired Immune Defi ciency Syndrome
ANC Antenatal Care
ART Anti-retroviral Therapy
ARV Antiretroviral
ASR Ashanti Region
BAR Brong Ahafo Region
BCG Bacille Calmette Guerin
BOD Burden of Disease
C and S Consultants and Specialists
CBR Crude Birth Rate
CBD Community Based Distribution
CFR Case Fatality Rate
CHAG Christian Health Association of Ghana
CHN Community Health Nurse
CHOs Community Health Offi cers
CHPS Community-based Health Planning and Services
CHIM Centre for Health Information Management
CR Central Region
CSM Cerebrospinal Meningitis
CVDs Cardiovascular Diseases
DALYs Disability-adjusted Life Years
state_of_the_nations_interior_new.indd 4state_of_the_nations_interior_new.indd 4 05/02/19 11.0605/02/19 11.06
List of Acronyms 5
DHMT District Health Management Team
DHIMS District Health Information Management System
DHS Demographic and Health Survey
DOCFR Direct Obstetric Case Fatality Rate
DPs Development Partners
DRGs Diagnostic Related Groups
DPT Diphtheria Pertussis Tetanus
EIB Early Infant Diagnosis
EMONC Emergency Obstetric and Newborn Care
EN Enrolled Nurse
ENT Ear Nose and Throat
EPI Expanded Programme on Immunization
ER Eastern Region
ERH External Resources for Health
ERP Economic Recovery Program
EVM Eff ective Vaccine Management
FDA Food and Drug Authority
FFS Fee for- service
FHD Family Health Division
GAR Greater Accra Region
GDHS Ghana Demographic and Health Survey
GDP Gross Domestic Product
GFR General Fertility Rate
GHC Ghana Cedis
GHS Ghana Health Service
GHSA Global Health Security Agenda
GGHE General Government Health Expenditure
GNI Gross National Income
GoG Government of Ghana
GSGDA Ghana Shared Growth and Development Agenda
HDI Human Development Index
HIB Haemophilus Infl uenza Type B
HIMS Health Information Management System
HIV Human Immuno-defi ciency Virus
state_of_the_nations_interior_new.indd 5state_of_the_nations_interior_new.indd 5 05/02/19 11.0605/02/19 11.06
University of Ghana School of Public Health State of the Nation’s Health Report 20186
HO Medical House Offi cer
HRH Human Resources for Health
HSMTDP Health Sector Medium Term Development Plan
HTC HIV Testing and Counselling
HW Health Worker
IALC Inter-Agency Leadership Committee
IGF Internally Generated Fund
IMCI Integrated Management of Childhood Illness
IMF International Monetary Fund
IMNCI Integrated Management of Neonatal and Childhood Illness
IMR Infant Mortality Rate
IMMR Institutional Maternal Mortality Rate
IPPD Integrated Personnel Payroll Data
ITNs Insecticide Treated Nets
LF Lymphatic Filariasis
LLINs Long Lasting Insecticide-treated Nets
LMIC Low Middle Income Countries
LSD Laboratory Services Department
MAF Millennium Development Goals (MDG) Acceleration Framework
MCV Measles Containing Vaccine
MDA Mass Drug Administration
MDAs Ministries, Department and Agencies
MDBs Multilateral Development Banks
MDC Medical and Dental Council
MDGs Millennium Development Goals
MHA Mental Health Act
MHO Mutual Health Organizations
MICS Multiple Indicator Cluster Survey
MMDAs Metropolitan, Municipal and District Assemblies
MMR Maternal Mortality Rate
MO Medical Offi cer
MoH Ministry of Health
MTEF Medium-Term Expenditure Framework
MW Midwife
state_of_the_nations_interior_new.indd 6state_of_the_nations_interior_new.indd 6 05/02/19 11.0605/02/19 11.06
List of Acronyms 7
NACP National AIDS/STIs Control Programme
NCDs Neglected Tropical Diseases
NDPC National Development Planning Commission
NGO Non-governmental Organisation
NHIA National Health Insurance Authority
NHIF National Health Insurance Fund
NHIL National Health Insurance Levy
NHIML National Health Insurance Medicine List
NHIS National Health Insurance Scheme
NMC Nursing and Midwifery Council
NMCP National Malaria Control Program
NMR Neonatal Mortality Rate
NR Northern Region
NRCD National Redemption Council Decree
ODA Offi cial Development Assistance
OOP Out-of Pocket Expenditure
OPD Outpatients Department
OPG Operational Policy Guidelines
PAB Protected At Birth
PC Pharmacy Council
PHEIC Public Health Events of International Concern
PIN Professional Identifi cation Number
PMI Presidents Malaria Initiative
PMTCT Prevention of Mother to Child Transmission
PN Professional Nurse
POW Programme of Work
PPP Public-private-partnership
PPME Policy Planning Monitoring and Evaluation
PrivHE
PU
Private Health Expenditure
Procurement Unit
PubHE Public Health Expenditure
QAMSA Quality of Antimalarial Medicines in Sub-Saharan Africa
state_of_the_nations_interior_new.indd 7state_of_the_nations_interior_new.indd 7 05/02/19 11.0605/02/19 11.06
University of Ghana School of Public Health State of the Nation’s Health Report 20188
RDT
RHA
Rapid Diagnostic Test
Regional Health Administration
SAFE Surgery Antibiotics Facial washing and Environment
SAP Structural Adjustment Program
SDGs Sustainable Development Goals
SP Sulphadoxine Pyrimethamine
SPP Sulfamethoxypyrazine/pyrimethamine
SSA
SSDM
Sub-Saharan Africa
Stores Supplies and Drug Management
SSNIT Social Security and National Insurance Trust
STH Soil-transmitted Helminths
TAS Transmission Assessment Survey
TFR Total Fertility Rate
THE Total Health Expenditure
RTAs Road Traffi c Accidents
UER Upper East Region
UNDP United Nations Development Program
USG United States Government
USAID United States Agency for International Development
UNICEF United Nations Children Fund
USP United States Pharmacopoeia Convention
UWR Upper West Region
U5MR Under-fi ve Mortality Rate
VAT Value Added Tax
VR Volta Region
WHO World Health Organization
WICRs Walk-in-cold rooms
WISN Workload Indicator of Staffi ng Needs
WR Western Region
state_of_the_nations_interior_new.indd 8state_of_the_nations_interior_new.indd 8 05/02/19 11.0605/02/19 11.06
Contents 9
Contents
Contributors to the Report 2
Foreword 3
List of Acronyms 4
List of Figures 13
List of Tables 15
Executive Summary 17
Acknowledgements 21
CHAPTER 1 Overview 23
CHAPTER 2 Health Service Delivery and Outcome 27
2.1 Introduction 27
2.2 Organisation of Health Service Delivery 28
2.3 Early Childhood Mortality 31
2.3.1 Stillbirth Rate 32
2.3.2 Neonatal Mortality Rate (NMR) 32
2.4 Status of Priority Disease Conditions 33
2.4.1 Cholera 33
2.4.2 Cerebrospinal Meningitis 34
2.4.3 Malaria 35
2.4.4 National Tuberculosis Control Programme 36
2.4.5 HIV/AIDS 37
2.4.6 Neglected Tropical Diseases (NTDs) 38
2.4.7 Non-communication Diseases (NCDs) 40
2.4.8 Road Traffi c Accidents (RTAs) 41
2.5 Top 10 Causes of Out- Patient Department (OPD) cases and Deaths 42
2.6 Nutritional Status 42
2.7 Health Service Coverage and Utilisation Indicators 44
2.7.1 Outpatients Department (OPD) Per Population 44
2.7.2 Expanded Programme on Immunization (EPI) 44
2.7.3 Antenatal Care (ANC) and Skilled Delivery 45
2.7.4 Family Planning Services and Fertility Rates 46
state_of_the_nations_interior_new.indd 9state_of_the_nations_interior_new.indd 9 05/02/19 11.0605/02/19 11.06

University of Ghana School of Public Health State of the Nation’s Health Report 201810
2.7.5 Breastfeeding 48
2.7.6 Emergency Obstetric and Newborn Care (EMONC] 48
2.7.7 Blood Transfusion service 50
2.7.8 Clinical and Public Health Emergency Services, including ambulance service 50
2.7.9 Integrated Management of Neonatal and Child Illness (IMNCI) 50
2.7.10 Community Health Planning & Services (CHPS) 51
2.7.11 Adolescent Health Services 52
2.8 Quality issues in service provision 52
2.9 Summary and Conclusion 53
CHAPTER 3 Financing the health sector 54
3.1 Introduction 54
3.2 Major Developments and Reforms in Health Financing 55
3.4 Health Insurance in Ghana 56
3.5 Structure of Health Financing in Ghana 57
3.6 Functions of Health Financing 57
3.6.1 Function 1: Raising Revenue 57
3.6.2 Function 2: Risk Pooling 61
3.6.3 Function 3: Purchasing 64
3.7 Health Sector Financial Resource Needs and Financing Gaps (2011-2014) 68
3.7.1 Fiscal space for health 68
3.7.2 Estimated Additional Fiscal Space for Health in Ghana from Economic
Growth, 2010–15 (See World Bank report page 125) 68
3.7.3 Funding gap under progressive fi nancing 69
3.7.4 Funding gap under Abuja declaration 70
3.7.5 Funding needs of the health sector (2014-2016) 72
3.8 Financial outlook 74
3.8.1 Government spending on health 74
3.8.2 Health service utilization 74
3.8.3 The NHIS expenditure 75
3.9 Summary and Conclusion 75
CHAPTER 4 Human resources for health 76
4.1 Introduction 76
4.2 Human Resources for Health Situation in Ghana 77
4.2.1 Distribution of Health workers by Occupational Category/Cadre 77
4.2.2 Distribution of Clinical Staff 78
4.2.3 Medical Doctor Situation in Ghana, 2015 79
4.2.4 Distribution of Pharmacy Staff 82
4.4 Trends in Distribution of Human Resources for Health in Ghana, 2012-2015 83
4.4 Health worker population ratios 85
4.5 Age Distribution of Health Workers 86
state_of_the_nations_interior_new.indd 10state_of_the_nations_interior_new.indd 10 05/02/19 11.0605/02/19 11.06
Contents 11
4.5.1 Cadre-specifi c age analysis 87
4.6 Health Workforce Management 88
4.7 Recruitment in the Ghana Health Service 89
4.7.1 Promotion 90
4.7.2 Retention and migration of health workers 90
4.7.3 Performance of Health Workers 92
4.7.4 Compensations / remuneration/Retirement 92
4.7.5 Posting and transfers 92
4.7.6 Staffi ng Norms 92
4.8 Issues of malpractices and how it has been addressed within the sector 93
4.9 Summary 94
CHAPTER 5 Health commodities and technology 95
5.1 Introduction 95
5.2 Availability of Quality Medical Products and Devices 96
5.3 Medical Supplies for Malaria Prevention and Control 97
5.4 Procurement and Supply Chain Management for Medical Product and Devices 99
5.5 Quality Assurance for Vaccines 101
5.6 Vaccine Storage and Monitoring 104
5.7 Availability of Health Facilities for Service Delivery 108
5.8 Summary and Conclusion 109
CHAPTER 6 Health management information system 110
6.1 Structure of the District Health Information Management System (DHIMS) 113
6.2 Human Resource Subsystem 114
6.2.1 Distribution of Health Professionals by Region 114
6.3 Health Status subsystem 115
6.3.1 Morbidity and mortality among children under fi ve years 115
6.3.2 Infant and Under Five Mortality Rate 118
6.3.3 Reproductive and Family Health 122
6.3.4 Financial Management subsystem 122
6.3.5 Support and services subsystem 124
6.4 Summary and Conclusion 127
CHAPTER 7 Leadership and governance 128
7.1 Introduction 128
7.2 Legal frameworks of health sector leadership and governance in Ghana 129
7.3 Governance structure of the health sector in Ghana 130
7.4 Ministry of Health (MoH) 131
7.5 Ghana Health Service 133
7.6 The fi ve-tier operational governance structure of the GHS 134
7.7 Implementation of Specifi c Policies by GHS 135
7.7.1 Health promotion and Regenerative health Policies 136
7.7.2 Non-Communicable Diseases Policies 137
state_of_the_nations_interior_new.indd 11state_of_the_nations_interior_new.indd 11 05/02/19 11.0605/02/19 11.06
University of Ghana School of Public Health State of the Nation’s Health Report 201812
7.7.3 Mental Act and Policy on Mental Health 137
7.7.4 Malaria, Tuberculosis and HIV Control Policies 138
7.7.5 Neglected Tropical Diseases policy 139
7.7.6 Expanded Programme on Immunization (EPI) 139
7.7.7 Private Sector Development Policy 140
7.8 Summary and Conclusion 140
CHAPTER 8 Cross-cutting issues (Health and Development) 142
8.1 Introduction 142
8.2 Defi ning Health & Development 143
1.3 Ghana’s Health and Development Agenda: Vision, Mission and State of Health Care Delivery 143
8.4 Historical Overview of Ghana’s Health Sector 144
8.5 Theory and conceptual framework 146
8.5.1 Theory of Health and Development 146
8.5.2 Relationship between Life expectancy and Gross Domestic Product of Ghana
(2000-2014) 146
8.5.3 National Health Policy Framework (Adapted from MOH, 2007) 147
8.6 Trends in Economic and Socio-Economic Development 149
8.6.1 Economic and human development index growth 149
8.6.2 Poverty, inequalities and health and development 150
8.6.3 Correlations between health and development indicators 151
8.7 Summary and Conclusions 152
Appendices 153
Appendix 1 Doctors Situation by Region and Year 153
Appendix 2 Specialists/Consultants Situation by Region and Year 154
Appendix 3 Professional Nurse Situation by region and year 154
Appendix 4 Enrolled Nurse Situation by year and region 155
Appendix 5 Community Health Nurse Situation by Region and year 155
Appendix 6 Midwives Situation by region and year 156
Appendix 7 Maternal Health services and outcomes 157
Appendix 8 Non-Communicable Disease Trends : 2010-2014 158
Appendix 9 Infant and Maternal Mortality Trends 159
Glossary 161
state_of_the_nations_interior_new.indd 12state_of_the_nations_interior_new.indd 12 05/02/19 11.0605/02/19 11.06
List of Figures 1313
Figure 1: Performance Framework for improved service delivery 28
Figure 2: Trend of Institutional Maternal Mortality Ratio 2010 -2015 [draft GHS Annual report 2015] 31
Figure 3: Trend in Institutional Maternal Mortality Ratio by Region 2010-2014 [GHS Annual Report 2015] 31
Figure 4: Trends in Early Childhood Mortality Rates, Ghana, DHS 1988-2014 32
Figure 5: Trend in Institutional Neonatal Mortality Rate FHD-GHS 2010-2014 32
Figure 6: Annual Trend of Cholera cases, Ghana, 1980-2014, Annual Report GHS, 2015 33
Figure 7: Annual Trend of Meningitis Cases and Death, Ghana 2009 - 2014 34
Figure 8: Survey Results DHS 2014: Prevalence of Malaria in Children 6-59months 35
Figure 9: Map showing the distribution of NTD 40
Figure 10: Trend of some Nutrition Indicators in Ghana, DHS 1988-2014; MICS 2011 43
Figure 11: ANC 4+ Coverage in Ghana 45
Figure 12: ANC 4+ Coverage across Regions in Ghana 45
Figure 13: Trend of skilled delivery from 2010 to 2014 46
Figure 14: Trend of Family Planning acceptor Rate FHD GHS 2012-2014 46
Figure 15: Trend in Family planning Acceptor Rate by Region 2012 - 2014 47
Figure 16: Trend of some Nutrition Interventions in Ghana. Source: DHS 1993-2014 48
Figure 17: Trend in implementation of Functional CHPS across Ghana 2002-2014 [source: Annual Report, GHS, 2015] 51
Figure 18: Overview of health fi nancing in Ghana. Adapted from Enemark et al, 2005 57
Figure 19: Health Sector fi nancial resource envelope (2009 - 2013) 58
Figure 20: Health sector revenue distribution for selected years 59
Figure 21: Health expenditure as percentage of GDP 60
Figure 22: Decomposition of Total Health Expenditure (THE) 60
Figure 23: Trend in health expenditure per capita (Current US$) 61
Figure 24: NHIS income and expenditure (2010-2013) 62
Figure 25: Utilization of health services among the insured 64
Figure 26: Progressive fi nancing-funding gap under status quo scenario 69
Figure 27: Progressive fi nancing-funding gap under conservative scenario 70
Figure 28: Progressive fi nancing-funding gap under ambitious scenario 70
Figure 29: Abuja fi nancing-funding gap under status quo scenario 71
Figure 30: Abuja fi nancing-funding gap under conservative scenario 71
Figure 31: Abuja fi nancing-funding gap under ambitious scenario 72
Figure 32: Estimated funding needs of the heath sector (2014-2016) 72
Figure 33: Distribution of Public Sector Health Workers by Agency 77
List of Figures
state_of_the_nations_interior_new.indd 13state_of_the_nations_interior_new.indd 13 05/02/19 11.0605/02/19 11.06
University of Ghana School of Public Health State of the Nation’s Health Report 201814
Figure 34: Distribution of Types of Doctors in Ghana, 2015 80
Figure 35: Distribution of Doctor Categories by Region in Ghana, 2015 80
Figure 36: Distribution of Nursing Staff across the Country, 2015 81
Figure 37: Proportion of Professional Nurse to Enrolled Nurse by Region, 2015 82
Figure 38: Distribution of Pharmacists and Pharmacy Technicians by Region, 2015 83
Figure 39: Distribution of Health Workforce in Ghana by Region, 2012-2015 83
Figure 40: Distribution of Health Public Sector Workers by Age 86
Figure 41: Age Distribution of Public Sector Midwives in Ghana, 2012-2015 87
Figure 42: Age Distribution of Professional Nurses in Ghana, 2012-2015 87
Figure 43: Age Distribution of Public Sector Doctors in Ghana, 2012-2015 88
Figure 44: Age Distribution of Public Sector Pharmacists in Ghana, 2012-2015 88
Figure 45: Trends in the Migration and Attrition of Nurses from Ghana 91
Figure 46: Migration and Attrition of Physicians from Ghana 91
Figure 47: Ghana Reporting and Distribution System 100
Figure 48: Percentage of BCG vaccination coverage among 1-year-olds in Ghana. 101
Figure 49: Percentage of neonates protected at birth against neonatal tetanus (PAB) in Ghana. 101
Figure 50: Percentage of Diphtheria tetanus toxoid and pertussis third dose (DTP3) immunization coverage among 1-year-olds in Ghana. 102
Figure 51: Percentage of Polio third dose (Pol3) immunization coverage among 1-year-olds in Ghana. 102
Figure 52: Percentage of Measles-containing vaccine (MCV) immunization coverage among 1-year-olds in Ghana. 103
Figure 53: Percentage of Haemophilus infl uenza B third dose (Hib3) immunization coverage among 1-year-olds in Ghana. 103
Figure 54: Percentage of Hepatitis B third dose (HepB3) immunization coverage among 1-year-olds in Ghana. 104
Figure 55: Number of adverse drug reactions (ADR) reported by the Safety Monitoring Department of Food and Drugs Authority (FDA) Ghana. 107
Figure 56: Number of adverse events following immunization (AEFI) reported by the Safety Monitoring Department of Food and Drugs Authority (FDA) Ghana. 107
Figure 57: Number of adverse drug reactions (ADR) submitted by the Safety Monitoring Department of Food and Drugs Authority (FDA) Ghana to World Health Organization (WHO) Pharmacovigilance (VigiFlow). 108
Figure 58: Structure of DHIMS 2 113
Figure 59: Percent Caesarean section deliveries by Region: 2011-2014 120
Figure 60: Postnatal Coverage by Regions 120
Figure 61: Health Sector Leadership and Governance Structure 131
Figure 62: Governance structures and functions of the directorates 134
Figure 63: Structure of the Ghana health sector 145
Figure 64: Preston Curve of relationship between Ghana GDP and life expectancy at birth -2000-2014 147
Figure 65: Framework for health and development 148
Figure 66: Trend of GDP growth 2000-2014 149
state_of_the_nations_interior_new.indd 14state_of_the_nations_interior_new.indd 14 05/02/19 11.0605/02/19 11.06
List of Tables 1515
University of Ghana, School of Public Health 1
Table 1: Ownership of health facilities by organizational unit, Ghana. DHIMS2 2013 29
Table 2: Service Provided by Primary Secondary and Tertiary Health Facilities in Ghana 29
Table 3: Trend of Life Expectancy at birth, Ghana, 1980-2013 30
Table 5: Reported Cholera Cases and Deaths, Ghana 2014 33
Table 6: Distribution of 2015/2016 Pneumococcal Meningitis Outbreak in Ghana 35
Table 7: Malaria indicators, 2014. [Source: Annual Report, GHS 2015] 36
Table 8: Trend of pregnant women tested and put on ART 37
Table 9: Hotspots for LF, 2015. [Source: NTDP 2015] 39
Table 10: Trend of some NCDs at OPD, 2011-2014. Annual Report, GHS 2015 41
Table 11: Top 10 OPD cases and Top 10 causes of death 2015, [Source DHIMS2, March 2016] 42
Table 12: Trend of EPI performance 2011-2014. Annual Report GHS 2015. 44
Table 13: Current fertility age-specifi c fertility rates for the three years preceding the survey, Ghana, DHS 2014 47
Table 14: Functions of health fi nancing 55
Table 15: Trends in enrolment and health insurance coverage 62
Table 16: Distribution of top 10 communicable diseases among adults and children (%) 2012-2014 63
Table 17: Distribution of top 5 non communicable diseases among adults and children 2012-2014 64
Table 18: Summary of health sector expenditure estimates by budget program 73
Table 19: Health service delivery summary of expenditure by budget sub programs 73
Table 20: Distribution of Health Workforce by Cadre, 2015 78
Table 21: Distribution of Clinical Staff in Ghana by Region, 2015 79
Table 22: Trend Analysis of Health Workers Distribution by Region, 2011-2015 84
Table 23: Trend Analysis of Doctor to population ratio by region, 2012-2015 85
Table 24: Trend Analysis of Nurse population ratio by region, 2012-2015 85
Table 25: Trend Analysis of Pharmacist population ratio by region, 2012-2015 85
Table 26: Promotion Schedule for Public Sector Health Workers 90
Table 27: Distribution of storage facilities for vaccines in Ghana in 2014a) 105
Table 28: Summary of EVM assessment results in Ghana for the years 2010 and 2014a). 105
Table 29: Summary of EVM assessment results at diff erent levels in Ghana 2014a). 106
Table 30: Deliverables of Health Information Management Subsystem 112
Table 31: Doctor Population Ratio 2009-20132: Doctor Patient Ratio 2009-2013 114
Table 32: Nurse Patient Ratio 2009-2012 114
List of Tables
state_of_the_nations_interior_new.indd 15state_of_the_nations_interior_new.indd 15 05/02/19 11.0605/02/19 11.06
University of Ghana School of Public Health State of the Nation’s Health Report 201816
Table 33: Midwife Patient Ratio 2010-2012 115
Table 34: Top 10 Causes of Morbidity among Children under fi ve years 116
Table 35: Top Causes of Communicable Diseases 116
Table 36: Top Causes of Non-communicable Diseases 117
Table 37: Infant and Under Five Mortality 118
Table 38: Institutional Infant Deaths 118
Table 39: Antenatal Care Coverage by Region 2009-2014 119
Table 40: Percent of Antenatal 4+ visits by Region 2009-2014 119
Table 41: Skilled Delivery by Region 2009-2014 121
Table 42: Institutional Maternal Mortality Ratio: 2009-2014 121
Table 43: Total Fertility Rate by Region 122
Table 44: OPD per Capita for Total OPD Cases 2010-2014 123
Table 45: Health sector structure according to Health facilities by type and ownership 124
Table 46: Health Facilities by Type and Ownership 125
Table 47: Trend in Health Facility Reporting and Timeliness to DHIMS by Region 126
Table 48: Correlation between GDP and some health indicators 151
Table 49: Correlation between GDP, HIV and health expenditure 151
state_of_the_nations_interior_new.indd 16state_of_the_nations_interior_new.indd 16 05/02/19 11.0605/02/19 11.06

Executive Summary 1717
Executive Summary
This book provides fi ndings of a comprehensive review of the state of Ghana’s health
using the World Health Organization’s six building blocks of the health system
comprising service delivery, health fi nancing, health workforce, medical supplies/
equipment (including health commodities and vaccines), management information
system, and leadership/ governance. The book assesses the current situation,
the main challenges in the health system, future outlook, and then proposes
recommendations for action.
Overall, Ghana’s health system is performing relatively well, Given that progress towards expanding physical infrastructure (i.e. number of health facilities) as well as bringing health care closer to communities, on the whole, has been remarkable in Ghana. The number of functional Community-based Health Planning and Services zones (according to GHS criteria) has been dramatically expanded from 190 in 2005 to 2,948 in 2014. These structure improvements have infl uenced health indicators. For example, maternal mortality reduced from 634 per 100,000 live births in 1990 to 319 per 100,000 live births in 2015. The infant mortality rate has declined from 77 per 1,000 live births in 1988 to 41 per 1000 live births in 2014, while under-5 mortality rate decreased from 155 per 1,000 live births in 1988 to 60 per 1000 live births in 2014. Under-fi ve mortality rate has decreased from 155 per 1,000 live births in 1988 to 60 per 1000 live births in 2014. NMR has decreased from 8.8 per 1000 live births in 2010 to 4.3 per 1000 live births in 2014. Under fi ve case fatality ratio for malaria in 2014 is 0.51 which is a decrease from 0.6 in 2013. National TB prevalence rate of 290 per 100,000 population with successful cure rate of above 85. Malaria Case Fatality Rate also showed a downward trend from 1.32 in 2010 to 0.54 in 2014. HIV prevalence declined from 1.8 in 2007 to 1.37 in 2012 and thereafter 1.3 in 2014.
state_of_the_nations_interior_new.indd 17state_of_the_nations_interior_new.indd 17 05/02/19 11.0605/02/19 11.06

University of Ghana School of Public Health State of the Nation’s Health Report 201818
Despite this progress, there are challenges that need to be addressed. For instance, periodic outbreaks of communicable disease still persist. The outbreak of cholera in 2014 which infected over 28,975 individuals resulted in 243 deaths. This epidemic identifi ed persisting challenges related sanitation practices. The 2015/2016 outbreak of pneumococcal meningitis in nine of the ten regions in Ghana also resulted in the death of 91 out of 543 cases. This also highlights the health system’s limited capacity to respond to health emergencies. Increasing non-communicable diseases (NCD) prevalence also demands revised strategies.
Ghana has also made progress in reproductive health services. Minimum frequency of antenatal care attendance (ANC 4+) was 76.1 in 2014, an increase from 74.3 in 2010. Skilled delivery increased from 44.6 in 2010 to 56.7 in 2014. About 70 women receive postnatal care within 24 hours of delivery, 81 percent within the fi rst two days and 4 between the third and fortieth day after delivery. Twenty-seven percent of currently married women use contraception while 22 used a modern method in 2014. The total fertility rate for Ghana is 4.2 children per woman. Overall, 98 of children are still being breastfed at age 9-11 months and 50 percent at age 20-23 months. Although 99 of children under age 6 months are being breastfed, only about half (52 percent) are exclusively breastfed.
In terms of fi nancing, the transition of Ghana from low-income to lower-middle-income status in 2010 contributed to the decline of critical donor funds, from GHC624, 060 in 2012 to GHC194, 460 in 2013. In nominal terms, internally generated Funds (IGF) increased from GHC 108,000 in 2009 to GHC 1,831,400 in 2013. IGF constitutes about 35 revenue for sub-district and district health facilities and 25 for regional hospitals in 2013. GOG transfers to the sector has increased over the decade from GHC334, 400 in 2009 to GHC 508,980 in 2013. However, majority of funding is used for employee compensation. The distribution of health Sector expenditure is as follows; employee compensation (55), goods and services (32) and assets (13).
Between 2001 and 2013, government spending as a percentage of GDP rose steadily from 1.5 to about 3.3 while private spending remained stable around 1.6 over the same period. Government spending as percentage of GDP is below the threshold of 15 with respect to the Abuja Declaration of 2000. The total health expenditure per capita was 84.53 in 2013 but declined to 57.89 in 2014.
The National Health Insurance Scheme (NHIS) operation has resulted in increased utilization of health care services. The scheme processes about 19 million claims annually, of which 60 are Outpatients and 40 are inpatient claims. This has led to increased spending on claims payment to service providers from GHC 397.77 million in 2010 to GHC 785.64 million in 2013. Thus, more than 75 of the scheme’s infl ows were spent on claims payment. At the end of 2014, over 30, 0000
state_of_the_nations_interior_new.indd 18state_of_the_nations_interior_new.indd 18 05/02/19 11.0605/02/19 11.06
Executive Summary 19
insured clients utilized services at the various accredited facilities in the country but enrolment into the scheme remains below 40 of the total population since the NHIS commenced implementation 11 years ago. There is therefore the need for innovative strategies to improve enrolment especially among poor. Given Ghana’s lower middle-income status, donor funds will continue to decline, hence alternative sources of funding for health care should be identifi ed and employed.
Over the past 15 years, the health workforce (all cadres of health workers) in Ghana has increased dramatically from 28,662 in 1999, to 94,696 in 2015. The doctor/population ratio has improved from 1:10,431 in 2012 to 1:8,840 people in 2015. However, rural-urban and regional disparities exist with more health workers working in urban areas. There is, therefore, the need for the Ministry of Health and Ghana Health Service to devise a distributional mechanism to ensure that health workers are fairly distributed across all the regions. Migration of health workers, especially doctors and nurses from Ghana has slowed in recent years.
Availability of medicines, vaccines, medical supplies and products has also received a boost. The median percentage availability of selected generic medicines in a sample of private health facilities increased from 18 (2001-2008) to 44.6 (2001-2009). On the contrary, the median percentage availability of selected generic medicines in a sample of public health facilities decreased from 45 (2001-2008) to 17.9 (2001-2009). In 2014, a total of 1,373,800 pupils attending classes two and six in more than 14,000 primary schools received insecticide treated bednets and information on ITN use. In addition, over 1.1 million ITNs were distributed through ANC clinics and CWCs to reduce the burden of malaria which consistently emerges as the highest condition reporting at OPDs in Ghana. Availability of Artemisinin-based Combination Therapy (ACTs) for malaria treatment in Ghana increased from 31 in 2009 to 83 in 2011 and beyond. The availability of ACTs in public health facilities was 80.7 while that of private health sector was 82.6 in 2011. However, concerns are raised about the infl ux of unregistered products (approximately 5) in the pharmaceutical market in Ghana. The extent of counterfeit medicines present on the Ghana pharmaceutical market is hard to estimate as no local market surveillance studies on this issue have been performed. There is, therefore, the need to regularly conduct routine pharmacovigilance studies to estimate level of unregistered product. Stringent measures are required to regulate the infl ux of counterfeit and unregistered medical products and devices.
The adoption of the District Health Information Management System (DHIMS II) has improved information for decision marking across all levels of health care delivery. The proportion of facilities reporting to the DHIMs was as low as 27 in 2012 and increase sharply to 70 in 2014. The timeliness of reporting is now high across the country (83; range 54-83). This notwithstanding, the failure of the data system to capture data from private health facilities and all six building blocks makes it
state_of_the_nations_interior_new.indd 19state_of_the_nations_interior_new.indd 19 05/02/19 11.0605/02/19 11.06

University of Ghana School of Public Health State of the Nation’s Health Report 201820
diffi cult to have holistic data on certain health indictors in Ghana. If DHIMS will have to be the main tool for making decisions, its database must refl ect all the six building blocks in the health system.
The 2014 human development report shows that Ghana is making improvement in human development index (HDI) with an average annual growth rate of 1.26 between 2000 and 2013. The HDI increased from 0.487 in 2000 to 0.573 in 2013 as compared to Sub Sahara African (SSA) regional average of 0.389. The country ranks 130 out 169 countries and is placed among Medium Human Development countries. The correlation between Gross Domestic Products (GDP) and neonatal mortality and under-fi ve mortality were negative 0.45 and 0.50 respectively. This means lower rate of neonatal and under-5 mortality is related to improved health and development. On the other hand there was a weak positive correlation between immunization against DPT and GDP (0.29), and measles (0.31). The positive correlations are indicative of economic development with increase immunization coverage. A strong correlation between GDP and improved sanitation in both rural (0.53) and urban (0.52) areas. The correlation between GDP and improved access to portable water in both rural and urban areas were positive 0.5 and 0.5 respectively. It was generally observed that life expectancy soars alongside increasing trends in GDP growth averaging 3.9 per annum over the last 15 years. In addition a general increase in standard of living and alongside declining poverty trend (from 28.8 to 24.2) and malnutrition and other social and environmental health and development indicators were observed.
In conclusion, Ghana has made major progress in all sectors of the health system. However, the managers of nation’s health system have a huge responsibility and they face the unenviable challenge of improving the performance of the health system across the six building blocks and ensuring there is no risk of future deterioration in health indicators to meet the Sustainable Development Goals (SDGs). Fundamental to achieving the SDGs is the recognition of the interdependence between economic growth, poverty and health. This therefore calls for integrated multi-sectoral approach which should emphasis the global agenda of health-in-all policies. Otherwise Ghana stand the risk of lamenting on another unfi nished business and a carry forward into any development goals that may come after 2030.
state_of_the_nations_interior_new.indd 20state_of_the_nations_interior_new.indd 20 05/02/19 11.0605/02/19 11.06
Acknowledgements 21
Acknowledgements
This work would not have been possible without the fi nancial support of the Offi ce of Research, Innovation and Development of the University of Ghana through its University of Ghana Research Fund and the World Health Organisation (WHO), Ghana Offi ce. We also acknowledge the technical support that the WHO Ghana Offi ce provided during the initial stages of this project, through the managing editor of the African Health Monitor and coordinator of African Health Report 2014, Yves Turgeon. Our special thanks goes to Dr. Magda Robalo, who was the WHO Representative to Ghana at the time this project commenced in 2015 and the current WHO Representative to Ghana, Dr Owen Laws Kaluwa.
We wish to thank the Chief Director and staff of the Ministry of Health as well as the Director general and staff “especially Mr. Francis Victor Ekey and Dr. Anthony Ofosu” of Ghana Health Service for the support, information, technical support, and data provided.
We are also especially indebted to Prof. Felix Asante of the Institute of Statistical, Social and Economic Research (ISSER), University of Ghana who lent his expertise to the work. We are also grateful to our external reviewers Dr. Cheryl Moyer of the University of Michigan Medical School and Professor Alexander Quarshie of the Morehouse School of Medicine for their invaluable comments.
We also express our appreciation to faculty, graduate students and research assistants of the school, especially Mr. Samuel Dery, Mr. Samuel Owusu, Ms. Benedicta Atsu and Mr, Nathaniel Coleman, and administrative staff of the University of Ghana School of Public Health who have contributed in diverse ways to this project. Faculty members from the various departments provided relevant expertise to each of the chapters. Dr. Philip Tabong’ was helpful in editing and fi nalizing chapters and responding to reviewer comments. Our thanks also Mr. Fidelis Anumu who initiated the administrative process of this project with support of Ms. Najat Dauda. Mrs Abena Engmann was critical for coordinating the entire development of the book from inception to publication.
Our thanks extend to members of the various working groups that supported the authors in diverse ways:
state_of_the_nations_interior_new.indd 21state_of_the_nations_interior_new.indd 21 05/02/19 11.0605/02/19 11.06
University of Ghana School of Public Health State of the Nation’s Health Report 201822
Human resources for health: Dr. Asabre, Ministry of Health, Dr. Margaret Chebere, Ghana Health Service, Dr. Abeka Nkrumah, University of Ghana Business School, Mr. Henry Nagai, UNAIDS and Cecilia Eliason, University of Ghana (PhD Student)
Health Financing: Dr. Bertha Garshong, Ghana Health Service, Dr. Francis Asenso Boadi National Health Insurance Authority, Mr. Kwakye Kontor Ministry of Health, Roger Atinga, University of Ghana (PhD Student)
Leadership and governance: Dr. Erasmus Agongo, Ghana Health Service, Dr. Gilbert Buckle, Korle Bu Teaching Hospital, Mr. Selassi d’Almeida, WHO, Dr. Josephina Blankson-Hemans, University of Ghana (PhD Student)
Health commodities and technology: Dr. Kojo Arhinful, Noguchi Memorial Institute for Medical Research, Dr. Amos Laar, University of Ghana School of Public Health, Mr. Kofi Essel, Food & Drugs Authority, Edith Andrews Annan, WHO, Professor Alex Dodoo, Pharmacy Council, Helen Odido, UNAIDS, Dr. Caroline Amissah, Mental Health Authority, Michael J. Adjabeng, University of Ghana (PhD Student)
Health management information system: Dr. Anthony Ofosu, Ghana Health Service, Dr. Lawson Ahadzie, WHO, Mr. Peter Takyi Peprah, Ghana Statistical Service, Prof. Jacques Emina, Indepth Network, Seth Afagbedzi, University of Ghana School of Public Health, Mr.. Samuel Dery, University of Ghana (PhD Student)
The Central Coordinating Group was made up of Prof. Richard Adanu, Professor Moses Aikins, Dr. Justice Nonvignon, Dr. Genevieve Cecilia Aryeetey, Dr. Richmond Aryeetey, and Mrs. Abena Engmann.
state_of_the_nations_interior_new.indd 22state_of_the_nations_interior_new.indd 22 05/02/19 11.0605/02/19 11.06
CHAPTER 1Overview
A healthy nation is a wealthy nation. In view of this, considerable attention has been paid to health evidence from global policies and treaties. The Alma Alta declaration on primary health care was aimed at making health care available and accessibile using culturallyx appropriate strategies. Decades after this declaration, the world is still burdened with both communicable and non-communicable diseases, with periodic outbreaks of infectious diseases that lead to catastrophic outcomes.
Globally, the number of deaths due to infectious diseases, including parasitic diseases and respiratory infections decreased from 12.1 million in 2000 to 9.5 million in 2012. The percentage of all deaths due to infectious diseases also decreased from 23 to 17. However, communicable diseases continue to dominate in developing countries, despite the upsurge of non-communicable diseases in recent times In the African, South-East Asia and Eastern Mediterranean Regions, communicable diseases are still a leading cause of death accounting for 81 of all deaths and 89 of all years of life lost (YLL) in the world.
Major progress has been made globally in the coverage of health interventions to reduce the burden of infectious diseases. In 2014, 14.9 million people living with HIV were receiving antiretroviral therapy (ART) and an estimated 68 of children under fi ve years were sleeping under an insecticide treated bednets (ITN) in 2015 in sub-Saharan Africa (WHO, 2015). Tuberculosis case detection also increased from 38 to 63 whilst treatment success rate has been 85 and higher in some countries including Ghana.
The emergence of new outbreak of infectious diseases remain an issue of global concern. Outbreak of severe acute respiratory syndrome (SARS in 2003), Hemagglutinin 1 Neurominidase 1 (H1N1 A in 2009), cholera (2010-2011 in many countries) and most recently Ebola in 2014-2015 have received global attention. These outbreaks which were largely attributed to weak health system and slow emergency response systems highlight the need for countries to build a robust system that can respond to health emergencies.
ath
loballes. In
d anted lso ome
ectiory s
010-2entieme
hat
C
thy nalth e
h caropriamunises t
lly, t
COveOvOv
lly, td respiratocentage o
However, communicable the upsurge of non-communicaband Eastern Mediterranean Region
of all deat
However, communithe upsurge of non-comm
respcenta
Overview 23
state_of_the_nations_interior_new.indd 23state_of_the_nations_interior_new.indd 23 05/02/19 11.0605/02/19 11.06
As the economies of these developing countries grow, non-communicable diseases are becoming more prevalent. This is largely due to the adoption of “western” lifestyles and their accompanying risk factors - smoking, high-fat diet, obesity and lack of exercise. It has been projected that 75 of deaths in sub-Saharan Africa will be attributable to non-communicable diseases by the year 2020 with higher mortality in urban than in rural areas. In developed countries, non-communicable diseases remain dominant. Heart disease and stroke have declined as causes of death in recent decades, while death rates from some cancers have risen.
In September 2015, world Leaders of 293 countries assembled in New York to sign on to the 17 Sustainable Development Goals (SDGs), which have 169 targets; the new development milestones to be achieved by the year 2030. These goals are meant to address the several environmental, political economic and health challenges facing the world. These goals also recognise the interconnectedness of the various sectors to produce a healthy society. Much focus is therefore given to intersectoral collaboration and action and evidenced-based decision-making. Goal 3 specifi cally recognises the burden of communicable and non-communicable diseases. Hence, member countries are expected to develop appropriate strategy to strengthen the health system to prevent, detect and manage both communicable and non-communicable disease conditions.
The WHO defi nes a health system as “all the organizations, institutions, resources and people whose primary purpose is to improve health” (WHO, 2000). In the year 2007, the WHO identifi ed six building blocks that are deemed relevant in strengthening the health system. These building blocks include: service delivery, health fi nancing, health workforce, medical supplies/equipment (health commodities, vaccines and technology), information system and leadership/governance. These building blocks have been adopted in presenting the chapters in this book with a fi nal chapter that examines the relationship between health and development.
Chapter two of the book discusses service delivery and health outcome in Ghana. Service delivery can be viewed as an output of the health system which requires inputs such as the health workforce, procurement and supplies, and fi nancing. The chapter gives an overview of how health services are organized in Ghana and the impact of those services on morbidity and mortality indicators. The chapter also provides descriptions of Ghana’s performance on special global programmes such as immunization, HIV, TB, nutrition, emergency obstetric and newborn care and blood transfusion services.
Chapter three of this book is devoted to the health fi nancing building block. Health fi nancing is concerned with mobilizing and allocating fi nancial resources to enable services to be delivered. This chapter discusses how health interventions are funded and how individuals pay for the health care they seek. The chapter further provides a historical antecedent of some major development and reforms in health fi nancing in Ghana, detailing analysis of the structure of health fi nancing and how Ghana is faring regarding the achievement of global declarations (e.g. Abuja declaration) on health fi nancing. The chapter concludes by providing an analysis on how to meet funding gaps for health in Ghana.
University of Ghana School of Public Health State of the Nation’s Health Report 201824
state_of_the_nations_interior_new.indd 24state_of_the_nations_interior_new.indd 24 05/02/19 11.0605/02/19 11.06
At the heart of good health systems is well trained and dedicated human resource with skill mix to provide the high quality services required by the population, and this is covered in chapter four of this book. Human resource is often measured as an indicator of the number of qualifi ed health workers per population. This is done by assessing the number of health care personnel (physicians, nurses and midwives) that are employed full-time in a given year in public and private health establishments expressed as the density per 10,000 population. The national and regional distribution of health workers is presented in this chapter. Furthermore, the chapter provides information on how various cadre of health workers are trained, regulated, hired, receive promotion and retirement. It further provides information on attrition and staffi ng norms in Ghana.
In the next chapter (fi ve), the authors describe the system of delivering medical supplies and commodities to ensure eff ective health care. Logistics and supplies entails a system of ensuring that the right products and commodities are delivered at the right time, right place and in right quantities. In this chapter, the authors provide a detailed description of medical supplies, products and vaccines along the logistic management cycle, including storage management, good inventory management and stock control, distribution of appropriate stock from the health facility storeroom, good dispensing practices, rational prescription and use of medicines, disposal of expired, damaged, or obsolete items and training and performance improvement. The authors further provide a link between the various elements of medical commodities and supply management system for some priority diseases in Ghana.
Chapter six of this book provides the state of Ghana’s health regarding the use of health information for decision making. Health information provides the information support to the decision-making process at all levels of the health system. It provides an overview of structures in place to collect health related data at the community, health facility and onwards transmission of this data to national level.
In chapter seven of this book, the authors examined the pivotal role of leadership and governance in the health system of Ghana. In this chapter, the authors describe the structures and processes through which policies, both formal and informal are developed to achieve health-related goals, including legislation, regulation of implementation of policies and oversight. The authors also provides information on leadership and governance issues in the context of disease specifi c interventions and a detailed review of the implementation of specifi c policies in achieving their goals.
The fi nal chapter of this book presents a cross cutting health issue on linkage between health and development. The author uses a theoretical framework to marry these two important constructs; health and development. The author further provides a longitudinal data to support the link between life expectancy and gross domestic product of a country and correlation between health and development indicators.
This book “State of the Nation’s Health” is the fi rst of its kind in Ghana and presents a holistic review of the health situation of the country and the outlook in future given the present status quo. Embedded in each chapter are innovative recommendations on ways
Overview 2525
state_of_the_nations_interior_new.indd 25state_of_the_nations_interior_new.indd 25 05/02/19 11.0605/02/19 11.06
University of Ghana School of Public Health State of the Nation’s Health Report 201826
to improve the health system to deliver quality health care for residents in Ghana and beyond. It was developed by a team of academics and practitioners from the University of Ghana, Ghana Health Service and Ministry of Health and their agencies. It is the vision of the authors that this collaboration will narrow the gap between academia and policy makers and help in the translation of research fi ndings to practice.
state_of_the_nations_interior_new.indd 26state_of_the_nations_interior_new.indd 26 05/02/19 11.0605/02/19 11.06
Health Service Delivery and Outcome 27
CHAPTER 2Health Service Delivery and Outcome
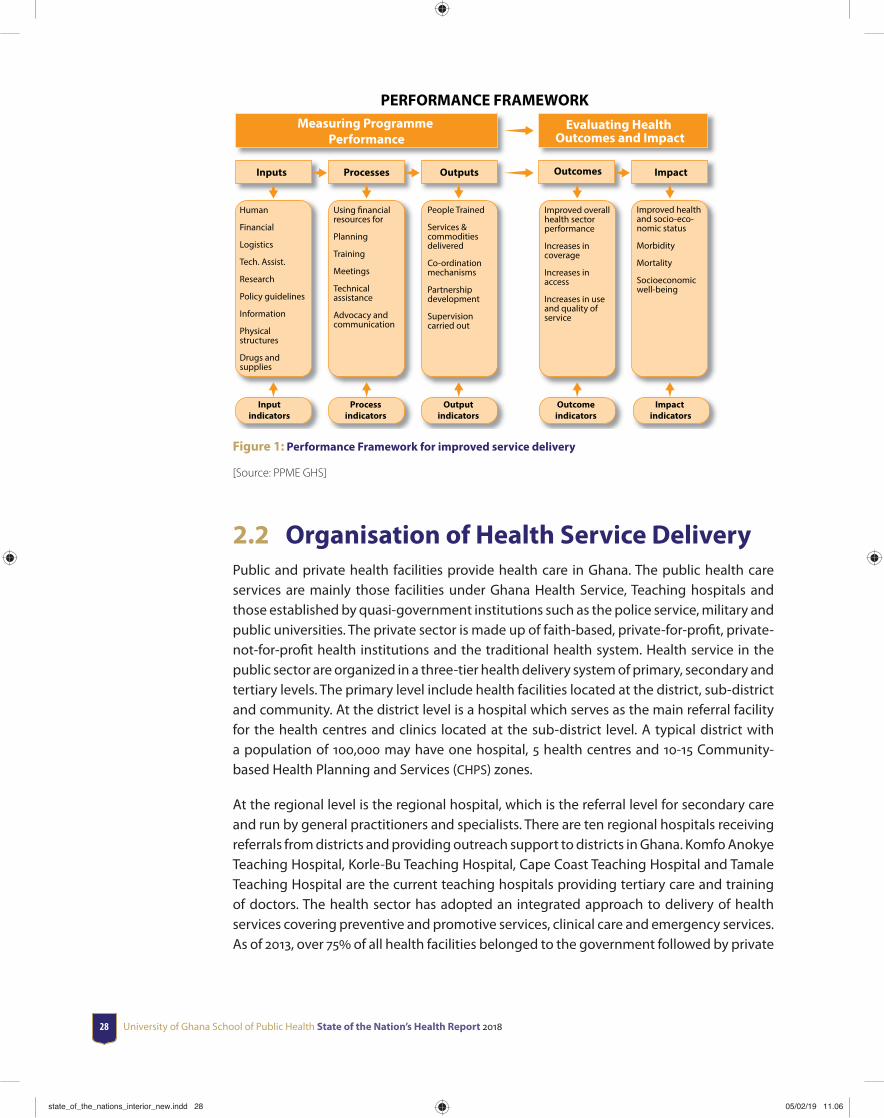
2.1 IntroductionService provision or delivery is the act of providing services to clients in the health system. It is an immediate output of the various inputs in health delivery. These inputs into the health system are health workforce, procurement and supplies, and fi nancing. The performance framework assumes that increased inputs will lead to improved service delivery and enhanced access to services and ultimately to improved health outcomes and impact (Figure 1). This has become necessary because of mounting pressure on health systems all over the world to deliver services equitably and effi ciently since these attributes are critical for achieving improved health status. Decision-makers therefore have to accurately track health progress and performance, evaluate impact of interventions and investments, and ensure accountability at country and global levels. Information is therefore needed to track progress particularly on how the health system respond to increased inputs, and improved processes result in improved health status. The objective of this chapter is to provide information on the status of current health indicators (as well as past trends, as applicable) which are key characteristics of good service delivery in the Ghanaian health system.
state_of_the_nations_interior_new.indd 27state_of_the_nations_interior_new.indd 27 05/02/19 11.0605/02/19 11.06
University of Ghana School of Public Health State of the Nation’s Health Report 201828
PERFORMANCE FRAMEWORKMeasuring Programme
PerformanceEvaluating Health
Outcomes and Impact
Inputs Processes Outputs Outcomes Impact
Improved health and socio-eco-nomic status
Morbidity
Mortality
Socioeconomic well-being
Improved overall health sector performance
Increases in coverage
Increases in access
Increases in use and quality of service
People Trained
Services & commodities delivered
Co-ordination mechanisms
Partnership development
Supervision carried out
Using financial resources for
Planning
Training
Meetings
Technical assistance
Advocacy and communication
Human
Financial
Logistics
Tech. Assist.
Research
Policy guidelines
Information
Physical structures
Drugs and supplies
Input indicators
Process indicators
Output indicators
Outcome indicators
Impact indicators
Figure 1: Performance Framework for improved service delivery
[Source: PPME GHS]
2.2 Organisation of Health Service DeliveryPublic and private health facilities provide health care in Ghana. The public health care services are mainly those facilities under Ghana Health Service, Teaching hospitals and those established by quasi-government institutions such as the police service, military and public universities. The private sector is made up of faith-based, private-for-profi t, private-not-for-profi t health institutions and the traditional health system. Health service in the public sector are organized in a three-tier health delivery system of primary, secondary and tertiary levels. The primary level include health facilities located at the district, sub-district and community. At the district level is a hospital which serves as the main referral facility for the health centres and clinics located at the sub-district level. A typical district with a population of 100,000 may have one hospital, 5 health centres and 10-15 Community-based Health Planning and Services (CHPS) zones.
At the regional level is the regional hospital, which is the referral level for secondary care and run by general practitioners and specialists. There are ten regional hospitals receiving referrals from districts and providing outreach support to districts in Ghana. Komfo Anokye Teaching Hospital, Korle-Bu Teaching Hospital, Cape Coast Teaching Hospital and Tamale Teaching Hospital are the current teaching hospitals providing tertiary care and training of doctors. The health sector has adopted an integrated approach to delivery of health services covering preventive and promotive services, clinical care and emergency services. As of 2013, over 75 of all health facilities belonged to the government followed by private
state_of_the_nations_interior_new.indd 28state_of_the_nations_interior_new.indd 28 05/02/19 11.0605/02/19 11.06
Health Service Delivery and Outcome 29
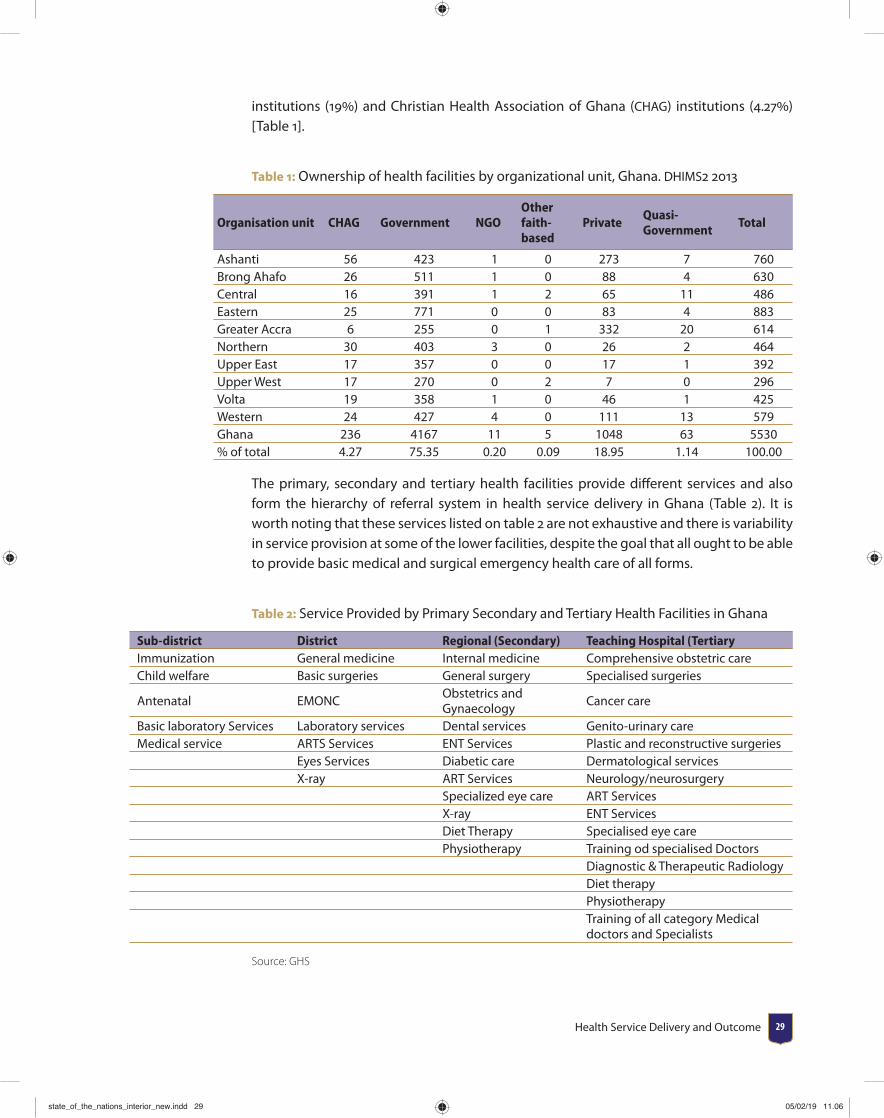
institutions (19) and Christian Health Association of Ghana (CHAG) institutions (4.27) [Table 1].
Table 1: Ownership of health facilities by organizational unit, Ghana. DHIMS2 2013
Organisation unit CHAG Government NGOOther faith-based
PrivateQuasi-Government
Total
Ashanti 56 423 1 0 273 7 760Brong Ahafo 26 511 1 0 88 4 630Central 16 391 1 2 65 11 486Eastern 25 771 0 0 83 4 883Greater Accra 6 255 0 1 332 20 614Northern 30 403 3 0 26 2 464Upper East 17 357 0 0 17 1 392Upper West 17 270 0 2 7 0 296Volta 19 358 1 0 46 1 425Western 24 427 4 0 111 13 579Ghana 236 4167 11 5 1048 63 5530% of total 4.27 75.35 0.20 0.09 18.95 1.14 100.00
The primary, secondary and tertiary health facilities provide diff erent services and also form the hierarchy of referral system in health service delivery in Ghana (Table 2). It is worth noting that these services listed on table 2 are not exhaustive and there is variability in service provision at some of the lower facilities, despite the goal that all ought to be able to provide basic medical and surgical emergency health care of all forms.
Table 2: Service Provided by Primary Secondary and Tertiary Health Facilities in Ghana
Sub-district District Regional (Secondary) Teaching Hospital (TertiaryImmunization General medicine Internal medicine Comprehensive obstetric careChild welfare Basic surgeries General surgery Specialised surgeries
Antenatal EMONCObstetrics andGynaecology
Cancer care
Basic laboratory Services Laboratory services Dental services Genito-urinary careMedical service ARTS Services ENT Services Plastic and reconstructive surgeries
Eyes Services Diabetic care Dermatological servicesX-ray ART Services Neurology/neurosurgery
Specialized eye care ART ServicesX-ray ENT ServicesDiet Therapy Specialised eye carePhysiotherapy Training od specialised Doctors
Diagnostic & Therapeutic RadiologyDiet therapyPhysiotherapyTraining of all category Medical doctors and Specialists
Source: GHS
state_of_the_nations_interior_new.indd 29state_of_the_nations_interior_new.indd 29 05/02/19 11.0605/02/19 11.06
University of Ghana School of Public Health State of the Nation’s Health Report 201830
The performance of the health system is often measured using indicators at various levels of service delivery including the impact of health interventions in reducing mortality. Some of the impact indicators include Life Expectancy1, Maternal Mortality Rate (MMR)2, Under-5 Mortality Rate (U5MR)3, Infant MortaIity Rate (IMR)4, Neonatal Mortality Rate (NMR)5, as well as burden of specifi c diseases.
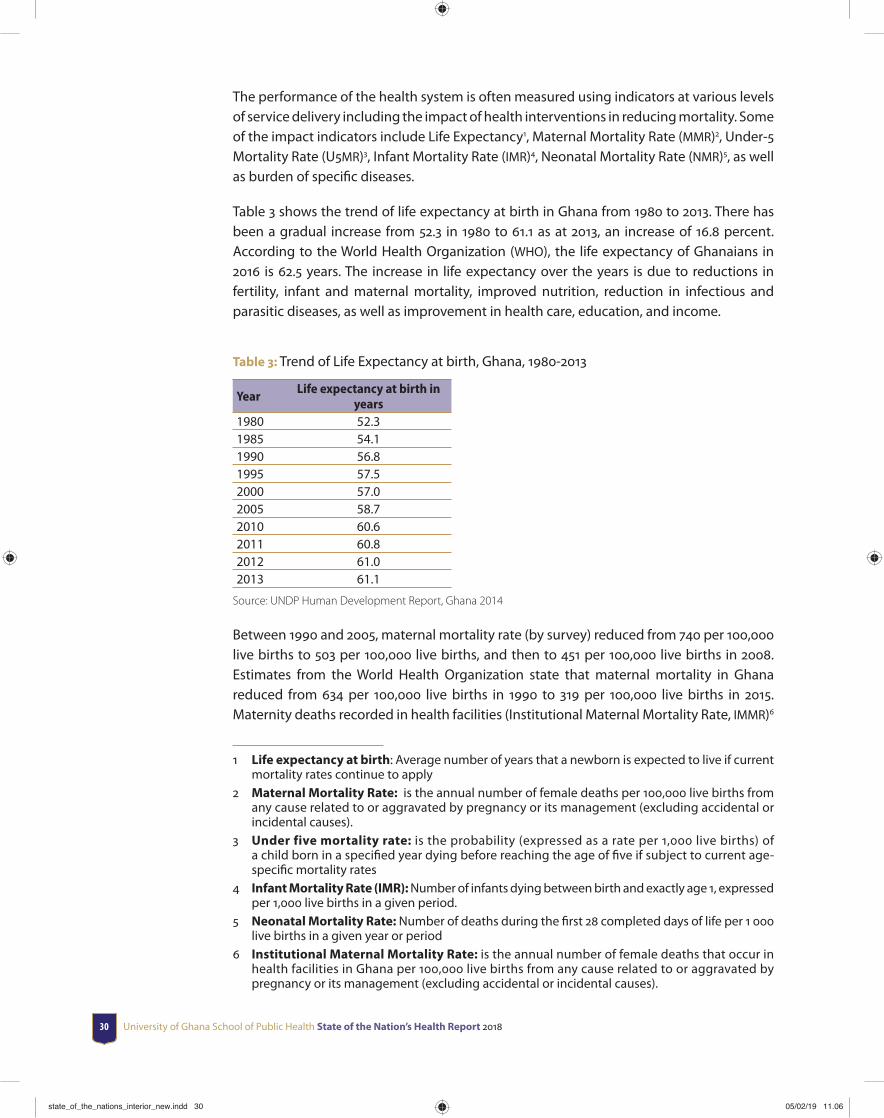
Table 3 shows the trend of life expectancy at birth in Ghana from 1980 to 2013. There has been a gradual increase from 52.3 in 1980 to 61.1 as at 2013, an increase of 16.8 percent. According to the World Health Organization (WHO), the life expectancy of Ghanaians in 2016 is 62.5 years. The increase in life expectancy over the years is due to reductions in fertility, infant and maternal mortality, improved nutrition, reduction in infectious and parasitic diseases, as well as improvement in health care, education, and income.
Table 3: Trend of Life Expectancy at birth, Ghana, 1980-2013
YearLife expectancy at birth in
years1980 52.31985 54.11990 56.81995 57.52000 57.02005 58.72010 60.62011 60.82012 61.02013 61.1
Source: UNDP Human Development Report, Ghana 2014
Between 1990 and 2005, maternal mortality rate (by survey) reduced from 740 per 100,000 live births to 503 per 100,000 live births, and then to 451 per 100,000 live births in 2008. Estimates from the World Health Organization state that maternal mortality in Ghana reduced from 634 per 100,000 live births in 1990 to 319 per 100,000 live births in 2015. Maternity deaths recorded in health facilities (Institutional Maternal Mortality Rate, IMMR)6
1 Life expectancy at birth: Average number of years that a newborn is expected to live if current mortality rates continue to apply
2 Maternal Mortality Rate: is the annual number of female deaths per 100,000 live births from any cause related to or aggravated by pregnancy or its management (excluding accidental or incidental causes).
3 Under five mortality rate: is the probability (expressed as a rate per 1,000 live births) of a child born in a specifi ed year dying before reaching the age of fi ve if subject to current age-specifi c mortality rates
4 Infant Mortality Rate (IMR): Number of infants dying between birth and exactly age 1, expressed per 1,000 live births in a given period.
5 Neonatal Mortality Rate: Number of deaths during the fi rst 28 completed days of life per 1 000 live births in a given year or period
6 Institutional Maternal Mortality Rate: is the annual number of female deaths that occur in health facilities in Ghana per 100,000 live births from any cause related to or aggravated by pregnancy or its management (excluding accidental or incidental causes).
state_of_the_nations_interior_new.indd 30state_of_the_nations_interior_new.indd 30 05/02/19 11.0605/02/19 11.06
Health Service Delivery and Outcome 31
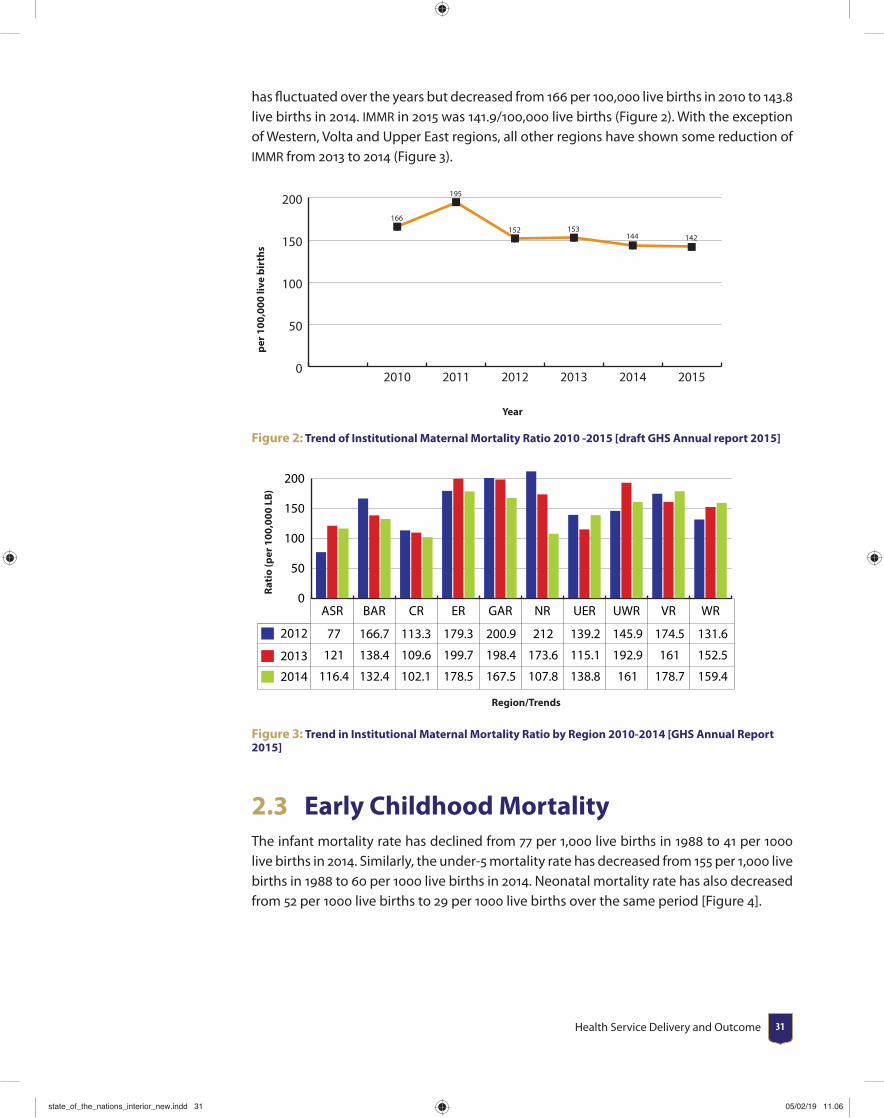
has fl uctuated over the years but decreased from 166 per 100,000 live births in 2010 to 143.8 live births in 2014. IMMR in 2015 was 141.9/100,000 live births (Figure 2). With the exception of Western, Volta and Upper East regions, all other regions have shown some reduction of IMMR from 2013 to 2014 (Figure 3).
0
50
100
150
200166
195
152 153144 142
201520142013201220112010
per 1
00,0
00 li
ve b
irth
s
Year
Figure 2: Trend of Institutional Maternal Mortality Ratio 2010 -2015 [draft GHS Annual report 2015]
0
50
100
150
200
2014
2013
2012
WRVRUWRUERNRGARERCRBARASR
77 166.7 113.3 179.3 200.9 212 139.2 145.9 174.5 131.6
121 138.4 109.6 199.7 198.4 173.6 115.1 192.9 161 152.5
116.4 132.4 102.1 178.5 167.5 107.8 138.8 161 178.7 159.4
Rati
o (p
er 1
00,0
00 L
B)
Region/Trends
Figure 3: Trend in Institutional Maternal Mortality Ratio by Region 2010-2014 [GHS Annual Report 2015]
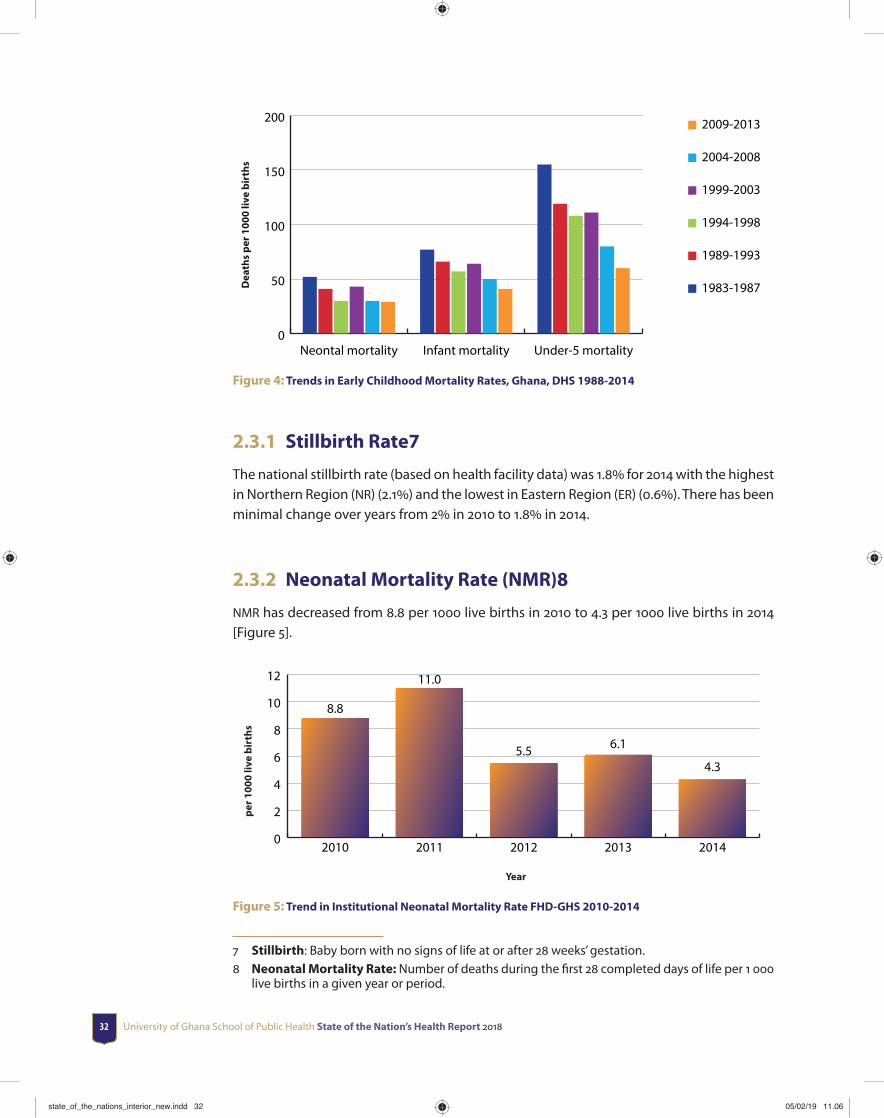
2.3 Early Childhood MortalityThe infant mortality rate has declined from 77 per 1,000 live births in 1988 to 41 per 1000 live births in 2014. Similarly, the under-5 mortality rate has decreased from 155 per 1,000 live births in 1988 to 60 per 1000 live births in 2014. Neonatal mortality rate has also decreased from 52 per 1000 live births to 29 per 1000 live births over the same period [Figure 4].
state_of_the_nations_interior_new.indd 31state_of_the_nations_interior_new.indd 31 05/02/19 11.0605/02/19 11.06
University of Ghana School of Public Health State of the Nation’s Health Report 201832
0
50
100
150
200 2009-2013
2004-2008
1999-2003
1994-1998
1989-1993
1983-1987
Under-5 mortalityInfant mortalityNeontal mortality
Dea
ths
per 1
000
live
birt
hs
Figure 4: Trends in Early Childhood Mortality Rates, Ghana, DHS 1988-2014
2.3.1 Stillbirth Rate7
The national stillbirth rate (based on health facility data) was 1.8 for 2014 with the highest in Northern Region (NR) (2.1) and the lowest in Eastern Region (ER) (0.6). There has been minimal change over years from 2 in 2010 to 1.8 in 2014.
2.3.2 Neonatal Mortality Rate (NMR)8
NMR has decreased from 8.8 per 1000 live births in 2010 to 4.3 per 1000 live births in 2014 [Figure 5].
per 1
000
live
birt
hs
Year
0
2
4
6
8
10
12
20142013201220112010
8.8
11.0
5.5 6.1
4.3
Figure 5: Trend in Institutional Neonatal Mortality Rate FHD-GHS 2010-2014
7 Stillbirth: Baby born with no signs of life at or after 28 weeks’ gestation.8 Neonatal Mortality Rate: Number of deaths during the fi rst 28 completed days of life per 1 000
live births in a given year or period.
state_of_the_nations_interior_new.indd 32state_of_the_nations_interior_new.indd 32 05/02/19 11.0605/02/19 11.06
Health Service Delivery and Outcome 33
2.4 Status of Priority Disease ConditionsThese diseases have been prioritized based on their endemicity, prevalence, number of outpatients visits in various health facility with that condition, periodic outbreaks of the disease and fatality in Ghana.
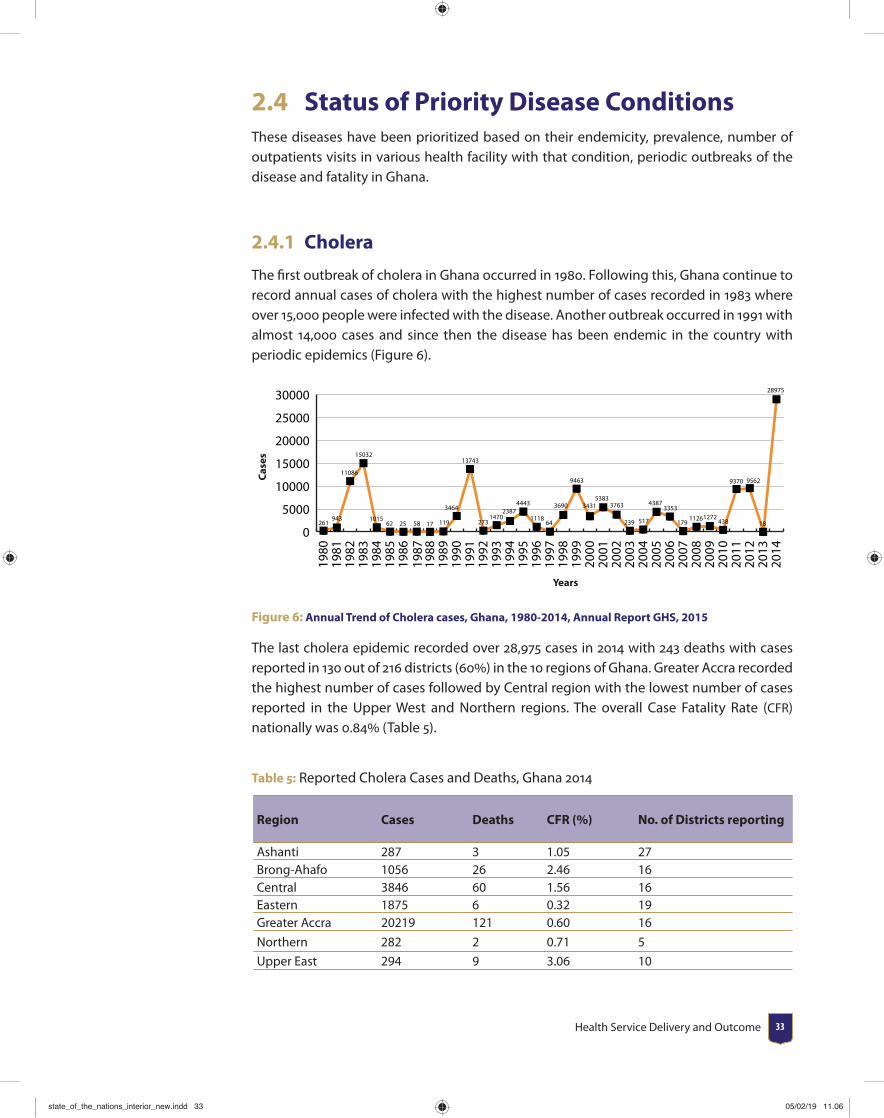
2.4.1 Cholera
The fi rst outbreak of cholera in Ghana occurred in 1980. Following this, Ghana continue to record annual cases of cholera with the highest number of cases recorded in 1983 where over 15,000 people were infected with the disease. Another outbreak occurred in 1991 with almost 14,000 cases and since then the disease has been endemic in the country with periodic epidemics (Figure 6).
0
5000
10000
15000
20000
25000
30000
261943
11086
15032
101562 25 58 17 119
3464
13743
2731470
23874443
111864
3690
9463
34315383
3763
239 517
43873353
17911261272
438
9370 9562
18
28975
2014
2013
2012
2011
2010
2009
2008
2007
2006
2005
2004
2003
2002
2001
2000
1999
1998
1997
1996
1995
1994
1993
1992
1991
1990
1989
1988
1987
1986
1985
1984
1983
1982
1981
1980
Case
s
Years
Figure 6: Annual Trend of Cholera cases, Ghana, 1980-2014, Annual Report GHS, 2015
The last cholera epidemic recorded over 28,975 cases in 2014 with 243 deaths with cases reported in 130 out of 216 districts (60) in the 10 regions of Ghana. Greater Accra recorded the highest number of cases followed by Central region with the lowest number of cases reported in the Upper West and Northern regions. The overall Case Fatality Rate (CFR) nationally was 0.84 (Table 5).
Table 5: Reported Cholera Cases and Deaths, Ghana 2014
Region Cases Deaths CFR (%) No. of Districts reporting
Ashanti 287 3 1.05 27Brong-Ahafo 1056 26 2.46 16Central 3846 60 1.56 16Eastern 1875 6 0.32 19Greater Accra 20219 121 0.60 16
Northern 282 2 0.71 5
Upper East 294 9 3.06 10
state_of_the_nations_interior_new.indd 33state_of_the_nations_interior_new.indd 33 05/02/19 11.0605/02/19 11.06
University of Ghana School of Public Health State of the Nation’s Health Report 201834
Region Cases Deaths CFR (%) No. of Districts reporting
Upper West 36 1 2.78 3
Volta 651 8 1.23 7Western 429 7 1.63 11Total (Ghana) 28,975 243 0.84 130
Source: Annual Report GHS 2015
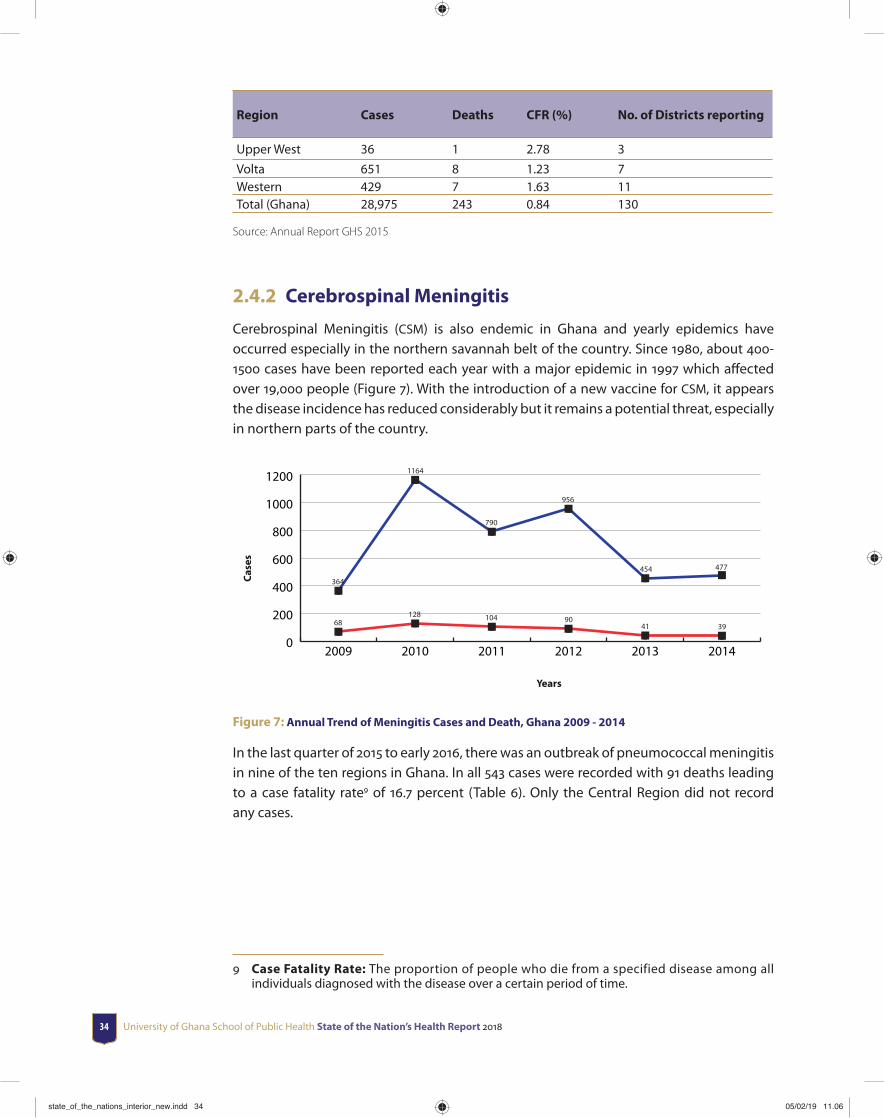
2.4.2 Cerebrospinal Meningitis
Cerebrospinal Meningitis (CSM) is also endemic in Ghana and yearly epidemics have occurred especially in the northern savannah belt of the country. Since 1980, about 400-1500 cases have been reported each year with a major epidemic in 1997 which aff ected over 19,000 people (Figure 7). With the introduction of a new vaccine for CSM, it appears the disease incidence has reduced considerably but it remains a potential threat, especially in northern parts of the country.
0
200
400
600
800
1000
1200
68128 104 90
41 39
364
1164
790
956
454 477
201420132012201120102009
Case
s
Years
Figure 7: Annual Trend of Meningitis Cases and Death, Ghana 2009 - 2014
In the last quarter of 2015 to early 2016, there was an outbreak of pneumococcal meningitis in nine of the ten regions in Ghana. In all 543 cases were recorded with 91 deaths leading to a case fatality rate9 of 16.7 percent (Table 6). Only the Central Region did not record any cases.
9 Case Fatality Rate: The proportion of people who die from a specified disease among all individuals diagnosed with the disease over a certain period of time.
state_of_the_nations_interior_new.indd 34state_of_the_nations_interior_new.indd 34 05/02/19 11.0605/02/19 11.06

Health Service Delivery and Outcome 35
Table 6: Distribution of 2015/2016 Pneumococcal Meningitis Outbreak in Ghana
Region Number of Cases Number of Deaths Case Fatality Rate (%)Brong Ahafo 359 52 14.5Northern 62 15 24.2Upper East 47 2 4.2Upper West 44 9 20.4Ashanti 18 8 44.4Volta 7 1 14.3Eastern 4 3 75.0Western 2 1 50.0National 543 91 16.7
2.4.3 Malaria
Upper WestRegion37.8%
Northern Region40%
WesternRegion
39%
EasternRegion29.5%
AshantiRegion16.6%
Brong Ahafo Region 26.5%
Upper East Region 11.7%
Greater Accra Region 11.2%
Central Region 37.9%
Volt
a Re
gion
25.
2%
Figure 8: Survey Results DHS 2014: Prevalence of Malaria in Children 6-59months
state_of_the_nations_interior_new.indd 35state_of_the_nations_interior_new.indd 35 05/02/19 11.0605/02/19 11.06

University of Ghana School of Public Health State of the Nation’s Health Report 201836
The 2014 Ghana Demographic and Health Survey showed that Northern region has the highest prevalence of malaria of 40 followed by Western region (39) with Greater Accra region having the lowest prevalence of 11.2 among children 6-59 months (Figure 8). Table 7 provides information on key malaria indicators for 2014. The overall malaria prevalence rate was 26.7 in 2014 with under 5 case fatality ratio of 0.51 which is a decrease from 0.6 in 2013.
Table 7: Malaria indicators, 2014. [Source: Annual Report, GHS 2015]
INDICATOR VALUE IN 2014Parasitemia prevalence: among those aged 6–59 months with malaria infection (by microscopy)
26.7%
Under fi ve Case fatality rate 0.51%All-cause under 5 mortality rate 60/1000 live birthConfi rmed malaria cases (microscopy and RDT) per 1000 population 138Percentage of pregnant women on intermittent preventive treatment (at least two doses of SP)
67.5%
Percentage of households with at least one insecticide treated nets (LLINs) 68.3%Percentage of children under 5 years old who slept under an insecticide-treated net the previous night
58.8%
Percentage of pregnant women who slept under an insecticide-treated net the previous night
54.6%
Percentage of structures in targeted districts sprayed by indoor residual spraying in the last 12 months
90.5%
Percentage of reported uncomplicated malaria cases (both suspected and confi rmed) treated with ACT at health facilities
74.3%
2.4.4 National Tuberculosis Control Programme
The national tuberculosis (TB) prevalence survey was completed in 2014. The results of the survey revealed a national prevalence rate of 290 per 100,000 population (Bonsu et al., 2014). Detailed analysis also revealed a bacteriological prevalence of 356 per 100,000 population and smear positive rate of 105 per 100,000 population. The proportion of childhood TB cases is expected to be 10 of reported cases.
Ghana has also made progress in the proportion of TB patients completing TB treatment and declared cured (successful treatment outcome) and those who cannot be traced for a period of two months or more after initiation of treatment (Lost to Follow Up10). Trend of successful treatment outcomes has progressed upwards annually and currently at 86.5 which is above the WHO recommended global target of 85. The Lost to Follow Up rate is 3. Regions have maintained high treatment success outcome in recent times. All regions except Eastern Region achieved and exceeded the 85 global treatment success target in 2014. All the Teaching Hospitals could not make this target largely due to the large numbers of critically ill patients referred for treatment.
10 Loss to Follow Up Rate: A proportion of patients whose treatment is interrupted for 2 consecutive months or more after initiation of treatment to the number of patients who were initiated treatment within the same period.
state_of_the_nations_interior_new.indd 36state_of_the_nations_interior_new.indd 36 05/02/19 11.0605/02/19 11.06

Health Service Delivery and Outcome 37
2.4.5 HIV/AIDS
Health facilities in Ghana test pregnant women for HIV as part of the Prevention of Mother to Child Transmission (PMTCT) of HIV strategy. In 2014, 601,726 pregnant women tested to know their HIV sero-status. Of the number that tested, 12, 583 were HIV positive, which is 2 of those who tested within the reporting period. Also, 8, 299 HIV positive pregnant women who were due to receive ARVs were given ARVs to prevent mother to child transmission of HIV (Table 8).
Table 8: Trend of pregnant women tested and put on ART
2010 2011 2012 2013 2014No pregnant women tested
520,000 627,180 548,933 492,622 601,726
# positive 10,984 15,783 11,145 9,508 12,583% positive 2.1 2.5 2 2 2# pregnant women on ART for PMTCT
5,845 (53%) 8,057 (51%) 7,781 (70%) 7,266 (76%) 8,299 (66%)
Source: NACP Annual Report 2014
HIV testing and counselling services (HTC) is another HIV prevention and control strategy adopted by the National AIDS/STIs Control Programme (NACP). At the end of 2014, 798, 763 people received HTC services. Out of the number that tested to know their HIV status in the period under review, a total of 43, 694 were HIV positive, indicating a period prevalence of 5.5.
state_of_the_nations_interior_new.indd 37state_of_the_nations_interior_new.indd 37 05/02/19 11.0605/02/19 11.06
University of Ghana School of Public Health State of the Nation’s Health Report 201838
Ghana has also been implementing the early infant diagnosis services (EID)11 for babies who are exposed to HIV across the country. In 2014, 2,878 HIV exposed babies were screened for EID. Of the number screened, 8 tested positive for HIV. From table 8, it is clear that gaps exist in EID services because 12, 583 women tested positive to HIV but only 2, 878 babies were screened for EID indicating that about 77 of babies who were exposed to HIV were not screened. According to the EID policy babies who test positive to HIV are put on ARV therapy12.
During the year under review, a total of 14, 994 people (comprising 4,179 males and 10,815 females) were put on ART. A total of 83, 712 persons (comprising 4, 581 children and 79, 131 adults) are currently alive and are on ART at the end of 2014.
2.4.6 Neglected Tropical Diseases (NTDs)
Ghana is burdened with a number of neglected tropical diseases (NTDs). Notable among them are: Lymphatic Filariasis (elephantiasis), Onchocerciasis (river blindness), Trachoma, Schistosomiasis (Bilharzia), Soil transmitted helminthiasis (worm), Buruli ulcer, Yaws, Leprosy, Guinea worm, Human African Trypanosomiasis (sleeping sickness), and Cutaneous Leishmaniasis. The Government of Ghana through the Ghana Health Service has developed a fi ve year strategic plan (2013 -2017) also known as the master plan to guide programmes and activities to address the morbidity and mortality associated with NTDs. The NTD Programme manages fi ve (5) of the NTDs for which the main strategy of intervention is annual/or bi-annual mass drug administration (MDA) complemented by morbidity control (clinical management of complications) and public education. These fi ve NTDs are Lymphatic Filariasis (elephantiasis), Onchocerciasis, Trachoma, Schistosomiasis, and Soil transmitted helminthiasis.
Lymphatic Filariasis is endemic in 8 regions and in 98 of the 216 districts in Ghana. Only Ashanti and Volta regions are not endemic for Lymphatic Filariasis. The Neglected Tropical Disease Program (NTDP) has completed between 7-13 rounds of Mass Drug Administration (MDA) in all endemic districts and transmission has been demonstrated to have been broken in 76 endemic districts. MDA was started in 2001 in some selected endemic areas but this reached national coverage in 2006. By 2014, 69 districts had stopped MDA after passing the transmission assessment survey while 29 others had persistent microfi laraemia (mf) prevalence (≥1). LF is targeted for elimination by 2020. Twenty two districts are now known to be hotspots for Lymphatic fi lariasis (Table 9).
11 Early infant diagnosis: Testing of infants to determine their HIV status following possible exposure to HIV during pregnancy, delivery and postpartum through breastfeeding.
12 Antiretroviral therapy: The use of a combination of three or more ARV drugs for treating HIV infection.
state_of_the_nations_interior_new.indd 38state_of_the_nations_interior_new.indd 38 05/02/19 11.0605/02/19 11.06
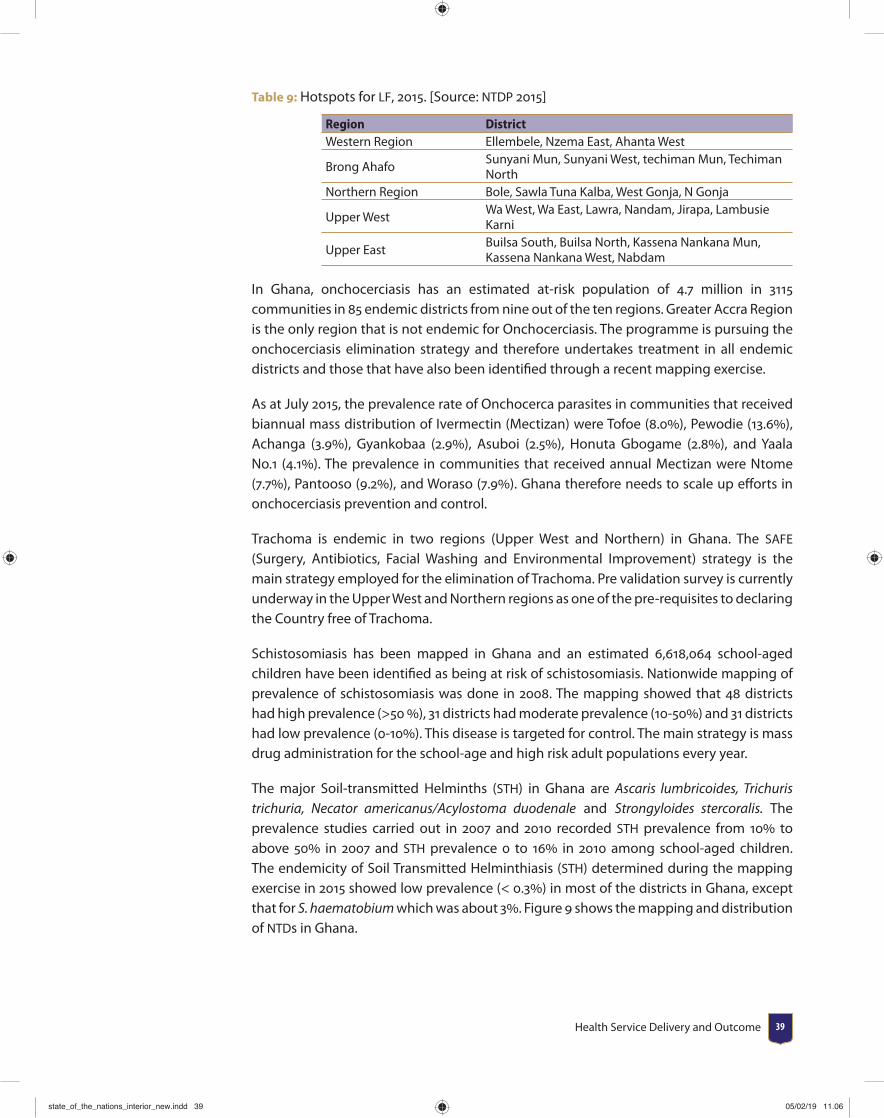
Health Service Delivery and Outcome 39
Table 9: Hotspots for LF, 2015. [Source: NTDP 2015]
Region DistrictWestern Region Ellembele, Nzema East, Ahanta West
Brong AhafoSunyani Mun, Sunyani West, techiman Mun, Techiman North
Northern Region Bole, Sawla Tuna Kalba, West Gonja, N Gonja
Upper WestWa West, Wa East, Lawra, Nandam, Jirapa, Lambusie Karni
Upper EastBuilsa South, Builsa North, Kassena Nankana Mun, Kassena Nankana West, Nabdam
In Ghana, onchocerciasis has an estimated at-risk population of 4.7 million in 3115 communities in 85 endemic districts from nine out of the ten regions. Greater Accra Region is the only region that is not endemic for Onchocerciasis. The programme is pursuing the onchocerciasis elimination strategy and therefore undertakes treatment in all endemic districts and those that have also been identifi ed through a recent mapping exercise.
As at July 2015, the prevalence rate of Onchocerca parasites in communities that received biannual mass distribution of Ivermectin (Mectizan) were Tofoe (8.0), Pewodie (13.6), Achanga (3.9), Gyankobaa (2.9), Asuboi (2.5), Honuta Gbogame (2.8), and Yaala No.1 (4.1). The prevalence in communities that received annual Mectizan were Ntome (7.7), Pantooso (9.2), and Woraso (7.9). Ghana therefore needs to scale up eff orts in onchocerciasis prevention and control.
Trachoma is endemic in two regions (Upper West and Northern) in Ghana. The SAFE (Surgery, Antibiotics, Facial Washing and Environmental Improvement) strategy is the main strategy employed for the elimination of Trachoma. Pre validation survey is currently underway in the Upper West and Northern regions as one of the pre-requisites to declaring the Country free of Trachoma.
Schistosomiasis has been mapped in Ghana and an estimated 6,618,064 school-aged children have been identifi ed as being at risk of schistosomiasis. Nationwide mapping of prevalence of schistosomiasis was done in 2008. The mapping showed that 48 districts had high prevalence (>50 ), 31 districts had moderate prevalence (10-50) and 31 districts had low prevalence (0-10). This disease is targeted for control. The main strategy is mass drug administration for the school-age and high risk adult populations every year.
The major Soil-transmitted Helminths (STH) in Ghana are Ascaris lumbricoides, Trichuris trichuria, Necator americanus/Acylostoma duodenale and Strongyloides stercoralis. The prevalence studies carried out in 2007 and 2010 recorded STH prevalence from 10 to above 50 in 2007 and STH prevalence 0 to 16 in 2010 among school-aged children. The endemicity of Soil Transmitted Helminthiasis (STH) determined during the mapping exercise in 2015 showed low prevalence (< 0.3) in most of the districts in Ghana, except that for S. haematobium which was about 3. Figure 9 shows the mapping and distribution of NTDs in Ghana.
state_of_the_nations_interior_new.indd 39state_of_the_nations_interior_new.indd 39 05/02/19 11.0605/02/19 11.06

University of Ghana School of Public Health State of the Nation’s Health Report 201840
Upper WestRegion
Northern Region
WesternRegion
EasternRegion
AshantiRegion
Brong Ahafo Region
Upper East Region
Greater Accra Region
Central Region
Volt
a Re
gion
LegendTrachoma, LF,Oncho, Schisto, STH
LF, Oncho, Schisto, STH
LF, Schisto, STH
Oncho, Schisto, STH
Figure 9: Map showing the distribution of NTD
Source: GHS, 2007
2.4.7 Non-communication Diseases (NCDs)
In Ghana, major NCDs include cardiovascular diseases (CVDs), endocrine disorders, chiefl y diabetes, haemoglobinopathies including sickle cell disorders, cancers, chronic respiratory diseases particularly asthma, and injuries. An estimated 86,200 NCD deaths occur each year in Ghana with 55.5 occurring in persons under age 70 years in 2011. An estimated 50,000 NCD deaths occur in males and 36,000 deaths occur in females. The age standardized NCD death rate is 817 per 100,000. In 2008, NCDs accounted for an estimated 34 deaths and 31 of disease burden in Ghana. CVDs are the leading cause of NCD-deaths with an estimated 35,000 deaths or 15 of the total deaths. NCDs cause an estimated 2.32 million disability-adjusted life years (DALYs) representing 10,500 DALYs lost per 100,000 populations. Table 10 shows increasing trend of all the key NCDs from 2011-2014.
state_of_the_nations_interior_new.indd 40state_of_the_nations_interior_new.indd 40 05/02/19 11.0605/02/19 11.06
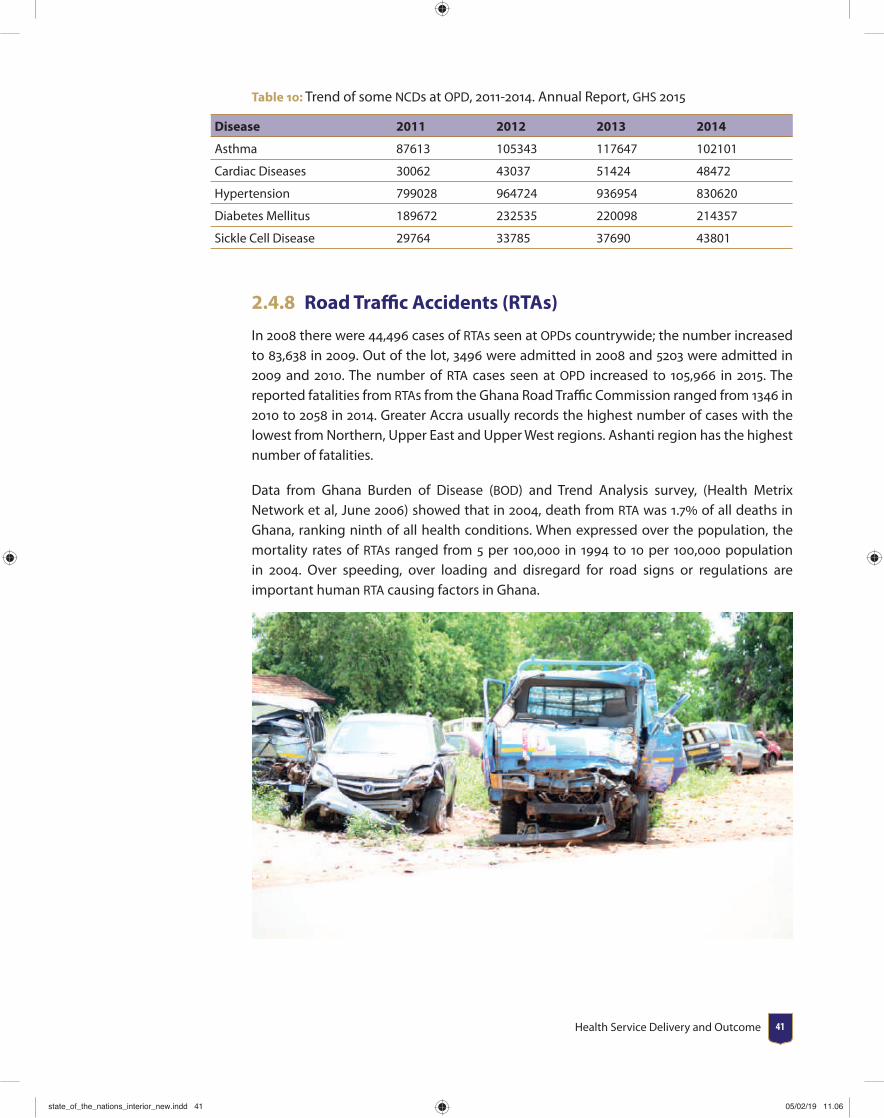
Health Service Delivery and Outcome 41
Table 10: Trend of some NCDs at OPD, 2011-2014. Annual Report, GHS 2015
Disease 2011 2012 2013 2014
Asthma 87613 105343 117647 102101
Cardiac Diseases 30062 43037 51424 48472
Hypertension 799028 964724 936954 830620
Diabetes Mellitus 189672 232535 220098 214357
Sickle Cell Disease 29764 33785 37690 43801
2.4.8 Road Traffi c Accidents (RTAs)
In 2008 there were 44,496 cases of RTAs seen at OPDs countrywide; the number increased to 83,638 in 2009. Out of the lot, 3496 were admitted in 2008 and 5203 were admitted in 2009 and 2010. The number of RTA cases seen at OPD increased to 105,966 in 2015. The reported fatalities from RTAs from the Ghana Road Traffi c Commission ranged from 1346 in 2010 to 2058 in 2014. Greater Accra usually records the highest number of cases with the lowest from Northern, Upper East and Upper West regions. Ashanti region has the highest number of fatalities.
Data from Ghana Burden of Disease (BOD) and Trend Analysis survey, (Health Metrix Network et al, June 2006) showed that in 2004, death from RTA was 1.7 of all deaths in Ghana, ranking ninth of all health conditions. When expressed over the population, the mortality rates of RTAs ranged from 5 per 100,000 in 1994 to 10 per 100,000 population in 2004. Over speeding, over loading and disregard for road signs or regulations are important human RTA causing factors in Ghana.
state_of_the_nations_interior_new.indd 41state_of_the_nations_interior_new.indd 41 05/02/19 11.0605/02/19 11.06

University of Ghana School of Public Health State of the Nation’s Health Report 201842
2.5 Top 10 Causes of Out- Patient Department (OPD) cases and Deaths
Malaria continues to top the list accounting for 35 of OPD cases and 7.78 of deaths in 2015. Hypertension features prominently accounting for about 4 of OPD cases and 4.6 of deaths. Other Non -communicable Diseases (NCDs) such as cardiovascular accidents and congestive cardiac failure are major causes of death in Ghana. Table 11 provides information on the top 10 OPD cases as well as top 10 causes of death in 2015.
Table 11: Top 10 OPD cases and Top 10 causes of death 2015, [Source DHIMS2, March 2016]
TOP OPD CONDITIONS AND DEATHS
#
2015 2015
DiseaseNumber of OPD Cases
% of Total DiseaseNumber of Deaths
% of Total
1 Malaria 7316615 35.04 Septicaemia 1435 19.54
2Upper Respiratory Tract Infections
3379534 16.19Cerebrovascular Accident
1418 19.31
3 Diarrhoea Diseases 1573569 7.54 Pneumonia 956 13.02
4Rheumatism & Other Joint Pains
1474615 7.06 Anaemia 818 11.14
5 Skin Diseases 1335465 6.40 HIV/AIDS 750 10.21
6 Anaemia 993135 4.76 Malaria 571 7.78
7 Intestinal Worms 855677 4.10Congestive Cardiac Failure
552 7.52
8 Hypertension 829655 3.97 Hypertension 340 4.63
9Acute Urinary Tract Infection
603607 2.89 Asphyxia 283 3.85
10 Acute Eye Infection 535487 2.56 Liver Disease 220 3.00TOTAL 20878266 100 7343 100
2.6 Nutritional StatusThe trend of some major nutrition indicators in Ghana from 1988 to 2014 is shown in Figure 10.
state_of_the_nations_interior_new.indd 42state_of_the_nations_interior_new.indd 42 05/02/19 11.0605/02/19 11.06

Health Service Delivery and Outcome 43
0
5
10
15
20
25
30
35 DHS 2014
MICS 2011
DHS 2008
DHS 2003
DHS 1998
DHS 1993
DHS 1988
OverweightUnderweightWastingStunting
Nutrition Indicators
Figure 10: Trend of some Nutrition Indicators in Ghana, DHS 1988-2014; MICS 2011
From fi gure 11, overall, 19 per cent of children under fi ve are moderately stunted in Ghana, with 10 percent being severely stunted. The proportion of children under fi ve who are stunted13 decreased from 34 percent in 1988 to peak at 35 percent in 2003 before decreasing to 19 percent in 2014. By region, stunting ranges from 10 percent in Greater Accra to 33 percent in the Northern region.
Five percent of children under fi ve are wasted14 with 1 percent severely wasted. As per Figure 11, the proportion of children who are wasted has also decreased over the past 15 years from 14 percent in 1993 to 5 percent in 2014. Wasting is more common in the Upper East (9 percent), Northern (6 percent) and Central (8 percent) regions than elsewhere.
Overall, 11 percent of Ghanaian children are underweight, with 2 percent classifi ed as severely underweight. The proportion of underweight15 children decreased from 23 percent in 1988 and 1993 to 11 percent in 2014. The proportion of children who are underweight is greater in rural areas (13 percent) than urban areas (9 percent) and ranges from 6 percent in the Brong Ahafo region, 8 percent in Eastern region to 14 percent in Eastern and Upper West regions and 20 percent in the Northern region.
According to Ghana Demographic and Health Survey (GDHS) 2014, 66 percent of children 6-59 months are anaemic (Hemoglobin level, Hb< 11g/dl), with 27 mildly anaemic (Hb=10-
13 Under-fi ve stunting: Percentage of children under age 5 whose height is two standard deviations or more below the median height-for-age of the reference population.
14 Under-fi ve wasting: Percentage of children under age 5 whose weight is two standard deviations or more below the median weight-for-height of the reference population.
15 Under-fi ve underweight: Percentage of children under age 5 whose weight is less than two standard deviations below the median weight-for-age of the reference population.
state_of_the_nations_interior_new.indd 43state_of_the_nations_interior_new.indd 43 05/02/19 11.0605/02/19 11.06
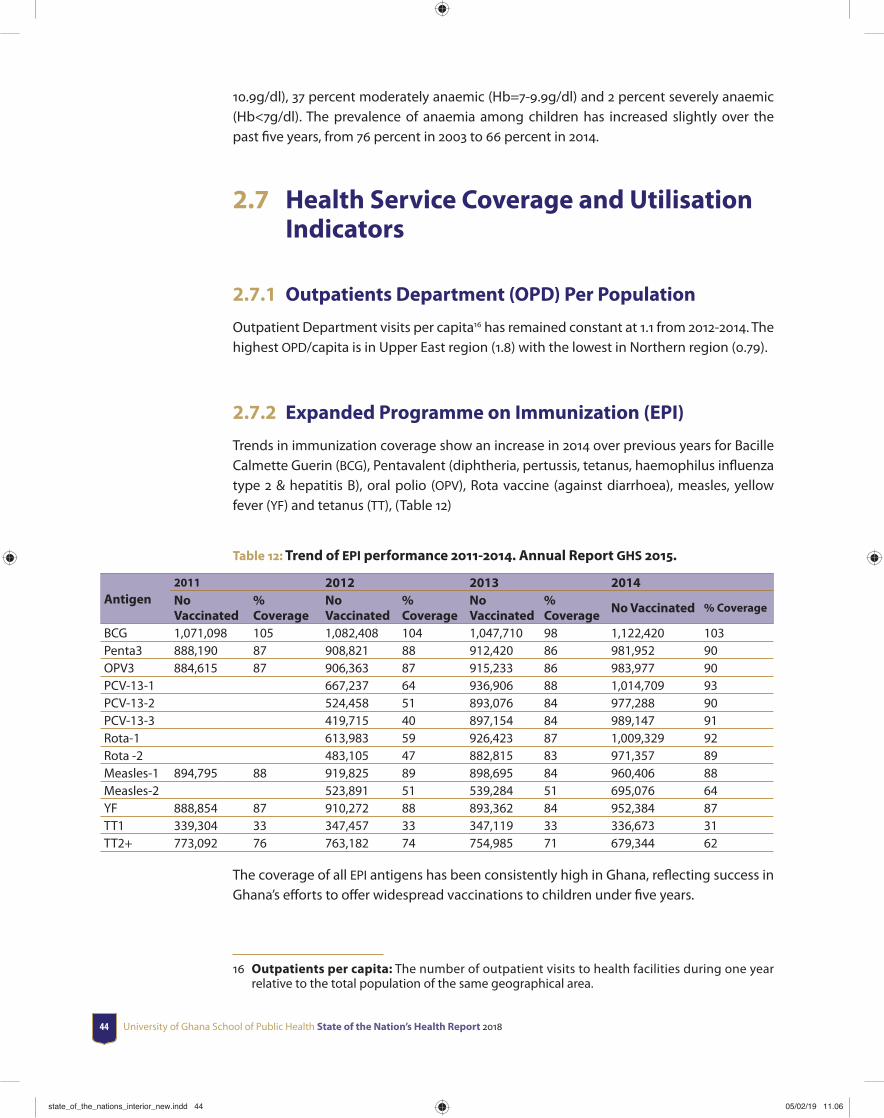
University of Ghana School of Public Health State of the Nation’s Health Report 201844
10.9g/dl), 37 percent moderately anaemic (Hb=7-9.9g/dl) and 2 percent severely anaemic (Hb<7g/dl). The prevalence of anaemia among children has increased slightly over the past fi ve years, from 76 percent in 2003 to 66 percent in 2014.
2.7 Health Service Coverage and Utilisation Indicators
2.7.1 Outpatients Department (OPD) Per Population
Outpatient Department visits per capita16 has remained constant at 1.1 from 2012-2014. The highest OPD/capita is in Upper East region (1.8) with the lowest in Northern region (0.79).
2.7.2 Expanded Programme on Immunization (EPI)
Trends in immunization coverage show an increase in 2014 over previous years for Bacille Calmette Guerin (BCG), Pentavalent (diphtheria, pertussis, tetanus, haemophilus infl uenza type 2 & hepatitis B), oral polio (OPV), Rota vaccine (against diarrhoea), measles, yellow fever (YF) and tetanus (TT), (Table 12)
Table 12: Trend of EPI performance 2011-2014. Annual Report GHS 2015.
Antigen2011 2012 2013 2014No Vaccinated
% Coverage
No Vaccinated
% Coverage
No Vaccinated
% Coverage
No Vaccinated % Coverage
BCG 1,071,098 105 1,082,408 104 1,047,710 98 1,122,420 103Penta3 888,190 87 908,821 88 912,420 86 981,952 90OPV3 884,615 87 906,363 87 915,233 86 983,977 90PCV-13-1 667,237 64 936,906 88 1,014,709 93PCV-13-2 524,458 51 893,076 84 977,288 90PCV-13-3 419,715 40 897,154 84 989,147 91Rota-1 613,983 59 926,423 87 1,009,329 92Rota -2 483,105 47 882,815 83 971,357 89Measles-1 894,795 88 919,825 89 898,695 84 960,406 88Measles-2 523,891 51 539,284 51 695,076 64YF 888,854 87 910,272 88 893,362 84 952,384 87TT1 339,304 33 347,457 33 347,119 33 336,673 31TT2+ 773,092 76 763,182 74 754,985 71 679,344 62
The coverage of all EPI antigens has been consistently high in Ghana, refl ecting success in Ghana’s eff orts to off er widespread vaccinations to children under fi ve years.
16 Outpatients per capita: The number of outpatient visits to health facilities during one year relative to the total population of the same geographical area.
state_of_the_nations_interior_new.indd 44state_of_the_nations_interior_new.indd 44 05/02/19 11.0605/02/19 11.06
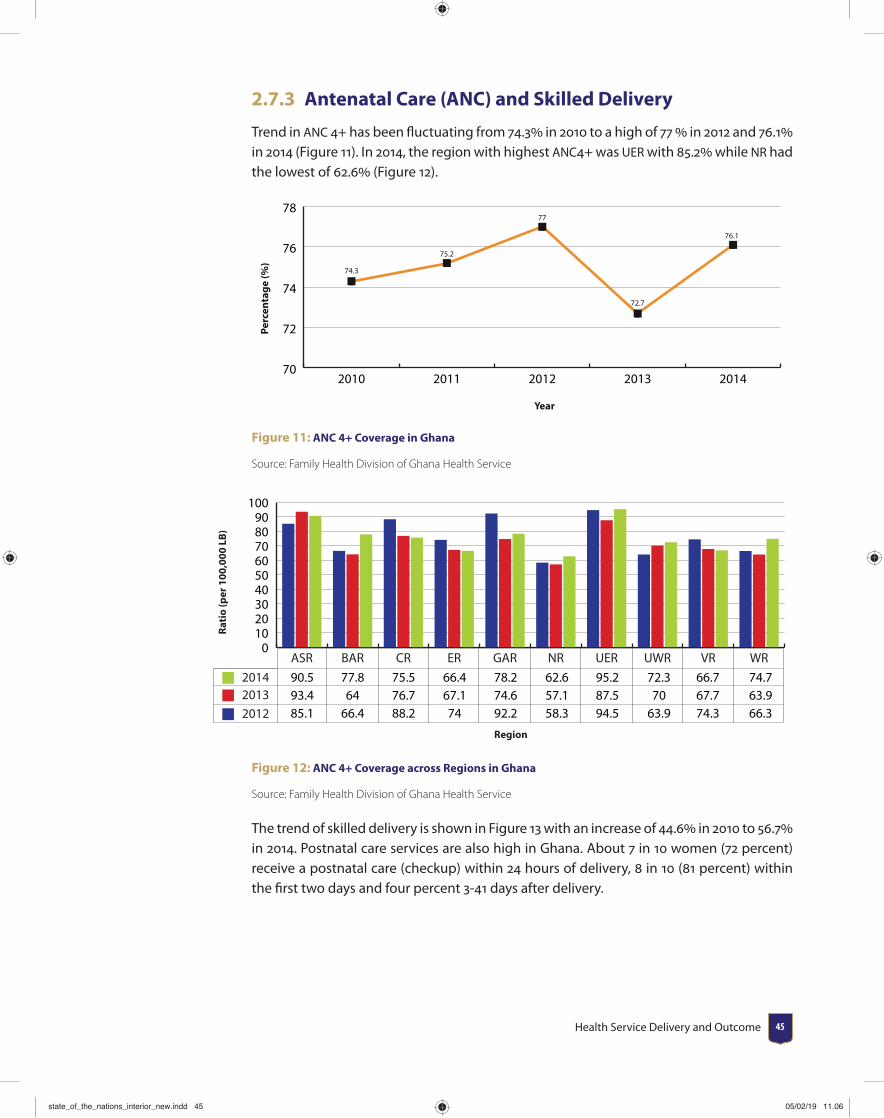
Health Service Delivery and Outcome 45
2.7.3 Antenatal Care (ANC) and Skilled Delivery
Trend in ANC 4+ has been fl uctuating from 74.3 in 2010 to a high of 77 in 2012 and 76.1 in 2014 (Figure 11). In 2014, the region with highest ANC4+ was UER with 85.2 while NR had the lowest of 62.6 (Figure 12).
70
72
74
76
78
74.3
75.2
77
72.7
76.1
20142013201220112010
Perc
enta
ge (%
)
Year
Figure 11: ANC 4+ Coverage in Ghana
Source: Family Health Division of Ghana Health Service
0102030405060708090
100
201420132012
WRVRUWRUERNRGARERCRBARASR
Rati
o (p
er 1
00,0
00 L
B)
Region
90.5 77.8 75.5 66.4 78.2 62.6 95.2 72.3 66.7 74.7 93.4 64 76.7 67.1 74.6 57.1 87.5 70 67.7 63.9 85.1 66.4 88.2 74 92.2 58.3 94.5 63.9 74.3 66.3
Figure 12: ANC 4+ Coverage across Regions in Ghana
Source: Family Health Division of Ghana Health Service
The trend of skilled delivery is shown in Figure 13 with an increase of 44.6 in 2010 to 56.7 in 2014. Postnatal care services are also high in Ghana. About 7 in 10 women (72 percent) receive a postnatal care (checkup) within 24 hours of delivery, 8 in 10 (81 percent) within the fi rst two days and four percent 3-41 days after delivery.
state_of_the_nations_interior_new.indd 45state_of_the_nations_interior_new.indd 45 05/02/19 11.0605/02/19 11.06

University of Ghana School of Public Health State of the Nation’s Health Report 201846
Perc
enta
ge (%
)
Year
0
10
20
30
40
50
60
44.6
49.4
54 55.156.7
20142013201220112010
Figure 13: Trend of skilled delivery from 2010 to 2014
Source: Family Health Division of GHS
2.7.4 Family Planning Services and Fertility Rates
Perc
enta
ge (%
)
Year
0
5
10
15
20
25
30
35
4034.7
28.1
25.2 24.7
29.1
20142013201220112010
Figure 14: Trend of Family Planning acceptor Rate FHD GHS 2012-2014
Routine data from GHS show a gradual decrease in the proportion of the people counselled on family planning who agree to use a method for the fi rst time (acceptor rate) in health facilities in Ghana. The acceptor rate decreased from 34.7 in 2010 to 24.7 in 2013 but there has been an increase to 29.1 in 2014 (Figure 14). Brong Ahafo Region has the highest family planning acceptor rate of 56 while northern region has the lowest at 19 [Figure 15].
state_of_the_nations_interior_new.indd 46state_of_the_nations_interior_new.indd 46 05/02/19 11.0605/02/19 11.06
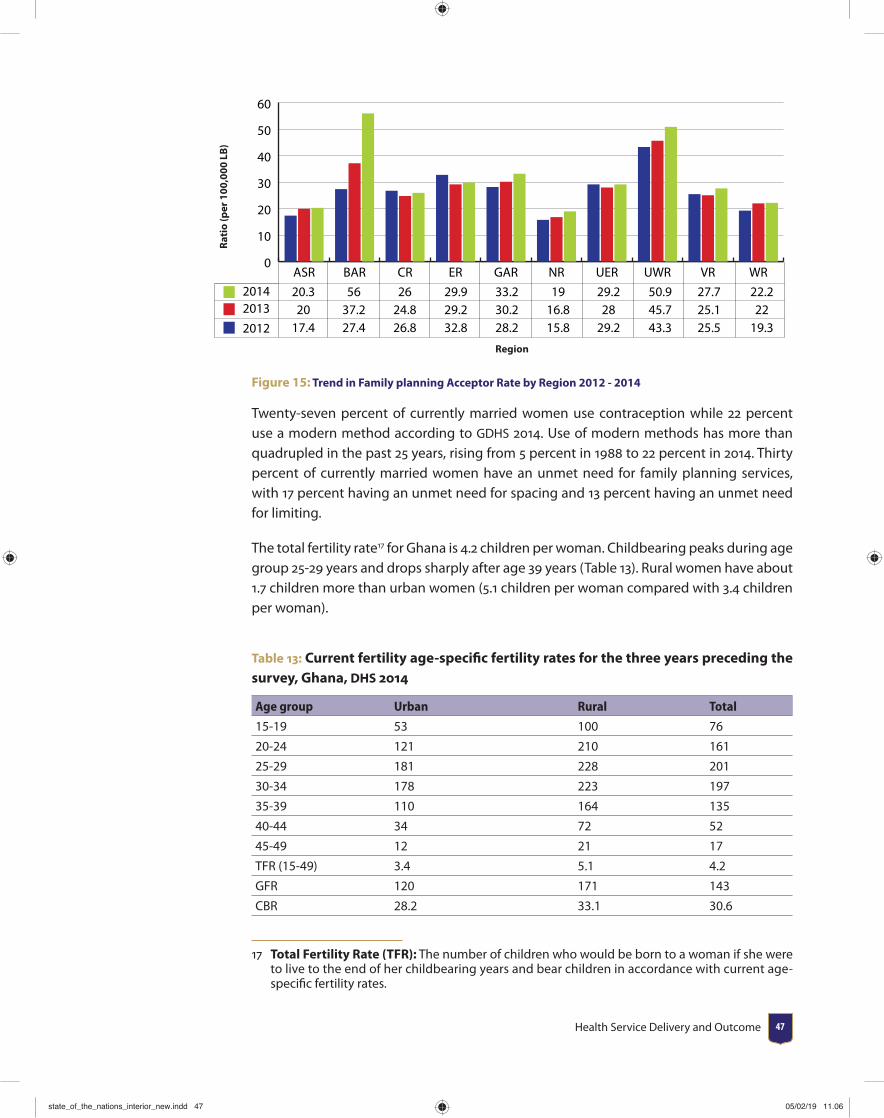
Health Service Delivery and Outcome 47
Rati
o (p
er 1
00,0
00 L
B)
Region
20.3 56 26 29.9 33.2 19 29.2 50.9 27.7 22.2 20 37.2 24.8 29.2 30.2 16.8 28 45.7 25.1 22 17.4 27.4 26.8 32.8 28.2 15.8 29.2 43.3 25.5 19.3
0
10
20
30
40
50
60
201420132012
WRVRUWRUERNRGARERCRBARASR
Figure 15: Trend in Family planning Acceptor Rate by Region 2012 - 2014
Twenty-seven percent of currently married women use contraception while 22 percent use a modern method according to GDHS 2014. Use of modern methods has more than quadrupled in the past 25 years, rising from 5 percent in 1988 to 22 percent in 2014. Thirty percent of currently married women have an unmet need for family planning services, with 17 percent having an unmet need for spacing and 13 percent having an unmet need for limiting.
The total fertility rate17 for Ghana is 4.2 children per woman. Childbearing peaks during age group 25-29 years and drops sharply after age 39 years (Table 13). Rural women have about 1.7 children more than urban women (5.1 children per woman compared with 3.4 children per woman).
Table 13: Current fertility age-specifi c fertility rates for the three years preceding the survey, Ghana, DHS 2014
Age group Urban Rural Total
15-19 53 100 76
20-24 121 210 161
25-29 181 228 201
30-34 178 223 197
35-39 110 164 135
40-44 34 72 52
45-49 12 21 17
TFR (15-49) 3.4 5.1 4.2
GFR 120 171 143
CBR 28.2 33.1 30.6
17 Total Fertility Rate (TFR): The number of children who would be born to a woman if she were to live to the end of her childbearing years and bear children in accordance with current age-specifi c fertility rates.
state_of_the_nations_interior_new.indd 47state_of_the_nations_interior_new.indd 47 05/02/19 11.0605/02/19 11.06
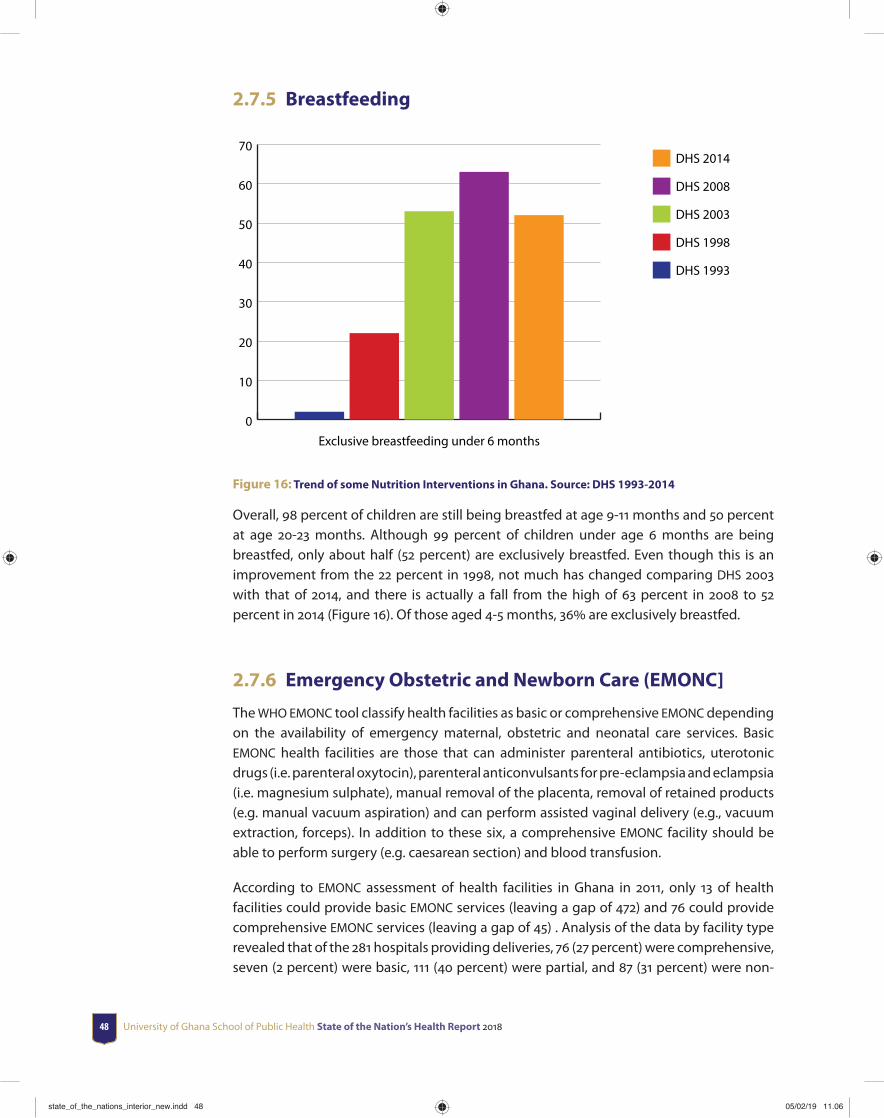
University of Ghana School of Public Health State of the Nation’s Health Report 201848
2.7.5 Breastfeeding
0
10
20
30
40
50
60
70DHS 2014
DHS 2008
DHS 2003
DHS 1998
DHS 1993
Exclusive breastfeeding under 6 months
Figure 16: Trend of some Nutrition Interventions in Ghana. Source: DHS 1993-2014
Overall, 98 percent of children are still being breastfed at age 9-11 months and 50 percent at age 20-23 months. Although 99 percent of children under age 6 months are being breastfed, only about half (52 percent) are exclusively breastfed. Even though this is an improvement from the 22 percent in 1998, not much has changed comparing DHS 2003 with that of 2014, and there is actually a fall from the high of 63 percent in 2008 to 52 percent in 2014 (Figure 16). Of those aged 4-5 months, 36 are exclusively breastfed.
2.7.6 Emergency Obstetric and Newborn Care (EMONC]
The WHO EMONC tool classify health facilities as basic or comprehensive EMONC depending on the availability of emergency maternal, obstetric and neonatal care services. Basic EMONC health facilities are those that can administer parenteral antibiotics, uterotonic drugs (i.e. parenteral oxytocin), parenteral anticonvulsants for pre-eclampsia and eclampsia (i.e. magnesium sulphate), manual removal of the placenta, removal of retained products (e.g. manual vacuum aspiration) and can perform assisted vaginal delivery (e.g., vacuum extraction, forceps). In addition to these six, a comprehensive EMONC facility should be able to perform surgery (e.g. caesarean section) and blood transfusion.
According to EMONC assessment of health facilities in Ghana in 2011, only 13 of health facilities could provide basic EMONC services (leaving a gap of 472) and 76 could provide comprehensive EMONC services (leaving a gap of 45) . Analysis of the data by facility type revealed that of the 281 hospitals providing deliveries, 76 (27 percent) were comprehensive, seven (2 percent) were basic, 111 (40 percent) were partial, and 87 (31 percent) were non-
state_of_the_nations_interior_new.indd 48state_of_the_nations_interior_new.indd 48 05/02/19 11.0605/02/19 11.06
Health Service Delivery and Outcome 49
EmONC. Of the 509 health centres providing deliveries, two (0.4 percent) were basic, 113 (22 percent) were partial, and 394 (77.4 percent) were non-EmONC. Of the 136 health clinics providing deliveries, one (0.7 percent) was basic, 23 (17 percent) were partial, and 112 (82 percent) were non-EmONC. Of the 164 maternity homes providing deliveries, three (2 percent) were basic, 28 (17 percent) were partial, and 133 (81 percent) were non-EmONC.
Provision of parenteral oxytocic is one of the seven basic signal functions, and it had the highest coverage in Ghana: 97 percent of the facilities surveyed. Provision of parenteral antibiotics had the next highest coverage: 78 percent. Signal functions with lowest coverage were assisted vaginal delivery (13 percent of facilities — the reason why many facilities did not meet the basic standard), removal of retained products (29 percent of facilities), and manual removal of placenta (46 percent of facilities).
Met need for EmONC is assessed by measuring the number of obstetric complications treated by facilities and comparing the result with the expected number of pregnancy complications. Out of all the expected complications, only 38,437 (34 percent) were seen at health facilities nationally. By region, met need ranged from 7 percent in Northern to 59 percent in Eastern.
According to WHO, caesarean section rates for populations should range between 5 percent and 15 percent if obstetric coverage is adequate. The assessment found a population-based caesarean section rate of 7 percent nationally and showed a rate of 4 percent in EmONC facilities. The assessment also found that 27 percent of the deliveries in the private for-profi t sector were resolved by caesarean section, compared with 20 percent in government health facilities and 19 percent in faith-based health facilities indicating high Caesarean sections in these facilities.
The direct obstetric case fatality rate (DOCFR)18 indicates the ability of facilities to handle obstetric emergencies. The maximum acceptable rate is less than 1 percent. Nationally, the DOCFR was 1 percent in all facilities. By region, the range in all facilities was 1 percent to 2 percent. Nationally, a total of 840 identifi ed maternal deaths were recorded in 2014. The most common direct obstetric causes of maternal death were severe preeclampsia and eclampsia — conditions that accounted for 23 percent of all direct causes of maternal deaths and 16 percent of all maternal deaths attributable to direct and indirect causes. The other leading direct causes of maternal deaths were postpartum haemorrhage (13 percent of all maternal deaths) and abortion complications (8 percent of all maternal deaths).
18 Direct obstetric case fatality: The percent of women admitted to a hospital or an emergency obstetric care (EmOC) facility with major direct obstetric complications, or who develop such complications after admission, and before discharge. The eight direct obstetric complications are hypertensive diseases, abortion, sepsis or infections, obstructed labor, ectopic pregnancy, embolism, and anesthesia-related death.
state_of_the_nations_interior_new.indd 49state_of_the_nations_interior_new.indd 49 05/02/19 11.0605/02/19 11.06
University of Ghana School of Public Health State of the Nation’s Health Report 201850
2.7.7 Blood Transfusion service
Blood collection index19 per 1000 population was 5.6 in 2014 and 5.3 in 2015 with a target of 10 by 2017. Percentage of Voluntary Non-Remunerated Blood Donations20 was 30 in 2014 and 34 in 2015 with a target of 60 by 2017.
2.7.8 Clinical and Public Health Emergency Services,
including ambulance service
Provision of clinical emergency services have been poor in the country. There were 214 functional ambulances in 2015 with a projection to 300 by 2017. The service response time is estimated to be 50 minutes but this may vary depending on location. Number of patients/casualties attended to was about 5000 in 2015.
Periodic outbreaks of pandemics and major epidemics have occurred globally over the years including Avian and Pandemic Infl uenzas, Cholera, and Ebola. A number of factors exist currently in the global world to increase the likelihood of severity and spread of pandemics especially in developing countries including, increasing globalization, poor sanitary and veterinary practices, ineff ective surveillance systems for early detection, confi rmation and response and already overburdened health systems struggling to deal with other endemic diseases.
In 2003, following concerns raised at the World Health Assembly for the overall lack of preparedness for an infl uenza pandemic, a National Working Group on Avian Infl uenza was formed in Ghana in September 2005 which produced a “National Preparedness and Response Plan for Avian and Pandemic Infl uenza”. Following the emergence of Infl uenza A (H1N1) in 2009, the Plan was further reviewed for the period 2009 – 2011 and later in 2013. In 2015, a new Integrated National Strategy for Public Health Events of International Concern (PHEIC) was developed based on the all-hazard approach of WHO, as well as on the U.S. government’s (USG) Global Health Security Agenda (GHSA) [Final Draft Integrated Strategic Plan for PHEIC 2015]. Recent outbreaks of cholera and streptococcal meningitis has once again revealed the weakness in national preparedness and response even though major strides have been chalked.
2.7.9 Integrated Management of Neonatal and Child Illness
(IMNCI)
The Integrated Management of Child Illness (IMCI) policy integrate both preventive and curative interventions at both community and health sector to reduce mortality among children under fi ve years. Ghana started the IMCI in 1998 in some pilot districts: Atwima
19 Blood Collection Index: Blood collection ratio per 1000 population in a year.20 Voluntary Non-Remunerated Blood Donations: Donating blood to health facility without
expecting any form of reward or remuneration.
state_of_the_nations_interior_new.indd 50state_of_the_nations_interior_new.indd 50 05/02/19 11.0605/02/19 11.06
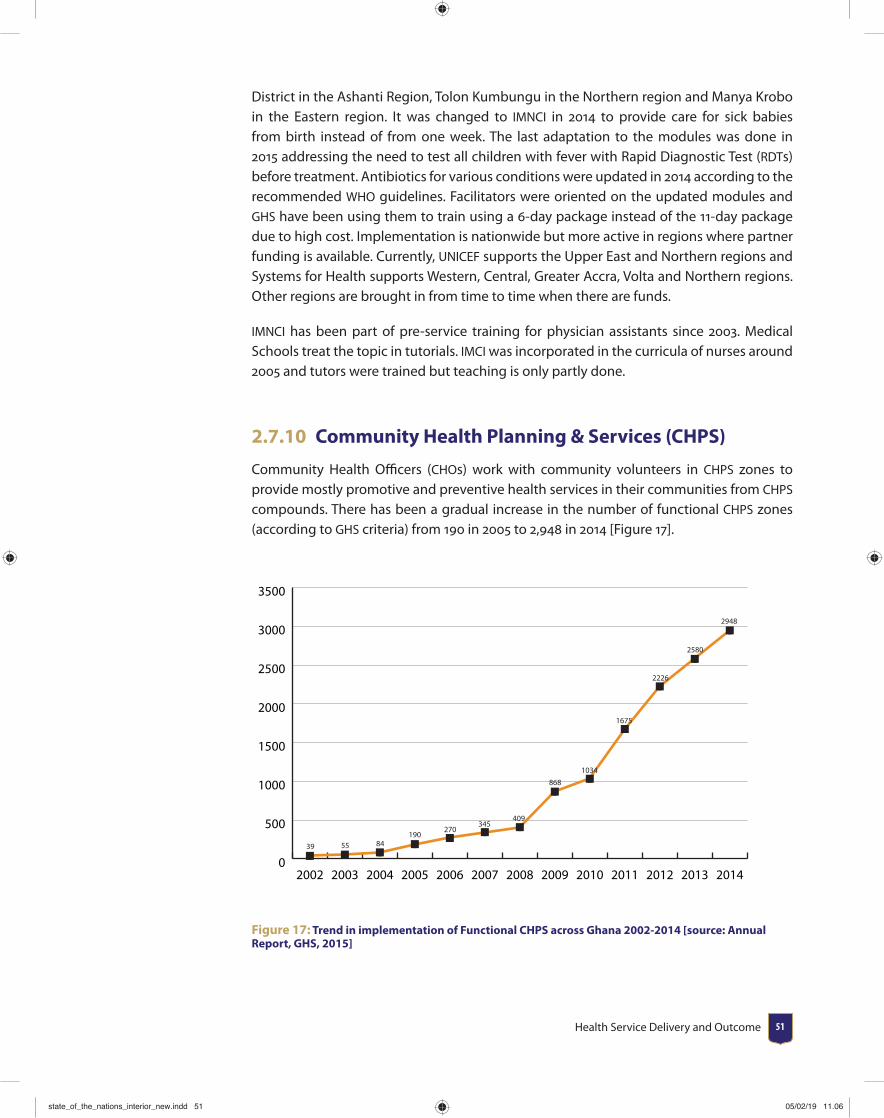
Health Service Delivery and Outcome 51
District in the Ashanti Region, Tolon Kumbungu in the Northern region and Manya Krobo in the Eastern region. It was changed to IMNCI in 2014 to provide care for sick babies from birth instead of from one week. The last adaptation to the modules was done in 2015 addressing the need to test all children with fever with Rapid Diagnostic Test (RDTs) before treatment. Antibiotics for various conditions were updated in 2014 according to the recommended WHO guidelines. Facilitators were oriented on the updated modules and GHS have been using them to train using a 6-day package instead of the 11-day package due to high cost. Implementation is nationwide but more active in regions where partner funding is available. Currently, UNICEF supports the Upper East and Northern regions and Systems for Health supports Western, Central, Greater Accra, Volta and Northern regions. Other regions are brought in from time to time when there are funds.
IMNCI has been part of pre-service training for physician assistants since 2003. Medical Schools treat the topic in tutorials. IMCI was incorporated in the curricula of nurses around 2005 and tutors were trained but teaching is only partly done.
2.7.10 Community Health Planning & Services (CHPS)
Community Health Offi cers (CHOs) work with community volunteers in CHPS zones to provide mostly promotive and preventive health services in their communities from CHPS compounds. There has been a gradual increase in the number of functional CHPS zones (according to GHS criteria) from 190 in 2005 to 2,948 in 2014 [Figure 17].
0
500
1000
1500
2000
2500
3000
3500
39 55 84190
270345
409
868
1034
1675
2226
2580
2948
2014201320122011201020092008200720062005200420032002
Figure 17: Trend in implementation of Functional CHPS across Ghana 2002-2014 [source: Annual Report, GHS, 2015]
state_of_the_nations_interior_new.indd 51state_of_the_nations_interior_new.indd 51 05/02/19 11.0605/02/19 11.06

University of Ghana School of Public Health State of the Nation’s Health Report 201852
2.7.11 Adolescent Health Services
There has been an increase in adolescent health services over the years. However, following a major review of adolescent health services strategy (2009-2015) early in 2016, the following conclusions were made:
• Access to appropriate health information by adolescents and young people has not improved signifi cantly over the period 2009-2015.
• Utilisation of health services by adolescents and young people has remained poor even though there is improvement overall.
• The political and legal environment has enhanced considerably but the same cannot be said of the social and cultural environment.
• Community participation in Adolescent health services has been weak; however, increasing numbers of adolescents and young people are getting more involved in health programme development and implementation.
• The management and coordination of Adolescent health services has improved considerably though more needs to be done at the decentralized levels. Funding for Adolescent health services, especially from donor partners, has increased considerably.
• There is gradual improvement in most of the adolescent indicators over the period. However, at current rate of impact it will be impossible to achieve envisaged targets set for the new Adolescent health policy.
2.8 Quality issues in service provisionGenerally, we can distinguish between clinical quality and service quality. The former refers to activities of the healthcare process such as surgical skill, suffi cient drugs, logistics and other factors that translate into better outcome. The latter on the other hand denote the multifactorial indicators of patients’ experiences and satisfaction such as hospital comfort, support from providers, waiting time, appointment and visits and the physical environment of the facility. It is important for healthcare managers to constantly determine the factors associated with the satisfaction of patients with the quality of care provided so as to understand what is valued by the patient, how the quality of care is construed by the patient and to determine where, when and how service change and improvement can be made (Zideldin, 2006).
Nationwide, quality of care surveys are seldom done though individual health facilities periodically undertake patient/customer satisfaction surveys as part of their quality assurance system. Issues raised in most of these surveys relate to long waiting times, lackadaisical and disrespectful attitude of some hospital staff , unavailability of certain prescribed drugs, discrimination and favouratism when it comes to who should be attended to fi rst at the OPD and consulting rooms and mistreatment during labour. About 35 of adults who visited Juaben Government Hospital in a study in 2010, for example, stated that their provider did not explain things clearly to them, and 68 complained of
state_of_the_nations_interior_new.indd 52state_of_the_nations_interior_new.indd 52 05/02/19 11.0605/02/19 11.06
Health Service Delivery and Outcome 53
unnecessary delays before being seen by a doctor. The situation may not be diff erent from what pertains in most hospitals in the country.
2.9 Summary and ConclusionThere is much improvement in service delivery (especially for communicable diseases) in terms of coverage, quality and impact but there are major challenges and gaps that have to be addressed going forward.
1. There is no systematic programme in place to address the increasing burden of non-communicable diseases.
2. The provision of emergency services (both clinical and public health emergencies) is inadequate and sub-standard. With increasing rate of RTAs and NCDs (for clinical care) and globalization with its associated exposure to diseases of pandemic potential (for public health), these areas have to be addressed as quickly as possible.
3. Adolescent health and health for elders and other marginalized groups need focused attention.
4. Other health system challenges identifi ed elsewhere in this document have to be addressed as they militate against sustained and eff ective delivery of quality health services in the country.
5. There is the need to establish systems for emergency clinical care and public health emergencies, including addressing inappropriate staff attitude, through preparedness and response planning and execution of these plans.
6. Treat NCD as national emergency and address appropriately.
state_of_the_nations_interior_new.indd 53state_of_the_nations_interior_new.indd 53 05/02/19 11.0605/02/19 11.06

University of Ghana School of Public Health State of the Nation’s Health Report 201854
CHAPTER 3Financing the health sector
3.1 IntroductionSupporting adequate, sustainable, equitable and eff ective health fi nancing to improve health outcomes is of relevance to any country. In order to achieve these goals, countries have implemented various systems and forms of health fi nancing. Health fi nancing refers to the “function of a health system concerned with the mobilization, accumulation and allocation of money to cover the health needs of the people, individually and collectively, in the health system” (WHO, 2005). The purpose of health fi nancing is thus to make funding available, as well as to set the right fi nancial incentives to providers, to ensure that all individuals have access to eff ective public health and personal health care”. The World Health Organization (WHO) proposes three main functions of health fi nancing namely raising revenue, risk pooling and purchasing (Table 14).
state_of_the_nations_interior_new.indd 54state_of_the_nations_interior_new.indd 54 05/02/19 11.0605/02/19 11.06
Financing the health sector 55
Table 14: Functions of health fi nancing
Function Objectives
Raising revenueRaise suffi cient and sustainable revenues in an effi cient and equitable manner to provide individuals with a basic package of essential services to improve health outcomes and provide fi nancial protection and consumer satisfaction
Risk pooling Manage revenue to equitably and effi ciently create insurance pools
PurchasingEnsure the purchase of health services in an allocative and technically effi cient manner
Source: Gorret and Schieber 2006
It is important that countries focus on eff ectively implementing the three health fi nancing functions in order to achieve the basic objectives of improving health outcomes, ensuring fi nancial protection, and responding to consumers in an equitable, effi cient, sustainability and sustainable manner. This chapter discusses health fi nancing in Ghana following the three main functions of raising revenue, risk pooling and purchasing. First we provide an overview of development of health fi nancing in Ghana followed by discussions of the health functions and issues of fi scal space for health since the country’s elevation to lower middle income status in 2010. The fi nancial outlook is also discussed and conclusion.
3.2 Major Developments and Reforms in Health Financing
Ghana has implemented a number of fi nancing reforms. In the pre-independence era, health fi nancing was mainly through out-of-pocket payments at point of service use. After independence in 1957, this system was abolished and government begun to fi nance health care services in public facilities through taxes and public health services were free. However, private sector health services continued to be paid for by out-of-pocket fees at point of service use.
By the early 1970s the general tax revenue could no longer support the tax-based system and the government gradually introduced user fees (The Hospital Fees Act of 1971). In 1972 for example, very low out-of-pocket fees were introduced in the public sector to discourage frivolous use. At the same time, the economy of Ghana begun to face major decline which aff ected the health sector leading to widespread shortages of essential medicines, supplies and equipment, and poor quality of care. The country had to succumb to World Bank and International Monetary Fund (IMF) structural adjustment program (SAP) policies and reforms.
Ghana’s SAP begun with the Economic Recovery Program (ERP) from 1983-1986 which called for the removal of subsidies. The notable health sector reforms under the SAP included the introduction of user fee charges, expansion and strengthening of district health services and reallocation of resources from the region to the districts. Other equally noticeable reforms were reduction of costs through the phasing out of institutional cost of feeding
state_of_the_nations_interior_new.indd 55state_of_the_nations_interior_new.indd 55 05/02/19 11.0605/02/19 11.06
University of Ghana School of Public Health State of the Nation’s Health Report 201856
in hospitals, reduction of non-technical staff , implementation of essential drug policy, improving drug management and enrolment of District Health Management Teams
In 1985, public sector user fees for health care were raised signifi cantly as part of structural adjustment policies which became known as the ‘cash and carry’ system. The aim of the 1985 user fees was to recover at least 15 of recurrent expenditure for quality improvements. Although the fi nancial aims were achieved, i.e. improvement in supply of essential medicines and other supplies, the system led to negative consequences in fi nancial access to basic health services in the general population and particularly among the poor. To off set the adverse eff ects of the user fees, the government introduced an exemption policy for children, pregnant women, the elderly, and the extreme poor as well as partial exemptions for persons suff ering from certain communicable diseases such as tuberculosis. In practice however, the exemption policy failed to work and many of those who should have been exempted were not due to poorly defi ned guidelines and mechanisms.
3.4 Health Insurance in GhanaIn the early 1990s various health insurance schemes evolved as ways of providing fi nancial protection against high cost of health care arising from the introduction of the user fees. Community based mutual health organizations (MHO) were formed in some districts. The Nkoranza Community Health Insurance Scheme was the fi rst to be established in 1992. By 2001, 57 district MHOs had been established in diff erent parts of the country. Premiums on average were as low as GH1.20 per annum (US 1) with payment terms distributed over a year.
Based on the principles of the MHO, two pilot schemes were commissioned in the Eastern region by the government and the Social Security and National Insurance Trust (SSNIT) in preparation towards the establishment of a centralized health insurance scheme. The pilot schemes did not materialize due to lack of technical expertise and leadership challenges. Despite these challenges and amidst political pressure to fulfi ll a political campaign promise, the government in 2003 drafted the health insurance act (Act 650) to set up a national health insurance scheme (NHIS) in all the districts as a policy to minimize out of pocket health expenditure at point of service and to ensure equitable access to health care particularly among the poor.
The NHIS is fi nanced by a national health insurance fund. The fund has three main sources: tax revenue of a 2.5 VAT which contributes to about 70 of the fund, 2.5 of contributions of Social Security and National Insurance Trust (SSNIT) contributors who are largely formal sector workers; and which contributes to about 20 of the fund; and income adjusted premiums which ranges from between GH7 to GH48 for non SSNIT contributors which contributes to about 5 or less to the fund. Funding for health care services, administration of the NHIS and premium exemptions for certain categories of people including the poor who are identifi ed are fi nanced by the National Health Insurance Fund (NHIF).
state_of_the_nations_interior_new.indd 56state_of_the_nations_interior_new.indd 56 05/02/19 11.0605/02/19 11.06

Financing the health sector 57
3.5 Structure of Health Financing in GhanaFigure 19 shows an overview of health fi nancing in Ghana. The revenue sources are in two folds: Households (out-of-pocket payments for health, taxes, and National Health Insurance Levy, NHIL), development partners (multi-donor budget support systems, sector budget support). These revenue sources goes to the National Health Insurance Authority (NHIA) as the National Health Insurance Fund (NHIF). The fund is disbursed to health service providers upon request for payment of claims. In addition, some funds from development partners goes to the ministry of health as earmarked funds for targeted programs such as the Presidents Malaria Initiative (PMI) and Global Fund for AIDS, tuberculosis and malaria. Funds are earmarked for the National Health Insurance Scheme (NHIS) from the budget, but the budget also supports the Ministry of Health, and some of the earmarked funding to NHIS is passed through to the Ministry of Health. Donor funds provide direct support to the government, the NHIS, and the Ministry of Health.
Taxes, NHIL MDBS, SBS
Household income GoG Revenues Development
Partners
PREMIUM NHIFEM
NHIA Health Fund, EM Embarked
Claims
Txfrs
DMHIS MOH
UserFees
Health Service Providers
Figure 18: Overview of health fi nancing in Ghana. Adapted from Enemark et al, 2005
3.6 Functions of Health FinancingThis section will discuss in detail the components of the functions of health fi nancing namely raising revenue, risk pooling and purchasing.
3.6.1 Function 1: Raising Revenue
It is important that the system is able to raise substantial revenue to support earmarked programs and activities, current and recurrent expenditure and investments. Revenues to
state_of_the_nations_interior_new.indd 57state_of_the_nations_interior_new.indd 57 05/02/19 11.0605/02/19 11.06

University of Ghana School of Public Health State of the Nation’s Health Report 201858
fi nance health care mainly comes from taxes, nontax revenues, donor contributions, and out-of-pocket payments by individuals. We analyze patterns of the health sector revenue and expenditure focusing on funding sources, distribution of revenue and expenditure, private funding for health, health expenditure as percentage to GDP etc. for the period 2000-2014.
Figure 19 shows the health sector fi nancing sources and the percentage change (secondary axis) in infl ows over the years. Since 2011 internally generated fund (IGF) or off -budget income has been the major contributor to the fi nancial resource envelope of the health sector. IGF mainly accrues from out-of-pocket payment by individuals and health insurance claims from both public and private users of the health facility. In nominal terms, IGF increased from GHC 108,000 in 2009 to GHC 1,831,400 in 2013. IGF constitute about 35 revenue for sub-district and district health facilities and 25 for regional hospitals. GOG transfers to the sector also demonstrated an increase over the decade from GHC334, 400 in 2009 to GHC 508,980 in 2013. This increase could be due to the strong economic growth within the last decade and deepening commitment to health. Cumulatively, the percentage change in total infl ows to the sector has risen to 62 in 2013. Also, the transition of Ghana from low income to lower middle income status has had implications on the infl ow of funds from donor partners. The distribution of direct donor transfers to the health sector and pooled funds in the government treasury does not show a clear pattern. However, it is anticipated that the change in Ghana’s status will have implications on donor funding for health. From the Figure 19, donor funds declined from GHC624, 060 in 2012 to GHC194, 460 in 2013.
GH
¢ 00
0'
10.2
29 28.8
30.9
0
500
1000
1500
2000
0
10
20
30
40
50
60
70
% Change NHIF PIP/SIP IGF Donor GoG
20132012201120102009
Figure 19: Health Sector fi nancial resource envelope (2009 - 2013)
Source: Ministry of Health Programme of Work (POW) and holistic assessment of various years
The resources in the health sector as described in Figure 20 are expended under major categories. These categories in the past were known as personnel emoluments, administration, services and investments. Since 2010, this has been newly categorised as employee compensation, goods and services and assets. Figure 20 shows the sector’s spending as follows; employee compensation accounted for more than 55 of the
state_of_the_nations_interior_new.indd 58state_of_the_nations_interior_new.indd 58 05/02/19 11.0605/02/19 11.06

Financing the health sector 59
sector’s expenditure for majority of the years analyzed, followed by goods and services (around 32) and assets (around 13). Indeed this distribution pattern has implications for investments in health and progress towards achieving the sector’s major targets. An improvements in the current allocation towards investments and assets will be benefi cial to the sector’s development in the future.
Perc
ent o
f tot
al re
venu
e
10.2
29 28.8
30.9
0
10
20
30
40
50
60
70
80
Assets Goods and services Employee compensation
2013201220092008200720062005
Categories
Figure 20: Health sector revenue distribution for selected years
Source: Ministry of Health Programme of Work (POW) and holistic assessment various years
Trends in expenditure on health relative to Gross Domestic Product (GDP)21 is analysed in Figure 21 (1995 – 2013). Total health expnditure (THE) is the sum of private health expenditure (PrivHE) and public health expenditure (PubHE). Public health expenditure is government’s contribution to health spending in general, including external resources from donors while private health expenditure represent individual and corporate contribution to health spending in the counry. Between 2001 and 2013, government spending as a percentage of GDP rose steadily from 1.5 to about 3.3 while private spending remained stable around 1.6 over the same period. Government spending as percentage of GDP is below the threshold of 15 earmarked in the Abuja Declaration of 2000. Under the declaration, health outcomes are likely to improve when countries in sub-Saharan Africa (SSA) plan and spend more than 15 of share of GDP on health. This has not happened in Ghana however planned spending in the budget statements is about 11 of GDP on health whilst in reality this is not the case.
21 Gross Domestic Product: The monetary value of all the fi nished goods and services produced within a country’s borders in a specifi c time period.
state_of_the_nations_interior_new.indd 59state_of_the_nations_interior_new.indd 59 05/02/19 11.0605/02/19 11.06
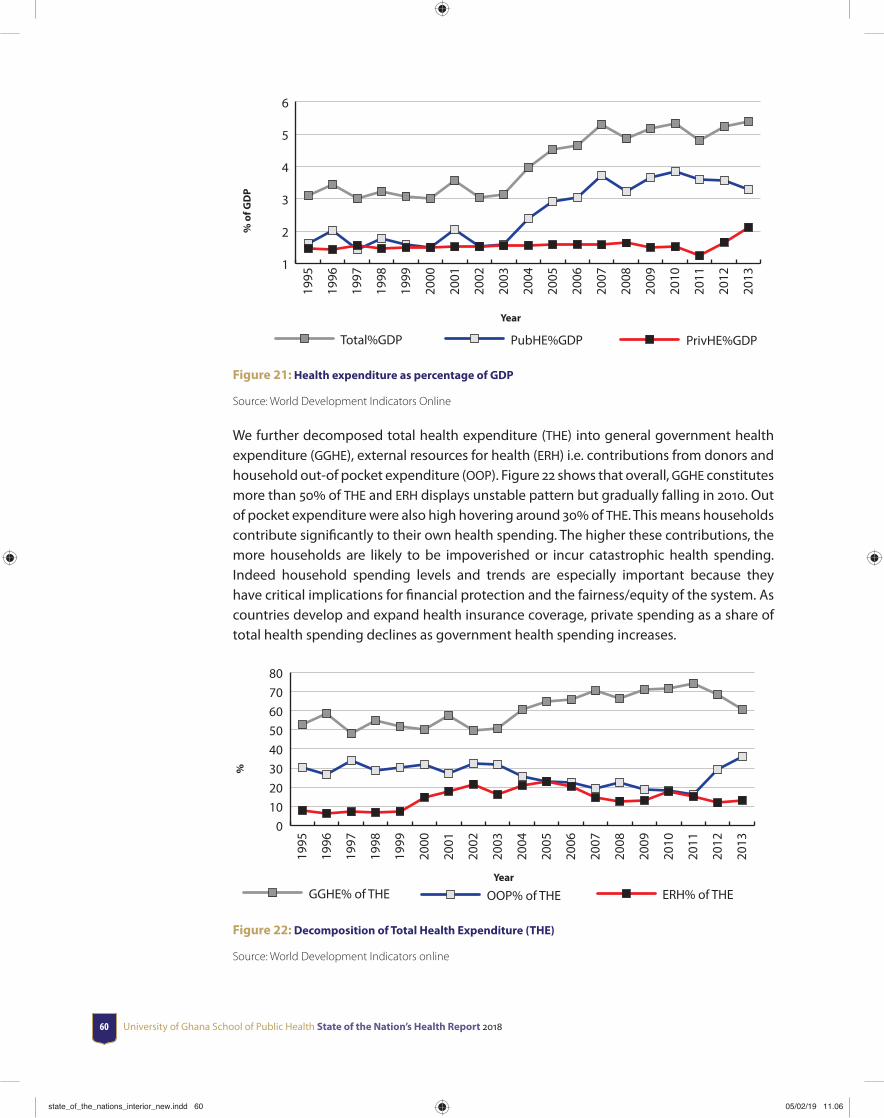
University of Ghana School of Public Health State of the Nation’s Health Report 201860
% o
f GD
P
Year
1
2
3
4
5
6
Total%GDP PubHE%GDP PrivHE%GDP
2013
2012
2011
2010
2009
2008
2007
2006
2005
2004
2003
2002
2001
2000
1999
1998
1997
1996
1995
Figure 21: Health expenditure as percentage of GDP
Source: World Development Indicators Online
We further decomposed total health expenditure (THE) into general government health expenditure (GGHE), external resources for health (ERH) i.e. contributions from donors and household out-of pocket expenditure (OOP). Figure 22 shows that overall, GGHE constitutes more than 50 of THE and ERH displays unstable pattern but gradually falling in 2010. Out of pocket expenditure were also high hovering around 30 of THE. This means households contribute signifi cantly to their own health spending. The higher these contributions, the more households are likely to be impoverished or incur catastrophic health spending. Indeed household spending levels and trends are especially important because they have critical implications for fi nancial protection and the fairness/equity of the system. As countries develop and expand health insurance coverage, private spending as a share of total health spending declines as government health spending increases.
%
Year
01020304050607080
GGHE% of THE OOP% of THE ERH% of THE
2013
2012
2011
2010
2009
2008
2007
2006
2005
2004
2003
2002
2001
2000
1999
1998
1997
1996
1995
Figure 22: Decomposition of Total Health Expenditure (THE)
Source: World Development Indicators online
state_of_the_nations_interior_new.indd 60state_of_the_nations_interior_new.indd 60 05/02/19 11.0605/02/19 11.06

Financing the health sector 61
Health expenditure per capita shows government spending on health per person. Over time, this has shown an increase following the increase in spending on health. The total health expenditure per capita increased gradually over the years. It hit a record high of 84.53 in 2013 but declined to 57.89 in 2014. The increase may be attributed to increase health care utilization over time. Introduction of the National Health Insurance Scheme (NHIS) may also be a contributing factor.
Expe
ndit
ure
per c
apit
a (c
urre
nt U
S$)
Year
0
20
40
60
80
100
201420132012201120102009200820072006200520042003200220012000
12.2715.25 14.98
18.48
26.7
36.03
43.11
58.25 59.8656.67
70.58
76.378.64
84.53
57.89
Figure 23: Trend in health expenditure per capita (Current US$)
Source: The World Bank
3.6.2 Function 2: Risk Pooling
The aim of this function is to manage revenue to equitably and effi ciently create insurance pools. The argument for insurance pools to be equitable is based on the view that society does not consider it to be fair that individuals should assume all the risk associated with their health care expenditure needs. The effi ciency arguments arise because pooling can lead to major improvements in population health, increase productivity, and reduces uncertainty associated with health care expenditure. Analysis of risk pooling will include NHIS coverage, NHIS revenue and expenditure and health service utilization for specifi c disease conditions in the country.
Insurance coverage since the implementation of the scheme has seen marked improvement. Insurance coverage for 2014 was 39 percent (Table 15).
state_of_the_nations_interior_new.indd 61state_of_the_nations_interior_new.indd 61 05/02/19 11.0605/02/19 11.06
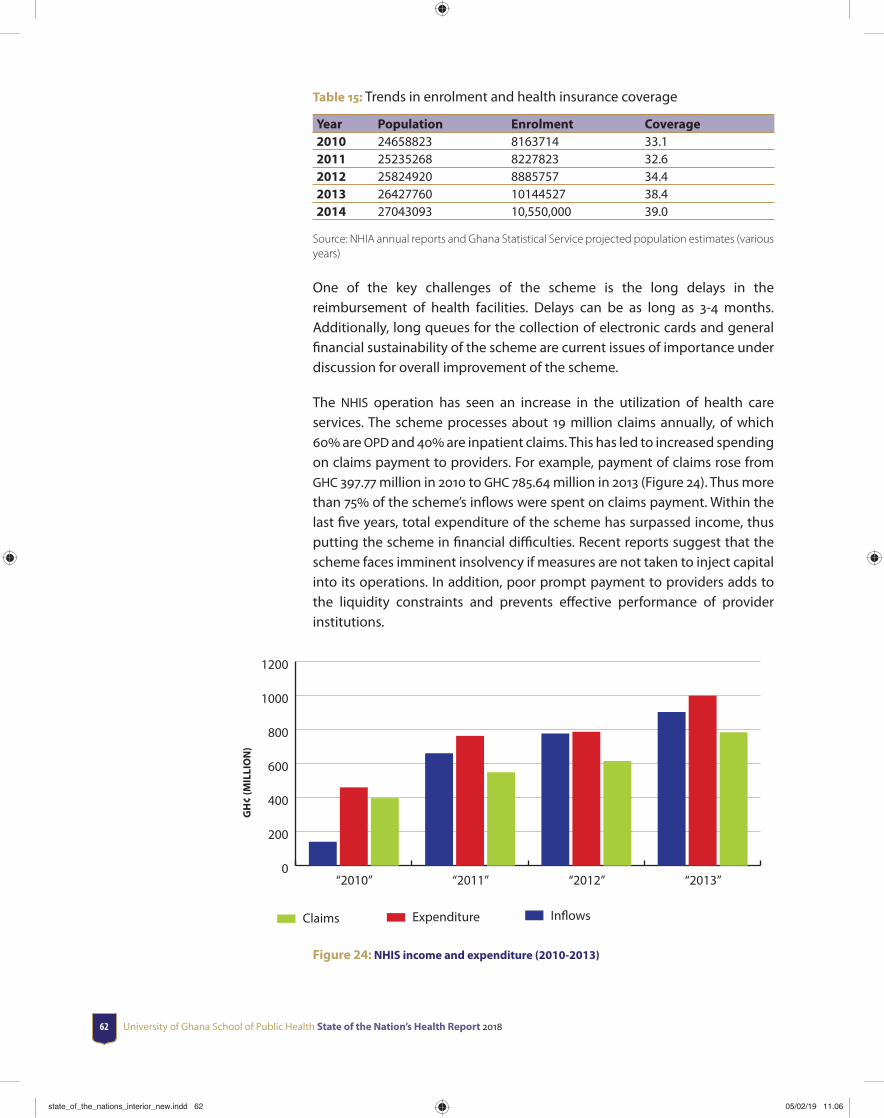
University of Ghana School of Public Health State of the Nation’s Health Report 201862
Table 15: Trends in enrolment and health insurance coverage
Year Population Enrolment Coverage2010 24658823 8163714 33.12011 25235268 8227823 32.62012 25824920 8885757 34.42013 26427760 10144527 38.42014 27043093 10,550,000 39.0
Source: NHIA annual reports and Ghana Statistical Service projected population estimates (various years)
One of the key challenges of the scheme is the long delays in the reimbursement of health facilities. Delays can be as long as 3-4 months. Additionally, long queues for the collection of electronic cards and general fi nancial sustainability of the scheme are current issues of importance under discussion for overall improvement of the scheme.
The NHIS operation has seen an increase in the utilization of health care services. The scheme processes about 19 million claims annually, of which 60 are OPD and 40 are inpatient claims. This has led to increased spending on claims payment to providers. For example, payment of claims rose from GHC 397.77 million in 2010 to GHC 785.64 million in 2013 (Figure 24). Thus more than 75 of the scheme’s infl ows were spent on claims payment. Within the last fi ve years, total expenditure of the scheme has surpassed income, thus putting the scheme in fi nancial diffi culties. Recent reports suggest that the scheme faces imminent insolvency if measures are not taken to inject capital into its operations. In addition, poor prompt payment to providers adds to the liquidity constraints and prevents eff ective performance of provider institutions.
GH
¢ (M
ILLI
ON
)
29 28.8
30.9
0
200
400
600
800
1000
1200
Claims Expenditure Inflows
“2013”“2012”“2011”“2010”
Figure 24: NHIS income and expenditure (2010-2013)
state_of_the_nations_interior_new.indd 62state_of_the_nations_interior_new.indd 62 05/02/19 11.0605/02/19 11.06

Financing the health sector 63
Health services utilization (outpatients and in-patients) have seen remarkable improvements in the last decade, particularly after the introduction of the National Health Insurance Scheme in 2004. The overall increase is largely due to improvement in access to health care due to NHIS and ongoing nationwide expansion and improvement of healthcare and service infrastructure at various service delivery points. In addition, the deployment of community health offi cers into CHPS zones has greatly improved geographical accessibility in most of the regions contributing to the high OPD per capita. The trend of OPD per capita (total OPD attendance by population) revealed that on the whole, this has increased from 0.81 in 2009 to 1.14 in 2012. Health sector reports from MOH and GHS have also shown that more than 80 of all OPD attendants are insured clients rising from 55.8 in 2010 to 80 in 2012. The proportion of the outpatients seen by Community Health Offi cers under CHPS has moved from 4.2 in 2009 to 5.2 in 2011.
Using data from the district health information management systems (DHIMS), we present the distribution of top 10 disease conditions reported to public health facilities in Ghana for the periods 2012 to 2014 for children and adults. Table 16 reveals that for both adults and children, uncomplicated malaria remained the most reported case, although it showed a declining trend from 61 to 50 in adults and from 58 to 51 in children from 2012-2014. This was followed by upper respiratory tract infections (contributing to about 20 of reported cases) and diarrhea diseases (contributing to about 10 of reported cases).
Table 16: Distribution of top 10 communicable diseases among adults and children () 2012-2014
COMMUNICABLE DISEASES ADULTS ≥ 12 YEARS CHILDREN <12 YEARS
2012 2013 2014 2012 2013 2014
Uncomplicated malaria 61.1 58.8 50.0 58.9 56.7 51.1
Severe malaria 3.7 4.1 3.0 4.0 4.3 3.0
Upper Respiratory Tract Infections 18.9 19.2 23.1 21.0 21.3 24.6
Diarrhea Diseases 7.0 7.5 9.9 9.2 10.0 12.2
Intestinal Worms 4.2 4.8 6.8 3.8 4.4 5.4
Typhoid Fever 2.5 3.0 3.9 0.7 0.9 1.0
Pneumonia 1.3 1.3 1.6 1.4 1.4 1.3
Septicemia 0.2 0.3 0.6 0.4 0.5 0.9
Chicken Pox 0.5 0.5 0.6 0.5 0.4 0.4
Suspected Cholera 0.1 0.0 0.3 0.0 0.0 0.1HIV/AIDS Related conditions 0.3 0.2 0.3 0.0 0.0 0.0Viral Hepatitis 0.2 0.2 0.0 0.0 0.0 0.0
Source: Authors’ computation from the district Health Management Information System (DHIMS) II
For non-communicable diseases, rheumatism and hypertension formed the highest number of cases reported among adults (more than 70 in combination) in public health facilities in Ghana while anemia was highest among children (more than 85) as illustrated in table 17.
state_of_the_nations_interior_new.indd 63state_of_the_nations_interior_new.indd 63 05/02/19 11.0605/02/19 11.06
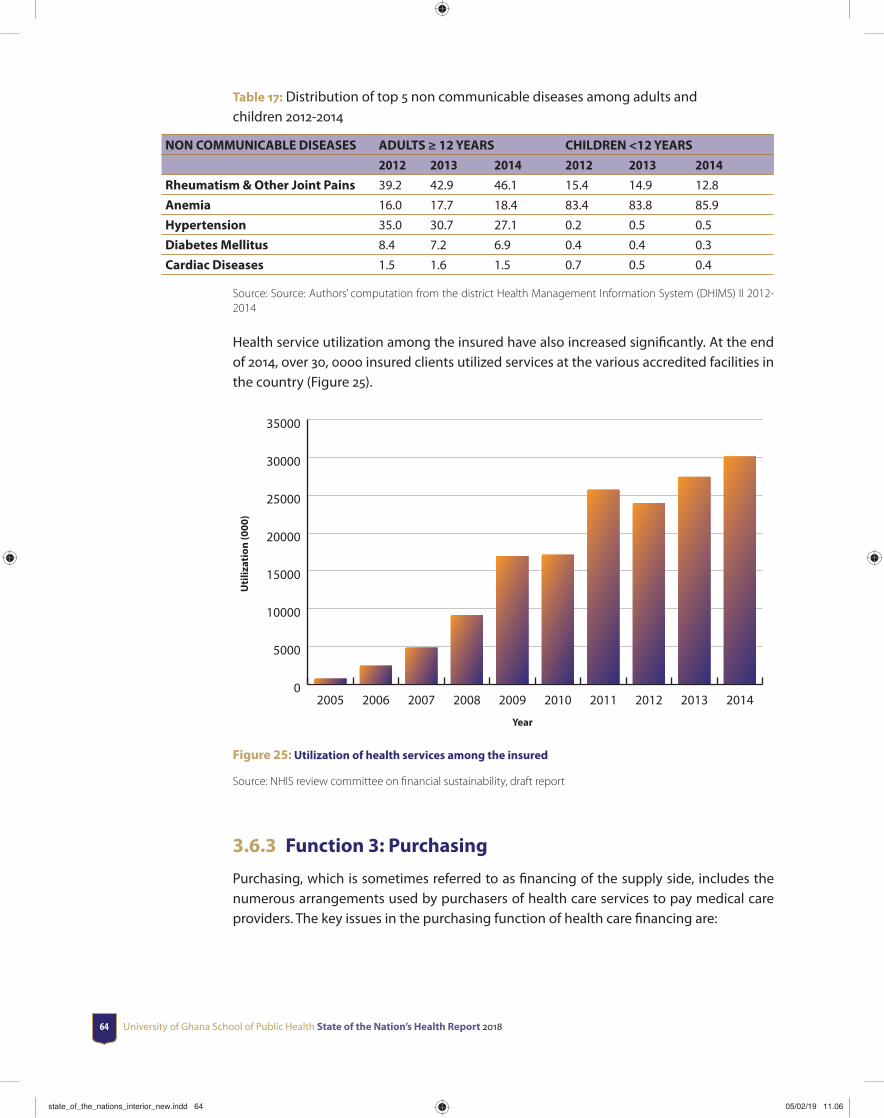
University of Ghana School of Public Health State of the Nation’s Health Report 201864
Table 17: Distribution of top 5 non communicable diseases among adults and children 2012-2014
NON COMMUNICABLE DISEASES ADULTS ≥ 12 YEARS CHILDREN <12 YEARS
2012 2013 2014 2012 2013 2014
Rheumatism & Other Joint Pains 39.2 42.9 46.1 15.4 14.9 12.8
Anemia 16.0 17.7 18.4 83.4 83.8 85.9
Hypertension 35.0 30.7 27.1 0.2 0.5 0.5
Diabetes Mellitus 8.4 7.2 6.9 0.4 0.4 0.3
Cardiac Diseases 1.5 1.6 1.5 0.7 0.5 0.4
Source: Source: Authors’ computation from the district Health Management Information System (DHIMS) II 2012-2014
Health service utilization among the insured have also increased signifi cantly. At the end of 2014, over 30, 0000 insured clients utilized services at the various accredited facilities in the country (Figure 25).
Uti
lizat
ion
(000
)
Year
0
5000
10000
15000
20000
25000
30000
35000
2014201320122011201020092008200720062005
Figure 25: Utilization of health services among the insured
Source: NHIS review committee on fi nancial sustainability, draft report
3.6.3 Function 3: Purchasing
Purchasing, which is sometimes referred to as fi nancing of the supply side, includes the numerous arrangements used by purchasers of health care services to pay medical care providers. The key issues in the purchasing function of health care fi nancing are:
state_of_the_nations_interior_new.indd 64state_of_the_nations_interior_new.indd 64 05/02/19 11.0605/02/19 11.06
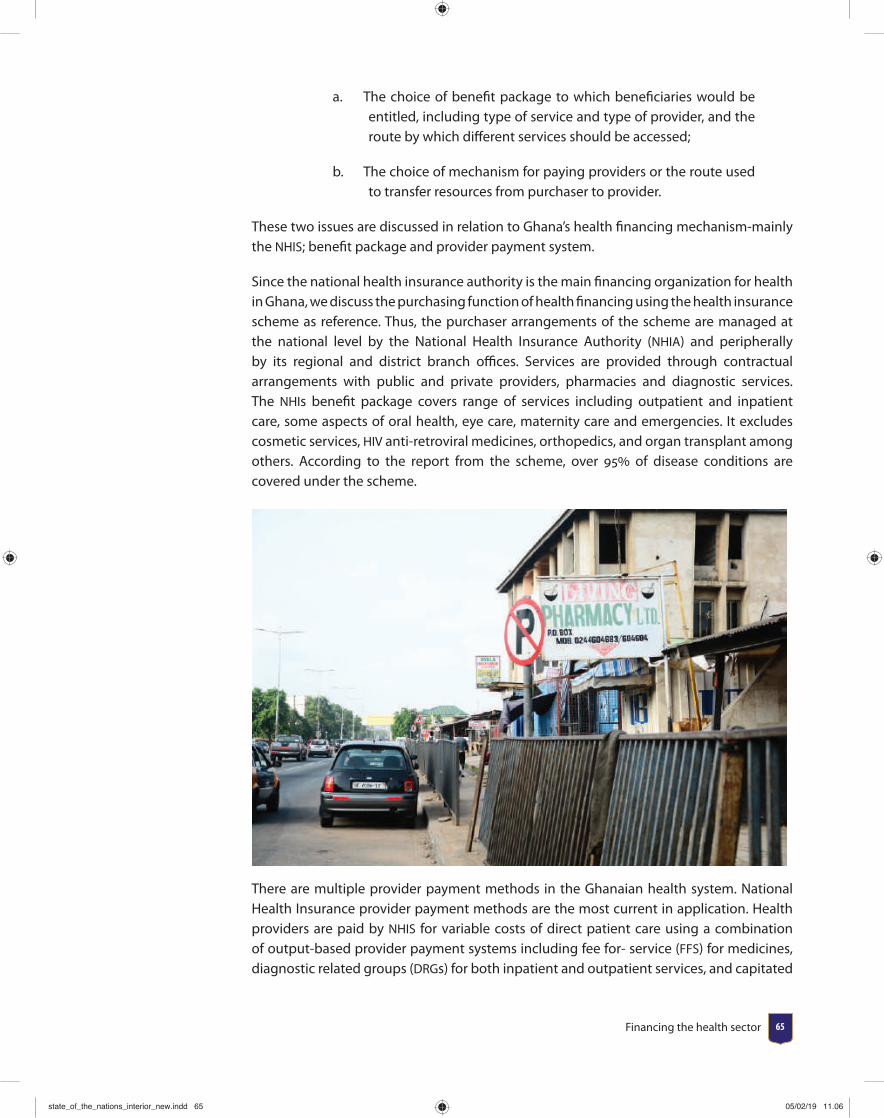
Financing the health sector 65
a. The choice of benefi t package to which benefi ciaries would be entitled, including type of service and type of provider, and the route by which diff erent services should be accessed;
b. The choice of mechanism for paying providers or the route used to transfer resources from purchaser to provider.
These two issues are discussed in relation to Ghana’s health fi nancing mechanism-mainly the NHIS; benefi t package and provider payment system.
Since the national health insurance authority is the main fi nancing organization for health in Ghana, we discuss the purchasing function of health fi nancing using the health insurance scheme as reference. Thus, the purchaser arrangements of the scheme are managed at the national level by the National Health Insurance Authority (NHIA) and peripherally by its regional and district branch offi ces. Services are provided through contractual arrangements with public and private providers, pharmacies and diagnostic services. The NHIs benefi t package covers range of services including outpatient and inpatient care, some aspects of oral health, eye care, maternity care and emergencies. It excludes cosmetic services, HIV anti-retroviral medicines, orthopedics, and organ transplant among others. According to the report from the scheme, over 95 of disease conditions are covered under the scheme.
There are multiple provider payment methods in the Ghanaian health system. National Health Insurance provider payment methods are the most current in application. Health providers are paid by NHIS for variable costs of direct patient care using a combination of output-based provider payment systems including fee for- service (FFS) for medicines, diagnostic related groups (DRGs) for both inpatient and outpatient services, and capitated
state_of_the_nations_interior_new.indd 65state_of_the_nations_interior_new.indd 65 05/02/19 11.0605/02/19 11.06
University of Ghana School of Public Health State of the Nation’s Health Report 201866
rate also for services. Donor contributions also represent a substantial portion of payment for goods and services for the variable costs of direct patient care and they also use a variety of diff erent provider payment systems.
The itemized fee schedule for medicines is based on a NHI medicines list (NHIML) that is periodically revised. Medicines can be dispensed by public and private provider facilities with an in house pharmacy/dispensary or by private community practice pharmacies accredited by the NHIA. Most community practice pharmacies, like other private self-fi nancing services, are based in wealthier and peri-urban areas. Poorer rural communities rely on chemical sellers (lay people licensed by the Pharmacy Council to sell over the counter medicines). Some of these are also accredited by the NHIA. The NHIS payment mechanism for medicines has eff ectively increased the availability of drugs at health facilities, with fewer shortages. However, the price of drugs has increased dramatically and continues to increase. Pharmaceutical reimbursement costs represent about half of total NHIS claims reimbursed (variable costs for direct patient care). Prices for the same drug tend to vary around the country. The private sector tends to charge higher prices, but price diff erentials exist even within the public sector. As a result, current pricing and cost structures capture the ineffi ciencies of the market.
The core components of a Diagnostic Related Groupings (DRGs) payment system are- a patient classifi cation system and a payment rate setting mechanism that takes into account the intensity of resources used to treat patients in a given DRG category to give cost weights or prices to the DRG. Typically, Ghana’s ‘G-DRG’ -DRG is not a pure DRG system in that, although it has the patient classifi cation system, it does not have cost weights and severity levels. It was designed and applied nationwide for all levels of care from the lowest (Community Health Planning and Services (CHPS) compounds) to the highest (teaching hospitals), to pay all accredited providers – public, quasi-government, and private – for inpatient and outpatient services. The tariff s refl ect preceding charges rather than a precise or economic costing; capital and equipment costs are not included. The tariff s are classifi ed into three broad groups of diagnoses, procedures/ operations, and investigations. The calculated direct cost of the services for consumables and labor are uniform for related or similar diagnosis, procedures, and investigations irrespective of level of care. Indirect or overhead costs comprising labour, vehicle maintenance and fuel, equipment and building maintenance, housekeeping, utilities, and general administrative and offi ce expenses are calculated, increasing from the lower to the higher level of care. The rationale is that facilities at higher levels of care consume larger amounts of overhead inputs because of their size and higher fragmentation of services.
The tariff s vary according to whether the facility is government, mission, or private to take into account the government subsidy, mainly for salaries but also some infrastructure, equipment, and overhead costs in the public and, to some extent, the private mission sector, as well as the zero subsidy in the private self-fi nancing sector. The tariff s also vary by type of fi nal service (inpatient or outpatient), type of intermediate service (laboratory investigations, imaging investigations, theatre, catering services), and specialty (obstetrics and gynecology, medicine, surgery, child health, eye, ENT, and dental). Since some district
state_of_the_nations_interior_new.indd 66state_of_the_nations_interior_new.indd 66 05/02/19 11.0605/02/19 11.06
Financing the health sector 67
hospitals have catering services and others do not, inpatient tariff s diff er by district hospitals with catering services and those without.
Ghana introduced capitation payment for primary care in 2010 with the view to containing escalating claims expenditure. Under the system, health care providers receive a lump sum per capita payment, intended to cover a fi xed ‘basket’ of services. Capitation rates are usually based on future expenditures determined through an assessment of predictable risks or events including demographic variables, previous diagnoses, self-reported health status and previous utilization. The pilot scheme was undertaken in the Ashanti Region due to its central location and heterogeneous infrastructure and culture, with one year mandate, after which it would be evaluated to inform roll out in the other regions of Ghana. The pilot was to enable testing of the overall eff ectiveness of the designed system in achieving the identifi ed objectives, identify key features of implementation that would be essential for success in scale-up after the pilot.
The objectives of the system were to (i) improve cost containment, effi ciency and eff ectiveness of health services through more rational resource use, (ii) share fi nancial risk between the scheme, providers and subscribers, (iii) introduce competition for providers and choice for patients to increase the responsiveness of the health system, (iv) correct some imbalances created by the use of the Ghana Diagnostic Related Groupings payment system for outpatient care such as outpatient supplier-induced demand, (v) simplify claims processing and (vi) address diffi culties in forecasting and budgeting.
Under capitation, the subscribers of the NHIS, after registration with the scheme, are asked to choose their service providers and have the fl exibility to change the provider after a period of not less than six months. The capitation system is practiced alongside other provider payment mechanisms for other levels of care other than the primary level. The piloting of the capitation payment system in Ghana has been met with mixed reactions from practitioners, subscribers and other stakeholders in the health industry.
In summary, payment to providers for services and medicines remains retrospective. Providers fi le claims, which go through a vetting process in the NHIA district scheme offi ces or for the higher-level facilities such as teaching and regional hospitals in the computerized central claims processing offi ce of the NHIA, before fi nal payment. The claims processes of many provider and district scheme offi ces remain predominantly manual despite increasing computerization. There remain administrative capacity, human resource, technical, and other challenges that slow down the process and can reduce the fi nal value of the reimbursements.
state_of_the_nations_interior_new.indd 67state_of_the_nations_interior_new.indd 67 05/02/19 11.0605/02/19 11.06

University of Ghana School of Public Health State of the Nation’s Health Report 201868
3.7 Health Sector Financial Resource Needs and Financing Gaps (2011-2014)
3.7.1 Fiscal space for health
Fiscal space can be defi ned as “the availability of budgetary room that allows a government to provide resources for a given desired purpose without any prejudice to the sustainability of a government’s fi nancial position” (Heller, 2005). An assessment of fi scal space typically examines whether and how a government could feasibly increase its expenditure in the short to medium term in a way that is consistent with the country’s macroeconomic fundamentals.
3.7.2 Estimated Additional Fiscal Space for Health in Ghana
from Economic Growth, 2010–15 (See World Bank
report page 125)
A simple and straight forward analysis of gaps in health fi nancing will be to analyze overall health expenditures against health revenue. To perform an analysis of the funding gap in the health sector will involve an analysis of the sector’s needs in relation to resource availability and/resource expectation. The fi ve-year POW between 2011 and 2013 focused on the needs of the health sector in a strategic plan called The Health Sector Medium Term Development Plan (HSMTDP). The Ministry of Health (MOH) in collaboration with the World Bank estimated the funding gap of the health sector in the country under some scenarios. The scenarios depended on assumptions about expectations of resource fl ow to fi nance the objectives of the sector. The three diff erent scenarios considered were as follows
Scenario one (status quo): This scenario assumed that insuffi cient funding is received or political will and expertise are insuffi cient to make the numerous strategic shifts outlined in the HSMTDP. It was also assumed under this scenario that all pipeline projects are done at the current pace of progress. This scenario was called the “status quo”.
Scenario two (conservative): This scenario assumed that the health sector received a moderate amount of funding for the HSMTDP and priority elements of the plan are implemented. Priority areas under consideration were MDG-related services and community based non-MDG services as well as a limited number of new ambulances and most of the required new or renovated health facilities. The scenario also assumed that coverage of essential services is expanded to reach 75-80 of the stated 2013 targets. This scenario was called the “conservative HSMTDP”.
Scenario three (ambitious): The third and fi nal scenario assumes that more generous funds are devoted to the health sector and this will be suffi cient to implement the full development plan. This include all prioritized capital investments and full expansion of
state_of_the_nations_interior_new.indd 68state_of_the_nations_interior_new.indd 68 05/02/19 11.0605/02/19 11.06
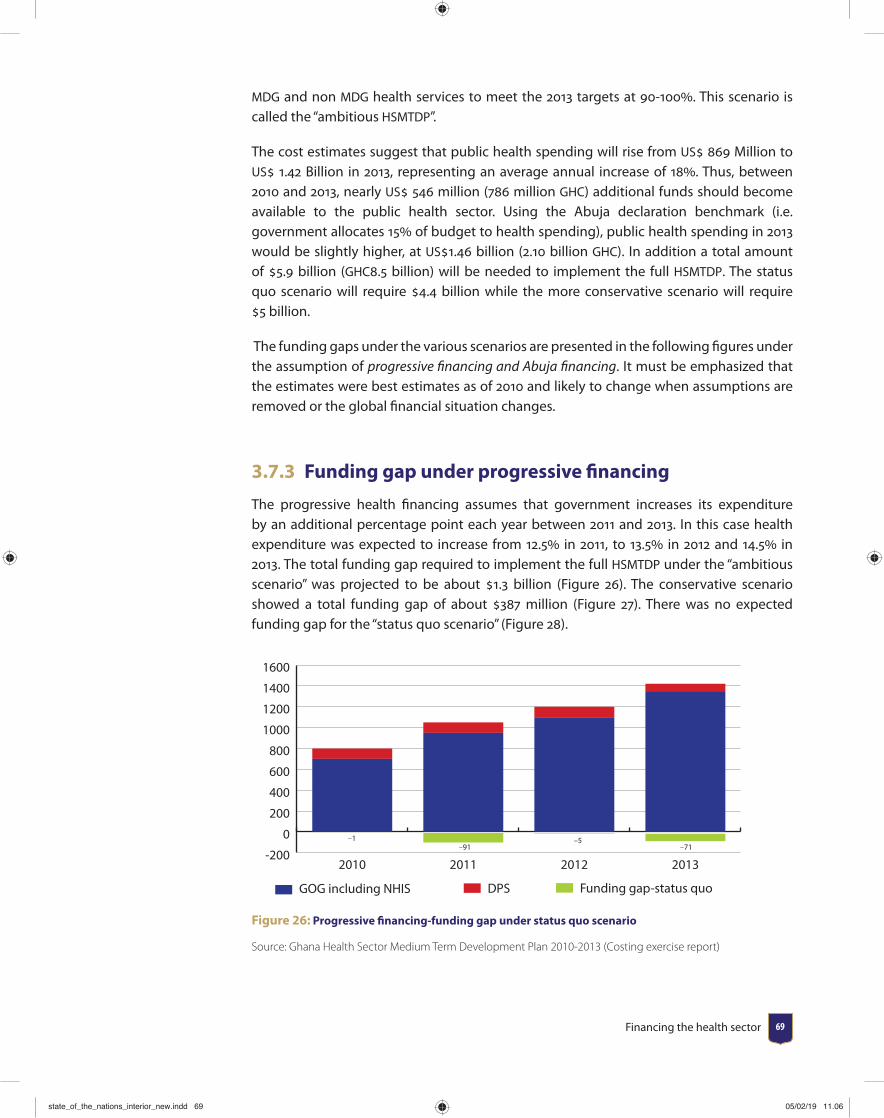
Financing the health sector 69
MDG and non MDG health services to meet the 2013 targets at 90-100. This scenario is called the “ambitious HSMTDP”.
The cost estimates suggest that public health spending will rise from US 869 Million to US 1.42 Billion in 2013, representing an average annual increase of 18. Thus, between 2010 and 2013, nearly US 546 million (786 million GHC) additional funds should become available to the public health sector. Using the Abuja declaration benchmark (i.e. government allocates 15 of budget to health spending), public health spending in 2013 would be slightly higher, at US1.46 billion (2.10 billion GHC). In addition a total amount of 5.9 billion (GHC8.5 billion) will be needed to implement the full HSMTDP. The status quo scenario will require 4.4 billion while the more conservative scenario will require 5 billion.
The funding gaps under the various scenarios are presented in the following fi gures under the assumption of progressive fi nancing and Abuja fi nancing. It must be emphasized that the estimates were best estimates as of 2010 and likely to change when assumptions are removed or the global fi nancial situation changes.
3.7.3 Funding gap under progressive fi nancing
The progressive health fi nancing assumes that government increases its expenditure by an additional percentage point each year between 2011 and 2013. In this case health expenditure was expected to increase from 12.5 in 2011, to 13.5 in 2012 and 14.5 in 2013. The total funding gap required to implement the full HSMTDP under the “ambitious scenario” was projected to be about 1.3 billion (Figure 26). The conservative scenario showed a total funding gap of about 387 million (Figure 27). There was no expected funding gap for the “status quo scenario” (Figure 28).
-200
0
200
400
600
800
1000
1200
1400
1600
Funding gap-status quoDPS GOG including NHIS
2013201220112010
–1–91
–5–71
Figure 26: Progressive fi nancing-funding gap under status quo scenario
Source: Ghana Health Sector Medium Term Development Plan 2010-2013 (Costing exercise report)
state_of_the_nations_interior_new.indd 69state_of_the_nations_interior_new.indd 69 05/02/19 11.0605/02/19 11.06
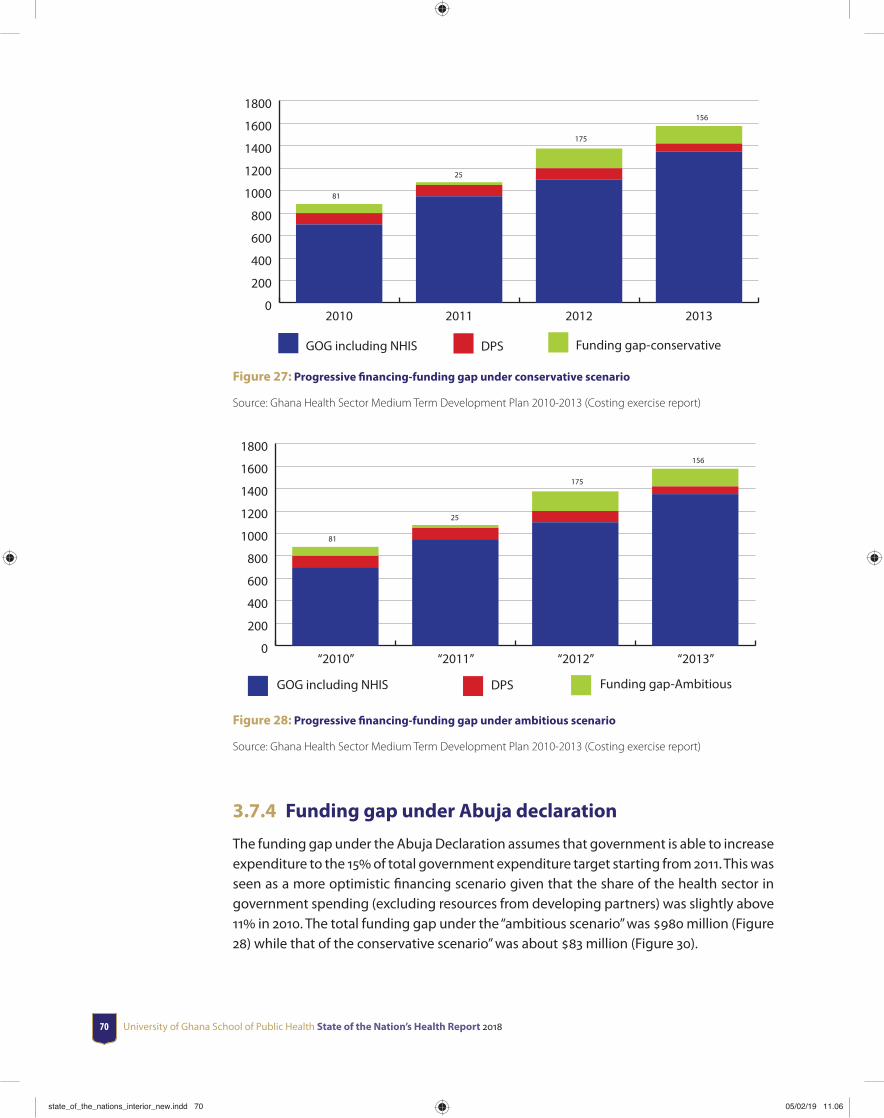
University of Ghana School of Public Health State of the Nation’s Health Report 201870
0
200
400
600
800
1000
1200
1400
1600
1800
Funding gap-conservativeDPSGOG including NHIS
2013201220112010
81
25
175
156
Figure 27: Progressive fi nancing-funding gap under conservative scenario
Source: Ghana Health Sector Medium Term Development Plan 2010-2013 (Costing exercise report)
0
200
400
600
800
1000
1200
1400
1600
1800
Funding gap-AmbitiousDPSGOG including NHIS
“2013”“2012”“2011”“2010”
81
25
175
156
Figure 28: Progressive fi nancing-funding gap under ambitious scenario
Source: Ghana Health Sector Medium Term Development Plan 2010-2013 (Costing exercise report)
3.7.4 Funding gap under Abuja declaration
The funding gap under the Abuja Declaration assumes that government is able to increase expenditure to the 15 of total government expenditure target starting from 2011. This was seen as a more optimistic fi nancing scenario given that the share of the health sector in government spending (excluding resources from developing partners) was slightly above 11 in 2010. The total funding gap under the “ambitious scenario” was 980 million (Figure 28) while that of the conservative scenario” was about 83 million (Figure 30).
state_of_the_nations_interior_new.indd 70state_of_the_nations_interior_new.indd 70 05/02/19 11.0605/02/19 11.06

Financing the health sector 71
–126
–278
–1
–117
-400
-200
0
200
400
600
800
1000
1200
1400
1600
Funding gap-status quoDPSGOG including NHIS
2013201220112010
Figure 29: Abuja fi nancing-funding gap under status quo scenario
Source: Ghana Health Sector Medium Term Development Plan 2010-2013 (Costing exercise report)
–161
81
54
109
-400
-200
0
200
400
600
800
1000
1200
1400
1600
Funding gap-conservativeDPSGOG including NHIS
“2013”“2012”“2011”“2010”
Figure 30: Abuja fi nancing-funding gap under conservative scenario
Source: Ghana Health Sector Medium Term Development Plan 2010-2013 (Costing exercise report)
state_of_the_nations_interior_new.indd 71state_of_the_nations_interior_new.indd 71 05/02/19 11.0605/02/19 11.06

University of Ghana School of Public Health State of the Nation’s Health Report 201872
0
200
400
600
800
1000
1200
1400
1600
1800
2000
Funding gap-ambitiousDPSGOG including NHIS
“2013”“2012”“2011”“2010”
211
21
315
433
Figure 31: Abuja fi nancing-funding gap under ambitious scenario
Source: Ghana Health Sector Medium Term Development Plan 2010-2013 (Costing exercise report)
3.7.5 Funding needs of the health sector (2014-2016)
The revised Mid-Term Expenditure Framework (MTEF) of the Ministry of Health sought to highlight the comprehensive plans and target from 2014 to 2016. The cost estimates show that the health sector will require a total budget of about GHC3, 353 million which is expected to rise to about GHC3, 495 million and about GHC3, 510 million in 2015 and 2016, respectively. These statistics are depicted in Figure 32 below.
3,353,707,815
3,509,715,3273,494,865,531
3250
3300
3350
3400
3450
3500
3550
201620152014
GH
¢ (0
00,0
00)
Year
Figure 32: Estimated funding needs of the heath sector (2014-2016)
Source: Ministry of Health, MTEF (2014-2016) Program based budget estimates
state_of_the_nations_interior_new.indd 72state_of_the_nations_interior_new.indd 72 05/02/19 11.0605/02/19 11.06
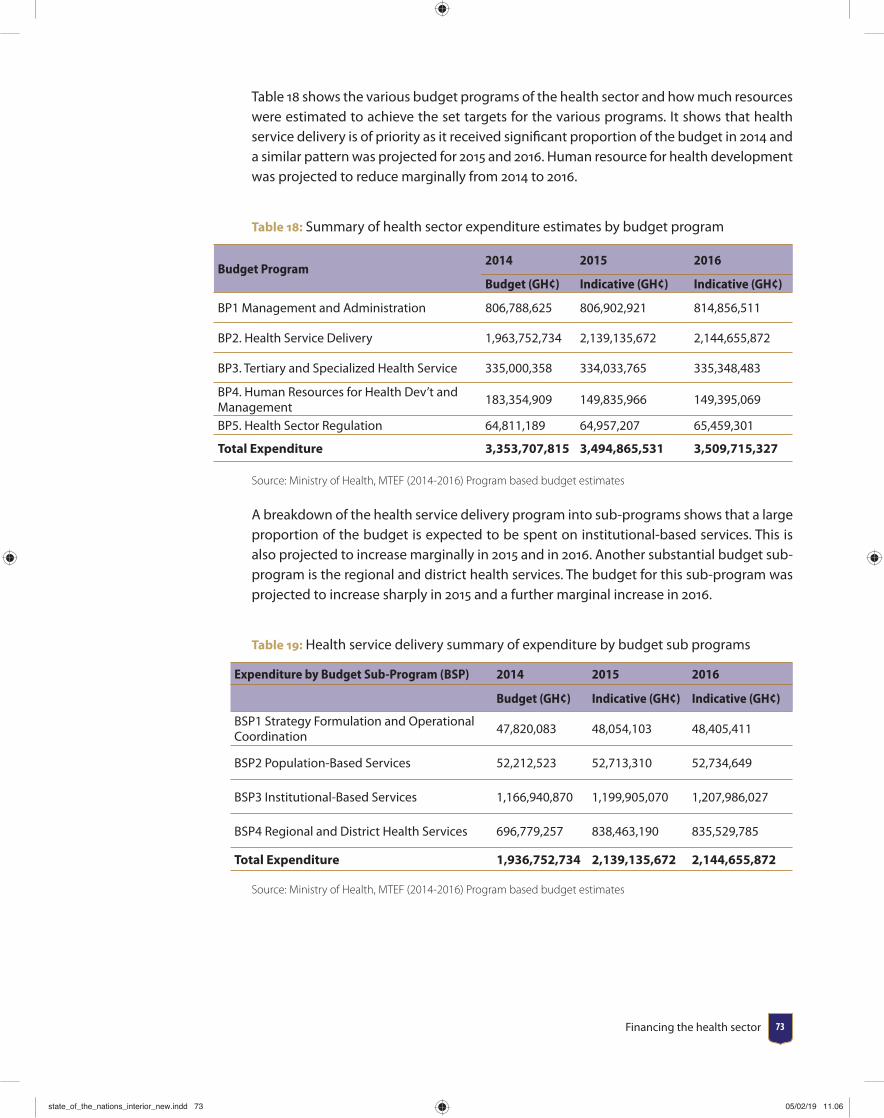
Financing the health sector 73
Table 18 shows the various budget programs of the health sector and how much resources were estimated to achieve the set targets for the various programs. It shows that health service delivery is of priority as it received signifi cant proportion of the budget in 2014 and a similar pattern was projected for 2015 and 2016. Human resource for health development was projected to reduce marginally from 2014 to 2016.
Table 18: Summary of health sector expenditure estimates by budget program
Budget Program2014 2015 2016
Budget (GH¢) Indicative (GH¢) Indicative (GH¢)
BP1 Management and Administration 806,788,625 806,902,921 814,856,511
BP2. Health Service Delivery 1,963,752,734 2,139,135,672 2,144,655,872
BP3. Tertiary and Specialized Health Service 335,000,358 334,033,765 335,348,483
BP4. Human Resources for Health Dev’t and Management
183,354,909 149,835,966 149,395,069
BP5. Health Sector Regulation 64,811,189 64,957,207 65,459,301
Total Expenditure 3,353,707,815 3,494,865,531 3,509,715,327
Source: Ministry of Health, MTEF (2014-2016) Program based budget estimates
A breakdown of the health service delivery program into sub-programs shows that a large proportion of the budget is expected to be spent on institutional-based services. This is also projected to increase marginally in 2015 and in 2016. Another substantial budget sub-program is the regional and district health services. The budget for this sub-program was projected to increase sharply in 2015 and a further marginal increase in 2016.
Table 19: Health service delivery summary of expenditure by budget sub programs
Expenditure by Budget Sub-Program (BSP) 2014 2015 2016
Budget (GH¢) Indicative (GH¢) Indicative (GH¢)
BSP1 Strategy Formulation and Operational Coordination
47,820,083 48,054,103 48,405,411
BSP2 Population-Based Services 52,212,523 52,713,310 52,734,649
BSP3 Institutional-Based Services 1,166,940,870 1,199,905,070 1,207,986,027
BSP4 Regional and District Health Services 696,779,257 838,463,190 835,529,785
Total Expenditure 1,936,752,734 2,139,135,672 2,144,655,872
Source: Ministry of Health, MTEF (2014-2016) Program based budget estimates
state_of_the_nations_interior_new.indd 73state_of_the_nations_interior_new.indd 73 05/02/19 11.0605/02/19 11.06
University of Ghana School of Public Health State of the Nation’s Health Report 201874
3.8 Financial outlookThis section discusses expectations and prospects for improvements in fi nancing for the health sector.
3.8.1 Government spending on health
Government of Ghana budgetary allocation and spending on the health sector has received marginal increment over the years. This is a common trend in many African countries. In response to improving government spending particularly to meet the Millennium Development Goals (MDGs), African Union countries met in Abuja and pledged to increase government funding for health to at least 15 of their Gross Domestic Product (GDP) and urged donor countries to scale up support. This is known as the Abuja declaration. A review ten years on (i.e. in 2011) revealed that 26 countries, including Ghana have increased the proportion of total government expenditures allocated to health but not enough to meet the 15 bench mark. In Ghana, government expenditure for health has hovered around 3.3 against what has usually been budgeted for (around 11 between 2012 and 2014). A staggered 3 annual increment over four years may be an option instead of higher budgeted fi gures that are unattainable.
In line with the Abuja declaration, donor countries were entreated to fulfi l a target of 0.7 of their Gross National Income (GNI) as offi cial development assistance (ODA) to developing countries. In the current global fi nancial crises, it appears health partners are unable to meet this target while some have reduced their support to countries. Our analysis for Ghana revealed that over time, donor support remained unstable. In addition, the country’s transition to lower middle income status in 2010 has had some fi scal implications with funding from health partners declining. This decline was particularly from 2011 to 2012 and further in 2013. It is necessary that alternative fi nancing sources are identifi ed to bridge the gap created by this decline. For instance, government should employ improved and innovative taxation mechanisms and compliance, strengthen excise taxes on goods and services with high demand such as telecommunication and entertainment.
3.8.2 Health service utilization
Since 2004, household utilization of health services has increased as a result of the implementation of Ghana’s National Health Insurance Scheme. Increases in utilization also imply increases in household spending on health even though insurance is meant to minimize fi nancial barriers to the use of health services. Various studies have reported that the insured pay out of pocket for some services despite the comprehensive benefi t package. These spending by the insured can sometimes be large enough to send households into impoverishment or to incur catastrophic health expenditure.
It must be emphasized that even though utilization has increased, enrolment into the scheme remains below 40 of the total population since the NHIS implementation 11 years
state_of_the_nations_interior_new.indd 74state_of_the_nations_interior_new.indd 74 05/02/19 11.0605/02/19 11.06

Financing the health sector 75
on. The 2013 enrolment stood at 38.4. Innovative strategies to improve enrolment are necessary if high coverage is desired particularly for the poor. It is important that the rich and those within the formal sector are encouraged to enroll to improve enrolment. This could be done by aligning benefi ts package to premium amounts paid especially by the rich. Some studies have shown that reasons for low enrolment among those in the higher socioeconomic status are quality of care. If quality of care is improved among this group, enrolment is likely to increase. If this becomes feasible, enrolment is likely to increase and the scheme will be able to pull enough resources to reimburse facilities and remain sustainable. In addition, delays in obtaining biometric ID cards needs to be improved.
3.8.3 The NHIS expenditure
The NHIS is a major resource pool for fi nancing health in the country. In 2013, the national health insurance levy (NHIL) formed a larger share of the health sector budget relative to government of Ghana’s (GOG). The scheme currently employs diff erent provider payment mechanisms-G-DRG for services, direct payment for medicines and capitation. With these systems running concurrently, ineffi ciencies are likely to increase and it is expected that soon, the scheme will have to make a decision to operate with a single payment system. Further, the current delays in reimbursements to providers, should it continue, will facilitate the refusal of providers to off er services to the insured as witnessed in 2014 when Christian Health Association of Ghana (CHAG) and private providers refused to off er services to NHIS clients. The credibility of the scheme could be compromised and the poor will be the most aff ected as they may pay out-of-pocket for health care.
3.9 Summary and ConclusionThe direction of fi nancing in the health sector has remained the same over the years- donor-dependent for program implementation and NHIS for provider reimbursements. Given Ghana’s lower middle income status, donor funds will continue to decline and therefore alternative sources of funding for health care should be identifi ed and employed. Funds allocated to health as a proportion of GDP should be increased to meet Abuja declaration target. Data from NHIA on reimbursements for major diseases in the country will be a useful resource for planning and be made publicly available.
state_of_the_nations_interior_new.indd 75state_of_the_nations_interior_new.indd 75 05/02/19 11.0605/02/19 11.06
University of Ghana School of Public Health State of the Nation’s Health Report 201876 University of Ghana School of Public Health State of the Nation’s Health Report 201876
CHAPTER 4Human resources for health
4.1 IntroductionHuman Resources for Health (HRH) is a critical component of a functional health system. The health sector’s ability to deliver the needed healthcare services for optimum health outcomes depends largely on the human resources; their right numbers, professional competence, skills-mix and motivation.
Over the past 15 years, the health workforce (all cadres of health workers) in Ghana has increased dramatically from 28,662 in 1999, to 94,696 in 2015. Over the same period, several new pre-service training institutions were established across the country, and existing ones were upgraded to tertiary status. The past 15 years also saw the establishment of two continuous professional development colleges, namely the Ghana College of Physicians and Surgeons and the Ghana College of Nurses and Midwives to contribute to the continuous professional development of workforce.
Even though the present HRH numbers are encouraging, there are some constraints regarding production, distribution, management and retention of health workforce in the health sector. For example, there is considerable distributional inequalities within and across the ten regions of the country. This chapter presents HRH situation in Ghana, with particular emphasis on core clinical staff .
state_of_the_nations_interior_new.indd 76state_of_the_nations_interior_new.indd 76 05/02/19 11.0605/02/19 11.06
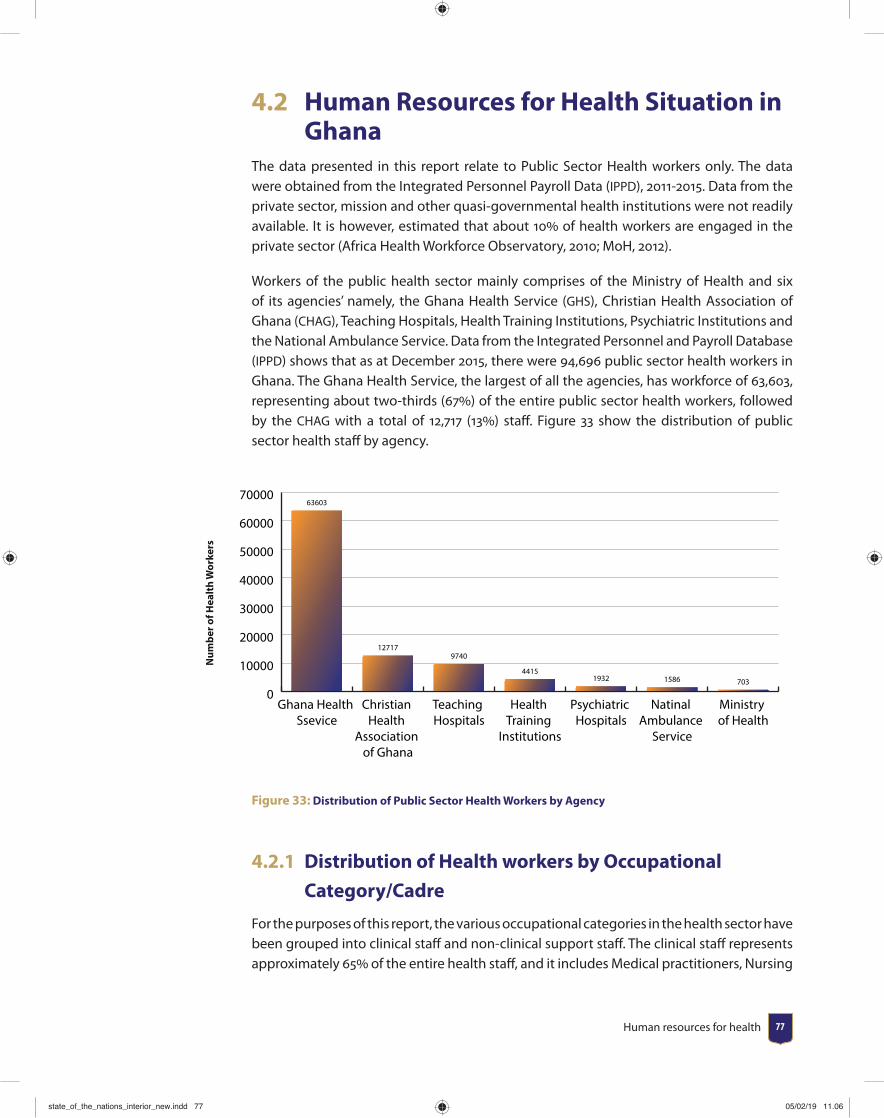
Human resources for health 77
4.2 Human Resources for Health Situation in Ghana
The data presented in this report relate to Public Sector Health workers only. The data were obtained from the Integrated Personnel Payroll Data (IPPD), 2011-2015. Data from the private sector, mission and other quasi-governmental health institutions were not readily available. It is however, estimated that about 10 of health workers are engaged in the private sector (Africa Health Workforce Observatory, 2010; MoH, 2012).
Workers of the public health sector mainly comprises of the Ministry of Health and six of its agencies’ namely, the Ghana Health Service (GHS), Christian Health Association of Ghana (CHAG), Teaching Hospitals, Health Training Institutions, Psychiatric Institutions and the National Ambulance Service. Data from the Integrated Personnel and Payroll Database (IPPD) shows that as at December 2015, there were 94,696 public sector health workers in Ghana. The Ghana Health Service, the largest of all the agencies, has workforce of 63,603, representing about two-thirds (67) of the entire public sector health workers, followed by the CHAG with a total of 12,717 (13) staff . Figure 33 show the distribution of public sector health staff by agency.
0
10000
20000
30000
40000
50000
60000
70000
Ministry of Health
Natinal Ambulance
Service
Psychiatric Hospitals
Health Training
Institutions
Teaching Hospitals
Christian Health
Association of Ghana
Ghana Health Ssevice
63603
127179740
44151932 1586 703
Num
ber o
f Hea
lth
Wor
kers
Figure 33: Distribution of Public Sector Health Workers by Agency
4.2.1 Distribution of Health workers by Occupational
Category/Cadre
For the purposes of this report, the various occupational categories in the health sector have been grouped into clinical staff and non-clinical support staff . The clinical staff represents approximately 65 of the entire health staff , and it includes Medical practitioners, Nursing
state_of_the_nations_interior_new.indd 77state_of_the_nations_interior_new.indd 77 05/02/19 11.0605/02/19 11.06
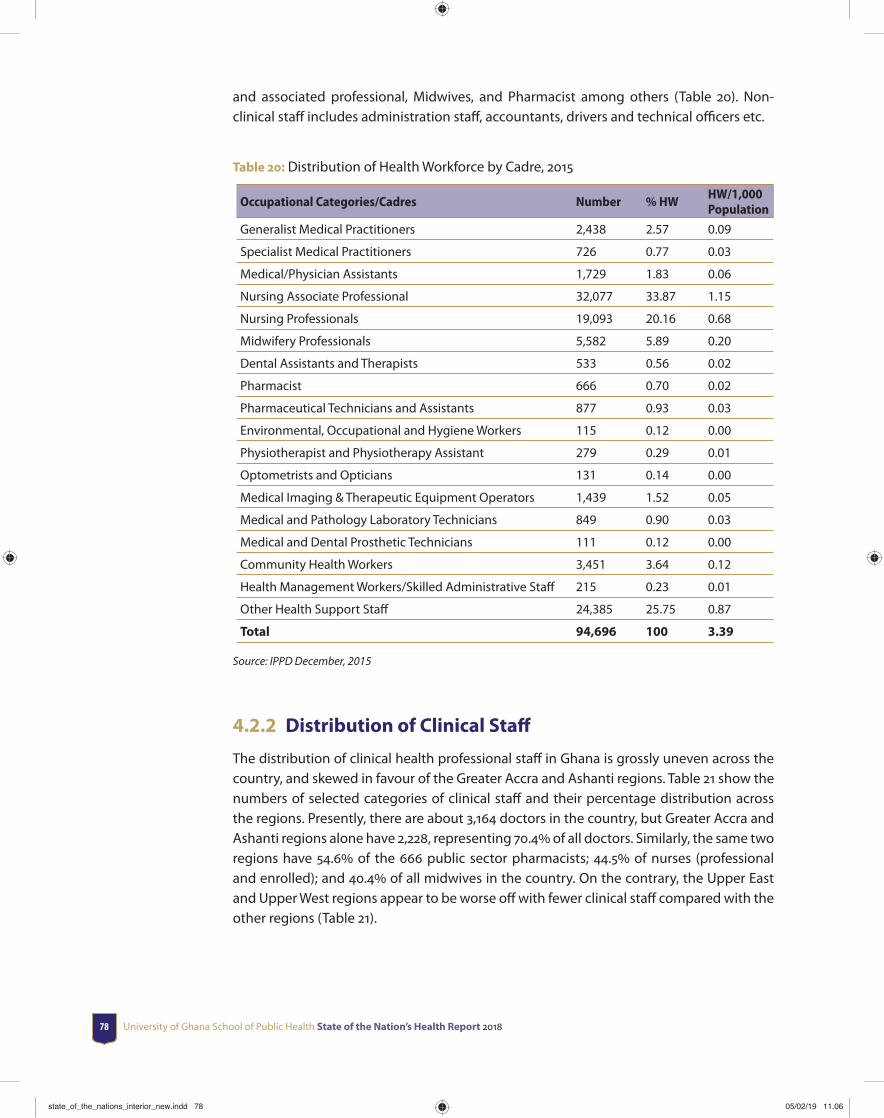
University of Ghana School of Public Health State of the Nation’s Health Report 201878
and associated professional, Midwives, and Pharmacist among others (Table 20). Non-clinical staff includes administration staff , accountants, drivers and technical offi cers etc.
Table 20: Distribution of Health Workforce by Cadre, 2015
Occupational Categories/Cadres Number % HWHW/1,000 Population
Generalist Medical Practitioners 2,438 2.57 0.09
Specialist Medical Practitioners 726 0.77 0.03
Medical/Physician Assistants 1,729 1.83 0.06
Nursing Associate Professional 32,077 33.87 1.15
Nursing Professionals 19,093 20.16 0.68
Midwifery Professionals 5,582 5.89 0.20
Dental Assistants and Therapists 533 0.56 0.02
Pharmacist 666 0.70 0.02
Pharmaceutical Technicians and Assistants 877 0.93 0.03
Environmental, Occupational and Hygiene Workers 115 0.12 0.00
Physiotherapist and Physiotherapy Assistant 279 0.29 0.01
Optometrists and Opticians 131 0.14 0.00
Medical Imaging & Therapeutic Equipment Operators 1,439 1.52 0.05
Medical and Pathology Laboratory Technicians 849 0.90 0.03
Medical and Dental Prosthetic Technicians 111 0.12 0.00
Community Health Workers 3,451 3.64 0.12
Health Management Workers/Skilled Administrative Staff 215 0.23 0.01
Other Health Support Staff 24,385 25.75 0.87
Total 94,696 100 3.39
Source: IPPD December, 2015
4.2.2 Distribution of Clinical Staff
The distribution of clinical health professional staff in Ghana is grossly uneven across the country, and skewed in favour of the Greater Accra and Ashanti regions. Table 21 show the numbers of selected categories of clinical staff and their percentage distribution across the regions. Presently, there are about 3,164 doctors in the country, but Greater Accra and Ashanti regions alone have 2,228, representing 70.4 of all doctors. Similarly, the same two regions have 54.6 of the 666 public sector pharmacists; 44.5 of nurses (professional and enrolled); and 40.4 of all midwives in the country. On the contrary, the Upper East and Upper West regions appear to be worse off with fewer clinical staff compared with the other regions (Table 21).
state_of_the_nations_interior_new.indd 78state_of_the_nations_interior_new.indd 78 05/02/19 11.0605/02/19 11.06
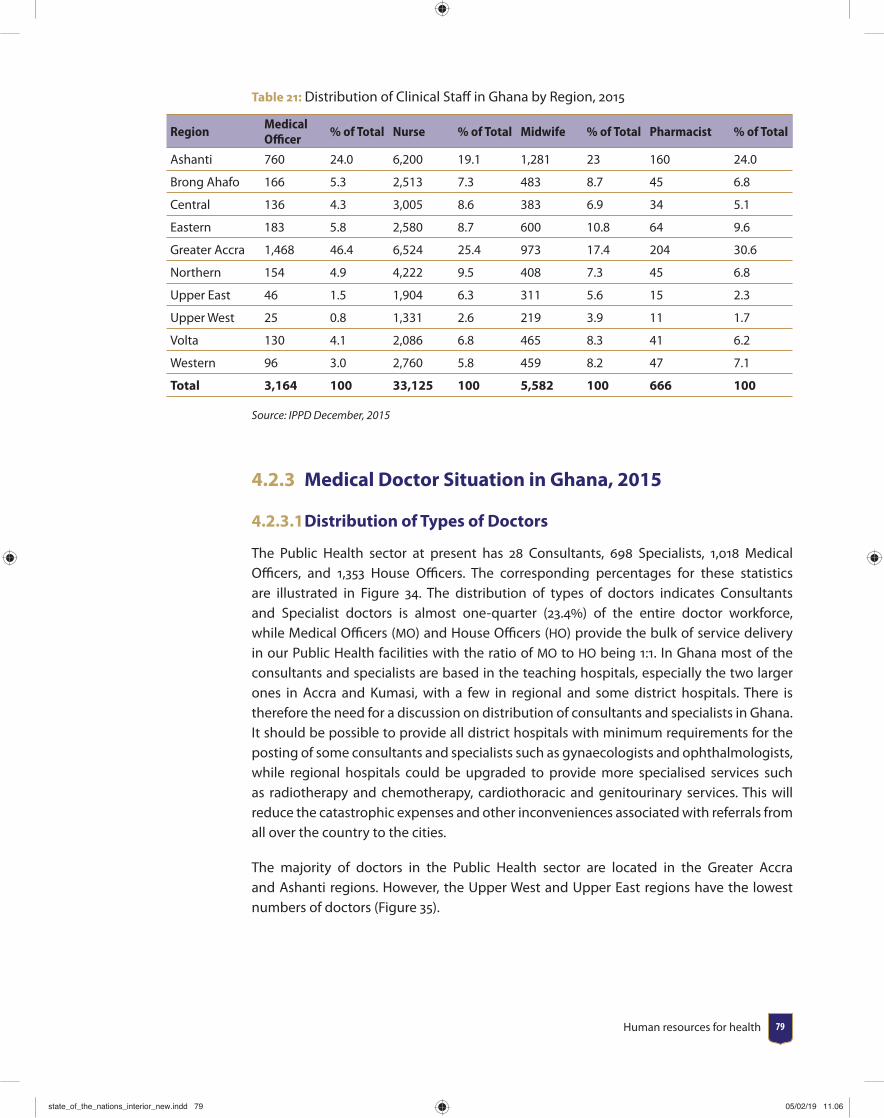
Human resources for health 79
Table 21: Distribution of Clinical Staff in Ghana by Region, 2015
RegionMedical Offi cer
% of Total Nurse % of Total Midwife % of Total Pharmacist % of Total
Ashanti 760 24.0 6,200 19.1 1,281 23 160 24.0
Brong Ahafo 166 5.3 2,513 7.3 483 8.7 45 6.8
Central 136 4.3 3,005 8.6 383 6.9 34 5.1
Eastern 183 5.8 2,580 8.7 600 10.8 64 9.6
Greater Accra 1,468 46.4 6,524 25.4 973 17.4 204 30.6
Northern 154 4.9 4,222 9.5 408 7.3 45 6.8
Upper East 46 1.5 1,904 6.3 311 5.6 15 2.3
Upper West 25 0.8 1,331 2.6 219 3.9 11 1.7
Volta 130 4.1 2,086 6.8 465 8.3 41 6.2
Western 96 3.0 2,760 5.8 459 8.2 47 7.1
Total 3,164 100 33,125 100 5,582 100 666 100
Source: IPPD December, 2015
4.2.3 Medical Doctor Situation in Ghana, 2015
4.2.3.1 Distribution of Types of Doctors
The Public Health sector at present has 28 Consultants, 698 Specialists, 1,018 Medical Offi cers, and 1,353 House Offi cers. The corresponding percentages for these statistics are illustrated in Figure 34. The distribution of types of doctors indicates Consultants and Specialist doctors is almost one-quarter (23.4) of the entire doctor workforce, while Medical Offi cers (MO) and House Offi cers (HO) provide the bulk of service delivery in our Public Health facilities with the ratio of MO to HO being 1:1. In Ghana most of the consultants and specialists are based in the teaching hospitals, especially the two larger ones in Accra and Kumasi, with a few in regional and some district hospitals. There is therefore the need for a discussion on distribution of consultants and specialists in Ghana. It should be possible to provide all district hospitals with minimum requirements for the posting of some consultants and specialists such as gynaecologists and ophthalmologists, while regional hospitals could be upgraded to provide more specialised services such as radiotherapy and chemotherapy, cardiothoracic and genitourinary services. This will reduce the catastrophic expenses and other inconveniences associated with referrals from all over the country to the cities.
The majority of doctors in the Public Health sector are located in the Greater Accra and Ashanti regions. However, the Upper West and Upper East regions have the lowest numbers of doctors (Figure 35).
state_of_the_nations_interior_new.indd 79state_of_the_nations_interior_new.indd 79 05/02/19 11.0605/02/19 11.06
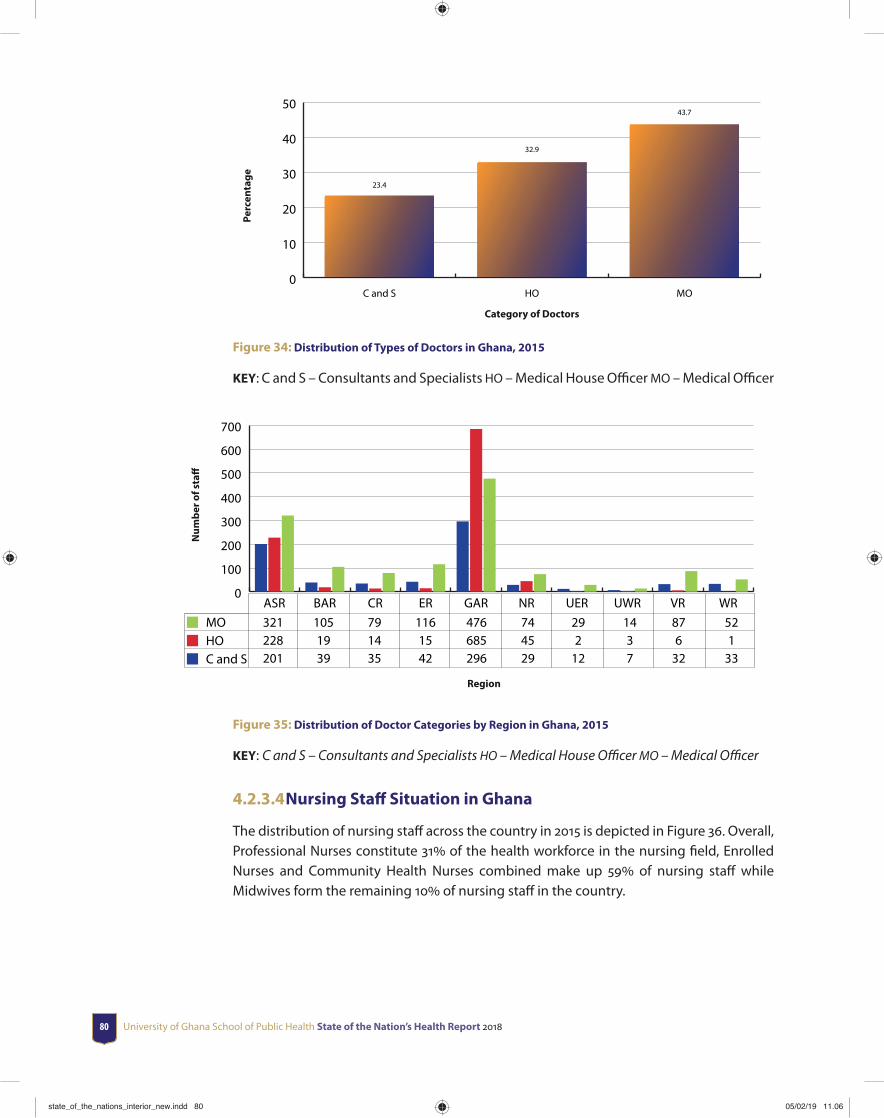
University of Ghana School of Public Health State of the Nation’s Health Report 201880
0
10
20
30
40
50
MOHOC and S
23.4
32.9
43.7
Perc
enta
ge
Category of Doctors
Figure 34: Distribution of Types of Doctors in Ghana, 2015
KEY: C and S – Consultants and Specialists HO – Medical House Offi cer MO – Medical Offi cer
0
100
200
300
400
500
600
700
MOHOC and S
WRVRUWRUERNRGARERCRBARASR 321 105 79 116 476 74 29 14 87 52 228 19 14 15 685 45 2 3 6 1 201 39 35 42 296 29 12 7 32 33
Num
ber o
f sta
ff
Region
Figure 35: Distribution of Doctor Categories by Region in Ghana, 2015
KEY: C and S – Consultants and Specialists HO – Medical House Offi cer MO – Medical Offi cer
4.2.3.4 Nursing Staff Situation in Ghana
The distribution of nursing staff across the country in 2015 is depicted in Figure 36. Overall, Professional Nurses constitute 31 of the health workforce in the nursing fi eld, Enrolled Nurses and Community Health Nurses combined make up 59 of nursing staff while Midwives form the remaining 10 of nursing staff in the country.
state_of_the_nations_interior_new.indd 80state_of_the_nations_interior_new.indd 80 05/02/19 11.0605/02/19 11.06

Human resources for health 81
0
5000
10000
15000
20000
10
15
20
25
30
35
Absolute Numbers
Percentage
PNENCHNMW
Tota
l Nur
sing
Sta
ff
Nurse Category
10.2
29 28.8
30.9
5582
15814 16263 16862
Figure 36: Distribution of Nursing Staff across the Country, 2015
KEY: MW – Midwives, EN – Enrolled Nurses, CHN – Community Health Nurses, PN – Professional Nurses
4.2.3.5 Skills-mix of Clinical Nurses by Region
Figure 37 shows the skills mix of professional versus enrolled nurses. Nationally, about 51 of clinical nurses are professionals (PN) as opposed to 49 who were enrolled nurses (EN). This national proportion of PN to EN is below the World Health Organization (WHO) recommended skills mix of professional nurses to enrolled nurses of 6:4 (i.e. 60 professional nurses and 40 enrolled nurses), (WHO, 2009). Generally, the regional distribution of PN to EN nurses’ skill mix appear to be akin to the national fi gures. Apart from the Greater Accra region that meets the recommended skills mix with about 66 professional nurses to 34 enrolled nurses, all the nine other regions fall short of skills mix norm. Northern, Western and Upper West regions have less than 40 of their nurses being professionals (Figure 37). This observed discrepancy in proportion of professional to enrolled nurses in Ghana is worrying as the lack of appropriate skill mix may aff ect the quality of health services.
state_of_the_nations_interior_new.indd 81state_of_the_nations_interior_new.indd 81 05/02/19 11.0605/02/19 11.06
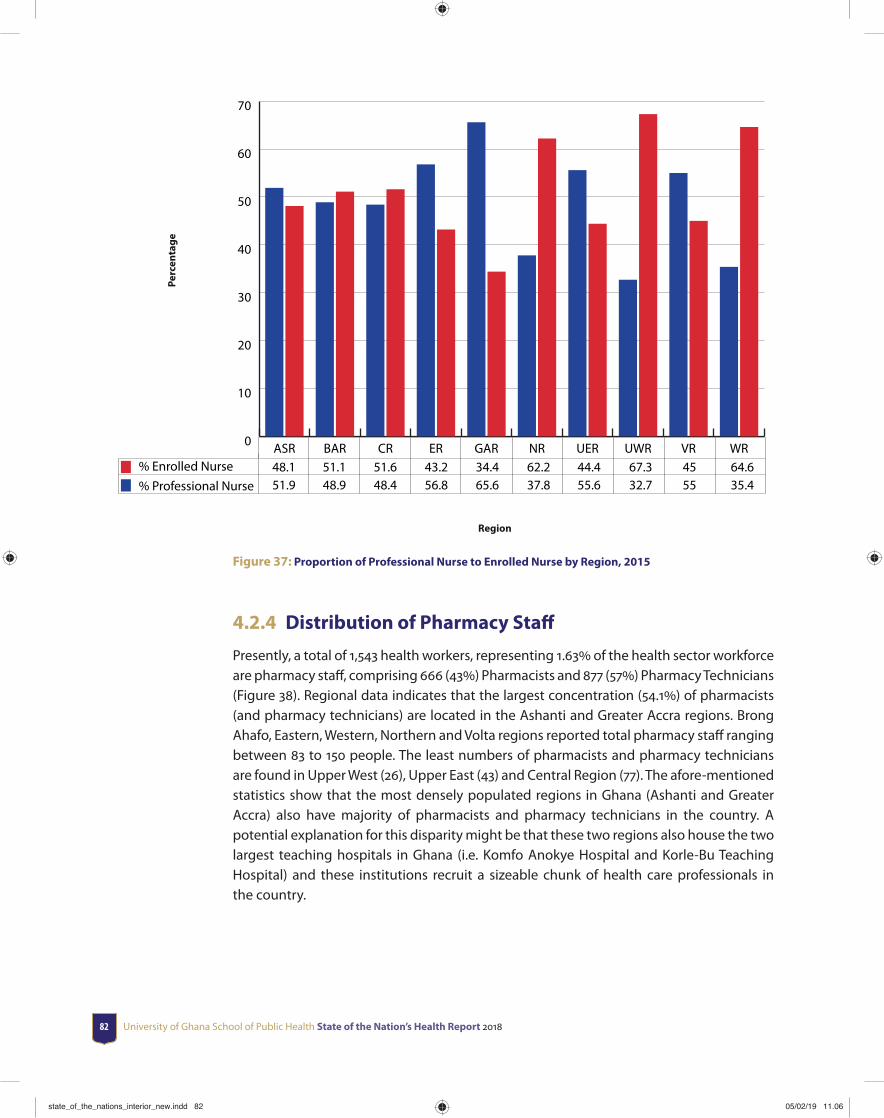
University of Ghana School of Public Health State of the Nation’s Health Report 201882
48.1 51.1 51.6 43.2 34.4 62.2 44.4 67.3 45 64.6 51.9 48.9 48.4 56.8 65.6 37.8 55.6 32.7 55 35.4
Perc
enta
ge
Region
0
10
20
30
40
50
60
70
% Enrolled Nurse% Professional Nurse
WRVRUWRUERNRGARERCRBARASR
Figure 37: Proportion of Professional Nurse to Enrolled Nurse by Region, 2015
4.2.4 Distribution of Pharmacy Staff
Presently, a total of 1,543 health workers, representing 1.63 of the health sector workforce are pharmacy staff , comprising 666 (43) Pharmacists and 877 (57) Pharmacy Technicians (Figure 38). Regional data indicates that the largest concentration (54.1) of pharmacists (and pharmacy technicians) are located in the Ashanti and Greater Accra regions. Brong Ahafo, Eastern, Western, Northern and Volta regions reported total pharmacy staff ranging between 83 to 150 people. The least numbers of pharmacists and pharmacy technicians are found in Upper West (26), Upper East (43) and Central Region (77). The afore-mentioned statistics show that the most densely populated regions in Ghana (Ashanti and Greater Accra) also have majority of pharmacists and pharmacy technicians in the country. A potential explanation for this disparity might be that these two regions also house the two largest teaching hospitals in Ghana (i.e. Komfo Anokye Hospital and Korle-Bu Teaching Hospital) and these institutions recruit a sizeable chunk of health care professionals in the country.
state_of_the_nations_interior_new.indd 82state_of_the_nations_interior_new.indd 82 05/02/19 11.0605/02/19 11.06

Human resources for health 83
307 105 43 75 154 47 28 15 42 61 160 45 34 64 204 45 15 11 41 47
Perc
enta
ge
Region
0
50
100
150
200
250
300
350
Pharmacy TechniciansPharmacists
WRVRUWRUERNRGARERCRBARASR
Figure 38: Distribution of Pharmacists and Pharmacy Technicians by Region, 2015
4.4 Trends in Distribution of Human Resources for Health in Ghana, 2012-2015
The distribution of human resources for health (HRH) in Ghana appears to follow a similar pattern. Trend analysis of IPPD data shows that the number of health workers in the country has increased rapidly over the last four years from 56,283 in 2011 to 94,696 in 2015. Figure 39 shows the trend of HRH distribution from 2012 to 2015 by region.
17154 8347 8235 9038 18950 8821 5094 3593 7904 7560 15263 7134 7238 8355 17449 7823 4237 2734 7184 6591 14383 7200 6882 7778 16114 6646 4014 2649 6537 6291 11152 5516 5492 6447 13665 5071 2924 2136 5631 4866
Num
ber o
f Wor
kfor
ce
Region
0
5000
10000
15000
20000
2015201420132012
WRVRUWRUERNRGARERCRBARASR
Figure 39: Distribution of Health Workforce in Ghana by Region, 2012-2015
state_of_the_nations_interior_new.indd 83state_of_the_nations_interior_new.indd 83 05/02/19 11.0605/02/19 11.06
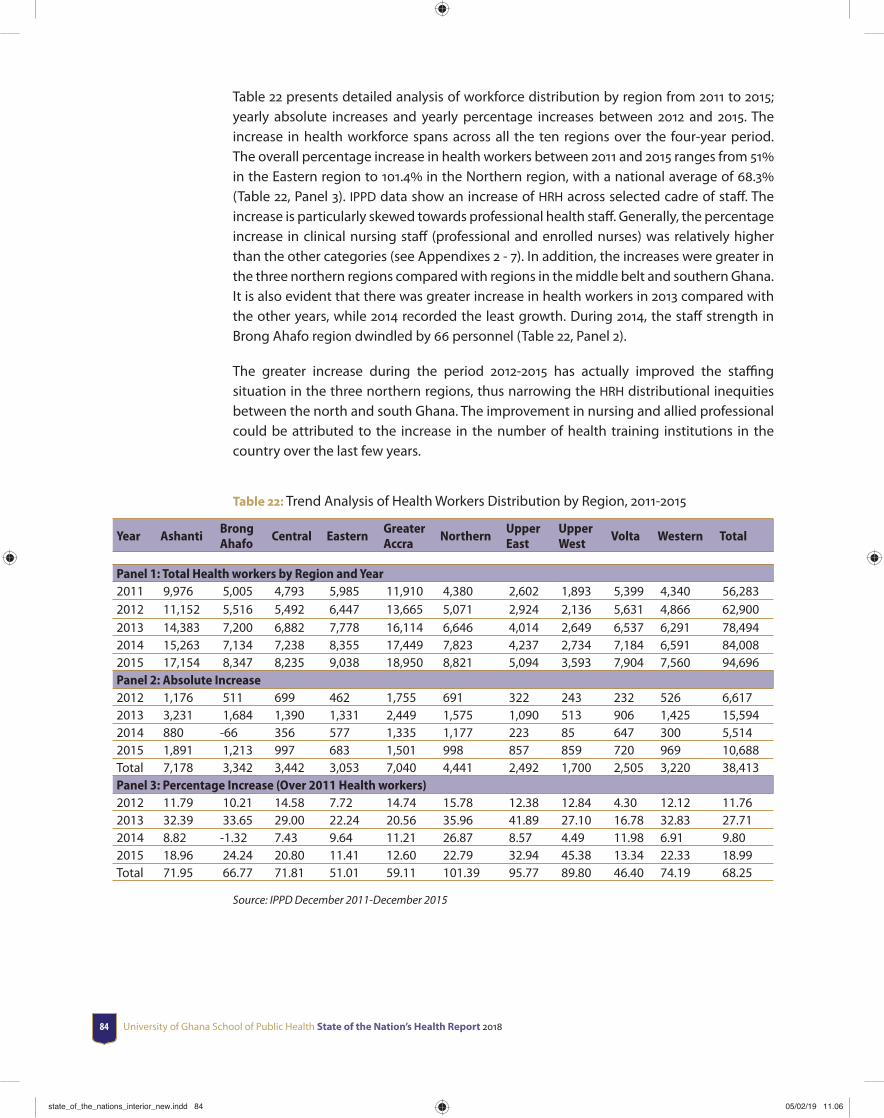
University of Ghana School of Public Health State of the Nation’s Health Report 201884
Table 22 presents detailed analysis of workforce distribution by region from 2011 to 2015; yearly absolute increases and yearly percentage increases between 2012 and 2015. The increase in health workforce spans across all the ten regions over the four-year period. The overall percentage increase in health workers between 2011 and 2015 ranges from 51 in the Eastern region to 101.4 in the Northern region, with a national average of 68.3 (Table 22, Panel 3). IPPD data show an increase of HRH across selected cadre of staff . The increase is particularly skewed towards professional health staff . Generally, the percentage increase in clinical nursing staff (professional and enrolled nurses) was relatively higher than the other categories (see Appendixes 2 - 7). In addition, the increases were greater in the three northern regions compared with regions in the middle belt and southern Ghana. It is also evident that there was greater increase in health workers in 2013 compared with the other years, while 2014 recorded the least growth. During 2014, the staff strength in Brong Ahafo region dwindled by 66 personnel (Table 22, Panel 2).
The greater increase during the period 2012-2015 has actually improved the staffi ng situation in the three northern regions, thus narrowing the HRH distributional inequities between the north and south Ghana. The improvement in nursing and allied professional could be attributed to the increase in the number of health training institutions in the country over the last few years.
Table 22: Trend Analysis of Health Workers Distribution by Region, 2011-2015
Year AshantiBrong Ahafo
Central EasternGreater Accra
NorthernUpper East
Upper West
Volta Western Total
Panel 1: Total Health workers by Region and Year2011 9,976 5,005 4,793 5,985 11,910 4,380 2,602 1,893 5,399 4,340 56,2832012 11,152 5,516 5,492 6,447 13,665 5,071 2,924 2,136 5,631 4,866 62,9002013 14,383 7,200 6,882 7,778 16,114 6,646 4,014 2,649 6,537 6,291 78,4942014 15,263 7,134 7,238 8,355 17,449 7,823 4,237 2,734 7,184 6,591 84,0082015 17,154 8,347 8,235 9,038 18,950 8,821 5,094 3,593 7,904 7,560 94,696Panel 2: Absolute Increase2012 1,176 511 699 462 1,755 691 322 243 232 526 6,6172013 3,231 1,684 1,390 1,331 2,449 1,575 1,090 513 906 1,425 15,5942014 880 -66 356 577 1,335 1,177 223 85 647 300 5,5142015 1,891 1,213 997 683 1,501 998 857 859 720 969 10,688Total 7,178 3,342 3,442 3,053 7,040 4,441 2,492 1,700 2,505 3,220 38,413Panel 3: Percentage Increase (Over 2011 Health workers)2012 11.79 10.21 14.58 7.72 14.74 15.78 12.38 12.84 4.30 12.12 11.762013 32.39 33.65 29.00 22.24 20.56 35.96 41.89 27.10 16.78 32.83 27.712014 8.82 -1.32 7.43 9.64 11.21 26.87 8.57 4.49 11.98 6.91 9.802015 18.96 24.24 20.80 11.41 12.60 22.79 32.94 45.38 13.34 22.33 18.99Total 71.95 66.77 71.81 51.01 59.11 101.39 95.77 89.80 46.40 74.19 68.25
Source: IPPD December 2011-December 2015
state_of_the_nations_interior_new.indd 84state_of_the_nations_interior_new.indd 84 05/02/19 11.0605/02/19 11.06
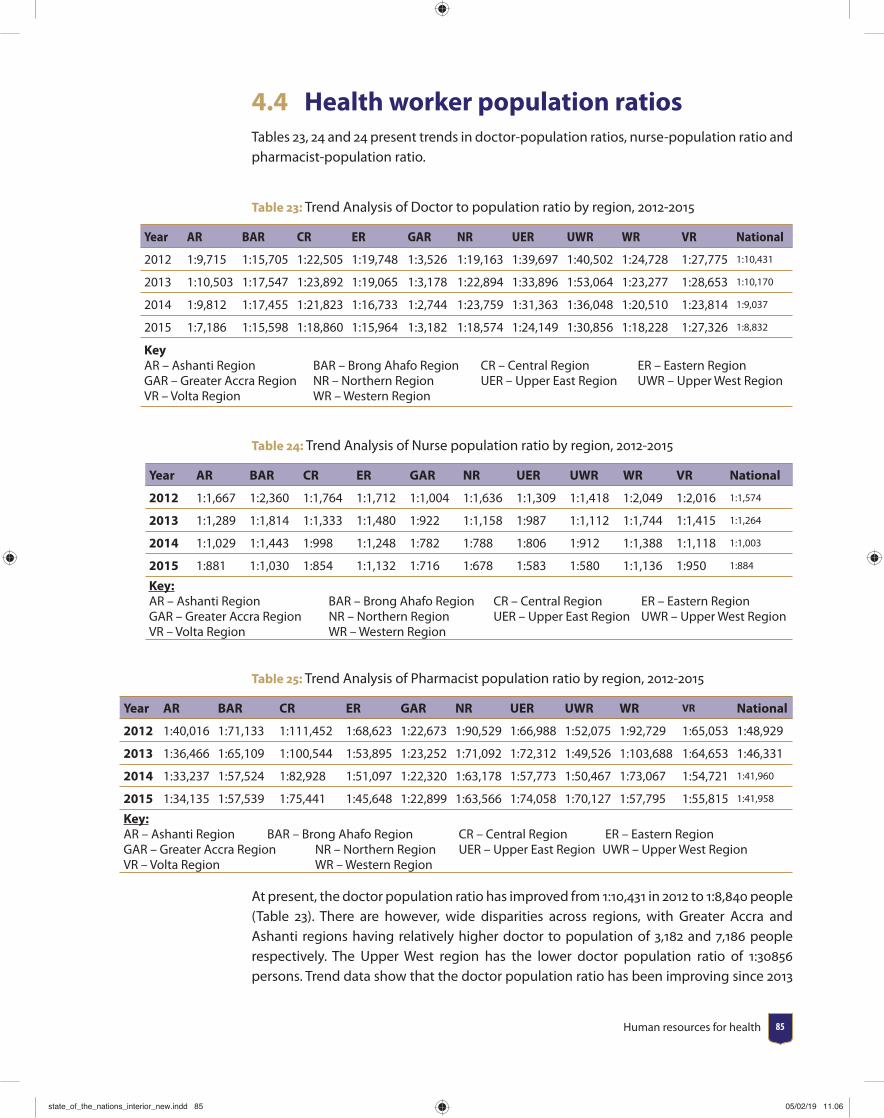
Human resources for health 85
4.4 Health worker population ratiosTables 23, 24 and 24 present trends in doctor-population ratios, nurse-population ratio and pharmacist-population ratio.
Table 23: Trend Analysis of Doctor to population ratio by region, 2012-2015
Year AR BAR CR ER GAR NR UER UWR WR VR National
2012 1:9,715 1:15,705 1:22,505 1:19,748 1:3,526 1:19,163 1:39,697 1:40,502 1:24,728 1:27,775 1:10,431
2013 1:10,503 1:17,547 1:23,892 1:19,065 1:3,178 1:22,894 1:33,896 1:53,064 1:23,277 1:28,653 1:10,170
2014 1:9,812 1:17,455 1:21,823 1:16,733 1:2,744 1:23,759 1:31,363 1:36,048 1:20,510 1:23,814 1:9,037
2015 1:7,186 1:15,598 1:18,860 1:15,964 1:3,182 1:18,574 1:24,149 1:30,856 1:18,228 1:27,326 1:8,832
KeyAR – Ashanti Region BAR – Brong Ahafo Region CR – Central Region ER – Eastern RegionGAR – Greater Accra Region NR – Northern Region UER – Upper East Region UWR – Upper West RegionVR – Volta Region WR – Western Region
Table 24: Trend Analysis of Nurse population ratio by region, 2012-2015
Year AR BAR CR ER GAR NR UER UWR WR VR National
2012 1:1,667 1:2,360 1:1,764 1:1,712 1:1,004 1:1,636 1:1,309 1:1,418 1:2,049 1:2,016 1:1,574
2013 1:1,289 1:1,814 1:1,333 1:1,480 1:922 1:1,158 1:987 1:1,112 1:1,744 1:1,415 1:1,264
2014 1:1,029 1:1,443 1:998 1:1,248 1:782 1:788 1:806 1:912 1:1,388 1:1,118 1:1,003
2015 1:881 1:1,030 1:854 1:1,132 1:716 1:678 1:583 1:580 1:1,136 1:950 1:884
Key:AR – Ashanti Region BAR – Brong Ahafo Region CR – Central Region ER – Eastern RegionGAR – Greater Accra Region NR – Northern Region UER – Upper East Region UWR – Upper West RegionVR – Volta Region WR – Western Region
Table 25: Trend Analysis of Pharmacist population ratio by region, 2012-2015
Year AR BAR CR ER GAR NR UER UWR WR VR National
2012 1:40,016 1:71,133 1:111,452 1:68,623 1:22,673 1:90,529 1:66,988 1:52,075 1:92,729 1:65,053 1:48,929
2013 1:36,466 1:65,109 1:100,544 1:53,895 1:23,252 1:71,092 1:72,312 1:49,526 1:103,688 1:64,653 1:46,331
2014 1:33,237 1:57,524 1:82,928 1:51,097 1:22,320 1:63,178 1:57,773 1:50,467 1:73,067 1:54,721 1:41,960
2015 1:34,135 1:57,539 1:75,441 1:45,648 1:22,899 1:63,566 1:74,058 1:70,127 1:57,795 1:55,815 1:41,958
Key:AR – Ashanti Region BAR – Brong Ahafo Region CR – Central Region ER – Eastern RegionGAR – Greater Accra Region NR – Northern Region UER – Upper East Region UWR – Upper West RegionVR – Volta Region WR – Western Region
At present, the doctor population ratio has improved from 1:10,431 in 2012 to 1:8,840 people (Table 23). There are however, wide disparities across regions, with Greater Accra and Ashanti regions having relatively higher doctor to population of 3,182 and 7,186 people respectively. The Upper West region has the lower doctor population ratio of 1:30856 persons. Trend data show that the doctor population ratio has been improving since 2013
state_of_the_nations_interior_new.indd 85state_of_the_nations_interior_new.indd 85 05/02/19 11.0605/02/19 11.06
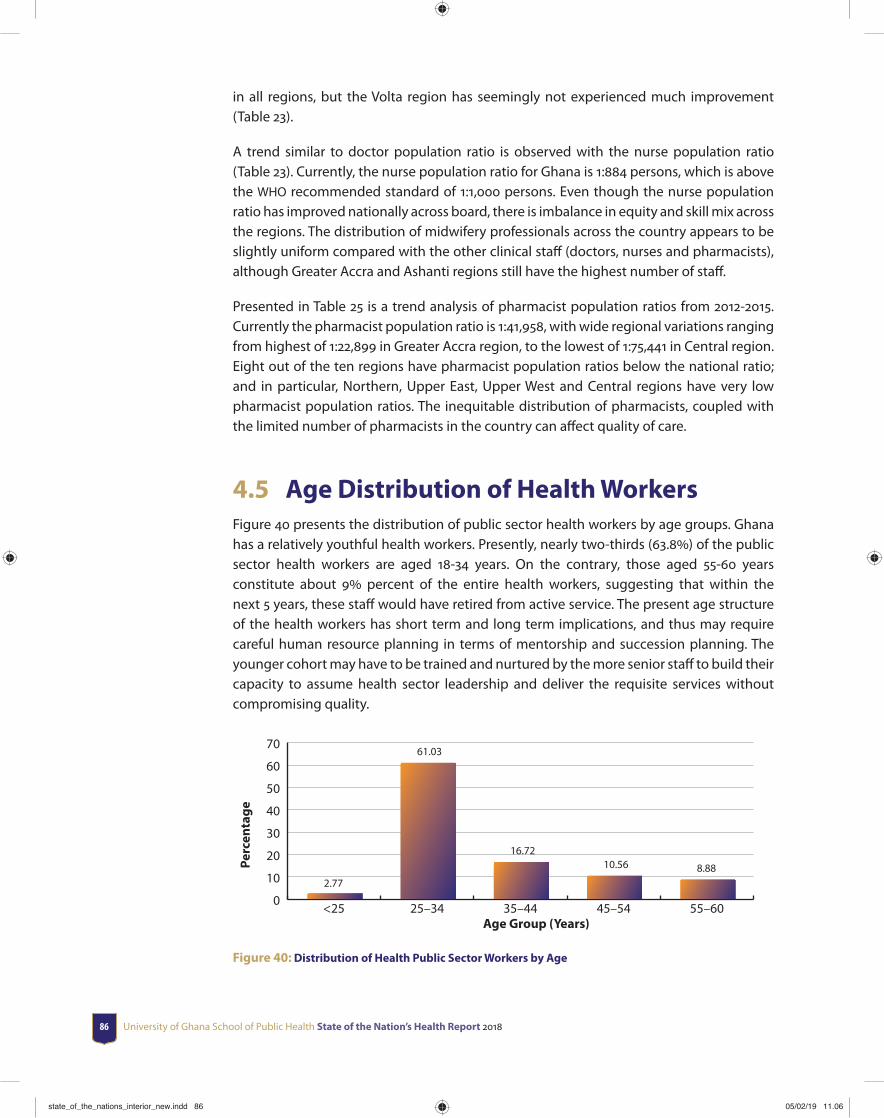
University of Ghana School of Public Health State of the Nation’s Health Report 201886
in all regions, but the Volta region has seemingly not experienced much improvement (Table 23).
A trend similar to doctor population ratio is observed with the nurse population ratio (Table 23). Currently, the nurse population ratio for Ghana is 1:884 persons, which is above the WHO recommended standard of 1:1,000 persons. Even though the nurse population ratio has improved nationally across board, there is imbalance in equity and skill mix across the regions. The distribution of midwifery professionals across the country appears to be slightly uniform compared with the other clinical staff (doctors, nurses and pharmacists), although Greater Accra and Ashanti regions still have the highest number of staff .
Presented in Table 25 is a trend analysis of pharmacist population ratios from 2012-2015. Currently the pharmacist population ratio is 1:41,958, with wide regional variations ranging from highest of 1:22,899 in Greater Accra region, to the lowest of 1:75,441 in Central region. Eight out of the ten regions have pharmacist population ratios below the national ratio; and in particular, Northern, Upper East, Upper West and Central regions have very low pharmacist population ratios. The inequitable distribution of pharmacists, coupled with the limited number of pharmacists in the country can aff ect quality of care.
4.5 Age Distribution of Health WorkersFigure 40 presents the distribution of public sector health workers by age groups. Ghana has a relatively youthful health workers. Presently, nearly two-thirds (63.8) of the public sector health workers are aged 18-34 years. On the contrary, those aged 55-60 years constitute about 9 percent of the entire health workers, suggesting that within the next 5 years, these staff would have retired from active service. The present age structure of the health workers has short term and long term implications, and thus may require careful human resource planning in terms of mentorship and succession planning. The younger cohort may have to be trained and nurtured by the more senior staff to build their capacity to assume health sector leadership and deliver the requisite services without compromising quality.
0
10
20
30
40
50
60
70
2.77
61.03
16.7210.56 8.88
55–6045–5435–4425–34<25Age Group (Years)
Perc
enta
ge
Figure 40: Distribution of Health Public Sector Workers by Age
state_of_the_nations_interior_new.indd 86state_of_the_nations_interior_new.indd 86 05/02/19 11.0605/02/19 11.06
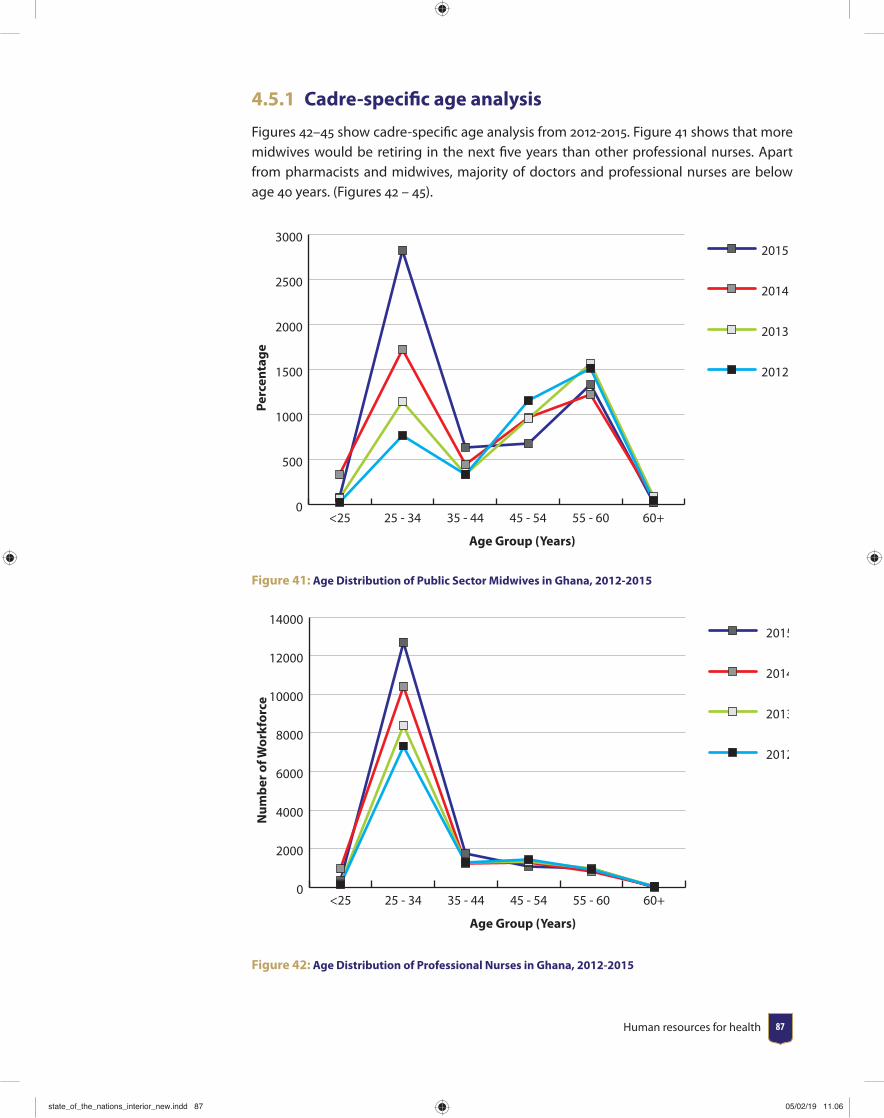
Human resources for health 87
4.5.1 Cadre-specifi c age analysis
Figures 42–45 show cadre-specifi c age analysis from 2012-2015. Figure 41 shows that more midwives would be retiring in the next fi ve years than other professional nurses. Apart from pharmacists and midwives, majority of doctors and professional nurses are below age 40 years. (Figures 42 – 45).
0
500
1000
1500
2000
2500
30002015
2014
2013
2012
60+55 - 6045 - 5435 - 4425 - 34<25
Age Group (Years)
Perc
enta
ge
Figure 41: Age Distribution of Public Sector Midwives in Ghana, 2012-2015
0
2000
4000
6000
8000
10000
12000
140002015
2014
2013
2012
60+55 - 6045 - 5435 - 4425 - 34<25
Age Group (Years)
Num
ber o
f Wor
kfor
ce
Figure 42: Age Distribution of Professional Nurses in Ghana, 2012-2015
state_of_the_nations_interior_new.indd 87state_of_the_nations_interior_new.indd 87 05/02/19 11.0605/02/19 11.06
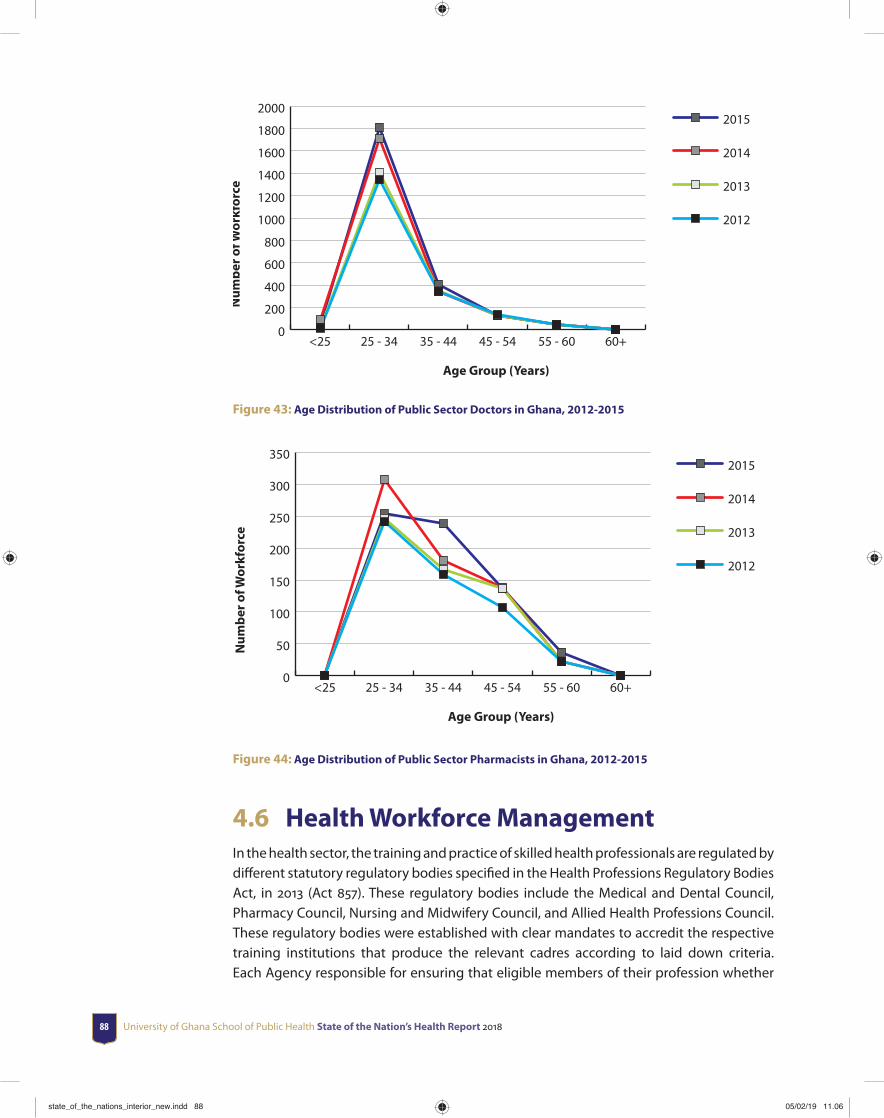
University of Ghana School of Public Health State of the Nation’s Health Report 201888
Age Group (Years)
Num
ber o
f Wor
kfor
ce
0
200
400
600
800
1000
1200
1400
1600
1800
20002015
2014
2013
2012
60+55 - 6045 - 5435 - 4425 - 34<25
Figure 43: Age Distribution of Public Sector Doctors in Ghana, 2012-2015
Age Group (Years)
Num
ber o
f Wor
kfor
ce
0
50
100
150
200
250
300
3502015
2014
2013
2012
60+55 - 6045 - 5435 - 4425 - 34<25
Figure 44: Age Distribution of Public Sector Pharmacists in Ghana, 2012-2015
4.6 Health Workforce ManagementIn the health sector, the training and practice of skilled health professionals are regulated by diff erent statutory regulatory bodies specifi ed in the Health Professions Regulatory Bodies Act, in 2013 (Act 857). These regulatory bodies include the Medical and Dental Council, Pharmacy Council, Nursing and Midwifery Council, and Allied Health Professions Council. These regulatory bodies were established with clear mandates to accredit the respective training institutions that produce the relevant cadres according to laid down criteria. Each Agency responsible for ensuring that eligible members of their profession whether
state_of_the_nations_interior_new.indd 88state_of_the_nations_interior_new.indd 88 05/02/19 11.0605/02/19 11.06
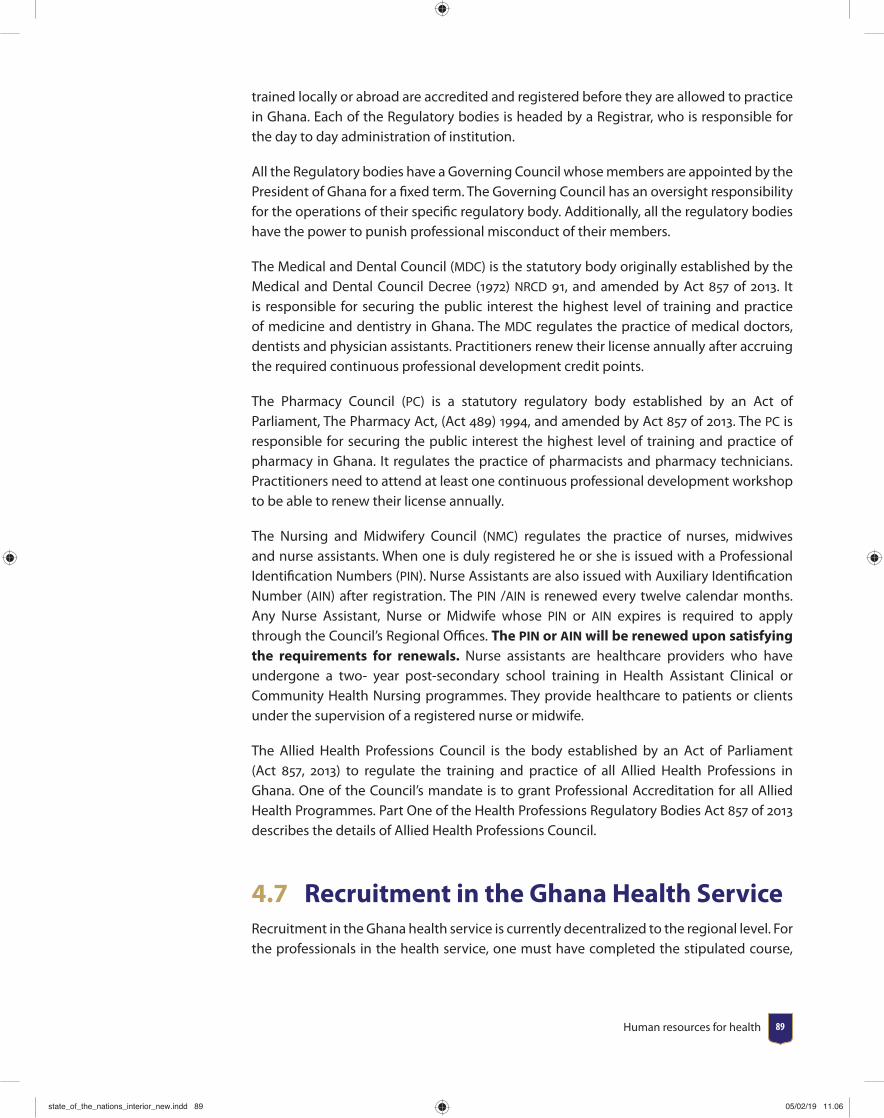
Human resources for health 89
trained locally or abroad are accredited and registered before they are allowed to practice in Ghana. Each of the Regulatory bodies is headed by a Registrar, who is responsible for the day to day administration of institution.
All the Regulatory bodies have a Governing Council whose members are appointed by the President of Ghana for a fi xed term. The Governing Council has an oversight responsibility for the operations of their specifi c regulatory body. Additionally, all the regulatory bodies have the power to punish professional misconduct of their members.
The Medical and Dental Council (MDC) is the statutory body originally established by the Medical and Dental Council Decree (1972) NRCD 91, and amended by Act 857 of 2013. It is responsible for securing the public interest the highest level of training and practice of medicine and dentistry in Ghana. The MDC regulates the practice of medical doctors, dentists and physician assistants. Practitioners renew their license annually after accruing the required continuous professional development credit points.
The Pharmacy Council (PC) is a statutory regulatory body established by an Act of Parliament, The Pharmacy Act, (Act 489) 1994, and amended by Act 857 of 2013. The PC is responsible for securing the public interest the highest level of training and practice of pharmacy in Ghana. It regulates the practice of pharmacists and pharmacy technicians. Practitioners need to attend at least one continuous professional development workshop to be able to renew their license annually.
The Nursing and Midwifery Council (NMC) regulates the practice of nurses, midwives and nurse assistants. When one is duly registered he or she is issued with a Professional Identifi cation Numbers (PIN). Nurse Assistants are also issued with Auxiliary Identifi cation Number (AIN) after registration. The PIN /AIN is renewed every twelve calendar months. Any Nurse Assistant, Nurse or Midwife whose PIN or AIN expires is required to apply through the Council’s Regional Offi ces. The PIN or AIN will be renewed upon satisfying the requirements for renewals. Nurse assistants are healthcare providers who have undergone a two- year post-secondary school training in Health Assistant Clinical or Community Health Nursing programmes. They provide healthcare to patients or clients under the supervision of a registered nurse or midwife.
The Allied Health Professions Council is the body established by an Act of Parliament (Act 857, 2013) to regulate the training and practice of all Allied Health Professions in Ghana. One of the Council’s mandate is to grant Professional Accreditation for all Allied Health Programmes. Part One of the Health Professions Regulatory Bodies Act 857 of 2013 describes the details of Allied Health Professions Council.
4.7 Recruitment in the Ghana Health ServiceRecruitment in the Ghana health service is currently decentralized to the regional level. For the professionals in the health service, one must have completed the stipulated course,
state_of_the_nations_interior_new.indd 89state_of_the_nations_interior_new.indd 89 05/02/19 11.0605/02/19 11.06
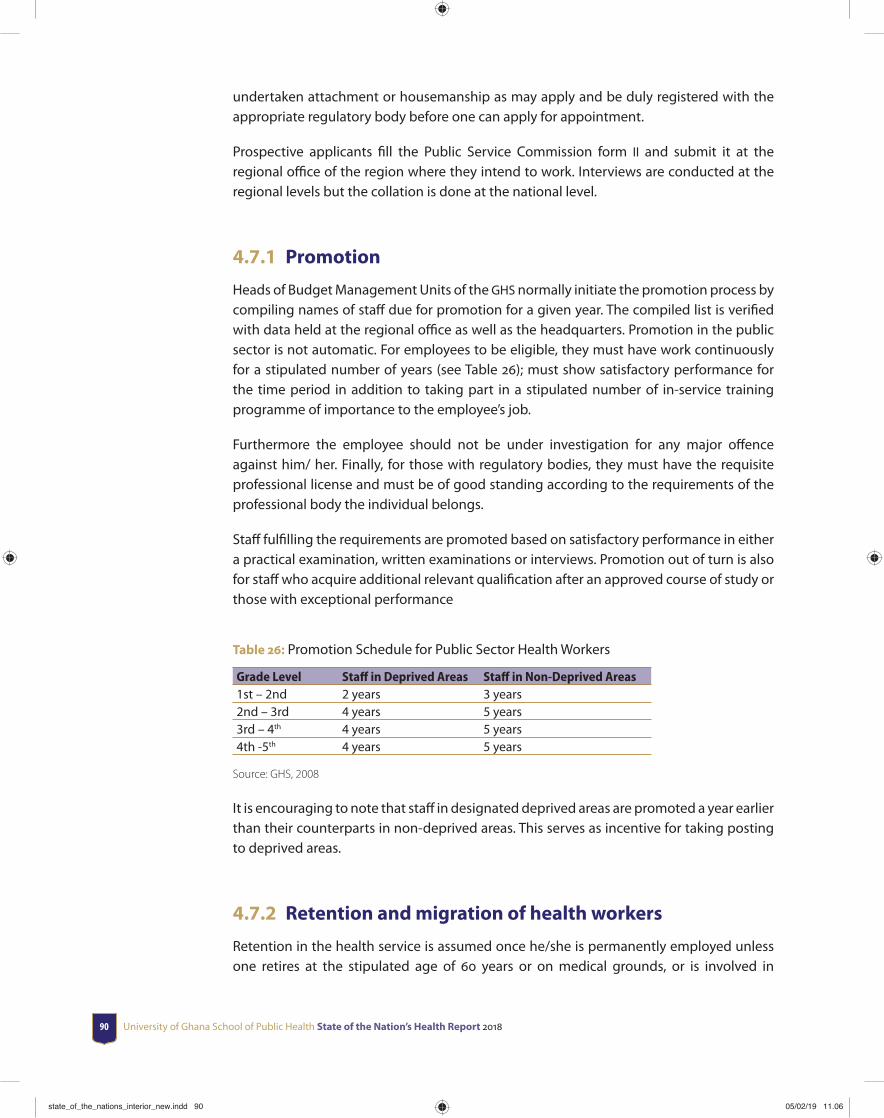
University of Ghana School of Public Health State of the Nation’s Health Report 201890
undertaken attachment or housemanship as may apply and be duly registered with the appropriate regulatory body before one can apply for appointment.
Prospective applicants fi ll the Public Service Commission form II and submit it at the regional offi ce of the region where they intend to work. Interviews are conducted at the regional levels but the collation is done at the national level.
4.7.1 Promotion
Heads of Budget Management Units of the GHS normally initiate the promotion process by compiling names of staff due for promotion for a given year. The compiled list is verifi ed with data held at the regional offi ce as well as the headquarters. Promotion in the public sector is not automatic. For employees to be eligible, they must have work continuously for a stipulated number of years (see Table 26); must show satisfactory performance for the time period in addition to taking part in a stipulated number of in-service training programme of importance to the employee’s job.
Furthermore the employee should not be under investigation for any major off ence against him/ her. Finally, for those with regulatory bodies, they must have the requisite professional license and must be of good standing according to the requirements of the professional body the individual belongs.
Staff fulfi lling the requirements are promoted based on satisfactory performance in either a practical examination, written examinations or interviews. Promotion out of turn is also for staff who acquire additional relevant qualifi cation after an approved course of study or those with exceptional performance
Table 26: Promotion Schedule for Public Sector Health Workers
Grade Level Staff in Deprived Areas Staff in Non-Deprived Areas1st – 2nd 2 years 3 years2nd – 3rd 4 years 5 years3rd – 4th 4 years 5 years4th -5th 4 years 5 years
Source: GHS, 2008
It is encouraging to note that staff in designated deprived areas are promoted a year earlier than their counterparts in non-deprived areas. This serves as incentive for taking posting to deprived areas.
4.7.2 Retention and migration of health workers
Retention in the health service is assumed once he/she is permanently employed unless one retires at the stipulated age of 60 years or on medical grounds, or is involved in
state_of_the_nations_interior_new.indd 90state_of_the_nations_interior_new.indd 90 05/02/19 11.0605/02/19 11.06
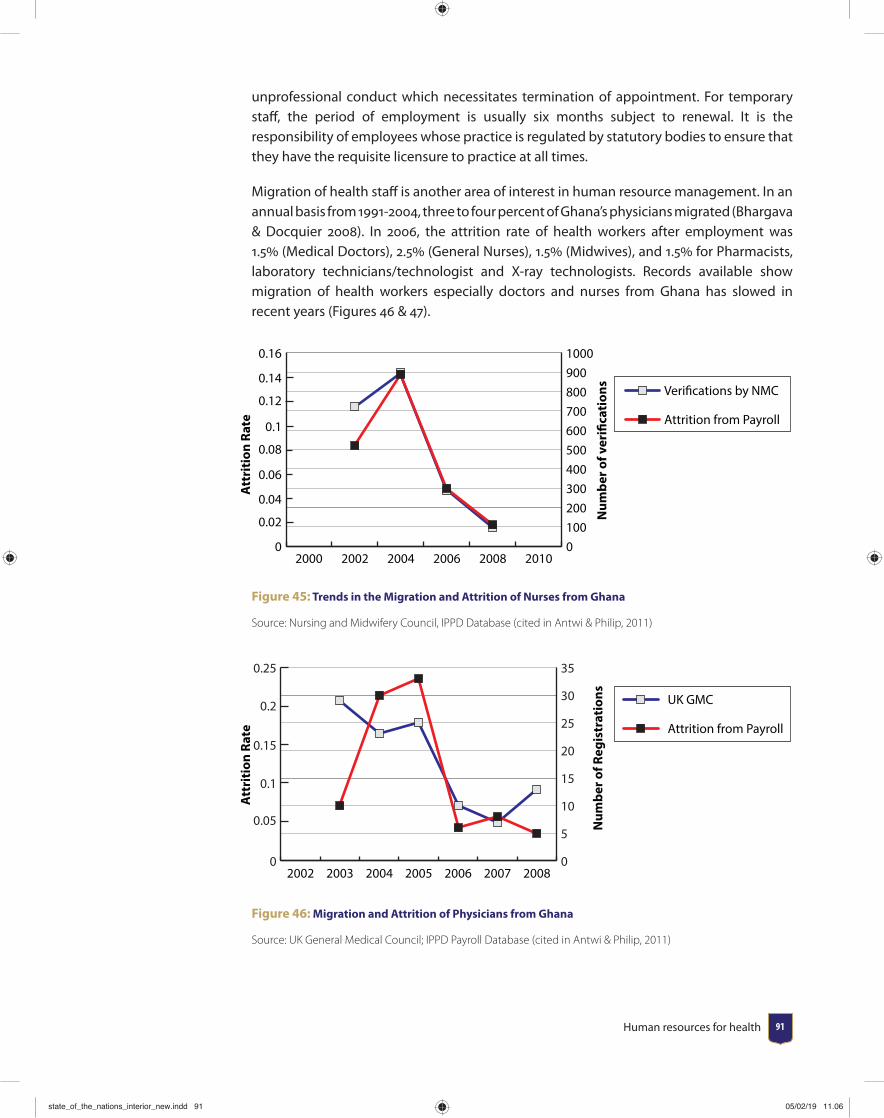
Human resources for health 91
unprofessional conduct which necessitates termination of appointment. For temporary staff , the period of employment is usually six months subject to renewal. It is the responsibility of employees whose practice is regulated by statutory bodies to ensure that they have the requisite licensure to practice at all times.
Migration of health staff is another area of interest in human resource management. In an annual basis from 1991-2004, three to four percent of Ghana’s physicians migrated (Bhargava & Docquier 2008). In 2006, the attrition rate of health workers after employment was 1.5 (Medical Doctors), 2.5 (General Nurses), 1.5 (Midwives), and 1.5 for Pharmacists, laboratory technicians/technologist and X-ray technologists. Records available show migration of health workers especially doctors and nurses from Ghana has slowed in recent years (Figures 46 & 47).
0
0.02
0.04
0.06
0.08
0.1
0.12
0.14
0.16
01002003004005006007008009001000
201020082006200420022000
Verifications by NMC
Attrition from Payroll
Att
riti
on R
ate
Num
ber o
f ver
ifica
tion
sFigure 45: Trends in the Migration and Attrition of Nurses from Ghana
Source: Nursing and Midwifery Council, IPPD Database (cited in Antwi & Philip, 2011)
Att
riti
on R
ate
Num
ber o
f Reg
istr
atio
ns
0
0.05
0.1
0.15
0.2
0.25
0
5
10
15
20
25
30
35
2008200720062005200420032002
UK GMC
Attrition from Payroll
Figure 46: Migration and Attrition of Physicians from Ghana
Source: UK General Medical Council; IPPD Payroll Database (cited in Antwi & Philip, 2011)
state_of_the_nations_interior_new.indd 91state_of_the_nations_interior_new.indd 91 05/02/19 11.0605/02/19 11.06
University of Ghana School of Public Health State of the Nation’s Health Report 201892
4.7.3 Performance of Health Workers
Performance of the health workers is done mainly through the appraisal system. At the beginning of the year, individual workers set their own objectives for the year with the aid of their supervisors. The objectives are reviewed at midway of the year to see whether they are on course and at the end of the year to ascertain whether they have been achieved.
4.7.4 Compensations / remuneration/Retirement
This is determined by the single spine salary structure. An annual award scheme has also been instituted to award hard working staff at facility, district, regional and national levels. Generally staff retire at the compulsory retirement age of 60 years as applied to other government employees.
4.7.5 Posting and transfers
Posting in the public sectors is not without challenges as majority of staff prefer working in the well-endowed urban centers to the detriment of deprived rural areas. It is not clear what criteria is used to determine who gets posted to a deprived area and who goes to the well-endowed areas. For those who take up posting to deprived areas have challenges securing transfer from such places. As a result, posting to deprived areas is seen as a punishment and many do not take their postings.
Currently, posting are based on the staffi ng norms which stipulates vacancies available at a particular region or district. Laudable as this may be in ensuring equitable distribution of health professionals, it still does not solve the problem of staff who want to go on transfer especially if they are serving in deprived areas. The reason being that, it becomes their responsibility to look for a region that has the vacancy and is willing to take the said offi cer on board.
4.7.6 Staffi ng Norms
The quality of service delivered by the health sector among other things is largely determined by the number and mix of health workers of a particular cadre required to cope with the workload. Staffi ng norms help various health institutions to align their workforce to their workload. Since it establishes the minimum and maximum number of the various categories of health workforce, it prevents both under and over staffi ng.
Hitherto the distribution of health staff had been based on population and an outmoded staff norms developed by the Ministry of Health (MoH). At present, the MoH and its agencies since 2011, have been working tirelessly to develop a more empirical and evidence-based Staffi ng Norms based on the WHO’s Workload Indicator of Staffi ng Needs (WISN). This revision was necessitated by the limitations of both the 1992 Facility Staffi ng Norms and
state_of_the_nations_interior_new.indd 92state_of_the_nations_interior_new.indd 92 05/02/19 11.0605/02/19 11.06
Human resources for health 93
the WHO Population Ratio Staffi ng Norms, which do not consider local variations and workload characteristics among others (GHS, 2015). At present, new Staffi ng Norm has been developed to cover most clinical and some non-clinical (support) staff in Health Centers, District Hospitals, Regional Hospitals, and Teaching Hospitals. Work is ongoing and the expectation is that all cadre of health workers and facilities will be covered. It is therefore incumbent on human resource managers of the various health facilities to consult the technical manual of the country on staffi ng norms to know their staffi ng needs.
4.8 Issues of malpractices and how it has been addressed within the sector
Malpractice and disciplinary issues are handled according to codes of conduct of the Ghana Health Service and the professional regulatory bodies.
Some argue that in Ghana low performance, especially in the public health sector, is not necessarily related to inadequate number of staff , but negative attitude to work. These include absenteeism, shirking (malingering) and moonlighting/dual practice.
Absenteeism has been found to be a persistent behaviour among health workers in Ghana. Users often report that doctors do not always honour appointments, or that doctors report late for duties. Doctors on morning shift normally start work at 8 am but in the urban areas in Ghana they sometimes arrive as late as 1.00pm, just before the afternoon shift. Absenteeism among public sector doctors and nurses is mostly linked to locum work in the private sector, mainly available in the urban areas. Most commonly, locum work will be done before or after public sector working hours. However, it is frequent that the locum work starts at the same time when the public shift ends; or that the time between the end of public service and the start of locum work is too short for the health worker to move from the public to the private facility. In those cases, health workers will mostly be absent from their public job, since lateness is not tolerated and sanctioned in the private sector. Health workers at well-staff ed public services may ‘cover each other up’, so that each in turn can take up locums that partially overlap with working hours. Alternatively, auxiliary or junior nurses will have to take over work (‘the donkey worker’) while the professional nurses are doing locum work.
Health worker behaviour is said to be shirking22 when they talk or chat away, which is most frequent, or are on phone or sleep during working hours; or show their face at the service and then disappear. Users are often upset with health workers serving them slowly, because they were talking with colleagues or friends, or talking too long on the phone. However, some health workers on the other hand argue that the workload does not even allow them to have lunch or other legitimate breaks. Moonlighting refers to health workers having or engaging in another professional activity, alongside their main job as a health worker. Moonlighting is very frequent among health workers in Ghana. Normally this is
22 Shirking: refers to a situation where a worker avoids working hard while at work.
state_of_the_nations_interior_new.indd 93state_of_the_nations_interior_new.indd 93 05/02/19 11.0605/02/19 11.06
University of Ghana School of Public Health State of the Nation’s Health Report 201894
done after working hours, because doing it during working hours is ‘illegal’. Moonlighting is most common in urban areas.
The range of professional activities and sectors in which health workers have a second job is vast and includes farming, owning and supervision of drug shops, owning and supervision of consumer goods shops, baking and selling of bread. Health professional with higher education such as doctors, pharmacists and nurses tend to be more involved in locum work than those lower education such as auxiliary nurses.
Health workers as well as users invariably report that moonlighting is practiced because of fi nancial reasons. Doctors report that income from moonlighting complements their salary; nurses point out that their base salary is not suffi cient and therefore have to engage in second jobs.
There are however, a number of diffi culties associated with locum work. Most health workers point out that the combination of two jobs is exhausting, leading to decreasing effi ciency and bad attitudes towards patients. For these reasons, some health workers scale down their primary public employment, to remain fi t for the secondary professional private activity.
4.9 SummaryThe analyses presented in this report indicate that there are marked imbalance in skills–mix and distribution of health workers in the country. This does not ensure quality health care for all. Thus moving forward, the Ministry of Health and the Ghana Health Service need to:
• Devise a distributional mechanism to ensure that health workers are fairly distributed across all the regions. The available staffi ng norms should be applied.
• Conduct a gap analysis to determine the actual HRH requirements for each region as well as per facility.
• Increase production of key professionals to ensure appropriate skill-mix for effi cient service delivery.
• Measures must also be taken to minimize the incidence of absenteeism, malingering and moonlighting, especially in the urban areas.
state_of_the_nations_interior_new.indd 94state_of_the_nations_interior_new.indd 94 05/02/19 11.0605/02/19 11.06
Health commodities and technology 9595
CHAPTER 5Health commodities and technology
5.1 IntroductionMedical products and devices, vaccines, infrastructure and equipment are some of the key drivers of an effi cient healthcare delivery of any country including Ghana. Hence, availability of quality medical products and devices, vaccines with the needed health infrastructure, and equipment should be the focus of any country seeking the health of its citizens.
This chapter will therefore give an overview of the quality and availability of medical products and devices, vaccines, infrastructure and equipment in Ghana from the year 2000 to 2014 with particular emphasis on how it aff ects the management of the top ten (10) communicable and top fi ve (5) non-communicable diseases in Ghana. The overview will be stratifi ed by public and private health facilities.
Subsequently, the content of this report will serve as policy guideline for improvement in the quality and availability of medical products, vaccines, health infrastructure and equipment in combating the top ten (10) communicable and top fi ve (5) non-communicable diseases in Ghana.
state_of_the_nations_interior_new.indd 95state_of_the_nations_interior_new.indd 95 05/02/19 11.0605/02/19 11.06
University of Ghana School of Public Health State of the Nation’s Health Report 201896
5.2 Availability of Quality Medical Products and Devices
The availability of quality and safe medical products and devices and vaccines in Ghana requires an eff ective procurement system for such products. However, eff ective procurement of medical products and devices can only be realized if an approved national list and technical specifi cations of medical products and devices are available. Although, there has being a recommendation for a national list of approved medical products and devices for procurement or reimbursement since 2010, this recommendation has still not been realized as at 2013. Fortunately, technical specifi cations of medical products and devices to support procurement or donations was developed in 2010. More importantly, diff erent healthcare facilities in Ghana have national standards or recommended lists of medical products and devices for eff ective healthcare delivery since 2010. In Ghana, there have also been units within the Ministry of Health responsible for the implementation of health technology policy since 2010.
Availability of quality generic medicines in Ghana is also relevant for eff ective healthcare management. As a step towards regulating the use of medicine for various purposes, the WHO established the fi rst Model List of Essential Medicines in 1977 to assist countries in formulating their own essential list of medicines. The Ghana National Drug Programme, as part of its mandate regularly develops and distributes an Essential Medicines Lists and Standard Treatment Guidelines to all public health institutions. The 6th Edition of the Ghana Standard Treatment Guidelines (STG) and Essential Medicines List (EML) of Ghana was launched in 2010. This list serves as a guide for the procurement and use of medicines in Ghana. Records available show that the median percentage availability of selected generic medicines in a sample of private health facilities increased from 18 (2001-2008) to 44.6 (2001-2009). On the contrary, the median percentage availability of selected generic medicines in a sample of public health facilities decreased from 45 (2001-2008) to 17.9 (2001-2009). The consumer price of generic medicines is critical for achieving quality but aff ordable healthcare in Ghana. The consumer price ratio23 is the mean unit price of selected generics compared to median unit of international references prices of the same product. The median consumer price ratio of selected generic medicines in selected private health facilities increased from 2.4 (2001-2008) to 3.8 (2001-2009). However, that of the public health facilities decreased from 3.8 (2001-2008) to 2.4 (2001-2009).
Monitoring access to medicines is linked to the governance and service delivery components of the health system. Essential medicines are intended to be available in adequate amounts and quality at the facility. A snapshot of access to medicines can be generated using indicators that provide information on availability of medicines. The World Health Organization and Health Action International developed a standardized methodology for facility based surveys on medicines availability, prices and aff ordability. The tracer medicines include availability of 14 essential medicines in public and private sector facilities in use worldwide. There are also regional specifi c drugs (WHO, 2010)
23 Consumer price ratio: ratio between median unit prices and the median international reference prices for that same product for the year preceding the survey.
state_of_the_nations_interior_new.indd 96state_of_the_nations_interior_new.indd 96 05/02/19 11.0605/02/19 11.06
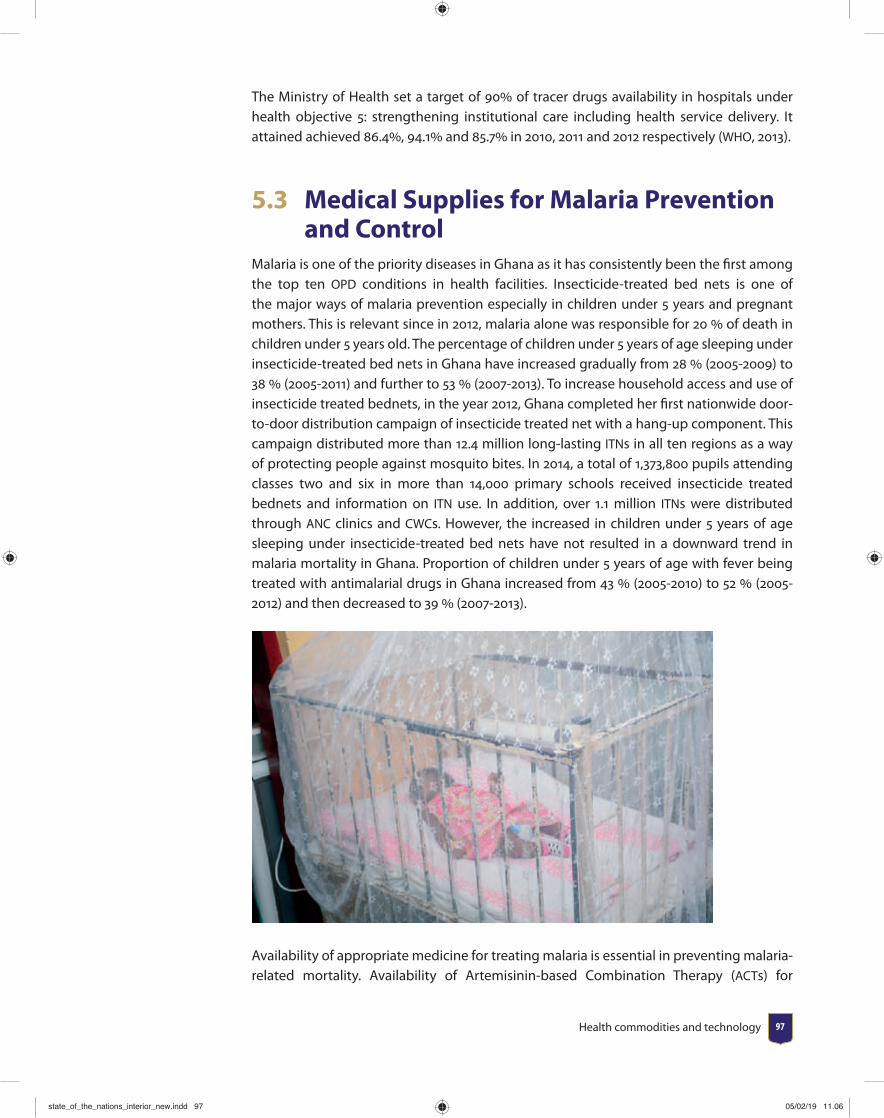
Health commodities and technology 97
The Ministry of Health set a target of 90 of tracer drugs availability in hospitals under health objective 5: strengthening institutional care including health service delivery. It attained achieved 86.4, 94.1 and 85.7 in 2010, 2011 and 2012 respectively (WHO, 2013).
5.3 Medical Supplies for Malaria Prevention and Control
Malaria is one of the priority diseases in Ghana as it has consistently been the fi rst among the top ten OPD conditions in health facilities. Insecticide-treated bed nets is one of the major ways of malaria prevention especially in children under 5 years and pregnant mothers. This is relevant since in 2012, malaria alone was responsible for 20 of death in children under 5 years old. The percentage of children under 5 years of age sleeping under insecticide-treated bed nets in Ghana have increased gradually from 28 (2005-2009) to 38 (2005-2011) and further to 53 (2007-2013). To increase household access and use of insecticide treated bednets, in the year 2012, Ghana completed her fi rst nationwide door-to-door distribution campaign of insecticide treated net with a hang-up component. This campaign distributed more than 12.4 million long-lasting ITNs in all ten regions as a way of protecting people against mosquito bites. In 2014, a total of 1,373,800 pupils attending classes two and six in more than 14,000 primary schools received insecticide treated bednets and information on ITN use. In addition, over 1.1 million ITNs were distributed through ANC clinics and CWCs. However, the increased in children under 5 years of age sleeping under insecticide-treated bed nets have not resulted in a downward trend in malaria mortality in Ghana. Proportion of children under 5 years of age with fever being treated with antimalarial drugs in Ghana increased from 43 (2005-2010) to 52 (2005-2012) and then decreased to 39 (2007-2013).
Availability of appropriate medicine for treating malaria is essential in preventing malaria-related mortality. Availability of Artemisinin-based Combination Therapy (ACTs) for
state_of_the_nations_interior_new.indd 97state_of_the_nations_interior_new.indd 97 05/02/19 11.0605/02/19 11.06

University of Ghana School of Public Health State of the Nation’s Health Report 201898
malaria in Ghana increased from 31 percent in 2009 to 83 percent in 2011. The availability of ACTs in public health facilities was 80.7 percent whilst that of private health sectors was 82.6 percent. The increase in availability was due to the introduction of the Aff ordable Medicines Facility for Malaria in Ghana by the Global Fund. This led to a reduction of ACTs from 5.0 to 0.5 for paediatric formulations and 7.0 to 0.75 for adult formulations. The increase in demand for antimalarial medications in Ghana also led to the infl ux of diff erent types such medications. In that light the Laboratory Services Department (LSD) of Food and Drugs Authority (FDA) in conjunction with other stakeholders such as National Malaria Control Program (NMCP) and United States Pharmacopoeia Convention (USP) have conducted yearly post market surveillance of the quality of antimalarial drug on the Ghanaian market from 2008 to 2013. In 2008, the Food and Drugs Authority of Ghana participated in QAMSA (Quality of Antimalarial Medicines in Sub-Saharan Africa) project, which was organized by the World Health Organization in collaboration with regulatory agencies of the participating countries. All the samples were analyzed using GPHF-Minilab techniques and full monograph protocols at the Research Institute for Industrial Pharmacy, incorporating CENQAM, North-West University, Potchefstroom, South Africa, which is a laboratory prequalifi ed by WHO and a WHO Collaborating Centre; however, samples of Sulfamethoxypyrazine/pyrimethamine (SPP) products were tested at the USP Laboratory, Rockville, USA. Ghana collected 175 samples, of which 99 were manufactured locally and the remaining 76 were imported. Out of the 99 locally manufactured samples 63 were not registered by the FDA. Eight percentage (8 ) of the sample failed the minilab testing. Fifty-six samples (32 ) were submitted for full monograph analysis; of which 27.3 of Artemisinin-based combination therapy (ACT) failed and 56.2 of Sulfadoxine/pyrimethamine (SP) also failed. The failure rates for registered and non-registered products were 52.2 and 20.0 respectively. Recommendations from the above survey have improved medicines regulation in Ghana. Subsequently, the National Malaria Control Programme in conjunction with the Food and Drugs Authority conducted another quality assessment of antimalarial drugs on the Ghana. Of note, full monograph analysis of 122 antimalarial medicines analyzed by the FDA indicated that 24 (31 products) failed quality assessment parameters and led to the withdrawer of several products from the market. The continued quality assessment of antimalarial medicines on the market by FDA and with support from USP-DQI program and the attended regulatory actions by the FDA from 2008-2013 have led to signifi cant availability of quality antimalarial medicines. This could probably be one of the reasons the mortality rate of malaria remained constant from 2010 to 2012. It would be interesting if the FDA could replicate the yearly quality assessment of antimalarial drugs on the market for other drugs used for the treatment and management of the other top 10 communicable and top 5 non-communicable diseases in Ghana. This has the potential of tremendously reducing the disease burden of Ghana and subsequently improving the health of the population. Oxytocin injection is normally used for uterus contraction to induce labor, strengthen labor contractions during childbirth, and control bleeding after childbirth.
state_of_the_nations_interior_new.indd 98state_of_the_nations_interior_new.indd 98 05/02/19 11.0605/02/19 11.06
Health commodities and technology 99
5.4 Procurement and Supply Chain Management for Medical Product and Devices
The public health sector in Ghana has a three-tiered system of managing health commodities. The Central Medical Stores (CMS), Regional Medical Stores (RMS) and the Service Delivery Points. The suppliers, CMS, RMS, SDP and the transportation system form the supply chain
In Ghana, the Public Procurement Law, Act 663 regulates the procurement of medical products and devices in the public health facilities. This is done through international competitive bidding (ICB) process and through local private suppliers. In order to qualify for ICB a manufacturer needs to fi rst technically pre-qualify its products with the WHO to ensure it meets international product regulatory standards as well as obtaining product registration with the Ghana Food and Drugs Authority (FDA). A national procurement assessment is done followed by tender announcements for international and national competitive bidding, followed by a process of public bid opening. The Central Medical Stores (CMS), at the national level procures locally and internationally all medical products and device relevant to the public health system. Then Regional Medical Store (RMS) also procures from the CMS and local manufacturers and wholesalers. The Public Procurement Authority (PPA) is the body mandated to oversee all public procurements in Ghana, including that of the public health system. Procurement is decentralized in most sectors of the country but each level has threshold of amount to procure at a given time. The CMS reports medical product and devices information to the Stores, Supplies and Drug Management (SSDM) Directorate through the Procurement Unit (PU) at GHS headquarters and Regional Health Administration (RHA) at regional level (Figure 47).
The Central Medical Stores procures medicines for the entire country based on aggregated commodity utilization from the regional medical stores and teaching hospitals. The regional medical stores also supply medical products and devices to the public and sometimes, private health facilities in the region.
It is important to note that facilities are also able to procure medical products and devices from private manufacturers and wholesalers provided they do that in line with the public procurement act. While it is MoH policy for facilities to procure logistics and supplies through the public system, except in cases of unavailability, it has been observed in survey in Ghana that there are signifi cant private sector purchases at all levels. In some regions and facilities, purchases from the private sector being in the majority.
Ghana also receive donations of medical products and devices from development partners and non-government organizations. A large number of vaccines and medical devices (e.g. disposables and condoms) are donated through UNICEF and USAID as well as ITNs through various NGOs. These donation can be to the Ministry or directly to health facilities.
state_of_the_nations_interior_new.indd 99state_of_the_nations_interior_new.indd 99 05/02/19 11.0605/02/19 11.06
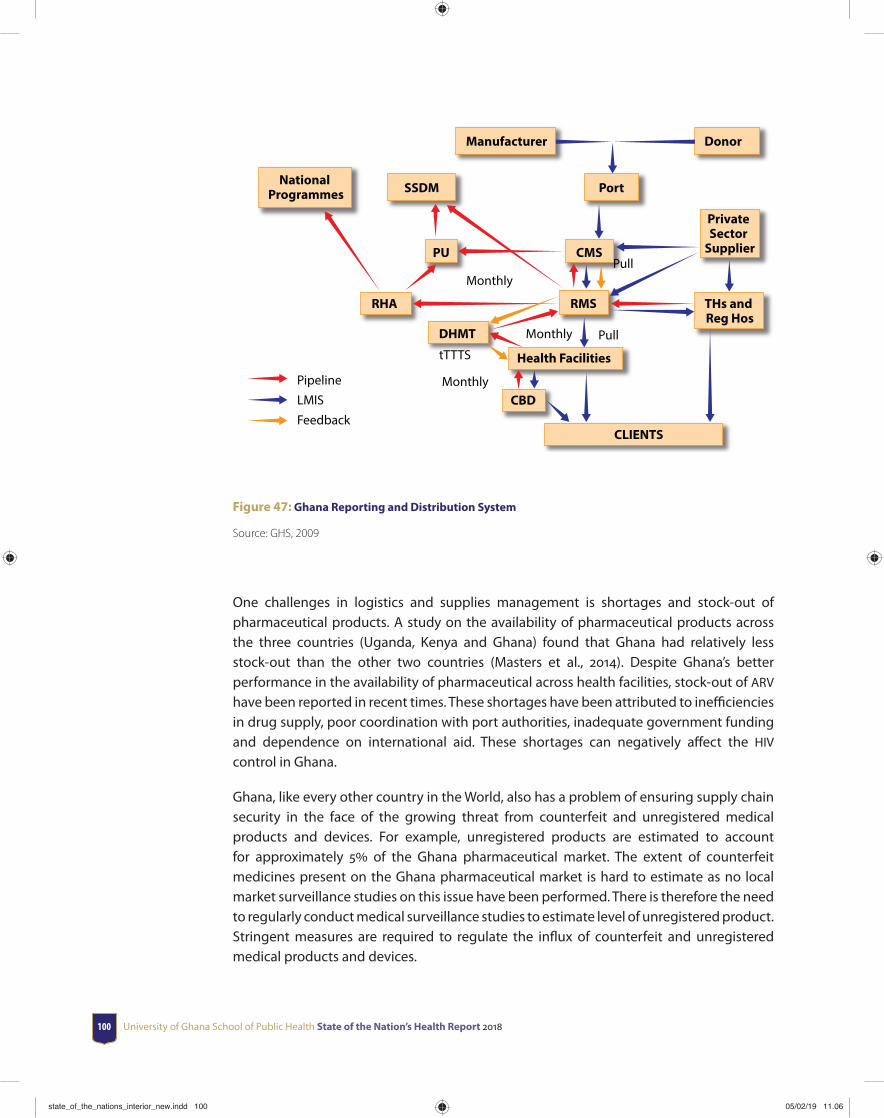
University of Ghana School of Public Health State of the Nation’s Health Report 2018100
Manufacturer Donor
National Programmes SSDM Port
PU CMS
Private Sector
Supplier
RHA RMS THs and Reg Hos
DHMT
Health Facilities
CBD
CLIENTS
Monthly
Monthly
tTTTS
Monthly
Pull
Pull
PipelineLMISFeedback
Figure 47: Ghana Reporting and Distribution System
Source: GHS, 2009
One challenges in logistics and supplies management is shortages and stock-out of pharmaceutical products. A study on the availability of pharmaceutical products across the three countries (Uganda, Kenya and Ghana) found that Ghana had relatively less stock-out than the other two countries (Masters et al., 2014). Despite Ghana’s better performance in the availability of pharmaceutical across health facilities, stock-out of ARV have been reported in recent times. These shortages have been attributed to ineffi ciencies in drug supply, poor coordination with port authorities, inadequate government funding and dependence on international aid. These shortages can negatively aff ect the HIV control in Ghana.
Ghana, like every other country in the World, also has a problem of ensuring supply chain security in the face of the growing threat from counterfeit and unregistered medical products and devices. For example, unregistered products are estimated to account for approximately 5 of the Ghana pharmaceutical market. The extent of counterfeit medicines present on the Ghana pharmaceutical market is hard to estimate as no local market surveillance studies on this issue have been performed. There is therefore the need to regularly conduct medical surveillance studies to estimate level of unregistered product. Stringent measures are required to regulate the infl ux of counterfeit and unregistered medical products and devices.
state_of_the_nations_interior_new.indd 100state_of_the_nations_interior_new.indd 100 05/02/19 11.0605/02/19 11.06
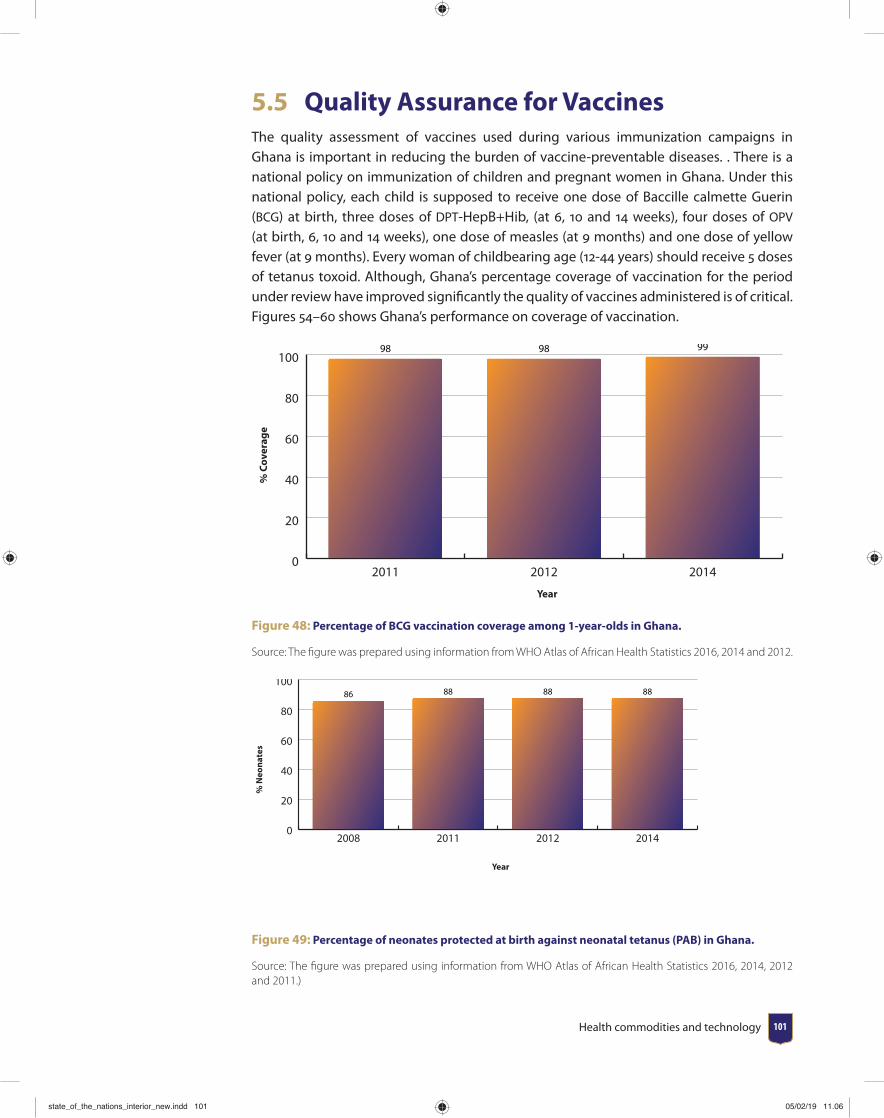
Health commodities and technology 101
5.5 Quality Assurance for VaccinesThe quality assessment of vaccines used during various immunization campaigns in Ghana is important in reducing the burden of vaccine-preventable diseases. . There is a national policy on immunization of children and pregnant women in Ghana. Under this national policy, each child is supposed to receive one dose of Baccille calmette Guerin (BCG) at birth, three doses of DPT-HepB+Hib, (at 6, 10 and 14 weeks), four doses of OPV (at birth, 6, 10 and 14 weeks), one dose of measles (at 9 months) and one dose of yellow fever (at 9 months). Every woman of childbearing age (12-44 years) should receive 5 doses of tetanus toxoid. Although, Ghana’s percentage coverage of vaccination for the period under review have improved signifi cantly the quality of vaccines administered is of critical. Figures 54–60 shows Ghana’s performance on coverage of vaccination.
0
20
40
60
80
100
201420122011
% C
over
age
Year
98 98 99
Figure 48: Percentage of BCG vaccination coverage among 1-year-olds in Ghana.
Source: The fi gure was prepared using information from WHO Atlas of African Health Statistics 2016, 2014 and 2012.
% N
eona
tes
Year
0
20
40
60
80
100
2014201220112008
86 88 88 88
Figure 49: Percentage of neonates protected at birth against neonatal tetanus (PAB) in Ghana.
Source: The fi gure was prepared using information from WHO Atlas of African Health Statistics 2016, 2014, 2012 and 2011.)
state_of_the_nations_interior_new.indd 101state_of_the_nations_interior_new.indd 101 05/02/19 11.0605/02/19 11.06
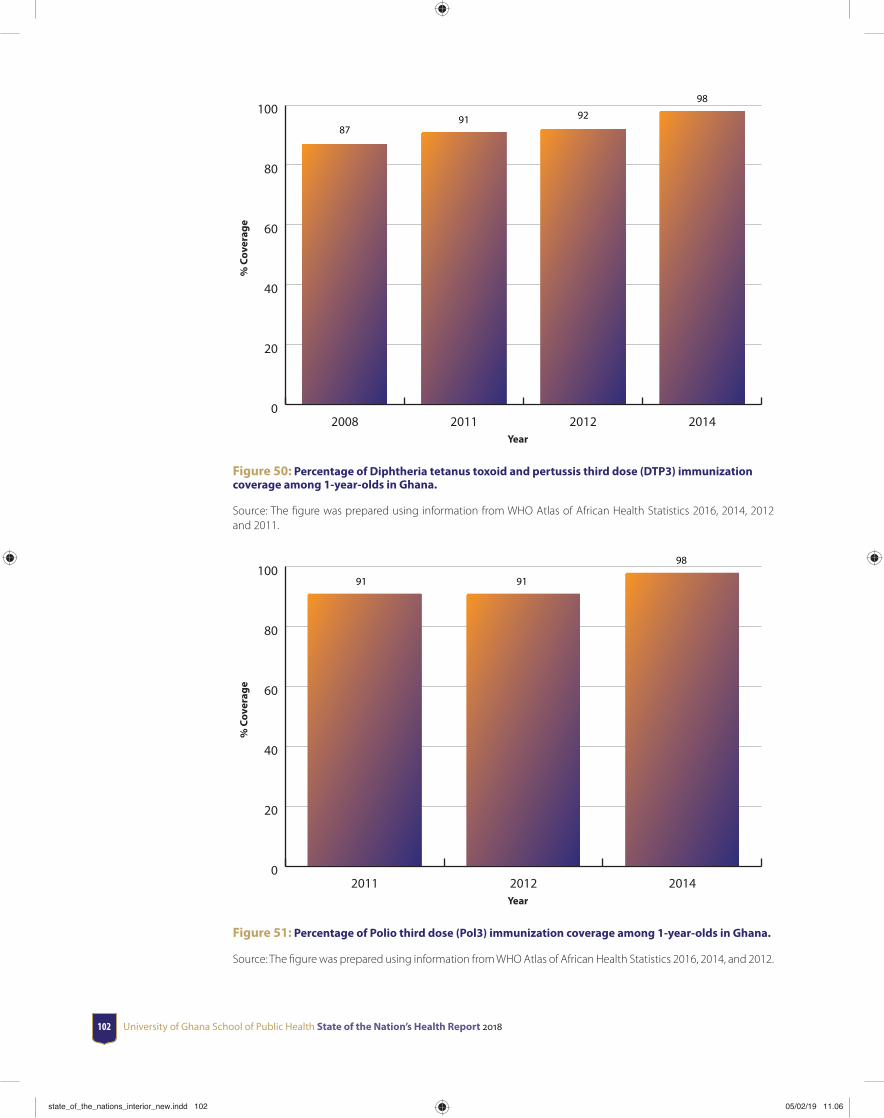
University of Ghana School of Public Health State of the Nation’s Health Report 2018102
% C
over
age
Year
0
20
40
60
80
100
2014201220112008
8791 92
98
Figure 50: Percentage of Diphtheria tetanus toxoid and pertussis third dose (DTP3) immunization coverage among 1-year-olds in Ghana.
Source: The fi gure was prepared using information from WHO Atlas of African Health Statistics 2016, 2014, 2012 and 2011.
% C
over
age
Year
0
20
40
60
80
100
201420122011
91 91
98
Figure 51: Percentage of Polio third dose (Pol3) immunization coverage among 1-year-olds in Ghana.
Source: The fi gure was prepared using information from WHO Atlas of African Health Statistics 2016, 2014, and 2012.
state_of_the_nations_interior_new.indd 102state_of_the_nations_interior_new.indd 102 05/02/19 11.0605/02/19 11.06
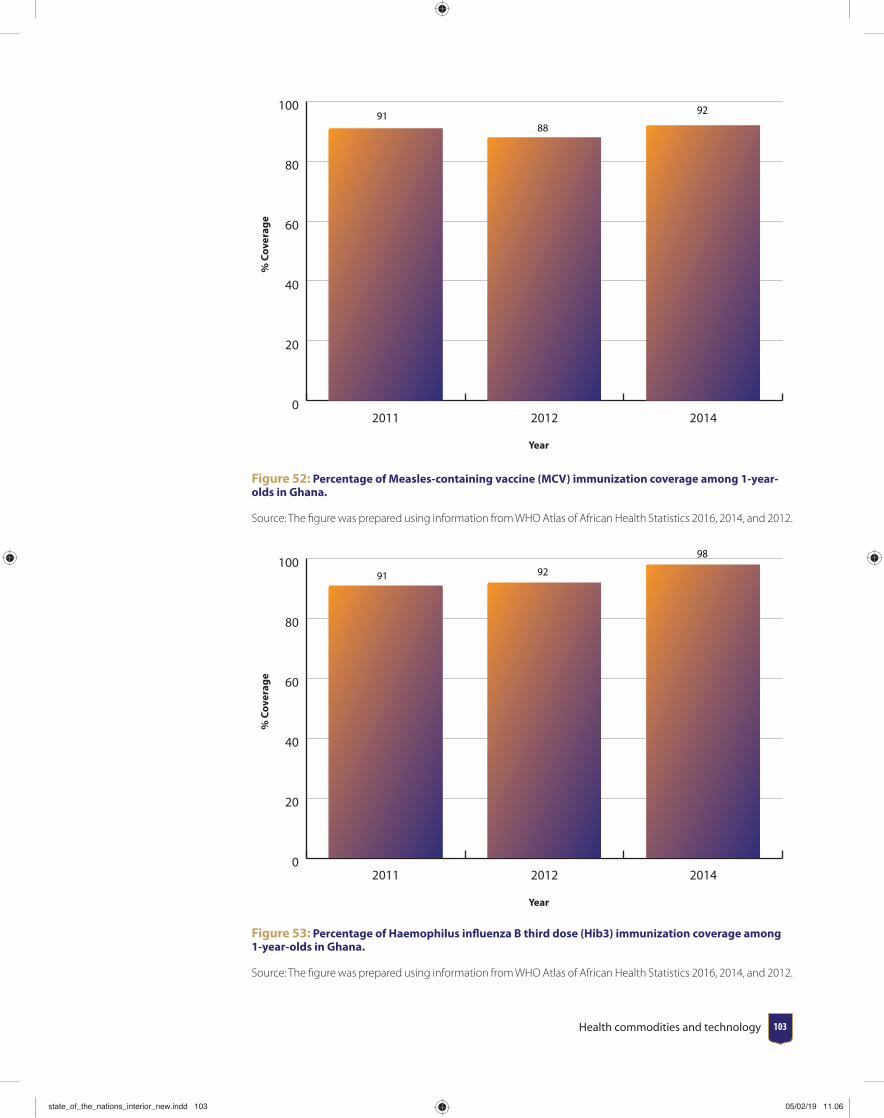
Health commodities and technology 103
% C
over
age
Year
0
20
40
60
80
100
201420122011
9188
92
Figure 52: Percentage of Measles-containing vaccine (MCV) immunization coverage among 1-year-olds in Ghana.
Source: The fi gure was prepared using information from WHO Atlas of African Health Statistics 2016, 2014, and 2012.
% C
over
age
Year
0
20
40
60
80
100
201420122011
91 92
98
Figure 53: Percentage of Haemophilus infl uenza B third dose (Hib3) immunization coverage among 1-year-olds in Ghana.
Source: The fi gure was prepared using information from WHO Atlas of African Health Statistics 2016, 2014, and 2012.
state_of_the_nations_interior_new.indd 103state_of_the_nations_interior_new.indd 103 05/02/19 11.0605/02/19 11.06
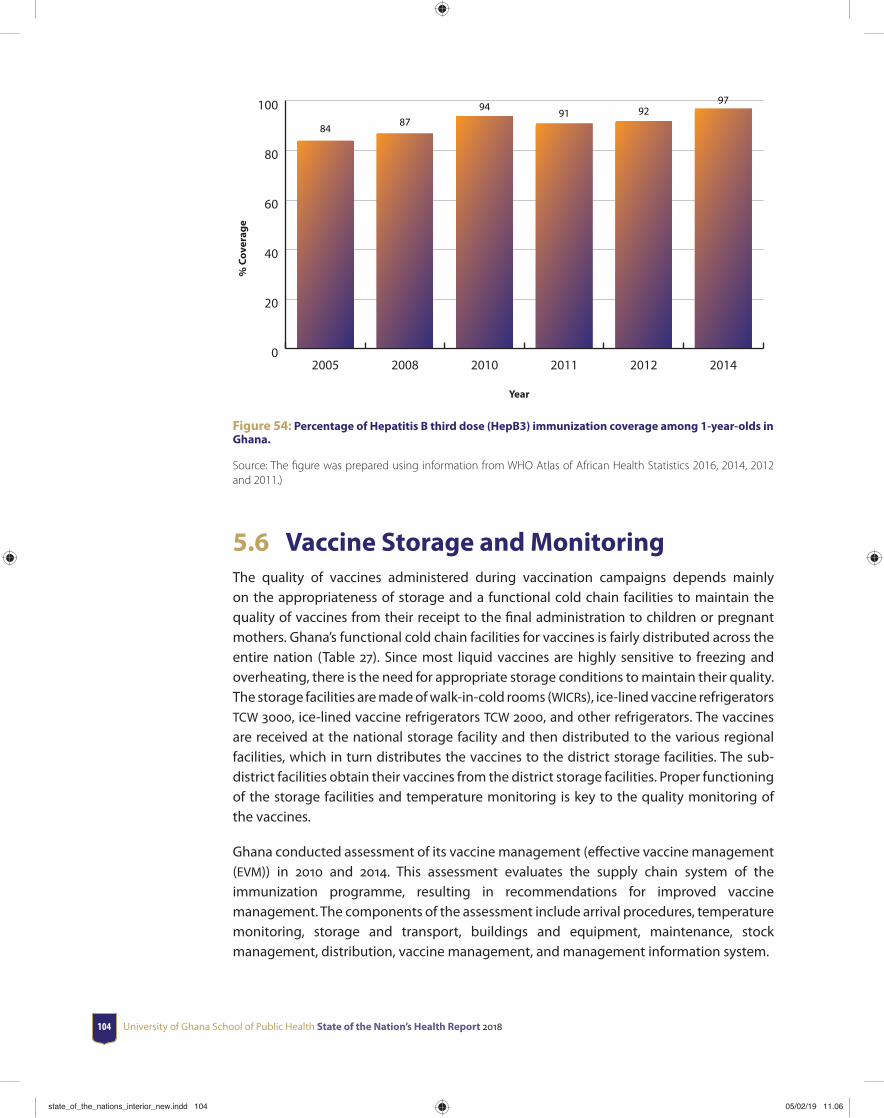
University of Ghana School of Public Health State of the Nation’s Health Report 2018104
% C
over
age
Year
0
20
40
60
80
100
201420122011201020082005
8487
9491 92
97
Figure 54: Percentage of Hepatitis B third dose (HepB3) immunization coverage among 1-year-olds in Ghana.
Source: The fi gure was prepared using information from WHO Atlas of African Health Statistics 2016, 2014, 2012 and 2011.)
5.6 Vaccine Storage and MonitoringThe quality of vaccines administered during vaccination campaigns depends mainly on the appropriateness of storage and a functional cold chain facilities to maintain the quality of vaccines from their receipt to the fi nal administration to children or pregnant mothers. Ghana’s functional cold chain facilities for vaccines is fairly distributed across the entire nation (Table 27). Since most liquid vaccines are highly sensitive to freezing and overheating, there is the need for appropriate storage conditions to maintain their quality. The storage facilities are made of walk-in-cold rooms (WICRs), ice-lined vaccine refrigerators TCW 3000, ice-lined vaccine refrigerators TCW 2000, and other refrigerators. The vaccines are received at the national storage facility and then distributed to the various regional facilities, which in turn distributes the vaccines to the district storage facilities. The sub-district facilities obtain their vaccines from the district storage facilities. Proper functioning of the storage facilities and temperature monitoring is key to the quality monitoring of the vaccines.
Ghana conducted assessment of its vaccine management (eff ective vaccine management (EVM)) in 2010 and 2014. This assessment evaluates the supply chain system of the immunization programme, resulting in recommendations for improved vaccine management. The components of the assessment include arrival procedures, temperature monitoring, storage and transport, buildings and equipment, maintenance, stock management, distribution, vaccine management, and management information system.
state_of_the_nations_interior_new.indd 104state_of_the_nations_interior_new.indd 104 05/02/19 11.0605/02/19 11.06
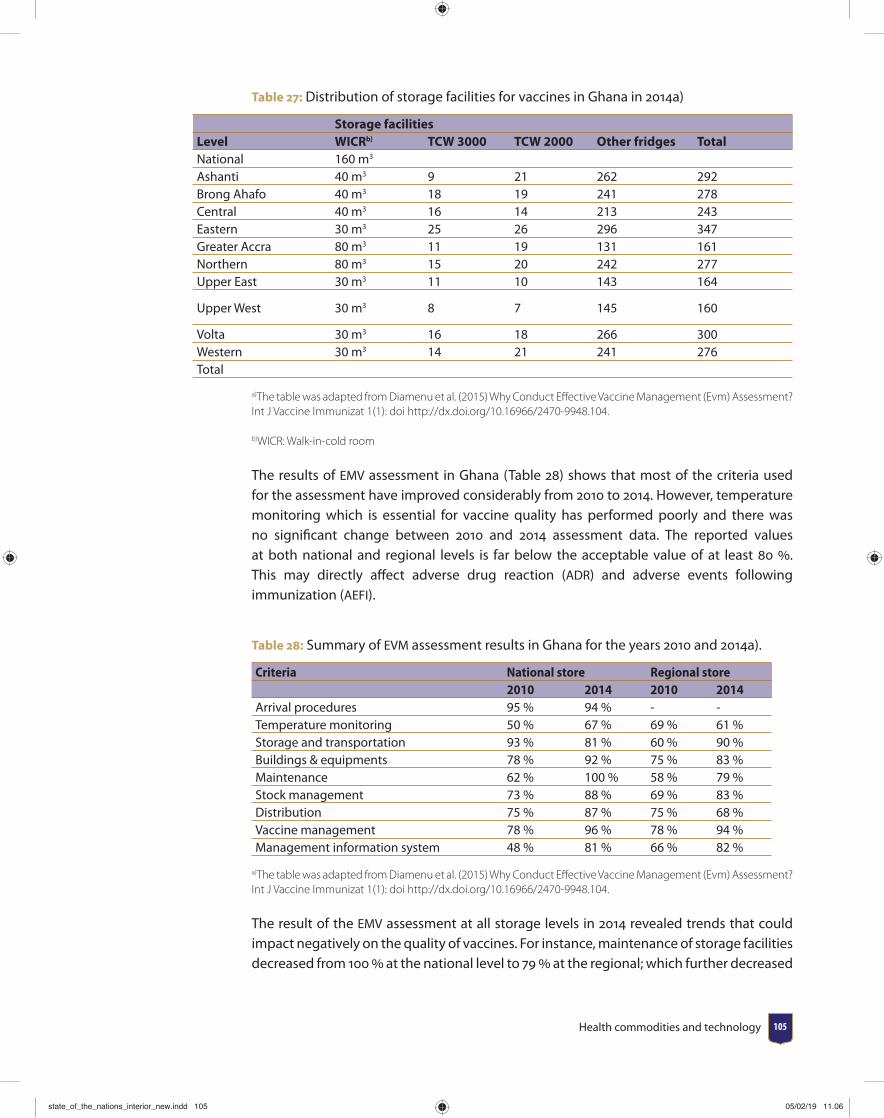
Health commodities and technology 105
Table 27: Distribution of storage facilities for vaccines in Ghana in 2014a)
Storage facilitiesLevel WICRb) TCW 3000 TCW 2000 Other fridges TotalNational 160 m3
Ashanti 40 m3 9 21 262 292Brong Ahafo 40 m3 18 19 241 278Central 40 m3 16 14 213 243Eastern 30 m3 25 26 296 347Greater Accra 80 m3 11 19 131 161Northern 80 m3 15 20 242 277Upper East 30 m3 11 10 143 164
Upper West 30 m3 8 7 145 160
Volta 30 m3 16 18 266 300Western 30 m3 14 21 241 276Total
a)The table was adapted from Diamenu et al. (2015) Why Conduct Eff ective Vaccine Management (Evm) Assessment? Int J Vaccine Immunizat 1(1): doi http://dx.doi.org/10.16966/2470-9948.104.
b)WICR: Walk-in-cold room
The results of EMV assessment in Ghana (Table 28) shows that most of the criteria used for the assessment have improved considerably from 2010 to 2014. However, temperature monitoring which is essential for vaccine quality has performed poorly and there was no signifi cant change between 2010 and 2014 assessment data. The reported values at both national and regional levels is far below the acceptable value of at least 80 . This may directly aff ect adverse drug reaction (ADR) and adverse events following immunization (AEFI).
Table 28: Summary of EVM assessment results in Ghana for the years 2010 and 2014a).
Criteria National store Regional store2010 2014 2010 2014
Arrival procedures 95 % 94 % - -Temperature monitoring 50 % 67 % 69 % 61 %Storage and transportation 93 % 81 % 60 % 90 %Buildings & equipments 78 % 92 % 75 % 83 %Maintenance 62 % 100 % 58 % 79 %Stock management 73 % 88 % 69 % 83 %Distribution 75 % 87 % 75 % 68 %Vaccine management 78 % 96 % 78 % 94 %Management information system 48 % 81 % 66 % 82 %
a)The table was adapted from Diamenu et al. (2015) Why Conduct Eff ective Vaccine Management (Evm) Assessment? Int J Vaccine Immunizat 1(1): doi http://dx.doi.org/10.16966/2470-9948.104.
The result of the EMV assessment at all storage levels in 2014 revealed trends that could impact negatively on the quality of vaccines. For instance, maintenance of storage facilities decreased from 100 at the national level to 79 at the regional; which further decreased
state_of_the_nations_interior_new.indd 105state_of_the_nations_interior_new.indd 105 05/02/19 11.0605/02/19 11.06
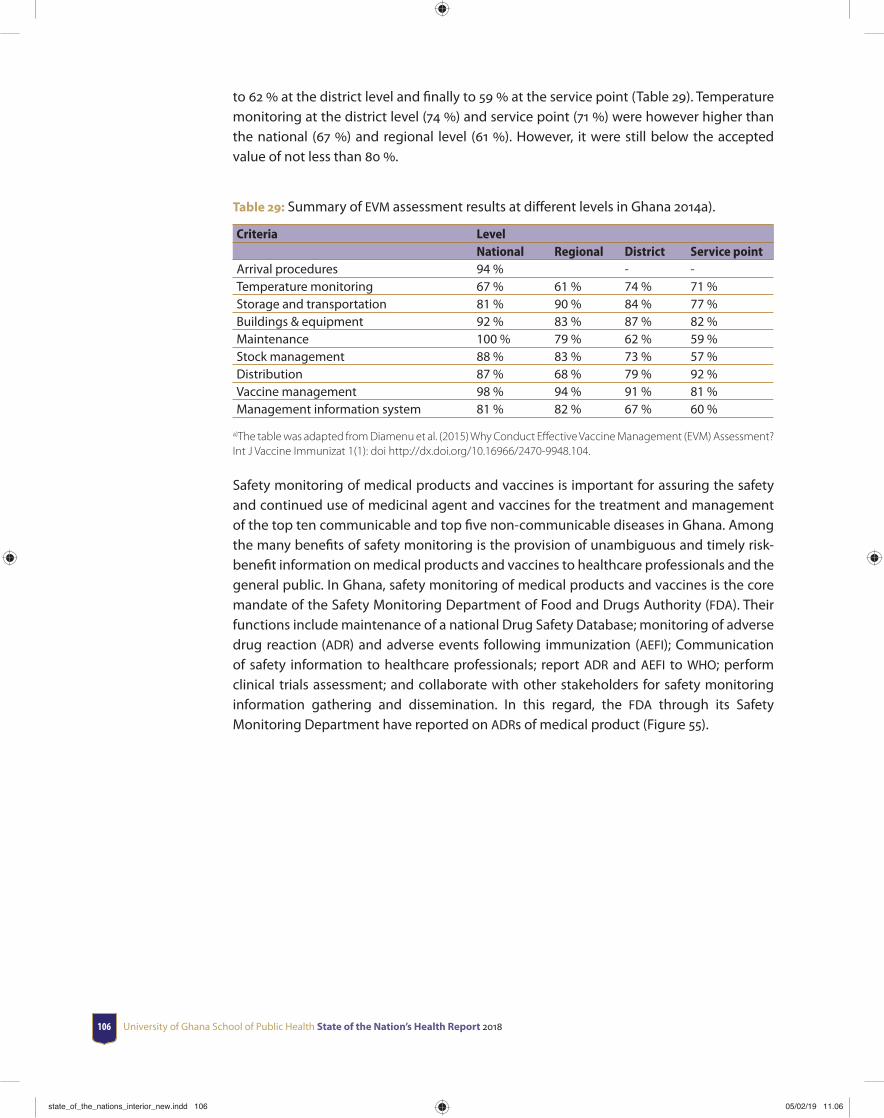
University of Ghana School of Public Health State of the Nation’s Health Report 2018106
to 62 at the district level and fi nally to 59 at the service point (Table 29). Temperature monitoring at the district level (74 ) and service point (71 ) were however higher than the national (67 ) and regional level (61 ). However, it were still below the accepted value of not less than 80 .
Table 29: Summary of EVM assessment results at diff erent levels in Ghana 2014a).
Criteria LevelNational Regional District Service point
Arrival procedures 94 % - -Temperature monitoring 67 % 61 % 74 % 71 %Storage and transportation 81 % 90 % 84 % 77 %Buildings & equipment 92 % 83 % 87 % 82 %Maintenance 100 % 79 % 62 % 59 %Stock management 88 % 83 % 73 % 57 %Distribution 87 % 68 % 79 % 92 %Vaccine management 98 % 94 % 91 % 81 %Management information system 81 % 82 % 67 % 60 %
a)The table was adapted from Diamenu et al. (2015) Why Conduct Eff ective Vaccine Management (EVM) Assessment? Int J Vaccine Immunizat 1(1): doi http://dx.doi.org/10.16966/2470-9948.104.
Safety monitoring of medical products and vaccines is important for assuring the safety and continued use of medicinal agent and vaccines for the treatment and management of the top ten communicable and top fi ve non-communicable diseases in Ghana. Among the many benefi ts of safety monitoring is the provision of unambiguous and timely risk-benefi t information on medical products and vaccines to healthcare professionals and the general public. In Ghana, safety monitoring of medical products and vaccines is the core mandate of the Safety Monitoring Department of Food and Drugs Authority (FDA). Their functions include maintenance of a national Drug Safety Database; monitoring of adverse drug reaction (ADR) and adverse events following immunization (AEFI); Communication of safety information to healthcare professionals; report ADR and AEFI to WHO; perform clinical trials assessment; and collaborate with other stakeholders for safety monitoring information gathering and dissemination. In this regard, the FDA through its Safety Monitoring Department have reported on ADRs of medical product (Figure 55).
state_of_the_nations_interior_new.indd 106state_of_the_nations_interior_new.indd 106 05/02/19 11.0605/02/19 11.06
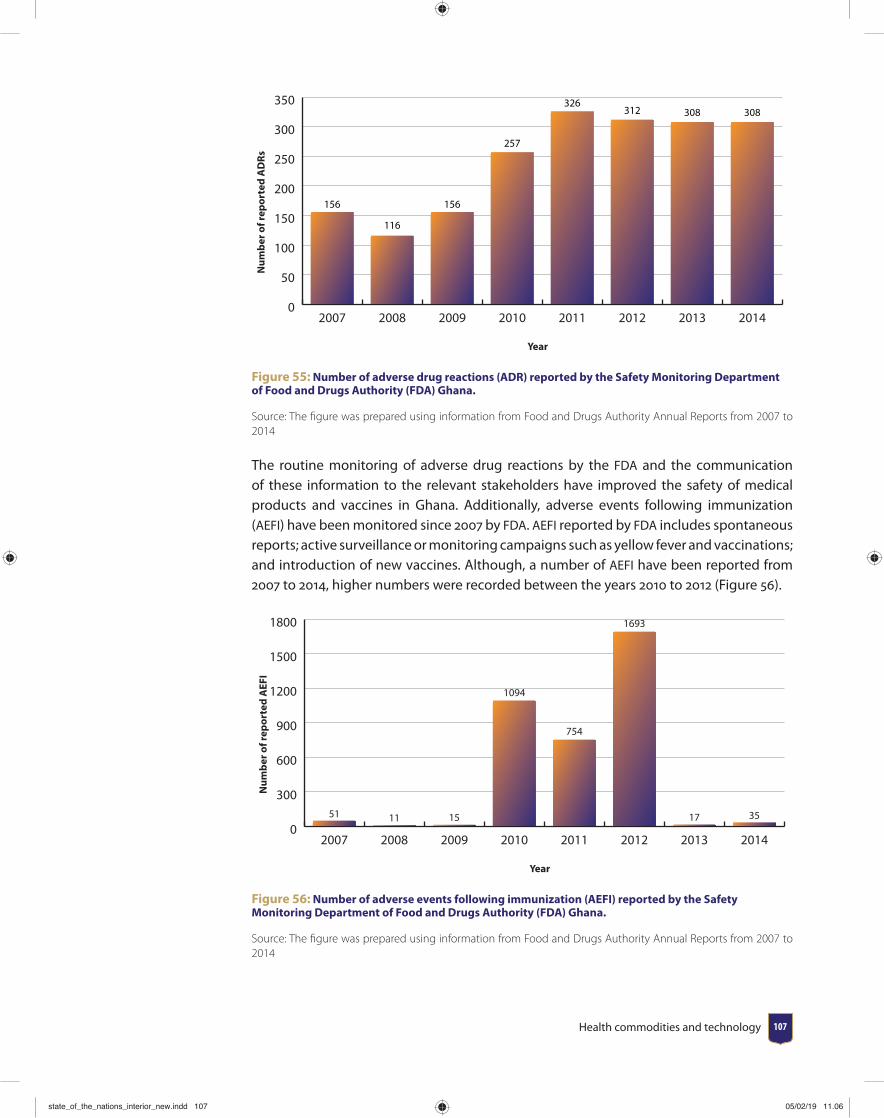
Health commodities and technology 107
Num
ber o
f rep
orte
d A
DRs
Year
0
50
100
150
200
250
300
350
20142013201220112010200920082007
156
116
156
257
326312 308 308
Figure 55: Number of adverse drug reactions (ADR) reported by the Safety Monitoring Department of Food and Drugs Authority (FDA) Ghana.
Source: The fi gure was prepared using information from Food and Drugs Authority Annual Reports from 2007 to 2014
The routine monitoring of adverse drug reactions by the FDA and the communication of these information to the relevant stakeholders have improved the safety of medical products and vaccines in Ghana. Additionally, adverse events following immunization (AEFI) have been monitored since 2007 by FDA. AEFI reported by FDA includes spontaneous reports; active surveillance or monitoring campaigns such as yellow fever and vaccinations; and introduction of new vaccines. Although, a number of AEFI have been reported from 2007 to 2014, higher numbers were recorded between the years 2010 to 2012 (Figure 56).
Num
ber o
f rep
orte
d A
EFI
Year
0
300
600
900
1200
1500
1800
20142013201220112010200920082007
51 11 15
1094
754
1693
17 35
Figure 56: Number of adverse events following immunization (AEFI) reported by the Safety Monitoring Department of Food and Drugs Authority (FDA) Ghana.
Source: The fi gure was prepared using information from Food and Drugs Authority Annual Reports from 2007 to 2014
state_of_the_nations_interior_new.indd 107state_of_the_nations_interior_new.indd 107 05/02/19 11.0605/02/19 11.06
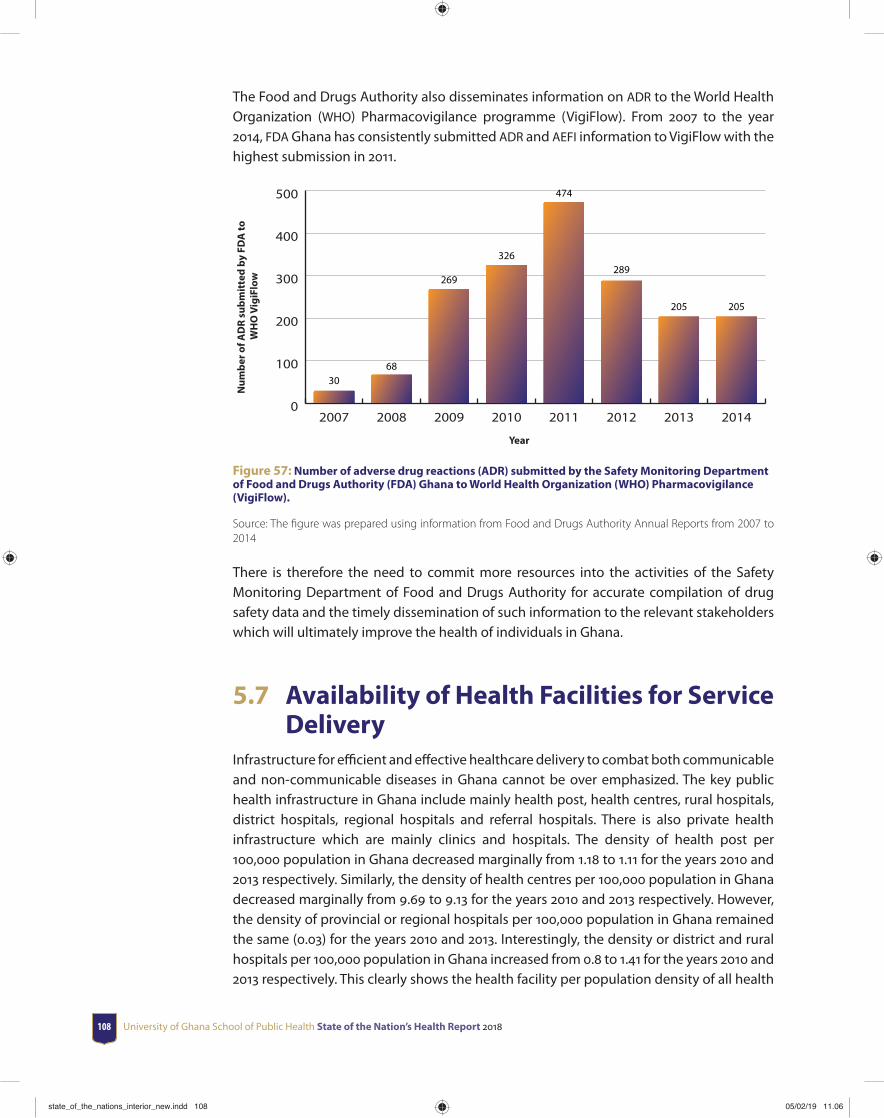
University of Ghana School of Public Health State of the Nation’s Health Report 2018108
The Food and Drugs Authority also disseminates information on ADR to the World Health Organization (WHO) Pharmacovigilance programme (VigiFlow). From 2007 to the year 2014, FDA Ghana has consistently submitted ADR and AEFI information to VigiFlow with the highest submission in 2011.
Num
ber o
f AD
R su
bmit
ted
by F
DA
to
WH
O V
igiF
low
Year
0
100
200
300
400
500
20142013201220112010200920082007
3068
269
326
474
289
205 205
Figure 57: Number of adverse drug reactions (ADR) submitted by the Safety Monitoring Department of Food and Drugs Authority (FDA) Ghana to World Health Organization (WHO) Pharmacovigilance (VigiFlow).
Source: The fi gure was prepared using information from Food and Drugs Authority Annual Reports from 2007 to 2014
There is therefore the need to commit more resources into the activities of the Safety Monitoring Department of Food and Drugs Authority for accurate compilation of drug safety data and the timely dissemination of such information to the relevant stakeholders which will ultimately improve the health of individuals in Ghana.
5.7 Availability of Health Facilities for Service Delivery
Infrastructure for effi cient and eff ective healthcare delivery to combat both communicable and non-communicable diseases in Ghana cannot be over emphasized. The key public health infrastructure in Ghana include mainly health post, health centres, rural hospitals, district hospitals, regional hospitals and referral hospitals. There is also private health infrastructure which are mainly clinics and hospitals. The density of health post per 100,000 population in Ghana decreased marginally from 1.18 to 1.11 for the years 2010 and 2013 respectively. Similarly, the density of health centres per 100,000 population in Ghana decreased marginally from 9.69 to 9.13 for the years 2010 and 2013 respectively. However, the density of provincial or regional hospitals per 100,000 population in Ghana remained the same (0.03) for the years 2010 and 2013. Interestingly, the density or district and rural hospitals per 100,000 population in Ghana increased from 0.8 to 1.41 for the years 2010 and 2013 respectively. This clearly shows the health facility per population density of all health
state_of_the_nations_interior_new.indd 108state_of_the_nations_interior_new.indd 108 05/02/19 11.0605/02/19 11.06

Health commodities and technology 109
facilities in Ghana is inadequate to manage both communicable and non-communicable diseases in Ghana.
Although the increased number of health facilities has improved access to health services in general, access remains poor in parts of the country especially in rural areas and in the northern parts of Ghana. The Community-Based Health Planning and Services (CHPS) is the strategy to improve access to basic health services to deprived areas. Though the content of the policy has varied over the years, its coverage has continuously increased. The total number of functional CHPS zones at the end of 2012 was 2,226. The estimated population covered by CHPS increased from 16.4 in 2009 to 21.4 in 2012. Specialist services also received a boost with 10 specialist mobile vans now functional and providing specialist services to the deprived areas. These measures are essential to increase access to basic health care to deprived areas.
5.8 Summary and ConclusionGhana has increased the availability of medical products and devices in all aspects of health care delivery. The supply of medical commodities in the malaria control and vaccine preventable condition have increased. Eff orts are also being made to assist local institutions to produce some medical products and devices for use by health care delivery in Ghana. Routine safety monitoring of the Ghanaian market is ongoing to ensure the safety of medical products and devices. Moving forward, it would be important for Ghana to develop a national list of approved medical devices for procurement or reimbursement. Also, more resources will be required to increase the density of health facilities at all levels throughout the nation for a more eff ective and effi cient management of both communicable and non-communicable diseases in Ghana. Of note, Ghana’s immunization program is achieving fantastic results, however the quality of vaccines needs to be improved through implementation of recommendations from the 2014 EMV assessment. Finally, the Food and Drugs Authority should be well-resourced and equipped to monitor the quality of medical products and vaccines on the market; and also monitor and report on the safety of medical products and vaccines on a timely manner to various stakeholders for improved health delivery in Ghana. Finally, the central medical store (national level), regional medical stores, district medical stores and the sub-district medical stores should be reorganized in line with the assessment criteria used for the EMV assessment of vaccines. This has tremendous potential to ensure the quality of medicines across the length and breadth of the nation. Also, Pharmacy Council should ensure that the storage and sale of medicines in pharmacies (both at the private and public facilities) are conducted at the appropriate temperature and humidity conditions.
state_of_the_nations_interior_new.indd 109state_of_the_nations_interior_new.indd 109 05/02/19 11.0605/02/19 11.06

University of Ghana School of Public Health State of the Nation’s Health Report 2018110
CHAPTER 6Health management information system
Planning and policy making in health depends on the availability of accurate data reporting from health institutions. Health information thus constitutes an essential component of any eff ective health system. Reforms in the Ghana Health Sector can only make the necessary impact with proper data and information management. Health information as a building block in the WHO health system framework provides the basic data for the proper functioning of the other building blocks (service delivery, products and technology, governance and leadership, human resource, fi nance). Without accurate information, wrong management decisions may be made which would cost the health system and the country in terms of use of scarce resources and eff ective delivery of health services to meet any health or development goal.
In order to improve upon the quality of data reported from lower health facility levels to the national level, the Ministry of Health (MOH) and the Ghana Health Service (GHS) began a reformation of the health management and information system in 2001. The health reforms of 1998 and 1999 restructured and separated the roles of MoH and GHS.
Prior to the restructuring of the health services into a policy making (MoH) and service delivery arms (GHS) health information system in Ghana followed a vertical structure. In this structure, diff erent departments located at the lower level provided information to the national level for onward transmission to meet programme demands and requirements. This vertical structure of
state_of_the_nations_interior_new.indd 110state_of_the_nations_interior_new.indd 110 05/02/19 11.0605/02/19 11.06
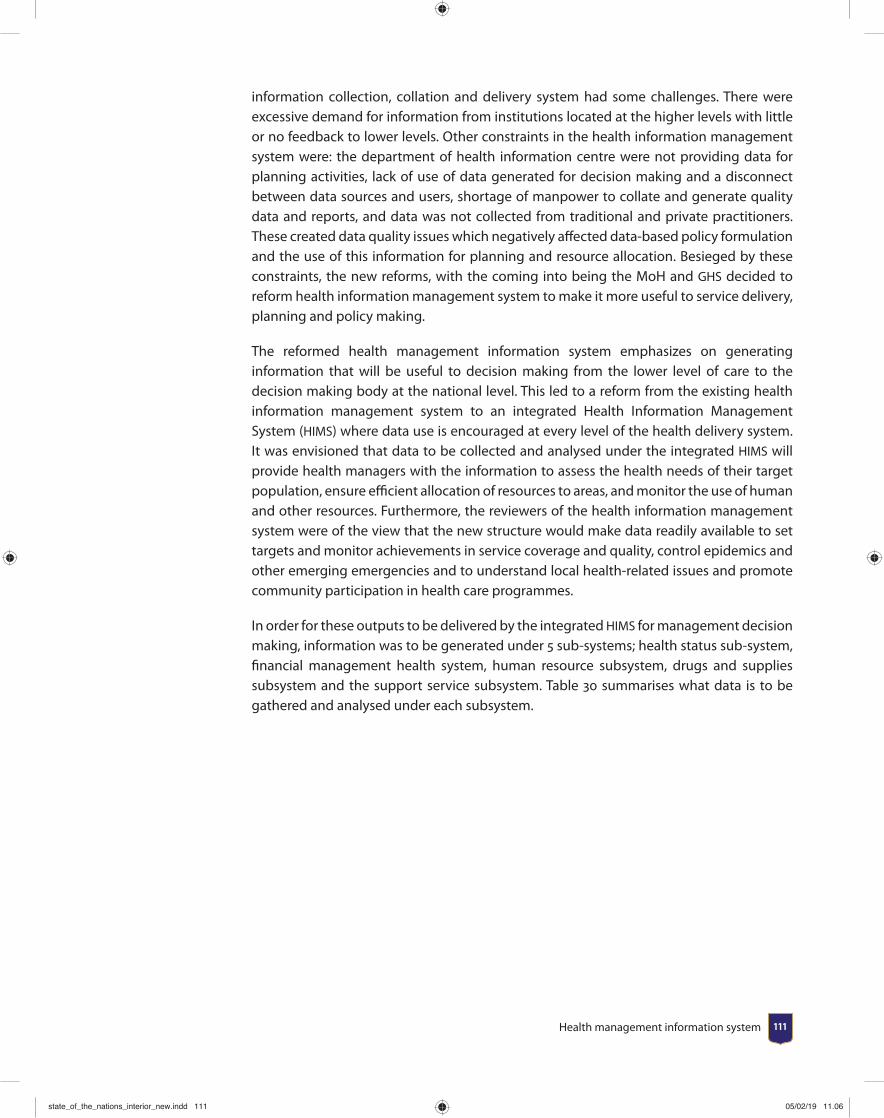
Health management information system 111
information collection, collation and delivery system had some challenges. There were excessive demand for information from institutions located at the higher levels with little or no feedback to lower levels. Other constraints in the health information management system were: the department of health information centre were not providing data for planning activities, lack of use of data generated for decision making and a disconnect between data sources and users, shortage of manpower to collate and generate quality data and reports, and data was not collected from traditional and private practitioners. These created data quality issues which negatively aff ected data-based policy formulation and the use of this information for planning and resource allocation. Besieged by these constraints, the new reforms, with the coming into being the MoH and GHS decided to reform health information management system to make it more useful to service delivery, planning and policy making.
The reformed health management information system emphasizes on generating information that will be useful to decision making from the lower level of care to the decision making body at the national level. This led to a reform from the existing health information management system to an integrated Health Information Management System (HIMS) where data use is encouraged at every level of the health delivery system. It was envisioned that data to be collected and analysed under the integrated HIMS will provide health managers with the information to assess the health needs of their target population, ensure effi cient allocation of resources to areas, and monitor the use of human and other resources. Furthermore, the reviewers of the health information management system were of the view that the new structure would make data readily available to set targets and monitor achievements in service coverage and quality, control epidemics and other emerging emergencies and to understand local health-related issues and promote community participation in health care programmes.
In order for these outputs to be delivered by the integrated HIMS for management decision making, information was to be generated under 5 sub-systems; health status sub-system, fi nancial management health system, human resource subsystem, drugs and supplies subsystem and the support service subsystem. Table 30 summarises what data is to be gathered and analysed under each subsystem.
state_of_the_nations_interior_new.indd 111state_of_the_nations_interior_new.indd 111 05/02/19 11.0605/02/19 11.06
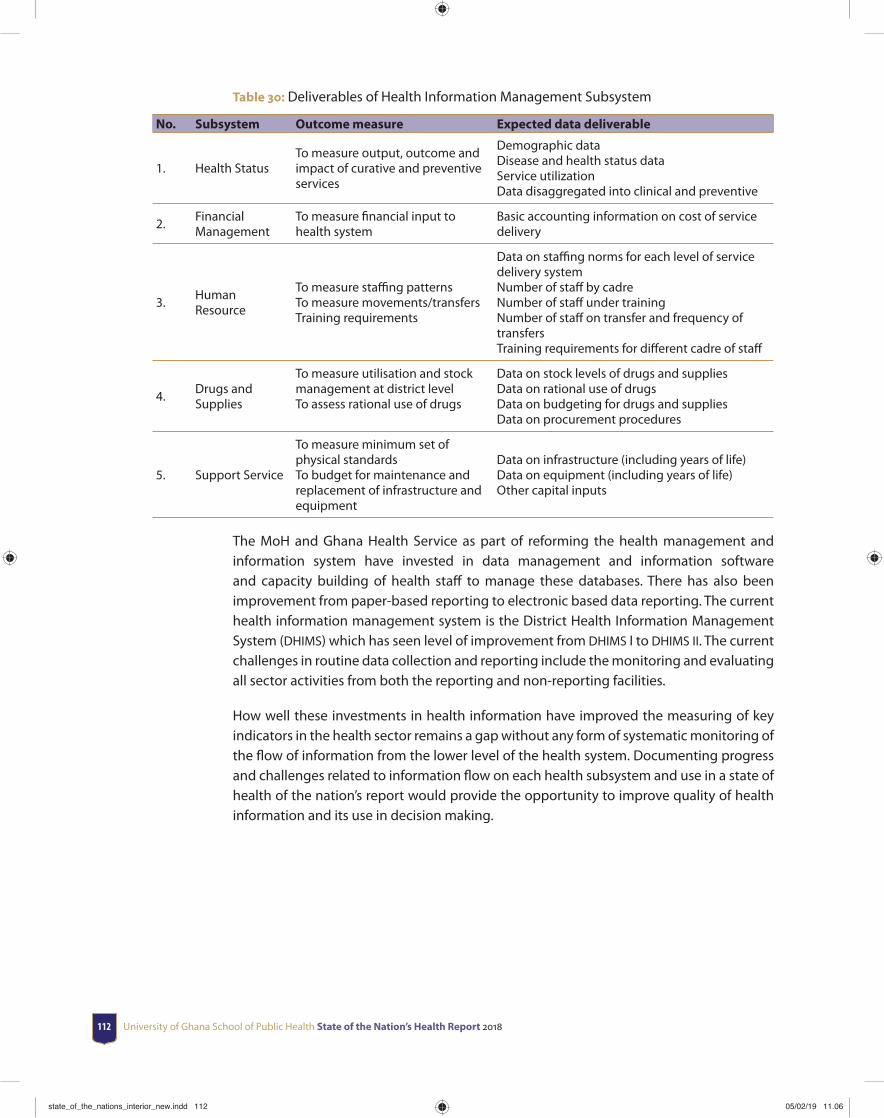
University of Ghana School of Public Health State of the Nation’s Health Report 2018112
Table 30: Deliverables of Health Information Management Subsystem
No. Subsystem Outcome measure Expected data deliverable
1. Health StatusTo measure output, outcome and impact of curative and preventive services
Demographic dataDisease and health status dataService utilizationData disaggregated into clinical and preventive
2.Financial Management
To measure fi nancial input to health system
Basic accounting information on cost of service delivery
3.Human Resource
To measure staffi ng patternsTo measure movements/transfersTraining requirements
Data on staffi ng norms for each level of service delivery systemNumber of staff by cadreNumber of staff under trainingNumber of staff on transfer and frequency of transfersTraining requirements for diff erent cadre of staff
4.Drugs and Supplies
To measure utilisation and stock management at district levelTo assess rational use of drugs
Data on stock levels of drugs and suppliesData on rational use of drugsData on budgeting for drugs and suppliesData on procurement procedures
5. Support Service
To measure minimum set of physical standardsTo budget for maintenance and replacement of infrastructure and equipment
Data on infrastructure (including years of life)Data on equipment (including years of life)Other capital inputs
The MoH and Ghana Health Service as part of reforming the health management and information system have invested in data management and information software and capacity building of health staff to manage these databases. There has also been improvement from paper-based reporting to electronic based data reporting. The current health information management system is the District Health Information Management System (DHIMS) which has seen level of improvement from DHIMS I to DHIMS II. The current challenges in routine data collection and reporting include the monitoring and evaluating all sector activities from both the reporting and non-reporting facilities.
How well these investments in health information have improved the measuring of key indicators in the health sector remains a gap without any form of systematic monitoring of the fl ow of information from the lower level of the health system. Documenting progress and challenges related to information fl ow on each health subsystem and use in a state of health of the nation’s report would provide the opportunity to improve quality of health information and its use in decision making.
state_of_the_nations_interior_new.indd 112state_of_the_nations_interior_new.indd 112 05/02/19 11.0605/02/19 11.06
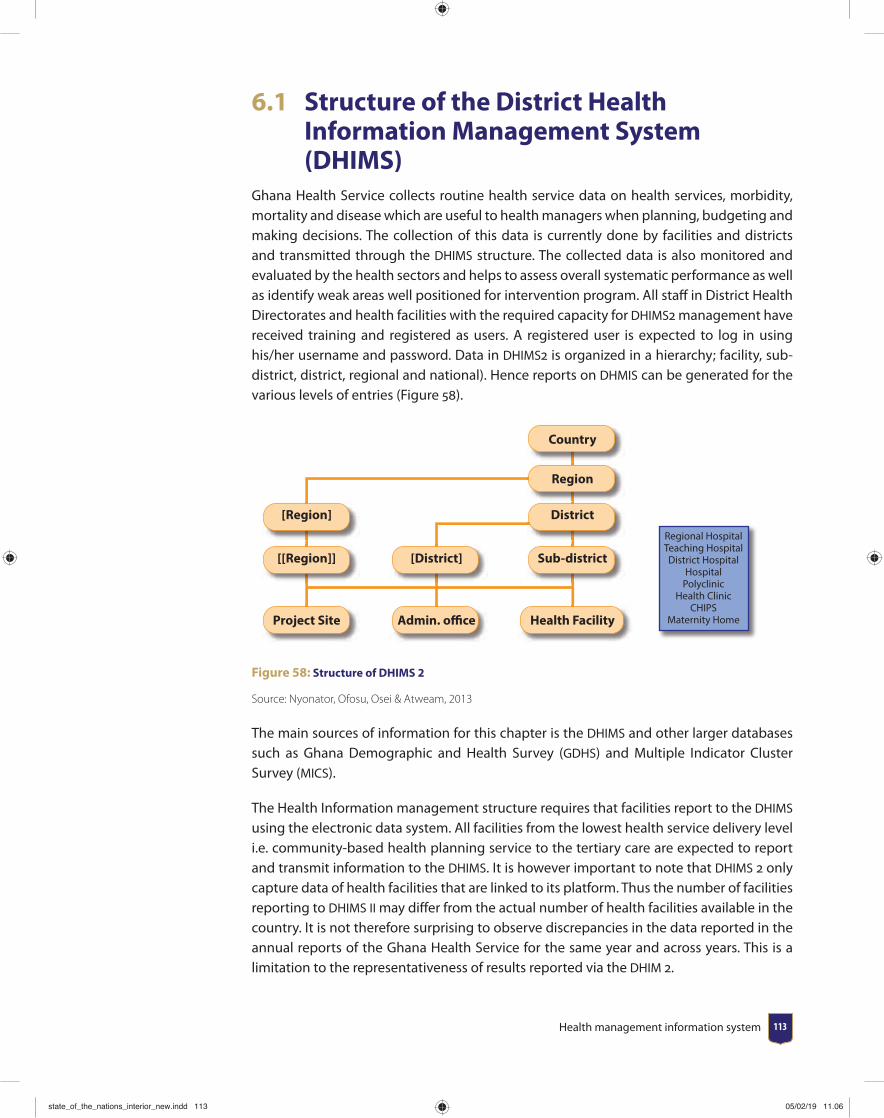
Health management information system 113
6.1 Structure of the District Health Information Management System (DHIMS)
Ghana Health Service collects routine health service data on health services, morbidity, mortality and disease which are useful to health managers when planning, budgeting and making decisions. The collection of this data is currently done by facilities and districts and transmitted through the DHIMS structure. The collected data is also monitored and evaluated by the health sectors and helps to assess overall systematic performance as well as identify weak areas well positioned for intervention program. All staff in District Health Directorates and health facilities with the required capacity for DHIMS2 management have received training and registered as users. A registered user is expected to log in using his/her username and password. Data in DHIMS2 is organized in a hierarchy; facility, sub-district, district, regional and national). Hence reports on DHMIS can be generated for the various levels of entries (Figure 58).
Country
Region
[Region] District
[[Region]] [District] Sub-district
Project Site
Regional HospitalTeaching HospitalDistrict Hospital
HospitalPolyclinic
Health ClinicCHIPS
Maternity HomeAdmin. office Health Facility
Figure 58: Structure of DHIMS 2
Source: Nyonator, Ofosu, Osei & Atweam, 2013
The main sources of information for this chapter is the DHIMS and other larger databases such as Ghana Demographic and Health Survey (GDHS) and Multiple Indicator Cluster Survey (MICS).
The Health Information management structure requires that facilities report to the DHIMS using the electronic data system. All facilities from the lowest health service delivery level i.e. community-based health planning service to the tertiary care are expected to report and transmit information to the DHIMS. It is however important to note that DHIMS 2 only capture data of health facilities that are linked to its platform. Thus the number of facilities reporting to DHIMS II may diff er from the actual number of health facilities available in the country. It is not therefore surprising to observe discrepancies in the data reported in the annual reports of the Ghana Health Service for the same year and across years. This is a limitation to the representativeness of results reported via the DHIM 2.
state_of_the_nations_interior_new.indd 113state_of_the_nations_interior_new.indd 113 05/02/19 11.0605/02/19 11.06
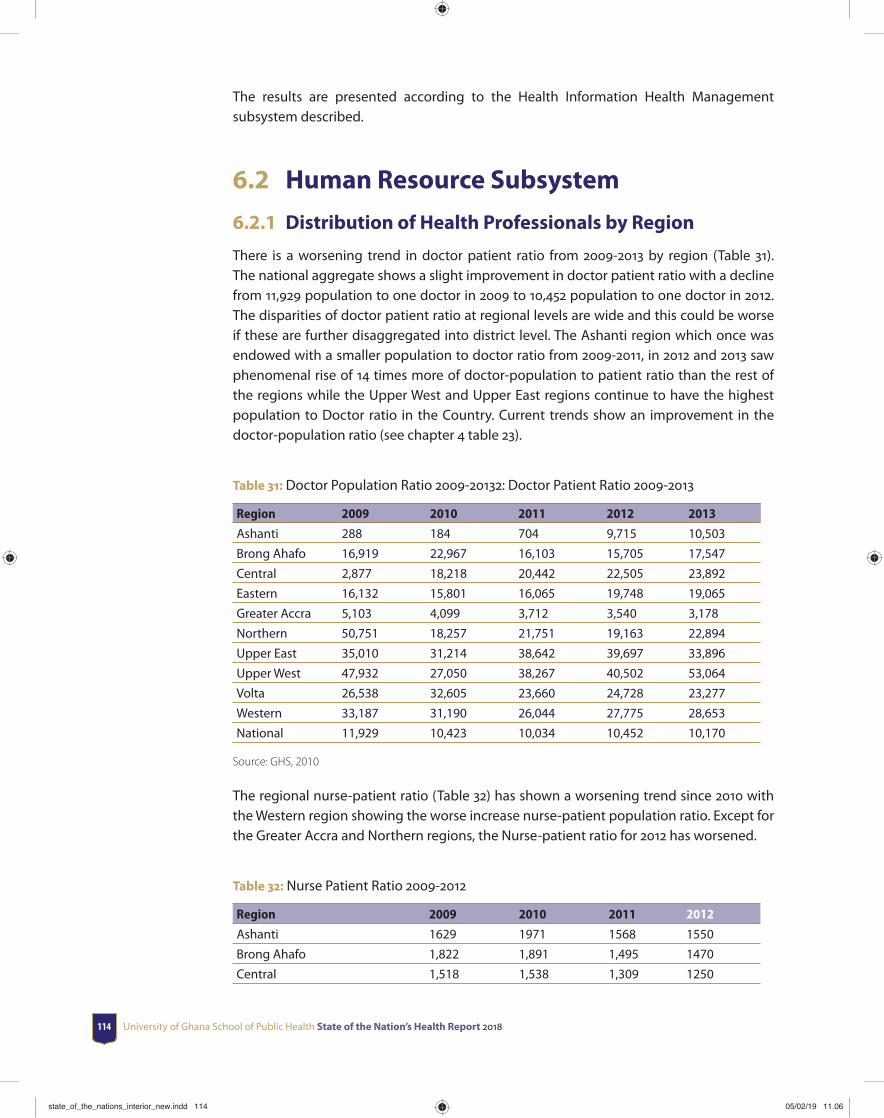
University of Ghana School of Public Health State of the Nation’s Health Report 2018114
The results are presented according to the Health Information Health Management subsystem described.
6.2 Human Resource Subsystem
6.2.1 Distribution of Health Professionals by Region
There is a worsening trend in doctor patient ratio from 2009-2013 by region (Table 31). The national aggregate shows a slight improvement in doctor patient ratio with a decline from 11,929 population to one doctor in 2009 to 10,452 population to one doctor in 2012. The disparities of doctor patient ratio at regional levels are wide and this could be worse if these are further disaggregated into district level. The Ashanti region which once was endowed with a smaller population to doctor ratio from 2009-2011, in 2012 and 2013 saw phenomenal rise of 14 times more of doctor-population to patient ratio than the rest of the regions while the Upper West and Upper East regions continue to have the highest population to Doctor ratio in the Country. Current trends show an improvement in the doctor-population ratio (see chapter 4 table 23).
Table 31: Doctor Population Ratio 2009-20132: Doctor Patient Ratio 2009-2013
Region 2009 2010 2011 2012 2013
Ashanti 288 184 704 9,715 10,503
Brong Ahafo 16,919 22,967 16,103 15,705 17,547
Central 2,877 18,218 20,442 22,505 23,892
Eastern 16,132 15,801 16,065 19,748 19,065
Greater Accra 5,103 4,099 3,712 3,540 3,178
Northern 50,751 18,257 21,751 19,163 22,894
Upper East 35,010 31,214 38,642 39,697 33,896
Upper West 47,932 27,050 38,267 40,502 53,064
Volta 26,538 32,605 23,660 24,728 23,277
Western 33,187 31,190 26,044 27,775 28,653
National 11,929 10,423 10,034 10,452 10,170
Source: GHS, 2010
The regional nurse-patient ratio (Table 32) has shown a worsening trend since 2010 with the Western region showing the worse increase nurse-patient population ratio. Except for the Greater Accra and Northern regions, the Nurse-patient ratio for 2012 has worsened.
Table 32: Nurse Patient Ratio 2009-2012
Region 2009 2010 2011 2012
Ashanti 1629 1971 1568 1550
Brong Ahafo 1,822 1,891 1,495 1470
Central 1,518 1,538 1,309 1250
state_of_the_nations_interior_new.indd 114state_of_the_nations_interior_new.indd 114 05/02/19 11.0605/02/19 11.06
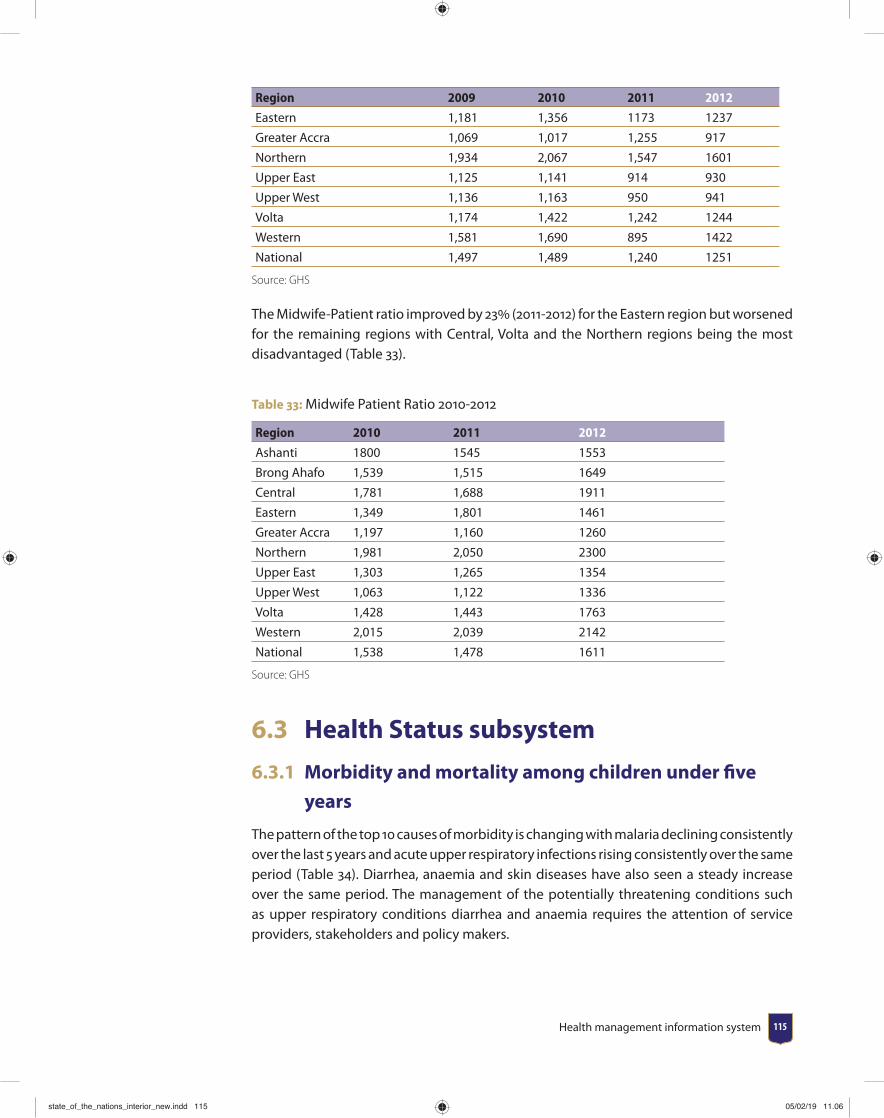
Health management information system 115
Region 2009 2010 2011 2012
Eastern 1,181 1,356 1173 1237
Greater Accra 1,069 1,017 1,255 917
Northern 1,934 2,067 1,547 1601
Upper East 1,125 1,141 914 930
Upper West 1,136 1,163 950 941
Volta 1,174 1,422 1,242 1244
Western 1,581 1,690 895 1422
National 1,497 1,489 1,240 1251
Source: GHS
The Midwife-Patient ratio improved by 23 (2011-2012) for the Eastern region but worsened for the remaining regions with Central, Volta and the Northern regions being the most disadvantaged (Table 33).
Table 33: Midwife Patient Ratio 2010-2012
Region 2010 2011 2012
Ashanti 1800 1545 1553
Brong Ahafo 1,539 1,515 1649
Central 1,781 1,688 1911
Eastern 1,349 1,801 1461
Greater Accra 1,197 1,160 1260
Northern 1,981 2,050 2300
Upper East 1,303 1,265 1354
Upper West 1,063 1,122 1336
Volta 1,428 1,443 1763
Western 2,015 2,039 2142
National 1,538 1,478 1611
Source: GHS
6.3 Health Status subsystem
6.3.1 Morbidity and mortality among children under fi ve
years
The pattern of the top 10 causes of morbidity is changing with malaria declining consistently over the last 5 years and acute upper respiratory infections rising consistently over the same period (Table 34). Diarrhea, anaemia and skin diseases have also seen a steady increase over the same period. The management of the potentially threatening conditions such as upper respiratory conditions diarrhea and anaemia requires the attention of service providers, stakeholders and policy makers.
state_of_the_nations_interior_new.indd 115state_of_the_nations_interior_new.indd 115 05/02/19 11.0605/02/19 11.06
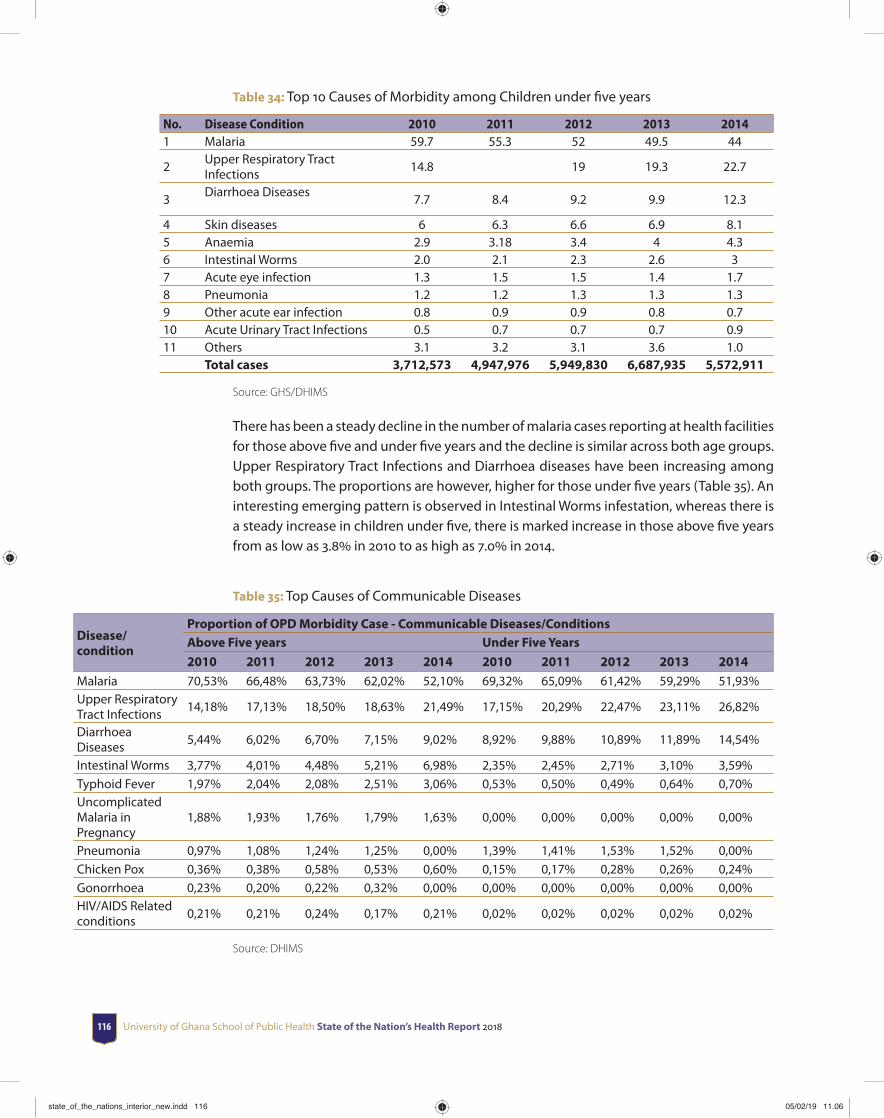
University of Ghana School of Public Health State of the Nation’s Health Report 2018116
Table 34: Top 10 Causes of Morbidity among Children under fi ve years
No. Disease Condition 2010 2011 2012 2013 20141 Malaria 59.7 55.3 52 49.5 44
2Upper Respiratory Tract Infections
14.8 19 19.3 22.7
3Diarrhoea Diseases
7.7 8.4 9.2 9.9 12.3
4 Skin diseases 6 6.3 6.6 6.9 8.15 Anaemia 2.9 3.18 3.4 4 4.36 Intestinal Worms 2.0 2.1 2.3 2.6 37 Acute eye infection 1.3 1.5 1.5 1.4 1.78 Pneumonia 1.2 1.2 1.3 1.3 1.39 Other acute ear infection 0.8 0.9 0.9 0.8 0.710 Acute Urinary Tract Infections 0.5 0.7 0.7 0.7 0.911 Others 3.1 3.2 3.1 3.6 1.0
Total cases 3,712,573 4,947,976 5,949,830 6,687,935 5,572,911
Source: GHS/DHIMS
There has been a steady decline in the number of malaria cases reporting at health facilities for those above fi ve and under fi ve years and the decline is similar across both age groups. Upper Respiratory Tract Infections and Diarrhoea diseases have been increasing among both groups. The proportions are however, higher for those under fi ve years (Table 35). An interesting emerging pattern is observed in Intestinal Worms infestation, whereas there is a steady increase in children under fi ve, there is marked increase in those above fi ve years from as low as 3.8 in 2010 to as high as 7.0 in 2014.
Table 35: Top Causes of Communicable Diseases
Disease/condition
Proportion of OPD Morbidity Case - Communicable Diseases/ConditionsAbove Five years Under Five Years
2010 2011 2012 2013 2014 2010 2011 2012 2013 2014
Malaria 70,53% 66,48% 63,73% 62,02% 52,10% 69,32% 65,09% 61,42% 59,29% 51,93%Upper Respiratory Tract Infections
14,18% 17,13% 18,50% 18,63% 21,49% 17,15% 20,29% 22,47% 23,11% 26,82%
Diarrhoea Diseases
5,44% 6,02% 6,70% 7,15% 9,02% 8,92% 9,88% 10,89% 11,89% 14,54%
Intestinal Worms 3,77% 4,01% 4,48% 5,21% 6,98% 2,35% 2,45% 2,71% 3,10% 3,59%Typhoid Fever 1,97% 2,04% 2,08% 2,51% 3,06% 0,53% 0,50% 0,49% 0,64% 0,70%Uncomplicated Malaria in Pregnancy
1,88% 1,93% 1,76% 1,79% 1,63% 0,00% 0,00% 0,00% 0,00% 0,00%
Pneumonia 0,97% 1,08% 1,24% 1,25% 0,00% 1,39% 1,41% 1,53% 1,52% 0,00%Chicken Pox 0,36% 0,38% 0,58% 0,53% 0,60% 0,15% 0,17% 0,28% 0,26% 0,24%Gonorrhoea 0,23% 0,20% 0,22% 0,32% 0,00% 0,00% 0,00% 0,00% 0,00% 0,00%HIV/AIDS Related conditions
0,21% 0,21% 0,24% 0,17% 0,21% 0,02% 0,02% 0,02% 0,02% 0,02%
Source: DHIMS
state_of_the_nations_interior_new.indd 116state_of_the_nations_interior_new.indd 116 05/02/19 11.0605/02/19 11.06
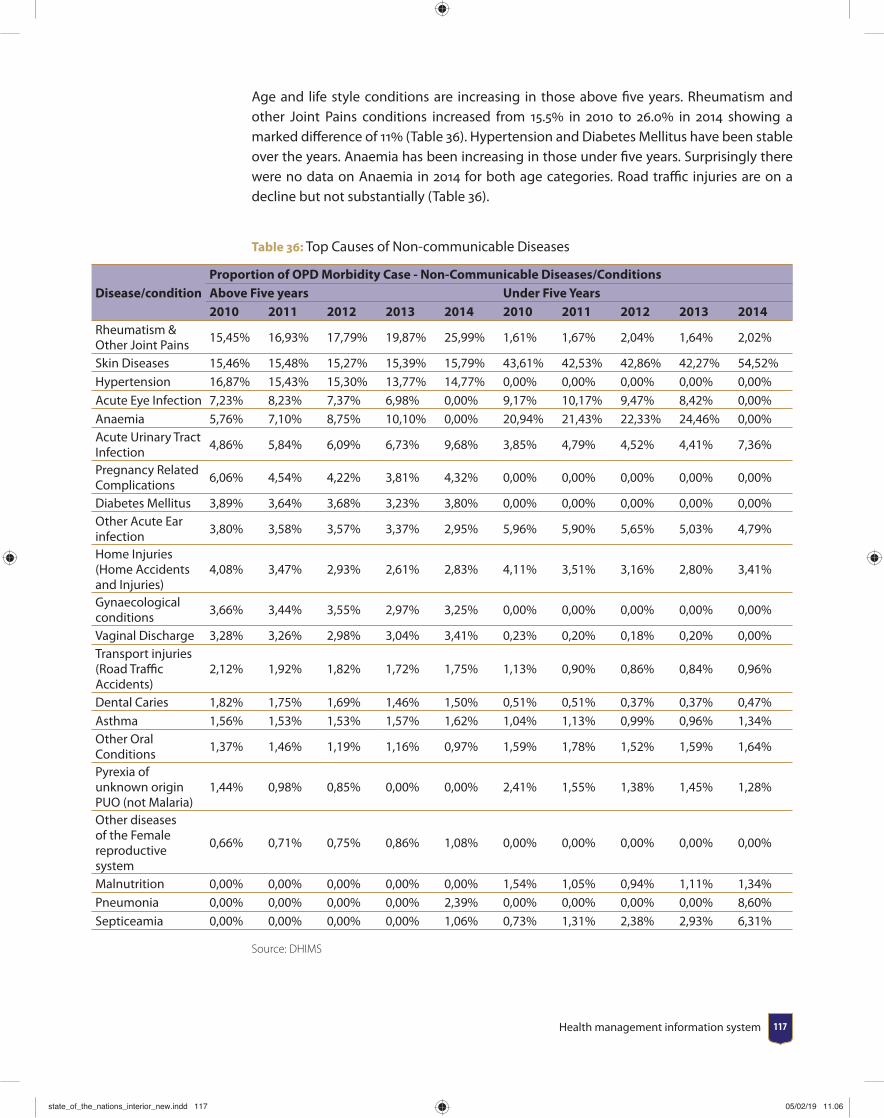
Health management information system 117
Age and life style conditions are increasing in those above fi ve years. Rheumatism and other Joint Pains conditions increased from 15.5 in 2010 to 26.0 in 2014 showing a marked diff erence of 11 (Table 36). Hypertension and Diabetes Mellitus have been stable over the years. Anaemia has been increasing in those under fi ve years. Surprisingly there were no data on Anaemia in 2014 for both age categories. Road traffi c injuries are on a decline but not substantially (Table 36).
Table 36: Top Causes of Non-communicable Diseases
Disease/conditionProportion of OPD Morbidity Case - Non-Communicable Diseases/ConditionsAbove Five years Under Five Years2010 2011 2012 2013 2014 2010 2011 2012 2013 2014
Rheumatism & Other Joint Pains
15,45% 16,93% 17,79% 19,87% 25,99% 1,61% 1,67% 2,04% 1,64% 2,02%
Skin Diseases 15,46% 15,48% 15,27% 15,39% 15,79% 43,61% 42,53% 42,86% 42,27% 54,52%Hypertension 16,87% 15,43% 15,30% 13,77% 14,77% 0,00% 0,00% 0,00% 0,00% 0,00%Acute Eye Infection 7,23% 8,23% 7,37% 6,98% 0,00% 9,17% 10,17% 9,47% 8,42% 0,00%Anaemia 5,76% 7,10% 8,75% 10,10% 0,00% 20,94% 21,43% 22,33% 24,46% 0,00%Acute Urinary Tract Infection
4,86% 5,84% 6,09% 6,73% 9,68% 3,85% 4,79% 4,52% 4,41% 7,36%
Pregnancy Related Complications
6,06% 4,54% 4,22% 3,81% 4,32% 0,00% 0,00% 0,00% 0,00% 0,00%
Diabetes Mellitus 3,89% 3,64% 3,68% 3,23% 3,80% 0,00% 0,00% 0,00% 0,00% 0,00%Other Acute Ear infection
3,80% 3,58% 3,57% 3,37% 2,95% 5,96% 5,90% 5,65% 5,03% 4,79%
Home Injuries (Home Accidents and Injuries)
4,08% 3,47% 2,93% 2,61% 2,83% 4,11% 3,51% 3,16% 2,80% 3,41%
Gynaecological conditions
3,66% 3,44% 3,55% 2,97% 3,25% 0,00% 0,00% 0,00% 0,00% 0,00%
Vaginal Discharge 3,28% 3,26% 2,98% 3,04% 3,41% 0,23% 0,20% 0,18% 0,20% 0,00%Transport injuries (Road Traffi c Accidents)
2,12% 1,92% 1,82% 1,72% 1,75% 1,13% 0,90% 0,86% 0,84% 0,96%
Dental Caries 1,82% 1,75% 1,69% 1,46% 1,50% 0,51% 0,51% 0,37% 0,37% 0,47%Asthma 1,56% 1,53% 1,53% 1,57% 1,62% 1,04% 1,13% 0,99% 0,96% 1,34%Other Oral Conditions
1,37% 1,46% 1,19% 1,16% 0,97% 1,59% 1,78% 1,52% 1,59% 1,64%
Pyrexia of unknown origin PUO (not Malaria)
1,44% 0,98% 0,85% 0,00% 0,00% 2,41% 1,55% 1,38% 1,45% 1,28%
Other diseases of the Female reproductive system
0,66% 0,71% 0,75% 0,86% 1,08% 0,00% 0,00% 0,00% 0,00% 0,00%
Malnutrition 0,00% 0,00% 0,00% 0,00% 0,00% 1,54% 1,05% 0,94% 1,11% 1,34%Pneumonia 0,00% 0,00% 0,00% 0,00% 2,39% 0,00% 0,00% 0,00% 0,00% 8,60%Septiceamia 0,00% 0,00% 0,00% 0,00% 1,06% 0,73% 1,31% 2,38% 2,93% 6,31%
Source: DHIMS
state_of_the_nations_interior_new.indd 117state_of_the_nations_interior_new.indd 117 05/02/19 11.0605/02/19 11.06
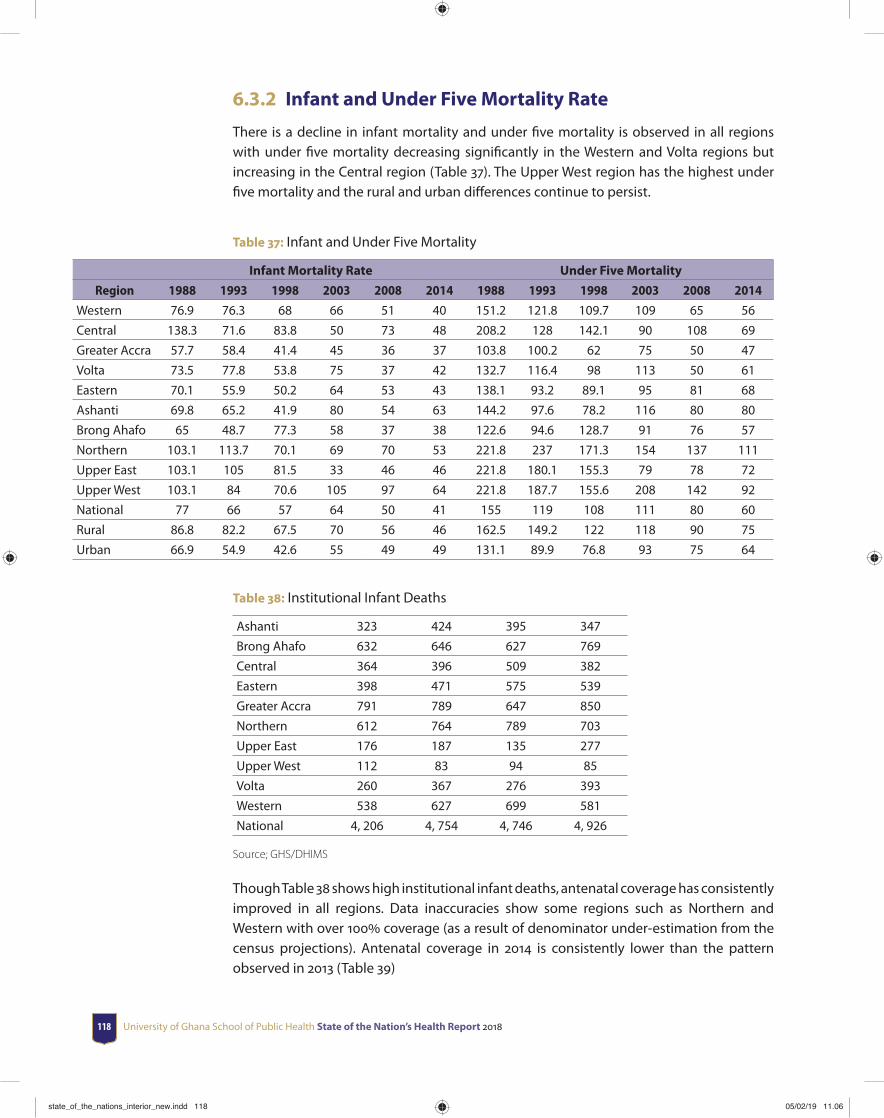
University of Ghana School of Public Health State of the Nation’s Health Report 2018118
6.3.2 Infant and Under Five Mortality Rate
There is a decline in infant mortality and under fi ve mortality is observed in all regions with under fi ve mortality decreasing signifi cantly in the Western and Volta regions but increasing in the Central region (Table 37). The Upper West region has the highest under fi ve mortality and the rural and urban diff erences continue to persist.
Table 37: Infant and Under Five Mortality
Infant Mortality Rate Under Five Mortality
Region 1988 1993 1998 2003 2008 2014 1988 1993 1998 2003 2008 2014
Western 76.9 76.3 68 66 51 40 151.2 121.8 109.7 109 65 56
Central 138.3 71.6 83.8 50 73 48 208.2 128 142.1 90 108 69
Greater Accra 57.7 58.4 41.4 45 36 37 103.8 100.2 62 75 50 47
Volta 73.5 77.8 53.8 75 37 42 132.7 116.4 98 113 50 61
Eastern 70.1 55.9 50.2 64 53 43 138.1 93.2 89.1 95 81 68
Ashanti 69.8 65.2 41.9 80 54 63 144.2 97.6 78.2 116 80 80
Brong Ahafo 65 48.7 77.3 58 37 38 122.6 94.6 128.7 91 76 57
Northern 103.1 113.7 70.1 69 70 53 221.8 237 171.3 154 137 111
Upper East 103.1 105 81.5 33 46 46 221.8 180.1 155.3 79 78 72
Upper West 103.1 84 70.6 105 97 64 221.8 187.7 155.6 208 142 92
National 77 66 57 64 50 41 155 119 108 111 80 60
Rural 86.8 82.2 67.5 70 56 46 162.5 149.2 122 118 90 75
Urban 66.9 54.9 42.6 55 49 49 131.1 89.9 76.8 93 75 64
Table 38: Institutional Infant Deaths
Ashanti 323 424 395 347
Brong Ahafo 632 646 627 769
Central 364 396 509 382
Eastern 398 471 575 539
Greater Accra 791 789 647 850
Northern 612 764 789 703
Upper East 176 187 135 277
Upper West 112 83 94 85
Volta 260 367 276 393
Western 538 627 699 581
National 4, 206 4, 754 4, 746 4, 926
Source; GHS/DHIMS
Though Table 38 shows high institutional infant deaths, antenatal coverage has consistently improved in all regions. Data inaccuracies show some regions such as Northern and Western with over 100 coverage (as a result of denominator under-estimation from the census projections). Antenatal coverage in 2014 is consistently lower than the pattern observed in 2013 (Table 39)
state_of_the_nations_interior_new.indd 118state_of_the_nations_interior_new.indd 118 05/02/19 11.0605/02/19 11.06
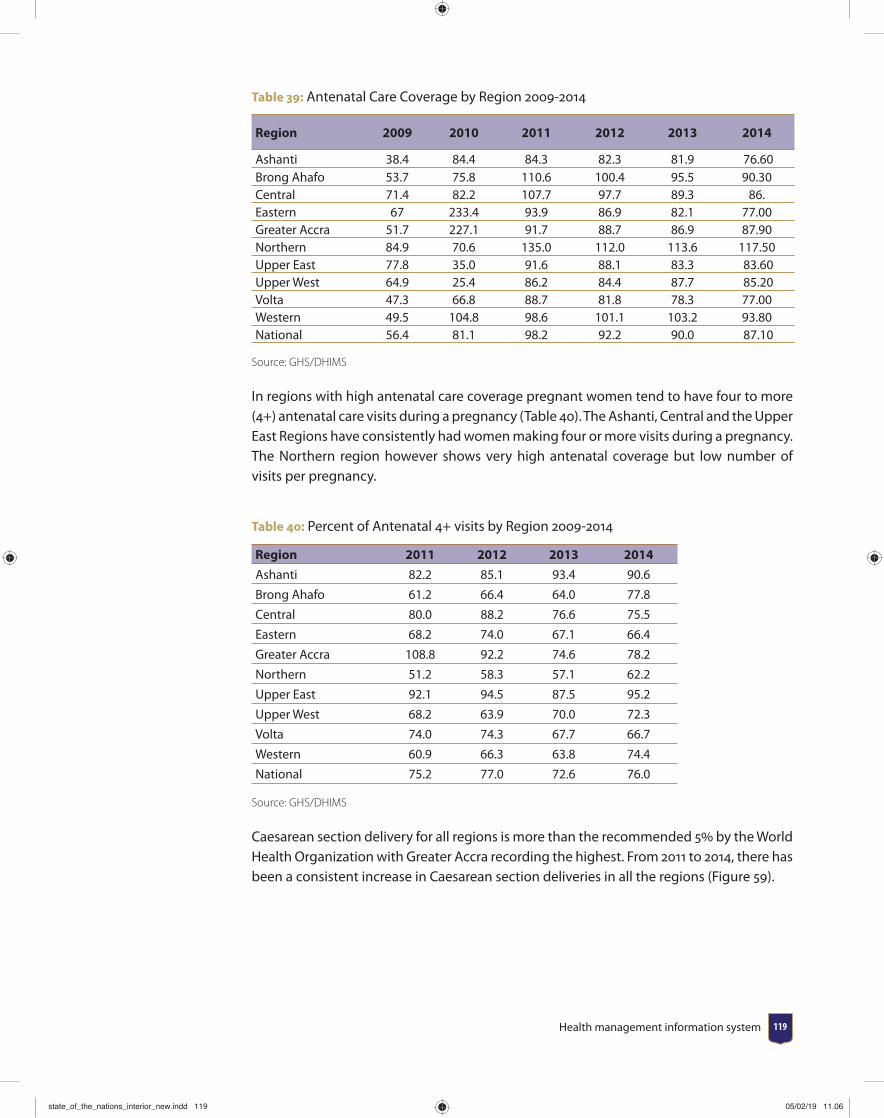
Health management information system 119
Table 39: Antenatal Care Coverage by Region 2009-2014
Region 2009 2010 2011 2012 2013 2014
Ashanti 38.4 84.4 84.3 82.3 81.9 76.60 Brong Ahafo 53.7 75.8 110.6 100.4 95.5 90.30 Central 71.4 82.2 107.7 97.7 89.3 86.Eastern 67 233.4 93.9 86.9 82.1 77.00 Greater Accra 51.7 227.1 91.7 88.7 86.9 87.90 Northern 84.9 70.6 135.0 112.0 113.6 117.50 Upper East 77.8 35.0 91.6 88.1 83.3 83.60 Upper West 64.9 25.4 86.2 84.4 87.7 85.20 Volta 47.3 66.8 88.7 81.8 78.3 77.00 Western 49.5 104.8 98.6 101.1 103.2 93.80 National 56.4 81.1 98.2 92.2 90.0 87.10
Source: GHS/DHIMS
In regions with high antenatal care coverage pregnant women tend to have four to more (4+) antenatal care visits during a pregnancy (Table 40). The Ashanti, Central and the Upper East Regions have consistently had women making four or more visits during a pregnancy. The Northern region however shows very high antenatal coverage but low number of visits per pregnancy.
Table 40: Percent of Antenatal 4+ visits by Region 2009-2014
Region 2011 2012 2013 2014
Ashanti 82.2 85.1 93.4 90.6
Brong Ahafo 61.2 66.4 64.0 77.8
Central 80.0 88.2 76.6 75.5
Eastern 68.2 74.0 67.1 66.4
Greater Accra 108.8 92.2 74.6 78.2
Northern 51.2 58.3 57.1 62.2
Upper East 92.1 94.5 87.5 95.2
Upper West 68.2 63.9 70.0 72.3
Volta 74.0 74.3 67.7 66.7
Western 60.9 66.3 63.8 74.4
National 75.2 77.0 72.6 76.0
Source: GHS/DHIMS
Caesarean section delivery for all regions is more than the recommended 5 by the World Health Organization with Greater Accra recording the highest. From 2011 to 2014, there has been a consistent increase in Caesarean section deliveries in all the regions (Figure 59).
state_of_the_nations_interior_new.indd 119state_of_the_nations_interior_new.indd 119 05/02/19 11.0605/02/19 11.06
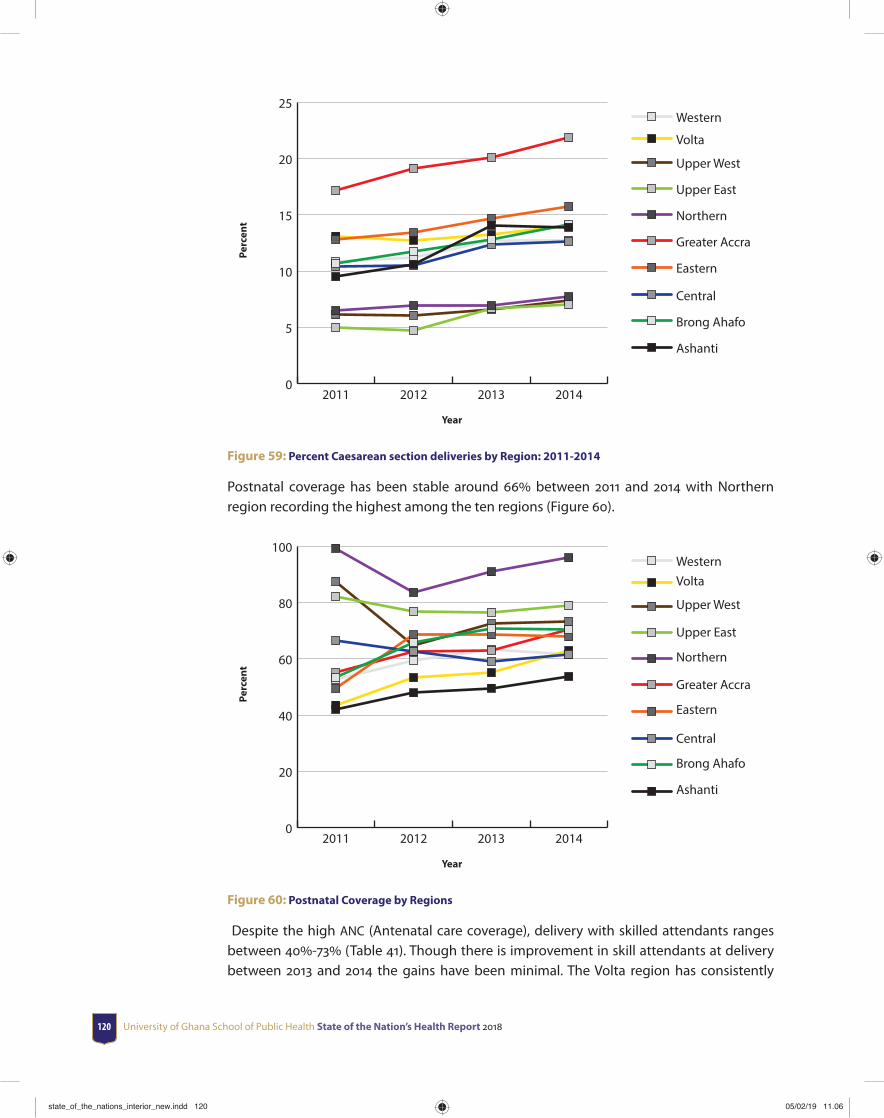
University of Ghana School of Public Health State of the Nation’s Health Report 2018120
0
5
10
15
20
25Western
Volta
Upper West
Upper East
Northern
Greater Accra
Eastern
Central
Brong Ahafo
Ashanti
2014201320122011
Perc
ent
Year
Figure 59: Percent Caesarean section deliveries by Region: 2011-2014
Postnatal coverage has been stable around 66 between 2011 and 2014 with Northern region recording the highest among the ten regions (Figure 60).
0
20
40
60
80
100WesternVolta
Upper West
Upper East
Northern
Greater Accra
Eastern
Central
Brong Ahafo
Ashanti
2014201320122011
Perc
ent
Year
Figure 60: Postnatal Coverage by Regions
Despite the high ANC (Antenatal care coverage), delivery with skilled attendants ranges between 40-73 (Table 41). Though there is improvement in skill attendants at delivery between 2013 and 2014 the gains have been minimal. The Volta region has consistently
state_of_the_nations_interior_new.indd 120state_of_the_nations_interior_new.indd 120 05/02/19 11.0605/02/19 11.06
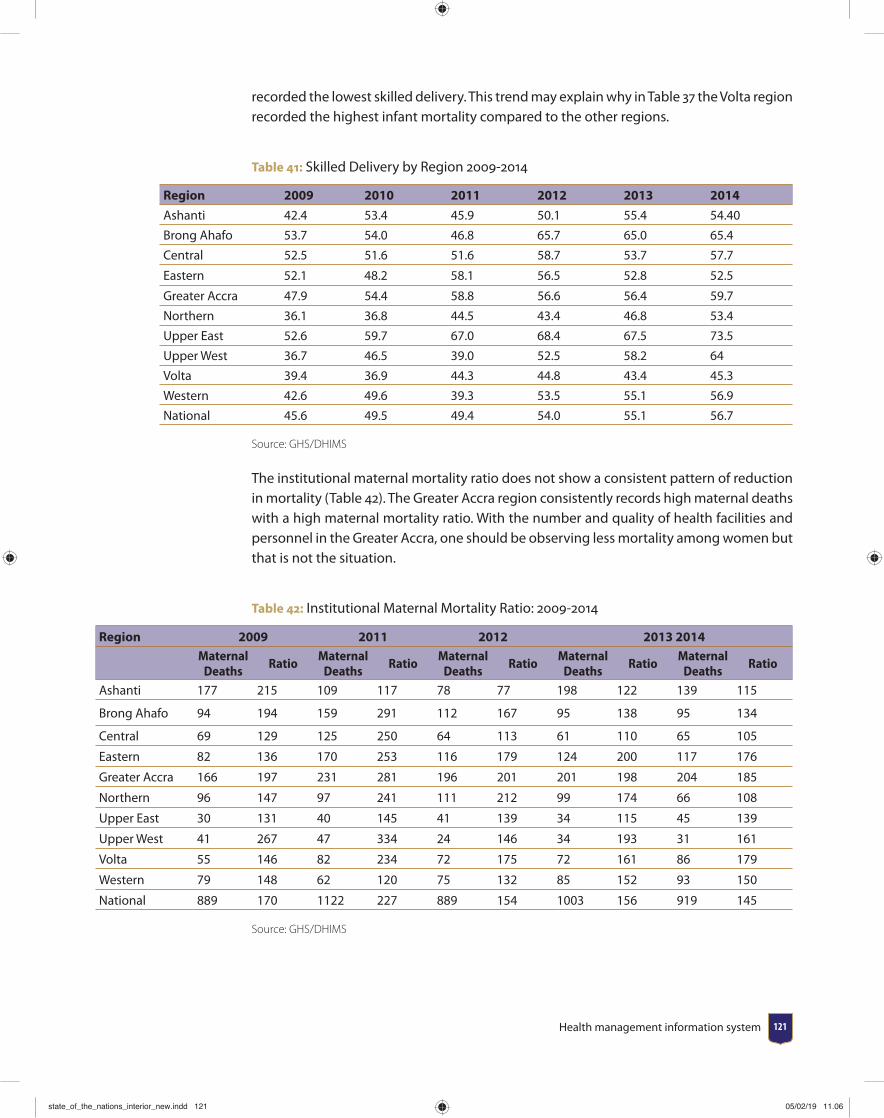
Health management information system 121
recorded the lowest skilled delivery. This trend may explain why in Table 37 the Volta region recorded the highest infant mortality compared to the other regions.
Table 41: Skilled Delivery by Region 2009-2014
Region 2009 2010 2011 2012 2013 2014
Ashanti 42.4 53.4 45.9 50.1 55.4 54.40
Brong Ahafo 53.7 54.0 46.8 65.7 65.0 65.4
Central 52.5 51.6 51.6 58.7 53.7 57.7
Eastern 52.1 48.2 58.1 56.5 52.8 52.5
Greater Accra 47.9 54.4 58.8 56.6 56.4 59.7
Northern 36.1 36.8 44.5 43.4 46.8 53.4
Upper East 52.6 59.7 67.0 68.4 67.5 73.5
Upper West 36.7 46.5 39.0 52.5 58.2 64
Volta 39.4 36.9 44.3 44.8 43.4 45.3
Western 42.6 49.6 39.3 53.5 55.1 56.9
National 45.6 49.5 49.4 54.0 55.1 56.7
Source: GHS/DHIMS
The institutional maternal mortality ratio does not show a consistent pattern of reduction in mortality (Table 42). The Greater Accra region consistently records high maternal deaths with a high maternal mortality ratio. With the number and quality of health facilities and personnel in the Greater Accra, one should be observing less mortality among women but that is not the situation.
Table 42: Institutional Maternal Mortality Ratio: 2009-2014
Region 2009 2011 2012 2013 2014Maternal
DeathsRatio
Maternal Deaths
RatioMaternal
DeathsRatio
Maternal Deaths
RatioMaternal
DeathsRatio
Ashanti 177 215 109 117 78 77 198 122 139 115
Brong Ahafo 94 194 159 291 112 167 95 138 95 134
Central 69 129 125 250 64 113 61 110 65 105
Eastern 82 136 170 253 116 179 124 200 117 176
Greater Accra 166 197 231 281 196 201 201 198 204 185
Northern 96 147 97 241 111 212 99 174 66 108
Upper East 30 131 40 145 41 139 34 115 45 139
Upper West 41 267 47 334 24 146 34 193 31 161
Volta 55 146 82 234 72 175 72 161 86 179
Western 79 148 62 120 75 132 85 152 93 150
National 889 170 1122 227 889 154 1003 156 919 145
Source: GHS/DHIMS
state_of_the_nations_interior_new.indd 121state_of_the_nations_interior_new.indd 121 05/02/19 11.0605/02/19 11.06
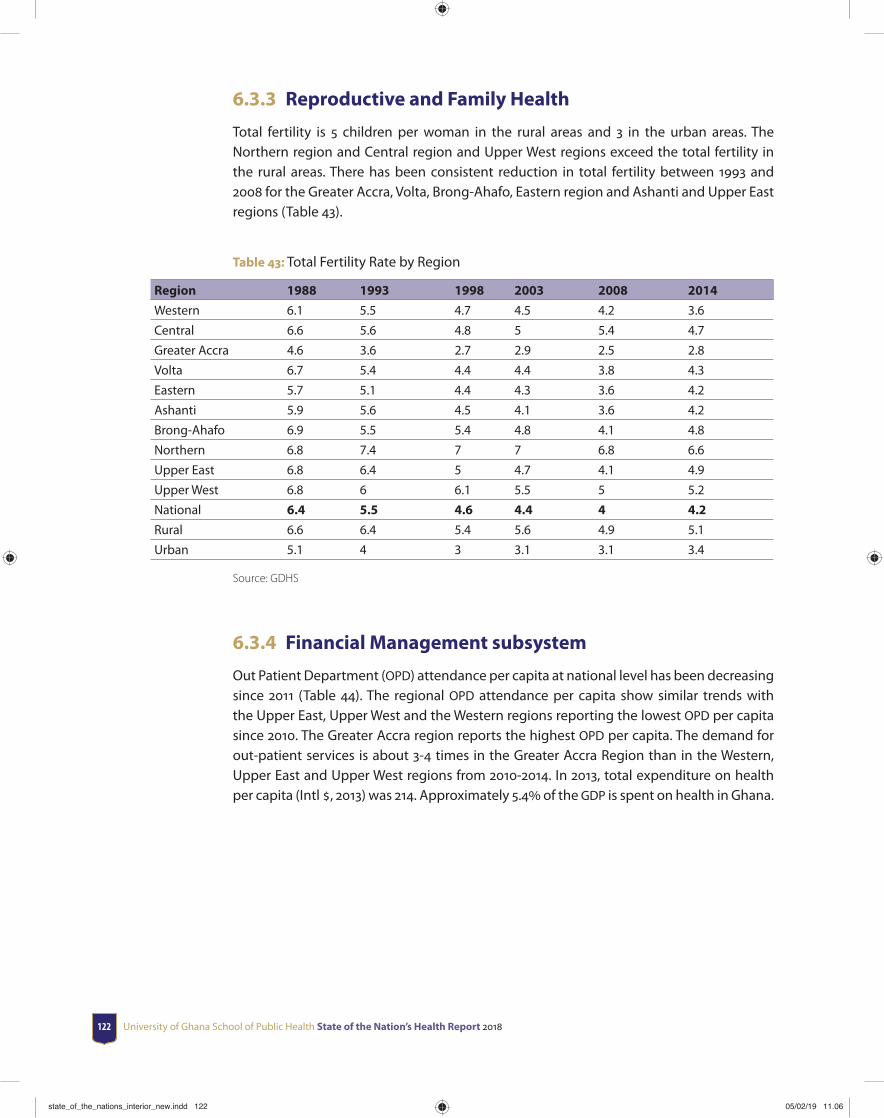
University of Ghana School of Public Health State of the Nation’s Health Report 2018122
6.3.3 Reproductive and Family Health
Total fertility is 5 children per woman in the rural areas and 3 in the urban areas. The Northern region and Central region and Upper West regions exceed the total fertility in the rural areas. There has been consistent reduction in total fertility between 1993 and 2008 for the Greater Accra, Volta, Brong-Ahafo, Eastern region and Ashanti and Upper East regions (Table 43).
Table 43: Total Fertility Rate by Region
Region 1988 1993 1998 2003 2008 2014
Western 6.1 5.5 4.7 4.5 4.2 3.6
Central 6.6 5.6 4.8 5 5.4 4.7
Greater Accra 4.6 3.6 2.7 2.9 2.5 2.8
Volta 6.7 5.4 4.4 4.4 3.8 4.3
Eastern 5.7 5.1 4.4 4.3 3.6 4.2
Ashanti 5.9 5.6 4.5 4.1 3.6 4.2
Brong-Ahafo 6.9 5.5 5.4 4.8 4.1 4.8
Northern 6.8 7.4 7 7 6.8 6.6
Upper East 6.8 6.4 5 4.7 4.1 4.9
Upper West 6.8 6 6.1 5.5 5 5.2
National 6.4 5.5 4.6 4.4 4 4.2
Rural 6.6 6.4 5.4 5.6 4.9 5.1
Urban 5.1 4 3 3.1 3.1 3.4
Source: GDHS
6.3.4 Financial Management subsystem
Out Patient Department (OPD) attendance per capita at national level has been decreasing since 2011 (Table 44). The regional OPD attendance per capita show similar trends with the Upper East, Upper West and the Western regions reporting the lowest OPD per capita since 2010. The Greater Accra region reports the highest OPD per capita. The demand for out-patient services is about 3-4 times in the Greater Accra Region than in the Western, Upper East and Upper West regions from 2010-2014. In 2013, total expenditure on health per capita (Intl , 2013) was 214. Approximately 5.4 of the GDP is spent on health in Ghana.
state_of_the_nations_interior_new.indd 122state_of_the_nations_interior_new.indd 122 05/02/19 11.0605/02/19 11.06

Health management information system 123
Tab
le 4
4: O
PD p
er C
apita
for T
otal
OPD
Cas
es 2
010-
2014
Reg
ion
20
1020
1120
1220
1320
14
Regi
on
Tota
l OPD
Vi
sits
OPD
per
Ca
pita
Tota
l OPD
Vi
sits
OPD
per
Ca
pita
Tota
l OPD
Vi
sits
O
PD p
er
Capi
taTo
tal O
PD
Visi
ts
OPD
per
Ca
pita
Tota
l OPD
Vi
sits
O
PD p
er
Capi
ta
Ash
anti
4,44
4,38
91.
085,
503,
778
0.93
4,78
6,81
91.
064,
682,
843
1.10
4,86
3,60
71.
09
Bron
g A
hafo
2,57
1,10
00.
903,
057,
688
0.80
3,49
6,02
80.
693,
613,
338
0.68
3,89
5,85
50.
65
Cen
tral
1,58
3,86
11.
391,
940,
722
1.04
2,26
3,75
01.
062,
476,
596
1.00
2,78
1,58
30.
65
East
ern
1,34
3,10
61.
961,
602,
972
1.64
2,06
1,82
31.
301,
995,
292
1.40
1,99
6,83
31.
48G
reat
er
Acc
ra1,
824,
979
2.20
2,09
7,65
82.
012,
802,
946
1.54
2,83
8,81
61.
552,
728,
936
1.66
Nor
ther
n1,
374,
870
1.80
1,54
6,62
11.
351,
845,
284
1.54
2,10
9,97
61.
362,
204,
674
1.26
Up
per
Eas
t2,
139,
118
0.49
2,50
3,77
80.
403,
376,
668
0.32
31,3
3,30
50.
3530
,458
,26
0.36
Up
per
Wes
t1,
488,
208
0.47
1,97
2,59
30.
272,
530,
328
0.29
2534
046
0.28
2458
727
0.31
Volt
a1,
659,
565
1.28
1,89
1,14
01.
342,
331,
113
0.96
2562
932
0.89
2668
761
0.88
Wes
tern
3,02
6,21
90.
793,
540,
035
0.78
4,00
2,53
40.
6641
9453
90.
6044
1898
60.
61
Nat
iona
l 21
,455
,415
1.15
25,6
56,9
850.
9929
,497
,293
0.90
3014
1683
0.89
3106
3788
0.89
state_of_the_nations_interior_new.indd 123state_of_the_nations_interior_new.indd 123 05/02/19 11.0605/02/19 11.06
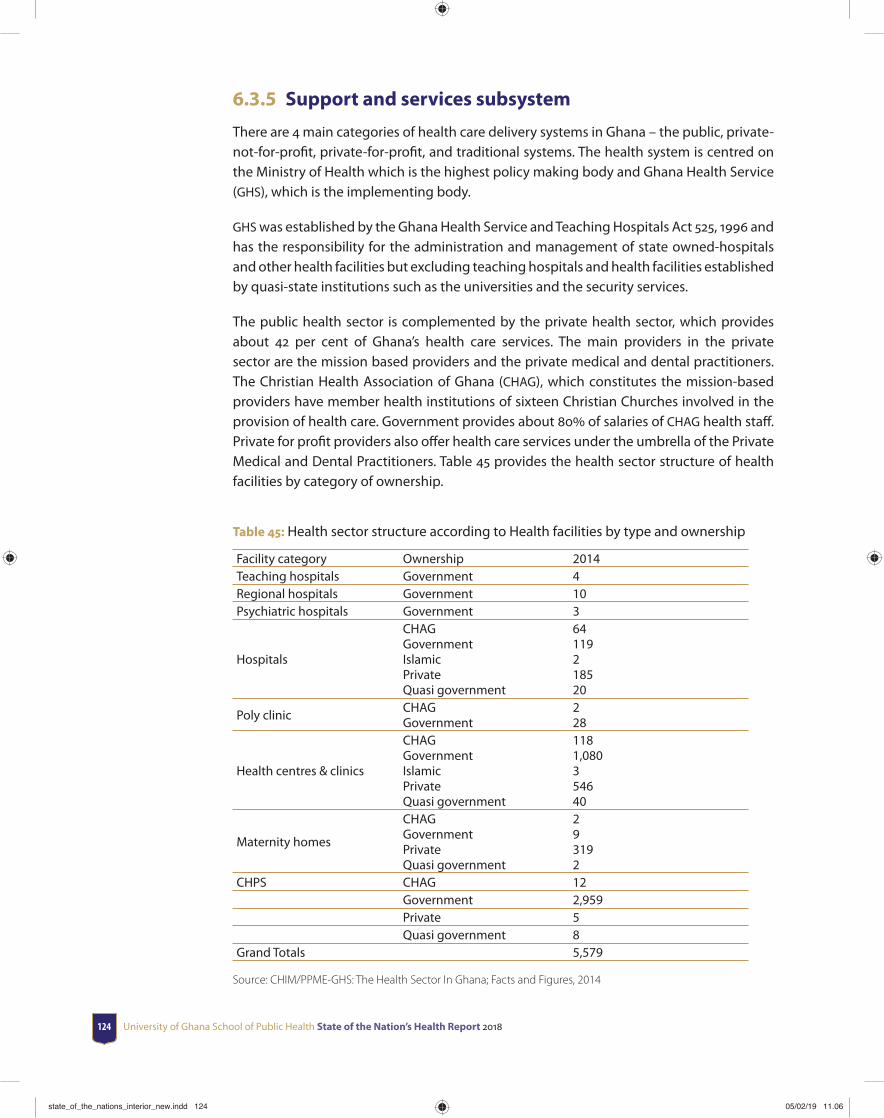
University of Ghana School of Public Health State of the Nation’s Health Report 2018124
6.3.5 Support and services subsystem
There are 4 main categories of health care delivery systems in Ghana – the public, private-not-for-profi t, private-for-profi t, and traditional systems. The health system is centred on the Ministry of Health which is the highest policy making body and Ghana Health Service (GHS), which is the implementing body.
GHS was established by the Ghana Health Service and Teaching Hospitals Act 525, 1996 and has the responsibility for the administration and management of state owned-hospitals and other health facilities but excluding teaching hospitals and health facilities established by quasi-state institutions such as the universities and the security services.
The public health sector is complemented by the private health sector, which provides about 42 per cent of Ghana’s health care services. The main providers in the private sector are the mission based providers and the private medical and dental practitioners. The Christian Health Association of Ghana (CHAG), which constitutes the mission-based providers have member health institutions of sixteen Christian Churches involved in the provision of health care. Government provides about 80 of salaries of CHAG health staff . Private for profi t providers also off er health care services under the umbrella of the Private Medical and Dental Practitioners. Table 45 provides the health sector structure of health facilities by category of ownership.
Table 45: Health sector structure according to Health facilities by type and ownership
Facility category Ownership 2014Teaching hospitals Government 4Regional hospitals Government 10Psychiatric hospitals Government 3
Hospitals
CHAGGovernmentIslamicPrivateQuasi government
64119218520
Poly clinicCHAGGovernment
228
Health centres & clinics
CHAGGovernmentIslamicPrivateQuasi government
1181,080354640
Maternity homes
CHAGGovernmentPrivateQuasi government
293192
CHPS CHAG 12Government 2,959Private 5Quasi government 8
Grand Totals 5,579
Source: CHIM/PPME-GHS: The Health Sector In Ghana; Facts and Figures, 2014
state_of_the_nations_interior_new.indd 124state_of_the_nations_interior_new.indd 124 05/02/19 11.0605/02/19 11.06
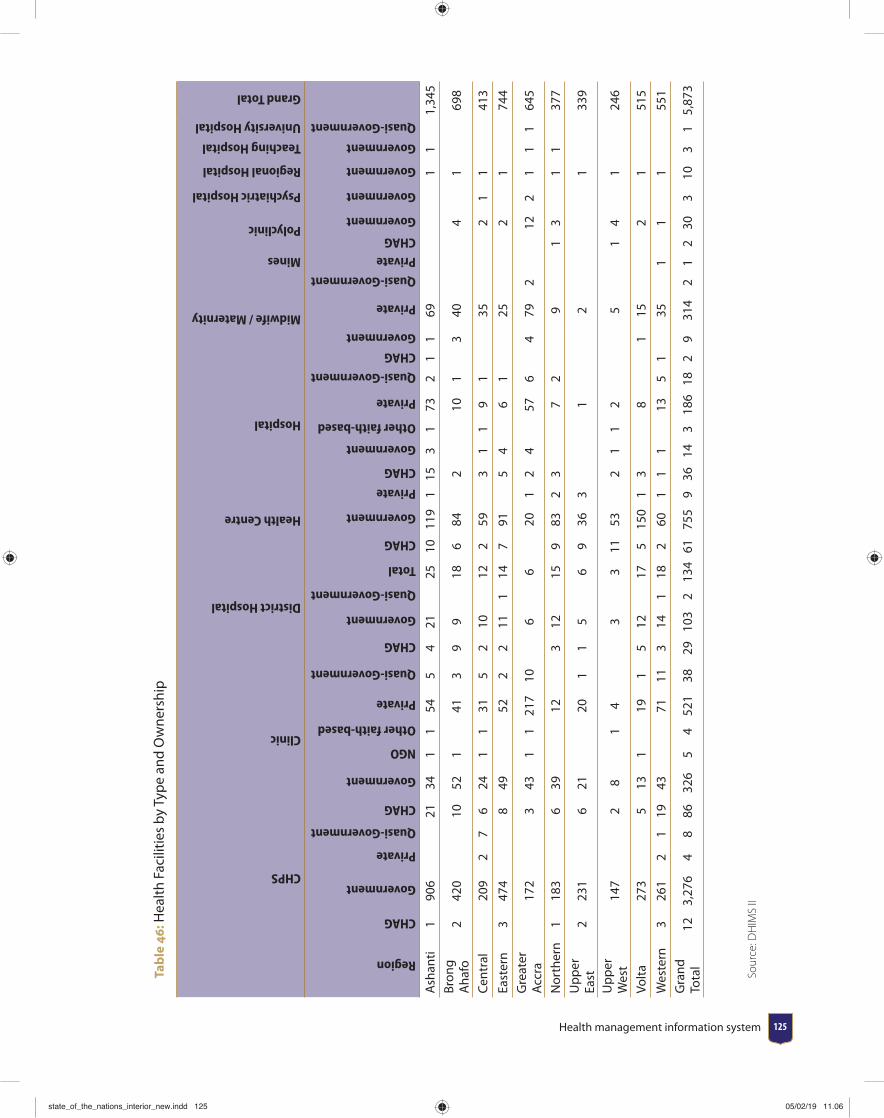
Health management information system 125
Tab
le 4
6: H
ealt
h Fa
cilit
ies
by T
ype
and
Ow
ners
hip
CHPS
Clinic
District Hospital
Health Centre
Hospital
Midwife / Maternity
Mines
Polyclinic
Psychiatric Hospital
Regional Hospital
Teaching Hospital
University Hospital
Grand Total
Region
CHAG
Government
Private
Quasi-Government
CHAG
Government
NGO
Other faith-based
Private
Quasi-Government
CHAG
Government
Quasi-Government
Total
CHAG
Government
Private
CHAG
Government
Other faith-based
Private
Quasi-Government
CHAG
Government
Private
Quasi-Government
Private
CHAG
Government
Government
Government
Government
Quasi-Government
Ash
anti
190
621
341
154
54
2125
1011
91
153
173
21
169
11
1,34
5 Br
ong
Aha
fo2
420
1052
141
39
918
684
210
13
404
169
8
Cen
tral
209
27
624
11
315
210
122
593
11
91
352
11
413
East
ern
347
48
4952
22
111
147
915
46
125
21
744
Gre
ater
A
ccra
172
343
11
217
106
620
12
457
64
792
122
11
164
5
Nor
ther
n1
183
639
123
1215
983
23
72
91
31
137
7 U
pp
er
East
223
16
2120
11
56
936
31
21
339
Up
per
W
est
147
28
14
33
1153
21
12
51
41
246
Volt
a27
35
131
191
512
175
150
13
81
152
151
5
Wes
tern
326
12
119
4371
113
141
182
601
11
135
135
11
155
1 G
rand
To
tal
123,
276
48
8632
65
452
138
2910
32
134
6175
59
3614
318
618
29
314
21
230
310
31
5,87
3
Sour
ce: D
HIM
S II
state_of_the_nations_interior_new.indd 125state_of_the_nations_interior_new.indd 125 05/02/19 11.0605/02/19 11.06

University of Ghana School of Public Health State of the Nation’s Health Report 2018126
The
DH
IMs
data
bas
e an
d fa
cilit
ies
rep
ortin
g to
the
DH
IMs
are
to fa
cilit
ate
deci
sion
mak
ing
by p
rovi
ding
tim
ely
and
accu
rate
dat
a. T
he p
rop
ortio
n of
faci
litie
s re
por
ting
to t
he D
HIM
s w
as a
s lo
w a
s 27
in
201
2 an
d in
crea
se s
harp
ly t
o 70
in
201
4. T
he t
imel
ines
s of
rep
ortin
g of
rep
ortin
g is
as
hig
h as
83
with
a ra
nge
54-8
3. T
hus
it ap
pea
rs a
s m
ore
faci
litie
s re
por
t to
the
DH
IMs
timel
ines
s im
pro
ves
and
thus
the
data
can
be
used
to
info
rm d
ecis
ion
mak
ing
(Tab
le 4
7).
Tab
le 4
7: T
rend
in H
ealt
h Fa
cilit
y Re
por
ting
and
Tim
elin
ess
to D
HIM
S by
Reg
ion
Reg
ion
2010
2011
2012
2013
2014
Expected reports
Reporting Rate
Timeliness
Expected reports
Reporting Rate
Timeliness
Expected reports
Reporting Rate
Timeliness
Expected reports
Reporting Rate
Timeliness
Expected reports
Reporting Rate
Timeliness
Ash
anti
134,
883
10.2
90.
0413
4,88
311
.31
0.10
134,
883
37.7
525
.43
134,
883
51.3
847
.713
4,88
380
.854
.8Br
ong
Aha
fo99
,971
9.09
0.07
84,8
994.
420.
1996
,631
45.3
836
.31
98,4
1158
.98
65.0
898
,651
74.5
074
.03
East
ern
125,
980
4.22
0.00
125,
548
5.49
0.01
132,
232
56.7
043
.99
125,
212
68.7
370
.41
125,
944
81.9
487
.64
Cen
tral
95,7
618.
920.
0195
,761
10.0
40.
0295
,833
44.9
129
.02
95,8
3361
.69
56.2
596
,108
76.0
773
.19
Nor
ther
n71
,796
12.7
90.
0171
,796
13.1
70.
0171
,796
38.8
032
.09
71,7
9659
.93
52.5
371
,796
69.6
968
.76
Up
per
Eas
t61
,744
13.4
00.
0061
,744
16.2
40.
0061
,744
43.6
343
.26
61,7
4463
.73
63.0
261
,744
78.9
085
.74
Up
per
Wes
t61
,797
12.2
30.
0061
,797
13.1
70.
0261
,797
50.9
335
,01
61,7
9762
.00
69.4
061
,797
73.8
578
.74
Wes
tern
97,6
5015
.88
0.04
97,6
5016
.18
0.04
97,6
5045
.09
27.6
297
,650
62.5
956
.89
97,6
5078
.78
66.0
1Vo
lta
92,7
9114
.24
0.00
92,7
9117
.00
0.02
92,7
9140
.81
33.5
392
,791
58.9
465
.24
92,7
9177
.74
74.1
0G
reat
er A
ccra
59,1
578.
630.
0259
,157
12,3
20.
1659
,157
40.4
127
.89
59,1
5759
.68
57.2
759
,157
83.5
683
.25
Nat
iona
l 9
01,5
30
10.6
10.
02 8
86,0
26
11.5
10.
05 9
04,5
14
44.7
633
.96
899
,274
60
.53
60.5
0 9
00,5
21
77.9
273
.48
Sour
ce: D
HIM
S II
state_of_the_nations_interior_new.indd 126state_of_the_nations_interior_new.indd 126 05/02/19 11.0605/02/19 11.06
Health management information system 127
6.4 Summary and Conclusion The Data Information and Management systems provide a structure for monitoring and measuring service delivery outcomes at the health facility level. The data from the health facilities provide comprehensive information about clinical and preventive services, infrastructure and fi nancial information that may be used to improve the health of the nation. The morbidity data show a declining trend for malaria but a rising trend for acute respiratory infections, anaemia and diarrhea which could be used to design interventions to manage these diseases. In comparing antenatal care visits with coverage and skilled delivery, one observes that districts with high ANC coverage have four or more visits and women are more likely to deliver with a skilled birth attendant.
The health facility level provides rich data that can be used to measure health service utilisation and to monitor the quality of care for the top ten causes of diseases.
There are gaps in the data collected especially for 2010 where most of the data is not available and for the indicators that are available. In calculating the indicators for measuring health coverage and impact of interventions, some denominators are sometimes inaccurate giving rise to unrealistic achievements or proportions in some instance. There is therefore the need to standard the information that is used to compute such indicators.
Although the data management and information system has six subsystems data on human resource, support services, fi nance and supply chain and drug supplies, they are not reported through the DHIMs and thus makes the data management and information systems reporting incomplete. If the DHIMs will have to be the main tool for making decisions, then every subsystem will have to provide the required information. For example where maternal deaths are on the increase, it would be appropriate to know the number of personnel with the required skill, those in training and on leave or due for retirement to enable redistribution or training of new personnel to fi ll in the gaps. Since the fi nancial information is not reported through the DHIMs one is unable to understand if the facilities do have the resources to deliver the services appropriately. It is therefore recommended that fi nancial reports of districts be integrated into DHIMS to enable users align activities with cost elements in the health system.
state_of_the_nations_interior_new.indd 127state_of_the_nations_interior_new.indd 127 05/02/19 11.0605/02/19 11.06

University of Ghana School of Public Health State of the Nation’s Health Report 2018128
CHAPTER 7Leadership and governance
7.1 IntroductionGood leadership and governance mechanisms are very much linked to the health status of a country’s population. Health leadership and governance relate to the stewardship function within the health system. The leadership and governance role involves overseeing and guiding the whole of a country’s health system, including the public, private and missionary health facilities, in order to promote and improve health outcomes. Leadership and governance in the health system requires political and technical action, since it involves harmonizing varied and competing demands for limited national resources, especially during very challenging times.
In low-middle income countries (LMIC), the right to health is gaining momentum, as there are increased demands and expectations for governments to provide more decentralized but comprehensive package of health services. Although there is arguably no universally accepted blueprint for an eff ective leadership and governance in health systems, the ultimate responsibility of health systems’ leadership and governance lies on government. However, this expected responsibility of the government for the nation’s health does not mean that all the leadership and governance functions of the health system must be carried out by the established agencies of government such as the Ministries of Health. There are established legislations that regulate the leadership and governance in the health sector.
state_of_the_nations_interior_new.indd 128state_of_the_nations_interior_new.indd 128 05/02/19 11.0605/02/19 11.06
Leadership and governance 129
7.2 Legal frameworks of health sector leadership and governance in Ghana
The organization, management and operations of the health sector in Ghana are governed by parliamentary legislations. These laws govern the operations of certain aspects of health delivery. Legislations governing the health sector have a long history predating independence. Nonetheless, over the years, some of these laws have been revised to conform to the complexities of today’s health system. Some of the laws that currently govern the operations of the health sector include, but not limited to:
1. The Ghana Health Services and Teaching Hospitals Act 525, 1996 revised into the new General Health Service Bill covering the General Health Service, the Teaching Hospital Authority, the National Ambulance Service and the National Blood Service. This Act set to clarify the roles of the institutions and to help increase their effi ciency.
2. The National Health Insurance Scheme under the National Health Insurance Act (2003, Act 650) revised as Act 852 in 2012, was also enacted to bridge the equity gap in access to healthcare; decrease fi nancial barriers to healthcare. This act has been operationalized across Ghana.
3. The Local Government Service Act 656 and the National Decentralization Policy and Action Plan which will see a gradual and systematic transfer of responsibility from centralised to decentralized administrations.
4. The National Environmental Sanitation Policy (2010) was adopted with priorities to increase access to adequate sanitation facilities; adapt to and mitigate the impact of climate change and promote sustainable environmental practices.
5. The Health Coordinating Council Act, 2010 was promulgated to ensure eff ective integration of health sector agencies. The Act provides council for all health delivery agencies, regulatory bodies, and research and training institutions. The governance structure of Health Professions Regulatory Bodies Bill was based on this Act.
6. The Health Professions Regulatory Bodies Act (2010) provide for governance structures that regulate health professional bodies - Medical and Dental Council; Nursing and Midwifery Council; the Pharmacy Council and the Allied Health Professionals Council. Provision of adequate mix of health professional is important for the delivery of preventive and curative health care. The Act was therefore promulgated to regulate the training of health professionals in the performance of their duties, and also to ensure adequate health professional are produced to cater for the health needs of the population.
state_of_the_nations_interior_new.indd 129state_of_the_nations_interior_new.indd 129 05/02/19 11.0605/02/19 11.06
University of Ghana School of Public Health State of the Nation’s Health Report 2018130
7. The Medical Training and Research Act (2010) was established as the Centre for Plant Medicine Research for the promotion of scientifi c research, knowledge and development in the fi eld of plant medicine. The Act led to the establishment of the Ghana College of Physicians and Surgeons as a national postgraduate medical college for training specialists in medicine, surgery and other disciplines, and the Ghana College of Nurses and Midwives to promote specialist education in nursing and midwifery.
8. The Traditional and Alternative Medicine Act (2010) provides for the promotion and regulation of the practice of traditional medicine and alternative medicine. It established a council that regulates traditional and alternative medicine practice and practitioners. To provide direction in the implementation of traditional medical practitioners in Ghana, a traditional health directorate has been established to provide leadership in the incorporation of traditional medicine into the health care delivery in Ghana. The council therefore regulates the traditional medical practitioners in Ghana.
9. The Health Institutions and Facilities Act 829 (2010) provides for licensing and regulation of facilities. It sets up the Health Facilities Regulatory Agency to oversee the operations of public and private health institutions and monitor the quality of service rendered by them. The Health Institutions and Facilities Act 829, 2010 covers the Centre for Scientifi c Research into Plant Medicine; Ghana College of Physicians and Surgeons; the Pharmacy College and the Ghana College of Nurses and Midwives.
10. The Mental Health Act 830, 2011 sets up a separate Mental Health Service leadership and governance structures to improve upon mental health service delivery.
11. The Public Health Act of 2012 (Act 851) was enacted to consolidate laws relating to prevention of disease, health promotion and to safeguard, maintain and protect the health of humans and other related matters. Key areas in this Act include certifi cation of vaccines, standards for drugs, prohibition of diseases advertisement, WHO regulations and the regulation of tobacco use as catalogued in the World Health Organization WHO Framework Convention on Tobacco Control.
7.3 Governance structure of the health sector in Ghana
The Ghana Health Service (GHS) and Teaching Hospitals Act (ACT 525), passed in 1996, separated the governance and policy from the operational aspects of health service
state_of_the_nations_interior_new.indd 130state_of_the_nations_interior_new.indd 130 05/02/19 11.0605/02/19 11.06
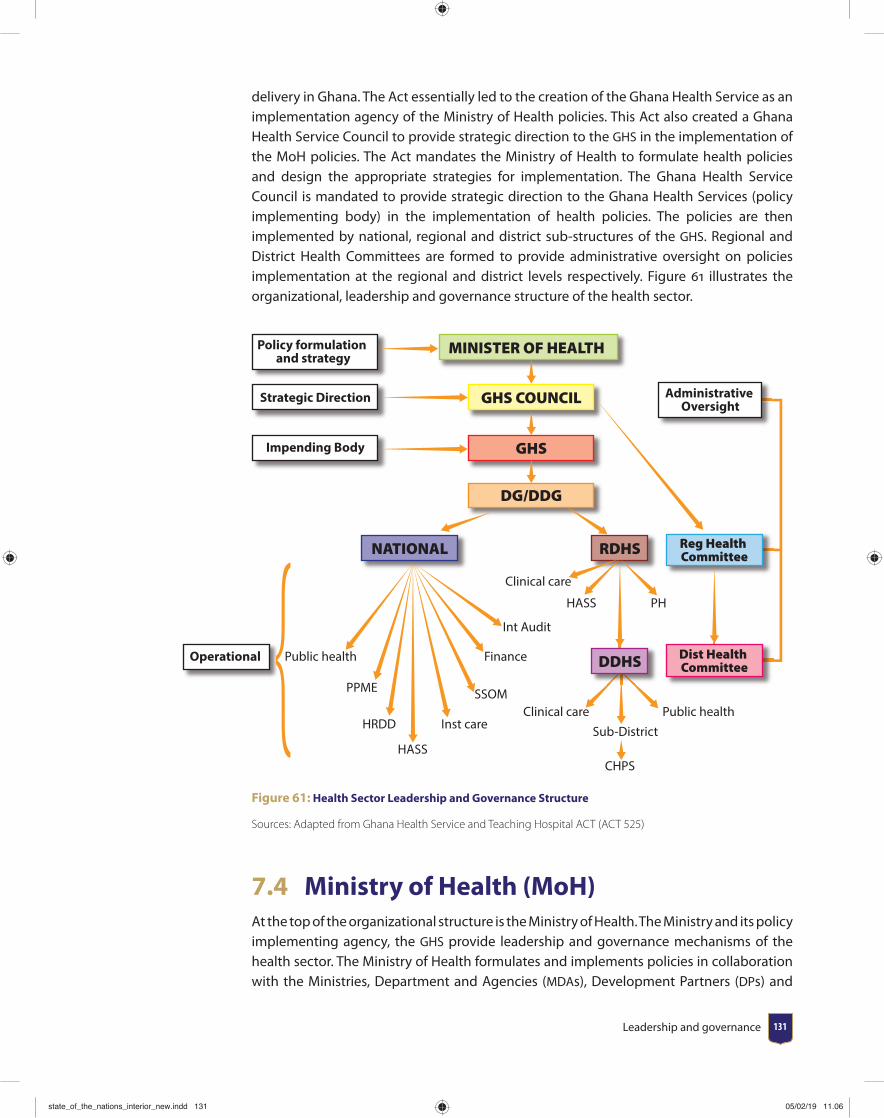
Leadership and governance 131
delivery in Ghana. The Act essentially led to the creation of the Ghana Health Service as an implementation agency of the Ministry of Health policies. This Act also created a Ghana Health Service Council to provide strategic direction to the GHS in the implementation of the MoH policies. The Act mandates the Ministry of Health to formulate health policies and design the appropriate strategies for implementation. The Ghana Health Service Council is mandated to provide strategic direction to the Ghana Health Services (policy implementing body) in the implementation of health policies. The policies are then implemented by national, regional and district sub-structures of the GHS. Regional and District Health Committees are formed to provide administrative oversight on policies implementation at the regional and district levels respectively. Figure 61 illustrates the organizational, leadership and governance structure of the health sector.
MINISTER OF HEALTH
Reg Health Committee
Dist Health Committee
RDHS
DDHS
NATIONAL
GHS COUNCIL
GHS
DG/DDG
Policy formulation and strategy
Strategic Direction
Impending Body
Administrative Oversight
Operational
Clinical care
CHPS
HASS PH
Public health
PPME
HRDD
HASS
Inst care
SSOM
Finance
Int Audit
Clinical careSub-District
Public health
Figure 61: Health Sector Leadership and Governance Structure
Sources: Adapted from Ghana Health Service and Teaching Hospital ACT (ACT 525)
7.4 Ministry of Health (MoH)At the top of the organizational structure is the Ministry of Health. The Ministry and its policy implementing agency, the GHS provide leadership and governance mechanisms of the health sector. The Ministry of Health formulates and implements policies in collaboration with the Ministries, Department and Agencies (MDAs), Development Partners (DPs) and
state_of_the_nations_interior_new.indd 131state_of_the_nations_interior_new.indd 131 05/02/19 11.0605/02/19 11.06
University of Ghana School of Public Health State of the Nation’s Health Report 2018132
the private sector. Recently the MoH sought to strengthen governance structures by establishing the Inter-Agency Leadership Committee (IALC) to promote accountability and collaboration between government agencies and the Ministry. The Agencies perform service delivery, regulatory, fi nancing, research and training functions and are responsible for implementing policies of the Ministry. The Ministry formulates the health sector strategies and technical policies; defi ne health sector goals, provide directions and prioritize sector spending across all services; identify the roles that other actors including the public, private and volunteer organizations play in the health system. Key functions of the Ministry include the following:
1. Information and oversight: ensure the generation, analysis and use of information to analyze trends on access, coverage, safety, responsiveness, fi nancial risk protection, health outcomes and the impact of policy on the political environment and as well as the opportunities for action.
2. Collaboration and coalition building: with international partners and across all sectors of government, including civil society groups in order to infl uence action on key determinants of the health and access to health services; to use the collaboration and coalition building to generate support for public health policies.
3. Formulation and implementation of health regulation: to ensure that they are eff ectively implemented and enforced across the health system.
4. System coordination: to avoid fragmentation of health delivery and to provide a unifi ed authority and responsibility structure.
5. Maintaining accountability: within the health system so that individuals and agencies are held accountable, and also to ensure that there is some level of transparency necessary for health sector performance.
As part of government’s development agenda to transform the country into a middle income status, interventions were put in place to spur growth through improvement in the country’s human capital. However, achieving such an objective could be hampered with an unhealthy population and an ineff ective health sector. Over the years, therefore, the MoH has designed policies to promote private health sector development, increase access, utilization, quality and health outcomes. Some of these policy frameworks are the programmes of work that aimed to create wealth through a healthy population. Other policies that have been developed in line with the ministry’s strategic goals include:
1. Health Promotion Policy 2005
2. Regenerative Health and Nutrition Programme Strategic Plan 2007-2011
state_of_the_nations_interior_new.indd 132state_of_the_nations_interior_new.indd 132 05/02/19 11.0605/02/19 11.06

Leadership and governance 133
3. Child Health Policy 2007-2015
4. Ghana Shared Growth and Development Agenda (GSGDA), 2010-2013
5. National Health Policy 2007, creating wealth through health
6. Health Sector Medium Term Development Plan 2010 -2013
7. Health Sector Medium Term Development Plan, 2014-2017
8. Expanded Programme on Immunization (EPI) Policy, 2010
9. Disease Control Strategy 2010-2014
10. Non-communicable Disease policy, 2012
11. National strategy for cancer control, 2012-2016
12. Private sector development policy
7.5 Ghana Health ServiceThe GHS is the implementing body of health policies developed by the MoH. Leadership and governance of Ghana Health Service is structured along a three-tiered administrative system: National; Regional and District levels. In terms of service delivery, the GHS is a fi ve-tiered service system, including: National, Regional, District, Sub-district and the Community (MoH, 2011). The regional, district and community levels, health facilities are established to provide primary and secondary health care services. However, tertiary health care is mainly provided by Korle-Bu, Okomfo Anokye, Tamale and most recently Cape Coast Teaching hospitals. At the services delivery points of the GHS include trained cadre of health related professionals. Recognizing the existence of operational and fi nancing challenges to achieving the health sector policy goals and objectives, the GHS constituted a team tasked with coordinating and designing guidelines for implementing policies and plans at all levels of the service. Among the outputs of the task team included the development of the Ghana Health Service Plans and Budget for 2014 and the Planning and Budget Guidelines for 2014-2016, which were developed and disseminated based on a National Medium Term Development Policy Framework.
Governance of the GHS at the national level is structured into three hierarchical levels including, the Ghana Health Service Council, The offi ces of the Director General and Deputy Director General, and Eight National Divisional Directorates. The council provides strategic decisions and direction in the implementation of health policies. The eight Divisional Directorates include: fi nance, Health Administration and Support Services, Human Resources, Institutional Care, Internal audit, Policy Planning Monitoring and Evaluation (PPME), Research and Development and Supplies, Stores and Drug Management. These eight divisions have divisional heads and deputies who provide leadership in the implementation of policies specifi c to their Directorates. These Directorates are replicated at the regional, and district levels of the governance structures. Governance structures and functions of the directorates are capture in Figure 62.
state_of_the_nations_interior_new.indd 133state_of_the_nations_interior_new.indd 133 05/02/19 11.0605/02/19 11.06
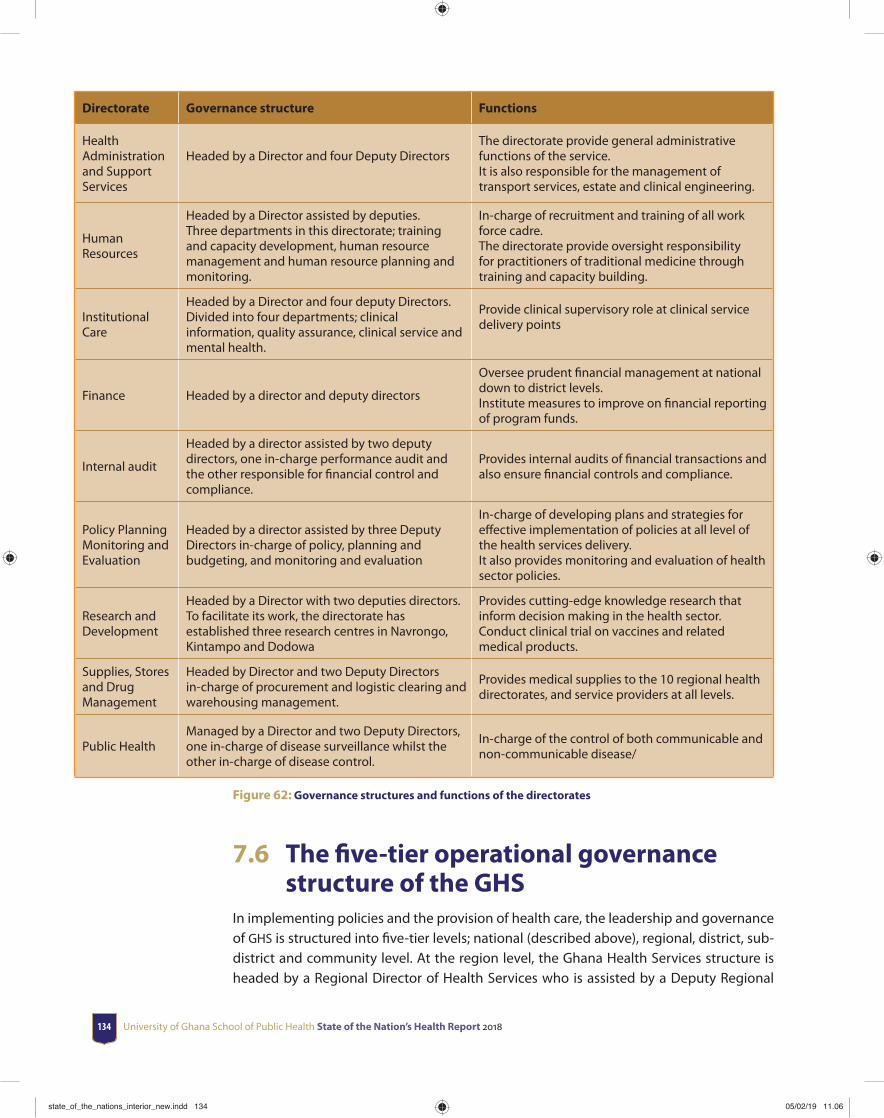
University of Ghana School of Public Health State of the Nation’s Health Report 2018134
Directorate Governance structure Functions
Health Administration and Support Services
Headed by a Director and four Deputy Directors The directorate provide general administrative functions of the service.It is also responsible for the management of transport services, estate and clinical engineering.
Human Resources
Headed by a Director assisted by deputies. Three departments in this directorate; training and capacity development, human resource management and human resource planning and monitoring.
In-charge of recruitment and training of all work force cadre.The directorate provide oversight responsibility for practitioners of traditional medicine through training and capacity building.
Institutional Care
Headed by a Director and four deputy Directors.Divided into four departments; clinical information, quality assurance, clinical service and mental health.
Provide clinical supervisory role at clinical service delivery points
Finance Headed by a director and deputy directors
Oversee prudent fi nancial management at national down to district levels.Institute measures to improve on fi nancial reporting of program funds.
Internal audit
Headed by a director assisted by two deputy directors, one in-charge performance audit and the other responsible for fi nancial control and compliance.
Provides internal audits of fi nancial transactions and also ensure fi nancial controls and compliance.
Policy Planning Monitoring and Evaluation
Headed by a director assisted by three Deputy Directors in-charge of policy, planning and budgeting, and monitoring and evaluation
In-charge of developing plans and strategies for eff ective implementation of policies at all level of the health services delivery.It also provides monitoring and evaluation of health sector policies.
Research and Development
Headed by a Director with two deputies directors. To facilitate its work, the directorate has established three research centres in Navrongo, Kintampo and Dodowa
Provides cutting-edge knowledge research that inform decision making in the health sector. Conduct clinical trial on vaccines and related medical products.
Supplies, Stores and Drug Management
Headed by Director and two Deputy Directors in-charge of procurement and logistic clearing and warehousing management.
Provides medical supplies to the 10 regional health directorates, and service providers at all levels.
Public HealthManaged by a Director and two Deputy Directors, one in-charge of disease surveillance whilst the other in-charge of disease control.
In-charge of the control of both communicable and non-communicable disease/
Figure 62: Governance structures and functions of the directorates
7.6 The fi ve-tier operational governance structure of the GHS
In implementing policies and the provision of health care, the leadership and governance of GHS is structured into fi ve-tier levels; national (described above), regional, district, sub-district and community level. At the region level, the Ghana Health Services structure is headed by a Regional Director of Health Services who is assisted by a Deputy Regional
state_of_the_nations_interior_new.indd 134state_of_the_nations_interior_new.indd 134 05/02/19 11.0605/02/19 11.06
Leadership and governance 135
Director of Health Services. There are also leaders’ in-charge of public health services, clinical care, and administration and individuals’ in-charge of various aspects of health care delivery to refl ect the national picture of the governance and leadership structures. At the district level, the Ghana Health Services structures are headed by a District Director of Health Services. There also representative of the various structures at the national level and coordinators of various disease-specifi c interventions such as malaria, tuberculosis and HIV. The leadership of the district level provide supervisory role to the sub-district level.
Leadership of the health sector has over the years instituted a number of measures as part of its community engagement and partnership eff orts to achieve the overall health sector policy goals and objectives. One of such initiatives was the Community-based Health Planning and Services (CHPS) program. The Ghana Health Service continued its eff orts to expand and increase access to quality health services through primary health care under the CHPS program. The Ghana Health Service completed a review of the CHPS Operational Policy Guidelines (OPG) in 2009. In 2013, a simplifi ed manual of the CHPS-OPG was developed to enable capacity building of the CHPS implementers and to advocate for CHPS implementation through a renewed community partnerships with DHMTs, MDAs, Sub-districts, Community Health Committees and health volunteers, fi rst in the Volta Region in 2013 and then nationwide in 2014.
The Ghana Health Service recognized that suffi cient community health nurses are essential for eff ective functioning of the CHPS program in the communities and for that matter they have produced more of the community health nurses over time. The Ghana Health Service assigns the community health nurses to demarcated CHPS zones as a measure to ensure the close-to-client model of community health services in those demarcated zones. The Ghana Health Service considered the community health nurses as the lynch-pin to community participation in planning and implementation for the communities health needs. The Ghana Health Service also engaged District Assemblies and local councils as key partners for the provision of CHPS compounds and residential accommodation for the community health nurses. Engaging the District Assemblies ensured their involvement and commitment to community placement and provision of essential tools necessary to enable the community health nurse to function eff ectively within the demarcated CHPS zone.
7.7 Implementation of Specifi c Policies by GHS
Part of the GHS core mandate is to implement policies to achieve good health. Several policies have been implemented by GHS in the past and recent times. Apart from implementing national policies which have been developed locally to meet the need of people in Ghana, the GHS also implement international health policies and treaties from World Health Assembly resolutions and the World Health Organization. One such international treaty was the just ended Millennium Development Goals (MDGs). As part of moves towards achieving MDGs 4 and 5 of reducing child and maternal mortality, Ghana
state_of_the_nations_interior_new.indd 135state_of_the_nations_interior_new.indd 135 05/02/19 11.0605/02/19 11.06
University of Ghana School of Public Health State of the Nation’s Health Report 2018136
adopted the Millennium Development Goals (MDG) Acceleration Framework Country Action Plan (MAF) in 2010, which laid emphasis on prioritizing reduction in maternal and child mortalities.
This initiative enabled the country prioritize its investment in development of the health sector. Recognizing the existence of operational and fi nancial system’s challenges to achieving the health sector policy goals and objectives, the Ghana Health Service, as the implementing agency of the Ministry of Health, instituted some measures to address some of these challenges. Among some of the measures included putting together a team that were tasked with coordinating the process of alignment of all divisional programme of work (POW) so that a performance agreement for all levels within the Ghana Health Service would be drafted. Among the initiatives implemented by the task team included the development of the Ghana Health Service Plans and Budget for 2014, the Planning and Budget Guidelines for 2014-2016, which were developed and disseminated based on a National Medium Term Development Policy Framework. The Ghana Health Service organized workshops for implementing staff on the planning process with the implementation timelines. Though Ghana had made signifi cant progress in achieving MDGs 4 and 5, it was unable to achieve the targets on reducing child and maternal mortality (UN/NDPC, 2015).
7.7.1 Health promotion and Regenerative health Policies
At the heart of the health promotion and regenerative health policies is promoting healthy living through changes in risky health behaviour and eating of healthy food. The policy focused on the promotion of healthy lifestyles through good nutrition, regular physical exercise, recreation, rest and personal hygiene. The Policy further places healthy lifestyles within the context of the physical and social environment in which people are born, grow, school, work and die; emphasizing potable water, sanitation, and safe food, housing and roads are means to that end. The Policy seeks to build a pluralistic health service that recognizes allopathic, traditional and alternative providers (both private and public). It also ensures access to quality health care for preventing diseases and injuries, as well as for restoring the health of the sick and disabled. In that regard, the policy aims to provide comprehensive health care services comprising preventive, curative and rehabilitative services. Finally, the policy seeks to promote a vibrant local health industry that supports eff ective, effi cient, and sustainable service delivery, creates jobs and contributes directly to wealth creation and the attainment of national development objectives.
Despite the fact that these two policies have been implemented for some years now, their impact on reducing Non-Communicable Diseases (NCD) is not substantial. The high prevalence of NCDs such as cardiovascular conditions, diabetes and cancers undermines the achievements of these policies. Exercise, eating habits, intake of alcohol and smoking play a role in the etiology of these conditions (Bosu, 2012; WHO, 2014). Both active and passive smoking has been reported to predispose people to respiratory tract cancers (WHO, 2015). The public health Act was passed to regulate smoking in public places but
state_of_the_nations_interior_new.indd 136state_of_the_nations_interior_new.indd 136 05/02/19 11.0605/02/19 11.06
Leadership and governance 137
the implementation is yet to see the light of day. The “no smoking” inscription are on public places, yet people still smoke in public environments. Enforcement of the ACT can be achieved through good leadership and inter-sectorial collaboration especially with security agencies to arrest and prosecute off enders to act as deterrents to others. Establishing an inter-agency task force comprising of representatives from GHS, MoH, and security agencies to provide leadership in the implementation of the “no public smoking” will be essential to achieve this policy direction.
7.7.2 Non-Communicable Diseases Policies
In recent times, NCDs have received wide recognition because of the burden in human development across the globe. NCDs contribute signifi cantly to illness, disability and deaths in Ghana. The major NCDs in Ghana are cardiovascular diseases, cancers, diabetes, chronic respiratory diseases, sickle cell disease and mental illness. A policy was therefore developed in 2012. The NCD-policy focuses on health promotion and early detection of these conditions and strengthening the health system (MoH, 2012). To enable eff ective implementation of the policy on NCD, health directorates were supposed to establish and assign focal persons to provide leadership in that direction. Though measures are put in place to ensure full implementation of the tenets of this policy, progress has been slow with minimal achievements of results. Cardiovascular conditions and cancers still remain a burden in Ghana and key components of the policy remains unimplemented (Bosu, 2012). For example, cervical cancer is the commonest of cancers among women with high fatality but access to screening services (a key component in reducing the burden) is still a problem and limited to mostly regional and teaching hospitals (GHS, 2015). Training of lower medical cadres working at primary health service system on screening procedures will increase access to these services. For example, a task shifting proof of concept study conducted in Ghana showed that Community Health Offi cers (CHO) can be re-oriented to conduct cervical cancer screening at community level using visual inspection with acetic acid and cervicography (Asgary et al., 2016).
7.7.3 Mental Act and Policy on Mental Health
In March 2012, the Parliament of Ghana passed the Mental Health Act (MHA-2012) law following series of advocacy by civil society, stakeholders and institutions. Some of the key areas of the law include the establishment of a mental health authority, enshrinement of human rights, community oriented care, and least restrictive environment. It also included strong emphasis on public education, integration of mental health into the general health care, establishment of mental health fund, free mental health care to all in need, wide accessibility to quality mental health services, emphasis on research, just to mention a few. The Mental Health Authority was established to spearhead the implementation of the provisions of the law. Though the law has been passed, mental health care is still largely provided at three public institutions (Accra, Pantang and Ankaful Psychiatric Hospitals) with little integration into primary health care, to enable prevention and early
state_of_the_nations_interior_new.indd 137state_of_the_nations_interior_new.indd 137 05/02/19 11.0605/02/19 11.06
University of Ghana School of Public Health State of the Nation’s Health Report 2018138
treatment of psychiatric disorders. Nonetheless, eff orts are been made to strengthen community services which is required to decentralize management of mental health to the communities and foster early detection and treatment of mental disorders.
The Accra Psychiatric Hospital for instance has the semblance of a prison where there are no adequate ventilation outlets, thus predisposing inmates to all kinds of diseases, particularly skin disease, due to overcrowding in the facilities. Institutional mental care in the country mostly limited to psychiatrists and nurses. The fact however, is that these two health professionals cadre alone cannot handle all issues pertaining to mental health care. Consequently, the need for a multidisciplinary team becomes paramount. As the situation is now, the availability of adequate number of well-trained multidisciplinary workforce (psychiatrists, psychologists, social workers, occupational therapists and nurses) leaves much to be desired. The Mental Health law includes a requirement that certain state institutions provide inputs to ensure successful implementation of the law. For example, the judicial system, social services, education services and the Ministry of Health, all have roles to play under the MHA-2012. It is impossible to say with certainty if these various institutions are prepared for these additional demands expected of them. It is obvious that the law was passed without the adequate political, organizational and structural readiness. The inference therefore is that the law was compromised even before its passage. Good leadership will be required to bring all these stakeholders together to circumvent the challenges in the implementation of MHA.
7.7.4 Malaria, Tuberculosis and HIV Control Policies
The Okinawa Infectious Disease Initiative, announced by Japan at the G8 summit in 2000, led to strengthened global eff orts on several diseases, in particular HIV/AIDS, tuberculosis, and malaria, poliomyelitis, parasitic diseases, and other neglected tropical diseases (Reich et al., 2008). These eff orts contributed to the establishment of the Global Fund to Fight AIDS, Tuberculosis (TB) and Malaria, as well as other single-disease control programmes, ushering in a new era in global health cooperation.
Tuberculosis remains a major communicable disease in Ghana despite expansion in prevention and control interventions. Since the year 2005, Ghana has been implementing the new Stop TB Strategy covering the six strategic areas developed by the WHO in all health facilities nationwide. Nonetheless, in the year 2014, 44,000 new tuberculosis cases were reported, which translates to 165 newly infected people per 100,000 population. This makes Ghana part of the high incident countries (estimated incidence rate of 40 per 100,000 or greater) in the world (WHO, 2015). Tuberculosis prevalence among adults in Ghana is 290 per 100,000 population, which is more than twice the estimated World Health Organization (WHO) acceptable TB prevalence for all ages (NTP, 2014). Though progress has been made in adherence24, case detection remains a problem in Ghana. It has been found that case detection was being undermined by the lack of coordination between
24 Adherence: the extent to which a person’s behaviour – taking medication, following a diet and/or changing lifestyle – corresponds with agreed recommendations from a health worker.
state_of_the_nations_interior_new.indd 138state_of_the_nations_interior_new.indd 138 05/02/19 11.0605/02/19 11.06
Leadership and governance 139
community level health services provider and the district level (Ahorlu and Bonsu 2013), a key leadership function of the managers of the district health management team. As the global targets is to end TB by 2030 as envisioned in the sustainable development goals, there would be the need health managers to re-strategize to increase case detection.
Ghana has made some signifi cant progress in malaria control. Ghana scaled up malaria interventions between 2000 and 2012. This scale-up led to a reduction of prevalence of more than 50 from 62.5 to current meso-endemic values of 27.5 (GSS, 2011). Malaria Case Fatality Rate has also been reported to have declined from 1.32 in 2010 to 0.54 in 2014 (NMCP, 2014). Regarding HIV control, the prevalence has also declined from 1.8 in 2007 to 1.37 in 2012 and 1.3 in 2014 (NACP, 2015). NACP records also show that annual AIDS-related deaths in adults has declined from a little under 16,000 in 2006 to about 7,800 in 2013 (NACP, 2015). However, early infant diagnosis (EID) is a major challenges in Ghana as it is reported to about 17 which is low (NACP, 2015). Though remarkable progress had been made in these trio diseases, many Ghanaians still die annually from these preventable diseases. Therefore, there would be a need to rethink the approaches and implementation strategies adopted in the past (as their achievements has been minimal relative to fi nancial investment in those areas) to bring their burden among Ghanaians and foreigners living in Ghana.
7.7.5 Neglected Tropical Diseases policy
The Neglected Tropical Diseases (NTDs) policy covers a wide range of endemic conditions such as lymphatic fi lariasis, onchocerciasis, trachoma, schistosomiasis, and soil transmitted helminthiasis, which the policy on NTP aims to prevent through administration of Preventive Chemotherapy (PCT). The other conditions in this policy include yaws, Buruli ulcer, leprosy and trypanosomiasis. Signifi cant progress has been reported in the control of these diseases through specifi c interventions. Ghana has been able to achieve the WHO targets for these conditions. For example, Ghana has achieved the WHO target of eliminating leprosy set at <1/10,000 and after several round of mass drug administration (MDA) for lymphatic fi lariasis, LF Transmission Assessment Survey (TAS) in 2014 showed that all the participating 64 districts passed the TAS and therefore qualify to stop mass drug administration, a signifi cant progress. However, many people still live with the sequelae of Buruli ulcer and leprosy, which are also associated with high stigma. Eff orts need to be tailored towards early detection and prompt treatment to prevent the permanent disabilities resulting from these diseases.
7.7.6 Expanded Programme on Immunization (EPI)
Routine immunization against preventable childhood conditions is one of the strategies used to reduce the burden of conditions such as poliomyelitis, measles, tetanus, haemophilus infl uenza type 2, diphtheria amongst other. Immunization activities therefore continue throughout the 216 districts in Ghana as envisioned in the EPI policy. Supply of
state_of_the_nations_interior_new.indd 139state_of_the_nations_interior_new.indd 139 05/02/19 11.0605/02/19 11.06

University of Ghana School of Public Health State of the Nation’s Health Report 2018140
all the antigens for the infant immunization are often regular with minimal cases shortage reported across the countries. Out of the 216 districts in Ghana, 150 districts (69.7) have recorded penta3 coverage ≥ 80 whilst two districts recorded penta3 coverage of <50 (GHS, 2015). This is a remarkable achievement the pentavalent vaccine off er protection for children under fi ve against the fi ve most common “killer conditions”. The estimated number of un-immunized children was 60,121 (representing 5.8) of total annual EPI target and this is a major progress towards reducing the burden of vaccine preventable conditions in Ghana as the high coverage off er herd immunity for the un-immunized.
7.7.7 Private Sector Development Policy
This policy which has its roots in the Private Hospitals and Maternity Homes Board Act (1958, Act 9) for regulating, accrediting and licensing healthcare providers has now been repealed and replaced with the Health Institutions and Facilities Act 829, 2011. The Act provides for the establishment of a Health Facilities Regulatory Agency to license facilities for the provision of both public and private health care services. This policy has led to the establishment and accreditation of several private institutions to provide health care. The integration of private sector into the formal health sector is essential in increasing access to health care.
7.8 Summary and ConclusionLeadership and governance are the bed rock of health care delivery in any country. Good leadership and governance are pivoted in both the design and implementing health-related policies to address the health needs of a country. In Ghana, leadership and governance of the health sector is regulated by various legislations. These legislations regulates all aspects of the health system, including training institutions management, all health professionals cadres, health institutions establishment, and designing and implementing both national and international health policies. The Ghana Health Service and Teaching Hospitals Act (ACT 525), which was passed in 1996, separated the governance and policy from the operational aspects of health service delivery. This Act institutionalized the MoH as the health policy formulation body and made the GHS in-charge of implementing the policies developed by MoH. Over the years several, numerous policies have been developed by the MoH, including those targeting health promotion and regenerative health, communicable and non-communicable diseases, neglected tropical disease, immunization and public-private partnership. The GHS which is mandated to implement these policies is organized into three-tier system at the national level (GHS council, Offi ce of Director General and Deputy Director General and eight Divisional Directorate). However, at the operational level, GHS is structured into fi ve level from the national through to the community. Through these operational levels, policies are implemented to reach their benefi ciaries at the community. Generally, the health sector has a well-structured leadership and governance that ensure implementation of policies at all levels. This notwithstanding, many health policies have achieved marginal impact, partly because, of weak leadership and governance structures.
state_of_the_nations_interior_new.indd 140state_of_the_nations_interior_new.indd 140 05/02/19 11.0605/02/19 11.06
Leadership and governance 141
Therefore, it would be important to evaluate and devise more innovative ways of strengthening leadership structures to effi ciently and eff ectively implement policies to achieve desired results.
From the review, it is obvious that progress in health can only be sustained through good leadership and governance. The prospects look good for Ghana provided measures are put in place to ensure that all managers of health systems are trained on good leadership skills. The introduction of leadership and governance at all levels of training of health workers will be essential in the global drive to achieving sustainable development goals. Emphasis should also be put on social accountability such that mechanisms can be put in place to ensure that communities, citizens and civil society organizations are oriented to hold public offi cials accountable. As funding of health interventions from donors are shrinking, another area that will emerge in the coming years will be how to mobilize local funding sources for health care. This will require leadership thinking outside the box and effi cient use of limited resources.
state_of_the_nations_interior_new.indd 141state_of_the_nations_interior_new.indd 141 05/02/19 11.0605/02/19 11.06

University of Ghana School of Public Health State of the Nation’s Health Report 2018142
CHAPTER 8Cross-cutting issues (Health and Development)
8.1 IntroductionHuman health is a critical ingredient for economic growth and human development. Principle 1 of The 1992 Rio Declaration Principles argues “human beings are the central concern of sustainable development”. Since then, internationally agreed development goals, such as the United Nations Millennium Declaration, Agenda 21, the MDGs, the UN Global Fund and the new Sustainable Development Goals (SDGs) recognize health as crucial ingredient for economic and human development. Historically, there have been attempts at associating the health of the Ghanaian population with development within the country. A comprehensive review conducted in 2000, using data from the Ghana Living Standards Survey (1988) and Ghana Health Demographic Survey (1993) showed low performance in key health indicators including malnutrition, high under-fi ve mortality, access to healthcare, etc. These were associated with declines in socioeconomic development during the same period. For critics, this suggested that poor health smothered development for which reason the World Bank policy direction for Structural Adjustment Programmes was initiated in the 1980s.
In this Chapter, we attempt to describe health and development trends over the past 15 (2000 to 2014) years in Ghana. We fi rst defi ne health and development, discuss Ghana’s vision and mission, and present an overview of collaborations between the Ministry of Health (MOH) and other ministries
state_of_the_nations_interior_new.indd 142state_of_the_nations_interior_new.indd 142 05/02/19 11.0605/02/19 11.06

Cross-cutting issues (Health and Development) 143
in Ghana. Later we conceptualize the relationship between health and development and describe some contemporary health and development indicators. We also discuss both public and private sector contribution to health and development.
8.2 Defi ning Health & DevelopmentDefi nitions provided for both health and development as concepts are often contested. Health, according to World Health Organization (WHO), is a complete state of physical, mental and social well-being, and not merely the absence of disease or infi rmity. Development, on the other hand is often defi ned from one of three perspectives - either as a process of change which can be short-to-medium-to-long term change or as a dominant discourse. Gross domestic product (GDP) and human development index are most often used to measure development. Although the use of GDP as a measure of development is popular it often fails to capture inequalities and diff erences in social deprivation in the population. Consequently, Human development index (HDI)25 is preferred as a broader approach to understanding developmental issues. The index includes most basic human capabilities such as long life, being knowledgeable, and enjoying a decent standard of living (UNDP, 1999) and good health etc. We defi ne development broadly, as a measure of progressive change in the lives of the Ghanaian population as a result of public and private strategies, investment and interventions put in place over the period of 2000 and 2015. For example improvement in health status, economic growth, living standards and related factors such as water, sanitation, social and health lifestyles, and health service delivery are indicative of development.
1.3 Ghana’s Health and Development Agenda: Vision, Mission and State of Health Care Delivery
The economic role of health provides a compelling rationale for Ghana’s vision on health and development. Ghana’s health vision is to create a healthy population for development. This is supported by the sector mission of contributing to socio-economic development by promoting health and vitality through access to quality health for all people living in Ghana using well-motivated personnel. These vision and mission statements were carved with the aim of having a healthy and productive Ghanaian population to facilitate the achievement of the Millennium Development Goals (MDGs), as well as human development and economic growth over the past 15 years. The underlining mechanisms for achieving the MDGs in conjunction with the vision, mission and goals of the Ministry of Health in Ghana were; 1) Delivery of health services; 1) Policy formulation and policy implementation; 3) Quality and regulatory services; 4) Financing and infrastructure; and
25 Human Development Index: A composite index measuring average achievement in three basic dimensions of human development—a long and healthy life, knowledge and a decent standard of living.
state_of_the_nations_interior_new.indd 143state_of_the_nations_interior_new.indd 143 05/02/19 11.0605/02/19 11.06
University of Ghana School of Public Health State of the Nation’s Health Report 2018144
5) Research and training. Health is thus not only emphasized as central to development but also presents a unique set of opportunities for improving the health sector of Ghana.
The Ministry of Health works with several agencies, sector partners (e.g. MIDAs, MMDAs, and DPs) and private partners. Among these partners are the Ghana Health Services (GHS) with its Community Based Health Planning and Services (CHPS) programme as primary health care units, Mission Based Health Providers (MBHP) such as the Christian Health Association (CHAG), and other private health institutions. These partners are tasked to provide public and clinical health services at primary and secondary levels. Four main Teaching Hospitals (Korle Bu, Komfo Anokye, Cape Coast and Tamale) support with tertiary health services including emergency, referrals, teaching etc.
8.4 Historical Overview of Ghana’s Health Sector
The development of modern healthcare system in Ghana can be categorized into four phases, before 1471-1844, 1844-1868, pre-independence and post-independence. The fi rst phase (1471-1844) saw the emergence of biomedicine and establishment of healthcare system to protect colonial masters and missionaries from infectious diseases (Senah, 2001). The Bond of 1844 marked the beginning of the second phase, when health delivery was extended to natives working with the colonial governments. The third phase started from 1868 to 1957, when the fi rst hospital was built in Cape Coast with dispensaries in several rural communities. The fi rst national hospital, Korle Bu Teaching Hospital was built in 1923. Following independence in 1957, an inclusive social and welfare services were prioritized to the health sector through state funds. The government intervention aimed at enlarging and modernizing health delivery facilities as well as training more medical personnel. Between 1957 and 1963 the number of health care facilities increased from 10 to 41 and Government health expenditure increased from 6.4 to 8.2 between 1965 and 1969. However, the quality of healthcare began to decline in late 1960s when government failed to sustain investment in the healthcare system.
The Community-based Health Planning and services (CHPS) facility concept was initiated in 1990 to improve accessibility to primary health care such as clinical services and community outreach covering antenatal and postnatal care through community health offi cer (CHO). It was done at a time when Ghanaians lived more than 8km from the nearest provider, and rural infant mortality was 50 higher in rural areas than urban areas. Following pressure from the International Monetary Fund’s (IMF) and World Bank’s Structural Adjustment Program (SAP), reforms sought after private supports, leading to introduction of user fees in 1969 and cash-and-carry in 1985. Government health expenditure decreased 10 in 1982 to 1.3 in 1997. Many people who could not aff ord to pay the cost of healthcare at the point of delivery “cash-and-carry” turned to self-medication and other cost-saving behaviours/practices (Asenso-Okyere et al., 2008)
state_of_the_nations_interior_new.indd 144state_of_the_nations_interior_new.indd 144 05/02/19 11.0605/02/19 11.06
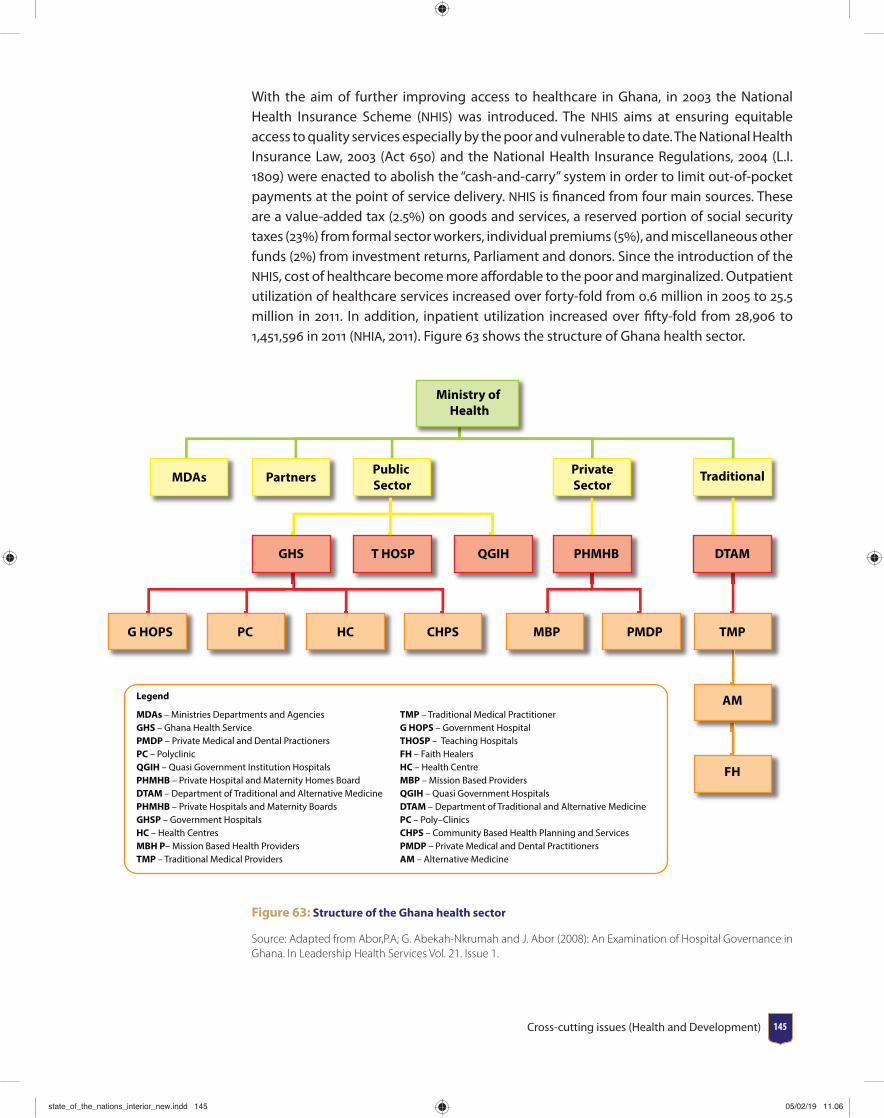
Cross-cutting issues (Health and Development) 145
With the aim of further improving access to healthcare in Ghana, in 2003 the National Health Insurance Scheme (NHIS) was introduced. The NHIS aims at ensuring equitable access to quality services especially by the poor and vulnerable to date. The National Health Insurance Law, 2003 (Act 650) and the National Health Insurance Regulations, 2004 (L.I. 1809) were enacted to abolish the “cash-and-carry” system in order to limit out-of-pocket payments at the point of service delivery. NHIS is fi nanced from four main sources. These are a value-added tax (2.5) on goods and services, a reserved portion of social security taxes (23) from formal sector workers, individual premiums (5), and miscellaneous other funds (2) from investment returns, Parliament and donors. Since the introduction of the NHIS, cost of healthcare become more aff ordable to the poor and marginalized. Outpatient utilization of healthcare services increased over forty-fold from 0.6 million in 2005 to 25.5 million in 2011. In addition, inpatient utilization increased over fi fty-fold from 28,906 to 1,451,596 in 2011 (NHIA, 2011). Figure 63 shows the structure of Ghana health sector.
Legend
MDAs – Ministries Departments and Agencies TMP – Traditional Medical PractitionerGHS – Ghana Health Service G HOPS – Government Hospital PMDP – Private Medical and Dental Practioners THOSP – Teaching Hospitals PC – Polyclinic FH – Faith HealersQGIH – Quasi Government Institution Hospitals HC – Health CentrePHMHB – Private Hospital and Maternity Homes Board MBP – Mission Based ProvidersDTAM – Department of Traditional and Alternative Medicine QGIH – Quasi Government Hospitals PHMHB – Private Hospitals and Maternity Boards DTAM – Department of Traditional and Alternative Medicine GHSP – Government Hospitals PC – Poly–ClinicsHC – Health Centres CHPS – Community Based Health Planning and Services MBH P– Mission Based Health Providers PMDP – Private Medical and Dental PractitionersTMP – Traditional Medical Providers AM – Alternative Medicine
Ministry of Health
MDAs Partners Public Sector
PrivateSector
Traditional
DTAMPHMHBQGIHT HOSPGHS
TMPPMDPMBPCHPSHCPCG HOPS
AM
FH
Figure 63: Structure of the Ghana health sector
Source: Adapted from Abor,P.A; G. Abekah-Nkrumah and J. Abor (2008): An Examination of Hospital Governance in Ghana. In Leadership Health Services Vol. 21. Issue 1.
state_of_the_nations_interior_new.indd 145state_of_the_nations_interior_new.indd 145 05/02/19 11.0605/02/19 11.06
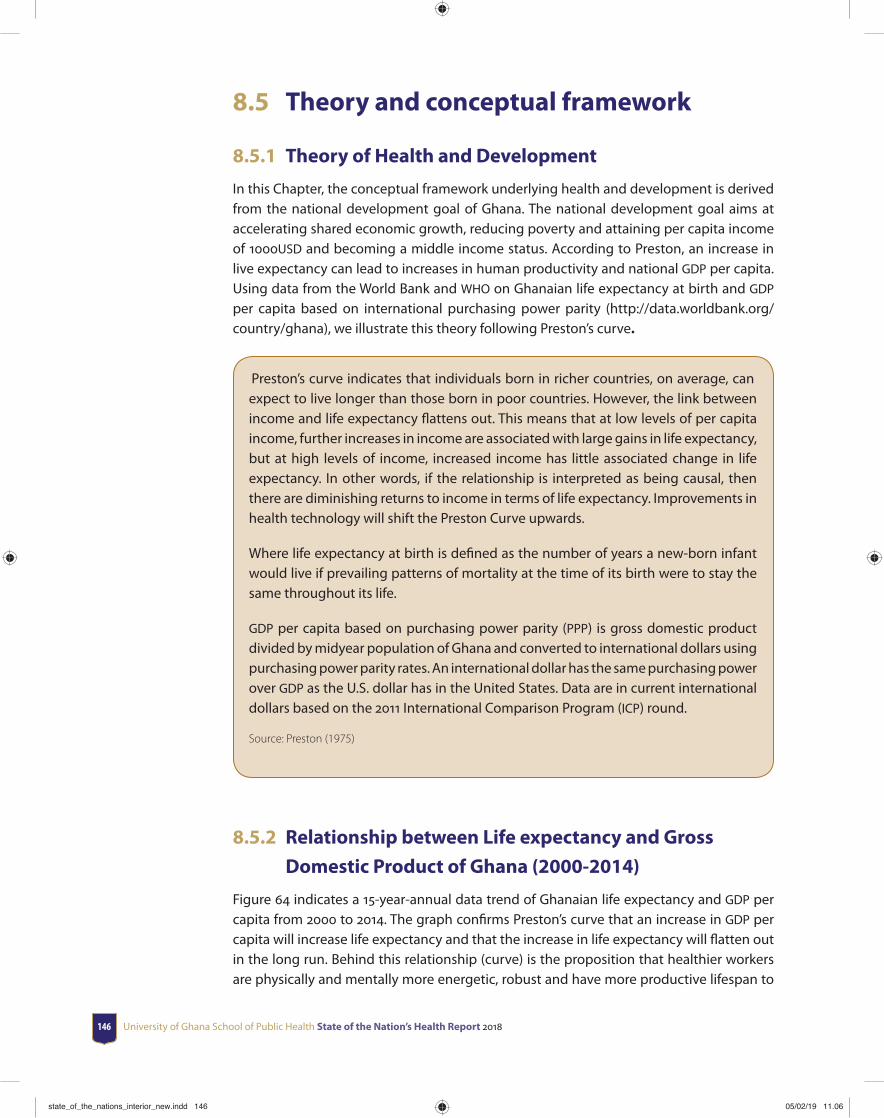
University of Ghana School of Public Health State of the Nation’s Health Report 2018146
8.5 Theory and conceptual framework
8.5.1 Theory of Health and Development
In this Chapter, the conceptual framework underlying health and development is derived from the national development goal of Ghana. The national development goal aims at accelerating shared economic growth, reducing poverty and attaining per capita income of 1000USD and becoming a middle income status. According to Preston, an increase in live expectancy can lead to increases in human productivity and national GDP per capita. Using data from the World Bank and WHO on Ghanaian life expectancy at birth and GDP per capita based on international purchasing power parity (http://data.worldbank.org/country/ghana), we illustrate this theory following Preston’s curve.
Preston’s curve indicates that individuals born in richer countries, on average, can expect to live longer than those born in poor countries. However, the link between income and life expectancy fl attens out. This means that at low levels of per capita income, further increases in income are associated with large gains in life expectancy, but at high levels of income, increased income has little associated change in life expectancy. In other words, if the relationship is interpreted as being causal, then there are diminishing returns to income in terms of life expectancy. Improvements in health technology will shift the Preston Curve upwards.
Where life expectancy at birth is defi ned as the number of years a new-born infant would live if prevailing patterns of mortality at the time of its birth were to stay the same throughout its life.
GDP per capita based on purchasing power parity (PPP) is gross domestic product divided by midyear population of Ghana and converted to international dollars using purchasing power parity rates. An international dollar has the same purchasing power over GDP as the U.S. dollar has in the United States. Data are in current international dollars based on the 2011 International Comparison Program (ICP) round.
Source: Preston (1975)
8.5.2 Relationship between Life expectancy and Gross
Domestic Product of Ghana (2000-2014)
Figure 64 indicates a 15-year-annual data trend of Ghanaian life expectancy and GDP per capita from 2000 to 2014. The graph confi rms Preston’s curve that an increase in GDP per capita will increase life expectancy and that the increase in life expectancy will fl atten out in the long run. Behind this relationship (curve) is the proposition that healthier workers are physically and mentally more energetic, robust and have more productive lifespan to
state_of_the_nations_interior_new.indd 146state_of_the_nations_interior_new.indd 146 05/02/19 11.0605/02/19 11.06
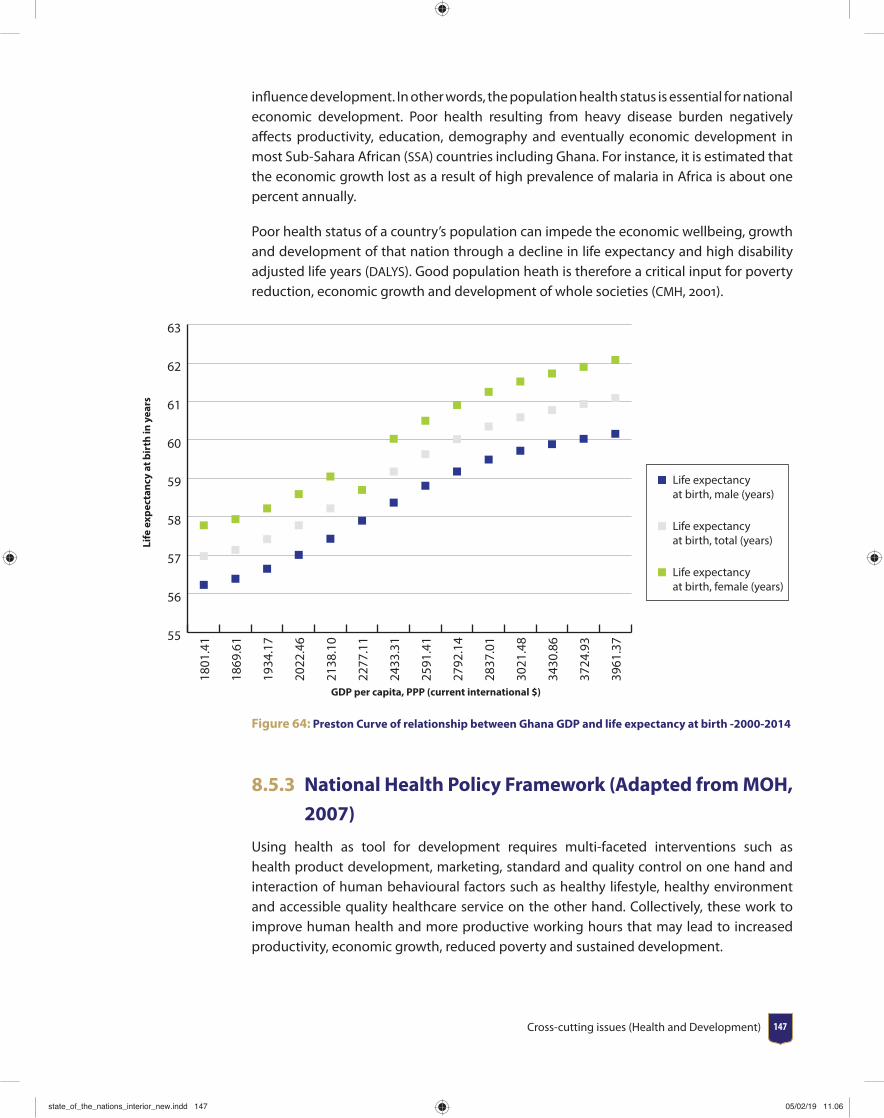
Cross-cutting issues (Health and Development) 147
infl uence development. In other words, the population health status is essential for national economic development. Poor health resulting from heavy disease burden negatively aff ects productivity, education, demography and eventually economic development in most Sub-Sahara African (SSA) countries including Ghana. For instance, it is estimated that the economic growth lost as a result of high prevalence of malaria in Africa is about one percent annually.
Poor health status of a country’s population can impede the economic wellbeing, growth and development of that nation through a decline in life expectancy and high disability adjusted life years (DALYS). Good population heath is therefore a critical input for poverty reduction, economic growth and development of whole societies (CMH, 2001).
55
56
57
58
59
60
61
62
63
Life expectancy at birth, male (years)
Life expectancy at birth, total (years)
Life expectancy at birth, female (years)
3961
.37
3724
.93
3430
.86
3021
.48
2837
.01
2792
.14
2591
.41
2433
.31
2277
.11
2138
.10
2022
.46
1934
.17
1869
.61
1801
.41
Life
exp
ecta
ncy
at b
irth
in y
ears
GDP per capita, PPP (current international $)
Figure 64: Preston Curve of relationship between Ghana GDP and life expectancy at birth -2000-2014
8.5.3 National Health Policy Framework (Adapted from MOH,
2007)
Using health as tool for development requires multi-faceted interventions such as health product development, marketing, standard and quality control on one hand and interaction of human behavioural factors such as healthy lifestyle, healthy environment and accessible quality healthcare service on the other hand. Collectively, these work to improve human health and more productive working hours that may lead to increased productivity, economic growth, reduced poverty and sustained development.
state_of_the_nations_interior_new.indd 147state_of_the_nations_interior_new.indd 147 05/02/19 11.0605/02/19 11.06
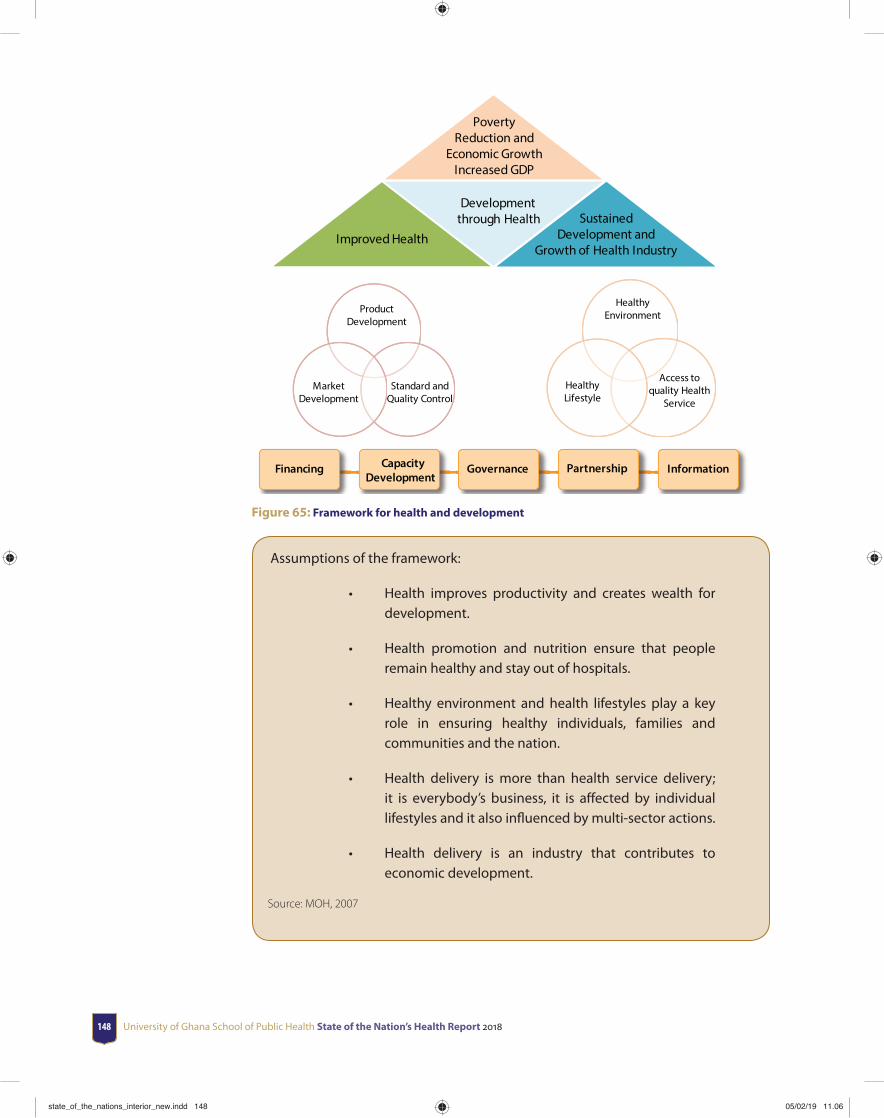
University of Ghana School of Public Health State of the Nation’s Health Report 2018148
Improved Health
Development through Health Sustained
Development and Growth of Health Industry
Healthy Environment
Access to quality Health
Service Healthy
Lifestyle
Product Development
Market Development
Financing CapacityDevelopment
Governance Partnership Information
Poverty Reduction and
Economic Growth Increased GDP
Standard and Quality Control
Figure 65: Framework for health and development
Assumptions of the framework:
• Health improves productivity and creates wealth for development.
• Health promotion and nutrition ensure that people remain healthy and stay out of hospitals.
• Healthy environment and health lifestyles play a key role in ensuring healthy individuals, families and communities and the nation.
• Health delivery is more than health service delivery; it is everybody’s business, it is aff ected by individual lifestyles and it also infl uenced by multi-sector actions.
• Health delivery is an industry that contributes to economic development.
Source: MOH, 2007
state_of_the_nations_interior_new.indd 148state_of_the_nations_interior_new.indd 148 05/02/19 11.0605/02/19 11.06
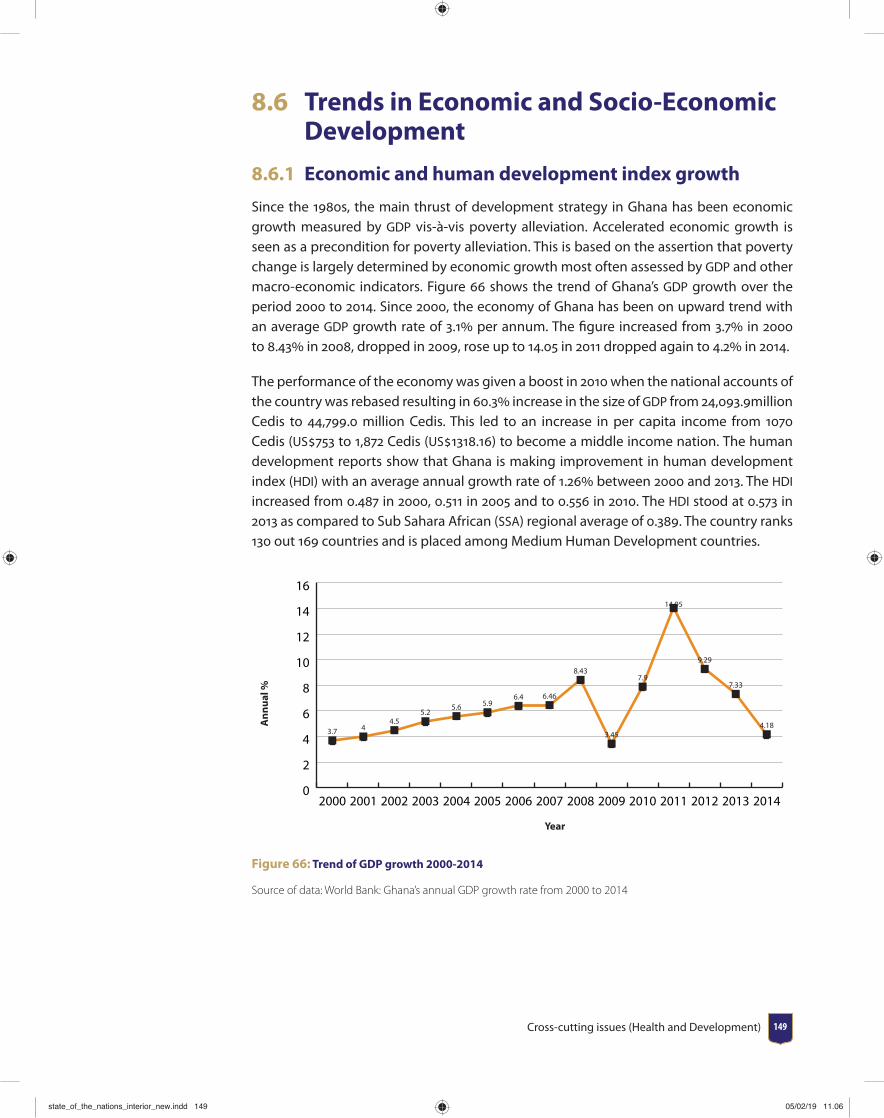
Cross-cutting issues (Health and Development) 149
8.6 Trends in Economic and Socio-Economic Development
8.6.1 Economic and human development index growth
Since the 1980s, the main thrust of development strategy in Ghana has been economic growth measured by GDP vis-à-vis poverty alleviation. Accelerated economic growth is seen as a precondition for poverty alleviation. This is based on the assertion that poverty change is largely determined by economic growth most often assessed by GDP and other macro-economic indicators. Figure 66 shows the trend of Ghana’s GDP growth over the period 2000 to 2014. Since 2000, the economy of Ghana has been on upward trend with an average GDP growth rate of 3.1 per annum. The fi gure increased from 3.7 in 2000 to 8.43 in 2008, dropped in 2009, rose up to 14.05 in 2011 dropped again to 4.2 in 2014.
The performance of the economy was given a boost in 2010 when the national accounts of the country was rebased resulting in 60.3 increase in the size of GDP from 24,093.9million Cedis to 44,799.0 million Cedis. This led to an increase in per capita income from 1070 Cedis (US753 to 1,872 Cedis (US1318.16) to become a middle income nation. The human development reports show that Ghana is making improvement in human development index (HDI) with an average annual growth rate of 1.26 between 2000 and 2013. The HDI increased from 0.487 in 2000, 0.511 in 2005 and to 0.556 in 2010. The HDI stood at 0.573 in 2013 as compared to Sub Sahara African (SSA) regional average of 0.389. The country ranks 130 out 169 countries and is placed among Medium Human Development countries.
0
2
4
6
8
10
12
14
16
3.7 44.5
5.25.6 5.9
6.4 6.46
8.43
3.45
7.9
14.05
9.29
7.33
4.18
201420132012201120102009200820072006200520042003200220012000
Ann
ual %
Year
Figure 66: Trend of GDP growth 2000-2014
Source of data: World Bank: Ghana’s annual GDP growth rate from 2000 to 2014
state_of_the_nations_interior_new.indd 149state_of_the_nations_interior_new.indd 149 05/02/19 11.0605/02/19 11.06
University of Ghana School of Public Health State of the Nation’s Health Report 2018150
8.6.2 Poverty, inequalities and health and development
In comparing poverty trends, the Ghana Statistical Services (GSS) records show that poverty incidences have declined alongside increasing GPD and human development index growth rates. Currently, the proportion of Ghanaians defi ned as poor stands at 24.2. It was about 28.8 in 2000. According to GLSS 2005/6 and GLSS 2012/13 poverty incidence reduced from 31.9 in 2005/06 to 24.3 in 2012/13 representing 7.8. The 7.8 implies that the average income of the poor fell below the upper poverty line (GHC 1,134) by 7.8. Although, the MDG target of halving poverty which stood at 51.7 in 1991/92 by 2015 was achieved, poverty is still prominent in rural localities. Proportion of the poor is high among those living in rural savannah than those in rural coastal and forest areas.
Poverty and inequality retard development. Poverty is a major cause of under-nutrition and ill health which retard development. Although, the proportion of Ghanaian in extreme poverty reduced from 27 to 23 over the period, considerable poverty remains in some districts especially, districts in the three northern regions of Ghana. Their health risk exposure is disproportionately high. The poor experience a disproportionate share of ill health and often live in unsafe crowded housing facilities and poor environment. About 99 of all deaths from AIDS, tuberculosis and malaria occur in developing countries (IMF, 2004). This situation is a refl ection of uneven economic development and inadequate primary health care in remote rural areas.
In Ghana, Two ly-based poverty lines are derived from this procedure:
1. A lower poverty line of 792.05 Ghana Cedis per adult per year: this focuses on what is needed to meet the requirements of household members. Individuals whose total expenditure falls below this line are considered to be in extreme poverty, since even if they allocated their entire budget to food, they would not be able to meet their minimum nutrition requirements (if they consume the average consumption basket).
2. An upper poverty line of 1314.00 Ghana Cedis per adult per year: this incorporates both essential food and non-food consumption. Individuals consuming above this level can be considered able to purchase enough food to meet their requirements and their basic non-food needs.
state_of_the_nations_interior_new.indd 150state_of_the_nations_interior_new.indd 150 05/02/19 11.0605/02/19 11.06
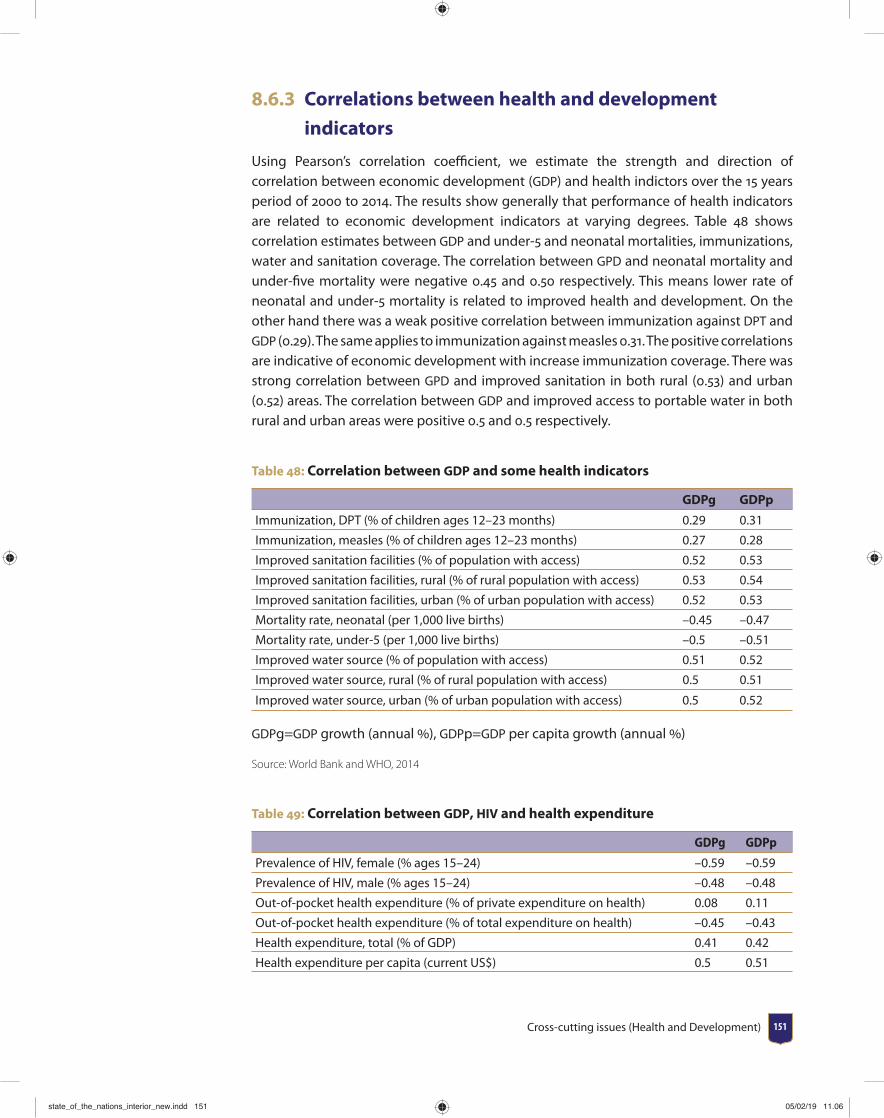
Cross-cutting issues (Health and Development) 151
8.6.3 Correlations between health and development
indicators
Using Pearson’s correlation coeffi cient, we estimate the strength and direction of correlation between economic development (GDP) and health indictors over the 15 years period of 2000 to 2014. The results show generally that performance of health indicators are related to economic development indicators at varying degrees. Table 48 shows correlation estimates between GDP and under-5 and neonatal mortalities, immunizations, water and sanitation coverage. The correlation between GPD and neonatal mortality and under-fi ve mortality were negative 0.45 and 0.50 respectively. This means lower rate of neonatal and under-5 mortality is related to improved health and development. On the other hand there was a weak positive correlation between immunization against DPT and GDP (0.29). The same applies to immunization against measles 0.31. The positive correlations are indicative of economic development with increase immunization coverage. There was strong correlation between GPD and improved sanitation in both rural (0.53) and urban (0.52) areas. The correlation between GDP and improved access to portable water in both rural and urban areas were positive 0.5 and 0.5 respectively.
Table 48: Correlation between GDP and some health indicators
GDPg GDPp
Immunization, DPT (% of children ages 12–23 months) 0.29 0.31
Immunization, measles (% of children ages 12–23 months) 0.27 0.28
Improved sanitation facilities (% of population with access) 0.52 0.53
Improved sanitation facilities, rural (% of rural population with access) 0.53 0.54
Improved sanitation facilities, urban (% of urban population with access) 0.52 0.53
Mortality rate, neonatal (per 1,000 live births) –0.45 –0.47
Mortality rate, under-5 (per 1,000 live births) –0.5 –0.51
Improved water source (% of population with access) 0.51 0.52
Improved water source, rural (% of rural population with access) 0.5 0.51
Improved water source, urban (% of urban population with access) 0.5 0.52
GDPg=GDP growth (annual ), GDPp=GDP per capita growth (annual )
Source: World Bank and WHO, 2014
Table 49: Correlation between GDP, HIV and health expenditure
GDPg GDPp
Prevalence of HIV, female (% ages 15–24) –0.59 –0.59
Prevalence of HIV, male (% ages 15–24) –0.48 –0.48
Out-of-pocket health expenditure (% of private expenditure on health) 0.08 0.11
Out-of-pocket health expenditure (% of total expenditure on health) –0.45 –0.43
Health expenditure, total (% of GDP) 0.41 0.42
Health expenditure per capita (current US$) 0.5 0.51
state_of_the_nations_interior_new.indd 151state_of_the_nations_interior_new.indd 151 05/02/19 11.0605/02/19 11.06
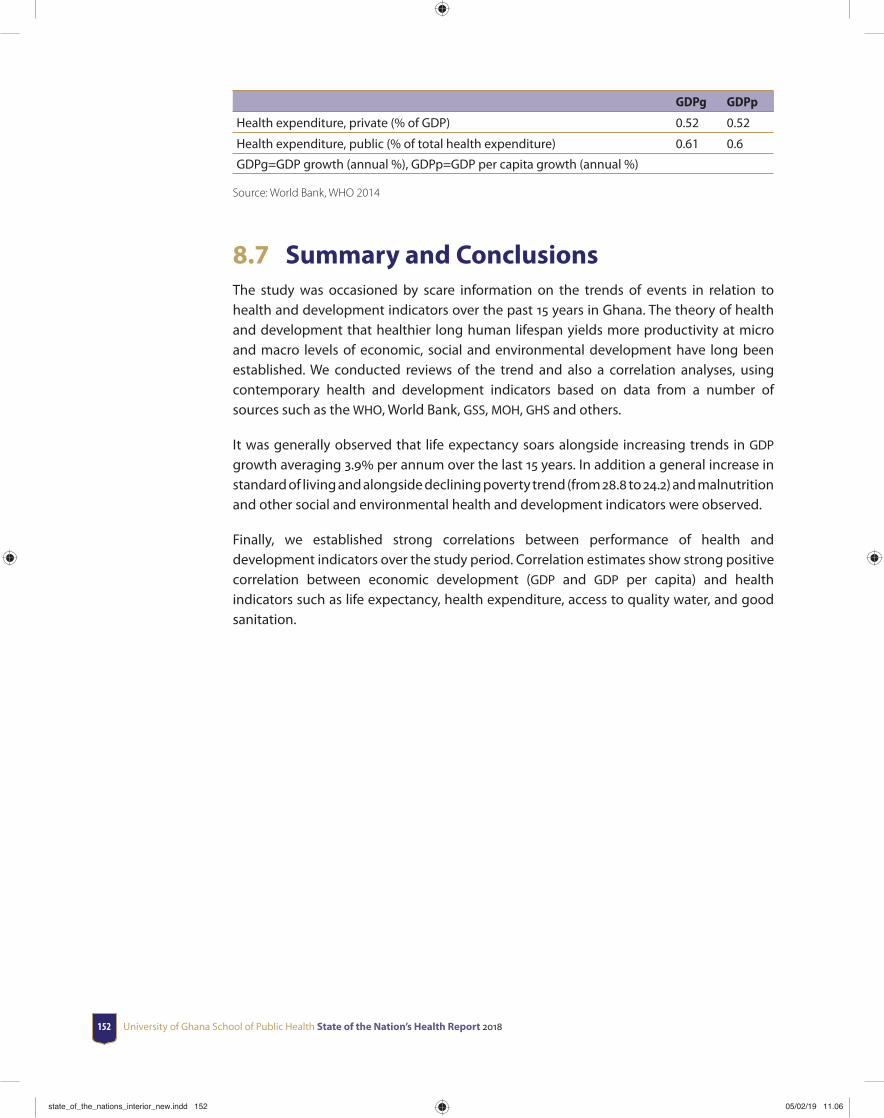
University of Ghana School of Public Health State of the Nation’s Health Report 2018152
GDPg GDPp
Health expenditure, private (% of GDP) 0.52 0.52
Health expenditure, public (% of total health expenditure) 0.61 0.6
GDPg=GDP growth (annual %), GDPp=GDP per capita growth (annual %)
Source: World Bank, WHO 2014
8.7 Summary and ConclusionsThe study was occasioned by scare information on the trends of events in relation to health and development indicators over the past 15 years in Ghana. The theory of health and development that healthier long human lifespan yields more productivity at micro and macro levels of economic, social and environmental development have long been established. We conducted reviews of the trend and also a correlation analyses, using contemporary health and development indicators based on data from a number of sources such as the WHO, World Bank, GSS, MOH, GHS and others.
It was generally observed that life expectancy soars alongside increasing trends in GDP growth averaging 3.9 per annum over the last 15 years. In addition a general increase in standard of living and alongside declining poverty trend (from 28.8 to 24.2) and malnutrition and other social and environmental health and development indicators were observed.
Finally, we established strong correlations between performance of health and development indicators over the study period. Correlation estimates show strong positive correlation between economic development (GDP and GDP per capita) and health indicators such as life expectancy, health expenditure, access to quality water, and good sanitation.
state_of_the_nations_interior_new.indd 152state_of_the_nations_interior_new.indd 152 05/02/19 11.0605/02/19 11.06

Appendices 153
Appendices
Appendix 1 Doctors Situation by Region and Year
Year AshantiBrong Ahafo
Central EasternGreater Accra
NorthernUpper East
Upper West
Volta Western Total
2011 487 117 81 132 812 98 22 12 67 72 1,900
2012 363 120 79 106 948 114 22 12 61 66 1,891
2013 320 109 72 107 1,103 97 25 8 64 61 1,966
2014 347 108 79 125 1,361 89 24 15 85 77 2,3102015 559 127 101 141 1,172 125 34 18 98 63 2,438
Absolute Increase2012 -124 3 -2 -26 136 16 0 0 -6 -6 -9
2013 -43 -11 -7 1 155 -17 3 -4 3 -5 75
2014 27 -1 7 18 258 -8 -1 7 21 16 344
2015 212 19 22 16 -189 36 10 3 13 -14 128
Total 72 10 20 9 360 27 12 6 31 -9 538
Percentage Increase (Over 2011 Workforce)2012 -25.5 2.6 -2.5 -19.7 16.7 16.3 0.0 0.0 -9.0 -8.3 -0.5
2013 -8.8 -9.4 -8.6 0.8 19.1 -17.3 13.6 -33.3 4.5 -6.9 3.9
2014 5.5 -0.9 8.6 13.6 31.8 -8.2 -4.5 58.3 31.3 22.2 18.1
201543.5 16.2 27.2 12.1 -23.3 36.7 45.5 25.0 19.4 -19.4 6.7
Total14.8 8.5 24.7 6.8 44.3 27.6 54.5 50.0 46.3 -12.5 28.3
state_of_the_nations_interior_new.indd 153state_of_the_nations_interior_new.indd 153 05/02/19 11.0605/02/19 11.06

University of Ghana School of Public Health State of the Nation’s Health Report 2018154
Appendix 2 Specialists/Consultants Situation by Region and Year
Year AshantiBrong Ahafo
Central EasternGreater Accra
NorthernUpper East
Upper West
Volta Western Total
2011 142 28 25 33 269 18 4 5 23 18 565
2012 156 34 25 33 261 23 5 6 29 23 595
2013 173 32 29 40 280 21 7 6 34 27 649
2014 195 37 35 46 290 28 11 6 29 31 708
2015 201 39 35 42 296 29 12 7 32 33 726
Absolute Increase
2012 14 6 0 0 -8 5 1 1 6 5 30
2013 17 -2 4 7 19 -2 2 0 5 4 54
2014 22 5 6 6 10 7 4 0 -5 4 59
2015 6 2 0 -4 6 1 1 1 3 2 18
Total 59 11 10 9 27 11 8 2 9 15 161
Percentage Increase (Over 2011 Workforce)
2012 9.9 21.4 0.0 0.0 -3.0 27.8 25.0 20.0 26.1 27.8 5.3
2013 12.0 -7.1 16.0 21.2 7.1 -11.1 50.0 0.0 21.7 22.2 9.6
2014 15.5 17.9 24.0 18.2 3.7 38.9 100.0 0.0 -21.7 22.2 10.4
2015 4.2 7.1 0.0 -12.1 2.2 5.6 25.0 20.0 13.0 11.1 3.2
Total 41.5 39.3 40.0 27.3 10.0 61.1 200.0 40.0 39.1 83.3 28.5
Appendix 3 Professional Nurse Situation by region and year
Year AshantiBrong Ahafo
Central EasternGreater Accra
NorthernUpper East
Upper West
Volta Western Total
2011 1,789 674 717 921 2,928 789 424 259 659 617 9,777
2012 2,096 720 858 1,019 3,336 900 505 288 712 691 11,125
2013 2,286 815 960 1,117 3,530 1,067 604 311 785 770 12,245
2014 2,885 997 1,256 1,331 3,995 1,305 750 364 978 915 14,776
2015 3,219 1,228 1,454 1,466 4,279 1,597 1,059 435 1,147 978 16,862
Absolute Increase
2012 307 46 141 98 408 111 81 29 53 74 1,348
2013 190 95 102 98 194 167 99 23 73 79 1,120
2014 599 182 296 214 465 238 146 53 193 145 2,531
2015 334 231 198 135 284 292 309 71 169 63 2,086
Total 1,430 554 737 545 1,351 808 635 176 488 361 7,085
Percentage Increase (Over 2011 Workforce)
2012 17.2 6.8 19.7 10.6 13.9 14.1 19.1 11.2 8.0 12.0 13.8
2013 10.6 14.1 14.2 10.6 6.6 21.2 23.3 8.9 11.1 12.8 11.5
2014 33.5 27.0 41.3 23.2 15.9 30.2 34.4 20.5 29.3 23.5 25.9
2015 18.7 34.3 27.6 14.7 9.7 37.0 72.9 27.4 25.6 10.2 21.3
Total 79.9 82.2 102.8 59.2 46.1 102.4 149.8 68.0 74.1 58.5 72.5
state_of_the_nations_interior_new.indd 154state_of_the_nations_interior_new.indd 154 05/02/19 11.0605/02/19 11.06
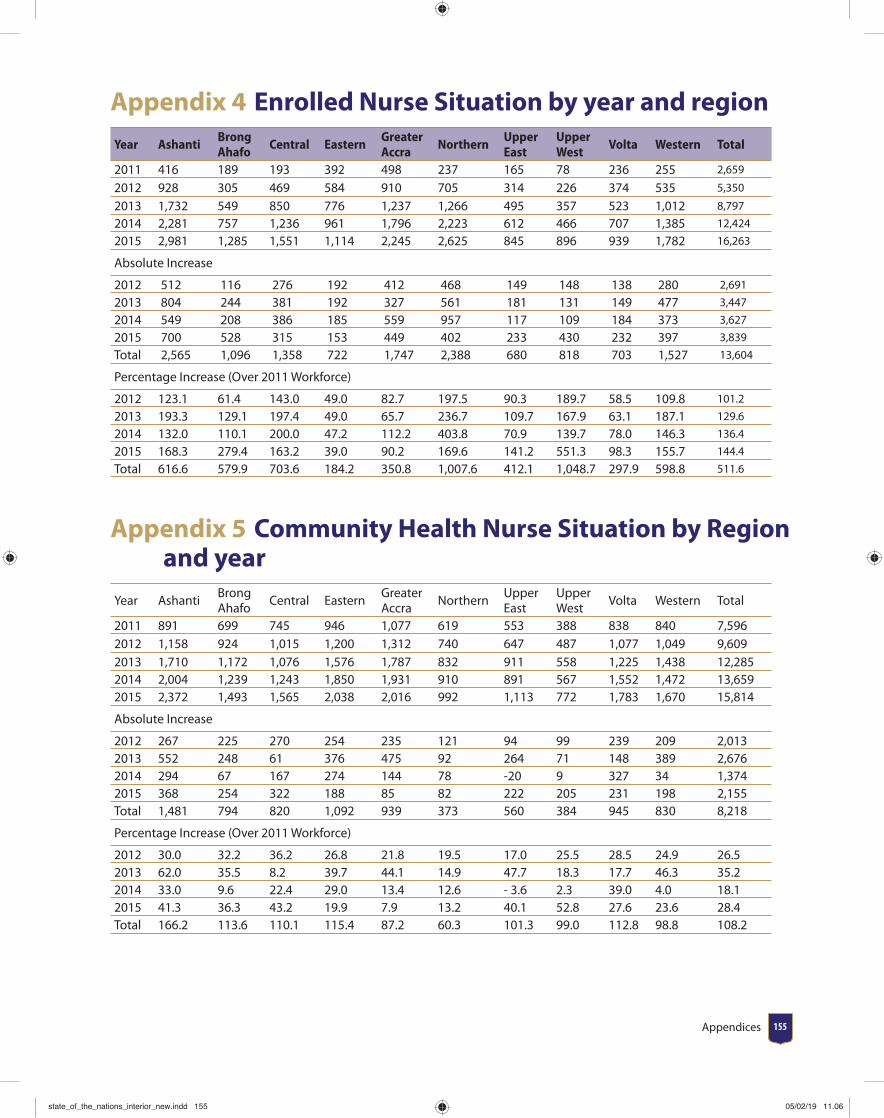
Appendices 155
Appendix 4 Enrolled Nurse Situation by year and region
Year AshantiBrong Ahafo
Central EasternGreater Accra
NorthernUpper East
Upper West
Volta Western Total
2011 416 189 193 392 498 237 165 78 236 255 2,659
2012 928 305 469 584 910 705 314 226 374 535 5,350
2013 1,732 549 850 776 1,237 1,266 495 357 523 1,012 8,797
2014 2,281 757 1,236 961 1,796 2,223 612 466 707 1,385 12,424
2015 2,981 1,285 1,551 1,114 2,245 2,625 845 896 939 1,782 16,263
Absolute Increase
2012 512 116 276 192 412 468 149 148 138 280 2,691
2013 804 244 381 192 327 561 181 131 149 477 3,447
2014 549 208 386 185 559 957 117 109 184 373 3,627
2015 700 528 315 153 449 402 233 430 232 397 3,839
Total 2,565 1,096 1,358 722 1,747 2,388 680 818 703 1,527 13,604
Percentage Increase (Over 2011 Workforce)
2012 123.1 61.4 143.0 49.0 82.7 197.5 90.3 189.7 58.5 109.8 101.2
2013 193.3 129.1 197.4 49.0 65.7 236.7 109.7 167.9 63.1 187.1 129.6
2014 132.0 110.1 200.0 47.2 112.2 403.8 70.9 139.7 78.0 146.3 136.4
2015 168.3 279.4 163.2 39.0 90.2 169.6 141.2 551.3 98.3 155.7 144.4
Total 616.6 579.9 703.6 184.2 350.8 1,007.6 412.1 1,048.7 297.9 598.8 511.6
Appendix 5 Community Health Nurse Situation by Region and year
Year AshantiBrong Ahafo
Central EasternGreater Accra
NorthernUpper East
Upper West
Volta Western Total
2011 891 699 745 946 1,077 619 553 388 838 840 7,5962012 1,158 924 1,015 1,200 1,312 740 647 487 1,077 1,049 9,6092013 1,710 1,172 1,076 1,576 1,787 832 911 558 1,225 1,438 12,2852014 2,004 1,239 1,243 1,850 1,931 910 891 567 1,552 1,472 13,6592015 2,372 1,493 1,565 2,038 2,016 992 1,113 772 1,783 1,670 15,814
Absolute Increase
2012 267 225 270 254 235 121 94 99 239 209 2,0132013 552 248 61 376 475 92 264 71 148 389 2,6762014 294 67 167 274 144 78 -20 9 327 34 1,3742015 368 254 322 188 85 82 222 205 231 198 2,155Total 1,481 794 820 1,092 939 373 560 384 945 830 8,218
Percentage Increase (Over 2011 Workforce)
2012 30.0 32.2 36.2 26.8 21.8 19.5 17.0 25.5 28.5 24.9 26.52013 62.0 35.5 8.2 39.7 44.1 14.9 47.7 18.3 17.7 46.3 35.22014 33.0 9.6 22.4 29.0 13.4 12.6 - 3.6 2.3 39.0 4.0 18.12015 41.3 36.3 43.2 19.9 7.9 13.2 40.1 52.8 27.6 23.6 28.4Total 166.2 113.6 110.1 115.4 87.2 60.3 101.3 99.0 112.8 98.8 108.2
state_of_the_nations_interior_new.indd 155state_of_the_nations_interior_new.indd 155 05/02/19 11.0605/02/19 11.06
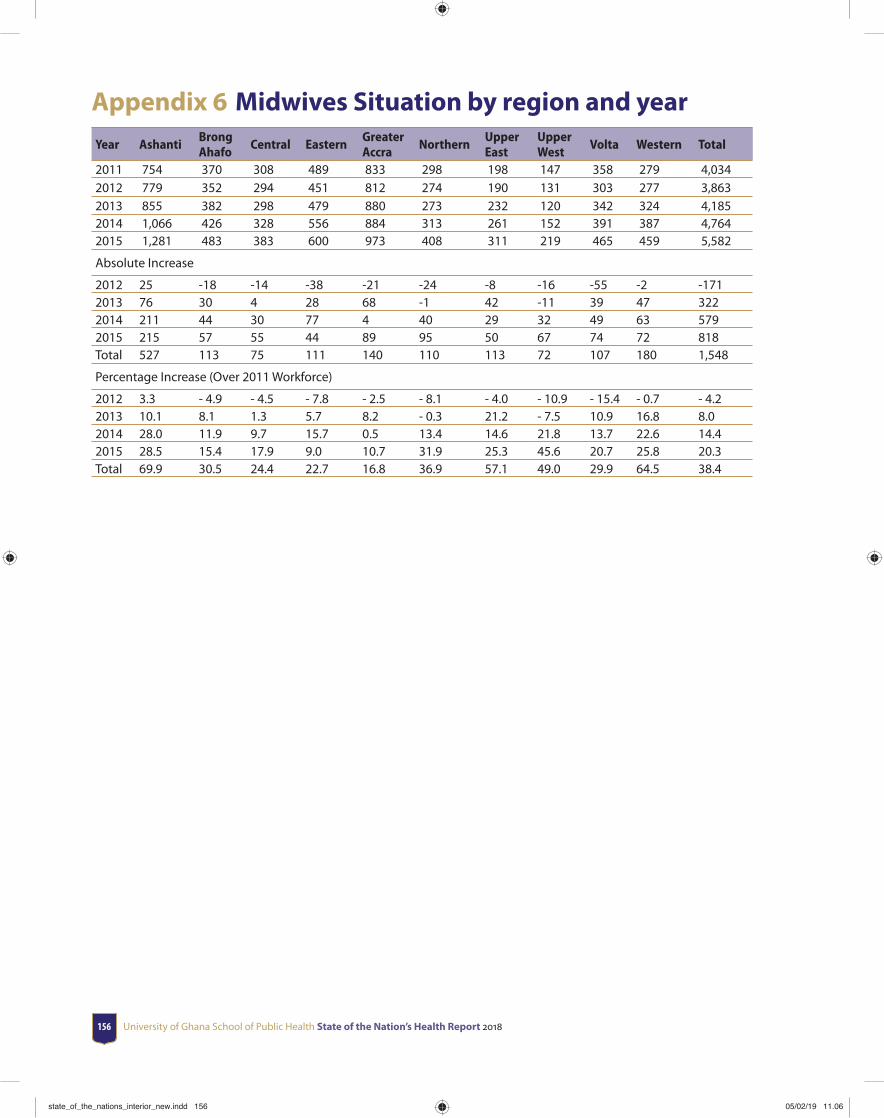
University of Ghana School of Public Health State of the Nation’s Health Report 2018156
Appendix 6 Midwives Situation by region and year
Year AshantiBrong Ahafo
Central EasternGreater Accra
NorthernUpper East
Upper West
Volta Western Total
2011 754 370 308 489 833 298 198 147 358 279 4,0342012 779 352 294 451 812 274 190 131 303 277 3,8632013 855 382 298 479 880 273 232 120 342 324 4,1852014 1,066 426 328 556 884 313 261 152 391 387 4,7642015 1,281 483 383 600 973 408 311 219 465 459 5,582
Absolute Increase
2012 25 -18 -14 -38 -21 -24 -8 -16 -55 -2 -1712013 76 30 4 28 68 -1 42 -11 39 47 3222014 211 44 30 77 4 40 29 32 49 63 5792015 215 57 55 44 89 95 50 67 74 72 818Total 527 113 75 111 140 110 113 72 107 180 1,548
Percentage Increase (Over 2011 Workforce)
2012 3.3 - 4.9 - 4.5 - 7.8 - 2.5 - 8.1 - 4.0 - 10.9 - 15.4 - 0.7 - 4.22013 10.1 8.1 1.3 5.7 8.2 - 0.3 21.2 - 7.5 10.9 16.8 8.02014 28.0 11.9 9.7 15.7 0.5 13.4 14.6 21.8 13.7 22.6 14.42015 28.5 15.4 17.9 9.0 10.7 31.9 25.3 45.6 20.7 25.8 20.3Total 69.9 30.5 24.4 22.7 16.8 36.9 57.1 49.0 29.9 64.5 38.4
state_of_the_nations_interior_new.indd 156state_of_the_nations_interior_new.indd 156 05/02/19 11.0605/02/19 11.06

Appendices 157
Ap
pen
dix
7 M
ater
nal
Hea
lth
ser
vice
s an
d o
utc
om
es20
1020
1120
1220
1320
14
Regi
on
Expected pregnancies
ANC registrants
ANC Coverage
% making 4+ visits
Expected pregnancies
ANC registrants
ANC Coverage
% making 4+ visits
Expected pregnancies
ANC registrants
ANC Coverage
% making 4+ visits
Expected pregnancies
ANC registrants
ANC Coverage
% making 4+ visits
Expected pregnancies
ANC registrants
ANC Coverage
% making 4+ visits
Ash
anti
191,
215.
216
1,25
7.0
84.3
397
.31
204,
678
167,
937
82.0
084
.80
202,
330
165,
593
81.6
085
.30
205,
334
169,
099
82.4
093
.50
211,
681
162,
127
76.
60 9
0.60
Up
per
W
est
92,4
39.3
23,5
19.0
25.4
470
.32
21,6
8223
,513
108.
4069
.70
29,4
6324
,853
84.1
063
.90
28,4
3426
,054
91.6
070
.00
30,0
30 2
5,57
7 8
5.20
72.
30
Wes
tern
88,0
74.5
92,2
54.0
104.
7565
.28
110,
850
104,
931
94.7
062
.50
105,
632
106,
792
100.
8066
.30
101,
018
104,
833
103.
8063
.90
108,
593
101,
843
93.
80 7
4.70
Cen
tral
105,
326.
286
,522
.082
.15
83.4
381
,009
87,3
4610
7.80
77.0
095
,861
93,6
3097
.40
88.2
099
,151
91,7
1492
.50
76.7
010
3,42
0 8
9,59
2 8
6.60
75.
50
Nor
ther
n16
0,40
2.2
113,
157.
070
.55
55.0
083
,756
114,
277
136.
4055
.90
113,
796
127,
398
111.
6058
.30
114,
703
132,
045
115.
1057
.10
111,
193
130,
599
117.
50 6
2.60
Up
per
Ea
st99
,178
.434
,755
.035
.04
78.6
140
,549
38,3
2994
.50
92.2
042
,990
37,8
6387
.80
94.5
043
,387
36,1
5583
.30
87.5
043
,908
36,
715
83.
60 9
5.20
Gre
ater
A
ccra
41,8
61.8
95,0
81.0
227.
1312
2.32
168,
948
134,
468
79.6
011
4.10
172,
181
152,
650
88.4
092
.20
175,
787
152,
730
86.9
074
.60
181,
236
159,
373
87.
90 7
8.20
East
ern
28,0
84.4
65,5
60.0
233.
4465
.10
104,
908
78,8
3375
.10
66.7
010
7,54
593
,442
86.6
074
.00
112,
102
92,0
5882
.10
67.1
011
8,33
5 9
1,09
3 7
7.00
66.
40Br
ong
Aha
fo84
,730
.164
,215
.075
.79
81.5
398
,367
89,4
5490
.90
65.5
097
,011
97,4
3410
0.20
66.4
098
,058
94,6
4896
.50
64.0
010
1,58
6 9
1,74
7 9
0.30
77.
80
Volt
a95
,040
.863
,477
.066
.79
76.5
110
1,11
972
,980
72.2
073
.90
89,2
6473
,038
81.6
074
.30
91,2
4571
,409
78.3
067
.70
93,5
26 7
2,00
3 7
7.00
66.
70
Nat
iona
l98
6,35
2.9
799,
797.
081
.09
81.9
41,
015,
866
912,
068
89.8
077
.80
1,05
6,07
197
2,69
391
.90
77.1
01,
069,
219
970,
745
90.8
072
.70
1,10
3,50
9 96
0,66
9 8
7.10
76.
00
state_of_the_nations_interior_new.indd 157state_of_the_nations_interior_new.indd 157 05/02/19 11.0605/02/19 11.06
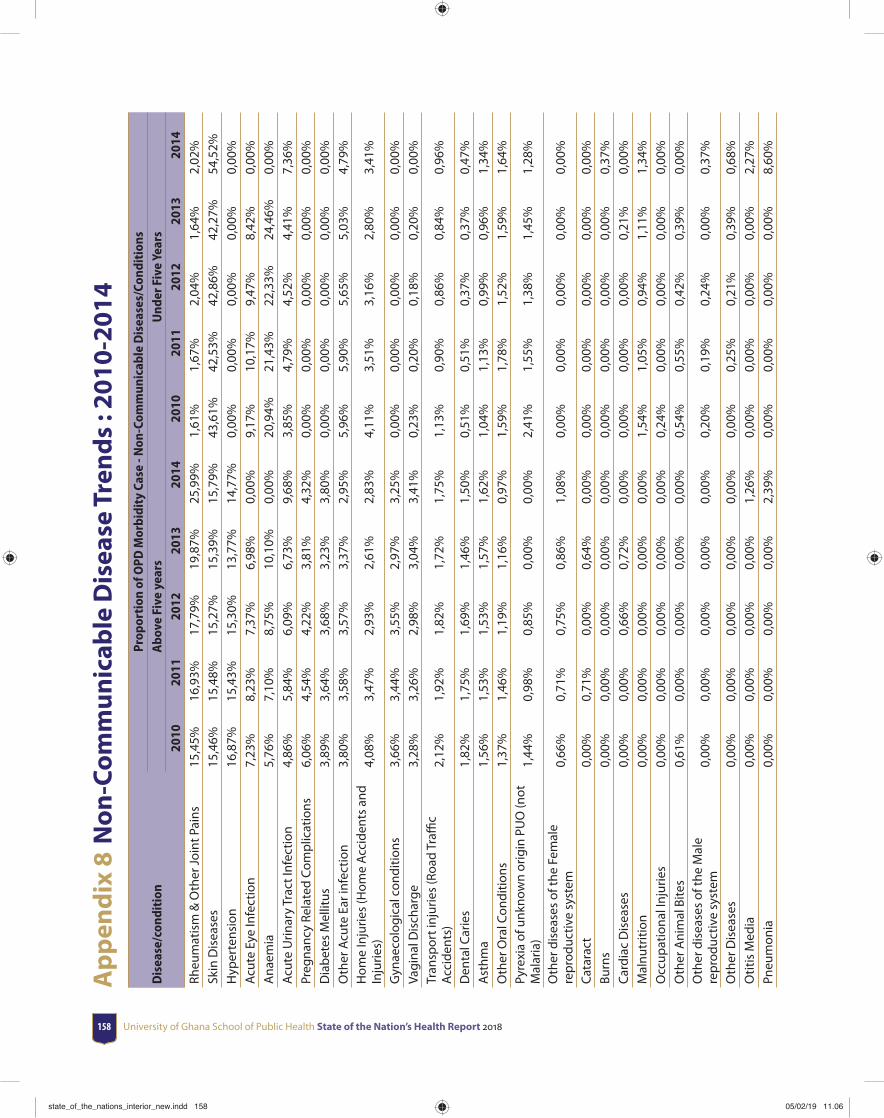
University of Ghana School of Public Health State of the Nation’s Health Report 2018158
Ap
pen
dix
8 N
on
-Co
mm
un
icab
le D
isea
se T
ren
ds
: 201
0-20
14
Dis
ease
/con
diti
onPr
opor
tion
of O
PD M
orbi
dity
Cas
e - N
on-C
omm
unic
able
Dis
ease
s/Co
ndit
ions
Abo
ve F
ive
year
sU
nder
Fiv
e Ye
ars
2010
2011
2012
2013
2014
2010
2011
2012
2013
2014
Rheu
mat
ism
& O
ther
Joi
nt P
ains
15,4
5%16
,93%
17,7
9%19
,87%
25,9
9%1,
61%
1,67
%2,
04%
1,64
%2,
02%
Skin
Dis
ease
s15
,46%
15,4
8%15
,27%
15,3
9%15
,79%
43,6
1%42
,53%
42,8
6%42
,27%
54,5
2%H
yper
tens
ion
16,8
7%15
,43%
15,3
0%13
,77%
14,7
7%0,
00%
0,00
%0,
00%
0,00
%0,
00%
Acu
te E
ye In
fect
ion
7,23
%8,
23%
7,37
%6,
98%
0,00
%9,
17%
10,1
7%9,
47%
8,42
%0,
00%
Ana
emia
5,76
%7,
10%
8,75
%10
,10%
0,00
%20
,94%
21,4
3%22
,33%
24,4
6%0,
00%
Acu
te U
rinar
y Tr
act I
nfec
tion
4,86
%5,
84%
6,09
%6,
73%
9,68
%3,
85%
4,79
%4,
52%
4,41
%7,
36%
Preg
nanc
y Re
late
d C
omp
licat
ions
6,06
%4,
54%
4,22
%3,
81%
4,32
%0,
00%
0,00
%0,
00%
0,00
%0,
00%
Dia
bet
es M
ellit
us3,
89%
3,64
%3,
68%
3,23
%3,
80%
0,00
%0,
00%
0,00
%0,
00%
0,00
%O
ther
Acu
te E
ar in
fect
ion
3,80
%3,
58%
3,57
%3,
37%
2,95
%5,
96%
5,90
%5,
65%
5,03
%4,
79%
Hom
e In
jurie
s (H
ome
Acc
iden
ts a
nd
Inju
ries)
4,08
%3,
47%
2,93
%2,
61%
2,83
%4,
11%
3,51
%3,
16%
2,80
%3,
41%
Gyn
aeco
logi
cal c
ondi
tions
3,66
%3,
44%
3,55
%2,
97%
3,25
%0,
00%
0,00
%0,
00%
0,00
%0,
00%
Vagi
nal D
isch
arge
3,28
%3,
26%
2,98
%3,
04%
3,41
%0,
23%
0,20
%0,
18%
0,20
%0,
00%
Tran
spor
t inj
urie
s (R
oad
Traffi
c
Acc
iden
ts)
2,12
%1,
92%
1,82
%1,
72%
1,75
%1,
13%
0,90
%0,
86%
0,84
%0,
96%
Den
tal C
arie
s1,
82%
1,75
%1,
69%
1,46
%1,
50%
0,51
%0,
51%
0,37
%0,
37%
0,47
%A
sthm
a1,
56%
1,53
%1,
53%
1,57
%1,
62%
1,04
%1,
13%
0,99
%0,
96%
1,34
%O
ther
Ora
l Con
ditio
ns1,
37%
1,46
%1,
19%
1,16
%0,
97%
1,59
%1,
78%
1,52
%1,
59%
1,64
%Py
rexi
a of
unk
now
n or
igin
PU
O (n
ot
Mal
aria
)1,
44%
0,98
%0,
85%
0,00
%0,
00%
2,41
%1,
55%
1,38
%1,
45%
1,28
%
Oth
er d
isea
ses
of th
e Fe
mal
e re
pro
duct
ive
syst
em0,
66%
0,71
%0,
75%
0,86
%1,
08%
0,00
%0,
00%
0,00
%0,
00%
0,00
%
Cat
arac
t0,
00%
0,71
%0,
00%
0,64
%0,
00%
0,00
%0,
00%
0,00
%0,
00%
0,00
%Bu
rns
0,00
%0,
00%
0,00
%0,
00%
0,00
%0,
00%
0,00
%0,
00%
0,00
%0,
37%
Car
diac
Dis
ease
s0,
00%
0,00
%0,
66%
0,72
%0,
00%
0,00
%0,
00%
0,00
%0,
21%
0,00
%M
alnu
triti
on0,
00%
0,00
%0,
00%
0,00
%0,
00%
1,54
%1,
05%
0,94
%1,
11%
1,34
%O
ccup
atio
nal I
njur
ies
0,00
%0,
00%
0,00
%0,
00%
0,00
%0,
24%
0,00
%0,
00%
0,00
%0,
00%
Oth
er A
nim
al B
ites
0,61
%0,
00%
0,00
%0,
00%
0,00
%0,
54%
0,55
%0,
42%
0,39
%0,
00%
Oth
er d
isea
ses
of th
e M
ale
rep
rodu
ctiv
e sy
stem
0,00
%0,
00%
0,00
%0,
00%
0,00
%0,
20%
0,19
%0,
24%
0,00
%0,
37%
Oth
er D
isea
ses
0,00
%0,
00%
0,00
%0,
00%
0,00
%0,
00%
0,25
%0,
21%
0,39
%0,
68%
Otit
is M
edia
0,00
%0,
00%
0,00
%0,
00%
1,26
%0,
00%
0,00
%0,
00%
0,00
%2,
27%
Pneu
mon
ia0,
00%
0,00
%0,
00%
0,00
%2,
39%
0,00
%0,
00%
0,00
%0,
00%
8,60
%
state_of_the_nations_interior_new.indd 158state_of_the_nations_interior_new.indd 158 05/02/19 11.0605/02/19 11.06
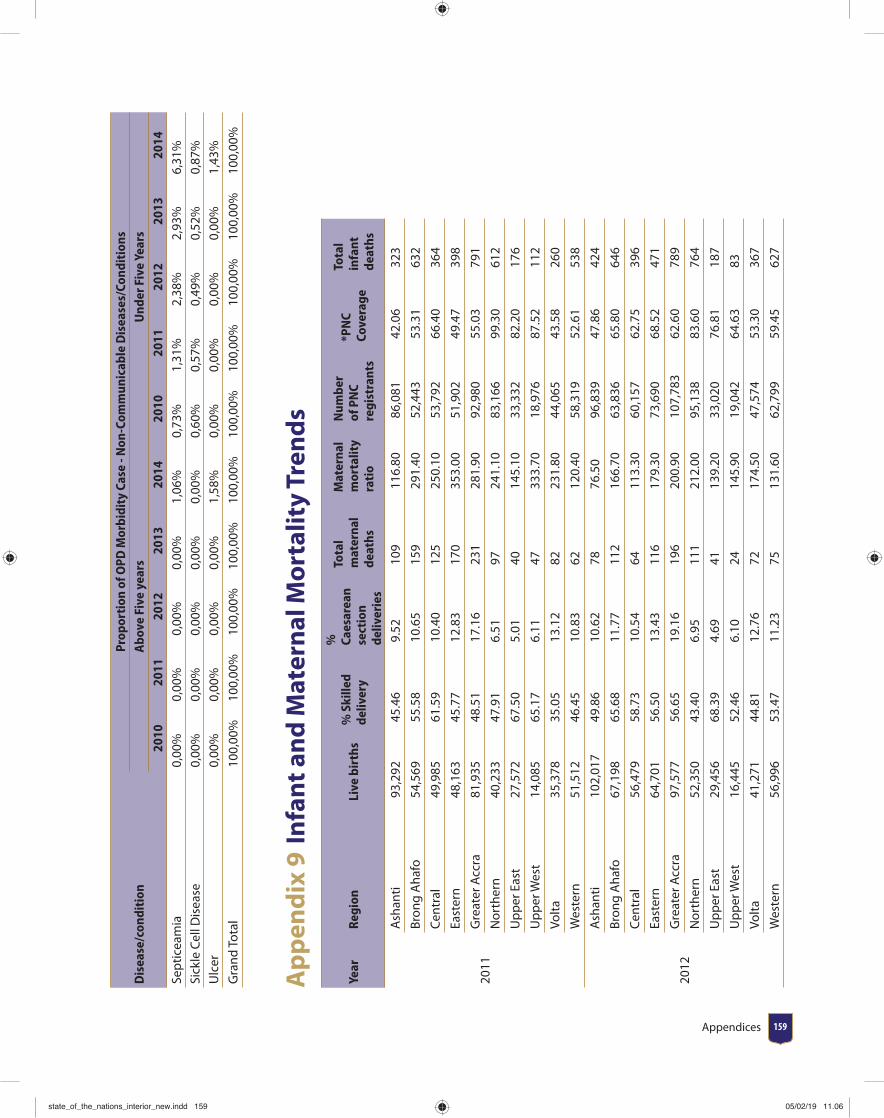
Appendices 159
Dis
ease
/con
diti
onPr
opor
tion
of O
PD M
orbi
dity
Cas
e - N
on-C
omm
unic
able
Dis
ease
s/Co
ndit
ions
Abo
ve F
ive
year
sU
nder
Fiv
e Ye
ars
2010
2011
2012
2013
2014
2010
2011
2012
2013
2014
Sep
ticea
mia
0,00
%0,
00%
0,00
%0,
00%
1,06
%0,
73%
1,31
%2,
38%
2,93
%6,
31%
Sick
le C
ell D
isea
se0,
00%
0,00
%0,
00%
0,00
%0,
00%
0,60
%0,
57%
0,49
%0,
52%
0,87
%U
lcer
0,00
%0,
00%
0,00
%0,
00%
1,58
%0,
00%
0,00
%0,
00%
0,00
%1,
43%
Gra
nd T
otal
100,
00%
100,
00%
100,
00%
100,
00%
100,
00%
100,
00%
100,
00%
100,
00%
100,
00%
100,
00%
Ap
pen
dix
9 I
nfa
nt a
nd
Mat
ern
al M
ort
alit
y Tr
end
s
Year
Regi
onLi
ve b
irth
s%
Ski
lled
deliv
ery
%
Caes
area
n se
ctio
n de
liver
ies
Tota
l m
ater
nal
deat
hs
Mat
erna
l m
orta
lity
rati
o
Num
ber
of P
NC
regi
stra
nts
*PN
C Co
vera
ge
Tota
l in
fant
de
aths
2011
Ash
anti
93,
292
45.
46 9
.52
109
116
.80
86,
081
42.
06 3
23
Bron
g A
hafo
54,
569
55.
58 1
0.65
159
291
.40
52,
443
53.
31 6
32
Cen
tral
49,
985
61.
59 1
0.40
125
250
.10
53,
792
66.
40 3
64
East
ern
48,
163
45.
77 1
2.83
170
353
.00
51,
902
49.
47 3
98
Gre
ater
Acc
ra 8
1,93
5 4
8.51
17.
16 2
31 2
81.9
0 9
2,98
0 5
5.03
791
Nor
ther
n 4
0,23
3 4
7.91
6.5
1 9
7 2
41.1
0 8
3,16
6 9
9.30
612
Up
per
Eas
t 2
7,57
2 6
7.50
5.0
1 4
0 1
45.1
0 3
3,33
2 8
2.20
176
Up
per
Wes
t 1
4,08
5 6
5.17
6.1
1 4
7 3
33.7
0 1
8,97
6 8
7.52
112
Volt
a 3
5,37
8 3
5.05
13.
12 8
2 2
31.8
0 4
4,06
5 4
3.58
260
Wes
tern
51,
512
46.
45 1
0.83
62
120
.40
58,
319
52.
61 5
38
2012
Ash
anti
102
,017
49.
86 1
0.62
78
76.
50 9
6,83
9 4
7.86
424
Bron
g A
hafo
67,
198
65.
68 1
1.77
112
166
.70
63,
836
65.
80 6
46
Cen
tral
56,
479
58.
73 1
0.54
64
113
.30
60,
157
62.
75 3
96
East
ern
64,
701
56.
50 1
3.43
116
179
.30
73,
690
68.
52 4
71
Gre
ater
Acc
ra 9
7,57
7 5
6.65
19.
16 1
96 2
00.9
0 1
07,7
83 6
2.60
789
Nor
ther
n 5
2,35
0 4
3.40
6.9
5 1
11 2
12.0
0 9
5,13
8 8
3.60
764
Up
per
Eas
t 2
9,45
6 6
8.39
4.6
9 4
1 1
39.2
0 3
3,02
0 7
6.81
187
Up
per
Wes
t 1
6,44
5 5
2.46
6.1
0 2
4 1
45.9
0 1
9,04
2 6
4.63
83
Volt
a 4
1,27
1 4
4.81
12.
76 7
2 1
74.5
0 4
7,57
4 5
3.30
367
Wes
tern
56,
996
53.
47 1
1.23
75
131
.60
62,
799
59.
45 6
27
state_of_the_nations_interior_new.indd 159state_of_the_nations_interior_new.indd 159 05/02/19 11.0605/02/19 11.06
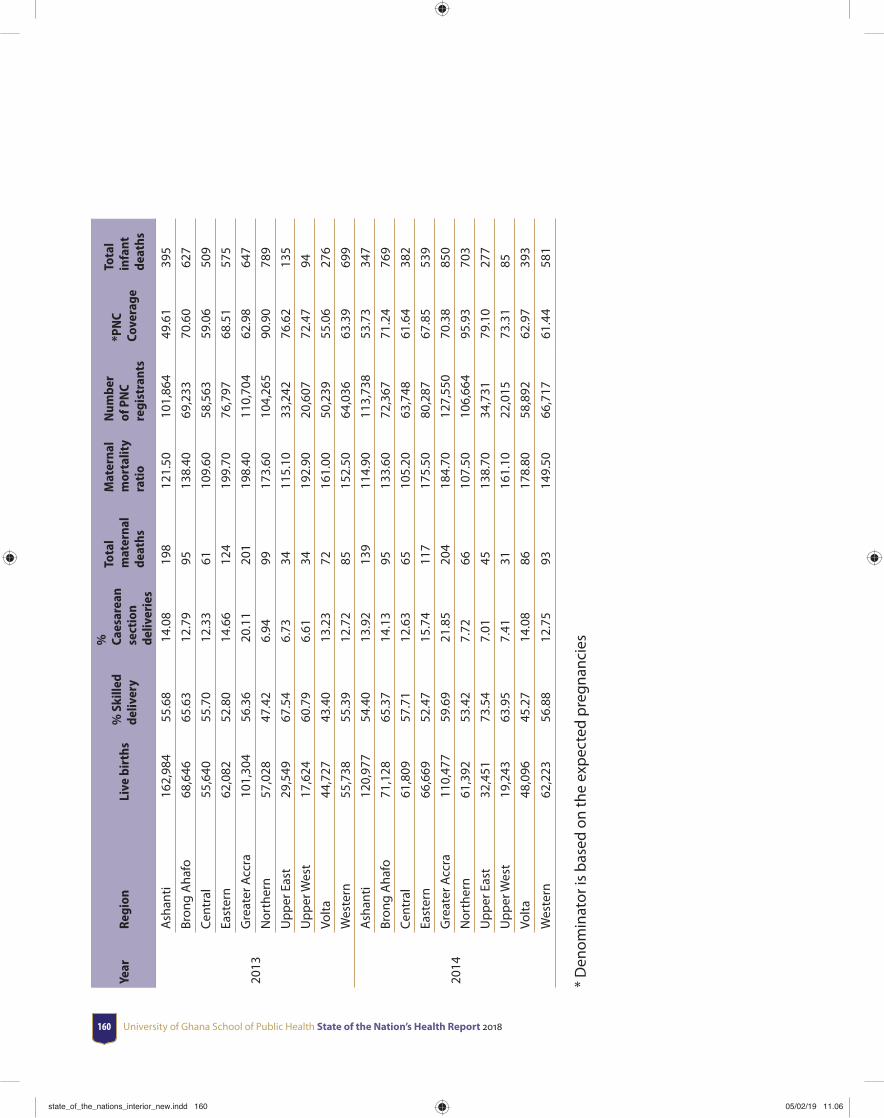
University of Ghana School of Public Health State of the Nation’s Health Report 2018160
Year
Regi
onLi
ve b
irth
s%
Ski
lled
deliv
ery
%
Caes
area
n se
ctio
n de
liver
ies
Tota
l m
ater
nal
deat
hs
Mat
erna
l m
orta
lity
rati
o
Num
ber
of P
NC
regi
stra
nts
*PN
C Co
vera
ge
Tota
l in
fant
de
aths
2013
Ash
anti
162
,984
55.
68 1
4.08
198
121
.50
101
,864
49.
61 3
95
Bron
g A
hafo
68,
646
65.
63 1
2.79
95
138
.40
69,
233
70.
60 6
27
Cen
tral
55,
640
55.
70 1
2.33
61
109
.60
58,
563
59.
06 5
09
East
ern
62,
082
52.
80 1
4.66
124
199
.70
76,
797
68.
51 5
75
Gre
ater
Acc
ra 1
01,3
04 5
6.36
20.
11 2
01 1
98.4
0 1
10,7
04 6
2.98
647
Nor
ther
n 5
7,02
8 4
7.42
6.9
4 9
9 1
73.6
0 1
04,2
65 9
0.90
789
Up
per
Eas
t 2
9,54
9 6
7.54
6.7
3 3
4 1
15.1
0 3
3,24
2 7
6.62
135
Up
per
Wes
t 1
7,62
4 6
0.79
6.6
1 3
4 1
92.9
0 2
0,60
7 7
2.47
94
Volt
a 4
4,72
7 4
3.40
13.
23 7
2 1
61.0
0 5
0,23
9 5
5.06
276
Wes
tern
55,
738
55.
39 1
2.72
85
152
.50
64,
036
63.
39 6
99
2014
Ash
anti
120
,977
54.
40 1
3.92
139
114
.90
113
,738
53.
73 3
47
Bron
g A
hafo
71,
128
65.
37 1
4.13
95
133
.60
72,
367
71.
24 7
69
Cen
tral
61,
809
57.
71 1
2.63
65
105
.20
63,
748
61.
64 3
82
East
ern
66,
669
52.
47 1
5.74
117
175
.50
80,
287
67.
85 5
39
Gre
ater
Acc
ra 1
10,4
77 5
9.69
21.
85 2
04 1
84.7
0 1
27,5
50 7
0.38
850
Nor
ther
n 6
1,39
2 5
3.42
7.7
2 6
6 1
07.5
0 1
06,6
64 9
5.93
703
Up
per
Eas
t 3
2,45
1 7
3.54
7.0
1 4
5 1
38.7
0 3
4,73
1 7
9.10
277
Up
per
Wes
t 1
9,24
3 6
3.95
7.4
1 3
1 1
61.1
0 2
2,01
5 7
3.31
85
Volt
a 4
8,09
6 4
5.27
14.
08 8
6 1
78.8
0 5
8,89
2 6
2.97
393
Wes
tern
62,
223
56.
88 1
2.75
93
149
.50
66,
717
61.
44 5
81
* D
enom
inat
or is
bas
ed o
n th
e ex
pec
ted
pre
gnan
cies
state_of_the_nations_interior_new.indd 160state_of_the_nations_interior_new.indd 160 05/02/19 11.0605/02/19 11.06
Glossary 161
Glossary
Adherence: the extent to which a person’s behaviour – taking medication, following a diet and/or changing lifestyle – corresponds with agreed recommendations from a health worker.
Age-specifi c fertility rate: the number of live births per 1000 women in a specifi c age group for a specifi ed geographic area and for a specifi c point in time.
Antiretroviral drugs: Medicines used to manage HIV.
Antiretroviral therapy: The use of a combination of three or more ARV drugs for treating HIV infection.
Blood Collection Index: Blood collection ratio per 1000 population in a year.
Case fatality rate: The proportion of people who die from a specifi ed disease among all individuals diagnosed with the disease over a certain period of time.
Consumer price ratio: ratio between median unit prices and the median international reference prices for that same product for the year preceding the survey.
Crude birth rate: number of live births per 1000 of population.
Early infant diagnosis: Testing of infants to determine their HIV status following possible exposure to HIV during pregnancy, delivery and postpartum through breastfeeding.
General fertility rate: the total number of live births per 1,000 women of reproductive age (ages 15 to 49 years) in a population per year.
Gross Domestic Product: The monetary value of all the fi nished goods and services produced within a country’s borders in a specifi c time period.
Human Development Index: A composite index measuring average achievement in three basic dimensions of human development—a long and healthy life, knowledge and a decent standard of living.
state_of_the_nations_interior_new.indd 161state_of_the_nations_interior_new.indd 161 05/02/19 11.0605/02/19 11.06
University of Ghana School of Public Health State of the Nation’s Health Report 2018162
Infant Mortality Rate (IMR): Number of infants dying between birth and exactly age 1, expressed per 1,000 live births in a given period.
Institutional Maternal Mortality Rate: is the annual number of female deaths that occur in health facilities in Ghana per 100,000 live births from any cause related to or aggravated by pregnancy or its management (excluding accidental or incidental causes).
Live birth: refers to the complete expulsion or extraction from its mother of a product of conception, irrespective of the duration of the pregnancy, which, after such separation, breathes or shows any other evidence of life - e.g. beating of the heart, pulsation of the umbilical cord or defi nite movement of voluntary muscles - whether or not the umbilical cord has been cut or the placenta is attached.
Life expectancy at birth: Average number of years that a newborn is expected to live if current mortality rates continue to apply.
Loss to Follow Up rate: A proportion of patients whose treatment is interrupted for 2 consecutive months or more after initiation of treatment to the number of patients who were initiated treatment within the same period.
Maternal Mortality: is the death of a woman while pregnant or within 42 days of termination of pregnancy, irrespective of the duration and site of the pregnancy, from any cause related to or aggravated by the pregnancy or its management but not from accidental or incidental causes.
Maternal Mortality Rate: is the annual number of female deaths per 100,000 live births from any cause related to or aggravated by pregnancy or its management (excluding accidental or incidental causes).
Medium-Term Expenditure Framework (MTEF): is annual, rolling three year-expenditure planning. It sets out the medium-term expenditure priorities and hard budget constraints against which sector plans can be developed and refi ned.
Modern family planning acceptor rate: The number of persons who accept any modern contraceptive for the fi rst time in their lives.
Neonatal Mortality Rate: Number of deaths during the fi rst 28 completed days of life per 1 000 live births in a given year or period.
Point-of-care testing: are tests conducted at or near the site at which care is being provided. Outpatients per capita: The number of outpatient visits to health facilities during one year relative to the total population of the same geographical area
Shirking: refers to a situation where a worker avoids working hard while at work.
Stillbirth: Baby born with no signs of life at or after 28 weeks’ gestation.
state_of_the_nations_interior_new.indd 162state_of_the_nations_interior_new.indd 162 05/02/19 11.0605/02/19 11.06
Glossary 163
Total Fertility Rate (TFR): The number of children who would be born to a woman if she were to live to the end of her childbearing years and bear children in accordance with current age-specifi c fertility rates.
Under fi ve mortality rate: is the probability (expressed as a rate per 1,000 live births) of a child born in a specifi ed year dying before reaching the age of fi ve if subject to current age-specifi c mortality rates.
Under-fi ve overweight: the percentage of children under age 5 whose weight for height is more than two standard deviations above the median for the international reference population of the corresponding age.
Under-fi ve stunting: Percentage of children under age 5 whose height is two standard deviations or more below the median height-for-age of the reference population.
Under-fi ve underweight: Percentage of children under age 5 whose weight is less than two standard deviations below the median weight-for-age of the reference population.
Under-fi ve wasting: Percentage of children under age 5 whose weight is two standard deviations or more below the median weight-for-height of the reference population.
Voluntary Non-Remunerated Blood Donations: Donating blood to health facility without expecting any form of reward or remuneration.
state_of_the_nations_interior_new.indd 163state_of_the_nations_interior_new.indd 163 05/02/19 11.0605/02/19 11.06

state_of_the_nations_interior_new.indd 164state_of_the_nations_interior_new.indd 164 05/02/19 11.0605/02/19 11.06
Related Documents