State of the Industry Tennis Court Contractors 2014

State of the Industry Tennis Court Contractors 2014.
Dec 14, 2015
Welcome message from author
This document is posted to help you gain knowledge. Please leave a comment to let me know what you think about it! Share it to your friends and learn new things together.
Transcript

State of the IndustryTennis Court Contractors
2014

2
Methodology
Personal business: annual comparison – 2014 vs 2013
Current outlook of the contracting business (in general)
Future outlook of the contracting business (in general)
Personal business expectations for 2015
Operation Summary
Respondent profile
Contents

3
Sports Marketing Surveys USA conducted this research on behalf of the Tennis Industry Association (TIA). Certified court builders and members of the American Sports Builders Association (ASBA) were invited to participate in an online survey during December 2014 and January 2015.
Respondents received an email containing an electronic link to the survey and participated voluntarily. They answered questions about their business operations for the year of 2014 and were asked to compare relative to the previous 12 months. They were also asked to project forward about their future expectations for the year of 2015.
A hardcopy version of the survey was developed from the electronic version. It was distributed at the annual ASBA conference in Ponte Vedra Beach, FL during December 2014.
23 hardcopy responses plus 11 online responses combined for a total response of 34 participants.
With an approximate universe of 160 ASBA tennis court contractors, this response rate is roughly 21%.
All data submitted has been aggregated to produce the following 2014 State of Industry for Court Contractors Report.
Question wording for operational summary was revised to more accurately reflect the market conditions.
Questions about pickleball courts were added to the survey to track the pickleball replacing tennis court phenomenon.
Methodology
4
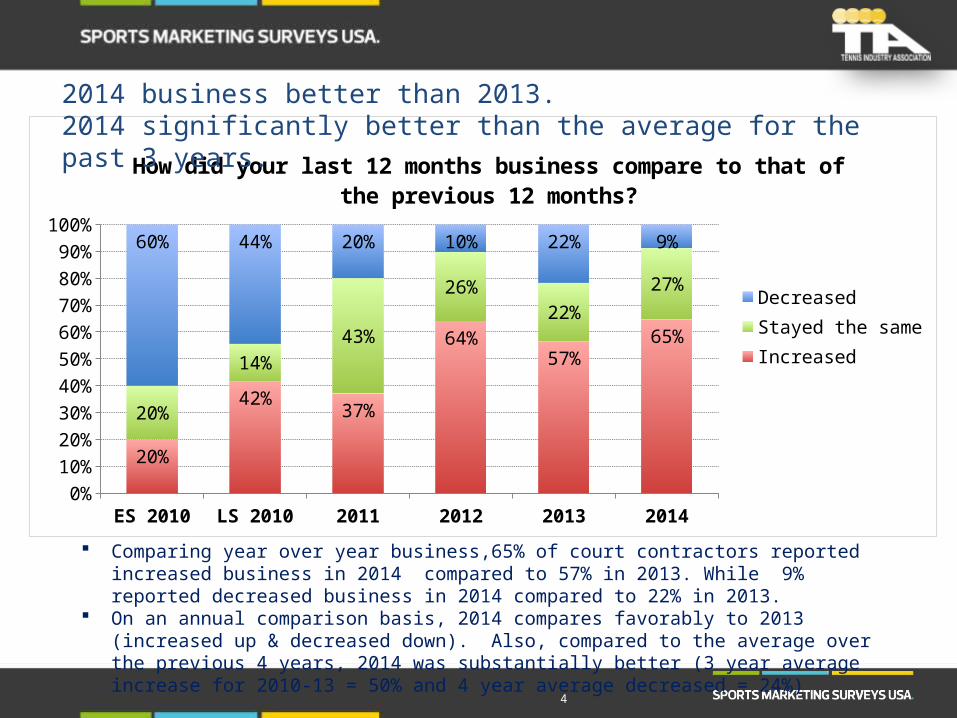
Comparing year over year business,65% of court contractors reported increased business in 2014 compared to 57% in 2013. While 9% reported decreased business in 2014 compared to 22% in 2013.
On an annual comparison basis, 2014 compares favorably to 2013 (increased up & decreased down). Also, compared to the average over the previous 4 years, 2014 was substantially better (3 year average increase for 2010-13 = 50% and 4 year average decreased = 24%)
ES 2010 LS 2010 2011 2012 2013 20140%
10%
20%
30%
40%
50%
60%
70%
80%
90%
100%
20%
42%37%
64%56%
65%
20%
14%
43%
26%22%
27%
60% 44% 20% 10% 22% 9%
How did your last 12 months business compare to that of the previous 12 months?
DecreasedStayed the sameIncreased
2014 business better than 2013.2014 significantly better than the average for the past 3 years.
5
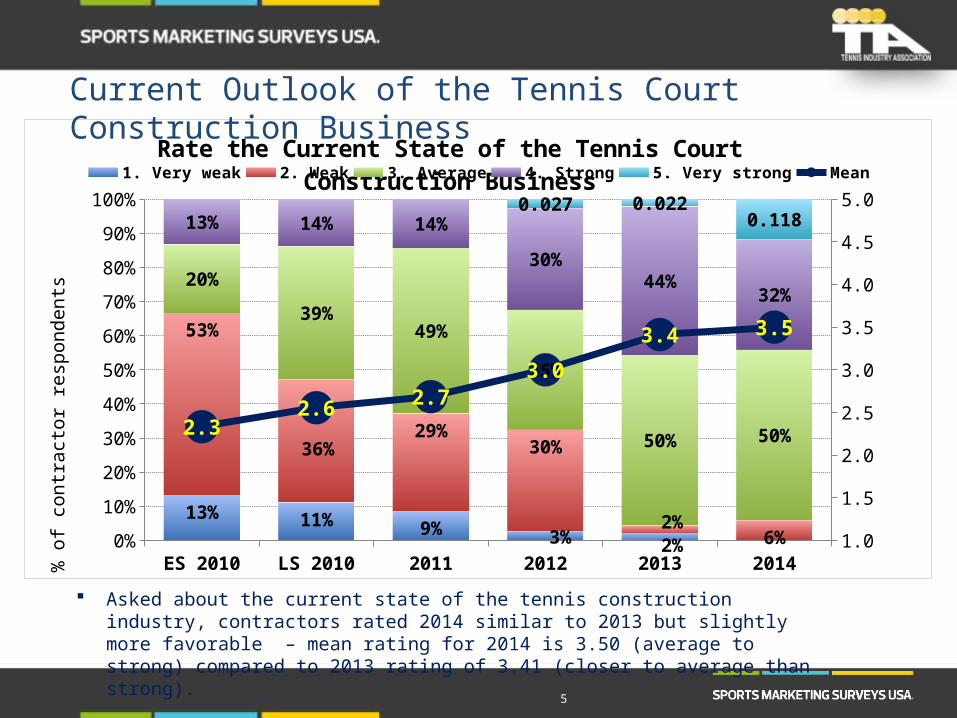
Asked about the current state of the tennis construction industry, contractors rated 2014 similar to 2013 but slightly more favorable – mean rating for 2014 is 3.50 (average to strong) compared to 2013 rating of 3.41 (closer to average than strong).
ES 2010 LS 2010 2011 2012 2013 20140%
10%
20%
30%
40%
50%
60%
70%
80%
90%
100%
1.0
1.5
2.0
2.5
3.0
3.5
4.0
4.5
5.0
13% 11% 9%3% 2%
53%
36%29%
30%
2%6%
20%
39%49%
35%
50% 50%
13% 14% 14%
30%44%
32%
0.027 0.0220.118
2.32.6 2.7
3.0
3.4 3.5
Rate the Current State of the Tennis Court Construction Business1. Very weak 2. Weak 3. Average 4. Strong 5. Very strong Mean
% o
f con
trac
tor r
espo
nden
ts
Current Outlook of the Tennis Court Construction Business

6
Asked about the future for the tennis construction industry, contractors rated 2014 nominally better than 2013, with a mean rating for 2014 of 3.60 (average to strong) compared to 2013 rating of 3.49
2013 20140%
10%
20%
30%
40%
50%
60%
70%
80%
90%
100%
1.0
1.5
2.0
2.5
3.0
3.5
4.0
4.5
5.0
9% 6%
35%33%
54% 55%
2% 6%
3.49 3.60
Rate the Future State of the Tennis Court Construction Business1. Very weak 2. Weak 3. Average 4. Strong 5. Very strong Mean
% o
f con
trac
tor r
espo
nden
ts
Future Outlook of the Tennis Court Construction Business
7
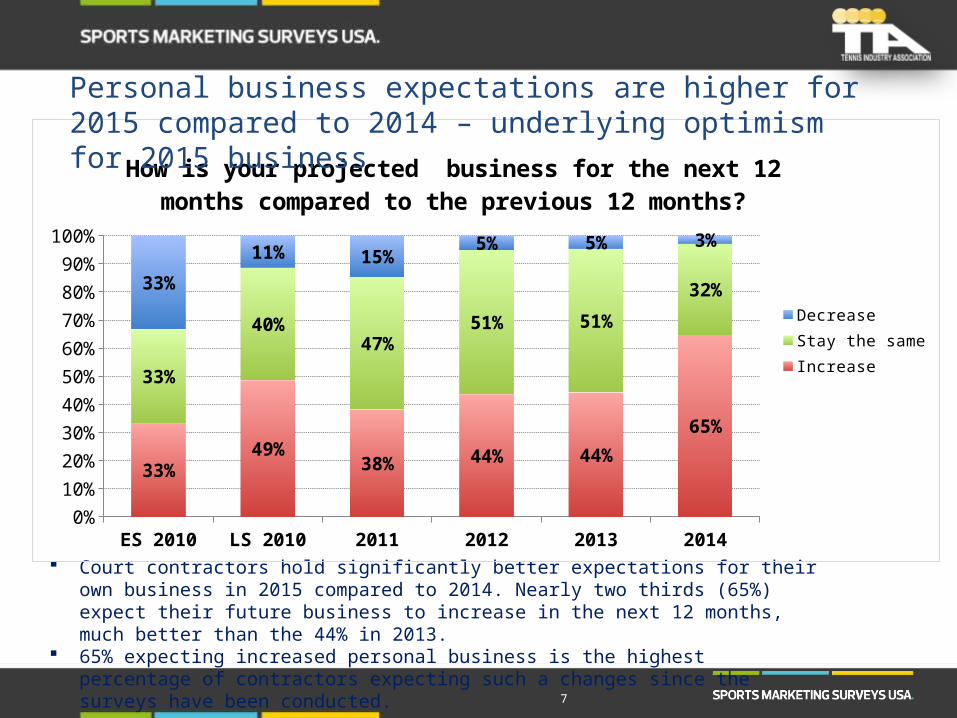
Court contractors hold significantly better expectations for their own business in 2015 compared to 2014. Nearly two thirds (65%) expect their future business to increase in the next 12 months, much better than the 44% in 2013.
65% expecting increased personal business is the highest percentage of contractors expecting such a changes since the surveys have been conducted.
ES 2010 LS 2010 2011 2012 2013 20140%
10%
20%
30%
40%
50%
60%
70%
80%
90%
100%
33%49%
38% 44% 44%
65%
33%
40%47%
51% 51%
32%33%
11% 15%5% 5% 3%
How is your projected business for the next 12 months compared to the previous 12 months?
DecreaseStay the sameIncrease
Personal business expectations are higher for 2015 compared to 2014 – underlying optimism for 2015 business
8
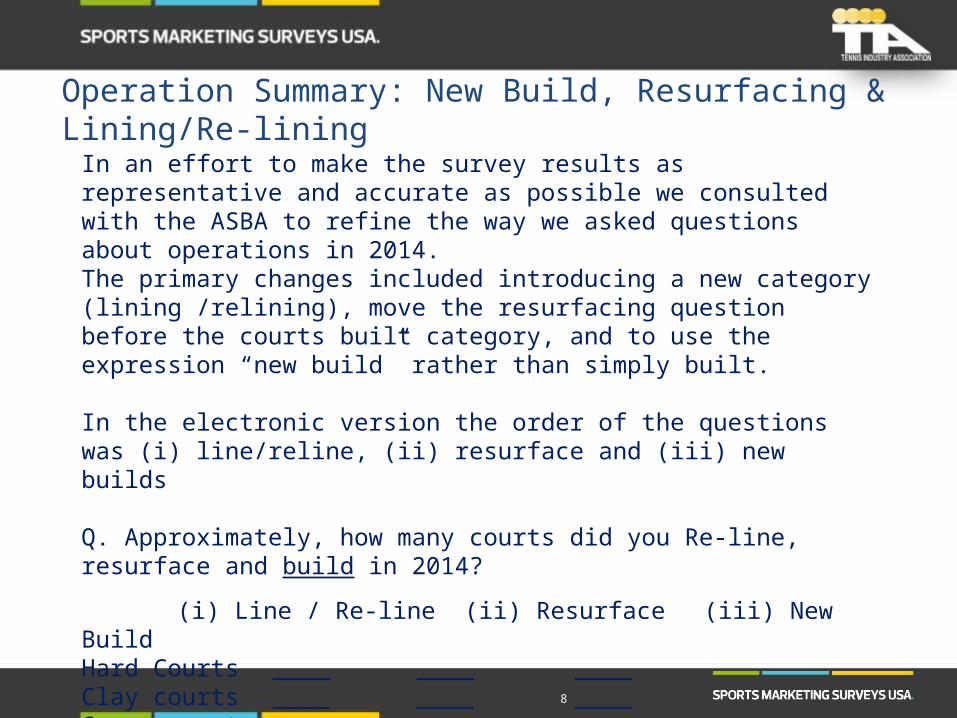
In an effort to make the survey results as representative and accurate as possible we consulted with the ASBA to refine the way we asked questions about operations in 2014.The primary changes included introducing a new category (lining /relining), move the resurfacing question before the courts built category, and to use the expression “new build” rather than simply built.
In the electronic version the order of the questions was (i) line/reline, (ii) resurface and (iii) new builds
Q. Approximately, how many courts did you Re-line, resurface and build in 2014?
(i) Line / Re-line (ii) Resurface (iii) New BuildHard Courts ____ ____ ____Clay courts ____ ____ ____Grass courts ____ ____ ____Total ____ ____ ____
Operation Summary: New Build, Resurfacing & Lining/Re-lining

9
Courts Lined / Re-lined 2012 2013 2014
Average Number of Courts Lined NA NA 22
Courts Resurfaced 2012 2013 2014
Average Number of Courts resurfaced 115 121 125[147=125+22]
Courts Built 2012 2013 2014
Average Number of Courts built 28 24 30
*The question wording revision is getting us closer to a more accurate representation of the court contractor business. Most probable meaningful annual comparison for the “Courts Resurfaced” is to include the relined and resurfaced numbers for 2014 (125+ 22= 147). Relining and resurfaced were broken out in 2014 but not in previous survey periods.
*147
Operation Summary: New Build, Resurfacing & Lining/Re-lining

10
Pickleball popularity has steadily grown over the past couple of years. During 2014 anecdotal evidence suggested an increasing number of tennis courts were being converted to pickleball courts. Thus, we added a series of questions to explore this phenomenon with the goal of quantifying the rise of pickleball courts.
Q. Did you replace or resurface existing tennis court courts with pickleball courts in 2014?
Yes; 67%
No; 33%
If yes, average number of tennis courts replaced with pickleball courts in 2014 = 5.1
Q. Did you construct new or resurface existing pickleball courts?
58%42%
If yes, average number of existing pickleball courts resurfaced = 6.2
If yes, average number of newly constructed pickleball courts = 5.7
Operation Summary: Pickleball

11
The average split between private vs. public contracts remains fairly constant since 2011. The majority of contracts are public (58%) compared to 42% private.
ES 2010 LS 2010 2011 2012 2013 20140%
10%
20%
30%
40%
50%
60%
70%
80%
90%
100%
41%53%
45% 46% 46% 42%
59%47%
55% 54% 54% 58%
Private/Public breakdown of Contracts
PublicPrivate
Operation Summary: Private/Public Contracts

12
The USTA’s *Youth Tennis promotion has clearly impacted the tennis court construction industry. In 2014, nearly three quarters (74%) of the contractors surveyed had worked on youth courts.
* Youth Tennis is now what used to be called Ten and Under or QuickStart Tennis
ES 2010 LS 2010 2011 2012 2013 20140%
10%
20%
30%
40%
50%
60%
70%
80%
90%
100%
7%
36% 38%21%
49%
74%
93%
64% 62%80%
51%
26%
Youth Court Activity During Last 12 months
NoYes
Operation Summary: 10 & Under Courts
13
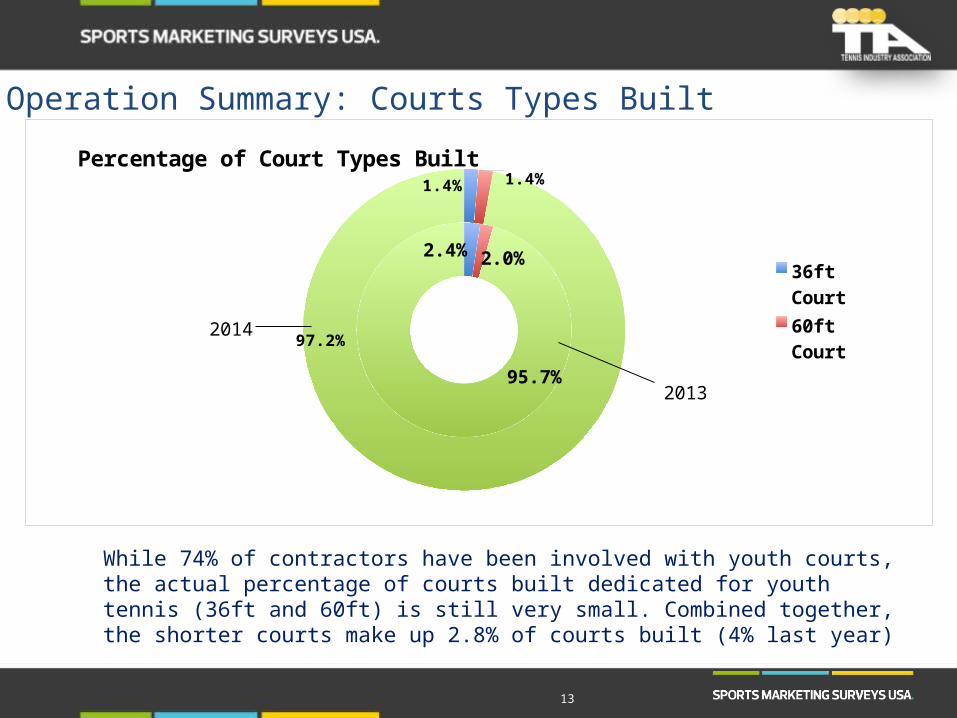
While 74% of contractors have been involved with youth courts, the actual percentage of courts built dedicated for youth tennis (36ft and 60ft) is still very small. Combined together, the shorter courts make up 2.8% of courts built (4% last year)
2.4% 2.0%
95.7%
1.4% 1.4%
97.2%
Percentage of Court Types Built
36ft Court
60ft Court
78ft Court2014
2013
Operation Summary: Courts Types Built

14
Approximately 10% of courts built by ASBA accredited court contractors were indoor courts in 2014. This is a slight uptick from the 7% in 2013
2013 20140%
10%
20%
30%
40%
50%
60%
70%
80%
90%
100%
93% 90%
7% 10%
Indoor Vs. Outdoor Courts Built
IndoorOutdoor
Operation Summary: Courts Types Built
15
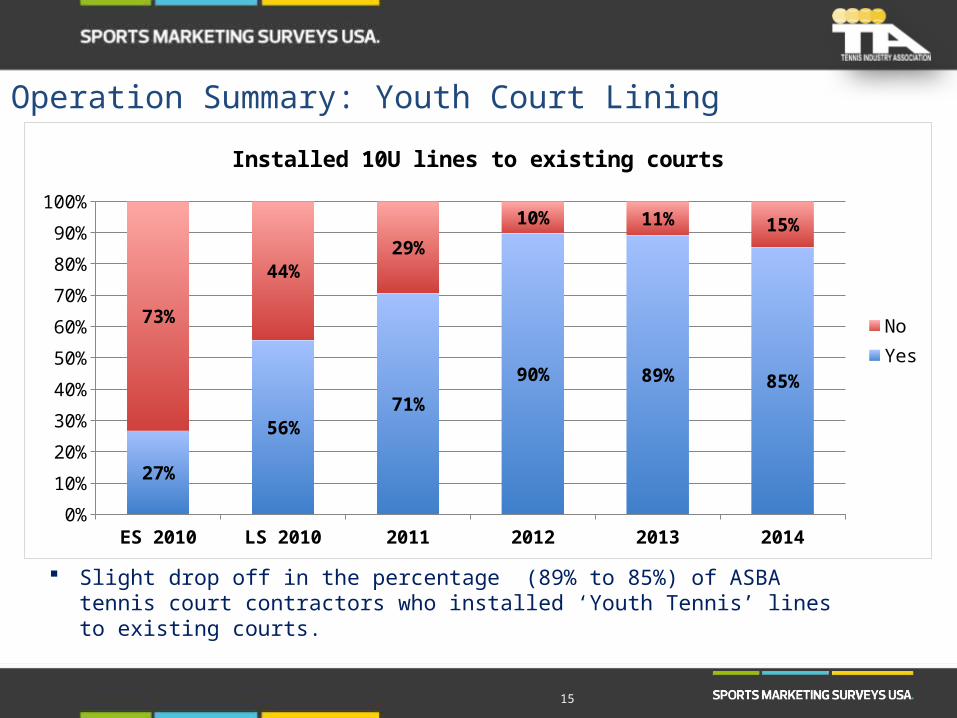
Slight drop off in the percentage (89% to 85%) of ASBA tennis court contractors who installed ‘Youth Tennis’ lines to existing courts.
ES 2010 LS 2010 2011 2012 2013 20140%
10%
20%
30%
40%
50%
60%
70%
80%
90%
100%
27%
56%71%
90% 89% 85%
73%
44%29%
10% 11% 15%
Installed 10U lines to existing courts
NoYes
Operation Summary: Youth Court Lining

16
$1-$249,999
$250,000-$500,000
$500,001 - $750,000
$750,001 - $1 million
$1.1 million - $2 million
Over $2 million
0% 10% 20% 30% 40% 50% 60%
2%
7%
9%
13%
29%
40%
6%
6%
6%
9%
21%
52%
20142013
What dollar sales range best approximates your total dollar sales?
Experience in Court Construction Industry 2013 2014
Average Number of years in court construction 29 30
Respondent Profile
Related Documents