Oak Park and River Forest High School District 200 State of the District Dec. 17, 2020

Welcome message from author
This document is posted to help you gain knowledge. Please leave a comment to let me know what you think about it! Share it to your friends and learn new things together.
Transcript

Oak Park and River Forest High School District 200
State of the DistrictDec. 17, 2020


Oak Park and River Forest High School provides a dynamic, supportive learning environment that cultivates knowledge,
skills, and character and strives for equity and excellence for all students.
Our Mission

AccomplishmentsData Dashboards
Focus on Transformative Education
Agenda

★ Supt. Dr. Joylynn Pruitt-Adams named Villager of the Year for Oak Park and River Forest★ Prevention and Wellness Coordinator Ginger Colamussi named to Gov. Pritzker’s Gender Equity
Task Force★ Oak Park Environment and Energy Commissions recognized Food Service for its contributions to
environmental sustainability, including the new zero-waste lunch initiative★ OPRF social-emotional learning coaches awarded $100,000 NoVo Foundation grant to enhance
social-emotional and equity-focused learning practices★ All 13 students in the Investigative Research Design and Innovation class named Illinois
BioGENEius Challenge semi-finalists★ Senior Natalie Serratos won the Illinois BioGENEius Challenge★ Theatre tech and design teacher Teslen Sadowski was named technical director for the All-State
production of “Aida” at the annual Illinois High School Theatre Festival○ Six students--one more than usual maximum per school--chosen for the production○ Stage crew member Christopher Moore II took first place in Tech Olympic event
★ OPRF Slam Team named Louder than a Bomb Slam finalist for third year in a row★ Boys swim and dive won West Suburban Silver Conference for the first time since 1998★ Oak Park Schools Polar Plunge team raised $44,000 for Special Olympics Illinois★ OPRF High School donated more than 20,000 PPE items to Chicago-area hospitals
2019-2020 Accomplishments


Summative DesignationsDue to the COVID-19 pandemic, the state kept all designations the same as they were in 2018-2019
ExemplarySchools performing in the top 10 percent of schools statewide with no underperforming student groups.
CommendableA school that has no underperforming student groups, a graduation rate greater than 67 percent, and whose performance is not in the top 10 percent of schools statewide.
UnderperformingA school in which one or more student groups is performing at or below the level of the “all students” group in the lowest performing 5 percent of schools.
Lowest PerformingA school that is in the lowest-performing 5 percent of schools in Illinois and any high school with a graduation rate of 67 percent or less.
Illinois Report Card2019-2020

Weight of Indicators in Overall Designation

Status of OPRF Indicators for Summative Designation
No data for 2019-2020 because the state canceled spring 2020 testing due to COVID-19 pandemic:● English-language arts proficiency● Math proficiency● Science proficiency
Updated indicators for 2019-2020:● Graduation rate: 95%● Chronic absenteeism: 19%● 5Essentials Climate Survey results: Moderately Organized for Improvement● Ninth-graders on track to graduate: 91.8%


Focus Area: Transformative Education
Long-term Outcomes
Racially proportionate outcomes that place us in the top 10% of schools across the state in the following areas:
● # of students earning at least one dual credit by graduation● % of students earning a 3 or higher on AP tests● % of students graduating in 4 years● % of students attending either 2 or 4 year post-secondary institutions one
year after graduation● % of students demonstrating ELA and Math proficiency on SAT
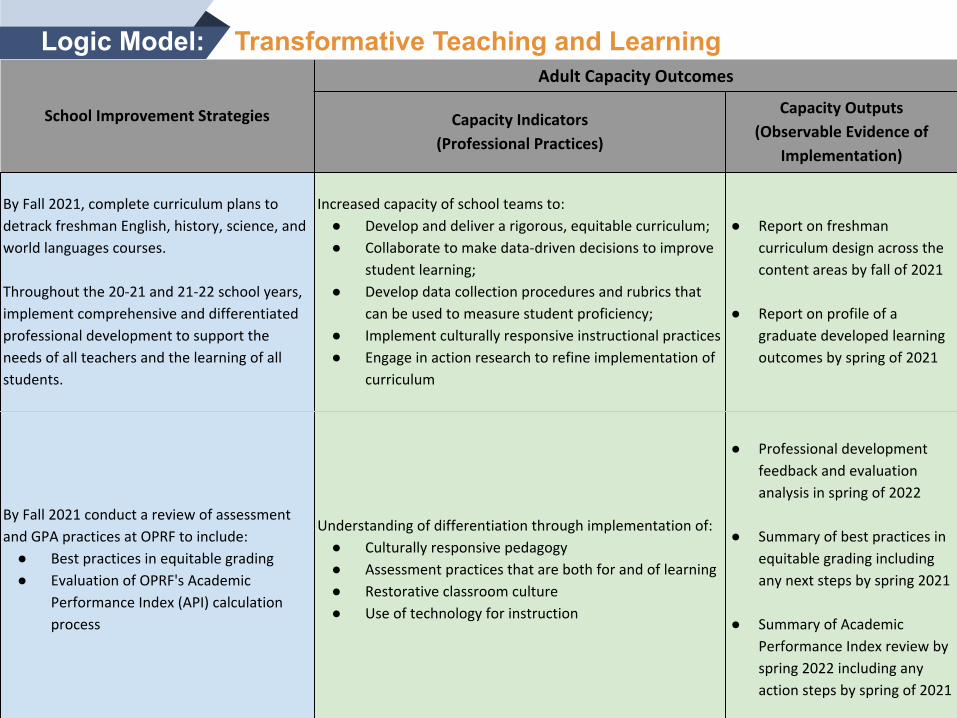
Logic Model: Transformative Teaching and Learning
●●
●
●●
●
●
●●
●●●●
●
●
●

By December 31, 2020, identify not more than five measurable outcome expectations to meet the following outcomes:
● An annual 2% improvement rate towards the attainment and maintenance of “exemplary” status on the ISBE report card (Strategic Plan, Priority 2-Transformative Education/Teaching and Learning).
● An annual 2% reduction rate in statistically meaningful correlations between race, ethnicity, and student achievement. (Strategic Plan, Priority 1- Racial Equity, Priority 2 – Transformative Education/Teaching and Learning).
2020-2021 Board of Education Goal 1-Superintendent’s Goal

●
●
●
●
●●●●
Logic Model: Transformative Teaching and Learning

Impact of COVID-19
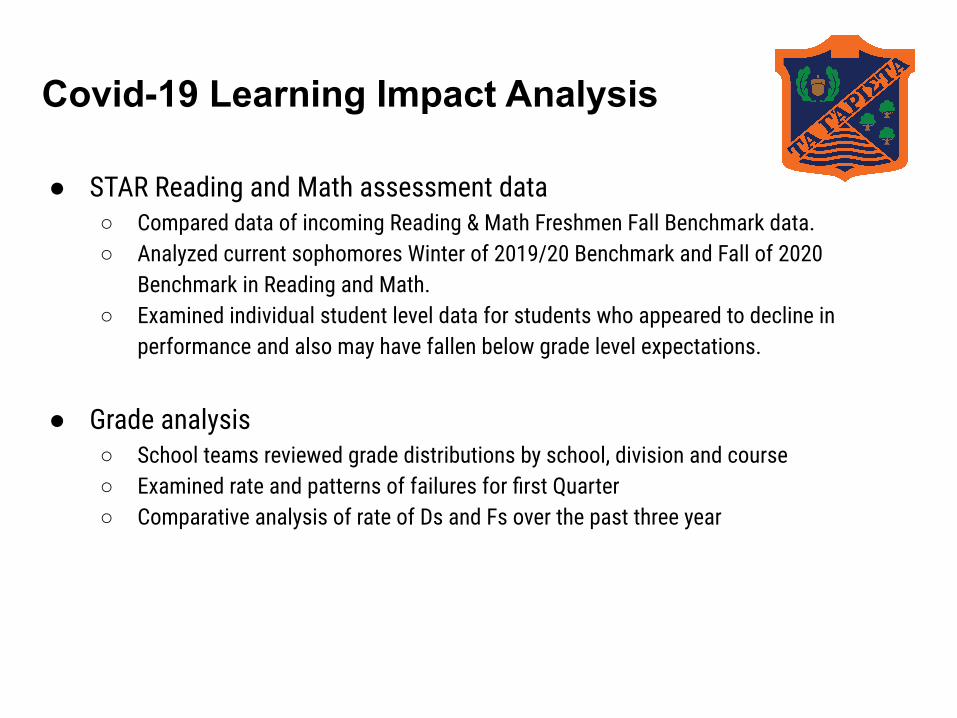
Covid-19 Learning Impact Analysis
● STAR Reading and Math assessment data○ Compared data of incoming Reading & Math Freshmen Fall Benchmark data.○ Analyzed current sophomores Winter of 2019/20 Benchmark and Fall of 2020
Benchmark in Reading and Math.○ Examined individual student level data for students who appeared to decline in
performance and also may have fallen below grade level expectations.
● Grade analysis○ School teams reviewed grade distributions by school, division and course○ Examined rate and patterns of failures for first Quarter○ Comparative analysis of rate of Ds and Fs over the past three year

STAR Reading and Math Fall Benchmark Comparison
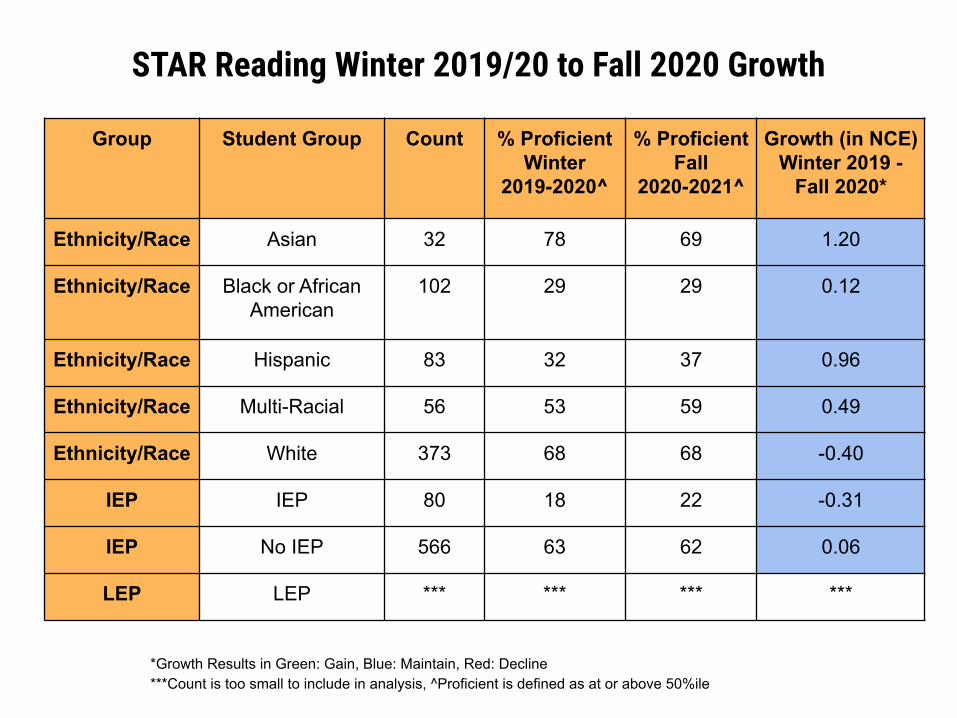
STAR Reading Winter 2019/20 to Fall 2020 Growth
Group Student Group Count % Proficient Winter
2019-2020^
% Proficient Fall
2020-2021^
Growth (in NCE) Winter 2019 -
Fall 2020*
Ethnicity/Race Asian 32 78 69 1.20
Ethnicity/Race Black or African American
102 29 29 0.12
Ethnicity/Race Hispanic 83 32 37 0.96
Ethnicity/Race Multi-Racial 56 53 59 0.49
Ethnicity/Race White 373 68 68 -0.40
IEP IEP 80 18 22 -0.31
IEP No IEP 566 63 62 0.06
LEP LEP *** *** *** ***
*Growth Results in Green: Gain, Blue: Maintain, Red: Decline***Count is too small to include in analysis, ^Proficient is defined as at or above 50%ile

Quarter 1 Grade Distribution for All Students

How many “critical grades” (e.g., D’s and F’s) are we seeing this year compared to prior years?

Percent of Students with One or More F’s by Race/Ethnicity: Three-Year Trend
2018-2019 2019-2020 2020-2021 Shift
Overall 13% 14% 19% +5%
Asian 5% 5% 12% +7%
Black or African-American
31% 31% 41% +10%
Hispanic 17% 16% 22% +6%
Multi-Racial 11% 14% 19% +5%
White 7% 8% 12% +4%


Questions?
Related Documents