State of North Carolina Debt Affordability Study February 1, 2014 Debt Affordability Advisory Committee Department of State Treasurer 325 North Salisbury Street Raleigh, NC 27603-1385 Phone: 919-508-5176

Welcome message from author
This document is posted to help you gain knowledge. Please leave a comment to let me know what you think about it! Share it to your friends and learn new things together.
Transcript
State of North Carolina
Debt Affordability Study
February 1, 2014
Debt Affordability Advisory Committee
Department of State Treasurer
325 North Salisbury Street Raleigh, NC 27603-1385
Phone: 919-508-5176

STATE OF NORTH CAROLINA DEBT AFFORDABILITY ADVISORY COMMITTEE
February 1, 2014
To: Governor Pat McCrory Lieutenant Governor Daniel J. Forest, President of the North Carolina Senate Senator Phil Berger, President Pro Tempore of the North Carolina Senate
Representative Thom Tillis, Speaker of the North Carolina House of Representatives Members of the 2014 General Assembly through the Fiscal Research Division
Attached is the February 1, 2014 report of the Debt Affordability Advisory Committee submitted to you pursuant to North Carolina General Statute §142-101. The report was created to serve as a tool for sound debt management practices by the State of North Carolina. The report provides the Governor and the General Assembly with a basis for assessing the impact of future debt issuance on the State's fiscal position and enables informed decision-making regarding both financing proposals and capital spending priorities. A secondary purpose of the report is to provide a methodology for measuring, monitoring and managing the State's debt levels, thereby protecting North Carolina’s bond ratings of AAA/Aaa/AAA. The methodology used by the Committee to analyze the State’s debt position incorporates trends in debt levels and peer group comparisons, and provides recommendations within adopted guidelines. The Committee has also provided recommendations regarding other debt and financial management related policies considered desirable and consistent with the sound management of the State’s debt. An area of special concern to the Committee is the ability of State entities to enter into arrangements which utilize the State’s debt capacity without centralized authorization, control, issuance or management. Respectfully submitted, Janet Cowell, State Treasurer Chair, Debt Affordability Advisory Committee

ii
Debt Affordability Advisory Committee Membership
Ms. Janet Cowell, State Treasurer, Chair
Mr. Lyons Gray, Secretary of Revenue
Mr. David McCoy, State Controller
Mr. Art Pope, State Budget Director
Ms. Beth Wood, State Auditor
Mr. Frank H. Aikmus, Senate Appointee
Mr. Bradford B. Briner, Senate Appointee
Mr. Brian T. Balfour, House Appointee
Mr. Murchison “Bo” Biggs, House Appointee

iii
Table of Contents Page Summary 1 Section I General Fund Debt Affordability 4
Review of General Fund Debt 4
Review of State Credit Ratings and Comparative Ratios 10
General Fund Guidelines, Debt Affordability Model and Results 12
General Fund Analysis - Other 15
Section II Transportation Debt Affordability 18
Review of Transportation Funds, Debt and Other Commitments 18 Comparative Transportation Ratios 22 Transportation Debt Guidelines, Affordability Model and Results 23
Section III Transportation and General Fund Ratios Combined 26 Appendix A General Fund - Revenues and Liabilities, Discussion of 27
Unreserved Fund Balance and 10-Year Model Solutions Appendix B Transportation Funds – Revenues and Liabilities and
10-Year Model Solution 32 Appendix C Recommendations-Further Discussion
Public Private Partnerships Review of Recent Debt-Related Legislation 35

iv
List of Charts and Tables
Page Summary General Fund Debt Capacity 5-Year Summary 2 Transportation Debt Capacity 5-Year Summary 2 Combined General Fund and Transportation Debt Ratios 2 General Fund Debt Affordability Review of General Fund Debt
Outstanding Net Tax-Supported Debt 4 Historic and Projected Net Tax-Supported Debt 5 Uses of Tax-Supported Debt 6 Historic and Projected Debt Service 7 Historic and Projected Appropriation-Supported Debt 8
Review of State Credit Ratings and Comparative Ratios NC Credit Rating Matrix 10 NC Comparative Debt Ratios 11 General Fund Guidelines, Debt Affordability Model and Results General Fund Debt Capacity 5-Year Summary 13 4% Target Solution Graph 14
General Fund Analysis Other Debt as Percentage of Personal Income 15 10-Year Payout Ratios 16 General Fund Total Fund Balances 17
Transportation Debt Affordability
Review of Transportation Funds, Debt and Other Commitments Transportation Debt Service 20 Transportation Expenses by Year 22
Comparative Transportation Ratios Transportation Peer Group Comparisons 23 Transportation Debt Guidelines, Affordability Model and Results Transportation Debt Capacity 5-Year Summary 25 Transportation and General Fund Ratios Combined Combined Transportation and General Fund Debt Ratios 26 Appendix A General Fund Revenue Estimates 28 General Fund Debt Capacity 10-Year Solutions 31 Appendix B Transportation Revenue Estimates 32 Transportation Debt Capacity 10-Year Solution 34
1
SUMMARY Background and Context A study of debt affordability is an essential management tool that helps to provide a comprehensive assessment of a government’s ability to issue debt for its capital needs. Standard & Poor’s, one of the three major bond rating agencies, has stated that “Most of the ‘AAA’ states have a clearly articulated debt management policy. Evaluating the impact of new or authorized but unissued bond programs on future operating budgets is an important element of debt management and assessing debt affordability.” Control of debt burden is one of the key factors used by rating agencies’ analysts in assessing credit quality. The Debt Affordability Advisory Committee (the “Committee” or “DAAC”) is required to annually advise the Governor and the General Assembly of the estimated debt capacity of the General, Highway and Highway Trust Funds for the upcoming ten fiscal years. The legislation also directs the Committee to recommend other debt management policies it considers desirable and consistent with the sound management of the State’s debt. The Committee hereby presents its study for 2014. Debt Controls and Ratings Debt capacity is a limited and scarce resource. It should be used only after evaluating the expected results and foregone opportunities. The Study enables the State to structure its future debt issuances within existing and future resource constraints by providing a comparison of its current debt position to relevant industry and peer group standards. The Study can thus be used to help develop and implement the State’s capital budget and is premised on the concept that resources, not only needs, should guide the State's debt issuance program. The Committee’s adopted guidelines attempt to strike a balance between providing sufficient debt capacity to allow for the funding of essential capital projects and imposing sufficient discipline so that the State does not create a situation that results in a loss of future budgetary flexibility and deteriorating credit position.
The State’s ratings were affirmed in 2013 at Aaa (Moody’s), AAA (S&P) and AAA (Fitch). Currently, all of the State’s debt ratios remain well below the median levels for the State’s peer group comprised of all states rated “triple A” by all three rating agencies. North Carolina’s debt is considered manageable at current levels. In affirming the State’s rating, Fitch stated that a key rating driver for North Carolina is “…a low–to-moderate debt burden and strong debt management practices including an affordability planning process.” Moody’s noted that, “Despite the sizeable increase in debt over the last several years, the state’s debt burden ranks below average…” and that “Debt levels [are] declining.” The Committee has adopted the ratio of debt service as a percentage of revenues as the controlling metric that determines the State’s debt capacity. Over the ten year planning horizon and after adjusting revenue for the tax rate changes passed during the last legislative session, the State’s revenue picture is positive overall, reflecting a continued economic recovery. The amount of debt service is projected including the issuance of the State’s balance of authorized but unissued debt of approximately $206 million. The model results show that the State’s General Fund has debt capacity of $570 million in each of the next 10 years. The ratio of debt service to revenues peaks at 3.72%, notably below the 4.00% target. Due substantially to legislative action rescinding the authorization of debt service for certain North Carolina Turnpike Authority projects, the ratio of transportation debt service to revenues is projected to peak at only 4.03% in this fiscal year versus the limit of 6% This is well below the 6.09% peak previously forecasted. As a result, Transportation debt capacity equals $805.4 million

2
in the current fiscal year declining thereafter. On a smoothed or optimized basis, capacity of $209 million exists for each and every year of the model horizon. In addition, the Committee notes the significant financial support for transportation projects afforded by the issuance of Grant Anticipation Revenue Vehicle Bonds and support for the North Carolina Turnpike Authority revenue bonds. On a combined basis, the General Fund and Transportation Fund’s debt service is projected to peak at approximately 3.76% of combined this year. Table 1
General FundNet Tax-Supported Debt Capacity using 4.0% debt service/revenues target ratio
(In millions of dollars)
Fiscal Year 2014 2015 2016 2017 2018Total Additional Debt Capacity per Year * $718.4 $422.4 $893.5 $425.5 $534.0
Debt Capacity Available Each and Every Year $570.0 $570.0 $570.0 $570.0 $570.0
* In addition to that already authorized but unissued. Assumes additional debt capacity is authorized and issued in stated fiscal year.
Table 2
TransportationNet Tax-Supported Debt Capacity using 6.0% debt service/revenues target ratio
(In millions of dollars)
Fiscal Year 2014 2015 2016 2017 2018Total Additional Debt Capacity per Year * $805.4 $238.1 $22.1 $190.1 $0.0
Debt Capacity Available Each and Every Year 209.3 209.3 209.3 209.3 209.3* In addition to that already authorized but unissued. Assumes additional debt capacity is authorized and issued in stated fiscal year. GAP Funding for North Carolina Turnpike Authority projects assumed to reach $49 million in FY 2014 and thereafter.
Table 3
General Fund and Transportation FundsCombined Debt Service / Revenue Percentages
Fiscal Year 2014 2015 2016 2017 2018
General Fund 3.72% 3.69% 3.53% 3.19% 3.06%
Transportation * 4.03% 3.87% 3.34% 3.39% 3.01%
Combined 3.76% 3.71% 3.50% 3.22% 3.06%
Note: Percentages are based on forecasted revenues and debt service.
* GAP Funding for North Carolina Turnpike Authority projects assumed to reach $49 million in FY 2014 and thereafter.

3
Interest rate levels remain near historic lows, and the State has been able to capitalize on the very favorable market conditions by refinancing over $3.0 billion of outstanding debt since 2009, achieving aggregate debt service savings of $127.3 million. Additional refundings are anticipated depending upon market conditions. Not only do refundings increase budgetary flexibility by reducing debt service, they also help to create additional debt capacity. Other Recommendations (see Appendix C for further discussion)
• Control of Debt Authorization Authority The Committee strongly encourages the General Assembly to adopt language restricting the ability of any state department, agency, institution, board or commission to enter into financial arrangements that create debt or debt-like obligations for which the State is obligated. Sponsoring agencies whose mission is to provide a particular service or assets are not in the best position to make decisions that prioritize the use of the State’s debt capacity. Centralized debt authorization, issuance and management are considered one of North Carolina’s credit strengths. In the Committee’s view, the prioritization of capital projects and the issuance of obligations that increase the State’s debt burden should remain the prerogative of the General Assembly.
• State-Aid Intercept The Committee strongly opposes proposals that would utilize a back-up pledge of State appropriations to provide support for debt issued by other entities.
• Structural Budget Balance and Continued Replenishment of Reserves Should Continue to be a Priority These are key ratings drivers contributing to the State’s “AAA” rating.
• Authorize Two-Thirds General Obligation Bonds The Committee recommends that Two-Thirds GO bonds be authorized to replace the remaining $206 million of authorized but unissued Special Indebtedness in order to reduce debt service costs.

4
SECTION I
GENERAL FUND DEBT AFFORDABILITY Review of General Fund Debt Outstanding Debt The State issues two kinds of tax-supported debt: GO Bonds and various kinds of “Special Indebtedness”, which are also known as non-GO debt or appropriation-supported debt. GO Bonds are secured by the full faith, credit and taxing power of the State. The payments on all other kinds of long-term debt, including Limited Obligation Bonds, Certificates of Participation (“COPs”), lease-purchase revenue bonds, capital lease obligations and installment purchase contracts are subject to appropriation by the General Assembly. Appropriation-supported debt may sometimes also be secured by a lien on facilities or equipment.
Debt that is determined to be self-supporting or supported by non-General Fund tax revenues does not constitute net tax-supported debt, but is included in the definition of “gross” tax-supported debt used by some rating analysts. The State's outstanding debt positions as of June 30, 2013 are shown below. Chart 1
State of North Carolina Outstanding Net Tax-Supported Debt
The State's total outstanding debt at June 30, 2013 totaled approximately$8.8 billion of which $7.4 billion was tax-Supported.
AmountsTax-Supported ($millions)
General Obligation Debt $3,999.6 General Fund ($3,660.4)
Highway Fund ($339.2)
Special Indebtedness $2,523.2
NCTA Gap-Funded Appropriation Bonds $788.4
Installment Purchase / Equipment & Capital Leases $46.4
Total General Fund Tax-Supported Debt $6,230.0Total Highway Tax-Supported Debt $1,127.6
Total Tax-Supported Debt $7,357.6
Non Tax-Supported
GARVEEs $600.4
NC Turnpike Authority (includes TIFIA) $621.6
Guaranteed Energy Savings Contracts $186.4
Total Debt $8,766.0

5
Trends in Amounts of General Fund Debt After showing substantial growth in the early 2000s, the State’s outstanding net tax-supported debt peaked in FY 2012 and will have declined by nearly $500 million by the end of FY 2014. Future declines of approximately $500 million per year are anticipated through the projection period as debt previously issued is retired and the State’s debt-financed capital improvement plan is completed. Chart 2 below illustrates the outstanding amounts of General Fund net tax-supported debt over the last five years and projects the amount outstanding through FY 2018. The absolute level of General Fund tax-supported debt is declining rapidly, and will drop by over $2 billion by FY 2018. Chart 2
$- $1,000 $2,000 $3,000 $4,000 $5,000 $6,000 $7,000
2009 2010 2011 2012 2013 2014 2015 2016 2017 2018
$6,006 $6,084 $6,128 $6,493 $6,230 $5,997 $5,528 $5,047
$4,582 $4,094
Fiscal Year
State of North Carolina General Fund Net Tax-Supported Debt Outstanding 2009 - 2018 (Projected)
Chart 2 above incorporates all of the State’s currently outstanding and all authorized, but unissued, debt. The State issues debt on a cash flow basis. Bond issues are timed to provide funds as they are actually needed and there is typically a lag between when debt is authorized and when it is actually issued. As of December 31, 2013, the total amount of authorized but unissued tax-supported debt totals approximately $206 million. For planning purposes, the State anticipates issuance of all currently authorized but unissued debt by the end of this fiscal year.
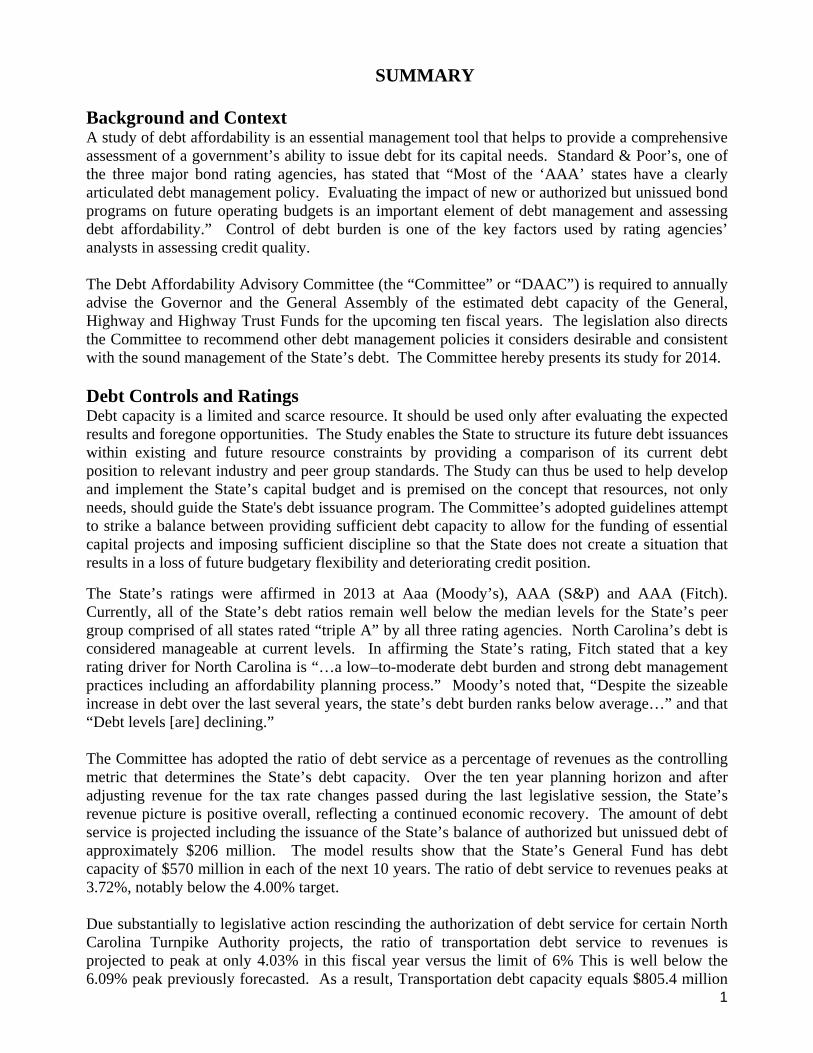
Uses of Total Outstanding Tax-Supported Debt The following chart illustrates the uses for which the State has issued all tax-supported debt, including that used for transportation purposes, calculated on the amount outstanding at June 30, 2013. The State has used the proceeds of its debt programs for many purposes with the three largest
6
being to provide facilities and infrastructure for higher education (47%), transportation (16%) and public schools (9%). Chart 3
Debt Service As a percentage of revenues used in the model calculations, debt service peaks in FY 2015 and begins to decline thereafter. Both the State’s historic and projected debt service is illustrated below in Chart 4. The absolute amount of annual debt service is projected to peak at approximately $730 million. This chart also illustrates the amount of capacity for additional debt service that exists while remaining under the 4% limit. For example, even in the peak year there is excess capacity amounting to approximately $63 million of debt service.
Public Schools9%
Clean Water6%
Repairs and Renovations
2%
Higher Education47%
Correctional & Youth Facilities
8%
Transportation16%
Hospitals4%
Other State Projects
8%
North Carolina Total Outstanding Tax-Supported Debt by Program
as of June 30, 2013
Total Tax‐Supported Debt at June 30, 2013 = $7,357.6 million

7
Chart 4
$0
$100,000
$200,000
$300,000
$400,000
$500,000
$600,000
$700,000
$800,000
$900,000
$1,000,000
2009 2010 2011 2012 2013 2014 2015 2016 2017 2018Tax
Supp
orte
d D
ebt S
ervi
ce (T
hous
ands
)
Fiscal Year
State of North Carolina General FundHistoric & Projected Debt Service
Net Tax-Supported Debt
Tax Supported Debt Service
4% of Revenues
General Obligation Bonds versus Special Indebtedness Prior to 2001, the State only issued GO bonded indebtedness. Such debt is usually considered to be the highest quality of all the various types of debt or debt-like instruments and usually carries the highest credit rating. Several factors contribute to the high rating including the legal protections inherent in constitutionally permitted debt, investor confidence in the pledge of the full faith and credit of the State and the presumption of the availability of the government’s full resources. GO bonds are generally the most transparent of the various types of State debt obligations and typically carry the lowest interest cost. The Fiscal Research Division estimates that the costs of holding a GO bond referendum would be extremely modest and would not add substantially to the cost of the projects being financed. Special Indebtedness (as defined in G.S. §142-82), is a commonly-used financing vehicle employed by most states and localities. Sometimes issued on an unsecured basis or secured by a specific stream of revenues, a lease payment or financing agreement (and sometimes by a security interest in the project being financed), such obligations are paid from annual appropriated amounts for debt service. Depending upon market conditions, additional credit support and structure, the financial markets usually assess an interest rate penalty of approximately 25 basis points for the State’s appropriation-supported debt when compared with the State’s GO bonds. This translates into approximately $3.4 million of additional interest over the life of a typical $100 million debt issue. Although modest, the interest rate penalty does increase the cost of the projects being financed. Most states have diversified their debt portfolios and utilize one or more of the various types of non-GO structures. However, since 2000, the State of North Carolina has relied extensively on authorizing this type of financing. In affirming the State’s rating in 2013, Fitch noted that, “Over time the state has become more reliant on appropriation debt.”

8
As discussed in Appendix C, S.L. 2013-78 will serve to limit the amount of Special Indebtedness that may be authorized in the future. However, even with no new debt authorizations, the amount of special indebtedness as a percentage of the total for North Carolina will actually increase as GO debt is retired on a 3:1 basis compared to Special Indebtedness. The amount of the State’s historic and projected outstanding appropriation-supported debt is shown below in Chart 5, with the percentage of appropriation-supported debt to total debt (including transportation debt) noted. Chart 5
25.8%
32.8%47.0%
39.1%
24.9%
35.2% 40.2% 41.4% 42.9%
200
600
1,000
1,400
1,800
2,200
2,600
3,000
3,400
2009 2010 2011 2012 2013 2014 2015 2016 2017 2018
$M
ilio
ns
Year
Special Indebtedness Outstanding
Special Indebtedness Amounts
% of Total Outstanding Debt
44.7%
In December 2006, Fitch published a report analyzing the amount of non-GO debt by all 50 states. They found that the higher-rated states tend to have the highest amount of GO debt relative to their total debt positions. Although this report has not been updated, it is illustrative. The median ratio of GO debt to total tax-supported debt for “AAA” rated states was 74%, while the ratio for all “AA” states (without modifiers) was 70%. Conversely, the ratio of Special Indebtedness to total debt was 26% and 30% for “AAA” and “AA” states, respectively. As predicted in previous DAAC reports, the State’s percentage of non-GO debt exceeds the medians reported for the “AAA” and “AA” rated states. The Committee therefore recommends that the State consider the authorization of GO debt as the preferred, but not necessarily exclusive, method to provide debt financing. Two-Thirds Bonds North Carolina’s Constitution permits the State to issue GO bonds, without a referendum, to the
Note: % of Total Outstanding Debt includes debt funded by the Highway and the Highway Trust Fund.

9
extent of two-thirds of the amount that GO bonds have been paid down over the previous biennium. Although refundings currently in process may affect the available two-thirds capacity, we currently estimate that approximately $564 million will be available for the FY 2013-15 biennium. This amount could be used to supplant existing authorized but unissued Special Indebtedness ($206 million) and would result in bonds being issued at a lower cost; but creates no new additional debt on its own.

10
Review of State Credit Ratings and Comparative Ratios Credit ratings are the rating agencies’ assessment of a governmental entity’s ability and willingness to repay debt on a timely basis. As a barometer of financial stress, credit ratings are an important factor in the public credit markets and can influence interest rates a borrower must pay. Chart 6
North Carolina Credit Rating Matrix
State of North CarolinaGeneral Obligation Bond Credit Ratings
Rating Agency Rating Outlook
Fitch Ratings AAA StableMoody's Investors Service Aaa StableStandard & Poor's Rating Services AAA Stable
The State’s general obligation bonds are rated AAA with a “stable” outlook by Fitch, AAA with a “stable” outlook by Standard & Poor’s Ratings Services and Aaa with a “stable” outlook by Moody’s Investors Service. These ratings are the highest ratings attainable from all three rating agencies.
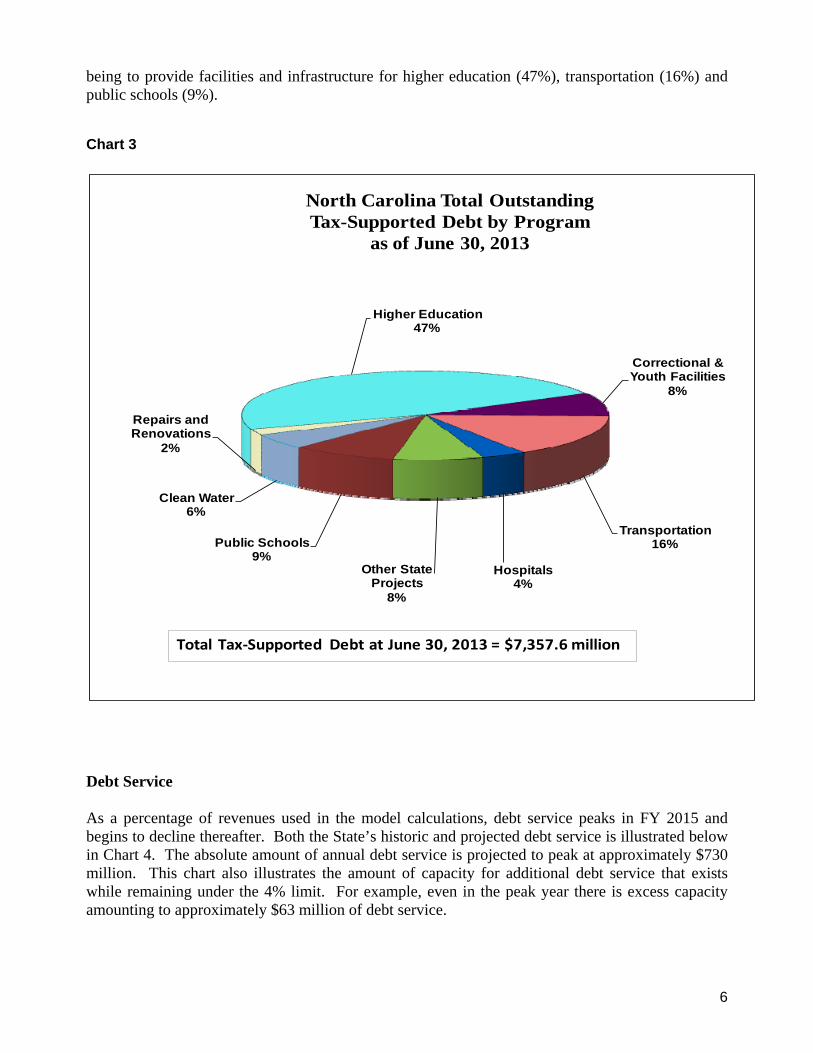
Comparison of Debt Ratios to Selected Medians A comparison to peer group medians is helpful because absolute values are more useful with a basis for comparison. In addition, the rating agencies combine General Fund and Transportation tax-supported debt in their comparative analysis. The primary source for this information is Moody’s 2013 State Debt Medians. How North Carolina compares with its peers is presented below. The peer group is composed of states rated “triple A” by all three credit rating agencies (often termed “triple-triple A”). Texas was recently upgraded to “triple-triple A” status and is presented as a peer group for the first time. Iowa has earned a “triple A” implied rating by all three agencies, but does not actually issue general obligation debt, relying solely on debt supported by appropriations or other sources. As shown in Chart 7, the State’s debt ratios are well below the median levels for its peer group.
11
Chart 7
General FundNorth Carolina Net Tax-Supported Comparative Debt Ratios (1)
Ratings Debt to Personal Debt per Debt as %State (Fitch/S&P/Moody's) Income % Capita Of GDP Debt Service Ratio (2)
Alaska AAA/AAA/Aaa 2.8% $1,251 1.78% 1.3%Delaware AAA/AAA/Aaa 6.2% 2,536 3.54% 7.8%Georgia AAA/AAA/Aaa 3.0% 1,061 2.51% 7.0%Iowa AAA/AAA/Aaa (3) 0.7% 287 0.59% 0.9%Maryland AAA/AAA/Aaa 3.6% 1,799 3.52% 5.7%Missouri AAA/AAA/Aaa 1.8% 699 1.69% 3.9%North Carolina AAA/AAA/Aaa 2.4% 853 1.89% 3.8%Texas AAA/AAA/Aaa 1.5% 580 1.16% 3.1%Utah AAA/AAA/Aaa 3.8% 1,275 2.92% 7.3%Virginia AAA/AAA/Aaa 2.9% 1,315 2.51% 5.2%
Peer Group Median 2.9% $1,156 2.20% 4.6%
Projected Tax-Supported Debt Ratios (4) Tax-SupportedDebt to Personal Debt per Debt Service as a % of DAAC
North Carolina Income % Capita Revenues
2013 (Actual) 1.7% $632 3.77%2014 1.5% $599 3.72%2015 1.3% $544 3.69%2016 1.1% $489 3.53%
(1) Source: Moody's 2013 State Debt Medians.(2) Defined by Moody's as debt service divided by operating revenues plus pledged revenues.(3) Implied by all three rating agencies. Iowa does not issue GO debt.(4) North Carolina projections are based on February 1, 2014 DAAC Report.
12
General Fund Guidelines, Debt Affordability Model and Results General Fund Debt Capacity Recommendations The Committee has adopted targets and outside guidelines to analyze and/or serve as the basis of calculating the recommended amount of General Fund–supported debt that the State could prudently authorize and issue over the next 10 years. Each measure is discussed in more detail below.
1. Net Tax-Supported Debt Service as a percentage of General Tax Revenues should be targeted at no more than 4% and not exceed 4.75%;
2. Net Tax-Supported Debt as a percentage of Personal Income should be targeted at no more than 2.5% and not exceed 3.0%; and
3. The amount of debt to be retired over the next ten years should be targeted at no less than 55% and not decline below 50%.
Net Tax-Supported Debt Service as a Percentage of General Tax Revenues (4% Target, 4.75% Ceiling) The Committee has adopted the measure of annual debt service arising from net tax-supported debt as a percentage of general tax revenues as the basis to evaluate the State’s existing and projected debt burden for the General Fund and as the basis for calculating how much additional debt the State can prudently incur. The Committee notes that policy makers control both variables that determine this ratio. In addition, the Committee believes that by measuring what portion of the State’s resources is committed to debt-related fixed costs, this ratio is a measure of the State’s budgetary flexibility and its ability to respond to economic downturns. In 2012, Moody’s stated that “the debt service ratio (is incorporated into) our assessment of fiscal flexibility, which measures the extent to which a state’s operating budget is burdened by fixed costs. The larger the fixed costs, the less flexibility a state has to structurally balance its budget in response to discretionary cost growth and revenue volatility…”. “…[S]tates with high fixed costs have lower budgetary flexibility and are more likely to rely on one-time budget solutions, creating structural budget imbalances that are difficult to reverse.” Because there is often a time lag, sometimes of multiple years, between when debt is authorized and when it is issued, the Committee determined that an optimized solution, whereby a fixed amount of debt could be authorized and issued each and every year over the model horizon provides a more useful management tool, and facilitates capital planning more effectively, than a measure that assumes that all available debt capacity is utilized in the year in which it is available. In practice, the limit imposed by the year of the least capacity over the model horizon (FY 2015) drives the calculation process. DAAC Revenues The model uses general tax revenues adjusted for one-time or non-recurring items plus certain investment income and miscellaneous revenues (“DAAC Revenues”). These revenue items are contained in the State’s Comprehensive Annual Financial Report. The Office of State Budget and Management (“OSBM”) has been consulted to provide actual projections through FY 2023. See Appendix A for more details on the specific revenue items utilized by the model and the revenue projections utilized throughout the model horizon. Debt Used in the General Fund Model Calculation The model uses a definition of net tax-supported debt that includes all outstanding and authorized,
13
but unissued, GO Bonds, Special Indebtedness, Capital Lease Obligations, Installment/Equipment Leasing Obligations and any other such obligations that are owed to a third party over a predetermined schedule payable from General Fund tax revenues. Obligations of Component Units, Highway Fund debt actually paid from Highway Fund revenues and non tax-supported special indebtedness are excluded. Other self-supporting or non-tax supported debt such as revenue bonds and short term tax anticipation notes (if they are not supported by General Fund tax revenues) are also excluded from the definition of net tax-supported debt. Energy Performance Contracts are excluded if they are performing as expected (debt service paid from energy savings). Consistent with rating agency practice, OPEB liabilities are also excluded unless the State were to actually issue debt to fund such obligations. Employment Security “borrowings” from the federal government are also excluded unless General Fund revenues will be used to meet the interest or principal payments due on such obligations. See Appendix A for further details.
Debt Structuring Assumptions The following assumptions were used in this year’s debt affordability model calculations:
• The State does not have any outstanding Variable Rate Debt and is not expected to issue any over the model horizon.
• The State does not have any authorized but unissued GO Debt. • The State has approximately $206 million of non-GO authorized but unissued debt. This
debt is assumed to be structured with a 20-year level principal profile and the interest cost is estimated to be 6%.
• Incremental model debt will be structured with a fixed rate 20-year maturity, a 6% interest rate, and an overall level debt service profile after the initial year.
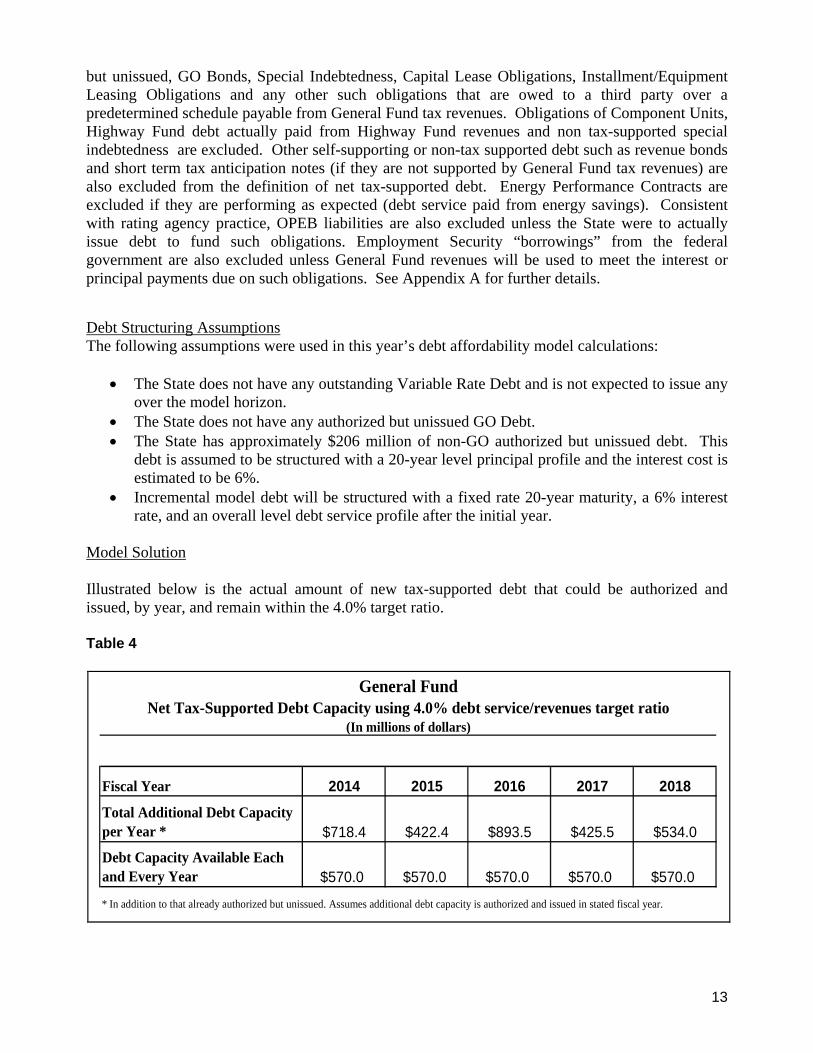
Model Solution Illustrated below is the actual amount of new tax-supported debt that could be authorized and issued, by year, and remain within the 4.0% target ratio. Table 4
General FundNet Tax-Supported Debt Capacity using 4.0% debt service/revenues target ratio
(In millions of dollars)
Fiscal Year 2014 2015 2016 2017 2018Total Additional Debt Capacity per Year * $718.4 $422.4 $893.5 $425.5 $534.0
Debt Capacity Available Each and Every Year $570.0 $570.0 $570.0 $570.0 $570.0
* In addition to that already authorized but unissued. Assumes additional debt capacity is authorized and issued in stated fiscal year.

14
Chart 8
Sensitivity Analysis on 4% Target Solution The model results are highly sensitive to changes in revenue and interest rate assumptions. A one percent change, either up or down, in general tax revenues in each and every year of the model horizon will change the amount of annual debt capacity each and every year by approximately $43 million. A variation in revenues of $100 million per year will impact the amount of new debt that may be prudently issued each and every year by approximately $18 million. If the interest rate assumption for all authorized but unissued and incremental model debt is reduced to 5%, approximately $44 million of additional annual capacity is created.
2.00%
2.50%
3.00%
3.50%
4.00%
4.50%
2013 2014 2015 2016 2017 2018 2019 2020 2021 2020
Year
General Fund Future Debt Service Ratios Assuming $570.0 Million New Debt Issued each Year
Debt Service Ratios Line 4% Target Ratio
Pe
rce
nta
ge
of
15
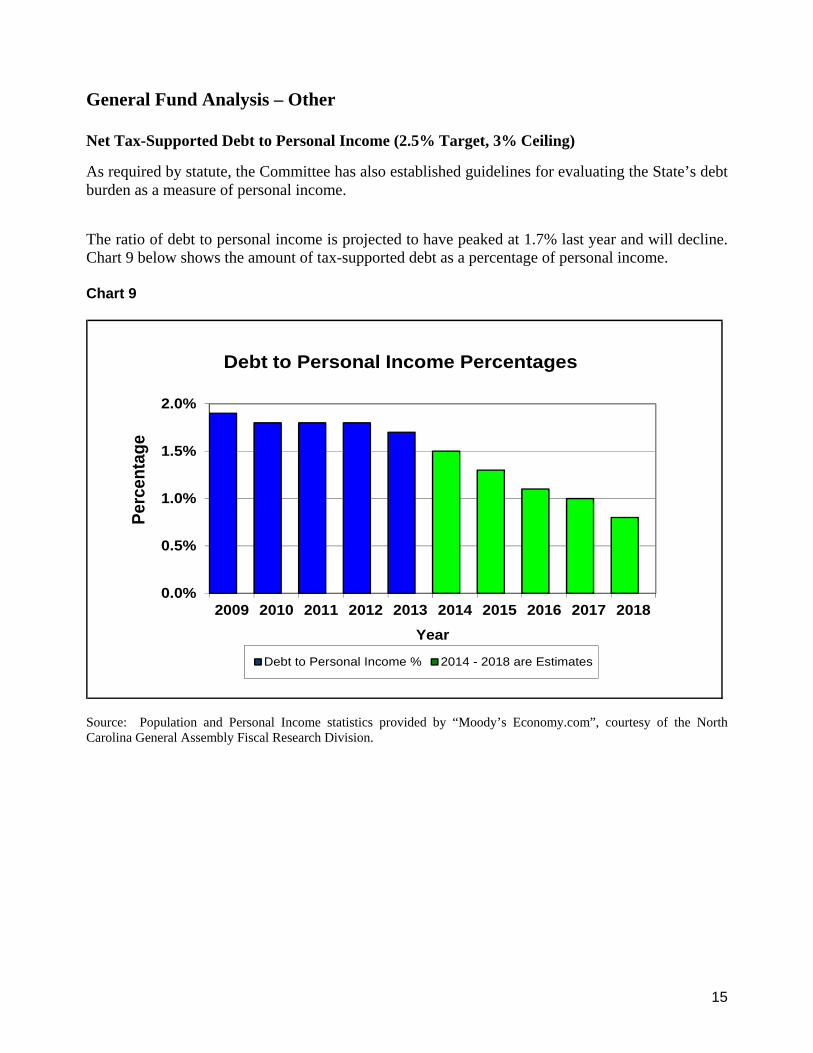
General Fund Analysis – Other Net Tax-Supported Debt to Personal Income (2.5% Target, 3% Ceiling)
As required by statute, the Committee has also established guidelines for evaluating the State’s debt burden as a measure of personal income.
The ratio of debt to personal income is projected to have peaked at 1.7% last year and will decline. Chart 9 below shows the amount of tax-supported debt as a percentage of personal income. Chart 9
0.0%
0.5%
1.0%
1.5%
2.0%
2009 2010 2011 2012 2013 2014 2015 2016 2017 2018Year
Debt to Personal Income Percentages
Debt to Personal Income % 2014 - 2018 are Estimates
Perc
enta
ge
Source: Population and Personal Income statistics provided by “Moody’s Economy.com”, courtesy of the North Carolina General Assembly Fiscal Research Division.

16
Ten-Year Payout Ratio (55% Target, 50% Minimum) The rating agencies consider the payout ratio (a measure of the period of time over which a State pays off its debt) as a credit factor. A fast payout ratio is a positive credit attribute. As illustrated in Chart 10 below, the State’s payout ratio exceeds its targeted level and is projected to improve further. Standard & Poor’s notes that for North Carolina, “overall tax-supported debt is amortized rapidly…”. The chart illustrates that over 70% of the State’s debt will be retired over the next 10 years assuming no new debt is authorized and issued. Chart 10
55% Target Ratio
50% Floor Ratio
40.0%45.0%50.0%55.0%60.0%65.0%70.0%75.0%80.0%85.0%90.0%95.0%
100.0%
Year
Ten-Year Payout Ratios
Ten -Year Payout Ratios
Ten
yea
r Pa
yout
%
Level of Unreserved Fund Balance As discussed previously, the rating agencies place a great deal of emphasis on budgetary reserves. In a 2005 report, Standard & Poor’s stated that “…reserves are critical to managing economic cycles and providing substantial flexibility to manage the budget and capital requirements of a government.”
The State ended FY 2013 with a positive fund balance in the General Fund of approximately $1.3 billion as calculated under generally accepted accounting principles (“GAAP”). This represents a significant turnaround from the negative ending balances of -$778 million and -$114 - million reported at the end of FY 2008-09 and FY 2009-10, respectively. The Rainy Day Fund has been boosted to $651 million, short of its peak of nearly $800 million and also short of the amount specified by the General Assembly in S.L. 2006-203 (8% of the prior year’s operating budget or approximately $1.582 billion). The Committee recognizes that during the recession the State faced serious financial and budgetary pressures and needed to draw down reserves in order to achieve

17
budgetary balance. In addition the Committee recognizes that the pace of the recovery has been slow. However, it is recommended that permanent sustainable solutions, that may require additional tax modifications, be evaluated to provide for the State’s ongoing revenue needs and achieve long term budgetary structural balance, including providing for an adequate level of reserves. In any event, the Committee recommends that provision for an adequate level of reserves, remain a priority.
Chart 11 depicts the State’s historic General Fund Balance on a GAAP basis over the last five years. The Rainy Day Fund is a budgetary reserve account and is not reported as an individual item in the GAAP basis financial statements, but as part of the fund balance. Chart 11
$1,048,969
$(777,573) $(114,380)
$1,183,105
($1,500,000)
($1,000,000)
($500,000)
$0
$500,000
$1,000,000
$1,500,000
$2,000,000
$2,500,000
$3,000,000
2009 2010 2011 2012 2013
Years
State of North CarolinaHistorical General Fund Total Fund Balances
Past 5 Years
Source: 2013 State of NC Comprehensive Annual Financial Report. Years prior to 2011 have not been restated for the implementation of GASB 54.
General Fund Total Fund Balance
GF
Bal
ance
$(0
00s)
$1,279,935
Refunding Opportunities Yields on tax-exempt debt obligations remain near historic lows. Rates have begun to rise, and many market analysts predict further increases. The State has standard procedures in place to monitor and take advantage of market opportunities by refinancing outstanding debt and replacing it with debt that carries lower interest costs. Typical refinancing structures employed by the State and its “triple-triple A” rated peers do not significantly extend maturities nor provide other one-time fixes to meet budgetary challenges. Since 2009, the State has refinanced a total of $3.0 billion of
18
previously outstanding GO Bonds and Special Indebtedness achieving aggregate debt service savings of $127.3 million. Additional refundings are being pursued but are dependent on market condition.
SECTION II
TRANSPORTATION DEBT AFFORDABILITY
Review of Transportation Funds, Debt and Other Commitments Highway Fund The Highway Fund accounts for most of the activities of the Department of Transportation (“DOT”), including the construction and maintenance of the State’s primary and secondary road systems. In addition, it supports areas such as the NC Ferry System and the Division of Motor Vehicles and provides revenue to municipalities for local street projects (termed “Powell Bill Transfers”) and to other State agencies. The principal revenues are motor fuels taxes, motor vehicle registration fees, driver’s license fees and federal aid. Highway Trust Fund The Highway Trust Fund was established by Chapter 692 of the 1989 Session Laws to provide a dedicated funding mechanism to meet the State’s highway construction needs. The Highway Trust Fund also provides allocations for secondary road construction, to municipalities for local street projects and provides transfers to both the General Fund and the Highway Fund. The principal revenues are highway use taxes, motor fuels taxes and various fees. The Highway Fund and the Highway Trust Fund are in many ways managed as a combined entity. Certain transportation revenues are deposited in each fund on a formulaic basis. For example, the Highway Fund receives ¾ of the Motor Fuels Tax and the Highway Trust Fund receives the remaining ¼. However, various combined expenditures are routinely paid from one fund or another. For example, salary expenses associated with the management of the Highway Trust Fund are actually paid out of the Highway Fund and debt service on the existing Highway GO Bonds is paid from the Highway Trust Fund. Powell Bill transfers are made from both Funds. Due to the interdependent nature of these funds, the Committee has determined that it is most useful to calculate the available debt capacities of these funds (collectively “Transportation Funds”) on an aggregate, rather than individual, basis. The resulting debt capacity is termed the “Transportation” debt capacity. On a combined basis, the Highway Fund and Highway Trust Fund are primarily involved with construction and maintenance of the State’s highways. From total budgeted sources in FY 2013, the Transportation Funds in total allocated approximately 82% ($3.62 billion) to capital intensive infrastructure improvements (Transportation Improvement Plan (“TIP”) Construction, Highway Maintenance and Other Construction).
19
Highway Debt The State has a long history dating back to 1921 of authorizing debt to fund transportation projects. The most recent authorization of $950 million of GO Bonds (the “1996 Bonds”) was enacted in 1996 by Chapter 590 of the Session Laws of the 1995 General Assembly, as amended (“The State Highway Bond Act of 1996” or “the 1996 Act”). The 1996 Bonds authorized debt to finance the capital costs of urban loops ($500 million), Intrastate System projects ($300 million) and secondary highway system paving projects ($150 million). All the Bonds authorized by the 1996 Act have been issued and as of June 30, 2013 the amount outstanding was $339.2 million. These are the only currently outstanding Highway Bonds. The 1996 Act stated the General Assembly’s intention to pay the debt service on the Bonds from the Highway Trust Fund, but did not pledge the Highway Trust Fund revenues to make such payments. Although the Act contained amendments regarding the priorities of the payment of funds from the Highway Trust Fund to provide for the payment of debt service, such funds are not pledged to secure the Bonds. Instead, the bonds are secured by “the faith and credit and taxing power of the State.” As such, the bond rating agencies did not analyze the ability of the Highway Trust Fund to service the debt when assigning their ratings. General Obligation Bonds versus Special Indebtedness-Transportation Implications As discussed above, the State’s outstanding Highway Bonds were issued as GO Bonds and are not secured by any transportation revenues. As a result, the bonds were rated on a parity with the State’s other GO Bonds, permitting them to be issued at the lowest possible interest rates. If the Bonds had not been on a parity basis but been rated on a stand-alone basis, they may not have been rated at the same level as the State’s GO Bonds. Bond counsel has determined that any bonding structure that pledges transportation revenues, the source of which is state-wide taxes or user fees, would most likely require a voter referendum. Therefore, the Committee advocates the use of GO Bonds for Transportation debt. Debt Service Debt Service on Highway Bonds peaked in FY 2006 at $93.6 million. In the future, the amount of actual debt service will decline as outstanding bonds are retired. Debt service, both on an absolute basis and as a percentage of Transportation revenues, is illustrated below. As discussed in more detail in Appendix B, appropriation of funds to support debt obligations issued by the North Carolina Turnpike Authority and any “availability payments” on Design-Build projects are treated the same as any other debt service obligation. Due substantially to legislative actions rescinding the annual authorization of $60 million of gap funded debt service for the Garden Parkway and Mid Currituck Bridge projects, future transportation-related debt service commitments shows a significant decline.

20
Chart 12
81.5
73.6
60.0
48.6
61.0
52.2
50.0
59.8
49.0
49.0
49.0
49.0
49.0
49.0
49.0
49.0
5.67.0
$0.0
$40.0
$80.0
$120.0
$160.0
$200.0
$240.0
2013 2014 2015 2016 2017 2018 2019 2020
Tota
l Deb
t Ser
vice
($m
illio
ns)
Fiscal Year
Transportation Debt Service Plus NCTA GAP & Availability Funding as % of Revenue
Availability Payments Funding NCTA Gap FundingTransportation Bonded Debt Service 6% of Transportation Revenue Line
3.3% 3.4%2.9%
3.1%3.9%4.0%
3.0%
Grant Anticipation Revenue Vehicle Bonds (“GARVEEs”)
A review of Transportation-related debt would be incomplete without a discussion of the State’s GARVEE program. Although not supported by State Transportation or General Fund revenues and therefore not technically a part of the Transportation debt affordability model, GARVEEs do represent a financing vehicle that provides significant funds to the State to accelerate transportation projects.
North Carolina General Statute §136-18 (12b) as codified by Session Law 2005-403 (“the GARVEE Act”) authorized the State to issue GARVEEs to accelerate the funding of transportation improvement projects across the State. GARVEEs are a revenue bond-type debt instrument where the debt service is to be paid solely from future federal transportation revenues and has no other State support. The State has issued four series of GARVEEs totaling $855 million and the program is targeted to reach nearly $1 billion over the next several years. The ratings assigned by Fitch,
4.3%
21
Standard & Poor’s and Moody’s for NC’s GARVEEs are, respectively: A+/AA/Aa3. Fitch and Moody’s downgraded the ratings by one level and, in addition, Moody’s lowered their outlook to “negative”. Related to these actions, all three noted the level of uncertainty about federal transportation funding policy, not concerns with the State’s GARVEE program. The low amount of GARVEE debt service relative to the total amount of federal reimbursements (approximately $86 million for FY 2013 versus actual collections of approximately $1 billion) means that federal sequestration should not impair bondholder payments.
North Carolina Turnpike Authority
The North Carolina Turnpike Authority (“NCTA”) as a part of the Department of Transportation is authorized to construct and operate toll roads within the State and to issue revenue bonds to finance the costs. The General Assembly has authorized funding to “pay debt service or related financing costs” for various series of revenue bonds issued by the NCTA (called “gap funding”). As of December 31, 2013, the NCTA had issued a total of $811 million of appropriation-supported bonds supported in part by this authorization utilizing a total of $49 million of gap funding to provide funding for two projects: the Triangle Expressway project and the Monroe Connector project. The NCTA has also issued approximately $622 million in toll-supported debt and is utilizing $146 million of GARVEEs for NCTA projects that are also not included in the model.
NCTA Build America Bonds (“BABs”) and Federal Sequestration As part of the plan of finance for both the Triangle Expressway project and the Monroe Connector project, the NCTA issued a total of approximately $469.6 million of BABs. These bonds depend upon a federal subsidy to make a portion of the interest payments due to bondholders. The federal subsidy was reduced by approximately $971,000 for this fiscal year due to Federal Sequestration. Reductions of a similar or slightly lesser size are anticipated for a number of the years into the future. DOT reports that there were sufficient funds in the general reserve accounts to make up for the shortfall so that bondholders were not affected. In addition, the debt service reserve funds for these issues total approximately $31.9 million and the total (net) annual subsidy for the current federal fiscal year totals $11.7 million.
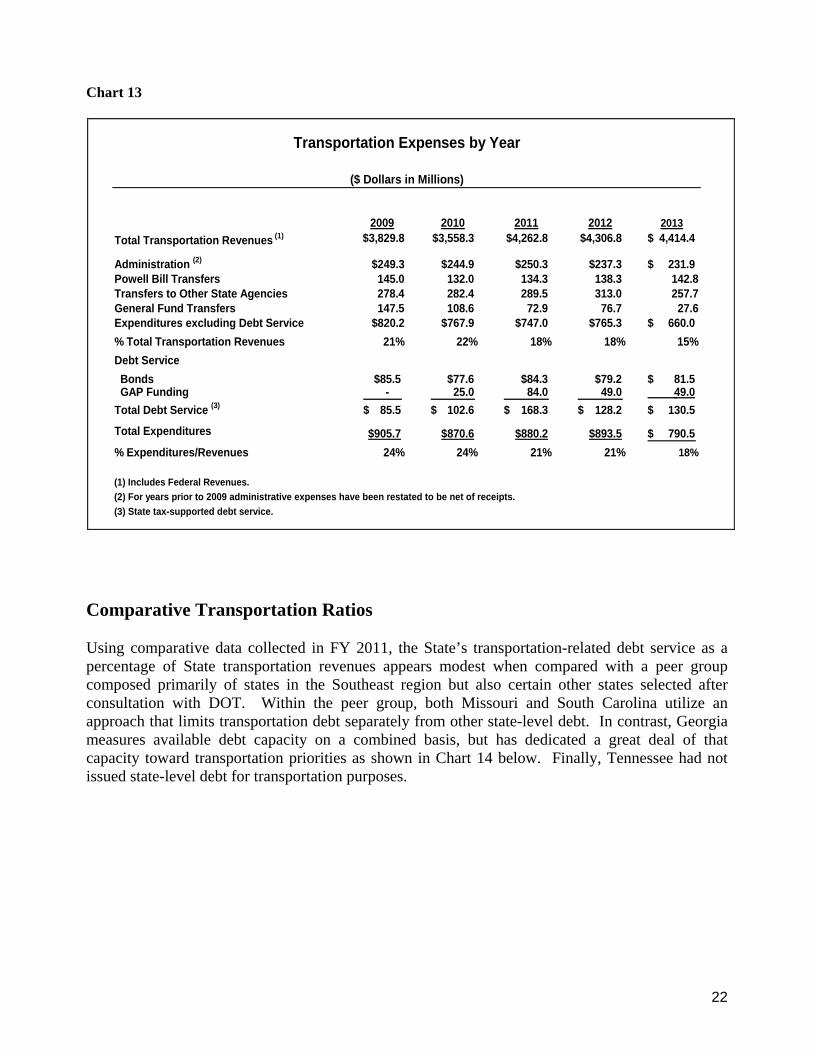
Other Transportation Expenditures Consistent with its treatment for General Fund debt affordability, the Committee does not advocate including non-debt related Transportation obligations or commitments in the definition of liabilities when measuring debt capacity. It is useful, however, to review the level of ongoing administrative and other recurring expenses/transfers when analyzing the level of flexibility in the Transportation Funds. From FY 2009-2013, the levels of these commitments are shown below both with and without debt service as a percentage of total Transportation Revenues, including federal revenues. On average, approximately 22% of the total Transportation revenues are allocated to administrative costs, transfers and debt service.
22
Chart 13
Transportation Expenses by Year
($ Dollars in Millions)
2009 2010 2011 2012 2013Total Transportation Revenues (1) $3,829.8 $3,558.3 $4,262.8 $4,306.8 4,414.4$
Administration (2) $249.3 $244.9 $250.3 $237.3 231.9$ Powell Bill Transfers 145.0 132.0 134.3 138.3 142.8Transfers to Other State Agencies 278.4 282.4 289.5 313.0 257.7General Fund Transfers 147.5 108.6 72.9 76.7 27.6Expenditures excluding Debt Service $820.2 $767.9 $747.0 $765.3 660.0$ % Total Transportation Revenues 21% 22% 18% 18% 15%Debt Service Bonds $85.5 $77.6 $84.3 $79.2 81.5$ GAP Funding - 25.0 84.0 49.0 49.0 Total Debt Service (3) 85.5$ 102.6$ 168.3$ 128.2$ 130.5$
Total Expenditures $905.7 $870.6 $880.2 $893.5 790.5$ % Expenditures/Revenues 24% 24% 21% 21% 18%
(1) Includes Federal Revenues.(2) For years prior to 2009 administrative expenses have been restated to be net of receipts.(3) State tax-supported debt service.
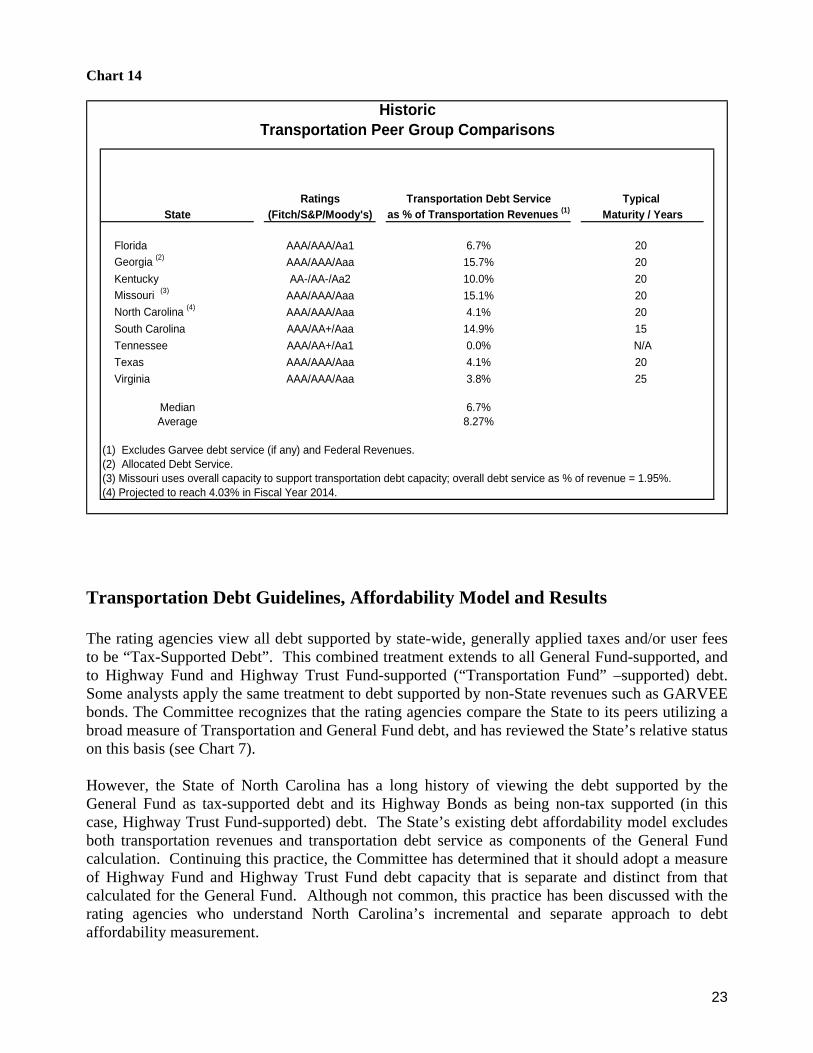
Comparative Transportation Ratios Using comparative data collected in FY 2011, the State’s transportation-related debt service as a percentage of State transportation revenues appears modest when compared with a peer group composed primarily of states in the Southeast region but also certain other states selected after consultation with DOT. Within the peer group, both Missouri and South Carolina utilize an approach that limits transportation debt separately from other state-level debt. In contrast, Georgia measures available debt capacity on a combined basis, but has dedicated a great deal of that capacity toward transportation priorities as shown in Chart 14 below. Finally, Tennessee had not issued state-level debt for transportation purposes.
23
Chart 14
HistoricTransportation Peer Group Comparisons
Ratings Transportation Debt Service Typical State (Fitch/S&P/Moody's) as % of Transportation Revenues (1) Maturity / Years
Florida AAA/AAA/Aa1 6.7% 20 Georgia (2) AAA/AAA/Aaa 15.7% 20 Kentucky AA-/AA-/Aa2 10.0% 20 Missouri (3) AAA/AAA/Aaa 15.1% 20 North Carolina (4) AAA/AAA/Aaa 4.1% 20 South Carolina AAA/AA+/Aaa 14.9% 15 Tennessee AAA/AA+/Aa1 0.0% N/A Texas AAA/AAA/Aaa 4.1% 20 Virginia AAA/AAA/Aaa 3.8% 25
Median 6.7%Average 8.27%
(1) Excludes Garvee debt service (if any) and Federal Revenues.(2) Allocated Debt Service.(3) Missouri uses overall capacity to support transportation debt capacity; overall debt service as % of revenue = 1.95%.(4) Projected to reach 4.03% in Fiscal Year 2014.
Transportation Debt Guidelines, Affordability Model and Results The rating agencies view all debt supported by state-wide, generally applied taxes and/or user fees to be “Tax-Supported Debt”. This combined treatment extends to all General Fund-supported, and to Highway Fund and Highway Trust Fund-supported (“Transportation Fund” –supported) debt. Some analysts apply the same treatment to debt supported by non-State revenues such as GARVEE bonds. The Committee recognizes that the rating agencies compare the State to its peers utilizing a broad measure of Transportation and General Fund debt, and has reviewed the State’s relative status on this basis (see Chart 7). However, the State of North Carolina has a long history of viewing the debt supported by the General Fund as tax-supported debt and its Highway Bonds as being non-tax supported (in this case, Highway Trust Fund-supported) debt. The State’s existing debt affordability model excludes both transportation revenues and transportation debt service as components of the General Fund calculation. Continuing this practice, the Committee has determined that it should adopt a measure of Highway Fund and Highway Trust Fund debt capacity that is separate and distinct from that calculated for the General Fund. Although not common, this practice has been discussed with the rating agencies who understand North Carolina’s incremental and separate approach to debt affordability measurement.
24
The Committee also recognizes the inherent differences between the General Fund and the Transportation Funds, not only in terms of the revenue streams, but also in terms of the commitments on those revenues. In addition, the State’s transportation “enterprise” is, by its nature, a long-lived, capital intensive, rapidly growing program. As such, a customized individual debt capacity model is appropriate to measure the debt capacities of the Transportation Funds. Finally, the Committee believes that an individual Transportation debt capacity calculation is consistent with the legislative intent of S.L. 2007-551. Due to the interdependent nature of the Highway and Highway Trust Funds as discussed earlier, the Committee has determined that it is more useful to calculate the available debt capacities of these Funds on an aggregate, rather than individual, basis. The resulting debt capacity is termed the “Transportation” debt capacity. The Committee has adopted the ratio of annual transportation-related debt service as a percentage of State transportation revenues as the measure to evaluate the level of Transportation debt capacity. By measuring what portion of the State’s transportation resources is committed to debt-related fixed costs, this ratio reflects the flexibility (or lack thereof) to allocate transportation resources to other priorities. Revenues Used in the Transportation Model Calculation The model uses a definition of State transportation revenues that includes an aggregate of all State-level revenues deposited into the Highway Fund and the Highway Trust Fund including the motor fuels tax, highway use tax, motor vehicle license tax and certain non-tax revenue such as investment income. Consistent with the model mechanics for the General Fund, there is no deduction for projected transfers to the General Fund, Powell Bill transfers or other non-debt commitments. Federal transportation revenues are specifically excluded from the definition of revenues used to calculate Transportation debt capacity as federal revenues have been pledged to the State’s GARVEE program and are not available to back other transportation-related debt. Debt Used in the Transportation Model Calculation The model uses a definition of State transportation debt service that includes outstanding Highway GO Bonds, gap funding and availability payments (see Appendix B for further discussion) but excludes the GARVEEs supported by federal revenues. There are currently no tax-supported capital lease obligations that need to be included. Highway Trust Fund support for debt issued by the North Carolina Turnpike Authority is included as a liability for model purposes. Debt Structuring Assumptions The following assumptions were used in this year’s debt affordability model calculations:
• There is no remaining authorized but unissued GO or non-GO debt. • Incremental model debt will be structured with a fixed rate 25-year maturity, a 6.15%
interest rate and an overall level debt service profile after the first year. It is the Committee’s determination that a 25-year structure, with a correspondingly higher interest rate, can be justified for analyzing debt that will be used to finance long-lived transportation infrastructure projects. The Committee notes that Virginia also utilizes a 25 year structure for transportation debt.

25
Transportation Debt Capacity Guidelines The Committee has adopted a guideline of 6% for transportation-related debt service as a percentage of state transportation revenues. In doing so, the Committee determined that the Transportation Funds enjoy a greater degree of budgetary flexibility than does the General Fund, and the Committee determined that the State’s Transportation funds could support a higher ongoing level of debt service as a percentage of revenues than was deemed appropriate for the General Fund. However, the Committee also determined not to adopt the same 15% guideline for Transportation debt capacity as was contained in the GARVEE legislation because GARVEEs have higher annual debt service requirements due to their shorter maturity. Primarily due to the reduced appropriation to support debt to be issued by the NCTA, the model projects currently available Transportation debt capacity in FY 2014. Table 5
TransportationNet Tax-Supported Debt Capacity using 6.0% debt service/revenues target ratio
(In millions of dollars)
Fiscal Year 2014 2015 2016 2017 2018
Total Additional Debt Capacity per Year * $805.4 $238.1 $22.1 $190.1 $0.0
Debt Capacity Available Each and Every Year 209.3 209.3 209.3 209.3 209.3* In addition to that already authorized but unissued. Assumes additional debt capacity is authorized and issued in stated fiscal year. GAP Funding for North Carolina Turnpike Authority projects assumed to reach $49 million in FY 2014 and thereafter.
Model Assumptions regarding Revenue Growth and Sensitivity Analysis The model uses NCDOT estimates for the revenues over the model horizon (see Appendix B). A one percent charge, either up or down, in transportation revenues in each and every year of the model horizon will change the amount of first year debt capacity by $2.2 million. A variation in revenues of $100 million per year will impact the amount of capacity in the first year by $75.6 million. If the interest rate assumption for all incremental debt is lowered by 100 basis points (1%) an addition $70.1 million of first year capacity is created.
26
SECTION III
Transportation and General Fund Ratios Combined
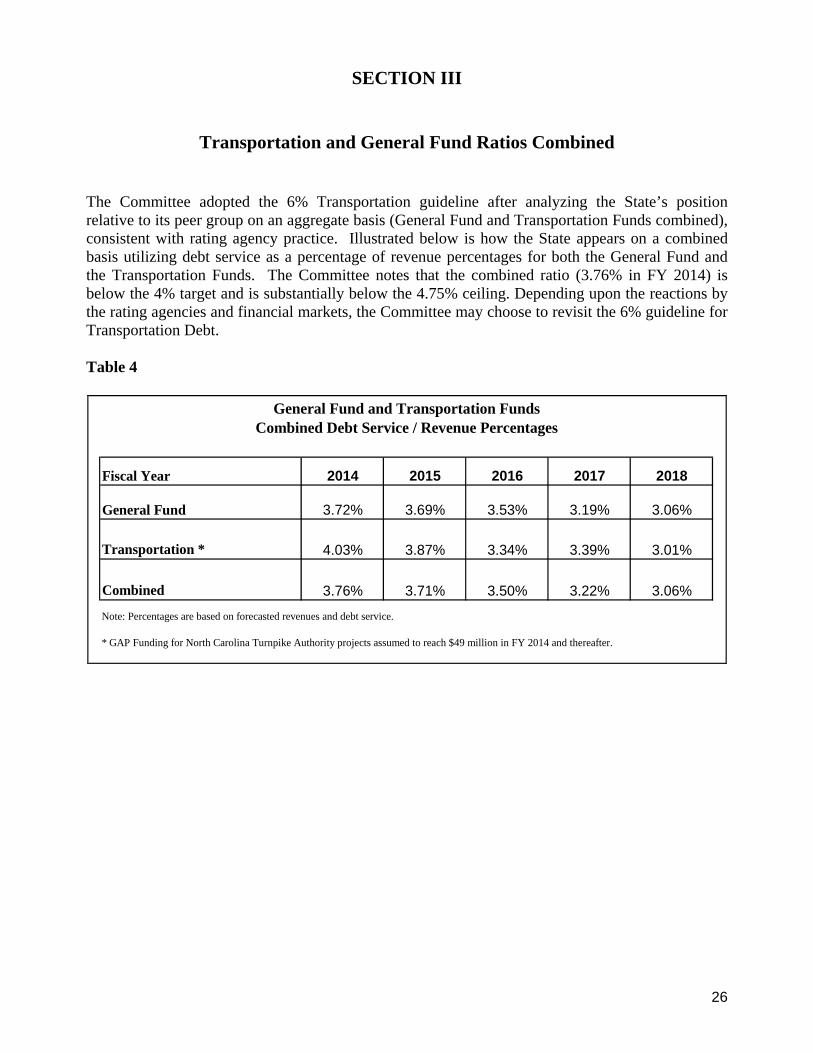
The Committee adopted the 6% Transportation guideline after analyzing the State’s position relative to its peer group on an aggregate basis (General Fund and Transportation Funds combined), consistent with rating agency practice. Illustrated below is how the State appears on a combined basis utilizing debt service as a percentage of revenue percentages for both the General Fund and the Transportation Funds. The Committee notes that the combined ratio (3.76% in FY 2014) is below the 4% target and is substantially below the 4.75% ceiling. Depending upon the reactions by the rating agencies and financial markets, the Committee may choose to revisit the 6% guideline for Transportation Debt. Table 4
General Fund and Transportation FundsCombined Debt Service / Revenue Percentages
Fiscal Year 2014 2015 2016 2017 2018
General Fund 3.72% 3.69% 3.53% 3.19% 3.06%
Transportation * 4.03% 3.87% 3.34% 3.39% 3.01%
Combined 3.76% 3.71% 3.50% 3.22% 3.06%
Note: Percentages are based on forecasted revenues and debt service.
* GAP Funding for North Carolina Turnpike Authority projects assumed to reach $49 million in FY 2014 and thereafter.

27
Appendix A
General Fund Revenues and Liabilities and Debt Affordability Model 10-Year Solutions
DAAC Revenues The model uses general tax revenues adjusted for one-time or non-recurring items plus certain other revenue items deemed available to service debt from the most recently available Comprehensive Annual Financial Report. The following items are included: General Fund Tax Revenues
• Individual Income Tax • Corporate Income Tax • Sales & Use Tax • Franchise Tax • Insurance Tax • Beverage Tax • Inheritance Tax • Other Taxes
Other General Fund Revenue Items
• Investment Income • Miscellaneous Revenues
Revenue Growth and Other Assumptions Changes to revenue estimates have a significant impact on the calculation of available debt capacity because of the multiplier effect of compounding growth over the ten-year period. Such projections are especially important when they reflect changing or differing economic outlooks.

28
In consultation with OSBM, DAAC revenue projections are assumed to be as follows: Table 6
General Fund Revenue ($ millions) (1)
Used in the Debt Affordability Model *
Revenues Growth Revenues Growth
Fiscal Year ($ millions) Rate Fiscal Year ($ millions) Rate
2013 $19,547.4 1.8% 2019 $23,582.2 3.0%2014 19,739.0 1.0% 2020 24,289.7 3.0%2015 20,309.6 2.9% 2021 25,018.3 3.0%2016 21,000.7 3.4% 2022 25,768.9 3.0%2017 21,951.0 4.5% 2023 26,542.0 3.0%2018 22,895.3 4.3% 2024 27,338.2 3.0%
* General Fund recurring tax revenues, miscellaneous revenues and Treasurer's investments.(1) Fiscal Years 2014 - 2024 revenue forecast as of December 20, 2013. Fiscal Year 2013 is actual.
Liabilities To calculate net tax-supported debt, credit analysts take into account all debt supported by general tax revenues. This debt position shows the amount of indebtedness serviced from an issuer’s General Fund; that is, it reflects the debt service payments made directly from tax revenues and is known as net tax-supported debt. Although a consensus appears to exist among credit analysts as to the appropriateness of using net tax-supported debt as the standard for determining an issuer’s debt position, there is less unanimity about the precise calculation. The Committee has determined to exclude self-supporting debt from its calculations.
The model uses a definition of net tax-supported debt that includes GO Bonds, Special Indebtedness, Capital Lease Obligations, and any other obligations that are owed to a third party over a predetermined schedule and paid from General Fund Revenues. Should mandatory payments be due to contractors or others under “Public Private” or “Design/Build/Finance” or other such arrangements, those payments would be counted as a liability for the model. Obligations of Component Units, Highway Fund debt that is paid from Highway Fund revenues and other self-supporting debt, including performing Energy Performance Contracts, are also excluded. The model includes the actual debt service from all outstanding net tax-supported debt and for all authorized, but currently unissued, tax-supported debt if such issuance does not require further action on the part of the General Assembly. OPEB In order to comply with Governmental Accounting Standards Board (GASB) Statements No. 43 and 45, the State Health Plan had an actuarial study completed that estimates the size of the State’s unfunded liability for OPEB. As of December 31, 2012 that unfunded liability was estimated at $23.117 billion. The bond rating agencies have been clear that OPEB liabilities do not represent a hard liability in the same way that debt service does and should not be considered part of a state’s

29
debt burden unless bonds are actually issued to fund the liability. They have also consistently assured the State that these liabilities do not represent a threat to the State’s credit rating in the short-term. Nevertheless, OPEB is receiving increased attention by the rating agencies including the development of analytics that calculate the burden on a per capita basis and other measures. We understand that the rating agency emphasis will be on determining the State’s flexibility to address and manage OPEB costs. Standard & Poor’s in particular notes that “Although North Carolina’s OPEB liabilities are high…, the state has made adjustments…to control costs and provide a mechanism to accumulate assets”. Actions taken by the State Health Plan have helped to reduce the State’s unfunded liability by approximately $6.493 billion over the last year ($9.685 in total), but over the longer term, the State will need to develop a plan to meet these obligations. Employment Security Commission Borrowings The Division of Employment Security (“DES”) has borrowed funds from U.S. Treasury to ensure uninterrupted payment of unemployment benefits when the cash balances in the Unemployment Compensation Fund were depleted. These advances, totaling $1.833 billion at December 31, 2013, are repayable solely from unemployment tax contributions. Interest began accruing on the balance on January 1, 2011; the first interest payment of $78.15 million was made in September 2011, the second of $83.9 million was made in September 2012 and the third of $62.5 million was made in September 2013. The advances themselves are paid from the unemployment tax contributions from employers which are designed to retire the liability. Currently DES estimates that they will be paid in full by late fall 2015 after factoring in changes taken last year to amend North Carolina’s program. Interest payments are made from the State’s surcharge reserve, which had a balance of $6.4 million at December 31, 2013. The interest rate charged to the State is based on the cost of federal borrowing, and declined for the current calendar year to 2.39%. Proposals in which the State would issue debt to retire the obligation early discussed in depth during the last legislative session would mean that the General Fund could be called upon to make debt service payments. If such debt is ever issued, those payments would need to be included in the model calculations. Teachers’ and State Employees’ Retirement System – Annual Required Contribution The State has fully funded the ARC for the TSERS in 71 of the last 72 years, helping to ensure that the State maintains a responsibly-funded system. At 94%, the System remains one of the best funded state retirement systems in the country. Like OPEB, any unfunded obligations do not represent a hard liability in the same way that debt service does and is not counted in the model. The following is a list of those liabilities that are included in the General Fund model (outstanding amounts as of June 30, 2013):
• GO Bonds supported by General Fund Tax Revenue - $3.7 billion • Supported by General Funds
o Limited Obligation Bonds - $1,993.7 million o Certificates of Participation- $508.5 million o Capital Leases, Installment Purchase Contracts and Equipment lease obligations
determined pursuant to G.S. 147-33.72H - $46.4 million o Lease Revenue or Lease-Purchase Revenue Bonds - $20.9 million
Liabilities not included in the General Fund model (outstanding amounts as of June 30, 2013):

30
• Highway Construction General Obligation Debt supported by Highway Trust Fund - $339.2 million
• Short Term Tax Anticipation Notes (not supported by General Tax Revenue) - $0 • Obligations of the University of North Carolina System or other Component Units – $8.2
billion
• Energy Performance Contract obligations where such obligations are guaranteed and approved pursuant to G.S. 142-64 and not supported by separate appropriations - $186.4 million issued
• OPEB
• Employment Security advances from the US Treasury not anticipated to be paid from
General Fund revenues. Note: Although these liabilities may not constitute tax-supported debt, some are obligations of the State or various component units and the State’s General Fund, although not legally obligated to, could be called upon to service these obligations if necessary.
Debt Structuring Assumptions The following assumptions were used in this year’s debt affordability model calculations:
• The State does not have any outstanding Variable Rate Debt and is not expected to issue any over the model horizon.
• The State does not have any authorized but unissued GO Debt. • The State has approximately $206 million of non-GO authorized but unissued debt. This
debt is assumed to be structured with a 20-year level principal profile and the interest cost is estimated to be 6%.
• Incremental model debt will be structured with a fixed rate 20-year maturity, a 6% interest rate, and an overall level debt service profile after the initial year.
31
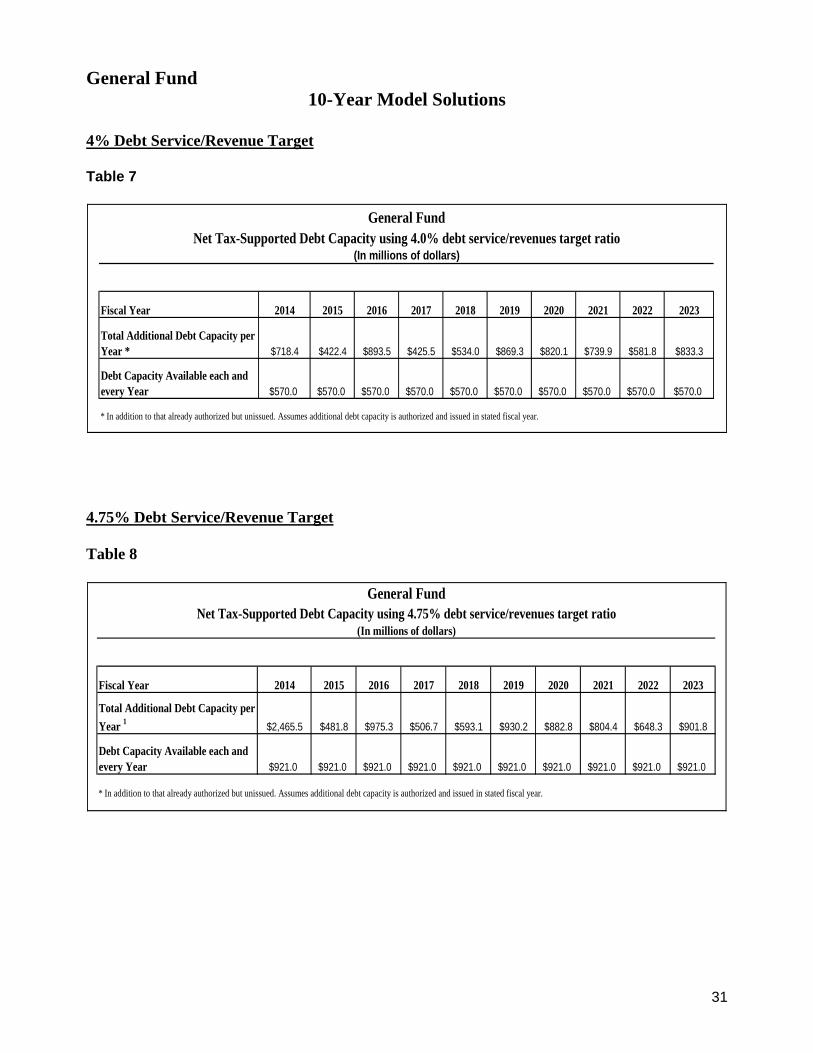
General Fund 10-Year Model Solutions
4% Debt Service/Revenue Target Table 7
General FundNet Tax-Supported Debt Capacity using 4.0% debt service/revenues target ratio
(In millions of dollars)
Fiscal Year 2014 2015 2016 2017 2018 2019 2020 2021 2022 2023
Total Additional Debt Capacity per Year * $718.4 $422.4 $893.5 $425.5 $534.0 $869.3 $820.1 $739.9 $581.8 $833.3
Debt Capacity Available each and every Year $570.0 $570.0 $570.0 $570.0 $570.0 $570.0 $570.0 $570.0 $570.0 $570.0
* In addition to that already authorized but unissued. Assumes additional debt capacity is authorized and issued in stated fiscal year.
4.75% Debt Service/Revenue Target Table 8
General FundNet Tax-Supported Debt Capacity using 4.75% debt service/revenues target ratio
(In millions of dollars)
Fiscal Year 2014 2015 2016 2017 2018 2019 2020 2021 2022 2023
Total Additional Debt Capacity per Year 1 $2,465.5 $481.8 $975.3 $506.7 $593.1 $930.2 $882.8 $804.4 $648.3 $901.8
Debt Capacity Available each and every Year $921.0 $921.0 $921.0 $921.0 $921.0 $921.0 $921.0 $921.0 $921.0 $921.0
* In addition to that already authorized but unissued. Assumes additional debt capacity is authorized and issued in stated fiscal year.
32
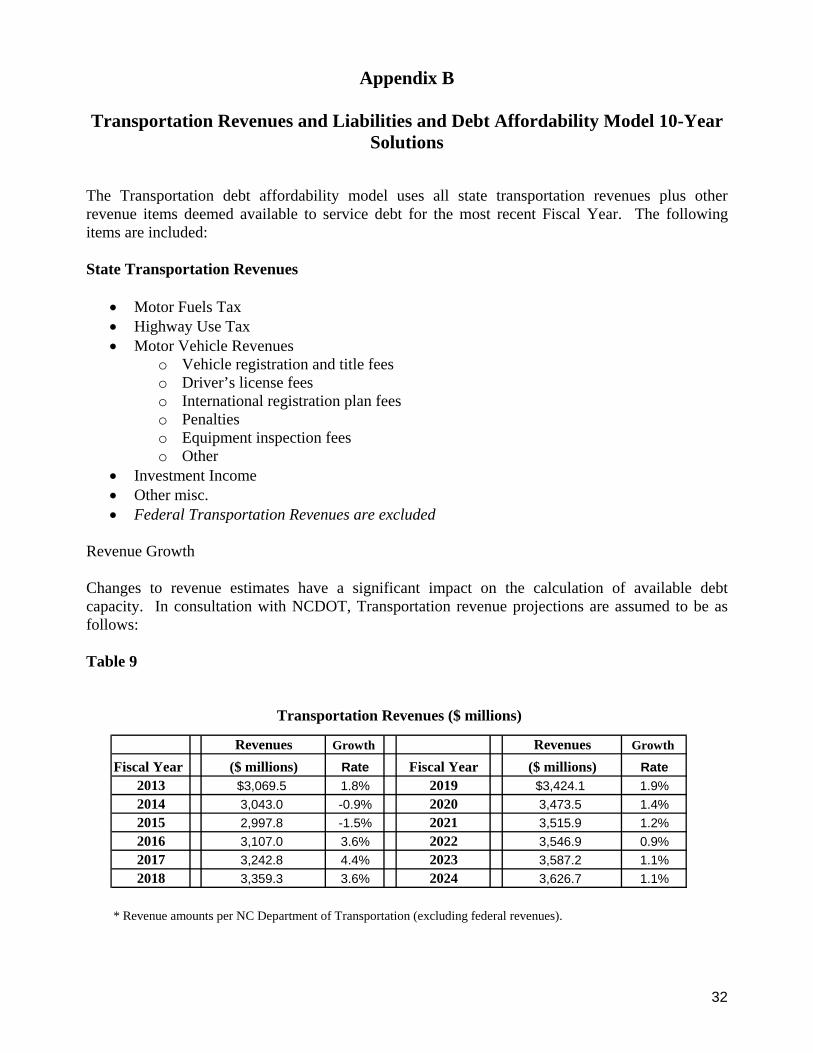
Appendix B
Transportation Revenues and Liabilities and Debt Affordability Model 10-Year Solutions
The Transportation debt affordability model uses all state transportation revenues plus other revenue items deemed available to service debt for the most recent Fiscal Year. The following items are included: State Transportation Revenues
• Motor Fuels Tax • Highway Use Tax • Motor Vehicle Revenues
o Vehicle registration and title fees o Driver’s license fees o International registration plan fees o Penalties o Equipment inspection fees o Other
• Investment Income • Other misc. • Federal Transportation Revenues are excluded
Revenue Growth Changes to revenue estimates have a significant impact on the calculation of available debt capacity. In consultation with NCDOT, Transportation revenue projections are assumed to be as follows: Table 9
Transportation Revenues ($ millions)
Revenues Growth Revenues Growth
Fiscal Year ($ millions) Rate Fiscal Year ($ millions) Rate2013 $3,069.5 1.8% 2019 $3,424.1 1.9%2014 3,043.0 -0.9% 2020 3,473.5 1.4%2015 2,997.8 -1.5% 2021 3,515.9 1.2%2016 3,107.0 3.6% 2022 3,546.9 0.9%2017 3,242.8 4.4% 2023 3,587.2 1.1%2018 3,359.3 3.6% 2024 3,626.7 1.1%
* Revenue amounts per NC Department of Transportation (excluding federal revenues).

33
Transportation Liabilities The model uses the debt service from all outstanding Highway Bonds and includes transportation-related capital lease obligations and installment purchase contracts if appropriate. There is no currently authorized but unissued transportation-related debt to include, but the model would count such debt and the resulting debt service as part of Transportation Liabilities if there were. Debt Service arising from the State’s GARVEE program is not included as a State Transportation Liability because the GARVEEs are supported solely by federal transportation revenues. The General Assembly has authorized funding to “pay debt service or related financing costs” for various series of revenue bonds issued by the North Carolina Turnpike Authority. The funds so appropriated are legally pledged to support the bonds and bondholders will depend upon the appropriations continuing. Therefore, the model treats the gap funding as the equivalent of debt service since it represents ongoing Highway Trust Fund support of debt. $49 million of GAP funding is treated as debt service for each year over the 10-year model horizon. NCDOT has also pledged certain operating and maintenance funds to secure debt, if necessary to provide adequate coverage levels. At the present, it appears that such funding will not be required. However, these funds would be treated as additional gap funding for model purposes if NCDOT were to be required to make such payments. The model counts “availability payments” as a debt-like obligation. These payments are contractually owed to the contractor or other service provider on a delayed schedule that stretches beyond the standard construction period. Sometimes entered into as part of Public Private Design/Build/Finance and/or other arrangements, the delayed payments represent debt service for contractor-provided financing. The debt-like characteristics of availability payments (even if “subject to appropriation”) mean that the payments are treated as a liability for the purposes of the model. NCDOT has entered into such arrangements that are projected to require availability payments of approximately $7.0 and $5.6 million in FY 2015 and FY 2016, respectively. This year’s Transportation debt affordability model assumes that model debt is fixed-rate 25-year maturity debt with an average interest cost of 6.15% and a level debt service profile after the first year.

34
Transportation
10-Year Model Solution Table 10
TransportationNet Tax-Supported Debt Capacity using 6.0% debt service/revenues target ratio
(In millions of dollars)
Fiscal Year 2014 2015 2016 2017 2018 2019 2020 2021 2022 2023
Total Additional Debt Capacity per Year * $805.4 $238.1 $22.1 $190.1 $0.0 $0.0 $785.4 $23.4 $30.5 $27.1
Debt Capacity Available each and every Year $209.3 $209.3 $209.3 $209.3 $209.3 $209.3 $209.3 $209.3 $209.3 $209.3
* In addition to that already authorized but unissued. Assumes additional debt capacity is authorized and issued in stated fiscal year. GAP Funding for North Carolina Turnpike Authority projects assumed to reach $49 million in FY 2014 and thereafter.
35
Appendix C
Public Private Partnerships Review of Recent Debt-Related Legislation
Recommendations-Discussion
Public Private Partnerships-Debt Aspects As the State enacts laws that permit the procurement and financing of assets through the use of Public Private Partnerships (“P3”s), care should be taken to ensure that sound debt management and authorization practices are in place in the review and approval process. The term P3 can describe a wide variety of arrangements in which a private sector entity plays a key role in the acquisition of an asset and/or the provision of a service. While P3s may appear to provide a new source of funds in a time of diminished revenues and debt capacity, such agreements often contain financing arrangements with the private entity that results in that entity incurring debt or obligations secured, directly or indirectly by governmental payments or charges to the citizens of that government. Governing Magazine notes in an article from the November 2013 issue concerning P3s that “capital often comes at a cost that can exceed the expense of a typical municipal borrowing”. In times of diminished resources governments should compare the costs of financing under a P3 arrangement with the issuance of more typical municipal debt when determining the preferable means of financing the acquisition of an asset. P3s do not create additional debt capacity although it may appear so if you do not view the agreements as debt or debt-like obligations. However, these are often a commitment of funds in order to acquire an asset and that must be treated like debt when determining debt capacity. Failure to make the contractual payments could result in loss of the asset and create a default of a contractual liability to another party, and would typically impact the credit rating of the government. The rating agency treatment is clear: when a state’s payments are used to support or secure debt issued by a private party, other public entity, and conduit issuer or through a lease arrangement, such debt will be counted toward the state’s debt burden. Sponsoring agencies whose mission is to provide a particular service or asset are not in the best position to make decisions that prioritize the use of a state’s debt capacity or require a state to enter into debt-like arrangements. That decision should be made by the state’s legislative body which represents all the citizens of the state and is equally responsible for providing all services to all citizens. Centralized debt authorization, issuance and management are considered one of North Carolina’s credit strengths. As stated by Fitch the “Issuance and management of all North Carolina debt is centralized” and “Centralized management of debt in North Carolina is a credit strength” further noting that the “treasurer approves execution of each financing”. In the Committee’s view, the prioritization of capital projects and the issuance of obligations that increase the State’s debt burden should remain the prerogative of the General Assembly.
36
Review of Recent Debt-Related Legislation Limitation on Special Indebtedness Session Law (“S.L.”) 2013-78 (SB 129) limits the amount of Special Indebtedness that the State may incur. According to this law, Special Indebtedness authorized by legislation enacted after January 1, 2013 cannot exceed 25% of the total bond indebtedness of the State supported by the General Fund that was authorized pursuant to legislation enacted after January 1, 2013. There has been no General Obligation or Special Indebtedness authorized after January 1, 2013. Debt Issuance Accountability Act Pursuant to the recommendations contained in the 2013 Debt Affordability Study, the Treasurer’s office prepared legislation to limit the ability of State agencies to enter into debt or debt-like arrangements without legislative authority (HB 364). The bill was subsequently amended to require the Joint Legislative Program Evaluation Oversight Committee to conduct a study to evaluate the current practices of State agencies and institutions in this area. The bill passed the House. In the Senate the bill was referred to the Committee on Rules and Operations. Public Private Partnerships There were two bills that concern debt and/or debt-like instruments within the context of P3s. S.L. 2013-183 (HB 817) permits DOT to enter into three agreements with private parties (with no dollar limitation) that provide for payments made by DOT to be assigned to a lender or bondholder. In addition, as a conduit issuer, DOT may issue revenue bonds subject to Local Government Commission (“LGC”) approval. DOT is required to report certain aspects of the agreements to the Joint Legislative Transportation Oversight Committee prior to entering into the agreements. S.L. 2013-401 (HB 857) expands the authority of the State to carry out procurement using “public private partnerships.” If the public private partnership arrangement involves a capital lease that requires payments from the General Fund, then the project would need to be approved under the same approval process that exists for Special Indebtedness (including legislative approvals). If the source of the funds is the Highway Fund or the Highway Trust fund, there are no further legislative or LGC approvals required. Debt Service Paid from Trust Funds Legislation passed which clarified that all debt service previously paid from various trust funds (e.g. Parks and Recreation Trust Fund, Natural Heritage Trust Fund, Clean Water Trust Fund, Health and Wellness Trust Fund and the Tobacco Trust Fund) is hereafter to be paid from the General Fund. For the purposes of the Debt Affordability Study, this legislation has no impact as such amounts have been treated as already being paid from the General Fund. Recommendations-Further Discussion Control of Debt Authorization Authority As an alternative to traditional debt structures, various agencies have proposed “off balance sheet” types of arrangements to provide funding for capital projects, including various lease structures and other agreements arranging for payments made over time subject to the availability of funds. Not only do such structures typically result in more expensive financing costs, they also circumvent the State’s historically conservative debt management practices. The Committee strongly recommends that the State of North Carolina maintain its historically conservative debt management practices with regard to (1) centralized debt authorization; (2) debt management and issuance; and (3)
37
classification of debt and debt-like obligations when determining the debt burden. These practices are among those considered by the rating agencies when assigning their “triple A” ratings to the State and ultimately allow the State to maintain a healthy financial position. Centralized debt authorization, issuance and management are considered one of North Carolina’s credit strengths. As stated by Fitch the “Issuance and management of all North Carolina debt is centralized” and “Centralized management of debt in North Carolina is a credit strength” further noting that the “treasurer approves execution of each financing”. The Committee believes that centralized debt management is a key best financial management practice and should be embraced by the State as a matter of policy. Furthermore, the Committee strongly encourages the General Assembly to adopt language restricting the ability of any state department, agency, institution, board or commission to enter into financial arrangements that incur debt or debt-like obligations. The Committee notes that legislation developed to implement this recommendation (HB 364) did not advance in a form that contained the desired level of control. State Aid Intercept There has been legislation proposed that would provide for the timely payment of special obligation bonds issued for the constituent institutions of the University of North Carolina by requiring the State to “intercept” General Fund appropriations to those entities in order to make debt service payments on “self-liquidating” indebtedness issued pursuant to G.S. 116D. Similar proposals have been discussed and put forth by other State entities. In essence, this back stop of debt service obligations by the State’s General Fund elevates the credit quality of the debt and provides the issuer with debt service savings. The Committee strongly opposes on policy grounds providing credit support for debt issues whose source of repayment was and is represented to be project revenues. The use of State appropriations is not currently permitted to be used to pay debt service on such debt issues. In addition, the proposals have not provided for appropriate levels of State oversight and control for debt issues that may potentially utilize the State’s debt capacity and increase its debt burden. 2/3rds General Obligation Bonds The State’s Constitution permits the issuance of GO bonds without voter approval to the extent of two-thirds of the amount by which the state’s outstanding GO indebtedness was reduced over the previous biennium. For the FY 2013-2015 biennium, the State could issue up to $564 million of 2/3rds GO bonds with legislative approval. If no new debt authorizations are desired, the Committee recommends that the General Assembly at least consider authorizing 2/3rds GO bonds to supplant the State’s $206 million of authorized but unissued Special Indebtedness. This should result in interest rate savings and lower debt service costs estimated at approximately $6.8 million over the life of the debt. Structural Budget Balance and Reserve Replenishment The Committee confirms its view that North Carolina’s priorities of achieving structural budgetary balance and rebuilding the State’s reserve funds are strong evidence of financial stability and flexibility. The Committee also recognizes that past legislative action targeting an 8% level of reserves in the State’s Budget Stabilization Fund (also known as the “Rainy Day Fund”) should serve the State well in the event of future economic downturns, and that the Rainy Day Fund has continued to be replenished after being severely depleted during the recession. The Committee recognizes that long term budgetary stability and reserve fund replenishment are key factors in maintaining our “triple A” bond rating. In its 2013 report, Moody’s states that a “Depletion of

38
budget reserves with no plans to replenish the funds” could result in a reduction in North Carolina’s bond rating. Other Liabilities The State has significant liabilities that do not impact the calculation of debt capacity for the General Fund and Highway Funds (see Appendix A). One such liability is the unfunded portion of retiree health care benefits (termed Other Post Employment Benefits or “OPEB”), which totaled $23.1 billion as of December 31, 2012 a decrease of approximately $6.5 billion from the prior year. Cumulative changes to the plan have reduced the unfunded liability by nearly $10 billion since the 12/31/10 valuation. The OPEB liability is not considered a “hard" liability because it is based upon estimates of costs the State will incur in the future and because the payment schedule of the liability is uncertain. Although the State has accumulated balances of approximately $811.6 million and the unfunded liability has been reduced, the State should consider additional action to fund this liability over time. As of December 31, 2013 the State had a liability of $1.833 billion to the U.S. Treasury for funds borrowed to make unemployment benefit payments. This debt is not considered an obligation of the General Fund as its repayment, including interest costs, is paid from contributions by our employers. The Committee recognizes that as a result of recent legislative changes the federal loan is projected to be retired by late 2015. The State has fully funded the annual required contribution (“ARC”) for the Teachers’ and State Employees’ Retirement System (“TSERS”) for 71 of the last 72 years. At 94%, the System represents the third best funded state retirement system in the country according to Morningstar. Like OPEB, any unfunded obligations do not represent a hard liability in the same way that debt service does and is not included in the model. While these other liabilities do not impact the debt capacity of the General Fund and Highway Funds, they could have a negative impact upon the bond ratings of the State. We recommend that the General Assembly determine the best course of action to address each of these liabilities, including measures to contain costs when possible and to appropriate funds or take other action to address these liabilities.
Related Documents


