STATE OF CHINOOK SALMON IN LAKE HURON in 1999 BY: Jim Johnson, Michigan Department of Natural Resources Lloyd Mohr, Ontario Ministry of Natural Resources Greg Wright, Chippewa Ottawa Fishery Resource Authority

STATE OF CHINOOK SALMON IN LAKE HURON in 1999 BY: Jim Johnson, Michigan Department of Natural Resources Lloyd Mohr, Ontario Ministry of Natural Resources.
Jan 03, 2016
Welcome message from author
This document is posted to help you gain knowledge. Please leave a comment to let me know what you think about it! Share it to your friends and learn new things together.
Transcript
STATE OF CHINOOK SALMON IN LAKE HURON
in1999 BY:
Jim Johnson, Michigan Department of Natural Resources
Lloyd Mohr, Ontario Ministry of Natural Resources
Greg Wright, Chippewa Ottawa Fishery Resource
Authority
CHINOOK STOCKING TRENDS LAKE HURON, ALL AGENCIES
0
1,000,000
2,000,000
3,000,000
4,000,000
5,000,000
6,000,000
1968
1970
1972
1974
1976
1978
1980
1982
1984
1986
1988
1990
1992
1994
1996
1998
2
CREEL CENSUS BEGINS20% reductionin stocking
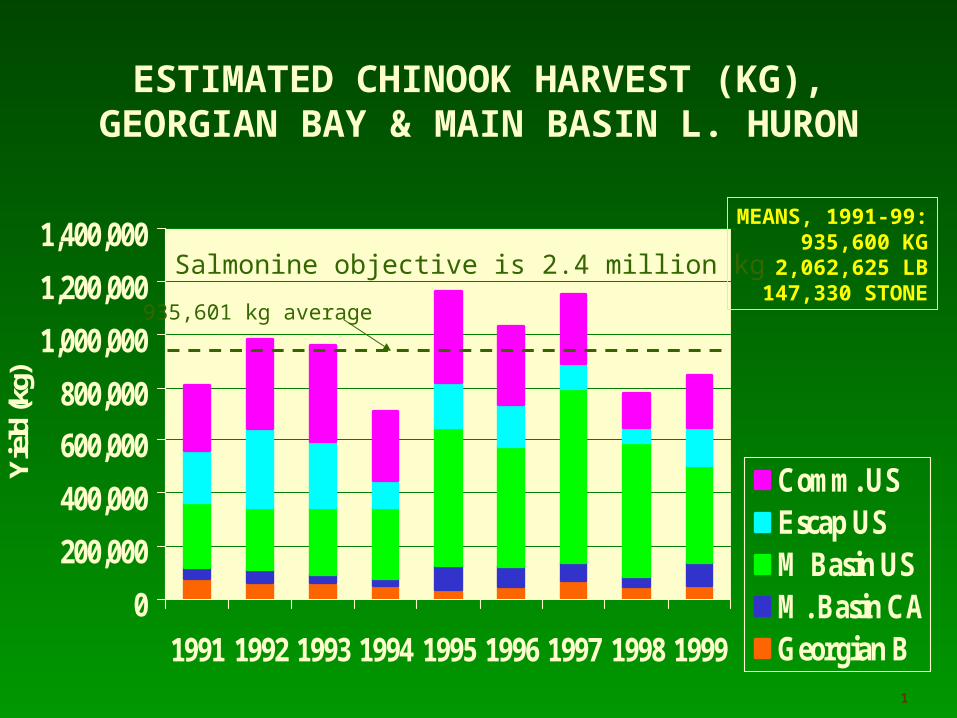
ESTIMATED CHINOOK HARVEST (KG), GEORGIAN BAY & MAIN BASIN L. HURON
0
200,000
400,000
600,000
800,000
1,000,000
1,200,000
1,400,000
1991 1992 1993 1994 1995 1996 1997 1998 1999
Yie
ld (k
g)
Comm. USEscap USM Basin USM. Basin CAGeorgian B
1
MEANS, 1991-99:935,600 KG
2,062,625 LB147,330 STONE
935,601 kg average
Salmonine objective is 2.4 million kg
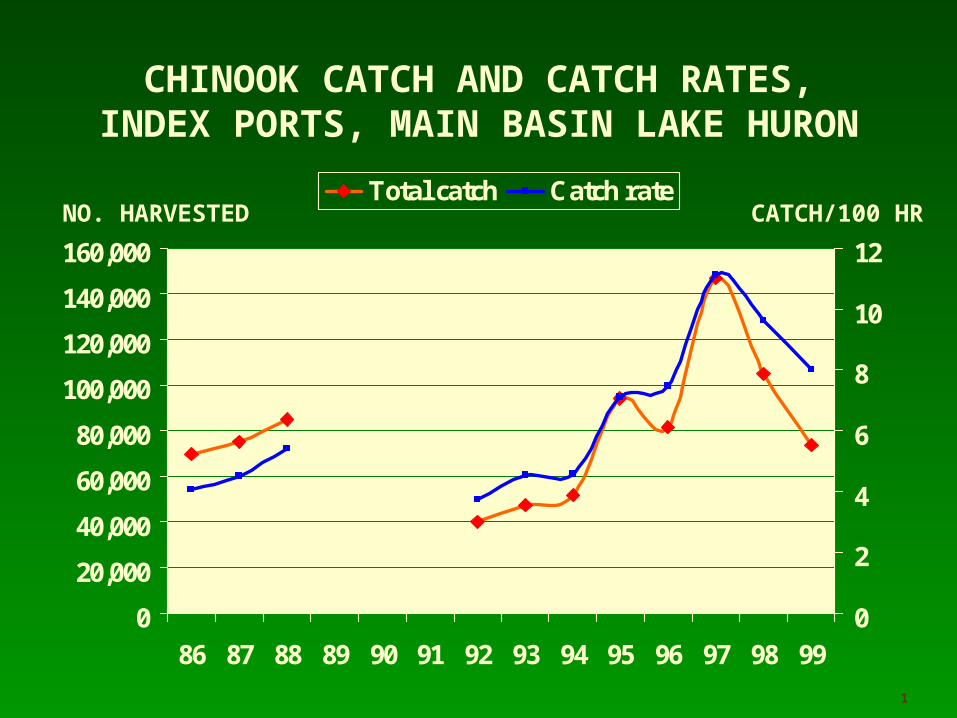
CHINOOK CATCH AND CATCH RATES, INDEX PORTS, MAIN BASIN LAKE HURON
0
20,000
40,000
60,000
80,000
100,000
120,000
140,000
160,000
86 87 88 89 90 91 92 93 94 95 96 97 98 990
2
4
6
8
10
12
Total catch Catch rateCATCH/100 HRNO. HARVESTED
1
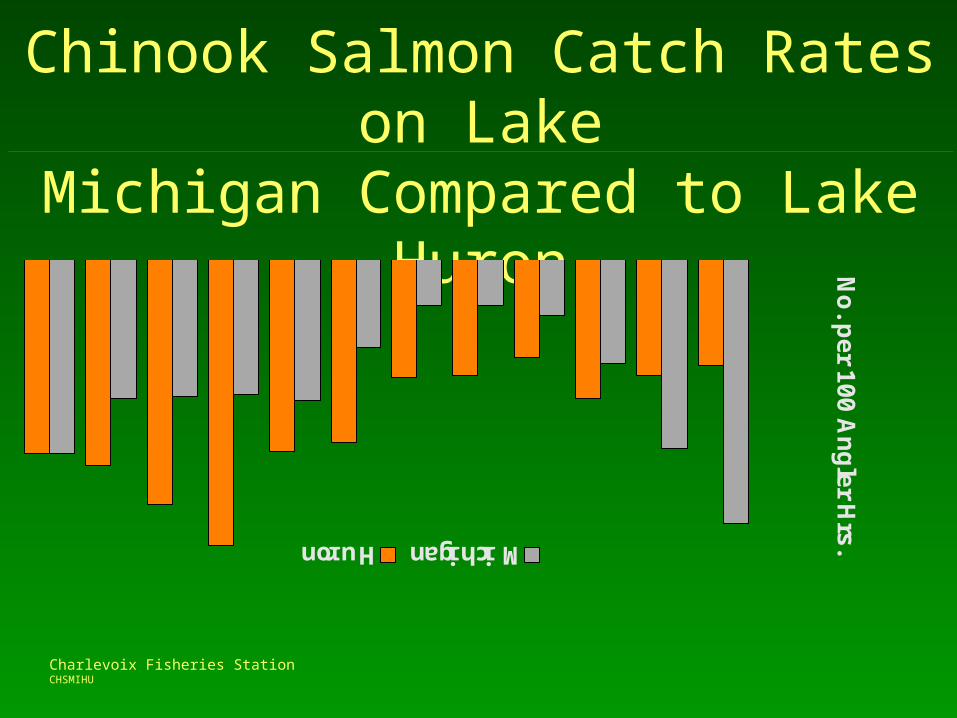
Chinook Salmon Catch Rates on LakeMichigan Compared to Lake Huron
Charlevoix Fisheries StationCHSMIHU
0.0
2.0
4.0
6.0
8.0
10.0
12.0
868788929394959697989900
No
. pe
r 10
0 A
ng
ler H
rs.MichiganHuron
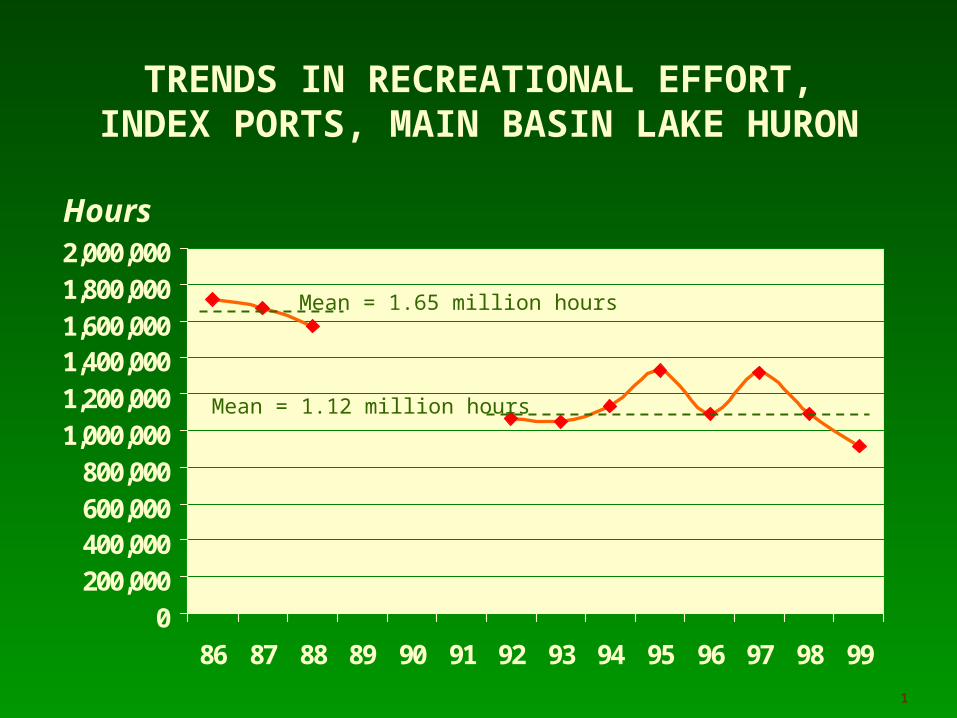
TRENDS IN RECREATIONAL EFFORT, INDEX PORTS, MAIN BASIN LAKE HURON
0200,000400,000600,000800,000
1,000,0001,200,0001,400,0001,600,0001,800,0002,000,000
86 87 88 89 90 91 92 93 94 95 96 97 98 99
Hours
1
Mean = 1.65 million hours
Mean = 1.12 million hours

Why the rise in Lake Huron chinook catch rates?
The answer probably includes:
•Increase in pen culture•Increase in vulnerability
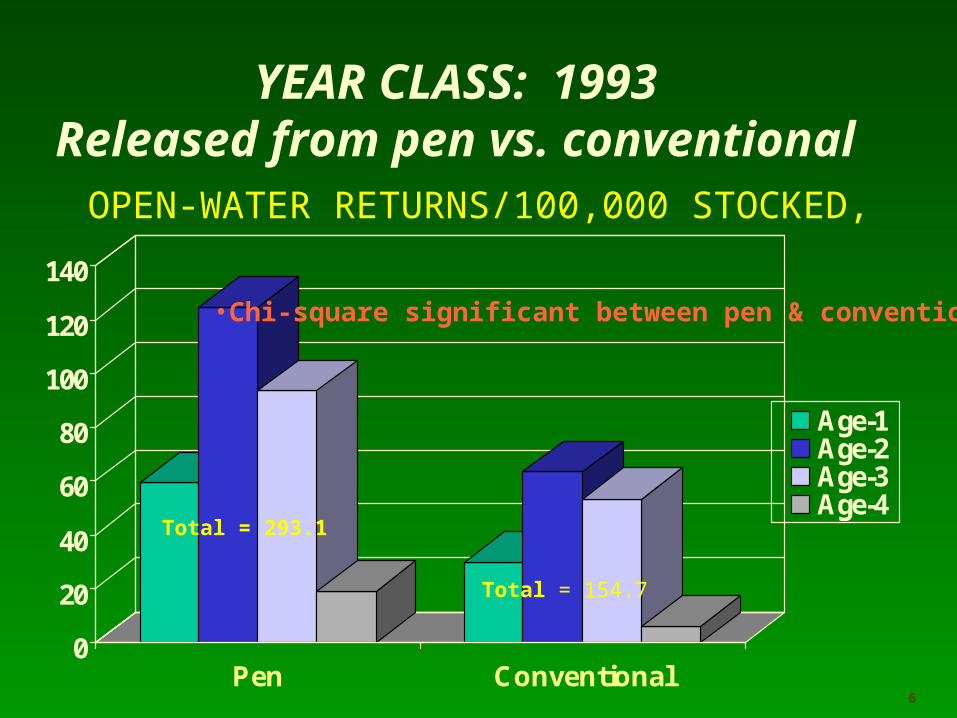
OPEN-WATER RETURNS/100,000 STOCKED,
0
20
40
60
80
100
120
140
Pen Conventional
Age-1Age-2Age-3Age-4
YEAR CLASS: 1993Released from pen vs. conventional
•Chi-square significant between pen & conventional
6
Total = 293.1
Total = 154.7
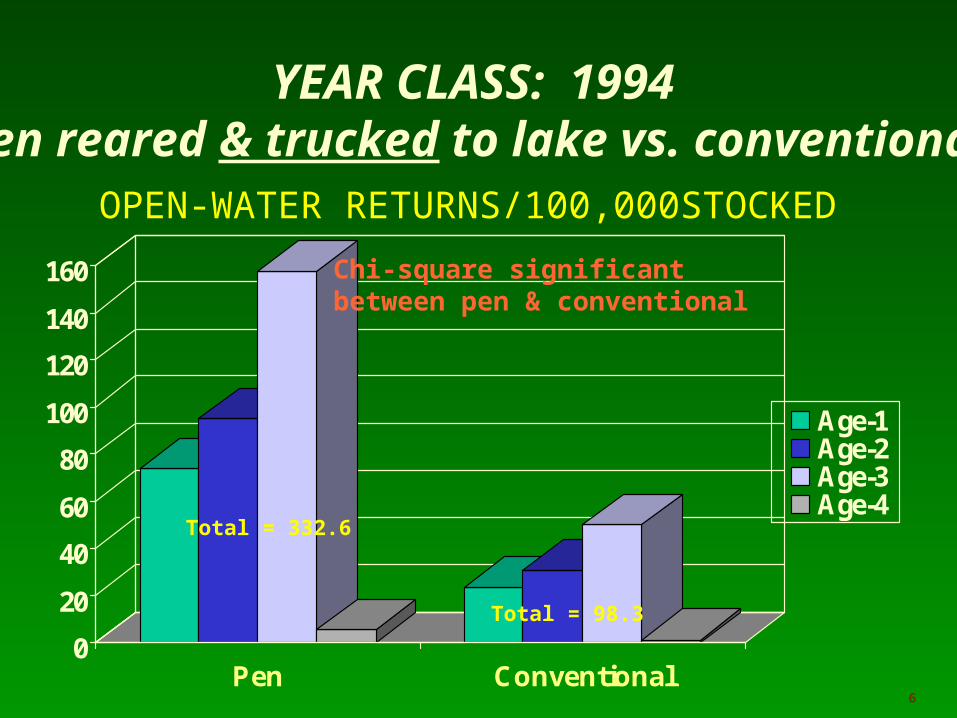
OPEN-WATER RETURNS/100,000STOCKED
0
20
40
60
80
100
120
140
160
Pen Conventional
Age-1Age-2Age-3Age-4
YEAR CLASS: 1994Pen reared & trucked to lake vs. conventional
Chi-square significantbetween pen & conventional
6
Total = 332.6
Total = 98.3
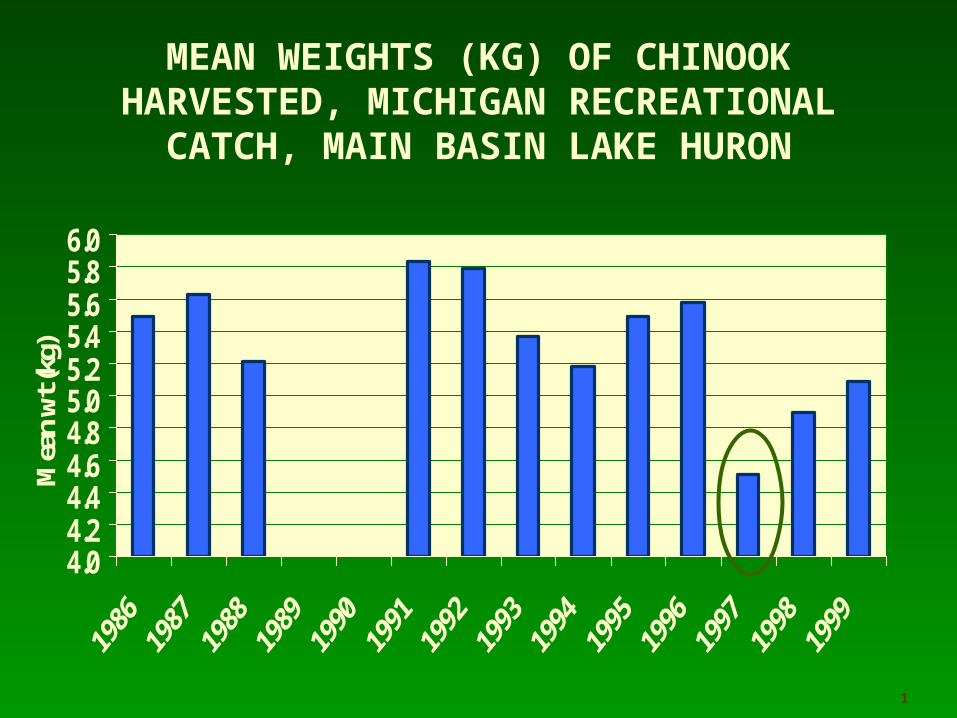
MEAN WEIGHTS (KG) OF CHINOOK HARVESTED, MICHIGAN RECREATIONAL
CATCH, MAIN BASIN LAKE HURON
4.04.24.44.64.85.05.25.45.65.86.0
Mea
n w
t (kg
)
1
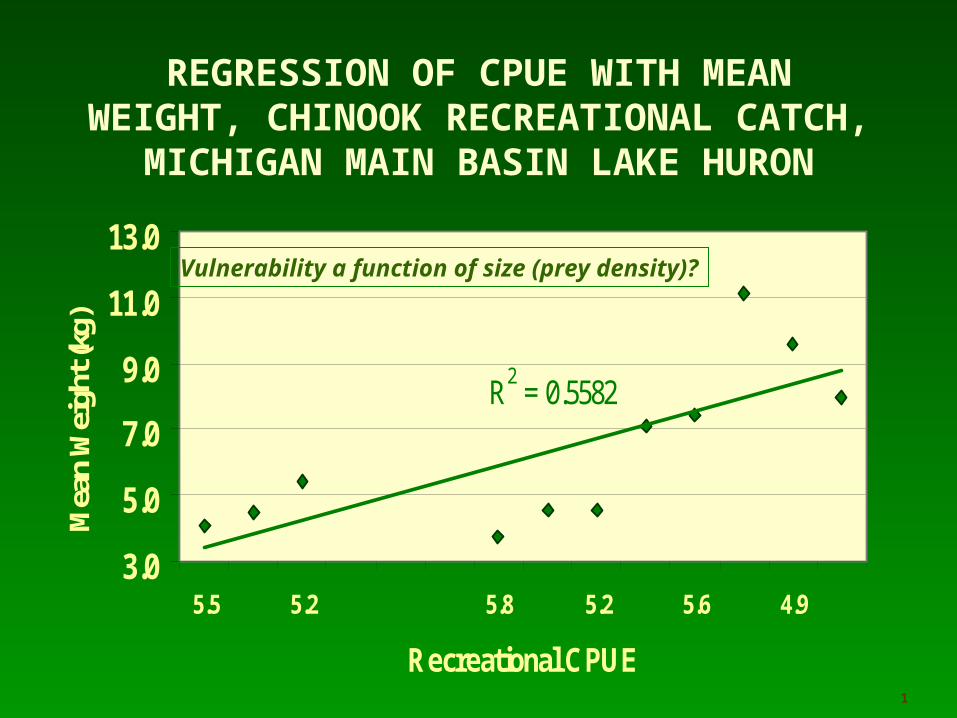
REGRESSION OF CPUE WITH MEAN WEIGHT, CHINOOK RECREATIONAL
CATCH, MICHIGAN MAIN BASIN LAKE HURON
1
R2 = 0.5582
3.0
5.0
7.0
9.0
11.0
13.0
5.5 5.2 5.8 5.2 5.6 4.9
Recreational CPUE
Mea
n W
eigh
t (kg
)
Vulnerability a function of size (prey density)?
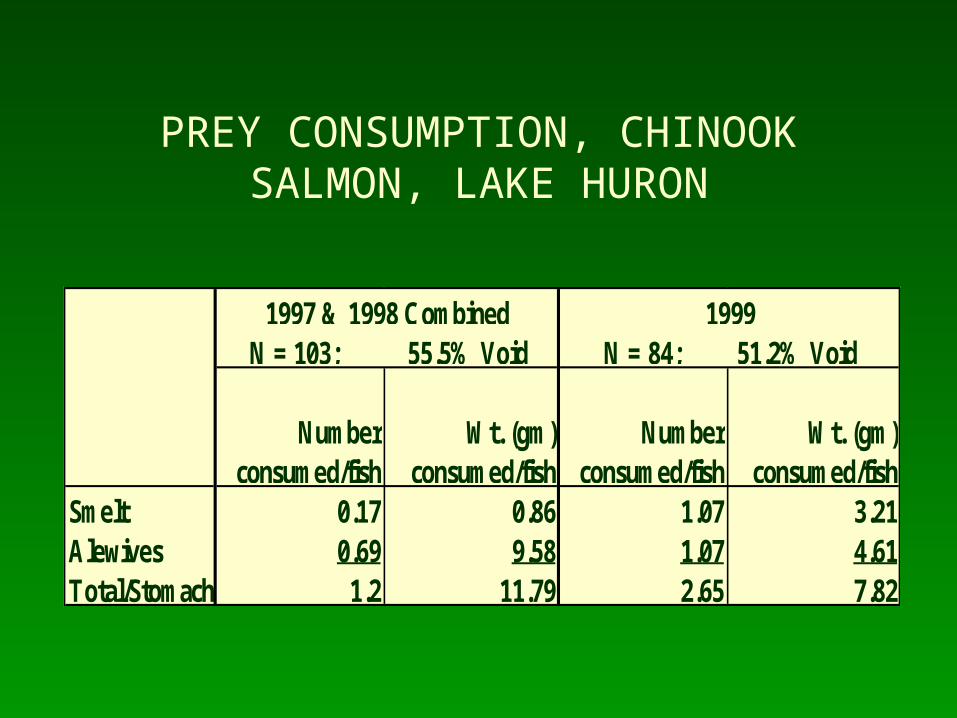
Number consumed/fish
Wt. (gm) consumed/fish
Number consumed/fish
Wt. (gm) consumed/fish
Smelt 0.17 0.86 1.07 3.21Alewives 0.69 9.58 1.07 4.61Total/Stomach 1.2 11.79 2.65 7.82
N = 103; 55.5% Void N = 84; 51.2% Void1997 & 1998 Combined 1999
PREY CONSUMPTION, CHINOOK SALMON, LAKE HURON
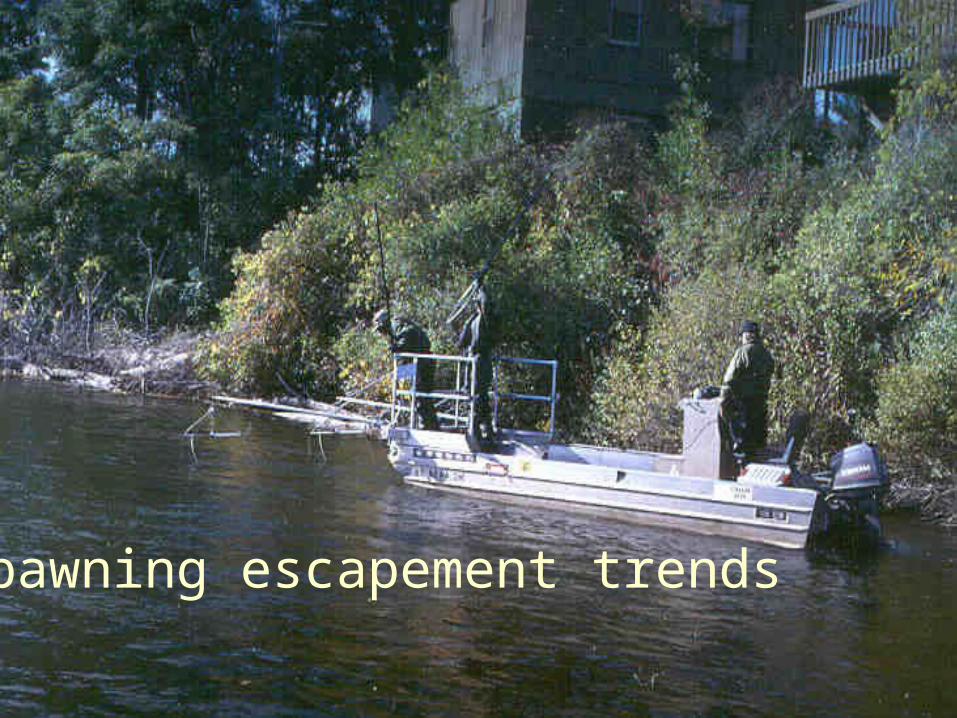
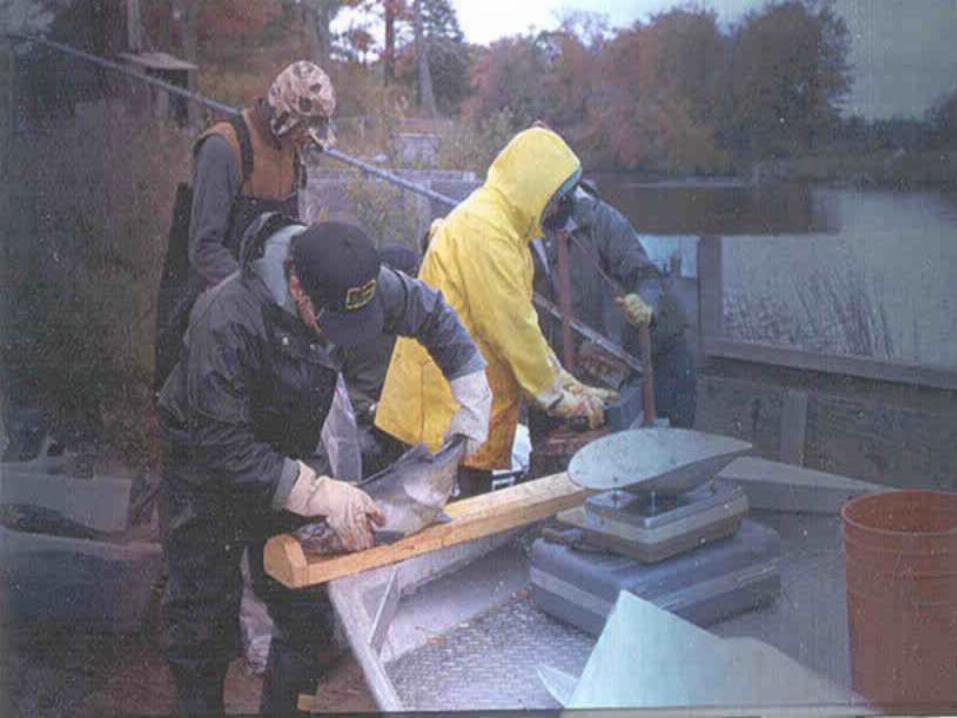
Spawning escapement trends
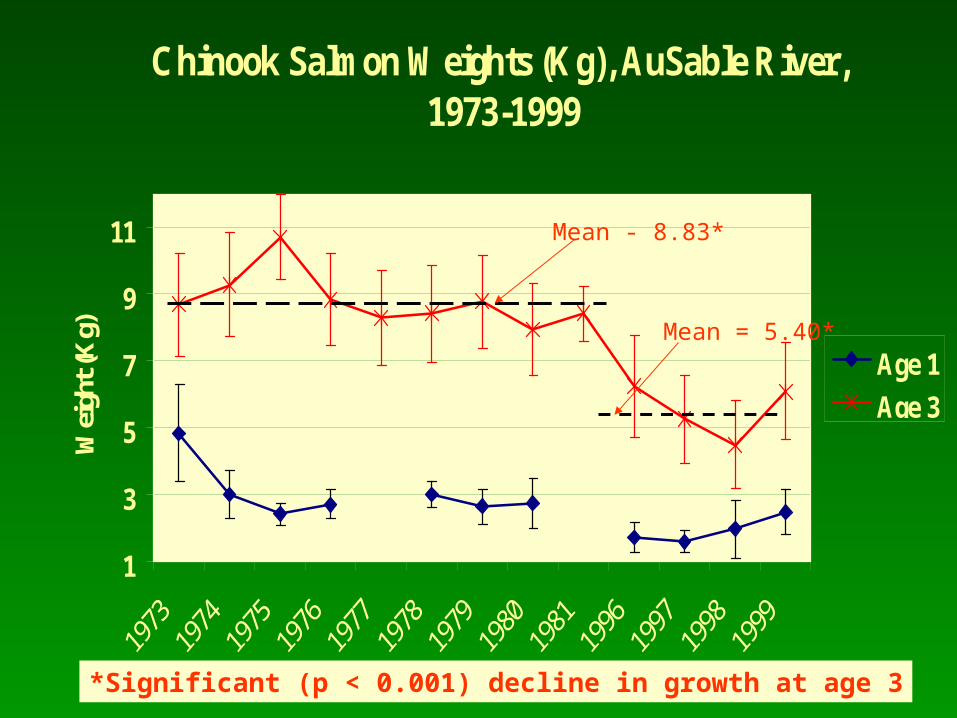
Chinook Salmon Weights (Kg), AuSable River, 1973-1999
1
3
5
7
9
11
Wei
ght (
Kg)
Age 1
Age 3
Mean - 8.83*
Mean = 5.40*
*Significant (p < 0.001) decline in growth at age 3
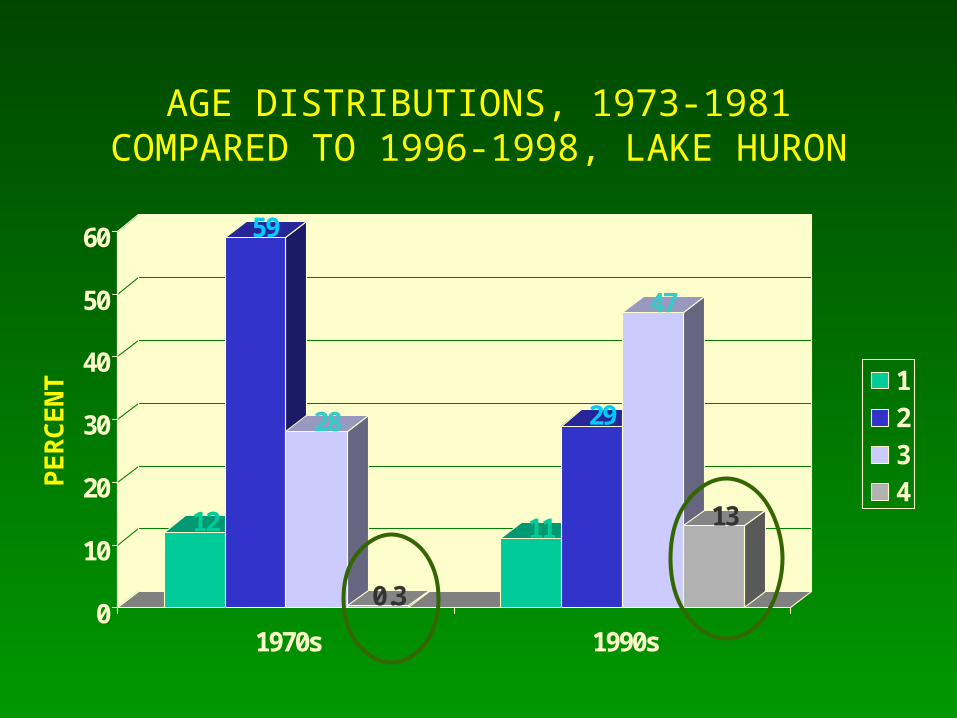
AGE DISTRIBUTIONS, 1973-1981 COMPARED TO 1996-1998, LAKE HURON
12
59
28
0.3
11
29
47
13
0
10
20
30
40
50
60
1970s 1990s
1234P
ER
CE
NT
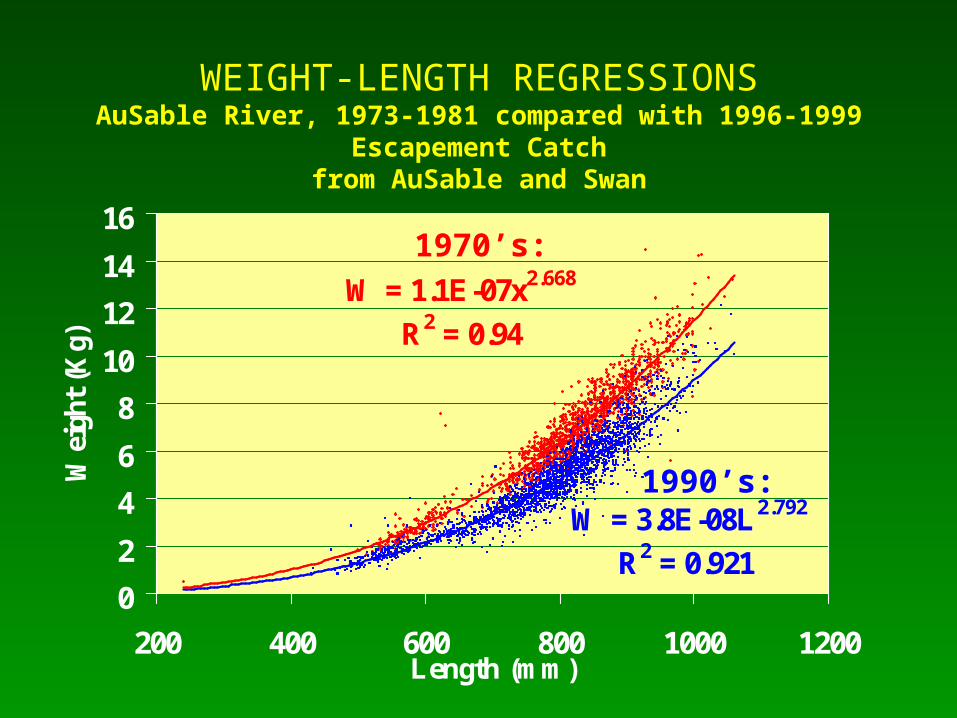
W = 3.8E-08L2.792
R2 = 0.921
W = 1.1E-07x2.668
R2 = 0.94
0
2
4
6
8
10
12
14
16
200 400 600 800 1000 1200Length (mm)
Wei
ght
(Kg)
WEIGHT-LENGTH REGRESSIONSAuSable River, 1973-1981 compared with 1996-1999 Escapement Catch
from AuSable and Swan
1970’s:
1990’s:
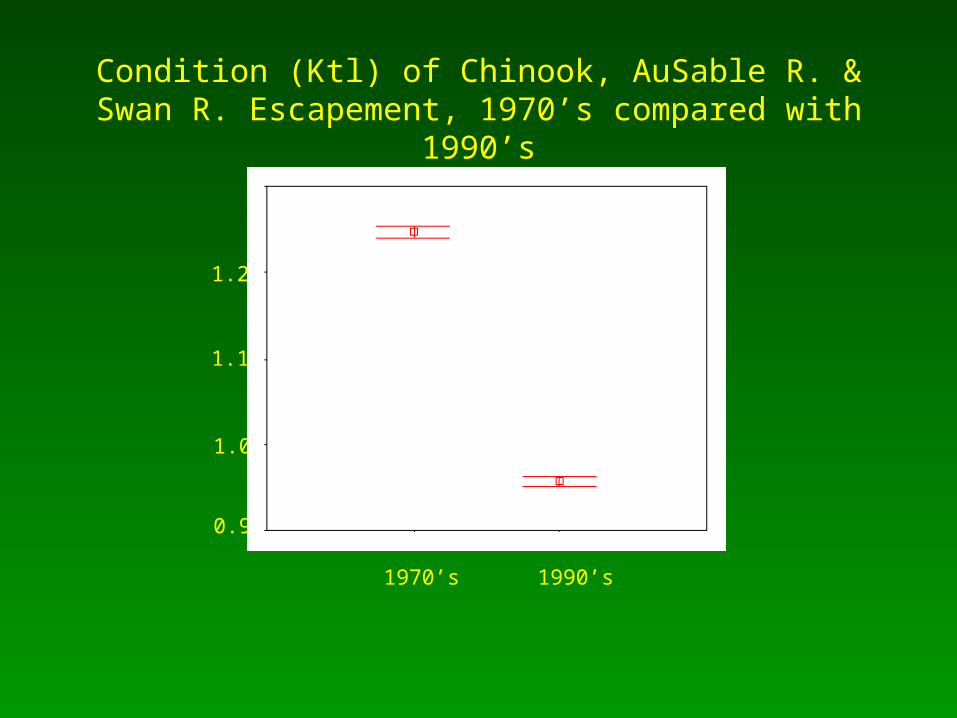
Condition (Ktl) of Chinook, AuSable R. & Swan R. Escapement, 1970’s compared with 1990’s
1970’s 1990’s
0.9
1.0
1.1
1.2
0
2
4
6
8
10
12
Kg
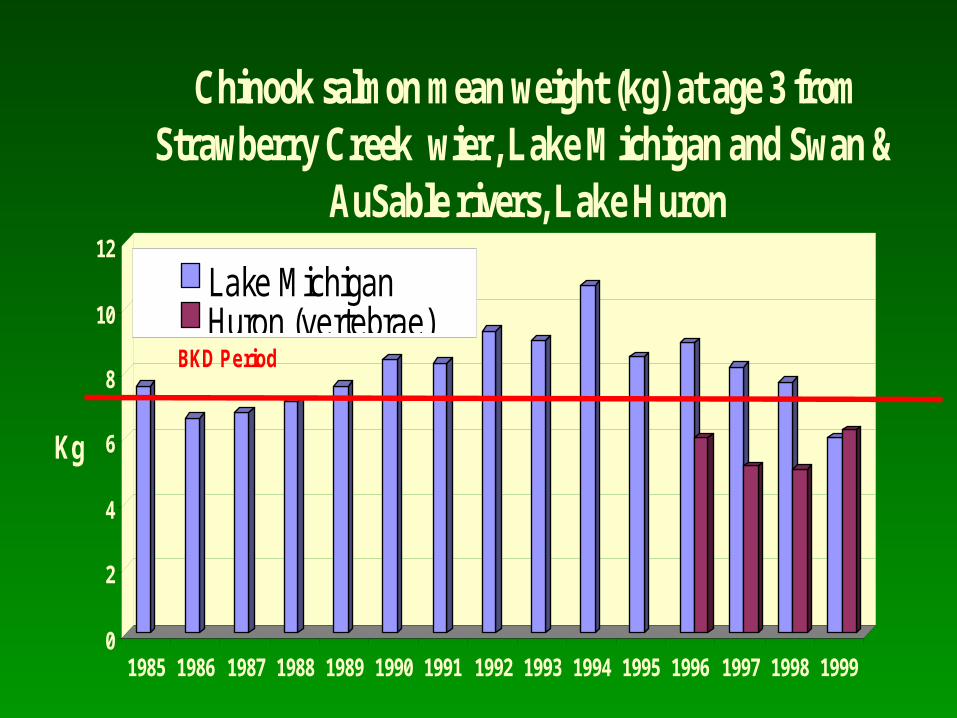
1985 1986 1987 1988 1989 1990 1991 1992 1993 1994 1995 1996 1997 1998 1999
Chinook salmon mean weight (kg) at age 3 from Strawberry Creek wier, Lake Michigan and Swan &
AuSable rivers, Lake Huron
Lake MichiganHuron (vertebrae)
BKD Period
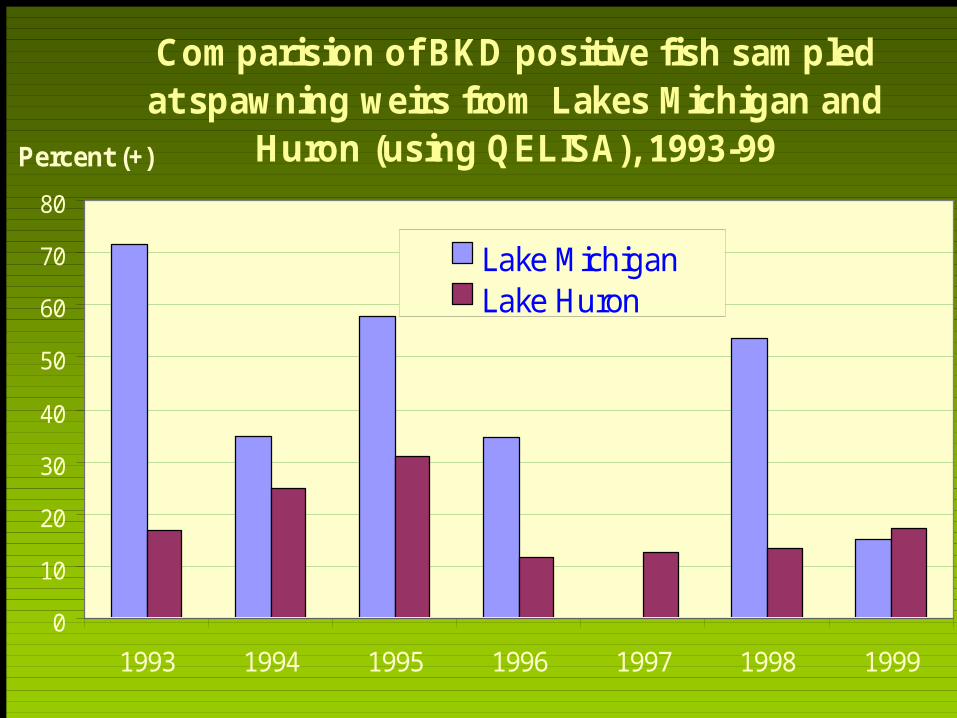
Comparision of BKD positive fish sampled at spawning weirs from Lakes Michigan and
Huron (using QELISA), 1993-99
0
10
20
30
40
50
60
70
80
1993 1994 1995 1996 1997 1998 1999
Percent (+)
Lake MichiganLake Huron
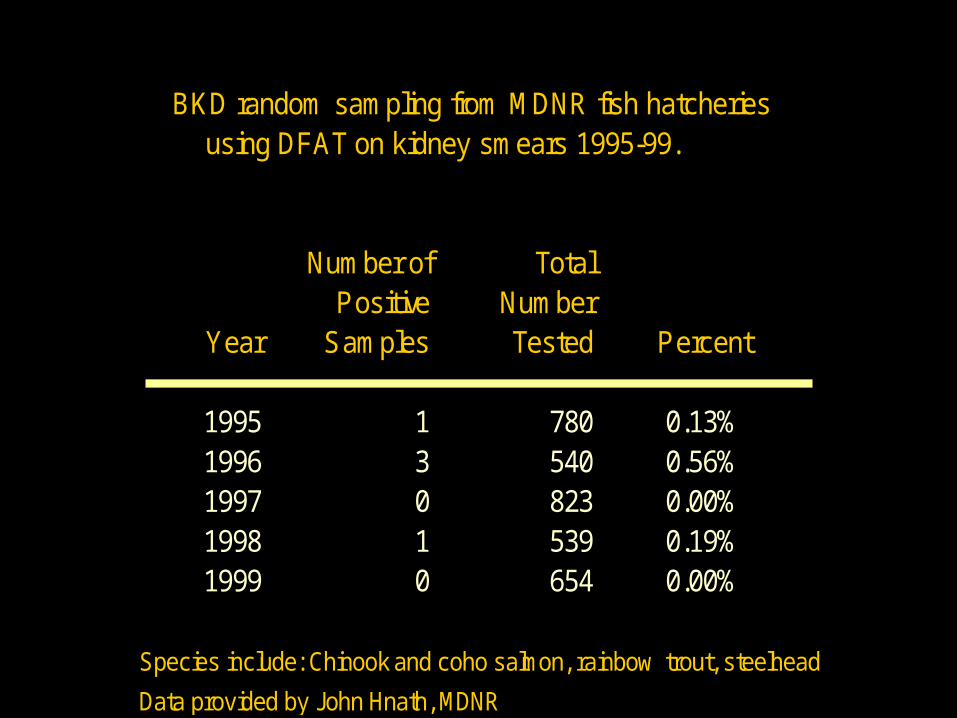
BKD random sampling from MDNR fish hatcheries using DFAT on kidney smears 1995-99.
Number of TotalPositive Number
Year Samples Tested Percent
1995 1 780 0.13%1996 3 540 0.56%1997 0 823 0.00%1998 1 539 0.19%1999 0 654 0.00%
Species include: Chinook and coho salmon, rainbow trout, steelhead
Data provided by John Hnath, MDNR
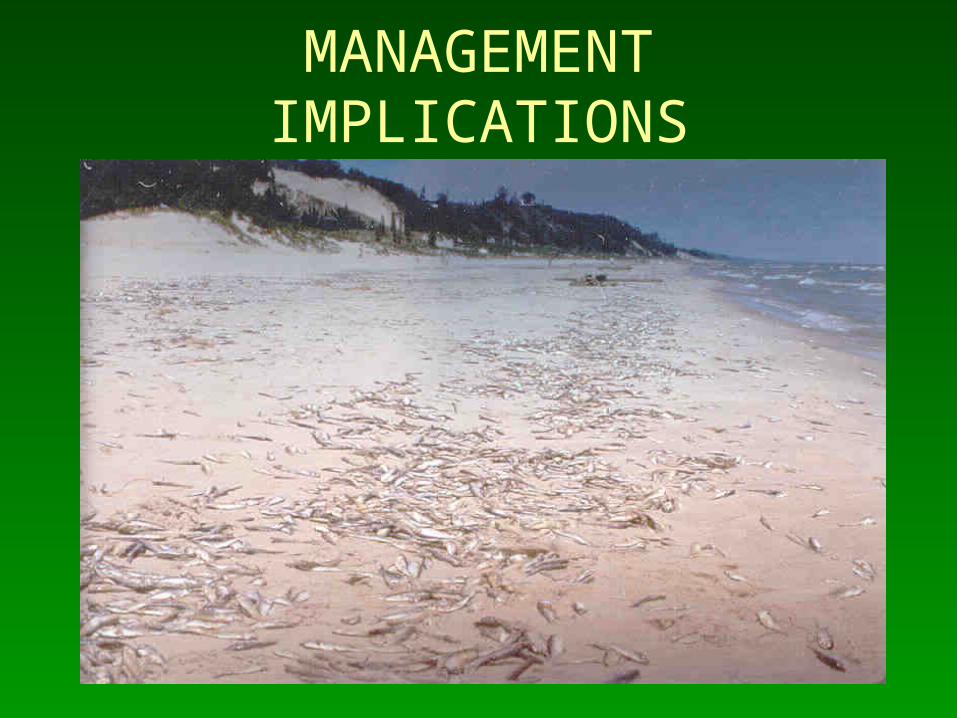
MANAGEMENT IMPLICATIONS
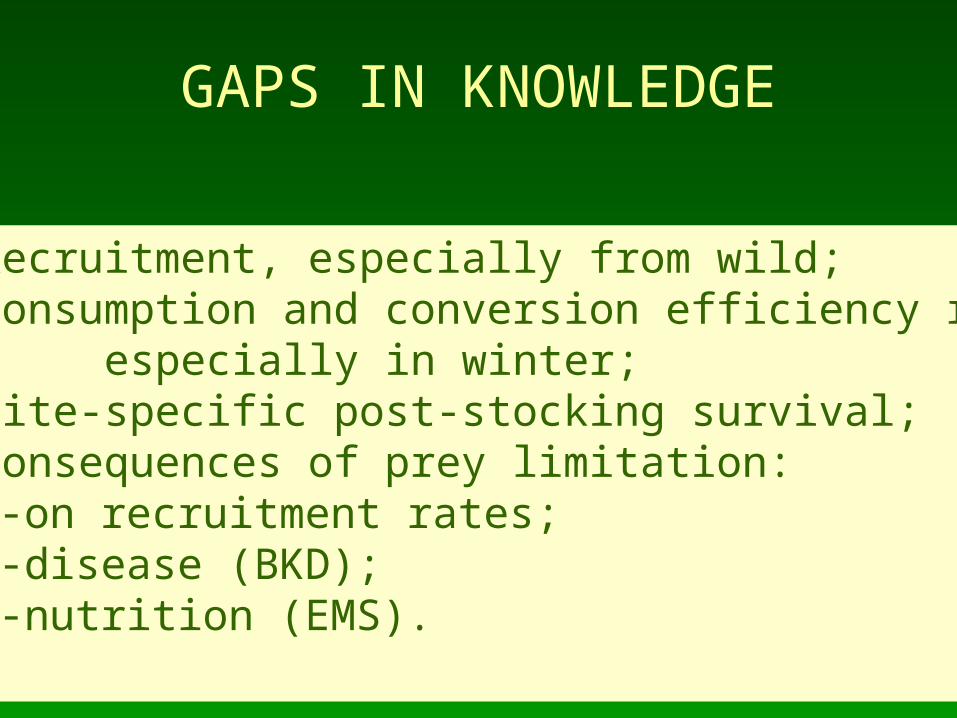
GAPS IN KNOWLEDGE
•Recruitment, especially from wild;•Consumption and conversion efficiency rates; especially in winter;•Site-specific post-stocking survival;•Consequences of prey limitation:
-on recruitment rates;-disease (BKD);-nutrition (EMS).
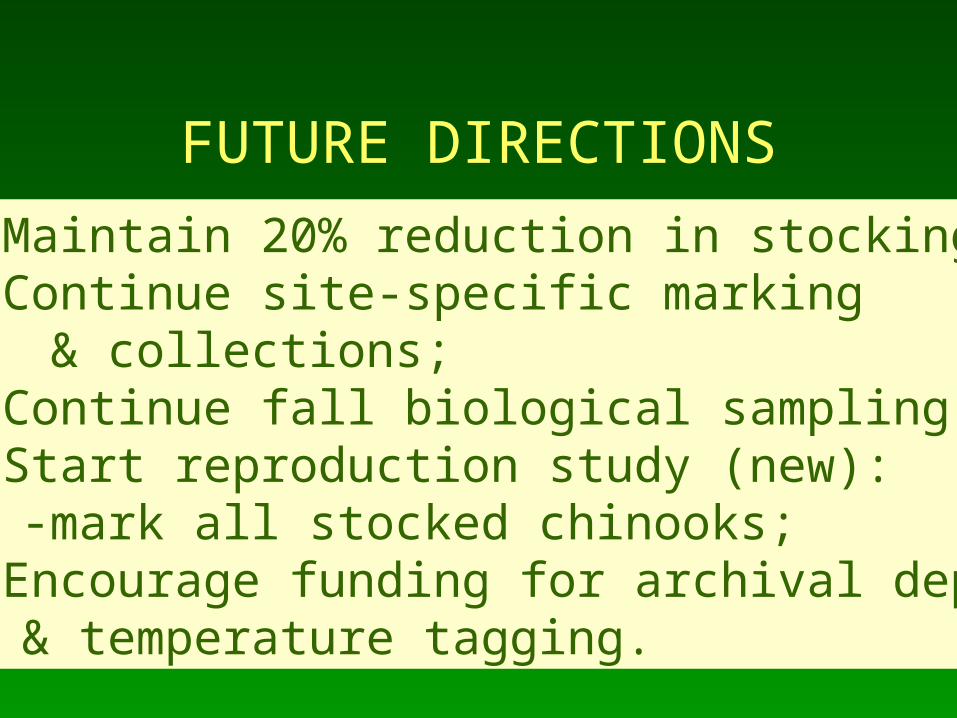
FUTURE DIRECTIONS
•Maintain 20% reduction in stocking;•Continue site-specific marking
& collections;•Continue fall biological sampling; •Start reproduction study (new):
-mark all stocked chinooks;•Encourage funding for archival depth
& temperature tagging.
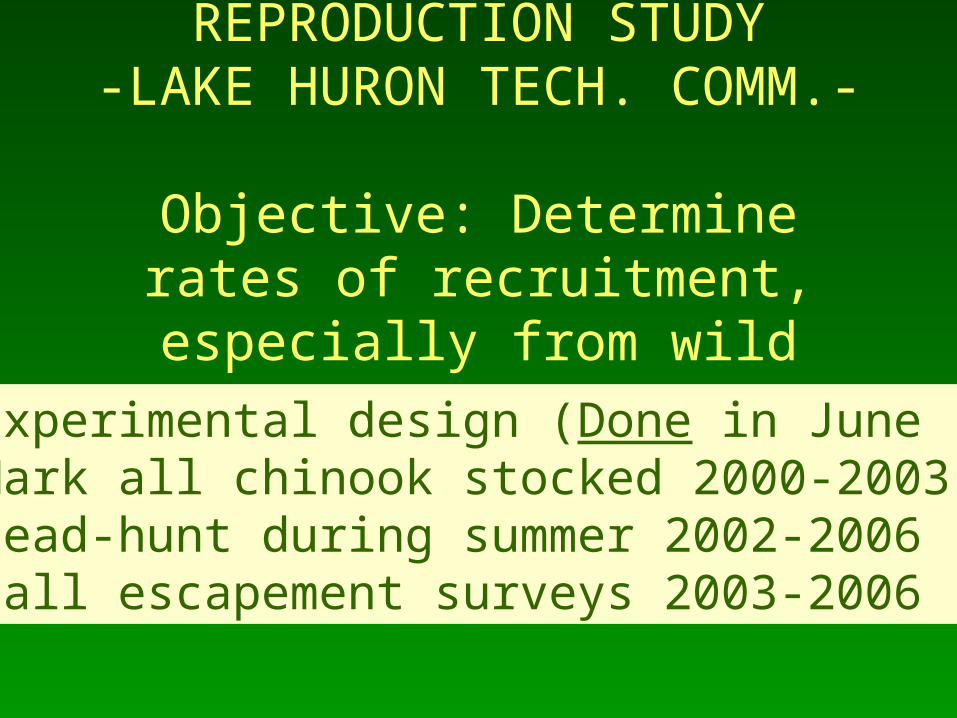
REPRODUCTION STUDY-LAKE HURON TECH. COMM.-
Objective: Determine rates of recruitment, especially from wild
•Experimental design (Done in June ‘00)•Mark all chinook stocked 2000-2003•Head-hunt during summer 2002-2006 •Fall escapement surveys 2003-2006
Related Documents