State Market Report Market Commentary www.residex.com.au Northern Territory March 2017 SAMPLE REPORT

Welcome message from author
This document is posted to help you gain knowledge. Please leave a comment to let me know what you think about it! Share it to your friends and learn new things together.
Transcript

State Market Report
Market Commentary
www.residex.com.au
Northern Territory
March 2017
SAMPLE REPORT

Welcome
Welcome to the Residex State Market Report for Northern
Territory.
This quarter we are proud to release a new format for the
State Market Reports which delivers refreshed data in new,
easier-to-understand formats.
It had been many years since the Residex reports had
undergone any changes, but during that time property
markets have altered considerably and new analytics and
methods for measuring the market have arisen providing
increasingly useful insights. These new reports have been
created from the combined might of the Residex and
CoreLogic databases and include insights to the end of
January 2017.
To this end, the data relects the diversity in housing market
conditions that Australia is currently experiencing and the
polarity in capital gain conditions is stark.
While Melbourne and Sydney median house values rose
at around 10% per annum, Perth and Darwin median
values continue to trend lower. Outside of these cities,
the remaining four capitals are generally recording more
sustainable growth conditions. More recently, Sydney and
Melbourne have been showing a rebound in the pace of
capital gain, with the annual rate of growth once again
trending higher after moderating during late 2015 and the
irst half of 2016.
An in-depth national economic overview is included in these reports, including new data on auction markets, heat maps
of median values and simple summaries of key performance
indicators in new graphical formats.
These new-look reports provide an even more
comprehensive overview of the property markets across
each state, context for the national market, together with
the statistics and igures that Residex followers know and rely upon.
We’d love your feedback. Please email marketing@
corelogic.com.au with any comments that you may have.
Tim Lawless
Research Director, Asia Pacific
Residex State Market Report - Northern Territory March 2017 | i
How to use this report iii
National Housing Market Update 1
Housing Supply 3
Demographic Overview 5
Housing Finance 8
National Accounts 10
Inflation 11
Consumer Sentiment 12
Auction Summary 13
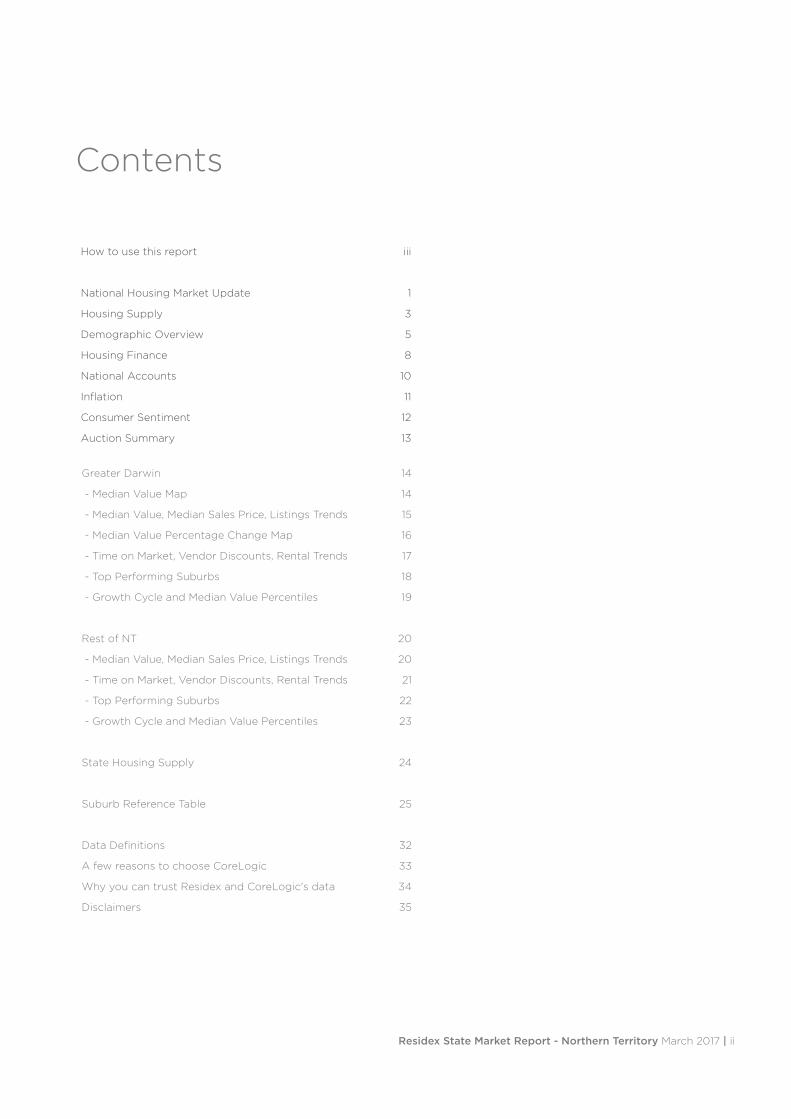
Contents
Residex State Market Report - Northern Territory March 2017 | ii
Greater Darwin
- Median Value Map
- Median Value, Median Sales Price, Listings Trends
- Median Value Percentage Change Map
- Time on Market, Vendor Discounts, Rental Trends
- Top Performing Suburbs
- Growth Cycle and Median Value Percentiles
Rest of NT
- Median Value, Median Sales Price, Listings Trends
- Time on Market, Vendor Discounts, Rental Trends
- Top Performing Suburbs
- Growth Cycle and Median Value Percentiles
State Housing Supply
Suburb Reference Table
Data Definitions
A few reasons to choose CoreLogic
Why you can trust Residex and CoreLogic's data
Disclaimers
14
14
15
16
17
18
19
20
20
21
22
23
24
25
32
33
34
35
How to use this reportData – and why you should always use common sense when interpreting statistics
Data on its own rarely tells the whole story. For example,
during World War One, the cloth caps worn by soldiers
were eventually replaced with metal helmets. However, the
statistics of the time showed that head injuries increased
after this change. A naïve interpretation of the data might
have assumed that helmets cause head injuries.
However, the true reason that head injuries increased after
the introduction of helmets is because before the helmets
were introduced, people who got hit in the head generally
died. After the helmets came along, there were fewer
deaths but more head injuries.
The moral of this story is this: if data is misinterpreted,
horribly wrong conclusions can be drawn. This section of
the report shows you how to draw the right conclusions
from the data.
Often, it is the questions that pop up from having access to
data which is where the real insights reveal themselves and
it is always important to apply common sense to statistical
results.
Sections you’ll find in this report
Below we outline the sections within this report and how
to use the information to make more conident property
decisions. More detailed, oicial data deinitions can be
found in the Data Deinitions chapter of the report.
Economic overview: Understanding how the Australian
economy is performing is essential to understanding the
health of the property market and elements that are likely
to inluence its future performance. Employment, interest
rates, inlation and relationship between housing supply and
demand all inluence the performance of the housing market.
Growth cycle data: Understanding where the market is
within the growth cycle can be helpful in understanding
whether short term future property prices are likely to go
up, hold steady or start to ease.
Housing supply data: Understanding how many new
properties are planned, being built or completing
construction provides a valuable insight into understanding
future supply levels and therefore which direction values
may move. This is particularly useful if you are considering
investing of the plan as it allows you to see how much
other stock is likely to be launched at the time you are due
to settle as this may afect the inal value of your property
or the competition it will face being rented.
Auction clearance rates: Auction markets are most active
in Sydney, Melbourne and Canberra, as well as parts
of Queensland. Auction trends are a useful barometer
of market performance and conidence. High auction
clearance rates signal strong demand and are usually an
indicator of good price performance, while lower clearance
rates signal that market conditions are easing.
Median value data: Median values are based of an automated
valuation methodology (AVM) which estimates the market
value of every property within the suburb and is therefore
based upon more data points than median prices and
regarded as a less volatile indicator. When median values
rise, it is a signal that prices overall are performing strongly.
Median sale price data: Median sale prices are based on
the middle price of all properties sold within the identiied
geography. These may or may not be representative of the
housing stock as a whole within an area. As an example,
if the majority of sales in a suburb occur at the more
expensive end of the market (such as the launch of a luxury
apartment release) the median price may appear to rise
considerably but this may not relect what is occurring with
property stock at other levels of the market. As an indicator,
it is wise to look deeper at the types of sales occurring
within a suburb that have helped make up that median
price so that you can understand the features and styles of
properties that are selling around this median price level.
Listings data: Listings data is a great indicator of how much
housing stock is available for sale in the market. When
listing volumes are high, it may imply that sellers have
conidence in the market or it could indicate that homes are
selling very slowly and stock levels are rising due to a low
level of absorption. Lower listing volumes can signal that
vendors are not as conident or that stock is selling faster
than it is being added to the market. High listing volumes
can be an indicator that buyers may have many options and
therefore be able to negotiate a better price. Low listing
volumes indicate less choice for buyers.
Time on market data: The time it takes to sell a property by
private treaty is identiied by the Time on Market data. This
is a useful indicator of conidence, especially when viewed
together with the Auction Clearance Rate. A low time on
market igure suggests properties are selling rapidly and it’s
a seller’s market. A high time on market igure indicates that
stock is selling slowly and sellers may need to discount their
price expectations in order to sell their property.
Average vendor discounting data: This data is based on
private treaty sales and indicates by how much vendors are
negotiating down on their initial listed sales price. Note that
it does not include sales that were higher than the listed
sales price. Low discounting rates indicate vendors are
empowered and they don’t have to be very lexible when
negotiating on price.
Median rent data: This is the middle observed advertised
price that is being asked for rent within the suburb and
property category. Like all medians, it relects the ‘middle’
asking rent based on stock that has been advertised for
rent. As such it is sensible to conirm the market rent for
individual properties based on their features, location and
attributes etc via local property managers or comparable
rental listings.
Median gross rental yields: This is based on the median
sales price divided by the median rent data to identify a
yield and is presented as a guide only. If you already own
a rental property or are considering buying a speciic
property, you should always calculate a net yield based on
the property’s purchase price, rental income and expected
holding costs.
Best performers: Our best performer tables are ranked
according to strongest median value growth over the
period. Please note past performance is not a guarantee of
future performance.
Residex State Market Report - Northern Territory March 2017 | iii

Making confident property decisions
While statistics and reports are useful to help you identify areas to buy in, or
understand the factors afecting your market, one of the most important factors is
always to ensure that you pay the right amount for the property in the irst place.
Every dollar too much you pay for the property impacts on your future growth
rate. Conversely, if you can ind a bargain that will improve your overall capital
gain when you eventually sell.
If you pay the right price for a property and it’s in a suburb with good statistical
factors at work and its non-statistical factors encourage growth also, then your
chances of achieving excellent capital growth in your investment are as high as
they’re ever likely to be.
We strongly recommend that in whatever area you decide to consider when
purchasing, and particularly where you are selecting a regional area, that you do
your homework. You should consider such things as:
� Financial Trends: are interest rates likely to rise or fall, and if they rise, will this
slow the growth rate of your selected area and will your level of proposed debt
be serviceable into the future?
� The Economy: what is driving the local economy? Are there new primary (eg
mining, agriculture), secondary (eg industrial, construction) or tertiary (eg
education, tourism) projects underway or in the pipeline? Areas without a
diverse mix of economic drivers can have a higher risk profile.
� The Population: what is the population composition and growth rate, local
employment prospects and what are the implications for the housing market?
� The Housing Market: go to a real estate portal and establish for yourself the
current number of listings, sales, rental vacancies and your price estimate for
any listed property in your chosen suburb or town.
� Your Own Personal Circumstances: including your ability to service the
mortgage (even if the interest rate rises or the property is vacant) and visit the
property from time to time – especially to find an agent you trust to manage it.
For many places, you will need to wait and maintain vigilance for purchase
opportunities. Given the increasing scarcity of well-located quality yielding
properties, it will be the vigilant and considered investor who succeeds.
Talk to the local council. They will be able to tell you the name of the local paper.
They also may have a local publication that will help you understand the potential
or lack of it in the area. Talk to local real estate agents, and register on websites
to receive free and automatic email notiication as soon as properties in your
selected areas and price range come on the market.
To assist your investment decision, you can also purchase our Comparative Market
Analysis Report from www.residex.com.au, which will provide you with an indexed
sale price for the property plus other local sales information. Negotiate hard. Do
whatever you need to do to ensure you pay fair market value for the property.
Taking a long term view
Once you’ve chosen a good suburb and found a good property and paid the right
price for it, then comes what, for many people is the most diicult part - waiting
for their investment to realise.
The most important thing to remember during this stage is not to panic. The
housing market does not grow at a steady rate. Instead, housing markets typically
move in cycles, with periods of growth, periods of falling prices and times when values remain steady. The igures provided are the average growth rates that we
expect the suburbs to achieve. Some years the market will grow by more than the
average rate. Some years, it will grow by less. The key here is to hold the property
long enough for the year-by-year luctuations to be overtaken by the average
growth, as predicted.
Property is a long term investment. Do not panic about short-term factors.
Do your research and stick to your strategy.
Residex State Market Report - Northern Territory March 2017 | iv

National Housing Market Update
The table below presents a summary of housing market conditions across the capital cities and combined regional areas of each state and territory. Across Australia, there is a great deal of diversity in housing market conditions. Cities with strong economic conditions are benefitting from high migration rates which fuels housing demand and drives dwelling prices higher, other cities are seeing the opposite, with weak economic conditions and negative migration rates resulting in a negative trend in the housing market.
The polarity in capital gain conditions is stark; while Melbourne and Sydney house values rise at around 10% per annum, Perth and Darwin house values continue to trend lower. Outside of these cities, the remaining four capitals are generally recording more sustainable growth conditions. More recently, Sydney and Melbourne have been showing a rebound in the pace of capital gain, with the annual rate of growth once again trending higher after moderating during late 2015 and the first half of 2016.
TABLE 1: SUMMARY OF HOUSING MARKET CONDITIONS AS AT JANUARY 2017
AreaMedian value
Change in median value over timeMedian asking
rent
12 month change in median asking
rent
Gross rental yield
12 month change
3 year change
5 year change
Australian Capital Territory
Greater Sydney
Rest of NSW
Greater Darwin
Rest of NT
Greater Brisbane
Rest of Qld
Greater Adelaide
Rest of SA
Greater Hobart
Rest of Tas.
Greater Melbourne
Rest of Vic.
Greater Perth
Rest of WA
Greater Sydney
Rest of NSW
Greater Darwin
Rest of NT
Greater Brisbane
Rest of Qld
Greater Adelaide
Rest of SA
Greater Hobart
Rest of Tas.
Greater Melbourne
Rest of Vic.
Greater Perth
Rest of WA
Residex State Market Report - Northern Territory March 2017 | 1
Australian Capital Territory
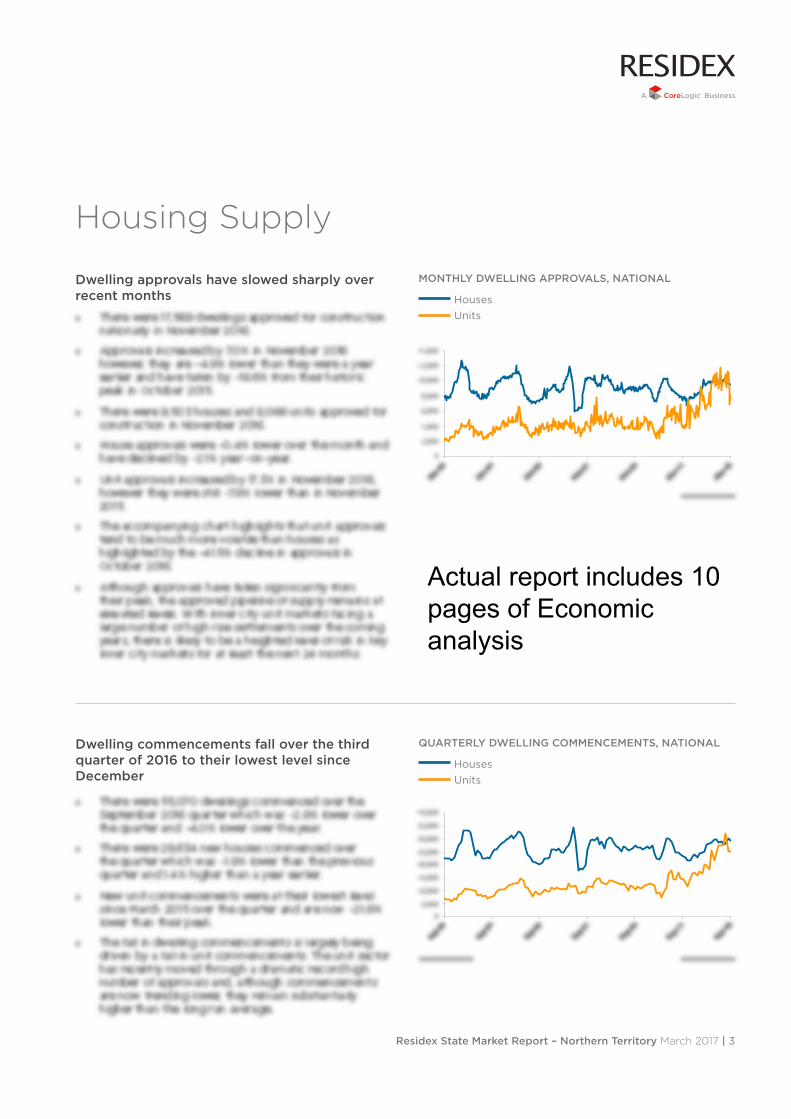
Housing Supply
Dwelling approvals have slowed sharply over recent months
Dwelling commencements fall over the third quarter of 2016 to their lowest level since December
QUARTERLY DWELLING COMMENCEMENTS, NATIONAL
Houses Units
MONTHLY DWELLING APPROVALS, NATIONAL
Houses Units
Residex State Market Report – Northern Territory March 2017 | 3
Actual report includes 10 pages of Economic analysis
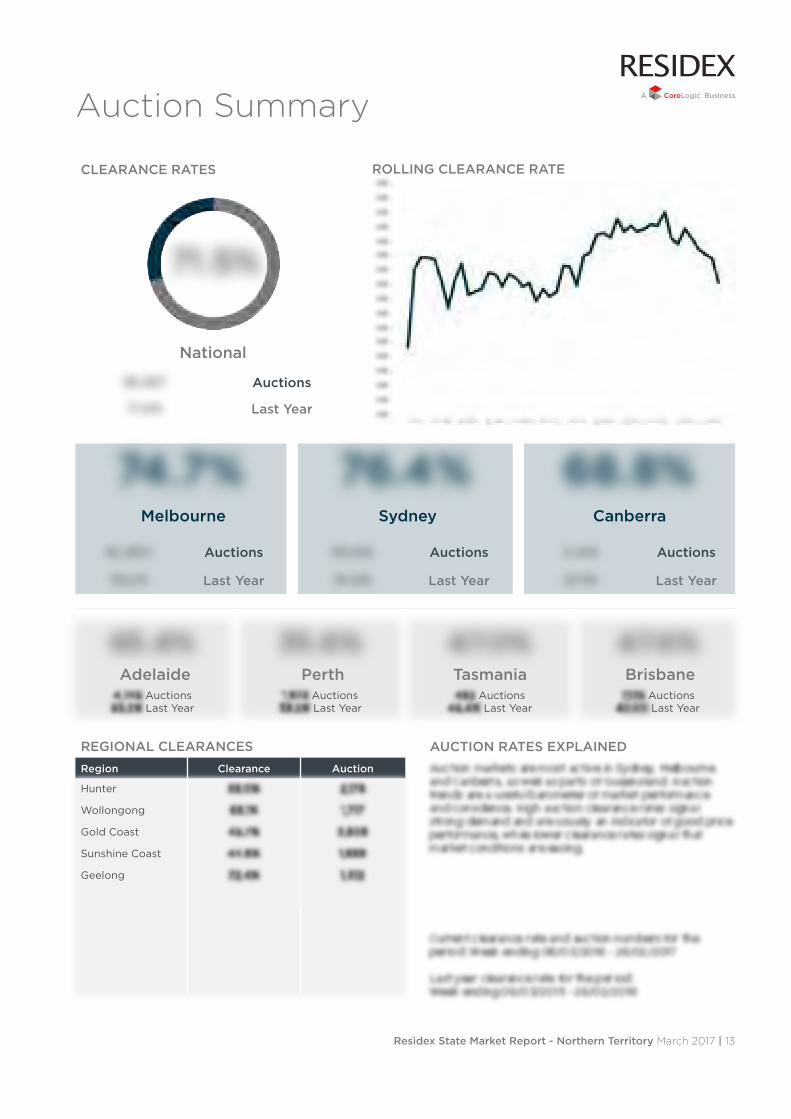
Auction Summary
CLEARANCE RATES
National
Auctions
Last Year
Melbourne Sydney Canberra
Auctions Auctions Auctions
Last Year Last Year Last Year
Adelaide Perth Tasmania Brisbane
REGIONAL CLEARANCES
Region Clearance Auction
ROLLING CLEARANCE RATE
AUCTION RATES EXPLAINED
Residex State Market Report - Northern Territory March 2017 | 13
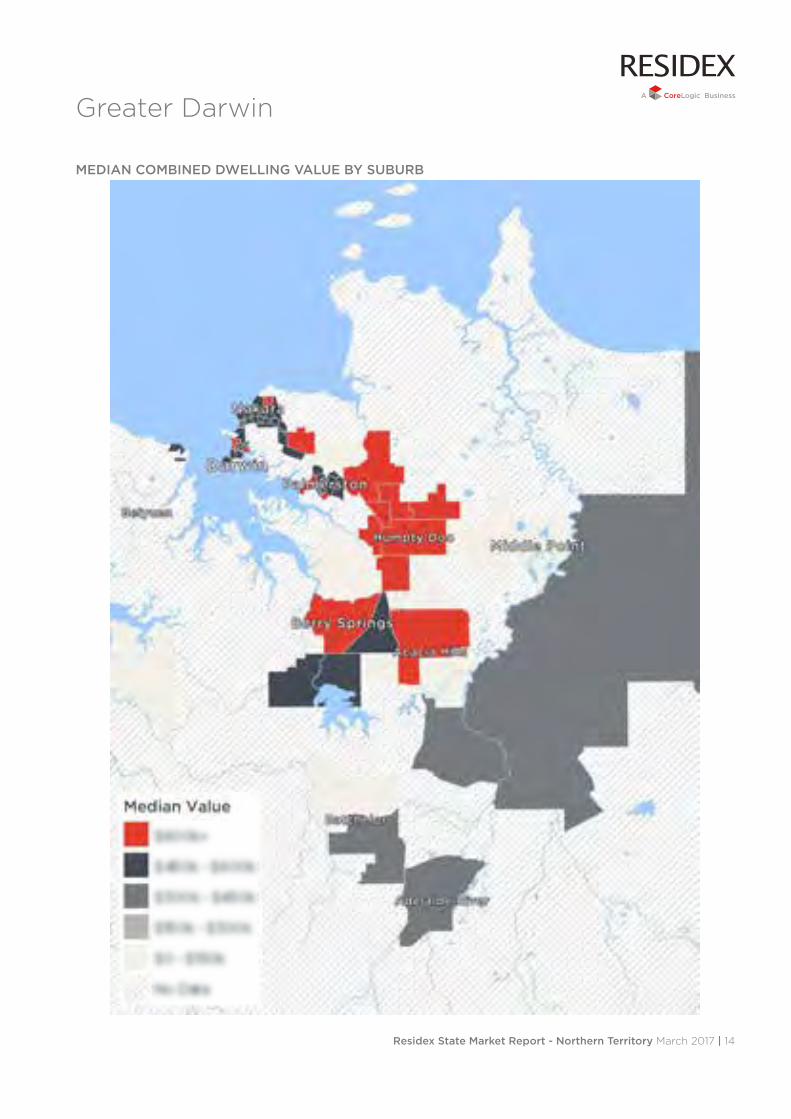
MEDIAN COMBINED DWELLING VALUE BY SUBURB
Greater Darwin
Residex State Market Report - Northern Territory March 2017 | 14

Median Value% Change(12 months)
Houses (last 12 months)
Houses (prior 12 months)
Units (last 12 months)
Units (prior 12 months)
Median Sales Price% Change(12 months)
Houses (last 12 months)
Houses (prior 12 months)
Units (last 12 months)
Units (prior 12 months)
Listings% Change(12 months)
Total Listings
Houses (last 12 months)
Units (last 12 months)
New Listings
Houses (last 12 months)
Units (last 12 months)
Residex State Market Report - Northern Territory March 2017 | 15
MARKET COMMENTARY
Greater Darwin
Houses Units
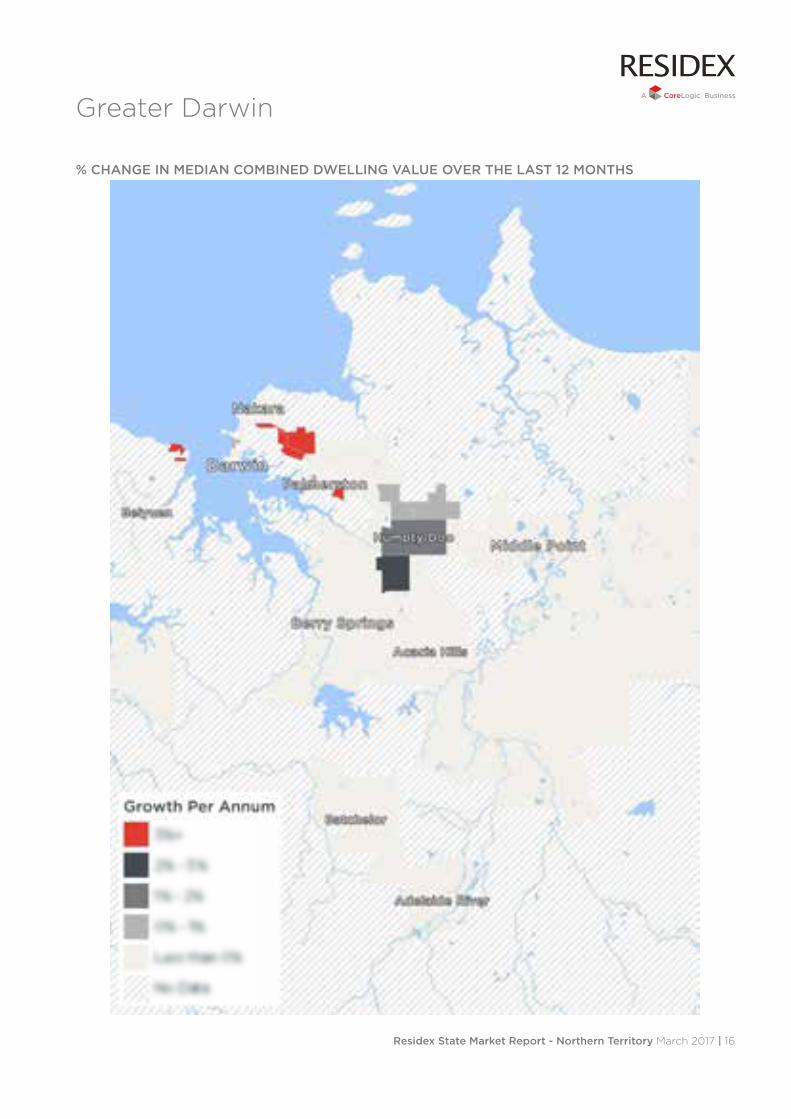
% CHANGE IN MEDIAN COMBINED DWELLING VALUE OVER THE LAST 12 MONTHS
Residex State Market Report - Northern Territory March 2017 | 16
Greater Darwin

Average Days on MarketChange
(12 months)
Houses (last 12 months)
Houses (prior 12 months)
Units (last 12 months)
Units (prior 12 months)
Average Vendor DiscountingChange
(12 months)
Houses (last 12 months)
Houses (prior 12 months)
Units (last 12 months)
Units (prior 12 months)
Median Asking Rents% Change(12 months)
Houses (last 12 months)
Houses (prior 12 months)
Units (last 12 months)
Units (prior 12 months)
Median Gross Rental YieldChange
(12 months)
Houses (last 12 months)
Houses (prior 12 months)
Units (last 12 months)
Units (prior 12 months)
Residex State Market Report - Northern Territory March 2017 | 17
Greater Darwin
Houses Units

SUBURB LGA# SOLD MEDIAN
VALUE
CAPITAL GROWTH
QTR Year 12 Months 3 Year 5 Year
BEST PERFORMERS BY 12 MONTH CAPITAL GROWTH
Residex State Market Report - Northern Territory March 2017 | 18
Greater Darwin
ZUCCOLI
JOHNSTON
HERBERT
FANNIE BAY
RAPID CREEK
MARLOW LAGOON
PARAP
HUMPTY DOO
GIRRAWEEN
MILLNER
BAYVIEW
MUIRHEAD
MOIL
FARRAR
STUART PARK
ALAWA
COCONUT GROVE
TIWI
BELLAMACK
NAKARA
DURACK
WANGURI
WAGAMAN
LUDMILLA
LYONS
WOODROFFE
MARRARA
GRAY
NIGHTCLIFF
ROSEBERY
Palmerston
Palmerston
Litchfield
Darwin
Darwin
Palmerston
Darwin
Litchfield
Litchfield
Darwin
Darwin
Darwin
Darwin
Palmerston
Darwin
Darwin
Darwin
Darwin
Palmerston
Darwin
Palmerston
Darwin
Darwin
Darwin
Darwin
Palmerston
Darwin
Palmerston
Darwin
Palmerston
BERRIMAH
LEANYER
KARAMA
COCONUT GROVE
NIGHTCLIFF
MILLNER
ZUCCOLI
JOHNSTON
DARWIN CITY
RAPID CREEK
Unincorporated NT
Darwin
Darwin
Darwin
Darwin
Darwin
Palmerston
Palmerston
Darwin
Darwin

GROWTH CYCLE
Quartile Values Now% Change(12 months)
(25th Percentile)
Mid(50th Percentile)
Prestige(75th Percentile)
Quartile Values Now% Change(12 months)
(25th Percentile)
Mid(50th Percentile)
Prestige(75th Percentile)
Houses (last 12 months)
Houses (prior 12 months)
Units (last 12 months)
Units (prior 12 months)
Residex State Market Report - Northern Territory March 2017 | 19
Greater Darwin
Houses Units
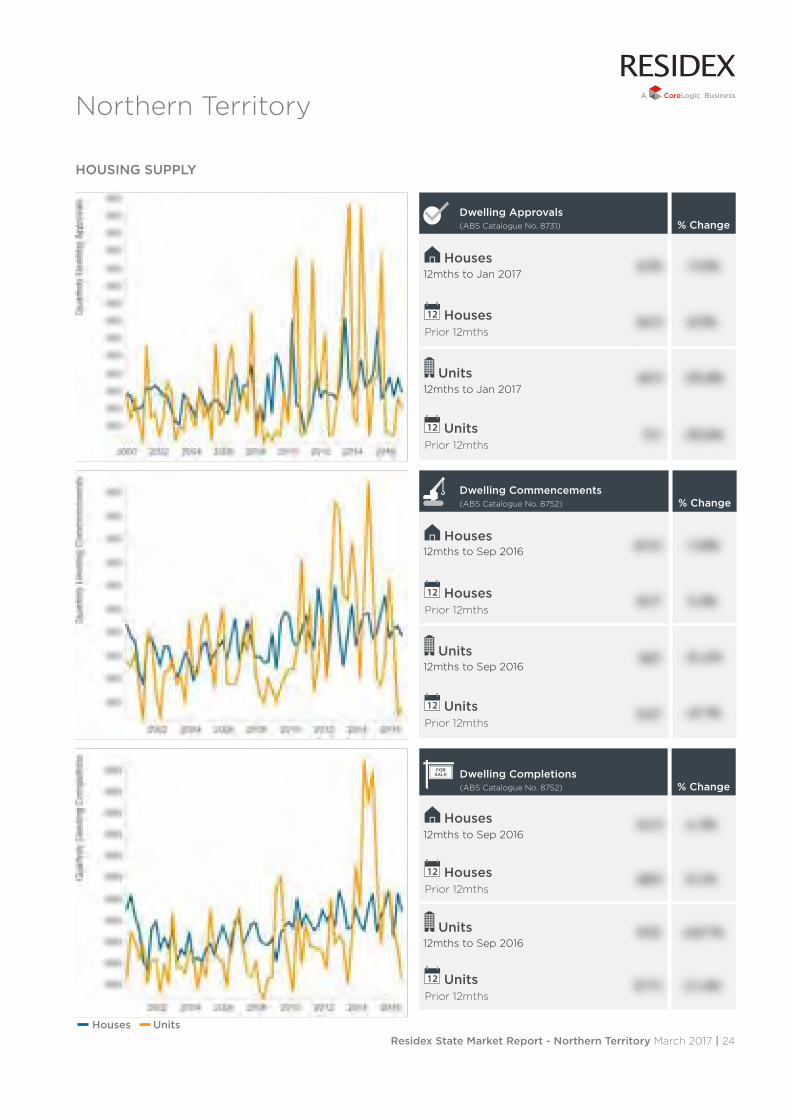
Dwelling Approvals (ABS Catalogue No. 8731) % Change
Houses
HousesPrior 12mths
Units
UnitsPrior 12mths
Dwelling Commencements (ABS Catalogue No. 8752) % Change
Houses
HousesPrior 12mths
Units
UnitsPrior 12mths
Dwelling Completions (ABS Catalogue No. 8752) % Change
Houses
HousesPrior 12mths
Units
UnitsPrior 12mths
HOUSING SUPPLY
Residex State Market Report - Northern Territory March 2017 | 24
Northern Territory
Houses Units
12mths to Jan 2017
12mths to Jan 2017
12mths to Sep 2016
12mths to Sep 2016
12mths to Sep 2016
12mths to Sep 2016

Suburb Postcode Dwelling Count
Sales, Last Median Value Median Rent Capital Growth (p.a.) Rental Yield (p.a.) Median Weekly Gross Household
Income(*2011 Census)Qtr Year 12 mths Last Year 12 mths Last Year 12 mths 5 Years 12 mths Last Year
Residex State Market Report - Northern Territory March 2017 | 25
ACACIA HILLS
ADELAIDE RIVER
ALAWA
ALICE SPRINGS
ANULA
ARALUEN
BAKEWELL
BATCHELOR
BAYVIEW
BEES CREEK
BELLAMACK
BERRIMAH
BERRY SPRINGS
BORROLOOLA
BRAITLING
BRINKIN
BYNOE
CICCONE
COCONUT GROVE
COSSACK
DARWIN CITY
DARWIN RIVER
DESERT SPRINGS
DRIVER
DUNDEE BEACH
DURACK
EAST SIDE
EDITH
EMUNGALAN
FANNIE BAY
FARRAR
FLY CREEK
GILLEN
GIRRAWEEN
0822
0846
0810
0870
0812
0870
0832
0845
0820
0822
0832
0828
0838
0854
0870
0810
0822
0870
0810
0850
0800
0841
0870
0830
0840
0830
0870
0852
0850
0820
0830
0822
0870
0836
NT Houses

Suburb Postcode Dwelling Count
Sales, Last Median Value Median Rent Capital Growth (p.a.) Rental Yield (p.a.) Median Weekly Gross Household
Income(*2011 Census)Qtr Year 12 mths Last Year 12 mths Last Year 12 mths 5 Years 12 mths Last Year
Residex State Market Report - Northern Territory March 2017 | 29
ALAWA
ALICE SPRINGS
ANULA
ARALUEN
BAKEWELL
BAYVIEW
BELLAMACK
BERRIMAH
BRAITLING
BRINKIN
CICCONE
COCONUT GROVE
DARWIN CITY
DESERT SPRINGS
DRIVER
DURACK
EAST SIDE
FANNIE BAY
FARRAR
GILLEN
GRAY
GUNN
HUMPTY DOO
JOHNSTON
KARAMA
KATHERINE
KATHERINE EAST
KATHERINE SOUTH
LARAPINTA
LARRAKEYAH
LEANYER
LUDMILLA
MALAK
MARRARA
0810
0870
0812
0870
0832
0820
0832
0828
0870
0810
0870
0810
0800
0870
0830
0830
0870
0820
0830
0870
0830
0832
0836
0832
0812
0850
0850
0850
0870
0820
0812
0820
0812
0812
NT Units
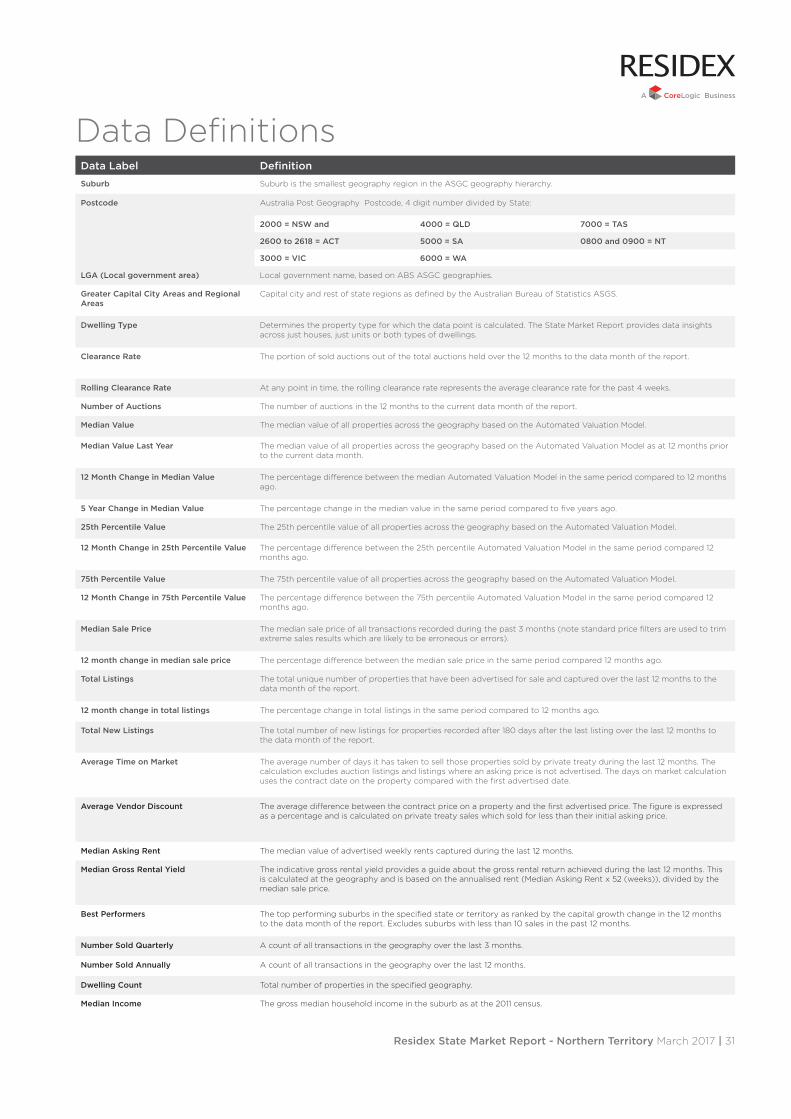
Data DeinitionsData Label Deinition
Suburb Suburb is the smallest geography region in the ASGC geography hierarchy.
Postcode Australia Post Geography Postcode, 4 digit number divided by State:
2000 = NSW and 4000 = QLD 7000 = TAS
2600 to 2618 = ACT 5000 = SA 0800 and 0900 = NT
3000 = VIC 6000 = WA
LGA (Local government area) Local government name, based on ABS ASGC geographies.
Greater Capital City Areas and Regional Areas
Capital city and rest of state regions as deined by the Australian Bureau of Statistics ASGS.
Dwelling Type Determines the property type for which the data point is calculated. The State Market Report provides data insights across just houses, just units or both types of dwellings.
Clearance Rate The portion of sold auctions out of the total auctions held over the 12 months to the data month of the report.
Rolling Clearance Rate At any point in time, the rolling clearance rate represents the average clearance rate for the past 4 weeks.
Number of Auctions The number of auctions in the 12 months to the current data month of the report.
Median Value The median value of all properties across the geography based on the Automated Valuation Model.
Median Value Last Year The median value of all properties across the geography based on the Automated Valuation Model as at 12 months prior to the current data month.
12 Month Change in Median Value The percentage diference between the median Automated Valuation Model in the same period compared to 12 months ago.
5 Year Change in Median Value The percentage change in the median value in the same period compared to ive years ago.
25th Percentile Value The 25th percentile value of all properties across the geography based on the Automated Valuation Model.
12 Month Change in 25th Percentile Value The percentage diference between the 25th percentile Automated Valuation Model in the same period compared 12 months ago.
75th Percentile Value The 75th percentile value of all properties across the geography based on the Automated Valuation Model.
12 Month Change in 75th Percentile Value The percentage diference between the 75th percentile Automated Valuation Model in the same period compared 12 months ago.
Median Sale Price The median sale price of all transactions recorded during the past 3 months (note standard price ilters are used to trim extreme sales results which are likely to be erroneous or errors).
12 month change in median sale price The percentage diference between the median sale price in the same period compared 12 months ago.
Total Listings The total unique number of properties that have been advertised for sale and captured over the last 12 months to the data month of the report.
12 month change in total listings The percentage change in total listings in the same period compared to 12 months ago.
Total New Listings The total number of new listings for properties recorded after 180 days after the last listing over the last 12 months to the data month of the report.
Average Time on Market The average number of days it has taken to sell those properties sold by private treaty during the last 12 months. The calculation excludes auction listings and listings where an asking price is not advertised. The days on market calculation uses the contract date on the property compared with the irst advertised date.
Average Vendor Discount The average diference between the contract price on a property and the irst advertised price. The igure is expressed as a percentage and is calculated on private treaty sales which sold for less than their initial asking price.
Median Asking Rent The median value of advertised weekly rents captured during the last 12 months.
Median Gross Rental Yield The indicative gross rental yield provides a guide about the gross rental return achieved during the last 12 months. This is calculated at the geography and is based on the annualised rent (Median Asking Rent x 52 (weeks)), divided by the median sale price.
Best Performers The top performing suburbs in the speciied state or territory as ranked by the capital growth change in the 12 months to the data month of the report. Excludes suburbs with less than 10 sales in the past 12 months.
Number Sold Quarterly A count of all transactions in the geography over the last 3 months.
Number Sold Annually A count of all transactions in the geography over the last 12 months.
Dwelling Count Total number of properties in the speciied geography.
Median Income The gross median household income in the suburb as at the 2011 census.
Residex State Market Report - Northern Territory March 2017 | 31

A few reasons to choose CoreLogic:
Accurate and timely data with unbeatable breadth and depth of data.
CoreLogic is the data provider most able to turn mountains of data into valuable insights. We collect and maintain the most comprehensive and current property and mortgage database. We apply an exacting set of processes to ensure the highest standards of data quality, deployed on platforms that enable us to store, sort and analyse data quickly and deliver it to our clients in simple and easy to use formats.
We are independent.
Our collection, analysis and research methods are audited regularly, and we are independent of any real estate, media or banking interests.
You can rely on our data and analytics.
We electronically value every property in Australia, every week used by lenders and consumers, and manage about 90% of Australian valuation instructions every month. We help professionals prepare properties for market and inance daily. Lenders rely on our insights to have strong responsible lending programs and consumers who ultimately are the center of the eco system need the conidence that they are making the best decisions around their most valuable asset.
We have the scale and experience that matters.
CoreLogic continues to grow with over 650 people employed in ten locations in Australia and New Zealand. Over 20,000 customers and 150,000 end users in property, inance and government use CoreLogic services and platform more than 30,000 times a day.
Who is CoreLogic?
CoreLogic Australia is a wholly owned subsidiary of CoreLogic (NYSE: CLGX), which is the largest property data and analytics company in the world. CoreLogic provides property information, analytics and services across Australia, New Zealand and Asia.
For more information call 1300 734 318 or visit www.corelogic.com.au.
Residex State Market Report - Northern Territory March 2017 | 32
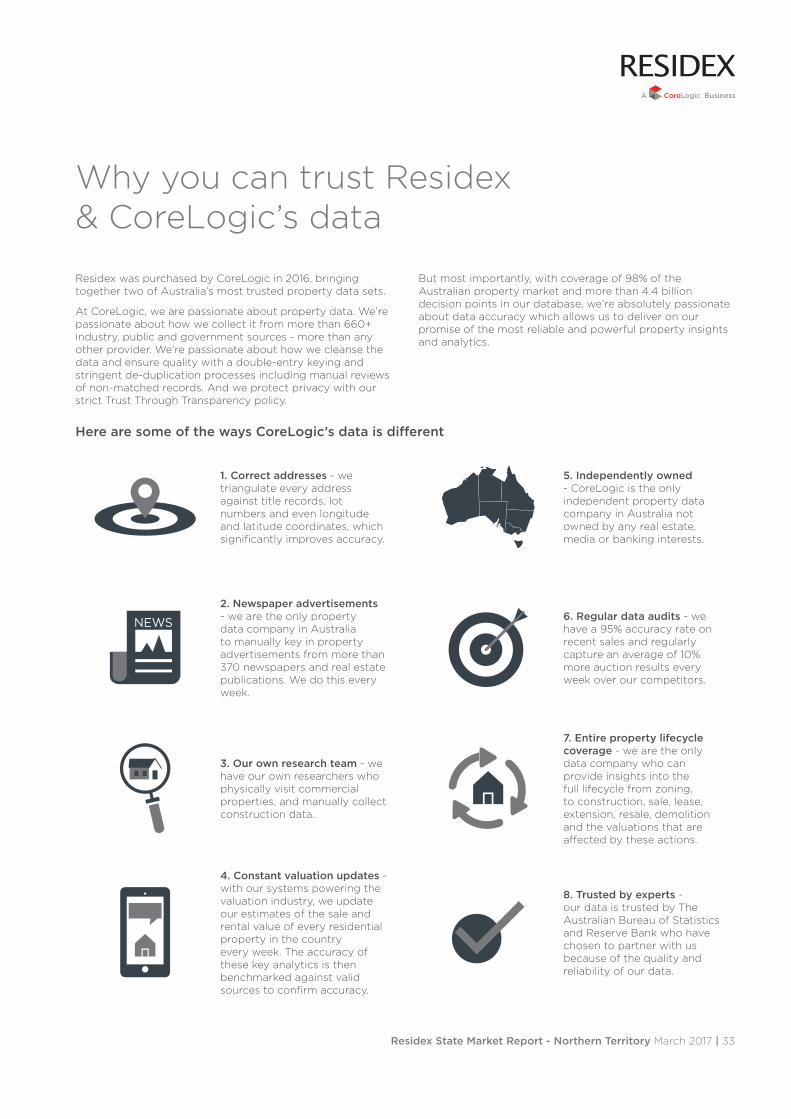
Why you can trust Residex & CoreLogic’s data
Residex was purchased by CoreLogic in 2016, bringing together two of Australia’s most trusted property data sets.
At CoreLogic, we are passionate about property data. We’re passionate about how we collect it from more than 660+ industry, public and government sources - more than any other provider. We’re passionate about how we cleanse the data and ensure quality with a double-entry keying and stringent de-duplication processes including manual reviews of non-matched records. And we protect privacy with our strict Trust Through Transparency policy.
But most importantly, with coverage of 98% of the Australian property market and more than 4.4 billion decision points in our database, we’re absolutely passionate about data accuracy which allows us to deliver on our promise of the most reliable and powerful property insights and analytics.
Here are some of the ways CoreLogic’s data is diferent
1. Correct addresses - we triangulate every address against title records, lot numbers and even longitude and latitude coordinates, which signiicantly improves accuracy.
5. Independently owned - CoreLogic is the only independent property data company in Australia not owned by any real estate, media or banking interests.
2. Newspaper advertisements - we are the only property data company in Australia to manually key in property advertisements from more than 370 newspapers and real estate publications. We do this every week.
6. Regular data audits - we have a 95% accuracy rate on recent sales and regularly capture an average of 10% more auction results every week over our competitors.
3. Our own research team - we have our own researchers who physically visit commercial properties, and manually collect construction data.
7. Entire property lifecycle coverage - we are the only data company who can provide insights into the full lifecycle from zoning, to construction, sale, lease, extension, resale, demolition and the valuations that are afected by these actions.
4. Constant valuation updates - with our systems powering the valuation industry, we update our estimates of the sale and rental value of every residential property in the country every week. The accuracy of these key analytics is then benchmarked against valid sources to conirm accuracy.
8. Trusted by experts - our data is trusted by The Australian Bureau of Statistics and Reserve Bank who have chosen to partner with us because of the quality and reliability of our data.
Residex State Market Report - Northern Territory March 2017 | 33
Disclaimers
The supply of any product data, including product data contained within or used for the generation of reports, is made subject to the following disclaimer:
The data and information (including commentary) provided in this publication (together, Information) is of a general nature and should not be construed as speciic advice or relied upon in lieu of appropriate professional advice.
While Residex (A CoreLogic business) uses commercially reasonable eforts to ensure the Information is current, Residex does not warrant the accuracy, currency or completeness of the Information and to the full extent permitted by law excludes all loss or damage howsoever arising (including through negligence) in connection with the Information.
AVM Estimates
The supply of any AVM Estimate is made subject to the following disclaimer:
An automated valuation model estimate is a statistically derived estimate of the value of the subject property generated (i) by a computer driven mathematical model in reliance on available data; (ii) without the physical inspection of the subject property; (iii) without taking into account any market conditions (including building, planning, or economic), and/or (iv) without identifying observable features or risks (including adverse environmental issues, state of repair, improvements, renovations, aesthetics, views or aspect) which may, together or separately, afect the market value (AVM Estimate).
An AVM Estimate is current only at the date of publication or supply. An AVM Estimate must not be relied upon as a professional valuation or an accurate representation of the market value of the subject property as determined by a valuer. Residex expressly excludes any warranties and representations that an AVM Estimate is an accurate representation as to the market value of the subject property.
To the full extent permitted by law, Residex (A CoreLogic business) excludes all liability for any loss or damage howsoever arising sufered by the recipient, whether as a result of the recipient’s reliance on the accuracy of an AVM Estimate or otherwise arising in connection with an AVM Estimate.
Forecast Models
The supply of any Forecast Data is made subject to the following disclaimer:
Forecast Data is a computer generated output from a mathematical model using available statistical and property data and must not be relied upon as an accurate prediction of future market performance or construed as advice. Forecast Data does not take into account future market conditions or your individual circumstances. You should exercise your own skill and judgment when considering investment decisions and seek professional advice where appropriate.
Forecast Data is current only at the date of publication or supply and may change over time. Residex expressly excludes any warranties and representations that Forecast Data is an accurate prediction of future market performance.
To the full extent permitted by law, Residex (A CoreLogic business) excludes all liability for any loss or damage howsoever arising sufered by the recipient, whether as a result of the recipient’s reliance on the accuracy of Forecast Data or otherwise arising in connection with Forecast Data.
External Data Sources
In compiling this publication, Residex (A CoreLogic business) has relied upon information supplied by a number of external sources. CoreLogic does not warrant its accuracy or completeness and to the full extent allowed by law excludes liability in contract, tort or otherwise, for any loss or damage sustained by subscribers, or by any other person or body corporate arising from or in connection with the supply or use of the whole or any part of the information in this publication through any cause whatsoever and limits any liability it may have to the amount paid to CoreLogic for the supply of such information.
ACT Data
The Territory Data is the property of the Australian Capital Territory. No part of it may in any form or by any means (electronic, mechanical, microcopying, photocopying, recording or otherwise) be reproduced, stored in a retrieval system or transmitted without prior written permission. Enquiries should be directed to: Director, Customer Services ACT Planning and Land Authority GPO Box 1908 Canberra ACT 2601.
New South Wales Data
Contains property sales information provided under licence from the Land and Property Information (“LPI”). CoreLogic is authorised as a Property Sales Information provider by the LPI.
Queensland Data
Based on or contains data provided by the State of Queensland (Department of Natural Resources and Mines) 2015. In consideration of the State permitting use of this data you acknowledge and agree that the State gives no warranty in relation to the data (including accuracy, reliability, completeness, currency or suitability) and accepts no liability (including without limitation, liability in negligence) for any loss, damage or costs (including consequential damage) relating to any use of the data. Data must not be used for direct marketing or be used in breach of the privacy laws
South Australian Data
This information is based on data supplied by the South Australian Government and is published by permission. The South Australian Government does not accept any responsibility for the accuracy or completeness of the published information or suitability for any purpose of the published information or the underlying data.
Tasmanian Data
This product incorporates data that is copyright owned by the Crown in Right of Tasmania. The data has been used in the product with the permission of the Crown in Right of Tasmania. The Crown in Right of Tasmania and its employees and agents:
a) give no warranty regarding the data’s accuracy, completeness, currency or suitability for any particular purpose; and
b) do not accept liability howsoever arising, including but not limited to negligence for any loss resulting from the use of or reliance upon the data.
Base data from the LIST © State of Tasmania http://www.thelist.tas.gov.au\
Victorian Data
The State of Victoria owns the copyright in the Property Sales Data which constitutes the basis of this report and reproduction of that data in any way without the consent of the State of Victoria will constitute a breach of the Copyright Act 1968 (Cth). The State of Victoria does not warrant the accuracy or completeness of the information contained in this report and any person using or relying upon such information does so on the basis that the State of Victoria accepts no responsibility or liability whatsoever for any errors, faults, defects or omissions in the information supplied.
Western Australian Data
Based on information provided by and with the permission of the Western Australian Land Information Authority (2015) trading as Landgate.
ABS Data
Where Product Data (or any reports supplied by Residex) have been compiled with data and statistics supplied under licence from the Australian Bureau of Statistics (ABS Data), the following notice applies in conjunction with CoreLogic Disclaimers:
This publication contains data and statistics provided by the Australian Bureau of Statistics, available at http://www.abs.gov.au/ and reproduced under Creative Commons Attribution 2.5 http://creativecommons.org/licenses/by/2.5/au/legalcode.
© Copyright 2016. Residex Pty Limited (Residex) and its licensors are the sole and exclusive owners of all rights, title and interest (including intellectual property rights) subsisting in this publication, including any data, analytics, statistics and other information contained in this publication.
All rights reserved.
Published by CoreLogic, Level 21, 2 Market St, Sydney NSW 2000 ABN 67 087 759 171.
Phone: 1300 734 318 Email: [email protected] No part of this report may be reproduced without written permission. Copyright 2017
www.residex.com.au www.corelogic.com.au
Residex State Market Report - Northern Territory March 2017 | 34

Related Documents