1 STATE LEVEL BACKGROUND PAPER ON TAMIL NADU FOR THE URBAN INFRASTRUCTURE REFORMS FACILITY (UIRF) AT THE SCHOOL OF HABITAT STUDIES TATA INSTITUTE OF SOCIAL SCIENCES PREPARED BY THE MADRAS INSTITUTE OF DEVELOPMENT STUDIES (MIDS) JULY 2011 M.Vijayabaskar, Assistant Professor, MIDS Karen Coelho, Assistant Professor, MIDS; Sriharini Narayanan, Independent Consultant, T. Venkat, Ph.D Candidate, MIDS

Welcome message from author
This document is posted to help you gain knowledge. Please leave a comment to let me know what you think about it! Share it to your friends and learn new things together.
Transcript

1
STATE LEVEL BACKGROUND PAPER ON
TAMIL NADU
FOR
THE URBAN INFRASTRUCTURE REFORMS FACILITY (UIRF) AT
THE SCHOOL OF HABITAT STUDIES TATA INSTITUTE OF SOCIAL SCIENCES
PREPARED BY THE MADRAS INSTITUTE OF DEVELOPMENT STUDIES (MIDS)
JULY 2011
M.Vijayabaskar, Assistant Professor, MIDS Karen Coelho, Assistant Professor, MIDS;
Sriharini Narayanan, Independent Consultant, T. Venkat, Ph.D Candidate, MIDS
2
CHAPTER 1: OVERVIEW OF URBANISATION IN TAMIL NADU. A. HISTORY OF URBANISATION IN TAMIL NADU Though urbanisation, as in other parts of the country, was spurred in large parts of Tamil Nadu during colonial rule, the history of urbanisation in the region is longer, going back to the early Christian era. Tamil epics indicate the presence of a thriving port town on the eastern coast and also a thriving urban center in Madurai, capital of the Pandya kingdom. The subsequent expansion of the Chola empire between the 9th and 12th century also paved the way for the emergence of several market towns in the region, particularly in the eastern and north-eastern parts of the state. There is also evidence of the presence of a number of small towns along the trade routes linking the eastern and western coastal towns in south India. As in other parts of the country, there are several temple towns in the state where historically the distance from the temple was an indicator of social and economic status of households. During the colonial period, commercialization was a clear factor spurring urbanization in the state. While the Madras region grew on account of both commerce and colonial administration, the laying of the first rail line between Madras (Chennai) and Beypore (current Mangalore) in 1862 led to the rise of several small towns along its route. Commercialisation of agriculture led to the growth of market towns not only along the railway routes but also along important transport corridors. Crises in rural areas induced by colonial policies was a major factor inducing large scale distress migration to urban centres for employment. Destruction of traditional industries, particularly handlooms, was another important factor. To an extent, the absorption of migrants was facilitated by industrialization in some parts of the state. The major impetus to industrial growth was provided by the spurt in war-time demand and an enforced import substitution due to disruption of trade. This favourable industrial climate attracted a considerable amount of capital into the industrial and banking sectors. While the established industries in the state grew, there was also a broadening of the industrial structure in the state (Mahadevan 1992, Baker 1984). The growth and diversification of the industrial sector was largely concentrated in the large urban agglomerations, particularly in Madras and Coimbatore regions and to this day, these two regions are the most dynamic in terms of both urbanization and industrial development in the state. Apart from the Chennai region, the Coimbatore region, and to a limited extent Madurai and Tirunelveli regions, urbanised due to the commericalisation of cotton cultivation and the rise of the textile industry. The Coimbatore region further witnessed a diversification from textiles into textile machinery which in turn paved the way for the growth of the engineering industry in the post-independence period. Between 1901 and 1921, the degree of urbanisation was stagnant, particularly in relation to the increase during 1921-1941. However, a rapid increase in the rate of urbanization was witnessed during the period 1941 to 1971. While the increase is around 5 % during 1901-41, population grew at a rate of 10% during the next three decades. The spurt in the 1940s may be attributed to the war-induced favourable investment climate and the accompanying growth in urbanisation. Then we witness a tapering of the rate of growth during 1971-2001. The immediate post-indendence era also

3
witnessed the growth of public sector enterprises, Central and state government, which further induced urbanisation and industrial development in places like Tiruchirapalli. Changes in town density, ie, the number of towns per unit area, however, reveal another facet of the process of urbansisation. While it shows a steady increase up to 1951, particularly with a rapid growth in the 1940s, since then it has been stagnant. This essentially implies that the scope for rise of new towns had more or less been exhausted by then. Increases in urbanization in the subsequent periods therefore are an outcome of the expansion of existing urban centres. B. CONTEMPORARY URBANISATION STATUS IN TAMIL NADU B.1. Trends in urban population growth in the state
Having come into existence in 1952, Tamil Nadu, the southernmost state in the Indian subcontinent covers a little over 130,000 sq. km, about 4 percent of India’s geographical area. It had a population of 62.11 million in the 2001 census against a total Indian population of 1027 million. The urban population of Tamil Nadu and India are 27.48 and 285.4 million respectively. Tamil Nadu thus accounts for 6% of the country's total population and 9.6% of country's urban population. Tables 1 and 2 provide an overview of changes in the overall and urban population in the state in relation to changes at the all-India level. Tamil Nadu (TN hereafter), with more than 44 per cent of the population living in urban areas according to the 2001 census (Table 2), is the most highly urbanised state among the fifteen major States of the country. Urbanisation has been on the increase since 1901. While the percentage of urban population in the country increased from 10.85% to 27.78% during 1901-2001, Tamil Nadu registered a much higher percentage increase, from 14.15% to 44.04% during the above period (Table 2). Table 1: Population of Tamil Nadu and India, 1901-2001: Population (in millions) Decadal change in
population (percent) Year
Tamil Nadu
India Tamil Nadu
India
1901 19.25 238.40 - - 1911 20.90 252.09 8.57 5.74 1921 21.63 251.32 3.49 -0.31 1931 23.47 278.98 8.51 11.01 1941 26.27 318.66 11.93 14.22 1951 30.12 361.09 14.66 13.32 1961 33.69 439.23 11.85 21.64 1971 41.20 548.16 22.29 24.80 1981 48.41 685.18 17.50 25.00 1991 55.86 846.30 15.39 23.51 2001 62.11 1027.02 11.19 21.34 Note: Figures in brackets give the index for decadal increase in population with 1901-1911= 100. Source: Census of India.

4
Table 2: Changes in Population of Tamil Nadu and India, 1901-2001: No. of
Towns
Urban
Population
Percentage to
Total Population (%) 1901 133 27,24,247 14.15 1911 162 31,49,137 15.07 1921 189 32,48,079 15.02 1931 222 42,30,382 18.02 1941 257 51,73,682 19.70 1951 297 73,33,525 24.35 1961 339 89,90,528 26.69 1971 439 1,24,64,834 30.26 1981 434 1,59,51,875 32.95 1991 469 1,90,77,592 34.15 2001 832 2,74,83,998 44.04 With regard to growth in urbanization across different size classes, Rukmani (1996) observes that since 1921, the bigger towns have grown at faster rates, followed by medium towns and then small towns. This large city bias has been particularly acute in the 1940s and Rukmani argues that this period marks the rise of duality in the process of urbanization in the state. Since then, urbanization seems to be characterized by distinct trends in the largest and the rest of the towns though there has been a narrowing of the gap between the two since the 1980s. This implies that the potential for emergence of new towns have been exhausted by this period. As a result, we witness a growing concentration of urban population in large towns. Differences can also be observed across the three phases in the rates of growth between urban agglomerations and isolated towns (Rukmani 1996). In recent times, the State’s population is expected to increase at an annual rate of 0.9 per cent to reach 674.44 lakhs by the end of Eleventh Plan period (see Table 3). The male and female population accounted for 50.3 per cent and 49.7 per cent respectively and rural and urban population in the ratio of 56:44. Table 3 : Population Profile: Tamil Nadu Population Indicators (in lakhs) 2001 2006 2011 Total population 624.06 651.35 674.44 Male population 314.01 327.30 338.52 Female population 310.05 324.05 335.92 0-14 age group 168.27 159.60 152.41 15-59 age group 399.44 426.80 446.23 60+ population 56.35 64.95 75.80 Birth Rate 18.5
5
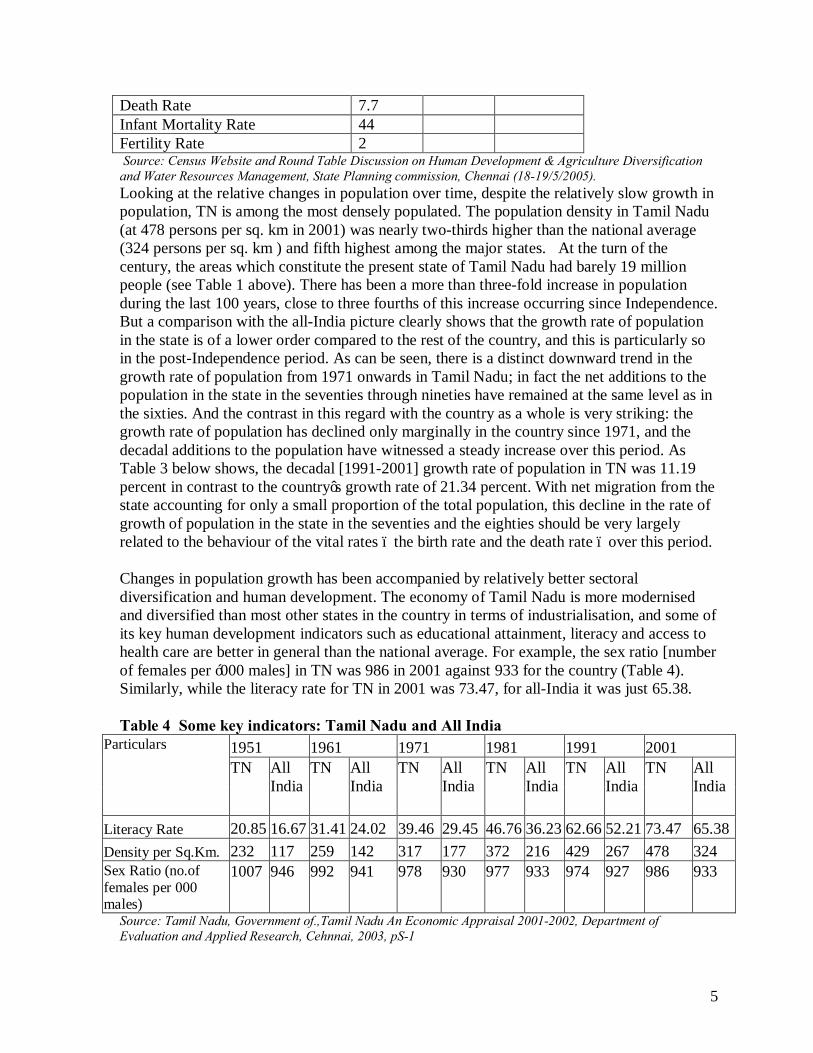
Death Rate 7.7 Infant Mortality Rate 44 Fertility Rate 2 Source: Census Website and Round Table Discussion on Human Development & Agriculture Diversification and Water Resources Management, State Planning commission, Chennai (18-19/5/2005). Looking at the relative changes in population over time, despite the relatively slow growth in population, TN is among the most densely populated. The population density in Tamil Nadu (at 478 persons per sq. km in 2001) was nearly two-thirds higher than the national average (324 persons per sq. km ) and fifth highest among the major states. At the turn of the century, the areas which constitute the present state of Tamil Nadu had barely 19 million people (see Table 1 above). There has been a more than three-fold increase in population during the last 100 years, close to three fourths of this increase occurring since Independence. But a comparison with the all-India picture clearly shows that the growth rate of population in the state is of a lower order compared to the rest of the country, and this is particularly so in the post-Independence period. As can be seen, there is a distinct downward trend in the growth rate of population from 1971 onwards in Tamil Nadu; in fact the net additions to the population in the state in the seventies through nineties have remained at the same level as in the sixties. And the contrast in this regard with the country as a whole is very striking: the growth rate of population has declined only marginally in the country since 1971, and the decadal additions to the population have witnessed a steady increase over this period. As Table 3 below shows, the decadal [1991-2001] growth rate of population in TN was 11.19 percent in contrast to the country’s growth rate of 21.34 percent. With net migration from the state accounting for only a small proportion of the total population, this decline in the rate of growth of population in the state in the seventies and the eighties should be very largely related to the behaviour of the vital rates – the birth rate and the death rate – over this period. Changes in population growth has been accompanied by relatively better sectoral diversification and human development. The economy of Tamil Nadu is more modernised and diversified than most other states in the country in terms of industrialisation, and some of its key human development indicators such as educational attainment, literacy and access to health care are better in general than the national average. For example, the sex ratio [number of females per ‘000 males] in TN was 986 in 2001 against 933 for the country (Table 4). Similarly, while the literacy rate for TN in 2001 was 73.47, for all-India it was just 65.38. Table 4 Some key indicators: Tamil Nadu and All India
1951 1961 1971 1981 1991 2001 Particulars TN All
India TN All
India TN All
India TN All
India TN All
India TN All
India
Literacy Rate 20.85 16.67 31.41 24.02 39.46 29.45 46.76 36.23 62.66 52.21 73.47 65.38 Density per Sq.Km. 232 117 259 142 317 177 372 216 429 267 478 324 Sex Ratio (no.of females per 000 males)
1007 946 992 941 978 930 977 933 974 927 986 933
Source: Tamil Nadu, Government of.,Tamil Nadu An Economic Appraisal 2001-2002, Department of Evaluation and Applied Research, Cehnnai, 2003, pS-1

6
This macro-picture conceals variations across regions and districts in population growth trends in the state. Table 5 provides a district-wise profile of populaton growth from 1981. Given the formation of new districts it is difficult to give a trend picture over a longer period of time. Table 5: Population, Decadal Growth Rate, Sex Ratio and Density, TN and Districts, 2001. District Population 2001 Decadal growth rate Sex Ratio Density Persons Males Females 1981-1991 1991-2001 1991 2001 1991 2001 Thiruvalluvar 2738866 1390292 1348574 31.53 22.35 957 970 654 800 Chennai 4216268 2161605 2054663 17.24 9.76 934 951 22077 24231 Kancheepuram 2869920 1455302 1414618 26.14 18.84 962 972 545 647 Vellore 3482970 1743871 1739099 15.14 15.09 978 997 498 573 Dharmapuri 2833252 1462136 1371116 21.61 16.66 942 938 252 294 Tiruvannamalai 2181853 1093191 1088662 14.4 6.8 983 996 330 352 Viluppuram 2943917 1484573 1459344 16.08 6.83 969 983 380 406 Salem 2992754 1551357 1441397 13.43 16.28 925 929 493 573 Namakkal 1495661 760409 735252 12.79 13.08 960 967 386 436 Erode 2574067 1306039 1268028 12.17 10.94 958 971 283 314 The Nilgiris 764826 379610 385216 12.7 7.69 983 1015 279 300 Coimbatore 4224107 2156280 2067827 14.65 20.4 952 959 470 566 Dindigul 1918960 966201 952759 12.54 8.99 976 986 291 317 Karur 933791 464489 469302 12.87 9.32 999 1010 284 311 Trichirapalli 2388831 1194133 1194698 15.57 8.76 982 1000 499 542 Perambalur 486971 242664 244307 17.92 7.97 975 1007 258 278 Ariyalur 694058 345777 348281 11.16 9.06 975 1007 328 358 Cuddalore 2280530 1148729 1131801 16.13 7.43 967 985 582 626 Nagapattinam 1487055 738287 748768 11.68 7.95 993 1014 507 548 Thiruvarur 1165213 578870 586343 12.04 5.92 987 1013 508 538 Thanjavur 2205375 1091557 1113818 11.13 7.38 996 1020 605 649 Pudukottai 1452269 720847 731422 14.72 9.43 1005 1015 285 312 Sivaganga 1150753 565594 585159 10.72 4.32 1033 1035 263 275 Madurai 2562279 1295124 1267155 17.51 6.75 964 978 686 733 Theni 1094724 553118 541606 12.98 4.33 964 979 342 357 Virudhunagar 1751548 870820 880728 16.71 11.92 994 1011 365 409 Ramanathapuram 1183321 582068 601253 12.11 5.73 1011 1033 271 287 Thoothukudi 1565743 764087 801656 7.8 7.54 1051 1049 315 339 tirunelveli 2801194 1372082 1429112 12.53 11.97 1034 1042 367 411 Kanniyakumari 1669763 829542 840221 12.43 4.34 991 1013 950 992 Tamil Nadu 62110839 31268654 30842185 15.39 11.19 974 986 429 478 Source: India, Government of., Census of India, 2001, Table 1, Provisional Population Total, Series 1, Paper-1 of 2001, Supplement: District Totals, pg.116-117

7
The decadal growth rate of population is the highest in Thiruvallur (22.35 percent between 1991 and 2001 as compared to the average of 11.19 percent for the state), followed by Coimbatore and Kancheepuram. It needs to be remembered that Tiruvallur and Kancheepuram are districts comprising peripheral regions of Chennai metropolitan region and thus the growth in population in these districts reflects the growing concentration of growth around Chennai. Many town panchayats and muncipalities in the two districts in fact belong to the Chennai Metropolitan area. The density of population per sq. km. for Thiruvallur, Kancheepuram and Cuddalore is way above the average for the state as a whole in 1991 as well as in 2001. B.2. Urbanisation Patterns and Status of Urban Centers The major administrative units of the state comprise 32 districts, 73 revenue divisions, 208 taluks, 1120 firkas, and 16563 revenue villages. Its political units comprise 10 City Corporations, 148 Municipalities, 561 Town Panchayats, and 12,618 Village Panchayats. The State has 39 Lok Sabha Constituencies and 234 Assembly Constituencies. The state capital Chennai (formerly known as Madras) is the fourth largest city in India and is also one of the five A1 Metropolitan cities of India. It extends over an area of 174 sq. km. It is proposed to expand the limits of the Chennai Corporation by incorporating 9 Municipalities, 8 Town Panchayats and 25 Panchayats Unions by 2011 to expand to an area of 426 sq. kms (per G.O (D) No.256 Dt. 26.12.2009). Also since the 74th amendment, as in other states, there has been a growing emphasis on improving the quality of governance in these bodies and improvement in the provision of public services.
Observing trends over time since the 1900s (Table 2), we find that during the period 1901-1911 a meager 13 percent of the state’s population moved to urban areas. The subsequent decades revealed a mixed trend of increasing and declining growth of percentage of population added to urban areas. After a slowdown during 1981-91, we find that there were massive additions to the urban population during 1991-2001. Importantly, we also find a negative growth of population in the rural areas during this period. With these trends continuing, forecasts suggest that, by 2026, 54 million people constituting nearly 74.8 percent of the state population would be residing in urban Tamil Nadu (Source: Population Projections for India and States 2001-2026, Census of India). Looking at the growth in the number of towns, we observe that while the numbers grew steadily between 1901 and 1991, there was a marked increase in the decade 1991-2001, with the number increasing from 469 to 832 (Table 2). This spurt is primarily due to the designation of Town Panchayats as urban bodies following the implementation of the 74th Constitutional Amendment in TN in 1994. All Town Panchayats irrespective of whether they satisfied the demographic and economic criteria laid out by the census, and despite the predominantly rural character of most of the towns, were brought under the urban fold along with Municipal Corporations, Municipalities and Cantonments by the 2001 Census. Such growth of urbanisation has obvious implications for diversification of livelihoods which we shall map in the next section.
8
In addition to being the most urbanised state, the state also has a better spread of urbanisation. Not only does it have a larger number of towns per unit area , it also has a better mix of small, medium and large towns and a better spatial spread of these towns, compared to either Maharastra or Gujarat, two other highly urbanised states in the country. Each district has at least one muncipality. In fact if a composite index of urbanisation taking into account (a) the degree of urbanisation, (b) rural population served by a town and (c) the average distance to a town from the village, is used for comparison across the states, Tamil Nadu ranks first among the major states in the country even in 1981 and 1991 (Rukmani, 1994). An important consequence of this relatively even spread of urbanisation in Tamil Nadu is that the rural-urban linkages in the state are quite strong compared to other states in the country (with the possible exception of Kerala). And there is reason to believe that the rural-urban linkages in the state have got strengthened in the recent past, particularly from the seventies onwards due to developments in transport infrastructure as we shall see later. Such strong rural-urban connectivity implies a high degree of mobility between the rural and urban regions of the state. This phenomenon is supported by micro-level evidence. With declining incomes from agriculture compounded by decreasing employment absorption in rural areas, intense short-term mobilities are a distinct feature of the state’s migratory landscape. However, the level of urbanisation in Tamil Nadu is high only in relation to rates of urbanisation in other states in the country. With less than 50 per cent of its population living in urban areas, Tamil Nadu continues to be a predominantly rural society. More significantly, even at this modest level of urbanisation there are clear indications of deceleration of urban growth in the state in the two decades 1971-81 and 81-91 [Table 2]. Also, much of the growth in urbanisation since 1991 is also attributable to the inclusion of town panchayats within the urban rubric following the 74th Constitutional Amendment, as discussed below. Looking at the factors that have enabled migration, the rapid urban growth in agglomerations in the 1960s was primarily due to expansion and diversification in the industrial sector with the setting up of public sector units and expansion of private sector firms. The moderate growth in the 1970s may be related to the growth and increasing market-orientation of the agricultural sector due to the green revolution. The sharp decline in urban growth in the eighties may again be linked to fortunes of the industrial sector which did witness a sharp decline in its growth in this period. Since the 1990s, while growth in larger agglomerations have been primarily driven by growth in the services sector, several small and medium towns (SMTs) have witnessed growth driven by sectors like textiles, garments, printing and fireworks, poultry, coir, etc. The state has emerged as a major centre of software and IT-enabled services exports and automobile production, originating primarily from Chennai and Coimbatore.

9
C. URBANISATION AND LABOUR MARKET DIVERSIFICATION: Table 7 provides the distribution of the population between workers and non-workers in TN and for all-India according to the 2001 census. Among the working population, a further distribution is drawn between Main and Marginal workers.
Table 7 Distribution of Population Across workers and Non-workers, India and Tamil Nadu: 2001
Workers Sl.
No.
India/
State
Total/
Rural/
Urban
Persons/
Males/
Females
Total
Population
Total workers % Main
workers %
Marginal
Workers %
Non
workers %
1 2 3 4 5 6 7 8 9
1 India Total Persons 1025251059 402512190 39.26 313173394 30.55 89338796 8.71 622738869 60.74
Males 530422415 275463736 51.93 240520672 45.35 34943064 6.59 254958679 48.07
Females 494828644 127048454 25.68 72652722 14.68 54395732 10.99 367780190 74.32
Rural Persons 740255371 310655339 41.97 229672348 31.03 80982991 10.94 429600032 58.03
Males 380438194 199199602 52.36 169333233 44.51 29866369 7.85 181238592 47.64
Females 359817177 111455737 30.98 60339115 16.77 51116622 14.21 248361440 69.02
Urban Persons 284995688 91856851 32.23 83501046 29.30 8355805 2.93 193138837 67.77
Males 149984221 76264134 50.85 71187439 47.46 5076695 3.38 73720087 49.15
Females 135011467 15592717 11.55 12313607 9.12 3279110 2.43 119418750 88.45
2
Tamil
Nadu Total Persons 62110839 27811647 44.78 23684611 38.13 4127036 6.64 34299192 55.22
Males 31268654 18153275 58.06 16346879 52.28 1806396 5.78 13115379 41.94
Females 30842185 9658372 31.32 7337732 23.79 2320640 7.52 21183813 68.68
Rural Persons 34869286 17572083 50.39 14290211 40.98 3281872 9.41 17297203 49.61
Males 17508985 10396912 59.38 9067457 51.79 1329455 7.59 7112073 40.62

10
Females 17360301 7175171 41.33 5222754 30.08 1952417 11.25 10185130 58.67
Urban Persons 27241553 10239564 37.59 9394400 34.49 845164 3.10 17001989 62.41
Males 13759669 7756363 56.37 7279422 52.90 476941 3.47 6003306 43.63
Females 13481884 2483201 18.42 2114978 15.69 368223 2.73 10998683 81.58
Source: Tamil Nadu Govt.of - Provisional Population Totals Paper 3 of 2001 Distribution of Workers and Non workers, Census of India, 2001, Series 34, Tamil Nadu pp. 101/109
It is clear from the table that the work participation rates (WPR) in TN for both men and women are above those for the country as a whole. Another interesting aspect is that while the percentage of marginal workers in TN are lower than the average for the country, the percentage of marginal workers in urban TN is higher than that for the country, for both men and women. By the TN government’s own admission in its Human Development Report, 2003, “What is worrisome about the 2001 Census results is that the number of marginal workers has gone up from 1.4 million in 1991 to 4.1 million in 2001. This suggests that the increase in WPR during this time period is largely accounted for by an increase in marginal workers as opposed to main workers. The number of main workers has only risen from 22.8 million to 23.7 million, by less than a million”[ibid: 20]. In other words, while the growth process has led to greater avenues for the state’s population to enter into the labour market, the terms of entry, particularly in the 1990s appears to have been adverse for large sections of the working population. In terms of workforce distribution across sectors, comparison of worker classification between TN and India into the following categories reveals that a larger proportion of workers in TN [both males and females] belong to the ‘Agricultural Labour’ and ‘Household Industry’ category [Table 8]. Table 8: Worker Classification: India and Tamil Nadu Comparison India/State Total/Rural/Urban Persons/Males/
Females Total workers ain+Marginal) Categories of Workers
Cultivators Agricultural Labourers
Household Industry Others
% % % % India Total Persons 402512190 31.71 26.69 4.07 37.52 Males 275463736 31.34 20.82 3.02 44.82 Females 127048454 32.51 39.43 6.36 21.70 Rural Persons 310655339 40.14 33.20 3.77 22.90 Males 199199602 42.19 27.48 2.83 27.49 Females 111455737 36.46 43.40 5.44 14.70 Urban Persons 91856851 3.21 4.71 5.10 86.98 Males 76264134 2.99 3.42 3.50 90.09 Females 15592717 4.26 11.03 12.93 71.77 Tamil Nadu Total Persons 27811647 18.39 31.16 5.24 45.21

11
Males 18153275 18.21 23.56 3.41 54.82 Females 9658372 18.73 45.43 8.69 27.15 Rural Persons 17572083 26.89 43.05 4.64 25.41 Males 10396912 29.13 35.28 3.12 32.48 Females 7175171 23.66 54.32 6.84 15.18 Urban Persons 10239564 3.79 10.74 6.28 79.18 Males 7756363 3.58 7.86 3.80 84.77 Females 2483201 4.48 19.74 14.05 61.73 As per census 2001, following is the more detailed occupational break-up of the state’s workforce. (Table 9) Table 9: Occupational Classification of TN’s Worforce
State:Tamil Nadu Male Female Total
Total Population* 31,400,909 31,004,770 62,405,679
Workers** 18,100,397 9,777,885 27,878,282
Main Workers*** 16,303,310 7,454,473 23,757,783
Main Cultivators 3,107,543 1,631,276 4,738,819
Main Agricultural Laborers 3,273,642 2,789,144 6,062,786
Main Workers in Household Industries 594,025 667,034 1,261,059
Main Other Workers 9,328,100 2,367,019 11,695,119
Marginal Workers**** 1,797,087 2,323,412 4,120,499
Marginal Cultivators 154,946 222,274 377,220
Marginal Agricultural Laborers 982,718 1,592,126 2,574,844
Marginal Workers in Household Industries 54,564 184,138 238,702
Marginal Other Workers 604,859 324,874 929,733
12
Non Workers 13,300,512 21,226,885 34,527,397
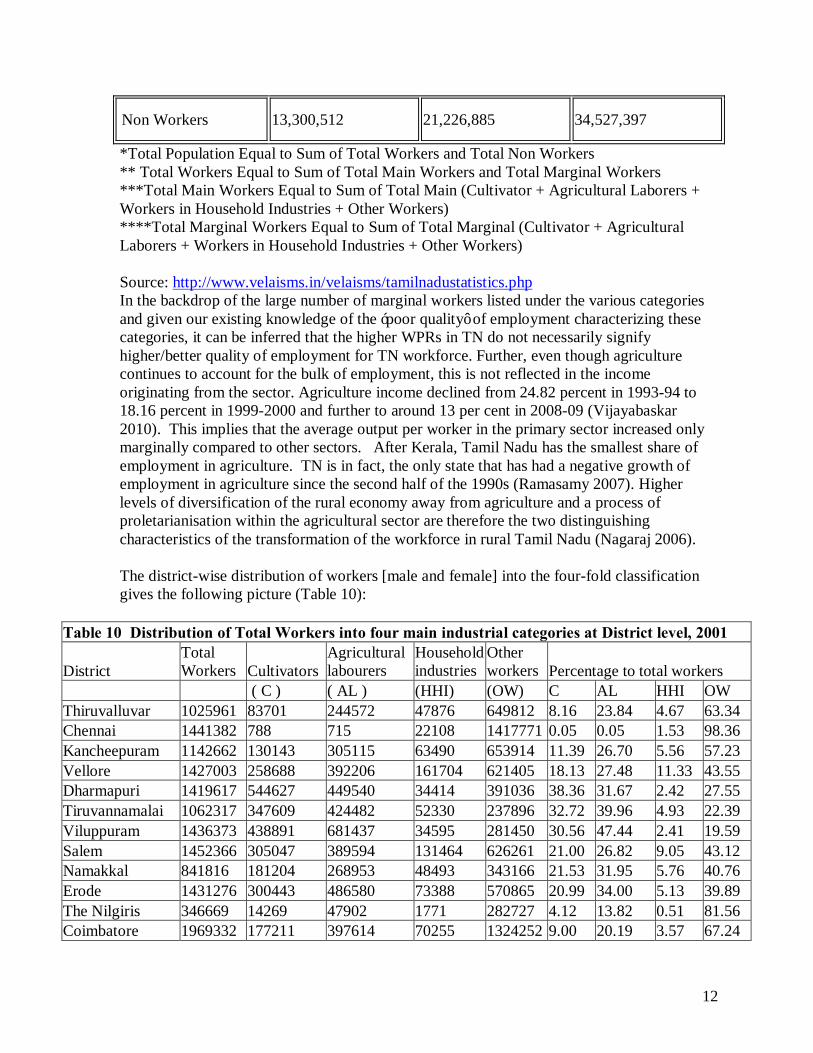
*Total Population Equal to Sum of Total Workers and Total Non Workers ** Total Workers Equal to Sum of Total Main Workers and Total Marginal Workers ***Total Main Workers Equal to Sum of Total Main (Cultivator + Agricultural Laborers + Workers in Household Industries + Other Workers) ****Total Marginal Workers Equal to Sum of Total Marginal (Cultivator + Agricultural Laborers + Workers in Household Industries + Other Workers) Source: http://www.velaisms.in/velaisms/tamilnadustatistics.php In the backdrop of the large number of marginal workers listed under the various categories and given our existing knowledge of the ‘poor quality’ of employment characterizing these categories, it can be inferred that the higher WPRs in TN do not necessarily signify higher/better quality of employment for TN workforce. Further, even though agriculture continues to account for the bulk of employment, this is not reflected in the income originating from the sector. Agriculture income declined from 24.82 percent in 1993-94 to 18.16 percent in 1999-2000 and further to around 13 per cent in 2008-09 (Vijayabaskar 2010). This implies that the average output per worker in the primary sector increased only marginally compared to other sectors. After Kerala, Tamil Nadu has the smallest share of employment in agriculture. TN is in fact, the only state that has had a negative growth of employment in agriculture since the second half of the 1990s (Ramasamy 2007). Higher levels of diversification of the rural economy away from agriculture and a process of proletarianisation within the agricultural sector are therefore the two distinguishing characteristics of the transformation of the workforce in rural Tamil Nadu (Nagaraj 2006). The district-wise distribution of workers [male and female] into the four-fold classification gives the following picture (Table 10):
Table 10 Distribution of Total Workers into four main industrial categories at District level, 2001
District Total Workers Cultivators
Agricultural labourers
Household industries
Other workers Percentage to total workers
( C ) ( AL ) (HHI) (OW) C AL HHI OW Thiruvalluvar 1025961 83701 244572 47876 649812 8.16 23.84 4.67 63.34 Chennai 1441382 788 715 22108 1417771 0.05 0.05 1.53 98.36 Kancheepuram 1142662 130143 305115 63490 653914 11.39 26.70 5.56 57.23 Vellore 1427003 258688 392206 161704 621405 18.13 27.48 11.33 43.55 Dharmapuri 1419617 544627 449540 34414 391036 38.36 31.67 2.42 27.55 Tiruvannamalai 1062317 347609 424482 52330 237896 32.72 39.96 4.93 22.39 Viluppuram 1436373 438891 681437 34595 281450 30.56 47.44 2.41 19.59 Salem 1452366 305047 389594 131464 626261 21.00 26.82 9.05 43.12 Namakkal 841816 181204 268953 48493 343166 21.53 31.95 5.76 40.76 Erode 1431276 300443 486580 73388 570865 20.99 34.00 5.13 39.89 The Nilgiris 346669 14269 47902 1771 282727 4.12 13.82 0.51 81.56 Coimbatore 1969332 177211 397614 70255 1324252 9.00 20.19 3.57 67.24

13
Dindigul 972775 195651 411304 26989 338831 20.11 42.28 2.77 34.83 Karur 495737 106863 187594 19597 181683 21.56 37.84 3.95 36.65 Trichirapalli 1055580 218856 335524 39465 461735 20.73 31.79 3.74 43.74 Perambalur 267042 127662 92111 3616 43653 47.81 34.49 1.35 16.35 Ariyalur 345132 112098 158133 19608 55293 32.48 45.82 5.68 16.02 Cuddalore 974966 190482 454614 28640 301230 19.54 46.63 2.94 30.90 Nagapattinam 584310 69072 313174 9032 193032 11.82 53.60 1.55 33.04 Thiruvarur 489904 68374 286033 8068 127429 13.96 58.39 1.65 26.01 Thanjavur 910414 147918 416052 40297 306147 16.25 45.70 4.43 33.63 Pudukottai 677314 248055 229846 15796 153627 36.62 33.93 2.33 22.68 Sivaganga 509493 187615 147550 10559 167769 36.82 28.96 2.07 32.93 Madurai 1081686 125892 332249 36774 586771 11.64 30.72 3.40 54.25 Theni 519449 53494 281574 11419 172962 10.30 54.21 2.20 33.30 Virudhunagar 880579 84953 197249 49140 549237 9.65 22.40 5.58 62.37 Ramanathapuram 520623 179562 124483 24952 191626 34.49 23.91 4.79 36.81 Thoothukudi 673682 71315 167407 45783 289177 10.59 24.85 6.80 42.92 Tirunelveli 1310582 144834 363434 288409 513905 11.05 27.73 22.01 39.21 Kanniyakumari 545605 16067 81998 38514 409025 2.94 15.03 7.06 74.97
Tamil Nadu 27811647 5114384 8665020 1458546 12573697 18.39 31.16 5.24 45.21
Source: Census of India, 2001 Provisional Populaiton Total Paper-3, Tamil Nadu, (Series 34) pg.30 while 31 percent of workers overall for TN are categorized as agricultural workers, the percentages of agricultural workers for Villupuram and Cuddalore, districts that are close to Chennai, are way above the state average, at 47 and 46 percent respectively. In a similar vein, while 45 percent of workers are categorized as ‘Other Workers’ for the state as a whole, the percentages for Thiruvallur and Kancheepuram for the same category are above the state average at 63 and 57 percent respectively [Table 13]. The district and sex-wise distribution of workers into the four-fold classification indicate the following1: while overall for the state, only 24 percent of male workers are returned as agricultural labourers, almost 45 percent of female workers belong to this category. The bulk of male workers [almost 55 percent] belong to the ‘Other Workers’ category. In contrast, just 27 percent of women workers belong to the ‘Other Workers’ category [Table 14 & 15]. In the case of men workers, the districts of Thiruvallur and Kancheepuram have returned almost 70 and 65 percent of workers, respectively, as belonging to the ‘Other Workers’ category; in Villupuram and Cuddalore on the other hand, the share of agricultural workers are above the average for the state, as far as men workers are concerned. The female workforce distribution follows a similar pattern. Here again, while Thiruvallur and Kancheepuram show higher than state average female workers as ‘Other Workers’, Villupuram and Cuddalore have higher than state average female workers in the agricultural labour category.
1 (Source: Census of India, 2001 Provisional Populaiton Total Paper-3, Tamil Nadu, (Series 34) pg.31)

14
Between 1981 and 1991 the WPR increased for women in TN both in rural and urban areas; for men on the other hand the WPR showed a marginal increase in urban areas but a marginal decrease in rural areas. However, a district-wise classification of WPR data for 1991 revealed the following disquieting feature: those districts that showed a distinct increase in female WPR were also the districts where female child and adolescent work participation rates had increased. For 1991, in 13 of the 21 districts that revealed female WPRs higher than state average, also showed higher than average increases in female child and adolescent WPRs. For males, 7 districts that had recorded WPRs higher than state average, showed higher than average male child and male adolescent WPRs in these districts [Swaminathan, 2002]. D. SECTORAL DIVERSIFICATION, GROWTH OF PER CAPITA INCOME AND INFRASTRUCTURE DEVELOPMENT The relatively slow rate of growth of population in Tamil Nadu in the post-Independence period has facilitated the higher per capita income growth in the state ompared to the country as a whole for the period after the early sixties. Considering the period 1960-61 to 1995-96 as a whole, the per capita income (in constant 1980-81 prices) in the state has grown by around 2 percent per annum, which is slightly higher than the corresponding all-India rate of 1.8 percent per annum. In the third period, viz., from the mid-eighties onwards, the per capita income in the state has witnessed a sharp increase, growing at rate significantly higher than the all-India rate. Steady increase in NSDP as well as a sharp fall in the birth rate have contributed to this phenomenon. In fact it is only in the nineties that the per capita income in the state has consistently been higher than the all-India average. For earlier periods, the per capita income in the state kept fluctuating around the all-India average, but was below the all-India average for 20 out of the thirty years (1971-2001). The growth of income from the mid-eighties coupled with a rapid decline in the birth rate – unlike in most other parts of the country – provided a clear advantage to Tamil Nadu in terms of the level of per capita income in the nineties. Since the mid-1990s, Tamil Nadu has become one of India’s fastest growing states with an average annual growth rate of nearly 7%.2 The State’s Net State Domestic Product (NSDP) growth rate was 6.3% per annum during the 1990s, ahead of the average NSDP growth rate of 5.99% of the 15 major States3. With a per capita income of Rs. 29,958 in 2005-06, it was ranked seventh among all states. In terms of diversification of employment across sectors, it had the best index with the highest share of manufacturing employment (21.1%) and a services share of 30.9% in early 2000 (Ramaswamy 2007). Tamil Nadu is among the most industrialised states, ranking next to Maharashtra in terms of the contribution made by the manufacturing sector to NSDP, It also has the largest number of factories in the country and the largest number of workers employed in the manufacturing sector (Planning Commission 2005: 91). 2 (Planning Commission 2005: 25) 3 http://pbplanning.gov.in/pdf/Ranking%20of%20States%20Current.pdf

15
Its work participation rates are among the highest in the country and are high for both male and female workers in both rural and urban areas (Govt of Tamil Nadu 2003: 20). Perhaps the most striking phenomenon of TN’s economy is the sluggishness of its primary sector. Over three decades, from the early sixties to early 2001, this sector grew at a rate of just above 1 percent per annum. The secondary and the tertiary sectors, in sharp contrast, have grown at rates which are nearly three and a half times the rate registered by the primary sector over this period. Though the stagnation in the agricultural sector has occurred in many other states, Tamil Nadu’s agrarian economy has certain specific features. Agricultural income declined over the period 1993-4 to 1999-2000 from 24.82% to 18.16% of total state domestic product, and further to 13.3% in 2005-06, the lowest in the country after Kerala. Returns to farming have consistently declined. In fact, in 2002-03, the average income for farmer households from cultivation (Rs. 7908) was lower than the amount spent on cultivation (Rs. 8597) (Narayanamoorthy 2006: 471). Under such cost-price conditions, it is not surprising to find high levels of indebtedness. 75% of rural households are indebted which is second only to Andhra Pradesh in the country (ibid.). This difference in income and cost of cultivation is also much higher than the all-India average. Also, while at the national level 45% of income for farmers comes from cultivation, in TN, it is less than 30%,. In sum, the striking aspects of sectoral growth in Tamil Nadu from the early sixties to early nineties may be summarised as: (a) a sluggish primary sector, (b) rapid growth of the secondary sector till about the mid-eighties and then again from the late 1990s (c) a relatively high growth of the tertiary sector all through, but particularly so in the period after the mid-eighties, when it emerges as the major factor behind the rapid growth of the state economy. TN has witnessed rapid industrial growth since the early 1990s and has one of the most vibrant manufacturing and tertiary sectors in the country. Nevertheless, this growth process is not evenly spread across the state and we find that certain urban centres like Chennai, Coimbatore and Tiruchirapalli have grown much faster than some others like Tirunelveli or Madurai. These differences are likely to be reflected and maybe even partly explained by differences in physical and social infrastructure in these regions. In terms of per capita net value added by the manufacturing sector, Tamil Nadu ranks fourth among the major states in the country, next to Maharastra, Gujarat and Punjab. Of the two states, viz., Maharastra and Gujarat, which, on the basis of value added per capita, have displayed a higher level of industrialisation than Tamil Nadu, only Gujarat ranks above Tamil Nadu in terms of the percentage of workers in (manufacturing) industry; and neither of these two states is ahead of Tamil Nadu in terms of proportion of workers in household industry; where Tamil Nadu ranks second, next only to West Bengal. Similarly, while both Maharastra and Gujarat have a larger number of registered factories than Tamil Nadu, the number of registered small scale industrial units is higher in Tamil Nadu compared to these two states. In terms of an overall index of infrastructural development4, TN is ahead of both these states, ranking third, next to Punjab and Kerala.
4. This index, which gives the level of development of general infrastural facilities in each state with the all-India as the base, is developed by the CMIE. The index is developed taking into account 13 different indicators relating to (a) transport facilities (b) energy consumption (c) irrigation facilities (d) banking facilities (e) communication infrastructure (f) educational facilities and (g) health facilities. For details see: CMIE: Profiles of States, March 1997.

16
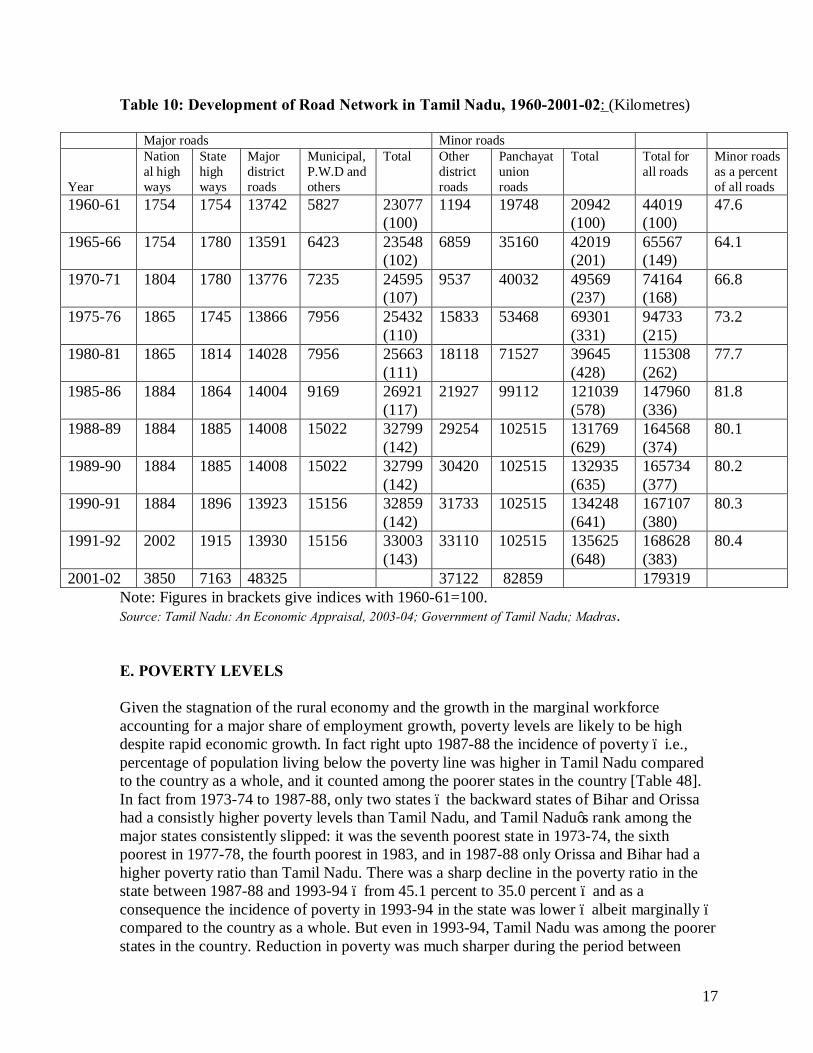
It is often claimed that industrial entrepreneurship in Tamil Nadu is more fragmented, both in socioeconomic and spatial terms compared to say, Maharastra or Gujarat. The emergence of a number of industrial entrepreneurs, with a relatively small size of capital, and on wider, dispersed social and spatial bases seems to be a distinct characteristic of Tamil Nadu [Ito, 1966; Mahadevan, 1984; Rukmani 1993]. This may be an important factor behind the better spatial spread of industries as well as the better mix of large, small and household industries that one finds in Tamil Nadu. This diffused process of industrialisation and corresponding urbanization has paved the way for better rural-urban linkages in TN than in most other states. It has also led to an intensification of short-term rural-urban migration, like daily commutation to work in a nearby urban area, or seasonal migration to an urban area. Some village resurveys too provide micro-level evidence for this phenomenon (Harriss–White and Janakarajan 1997 cited in Nagaraj 2006). Industrial growth has been concentrated in several small town clusters which though present throughout the state, are to a considerable extent concentrated in the western region of the state. Referred to as the Kongunad region, the region is spread roughly over six districts- Coimbatore, Tiruppur, Erode, Salem, Namakkal and Karur. These clusters specialize in a range of activities like clothing, home furnishings, textiles, leather, poultry, coir products, transport equipment servicing, engineering services and auto component making. A few of the semi-arid southern districts are home to dynamic small towns specialising in matches, fireworks and printing, The diffusion of industrialisation also implies a widening of the social base of entrepreneurship. The growth of these clusters relies heavily upon the huge reserves of migrant labour that have moved into these clusters due to a combination of push and pull factors. The well developed road and transport networks too play an important role in intensifying the new forms of rural-urban mobilities. The relatively diffused and small scale nature of industrialization in the state has also been accompanied in recent years by entry of FDI in sectors like automobiles, hardware and telecommunications. These investments interestingly have largely taken place in and around the Chennai metropolitan region and at the moment do not appear to have developed adequate linkages with the SME base in the state. A significant share of these investments has come up in special economic zones in the districts bordering Chennai and hence Tamil Nadu has often been hailed as a model for successfully using the SEZ route to attract productive investments. It must however be borne in mind that many firms converted themselves into SEZs after coming into the state. Their impacts on urban infrastructure requirements and on the host economy are yet to be studied. The 60s, 70s and 80s witnessed a very significant increase in the spread and development of the road network, particularly of the ‘minor’ roads, viz., roads other than highways and major district roads, and of transportation facilities, particularly of public transportation in the state [Table 5]. According to the census, in 1971 nearly a third (32.4 percent) of the villages in Tamil Nadu had a town less than 10 kilometres away (Rukmani, 1996); this proportion had increased to nearly half (49.0 percent) by 1992-93 according to the National Family Health Survey.
17
Table 10: Development of Road Network in Tamil Nadu, 1960-2001-02: (Kilometres)
Major roads Minor roads Year
National high ways
State high ways
Major district roads
Municipal, P.W.D and others
Total Other district roads
Panchayat union roads
Total Total for all roads
Minor roads as a percent of all roads
1960-61 1754 1754 13742 5827 23077 (100)
1194 19748 20942 (100)
44019 (100)
47.6
1965-66 1754 1780 13591 6423 23548 (102)
6859 35160 42019 (201)
65567 (149)
64.1
1970-71 1804 1780 13776 7235 24595 (107)
9537 40032 49569 (237)
74164 (168)
66.8
1975-76 1865 1745 13866 7956 25432 (110)
15833 53468 69301 (331)
94733 (215)
73.2
1980-81 1865 1814 14028 7956 25663 (111)
18118 71527 39645 (428)
115308 (262)
77.7
1985-86 1884 1864 14004 9169 26921 (117)
21927 99112 121039 (578)
147960 (336)
81.8
1988-89 1884 1885 14008 15022 32799 (142)
29254 102515 131769 (629)
164568 (374)
80.1
1989-90 1884 1885 14008 15022 32799 (142)
30420 102515 132935 (635)
165734 (377)
80.2
1990-91 1884 1896 13923 15156 32859 (142)
31733 102515 134248 (641)
167107 (380)
80.3
1991-92 2002 1915 13930 15156 33003 (143)
33110 102515 135625 (648)
168628 (383)
80.4
2001-02 3850 7163 48325 37122 82859 179319 Note: Figures in brackets give indices with 1960-61=100. Source: Tamil Nadu: An Economic Appraisal, 2003-04; Government of Tamil Nadu; Madras. E. POVERTY LEVELS Given the stagnation of the rural economy and the growth in the marginal workforce accounting for a major share of employment growth, poverty levels are likely to be high despite rapid economic growth. In fact right upto 1987-88 the incidence of poverty – i.e., percentage of population living below the poverty line was higher in Tamil Nadu compared to the country as a whole, and it counted among the poorer states in the country [Table 48]. In fact from 1973-74 to 1987-88, only two states – the backward states of Bihar and Orissa had a consistly higher poverty levels than Tamil Nadu, and Tamil Nadu’s rank among the major states consistently slipped: it was the seventh poorest state in 1973-74, the sixth poorest in 1977-78, the fourth poorest in 1983, and in 1987-88 only Orissa and Bihar had a higher poverty ratio than Tamil Nadu. There was a sharp decline in the poverty ratio in the state between 1987-88 and 1993-94 – from 45.1 percent to 35.0 percent – and as a consequence the incidence of poverty in 1993-94 in the state was lower – albeit marginally – compared to the country as a whole. But even in 1993-94, Tamil Nadu was among the poorer states in the country. Reduction in poverty was much sharper during the period between

18
1993-94 and 1999-2000 when the rural poverty fell to 20.5 percent of the population and the urban levels fell to 22.1 per cent. This translated to 8 million rural poor and 5 million urban poor in the state. Table 10: Number and Percentage of Poor:
Percentage of Poor Rural Urban Combined
Year
Tamil Nadu India Tamil Nadu India Tamil Nadu India 1973-74 57.4 56.4 54.5 49.2 56.5 54.9 1977-78 57.7 53.1 53.2 47.4 56.3 51.8 1983 54.0 45.6 49.2 42.2 52.4 44.8 1987-88 45.8 39.1 43.9 40.1 45.1 39.3 1993-94 32.5 37.3 39.6 33.5 35.0 36.3 1999-00 20.5 27.9 22.11 23.62 21.12 26.1
Number of Poor (in lakhs) Rural Urban Combined
Year
Tamil Nadu India Tamil Nadu India Tamil Nadu India 1973-74 172.6 (100) 2612.9 (100) 73.8 (100) 603.1 (100) 246.4 (100) 3216.0 (100) 1977-78 182.5 (106) 2642.5 (101) 79.8 (108) 677.4 (112) 262.3 (106) 3319.9 (103) 1983 181.8 (105) 2517.2 (96) 84.6 (115) 752.9 (125) 266.4 (108) 3270.1 (102) 1987-88 160.7 (93) 2294.0 (88) 82.5 (112) 833.5 (138) 243.2 (99) 3127.5 (97) 1993-94 121.7 (71) 2400.7 (94) 80.4 (109) 740.9 (123) 202.1 (82) 3151.6 (98) 1999-00 80.5 1932.43 49.97 670.07 130.48 2602.5 Source: 1. For 1973-74 to 1987-88: Report of the Expert Group on Estimation of Proportion and Number of Poor; Perspective Planning Division, Planning Commission, Government of India, New Delhi, 1993. 2. For 1993-94: for Tamil Nadu: CMIE: Profiles of States, March 1997. For all India, the estimates are obtained using the CMIE for the 17 major states only. This pattern had not changed even by 1999-2000 as the state witnessed a sharp reduction in the poverty figures. As for the trend in poverty levels over time, a significant dent into the problem of poverty in the state occurred only since 1987-88. It is only since then that the decline in the poverty ratio has also resulted in a significant decline in the number of the poor. Within Tamil Nadu the record of poverty reduction is better in the rural sector compared to the urban. Over the two decades 1973-74 to 1993-94, the poverty ratio declined by 24.9 percentage points, and the number of poor declined by 29 percent in rural Tamil Nadu. In urban Tamil Nadu on the other hand the poverty ratio declined by only 14.9 percentage points, and the number of poor in fact increased over the same period. Thus the problem of poverty is getting increasingly urbanised in Tamil Nadu. It is also noteworthy while the urban poverty ratios in Tamil Nadu have consistently been higher than the corresponding ratios for the country as whole – this is true even for 1993-94 – by 1993-94 the rural poverty ratio in the state had fallen to a level below the rural ratio for the country as a whole.

19
Between 1993 and 2005, Tamil Nadu’s GSDP (at constant prices) grew at 5.46 per cent per annum, whereas the poverty ratio declined by 3.31 per cent per annum, with 146 lakh persons still living below poverty line. The urban poverty ratio declined sharply from 39.9 to 22.2 and the rural poverty ratio declined rather slowly from 32.9 to 22.2. The number of poor persons in rural areas is still 76.50 lakh compared to 69.13 lakh in urban areas. Given the stagnation of the agricultural sector during this period, the larger growth rates of secondary and tertiary sectors at 4.35 and 8.37 respectively (both in rural and urban areas) have contributed to the observed reductions in rural poverty substantially5. According to Census 2001 estimates, about 58.5 per cent of the households live in pucca households, 78.2 per cent of the households have electricity while 33.0 per cent of the households have access to hygienic sanitation. Accessibility to protected drinking water was limited to 39.2 per cent of households. Even though pucca houses account for about sixty per cent of the households, in 27.0 per cent of the households, more than three persons are living in a single room, and this crowded housing condition may affect the health as well as the quality of life. The average number of persons per room at 2 in 1999-2000 has increased to 3 during 2004-05 which, as per National Family Health Survey indicates the housing shortage. F. CONCLUSIONS To conclude, not only is Tamil Nadu India’s most urbanized state, but importantly, has a pattern of urbanization that is relatively broad-based. In addition, the development of transport infrastructure has not only enabled the various urban centres to link up with one another, but, importantly, has helped labour mobility from the rural hinterlands to these towns. Daily commutes from nearby rural villages are an important feature of the state’s urbanscape. Further, several of the small and medium towns in the state have a vibrant economic base, with clusters of small enterprises specialising in various manufacturing segments like auto components, textiles, garments, leather, coir, poultry, etc. Although the growth and urbanization in the state have been partially accompanied by reduction in urban and rural poverty, data reveal more that the state continues to be home to large numbers of urban poor. In terms of sectoral diversification, though there has been a steady growth of the secondary and tertiary sectors, the agriculture sector continues to be sluggish and has not been able to develop appropriate linkages with the other sectors. Nevertheless, as we shall see later, the state has been one of the earliest in terms of implementing urban reforms in the country. This is particularly true in the case of reforms aimed at making the ULBs more creditworthy through reforms in accounting and introduction of a pooled fnance scheme for ULBs to borrow for infrastructure development. It is possible to surmise that the broad basing of urbanization and the presence of a sizeable number of towns with a vibrant economic base and hence with potential to generate revenue maybe a factor spurring this process.
5 http://www.hindu.com/2007/10/19/stories/2007101954681200.htm Vaidyanathan, Anand & Srinivasan, Dimensions of rural poverty in Tamil Nadu.

20
CHAPTER TWO
MAPPING INSTITUTIONAL RELATIONSHIPS BETWEEN ULBS AND THE
STATE GOVERNMENT A: INTRODUCTION: LEGAL FRAMEWORKS AND URBAN GOVERNANCE INSTITUTIONS Most of the concerns that are repeatedly encountered in relation to urban local governance in India today are those that have dogged the idea and practice of municipal government since its institutionalization as part of modern state formation in colonial times. Debates over the political autonomy of local bodies, the balance of powers between elected members and officials, the extent of managerial and functional autonomy local bodies should enjoy, and the sources and flows of finances, have marked the long history of relations between provincial (state) governments and municipal bodies, as reflected in the laws and policies governing these relations since the late 17th century. While the 74th Amendment in 1993 sought to provide a strong impetus to urban self-government across the country through framing constitutional mandates, the section below shows that many of its elements had been conceived and experimented with for over a couple of centuries. The Madras Presidency, around which the present State of Tamil Nadu has been shaped, was a key site of many of these debates and experiments in municipal self-government. A.1. Historical Overview of Legislation on Urban Local Bodies in Tamil Nadu: While various forms of local government have existed in different parts of India from early historical times, the modern legal and institutional system of municipal administration as currently exists is commonly traced back to the British period. Municipal bodies were the first institutions of rule in the colonial era to include locally elected Indian representatives. A landmark in the installation of municipal self-government was the establishment of the Madras Corporation (the oldest municipal body in the country) and a Mayor’s Court in Madras in 1688, through a charter of the East India Company (Joshi and Singh 2010). The primary purpose of this was to facilitate the collection of local taxes (ibid, Singh 2010). The Corporation was to consist of a Mayor, 12 Aldermen and 60-120 Burgesses. The Madras Corporation Charter of 1687 declared an interest in encouraging people of all nations and religious sects residing within the limits of the corporation to participate in municipal governance (RCUES). It recommended that Aldermen should be from among the heads and chiefs of all relevant castes, and that Burgesses were to be drawn from both from European and Indian residents (ibid). The Mayor was to be British, and was to be assisted by a town clerk and a recorder, who also could not be other than British. The Mayor and three Aldermen formed the Mayor’s Court. In keeping with the British system wherein judicial powers were vested in Municipal Corporations, the members of the Mayor’s Court were empowered to act as Justices of Peace. The taxes that the Madras Corporation was empowered to raise were to be used to improve roads, lighting and drainage, and to build a town hall, a jail and a school. In 1726, another charter issued by King George I established

21
a Mayor’s Court and a Corporation in the presidency towns of Calcutta and Bombay and introduced a uniformity of approach in the three towns (ibid). In 1793, a new Charter granted to the East India Company by the British Parliament gave a firmer statutory footing to municipal administration in the three Presidency towns, with the Governor General-in-Council empowered to appoint Justices of Peace to serve in the Mayor’s Court from among Company personnel or from other British inhabitants. The Justices, besides judicial duties, were required to provide for scavenging, police, and repair of street, and were authorized to assess households for payment of rates (ibid). Numerous Charter Acts and other regulations in the early decades of the nineteenth century attempted to strengthen the taxation powers of municipal bodies to raise revenue for town services, including by providing for the constitution of town committees in district towns to collect direct taxes on houses and lands. Attempts to collect direct taxes from inhabitants, however, were often resisted: a notable example is that of the unpopular Bengal Act of 1842, which was ultimately implemented only in one town, and even there, when inhabitants were called upon to pay taxes, they successfully sued the tax collector for trespass (RCUES, Joshi and Singh). Following this, the Government of India Act of 1850, which provided for the setting up of municipal bodies all over the country, shifted the municipal tax source to indirect taxes (Joshi and Singh 2010, Singh 2010). Principles of decentralized governance and local elected representation, however, had a more uneven history in the colonial era, with some legal efforts made in the 1849s in Calcutta and Bombay to introduce elected members on conservancy boards, but these efforts receiving a setback in 1856, when a parliamentary Act once more attempted to establish a uniform system of municipal administration across the three presidency towns, by creating corporate bodies consisting of three salaried nominated commissioners in each town, and vesting all municipal powers in these bodies (RCUES). Meanwhile, a Royal Army Sanitation Commission, appointed by the Government in 1863 to report on the health of the Indian Army, raised concerns about the unplanned and unsanitary condition of towns across the country, and recommended measures to ameliorate urban sanitation. The Commission’s report contributed to a series of acts passed to extend municipal administration in various provinces, e.g. the Punjab Municipalities Act, 1867, and the Madras Town Improvement Act, 1865, which put the administration of municipalities (apart from Madras City) in the hands of District Magistrates, who in turn appointed chairmen and vice chairmen for these bodies from among the public (TNIUS 2010). These municipalities acquired powers to levy property and professional taxes, vehicle tax, road tolls, and license fees; and to use the income for law and order, local judiciary and for creating and maintaining infrastructure such as roads and sanitation. The administration of Madras City was also reorganized in 1867, with the city being divided into 8 wards, each under 4 executive authorities (or commissioners) (ibid). In 1870, a Resolution on Provincial Finances issued by Viceroy and Governor General Lord Mayo’s provided a high watermark in launching decentralization in India. The resolution stated that “Local interest, supervision and care are necessary to success in the management of funds devoted to Education, Sanitation, … and Local Public Works. The operation of this

22
resolution … will afford opportunities for the development of self-government, for strengthening Municipal Institutions, and for the association of native and Europeans, to a greater extent than heretofore, in the administration of affairs” (quoted in RCUES: 9). This resolution led to new acts being passed or old acts being amended in many provinces to incorporate the elective principle in local bodies. The Madras Town Improvement Act of 1865 was amended in 1877 for district towns, and in Madras City, the elective principle was introduced through the Madras Act V of 1878, which allowed for half of the city’s 32 commissioners to be elected by taxpayers (TNIUS 2010, Joshi and Singh 2010). Bengal and Punjab also introduced elections in larger towns in 1873. Yet, the implementation of the elective principle remained incomplete and half-hearted in most municipalities, with presidents and chairmen still from amongst the officials. Lord Ripon, who took over as Governor General and Viceroy in 1880, gave the next definitive push to local self-government in India, in his famous Minute of 1882 which is regarded as the Magna Carta of Local Self-Government (RCUES, Singh 2010). The resolution envisaged institutions of local self-government as instruments of popular political education, and recommended substantial autonomy and adequate resources to be given to local bodies (Singh 2010). Ripon sought to restructure local boards, both rural and urban, to comprise a preponderance of nonofficial members, with official members comprising no more than one third of the body, and non-official members being made chairmen of the boards wherever practicable. He recommended that, where District Magistrates continued to be chairmen; they must not have, in that capacity, the right to vote in the proceedings (RCUES). Following this resolution, a committee was appointed by the government in Madras in 1882 to suggest necessary reforms, which were then legislated in the form of the District Municipalities Act of 1884. The act stipulated that each municipality should have 12 councillors, of which 8, or three-quarters of the total membership, were to be elected by rate-payers. The president was appointed by the government from among the members, and had all powers enjoyed by the present commissioners. In the same year, the Madras Local Boards Act 1884 was passed for rural areas, which established district and taluk boards, panchayat union boards and village panchayats. In 1920, this became the Madras Local Boards and Village Panchayats Act. The Royal Commission on Decentralization, appointed in 1908 to resolve internal tensions and inconsistencies in the power-sharing arrangements between central and provincial governments as well as the provincial and local self-government bodies, observed that there were enormous differences between different types of towns which were governed by municipal bodies. It recommended classifying municipalities on the basis of population, and suggested that the required enhancement of municipal revenue to meet the functions that these bodies were performing be achieved about not through increased taxation (which might diminish the popularity of these local bodies) but through budgetary subventions from the government. Many of the Commission’s recommendations were reiterated by the Montague-Chelmsford Report of 1918, which once again pointed to the “all-pervading official activity” by district and provincial government in the jurisdiction of local boards and municipalities, in the name of achieving results (Singh 2010). The Government of India Act of 1919, which

23
drew on the recommendations of both the Montague-Chelmsford Report and the Royal Commission Report, expansion local electorates and municipal franchise, giving rise to vigorous electoral politics at the municipal level in many provinces. It also gave rise to a new spate of legislation, including the Madras Municipal Corporation Act 1919 (for Madras City), and the Madras District Municipalities Act 1920 (for towns other than Madras), which are still in force today. These Acts empowered Councils to elect their own chairmen and frame their own budgets, reducing external control to a minimum, and giving all rate-payers, including women, the right to vote and to seek election (RCUES). The 1919 Government of India Act was replaced by the 1935 Act, which gave more powers to local bodies. The Constitution of Independent India which came into force in 1950 took local self-government into a new phase, with local government made a state subject, and new laws passed by different states. The Madras Village Panchayats Act of 1950 provided for the creation of village panchayats in every village or hamlet with a population of 500 and above, to be entrusted with certain obligatory civic functions and a host of discretionary functions. The launching of the nation-wide Community Development Programme in 1952 created the context for the next phase of restructuring of local bodies. The study team on Community Development and Panchayati Raj (popularly known as the Balwantrai Mehta Committee), constituted in the late fifties, recommended the establishment of a three-tier system of Panchayati raj, with the middle tier, the Panchayat Union, constituting the key level in the scheme of decentralization. The Panchayat Union’s jurisdiction corresponded with that of the Community Development Block, thus replacing the Block Development Office (BDO) with a viable unit of local self-government, and entrusted with responsibilities for a range of development programs and welfare schemes, including primary health, animal husbandry, agriculture, fisheries, village industries, social welfare, elementary education, and non-formal education. At the district level there was a Zilla Parishad, essentially an advisory body, and Village Panchayats at the lowest level. The Tamil Nadu Panchayats Act, 1958 was enacted on the basis of the Balwantrai Mehta Committee Report, paving the way for the establishment of Village Panchayats across the state, about 12,600 in all. Villages which had an urban character were classified as Town Panchayats. All Village and Town Panchayats within a block constituted a Panchayat Union; 374 such Panchayat Unions were formed. (ibid). District Development Councils were created as advisory bodies for each development district, replacing the earlier District Boards (ibid). A.1.2. Current Legal Framework Governing Urban Local Bodies The legal framework within which urban governance in Tamil Nadu was located prior to the passing of the 74th Amendment, as shown in the above account, comprised a plethora of laws, revealing the distinct histories of Madras City, other municipalities of the state, and the large number of smaller towns. The Corporation of Chennai has been governed from 1919 to this day by the Madras Municipal Corporation Act, 1919, now known as the Chennai City Municipal Corporation Act. Two other municipal corporations were formed in the 70s and 80s, each with their own acts closely modeled on the Madras Municipal Corporation Act: Madurai (the Madurai City Municipal Corporation Act 1971), Coimbatore (the Coimbatore

24
City Municipal Corporation Act, 1981). In 1994, as the conformity legislation for the 74th Amendment was being passed in Tamil Nadu, 3 more corporations were formed: Tirunelveli, Tiruchirappalli, and Salem, each with their own acts. Aside from the corporations, larger towns and cities in Tamil Nadu have remained under the jurisdiction of the District Mnicipalities Act 1920 until the present. Until quite recently, however, the governance of smaller towns evolved within a legal framework shared with villages and distinct from that governing municipalities, viz, the Tamil Nadu Panchayats Act, 1958. However, by the end of 1970s, local bodies in many (though not all) parts of the country were superseded for various reasons, among them the Emergency. In 1968, the Tamil Nadu government, which had been periodically holding elections to local bodies, extended the term of the elected bodies to 1975. With the Emergency in 1975, local bodies in the state were dissolved and placed under Special Officers. In 1986, after a gap of almost 18 years, Chief Minister MG Ramachandran attempted to revive elections to local bodies, but these were dissolved again in 1989 when the DMK took power. When the next elections were due in 1991, they were not conducted. (Second State Finance Commission). Thus, by the early 1990s, the long, if uneven, tradition of urban self-governance in Tamil Nadu was in a dormant phase. After the passing of the 73rd and 74th Constitutional Amendments at the national level in 1992, fresh laws were not passed in conformity in Tamil Nadu. Instead, the Tamil Nadu Panchayats Act of 1958 was amended in 1994 to constitute the conformity legislation for the 73rd Amendment, dealing only with rural areas, while Town Panchayats were redesignated as Urban Local Bodies and brought under the purview of the Tamil Nadu District Municipalities Act, 1920 as transitional areas from rural to urban. Amendments were made to the District Municipalities Act to bring it into conformity with the 74th Amendment, with a separate chapter on Town Panchayats inserted into the Act, and the Directorate of Town Panchayats brought under the administrative control of the Municipal Administration and Water Supply Department (MAWS) at the Secretariat. In addition to the various Acts governing ULBs in the state, there is another series of Acts that govern specific functions of urban governance. Many of these Acts, passed in the 1970s, provided for the creation of paratatal bodies at the state level to deliver services and/or take responsibility for municipal functions such as water and sanitation (e.g. the Tamil Nadu Water and Drainage Act 1971 and the Chennai Metropolitan Water Supply and Drainage Act 1977), housing and slum improvement (e.g. the Tamil Nadu Housing Board Act 1961, and the Tamil Nadu Slum Clearance Act, 1971), and urban planning and land-use regulation (the Town and Country Planning Act, 1971). The Town and Country Planning Act, 1971, replaced the Madras Town Planning (MTP) Act, 1920, which had applied only to urban areas. The new act covered an extended jurisdiction of rural as well as urban areas across the state. It provides for the notification of areas, constitution of planning and development authorities like the Chennai Metropolitan Development Authority (CMDA, see below), preparation and implementation of Master

25
Plans and Detailed Development Plan and enforcement of Development Control Regulations. While the MTP Act made urban local bodies responsible for the preparation and implementation of Town Planning Schemes (TPS), and for enforcing their regulations, the TCP Act took away planning functions from local bodies and entrusted them to specialized planning authorities such as the CMDA, Local Planning Authorities (LPAs) and New Town Development Authorities (Subramaniam, K.P. 2007). Given the existence of such a large number of acts, the government of Tamil Nadu under the DMK regime drafted a single comprehensive legislation, the Tamil Nadu Urban Local Bodies Act in 1998, to bring all ULBs, including corporations and townships under a single framework, and to enhance the functional autonomy of ULBs. Rules were framed in 2000. However, before the Act could be implemented, it was withdrawn due to reservations expressed by the ULBs. The Act stands suspended at the current moment. A.2. State Institutions involved in urban services and local government Urban affairs in the state of Tamil Nadu are currently governed by the Department of Municipal Administration and Water Supply (MAWS). The department was formed in 1984, after bifurcation from the Rural Development and Local Administration Department of the Government of Tamil Nadu (GOTN). The department is headed by the Minister for Local Administration, and is responsible for the governance of Urban Local Bodies across the state and for the provision of drinking water in rural as well as urban areas. Administratively, the Department is headed by the Secretary to the Government of Tamil Nadu, a senior IAS officer, who advises the Minister for Local Administration. She/he is assisted by one Special Secretary, one Joint Secretary, two Deputy Secretaries and eight Under Secretaries. The various units that comprise the department are shown below:

26
Fig.1: Components of the Municipal Administration & Water Supply Dept., TN
Components of MAWS
The Directorate of Town Panchayats (DTP): Until 1996, as described in the history section above, Town Panchayats (TPs) in Tamil Nadu were categorized as rural entities, and came under the administrative control of Directorate of Rural Development. In 1981, the Government (vide G.O. Ms. 828 dated 7.5.1981) constituted a separate Directorate of Town Panchayats (DTP), which remained under the Rural Development Department as TPs were still governed, along with Village Panchayats, by the Tamil Nadu Panchayats Act 1958.
Following the redesignation of TPs as urban local bodies (ULBs) after the 74th Amendment and their transfer to the legal jurisdiction of the District Municipalities Act 1920, the Directorate of Town Panchayats was brought under the Department of MAWS in 1996. The DTP is headed by a Director, who is also the Inspector of Town Panchayats, and is assisted by 16 Assistant Directors of Town Panchayats based in 16 zonal offices all over the state. However, in Tamil Nadu, District Collectors of the respective districts are “entrusted with the responsibility of supervising the affairs of these local bodies” (p. 190 Policy Note 2010-2011)
The Directorate of Municipal Administration (DMA): The DMA is responsible for the functioning of the nine municipal corporations and 148 municipalities in the state. He/she is assisted by a Joint Commissioner of Municipal Administration, a Joint Commissioner (Admn), and two Additional Directors stationed at the Secretariat. In addition, there are seven Regional Directors of Municipal Administration
Department of Municipal Administration and Water Supply, Government of Tamil Nadu
Directorate of Municipal Administration (DMA)
Directorate of Town Panchayats
Corporation of Chennai
Chennai Metropolitan Water Supply and Sewerage Board (CMWSSB)
Tamil Nadu Watter and Drainage Board (TWAD) Tamil Nadu
Urban Finance and Infrastructure Development Corporation (TUFIDCO)
Tamil Nadu Urban Infrastructure Financial Services Limited (TNUIFSL)
New Tiruppur Area Development Corporation Limited (NTADCL)

27
(RDMAs) distributed across the state, who have been delegated administrative and financial powers to govern the municipalities in their respective regions.6 Corporation of Chennai The Corporation of Chennai is the oldest municipal institution in the country, established on 29th September 1688. It is currently governed by the Madras Municipal Corporation Act, 1919, and administered directly by the MAWS department of the Tamil Nadu. Government. It comprises a council with 155 ward councilors in 10 zones, a Mayor-in-Council, and six Standing Committees, besides an Appointments Committee and one Ward Committee for each Zone. The Tamil Nadu Urban Finance and Infrastructure Development Corporation Limited (TUFIDCO) TUFIDCO was established in 1990 under the Companies Act, 1956, as a specialized agency to assist ULBs with financial and technical inputs for infrastructure projects. TUFIDCO is an undertaking of the Government of Tamil Nadu, and has been functioning primarily as a nodal agency for schemes sponsored by the Government of India, such as the Low Cost Sanitation Scheme and the Nehru Rozgar Yojana, the Mega Cities Project and the Infrastructure Development Schemes for Small and Medium Towns (IDSSMT), and now (since 2005), functions as the nodal agency for the JNNURM in Tamil Nadu. The Tamil Nadu Urban Infrastructure Financial Services Ltd (TNUIFSL) TNUIFSL is a financial intermediary that channels funds from capital markets to urban local bodies. It functions as the fund manager for the Tamil Nadu Urban Development Fund (TNUDF), a Trust established in 1996 (under The Indian Trust Act 1882) to finance urban infrastructure in the state of Tamilnadu primarily by attracting private capital into urban infrastructure and by facilitating better performing ULBs to access capital markets for long-terms loans on a no-guarantee basis. TNUDF is an offshoot of the World Bank-funded Tamil Nadu Urban Development Program (TNUDP) and is structured as a public-private partnership between the Government of Tamil Nadu and three private financial institutions, namely ICICI Bank Limited, Housing Development Finance Corporation Limited (HDFC), and Infrastructure Leasing and Financial Services Limited (IL&FS). It currently operates three lines of credit, from the World Bank, Japan International Cooperation Agency (JICA) and KfW of Germany. The TNUDF launched the TNUDP III in 2005, for a period of five years, with the objective of strengthening its role as a financial intermediary for ULBs, strengthening urban reforms and consolidating the achievements of TNUDP-II in institutional strengthening and capacity building. Tamil Nadu Water Supply and Drainage Board (TWAD) TWAD was established in 1971 to provide protected water and drainage facilities to urban and rural areas across the state. It comprises four regional headquarters, at Vellore, Coimbatore, Madurai and Tanjavur, with a Head Office at Chennai. TWAD is responsible for planning and implementing water supply projects for ULBs under various schemes including the UIDSSMT. 6 The RDMAs are stationed at Chengalpattu, Vellore, Salem, Thanjavur, Tiruppur, Madurai and Tirunelveli.

28
Chennai Metropolitan Water Supply and Drainage Board ( CMWSSB) CMWSSB was formed in 1978 to promote the planned development of water and sewerage facilities and maintain water and sewerage systems for the Chennai Metropolitan Area. It focuses its attention on Chennai city, but also provides water to 12 municipalities, 5 town panchayats and 3 village panchayats adjacent to the city. The CMWSSB is an autonomous board that reports directly to the state government rather than to the Chennai Municipal Corporation, despite the fact that water supply is marked as a function of local bodies under the 74th Amendment. New Tiruppur Area Development Corporation Limited (NTADC) The NTADC is a Special Purpose Vehicle set up in 2000 to implement a 185 mld water supply project, in public-private partnership mode, mainly for the knitting industries in and around the town of Tiruppur, but also to supplement domestic drinking water supplies in Tiruppur. Other institutions of urban governance In addition to the administrative and financial roles performed by the bodies that constitute the MAWS department, as described above, there are other institutions that play a role in urban planning, regulation, and development on behalf of ULBs. While the 74th Amendment in 1993 recommended that planning be handed over as one of the functions of ULBs, the legacy of the Town Planning Act of 1971 has remained strong in the state, in the form of specialized parastatal Metropolitan Development Authorities, like the Chennai Metropolitan Development Authority and the Directorate of Town Planning, that have kept planning functions in the hands of bureaucrats and expert planners accountable to the state government. The Chennai Metropolitan Development Authority (CMDA) The CMDA was established in 1972 and acquired statutory standing in 1974 under the Tamil Nadu Town and Country Planning Act 1971. Its functions are to prepare Master Plans, Detailed Development Plans, and New Town Development Plans for the spatial development of the Chennai Metropolitan planning Area, to formulate and implement specific spatial development projects envisaged in the plans, and to regulate developmental activity in accordance with the rules. The CMDA has, since the 1970s, carried out all the planning and development functions that were supposed to be devolved to local bodies. It published the first master plan in 1975, and the second in 2008. In recent years, the CMDA has gradually delegated some limited powers to local bodies, as discussed in section D below. Directorate of Town and Country Planning (DTCP) The DTCP was established in 1972 under the provisions of the Town and Country Planning Act, 1971, and has performed the role of producing master plans and detailed development plans, issuing building permits and licenses, and enforcing land-use and building regulations in all local bodies across the state. Tamil Nadu Housing Board (TNHB) The TNHB is a parastatal body created in 1961 as a successor to the City Improvement Trust, and constituted by the Tamil Nadu Housing Board Act, 1961. Its role is to provide affordable

29
housing for various categories of the population in tune with their economic status, to developing house sites and plots across the state, and to create satellite towns and developments with the required infrastructure (such as roads, water, sanitation, etc) in appropriate areas. The 7 members of TNHB’s Board of Directors are all officials from state departments concerned with housing, urban planning and finance, plus the commissioner of the Chennai Corporation. The agency has its secretariat office in Chennai and divisional/unit offices all over the state. Its work has focused largely on Chennai and on larger District Headquarters of Tamil Nadu. TNHB was appointed as nodal agency for the central government’s Interest Subsidy Scheme for Housing the Urban Poor (ISHUP). The Tamil Nadu Slum Clearance Board (TNSCB) The Tamil Nadu Slum Clearance Board was established in 1970 under the Tamil Nadu Slum (Improvement and Clearance) Act 1971, to undertake notification of slums as well as improvement, resettlement and rehabilitation of slum dwellers. Its major objective was to improve slum areas through providing tenements and dwelling units for slum dwellers along with the necessary infrastructure (water, electricity, roads and sanitation). From the late 1970s, TNSCB implemented large World Bank-funded projects, the Madras Urban Development Projects (MUDP) I and II, which built up the autonomy and professionalism of the agency, and shifted its emphasis from in-situ tenement construction toward environmental improvement and sites and services. In recent times, however, the TNSCB has moved back to becoming a construction agency, as it has come to focus again on mass eviction and resettlement of slums in the urban peripheries, with the objective of creating slum-free cities in the state by 2020. TNSCB presently utilizes the grants from central government and state governments under the JnNURM-BSUP and IHSDP missions as well as availing grants and loans from central government as well as international funding agencies for other projects. The above mapping of the institutional landscape of urban governance in Tamil Nadu reveals three key facets of the character of municipal administration in the state:
i) The multiplicity of agencies performing sectorally specialized functions – e.g. water supply, housing, planning, etc. – points to a problem of functional fragmentation. The lack of coordination among these different agencies has been identified as one of the major hurdles in effective and responsive governance, even in strong ULBs like the Chennai Corporation.
ii) Linked to this is the issue of the superior powers and authority of state-level service bureaucracies over municipal bodies. Parastatals like CMDA, CMWSSB, TNSCB and TWAD, carryovers from the 1970s World Bank-led era of corporatisation of municipal governance (again, particularly in Chennai) contribute to the above problem of functional fragmentation, to create a significant hurdle in the way of effective devolution of functions to ULBs in the spirit of the 74th Amendment.
iii) The central positioning of financing agencies in public-private partnership mode (TNUIFSL, NTADC, etc) within the department of municipal administration suggests TN’s institutionalized commitment to PPPs and private financing of municipal infrastructure.

30
A.3. Numbers and classification of urban local bodies in the state The declaration and classification of urban local bodies in Tamil Nadu has been a dynamic and uneven process, as will be elaborated under section B below. By early 2011, there were 3 types of urban local bodies in the state: Town Panchayats (561 in mumber), Municipalities (148), and City Corporations (10). Town Panchayats are classified into special, selection, first and second grade based on their annual income. According to the 2001 census, 12% of the state’s population and 28% of the state’s urban population live in these towns. The numbers of TPs in each grade are shown below: Table 1: Town Panchayats in TN– numbers and classification Grades No. of TPs Income Criteria Special Grade 13 Above 20 lakh Selection Grade 245 Above 16 lakh Grade I 221 Above 8 lakh Grade II 82 Above 4 lakh Total 561 Municipalities are classified into grades based on their annual income and population. The distribution of various grades of municipalities is as follows: Table 2: Municipalities in TN: numbers and classification Grades No. of municipalities Special Grade 20 Selection Grade 29 First Grade 29 Second Grade 21 Third Grade 49 TOTAL 148 Source: Policy Note, MAWS, 2010-11. There are 10 Municipal Corporations in the state: Chennai (formed in 1678) Madurai (in 1971), Coimbatore (1981), Tiruchirapalli (1994), Tirunelveli (1994), Salem (2006), Erode (2009), Vellore (2009), Thootukudi (2010) and Tiruppur (2010). Current plans to expand the boundaries of the Chennai City Corporation as well as other Corporations in the state will once again change the numbers and classification of ULBs in the state. The classification of ULBs, whether into municipalities versus town panchayats, or into different grades of municipality or town panchayat, or indeed, the upgrading of municipalities into city corporations, has remained a dynamic and contested process in Tamil Nadu for over two decades. Some of these debates and dynamics, which reveal the meanings and significance of the classification for various stakeholders, are discussed in section B.2. below

31
B. CONSTITUTION OF ULBS
B.1. Declaration of Urban Areas prior to 74th CAA As described above, the administration of towns in Tamil Nadu remained under a legal and institutional frameworks shared with villages until the mid 1990s, suggesting that the character of urbanization in the state was that of a continuum rather than a break between rural and urban. Declaration and Expansion of Town Panchayats Under the District Local Boards Act of 1920, a population of 500 was enough to identify a village, but villages were classified into Major and Minor based on population and annual income. In the Madras Village Panchayats Act 1950, panchayats were classified as Class I and Class II. These classifications were carried over into the town/village distinction under the Tamil Nadu Panchayats Act of 1958, where Panchayats with a population of 5000 and annual income of Rs. 10,000 could be declared as Town Panchayats. According to Section 3 of Act, “the Inspector may, by notification, classify and declare every local area possessing urban characteristics and comprising a revenue village or villages or any portion of a revenue village or contiguous portions of two or more revenue villages, and having a population estimated at not less than five thousand and an annual income estimated at not less than ten thousand rupees as a panchayat town…”. The Inspector (the Director of Town Panchayats) could also merge contiguous areas, change the names or boundaries of notified towns or villages after giving the affected bodies a “reasonable opportunity for showing cause against the proposal” and after considering these objections, if any. Any taxpayer or inhabitant could also appeal against a notification to the Government within a specified period. Revenue villages with not less than 500 population could be notified as panchayat villages. Town Panchayats were then classified into Grade II, Grade I and Selection Grade depending on income levels, of Rs. 10,000, Rs. 40,000 and Rs. 1,00,000 respectively. The Act also provided (under Section 7) for the formation of panchayat unions (by government notification), each of which would represent a development block under the National Extension Service Scheme of the Community Development program. Section 4 of the TN Panchayats Act 1958 also provided for the declaration of townships by the government: any village, town or part thereof could be declared a township if it was an industrial or labor colony or a health resort, and could constitute a township committee, and vest in it the functions and powers that were vested in panchayats. By the 1970s there were 16 townships in the state, with township committees comprised mostly of official members and 1-2 non-official members. District Collectors were the chairpersons of these committees. All townships were abolished by the 1990s. Section 5 of the Act provided for the government to notify any panchayat town with a population of not less than 20,000, and annual income of not less than 1 lakh as a municipality. It also allowed the government to declare a town panchayat as a municipality on the request of the panchayat, if it had a population less than 20,000 but income exceeding

32
1 lakh. In the case of such a changed classification, the Act declared that all members holding office in the panchayat would be deemed to be elected members of the municipal council, and required that all the provision of the District Municipalities Act be made applicable to the newly formed municipality. Municipalities The creation of a municipality, according to the TN District Municipalities Act 1920, was simply a matter of notification by the government. Under Section 4 of the Act, “The State Government may by notification declare their intention to constitute as a municipality any town, village, hamlet, bazaar, station or any other local area or any group of the same in the immediate neighborhood of one another, or to exclude from a municipality any local area comprised therein…, or to include within a municipality any local area in the vicinity thereof… “ except for cantonment areas. Any local inhabitant or tax payer can submit a written objection to such a proposal to the state government within six weeks of the publication of the notification, and the government is obliged to take all such objections into consideration. However, worth noting is the fact that no criteria – either of population, income or urban characteristics -- are specified in law for the declaration of a municipality.
The Act also provided for the declaration of a township by passage of a motion in both Houses of the Legislature. Here, the criterion is if the municipality, or any part of it is “an industrial, labour or institutional colony or a health resort”. The Explanation provided in the Act spells this out to mean “any area wherein the majority of inhabitants are engaged in any industry or are labourers or are connected with any institution in the area in any manner whatsoever”
Municipal Corporations Neither the Madras City Municipal Corporation Act nor any of the other Municipal Corporation Acts modeled on it specify any criteria for constitution of a municipal corporation. The declaration of a Corporation has thus remained at the discretion of state governments. Recent bodies such as the State Finance Commissions have sought to establish broad norms for the declaration of Corporations; these will be discussed below.
B.2. Declaration, Reclassification and Extension of Urban Local Bodies Following the 74th Amendment and Beyond.
Since the 1990s, ULBs in Tamil Nadu have undergone relatively rapid and frequent changes in classification, jurisdiction and governance, partly as a consequence of the dynamism of the urbanization process, but more importantly, as a reflection of shifts in state-level political regimes, and their respective visions of, and relationships with urban local bodies. Town Panchayats The category of town panchayats (TPs) in particular has undergone several changes over the last decade and a half in TN. Tamil Nadu is the first State in the country to have introduced (in 1958) the category of Town Panchayats, as transitional bodies between rural and urban

33
local bodies; this category was only recently introduced in other states. Over several decades, several committees and commissions have examined the necessity and desirability of maintaining the category of TPs, given their anomalous position of being neither in the fiscally strong position of municipalities, nor being able to access grants earmarked for rural bodies. In 1990, a committee set up to review the finances of local bodies in TN7 commented that the existing classification of Panchayat Villages and Panchayat Towns emerged as problematic in terms of the viability of local government units and in efforts to reduce the fragmentation of local areas,. The Committee remarked that this classification was, according to the law, supposed to be based on the existence of urban characteristics along with population and income criteria, but in practice, was carried out entirely on the latter two considerations. The towns thus classified, although in many cases resembling villages in their economic and infrastructural criteria, became ineligible for grant assistance from the Central Government under Poverty Alleviation and other schemes especially targeted at rural bodies. The Committee remarked that with the formation of a separate Directorate for Town Panchayats, representatives of these bodies appeared to be eager to exit from Panchayat Unions and demand a separate organizational structure, under the claim that they were more like miniature municipalities than village panchayats. Yet they also demanded benefits that accrued to village panchayats. “While there is such cry (sic) for a separate entity, the condition of the Town Panchayats reveal that many do not have adequate financial resources and most of them are no better than Village Panchayats” (p.18). The Committee therefore recommended much higher income norms (Rs. 3 lakh to 10 lakh) for upgrading village panchayats, and removing the term “towns” from the nomenclature to remove the assumption of urban nature – instead to revert to the terminology of Major and Minor, using grades to further mark categores, e.g. Grade II Major Panchayat, Special Grade Panchayat. While these recommendations of the Committee were not adopted at the time, the fluidity of the categories town and village was maintained for pragmatic reasons until well into the decade of the 2000s, as will be shown below. The adoption of the 74th Constitution Amendment in Tamil Nadu in 1994 resulted in town panchayats being brought under the Tamil Nadu District Municipalities Act,1920 (Tamil Nadu Act V of 1920). Accordingly, Section 3-B of the Act stated, "The Governor may, having regard to the revenue generated for local administration, the percentage of employment in non-agricultural activities, the economic importance or such other factor as he deems fit by notification, classify and declare every local area comprising a revenue village or villages or any portion of a revenue village or contiguous portion of two or more revenue villages and having a population estimated at not less than five thousand and an annual income of not less than one lakh rupees as a Panchayat Town for the purposes of this Act". The Act also allows the Governor to, by notification, add contiguous areas to the town, exclude areas from the town to form a new panchayat, or merge the town or parts of it with another contiguous town, subject to the population and income criteria specified above. He/she can also cancel or modify a notification declaring the constitution of a town. To carry out these changes, the Governor is obliged to allow the town panchayat in question 7 “Report of the Expert Committee on the Financial Position of the Panchayats and Panchayat Union Councils in Tamil Nadu, 1990.” Committee Chair: A.R. Damodaran.

34
“reasonable opportunity for showing cause against the proposal” and to consider explanations and objections if any. Residents of the town are entitled to appeal against notifications in the High Court.
The total number of TPs in Tamil Nadu in 1996 was 636. This got reduced to 611 following the downgradation of 25 Town Panchayats into Village Panchayats in 1998, on the basis of recommendations of the First State Finance Commission (FSFC).8 However, the Second SFCin 2001 also found that, in comparison with other states, the number of TPs in Tamil Nadu was unjustifiably high (611, compared with 447 in UP, 280 in MP and none in Karnataka, Andhra Pradesh or Maharashtra), and that this “surfeit” had placed them in a disadvantageous position. The SSFC found that 400 of the 611 TPs were rural in character, but to avoid taking too drastic a stand, it proposed to re-examine only the viability of Grades II and I TPs (the lowest grades), using the following criteria to establish their non-viability as TPs:
i) operating ratios (ratio of revenue expenditure to revenue income) more than 1; ii) per capita income less than Rs.200; iii) population less than 10,000; iv) rural characteristics
The SSFC identified 26 TPs to be merged with other TPs, and another 178 that met the above criteria and were therefore recommended for downgrading to Village Panchayats or merging with nearby municipalities. It also identified 18 Village Panchayats in the Chennai Metro Area which were census towns, and recommended upgrading these to TPs or merging them with nearby ULBs to tap their tax potential. It recommended the following revision of norms for classifying TPs:
Table 3: Second SFC Norms for Classifying Town Panchayats Town Panchayat Grades Norms Grade II Annual income above 30 lakh but below 40 lakh Grade I Above 40 lakh but below 60 lakh Selection Grade Above 60 lakh but below 1 crore Special Grade Above 1 crore but below 2 crore.
The SSFC warned that reclassification along these lines should be completed before the 2001 local body elections and before the 2001 Census Report. However, the Government did not act on the report till 2004 (TSFC report, 2006).
In 2004, the state government under the AIADMK regime, still in the grip of the severe financial crunch that it had inherited when it came to power in 2001, moved to downgrade 568 out of the 611 TPs, in one stroke, to Village Panchayats. This was done with the explicit purpose of attracting greater central government funding for these local bodies. The Order claimed that, “Since most of the town panchayats are financially weak, and rural in character,
8 The FSFC recommended reclassification of 98 Town Panchayats as Village Panchayats but 25 alone opted for downgradation.
35
the Government considered that the town panchayats having a population of less than 30,000 may be reclassified as village panchayats so as to enable them to receive more funds from the Government of India and State Government under various grants and assistance.” As required by the law, the chairpersons of these TPs were asked to obtain resolutions showing cause why such a reclassification should not be carried out. The Director of Town Panchayats (DTP) reported that of the responses received from the 568 town panchayats, 182 agreed to undergo reclassification, 358 town panchayats opposed it, and 27 resolved to get upgraded to municipalities. According to the DTP’s letter to the government, those in opposition had given reasons that (i) their administrative set-up as town panchayats was essential for them to fulfil their roles and attend to public needs and (ii) revenues from tax and other sources may decline. However, the DTP, on the grounds that the opposing panchayats had the same characteristics as those that accepted, recommended to the government that all the 568 town panchayats be reclassified as village panchayats.
The government, accordingly, passed an order in June 2004 (G.O.(Ms) No: 270 MAWS, dated 11.6.2004) which argued that, since the elected membership as well as staff would carry over from the town panchayats to the newly constituted village panchyats, and that the levy of house taxes and many other sources of revenue would continue under the provisions of the Tamil Nadu Panchayats Act,1994, “therefore the contention of the TPs which are opposing their reclassification are not acceptable. The Government, have, therefore decided to overrule the objections raised in the resolutions of the town panchayats.”
Excluding two TPs that filed writ petitions in court against the proposed reclassification, 566 town panchayats were thus designated as Special Village Panchayats as per section 6 (4) of the Tamil Nadu Panchayats Act, 1994. The four remaining TPs with a population of over 30,000 were redesignated as Third Grade Municipalities by amendments to the Tamil Nadu District Municipalities Act, 1920. By 2006, the state had 561 Special Village Panchayats (SVPs), with 50 SVPs having become Grade III Municipalities. Through an Ordinance (the TN District Municipalities (Amendment) Ordinance: Ordinance No. 7 of 2004), the categories of Town Panchayats and Panchayat Towns were eliminated, and replaced by “Third Grade Municipalities” and “transitional areas”.
The Third State Finance Commission (TSFC), constituted under the DMK regime, in its Report submitted in 2006, was extremely critical of the downgrading of TPs to SVPs, commenting that this contravened the Constitutional mandate (under the 74th Amendment) to create Nagar Panchayats or Transitional bodies in each State. It also noted that the stated aim of this move, which was to enable access to central funds for rural development, had not borne fruit for various reasons, while the reclassification denied these bodies assistance from schemes intended for urban areas, like the National Slum Development Programme and Swarna Jayanthi Shahari Rozgar Yojana Schemes. Despite assurances that funds from these schemes would continue to the Special Village Panchayats, this did not happen.
The TSFC also recommended that all 111 census towns in the state be classified as urban to avoid differences in classification between Census and the State Act; that the 4-grade classification of Town Panchayats be brought down to 3 by upgrading all Grade II TPs to

36
Grade I; and that the Government should periodically examine reclassification of Village Panchayat to Town Panchayats, particularly around major urban centres.
In July 2006, the reclassification carried out in 2004 was reversed by the state government under the DMK. The government order (GO No.55, MAWS, dated 14.07.2006) claimed that representations had been received about practical difficulties being faced by the Special Village Panchayats under the new set-up, with requests for reclassification as Town Panchayats. District Collectors were requested to issue notice and obtain council resolution from these Special Village Panchayats as to whether they wished to revert to the status of erstwhile Town Panchayats under Tamil Nadu District Municipalities Act, 1920, or to be treated as (ordinary) village Panchayats under Sec.4(1) (a) of the Tamil Nadu Panchayats Act, 1994. The responses were as follows, (as reported by the Director of Special Village Panchayats)
Sl.No. Details of Resolution passed by Special Village Panchayats
Number of Special Village Panchayats
1 To become Town Panchayats 506 2 To remain as special village panchayats 17 3 To become Municipalities 02 4 To leave the decision to Government 07 5 To become village panchayats 11 6 Did not conduct meeting and pass resolution 18 TOTAL 561
The order went on to explain that “The Special Village Panchayats were informed that they could choose only between becoming Town Panchayats or (ordinary) Village Panchayats and that if they failed to pass any resolution, it will be construed that they have no objection to being reclassified as Town Panchayats. Out of the 561 Special Village Panchayats, 26 Special Village Panchayats have passed resolutions which are not in accordance with the above option… Therefore, the said 26 Special Village Panchayats and the 18 Special Village Panchayats which did not pass any resolution are deemed to have opted to become Town Panchayats. Thus, 550 out of the 561 Special Village Panchayats have opted or deemed to have opted to become Town panchayats. The remaining 11 have opted to become (ordinary) Village Panchayats. … The Government, after considering the views of the various Special Village Panchayats, have decided that all the 561 Special Village Panchayats be reconstituted as Town Panchayats…” Following this reclassification, a new chapter was inserted in the Tamil Nadu District Municipalities Act, 1920 by an ordinance (the Tamil Nadu Municipal Laws (Amendment) Ordinance, 2006) specifically to govern the Town Panchayats reconstituted from the Special Village Panchayats.
According to local politicians and municipal officials, these shifts in classification amounted to little more than changes in nomenclature, as they did not carry much significance on the ground, either for the local body or for its inhabitants, apart from a small reduction in staffing for village panchayats in comparison to town panchayats. One municipal chairperson claimed in an interview that these shifts were simply a case of “cheap politics” of inter-regime competition being played out on local bodies. It appears, then, that exercises of classification and grading of local bodies, despite the elaborate procedural protocols

37
established and invoked, are instances of the arbitrary application of state dominance over municipal bodies in Tamil Nadu.
Municipalities In the absence of specific numerical norms for constitution or classification of municipalities in Tamil Nadu District Municipalities Act 1920, such norms were specified by orders periodically issued by the Government. In 1996, the First State Finance Commission recommended norms for the constitution/classification of Municipalities as follows: Norms for Constitution: 1. Should be urban in character; should satisfy the census norms for population density and 75% of male working force being engaged in non-agricultural activities; 2. Minimum population of 30,000 and; 3. An average annual income (based on preceding three years) exceeding Rs.50 lakhs excluding non-statutory and development grants, loans and lapsed deposits. It also recommended a system of classifying municipalities, as follows: Table 4- First SFC Norms for Classification of Municipalities: Grade Norms (Average Annual income of
municipality based on last 3 years) II Exceeding Rs.50 lakhs I Exceeding Rs.100 lakhs Selection Exceeding Rs.200 lakhs Special Exceeding Rs.500 lakhs These norms were accepted by the government in 1997 (vide GO.Ms.No.311/MAWS dated 26.12.97), and in 1998 orders were issued notifying the list of municipalities accordingly upgraded (GO.Ms.No.85/MAWS, dated 22.5.98). The government also empowered the Commissioner of Municipal Administration to reclassify municipalities once in three years adopting the above norms. Following this, the Tamil Nadu Urban Local Bodies Act 1998 (currently held in abeyance) prescribed a modified set of norms for the constitution and classification of Municipalities, as follows: Table 5: Norms for Classifying Muncipalities: TN Local Bodies Act 1998. Grades Norms Grade II Population not less than 30,000 and annual income of not
less than Rs.50 lakh Grade I Rs. 4 crore and above but below Rs.6 crores Selection Grade Rs. 6 crore and above but below Rs.10 crores Special Grade Rs.10 crore and above In 2001, the Second State Finance Commission recommended a further change in the norms as follows:

38
Table 6: Second SFC Norms for Classifying Municipalities Grades Norms For upgrading from Town Panchayat to Grade III Municipality
Minimum population of 30,000 and minimum average annual income for past 3 consecutive years of Rs. 2 crores
Grade II Rs.2 crores and above but below Rs.4 crores Grade I Above Rs.4 crores but below Rs.6 crores Selection Grade Above Rs.6 crores but below Rs.10 crores Special Grade Above Rs.10 crores but below Rs.50 crores CORPORATIONS Income above Rs.50 crores with minimum
population of 5 lakhs Based on these norms, it recommended that 11 Municipalities be downgraded as Town Panchayats, and two TPs be upgraded to Grade II Municipalities. The approach of the SSFC was that “Retaining large number of non-viable local bodies would only keep up (a) sense of grievance of inadequate devolution, (but) is not conducive to good Government-Local Bodies relation, when in effect there is increasing flow of resources from the State over the years.” No specific orders, however, were issued to institutionalize these norms. In 2006, when the Third Finance Committee (TSFC) submitted its report, there were six City Municipal Corporations, 102 Municipalities and 50 Third Grade Municipalities in the State. The TSFC, in addition to criticizing the elimination of TPs by the previous regime of the state government as mentioned above, also attacked the creation of the category of Grade III Municipalities, arguing that this grading was confusing as it was based primarily on population norms (of over 30,000 population) where income had hitherto been the major criterion. This, according to the TSFC findings, resulted in overlaps and anomalies, with several Grade II Municipalities having lower incomes and lower populations than the newly constituted Grade III bodies. The TSFC pushed for reducing the number of grades for municipalities to a total of 3, citing the recommendations of the Model Municipal Law circulated by the Government of India, as well as the suspended Tamil Nadu Urban Local Bodies Act, 1998, both of which identified three grades for municipalities. However the former uses a population criterion as shown below, and the latter an income criterion as shown in the two tables below. Table 7: Classification of Municipalities suggested by the Model Municipal Law, GOI. Classes of Municipalities Criteria Class 'A' Municipal area Population above 1.5 lakhs but below 3 lakhs Class 'B' Municipal area Population above 75000 but below 1.5 lakhs Class 'C' Municipal area Population above 25000 but below, 75000. Table 8 : Classification of Municipalities suggested by the Tamil Nadu Urban Local Bodies Act, 1998 Grades of Municipalities Criteria Special Grade Income above Rs.10 crores Selection Grade Income above Rs.6 crores but below Rs.10 crores

39
Grade-I Income above Rs.4 crores but below Rs.6 crores The TSFC noted that Tamil Nadu had many municipalities with small population but high incomes and many with large population but low income, and recommended that income alone be established as the criterion for classifying municipalities. It outlines the following scheme of classification to be used, and recommended that existing municipalities with income below 1 crore be reclassified as Town Panchayats. Table 9: Classification of Municipalities recommended by the Third SFC
Grade II Above Rs.1 crore but below Rs.4 crores Grade I Above Rs.4 crores but below Rs.6 crores Selection Grade Above Rs.6 crores
Thus, while the state has veered between population and income as the criterion for declaring and classifying municipalities, it has tended to favor the income criterion for grading municipalities. An official of the DMA explained that this was because the income criterion assisted the state in determining the municipality’s eligibility for higher levels of infrastructure investment. Higher grades of municipalities also enjoyed greater sanctioning powers for works compared to lower grades. This highlights the focus on financial strength as a key parameter of municipal governance in Tamil Nadu. Municipal Corporations: By 1996, when the 74th Amendment was implemented in Tamil Nadu, there were six Municipal Corporations (henceforth MCs) in the state. Chennai, Madurai, Coimbatore, Salem, Tiruchirapalli and Tirunelveli. When the First State Finance Commission (FSFC) submitted its report in 1996, they noted that the population of these MCs ranged from 3.5 to 60 lakh according to the 1991 census. The FSFC recommended adopting a norm of a minimum population of 10 lakh and income of 50 crore for declaration of a Municipal Corporation or for upgrading a Municipality to a Corporation. The suspended TN Urban Local Bodies Act, 1998 prescribed a minimum of 5 lakhs for constitution of a Municipal Corporation. The GOI’s Model Municipal Law prescribed 3 lakhs as the minimum population for larger urban areas (Municipal Corporations). In 2001, the Second Finance Commission recommended strengthening the tax potential of the Madurai MC, which was considered a weak corporation, by extending its boundaries to incorporate 6 Town Panchayats and Village Panchayats in the contiguous areas. The Third Finance Commission (TSFC) similarly found, in 2006, that, in order to tap the tax potential of MCs, “it is necessary to devise guidelines for extension of Municipal limits to contiguous areas so that such extension is anticipated and achieved in time. Where rapid urbanisation takes place outside the Municipal limits, the case for extension of Municipal limits is to be considered first and foremost before other alternatives are explored. Also for availing grants from the programme of Jawaharlal Nehru National Urban Renewal Mission, it is necessary to extend the Municipal area.” The TSFC, thus recommended that the government look into extending the boundaries, particularly of the Chennai Corporation, to increase access to JNNURM funds, but stated that it did not recommend the constitution of any new MCs.

40
Yet the declaration of city corporations was rapid in the latter half of the 2000-2010 decade. Between 2006 and 2010, four new municipal corporations were constituted: Erode, Tiruppur, Vellore and Thoothukudi. The upgrading of a municipality to a Municipal Corporation, typically done to increase tax revenues, upgrade facilities, and enhance the financial viability of the local bodies involved, also has pitfalls in the form of extreme challenges faced in ensuring an even spread of services and infrastructure across the new territorial unit. In the case of Tirupur, which was upgraded in 2007, for example, some of the municipalities incorporated did not have even a single household water connection (cite article) For residents of the incorporated municipalities, towns and villages, the higher property tax liabilities attached to the upgradation are offset by their expectation of access to the more advanced service-delivery capacities and management of Municipal Corporations. It is not yet clear whether the newly formed MCs of Tamil Nadu have been able to adequately deliver on these expectations. In 2009, the state government announced that the jurisdiction of the Corporation of Chennai would be significantly expanded, to incorporate 9 municipalities, 8 town panchayats and 25 village panchayats. This would result in a three-fold increase in the area of the corporation, from 174 square km (according to the boundaries fixed in 1978) to 424.45 sq km., and would encompass 8 Assembly constituencies. The announcement met mixed responses, with representatives of resident welfare associations in the municipalities and towns expressing skepticism about whether the Corporation would be able to attend to its “extended family” (cite article). In 2010, the government issued orders similarly expanding the limits of the recently constituted Corporations of Erode, Tiruppur, Vellore and Thoothukudi, to include several Grade III municipalities and village panchayats in their vicinities. The expansions are to take effect in 2011, when the tenure of the incumbent local councils are over. (MAWS Policy Note 2010-11). Special Officers were appointed for these new corporations, and entrusted with ward delineation and related activities.
C. COMPOSITION OF ULBS While many of the crucial current compositional elements of urban local bodies were found in legislations even before the 74th Amendment, including elected chairpersons and councils, reservations of seats for SCs/STs and women, and provisions for standing committees and full-time executive staff, there was a lot more discretion for state government officials in these matters. The 74th Amendment provoked a large-scale systematic process of delineating wards in each local body, identifying candidates, reserving a fixed proportion of seats, rotating reserved constituencies, and holding elections. This section discusses the provisions governing the composition of ULBs before and after the implementation of the 74th Amendment in the state. C.1. Before the 74th Amendment Town Panchayats
41
Under the provisions of the Madras Panchayats Act of 1958, all members of Village and Town Panchayats were to be elected for a term of 3 years; the number of members to be notified by the Inspector on the basis of the population of the town, but to be no less than 5 and no more than 15. A maximum of 3 seats were to be reserved for SC and ST communities, and one for women. Each panchayat was to have a president and vice president, the former to be directly elected by the voters, and the latter indirectly, by panchayat members from among themselves. The Act also went into detail on the composition of panchayat unions. The latter were to comprise a chairman and vice chairman, the presidents of all the panchayats in that union, and one non-official member of each township committee in the union. The term of all members was 3 years. The Act mandated a minimum number of women and SC/ST members of the PU councils: two each in the case of panchayat unions comprising less than 12 panchayats, three each for PUs comprising between 12 and 20 panchayats, and five each for PUs having more than 20 panchayats. Where these members were not automatically members of the PU (by virtue of being a president of a panchayat) they were to be coopted by the PU. In addition, the District Collector could nominate some members of these sections and communities to the PU council (1 each for PUs with less than 20 panchayats, and 2 each for larger PUs). However, the women members could not be spouses of existing members. Chairmen were to be directly elected by citizens of the panchayats and townships in the PU area, and vice-chairmen from among the members of the PU. The chairmen became automatic members of the advisory district body, the District Development Council, which had the District Collector as chairman. Under Section 40 of the Act, while the executive authority for all village panchayats was the president himself, all town panchayats were to have a full-time executive officer appointed by the government, to be paid for by the panchayat from its funds. Each panchayat union would have a commissioner, appointed by the government, typically the Development Officer appointed for each block under the Community Development Programme. Municipalities Under the TN District Municipalities Act of 1920, each municipality comprised a council, a chairman and an executive authority. The number of councilors in the council was to be determined by the state government but could not be less than 20 or more than 52. All councilors were to be directly elected; in addition, the council included, as non-voting members, MLAs and MLCs whose constitutuencies overlapped with or comprised the municipality. The state government could, from time to time, reserve wards for members of SC/ST communities and women. The government could determine how many wards were to be reserved taking into consideration their population in the municipality, with a maximum limit of one-fourth of the total strength of the council. The chairman was to be directly elected by the voters for a term of 5 years. A vice-chairman could be elected by the members of the council from among themselves.

42
The executive authority of the muncipality, according to the Act, was a commissioner to be appointed by the state government for all municipalities listed under Schedule IX of the Act. The commissioner was to be a full-time officer of the municipality. Municipal Corporations Municipal Corporations comprised an elected council with a directly elected mayor, a standing committee, and a commissioner with his/her staff. Standing committees were introduced in 1971 in the Chennai Municipal Corporation Act. In 1936, the Act introduced provisions for the constitution of a joint committee comprising representatives of other local authorities as well as non-officials members, up to one-third of the total membership. There were also provisions for reservations of seats for special communities, whereby one Scheduled Caste (SC) member was to be coopted in each circle, if no SC member was elected from any division in the Circle. In 1961, this clause was amended to state that the person thus coopted should satisfy the test of eligibility for being elected as a councilor from any division. Also, the SC candidate elected did not have to belong to the circle which he/she represented. The commissioner was to be appointed by the state government. The state government could also appoint other officers to assist the commissioner. The salaries, allowances and benefits were all to be paid for from the corporation’s budget. The state government had powers to withdraw the commissioner from office, and was obliged to do so if this was recommended by a resolution of the council passed a meeting called specifically for the purpose and supported by the votes of no less than three-fourths of the sanctioned strength of council members. C.2. After the 74th Amendment: Town Panchayats which were brought under the purview of the TN District Municipalities Act in 1994 were to be divided into wards by the Inspector (the Director of Town Panchayats) in consultation with the panchayat council. From each ward, one councilor was to be elected to the Town Panchayat. Councilors ordinarily hold office for a term of 5 years from the first meeting of the panchayat. MPs, MLAs and MLCs whose constituencies include or overlap with the town, were also included as members of the TP, and were permitted to take part in proceedings, but were not allowed to vote. Subsequently, however, the TN Municipal Laws (Amendment) Act of 2006 gave MPs, MLAs and MCs voting rights in town panchayats that came within their constituencies.. Municipalities, according to the District Municipalities Act as amended in 1994, comprised a council, a chairperson and an executive authority. The numbers of councilors as stipulated by the Act was to be decided by the State government once in five years, but were to be not less than twenty and not more than fifty two. MPs and MLAs whose constituencies fell within or overlapped with the municipality were also members of the council, but would not have the right to vote. Reservations for seats and for offices of chairpersons were provided for SCs, STs and women in line with the 74th Amendment, and by rotation. Chairpersons and

43
vice-chairpersons were to be elected indirectly by, and from among, the members of the council (excepting MPs and MLAs). Each municipality (listed under schedule IX of the District Municipalities Act) and others notified by the state government were to have a commissioner appointed by the state government. The commissioner is a full-time officer of the municipality, with conditions of employment regulated by the state government, although his/her salary and benefits can be taken from the municipal budget. The Commissioner is allowed to attend council meetings but cannot move resolutions or vote on them. Officers and servants of the council are subordinate to the Commissioner. The Commissioner is required to make available any documents or records requested by the council unless judged to be prejudicial to the interest of the council or of the public, in which case he/she is required to declare this in writing. Municipalities can also appoint up to three standing committees for specific functions, as well as a Taxation Appeals Committee. Special Committees comprising experts from outside the council (number of such persons not to exceed one-third of the strength of the committee) can be appointed by a council resolution. Wards committees can be constituted by the state government, for one or more wards having a population of three lakhs or more, and will comprise the councilors from the relevant ward(s). Joint committees comprising representatives of other local authorities can also be constituted, with provision for outside experts (not to exceed one-third of strength of the committee). With minor variations, the administrative structure of municipalities currently includes the following:
• General Section: administration, council, establishment, budget, accounts, election, Census etc.
• Engineering Section: roads, bridges, drains, parks, water supply, lighting and basic amenities.
• Public Health Section: births & deaths, solid waste management, D&O License, sanitation.
• Town Planning Section: building permission, encroachment, rainwater harvesting, installation of machineries.
• Revenue Section: professional tax, property tax, market lease and all revenue. • Medical Section: hospitals, maternal & child health service, immunization.
Corporations Amendments to the Municipal Corporation Acts in 1994, following the 74th Amendment, introduced wards committees into the council structure, vide the TN Municipal Corporation Laws (Amendment and Special Provisions) Act, (TN Act 2 of 1994). In 1996, the Chennai Municipal Corporation comprised, apart from 155 councilors representing the 155 wards of the city, MPs, and MLAs whose constituencies comprised the area of the corporation, and members of Council of State registered as electors in the area. An amendment passed in 1996 (TN Law 22 of 1996) stipulated that these members would not be allowed to vote in council meetings. Wards committees, as conceived in 1996, were each to comprise a number of wards, the number of wards within a wards committee and of wards committees within the corporation to be decided by the government. Each wards committee would comprise all the

44
councilors of the wards included in the territorial area of the wards committee, and a chairperson to be elected from among members of the committee. The Mayor was, from 1996 until 2006, elected directly by voters. In 2006, an amendment made the post, along with that of the deputy mayor, subject to indirect election by council members. A GO issued in 1997 (GO No.27, MAWS, dated 7 Feb 1997), stipulated rules for the constitution of Standing Committees: councils of the corporations could constitute a maximum of 6 Standing Committees, each with a minimum of 6 and a maximum of 15 councillors, of which no less that a third had to be women, and a chairman elected by the members. The implementation of the 74th Amendment in Tamil Nadu involved the crucial step of systematically identifying and delimiting wards or divisions in urban bodies across the state, and arranging for elections to seats and offices based on this delimitation. Accordingly, in 1996, under the DMK regime, two set of Rules were passed. First, the TN Panchayats, Municipalities and Corporations (Delimitation of Wards or Divisions and Reservation) Rules 1996 were passed, which provided for Inspectors in the case of TPs, and the government in the case of municipalities and corporations, to divide the area of the local body into wards or divisions, that would be compact, contiguous and of easily recognizable areas like colonies, localities, and as far as possible full streets, with as far as possible equal population in each division. The wards or divisions were not to cut across Assembly constituencies or natural boundaries such as rivers, canals, etc. (GO Ms. No. 136, MAWS) dated 11 June 1996. Second, the TN Town Panchayats and Municipal and Corporation Councils (Elections) Rules, 1996 elaborately outlined the machinery for elections, the role of the State Election Commission and electoral officers, procedures for preparation and publication of electoral rolls, nomination of candidates, conduct of polls, (a sub-section on voting by electronic voting machines was inserted in 2004), counting of votes, procedures for indirect election of officers (vice-chairpersons, deputy mayors and members of statutory committees and chairpersons of ward committees), regulation of election expenses, and adjudication of election disputes. Following the implementation of the 74th Amendment in the state, elections were held 3 times: in 1996, in 2001 and in 2006. Although the 74th Amendment specifies that population figures used to delineate wards should be from the last preceding census, the elections of 2006 did not use the 2001 census, as, according to the government, carrying out a fresh delineation of wards and divisions would delay the election. Hence, “existing” territorial boundaries, numbers of wards and councilors (from 1991 census) were used for ascertaining the numbers for the 2006 elections. The state now has over 14,000 elected councilors and over 719 elected heads (Mayors, Chairpersons and Presidents) in ULBs. The total numbers of seats and offices of urban local bodies in the state, and the reserved seats and offices following the third elections to local bodies held in 2006, are shown in the two tables below.

45
Table 10: Seats and Offices of ULBs in Tamil Nadu, 2010. Seats Offices Municipal Corporation Wards 474 Chennai Corporation Wards 155
Municipal Corporation Mayors 6
Municipality Wards 3392 Municipal Chairpersons 102 Grade III Municipality Wards 987 Grade III Municipality Chairpersons 50 Town Panchayat Wards 8807 Town Panchayat Presidents 561 Total 14534 Total 719 Source: MAWS Policy Note, 2010-11 Table 11: Reserved seats and offices in TN ULBs in 2006
Reserved for SC Reserved for ST Categories Total Res for Women (excl. SC/ST)
%
Gen % Women % Gen % Women %
Offices Corp Mayors 6 1 17 0 0 1 17 - - - - Municipal chairpersons
102 30 29 7 7 4 4 - - - -
Grade III Municipal chairpersons
50 14 28 4 8 3 6 - - - -
Town Panch Presidents
561 156 28 59 11 30 5 2 0.36 1 -
Seats Corp. wards 474 140 30 32 7 19 4 - - - - Chennai Corp wards
155 45 29 14 9 7 5 - - - -
Municipal wards
3392 967 29 222 7 164 5 - - - -
Grade III Mun wards
987 262 27 73 7 64 6 - - - -
TP wards 8807 2207 25 787 9 707 8 3 - 21 - TOTAL 14534 3822 26 1198 8 999 7 5 - 22 - Source: MAWS Policy Note, 2010-11 In 2006, the Report of a High Level Committee appointed to make recommendations on devolution of powers to local bodies, articulated a set of disagreements that the state government of Tamil Nadu (or the DMK regime, as the Committee was chaired by M.K. Stalin, then Minister of Rural Development and Panchayati Raj) had with the 73rd and 74th Amendments. It argued, among other things, that the act should have provided for a better integration of rural and urban local bodies: “The Government of Tamil Nadu has long held the view that there should have been a single consolidated Amendment to the Constitution covering both rural and urban Local Bodies instead of two Amendments – one covering rural Local Bodies (73rd) and the other urban Local Bodies (74th). This ‘compartmentalisation’ has resulted in a scenario whereby the District Panchayat – instead of being a nodal body responsible for coordinating and monitoring all the rural and urban Local Bodies in the

46
district – finds that its jurisdiction is confined only to the rural areas. In a State like Tamil Nadu with about 42% urban population, and with several highly urbanized districts such as Kanyakumari (66%), Coimbatore (62%), The Nilgiris (58%), Theni (54%) and Madurai (52%), the argument that the District Panchayat should become the nodal body responsible for coordinating and monitoring the development activities in the entire district becomes weak. A system whereby all the Chairpersons of Panchayat Unions, Municipalities and Town Panchayats are ex-officio members of the District Panchayats, with the Chairman of the District Panchayat being either directly or indirectly elected would have been more meaningful and credible. This weakness has been sought to be overcome through the District Planning Committee which has members drawn from both rural and urban Local Bodies but even this has been rendered ineffective due to its flawed composition.”
D. FUNCTIONS D-1 Prior to the74th Amendment Town Panchayats Under Section 63 of the TN Panchayats Act 1958, all panchayats including Town Panchayats were entrusted with a set of statutory functions, which were as follows: a) The construction, repair and maintenance of all village roads other than those classified as National or State Highways, Major District Roads and Panchayat Union Roads, and of all bridges, culverts, road-dams and causeways on such roads; b) the lighting of public roads and public places in built-up areas; c) the construction of drains and the disposal of drainage water and sullage; d) the cleaning of streets and removal of garbage; the filling of disused wells, sanitary ponds, pits, pools and ditches, and improvement of sanitary conditions; e) the provision of public latrines and arrangements to cleanse latrines whether public or private; f) the opening and maintenance of burial and burning grounds; and g) the sinking and repair of wells, excavation, repair and maintenance of ponds or tanks, the construction and maintenance of water works for supply of bathing and washing water, and of protected water for drinking. Panchayats were also given powers to carry out discretionary functions such as planting of road-side trees, lighting of public roads and public places in non-built-up areas, opening and maintenance of public markets, control of fairs and festivals, opening of bus-stops and car parks, opening and maintenance of slaughter houses, opening and maintenance of reading rooms, opening and maintenance of play grounds, sports clubs, etc, opening and maintenance of literacy centers, construction of works for public utility, and the provision of other facilities for the safety, health, comfort, convenience, culture or recreation of the local inhabitants. Panchayat Unions were entrusted with: the construction, maintenance and repair of roads classified as panchayat union roads, and of bridges, culverts etc on these roads; establishment and maintenance of dispensaries; construction and maintenance of poor houses, orphanages,

47
shops, stalls, the training and employment of vaccinators, decongestion of the area and provision of house-sites; the opening, maintenance, improvement or expansion of elementary schools; control of fairs and festivals; extension of village sites and regulation of building; opening and maintenance of markets classified as PU markets; maintenance of statistics on births and deaths; establishment and maintenance of choultries; the improvement of agriculture; and the promotion and encouragement of cottage industries. In addition, PUs were entrusted with implementation of the Community Development programme in their respective blocks, in terms of schemes related to agriculture, animal husbandry and village industries. Municipalities The functions of municipalities in the TN District Municipalities Act of 1920 are contained in various sections, and include: construction and maintenance of water works including channels, tanks, reservoirs, cisterns, wells, fountains and standpipes for supply of water to inhabitants (section 126); lighting of public streets (section 136); provision and maintenance of public drainage (section 137) and maintenance/control of private drainage systems (section 138); provision and maintenance of public latrines and urinals (section 145); sweeping of streets and removal of rubbish; maintenance and repair of streets and bridges (section 162), the planting and preservation of avenue trees. D-2 After 74th Amendment After the passing of the conformity legislation in Tamil Nadu, the functions of Town Panchayats, Municipalities and Municipal Corporations became the same, as defined by the TN District Municipalities (Amendment) Act, 1994 and the various Municipal Corporation Acts, except that in the case of the Chennai Corporation, water supply and drainage are taken care of by the state level parastatal Board CMWSSB (or Metrowater). The functions of ULBs comprise: a) Provision and maintenance of water supply; b) Provision and maintenance of street lights; c) Provision and maintenance of public drainage; d) Provision and maintenance of latrines; e) Arrangements for sweeping streets and removing solid waste; f) Provision and maintenance of public streets and roads; g) Planting and maintenance of trees on the sides of roads. In addition, Section 374 of the District Municipalities Act declared that “the State Government may, by notification and subject to such conditions and restrictions as may be specified therein, entrust to the Municipality (or Town Panchayat), the wards committee or any other committee constituted under this Act such powers and responsibilities with respect to the preparation of plans for economic development and social justice and also with such powers and authority as may be necessary to enable them to carry out the responsibilities conferred upon them in relation to the matter listed in Schedule X.” This language is in compliance with that of Article 243W of the 74th Constitutional Amendment, which requires the state legislatures to, by law, endow municipalities with “such powers and authority as

48
may be necessary to enable them to function as institutions of self-government” with provisions for devolution of powers and responsibilities with respect to (i) the preparation of plans for economic development and social justice; and (ii) the performance of functions and the implementation of schemes as may be entrusted to them including those in relation to the matters listed in the Twelfth Schedule. Schedule X of the TN District Municipalities Act 1994 comprises the 18 functions that have been listed in the Twelfth Schedule of the 74th CAA. The First Finance Commission in 1996 declared that, following the passage of the 74th Amendment, “urban local bodies [would] hereafter be responsible, in addition to their usual functions of provision and maintenance of civic services, regulation of industrial, trade and construction activities for such functions and implementations {sic) of centrally sponsored and state-level socio-economic schemes, prominent among them being the Urban Basic Services for the Poor, Nehru Rozgar Yojana, Integrated Development of Small and Medium Towns, and slum improvement” (First Finance Commission Report, 1996: p.9). However, no specific language in any of the state conformity laws indicates the legal incorporation of these responsibilities in local body functions. Based on the TN Act (26) of 1994, Section 27-B was inserted into the Chennai Municipal Corporation Act, which provided for the constitution of a Metropolitan Planning Committee, leaving it to the state government to determine its composition, its functions and the manner of choosing its chairpersons. This measure has not yet been implemented in any metropolitan area of the state. The First State Finance Commission (FSFC), studying the issue of devolution of functions to ULBs in 1996, noted that 10 of the 18 functions listed in the Twelfth Schedule were already being partly or fully discharged by these bodies (Report of the First State Finance Commission, 1996). The FSFC also opined that while the devolution of functions was provided for in the Acts, there was no clear specification of functions to be covered at each tier. The FSFC therefore held discussions with Secretaries and Heads of various departments of the state government to formulate a plan for gradual and phased devolution of the remaining functions, accompanied by appropriate funds and functionaries. The proposed devolution package that resulted from these discussions is spelt out in the an Appendix (Appendix 104 of the FSFC report). A study of this document reveals the way in which the concept of devolution of functions has been understood and/or interpreted by the state from the beginning: the package comprises a set of subordinate and logistical activities (e.g. identification of beneficiaries, needs assessment, monitoring and supervision, maintenance, administrative and managerial aspects) for ULBs, to assist the deployment or functioning of state-level schemes and programmes, rather than a devolution of powers in the spirit of self-governance. Even this package, however, was only “accepted in principle” by the state government – no orders were passed (SSFC Report). Unsurprisingly, the situation 5 years later provoked the following comment from the Second State Finance Commission (SSFC) in 2001: “Presently, the affairs of both the Local Bodies and the State Government are inextricably intertwined and their respective roles are not

49
clearly defined. In other words, at present, the functions of the local bodies and the State Government are concurrent in nature and this results in a situation where the public are not in a position to clearly demand services from a particular level of Government and whenever they approach the local body, which is closest to them, the concerned local body pleads paucity of funds as a reason for its inability to satisfy the citizens’ requirements. Accordingly, when the next batch of elected representatives take position later in 2001, role clarity has to emerge with well-defined functions to be performed by the local bodies. These well-defined functions may be, to start with, the basic civic amenities, which every citizen of India is clamouring for and the absence of which, despite spending several crores of rupees since independence, leads sometimes to a feeling of neglect among the masses.” (SSFC Report, p. 9). However, beyond this observation, the SSFC did not deal substantively with the issue of devolution of functions, stating that “In this chapter, we are not going into dialectics about the functions of the Local Bodies. For the present we are restricting our study to the civic functions traditionally being performed by the Local Bodies. The general perception of the people is that the level and quality of civic services provided by Local Bodies is neither adequate nor satisfactory.” The Third Finance Commission, however, was explicitly tasked, in its Terms of Reference, to suggest well-defined demarcation of functions between the state and local government in the context of the administrative and financial resources and powers delegated to them. Accordingly, the TSFC set up two sub-committees to examine these issues, one for rural and one for urban local bodies. The sub-committee on ULBs reported that, out of 18 functions listed in XII Schedule of the Constitution, ULBs played some role in 11 functions, with the remaining 7 being handled largely by the state government and/or its parastatal agencies. The sub-committee made recommendations (discussed below) on functions relating to urban planning and land use. It then declared that: “In respect of other functions, there is no urgent necessity to transfer the functions. However, in the functions now being administered, there is no adequate delegation to Municipal councils and to the Regional Director of Municipal Administration.” In terms of planning functions, both the Second and Third Finance Commissions had recommended a phased shift of responsibilities to local bodies: while the drawing of Master Plans and detailed development plans could continue to remain with the specialized agencies (the Directorate of Town Planning and the CMDA), responsibilities for regulating land-use and construction should be handed over the ULBs. The TSFC in 2006 commented that since the 1970s, “parastatal agencies have gained experience in the absence of elected bodies and hence they are reluctant to part with their functions. Wherever the local authority happens to be the local planning authority, the problem in land use and regulation of construction is not insurmountable… But in the case of composite planning authorities, the problem in land use and construction continues to persist. As per the latest figures furnished by the Municipal authorities, five Municipal Corporations (except Chennai) have 1482 unapproved layouts (51,953 assessments) Municipalities have more than 2181 unapproved layouts (2,26,398 assessments) and Town Panchayats have 3401 unapproved layouts (41,178 assessments).” The TSFC opined that the lack of adequate powers with municipal councils to demolish

50
unauthorised constructions had “emboldened many to resort to constructing without permission / approval from Municipal authorities.” It recommended that the planning authority and the building license authority be brought under one umbrella to clear the back-log in layout approval and augment the resources of ULBs. It also recommended that the Directorate of Town and Country Planning, which was under the administrative control of Housing and Urban Development Department, be brought under the Municipal Administration and Water Supply Department, as urban development and planning was an integral part of municipal administration. Devoting a section to discussion of the Chennai Metropolitan Development Authority (CMDA), the TSFC noted that conformity legislation as mandated under Article 243 (ZF) of the Constitution.(74th Amendment) to amend the Town and Country Planning Act by restricting the role and function of Chennai Metropolitan Development Authority had not been enacted, and a separate law on Metropolitan Planning Committee was lacking, even after 14 years after the mandate. On the basis of these recommendations, the government has made some moves to delegate planning powers to ULBs. In 2009, the CMDA passed a resolution conferring the authority to issue planning permissions for ordinary buildings, in accordance with the Development Regulations of the Second Master Plan, to local bodies within the Chennai Metropolitan Areas (CMDA Proc. No. RT./6398/09). In the 2010-2011 Policy Note of the MAWS department, the state government claimed that 17 out of the 18 functions, with the exception of fire services, had been transferred to ULBs. It also stated that “District Planning Committees have been constituted and are functioning” and that city planning functions have been transferred to local bodies (ibid, p.111). However, commentators note that this statement covers up the fact that functions are transferred only in terms of administrative instructions for the implementation of state or central schemes, or for assistance to be given to departments carrying out programs. According to a retired municipal councilor, the state government often cites the increase in administrative sanctions for works and in sitting allowances for councilors as examples of achievements in strengthening ULBs9. Observers also note that the current functioning of District Planning Committees leaves much to be desired: its members assemble to hear presentations from district authorities and parastatal boards on the plans that are being implemented for their areas, rather than engaging in an active planning process.
E. HUMAN RESOURCES
E.1. Staffing of ULBs prior to 74th Amendment: guidelines; decision-making authorities and procedures In theory and in legal terms, the staffing of urban local bodies has been an arena of shared or negotiated power between the local body and the state government since the early days of panchayats and municipal bodies. All the relevant Acts (the TN Panchayats Act 1958, the District Municipalities Act 1920, and the Chennai Municipal Corporation Act 1919) contain 9 Interview with S.Sivasamy, retired municipal commissioner.

51
language that makes the sanction of the local body necessary for all proposals to alter the number, designations and grades of its officers and servants, and of their salaries, fees and allowances. These proposals were to be initiated by the executive officers of the local bodies and could be modified by the councils. Any proposal adversely affecting permanent staff of the municipality who had been in service for over 5 years, and drew a salary of not less than Rs.50 p/m, was to be discussed at a special meeting and required assent of at least half the members. In all the Acts, however, a subsequent clause declared that notwithstanding the above provisions, the state government (and in the case of panchayats, the Inspector of Panchayats) had, “the power to fix or alter the numbers, designations and grades of and the salaries, fees and allowances payable to the officers and servants” of these bodies. The local bodies are not allowed to modify these decisions of the government. Early versions of the laws also allowed for what came to be known as “provincialisation”, i.e. the constitution of a class of officers or servants of local bodies into a (municipal or state) service for the whole of the state. This brought the provincialised category of staff under the purview of rules framed by the state government to regulate the recruitment, qualifications, classification, conditions of service, pay and allowances, discipline and conduct of the municipal service thereby constituted. Manpower norms for municipal bodies in Tamil Nadu are derived from multiple sources. In the water sector, norms have been derived from the Central Public Health Engineering and Environment Organisation (CPHEEO)10; for roads, from the Highways and Rural Works Department of the state government. For other services such as sanitation, solid waste and finance, the state government’s Norms Committees specify norms from time to time. Since 1996, the State Finance Commissions have also recommended norms for municipal staffing taking into consideration on the one hand the demand for higher service levels with the growing urbanization of the state (and the need for adequate O&M.following increased investments), and on the other hand the overall financial viability of the ULB. Procedures for appointing municipal staff are derived from the laws and rules governing different categories of ULBs. Town Panchayats As mentioned above (under Section C.1), the TN Panchayats Act of 1958 provided for the state government to appoint a full time executive authority for town panchayats. Section 59 of the Act also allowed two or more panchayats or PUs to appoint the same officer or staff (in other words, to share staff) for specific functions. Inspectors of Panchayats (the Director of TPs) had powers to transfer any officer or servant of the panchayat or PU to other panchayats, PUs or municipalities after consultation with the executive authorities concerned, and executive officers had the power to promote, censure, fine or otherwise discipline officers and servants of the panchayat. These powers were gradually removed from executive officers of local bodies as more and more classes of staff became provincialised from the 1970s on. Municipalities 10 Except in the case of Chennai Corporation, where the CMWSSB develops and follows its own norms.

52
Apart from the commissioner (discussed under Section C above), the District Municipalities Act also provided (under Section 71) for all municipalities having an income of Rs.1 lakh from ordinary receipts for three consecutive years to appoint a health officer and a municipal engineer. For those not listed in Schedule IX or otherwise notified (i.e. those that did not have a commissioner), a post of secretary could be sanctioned by the council. In addition, municipalities which generated, transmitted or supplied electric power could sanction posts of municipal electrical engineer and assistant municipal electrical engineer. Section 76 A of the Act gave the state government powers to appoint, regulate (conditions of service, pay allowances, discipline and conduct) and transfer all these officers and engineers. For other municipal staff (whose pay was more than Rs.50 per month), appointments could be made by an Appointments Committees of the municipal council, comprising the chairman, the municipal commissioner and one councilor, or (for lower grades) by the commissioner him/herself. The commissioner made proposals for appointment of necessary posts, based on which the council passed a resolution, which was then sent to the state government for sanction. A set of norms guided the commissioner in framing staffing proposals, these were based on workload criteria, e.g. one bill collector could be hired for every 1500 bills to be collected per half year. For every five bill collectors, one revenue inspector and one junior assistant could be hired. Similarly, depending on the number of applications received, one town planning inspector, or one public health junior assistant could be hired. According to Section 70 of the District Municipalities Act 1920, recruitments of municipal staff, or any change in “numbers, designations and grades” as well as in the salaries, fees and allowances of municipal officers and servants, required a sanction of the concerned municipal council. The Act specifies that the proposal for such changes should come from the executive authority of the ULB (usually the municipal commissioner). However, sub-section 3 goes on to say that the state government has the ultimate power to fix or alter numbers, designations and grades, as well as salaries fees and allowances of municipal officers and servants. The powers of municipal councils are, then, clearly subject to those of state governments in staffing of municipalities. Dismissal or termination of a Government servant employed by a municipality could not be done without the consent of the state government and three months notice in writing sent to the state authority. Conversely, the services of a government servant employed by a municipality could not be withdrawn from the municipality without the consent of the latter and three months notice in writing to the council, or a replacement. Provincialisation could be carried out after consultation with all municipalities, and if the majority supported the move. These provisions remain in current versions of the law. The Directorate of Municipal Administration (DMA) was (and still is) the authority for appointing municipal posts that are specified under the under the Tamil Nadu Municipal Services Act, or the provincialised grades. Lower grades of municipal staff are appointed by Municipal Commissioners. The DMA is also the appellate authority for any punishment imposed on municipal employees hired by the Commissioner. The DMA has powers to transfer senior (grades I and II) municipal commissioners and municipal employees as well as Regional Directors of Municipal Admininstration (RDMAs). The DMA is also the

53
disciplinary authority for these posts and governs all service matters for these personnel. Several of the powers of the DMA have been delegated to RDMAs for the municipalities within their jurisdiction, including powers to decide appeals in disciplinary cases concerning lower grade staff of 1st , 2nd and 3rd grade municipalities for whom the Commissioners are the appointing authorities, and the powers to transfer the staff of 1st, 2nd and 3rd Grade municipalities within the unit (region). Provincialised municipal appointments are governed by the TN State and Subordinate Service Rules and the Tamil Nadu Government Servants’ Conduct Rules, 1973. Municipal Corporations The executive head in all municipal corporations is the commissioner, to be appointed by the state government, along with any officers required to assist him/her. The state government can withdraw the commissioner at any time, and is obliged to do so if requested through a resolution of the council passed at a special meeting called for the purpose and supported by two-thirds of the sanctioned strength. In addition, the corporation establishment comprises four classes of employees. In the case of Chennai, these are specified as follows (by the Chennai City Corporation Act): Class I-A.—A health officer, an engineer, an electrical engineer, a waterworks engineer, a drainage engineer, a revenue officer, a chief accounts officer and the educational officer. Class I-B.—Officers, who in the opinion of the council are of a status equivalent to the status of Class I-A officers appointed to serve under the Corporation. Class II.—Assistants to Class I-A and Class I-B officers. Class III.—All other persons (not being persons holding post in a service classified by the council as a last grade service) appointed to service under the corporation. Class IV.—All persons holding posts in a service classified by the council as a last grade service. For other corporations, the category of Class I officers is simply defined as heads of departments and assistants to the commissioner, and the other categories are the same as for Chennai. The government appoints all Class I officers. Class II officers can be appointed by the council subject to confirmation by the government. Classes III and IV staff are to be appointed by the Appointments Committee of the council, consisting of the Mayor, the Commissioner, and one elected member. These appointments are to be made from a list of names obtained from the Employment Exchange by the municipal commissioner and placed before the Appointment Committee.11 The appointment committee makes the selection from the list in accordance with the service rules in force, including rules on reservations. A Special Health Officer can be appointed on a temporary basis (maximum six months) for the corporation by the government in the event of any unusual mortality or the prevalence or anticipated outbreaks of infectious diseases 11 TN Municipal Corporations Appointments Committee (Method of Selection) Rules 1998. (vide GO. Ms. No. 225, MAWS, 24 Nov 1998).

54
The government is also empowered to transfer any staff or municipal corporations to other municipal corporations or municipality. E.2. Degree of autonomy available to ULBs to recruit appropriate staff Until 1972, municipalities exercised substantial autonomy in staffing of their establishments. In 1970, the state government adopted a series of service rules for various municipal services, which provincialized many more cadres of municipal staff than before, bringing them within a statutory framework for recruitments, grades and salaries, and regulating transfers and promotions. These rules included the Tamil Nadu Municipal Town Planning Rules, 1970, the Tamil Nadu Municipal Medical Service Rules, the Tamil Nadu Municipal Engineering Service Rules, 1970, the Tamil Nadu Municipal General Service Rules, 1970, the Tamil Nadu Municipal Educational Service Rules, 1970. From 1972 on, councils could only appoint staff at or below the grade of junior assistants. For all others, the sanction of the Directorate at the state government was needed. This was the beginning of a process by which the powers of municipal bodies were slowly taken away in the domain of staffing. As a retired municipal commissioner commented: “At one time I hired everybody who worked in the municipality: teachers, headmasters, managers, clerks, etc. Now all these hires are done by the directorate.” In 1985, the posts of Junior Assistants, Head Clerks, Revenue Inspectors and Typists of Town Panchayats were also provincialised (GO Ms.No.64, Rural Development, 5-2-1985) and in 1986, following the Fourth Pay Commission recommendations, pay scales of Bill Collectors and Junior Assistants were equalized and made interchangeable. In 1988, posts of Bill Collectors in TPs were also provincialised (GO MS.No. 800, Rural Development, 1-12-1988). Provincialisation held advantages as well as disadvantages for municipal establishments. Before the 1970s, staff could not be easily transferred from one municipality to another – they were entirely servants of the municipality that hired them. In order for a transfer to be effected, both the sending and the receiving municipal bodies had to pass resolutions. The provincialization rules, by making the majority of municipal staff posting transferable, allowed for occupational mobility. Staff could move to higher posts elsewhere. However, this not only reduced local self-government in terms of powers of appointment, but often rendered staff less committed to particular places, because they could easily be transferred.12 The SSFC in 2001, after discussions with Town Panchayats, recommended that in order to give TPs greater autonomy and control over their staff, and to allow them to be transferred among various TPs based on administrative convenience, all posts below that of Executive Officers of TPs be non-provincialised even if recruitment to these posts are carried out through the TN Public Services Commission (SSFC Report, p. 62). Effectively, then, the powers to appoint, transfer and manage lower grades of municipal staff remain with municipalities. In this sense, provincialisation appears to have benefited higher grades of municipal staff rather than lower grades. E.3. Revisions in staffing guidelines after 74th Amendment. 12 Interview with S.Sivasamy, retired municipal commissioner.
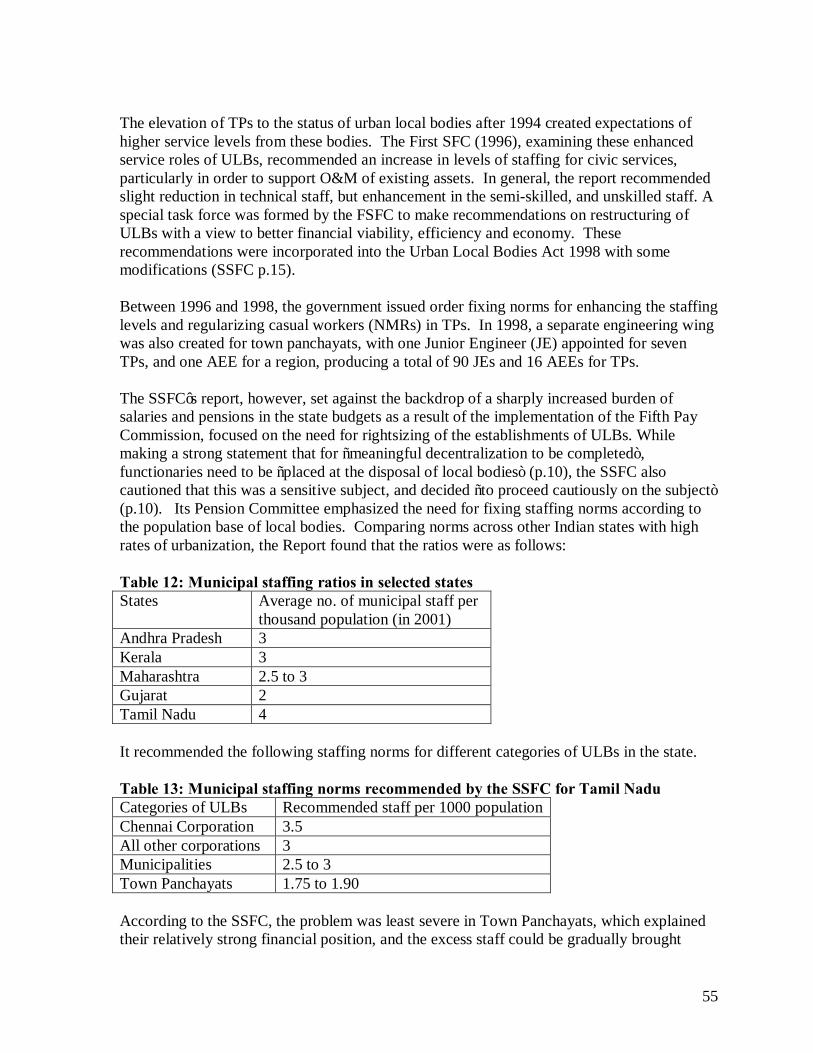
55
The elevation of TPs to the status of urban local bodies after 1994 created expectations of higher service levels from these bodies. The First SFC (1996), examining these enhanced service roles of ULBs, recommended an increase in levels of staffing for civic services, particularly in order to support O&M of existing assets. In general, the report recommended slight reduction in technical staff, but enhancement in the semi-skilled, and unskilled staff. A special task force was formed by the FSFC to make recommendations on restructuring of ULBs with a view to better financial viability, efficiency and economy. These recommendations were incorporated into the Urban Local Bodies Act 1998 with some modifications (SSFC p.15). Between 1996 and 1998, the government issued order fixing norms for enhancing the staffing levels and regularizing casual workers (NMRs) in TPs. In 1998, a separate engineering wing was also created for town panchayats, with one Junior Engineer (JE) appointed for seven TPs, and one AEE for a region, producing a total of 90 JEs and 16 AEEs for TPs. The SSFC’s report, however, set against the backdrop of a sharply increased burden of salaries and pensions in the state budgets as a result of the implementation of the Fifth Pay Commission, focused on the need for rightsizing of the establishments of ULBs. While making a strong statement that for “meaningful decentralization to be completed”, functionaries need to be “placed at the disposal of local bodies” (p.10), the SSFC also cautioned that this was a sensitive subject, and decided “to proceed cautiously on the subject” (p.10). Its Pension Committee emphasized the need for fixing staffing norms according to the population base of local bodies. Comparing norms across other Indian states with high rates of urbanization, the Report found that the ratios were as follows: Table 12: Municipal staffing ratios in selected states States Average no. of municipal staff per
thousand population (in 2001) Andhra Pradesh 3 Kerala 3 Maharashtra 2.5 to 3 Gujarat 2 Tamil Nadu 4 It recommended the following staffing norms for different categories of ULBs in the state. Table 13: Municipal staffing norms recommended by the SSFC for Tamil Nadu Categories of ULBs Recommended staff per 1000 population Chennai Corporation 3.5 All other corporations 3 Municipalities 2.5 to 3 Town Panchayats 1.75 to 1.90 According to the SSFC, the problem was least severe in Town Panchayats, which explained their relatively strong financial position, and the excess staff could be gradually brought

56
down by stopping fresh recruitment, redeploying excess staff to needy TPs, and other such measures. However, the SSFC found that, with the flow of funds from different sources to TPs, and works amounting to Rs.200 crores per annum being taken up, further strengthening of the engineering wing was needed. With annual capital investment of Rs 150 crore per annum during the Commission period, there was a need for proper monitoring of O&M as well as of the quality of execution of engineering works (much of which was being carried out by NMRs). The SSFC therefore recommended that a Technical Assistant or Works Inspector be appointed for each TP, that the numbers of AEs/JEs and AEEs be increased (to one AE/JE per 4 TPs and one AEE per 25 TPs) and that a post of Superintending Engineer (SE) be added at the Directorate of Town Panchayats. In the case of municipalities, the SSFC found that staffing ratios were unjustifiably high, averaging about 3.87/1000, and going up to 6.85 in some cases. The report stressed the need for municipalities to “decisively reduce the (staff) strength” to improve their financial viability, by redeploying surplus staff to municipalities with a greater need, and by surrendering retirement vacancies until the desired norms were reached. In terms of solid waste management, the SSFC saw a significant scope for privatization, and recommended that specific components be privatized to reduce conservancy staff “to the barest minimum” and ensure lower cost and better service. In Corporations, the report found that the existing staff strength worked out to a ratio of 5.11 per 1000, about 71% higher than the desired norm. Reductions were to be made by abolishing posts on retirement of existing staff, and/or transferring them to other departments or positions when vacancies arise. Wherever feasible, computerisation and privatization of operations was recommended to accompany the ban on filling up new posts, and the Commission recommended a continuous review of workload and sanctioned strength in order to “right-size” the establishment. However, from the latter part of the 2000s, the staffing of municipalities received a boost. The DMK, in its election campaign in 2006, promised to regularize or reinstate large numbers of personnel that had been kept in casual positions or retrenched during the austerity drives of the early 2000s. When the DMK came to power, the state government from 2006 on took measures to enhance the staffing of urban local bodies through filling vacant posts in various categories and creating new posts. In 2006, it regularized large numbers of employees who had been working on consolidated pay, and NMRs (Nominal Muster Roll employees on daily wages) for over a decade, bringing them into the time scale of pay. Previous orders that had been in force from the early 2000s freezing recruitments in entry level posts were cancelled. (GO.No. 14 Personnel and Administrative Reforms Dept dated 7-2-2007). Through an order of the MAWS department in 2006, (GO Ms. No. 21, MAWS, dated 23-2-2006) commissioners of municipalities (including Grade III municipalities) and corporations (excepting Chennai corporation) were directed to regularize a total of 6732 employees who had been on their rolls since 1996, subject to the availability of sanctioned positions, the fulfillment of educational and other criteria by the persons to be regularized, and the stipulation that after the filling of posts, establishment (pay and pension)

57
expenditures of the concerned local bodies should not exceed 49% of their revenue. The order also prohibited any further appointments on daily wage or consolidated pay bases in municipalities and corporations in the future. Between 2006 and 2010, a total of 7535 posts, including those of Municipal Commissioners, Medical Officers, Town Planning Officers, Assistant Engineers, Sanitary Inspectors, as well as in other cadres, were filled. The figures, as reported in the Policy Note of 2010-11 are as follows: Table 14: Municipal staff appointments in TN between 2006 and 2010. Method of Appointment Number of appointments filled Direct recruitment 2799 Compassionate Grounds Appointments 1528 Regularisation of NMRs 3074 Reemployment of retrenched employees in PSUs
134
Total 7535 Source: MAWS Policy Note 2010-11. Conclusion This chapter reveals that the glass of municipal self-government is both half-empty and half-full. While definitive moves forward have been made in creating a vigorous layer of political decentralization at ULB levels through elections and reservations of seats and offices, and while the staffing of ULBs has been strengthened in recent years, the discussions above reveal that considerable ambivalence remains in the state’s conception of the viability of ULBs, on parameters for classifying and upgrading them, and most of all, on a clear devolution of functions to ULBs.

58
CHAPTER 3
FINANCIAL RESOURCES OF ULBS
Historically, it has been observed that fiscal decentralisation was central to the decentralisation of power, and that local democracy or city government is founded on the notion of payment of municipal rates, either as property tax, excise or other form of tax (Singh 2010:18). During British rule in India, local governments were seen as institutions better equipped to handle local problems than the ‘capital’. Although local governments were given the power to raise resources through taxation, both urban and rural ‘boards’ seem to have depended largely on the government for expenditure on education, hospitals and other capital works such as water supply and drainage (Singh 2010:21). However, until the enactment of the 73rd and 74th Constitutional Amendments, local bodies across the country were in no position to be called “local governments” as they did not have a constitutional status. Funds, functions and functionaries were not made available to them to perform their duties as local governments which hobbled their growth into robust institutions at the grassroot level. While devolution of funds has been occurring and State Finance Commissions (SFCs) have been at work, many opportunities to strengthen resources of ULBs particularly through own revenues have been compromised, making them more dependent on State grants, debt write-offs and central schemes. According to Oomen (2010:44), SFCs have been working within a restricted framework and offer recommendations that are often times not accepted by the State or accepted but not implemented. Specifically in Tamil Nadu, he opines that due to the State’s own financial commitments, devolution has not been a priority and this has severely affected the role of Urban Local Bodies (ULBs) in providing social sector goods and services essential for human development. In this section we look specifically at the financial resources of UL Bs, both prior to the 74th amendment and in the current moment. A. MAJOR SOURCES OF FINANCIAL RESOURCES OF ULBS PRIOR TO 74TH AMENDMENT As noted at the beginning of chapter 2, the system of local self government, both rural and urban, is not new to Tamil Nadu. Forms of local governments existed during the Chola period in the 10th and 11th Centuries. Local bodies, as we know them today, were created as early as 1687 by the British in order to levy certain direct taxes for the provision of local amenities such as education, sanitation etc (First TN State Finance Commission). A turning point in the history of local self governments came about in the late 19th century when Lord Ripon undertook an evaluation of progress of local governments since 1870. In his minutes of 1882, Lord Ripon pointed to the roadblocks faced by local bodies in fulfilling their responsibilities i.e., official interference, lack of resources and sharing of financial and administrative powers between the provincial and local government. Following Ripon’s minutes of 1882, the Royal Commission on Decentralisation was set up in 1909 to look into the financial and administrative problems faced by local governments including power-sharing arrangements between the local and provincial governments (Singh 2010).

59
The Royal Commission of 1909, like the present day State Finance Commissions, observed dependence by rural local bodies on regular government contributions, while urban local bodies were considered to be much better off. However, the Royal Commission also observed that while urban local bodies may be financially better off, their revenues from taxation were not substantial enough to undertake the construction of new capital works, forcing them to depend on grants given by the provincial governments. The Royal Commission on Decentralisation also paved the way for the creation of Municipalities for smaller towns and cities and Municipal Corporations for big cities. In Tamil Nadu the Madras Municipal Corporation Act was enacted in1919, District Municipalities Act, 1920. Other Corporations like Madurai (1971) and Coimbatore (1981) were subsequently created by enacting specific Municipal Corporation laws. As mentioned above, local governments were primarily founded to facilitate local revenue generation by way of taxes, excise and levies which could be used for provision of services within the territorial jurisdictions of the local body. Some of the earlier taxes that were collected by municipalities include property tax, taxation on trade, pilgrim tax, tax on movement of goods (octroi), tax on vacant land and excise and other duties. The revenue derived from these taxes and duties were seen as a way to reduce dependence on grants from provincial government, which in turn could lead to greater autonomy for municipal councils (Singh 2010). While the intention of early proponents of local self government was to ensure financial and administrative autonomy to local bodies, actual implementation was severely flawed. Over the years, the power to determine the revenue base of municipalities has remained with the State. This includes the tax authority, tax rate setting, local tax autonomy, grants-in-aid and other forms of transfers from the state government (Mathur 2006). During the period prior to the 73rd and 74th Constitutional Amendments, the fiscal situation of Urban Local Bodies (ULBs) across India was rather weak and making a clear assessment of the fiscal health of ULBs was difficult. This is primarily because the Constitution of India did not lay down the revenue base for municipalities in India (ibid). However, it is unclear as to how much of these taxes were actually collected by the local bodies and what share of such collection could be retained by them to fund their operations and functions. Several committees were constituted to review municipal finances in TamilNadu even prior to the constitutional amendments. In 1972, a high powered committee under the chairmanship of Mr.S.Venkatiraman I.A.S was constituted to study the ways and means position of Corporations in TamilNadu. This was followed by the Committee headed by Mr. Sattanandhan in 1978 who examined the administration of the Corporation of Madras. The Shanmuganathan Committee and the Municipal Finance Enquiry Committee in the 1980s conducted detailed studies on the finances of the Corporations and made several recommendations for strengthening local finances and tax reforms. With the ushering in of the 73rd and 74th Constitutional Amendments, devolution of funds, functions and functionaries gained greater prominence. B. FINANCIAL RESOURCES TO ULB’S AFTER THE 74TH AMENDMENT.

60
Amendments to state laws passed by the Government of Tamil Nadu 1994 in conformity with the 74th Constitutional Amendment created three types of municipalities in the state: Municipal Corporations for large cities, Municipal Councils for smaller cities and towns, and Town Panchayats for areas in transition from ‘rural’ to ‘urban’. One of the salient features of the 73rd and 74th Constitutional Amendments is the provision for the formation of State Finance Commissions in the States. Articles 243 (I) and 243 (Y) of the Constitution of India, considered to be a watershed in the history of local bodies in India, have provided for the constitution of State Finance Commissions (SFC) in all the States within one year of passing of the Constitutional Amendment initially and subsequently once every five years. The main function of the SFC is to study the finances of local bodies and recommend the basis on which taxes are to be appropriated or assigned to local bodies as well as allocation of grants-in-aid to local bodies from the consolidated fund of the State. SFC also studies the powers of taxation of local bodies and their mechanisms to improve their finances and services. The First SFC in Tamil Nadu was constituted in April 1994 with a single Member Secretary and was later expanded in September 1994 with the appointment of Chairman and other members. The mandate of the subsequent SFC’s were also broadened to include the study of repayment of loans given by the Government to Local Bodies, payment of pension, accountability of local bodies, devolution of funds from the Eleventh Finance Commission, etc. With the constitution of State Finance Commissions, there has been strong emphasis on the finances of local bodies, both rural and urban. TamilNadu so far has had three SFC’s for the period 1997-2002, 2002-2007 and 2007-2012. While the State government has not accepted all of the recommendations made by the SFC, it has been devolving an agreed percentage of funds every year from its own tax revenue. A brief summary of some of the key recommendations of the three SFCs in TamilNadu are given below: The first SFC had recommended the concept of global sharing of resources whereby central revenues are shared with the State from a common pool of resources called Pool B. This revenue is further shared with the local bodies and in Tamil Nadu this is claimed to have increased the fund flow to local bodies. For the year 1996-97, devolution to local bodies prior to the setting up of the first SFC stood at Rs.588 crores. In the year 97-98, after the creation of a separate pool for local bodies under the global sharing model, the allocation was Rs.612 crores. This increased to Rs. 1036 crores in 2000-01. Combined with the assigned revenues to local bodies, the total devolution in 2000-01 stood at Rs.1334 crores (Report of the Second TN State Finance Commission 2001). Table 1 gives more recent data on the percentage of devolution. Table 1: Amount devolved since 2006-07 till 2009-2010 (Rs. in Crores) Municipalities Corporations Town Panchayats % of Devolution
2006-07 (II SFC) 363.08 274.94 248.88 8.00 2007-08 (III SFC) 471.64 345.11 316.92 9.00 2008-09 (III SFC) 509.60 372.89 342.43 9.00 2009-10 (III SFC) 569.82 416.95 382.89 9.50 Total 1914.14 1409.89 1291.12

61
Source: 2010-2011 Policy Note, Department of Municipal Administration and Water Supply, Government of TamilNadu. However, it is found from the details given in the Third State Finance Commission report that a sum of Rs.285.30 crores (upto 2006-07) relating to Urban Local Bodies is yet to be transferred. These 285.30 crores consist of several taxes that ought to be shared between the State and the ULB such as entertainment tax, surcharge on stamp duty, etc which are covered in detail in the following sections. The devolution package provided by the State to local bodies was initially meant for maintenance of existing assets and for those that are newly created and also for the payment of salaries to staff of local bodies. An Infrastructure Gap-Filling Fund and an Operation and Maintenance Gap-Filling Fund were created in order to fund the creation of new infrastructure by local bodies as well as their regular maintenance which were essential for provision of basic services such as water supply, sewerage etc. The current allocation is 3% towards the Infrastructure Gap-Filling Fund and 2% for Operation and Maintenance Gap-Filling Fund from out of the share of each tier. These two funds have provided the much needed resources to local bodies for the maintenance of their assets as well as to meet certain operational expenses. The table below shows the amount devolved under the Infrastructure Gap Filling Fund from 2007- 2010. Table 2: Infrastructure Gap Filling Fund Municipalities Corporations Town Panchayats % of Devolution Rs. In Crore 2007-08 (III SFC)
14.15 10.35 10.01
2008-09 (III SFC)
15.29 11.19 10.81
2009-10 (III SFC)
17.09 12.51 12.09
3% from out of the devolution amount
Total 46.53 34.05 21.94 Source: 2010-2011 Policy Note, Department of Municipal Administration and Water Supply, Government of TamilNadu. The State Finance Commissions have also recommended the sharing of resources amongst urban local bodies based on the nature of the ULB and their financial position. As recommended by the Third State Finance Commission, the total share of urban local bodies in the devolution grant from the State Government shall be distributed to Municipal Corporations, Municipalities and Town Panchayats in the ratio of 30:41:29 respectively. Apart from recommending guidelines for revenue sharing between the State and the local bodies, the three SFCs have also made several recommendations for the improvement of tax collection and augmentation of own source revenues. Some of the main recommendations that have been identified by the three SFC’s have been: revision of property tax rates and guidelines, professional tax rates, surcharge on stamp duty, sharing of entertainment tax, collection of advertisement tax by ULB’s, tax on vacant land, revision of license fees etc. While some of the SFC’s recommendations have been accepted by the State Government,

62
several others have been rejected. Subsequent sections of this chapter cover these aspects in detail. The role of SFC’s in decentralisation and devolution has not been free of criticism. Few of the main criticisms have been the (i) lack of adequate response to SFC from State Governments, (ii) composition of SFC’s are dominated by officials, a problem that seems to plague attempts at decentralisation since the 1900s, (iii) lack of monitoring mechanisms to ensure implementation of SFC recommendations, (iv) unreliable data that SFC’s are compelled to use and (v) minimal and imperceptible impact of SFC recommendations on local body finances (Joshi 2005). B.1. Sources of finance for Urban Local Bodies (ULB) in TamilNadu. The major sources of finances for ULBs in Tamil Nadu are: own revenues that include tax and non-tax revenues, and assigned revenues that include grants and loans from the government (Entertainment tax, Surcharge on Stamp Duty and Local Cess/Local Cess Surcharge); According to the TamilNadu District Municipalities Act 1920 which is modelled on the Chennai City Municipal Corporation Act 1919 (on which other city corporation acts such as Madurai, Coimbatore, Trichy etc are modelled on), tax revenues that can be levied by an ULB or municipal council are described under Sec 78, Sec 78A, Sec 79, Sec 88, Sec 88 –A, Sec 93, Sec 98, Sec 116, are:
• Property tax;
• Profession tax;
• A tax on carriage and animals;
• A tax on carts;
• Tax on advertisements other than advertisements published in the newspaper and advertisements broadcast by radio or television;
• A hill station municipal council may also levy a tax on servants;
• Pilgrim Tax;
• Surcharge on transfer of Property (decreased from 5%-2% since 21.11.03);
• Miscellaneous income such as income from interest on deposits.
Though there are a range of taxes that the ULB can derive its revenue from, property tax and profession tax are the major sources. The following sections deal with property tax and profession tax in detail. B.1.1. Property tax Property Tax is the most important tax source of revenue to Urban Local Bodies, particularly in a non-Octroi State like Tamil Nadu. According to the State Finance Commissions reports, property tax constitutes anywhere between 30-60% of municipal revenues. Tables 3 to 6
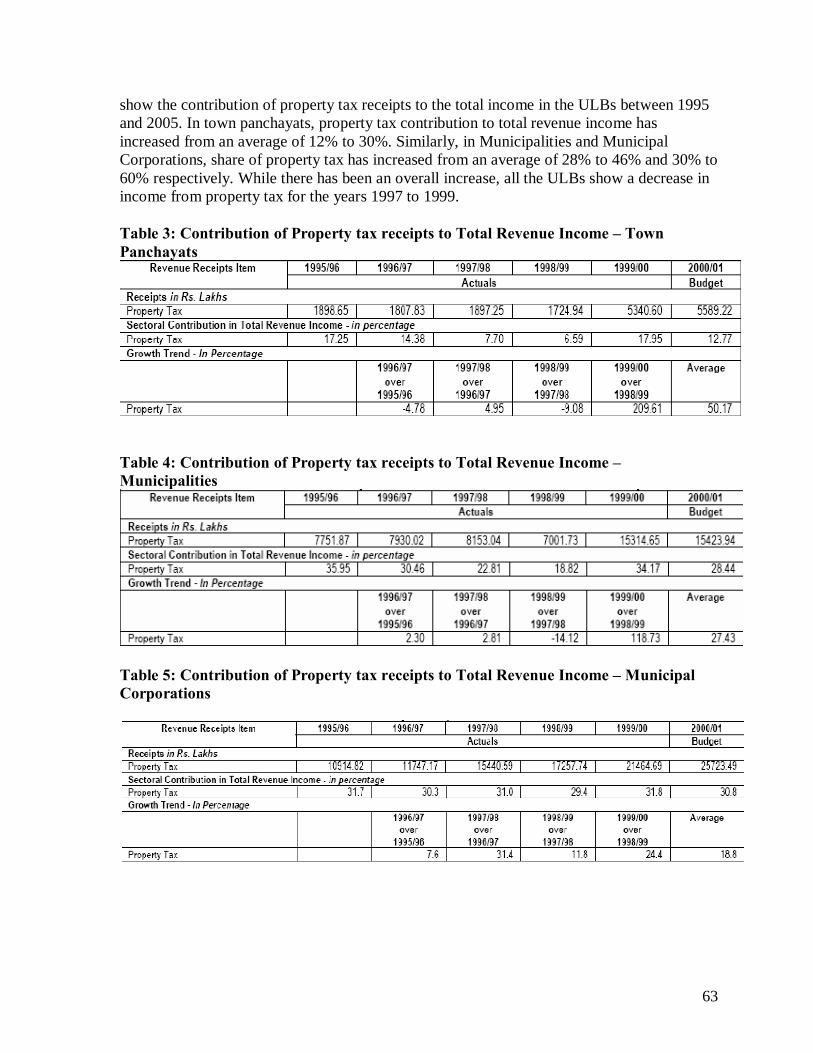
63
show the contribution of property tax receipts to the total income in the ULBs between 1995 and 2005. In town panchayats, property tax contribution to total revenue income has increased from an average of 12% to 30%. Similarly, in Municipalities and Municipal Corporations, share of property tax has increased from an average of 28% to 46% and 30% to 60% respectively. While there has been an overall increase, all the ULBs show a decrease in income from property tax for the years 1997 to 1999. Table 3: Contribution of Property tax receipts to Total Revenue Income – Town Panchayats
Table 4: Contribution of Property tax receipts to Total Revenue Income – Municipalities
Table 5: Contribution of Property tax receipts to Total Revenue Income – Municipal Corporations

64
Table 6: Property Tax Receipts of ULBs between 2000- 2005 Rs (in Crores)
Local Body Details 2000-01
2001-02
2002-03
2003-04
2004-05
Property Tax 35.73 54.29 39.79 40.31 51.2 Total Own Income 110.16 181.05 141.99 147.54 186.66
Town Panchayats Percentage of Property Tax in Own Income 32.4 29.9 28 27.3 27.4 Property Tax 159.24 173.24 181.33 185.81 199.28 Total Own Income 338.03 365.14 395.49 418.41 446.51
Municipalities Percentage of Property Tax in Own Income 47.11 47.44 45.85 44.41 44.67 Property Tax 211 250 253 302 323 Total Own Income 388 409 419 501 538
Municipal Corporation
Percentage of Property Tax in Own Income 54 61 60 60 60
Although property tax is the single largest source of revenue to the ULBs, several public finance experts believe it has not been utilised to its full potential due to improper valuation, inequitable rates, exemptions and rebates, absence of tax mapping and because it is politically unpopular to increase taxes (Gnaneswar). Between the years 1995-2001, percentage of property tax collection in ULBs has been averaging between 50-60% (table 7). It is believed that with the introduction of online payments of property tax and self assessment by property owners, tax collection in recent years has gone up to 75-80%. Table 7: Collection of Property Tax by ULBs between 1995 and 2001
YEAR COLLECTION DEMAND % OF COLLECTION
1995-96 109.14 crores 69.06 crores 63.27 1996-97 127.74 crores 75.13 crores 58.81 1997-98 166.48 crores 104.76 crores 62.92 1998-99 184.67 crores 112.95 crores 61.16 1999-2000 224.88 crores 129.00 crores 57.36 2000-2001 262.00 crores 135.60 crores 51.75 Source: Report of the Second TamilNadu State Finance Commission, 2001 The First SFC recommended the Annual Rental Value (ARV) method of property taxation where the rental value of the property is the basis for calculating property tax. The annual

65
value is the gross annual rent which the owner of the property is expected to earn after deducting 10% for the cost of building maintenance. In case of buildings that are not let out, the annual value is the total estimated value of land and the estimated present cost of erecting the building, less 10% depreciation. The ARV method sought to replace the plinth area rate method that prevailed since 1978. The plinth area method of property valuation did not provide sufficient revenue to the ULBs since it took into account the built-up area of the building and not the value of the entire property including the open space around the building. Also, the plinth area method was based on fixed rates which did not reflect the increase in property values over the years (Third TN SFC, 2006). Although property tax revision was meant to be undertaken once every five years, the first general revision was brought about in 1993. This revision sought to replace the property tax rates that were prevailing since 1978. But the revision in 1993 did not come into effect until 1998 due to delay in implementation and need for legislative approval. However the same guideline for tax revision issued in 1993 by the Government of TamilNadu were adopted during the general revision in 1998. Some salient features of this guideline are:
• Division of the town/city into viable zones
• Fixation of basic values for different zones for purpose of fixation of ARV of buildings and lands. The basic value is probable rental yield per sft. per month of residential properties. The basic values were fixed based on the rental values obtained for newly constructed reinforced concrete buildings measuring 1000 sft.
• Discounts based on the age of the building. The discount is nil for the buildings of 5 years in age. For buildings between 5-15 years it is 10%, for buildings between 15-20 years it is 15%, and for the buildings above 25 years age it is 20%.
• A discount of 30% is also allowed in respect of self-occupied buildings.
As the basic values are fixed in case of Reinforced Cement Concrete (RCC) buildings as a standard, a discount is allowed in case of the other buildings. A 25% discount is allowed for tiled, AC sheet and GA sheet roof buildings and 50% discount in case of thatched roof buildings. On the same analogy appreciated values are applied in case of non-residential buildings. In case of buildings used for industrial purpose, the basic value is double that of residential buildings and in case of commercial uses like nursing homes, Kalyana Mantapams, etc., the basic value will be thrice that of residential buildings. Property tax rates for Chennai Corporation and other ULBs At present, ULBs except Corporation of Chennai charge the following rates of property tax for buildings and vacant land since 1998: Table 8: Property tax components and rates charged by ULBs other than Chennai Corporation
Sl.No. Components Buildings Vacant Site

66
1. General Purpose 2% ¼ %
2. Street Lighting 1½% -
3. Scavenging 1¼% 1 1/6 %
4. Water Supply 7 1/8% -
5. Drainage 1 7/8% -
6. Education 2½% 1/16%
7. Total 16¼% 5/8 % Source: Corporation of Salem website: www.salemcorporation.gov.in Though ULBs were empowered to levy a separate water/sewerage tax under the TN Urban Local Bodies Act. 1998 (now under suspension) and the Second SFC had also recommended for such a levy, the State Government of TamilNadu did not issue the requisite orders. However, since new water and sewerage connections were already being given by ULBs on payment of a deposit and user charges were recovered on a monthly basis, the Third SFC recommended that a separate levy on water and sewerage was not necessary. As far as Corporation of Chennai is concerned, water and sewerage tax is not part of the property tax as the Chennai Metropolitan Water Supply and Drainage Board (CMWSSB) collects 7% of annual value of property as water and sewerage tax. Therefore the property tax rate within the limits of Corporation of Chennai includes a general tax, education tax and library cess. The table below provides the details of the property tax rates charged by the Corporation of Chennai for every six months (half yearly): Table 9: Property Tax Rates - (Per half year) for Chennai Corporation only Grade Annual
Value General Tax
Education Tax
Total Library Cess
Total
I Rs.1 – 500 3.75% 2.50% 6.25% 0.18% 6.43%
II Rs. 501 – 1000
6.75% 2.50% 8.25% 0.33% 9.58%
III Rs.1001 – 5000
7.755% 2.50% 10.25% 0.38% 10.63%
IV Rs.5001 and above
9.00% 2.50% 11.50% 0.45% 11.95%
Source: Report of the 12th Finance Commission available at http://www.tn.gov.in/budget/12thfincomm/default.htm accessed on April 11, 2011 Impact of Property Tax Reform in TamilNadu Since property tax revisions were not conducted on a regular basis, the tax burden on the citizens was bound to be very high. In order to overcome the tax burden every 5 years and to reduce the prevalence of under valuation of properties, the Government of Tamil Nadu imposed a ceiling on the enhancement of tax consequent to the general revision. In case of

67
owner-occupied residential buildings, it was stipulated that the enhancement should not exceed 50% of the pre-revision tax and in case of rented buildings, the ceiling was 100% of the pre-revision tax. In case of industrial buildings, it was 150% of the pre-revision tax. Further, it was also stipulated that the revised tax should not be less than the existing tax. Property tax assesses were expected to file returns of property tax and submit to the municipal officials who in turn were expected to verify the records and data and assess the buildings. The ceilings imposed on the rise, while benefiting existing buildings, led to a wide gap between old and new assessments. This problem has been common in states where the Governments put caps on increases due to implementation of new system according to the Annual Rental Value method. According to public finance experts, the solution to this problem lies in the conduct of general revision regularly as postponement always leads to high tax incidence due to revision and consequent taxpayer protests (Gnaneswar, NIUA). The figures for 102 municipalities (excluding the 43 municipalities that were upgraded from town Panchayats in 2004) ranged between 18% and 37% during 2004-05. In absolute terms, the revenues increased from Rs.77.51/- crore to Rs. 205.90/- crore by 2004-05 registering a cumulative growth of 165.6%. Over 100% growth during 1999-2000 was due to general revision effected in 1998 in municipalities (ibid). There appears to be much scope for exploiting property tax as an own source revenue in ULBs. The reforms initiated can yield better results only if it is supported by better collection performance. The Second SFC (2001) recommended several measures to improve yield from the property tax. Important suggestions include: ensuring that all properties are assessed through regular surveys and inspections; issue of assessee cards for all tax payers to maintain a record of tax payment; computerizing the entire tax administration; introduction of self-declaration to make tax administration simple, transparent and assessee-friendly; constitution of a guideline committee at the ULB level to rationalize the assessment and zoning process and zonal rates; levy of 2% fine per month for not filing or wrong filing of returns; bringing a parity between the old and new assessments in the next general revisions; and eliminating the time limit for proceeding with legal charges for recovery of tax. In addition to the recommendations made by the Second State Finance Commission, the Third State Finance Commission (2006) also made some recommendations on increasing the use of technology in municipal governance. Some of the key recommendations of the Third SFC are:
• Effect an annual increase in property values using land appreciation values or an inflation rate, so as not to impose heavy burden at the time of the 5-yearly general revision;
• Tax mapping using Geographical Information System (GIS)
• The use of computer- fitted mobile vans for tax collection
• Enhance rebate according to the age of property

68
B.1.2. Profession Tax
Innovative cases of in property tax reform in TamilNadu In a study of ten selected ULBs in TamilNadu conducted by the National Institute of Urban Affairs (1998), innovative instances of using property tax reforms to improve the tax revenue have been highlighted. Bodinayakanur and Arakonam are two First Grade municipalities in Theni District and Vellore district respectively. Since the finances of both these municipalities were in the red with deficit operating balances, it was decided to enhance the property tax rate. In Bodinayakanur, since the ARV was enhanced in 1998, the only way to augment the resource base was to increase the property tax rate from 13.8 per cent (half-yearly) to 16.5 per cent. This led to an increase from Rs. 71 lakhs to Rs.88 Lakhs, an increase of 23%. Apart from this, the municipality also achieved 100% tax collection by motivating the bill collectors through monetary incentives. In Arakonam municipality, the property tax rate had remained static for 25 years though the ARV had been periodically revised since 1987. The General Tax* component of Property Tax was enhanced from 2 to 4 per cent of ARV in 2000. This revision also restructured the share of different components of property tax, raising the General Tax from 2 to 4 per cent of ARV half yearly, and reducing the Water Supply and Drainage component from 5 to 2 per cent of ARV half yearly in 2001 (as per Council Resolution 341 dated 28/2/2000). Again in 2001, the general tax component was enhanced from 4 to 7 per cent by transferring 3 per cent from water tax, which was put into practice from 01/10/2001. As a result of the above changes, the property tax demand was increased to Rs. 92.93 lakhs from Rs. 80.38 lakhs, an increase of 15% in the municipality’s income. The above case studies show that ULB’s can use the revenue generating potential of property tax to improve their fiscal situation. However, a combination of bold decision-making by heads of municipalities, innovative methods of collection combined with co-operation from citizens and elected representatives of that area are critical to make this a success. *General Tax is the only component of Property tax that is untied and can be used for general functions of the ULBs.

69
Another important source of revenue for ULBs is Profession tax. Sec 93 of the TamilNadu District Municipalities Act 1920 authorises ULBs to levy tax on profession, trade, calling and employment. The rate of profession tax revised as per the G.O. No. 249 Municipal Administration and Water Supply Department as below with effect from 01.10.1958 till 2004 is as below: Table 10: Profession Tax rates prior to 2004
Sl.No Average half-yearly income Half yearly tax -1 (2) (3) From To Rs. Rs. 1 Upto 21,000 ---- Nil 2 21,001 30,000 60 3 30,001 45,000 150 4 45,001 60,000 300 5 60,001 75,000 450 6 75,001 and above ---- 600 Collection of professional tax by ULBs also presents a dismal picture. Data presented in the Third SFC report (Table:11) clearly shows that professional tax accounts for less than 40% of the income in Municipal Corporations and much less in Municipalities and Town Panchayats. Table 11: Income from Profession Tax (percentage of total income)
The increase seen in 2001-02 in town Panchayats is due to collection of arrears and the overall increase in 2004-05 is due to revision of tax rates across ULBs by 25-35% in October 2003. Due to the poor collection machinery of ULB’s the First SFC had recommended that the Commercial Taxes Department be given the responsibility of collecting professional taxes
Sl. No.
Year Municipal Corporations
Municipalities Town Panchayats
Village Panchayats
1 2000-01 38.29 22.54 12.10 N.A 2 2001-02 37.38 24.90 18.73 N.A 3 2002-03 38.19 25.59 12.74 17.55 4 2003-04 39.02 26.27 14.51 23.08 5 2004-05 60.51 29.96 17.48 36.45

70
under the Tamil Nadu Tax on Professions, Trade, Calling and Employment Act but the Government of Tamil Nadu in 1998 cancelled the Act and entrusted the responsibility with ULBs to collect that tax based on income for all prescribing Rs. 600 as the maximum tax rate from Rs. 900-1000. This resulted in loss of income for ULBs which was not compensated. In October 2003, an upward revision in the rate of professional tax by the councils of a few ULBs was undertaken. This revision, to be done once in every five years, was stipulated to be not less than twenty-five per cent and not more than thirty-five per cent. By virtue of this provision, some Municipal Corporations such as Chennai and Salem increased their professional tax up to 35% and 30% respectively. The revised rates are specified in the table below. Table 12: Revised Profession Tax Rates since 2003 (In Rupees) Sl. No. Average half-yearly income slab Rate after
35% increase Rate after 30% increase
Rate after 25% hike
1. Rs. upto 21000 Nil Nil Nil 2. Rs.21001 to 30000 81 78 75 3. Rs.30001 to 45000 203 195 188 4. Rs.45001 to 60000 405 390 375 5. Rs.60001 to 75000 608 585 563 6. Rs.75001 and above 810 780 750 Source: Report of the Third TamilNadu State Finance Commission Report, 2006 B.1.3. Other taxes and Assigned Revenues i. Advertisement Tax (ULBs): Tax on advertisements is another source of own tax revenue for ULBs. There are two parts to this tax: (i) tax on lamp posts, posters, writing on walls, buses and vehicles and (ii) tax on advertisement on hoardings. Prior to 1997, Chennai Corporation and other Municipal Corporations were collecting advertisement tax and based on the recommendations of the First SFC; necessary amendments were made to all other Municipal Acts to enable ULBs to collect tax on advertisement. However with an amendment in 2003, the State Government entrusted the power to collect the tax on advertisement hoardings to the district collector and amended section 285 (C) and 285(CC) of the District Municipalities Act 1920 accordingly. Due to misinterpretation of this amendment by officials, municipalities stopped collecting both the tax on hoardings as well as the tax on advertisements on lamp posts etc. Even within the tax on hoardings collected by district collectors, in 2004, the Government had instructed (vide letter No.26570/Elec/2003-2 dated 16.03.2004) the sharing of the tax proceeds between Government and the local bodies in the ratio of 75:25 respectively. However, the entire tax proceeds on advertisements have been credited to the Governments account. In several places including Chennai, advertisement tax has not been levied at all. As a result ULBs are not getting their share of 25% of the total advertisement tax collected leading to a loss in revenue to that extent. The Third SFC has recommended, apart from other things, to return the arrears to the ULBs and the rate of tax on advertisements to be revised. ii. Tax on Cable TV
71
Tax on Cable TV was first introduced in September 1994 by Amendment Act 37 of 1994. Under the Act, 40% of the total amount collected by way of contribution or subscription or installation or connection charges for Television shall paid to the State Government as Tax on cable TV. The value of 40% was subsequently reduced to 20% from 1st April 1995 (Section 2 of the Amendment Act No.21 of 1995). In 1997, it was decided through an amendment that tax should be paid on the basis of every connection instead of the gross receipts (Amendment Act No.38 of 1997) at a rate of Rs.20/- per connection in Municipal Corporation areas, Rs.15/- per connection in Municipal areas and Rs.10/- per connection in Industrial Towns / Town Panchayats / Village Panchayats. These rates were further amended in June, 2000 by Section 2 (1) by which local bodies were empowered to determine the rate of tax and also to collect and retain the collections. This was reversed in 2003 when the State Government was once more appointed as the agency to levy, collect and retain the taxes from the cable TV operators at a fixed rate of Rs.6000/- per month for those within the Municipal Corporation limits, Rs.3000/- per month for those in Municipality area, Rs 1,500/- per month in Town Panchayat area and Rs. 1000/ per month in Village Panchayat area. While amending the Entertainment Tax Act on Cable TV, the then Finance Minister announced that the Tax receipts from Cable TV would be passed on to the local bodies at the level at which they collected as on 31.03.2003. The following are the collection details (Rupees in lakhs)
• Municipal Corporation - 88.12
• Municipalities - 205.31
• Town Panchayats - 100.45
But no amount was passed on to the local bodies in 2003-04, 2004-05 and 2005-06. In the year 2008, the Government of Tamil Nadu vide G.O MS. No. 126 dated 19.12.2008, granted exemption from payment of entertainment tax arrears to the tune of Rs. 16 Crores to Cable TV operators and payment of entertainment tax w.e.f 1.4.2008. iii. Entertainment Tax (Assigned Revenue) Entertainment Tax collected according to the Tamil Nadu Entertainment Tax Act 1939 is an assigned revenue for the ULBs, i.e. the State Government levies this tax and assigns a portion of it to the ULBs. In Tamil Nadu, the First SFC recommended that 90% of the entertainment tax collected should be transferred to the ULBs. The Second SFC had also recommended the same and the Government issued orders in 2002 (G.O. Ms. No.90, Commercial Taxes Department, dated 12.7.2002) for transfer of 90% of the Entertainment Tax proceeds with effect from 1.4.97. However, the Government of TamilNadu has not amended the Tamil Nadu Entertainment Tax Act 1939 and continues to transfers only 65% of the proceeds. The total entitlement and the actual amount transferred for the period 1997-2002 are tabulated below. This includes the entitlement for 2000-01 and 2001-02 made under Section 5(A) and 5(B) of Tamil Nadu Entertainment Tax Act but not assigned to local bodies (Third SFC 2006).

72
Table 13: Entertainment tax entitlement and actual transfers to ULBs for 1997-2002 (Rs in Crores) Sl. No.
Local Body Tax Entitlement Tax proceeds transferred
Difference
1 Municipal Corporations 162,12,84,974 162,12,82,974 Nil 2 Municipalities 116,83,14,882 116,37,41,428 45,73,454 3 Town Panchayats 45,81,69,762 45,80,07,545 1,62,217 4 Village Panchayats 22,45,93,870 22,37,38,446 8,55,424 5 Panchayat Unions 28,18,708 28,18,708 Nil Source: Report of the Third TamilNadu State Finance Commission Report The total amount of Entertainment Tax collected during 2002-2005 and the amount transferred to local bodies are given below: Table 14: Entertainment Tax collected by the State Government and transferred to ULBs Year
Amount Collected(Rs. in Crores)
Amount Transferred
2002-03
73.95 81.35
2003-04
106.97
58.28
2004-05
61.05
44.15
Total
241.97
183.78
Source: Report of Third TamilNadu State Finance Committee Report 2006: 69 The amount which should have been transferred out of the total collection works out to Rs.217.78 crores whereas the amount actually transferred was 183.78, thus leaving a balance of Rs.34 crores. This, besides the dues from 1997-2002, constitutes a big sum which needs to be transferred. Reduction in Entertainment Tax rates: In addition to the arrears that are yet to be transferred to the ULBs, the Government has switched over from the compounding pattern to collection on gross admission with effect from 4.10.2004 (TamilNadu Ordinance 12 of 2004) where the taxes are recovered based on the number of tickets sold by the entertainment establishment. This was done to help the Tamil Film Industry that was said to be facing a period of hardship in 2004.This move by the State Government has resulted in substantial fall in income under Entertainment Tax during 2004-05 to Rs. 61.05 crores (Third SFC 2006) In this connection, it is important to note a recommendation made by the Twelfth Central Finance Commission that suggested consultations by the State with local bodies on decisions that resulted in a reduction in assigned revenue. If the decision resulted in a reduction in assigned revenues to local bodies, the Commission suggested that the Government should compensate the local bodies for the revenue lost.

73
Entertainment Tax Holiday for Films with Tamil Title: On 22.7.2006, with a view to promote the use of Tamil language in Tamil Films, the Government of Tamilnadu granted a full tax exemption for new films with Tamil titles (GO MS No. 72 CT & R (C1) dated 22-7-2006). While the data for the exact loss of tax revenue from this tax exemption is not available, officials in the Chennai Corporation claim that there has been a further decrease in the revenue assigned by the State Government and no compensation for this loss has been awarded. In the above context, the Third State Finance Commission has recommended the following:
• The Entertainment Tax dues from 1997-2002 and from 2002-2006 should be adjusted to local bodies in 2007-08 by the Government failing which the local bodies are entitled for interest at the maximum for the period of delay.
• Monthly adjustment of Entertainment Tax shall be made on 15th of the succeeding month instead of quarterly adjustment in view of the computerisation of functions.
• Collection charge shall be 1% of the tax proceeds and the balance 99% of Entertainment Tax shall be transferred to local bodies with effect 1.4.2007.
• The shareable components of the tax collected under Entertainment Tax should clearly be exhibited in the Revenue Budget by the departmental authorities so as to cross verify the deduct entry under transfer to local bodies.
• The local bodies should be consulted whenever any reduction in Entertainment Tax rate is contemplated and the loss in income should be compensated till the end of the award period of the Third State Finance Commission.
iv. Surcharge on Stamp Duty ULBs are entitled to a share of the surcharge on stamp duty on transfer of property. Prior to 2003, the surcharge on stamp duty in TamilNadu was 5% and this was brought down to 2% on 21.11.2003. The decision to reduce the surcharge was made between the State Government and the Government of India. Local bodies were not consulted in this decision despite the 12th Finance Commissions explicit mandate that local bodies should be consulted on issues that may reduce their share of assigned revenue. In addition to this decrease in surcharge that has reduced the revenue to ULBs, the State also retains a collection charge of 5% for ULBs and 3 % for Rural Local Bodies. Given below are the details on total surcharge collected and share transferred to local bodies from 2000-2005. Table 15: Total Surcharge collected and transferred to ULBs (Rupees in crores) Sl. No.
Year Total Surcharge collected
Allocation to Local Bodies
Collection charges retained
AG's figure on the transfers to the local bodies
1 2000-01 327.74 302.19 25.55 265.80 2 2001-02 408.98 382.55 26.43 179.22 3 2002-03 482.20 454.32 27.84 646.75 4 2003-04 468.36 444.52 23.84 513.69 5 2004-05 369.18 350.04 19.14 346.81

74
Total 2056.46 1933.62 122.80 1952.27 Source: Report on the Third TamilNadu State Finance Commission Report 2006 A discrepancy that can be seen from the table above is the disagreement on the amount that has actually been transferred to the ULB as given by the government and as collected by the Auditor General from the local bodies. It can also be noticed that collection charges are much higher than 5% that is prescribed. However, from the AG’s figures the total surcharge transferred to ULBs is higher than the amount allocated to ULBs by the State Government! A possible reason for this discrepancy could be the poor quality of data made available to the Third State Finance Commission by the Government of TamilNadu. There are a few other revenue sources of revenue that ought to have been shared with ULBs but have been neglected by the Government despite the recommendations of all the State Finance commissions. A perusal of this list shows the inaction of the State Government in passing orders to facilitate transfer of funds, or lack of initiative to bring about amendments to laws that are necessary for the transfer of financial powers to the ULBs. In some cases, transfer of revenue to ULBs has been held up due to non-receipt of orders by the respective departments. Annexure 1 provides a detailed tabulation of recommendations by the Third SFC and its implementation. B.2. Non Tax Revenue Income from regulatory fees and user charges form part of Non-Tax Revenue. A major portion of this income comes from water charges, Dangerous & Offensive license fees (D&O), building fees, development charges, lease rental and other fees and fines. From these incomes, a sizeable investment is made for water supply and sewerage schemes. Water Charges: Apart from Chennai, where the Chennai Metropolitan Water Supply and Sewerage Board supplies water, in all other ULBs water supply remains one of the core functions. Water in ULBs is either supplied through a Locally Administered Scheme or a Combined Water Supply Scheme administered by the Tamil Nadu Water Supply and Drainage Board (TWAD). Data from the Third SFC shows that except for Chennai, all other ULBs have large arrears payable to the TWAD Board. Even though the government has been revising the water charges under the Combined Water Supply Scheme, ULBs continue to charge a flat rate of Rs. 50/- to Rs. 75/- per month from residential and higher for industrial or commercial use. As on 31.3.2005, ULBs across the State owed the TWAD board Rs. 152.9 Crores (Report of the Tamil Nadu Third State Finance Commission Report 2006). C. DEBTS AND LOANS OF ULBS Apart from the tax and non- tax revenue and the Finance Commission grants, ULBs often borrow money from the Government of TamilNadu and other financial institutions to undertake capital expenditure. Given below is an agency wise distribution of outstanding loans as on March 2005. This position is likely to have changed with the introduction of JnNURM which has made a fresh pool of resources available to ULBs. Table 16: Municipal Corporations - Agency-wise outstanding loans as on 31.03.2005

75
(Rupees in Crores) Sl. No.
Municipal Corporations Govt. of Tamil Nadu and LIC
TUFIDCO Others
1 Chennai 0 63.03 69.49 2 Madurai 86.03 11.46 98.39 3 Coimbatore 72.37 0 81.16 4 Trichy 31.42 14.36 45.78 5 Salem 23.28 20.07 43.35 6 Tirunelveli 28.69 63.37 92.19 Total 241.79 172.29 430.36 Table 17: Agency-wise outstanding loans as on 31.03.2005 (Rupees in Crores) Sl. No.
Local Body Government
LIC TUIFSL TUFIDCO
Others Total
1 Municipalities 442.68 @ 355.62 506.89 540.53 1845.72
2 Town Panchayats 24.87 59.74 38.66 26.54 38.57 188.38 @ Combined figures of Government and LIC loans. Source: Report on the Third TamilNadu State Finance Commission Report 2006 Out of the total outstanding, Government of Tamil Nadu and LIC loans account for 30% of the total debt. These borrowings have been mainly used for water supply and drainage schemes where the cost recovery is low. Though lending rates have come down in the last few years, LIC and the Government funded loans continue to cost an interest of 13.5 %. TNUIFSL and TUFIDCO have consolidated the loans they provide mainly for remunerative projects, where cost recovery is comparatively better and are now charging 8%. The high interest rates charged by LIC and Government of TamilNadu, place a strain on the resources of ULBs. Interest pending on Government / LIC loans as on 31.03.2005 from Municipal Corporations / Municipalities and Town Panchayats are as follows:
• Municipal Corporations except Chennai - Rs.154.71 crores
• Municipalities - Rs.179.09 crores
• Town Panchayats - Rs.41.48 crores
In order to overcome these high debts, the Third SFC has recommended that ULBs seek a debt write-off from the State Government similar to the write-off that State governments seek from the Government of India. The quantum of relief for repayment and interest given to the State of TamilNadu for the period 2005-10 is Rs.1884.17 crores. D. GRANTS AND SCHEMES TO IMPROVE ULBS – JNNURM AND TNUDF Apart from own source revenue and grants/transfers from the state, municipal bodies also receive funds from the Jawaharlal Nehru National Urban Renewal Mission (JnNURM), TamilNadu Urban Infrastructure Financial Services Limited (TNUIFSL), and TamilNadu
76
Urban Finance and Infrastructure Corporation (TUFIDCO). TUFIDCO, apart from being the nodal agency for JnNURM, also functions as an agency to fulfill the infrastructure requirements of the ULBs. TNUIFSL is the financial agency that channelizes the flow of credit to the urban sector and currently operates three lines of credit from World Bank, Japanese International Co-operation Agency (JICA) and KfW of Germany. TNUIFSL is also the fund manager for the Tamil Nadu Urban Development Fund (TNUDF), a municipal development fund set up in 1996, the first public private partnership to provide long-term debt for civic infrastructure on a non-guarantee mode. TNUDF has its origin in the Municipal Urban Development Fund (MUDF), created in 1988 by the World Bank to fund urban infrastructure needs in the Indian state of Tamil Nadu. The successful track record of MUDF encouraged the Tamil Nadu Government to broaden its scope, and in 1996 the Tamil Nadu Urban Development Fund(TNUDF) was established with equity participations from the Government of Tamil Nadu, Indian financial institutions such ICICI, HDFC, and IL&FS, and a line of credit from the World Bank. TNUDF is hailed as a success for it has connected the local bodies to financial markets which were earlier inaccessible. It is said to have brought together the Government, private financial institutions, multilateral donors and local governments in development financing of urban infrastructure projects that benefit the urban poor. Since its inception the Fund has made several innovations that were unknown in Indian local development such as fostering private-public partnerships in the creation of social and environmental infrastructure, investments through the creation of Special Purpose Vehicles (SPVs), designing credit enhancement and government guarantee in financial arrangement, raising of municipal bonds, structuring securitization for projects, channeling inter-governmental transfers as well as creating an environment for community participation (Pradhan 2004). Over 500 projects covering water supply and sanitation, roads, bridges, streetlights, solid waste plants, bus stations, and shopping complexes in 90 out of 110 municipalities in the state of Tamil Nadu have been financed by the fund. It provides grants to ULBs to (i) subsidize the capital cost of projects, (ii) provide training and technical equipment, (iii) support project preparation and implementation, and (iv) support privatization and other innovative schemes. The fund supports capacity-building activities such as computerization of accounts and training development of municipal administration to improve ULBs’ management performance (ibid). JNNURM: Recognising the importance of Infrastructure for economic development and service delivery, the Government of India launched the JnNURM in 2005. In TamilNadu three cities have been taken up as mission cities namely: Chennai, Madurai and Coimbatore. Under this scheme, cities can seek funds to improve their infrastructure in the following areas: water supply and sanitation, sewerage and solid waste management, storm water drains, heritage areas, preservation of water bodies and traffic and transportation. The Government of India has so far sanctioned 52 projects with an estimated value of Rs 5565.66 crores. Details of these projects are given below in Table 18:

77
Table 18: Projects sanctioned under JnNURM in the cities of Chennai, Madurai and Coimbatore.
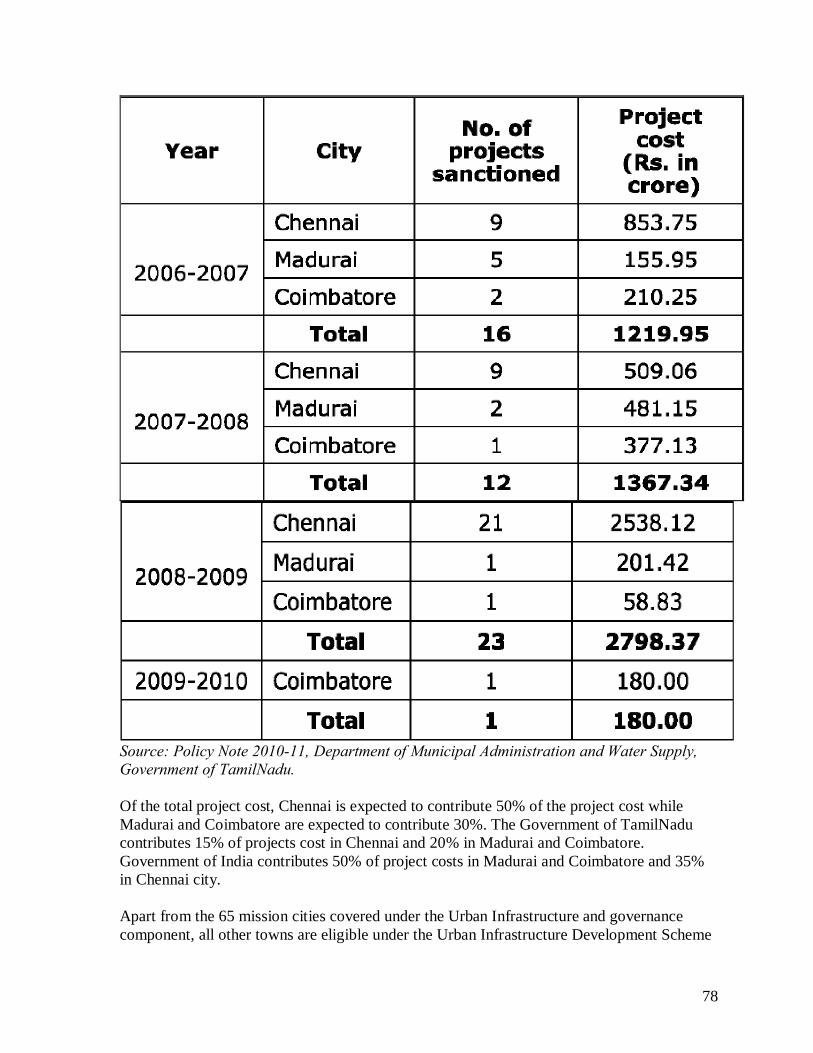
78
Source: Policy Note 2010-11, Department of Municipal Administration and Water Supply, Government of TamilNadu. Of the total project cost, Chennai is expected to contribute 50% of the project cost while Madurai and Coimbatore are expected to contribute 30%. The Government of TamilNadu contributes 15% of projects cost in Chennai and 20% in Madurai and Coimbatore. Government of India contributes 50% of project costs in Madurai and Coimbatore and 35% in Chennai city. Apart from the 65 mission cities covered under the Urban Infrastructure and governance component, all other towns are eligible under the Urban Infrastructure Development Scheme

79
for Small and Medium Towns (UIDSSMT). The sharing pattern under this scheme is different from the JnNURM in that maximum contribution of 80% is from Government of India, 10% from Government of TamilNadu and 10% from ULBs. From the list of projects reproduced below from the Municipal Administration Policy note of 2010-2011, there are five phases in project implementation amongst local bodies. It is apparent that several ULBs have chosen to improve their road network, water supply and drainage systems as their top priorities in improving infrastructure and basic services in small and medium towns.

80
Table 19: Details of projects under the UIDSSMT
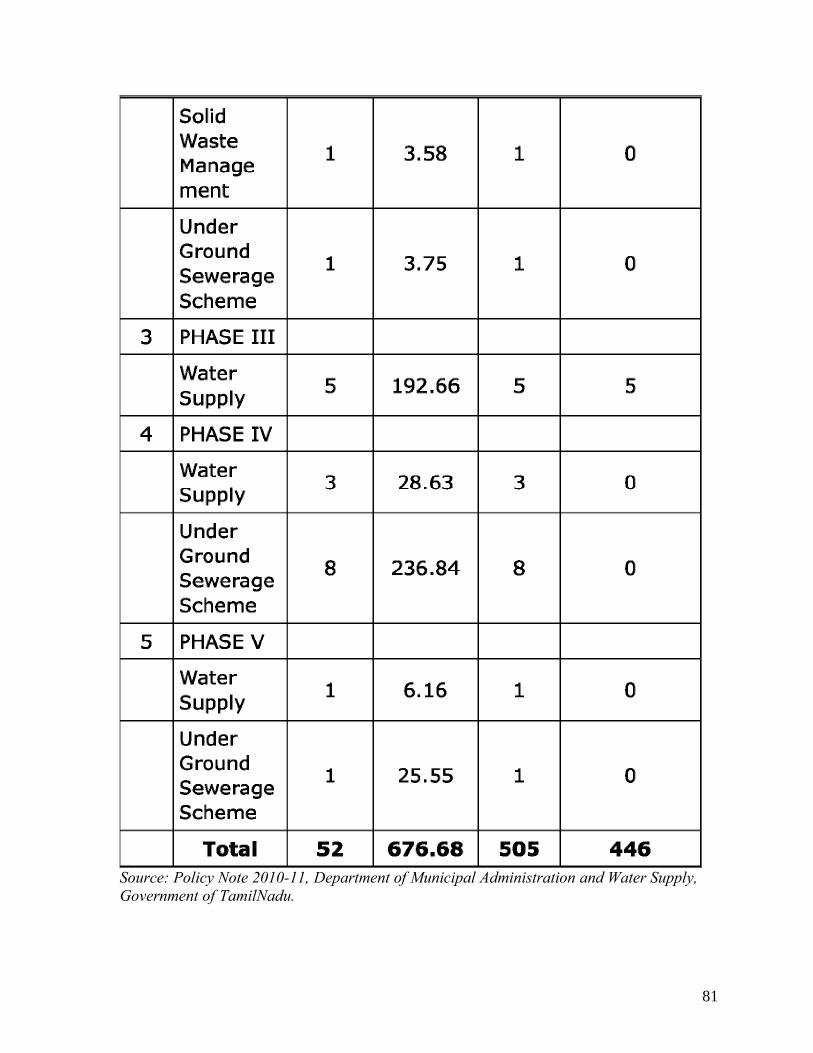
81
Source: Policy Note 2010-11, Department of Municipal Administration and Water Supply, Government of TamilNadu.

82
It is said that the JnNURM and the UIDSSMT has been a short in the arm for ULBs across the country since they have given the much needed financial support to improve basic services. However, there questions raised by critics on the capacity of ULB’s to handle such high value projects. Non-availability of adequate data on the share of JnNURM and UIDSSMT funds in the total budget of the ULBs has been a challenge in coming to any conclusion regarding the actual impacts of these two mega-schemes. E. CURRENT ISSUES FACED BY ULBS – SUMMARY Though the 74th Constitutional Amendment is regarded as a watershed in the history of Local bodies in India, the implementation of its provisions leave much to be desired. Devolution of funds to ULBs continues to be a major challenge. Despite recommendations of all three SFC’s and the Central Finance Commission, several grants and assigned revenues have not been transferred to the ULBs or have been inadequately transferred. ULBs are not consulted before decisions that affect their revenue sharing are made by the State Government such as entertainment tax holidays or decrease in surcharge on stamp duty etc. Collection of charges, fees and taxes are very poor in several municipalities and town panchayats. Though municipal corporations are better off, the use of technology such as GIS mapping, e-governance etc must be implemented with diligence across all grades of ULBs in order to improve collections. Several ULBs are unable to meet their own operating expenses and this is reflected in the arrears they owe to the TNEB and the TWAD Board. This situation is very unviable and creates an unhealthy dependence on the State apart from undermining their role as local self governments. ULBs are not given complete freedom to determine the rate of property tax, which is one of the major sources of revenues. Collection of property tax and profession tax must be streamlined in order to strengthen the financial position of the ULBs. ULBs must request an interest waiver from LIC and Government of Tamil Nadu similar to the waivers granted to the State by the Government of India. In addition to this, interest rates must be consolidated and made available at a reasonable rate. With the creation of para-statal bodies such as the CMWSSB, TWAD Board, CMDA and a few others, some key functions that are within the domain of the ULBs have not yet been devolved. While it may be true that the ULBs do not have the capacity to handle these functions at present, this incomplete devolution implies significant loss of revenue to the ULBs and undermines their role in governance.

83
CHAPTER FOUR
HOUSING 4.1 Introduction The provision of housing and the development of housing markets play a vital role in the process of urbanization. With the increase in demand for urban land, and as real estate values rise, the cost of housing and associated utilities tends to inflate, resulting in increasing sections of the urban poor and low income households being denied habitable living spaces. At the same time the growth in construction spurred by the demand for housing and related amenities results in increased inflow of migrants from rural areas to exploit the demand for labour. In the absence of affordable housing for the poor, slums and squatter settlements become the only viable option for such households leading to the persistence of slums in urban areas. The quantity and quality of housing stock are important factors in any assessment of housing conditions. Housing is a product whose value depends on numerous factors such as availability of drinking water, sanitation, drainage, access roads, electricity as well as socio cultural and lifestyle factors such as proximity to educational and health care facilities, recreational spaces, proximity to work and also the value arising out of the symbolic status of the neighbourhood. The increase in property values due to increasing pressure on land is one of the major impediments to providing affordable housing through market mechanisms. Access to necessary credit facilities for constructing or purchasing a house is limited to a small section of the population with adequate incomes. In a country where a large majority lives below poverty line and an overwhelming majority live at very low levels of income, it is inevitable that slums and squatter settlements not only persist but also pervade urban space. It is in this context that state intervention becomes essential for providing affordable and habitable housing for the majority of the urban population. The interventions of State and Central governments can be classified into three forms a) regulation of urban development, land use, and land ownership through legal frameworks, and control of rents and lease, b) facilitating individuals to invest in housing by providing accessible and soft credit through housing cooperatives and banks, and c) directly entering the housing market by building tenements and housing plots. We observe that all three forms of intervention are adopted by governments in order to tackle the housing crisis. The shift in emphasis from one to the other marks the changing trends in the housing sector. 4.2. Housing situation in Tamil Nadu Tamil Nadu, being the most urbanized state in India, has had to grapple with increasing pressures on urban land for residential use. High levels of rural to urban migration, high levels of informal work with low wage rates and high cost of land due to increased demand have together led to a proliferation of slums and informal settlements in and around urban

84
centers. The decades of the 1960s and 1970s witnessed the fastest growth in urban population in Tamilnadu. It was also the period that saw the proliferation of slums in cities, especially Chennai. The provisional population figures for 2011 released by the census department pegs the total population of Tamil Nadu at around 7.21 crores with a decadal growth of nearly 1 crore. While the provisional figures do not provide data on levels of urbanization, it reveals that the trend towards urbanization has continued. The district of Chennai comprising the entire Chennai Corporation remains the most populated district. Although the decadal growth of population in Chennai district has been lower than the state average (decadal growth of 7.8% as against 15.6% for Tamil Nadu)13, the districts adjoining Chennai — Kancheepuram and Thiruvallur — have become the fastest growing districts (decadal growth of 38.7% and 35.2% respectively) in Tamil Nadu. Chennai Metropolitan Area (CMA) is spread over the districts of Kanchepuram and Thiruvallur. From this it can be safely inferred that the population of CMA has grown faster than the population of Tamil Nadu. These being provisional results we need to look at the 2001 census data for a better appreciation of urbanization in Tamil Nadu. As per the 2001 Census, Tamil Nadu had an urban population of 2.75 crores14 (44% of total population), making it the most urbanized state in India. The majority of the population was concentrated in the three major urban areas of Chennai (43.43 lakhs), Coimbatore (9.30 lakhs) and Madurai (9.28 lakhs). Chennai city and its urban agglomeration had a population of 65.6 lakhs contributing nearly 23.8% of the urban population of Tamil Nadu. Census 2001 has also captured the slum population in the urban areas of Tamilnadu and is presented in the following table Table 4.1 Slum Population in Urban Tamilnadu
Sr No Name of the Corporation
Total Population Slum Population % of total
population 1 Chennai 4343645 819873 18.88% 2 Thiruchy 752066 178410 23.72% 3 Coimbatore 930882 58406 6.27% 4 Salem 696760 151577 21.75% 5 Madurai 928869 221338 23.83% 6 Tirunelveli 411831 59845 14.53% 7 Thoothukudi 216054 24851 11.50% 8 Thiruppur 344543 9183 2.67% 9 Vellore 177230 31719 17.90%
13 Provisional Population Totals Census 2011: Tamil Nadu from http://www.censusindia.gov.in/2011-prov-results/prov_data_products_Tamil Nadu.html 14 Census 2001

85
10 Erode 150541 22115 14.69% Total in Corporation 8952421 1577317 17.62%
11 150 Municipalities 8175567 2101956 25.71%
Grand Total 17127988 3679273 21.48% Source: TNSCB Using the census 2001 projections, the State Planning commission in its 2008-09 annual report has projected the demand for housing units in 2011 to be 26.27 lakhs, growing form 9.11 lakhs in 2001. It also estimates that the housing demand would further increase to 35 lakhs by 2016. Table 4.2a15 Estimated Housing need in Tamilnadu (in lakhs) 2001 2006 2011 2016 2021 2026 Population 624.05 659.34 696.62 736.01 777.62 821.59 Households 146.65 154.77 163.52 172.77 182.54 192.36 Number of Houses 139.70 Vacancy Rate 0.70 0.77 0.82 0.86 0.91 0.96 >60 years old building 2% 2% 2% 2% 2% 2% Demolition Rate 2.90 3.10 3.30 3.50 3.70 3.90 Total 10.58 18.94 27.91 37.38 47.40 57.98 Table 4.2b Estimated Demand for Housing in Tamilnadu (in lakhs) 2001 2006 2011 2016 2021 2026 Shortage 6.95 15.07 23.82 33.07 42.83 53.16 Vacancy 0.70 0.77 0.82 0.86 0.91 0.96 Replacement of Old Buildings
1.47 1.55 1.63 1.72 1.82 1.92
Total 9.11 17.39 26.27 35.65 45.57 56.05 Tables 4.2a and 4.2b point to the housing demand arising from the housing deficit and demolition of old houses. The population estimate for 2011 by census 2001 is lower than the provisional figures from 2011 by as much as 25 lakhs. It can be assumed safely that the demand for houses would be at least five lakh units more (given a household size of 5). This brings the total demand in 2011 to more than 30 lakh housing units. The demand for housing units exposes only one side of the issue. The condition of existing houses is also an important factor and has to be analyzed to evolve a holistic understanding of the housing situation in Tamil Nadu. According to the 58th round of NSS, conducted between July to December 2002, the estimated total number of urban households in Tamil Nadu was 59.09 lakhs, with a family size of 3.82 members per household. Table 4.3 presents a comparative analysis of the condition of housing in urban areas of Tamil Nadu. 15 State Planning Commission Annual Report 2008/Housing

86
Table 4.3 Condition of Housing in Urban Areas of Tamil Nadu (values per 1000 households)
Characteristic Classification Tamil Nadu All India
No Dwelling 2 1
Owned 475 599
Employer's Quarters 40 58
Hired Accommodation 423 366
Ownership of Dwelling
Others 60 83
Exclusive 278 306
Common 252 137 Access to Drinking water source
Public/Community 469 557
Attached 405 411
Detached 344 274 Type of Bathroom
Not available 251 315
Own 480 531
Shared 244 195 Public/Community 49 81
Availability of Latrine
Not available 219 179
Underground 243 292
Covered pucca 158 125
Open pucca 318 313
Open katcha 62 85
Type of Drainage
Not available 219 185 Living rooms 1.79 1.92 No of Rooms (per household) other rooms 1.37 1.31
Source NSS report no 488 ‘Housing Condition in India Housing Stock and Constructions NSS 58th Round July 2002 to December 2002

87
While the overall condition of housing in Tamil Nadu is similar to conditions in the rest of India, the table provides information about the important deficiencies in the quality of housing in Tamilnadu. Nearly 73% of the households in Tamil Nadu as against 68% of household in India do not have an exclusive source of water and have to depend upon community taps. Similarly, 21% of the households in urban Tamil Nadu have no access to sanitation facilities as against 17% in all of India. The picture as presented in table 4.3 gets more complicated as we analyze the availability of these facilities over different forms of settlement. Table 4.4 presents a comparison across different forms of settlement. The 58th round of NSS estimates the total number of urban households in Tamil Nadu to be around 59.09 lakhs of which 55.37 lakhs are housed in non slum conditions, 3.60 lakhs are in squatter and slum settlements and 10436 families are left without any dwelling. Table 4.4 Basic amenities and condition of housing in Tamil Nadu: Comparison between different forms of settlement
(values per 1000 households)
Characteristic Classification Tamil Nadu
Squatter and slum
other areas
no dwelling
Owned 475 609 530 NA Employer's Quarters 40 39 21 NA Hired 423 234 319 NA
Type of Ownership
Others 60 118 130 NA Exclusive 278 41 294 0 Common 252 78 265 0 Nature of Source of
Drinking Water Public/Community 469 881 441 1000
Attached 405 272 415 0
Detached 344 313 347 0 Type of Bathroom
Not available 251 415 239 1000
Own 480 188 500 0
Shared 244 209 248 0 Public/Community 49 181 40 682
Availability of Latrine
Not available 219 407 207 317
Underground 243 238 244 243
Covered pucca 158 82 163 NA Open pucca 318 220 325 NA Open katcha 62 64 62 NA
Type of Drainage
Not available 219 397 207 NA Living rooms 1.79 1.26 1.82 NA
Average No.of Rooms Other rooms 1.37 0.58 1.42 NA Source NSS report no 488 ‘Housing Condition in India Housing Stock and Constructions

88
This table reveals the skewed distribution of basic services among different forms of settlements, highlighting the need to reach services to the existing slums. For example a meager 4% of the slums are serviced by independent water lines, with over 88% depending on public taps. The table also indicates that nearly 40% of slums and 31% of those living without homes have no access to covered sanitation facilities (even public/community toilets). Even between the slums, the distribution of services and infrastructure is unevenly spread, with notified slums garnering a greater share of services while non-notified slums suffer from an acute lack of basic services. It has to be noted that while more than 50% of the slum population live in notified slum areas and 46% live in non-notified slum areas, the number of non notified slums are more than twice the number of notified slums, indicating the smaller size of these slums. Table 4.5 captures the skewed nature of infrastructure and service provisioning between notified and non-notified slums in urban Tamilnadu. Table 4.5 Extent and condition of Notified and Non Notified Slums in Tamilnadu (Values per 1000 slums)
Characteristics Categories TN
Notified Non Notified not+nonNot
Estimated no. of Slums 930 2234 3165
Households 331342 288276 619618 Private 138 Public 863 Ownership of Slum
Land Not known 0
Residential 824
Industrial 50 Commercial 96
Type of Surrounding Area
Others 31 Pucca 628 136 297 Semi pucca 219 329 296 Type of Structures Katcha 100 535 407 Tap 851 925 903
Tube well/hand pump 0 29 20
well 0 47 33
Source of Drinking Water
others 149 0 44 Pucca 715 283 410
Roads in Slums Katcha 285 717 590

89
Owned 259 0 76 Shared 105 131 123 Public/Community 381 143 213 Others 105 62 74
Type of Latrine
No facility 150 665 513
Arranged by govt 590
arranged by residence 79 Garbage Disposal
no arrangement 331 0.5 km 816 646 696 0.5-1 km 177 325 281 1-2 km 8 29 22
Distance from Primary School
2-5 km 0 0 0 0.5 km 217 260 247 0.5-1 km 421 329 356 1-2 km 362 260 290 2-5 km 0 110 78
Distance from health center
>5 km 0 41 29 Source NSS 58th round July-December 2002 As 86% of the slums are situated in government lands, the above data highlight the opportunities available to the state government to implement basic service provision as well as providing slum dwellers with security of tenure. While most slums have access to public water taps, nearly 65% of non-notified slums lack any form of sanitation facility as against 10% of the notified slums. Similarly most of the roads in non-notified slums are not black topped or cemented. In terms of primary schools and health care facilities, both the notified and non-notified slums are fairly well served. Tamil Nadu, being a highly urbanized state, tends to score better in access to health care and primary education as well as connectivity when compared to all India averages. On most counts, the notified slums in Tamil Nadu fare better than the All India average. But the conditions found in non-notified slums reveal significant deficiencies in provision of basic services. Given that non-notified slums in Tamil Nadu are twice the number of notified slums and accommodate 46% of slum dwellers, the lack of provisions in these slums affects a large section of the urban population. From the tables 4.3, 4.4, and 4.5 we can infer that the situation of housing in urban Tamilnadu presents a picture of uneven development. The provision of infrastructure and services to different categories and forms of housing vary significantly. While the condition of non-slum settlements in urban Tamilnadu is similar to the conditions in the rest of India, slums tend to suffer from severe lack of infrastructure and services. Even within this category, the non-notified slums tend to have grave shortages vis-à-vis water supply, sanitation and roads. This highlights the need for systematic investment in improving the infrastructure and service delivery mechanisms to reach out to slum households, which is one of the primary objectives of BSUP-JnNURM.

90
4.3. History of housing sector development in Tamil Nadu The development of the housing sector in Tamil Nadu can be tracked through three different phases. The immediate post-independence period was marked by the establishment of legal frameworks and institutions, improvements and amendments to colonial statutes to cohere with the policies of the post-independence Indian state, and a steady centralization and bureaucratization of the public housing sector and connected services. It was also marked by the increased role of public sector institutions in providing housing stock to keep pace with the growth of urban population. The second phase begins with the involvement of World Bank in urban development, through the Madras Urban Development Projects. The World Bank pushed for affordability and financial sustainability of projects through cost-recovery. This had a profound impact on the policies and programmes of the TNHB, TNSCB and the CMDA. The dedicated state agencies played a significant role in providing tenements and developed plots, especially to the economically weaker sections and low income groups. The CMDA also evolved township projects wherein it developed residential colonies and sold plots to middle income groups. The rationale behind these township projects was to disperse the population and improve residential spaces in upcoming industrial and commercial areas. The third phase began with liberalization and the consequent urbanization driven by increased commercial and service sector activity and real estate boom. This phase is marked by a relaxation of legislative control over land development as well as building control rules in order to make investments in land and real estate lucrative. Soft loans for middle income groups increased the contribution of private developers in providing housing for middle income groups. The state housing agencies began to concentrate entirely on EWS and LIG housing. The present phase is driven largely by the central government sponsored national level urban renewal mission (JnNURM) and its programs which have also attempted to restructure the policy and legal frameworks of urban development and municipal administration with emphasis on public private partnerships, decentralization and building the financial capacity of municipal bodies. The reforms under JnNURM will have significant impact on the functioning of the urban local bodies and consequently on the provision of basic services to households. The three phases are discussed below. Each phase is further divided into sections that discuss the urban scenario at the time, the institutional and policy changes that occurred during that time and its effects on the housing and urban development scenario. 4.3.1. Post Independence period (1950s to 1975) Urban scenario: Tamil Nadu was carved out of the Madras Presidency with Madras as the capital city. Madras, having been an important port city and the administrative capital of Madras presidency was already the fourth largest city in India. Madras had a long history of municipal administration. The municipal corporation was mandated to provide basic services for the city population and collect taxes to support the expenditure. After independence, the

91
City Improvement Trust (CIT) was formed in 1947 under the municipal corporation and it initiated a policy of providing housing plots with basic amenities at nominal installments, building tenements for low income groups, as well as providing brick houses for slum dwellers in the same location in order to ease the growth of slum conditions across Madras. The decade of 1960s saw a spurt of industrial activity, leading to an exponential increase in the population of Madras and resulting in an acute shortage of housing and an almost 120% increase in the number of slums16. This called for more effective and concerted action from the state government and local bodies. Evolution of policy, institutions and legislations: This period was marked by the enactment of legislations and amendments to existing municipal laws that were meant to regulate the development of the urban region. The Buildings (Lease and Rent control) Act, 1960 was passed in concurrence with the Central government legislation, to protect tenants from arbitrary evictions. In 1961, the Tamil Nadu State Housing Board Act was passed. The objective was to create an institution vested with legal authority to provide low cost, affordable and quality housing and services for different income groups. Under this Act, the Tamil Nadu Housing Board (TNHB) was formed in 1961 from the City Improvement Trust, with a mandate to develop housing sites across Tamil Nadu and to create satellite townships in the peripheral areas of cities. Table 4.6 presents the houses built by the board upto 1975. Table 4.6 Housing Tenements built by TNHB upto 1975 Income Category Chennai Rest of Tamil Nadu Total Economically Weaker Sections 843 3115 3958 Low Income Group 3947 2496 6443 Middle Income Group 3842 535 4377 Government Rental Housing 2113 5644 7757 Spl. Low cost housing 994 1500 2494 Total 11739 13290 25029 Source: MUDP Appraisal Report, 1977, World Bank TNHB had also developed land for housing to the tune of 50000 housing sites (40871 in Chennai and 9454 in rest of Tamil Nadu)17. The table reveals that most of the housing sites were provided for the low income groups (LIG) and middle-income groups (MIG). The World Bank report maintains that 50% of the families could not afford the cost of housing. The period from 1961 to 1971 saw a proliferation of slums in Chennai, leading to the acute need to solve the growing slum crisis. The Dravida Munnetra Khazagam (a regional party with a base among urban poor) came to power in Tamil Nadu 1967. It had made a promise to establish a separate agency to provide houses to the poor living in huts and promised that it would make Chennai slum-free in a decade. Thus in 1971 the Tamil Nadu Slum Areas (improvement and clearance) Act was passed and the Tamil Nadu Slum Clearance Board (TNSCB) was setup. The objective was to protect slum dwellers from arbitrary evictions, 16 The slums increased from 654 to 1202 (Rukmani, R. Slums of Madras City, (1985), interns report 3 Madras Institute of Development Studies. 17 ibid

92
provide security of tenure, improve the living conditions and if necessary to resettle them in tenements. The TNSCB was vested with the power to notify an area as slum area, to provide infrastructural facilities, to build tenements at the same site or to resettle slum dwellers in a nearby area if the slum is located in an inhabitable place or for any other reason. The TNSCB set the target of making Chennai slum free in seven years, which meant constructing more than 20000 tenements a year. However, it could only provide 30995 tenements in this period, which accounted for only 54% of the decadal growth of slum families18. Upto 1976, TNSCB had invested Rs 18.32 crores in slum clearance and tenement construction against Rs 3.42 crores spent in improvements to the slum environment19. In 1971, the state government passed the Town and Country Planning Act that replaced the Madras Town Planning Act 1920. The new act was meant to provide a legal framework for planned and regulated urban development. It prescribed that buildings in cities and towns have to adhere to zoning rules as well as building regulation rules as prescribed by the planning authorities in order to allow urban regions to grow in a planned and sustainable manner. It called for the establishment of agencies that could evolve holistic master plans and detailed development plans while also prescribing zoning and building construction norms. The Directorate of Town and Country Planning (DT&CP) was established to plan, regulate and monitor urban development in all areas except Chennai Metropolitian Area (CMA), while the Madras Urban Development Authority (presently Chennai Urban Development Authority; CMDA) was established with jurisdiction over the CMA. The CMDA, established in 1973 as a department under the Madras Corporation, was made into a statutory authority under the Department of Housing and Urban Development in 1975. These changes in the legal and institutional realm of urban planning and development laid the foundations for the implementation of numerous schemes and programmes to address the issue of housing and slums in urban Tamilnadu. Importantly, these institutional arrangements shifted the responsibilities for provision of housing as well as for urban planning away from local bodies and into the hands of statutory agencies directly under the state ministries. The role of elected local bodies began to diminish. Impact on Urban Development and Housing: As the issues of housing and slums became acute and spread to other cities and towns, the institutions that had hitherto catered to Chennai had to be expanded and legally mandated to carry forward their tasks. While the intensity of the housing crisis was recognized and dedicated institutions were set up to address the problem, these institutions remained strongly Chennai-centric. TNSCB focused on constructing multi-storied tenements for slum dwellers, most of which were in-situ. Most of the slums that were redeveloped into tenements were in areas considered non-objectionable. But the lack of financial support for the rather expensive programme of in-situ tenement construction led to severe constraints for TNSCB. The projects depended heavily on state funding, and proved unable to meet their targets or to provide facilities for the growing influx of poor into the cities. By 1981 only 17% (38186 families of 2.21 lakh households) of the slum dwellers in Chennai had been housed in tenements. On the other hand, the environment improvement scheme and the accelerated 18 From Ramani.Rukmani,(1985) Intern report 3, MIDS pp 142/table 73 19 MUDP1 appraisal report, World Bank (1977)

93
slum improvement scheme of the TNSCB provided improved services and infrastructure facilities to more than 87000 families, at a cost of 6 crore rupees. 4.3.2. The World Bank and Urban Development in Tamilnadu (1977-1990) Urban scenario: As was discussed above, while institutions had been set up, the lack of funding and the economic non-viability of projects had resulted in a very slow pace of addressing the urban housing crisis. CMDA had released the First Madras Master Plan for Chennai in 1975, which was approved in 1976. It called for massive investments in transport infrastructure as well as the development of townships in the urban peripheries. The first socioeconomic survey of slums in Madras was carried out by TNSCB in 1975. It estimated that nearly 50000 houses need to be built annually to make for the deficit within 10 years, and that a substantial number of these should be provided by TNHB and TNSCB for LIG and EWS categories. In the 1970s, the International Bank of Reconstruction and Development, or the World Bank, began to take interest in urbanization and issues arising out of it. The Bank after initial consultations with the Government of India and Government of Tamil Nadu provided the first installment of funding in 1977 for the first Madras Urban Development Project (MUDP I).
The primary objective of the World Bank was to provide affordable housing, so that costs, including interest, could be recovered. This was necessary to make the projects self-sustaining. The World Bank, therefore, advocated against building high-cost tenements in slum areas and pushed for improvement of slum areas and provision of basic services through its ‘sites and services’ scheme. The theory behind this approach was that low-income groups and slum dwellers would be able to invest in housing if they were provided with security of tenure, low cost land with adequate infrastructure, and low-interest credit. Institutional and policy shifts: The World Bank policy for urban development was that projects should be financially sustainable; in other words, they should be able to recover most of their costs through user charges. In order to recover the costs, it became important to invest in schemes and projects that would be affordable to the target group. Affordability thus became an important criterion in approving projects. Secondly, the World Bank wanted projects to be replicable, thus it emphasized setting up a revolving fund. Given the need for affordable solutions to the housing crisis, the World Bank insisted on the ‘sites and services’ scheme as well as in-situ redevelopment of slums. Thus the TNSCB and TNHB, who were the nodal agencies for the housing sections of MUDP I and MUDP II began to orient their activities along these lines. The MUDP I was implemented between 1977 and 1981. The total project cost was estimated at $52 million. It brought in grants and loans from International Development Agency to the tune of $24 million. One of its important recommendations was to provide freehold titles to slum dwellers in areas that had been improved under sites and services schemes, and lease-cum-sale deeds for families that were moved into the improved areas or into TNHB and TNSCB tenements. MUDP I proposed to provide housing for 13500 families under TNHB
94
and to improve the condition of 85 slum areas comprising 23000 households under the slum improvement component to be implemented by TNSCB. The World Bank insisted that the beneficiaries of tenement construction should be low income and economically weaker households, thus more than 93% of the tenements were built for different strata of EWS and LIG income category. . The MUDP II provided funding for the continuation and expansion of the earlier schemes. The total cost of the project was pegged at $87.9 million with TNHB and TNSCB getting about $40 million. Of the total 87.9 million, the IDA would provide grants and loans to the tune of $42 million. The MUDP II also emphasized cost recovery, stipulating clearly the extent to which costs need to be recovered. The slum improvement schemes were to ensure recovery up to 72% of the costs invested, while the site and services scheme was to recover 66% of the total cost. This was to be done through a system of cross subsidization, allowing lower income groups to access the scheme with a subsidized cost to be recovered by selling MIG plots at market rates. The MUDP II developed a set of guidelines and recommendations that were drafted by the appraisal team. The TNHB was asked not to spend more that 55% of its total expenditure on categories other than EWS, and TNSCB to not spend more that 3.75 crores annually on eviction and resettlement. The MUDP II targeted 15000 households to be provided with housing sites under the sites and services scheme and another 50000 families to be covered by the slum improvement scheme. Security of tenure for the households through freehold titles or lease-cum-sale deeds was an important objective of the two projects. The project implementation was delayed by over two years due to problems in acquisition of land and implementation of projects by the agencies. At the end of the project, MUDP II had achieved more than the target in the sites and services scheme as well as the slum improvement scheme. TNHB had provided 18300 tenements against the target of 15000, while TNSCB had covered 60000 slum families as against the target of 50000.20 In 1978, Tamil Nadu government enacted the Tamil Nadu Urban Land (Ceiling and Regulation) Act. The act was passed to release vacant undeveloped land in urban areas for development that would benefit the poor. The act allowed the government to prescribe a ceiling on vacant land holdings and allowed the state government to appropriate the excess land. It also placed limits on the extent of plinth area of dwelling units and on transfer of urban property. The act was passed in 1976 to concur with central government legislation on urban land ceiling. But its implementation has not been satisfactory, as very little urban land was acquired through this process. Many categories of ownership were also excluded from the purview of the urban land ceiling act. Problems in implementation also arose with more areas in the peripheries becoming part of Chennai’s metropolitan area. A former bureaucrat maintained that with erstwhile agricultural lands becoming lucrative real estate property due to the growth of the city, the urban land ceiling act was bypassed by property owners who divide large land holdings into residential layouts without the approval of CMDA and at times without getting clearance from the Urban Land Ceiling commissionerate for conversion. Over time the small holdings on which the new buyers had built their houses 20 Project Completion Report Madras Urban Development Project II, May 1993, World Bank

95
were regularized by CMDA. Many companies also claimed exemptions for being in distress. This along with issues such as benami holdings and legal suits to delay acquisition led to very poor implementation of the Land Ceiling Act. The cost of implementation of the act was becoming far in excess of any benefits that might accrue. Thus, the former bureaucrat maintains that the actual land acquired under the act was less than 10% of what was notified and only 10% of the land was redistributed. He maintained that the role played by the act in either facilitating or hindering the growth of housing stock was insignificant. In order to promote individual housing construction, the government of Tamil Nadu set up the Housing Cooperative Federation as a wing of TNHB in 1979 and in the same year made it an independent body. This department acts as an apex body to all housing cooperatives in the state and facilitates the construction of houses and purchase of plots by members within the low income and middle income groups. The department has implemented a number of housing schemes in both rural and urban areas for construction and improvement of LIG and MIG houses. It allows members to access low interest housing credits from financial institutions and banks like LIC, HUDCo, HDFC and other nationalized and cooperative banks.
Table 4.8 Loans provided by Housing Cooperative Federation till 2005 Sr.no Name of the scheme House
Constructed as on
31.3.2005
Loan issued (Rs in Crores)
1 EWS Urban Housing Scheme
28088 68.33
2 Urban Housig Scheme 312023 3052.60 3 Vambay scheme 7408 27.90 4 Repairs and Renewal
Scheme 59147 52.06
5 Mortgage Loan 6919 165.32 Source: Handbook of Housing Cooperative Federation
Impact on Urban Development and Housing Sector This phase had significant impact on the policy and institutional capacity of housing and urban development institutions in Tamil Nadu. The project completion report of MUDP II states that the capacity of the institutions involved in implementation of the project was vastly improved. The focus of housing development also moved away from expensive tenement construction to provision of infrastructure and services in slums and developing layouts for LIG and MIG categories. The MUDP II appraisal report also mentions that the TNHB was able to divert increasing resources to LIG and EWS, and that the EWS component, which was nil prior to the MUDPs, increased to 20% of TNHB projects by the end of MUDP I and would increase to 45% by the completion of MUDP II.

96
Some scholars21 maintain that the World Bank tried hard to dissociate the functioning of the boards and departments from political influence. While the boards were never completely outside the purview of political authority, the World Bank was successful in creating executive heads drawn from the bureaucracy rather than elected representatives or political appointees. This, the Bank maintained, was essential for continuity of the projects and the reforms. The Bank was able to leverage the boards and the government primarily because of the extent of funding. But this process further alienated the government agencies from control by the elected representatives of the people, leading to greater centralization and bureaucratization of urban development. It remains unclear how much the World Bank has achieved in making the CMDA, TNSCB and TNHB independent of political control, but the funding did aid in expansion of these boards and in building their capacity, even while it fell far short of the needed investment to meet the goals and targets. Researchers also contend that the institutional reforms did leave their mark as they made ‘cost recovery’ an important objective in all investments made by these boards22. The TNSCB and TNHB had been able to steadily recover costs, even though there remained delays as well as defaults. The revolving fund for both sites and services and slum improvement had become robust. The MUDP II appraisal report maintains that over 2.7 crores would be vested with TNHB as a revolving fund while the TNSCB would hold about 2.79 crores as a revolving fund.23 However, the MUDP II project completion report of the World Bank comments that the lease-cum-tenure component of TNSCB had not been well implemented and that the households in slum improvement areas were unevenly benefited. Similarly the report reveals that the agencies continued to direct funding from other sources to the construction of tenements. The report recommended that the IDA negotiate in such a way that agencies do not pursue objectives divergent to those of the MUDP, using other sources of funds. This reveals the resistance from the agencies to the World Bank’s efforts to shift the policies of TNSCB and TNHB away from eviction and expensive tenement construction. While the enactment of the Urban Land (ceiling and regulation) Act, did not have much influence on the housing situation, as very little land was acquired, much still redistributed, the rest of the legislative and institutional shifts, including the establishment of the Chennai Metropolitan Water Supply and Sewerage Board (CMWSSB) was towards further bureaucratization and centralization of functions of the local bodies with departments under the state government. It is to be noted that this was also the period when the local bodies had ceased to be elected bodies and were being directly administered by the Department of Municipal administration through Special Officers.
21 Pugh Cedric and Raman Nithya V, 22 Cedric Pugh claims that the cost recovery in MUDP II was upto 96%. 23 Refer table 7&8 of annexure 3 of the MUDP II appraisal report, (1980) World Bank

97
4.3.3. Liberalization, urban growth and financial decentralization of ULBs (1990s to present)
Urban scenario Liberalization of the Indian economy not only resulted in a spurt in industrial, service and commercial activities, it also led to a spurt in urbanization. While Chennai and other cities in Tamil Nadu do not show a large increase in population over and above natural growth rates, increasing economic activity has increased the demand for better infrastructure and land. With the Information Technology sector boom in India, Tamil Nadu began vying with other southern states to draw in as much investment to the sector as possible. Chennai was portrayed not only as a hub of the IT service industry but also as a hub for automotive and electronic industries, with numerous factories being provided incentives to set up shop in Chennai’s urban peripheries. Chennai and other cities were also becoming centers of commerce and consumption. All this resulted in increasing demand and pressure on land and had a direct impact on the real estate value of land in urban regions. It was also imperative that the policies of urban development and housing change to suit the free market direction of the economy. Even as the country was moving into an era of free market economics, after four decades of command economy mode, the central government pushed for the 73rd and 74th amendment to the constitution, paving the way for a significant decentralization of governance. The 74th amendment focused primarily on the reconstitution and devolution of powers to urban local bodies. It made the election to urban local bodies mandatory and also pushed the state governments to setup the state finance commission. These measures have empowered the local bodies to take up a greater role in providing basic services as well as planning and investing in infrastructure. Institutional and policy shifts: The 74th Amendment to the Constitution meant that the state government, which had until then consistently centralized administrative powers and responsibilities for provision of basic services in urban regions, had to devolve these powers to elected local bodies. The 74th amendment, to an extent has reversed the trend in urban local governance, by reestablishing the relevance of local bodies in urban planning, infrastructure improvement and service delivery that had been shrinking over the earlier decades. But the process remains unfinished with many critical areas of urban governance still outside the purview of local bodies. In order to streamline the finances of the urban local bodies and support them in accessing loans directly from financial institutions, the state government established TUFIDCO, (Tamil Nadu Urban Finance and Development Corporation), a limited company under the Companies Act. It was jointly held by the government of Tamil Nadu (96.9%) along with municipalities and HUDCO which held marginal shares. TUFIDCO is presently the nodal agency of the UIG mission of JnNURM, supporting the ULBs to come up with detailed plans for providing basic services. Even while TUFIDCO is not directly involved in either BSUP or the IHSDP schemes under JNNURM and UIDSSMT respectively, its role becomes important in the larger scheme of improving the service delivery and financial management

98
of ULBs who continue to play an important role in providing services like roads, street lights, storm water drains, solid waste management, and in some cases water supply and sewerage to households. The State government repealed the Urban Land (ceiling and regulation) Act in 1999 when the Central government repealed the Act. The act had become controversial, with many planners and policy makers claiming that it was inhibiting large scale investments in the housing sector. While the reason for enacting the law in 1976 was to increase the availability of land in urban areas, the same reason was presented for the repeal of the act. It was argued that the act had not been implemented well and was only causing more land to be locked up. Those in support of the act, however, argued that a mere lack of implementation cannot be justified reason for its repeal24 Following the repeal of the act, the government ordered that the land that had been acquired and was vested with the State be allotted to TNSCB, TNHB, electricity board, CMWSSB, and other departments of the government. The remaining land was to be sold to private players through auction-cum-tender. All the land that was currently under litigation was to be returned to the owners. One of the reasons presented in the JnNURM reforms document25 for the inclusion of this provision (repeal of urban land celing act) in the mandated list of reforms was that it would encourage foreign investments in urban housing and development. It becomes apparent from this that the policies of Central and State government towards distribution of land in city had shifted. From being a regulator of urban development and provider of low cost, affordable housing, the government was transforming itself into a facilitator for private investments. In 2000, the Tamil Nadu government moved an ordinance to amend section 113 of the Town and Country Planning Act, which was meant to restrict and penalize buildings that violated the building regulation rules. The government moved toward regularizing these buildings by amending the Act in such a way as to provide for a penal fee which would condone the violations. This amendment was challenged in the High Court, which, while upholding the amendment, maintained that it can only be a one-time solution and set the cut off date for buildings eligible for regularization as 199926. Subsequently, however, the government has passed ordinances every year to extend the cut off date for eligibility, while reducing the regularization fees27. The state government has also been attempting to relax the multi-storied building regulation rules and other rules that regulate the proliferation of buildings in the city. It has been argued that this is being done primarily to facilitate builders and land owners to enjoy increased real estate value. In 2007, the Madras High Court ordered the Public Works Department to initiate a drive against encroachments on water bodies. At the same time, the Government of Tamilnadu passed the Tamilnadu Protection of Tanks and Eviction of Encroachments Act 2007. It gave
24 Sudha Mahalingam, ‘The false ceiling’ in Frontline, Vol 15 No 16 Aug 1-14, 1998 25 http://jnnurm.nic.in/nurmudweb/Reforms/Primers/Mandatory/5-RepealULCRA.pdf 26 Refer high court order dated 23.8.2006 in consumer action group vs state of Tamil Nadu 27 Refer GO no 190 municipal administration and water supply dt 3.6.99, GO No 121 HUD department dt 24.4.2002 and GO No 11 Municipal Administration and Water Supply dt 19.1.2006

99
the PWD the right to take action against any encroachment on water bodies and to evict them after a notice period of 21 days. The drive to conserve the fast depleting water bodies, especially in water starved cities like Chennai has led to series of eviction drives. Urban peripheries like Ambattur and Porur have been cleared of encroachments. Many of the households have been relocated by PWD to revenue lands without any infrastructure facilities for the provision of water, sanitation and transport. The court verdicts have also allowed the state government to plan and embark on large scale projects to clear encroachments along river banks and other water ways. In order to rehabilitate the evicted families, TNSCB has launched massive tenement construction activity in urban peripheries of the three major cities, Chennai, Coimbatore and Madurai. Most of the projects are being funded under JNNURM-BSUP projects. The central government has also been taking greater interest in improving urban infrastructure by providing large grants and facilitating loans through HUDCO under different schemes. Under the Valmiki Ambedkar Awaz Yojana (VAMBAY) various agencies in Tamil Nadu have constructed or repaired 121541 houses and 23930 toilets28. The TNSCB has constructed 17250 tenements across Tamil Nadu and repaired 30000 houses under this scheme for a cost of 84 crores29. TNSCB, with its mandate to provide low cost housing and tenement for the poor across Tamilnadu, has primarily concentrated on Chennai. Until the launch of the JNNURM, TNSCB had constructed more than 91,000 tenements across Tamilnadu, of which more than 82000 were built in Chennai. Table 4.9 presents the split of TNSCB tenements by city and division. Table 4.9 Tenements Constructed by TNSCB upto 31.3.2009
Sr No
TNSCB Division City/Town No. of tenements
1 Chennai Division 1 Chennai 11040 2 Chennai Division 2 Chennai 6212 3 Chennai Division 3 Chennai 12947 4 Chennai Division 4 Chennai 6010 5 Chennai Division 5 Chennai 13989 6 Chennai Division 6 Chennai 12561 7 Madurai Division Madurai 1520 8 Salem Division Salem 1472 9 Coimbatore Division Coimbatore 1738 10 Coimbatore Division Thiruppur 240 11 Coimbatore Division Erode 1880 12 Trichy Division Trichy 927 13 Trichy Division Karur 256 14 Trichy Division Kumbakonam 206
28 Statewise Cummulative details of Vambay Scheme, Ministry of Housing and Urban Poverty Alleviation (http://mhupa.gov.in/programs/upa/nsdp/vambaypdf/vambay_cum.pdf) 29 TNSCB cumulative achievement data upto 2006

100
15 Trichy Division Thanjavur 294 16 Trichy Division Nagapattinam 117 17 Thirunelveli Division SangaranKoil 48 18 Thirunelveli Division Thirunelveli 704 19 Thirunelveli Thoothukudi 160 20 Grand Total 91917 Source: TNSCB
The central government launched the Jawaharlal Nehru National Urban Renewal Mission (JNNURM) in 2005 with sub-missions for providing Basic Services to the Urban Poor (BSUP) and Integrated Housing and Slum Development Programme (IHSDP). Tamil Nadu has sent in 248 proposals under IHSDP of which 84 projects have been approved, covering 37585 dwelling units at a total project cost of Rs 515 crores30. The 2008 Policy Note of the Department of Housing and Urban Development, Government of Tamil Nadu, set a target for provision of 80000 tenements between 2006 and 2011. It further mentioned that through JnNURM, TNSCB planned to resettle more 35000 families living in both objectionable and unobjectionable slums in Chennai. TNSCB has also taken up relocation and resettlement of urban slums under the BSUP component. Officials at the board maintained that all the projects that they have undertaken under BSUP are relocation projects as no land is available in mission cities for in-situ redevelopment. Table 4.10 BSUP projects undertaken by TNSCB in mission cities
Sr No Name of the City
Name of the Prioject
No. of Tenements
Project Status as of May 2011
1 Chennai Perumbakkam Phase I 10452
2046 in progress, rest to be
commenced
2 Chennai Perumbakkam Phase II 9476 To be commenced
3 Chennai Ezhil Nagar 9936 On progress Total (Chennai) 3 projects 29864
4 Coimbatore Ukkadam I 2232 In Progress 5 Coimbatore Ukkadam II 9600 To be commenced 6 Coimbatore Ammankulam 1608 In progress
Total (coimbatore) 3 Projects 13440
7 Madurai Periyar Nagar 1566 720 completed to be
allotted; rest in progress
Grand Total 7 projects 35270 Apart from maintaining that they would evict and resettle families from objectionable areas, the officials are prompt to point out that they would also be evicting slum dwellers from government-owned land meant for infrastructure projects or other public purpose. This policy 30 Refer JnNURM website on IHSDP

101
enables TNSCB and other agencies to evict slum dwellers from lands that might otherwise fall within notified as well as non-objectionable sites. It becomes clear that with the availability of large scale funding as grant and low interest loans, the government has begun a massive drive to clear scarce urban land of slums and that housing agencies having been tasked with the role of resettlement of these families in urban fringes. In 2009, the CMDA presented the Second Chennai Master Plan in which proposals for relaxing Floor Space Index (FSI) for certain buildings while allowing enhanced FSI for additional fee and taxes (premium FSI) have been mooted31. The government of Tamil Nadu defended its orders staying the demolition of buildings that were in violation of building control rules, by arguing that, as CMDA had recommended the relaxation of FSI norms, it would be hasty to conduct demolitions against illegal buildings before a decision had been taken on this recommendation. Here again, it is clear that the policy in urban planning has shifted to providing incentives to private investors to invest in real estate rather than regulating urban growth. Impact on urban development and housing: The current paradigm in urban development and housing policies is clearly revealed in the policy documents of the Department of Housing and Urban Development. The process of liberalization, combined with the flow of grants and infrastructure investments by foreign financial institutions, has meant that departments are not cash strapped any more. Given the need to augment urban infrastructure to supplement the growth of commerce and industry, the government has embarked on massive investments into infrastructure building projects like TNUDP and JnNURM. The pressure on urban land has increased manifold leading to a shift in policies on housing and slums. While the earlier phases had emphasized in-situ redevelopment of slums, the present phase is marked by relocation of slum dwellers to urban peripheries. The increasing need for better roads and rail systems as well as environmental improvement through parks and open spaces has put a premium on urban land, resulting in the eviction of slum dwellers from the city limits. While the TNSCB clearly mentions in its objectives that its aim is to prevent arbitrary evictions and secure decent living conditions for slum dwellers in proximity to their place of work, the present paradigm has been relocation of slum households to urban fringes in order to release the land for eco-restoration, beautification and tourism, or projects for “public good”. This phase has also witnessed the formation of two new institutions that are part of the public-private partnership model and have been set up to promote financially sound, profitable projects that can bring in corporate investments. While TUFIDCO remains largely an expert body that facilitates municipal councils and small towns in accessing credit from financial institutions, TNUDF which is a partnership between the State and financial institutions, is geared towards developing projects that are viable for public-private partnerships. The relaxation of building control rules and land ceiling, together with emphasis on the role of private institutions in urban infrastructure development, points to an increased orientation towards free market-driven urban development where governments become facilitators of private investment, including in housing sector. 31 Refer GO no 163 of housing and urban development department dt 9.9.2009
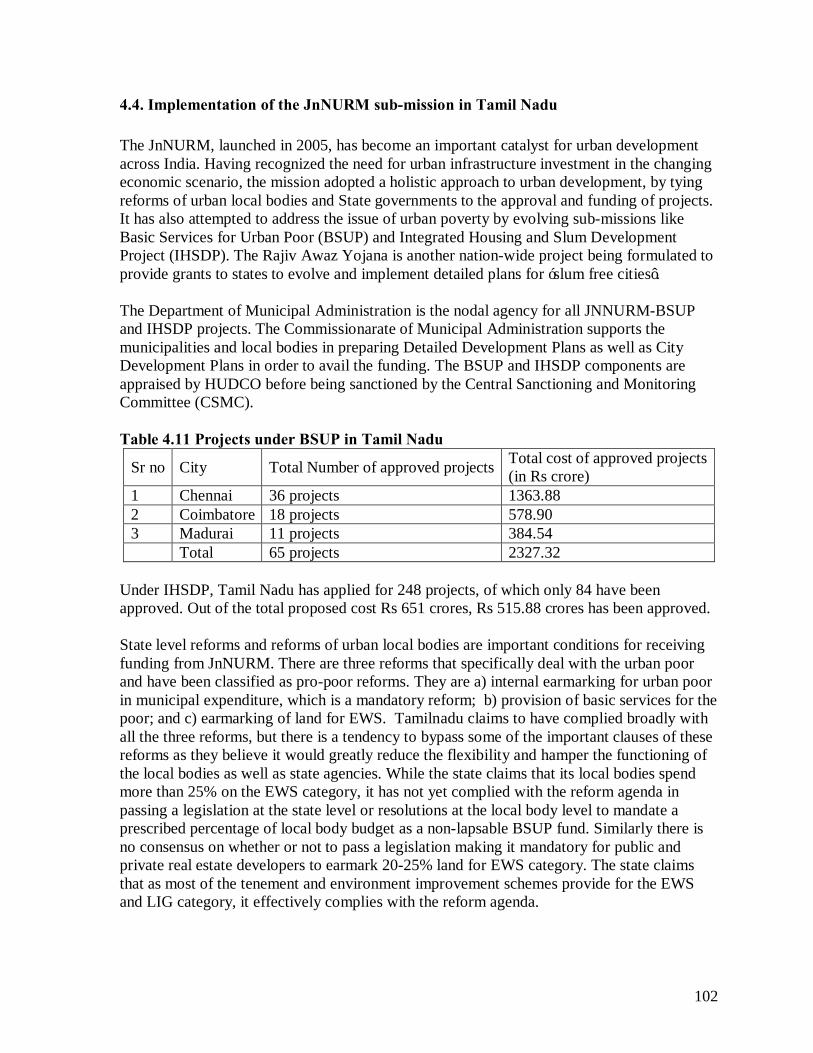
102
4.4. Implementation of the JnNURM sub-mission in Tamil Nadu The JnNURM, launched in 2005, has become an important catalyst for urban development across India. Having recognized the need for urban infrastructure investment in the changing economic scenario, the mission adopted a holistic approach to urban development, by tying reforms of urban local bodies and State governments to the approval and funding of projects. It has also attempted to address the issue of urban poverty by evolving sub-missions like Basic Services for Urban Poor (BSUP) and Integrated Housing and Slum Development Project (IHSDP). The Rajiv Awaz Yojana is another nation-wide project being formulated to provide grants to states to evolve and implement detailed plans for ‘slum free cities’. The Department of Municipal Administration is the nodal agency for all JNNURM-BSUP and IHSDP projects. The Commissionarate of Municipal Administration supports the municipalities and local bodies in preparing Detailed Development Plans as well as City Development Plans in order to avail the funding. The BSUP and IHSDP components are appraised by HUDCO before being sanctioned by the Central Sanctioning and Monitoring Committee (CSMC). Table 4.11 Projects under BSUP in Tamil Nadu
Sr no City Total Number of approved projects Total cost of approved projects (in Rs crore)
1 Chennai 36 projects 1363.88 2 Coimbatore 18 projects 578.90 3 Madurai 11 projects 384.54 Total 65 projects 2327.32
Under IHSDP, Tamil Nadu has applied for 248 projects, of which only 84 have been approved. Out of the total proposed cost Rs 651 crores, Rs 515.88 crores has been approved. State level reforms and reforms of urban local bodies are important conditions for receiving funding from JnNURM. There are three reforms that specifically deal with the urban poor and have been classified as pro-poor reforms. They are a) internal earmarking for urban poor in municipal expenditure, which is a mandatory reform; b) provision of basic services for the poor; and c) earmarking of land for EWS. Tamilnadu claims to have complied broadly with all the three reforms, but there is a tendency to bypass some of the important clauses of these reforms as they believe it would greatly reduce the flexibility and hamper the functioning of the local bodies as well as state agencies. While the state claims that its local bodies spend more than 25% on the EWS category, it has not yet complied with the reform agenda in passing a legislation at the state level or resolutions at the local body level to mandate a prescribed percentage of local body budget as a non-lapsable BSUP fund. Similarly there is no consensus on whether or not to pass a legislation making it mandatory for public and private real estate developers to earmark 20-25% land for EWS category. The state claims that as most of the tenement and environment improvement schemes provide for the EWS and LIG category, it effectively complies with the reform agenda.

103
4.5. Conclusion The housing sector in Tamilnadu presently is widely diversified with numerous private developers venturing into large-scale, township-size housing communities. The relaxation in building control rules, the scrapping of the Urban Land Ceiling Act, and the availability of credit to potential buyers have allowed property developers to invest in a wide array of high cost housing. But land remains a significant problem leading to the continued suburbanization of major cities. State agencies like CMDA, TNSCB and TNHB have turned their attention towards EWS and LIG groups. While eviction of slums from road margins and private land has been pursued through out the history of Tamil Nadu, the shift from in-situ redevelopment of slums in non-objectionable areas to summary evictions with the objective of releasing land for large infrastructure and environmental improvement schemes, marks a departure from the previous decades. Since the late 1990s, the TNSCB has concentrated on developing multi-storied tenements in the outskirts of the Chennai Metropolitan Area. These projects are primarily funded by various central government schemes like JnNURM, UIDSSMT, IHSDP and VAMBAY or World Bank-sponsored schemes like Emergency Tsunami Reconstruction Package. It has presently built over 20000 tenements and is further planning to construct another 30000 tenements to rehabilitate families evicted by infrastructural projects. While the 70s and 80s saw recognition of the rights of slum dwellers and squatters, the present policy documents highlight the environmental degradation caused by unplanned settlements and declare that all slum areas will be evicted to make Chennai a slum-free city in the coming decade. The State government has also made it a policy to provide the land for major infrastructural projects in order to keep the cost down and make it attractive for private players to invest in the same. The present paradigm marks a period of decentralization of governance and reforms that seek to make local bodies creditworthy and capable of financing investments in civic infrastructure. The dominant trend in the housing sector is the state’s growing distance from direct provision of housing stock for most of the population, and its role in facilitating access to lines of credit. But given the need to provide dwelling for the slum population, this period has also witnessed large-scale tenement construction activity by the TNSCB in particular. One significant feature of all three phases is the fact that finance has been the most important concern of all the agencies and therefore the financier has been the master, dictating the direction of projects and policy. In the first phase, the state government actively created policies, but eventually took a secondary role in programme- and policy-formulation as the World Bank, which brought large amounts of funding, demanded a reorientation of policy. Presently, it is the central government that is demanding that institutions and legal frameworks be reformed so that the functioning and financial administration of municipalities, as well as laws that influence investment in urban development, are uniform, enabling greater flexibility and clarity for investors. There has been resistance from government and state agencies and it has primarily taken the form of bypassing the reform agenda or implementing them partially, but overall the direction of urban planning and

104
development has been oriented towards the objectives of the institution that provides the funds. The second significant feature is that institutions and agencies have become more professional, with financial soundness and management becoming primary objective to welfare gains and political demands. Nithya Raman (2008) has claimed that the TNSCB was primarily founded as a tool to extend welfare goods to political vote banks, but the intervention of the World Bank changed it significantly. TNSCB also developed the required staff strength and expertise to handle efficiently the large volume of funding that was brought by the World Bank and government assistance. Today the agency proudly maintains that it is capable of handling mega projects and programmes such as JnNURM. It is able to carry forward multiple projects without any constraint. One official also maintained that the agency has gained enormous experience in this field and therefore would rather depend on its own estimations and valuations than those presented by the private consultants. The present reforms agenda intends to make the corporations and municipal councils depend on internal source for revenue generation. Given that the economic viability of ULBs will depend increasingly on cost recovery from the services provided rather than from grants from state and central government, ULBs will have to increasingly adhere to the terms laid down by the financial institutions. The housing sector has been attracting substantial public and private investments in the last decade. But the increasing costs of land and real estate have meant that large sections of the population have been unable to afford decent housing. At the same time, urban slum dwellers have lost the defacto right to space that they enjoyed in the mid 1970s-80s as the State, armed with legislations such as the Tank and Water Bodies Encroachment Act (2007) is able to find public purpose in removing the slum dwellers and resettling them on the urban fringes.

105
REFERENCES Datta, Abhijit (1995): “Municipal Reform in India: Comparative Models and Processes”, Economic and Political Weekly, Vol. 30, No. 38, Sep. 23, 1995, pp. 2395-2398 Gnaneswar.V (….), Property tax reforms in India, NIUA. Government of India: Report of the 12th Finance Commission available at http://www.tn.gov.in/budget/12thfincomm/default.htm accessed on April 11, 2011 Government of Tamil Nadu, Department of Municipal Administration and Water Supply, Policy Note 2010-11. Government of Tamil Nadu (2003): Tamil Nadu Human Development Report, Government of Tamil Nadu in association with Social Science Press, New Delhi. Government of Tamil Nadu (1996): Report of the First Tamil Nadu State Finance Commission Government of Tamil Nadu (2001): Report of the Second TamilNadu State Finance Commission Government of Tamil Nadu (2006): Report of the Third Tamil Nadu State Finance Commission Government of Tamil Nadu: Report of the High Level Committee chaired by M.K.Stalin: “Devolution of Powers and Functions to Rural Local Bodies” (2006). Available at http://www.tnrd.gov.in/reports/stalin_committee_2007_final_english.pdf Joshi.R. (2005): Decentralisation and Local Finance Issues – The Workings of State Finance Commissions in India, Prepared under ADB’s Technical Assistance Project Policy Research Networking to Strengthen Policy Reforms Thematic Cluster: State Government Budget Constraints and Delivery of Social Services. Nagaraj, K (2006): Tamil Nadu Economy: Contours Of Change – A Secondary Data Exploration, mimeo, Madras Institute of Development Studies, Chennai. Pal, Mahi (2001): “Decentralised Planning and Panchayati Raj: Report of Working Group in Tamil Nadu”, Economic and Political Weekly, Vol. 36, No. 12 (Mar. 24-30, 2001), pp. 1002-1005. Palanidurai, K.V. (1988): Decentralized Planning in India: Precept and Practice – experiences of Tamil Nadu and Karnataka. New Delhi: Institute for Economic Growth. Planning Commission, Government of India (2005): Tamil Nadu Development Report, Academic Foundation:N. Delhi.

106
Pradhan H.K, 2004, Connecting markets and cities: case study of TNUDF, XLRI, Jamshedpur, India. Pugh, Cedric (1990): “The World Bank and Housing Policy in Madras” in Journal of Urban Affairs, Vol 12, No. 2, pp.173-196. Raman, N. (2008). The Politics and Anti-Politics of Shelter Policies in Chennai, India, Unpublished Masters Thesis from M.I.T. RCUES, Lucknow (undated): “History of Urban Local Bodies.” Ramaswamy, KV (2007): Regional Dimension of Growth and Employment, Economic and Political Weekly, December 8-14, Vol. XLII (49): 47-56. Rukmani R (1996): Factors underlying High Dispersal of Towns in Tamil Nadu, Review of Development and Change; January-June, 1 (1): 113-125.
(1994): Urbanisation and Socio-Economic Change in Tamil Nadu, 1901-9, Economic and Political Weekly, 29/51/52: 263-3272
Singh, A. 2010, Local Self Government in Colonial India: Self-Government by natives and the Development of Municipal Institutions, CBPS, Bangalore. Tamil Nadu Institute of Urban Studies (TNIUS) (2010). Training Handbook for Town Planning Officers and Inspectors of Municipalities.

107
Annexure 3.1:
Sl. No. Subject To whom it
related
Stage of the recommenda-tion
Details on orders issued
Reasons for delay in implementation
1 a)
Property Tax Reforms
Urban Local Body
Accepted by Government No orders
Provisions are available in the suspended Act but amendment has to be incorporated in Tamil Nadu. District Municipalities Act, 1920 and Municipal Corporation Acts
b) House Tax Rural Local Body
Accepted by Government No orders Requires Act
Amendment
c) Profession Tax for Industries and companies
Urban Local Body/Rural Local Body
Accepted at Secretaries level meeting
No orders -do-
d)
Profession Tax for Professionals on Karnataka pattern
Urban Local Body/Rural Local Body
Accepted at Secretaries level meeting
No orders from R.D. Department. For urban, orders issued inG.O.Ms.No.59 / MAWS Dept. dt.11.5.2005
Want of detailed study by Commissioner of Municipal Administration for amendment of Act. No direction from RD Secretary

108
e) Advertisement Tax
Urban Local Body
Taken over by Government
Resource sharing: 75% to Government 25% to local body could not be transferred as it is a non-tax receipt for which specific refund head is needed. Finance Department has to propose necessary refund head based on HOD's proposal. No proposal has been sent to Government from Commissioner of Municipal Administration / Director of Town Panchayats and Chennai Corporation
f) Vacant Land Tax -Revision of rates
Urban Local Body
Accepted at Secretaries' level meeting
No Orders Want of amendment to the present Act
g) Pilgrim Tax Urban Local Body
-do- G.O.Ms.No. 59 /MAWS Dept. Dt.11.5.2005
To incorporate provisions available in the suspended Act in the Tamil Nadu District Municipalities Act, 1920, Commissioner of Municipal Administration has to send proposals for amendment.

109
h)
Motor Vehicle Tax for Rural Road Development Fund
Rural Local Body
Accepted by Government
G.O.Ms. No.158 RD Dept. dt.14.10.2004
Arrears for 1997-2002 have not been adjusted to local bodies as there is no response from Home Dept.
i) Tax on Cable TV
Urban Local Body / Rural Local Body
Taken over by Government
The then Finance Minister announced that the tax proceeds should be shared on the basis of the collections reached in 2002-03.
Tax proceeds have not been shared with local bodies for want of amendment to Section 4 (E) and Section 13 of Entertainment Tax Act.
2) Non-Tax
a) D&O License Fees
Rural Local Body
Accepted by Government
G.O.Ms. No. 158 RD Dept. dt.14.10.2004
Not implemented in many districts because of the Act provision (Section 159 of Panchayats Act, 1994)
b) 2C Patta trees Rural Local Body
Accepted by Government
G.O.Ms. No.158 RD Dept. dt.14.10.2004
Not implemented because Highways Department has not received the order.
c) Fishery rental in PWD tank
Rural Local Body
Accepted at Secretaries level meeting
No orders
d) Social Forestry receipt
Rural Local Body
Accepted by Government
G.O.Ms.No.158 Rural Development dt.14.4.04
Forest Department requested the Government to review the sharing on 50:50 basis.

110
e)
Open space regulation charges / Development charges
Urban Local Body
Accepted in Principle
Orders have been issued covering Director of Town and Country Planning areas with conditionalities
In respect of Chennai Metropolitan Area, no orders have been issued
f) Congestion Tax
Urban Local Body
Accepted at Secretaries level meeting.
No orders
g) Library Cess -Collection charges
Rural Local Body / Urban Local Body
Accepted at Secretaries level meeting.
No orders
h)
Uzhavar Sandhai Land-Fixing Rental charges
Urban Local Body
Accepted at Secretaries level meeting.
No orders
i) Vacant Land Tax -Revision of rates
Urban Local Body
Accepted at Secretaries level meeting
No orders
At present over-riding powers are available in Tamil Nadu Housing Board Act; Needs amendment
j)
Mines and Minerals – Minor minerals
Rural Local Body / Urban Local Body
Accepted by Government
G.O.Ms.No.284 Fin (FC-IV) Dept dt.12.8.2002
For want of funds under Refund head, adjustment is delayed.
3) Assigned Revenue
a) Entertainment Tax - 90% transfer
Urban Local Body / Rural Local Body
Accepted by Government
G.O.Ms.No. 284 Fin (FCIV) Dept dt.12.8.02 G.O.Ms. No.90 CT Dept. dt.12.7.02
For want of amendment to TNFC Vol.-I
Arrears for the period of
Urban Local
Accepted in principle
G.O. Ms. No.59 MAWS Dept.
Depending upon cash

111
1997-2002 Body / Rural Local Body
dt.11.5.05 position as revealed in G.O dated 11.5.2005
b)
Surcharge on Stamp Duty -Apportionment among PRIs
Rural Local Body
Accepted by Government
G.O.Ms.No.284 Fin (FC-IV) Dept dt.12.8.02
Want of amendment to Tamil Nadu Panchayats Act
Adjustment to Urban Local Bodies
Urban Local Body
Accepted by Government
G.O.Ms.No.59 MAWS Dept dt.11.5.2005
Not implemented for want of proposal from Commissioner of Municipal Administration
Adjustment of dues for 1997-2002
Rural Local Body / Urban Local Body
Accepted at Secretaries level meeting
No orders
During interaction, it was revealed that there were no arrears to be settled.
c)
Local Cess, Local Cess Surcharge – Enhancement
Rural Local Body
Accepted by Government
G.O.Ms.No.284 Fin (FC-IV) Dept dt.12.8.02
Not implemented for want of amendment to Act provision
Vacant Land Tax -Revision of rates
Rural Local Body
Accepted by Government -do-
Not implemented in the Districts for want of further orders.
Related Documents