Citation: Koundi, M.; El Idrissi, Z.; El Fadil, H.; Belhaj, F.Z.; Lassioui, A.; Gaouzi, K.; Rachid, A.; Giri, F. State-Feedback Control of Interleaved Buck–Boost DC–DC Power Converter with Continuous Input Current for Fuel Cell Energy Sources: Theoretical Design and Experimental Validation. World Electr. Veh. J. 2022, 13, 124. https://doi.org/10.3390/ wevj13070124 Academic Editor: Hang Gao Received: 9 May 2022 Accepted: 16 June 2022 Published: 7 July 2022 Publisher’s Note: MDPI stays neutral with regard to jurisdictional claims in published maps and institutional affil- iations. Copyright: © 2022 by the authors. Licensee MDPI, Basel, Switzerland. This article is an open access article distributed under the terms and conditions of the Creative Commons Attribution (CC BY) license (https:// creativecommons.org/licenses/by/ 4.0/). Article State-Feedback Control of Interleaved Buck–Boost DC–DC Power Converter with Continuous Input Current for Fuel Cell Energy Sources: Theoretical Design and Experimental Validation Mohamed Koundi 1,† , Zakariae El Idrissi 1, * ,† , Hassan El Fadil 1 , Fatima Zahra Belhaj 1 , Abdellah Lassioui 1 , Khawla Gaouzi 1 , Aziz Rachid 2 and Fouad Giri 3 1 ISA Laboratory, ENSA, Ibn Tofail University, Kenitra 14000, Morocco; [email protected] (M.K.); [email protected] (H.E.F.); [email protected] (F.Z.B.); [email protected] (A.L.); [email protected] (K.G.) 2 LSIB Laboratory, FST, Hassan II University, Mohammedia 28806, Morocco; [email protected] 3 LAC, UNICAEN, 14000 Caen, France; [email protected] * Correspondence: [email protected] † These author contribute equally in the paper. Abstract: It is well known that the classical topologies of Buck–Boost converters drain pulsating current from the power source. These pulsating currents entail acceleration of the aging rate of the fuel cell. In this paper, we are considering a Buck–Boost DC–DC converter topology featuring continuous input current. The converter interleaved structure ensures the substantial increase in power density compensating power losses related to the converter switching nature. The control objective is to enforce the DC-bus voltage to track its desired value despite load uncertainties and to ensure adequate current sharing between the different parallel modules of the fuel cell interleaved Buck–Boost converter (FC-IBBC). The point is that the internal voltage of the fuel cell is not accessible for measurement. Therefore, the state-feedback control, which consists of nonlinear control laws, is designed on the basis of a nonlinear model of the FC-IBBC system. We formally prove that the proposed controller meets its objectives, i.e., DC-bus voltage regulation and equal current sharing. The theoretical proof relies on the asymptotic stability analysis of the closed-loop system using Lyapunov stability tools. The theoretical results are well confirmed both by simulation, using MATLAB ® /Simulink ® , and by experimental tests using DS 1202 MicroLabBox. Keywords: adaptive nonlinear control; DC–DC interleaved Buck–Boost converter; experimental validation; fuel cell 1. Introduction In the past two decades, clean energy demand has become a worldwide strategic challenge. To meet this challenge, huge financial investments are being made in the technological development of renewable energies, especially fuel cell, solar energy, wind energy, marine energy, and others [1–3]. All sources contribute to reducing CO 2 emissions and reducing global warming effects [4]. In this study, fuel cell energy sources are focused on. A fuel cell is an electrochemical generator, whose electrodes are continuously supplied with fuel and oxidant. In electric vehicles, proton exchange membrane fuel cell (PEMFC) technology is used [5]. Accordingly, proton exchange membranes supply hydrogen, while oxygen is obtained from the air. In most applications, the electrical energy produced by fuel cells is not well shaped for immediate use (e.g., the provided voltage is not constant). To be usable with several loads of different nature, a fuel cell needs to be associated with one or more power converters with appropriate topologies. The converters are required to shape the provided electric energy (see Figure 1). World Electr. Veh. J. 2022, 13, 124. https://doi.org/10.3390/wevj13070124 https://www.mdpi.com/journal/wevj

Welcome message from author
This document is posted to help you gain knowledge. Please leave a comment to let me know what you think about it! Share it to your friends and learn new things together.
Transcript

Citation: Koundi, M.; El Idrissi, Z.; El
Fadil, H.; Belhaj, F.Z.; Lassioui, A.;
Gaouzi, K.; Rachid, A.; Giri, F.
State-Feedback Control of Interleaved
Buck–Boost DC–DC Power
Converter with Continuous Input
Current for Fuel Cell Energy Sources:
Theoretical Design and Experimental
Validation. World Electr. Veh. J. 2022,
13, 124. https://doi.org/10.3390/
wevj13070124
Academic Editor: Hang Gao
Received: 9 May 2022
Accepted: 16 June 2022
Published: 7 July 2022
Publisher’s Note: MDPI stays neutral
with regard to jurisdictional claims in
published maps and institutional affil-
iations.
Copyright: © 2022 by the authors.
Licensee MDPI, Basel, Switzerland.
This article is an open access article
distributed under the terms and
conditions of the Creative Commons
Attribution (CC BY) license (https://
creativecommons.org/licenses/by/
4.0/).
Article
State-Feedback Control of Interleaved Buck–Boost DC–DCPower Converter with Continuous Input Current for Fuel CellEnergy Sources: Theoretical Design andExperimental ValidationMohamed Koundi 1,†, Zakariae El Idrissi 1,*,† , Hassan El Fadil 1, Fatima Zahra Belhaj 1, Abdellah Lassioui 1,Khawla Gaouzi 1, Aziz Rachid 2 and Fouad Giri 3
1 ISA Laboratory, ENSA, Ibn Tofail University, Kenitra 14000, Morocco;[email protected] (M.K.); [email protected] (H.E.F.); [email protected] (F.Z.B.);[email protected] (A.L.); [email protected] (K.G.)
2 LSIB Laboratory, FST, Hassan II University, Mohammedia 28806, Morocco; [email protected] LAC, UNICAEN, 14000 Caen, France; [email protected]* Correspondence: [email protected]† These author contribute equally in the paper.
Abstract: It is well known that the classical topologies of Buck–Boost converters drain pulsatingcurrent from the power source. These pulsating currents entail acceleration of the aging rate ofthe fuel cell. In this paper, we are considering a Buck–Boost DC–DC converter topology featuringcontinuous input current. The converter interleaved structure ensures the substantial increase inpower density compensating power losses related to the converter switching nature. The controlobjective is to enforce the DC-bus voltage to track its desired value despite load uncertainties and toensure adequate current sharing between the different parallel modules of the fuel cell interleavedBuck–Boost converter (FC-IBBC). The point is that the internal voltage of the fuel cell is not accessiblefor measurement. Therefore, the state-feedback control, which consists of nonlinear control laws,is designed on the basis of a nonlinear model of the FC-IBBC system. We formally prove that theproposed controller meets its objectives, i.e., DC-bus voltage regulation and equal current sharing.The theoretical proof relies on the asymptotic stability analysis of the closed-loop system usingLyapunov stability tools. The theoretical results are well confirmed both by simulation, usingMATLAB®/Simulink®, and by experimental tests using DS 1202 MicroLabBox.
Keywords: adaptive nonlinear control; DC–DC interleaved Buck–Boost converter; experimentalvalidation; fuel cell
1. Introduction
In the past two decades, clean energy demand has become a worldwide strategicchallenge. To meet this challenge, huge financial investments are being made in thetechnological development of renewable energies, especially fuel cell, solar energy, windenergy, marine energy, and others [1–3]. All sources contribute to reducing CO2 emissionsand reducing global warming effects [4]. In this study, fuel cell energy sources are focusedon. A fuel cell is an electrochemical generator, whose electrodes are continuously suppliedwith fuel and oxidant. In electric vehicles, proton exchange membrane fuel cell (PEMFC)technology is used [5]. Accordingly, proton exchange membranes supply hydrogen, whileoxygen is obtained from the air. In most applications, the electrical energy produced byfuel cells is not well shaped for immediate use (e.g., the provided voltage is not constant).To be usable with several loads of different nature, a fuel cell needs to be associated withone or more power converters with appropriate topologies. The converters are required toshape the provided electric energy (see Figure 1).
World Electr. Veh. J. 2022, 13, 124. https://doi.org/10.3390/wevj13070124 https://www.mdpi.com/journal/wevj
World Electr. Veh. J. 2022, 13, 124 2 of 22
World Electr. Veh. J.2022, 13, x FOR PEER REVIEW 2 of 21
one or more power converters with appropriate topologies. The converters are required to shape the provided electric energy (see Figure 1).
Figure 1. DC-bus voltage for a PEMFC.
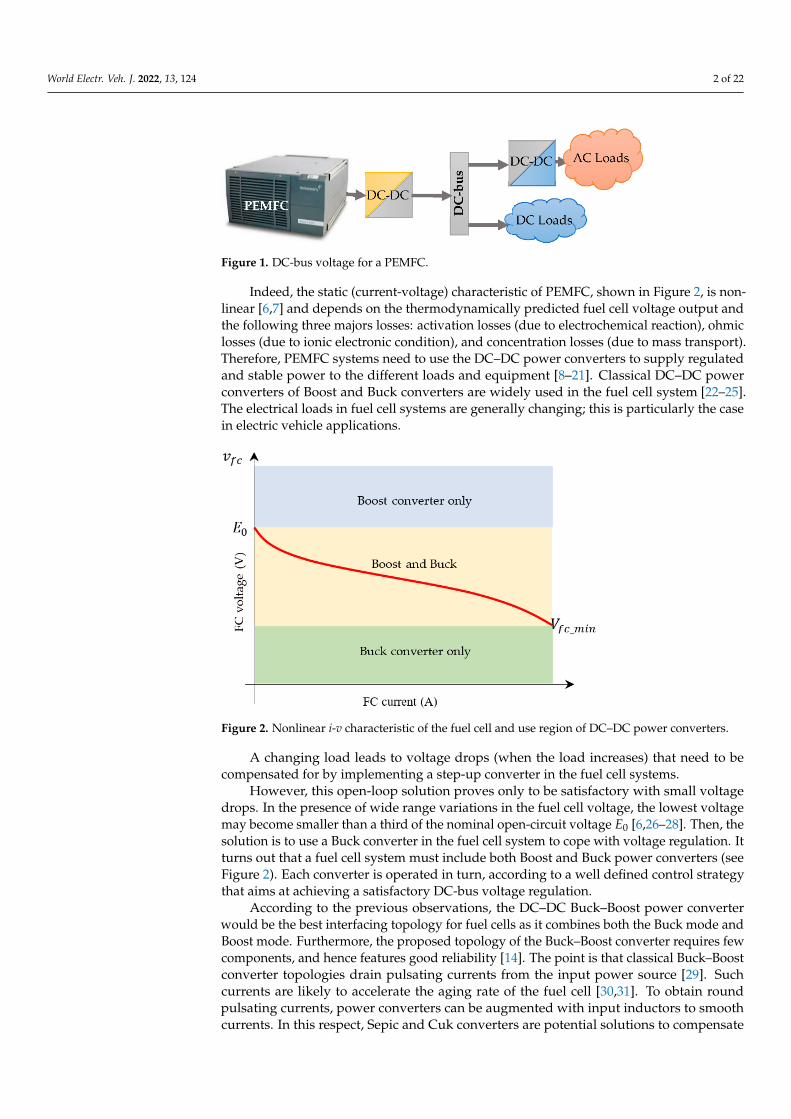
Indeed, the static (current-voltage) characteristic of PEMFC, shown in Figure 2, is nonlinear [6,7] and depends on the thermodynamically predicted fuel cell voltage output and the following three majors losses: activation losses (due to electrochemical reaction), ohmic losses (due to ionic electronic condition), and concentration losses (due to mass transport). Therefore, PEMFC systems need to use the DC–DC power converters to supply regulated and stable power to the different loads and equipment [8–21]. Classical DC–DC power converters of Boost and Buck converters are widely used in the fuel cell system [22–25]. The electrical loads in fuel cell systems are generally changing; this is particularly the case in electric vehicle applications.
A changing load leads to voltage drops (when the load increases) that need to be compensated for by implementing a step-up converter in the fuel cell systems.
However, this open-loop solution proves only to be satisfactory with small voltage drops. In the presence of wide range variations in the fuel cell voltage, the lowest voltage may become smaller than a third of the nominal open-circuit voltage 𝐸 [6,26–28]. Then, the solution is to use a Buck converter in the fuel cell system to cope with voltage regula-tion. It turns out that a fuel cell system must include both Boost and Buck power convert-ers (see Figure 2). Each converter is operated in turn, according to a well defined control strategy that aims at achieving a satisfactory DC-bus voltage regulation.
Figure 2. Nonlinear i-v characteristic of the fuel cell and use region of DC–DC power converters.
According to the previous observations, the DC–DC Buck–Boost power converter would be the best interfacing topology for fuel cells as it combines both the Buck mode and Boost mode. Furthermore, the proposed topology of the Buck–Boost converter re-quires few components, and hence features good reliability [14]. The point is that classical Buck–Boost converter topologies drain pulsating currents from the input power source [29]. Such currents are likely to accelerate the aging rate of the fuel cell [30,31]. To obtain
Figure 1. DC-bus voltage for a PEMFC.
Indeed, the static (current-voltage) characteristic of PEMFC, shown in Figure 2, is non-linear [6,7] and depends on the thermodynamically predicted fuel cell voltage output andthe following three majors losses: activation losses (due to electrochemical reaction), ohmiclosses (due to ionic electronic condition), and concentration losses (due to mass transport).Therefore, PEMFC systems need to use the DC–DC power converters to supply regulatedand stable power to the different loads and equipment [8–21]. Classical DC–DC powerconverters of Boost and Buck converters are widely used in the fuel cell system [22–25].The electrical loads in fuel cell systems are generally changing; this is particularly the casein electric vehicle applications.
World Electr. Veh. J.2022, 13, x FOR PEER REVIEW 2 of 21
one or more power converters with appropriate topologies. The converters are required to shape the provided electric energy (see Figure 1).
Figure 1. DC-bus voltage for a PEMFC.
Indeed, the static (current-voltage) characteristic of PEMFC, shown in Figure 2, is nonlinear [6,7] and depends on the thermodynamically predicted fuel cell voltage output and the following three majors losses: activation losses (due to electrochemical reaction), ohmic losses (due to ionic electronic condition), and concentration losses (due to mass transport). Therefore, PEMFC systems need to use the DC–DC power converters to supply regulated and stable power to the different loads and equipment [8–21]. Classical DC–DC power converters of Boost and Buck converters are widely used in the fuel cell system [22–25]. The electrical loads in fuel cell systems are generally changing; this is particularly the case in electric vehicle applications.
A changing load leads to voltage drops (when the load increases) that need to be compensated for by implementing a step-up converter in the fuel cell systems.
However, this open-loop solution proves only to be satisfactory with small voltage drops. In the presence of wide range variations in the fuel cell voltage, the lowest voltage may become smaller than a third of the nominal open-circuit voltage 𝐸 [6,26–28]. Then, the solution is to use a Buck converter in the fuel cell system to cope with voltage regula-tion. It turns out that a fuel cell system must include both Boost and Buck power convert-ers (see Figure 2). Each converter is operated in turn, according to a well defined control strategy that aims at achieving a satisfactory DC-bus voltage regulation.
Figure 2. Nonlinear i-v characteristic of the fuel cell and use region of DC–DC power converters.
According to the previous observations, the DC–DC Buck–Boost power converter would be the best interfacing topology for fuel cells as it combines both the Buck mode and Boost mode. Furthermore, the proposed topology of the Buck–Boost converter re-quires few components, and hence features good reliability [14]. The point is that classical Buck–Boost converter topologies drain pulsating currents from the input power source [29]. Such currents are likely to accelerate the aging rate of the fuel cell [30,31]. To obtain
Figure 2. Nonlinear i-v characteristic of the fuel cell and use region of DC–DC power converters.
A changing load leads to voltage drops (when the load increases) that need to becompensated for by implementing a step-up converter in the fuel cell systems.
However, this open-loop solution proves only to be satisfactory with small voltagedrops. In the presence of wide range variations in the fuel cell voltage, the lowest voltagemay become smaller than a third of the nominal open-circuit voltage E0 [6,26–28]. Then, thesolution is to use a Buck converter in the fuel cell system to cope with voltage regulation. Itturns out that a fuel cell system must include both Boost and Buck power converters (seeFigure 2). Each converter is operated in turn, according to a well defined control strategythat aims at achieving a satisfactory DC-bus voltage regulation.
According to the previous observations, the DC–DC Buck–Boost power converterwould be the best interfacing topology for fuel cells as it combines both the Buck mode andBoost mode. Furthermore, the proposed topology of the Buck–Boost converter requires fewcomponents, and hence features good reliability [14]. The point is that classical Buck–Boostconverter topologies drain pulsating currents from the input power source [29]. Suchcurrents are likely to accelerate the aging rate of the fuel cell [30,31]. To obtain roundpulsating currents, power converters can be augmented with input inductors to smoothcurrents. In this respect, Sepic and Cuk converters are potential solutions to compensate
World Electr. Veh. J. 2022, 13, 124 3 of 22
for the pulsating currents in fuel cells. However, these converters require a large number ofcomponents, which increases their cost and reduces their reliability [32]. In this paper, wepropose a fuel cell system with a Buck–Boost DC–DC converter that features a continuousinput current [33,34]. The proposed topology of interleaved Buck–Boost DC–DC powerconverter features a structure that ensures much higher power density in the switching con-verters. The interleaving principle consists of connecting a number of converters connectedin parallel with an appropriate switching function between transistors. It is shown in manyplaces (e.g., in [35]); DC–DC power converters based on the interleaving technique offersubstantial features. Indeed, when the interleaving N module switches phase shift 2π
N , thefrequency of the total current ripple is much smaller than that of the current in the variousindividual modules; specifically, the ratio between both frequencies is less than 1
N . There-fore, for a given net ripple amplitude and electromagnetic interference specification, theparameter values of the input filter can be made smaller by a factor of 1
N . On the other hand,for a fixed net frequency f, the switching frequency in the individual modules is reduced tofN , leading to a substantial reduction in the switching losses. Furthermore, splitting the totalpower on the N paralleled converters entails the division N of the input/output current ineach individual module. Accordingly, the current ripple can be reduced N times, and so canthe inductance value in each module, consequently, allowing a smaller size converter undercurrent passive component technology. Ensuring a satisfactory energy exchange betweenthe FC-IBBC and the load necessitates the design and implementation of a controller withthe following satisfactory performances: stability, reliability, robustness, etc. In this respect,several controllers have been proposed in the literature for the association of the FC andthe power converter.
In [9], a (linear/nonlinear/adaptive . . . ) controller was proposed for a multi-devicemulti-phase interleaved Buck–Boost converter, which meets the constraint of current con-tinuity of the fuel cell. The point with the considered architecture is the high number ofthe converter components, which entails the high cost and large size of the converter, andgreater energy losses.
In [10], a classical interleaved Buck–Boost converter (with N = 6) has been highlightedand a (linear/nonlinear/adaptive . . . ) controller has been proposed. A drawback of theproposed solution is that actuation is performed by transistors with a gap between them,in order to ensure the continuity of the current of the fuel cell.
The authors [15–17] present multi-level architectures of Boost-type power converters;these converters are not suitable with the fuel cell as a power source, when one wants aconverter output voltage lower than Vfc_min (minimum fuel cell voltage). However, theycan be used in other applications.
In [33], DC-bus voltage in a mono-module (N = 1) FC-IBBC system was indirectly dealtwith by regulating the inductor current at a given reference. The indirect control strategywas motivated by the non-minimum phase nature of the involved Buck–Boost converter.The study emphasized the importance of conveniently sizing the converter components(especially capacitance and inductance) to avoid excessive peaks in current ripples.
The present work is focused on the problem of controlling multiple-module (N > 1)FC-IBBC systems. We seek the achievement of the following control objectives: (i) tightregulation of the DC-bus voltage, (ii) equal current sharing between different parallelmodules of the IBBC, and (iii) asymptotic stability of the closed-loop system. In addition tothe (multiple-module) interleaved structure of the converter, the system complexity alsolies in the nonlinear non-minimum phase dynamics, and the load variation and uncertainty.The control problem at hand is coped with by developing a nonlinear controller that isdesigned using the backstepping technique, on the basis of the nonlinear system model.The adaptive feature reflects the controller’s ability to perform an online estimate of loadresistance (a part of the system), despite parameter uncertainty. To this end, estimatingthe load resistance entails the reduction in sensors and, consequently, the increase incontrol system reliability and the reduction in its size. The effectiveness of the proposedcontroller is first established by a theoretical analysis of the closed-loop control stability.

World Electr. Veh. J. 2022, 13, 124 4 of 22
The outcome of the theoretical analysis is then confirmed both by the simulation resultsand by experimental tests.
The rest of the paper is organized as follows: the system of interest, including aPEMFC and an interleaved DC–DC Buck–Boost power converter is described, modelled,and analyzed in Section 2; in Section 3, we present an adaptive state-feedback controller; thesimulation and experimental results are presented in Section 4. A conclusion and referencelist conclude the paper.
2. Modelling and Analysis of Fuel-Cell in Association with Buck–Boost Converter2.1. System Presentation
The FC-IBBC system of interest is depicted in Figure 3. It is constituted of a fuel cell(FC), an interleaved Buck–Boost converter (IBBC), and a load. The FC is represented byits equivalent electric circuit [36,37]. The IBBC contains N modules connected in parallel,operating according to the pulse width modulation (PWM) principal. The parallel modulesshare a common DC-bus with the load, which is a resistance R. The FC is characterizedby an open-circuit voltage E0, an ohmic resistance Ro, an equivalent electrical capacitanceC f c, and a series equivalent resistance of activation and concentration resistance Rac. EachBuck–Boost module consists of an inductor Lk with its equivalent series resistance rk, afiltering capacitor C in parallel with the switches and diodes, a static switch Sk controlledby the binary input signal uk, and a diode Dk (k = 1, . . . , N). Each diode anode is connectedto the same point with the load represented by a pure resistance R, according to the inputimpedance of the DC-bus. This impedance is actually unknown because it depends onthe power demand. This uncertainty, together with other parameter uncertainties, will beinvestigated in the next section.
World Electr. Veh. J.2022, 13, x FOR PEER REVIEW 4 of 21
of load resistance (a part of the system), despite parameter uncertainty. To this end, esti-mating the load resistance entails the reduction in sensors and, consequently, the increase in control system reliability and the reduction in its size. The effectiveness of the proposed controller is first established by a theoretical analysis of the closed-loop control stability. The outcome of the theoretical analysis is then confirmed both by the simulation results and by experimental tests.
The rest of the paper is organized as follows: the system of interest, including a PEMFC and an interleaved DC–DC Buck–Boost power converter is described, modelled, and analyzed in Section 2; in Section 3, we present an adaptive state-feedback controller; the simulation and experimental results are presented in Section 4. A conclusion and ref-erence list conclude the paper.
2. Modelling and Analysis of Fuel-Cell in Association with Buck–Boost Converter 2.1. System Presentation
The FC-IBBC system of interest is depicted in Figure 3. It is constituted of a fuel cell (FC), an interleaved Buck–Boost converter (IBBC), and a load. The FC is represented by its equivalent electric circuit [36,37]. The IBBC contains 𝑁 modules connected in parallel, operating according to the pulse width modulation (PWM) principal. The parallel mod-ules share a common DC-bus with the load, which is a resistance 𝑅. The FC is character-ized by an open-circuit voltage 𝐸 , an ohmic resistance 𝑅 , an equivalent electrical capac-itance 𝐶 , and a series equivalent resistance of activation and concentration resistance 𝑅 . Each Buck–Boost module consists of an inductor Lk with its equivalent series re-sistance 𝑟 , a filtering capacitor C in parallel with the switches and diodes, a static switch Sk controlled by the binary input signal uk, and a diode Dk (k = 1, …, N). Each diode anode is connected to the same point with the load represented by a pure resistance R, according to the input impedance of the DC-bus. This impedance is actually unknown because it depends on the power demand. This uncertainty, together with other parameter uncer-tainties, will be investigated in the next section.
Figure 3. Fuel cell association with an interleaved Buck–Boost DC–DC converter (IBBC).
2.2. System Modelling Applying Kirchhoff’s laws to the systems of Figure 3, we obtain the following bilinear
model:
Figure 3. Fuel cell association with an interleaved Buck–Boost DC–DC converter (IBBC).
2.2. System Modelling
Applying Kirchhoff’s laws to the systems of Figure 3, we obtain the followingbilinear model:
dikdt
= − rkLk
ik −1Lk
(1− uk)vc +1Lk
v f c (1)
dvc
dt=
1C ∑N
k=1(1− uk)ik +1
RC(v f c − vc) (2)
World Electr. Veh. J. 2022, 13, 124 5 of 22
dvidt
= − 1τf c
vi +1
C f ci f c (3)
i f c =R
R + Ro∑N
k=1ik +1
R + Ro(E0 − vc − vi) (4)
v f c = E0 − Roi f c − vi (5)
vdc = vc − v f c (6)
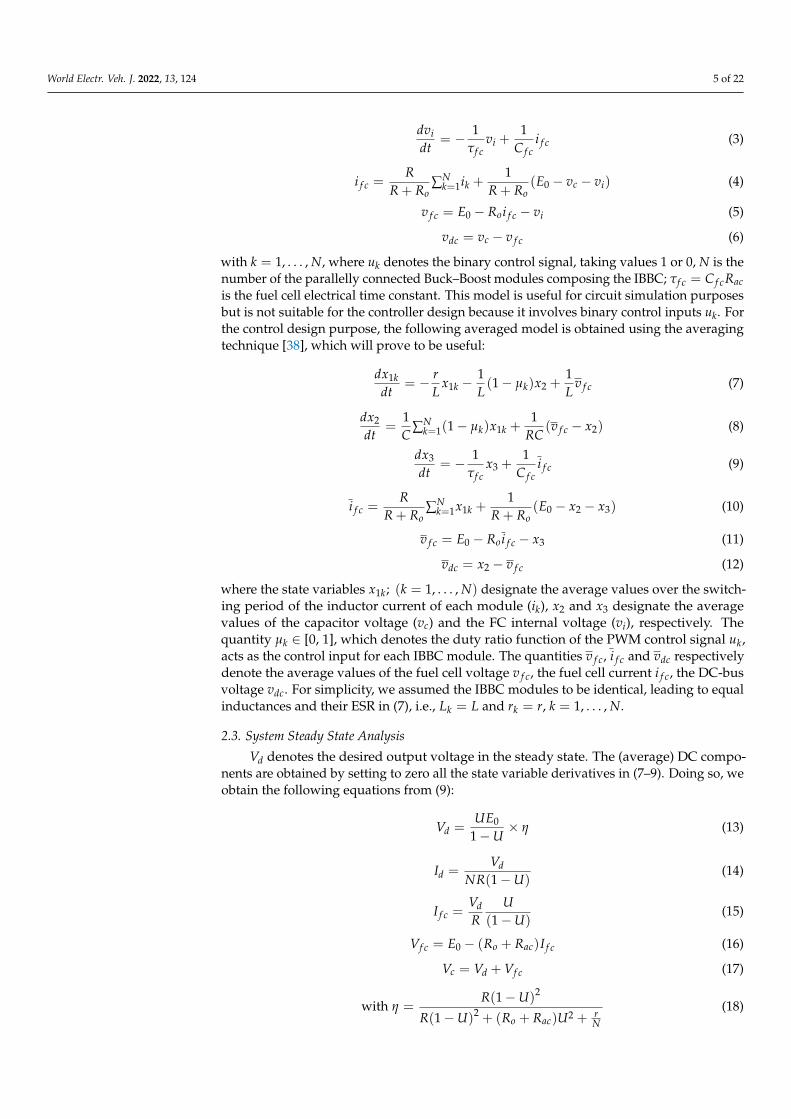
with k = 1, . . . , N, where uk denotes the binary control signal, taking values 1 or 0, N is thenumber of the parallelly connected Buck–Boost modules composing the IBBC; τf c = C f cRacis the fuel cell electrical time constant. This model is useful for circuit simulation purposesbut is not suitable for the controller design because it involves binary control inputs uk. Forthe control design purpose, the following averaged model is obtained using the averagingtechnique [38], which will prove to be useful:
dx1kdt
= − rL
x1k −1L(1− µk)x2 +
1L
v f c (7)
dx2
dt=
1C ∑N
k=1(1− µk)x1k +1
RC(v f c − x2) (8)
dx3
dt= − 1
τf cx3 +
1C f c
i f c (9)
i f c =R
R + Ro∑N
k=1x1k +1
R + Ro(E0 − x2 − x3) (10)
v f c = E0 − Roi f c − x3 (11)
vdc = x2 − v f c (12)
where the state variables x1k; (k = 1, . . . , N) designate the average values over the switch-ing period of the inductor current of each module (ik), x2 and x3 designate the averagevalues of the capacitor voltage (vc) and the FC internal voltage (vi), respectively. Thequantity µk ∈ [0, 1], which denotes the duty ratio function of the PWM control signal uk,acts as the control input for each IBBC module. The quantities v f c, i f c and vdc respectivelydenote the average values of the fuel cell voltage v f c, the fuel cell current i f c, the DC-busvoltage vdc. For simplicity, we assumed the IBBC modules to be identical, leading to equalinductances and their ESR in (7), i.e., Lk = L and rk = r, k = 1, . . . , N.
2.3. System Steady State Analysis
Vd denotes the desired output voltage in the steady state. The (average) DC compo-nents are obtained by setting to zero all the state variable derivatives in (7–9). Doing so, weobtain the following equations from (9):
Vd =UE0
1−U× η (13)
Id =Vd
NR(1−U)(14)
I f c =VdR
U(1−U)
(15)
Vf c = E0 − (Ro + Rac)I f c (16)
Vc = Vd + Vf c (17)
with η =R(1−U)2
R(1−U)2 + (Ro + Rac)U2 + rN
(18)

World Electr. Veh. J. 2022, 13, 124 6 of 22
where Vc, Vf c, Id, I f c and U denote the steady-state values of the various variables, i.e.,capacitor voltage, fuel cell voltage, inductor current in each IBBC branch, fuel cell current,the duty ratio of each IBBC module.
From (13), the conversion ratio of the FC-IBBC system is given by
Gv(U) =VdE0
=U
1−U× η (19)
Remark 1. Equation (18) shows that the interleaving nature improves the conversion ratio as theideality factor η in (19) increases with N. On the other hand, (18) also shows that η depends on fuelcell parameters (Ro, Rac) and the inductance ESR. For r, the smaller it is (r, Ro, Rac), the larger theconversion ratio.
Remark 2. In ideal conditions, i.e., Ro = Rac = r = 0, one has η = 1, which gives Gvi =U
1−U .The latter represents the classical conversion ratio for the traditional Buck–Boost converter. Whenthe duty ratio U varies between 0 and 1, the output voltage could be smaller or larger than theinput voltage E0; this justifies the Buck–Boost designation of the converter. It is worth noting thatthe main feature of the proposed Buck–Boost is the continuous current provided by the fuel cell.Figure 4 illustrates the conversion ratio versus duty ratio in the presence of the variations in theload resistance R and parasitic parameters (Ro, Rac, r).
World Electr. Veh. J.2022, 13, x FOR PEER REVIEW 6 of 21
𝑉 = 𝐸 − (𝑅 + 𝑅 )𝐼 (16)𝑉 = 𝑉 + 𝑉 (17)
with 𝜂 = ( )( ) ( ) (18)
where 𝑉 , 𝑉 , 𝐼 , 𝐼 and 𝑈 denote the steady-state values of the various variables, i.e., capacitor voltage, fuel cell voltage, inductor current in each IBBC branch, fuel cell current, the duty ratio of each IBBC module.
From (13), the conversion ratio of the FC-IBBC system is given by 𝐺 (𝑈) = = × 𝜂 (19)
Remark 1. Equation (18) shows that the interleaving nature improves the conversion ratio as the ideality factor 𝜂 in (19) increases with 𝑁. On the other hand, (18) also shows that 𝜂 depends on fuel cell parameters (𝑅 , 𝑅 ) and the inductance ESR. For 𝑟, the smaller it is (r, 𝑅 , 𝑅 ), the larger the conversion ratio.
Remark 2. In ideal conditions, i.e., 𝑅 = 𝑅 = 𝑟 = 0, one has 𝜂 = 1, which gives 𝐺 = . The latter represents the classical conversion ratio for the traditional Buck–Boost converter. When the duty ratio 𝑈 varies between 0 and 1, the output voltage could be smaller or larger than the input voltage 𝐸 ; this justifies the Buck–Boost designation of the converter. It is worth noting that the main feature of the proposed Buck–Boost is the continuous current provided by the fuel cell. Figure 4 illustrates the conversion ratio versus duty ratio in the presence of the variations in the load resistance 𝑅 and parasitic parameters (𝑅 , 𝑅 , 𝑟).
Figure 4. Conversion ratio versus resistance load and parasitic parameters.
The maximum conversion ratio 𝐺 and its corresponding duty ratio 𝑈 are obtained from (18), (19), which is as follows: 𝑈 = ( )( ( ))( ) (20)
𝐺 = ( )( ) ( ) (21)
Figure 4. Conversion ratio versus resistance load and parasitic parameters.
The maximum conversion ratio Gvmax and its corresponding duty ratio Umax areobtained from (18), (19), which is as follows:
Umax =−(r + NRo −
√(r + NR)(r + N(Rac + Ro)))
N(Rac + Ro − R)(20)
Gvmax =RUmax(1−Umax)
R(1−Umax)2 + (Ro + Rac)U2
max +rN
(21)
3. Nonlinear State Feedback Controller
In this section, we aim at designing an appropriate controller for the nonlinearsystem (1–3), on the basis of the nonlinear model (7–9). The model complexity lies inits nonlinearity and the uncertainty of the load resistance. The control objectives arethe following:
(i) Tight regulation of output DC-bus voltage despite load uncertainty.

World Electr. Veh. J. 2022, 13, 124 7 of 22
(ii) Equal current sharing between IBBC branches, i.e., the inductor currents should beequal to each other in order to avoid overloading one of the modules, especiallywhen supplying heavy loads. This property entails the reduction in the current ripple,which is beneficial for fuel cells.
(iii) Asymptotic stability of the closed-loop system.
Note that load resistance R uncertainty results from the fact that the load usuallyvaries in practical applications. This model uncertainty will now be solved by providingthe controller with adaptive capability. To this end, the controller to be designed willbe equipped with a parameter estimator providing online estimates of the unknownparameter θ = 1
R .The first control objective amounts to enforcing the DC-bus voltage vdc to track its
desired value Vd. The point is that the Buck–Boost converter is of a non-minimum phasenature [39] and so perfect tracking of the arbitrary reference signals is not achievable. Toavoid this issue, we seek the achievement of the above objective indirectly. Specifically, weconsider the inductor currents x1k, in IBBC modules, as output signals and aim at enforcingthem to track reference signals, denoted Id. The latter is chosen so that if x1k = Id thenvdc = Vd. From (13), (14), we obtain the following relationship between the desired currentvalue Id and the desired voltage Vd:
Id =VdN
(η0
VdE0
+ 1)
1R
= Kθ (22)
with
K =VdN
(η0
VdE0
+ 1)
(23)
where η0 ≥ 1 is an ideality factor introduced to take into account all losses, includingswitching losses in the converters and the losses in the inductances ESR and the lossesin the fuel cell resistance (see Section 2.3). Since θ is unknown, one must introduce theestimated value of Id.
Id = Kθ (24)
where θ is an online estimate of θ = 1R provided by a parameter estimator yet to be
determined. The following state tracking errors are introduced:
e1k = x1k − Id; k = 1, . . . , N (25)
Clearly, the objective of regulating the DC-bus voltage vdc to its reference value Vdamounts to regulating the errors ek to zero. To meet the last requirement, we will applythe backstepping design technique. Accordingly, we first highlight the dynamics of ek bydifferentiation (25), with respect to time, and using (7) as follows:
.e1k = −
rL
x1k −1L(1− µk)x2 +
1L
v f c − K.θ (26)
To make the errors e1k asymptotically vanish, one can enforce their dynamics to behaveas follows:
.e1k = −c1ke1k + e2 (27)
where c1k > 0 are design parameters, and
e2 = x2 − x2d (28)
is the error between the capacitor voltage x2 and x2d, which is its desired value to bedefined later.
Combining (26) with (27), one can obtain the following control laws for the FC-IBBC system:

World Electr. Veh. J. 2022, 13, 124 8 of 22
µk = 1 +Lx2
(−c1ke1k + e2 +
rL
x1k −1L
v f c + K.θ
)(29)
Using (8) and (28), it is readily checked that the dynamics of e2 are governed by thefollowing equation:
.e2 =
1C ∑N
k=1(1− µk)x1k +1C(v f c − x2)(θ + θ)− .
x2d (30)
The third control objective ensures asymptotic stability of the error system with statevariables (e1k, e2). This requirement will be enforced by conveniently selecting the still freequantities x2d and θ, in (26) and (29). To this end, we consider the following Lyapunovfunction candidate [40] for the (e1k, e2, θ) system as follows:
V1 =12
(∑N
k=1 e21k + e2
2 +1γ
θ2)
(31)
with θ = θ − θ being the estimation error and γ > 0 any real scalar, which is calledparameter adaptation gain, to be chosen by the designer. The time-derivative of V1 givesthe following equation, using (27):
.V1 = −∑N
k=1c1ke21k + e2(∑N
k=1e1k +.e2) +
1γ
θ.θ (32)
Using (32), it follows from (32).
.V1 = −∑N
k=1c1ke21k + e2(∑N
k=1e1k +1C ∑N
k=1(1− µk)x1k +θ
C(v f c − x2)−
.x2d) + (−
.θ
γ+
1C(v f c − x2)e2)θ (33)
Equation (33) shows that.
V1 can be made negative definite, letting.x2d and
.θ be
the following:
∑Nk=1 e1k +
1C ∑N
k=1(1− µk)x1k +θC
(v f c − x2
)− .
x2d = −c2e2
−.θγ + 1
C
(v f c − x2
)e2 = 0
(34)
where c2 > 0 is a design parameter. From the second part of (34), we obtain the followingparameter adaptive control law:
.θ = −
.θ =
γ
C(v f c − x2)e2 (35)
using the fact that.θ = −
.θ, assuming that the uncertain parameter θ is time-invariant or
subject to infrequent step changes. In addition, using (28), the first part of (34) implies thefollowing desired value x2d:
x2d =1
s + c2[∑N
k=1c1ke1k + c2x2 +1C ∑N
k=1(1− µk)x1k +θ
C(v f c − x2)] (36)
with s being the Laplace variable.Finally, using (36) and (35), the control law (29) becomes the following equation:
µk = 1 +Lx2
(−c1ke1k + e2 +
rL
x1k −1L
v f c +Kγ
C(v f c − x2)e2
)(37)
World Electr. Veh. J. 2022, 13, 124 9 of 22
The main result of this subsection is now summarized in the following Theorem 1.
Theorem 1. Consider the closed-loop system consisting of a fuel cell interleaved Buck–Boostconverter system described by (7)–(9), subject to load resistor uncertainty, and the controllerconsisting of the adaptive control law (37), the parameter update law (35), and the desired trajectoryx2d of the capacitor voltage (36). Then, one has the following:
(1) The closed-loop system with state variables (e1k, e2) is globally asymptotically stable aroundthe origin;
(2) The tracking errors e1k converge asymptotically to zero, implying proper current sharingbetween the modules;
(3) The estimation error θ = θ − θ converges to zero and, consequently, the estimated referencecurrent Id converges to its real value, Id. It turns out that the tracking error ε = vdc − Vdconverges to zero, ensuring tight regulation of the DC-bus voltage.
Proof. First, a state-space representation of the closed-loop system should be obtained,substituting
.x2d obtained from (34) in (32) yields.
.e2 = −c2e2 −∑N
k=1e1k +1C(v f c − x2)θ (38)
This together with (27) and (35) describes the closed-loop system, which is rewrittenas follows:
.e1k = −∑N
k=1e1kc1k + e2; k = 1, . . . , N (39)
.e2 = −c2e2 −∑N
k=1e1k +1C(v f c − x2)θ (40)
.θ = −
.θ = −γ
C(v f c − x2)e2 (41)
Part 1: Now, substituting the right side of (34) in (33), one obtains the followingderivative of the Lyapunov function:
.V1 = −∑N
k=1c1ke21k − c2e2
2 (42)
In view of (30), (38) shows that.
V1 is a negative semi-definite function of the statevector (e1k, e2, θ). Therefore, (e1k, e2, θ) = (0, 0, 0) is globally stable.
Part 2: After applying LaSalle’s invariance theorem [41], it further follows that thestate vector (e1k, e2, θ) converges to the largest invariant set of (40–42) contained in theset(e1k, e2, θ) ∈ IRN+2/
.V1 = 0
. Given (38), the invariant set denoted M is contained in
M0
World Electr. Veh. J.2022, 13, x FOR PEER REVIEW 9 of 21
of the adaptive control law (37), the parameter update law (35), and the desired trajectory 𝑥2𝑑 of
the capacitor voltage (36). Then, one has the following:
(1) The closed-loop system with state variables (𝑒1𝑘 , 𝑒2) is globally asymptotically stable around
the origin;
(2) The tracking errors 𝑒1𝑘 converge asymptotically to zero, implying proper current sharing
between the modules;
(3) The estimation error = 𝜃 − 𝜃 converges to zero and, consequently, the estimated reference
current 𝐼𝑑 converges to its real value, 𝐼𝑑. It turns out that the tracking error 𝜀 = 𝑣𝑑𝑐 − 𝑉𝑑
converges to zero, ensuring tight regulation of the DC-bus voltage.
Proof. First, a state-space representation of the closed-loop system should be obtained,
substituting 2𝑑 obtained from (34) in (32) yields.
2 = −𝑐2𝑒2 − ∑ 𝑒1𝑘𝑁𝑘=1 +
1
𝐶(𝑓𝑐 − 𝑥2) (38)
This together with (27) and (35) describes the closed-loop system, which is rewritten as
follows:
1𝑘 = −∑ 𝑒1𝑘𝑁𝑘=1 𝑐1𝑘 + 𝑒2; 𝑘 = 1, . . , 𝑁 (39)
2 = −𝑐2𝑒2 − ∑ 𝑒1𝑘𝑁𝑘=1 +
1
𝐶(𝑓𝑐 − 𝑥2) (40)
= − = −𝛾
𝐶(𝑓𝑐 − 𝑥2)𝑒2 (41)
Part 1: Now, substituting the right side of (34) in (33), one obtains the following de-
rivative of the Lyapunov function:
1 = −∑ 𝑐1𝑘𝑒1𝑘2𝑁
𝑘=1 − 𝑐2𝑒22 (42)
In view of (30), (38) shows that 1 is a negative semi-definite function of the state
vector (𝑒1𝑘, 𝑒2, ). Therefore, (𝑒1𝑘, 𝑒2, ) = (0, 0, 0) is globally stable.
Part 2: After applying LaSalle’s invariance theorem [41], it further follows that the
state vector (𝑒1𝑘, 𝑒2, ) converges to the largest invariant set of (40–42) contained in the
set (𝑒1𝑘, 𝑒2, ) ∈ 𝐼𝑅𝑁+2/1 = 0. Given (38), the invariant set denoted M is contained in
𝑀0 ≝ (𝑒1𝑘, 𝑒2, ) ∈ 𝐼𝑅𝑁+2/(𝑒1𝑘, 𝑒2) = 0, which shows that
lim𝑡→∞
(𝑒1𝑘(𝑡), 𝑒2(𝑡)) = 0 (43)
which in turn, using (40) and the fact that lim𝑡→∞
(1𝑘(𝑡), 2(𝑡)) = 0, shows that
lim𝑡→∞
(𝑡) = 0 (44)
This implies that converges to its true value 𝜃 and, in turn, gives 𝐼𝑑 → 𝐼𝑑, which
also implies, using (25), that
lim𝑡→∞
𝑥1𝑘(𝑡) = 0 = 𝐼𝑑 (45)
From Figure 3, in the steady-state, the averaged current in each transistor is
𝐼𝑆𝑘 = 𝑙𝑖𝑚𝑡→∞
𝜇𝑘𝑥1𝑘 = 𝑈𝐼𝑑 ; 𝑘 = 1, . . . , 𝑁 (46)
which, using (14) and (15), gives
𝐼𝑆𝑘 =𝐼𝑓𝑐
𝑁; 𝑘 = 1, . . . , 𝑁 (47)
This clearly shows that the fuel cell current is equally shared between the IBBC
branches. This implies that the objective of proper current sharing between the modules
is ensured.
(e1k, e2, θ) ∈ IRN+2/(e1k, e2) = 0
, which shows that
limt→∞
(e1k(t), e2(t)) = 0 (43)
which in turn, using (40) and the fact that limt→∞
(.e1k(t),
.e2(t)) = 0, shows that
limt→∞
θ(t) = 0 (44)
This implies that θ converges to its true value θ and, in turn, gives Id → Id , which alsoimplies, using (25), that
limt→∞
x1k(t) = 0 = Id (45)
From Figure 3, in the steady-state, the averaged current in each transistor is
ISk = limt→∞
µkx1k = UId ; k = 1, . . . , N (46)

World Electr. Veh. J. 2022, 13, 124 10 of 22
which, using (14) and (15), gives
ISk =I f c
N; k = 1, . . . , N (47)
This clearly shows that the fuel cell current is equally shared between the IBBCbranches. This implies that the objective of proper current sharing between the modulesis ensured.
Part 3: We have just shown that Id converges towards its true value Id. We will nowdemonstrate that the DC-bus voltage vdc converges to its desired value Vd.
From (8), it follows in the steady-state, using (12), that
limt→∞
vdc(t) = R(1−U)NId (48)
which implies, using (14), thatlimt→∞
vdc(t) = Vd (49)
This shows that the objective of tight regulation of the DC-bus voltage is also achieved;the proof of Theorem 1 is then completed.
Remark 3. The nonlinear controller composed of the adaptive control law (37) and the parameterupdate law (35) looks similar to a classic cascade control architecture consisting of an inner currentloop and an outer voltage loop. In this case, the control law (37) is considered as an inner loop foreach IBBC branch, while (22), (23) and (35) are considered as an outer loop for all branches. Figure 5illustrates a simplified architecture of the proposed control approach.
World Electr. Veh. J.2022, 13, x FOR PEER REVIEW 11 of 21
Figure 5. Nonlinear cascade control architecture.
4. Simulation and Experimental Results The adaptive nonlinear controller developed in this paper for the FC-IBBC system
will now be validated both by simulation and by experiments. Simulation is carried out using the Matlab®/Simulink® SimPower toolbox, and the experiments are performed using a laboratory prototype based on the Dspace DS1202 card.
4.1. Simulation Results The fuel cell parameters are those of the Ballard Nexa 1200 fuel cell module, which
has a rated power of 1.2 kW. Figure 5 describes the simulation bench of the controlled system FC-IBBC. The controlled system characteristics are listed in Table 2. The adaptive control design parameters are listed in Table 3.
Table 2. Controlled system parameters.
Parameter Designation Value
Fuel Cell
FC open circuit voltage 𝐸 = 28.3 V FC internal capacitor 𝐶 = 130 F
Association of the activation and concentration resistances
𝑅 = 0.155 Ω
Ohmic resistance 𝑅 = 2.89 mΩ
IBBC
Number of IBBC 𝑁 = 3 Filtering inductance 𝐿 = 𝐿 = 𝐿 = 1 mH Filtering capacitor 𝐶 = 68 μF
ESR of the inductance 𝑟 = 𝑟 = 𝑟 = 0.2 Ω Switching frequency 𝑓 = 20 kHz
Table 3. The design control parameters.
Parameter Value C11 = C12 = C13 6000
C2 10,000 𝛾 0.0025 η0 1
Figure 5. Nonlinear cascade control architecture.
For convenience, the FC-IBBC system is summarized, along with the adaptive con-troller in Table 1.

World Electr. Veh. J. 2022, 13, 124 11 of 22
Table 1. Nonlinear adaptive controller.
FC-IBBC system
dx1kdt = − r
L x1k − 1L (1− µk)x2 +
1L v f c (7)
dx2dt = 1
C
N∑
k=1(1− µk)x1k +
1RC (v f c − x2)
(8)
dx3dt = − 1
τf cx3 +
1C f c
i f c (9)
where k = 1, . . . , N;
Adaptive control laws
K = VdN
(η0
VdE0
+ 1)
(23)
Id = Kθ (24)e1k = x1k − Id (25)e2 = x2 − x2d (28)
x2d = 1s+c2
[N∑
k=1c1ke1k + c2x2 +
1C
N∑
k=1(1− µk)x1k +
θC
(v f c − x2
)](36)
µk = 1 + Lx2
(−c1ke1k + e2 +
rL x1k − 1
L v f c +KγC (v f c − x2)e2
)(37)
Adaptive law.θ = γ
C (v f c − x2)e2 (35)
Design parameters η0 ≥ 1; Vd > 0; γ > 0; c1k > 0; c2 > 0;
4. Simulation and Experimental Results
The adaptive nonlinear controller developed in this paper for the FC-IBBC system willnow be validated both by simulation and by experiments. Simulation is carried out usingthe Matlab®/Simulink® SimPower toolbox, and the experiments are performed using alaboratory prototype based on the Dspace DS1202 card.
4.1. Simulation Results
The fuel cell parameters are those of the Ballard Nexa 1200 fuel cell module, which hasa rated power of 1.2 kW. Figure 5 describes the simulation bench of the controlled systemFC-IBBC. The controlled system characteristics are listed in Table 2. The adaptive controldesign parameters are listed in Table 3.
Table 2. Controlled system parameters.
Parameter Designation Value
Fuel Cell
FC open circuit voltage E0 = 28.3 V
FC internal capacitor C f c = 130 F
Association of the activation andconcentration resistances Rac = 0.155 Ω
Ohmic resistance RO = 2.89 mΩ
IBBC
Number of IBBC N = 3
Filtering inductance L1 = L2 = L3 = 1 mH
Filtering capacitor C = 68 µF
ESR of the inductance r1 = r2 = r3 = 0.2 Ω
Switching frequency fs = 20 kHz

World Electr. Veh. J. 2022, 13, 124 12 of 22
Table 3. The design control parameters.
Parameter Value
C11= C12= C13 6000
C2 10,000
γ 0.0025
η0 1
Figures 6–16 show the resulting control performances of the fuel cell interleavedBuck–Boost converter system.
World Electr. Veh. J.2022, 13, x FOR PEER REVIEW 12 of 21
Figures 6–16 show the resulting control performances of the fuel cell interleaved Buck–Boost converter system.
Figure 6 illustrates the voltage measurement of vdc and its reference signal Vd. In this figure, one can observe that the controller behavior is satisfactory. Indeed, the DC-bus vdc perfectly tracks its reference Vd. The overshoot is 0 at t0 and 5% of Vd at the instant of change in the load, the system response time is less than 5 ms.
Figure 7 shows that the inductance currents are equal to the variation in the load. So, the equal current sharing between the IBBC branches is ensured.
Figure 8 shows the error e1k between the inductance current in each IBBC branch and its reference. The figure clearly shows that the error e1k converges to zero, despite load variations. The signal ripple is tolerable, as it is less than 0.12A.
Figure 9 shows that the online estimate of the unknown parameter 𝜃 converges to its true value.
Figures 10 and 11 respectively show the behavior of the voltage vfc and current ifc of the fuel cell in the presence of load variations. We can observe that the current of the fuel cell is continuous, which is beneficial for the fuel cell.
Figure 12 illustrates the capacitor voltage vc. Figure 13 shows the error e2 between the capacitor voltage x2 and its desired value x2d.
Clearly, e2 is well regulated to zero, despite the variation in the load. Figure 14 shows the FC internal voltage vi; one should note that the value of vi is low
because its charge rate is very high. The value of vi also represents the discharge of hydro-gen H2 in the fuel cell.
Figures 15 and 16 show the control signals μ1k and the PWM signals, with a switching frequency of 20 kHz.
Figure 6. Voltage measurement of vdc and its reference signal Vd.
0 0.01 0.02 0.03 0.04 0.05 0.06 0.07 0.08 0.09 0.10
5
10
15
20
25
DC-bus voltage ( V )
Time ( s )
0 0.01 0.02 0.03 0.04 0.05 0.06 0.07 0.08 0.09 0.1
0
0.5
1
1.5
Inductor current ik ( A )
Time ( s )
0.04 0.04 0.0401 0.0401 0.0401 0.04011.1
1.15
1.2
1.25
i1
i2
i3
Figure 6. Voltage measurement of vdc and its reference signal Vd.
World Electr. Veh. J.2022, 13, x FOR PEER REVIEW 12 of 21
Figures 6–16 show the resulting control performances of the fuel cell interleaved Buck–Boost converter system.
Figure 6 illustrates the voltage measurement of vdc and its reference signal Vd. In this figure, one can observe that the controller behavior is satisfactory. Indeed, the DC-bus vdc perfectly tracks its reference Vd. The overshoot is 0 at t0 and 5% of Vd at the instant of change in the load, the system response time is less than 5 ms.
Figure 7 shows that the inductance currents are equal to the variation in the load. So, the equal current sharing between the IBBC branches is ensured.
Figure 8 shows the error e1k between the inductance current in each IBBC branch and its reference. The figure clearly shows that the error e1k converges to zero, despite load variations. The signal ripple is tolerable, as it is less than 0.12A.
Figure 9 shows that the online estimate of the unknown parameter 𝜃 converges to its true value.
Figures 10 and 11 respectively show the behavior of the voltage vfc and current ifc of the fuel cell in the presence of load variations. We can observe that the current of the fuel cell is continuous, which is beneficial for the fuel cell.
Figure 12 illustrates the capacitor voltage vc. Figure 13 shows the error e2 between the capacitor voltage x2 and its desired value x2d.
Clearly, e2 is well regulated to zero, despite the variation in the load. Figure 14 shows the FC internal voltage vi; one should note that the value of vi is low
because its charge rate is very high. The value of vi also represents the discharge of hydro-gen H2 in the fuel cell.
Figures 15 and 16 show the control signals μ1k and the PWM signals, with a switching frequency of 20 kHz.
Figure 6. Voltage measurement of vdc and its reference signal Vd.
0 0.01 0.02 0.03 0.04 0.05 0.06 0.07 0.08 0.09 0.10
5
10
15
20
25
DC-bus voltage ( V )
Time ( s )
0 0.01 0.02 0.03 0.04 0.05 0.06 0.07 0.08 0.09 0.1
0
0.5
1
1.5
Inductor current ik ( A )
Time ( s )
0.04 0.04 0.0401 0.0401 0.0401 0.04011.1
1.15
1.2
1.25
i1
i2
i3
Figure 7. Inductance currents ik of IBBC.

World Electr. Veh. J. 2022, 13, 124 13 of 22
World Electr. Veh. J.2022, 13, x FOR PEER REVIEW 13 of 21
Figure 7. Inductance currents ik of IBBC.
Figure 8. Error e1k between inductance current in each IBBC branch and its reference.
Figure 9. Estimate unknown parameter 𝜃 and its reference.
Figure 10. Fuel cell voltage vfc.
0 0.01 0.02 0.03 0.04 0.05 0.06 0.07 0.08 0.09 0.1-1
-0.8
-0.6
-0.4
-0.2
0
0.2
Error e1k ( A )
Time ( s )
0.0391 0.0391 0.0392 0.0392 0.0392
-0.05
0
0.05
e11
e12
e13
0 0.01 0.02 0.03 0.04 0.05 0.06 0.07 0.08 0.09 0.10.02
0.04
0.06
0.08
0.1
0.12Θref and est ( Ω
-1 )
Time ( s )
Θest
Θref
0.06 0.0605 0.061 0.0615
0.08
0.085
0.09
0.095
0.0295 0.03 0.0305 0.031 0.03150.07
0.08
0.09
0.1
0 0.01 0.02 0.03 0.04 0.05 0.06 0.07 0.08 0.09 0.128.285
28.29
28.295
28.3
28.305fuel cell voltage vfc ( V )
Time ( s )
Figure 8. Error e1k between inductance current in each IBBC branch and its reference.
World Electr. Veh. J.2022, 13, x FOR PEER REVIEW 13 of 21
Figure 7. Inductance currents ik of IBBC.
Figure 8. Error e1k between inductance current in each IBBC branch and its reference.
Figure 9. Estimate unknown parameter 𝜃 and its reference.
Figure 10. Fuel cell voltage vfc.
0 0.01 0.02 0.03 0.04 0.05 0.06 0.07 0.08 0.09 0.1-1
-0.8
-0.6
-0.4
-0.2
0
0.2
Error e1k ( A )
Time ( s )
0.0391 0.0391 0.0392 0.0392 0.0392
-0.05
0
0.05
e11
e12
e13
0 0.01 0.02 0.03 0.04 0.05 0.06 0.07 0.08 0.09 0.10.02
0.04
0.06
0.08
0.1
0.12Θref and est ( Ω
-1 )
Time ( s )
Θest
Θref
0.06 0.0605 0.061 0.0615
0.08
0.085
0.09
0.095
0.0295 0.03 0.0305 0.031 0.03150.07
0.08
0.09
0.1
0 0.01 0.02 0.03 0.04 0.05 0.06 0.07 0.08 0.09 0.128.285
28.29
28.295
28.3
28.305fuel cell voltage vfc ( V )
Time ( s )
Figure 9. Estimate unknown parameter θ and its reference.
Figure 6 illustrates the voltage measurement of vdc and its reference signal Vd. In thisfigure, one can observe that the controller behavior is satisfactory. Indeed, the DC-bus vdcperfectly tracks its reference Vd. The overshoot is 0 at t0 and 5% of Vd at the instant ofchange in the load, the system response time is less than 5 ms.
Figure 7 shows that the inductance currents are equal to the variation in the load. So,the equal current sharing between the IBBC branches is ensured.
Figure 12 illustrates the capacitor voltage vc. Figure 8 shows the error e1k between theinductance current in each IBBC branch and its reference. The figure clearly shows that theerror e1k converges to zero, despite load variations. The signal ripple is tolerable, as it isless than 0.12A.

World Electr. Veh. J. 2022, 13, 124 14 of 22
World Electr. Veh. J.2022, 13, x FOR PEER REVIEW 13 of 21
Figure 7. Inductance currents ik of IBBC.
Figure 8. Error e1k between inductance current in each IBBC branch and its reference.
Figure 9. Estimate unknown parameter 𝜃 and its reference.
Figure 10. Fuel cell voltage vfc.
0 0.01 0.02 0.03 0.04 0.05 0.06 0.07 0.08 0.09 0.1-1
-0.8
-0.6
-0.4
-0.2
0
0.2
Error e1k ( A )
Time ( s )
0.0391 0.0391 0.0392 0.0392 0.0392
-0.05
0
0.05
e11
e12
e13
0 0.01 0.02 0.03 0.04 0.05 0.06 0.07 0.08 0.09 0.10.02
0.04
0.06
0.08
0.1
0.12Θref and est ( Ω
-1 )
Time ( s )
Θest
Θref
0.06 0.0605 0.061 0.0615
0.08
0.085
0.09
0.095
0.0295 0.03 0.0305 0.031 0.03150.07
0.08
0.09
0.1
0 0.01 0.02 0.03 0.04 0.05 0.06 0.07 0.08 0.09 0.128.285
28.29
28.295
28.3
28.305fuel cell voltage vfc ( V )
Time ( s )
Figure 10. Fuel cell voltage vfc.
World Electr. Veh. J.2022, 13, x FOR PEER REVIEW 14 of 21
Figure 11. Fuel cell current ifc.
Figure 12. Capacitor voltage vc.
Figure 13. Error e2 between the capacitor voltage vc and its desired value x2d.
0 0.01 0.02 0.03 0.04 0.05 0.06 0.07 0.08 0.09 0.10
0.5
1
1.5
2
2.5
fuel cell current ifc ( A )
Time ( s )
0 0.01 0.02 0.03 0.04 0.05 0.06 0.07 0.08 0.09 0.125
30
35
40
45
50
55Capacitor voltage vc ( V )
Time ( s )
0 0.01 0.02 0.03 0.04 0.05 0.06 0.07 0.08 0.09 0.1-0.4
-0.2
0
0.2
0.4Error e2 ( A )
Time ( s )
Figure 11. Fuel cell current ifc.
Figure 9 shows that the online estimate of the unknown parameter θ converges to itstrue value.
Figures 10 and 11 respectively show the behavior of the voltage vfc and current ifc ofthe fuel cell in the presence of load variations. We can observe that the current of the fuelcell is continuous, which is beneficial for the fuel cell.
Figure 13 shows the error e2 between the capacitor voltage x2 and its desired value x2d.Clearly, e2 is well regulated to zero, despite the variation in the load.
Figure 14 shows the FC internal voltage vi; one should note that the value of vi islow because its charge rate is very high. The value of vi also represents the discharge ofhydrogen H2 in the fuel cell.
Figures 15 and 16 show the control signals µ1k and the PWM signals, with a switchingfrequency of 20 kHz.

World Electr. Veh. J. 2022, 13, 124 15 of 22
World Electr. Veh. J.2022, 13, x FOR PEER REVIEW 14 of 21
Figure 11. Fuel cell current ifc.
Figure 12. Capacitor voltage vc.
Figure 13. Error e2 between the capacitor voltage vc and its desired value x2d.
0 0.01 0.02 0.03 0.04 0.05 0.06 0.07 0.08 0.09 0.10
0.5
1
1.5
2
2.5
fuel cell current ifc ( A )
Time ( s )
0 0.01 0.02 0.03 0.04 0.05 0.06 0.07 0.08 0.09 0.125
30
35
40
45
50
55Capacitor voltage vc ( V )
Time ( s )
0 0.01 0.02 0.03 0.04 0.05 0.06 0.07 0.08 0.09 0.1-0.4
-0.2
0
0.2
0.4Error e2 ( A )
Time ( s )
Figure 12. Capacitor voltage vc.
World Electr. Veh. J.2022, 13, x FOR PEER REVIEW 14 of 21
Figure 11. Fuel cell current ifc.
Figure 12. Capacitor voltage vc.
Figure 13. Error e2 between the capacitor voltage vc and its desired value x2d.
0 0.01 0.02 0.03 0.04 0.05 0.06 0.07 0.08 0.09 0.10
0.5
1
1.5
2
2.5
fuel cell current ifc ( A )
Time ( s )
0 0.01 0.02 0.03 0.04 0.05 0.06 0.07 0.08 0.09 0.125
30
35
40
45
50
55Capacitor voltage vc ( V )
Time ( s )
0 0.01 0.02 0.03 0.04 0.05 0.06 0.07 0.08 0.09 0.1-0.4
-0.2
0
0.2
0.4Error e2 ( A )
Time ( s )
Figure 13. Error e2 between the capacitor voltage vc and its desired value x2d.
World Electr. Veh. J.2022, 13, x FOR PEER REVIEW 15 of 21
Figure 14. FC internal voltage vi.
Figure 15. Control signals μ1k with zoom.
Figure 16. Pulse width modulation of IBBC with zoom.
0 0.01 0.02 0.03 0.04 0.05 0.06 0.07 0.08 0.09 0.10
0.5
1
1.5x 10⁻³ FC internal voltage vi ( V )
Time ( s )
0 0.01 0.02 0.03 0.04 0.05 0.06 0.07 0.08 0.09 0.1
0.1
0.2
0.3
0.4
0.5
Duty ratio µ1k
Time ( s )
µ1
µ2µ30.0453 0.0454
0.45
0.455
0.46
0.465
0.47
0 0.01 0.02 0.03 0.04 0.05 0.06 0.07 0.08 0.09 0.1
-0.5
0
0.5
1Pulse Width Modulation
Time ( s )
PWM1
PWM2
PWM3
0.039 0.039 0.039 0.039 0.039 0.0391 0.0391 0.0391 0.0391 0.0391
0
0.5
1
Figure 14. FC internal voltage vi.

World Electr. Veh. J. 2022, 13, 124 16 of 22
World Electr. Veh. J.2022, 13, x FOR PEER REVIEW 15 of 21
Figure 14. FC internal voltage vi.
Figure 15. Control signals μ1k with zoom.
Figure 16. Pulse width modulation of IBBC with zoom.
0 0.01 0.02 0.03 0.04 0.05 0.06 0.07 0.08 0.09 0.10
0.5
1
1.5x 10⁻³ FC internal voltage vi ( V )
Time ( s )
0 0.01 0.02 0.03 0.04 0.05 0.06 0.07 0.08 0.09 0.1
0.1
0.2
0.3
0.4
0.5
Duty ratio µ1k
Time ( s )
µ1
µ2µ30.0453 0.0454
0.45
0.455
0.46
0.465
0.47
0 0.01 0.02 0.03 0.04 0.05 0.06 0.07 0.08 0.09 0.1
-0.5
0
0.5
1Pulse Width Modulation
Time ( s )
PWM1
PWM2
PWM3
0.039 0.039 0.039 0.039 0.039 0.0391 0.0391 0.0391 0.0391 0.0391
0
0.5
1
Figure 15. Control signals µ1k with zoom.
World Electr. Veh. J.2022, 13, x FOR PEER REVIEW 15 of 21
Figure 14. FC internal voltage vi.
Figure 15. Control signals μ1k with zoom.
Figure 16. Pulse width modulation of IBBC with zoom.
0 0.01 0.02 0.03 0.04 0.05 0.06 0.07 0.08 0.09 0.10
0.5
1
1.5x 10⁻³ FC internal voltage vi ( V )
Time ( s )
0 0.01 0.02 0.03 0.04 0.05 0.06 0.07 0.08 0.09 0.1
0.1
0.2
0.3
0.4
0.5
Duty ratio µ1k
Time ( s )
µ1
µ2µ30.0453 0.0454
0.45
0.455
0.46
0.465
0.47
0 0.01 0.02 0.03 0.04 0.05 0.06 0.07 0.08 0.09 0.1
-0.5
0
0.5
1Pulse Width Modulation
Time ( s )
PWM1
PWM2
PWM3
0.039 0.039 0.039 0.039 0.039 0.0391 0.0391 0.0391 0.0391 0.0391
0
0.5
1
Figure 16. Pulse width modulation of IBBC with zoom.
4.2. Experimental Results
The considered experimental test bench of the fuel cell interleaved Buck–Boost con-verter system is shown by Figure 17. The adaptive state-feedback controller of Table 2is implemented using dSPACE 1202 and Control Desk®/software®. The testbed consistsessentially of the following elements:
Ballard Nexa 1200 fuel cell module with its monitoring software.Three metal hydride canisters from Heliocentris with storage capacities of 800 NL hydrogen.
- Power supply from BK Precision.- Power resistors.- Programmable DC electronic load from BK Precision.- MicroLabBox-dSPACE DS1202 with Control Desk®/software® plugged in a Pentium 4
personal computer.- Semikron IGBT module (SEMITEACH).- Power card together with measurement card.

World Electr. Veh. J. 2022, 13, 124 17 of 22
- Two ferrite inductance.- Two hall effect current sensors.- Two voltage sensors.- A digital scope.
World Electr. Veh. J.2022, 13, x FOR PEER REVIEW 16 of 21
4.2. Experimental Results The considered experimental test bench of the fuel cell interleaved Buck–Boost con-
verter system is shown by Figure 17. The adaptive state-feedback controller of Table 2 is implemented using dSPACE 1202 and Control Desk®/software®. The testbed consists es-sentially of the following elements:
Ballard Nexa 1200 fuel cell module with its monitoring software. Three metal hydride canisters from Heliocentris with storage capacities of 800 NL
hydrogen. - Power supply from BK Precision. - Power resistors. - Programmable DC electronic load from BK Precision. - MicroLabBox-dSPACE DS1202 with Control Desk®/software® plugged in a Pentium
4 personal computer. - Semikron IGBT module (SEMITEACH). - Power card together with measurement card. - Two ferrite inductance. - Two hall effect current sensors. - Two voltage sensors. - A digital scope.
The load resistance changes are programmed using the programmable DC electronic load. The controlled system characteristics are summarized in Table 4. The adaptive con-trol design parameters are shown in Table 5. The number of parallel branches of the IBBC is N = 2.
Figure 17. Laboratory prototype used for experimental validation.
Table 4. Controlled system parameters.
Parameter Designation Value Fuel Cell Ballard Nexa 1200 fuel cell module the fuel cell has a rated power of 1.2 kW
IBBC
Number of IBBCs 𝑁 = 2 Filtering inductance 𝐿 = 𝐿 = 4 mH Filtering capacitor 𝐶 = 110 μF
ESR of the inductance 𝑟 = 𝑟 = 0.3 Ω Switching frequency 𝑓 = 20 kHz
Figure 17. Laboratory prototype used for experimental validation.
The load resistance changes are programmed using the programmable DC electronicload. The controlled system characteristics are summarized in Table 4. The adaptive controldesign parameters are shown in Table 5. The number of parallel branches of the IBBC isN = 2.
Table 4. Controlled system parameters.
Parameter Designation Value
Fuel Cell Ballard Nexa 1200 fuel cell module the fuel cell has a rated power of 1.2 kW
IBBC
Number of IBBCs N = 2
Filtering inductance L1 = L2 = 4 mH
Filtering capacitor C = 110 µF
ESR of the inductance r1 = r2 = 0.3 Ω
Switching frequency fs = 20 kHz
Table 5. The design control parameters.
Parameter Value
C11 = C12 2000
C2 90,000
γ 0.002
η0 1.077
The load switches from 90 Ω to 30 Ω and returns to 90 Ω. The reference signal of theDC-bus voltage is set to Vdc = 24 V.
Figure 18 illustrates the voltage measurement of vdc and its reference signal Vd. In thisfigure, one can observe that the controller behavior is satisfactory. Indeed, the DC-bus vdcperfectly tracks its reference Vd.

World Electr. Veh. J. 2022, 13, 124 18 of 22
World Electr. Veh. J.2022, 13, x FOR PEER REVIEW 17 of 21
Table 5. The design control parameters.
Parameter Value C11 = C12 2000
C2 90,000 𝛾 0.002 η0 1.077
The load switches from 90 Ω to 30 Ω and returns to 90 Ω. The reference signal of the DC-bus voltage is set to 𝑉 = 24 V.
Figure 18 illustrates the voltage measurement of vdc and its reference signal Vd. In this figure, one can observe that the controller behavior is satisfactory. Indeed, the DC-bus vdc perfectly tracks its reference Vd.
Figure 19 shows that the inductance currents are equal to the variation in the load. So, the equal current sharing between IBBC branches is ensured. This figure clearly shows that the desired current Id was well estimated.
Figure 20 shows that the online estimate of the unknown parameter 𝜃 converges to its true value.
Figure 21 shows the voltage vfc of the fuel cell in the presence of load variations. Figure 22 illustrates the capacitor voltage vc. Figures 23 and 24 show the control signals μ1k and the PWM signals, with a switching
frequency of 20 kHz. The experimental results confirm the performances established in the theoretical
analysis and simulation. Specifically, the DC-bus voltage regulation and the equal current sharing between modules are well ensured, etc.
Figure 18. Voltage measurement of vdc and its reference signal Vd.
0 5 10 15 20 25 30 35 40 45
15
20
25
30DC-bus voltage ( V )
Time ( s )
V
d
vdc
29.5 30 30.5 31
24
26
28
30
Figure 18. Voltage measurement of vdc and its reference signal Vd.
Figure 19 shows that the inductance currents are equal to the variation in the load. So,the equal current sharing between IBBC branches is ensured. This figure clearly shows thatthe desired current Id was well estimated.
Figure 20 shows that the online estimate of the unknown parameter θ converges to itstrue value.
Figure 21 shows the voltage vfc of the fuel cell in the presence of load variations.
World Electr. Veh. J.2022, 13, x FOR PEER REVIEW 18 of 21
Figure 19. Inductance currents ik of IBBC and its desired value Id est.
Figure 20. Estimate unknown parameter θ and its reference.
Figure 21. Fuel cell voltage vfc.
0 5 10 15 20 25 30 35 40 450.1
0.2
0.3
0.4
0.5
0.6
0.7Inductor current ( A )
Time ( s )
4.6 4.7 4.80.3
0.32
0.34
i1i2Id est
4.69 4.695 4.7
0.31
0.32
0.33
0 5 10 15 20 25 30 35 40 450.005
0.01
0.015
0.02
0.025
0.03
0.035Θref and est ( Ω
-1 )
Time ( s )
Θref
Θest
4 6 80.0105
0.011
0.0115
30 30.5 310.01
0.02
0.03
0 5 10 15 20 25 30 35 40 4525
26
27
28
29
30
31fuel cell voltage vfc ( V )
Time ( s )
Figure 19. Inductance currents ik of IBBC and its desired value Id est.

World Electr. Veh. J. 2022, 13, 124 19 of 22
World Electr. Veh. J.2022, 13, x FOR PEER REVIEW 18 of 21
Figure 19. Inductance currents ik of IBBC and its desired value Id est.
Figure 20. Estimate unknown parameter θ and its reference.
Figure 21. Fuel cell voltage vfc.
0 5 10 15 20 25 30 35 40 450.1
0.2
0.3
0.4
0.5
0.6
0.7Inductor current ( A )
Time ( s )
4.6 4.7 4.80.3
0.32
0.34
i1i2Id est
4.69 4.695 4.7
0.31
0.32
0.33
0 5 10 15 20 25 30 35 40 450.005
0.01
0.015
0.02
0.025
0.03
0.035Θref and est ( Ω
-1 )
Time ( s )
Θref
Θest
4 6 80.0105
0.011
0.0115
30 30.5 310.01
0.02
0.03
0 5 10 15 20 25 30 35 40 4525
26
27
28
29
30
31fuel cell voltage vfc ( V )
Time ( s )
Figure 20. Estimate unknown parameter θ and its reference.
World Electr. Veh. J.2022, 13, x FOR PEER REVIEW 18 of 21
Figure 19. Inductance currents ik of IBBC and its desired value Id est.
Figure 20. Estimate unknown parameter θ and its reference.
Figure 21. Fuel cell voltage vfc.
0 5 10 15 20 25 30 35 40 450.1
0.2
0.3
0.4
0.5
0.6
0.7Inductor current ( A )
Time ( s )
4.6 4.7 4.80.3
0.32
0.34
i1i2Id est
4.69 4.695 4.7
0.31
0.32
0.33
0 5 10 15 20 25 30 35 40 450.005
0.01
0.015
0.02
0.025
0.03
0.035Θref and est ( Ω
-1 )
Time ( s )
Θref
Θest
4 6 80.0105
0.011
0.0115
30 30.5 310.01
0.02
0.03
0 5 10 15 20 25 30 35 40 4525
26
27
28
29
30
31fuel cell voltage vfc ( V )
Time ( s )
Figure 21. Fuel cell voltage vfc.
Figure 22 illustrates the capacitor voltage vc.Figures 23 and 24 show the control signals µ1k and the PWM signals, with a switching
frequency of 20 kHz.The experimental results confirm the performances established in the theoretical
analysis and simulation. Specifically, the DC-bus voltage regulation and the equal currentsharing between modules are well ensured, etc.

World Electr. Veh. J. 2022, 13, 124 20 of 22World Electr. Veh. J.2022, 13, x FOR PEER REVIEW 19 of 21
Figure 22. Capacitor voltage vc.
Figure 23. Control signals μk with zoom.
Figure 24. Pulse width modulation of IBBC.
0 5 10 15 20 25 30 35 40 4525
30
35
40
45
50
55
60Capacitor voltage ( V )
Time ( s )
0 5 10 15 20 25 30 35 40 450.3
0.35
0.4
0.45
0.5
0.55
0.6Duty ratio µk
Time ( s )
14.6 14.8 15 15.2 15.4 15.6 15.8 160.44
0.46
0.48
µ1
µ2
Figure 22. Capacitor voltage vc.
World Electr. Veh. J.2022, 13, x FOR PEER REVIEW 19 of 21
Figure 22. Capacitor voltage vc.
Figure 23. Control signals μk with zoom.
Figure 24. Pulse width modulation of IBBC.
0 5 10 15 20 25 30 35 40 4525
30
35
40
45
50
55
60Capacitor voltage ( V )
Time ( s )
0 5 10 15 20 25 30 35 40 450.3
0.35
0.4
0.45
0.5
0.55
0.6Duty ratio µk
Time ( s )
14.6 14.8 15 15.2 15.4 15.6 15.8 160.44
0.46
0.48
µ1
µ2
Figure 23. Control signals µk with zoom.
World Electr. Veh. J.2022, 13, x FOR PEER REVIEW 19 of 21
Figure 22. Capacitor voltage vc.
Figure 23. Control signals μk with zoom.
Figure 24. Pulse width modulation of IBBC.
0 5 10 15 20 25 30 35 40 4525
30
35
40
45
50
55
60Capacitor voltage ( V )
Time ( s )
0 5 10 15 20 25 30 35 40 450.3
0.35
0.4
0.45
0.5
0.55
0.6Duty ratio µk
Time ( s )
14.6 14.8 15 15.2 15.4 15.6 15.8 160.44
0.46
0.48
µ1
µ2
Figure 24. Pulse width modulation of IBBC.

World Electr. Veh. J. 2022, 13, 124 21 of 22
5. Conclusions
The problem of controlling an interleaved Buck–Boost converter connected to a fuelcell energy source is dealt with in this paper. The control objectives are as follows: (i) outputDC-bus voltage regulation under load uncertainty (this is necessary to maintain the voltageconstant in the DC-bus), (ii) equal current sharing between IBBC branches, especially whensupplying heavy loads, and (iii) asymptotic stability of the closed-loop system. To meetthese objectives, we have developed an adaptive state-feedback controller that consists ofnonlinear control laws. Using theoretical analysis, simulation study, and experimental tests,we have shown that the proposed controller indeed meets all the control objectives.
Author Contributions: Formal analysis, M.K. and H.E.F.; Methodology, H.E.F. and F.G.; Resources,A.R.; Software, Z.E.I., F.Z.B. and K.G.; Supervision, H.E.F. and F.G.; Validation, M.K., Z.E.I. and A.L.;Visualization, F.Z.B. and A.R.; Writing—original draft, M.K., Z.E.I. and K.G.; Writing—review andediting, A.L. and F.G. All authors have read and agreed to the published version of the manuscript.
Funding: This research received no external funding.
Institutional Review Board Statement: Not applicable.
Informed Consent Statement: Not applicable.
Data Availability Statement: Not applicable.
Acknowledgments: The authors gratefully acknowledge the support of the Moroccan Ministry ofHigher Education (MESRSFC) and the CNRST under grant number PPR/2015/36.
Conflicts of Interest: The authors declare no conflict of interest.
References1. Brand, C.; Anable, J.; Ketsopoulou, I.; Watson, J. Road to zero or road to nowhere? Disrupting transport and energy in a zero
carbon world. Energy Policy 2020, 139, 111334. [CrossRef]2. Chen, H.; Wang, Z.; Xu, S.; Zhao, Y.; Cheng, Q.; Zhang, B. Energy demand, emission reduction and health co-benefits evaluated in
transitional China in a 2 C warming world. J. Clean. Prod. 2020, 264, 121773. [CrossRef]3. El Idrissi, Z.; El Fadil, H.; Belhaj, F.Z.; Lassioui, A.; Oulcaid, M.; Gaouzi, K. Theoretical Design and Experimental Validation of a
Nonlinear Controller for Energy Storage System Used in HEV. World Electr. Veh. J. 2020, 11, 49. [CrossRef]4. Zhang, M.; Fan, X. Review on the State of Charge Estimation Methods for Electric Vehicle Battery. World Electr. Veh. J. 2020, 11, 23.
[CrossRef]5. Fathabadi, H. Combining a proton exchange membrane fuel cell (PEMFC) stack with a Li-ion battery to supply the power needs
of a hybrid electric vehicle. Renew. Energy 2019, 130, 714–724. [CrossRef]6. Qi, Z. Proton Exchange Membrane Fuel Cells; CRC Press: Boca Raton, FL, USA, 2013.7. James, L. Fuel Cell Systems Explained, 2nd ed.; Wiley: New York, NY, USA, 2003.8. Abdelfatah, K.; Gaillard, A.; De Bernardinis, A.; Bethoux, O.; Hissel, D.; Khatir, Z. A review on DC/DC converter architectures
for power fuel cell applications. Energy Convers. Manag. 2015, 105, 716–730.9. VenkateshNaik, M.; Samuel, P. A Non-Inverting Multi Device Interleaved Buck Boost Converter for Fuel Cell Low Voltage
Applications. In Proceedings of the 2019 Global Conference for Advancement in Technology (GCAT), Bangaluru, India,18–20 October 2019; pp. 1–7. [CrossRef]
10. Velázquez-Elizondo, P.E.I.; Araujo-Vargas, A.; Villarruel-Parra, F.J.; Gómez-Olguín, K.; Cano, P.; Granados-Luna, T.R. Six-phasedual-interleaved buck-boost converter for high power-density automotive applications. J. Eng. 2019, 17, 3592–3597. [CrossRef]
11. Izci, D.; Ekinci, S. A novel improved version of hunger games search algorithm for function optimization and efficient controllerdesign of buck converter system. e-Prime—Advances in Electrical Engineering. Electron. Energy 2022, 2, 100039. [CrossRef]
12. Rahimi, T.; Islam, M.R.; Gholizadeh, H.; Mahdizadeh, S.; Afjei, E. Design and Implementation of a High Step Up DC-DCConverter Based on the Conventional Boost and Buck-Boost Converters with High Value of the Efficiency Suitable for RenewableApplication. Sustainability 2021, 13, 10699. [CrossRef]
13. Thi Kim Nga, T.; Park, S.-M.; Park, Y.-J.; Park, S.-H.; Kim, S.; Van Cong Thuong, T.; Lee, M.; Hwang, K.C.; Yang, Y.; Lee, K.-Y. AWide Input Range Buck-Boost DC–DC Converter Using Hysteresis Triple-Mode Control Technique with Peak Efficiency of 94.8%for RF Energy Harvesting Applications. Energies 2018, 11, 1618. [CrossRef]
14. Azer, P.; Emadi, A. Generalized State Space Average Model for Multi-Phase Interleaved Buck, Boost and Buck-Boost DC-DCConverters: Transient, Steady-State and Switching Dynamics. IEEE Access 2020, 8, 77735–77745. [CrossRef]
15. Rahimi, T.; Ding, L.; Kheshti, M.; Faraji, R. A ZVS Three-Phase Interleaved DC-DC converter with SFM control method forthe Microgrid Applications. In Proceedings of the 2020 11th Power Electronics, Drive Systems, and Technologies Conference(PEDSTC), Tehran, Iran, 4–6 February 2020; pp. 1–5. [CrossRef]

World Electr. Veh. J. 2022, 13, 124 22 of 22
16. Rahimi, T.; Ding, L.; Faraji, R.; Kheshti, M.; Pou, J. Performance Improvement of a Three-Phase Interleaved DC–DC ConverterWithout Requiring Antisaturation Control for Postfault Conditions. IEEE Trans. Power Electron. 2021, 36, 7378–7383. [CrossRef]
17. Sampath, S.; Rahiman, Z.; Chenniappan, S.; Sundaram, E.; Subramaniam, U.; Padmanaban, S. Efficient Multi-Phase Converter forE-Mobility. World Electr. Veh. J. 2022, 13, 67. [CrossRef]
18. Cheddadi, Y.; El Idrissi, Z.; Errahimi, F.; Es-sbai, N. Robust integral sliding mode controller design of a bidirectional DC chargerin PV-EV charging station. Int. J. Digit. Signals Smart Syst. 2021, 5, 137–151. [CrossRef]
19. Elamri, O.; Oukassi, A.; El Bahir, L.; El Idrissi, Z. Combined Vector and Direct Controls Based on Five-Level Inverter for HighPerformance of IM Drive. World Electr. Veh. J. 2022, 13, 17. [CrossRef]
20. Gaouzi, K.; El Fadil, H.; Belhaj, F.Z.; El Idrissi, Z. Model predictive control of an inverter for electric vehicles applications.In Proceedings of the 2020 IEEE 2nd International Conference on Electronics, Control, Optimization and Computer Science(ICECOCS), Kenitra, Morocco, 2–3 December 2020. [CrossRef]
21. Belhaj, F.Z.; El Fadil, H.; Idrissi, Z.E.; Koundi, M.; Gaouzi, K. Modeling, Analysis and Experimental Validation of the Fuel CellAssociation with DC-DC Power Converters with Robust and Anti-Windup PID Controller Design. Electronics 2020, 9, 1889.[CrossRef]
22. Wu, X.; Shi, W.; Du, J. Dual-Switch Boost DC–DC Converter for Use in Fuel-Cell-Powered Vehicles. IEEE Access 2019, 7,74081–74088. [CrossRef]
23. El Fadil, H.; Giri, F.; Guerrero, J.M.; Tahri, A. Modeling and Nonlinear Control of a Fuel Cell/Supercapacitor Hybrid EnergyStorage System for Electric Vehicles. IEEE Trans. Veh. Technol. 2014, 63, 3011–3018. [CrossRef]
24. Slah, F.; Mansour, A.; Hajer, M.; Faouzi, B. Analysis, modeling and implementation of an interleaved boost DC-DC converter forfuel cell used in electric. Int. J. Hydrogen Energy 2017, 42, 28852–28864. [CrossRef]
25. Zhang, Y.; Liu, H.; Li, J.; Sumner, M.; Xia, C. DC–DC Boost Converter With a Wide Input Range and High Voltage Gain for FuelCell Vehicles. IEEE Trans. Power Electron. 2019, 34, 4100–4111. [CrossRef]
26. Gao, D.; Jin, Z.; Liu, J.; Ouyang, M. An interleaved step-up/step-down converter for fuel cell vehicle applications. Int. J. HydrogenEnergy 2016, 41, 22422–22432. [CrossRef]
27. Intidam, A.; El Fadil, H.; El Idrissi, Z.; Lassioui, A.; Rachid, A.; Jabal Laafou, A. Speed Control of a Brushless DC Motor Poweredby a PEM Fuel Cell. In Proceedings of the 2021 9th International Renewable and Sustainable Energy Conference (IRSEC), Morocco,23–27 November 2021; pp. 1–6. [CrossRef]
28. Belhaj, F.Z.; El Fadil, H.; El Idrissi, Z.; Intidam, A.; Koundi, M.; Giri, F. New Equivalent Electrical Model of a Fuel Celland Comparative Study of Several Existing Models with Experimental Data from the PEMFC Nexa 1200 W. Micromachines2021, 12, 1047. [CrossRef] [PubMed]
29. Erickson, R.; Maksimovic, D. Power electronics. In Fundamentals of Power Electronics; Springer: New York, NY, USA, 2001.30. Yu, X.; Starke, M.R.; Tolbert, L.M.; Ozpineci, B. Fuel cell power conditioning for electric power applications: A summary. IET
Electr. Power Appl. 2007, 1, 643–656. [CrossRef]31. Fontes, G.; Turpin, C.; Astier, S.; Meynard, T.A. Interactionsbetween fuel cells and power converters: Influence of current
harmonics on a fuel cell stack. IEEE Trans Power Electron. 2007, 22, 670e8. [CrossRef]32. Rosas-Caro, J.C.; Sanchez, V.M.; Vazquez-Bautista, R.F.; Morales-Mendoza, L.J.; Mayo-Maldonado, J.C.; Garcia-Vite, P.M.;
Barbosa, R. A novel DC-DC multilevel SEPIC converter for PEMFC systems. Int. J. Hydrogen Energy 2016, 41, 23401–23408.[CrossRef]
33. Valdez-Resendiz, J.E.; Sanchez, V.M.; Rosas-Caro, J.C.; Mayo-Maldonado, J.C.; Sierra, J.M.; Barbosa, R. Continuous input-currentbuck-boost DC-DC converter for PEM fuel cell applications. Int. J. Hydrogen Energy 2017, 42, 30389–30399. [CrossRef]
34. Gerard, M.; Poirot-Crouvezier, J.-P.; Hissel, D.; Pera, M.-C. Ripple current effects on pemfc aging test by experimental andmodeling. ASME J. Fuel Cell Sci. Technol. 2011, 8, 021004. [CrossRef]
35. Chang, C.; Knights, M.A. Interleaving technique in distributed power conversion systems. IEEE Trans. Circuits Syst. I Fundam.Theory Appl. 1995, 42, 245–251. [CrossRef]
36. Wang, Y.; Wang, C.-Y. Transient Analysis of Polymer Electrolyte Fuel Cells. Electrochim. Acta 2005, 50, 1307–1315. [CrossRef]37. Amrouche, F.; Mahmah, B.; Belhamel, M.; Benmoussa, H. Modélisation d’une Pile à Combustible PEMFC Alimentée Directement
en Hydrogène-Oxygène et Validation Expérimentale. Rev. Des Energ. Renouv. 2005, 8, 109–120.38. Krein, P.T.; Bentsman, J.; Bass, R.M.; Lesieutre, B.L. On the use of averaging for the analysis of power electronic systems. IEEE
Trans. Power Electron. 1990, 5, 182–190. [CrossRef]39. Goudarzian, A.; Khosravi, A.; Raeisi, H.A. Optimized sliding mode current controller for power converters with non-minimum
phase nature. J. Frankl. Inst. 2019, 356, 8569–8594. [CrossRef]40. Khalil, H.K. Nonlinear Systems Analysis; Prentice Hall Inc.: Upper Saddle River, NJ, USA, 2003.41. Lee, J.-W. Constructive and discrete versions of the lyapunov’s stability theorem and the lasalle’s invariance theorem. Commun.
Korean Math. Soc. 2002, 17, 155–163. [CrossRef]
Related Documents