State diagram of foods: Its potential use in food processing and product stability Mohammad Shafiur Rahman * & Department of Food Science and Nutrition, College of Agricultural and Marine Sciences, Sultan Qaboos University, P.O. Box-34, Al-Khod, PC 123, Sultanate of Oman (Tel.: C968 24415 236; fax: C968 24413 418; e-mail: shafi[email protected]) State diagram is a map of the different states of a food as a function of water or solids content and temperature. The main advantage of drawing map is in identifying different states of a food, such as freezing point and glass transition, which helps in understanding the complex changes when food’s water content and temperature are changed. It also assists in identifying food’s stability during storage as well as selecting suitable conditions of temperature and moisture content for processing. This paper provides an overview and critical assessment on the basic concepts of the state diagram with their terminologies, selected measurement techniques, and their use. Glass transition alone could not be considered as generic rules for food stability criteria since numbers of instances, such as pore formation, diffusion, microbial stability, non-enzymatic browning, other factors or mechanisms play important role. However, it is definitely one of the factors affecting the stability, and a future challenge to combine the glass concept with other mechanisms or factors. Introduction In the literature new concepts and hypotheses are being developed and proposed in the areas of food properties in order to bring food science from empiricism to the strong scientific foundation (Rahman, 2005). In the middle of the 20th century scientists began to discover the existence of a relationship between the water contained in a food and its relative tendency to spoil (Scott, 1953). In 1980s Labuza and his group generated significant data on food stability as a function of water activity. They also began to realize that the active water could be much more important to the stability of a food than total amount of water present. Thus, it is possible to develop generalized rules or limits for the stability of foods using water activity. For example, there is a critical water activity below no microorganisms can grow is about 0.6 values of water activity. A food product is most stable at its monolayer moisture content, which vary with the chemical composition and structure. This was the main reason why food scientists started to emphasis water activity rather than total water content. Since then, the scientific community has explored the great significance of water activity in determining the physical characteristics, pro- cesses, shelf life, and sensory properties of foods. It is now used to predict the end point of drying, process design and control, ingredient selection, product stability and packa- ging selection. Recently, the limitations of water activity are pointed and alternatives are proposed. These limitations are: (i) water activity is defined at equilibrium, whereas foods may not be in a state of equilibrium, (ii) the critical limits of water activity may also be shifted to higher or lower levels by other factors, such as pH, salt, anti-microbial agents, heat treatment, and temperature, (iii) nature of the solute used also plays an important role, (iv) it does not indicate the state of the water present and how it is bound to the substrate (Chirife, 1994; Hardman, 1986; Rahman & Labuza, 1999; Scott, 1953). Glass transition concept was put forwarded considering the limitations of water activity. Glassy materials have been known for centuries but it is only in the last 70 years or so that scientific understanding of these systems has evolved (Ferry, 1991). A glassy material is hard and fragile. Angell (1988) described a glass as any liquid or super-cooled liquid whose viscosity is between 10 12 and 10 13 Pa s thus effectively behaving like a solid, which is able to support its own weight against flow due to gravity. To put this viscosity into context, a supercooled liquid with a viscosity of 10 14 Pa s would flow 10 K14 m/s in the glassy state compared to the flow rate of a typical liquid is in the order of 10 m/s. In other words, a glass is a liquid that flows about 30 mm in a century (Buitink & Leprince, 0924-2244/$ - see front matter q 2005 Elsevier Ltd. All rights reserved. doi:10.1016/j.tifs.2005.09.009 Trends in Food Science & Technology 17 (2006) 129–141 Viewpoint

Welcome message from author
This document is posted to help you gain knowledge. Please leave a comment to let me know what you think about it! Share it to your friends and learn new things together.
Transcript
State diagram
of foods: Its potential
use in food
processing and
product stability
Mohammad Shafiur Rahman*&
Department of Food Science and Nutrition,
College of Agricultural and Marine Sciences,
Sultan Qaboos University, P.O. Box-34,
Al-Khod, PC 123, Sultanate of Oman
(Tel.: C968 24415 236; fax: C968 24413 418;
e-mail: [email protected])
State diagram is a map of the different states of a food as a
function of water or solids content and temperature. The
main advantage of drawing map is in identifying different
states of a food, such as freezing point and glass transition,
which helps in understanding the complex changes when
food’s water content and temperature are changed. It also
assists in identifying food’s stability during storage as well as
selecting suitable conditions of temperature and moisture
content for processing. This paper provides an overview and
critical assessment on the basic concepts of the state
diagram with their terminologies, selected measurement
techniques, and their use. Glass transition alone could not
be considered as generic rules for food stability criteria since
numbers of instances, such as pore formation, diffusion,
microbial stability, non-enzymatic browning, other factors
or mechanisms play important role. However, it is definitely
one of the factors affecting the stability, and a future
challenge to combine the glass concept with other
mechanisms or factors.
IntroductionIn the literature new concepts and hypotheses are being
developed and proposed in the areas of food properties in
order to bring food science from empiricism to the strong
0924-2244/$ - see front matter q 2005 Elsevier Ltd. All rights reserved.doi:10.1016/j.tifs.2005.09.009
scientific foundation (Rahman, 2005). In the middle of
the 20th century scientists began to discover the existence of
a relationship between the water contained in a food and its
relative tendency to spoil (Scott, 1953). In 1980s Labuza
and his group generated significant data on food stability as
a function of water activity. They also began to realize that
the active water could be much more important to the
stability of a food than total amount of water present. Thus,
it is possible to develop generalized rules or limits for the
stability of foods using water activity. For example, there is
a critical water activity below no microorganisms can grow
is about 0.6 values of water activity. A food product is most
stable at its monolayer moisture content, which vary with
the chemical composition and structure. This was the main
reason why food scientists started to emphasis water activity
rather than total water content. Since then, the scientific
community has explored the great significance of water
activity in determining the physical characteristics, pro-
cesses, shelf life, and sensory properties of foods. It is now
used to predict the end point of drying, process design and
control, ingredient selection, product stability and packa-
ging selection.
Recently, the limitations of water activity are pointed and
alternatives are proposed. These limitations are: (i) water
activity is defined at equilibrium, whereas foods may not be
in a state of equilibrium, (ii) the critical limits of water
activity may also be shifted to higher or lower levels by
other factors, such as pH, salt, anti-microbial agents, heat
treatment, and temperature, (iii) nature of the solute used
also plays an important role, (iv) it does not indicate the
state of the water present and how it is bound to the substrate
(Chirife, 1994; Hardman, 1986; Rahman & Labuza, 1999;
Scott, 1953). Glass transition concept was put forwarded
considering the limitations of water activity.
Glassy materials have been known for centuries but it is
only in the last 70 years or so that scientific understanding of
these systems has evolved (Ferry, 1991). A glassy material
is hard and fragile. Angell (1988) described a glass as any
liquid or super-cooled liquid whose viscosity is between
1012 and 1013 Pa s thus effectively behaving like a solid,
which is able to support its own weight against flow due to
gravity. To put this viscosity into context, a supercooled
liquid with a viscosity of 1014 Pa s would flow 10K14 m/s in
the glassy state compared to the flow rate of a typical liquid
is in the order of 10 m/s. In other words, a glass is a liquid
that flows about 30 mm in a century (Buitink & Leprince,
Trends in Food Science & Technology 17 (2006) 129–141
Viewpoint
atur
e
ACrystalCollapseStickinessSolution
Liquid
Tms
L
Solid
DMTbw
Water vapor
P
Viewpoint / Trends in Food Science & Technology 17 (2006) 129–141130
2004). This is evidenced by the fact that ancient stained
glass windows are thicker at their base due to flow under
gravity (Kasapis, 2005).
The early papers of the glass transition in food and
biological systems appeared in the literature in the 1960s
(Luyet & Rasmussen, 1968; Rey, 1958; White & Cake-
bread, 1966). Perhaps, White and Cakebread (1966) was the
first, who highlighted the importance of the glassy state of
foods in determining its stability. The significant appli-
cations of the glass transition concept in the 1980s are
emerged in food processing when Levine and Slade (1986);
Slade and Levine (1988) identified its merits in huge variety.
In 1990s Roos, Karel, and other groups generated significant
data on the glass transition and components of state diagram
for numbers of food components. The hypothesis has
recently been stated that this transition greatly influences
food stability, as the water in the concentrated phase
becomes kinetically immobilized and therefore does not
support or participate in reactions (Rahman, 1999; Slade &
Levine, 1991a).
The rules of glass-transition concept are: (i) the food
is most stable at and below its glass transition, and (ii)
higher the TKTg (i.e above glass transition), higher the
deterioration or reaction rates. Similarly, mechanical and
transport properties could also be related with glass
transition. It is very interesting to see that this concept
has been so widely tested in foods. In many instances
glass transition concept does not work alone, thus it is
now being recommended to use both the water activity
and glass transition concepts in assessing process-ability,
deterioration, food stability, and shelf-life predictions
(Roos, 1995a,b). Recently the concept of state diagram
based on glass transition and freezing curve is proposed.
Food industry is currently using water activity concept in
determining food stability. The scientific evidence
showed that glass transition concept could be added to
their existing criterion on water activity. This should give
better confidence to the food industry in determining the
food stability. Food industry could locate their products
in the state diagram as a function of solids content and
temperature. Based on the location they could determine
the stability of their product. The objective of this work
is to explore in depth concepts of state diagram and glass
transition.
Solute Mass Fraction
Tem
per
F
E
G
Xs′
B
Glass
Ice+Solution+Solute
Ice+Glass+Solute
RubberSoftening zoneReaction zoneEntangle flow
Tgs
Tgw
Tg′
Tm′C
Ice+Rubber+Solute
HTu
I
J
Ice+Solution N
O
BE
T-M
onol
ayer
QIce+Glass+Solute
RS
0 1
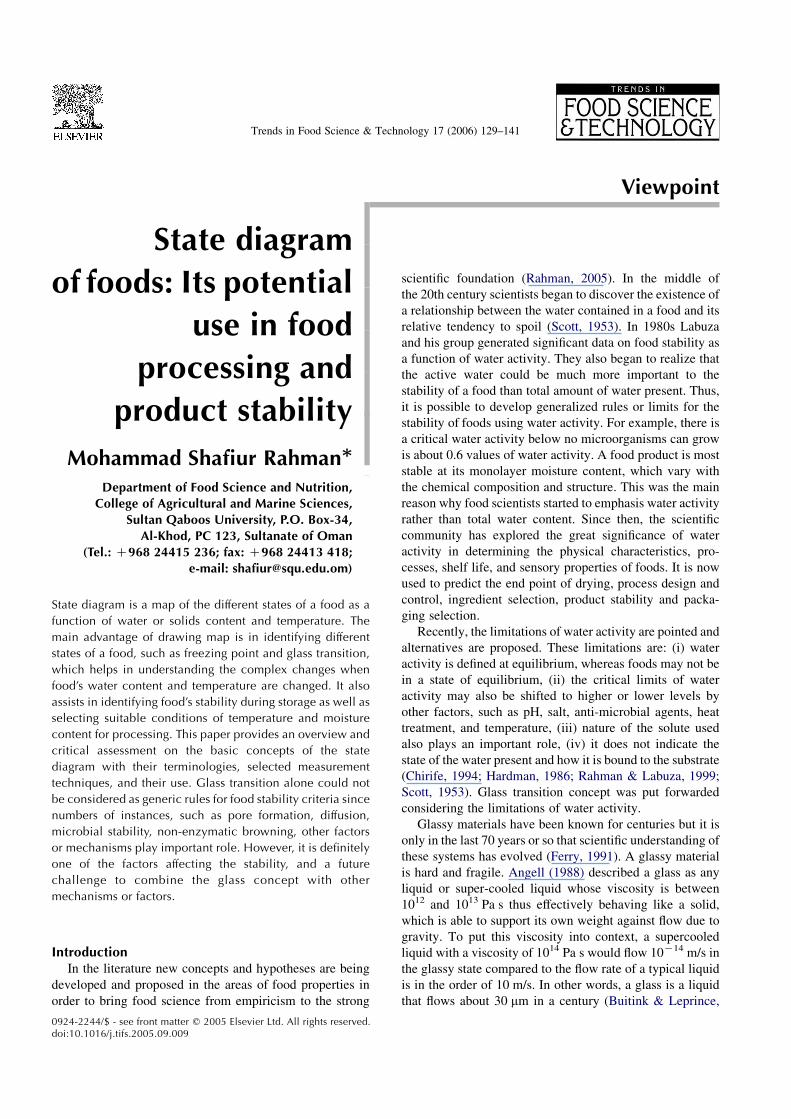
Fig. 1. State diagram showing different regions and state of foods(Tbw, boiling point; Tu, eutectic point; Tm
0, end point of freezing; Tg0,
glass transition at end point of freezing; Tgw, glass transition of water;Tms, melting point of dry solids; Tgs, glass transition of dry solids.
Glass transition and glassy stateGlass transition is a nature of second-order time-
temperature dependent transition, which is characterized
by a discontinuity in physical, mechanical, electrical,
thermal, and other properties of a material (Rahman,
1995). The process is considered to be second order
thermodynamic transition in which the material undergoes
a change in state but not in phase. It is more meaningful to
define as the nature second-order change in the properties
since each measurement technique is based on monitoring
change in a specific property, and since change or break in
properties are achieved within a certain temperature range
rather than a specific temperature. A perfect second-order
transition occurs at a specific temperature (Allen, 1993;
Kasapis, 2005).
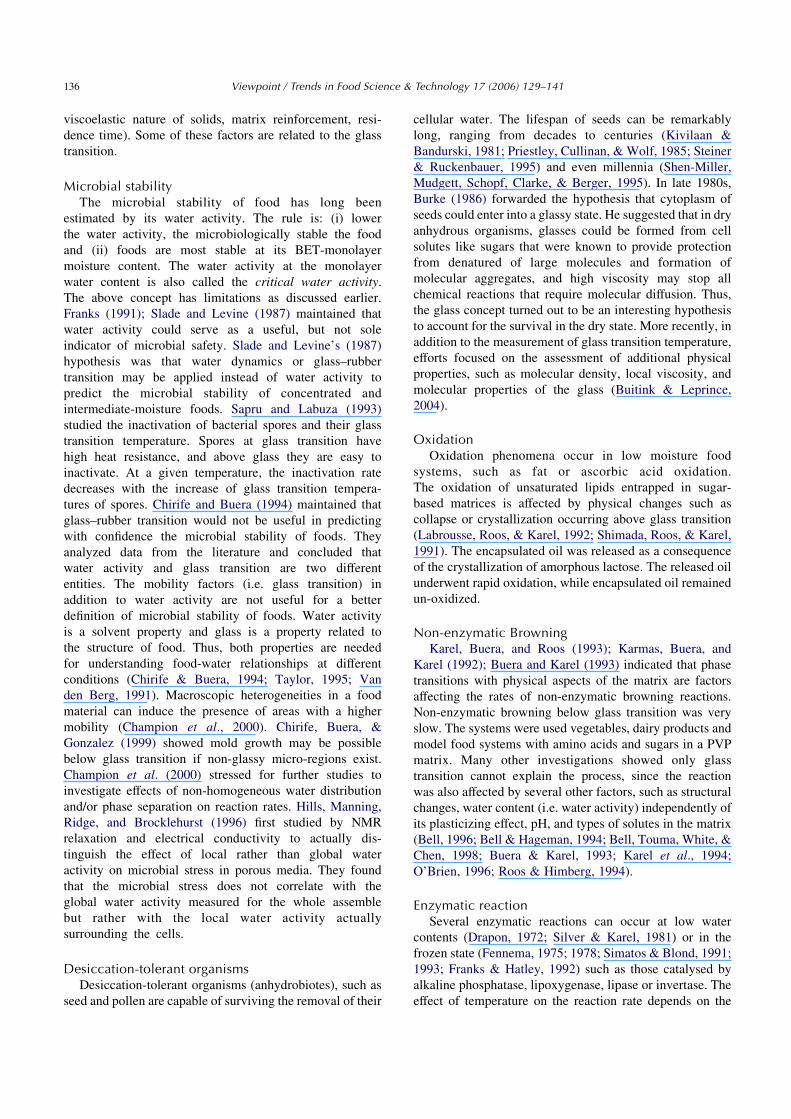
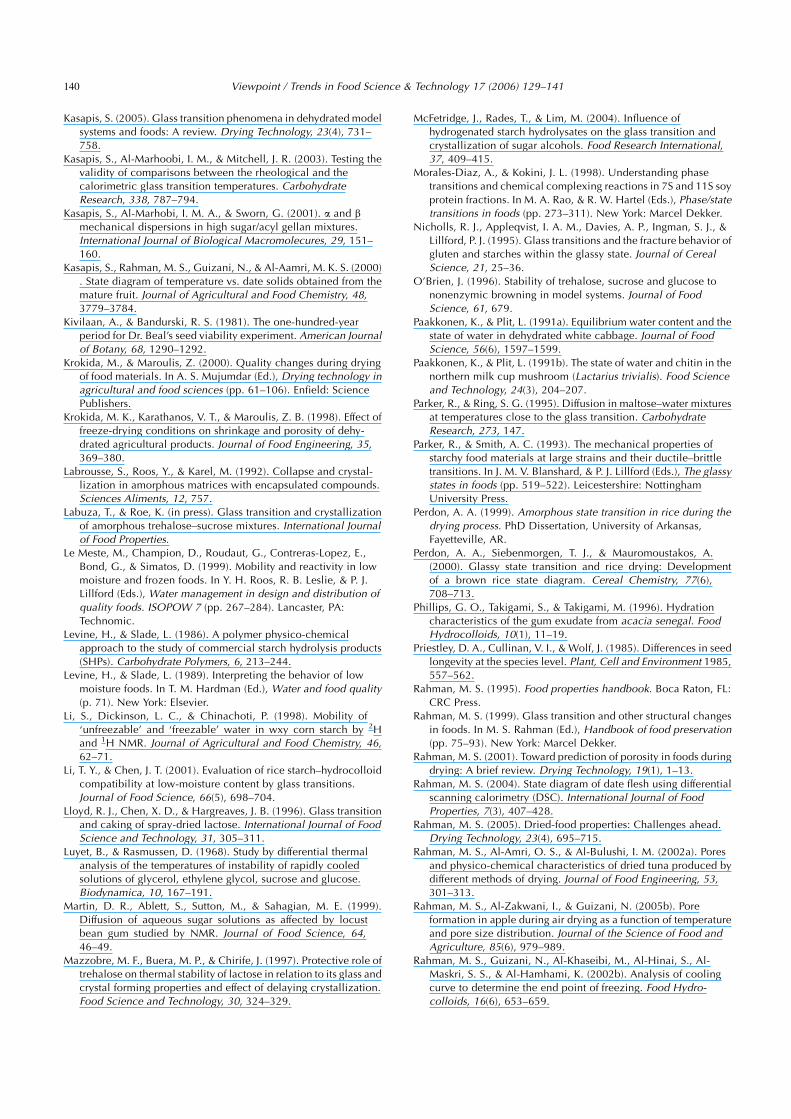
State diagram and its componentsState diagram
State diagram is the map of different states of a food as a
function of water or solids content and temperature
(Rahman, 2004). The main advantages of drawing a map
are to help in understanding the complex changes when
food’s water content and temperature are changed. It also
assists in identifying food’s stability during storage as well
as selecting a suitable condition of temperature and
moisture content for processing. Fig. 1 shows state diagram
indicating different states as a function of temperature and
solids mass fraction.
Components of state diagramEarlier state diagram was constructed with only freezing
curve and glass transition line. Recently, attempts are being
made to add other structural changes with glass line,
freezing curve, and solubility line in the state diagram.
Numbers of micro-regions and new terminologies are being
included in constructing the state diagram. The presented
state diagram shown in Fig. 1 is updated from Rahman
(2004). In Fig. 1 the freezing line (ABC) and solubility line
(BD) are shown in relation to the glass transition line (EFS).
The point F (Xs0 and Tg
0) lower than Tm0 (point C) is a
characteristic transition (maximal-freeze-concentration
condition) in the state diagram defined as the intersection
of the vertical line from Tm0 to the glass line EFS. The water
content at point F or C is considered as the un-freezeable
Viewpoint / Trends in Food Science & Technology 17 (2006) 129–141 131
water (1KXs0). Un-freezable water mass fraction is the
amount of water remaining unfrozen even at very low
temperature. It includes both un-crystallized free water and
bound water attached to the solids matrix. The point Q is
defined as Tg00 and Xs
00 as the intersection of the freezing
curve to the glass line by maintaining the similar curvature.
Point R is defined as Tg000 as the glass transition of the solids
matrix in the frozen sample, which is determined by DSC.
This is due to the formation of same solid matrix associated
un-freezable water and transformation of all free water into
ice although the sample contains different level of total
water before the start of DSC scanning (Rahman, Sablani,
Al-Habsi, Al-Maskri, & Al-Belushi, 2005a).
Different zones or regions are marked in the state
diagram showing different characteristics. The line BDL
is the melting line which is important when products
goes high temperature during processing, such as frying,
baking, roasting, extrusion cooking. In case of multi-
component mixture such as food a clear melting is
difficult to observe at high temperature due the reactions
between components. In this case Rahman (2004) defined
it as decomposition temperature. Line MDP is the boiling
line for water evaporation from the liquid (line MD) and
solid phases (line DP). This line does not intersect the
y-axis at the right. The line LNO is drawn from the BET
monolayer stability as a function of temperature, which
are discussed later. The region of drying and freezing
process can be easily visualized in the diagram, and
product stability could be assessed based on moisture
content and temperature.
State of water in foodsDifferent states of water, such as bound, free, capillary,
mobile, non-solvent, and un-freezable water are defined in
the literature (Rahman, 1995). The state of water can be
measured with different techniques or methods. The water
sorption isotherm is based on the three types of water:
monolayer, multiplayer and mobile or free water (Rockland,
1969). The BET-monolayer is estimated from water sorption
isotherm and commonly presented in the literature. It could
be mentioned that only BET-monolayer has strong theo-
retical basis and should be used in stability determination
(Rahman, 2005; Rahman & Labuza, 1999). Un-freezable
water content can be estimated comparing DSC endotherms
of samples having freezable water from the plot of meting
enthalpy as a function of water content (Roos, 1987). This
procedure was used for model crackers (Given, 1991),
strawberry (Roos, 1987), dates (Rahman, 2004), sucrose
(Ablett, Clark, Izzard, & Lillford, 1992; Ablett, Izzard, &
Lillford, 1992), cabbage (Paakkonen & Plit (1991a)) and
garlic (Rahman et al., 2005a). From state diagram shown in
Fig. 1, un-freezable water can be estimated from point C and
F. Comparison of determining un-freezable water using
different methods was presented for dates (Rahman, 2004)
and garlic (Rahman et al., 2005a). It is always found that
BET-monolayer values are much lower that the un-freezable
water (Duckworth & Smith, 1963).
It is important to explore more in depth information
on the characteristics, such as mobility, and factors
affecting its nature below and above glassy state in order
to apply the glassy concept. It was found that water
remained high in mobility below glassy state (Bell et al.,
2002; Li, Dickinson, & Chinachoti, 1998). Thus glassy
state could not be appropriate term to imply or to predict
the molecular dynamics of water and its influence on
food stability. Other characteristics were measured by
Hatakeyama, Quinn, and Hatakeyama, 1996 and Paakko-
nen and Plit, 1991b. Techniques used to determine the
state of water are: dielectric spectroscopy, Fourier
transformation infrared spectroscopy (FTIR), X-ray
scattering, nuclear magnetic resonance (NMR), magnetic
resonance imaging (MRI), electrical resistance and self-
diffusion methods. Although many techniques are being
used to determine the mobility and state of water and
solutes available for chemical reactions, but their
interpretation is far from straightforward (Hardman,
1986).
Measurement methodsMost of the transitions defined in the state diagram are
commonly measured by DSC method using appropriate
protocol. The thermo-mechanical analysis (TMA) and
oscillation methods are less commonly used, however
these methods are more sensitive. In this paper mainly
these two methods are discussed in the following
sections.
Differential scanning calorimetry (DSC)The glass transition temperature is difficult to
determine in real food systems due to their complexity
and/or heterogeneity (Champion, Le Meste, & Simatos,
2000). DSC detects the change in heat capacity occurring
over glass transition temperature range. In 1990s
modulated DSC (MDSC) was commercialized in order
to increase the sensitivity and resolution of thermal
analysis, provide the heat capacity and heat flow in a
single experiment (Kasapis, 2005; Verdonck, Schaap, &
Thomas, 1999). It is common to use mainly heating DSC
curve to study the characteristic transitions, and usually
heating rate at 5 8C/min are used. However, heating rate
affects the values of glass transition. The experimental
conditions, such as cooling rate, sample size, and
annealing conditions used should be always reported
with glass transition values. Calorimetric or spectroscopic
techniques have some limitations in terms of sample size
and shape, and water content control. In some cases, for
example in case of starch it is less sensitive.
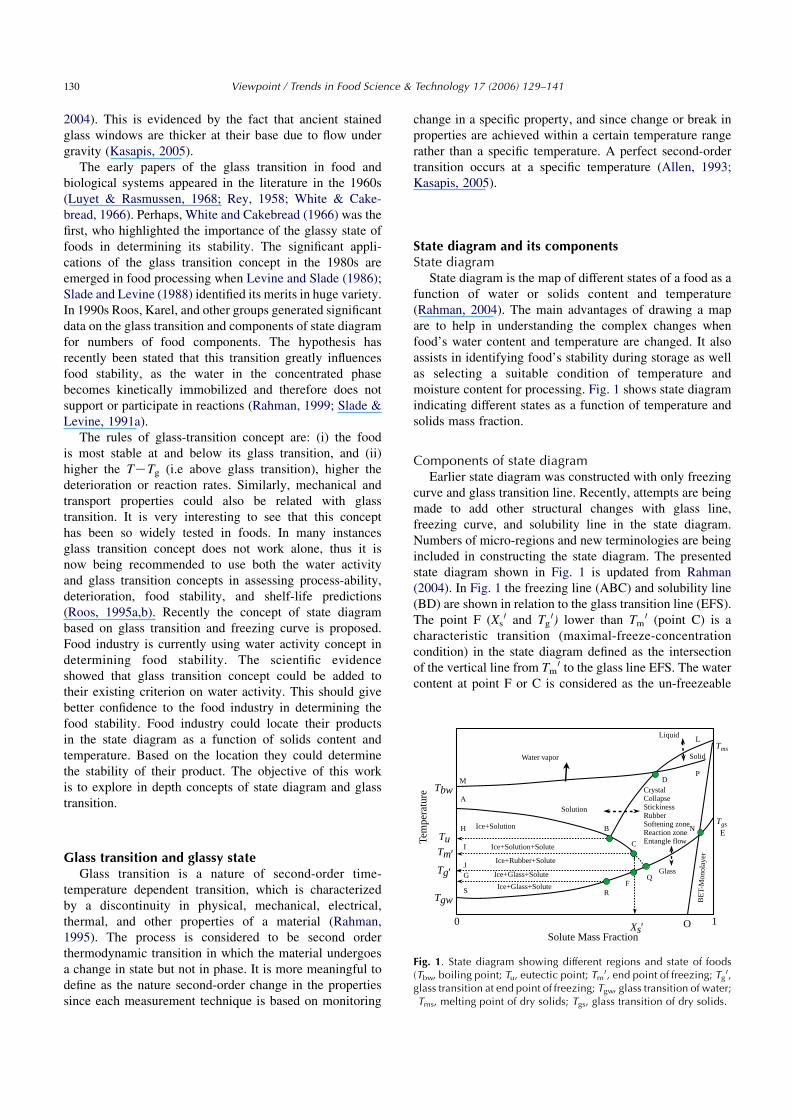
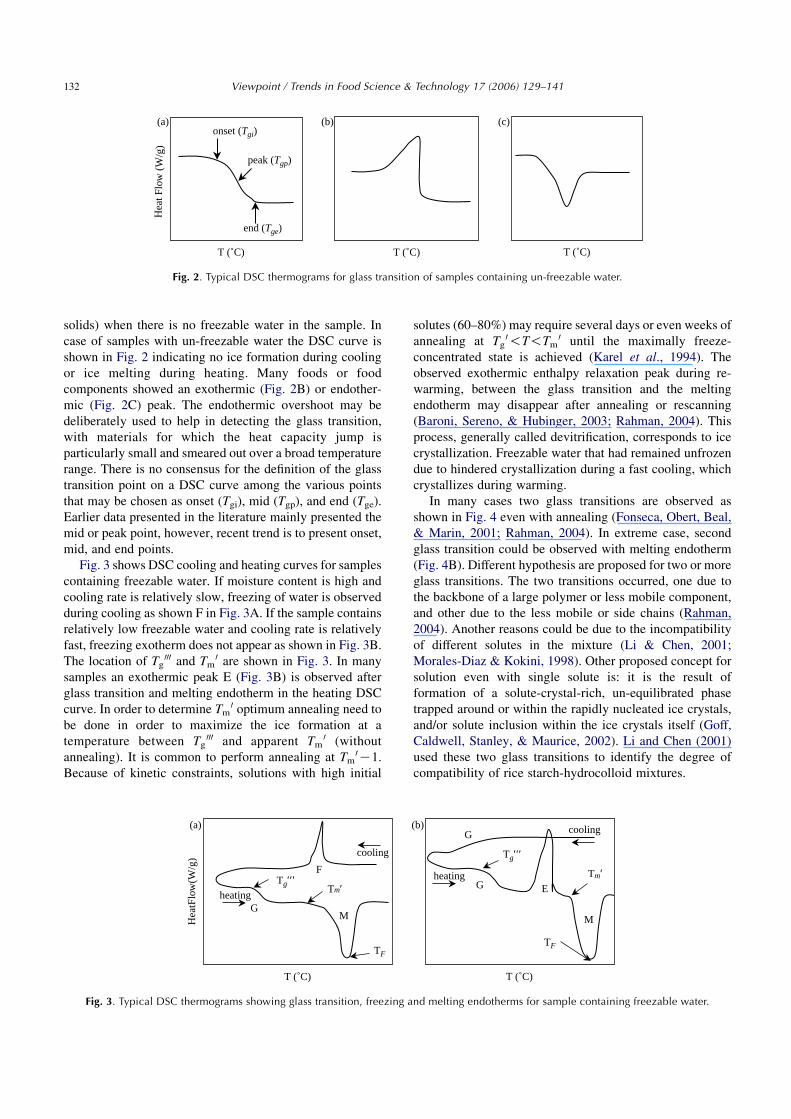
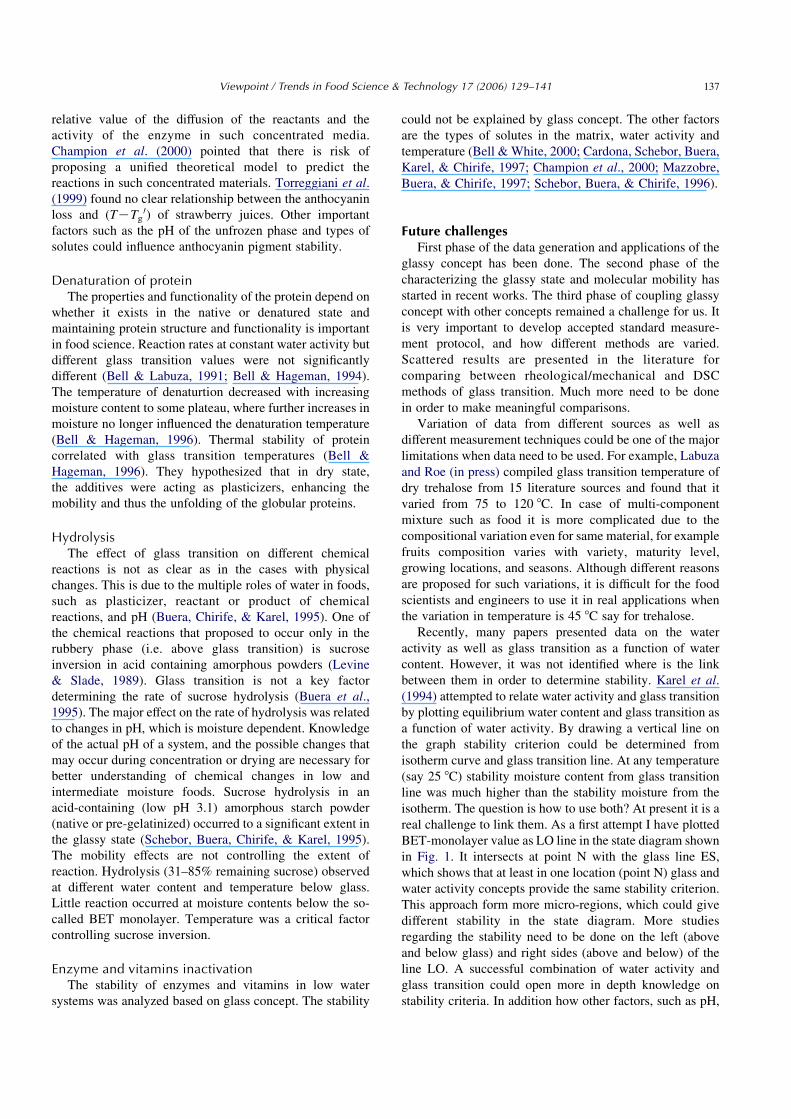
The typical DSC curves shown in Figs. 2–4 are based on
the level of moisture contents and types of the samples.
Fig. 2 shows DSC graphs for low moisture content (i.e. high
T (˚C)
(b)
T (˚C)
(c)
Hea
t Flo
w (
W/g
)
T (˚C)
(a)onset (Tgi)
end (Tge)
peak (Tgp)
Fig. 2. Typical DSC thermograms for glass transition of samples containing un-freezable water.
Viewpoint / Trends in Food Science & Technology 17 (2006) 129–141132
solids) when there is no freezable water in the sample. In
case of samples with un-freezable water the DSC curve is
shown in Fig. 2 indicating no ice formation during cooling
or ice melting during heating. Many foods or food
components showed an exothermic (Fig. 2B) or endother-
mic (Fig. 2C) peak. The endothermic overshoot may be
deliberately used to help in detecting the glass transition,
with materials for which the heat capacity jump is
particularly small and smeared out over a broad temperature
range. There is no consensus for the definition of the glass
transition point on a DSC curve among the various points
that may be chosen as onset (Tgi), mid (Tgp), and end (Tge).
Earlier data presented in the literature mainly presented the
mid or peak point, however, recent trend is to present onset,
mid, and end points.
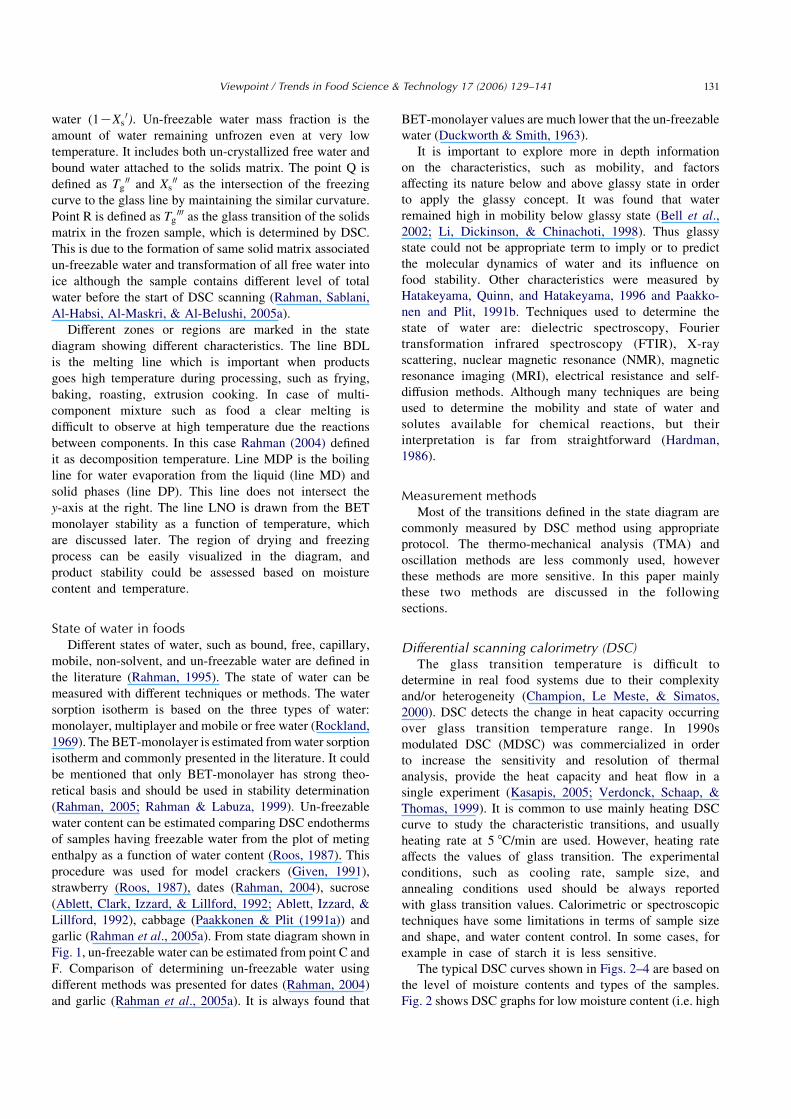
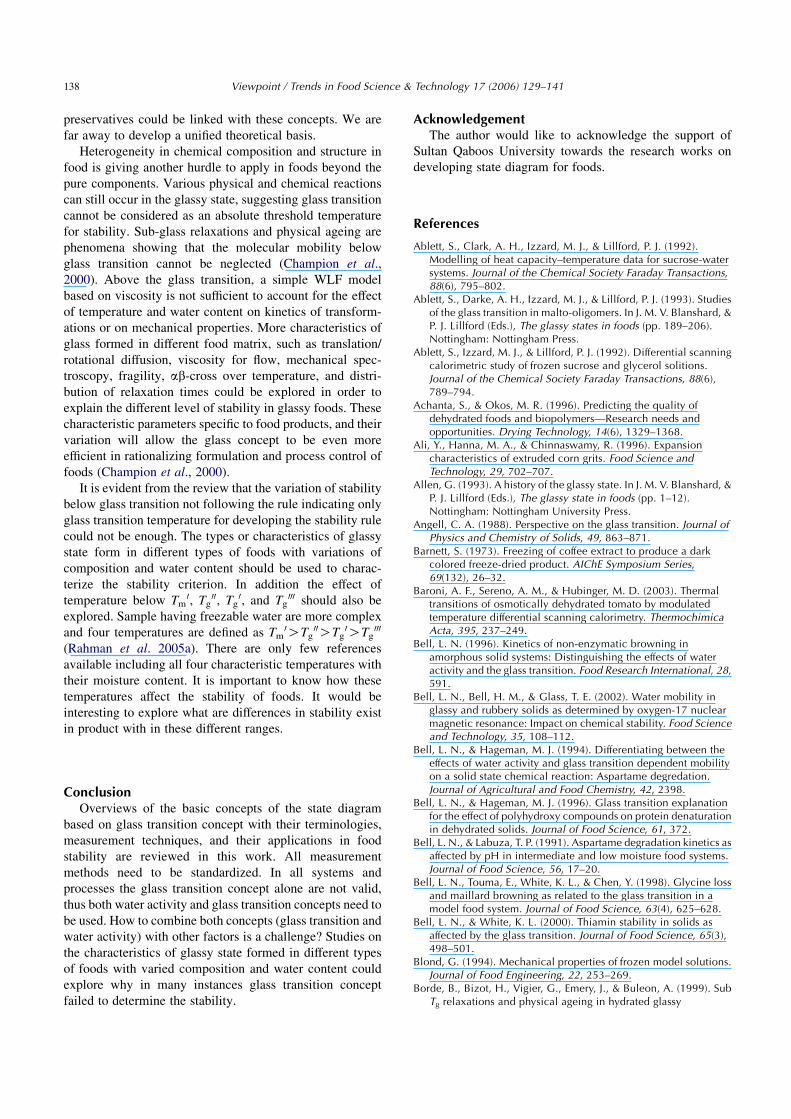
Fig. 3 shows DSC cooling and heating curves for samples
containing freezable water. If moisture content is high and
cooling rate is relatively slow, freezing of water is observed
during cooling as shown F in Fig. 3A. If the sample contains
relatively low freezable water and cooling rate is relatively
fast, freezing exotherm does not appear as shown in Fig. 3B.
The location of Tg000 and Tm
0 are shown in Fig. 3. In many
samples an exothermic peak E (Fig. 3B) is observed after
glass transition and melting endotherm in the heating DSC
curve. In order to determine Tm0 optimum annealing need to
be done in order to maximize the ice formation at a
temperature between Tg000 and apparent Tm
0 (without
annealing). It is common to perform annealing at Tm0K1.
Because of kinetic constraints, solutions with high initial
T (˚C)
F
GM
cooling
heating
Tg′′′Tm′
TF
Hea
tFlo
w(W
/g)
(a)
Fig. 3. Typical DSC thermograms showing glass transition, freezing a
solutes (60–80%) may require several days or even weeks of
annealing at Tg0!T!Tm
0 until the maximally freeze-
concentrated state is achieved (Karel et al., 1994). The
observed exothermic enthalpy relaxation peak during re-
warming, between the glass transition and the melting
endotherm may disappear after annealing or rescanning
(Baroni, Sereno, & Hubinger, 2003; Rahman, 2004). This
process, generally called devitrification, corresponds to ice
crystallization. Freezable water that had remained unfrozen
due to hindered crystallization during a fast cooling, which
crystallizes during warming.
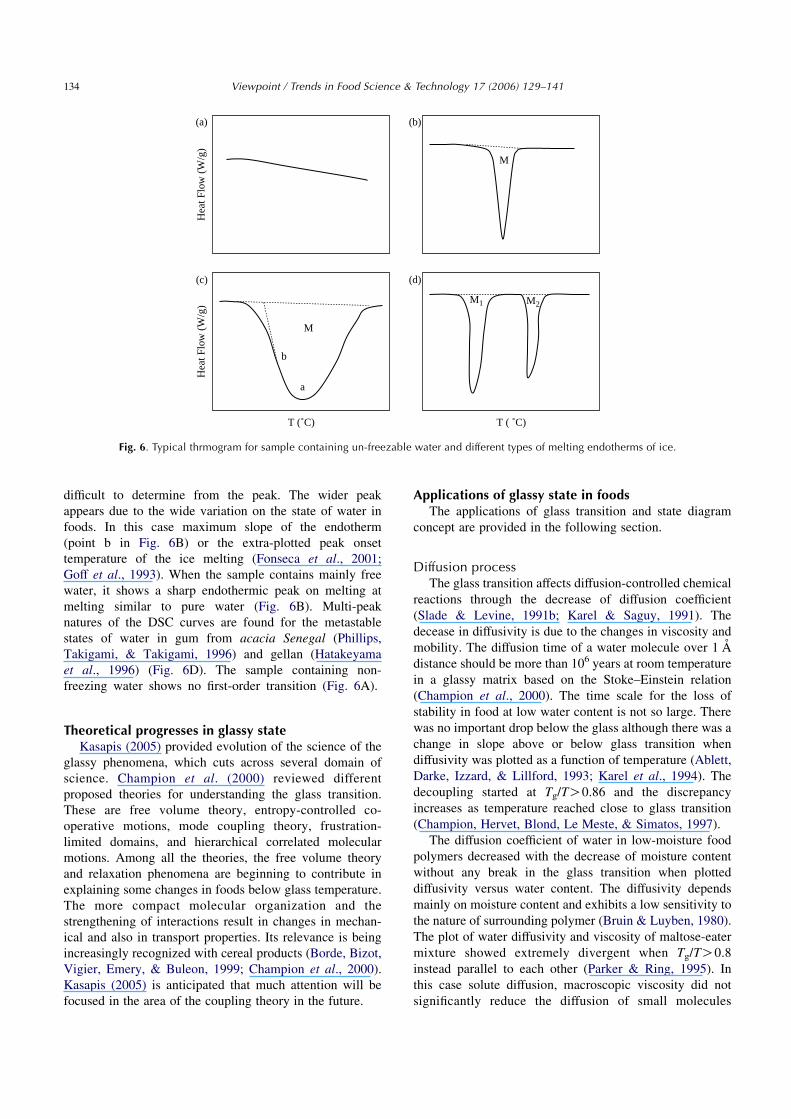
In many cases two glass transitions are observed as
shown in Fig. 4 even with annealing (Fonseca, Obert, Beal,
& Marin, 2001; Rahman, 2004). In extreme case, second
glass transition could be observed with melting endotherm
(Fig. 4B). Different hypothesis are proposed for two or more
glass transitions. The two transitions occurred, one due to
the backbone of a large polymer or less mobile component,
and other due to the less mobile or side chains (Rahman,
2004). Another reasons could be due to the incompatibility
of different solutes in the mixture (Li & Chen, 2001;
Morales-Diaz & Kokini, 1998). Other proposed concept for
solution even with single solute is: it is the result of
formation of a solute-crystal-rich, un-equilibrated phase
trapped around or within the rapidly nucleated ice crystals,
and/or solute inclusion within the ice crystals itself (Goff,
Caldwell, Stanley, & Maurice, 2002). Li and Chen (2001)
used these two glass transitions to identify the degree of
compatibility of rice starch-hydrocolloid mixtures.
T (˚C)
E
G
G
M
cooling
heating
Tg′′′
Tm′
TF
(b)
nd melting endotherms for sample containing freezable water.
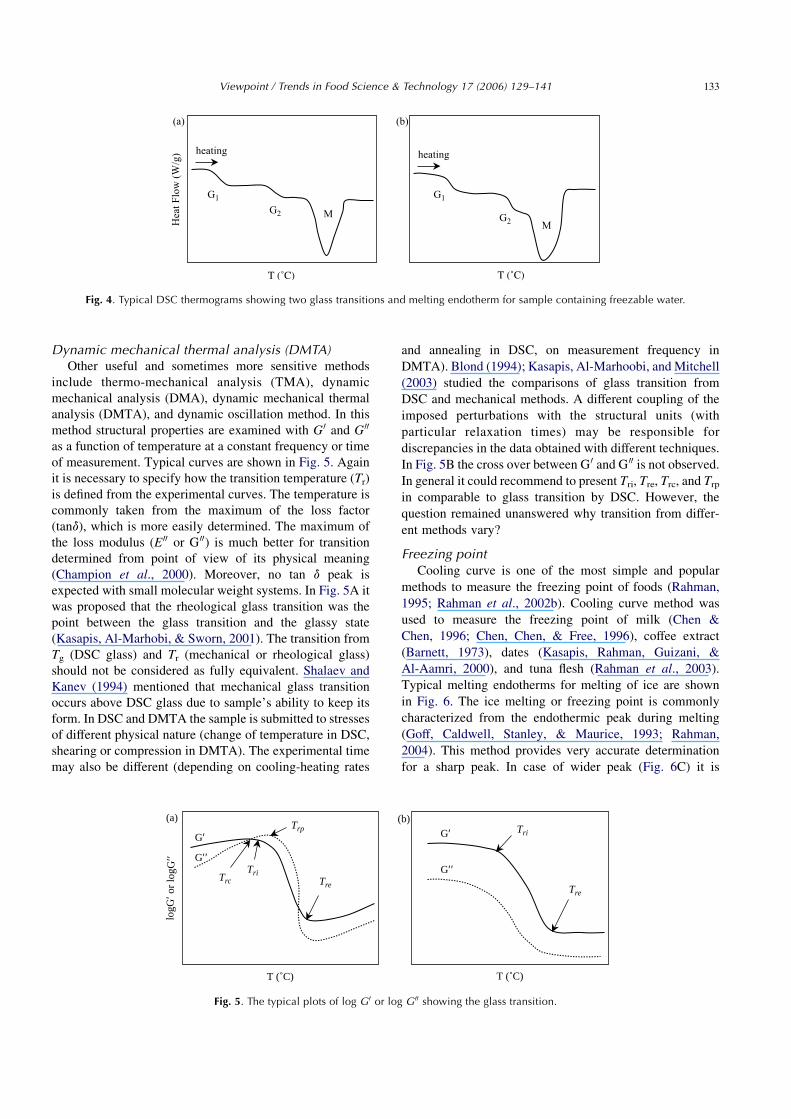
Fig. 4. Typical DSC thermograms showing two glass transitions and melting endotherm for sample containing freezable water.
Viewpoint / Trends in Food Science & Technology 17 (2006) 129–141 133
Dynamic mechanical thermal analysis (DMTA)Other useful and sometimes more sensitive methods
include thermo-mechanical analysis (TMA), dynamic
mechanical analysis (DMA), dynamic mechanical thermal
analysis (DMTA), and dynamic oscillation method. In this
method structural properties are examined with G 0 and G 00
as a function of temperature at a constant frequency or time
of measurement. Typical curves are shown in Fig. 5. Again
it is necessary to specify how the transition temperature (Tr)
is defined from the experimental curves. The temperature is
commonly taken from the maximum of the loss factor
(tand), which is more easily determined. The maximum of
the loss modulus (E 00 or G 00) is much better for transition
determined from point of view of its physical meaning
(Champion et al., 2000). Moreover, no tan d peak is
expected with small molecular weight systems. In Fig. 5A it
was proposed that the rheological glass transition was the
point between the glass transition and the glassy state
(Kasapis, Al-Marhobi, & Sworn, 2001). The transition from
Tg (DSC glass) and Tr (mechanical or rheological glass)
should not be considered as fully equivalent. Shalaev and
Kanev (1994) mentioned that mechanical glass transition
occurs above DSC glass due to sample’s ability to keep its
form. In DSC and DMTA the sample is submitted to stresses
of different physical nature (change of temperature in DSC,
shearing or compression in DMTA). The experimental time
may also be different (depending on cooling-heating rates
logG
′ or
logG
′′
T (˚C)
Tri
G′
Tre
G′′
Trc
Trp(a) (
Fig. 5. The typical plots of log G 0 or log
and annealing in DSC, on measurement frequency in
DMTA). Blond (1994); Kasapis, Al-Marhoobi, and Mitchell
(2003) studied the comparisons of glass transition from
DSC and mechanical methods. A different coupling of the
imposed perturbations with the structural units (with
particular relaxation times) may be responsible for
discrepancies in the data obtained with different techniques.
In Fig. 5B the cross over between G 0 and G 00 is not observed.
In general it could recommend to present Tri, Tre, Trc, and Trp
in comparable to glass transition by DSC. However, the
question remained unanswered why transition from differ-
ent methods vary?
Freezing pointCooling curve is one of the most simple and popular
methods to measure the freezing point of foods (Rahman,
1995; Rahman et al., 2002b). Cooling curve method was
used to measure the freezing point of milk (Chen &
Chen, 1996; Chen, Chen, & Free, 1996), coffee extract
(Barnett, 1973), dates (Kasapis, Rahman, Guizani, &
Al-Aamri, 2000), and tuna flesh (Rahman et al., 2003).
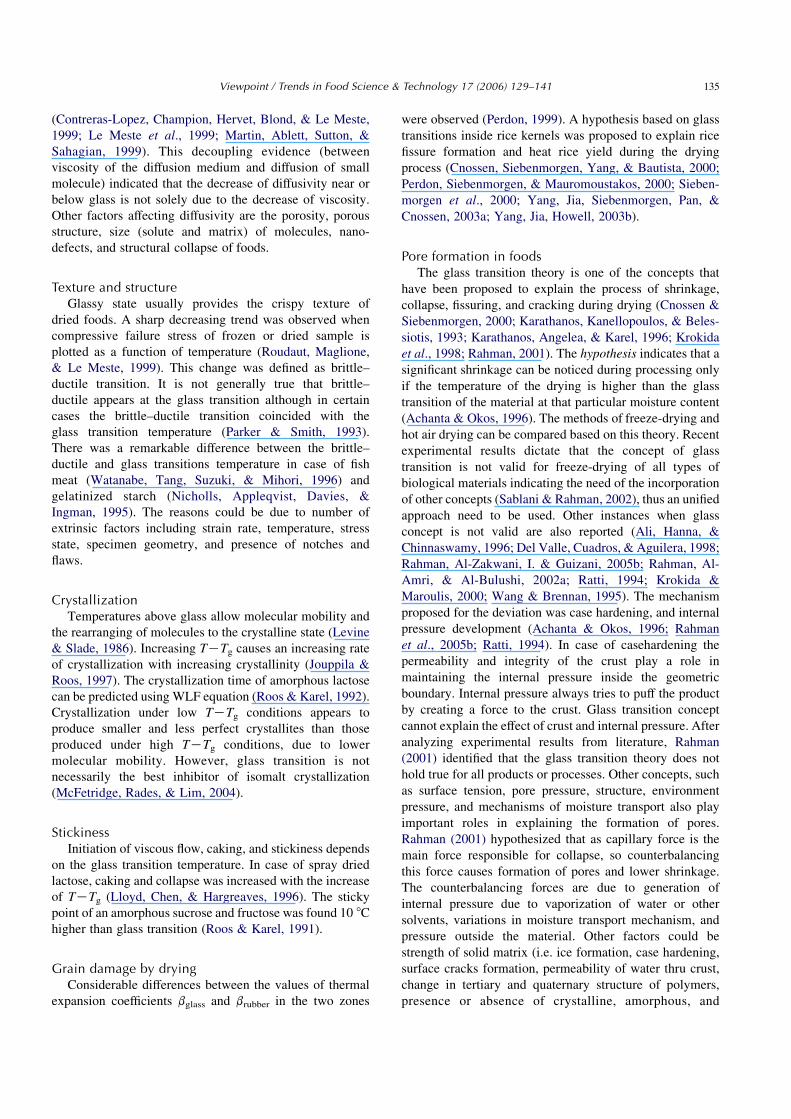
Typical melting endotherms for melting of ice are shown
in Fig. 6. The ice melting or freezing point is commonly
characterized from the endothermic peak during melting
(Goff, Caldwell, Stanley, & Maurice, 1993; Rahman,
2004). This method provides very accurate determination
for a sharp peak. In case of wider peak (Fig. 6C) it is
T (˚C)
Tri
Tre
G′
G′′
b)
G 00 showing the glass transition.
Hea
t Flo
w (
W/g
)
(a)
M
(b)
Hea
t Flo
w (
W/g
)
T (˚C)
M
a
b
(c)
T ( ˚C)
M1 M2
(d)
Fig. 6. Typical thrmogram for sample containing un-freezable water and different types of melting endotherms of ice.
Viewpoint / Trends in Food Science & Technology 17 (2006) 129–141134
difficult to determine from the peak. The wider peak
appears due to the wide variation on the state of water in
foods. In this case maximum slope of the endotherm
(point b in Fig. 6B) or the extra-plotted peak onset
temperature of the ice melting (Fonseca et al., 2001;
Goff et al., 1993). When the sample contains mainly free
water, it shows a sharp endothermic peak on melting at
melting similar to pure water (Fig. 6B). Multi-peak
natures of the DSC curves are found for the metastable
states of water in gum from acacia Senegal (Phillips,
Takigami, & Takigami, 1996) and gellan (Hatakeyama
et al., 1996) (Fig. 6D). The sample containing non-
freezing water shows no first-order transition (Fig. 6A).
Theoretical progresses in glassy stateKasapis (2005) provided evolution of the science of the
glassy phenomena, which cuts across several domain of
science. Champion et al. (2000) reviewed different
proposed theories for understanding the glass transition.
These are free volume theory, entropy-controlled co-
operative motions, mode coupling theory, frustration-
limited domains, and hierarchical correlated molecular
motions. Among all the theories, the free volume theory
and relaxation phenomena are beginning to contribute in
explaining some changes in foods below glass temperature.
The more compact molecular organization and the
strengthening of interactions result in changes in mechan-
ical and also in transport properties. Its relevance is being
increasingly recognized with cereal products (Borde, Bizot,
Vigier, Emery, & Buleon, 1999; Champion et al., 2000).
Kasapis (2005) is anticipated that much attention will be
focused in the area of the coupling theory in the future.
Applications of glassy state in foodsThe applications of glass transition and state diagram
concept are provided in the following section.
Diffusion processThe glass transition affects diffusion-controlled chemical
reactions through the decrease of diffusion coefficient
(Slade & Levine, 1991b; Karel & Saguy, 1991). The
decease in diffusivity is due to the changes in viscosity and
mobility. The diffusion time of a water molecule over 1 A
distance should be more than 106 years at room temperature
in a glassy matrix based on the Stoke–Einstein relation
(Champion et al., 2000). The time scale for the loss of
stability in food at low water content is not so large. There
was no important drop below the glass although there was a
change in slope above or below glass transition when
diffusivity was plotted as a function of temperature (Ablett,
Darke, Izzard, & Lillford, 1993; Karel et al., 1994). The
decoupling started at Tg/TO0.86 and the discrepancy
increases as temperature reached close to glass transition
(Champion, Hervet, Blond, Le Meste, & Simatos, 1997).
The diffusion coefficient of water in low-moisture food
polymers decreased with the decrease of moisture content
without any break in the glass transition when plotted
diffusivity versus water content. The diffusivity depends
mainly on moisture content and exhibits a low sensitivity to
the nature of surrounding polymer (Bruin & Luyben, 1980).
The plot of water diffusivity and viscosity of maltose-eater
mixture showed extremely divergent when Tg/TO0.8
instead parallel to each other (Parker & Ring, 1995). In
this case solute diffusion, macroscopic viscosity did not
significantly reduce the diffusion of small molecules
Viewpoint / Trends in Food Science & Technology 17 (2006) 129–141 135
(Contreras-Lopez, Champion, Hervet, Blond, & Le Meste,
1999; Le Meste et al., 1999; Martin, Ablett, Sutton, &
Sahagian, 1999). This decoupling evidence (between
viscosity of the diffusion medium and diffusion of small
molecule) indicated that the decrease of diffusivity near or
below glass is not solely due to the decrease of viscosity.
Other factors affecting diffusivity are the porosity, porous
structure, size (solute and matrix) of molecules, nano-
defects, and structural collapse of foods.
Texture and structureGlassy state usually provides the crispy texture of
dried foods. A sharp decreasing trend was observed when
compressive failure stress of frozen or dried sample is
plotted as a function of temperature (Roudaut, Maglione,
& Le Meste, 1999). This change was defined as brittle–
ductile transition. It is not generally true that brittle–
ductile appears at the glass transition although in certain
cases the brittle–ductile transition coincided with the
glass transition temperature (Parker & Smith, 1993).
There was a remarkable difference between the brittle–
ductile and glass transitions temperature in case of fish
meat (Watanabe, Tang, Suzuki, & Mihori, 1996) and
gelatinized starch (Nicholls, Appleqvist, Davies, &
Ingman, 1995). The reasons could be due to number of
extrinsic factors including strain rate, temperature, stress
state, specimen geometry, and presence of notches and
flaws.
CrystallizationTemperatures above glass allow molecular mobility and
the rearranging of molecules to the crystalline state (Levine
& Slade, 1986). Increasing TKTg causes an increasing rate
of crystallization with increasing crystallinity (Jouppila &
Roos, 1997). The crystallization time of amorphous lactose
can be predicted using WLF equation (Roos & Karel, 1992).
Crystallization under low TKTg conditions appears to
produce smaller and less perfect crystallites than those
produced under high TKTg conditions, due to lower
molecular mobility. However, glass transition is not
necessarily the best inhibitor of isomalt crystallization
(McFetridge, Rades, & Lim, 2004).
StickinessInitiation of viscous flow, caking, and stickiness depends
on the glass transition temperature. In case of spray dried
lactose, caking and collapse was increased with the increase
of TKTg (Lloyd, Chen, & Hargreaves, 1996). The sticky
point of an amorphous sucrose and fructose was found 10 8C
higher than glass transition (Roos & Karel, 1991).
Grain damage by dryingConsiderable differences between the values of thermal
expansion coefficients bglass and brubber in the two zones
were observed (Perdon, 1999). A hypothesis based on glass
transitions inside rice kernels was proposed to explain rice
fissure formation and heat rice yield during the drying
process (Cnossen, Siebenmorgen, Yang, & Bautista, 2000;
Perdon, Siebenmorgen, & Mauromoustakos, 2000; Sieben-
morgen et al., 2000; Yang, Jia, Siebenmorgen, Pan, &
Cnossen, 2003a; Yang, Jia, Howell, 2003b).
Pore formation in foodsThe glass transition theory is one of the concepts that
have been proposed to explain the process of shrinkage,
collapse, fissuring, and cracking during drying (Cnossen &
Siebenmorgen, 2000; Karathanos, Kanellopoulos, & Beles-
siotis, 1993; Karathanos, Angelea, & Karel, 1996; Krokida
et al., 1998; Rahman, 2001). The hypothesis indicates that a
significant shrinkage can be noticed during processing only
if the temperature of the drying is higher than the glass
transition of the material at that particular moisture content
(Achanta & Okos, 1996). The methods of freeze-drying and
hot air drying can be compared based on this theory. Recent
experimental results dictate that the concept of glass
transition is not valid for freeze-drying of all types of
biological materials indicating the need of the incorporation
of other concepts (Sablani & Rahman, 2002), thus an unified
approach need to be used. Other instances when glass
concept is not valid are also reported (Ali, Hanna, &
Chinnaswamy, 1996; Del Valle, Cuadros, & Aguilera, 1998;
Rahman, Al-Zakwani, I. & Guizani, 2005b; Rahman, Al-
Amri, & Al-Bulushi, 2002a; Ratti, 1994; Krokida &
Maroulis, 2000; Wang & Brennan, 1995). The mechanism
proposed for the deviation was case hardening, and internal
pressure development (Achanta & Okos, 1996; Rahman
et al., 2005b; Ratti, 1994). In case of casehardening the
permeability and integrity of the crust play a role in
maintaining the internal pressure inside the geometric
boundary. Internal pressure always tries to puff the product
by creating a force to the crust. Glass transition concept
cannot explain the effect of crust and internal pressure. After
analyzing experimental results from literature, Rahman
(2001) identified that the glass transition theory does not
hold true for all products or processes. Other concepts, such
as surface tension, pore pressure, structure, environment
pressure, and mechanisms of moisture transport also play
important roles in explaining the formation of pores.
Rahman (2001) hypothesized that as capillary force is the
main force responsible for collapse, so counterbalancing
this force causes formation of pores and lower shrinkage.
The counterbalancing forces are due to generation of
internal pressure due to vaporization of water or other
solvents, variations in moisture transport mechanism, and
pressure outside the material. Other factors could be
strength of solid matrix (i.e. ice formation, case hardening,
surface cracks formation, permeability of water thru crust,
change in tertiary and quaternary structure of polymers,
presence or absence of crystalline, amorphous, and
Viewpoint / Trends in Food Science & Technology 17 (2006) 129–141136
viscoelastic nature of solids, matrix reinforcement, resi-
dence time). Some of these factors are related to the glass
transition.
Microbial stabilityThe microbial stability of food has long been
estimated by its water activity. The rule is: (i) lower
the water activity, the microbiologically stable the food
and (ii) foods are most stable at its BET-monolayer
moisture content. The water activity at the monolayer
water content is also called the critical water activity.
The above concept has limitations as discussed earlier.
Franks (1991); Slade and Levine (1987) maintained that
water activity could serve as a useful, but not sole
indicator of microbial safety. Slade and Levine’s (1987)
hypothesis was that water dynamics or glass–rubber
transition may be applied instead of water activity to
predict the microbial stability of concentrated and
intermediate-moisture foods. Sapru and Labuza (1993)
studied the inactivation of bacterial spores and their glass
transition temperature. Spores at glass transition have
high heat resistance, and above glass they are easy to
inactivate. At a given temperature, the inactivation rate
decreases with the increase of glass transition tempera-
tures of spores. Chirife and Buera (1994) maintained that
glass–rubber transition would not be useful in predicting
with confidence the microbial stability of foods. They
analyzed data from the literature and concluded that
water activity and glass transition are two different
entities. The mobility factors (i.e. glass transition) in
addition to water activity are not useful for a better
definition of microbial stability of foods. Water activity
is a solvent property and glass is a property related to
the structure of food. Thus, both properties are needed
for understanding food-water relationships at different
conditions (Chirife & Buera, 1994; Taylor, 1995; Van
den Berg, 1991). Macroscopic heterogeneities in a food
material can induce the presence of areas with a higher
mobility (Champion et al., 2000). Chirife, Buera, &
Gonzalez (1999) showed mold growth may be possible
below glass transition if non-glassy micro-regions exist.
Champion et al. (2000) stressed for further studies to
investigate effects of non-homogeneous water distribution
and/or phase separation on reaction rates. Hills, Manning,
Ridge, and Brocklehurst (1996) first studied by NMR
relaxation and electrical conductivity to actually dis-
tinguish the effect of local rather than global water
activity on microbial stress in porous media. They found
that the microbial stress does not correlate with the
global water activity measured for the whole assemble
but rather with the local water activity actually
surrounding the cells.
Desiccation-tolerant organismsDesiccation-tolerant organisms (anhydrobiotes), such as
seed and pollen are capable of surviving the removal of their
cellular water. The lifespan of seeds can be remarkably
long, ranging from decades to centuries (Kivilaan &
Bandurski, 1981; Priestley, Cullinan, & Wolf, 1985; Steiner
& Ruckenbauer, 1995) and even millennia (Shen-Miller,
Mudgett, Schopf, Clarke, & Berger, 1995). In late 1980s,
Burke (1986) forwarded the hypothesis that cytoplasm of
seeds could enter into a glassy state. He suggested that in dry
anhydrous organisms, glasses could be formed from cell
solutes like sugars that were known to provide protection
from denatured of large molecules and formation of
molecular aggregates, and high viscosity may stop all
chemical reactions that require molecular diffusion. Thus,
the glass concept turned out to be an interesting hypothesis
to account for the survival in the dry state. More recently, in
addition to the measurement of glass transition temperature,
efforts focused on the assessment of additional physical
properties, such as molecular density, local viscosity, and
molecular properties of the glass (Buitink & Leprince,
2004).
OxidationOxidation phenomena occur in low moisture food
systems, such as fat or ascorbic acid oxidation.
The oxidation of unsaturated lipids entrapped in sugar-
based matrices is affected by physical changes such as
collapse or crystallization occurring above glass transition
(Labrousse, Roos, & Karel, 1992; Shimada, Roos, & Karel,
1991). The encapsulated oil was released as a consequence
of the crystallization of amorphous lactose. The released oil
underwent rapid oxidation, while encapsulated oil remained
un-oxidized.
Non-enzymatic BrowningKarel, Buera, and Roos (1993); Karmas, Buera, and
Karel (1992); Buera and Karel (1993) indicated that phase
transitions with physical aspects of the matrix are factors
affecting the rates of non-enzymatic browning reactions.
Non-enzymatic browning below glass transition was very
slow. The systems were used vegetables, dairy products and
model food systems with amino acids and sugars in a PVP
matrix. Many other investigations showed only glass
transition cannot explain the process, since the reaction
was also affected by several other factors, such as structural
changes, water content (i.e. water activity) independently of
its plasticizing effect, pH, and types of solutes in the matrix
(Bell, 1996; Bell & Hageman, 1994; Bell, Touma, White, &
Chen, 1998; Buera & Karel, 1993; Karel et al., 1994;
O’Brien, 1996; Roos & Himberg, 1994).
Enzymatic reactionSeveral enzymatic reactions can occur at low water
contents (Drapon, 1972; Silver & Karel, 1981) or in the
frozen state (Fennema, 1975; 1978; Simatos & Blond, 1991;
1993; Franks & Hatley, 1992) such as those catalysed by
alkaline phosphatase, lipoxygenase, lipase or invertase. The
effect of temperature on the reaction rate depends on the
Viewpoint / Trends in Food Science & Technology 17 (2006) 129–141 137
relative value of the diffusion of the reactants and the
activity of the enzyme in such concentrated media.
Champion et al. (2000) pointed that there is risk of
proposing a unified theoretical model to predict the
reactions in such concentrated materials. Torreggiani et al.
(1999) found no clear relationship between the anthocyanin
loss and (TKTg0) of strawberry juices. Other important
factors such as the pH of the unfrozen phase and types of
solutes could influence anthocyanin pigment stability.
Denaturation of proteinThe properties and functionality of the protein depend on
whether it exists in the native or denatured state and
maintaining protein structure and functionality is important
in food science. Reaction rates at constant water activity but
different glass transition values were not significantly
different (Bell & Labuza, 1991; Bell & Hageman, 1994).
The temperature of denaturtion decreased with increasing
moisture content to some plateau, where further increases in
moisture no longer influenced the denaturation temperature
(Bell & Hageman, 1996). Thermal stability of protein
correlated with glass transition temperatures (Bell &
Hageman, 1996). They hypothesized that in dry state,
the additives were acting as plasticizers, enhancing the
mobility and thus the unfolding of the globular proteins.
HydrolysisThe effect of glass transition on different chemical
reactions is not as clear as in the cases with physical
changes. This is due to the multiple roles of water in foods,
such as plasticizer, reactant or product of chemical
reactions, and pH (Buera, Chirife, & Karel, 1995). One of
the chemical reactions that proposed to occur only in the
rubbery phase (i.e. above glass transition) is sucrose
inversion in acid containing amorphous powders (Levine
& Slade, 1989). Glass transition is not a key factor
determining the rate of sucrose hydrolysis (Buera et al.,
1995). The major effect on the rate of hydrolysis was related
to changes in pH, which is moisture dependent. Knowledge
of the actual pH of a system, and the possible changes that
may occur during concentration or drying are necessary for
better understanding of chemical changes in low and
intermediate moisture foods. Sucrose hydrolysis in an
acid-containing (low pH 3.1) amorphous starch powder
(native or pre-gelatinized) occurred to a significant extent in
the glassy state (Schebor, Buera, Chirife, & Karel, 1995).
The mobility effects are not controlling the extent of
reaction. Hydrolysis (31–85% remaining sucrose) observed
at different water content and temperature below glass.
Little reaction occurred at moisture contents below the so-
called BET monolayer. Temperature was a critical factor
controlling sucrose inversion.
Enzyme and vitamins inactivationThe stability of enzymes and vitamins in low water
systems was analyzed based on glass concept. The stability
could not be explained by glass concept. The other factors
are the types of solutes in the matrix, water activity and
temperature (Bell & White, 2000; Cardona, Schebor, Buera,
Karel, & Chirife, 1997; Champion et al., 2000; Mazzobre,
Buera, & Chirife, 1997; Schebor, Buera, & Chirife, 1996).
Future challengesFirst phase of the data generation and applications of the
glassy concept has been done. The second phase of the
characterizing the glassy state and molecular mobility has
started in recent works. The third phase of coupling glassy
concept with other concepts remained a challenge for us. It
is very important to develop accepted standard measure-
ment protocol, and how different methods are varied.
Scattered results are presented in the literature for
comparing between rheological/mechanical and DSC
methods of glass transition. Much more need to be done
in order to make meaningful comparisons.
Variation of data from different sources as well as
different measurement techniques could be one of the major
limitations when data need to be used. For example, Labuza
and Roe (in press) compiled glass transition temperature of
dry trehalose from 15 literature sources and found that it
varied from 75 to 120 8C. In case of multi-component
mixture such as food it is more complicated due to the
compositional variation even for same material, for example
fruits composition varies with variety, maturity level,
growing locations, and seasons. Although different reasons
are proposed for such variations, it is difficult for the food
scientists and engineers to use it in real applications when
the variation in temperature is 45 8C say for trehalose.
Recently, many papers presented data on the water
activity as well as glass transition as a function of water
content. However, it was not identified where is the link
between them in order to determine stability. Karel et al.
(1994) attempted to relate water activity and glass transition
by plotting equilibrium water content and glass transition as
a function of water activity. By drawing a vertical line on
the graph stability criterion could be determined from
isotherm curve and glass transition line. At any temperature
(say 25 8C) stability moisture content from glass transition
line was much higher than the stability moisture from the
isotherm. The question is how to use both? At present it is a
real challenge to link them. As a first attempt I have plotted
BET-monolayer value as LO line in the state diagram shown
in Fig. 1. It intersects at point N with the glass line ES,
which shows that at least in one location (point N) glass and
water activity concepts provide the same stability criterion.
This approach form more micro-regions, which could give
different stability in the state diagram. More studies
regarding the stability need to be done on the left (above
and below glass) and right sides (above and below) of the
line LO. A successful combination of water activity and
glass transition could open more in depth knowledge on
stability criteria. In addition how other factors, such as pH,
Viewpoint / Trends in Food Science & Technology 17 (2006) 129–141138
preservatives could be linked with these concepts. We are
far away to develop a unified theoretical basis.
Heterogeneity in chemical composition and structure in
food is giving another hurdle to apply in foods beyond the
pure components. Various physical and chemical reactions
can still occur in the glassy state, suggesting glass transition
cannot be considered as an absolute threshold temperature
for stability. Sub-glass relaxations and physical ageing are
phenomena showing that the molecular mobility below
glass transition cannot be neglected (Champion et al.,
2000). Above the glass transition, a simple WLF model
based on viscosity is not sufficient to account for the effect
of temperature and water content on kinetics of transform-
ations or on mechanical properties. More characteristics of
glass formed in different food matrix, such as translation/
rotational diffusion, viscosity for flow, mechanical spec-
troscopy, fragility, ab-cross over temperature, and distri-
bution of relaxation times could be explored in order to
explain the different level of stability in glassy foods. These
characteristic parameters specific to food products, and their
variation will allow the glass concept to be even more
efficient in rationalizing formulation and process control of
foods (Champion et al., 2000).
It is evident from the review that the variation of stability
below glass transition not following the rule indicating only
glass transition temperature for developing the stability rule
could not be enough. The types or characteristics of glassy
state form in different types of foods with variations of
composition and water content should be used to charac-
terize the stability criterion. In addition the effect of
temperature below Tm0, Tg
00, Tg0, and Tg
000 should also be
explored. Sample having freezable water are more complex
and four temperatures are defined as Tm0OTg
00OTg0OTg
000
(Rahman et al. 2005a). There are only few references
available including all four characteristic temperatures with
their moisture content. It is important to know how these
temperatures affect the stability of foods. It would be
interesting to explore what are differences in stability exist
in product with in these different ranges.
ConclusionOverviews of the basic concepts of the state diagram
based on glass transition concept with their terminologies,
measurement techniques, and their applications in food
stability are reviewed in this work. All measurement
methods need to be standardized. In all systems and
processes the glass transition concept alone are not valid,
thus both water activity and glass transition concepts need to
be used. How to combine both concepts (glass transition and
water activity) with other factors is a challenge? Studies on
the characteristics of glassy state formed in different types
of foods with varied composition and water content could
explore why in many instances glass transition concept
failed to determine the stability.
AcknowledgementThe author would like to acknowledge the support of
Sultan Qaboos University towards the research works on
developing state diagram for foods.
References
Ablett, S., Clark, A. H., Izzard, M. J., & Lillford, P. J. (1992).Modelling of heat capacity–temperature data for sucrose-watersystems. Journal of the Chemical Society Faraday Transactions,88(6), 795–802.
Ablett, S., Darke, A. H., Izzard, M. J., & Lillford, P. J. (1993). Studiesof the glass transition in malto-oligomers. In J. M. V. Blanshard, &P. J. Lillford (Eds.), The glassy states in foods (pp. 189–206).Nottingham: Nottingham Press.
Ablett, S., Izzard, M. J., & Lillford, P. J. (1992). Differential scanningcalorimetric study of frozen sucrose and glycerol solitions.Journal of the Chemical Society Faraday Transactions, 88(6),789–794.
Achanta, S., & Okos, M. R. (1996). Predicting the quality ofdehydrated foods and biopolymers—Research needs andopportunities. Drying Technology, 14(6), 1329–1368.
Ali, Y., Hanna, M. A., & Chinnaswamy, R. (1996). Expansioncharacteristics of extruded corn grits. Food Science andTechnology, 29, 702–707.
Allen, G. (1993). A history of the glassy state. In J. M. V. Blanshard, &P. J. Lillford (Eds.), The glassy state in foods (pp. 1–12).Nottingham: Nottingham University Press.
Angell, C. A. (1988). Perspective on the glass transition. Journal ofPhysics and Chemistry of Solids, 49, 863–871.
Barnett, S. (1973). Freezing of coffee extract to produce a darkcolored freeze-dried product. AIChE Symposium Series,69(132), 26–32.
Baroni, A. F., Sereno, A. M., & Hubinger, M. D. (2003). Thermaltransitions of osmotically dehydrated tomato by modulatedtemperature differential scanning calorimetry. ThermochimicaActa, 395, 237–249.
Bell, L. N. (1996). Kinetics of non-enzymatic browning inamorphous solid systems: Distinguishing the effects of wateractivity and the glass transition. Food Research International, 28,591.
Bell, L. N., Bell, H. M., & Glass, T. E. (2002). Water mobility inglassy and rubbery solids as determined by oxygen-17 nuclearmagnetic resonance: Impact on chemical stability. Food Scienceand Technology, 35, 108–112.
Bell, L. N., & Hageman, M. J. (1994). Differentiating between theeffects of water activity and glass transition dependent mobilityon a solid state chemical reaction: Aspartame degredation.Journal of Agricultural and Food Chemistry, 42, 2398.
Bell, L. N., & Hageman, M. J. (1996). Glass transition explanationfor the effect of polyhydroxy compounds on protein denaturationin dehydrated solids. Journal of Food Science, 61, 372.
Bell, L. N., & Labuza, T. P. (1991). Aspartame degradation kinetics asaffected by pH in intermediate and low moisture food systems.Journal of Food Science, 56, 17–20.
Bell, L. N., Touma, E., White, K. L., & Chen, Y. (1998). Glycine lossand maillard browning as related to the glass transition in amodel food system. Journal of Food Science, 63(4), 625–628.
Bell, L. N., & White, K. L. (2000). Thiamin stability in solids asaffected by the glass transition. Journal of Food Science, 65(3),498–501.
Blond, G. (1994). Mechanical properties of frozen model solutions.Journal of Food Engineering, 22, 253–269.
Borde, B., Bizot, H., Vigier, G., Emery, J., & Buleon, A. (1999). SubTg relaxations and physical ageing in hydrated glassy
Viewpoint / Trends in Food Science & Technology 17 (2006) 129–141 139
polysaccharides. In P. Colonna, & S. Guilbert (Eds.), Biopolymer
science: Food and non food applications (pp. 167–172). Paris:
INRA Editions.
Bruin, S., & Luyben, K. (1980). In A. Mujumdar (Ed.), Advances in
drying. Washington, DC: Hemisphere.
Buera, M. D. P., Chirife, J., & Karel, M. (1995). A study of acid-
catalyzed sucrose hydrolysis in an amorphous polymeric matrix
at reduced moisture contents. Food Research International, 28,
359.
Buera, M. P., & Karel, M. (1993). Application of the WLF equation to
describe the combined effects of moisture and temperature on
non-enzymatic browning rates in food systems. Journal of Food
Processing and Preservation, 17, 31.
Buitink, J., & Leprince, O. (2004). Glass formation in plant
anhydrobiotes: Survival in the dry state. Cryobiology, 48, 215–
228.
Burke, M. J. (1986). The glassy state and survival of anhydrous
biological systems. In A. C. Leopold (Ed.), Membranes,
metabolism and dry organisms (pp. 358–363). Ithaca, NY:
Cornell University Press.
Cardona, S., Schebor, C., Buera, M. P., Karel, M., & Chirife, J. (1997)
. Thermal stability of invertase in reduced-moisture amorphous
matrices in relation to glassy state and trehalose crystallization.
Journal of Food Science, 62, 105.
Champion, D., Hervet, H., Blond, G., Le Meste, M., & Simatos, D.
(1997). Translation diffusion in sucrose solutions in the vicinity
of their glass transition. The Journal of Physical Chemistry, B10,
10674–10679.
Champion, D., Le Meste, M., & Simatos, D. (2000). Towards an
improved understanding of glass transition and relaxations in
foods: Molecular mobility in the glass transition range. Trends in
Food Science and Technology, 11, 41–55.
Chen, P., Chen, X. D., & Free, K. W. (1996). Measurement and data
interpretation of the freezing point depression of milks. Journal
of Food Engineering, 30, 239–253.
Chen, X. D., & Chen, P. (1996). Freezing of aqueous solution in a
simple apparatus designed for measuring freezing point. Food
Research International, 29(8), 723–729.
Chirife, J. (1994). Specific solute effects with special reference to
Staphylococcus aureus. Journal of Food Engineering, 22, 409.
Chirife, J., & Buera, M. D. P. (1994). Water activity, glass transition
and microbial stability in concentrated/semimoist food systems.
Journal of Food Science, 5, 43.
Chirife, J., Buera, M. P., & Gonzalez, H. L. (1999). The mobility and
mold growth in glassy/rubbery substances. In Y. H. Roos, R. B.
Leslie, & P. J. Lillford (Eds.), Water management in the design and
distribution of quality foods. ISOPOW 7 (pp. 285–298). Lan-
caster, PA: Technomic.
Cnossen, A. G., & Siebenmorgen, T. J. (2000). The glass transition
temperature concept in rice drying and tempering: Effect on
milling quality. Transactions of the ASAE, 43(6), 1661–1667.
Cnossen, A. G., Siebenmorgen, T. J., Yang, W., & Bautista, R. C.
(2000). An application of glass transition temperature to explain
rice kernel fissure occurrence during the drying process. Drying
Technology, 19(8), 1661–1682.
Contreras-Lopez, E., Champion, D., Hervet, H., Blond, G., & Le
Meste, M. (1999). Effet de differents polysaccharides sur la
mobilite rotationnelle et translationelle de petites molecules
dans des solutions concentrees de saccharose. In Les Produits
Alimentaires et I’Eau (pp. 253–258). Agoral-99: Paris.
Del Valle, J. M., Cuadros, T. R. M., & Aguilera, J. M. (1998). Glass
transitions and shrinkage during drying and storage of osmosed
apple pieces. Food Research International, 31(3), 191–204.
Drapon, R. (1972). Reactions enzymatiques en Milieu Peu hydrate.
Annals Technology in Agriculture, 21, 487–499.
Duckworth, R. B., & Smith, G. M. (1963). The environment for
chemical change in dried and frozen foods. Proceedings of the
Nutrition Society, 22, 182–189.
Fennema, O. (1975). Activity of enzymes in partially frozen aqueous
systems. In R. B. Duckworth (Ed.), Food science and technology.
A series of monograph (pp. 397–412). London: Academic Press.
Fennema, O. (1978). Enzyme kinetics at low temperature and
reduced water activity. In J. H. Crowe, & J. S. Clegg (Eds.), Dry
biological systems (pp. 297–342). London: Academic Press.
Ferry, J. D. (1991). Some reflections on the early development of
polymer dynamics: Viscoelasticity, dielectric dispersion, and
self-diffusion. Macromolecules, 24, 5237–5245.
Fonseca, F., Obert, J. P., Beal, C., & Marin, M. (2001). State diagrams
and sorption isotherms of bacterial suspensions and fermented
medium. Thermochimica Acta, 366, 167–182.
Franks, F. (1991). Water activity: A credible measure of food safety
and quality? Trends in Food Science and Technology, 2, 68.
Franks, F., & Hatley, R. H. M. (1992). Stable enzymes by water
removal. In W. J. J. Van Den Tweel, R. A. Harde, & R. M.
Buitelaar (Eds.), Stability and stabilization of enzymes (pp. 45–
54). Amsterdam: Elsevier.
Given, P. S. (1991). Molecular behavior of water in a flour–water
baked model system. In H. Levine, & L. Slade (Eds.), Water
relationships in food (pp. 465–483). New York: Plenum Press.
Goff, H., Caldwell, K. B., Stanley, D. W., & Maurice, T. P. (1993). The
influence of polysaccharides on the glass transition in frozen
sucrose solutions and ice cream. Journal of Dairy Science, 76,
1268–1277.
Goff, H. D., Montoya, K., & Sahagian, M. E. (2002). The effect of
microstructure on the complex glass transition occurring in
frozen sucrose model systems and foods. In H. Levine (Ed.),
Amorphous food and pharmaceutical systems (pp. 145–157).
Cambridge: The Royal Society of Chemistry.
Hardman, T. M. (1986). Interaction of water with food component.
In G. G. Birch, & M. G. Lindley (Eds.), Interaction of food
components (pp. 19–30). London: Elsevier.
Hatakeyama, T., Quinn, F. X., & Hatakeyama, H. (1996).
Changes in freezing bound water in water–gellan systems
with structure formation. Carbohydrate Polymers, 30, 155–
160.
Hills, B. P., Manning, C. E., Ridge, Y., & Brocklehurst, T. (1996).
NMR water relaxation, water activity and bacterial survival in
porous media. Journal of the Science of Food and Agriculture,
71, 185–194.
Jouppila, K., & Roos, Y. H. (1997). The physical state of amorphous
corn starch and its impact on crystallization. Carbohydrate
Polymers, 32, 95–104.
Karathanos, V., Angelea, S., & Karel, M. (1993). Collapse of
structure during drying of celery. Drying Technology, 11, 1005.
Karathanos, V. T., Kanellopoulos, N. K., & Belessiotis, V. G. (1996).
Development of porous structure during air drying of agricultural
plant products. Journal of Food Engineering, 29, 167–183.
Karel, M., Anglea, S., Buera, P., Karmas, R., Levi, G., & Roos, Y.
(1994). Stability-related transitions of amorphous foods. Ther-
mochimica Acta, 246, 249–269.
Karel, M., Buera, M. P., & Roos, Y. (1993). Effects of glass transitions
on processing and storage. In J. M. V. Blanshard, & P. J. Lillford
(Eds.), The science and technology of the glassy state in foods (p.
13). Nottingham: Nottingham University Press.
Karel, M., & Saguy, I. (1991). Effects of water on diffusion in food
systems. In H. Levine, & L. Slade (Eds.), Water relationships in
foods (p. 157). New York: Plenum Press.
Karmas, R., Buera, M. P., & Karel, M. (1992). Effect of glass transition
on rates of nonenzymatic browning in food systems. Journal of
Agricultural and Food Chemistry, 40, 873.
Viewpoint / Trends in Food Science & Technology 17 (2006) 129–141140
Kasapis, S. (2005). Glass transition phenomena in dehydrated model
systems and foods: A review. Drying Technology, 23(4), 731–
758.
Kasapis, S., Al-Marhoobi, I. M., & Mitchell, J. R. (2003). Testing the
validity of comparisons between the rheological and the
calorimetric glass transition temperatures. Carbohydrate
Research, 338, 787–794.
Kasapis, S., Al-Marhobi, I. M. A., & Sworn, G. (2001). a and b
mechanical dispersions in high sugar/acyl gellan mixtures.
International Journal of Biological Macromolecures, 29, 151–
160.
Kasapis, S., Rahman, M. S., Guizani, N., & Al-Aamri, M. K. S. (2000)
. State diagram of temperature vs. date solids obtained from the
mature fruit. Journal of Agricultural and Food Chemistry, 48,
3779–3784.
Kivilaan, A., & Bandurski, R. S. (1981). The one-hundred-year
period for Dr. Beal’s seed viability experiment. American Journal
of Botany, 68, 1290–1292.
Krokida, M., & Maroulis, Z. (2000). Quality changes during drying
of food materials. In A. S. Mujumdar (Ed.), Drying technology in
agricultural and food sciences (pp. 61–106). Enfield: Science
Publishers.
Krokida, M. K., Karathanos, V. T., & Maroulis, Z. B. (1998). Effect of
freeze-drying conditions on shrinkage and porosity of dehy-
drated agricultural products. Journal of Food Engineering, 35,
369–380.
Labrousse, S., Roos, Y., & Karel, M. (1992). Collapse and crystal-
lization in amorphous matrices with encapsulated compounds.
Sciences Aliments, 12, 757.
Labuza, T., & Roe, K. (in press). Glass transition and crystallization
of amorphous trehalose–sucrose mixtures. International Journal
of Food Properties.
Le Meste, M., Champion, D., Roudaut, G., Contreras-Lopez, E.,
Bond, G., & Simatos, D. (1999). Mobility and reactivity in low
moisture and frozen foods. In Y. H. Roos, R. B. Leslie, & P. J.
Lillford (Eds.), Water management in design and distribution of
quality foods. ISOPOW 7 (pp. 267–284). Lancaster, PA:
Technomic.
Levine, H., & Slade, L. (1986). A polymer physico-chemical
approach to the study of commercial starch hydrolysis products
(SHPs). Carbohydrate Polymers, 6, 213–244.
Levine, H., & Slade, L. (1989). Interpreting the behavior of low
moisture foods. In T. M. Hardman (Ed.), Water and food quality
(p. 71). New York: Elsevier.
Li, S., Dickinson, L. C., & Chinachoti, P. (1998). Mobility of
‘unfreezable’ and ‘freezable’ water in wxy corn starch by 2H
and 1H NMR. Journal of Agricultural and Food Chemistry, 46,
62–71.
Li, T. Y., & Chen, J. T. (2001). Evaluation of rice starch–hydrocolloid
compatibility at low-moisture content by glass transitions.
Journal of Food Science, 66(5), 698–704.
Lloyd, R. J., Chen, X. D., & Hargreaves, J. B. (1996). Glass transition
and caking of spray-dried lactose. International Journal of Food
Science and Technology, 31, 305–311.
Luyet, B., & Rasmussen, D. (1968). Study by differential thermal
analysis of the temperatures of instability of rapidly cooled
solutions of glycerol, ethylene glycol, sucrose and glucose.
Biodynamica, 10, 167–191.
Martin, D. R., Ablett, S., Sutton, M., & Sahagian, M. E. (1999).
Diffusion of aqueous sugar solutions as affected by locust
bean gum studied by NMR. Journal of Food Science, 64,
46–49.
Mazzobre, M. F., Buera, M. P., & Chirife, J. (1997). Protective role of
trehalose on thermal stability of lactose in relation to its glass and
crystal forming properties and effect of delaying crystallization.
Food Science and Technology, 30, 324–329.
McFetridge, J., Rades, T., & Lim, M. (2004). Influence of
hydrogenated starch hydrolysates on the glass transition and
crystallization of sugar alcohols. Food Research International,
37, 409–415.
Morales-Diaz, A., & Kokini, J. L. (1998). Understanding phase
transitions and chemical complexing reactions in 7S and 11S soy
protein fractions. In M. A. Rao, & R. W. Hartel (Eds.), Phase/state
transitions in foods (pp. 273–311). New York: Marcel Dekker.
Nicholls, R. J., Appleqvist, I. A. M., Davies, A. P., Ingman, S. J., &
Lillford, P. J. (1995). Glass transitions and the fracture behavior of
gluten and starches within the glassy state. Journal of Cereal
Science, 21, 25–36.
O’Brien, J. (1996). Stability of trehalose, sucrose and glucose to
nonenzymic browning in model systems. Journal of Food
Science, 61, 679.
Paakkonen, K., & Plit, L. (1991a). Equilibrium water content and the
state of water in dehydrated white cabbage. Journal of Food
Science, 56(6), 1597–1599.
Paakkonen, K., & Plit, L. (1991b). The state of water and chitin in the
northern milk cup mushroom (Lactarius trivialis). Food Science
and Technology, 24(3), 204–207.
Parker, R., & Ring, S. G. (1995). Diffusion in maltose–water mixtures
at temperatures close to the glass transition. Carbohydrate
Research, 273, 147.
Parker, R., & Smith, A. C. (1993). The mechanical properties of
starchy food materials at large strains and their ductile–brittle
transitions. In J. M. V. Blanshard, & P. J. Lillford (Eds.), The glassy
states in foods (pp. 519–522). Leicestershire: Nottingham
University Press.
Perdon, A. A. (1999). Amorphous state transition in rice during the
drying process. PhD Dissertation, University of Arkansas,
Fayetteville, AR.
Perdon, A. A., Siebenmorgen, T. J., & Mauromoustakos, A.
(2000). Glassy state transition and rice drying: Development
of a brown rice state diagram. Cereal Chemistry, 77(6),
708–713.
Phillips, G. O., Takigami, S., & Takigami, M. (1996). Hydration
characteristics of the gum exudate from acacia senegal. Food
Hydrocolloids, 10(1), 11–19.
Priestley, D. A., Cullinan, V. I., & Wolf, J. (1985). Differences in seed
longevity at the species level. Plant, Cell and Environment 1985,
557–562.
Rahman, M. S. (1995). Food properties handbook. Boca Raton, FL:
CRC Press.
Rahman, M. S. (1999). Glass transition and other structural changes
in foods. In M. S. Rahman (Ed.), Handbook of food preservation
(pp. 75–93). New York: Marcel Dekker.
Rahman, M. S. (2001). Toward prediction of porosity in foods during
drying: A brief review. Drying Technology, 19(1), 1–13.
Rahman, M. S. (2004). State diagram of date flesh using differential
scanning calorimetry (DSC). International Journal of Food
Properties, 7(3), 407–428.
Rahman, M. S. (2005). Dried-food properties: Challenges ahead.
Drying Technology, 23(4), 695–715.
Rahman, M. S., Al-Amri, O. S., & Al-Bulushi, I. M. (2002a). Pores
and physico-chemical characteristics of dried tuna produced by
different methods of drying. Journal of Food Engineering, 53,
301–313.
Rahman, M. S., Al-Zakwani, I., & Guizani, N. (2005b). Pore
formation in apple during air drying as a function of temperature
and pore size distribution. Journal of the Science of Food and
Agriculture, 85(6), 979–989.
Rahman, M. S., Guizani, N., Al-Khaseibi, M., Al-Hinai, S., Al-
Maskri, S. S., & Al-Hamhami, K. (2002b). Analysis of cooling
curve to determine the end point of freezing. Food Hydro-
colloids, 16(6), 653–659.
Viewpoint / Trends in Food Science & Technology 17 (2006) 129–141 141
Rahman, M. S., Kasapis, S., Guizani, N., & Al-Amri, O. (2003). State
diagram of tuna meat: Freezing curve and glass transition.
Journal of Food Engineering, 57(4), 321–326.
Rahman, M. S., & Labuza, T. P. (1999). Water activity and food
preservation. In M. S. Rahman (Ed.), Handbook of food
preservation (pp. 339–382). New York: Marcel Dekker.
Rahman, M. S., Sablani, S. S., Al-Habsi, N., Al-Maskri, S., & Al-
Belushi, R. (2005a). State diagram of freeze-dried garlic powder
by differential scanning calorimetry and cooling curve methods.
Journal of Food Science, 70(2), E135–E141.
Ratti, C. (1994). Srinkage during drying of foodstuffs. Journal of Food
Engineering, 23, 91–105.
Rey, L. R. (1958). Etude Physiologique et Physico-chimique de
I’Action des Basses Temperatures sur Tissus Animaux Vivants.
PhD thesis, 122 p.
Rockland, L. B. (1969). Water activity and storage stability. Food
Technology, 23, 11–21.
Roos, Y. (1995a). Characterization of food polymers using state
diagrams. Journal of Food Engineering, 24, 339–360.
Roos, Y. (1995b). Water activity and glass transition temperature:
How do they complement and how do they differ?. In G. V.
Barbosa-Canovas, & J. Welti-Chanes (Eds.), Food preservation by
moisture control. Fundamentals and applications (pp. 133–154).
Pennsylvania: Technomic.
Roos, Y., & Karel, M. (1991). Plasticizing effect of water on thermal
behavior and crystallization of amorphous food models. Journal
of Food Science, 56, 38–43.
Roos, Y., & Karel, M. (1992). Crystallization of amorphous lactose.
Journal of Food Science, 57, 775–777.
Roos, Y. H. (1987). Effect of moisture on the thermal behavior of
strawberries studied using differential scabbing calorimetry.
Journal of Food Science, 52(1), 146–149.
Roos, Y. H., & Himberg, M. J. (1994). Nonenzymatic browning behavior,
as related to glass transition of food model at chilling temperature.
Journal of Agricultural and Food Chemistry, 42, 893–898.
Roudaut, G., Maglione, M., & Le Meste, M. (1999). Sub-Tg
relaxations in cereal-based systems. Cereal Chemistry, 76,
78–81.
Sablani, S. S., & Rahman, M. S. (2002). Pore formation in selected
foods as a function of shelf temperature during freeze drying.
Drying Technology, 20(7), 1379–1391.
Sapru, V., & Labuza, T. P. (1993). Glass state in bacterial spores
predicted by polymer glass-transition theory. Journal of Food
Science, 58, 445.
Schebor, C., Buera, M. D. P., Chirife, J., & Karel, M. (1995). Sucrose
hydrolysis in glassy starch matrix. Food Science and Technology,
28, 245.
Schebor, C., Buera, M. P., & Chirife, J. (1996). Glassy state in relation
to the thermal inactivation of enzyme invertase in amorphous
dried matrices of trehalose, maltodextrin and PVP. Journal of
Food Engineering 1996;.
Scott, W. J. (1953). Water relations of Staphylococcus aureus at
30 8C. Australian Journal of Biological Science, 6, 549.
Shalaev, E. Y., & Kanev, A. N. (1994). Study of the solid–liquid state
diagram of the water–glycine–sucrose system. Cryobiology, 31,
374–382.
Shen-Miller, J., Mudgett, M. B., Schopf, J. W., Clarke, S., & Berger, R.
(1995). Exceptional seed longevity and robust growth: Ancient
sacred lotus from China. American Journal of Botany, 82, 1367–
1380.
Shimada, Y., Roos, Y., & Karel, M. (1991). Oxidation of methyl
linoleate encapsulated in amorphous lactose-based food
models. Journal of Agricultural and Food Chemistry, 39, 637.
Siebenmorgan, T. J., Yang, W., Howell, T. A., Meullenet, J. F., Wang,Y. J., & Cnossen, A. G. (2000). Fissure formation in rice kernelsduring the drying process: a glass transition perspective.Proceedings if the 2000 Rice Technical Working GroupConference, Biloxi, MS.
Silver, M., & Karel, M. (1981). The behavior of invertase inmodel systems at low moisture content. Food Chemistry, 5, 283–311.
Simatos, D., & Blond, G. (1991). DSC studies and stability of frozenfoods. In H. Levine, & L. Slade (Eds.), Water relationships infoods (pp. 139–156). New York: Plenum Press.
Simatos, D., & Blond, G. (1993). Some aspects of the glass transitionin frozen food systems. In J. M. V. Blanshard, & P. J. Lillford (Eds.),The glassy state in food (pp. 395–415). Nottingham: NottinghamUniversity Press.
Slade, L., & Levine, H. (1987). Structural stability of intermediatemoisture foods—a new understanding. In J. R. Mitchell, &J. M. V. Blanshard (Eds.), Food structure—Its creation andevaluation (p. 115). London: Butterworths.
Slade, L., & Levine, H. (1988). Non-equilibrium behavior of smallcarbohydrate–water systems. Pure and Applied Chemistry, 60,1841–1864.
Slade, L., & Levine, L. (1991a). A food polymer science approach tostructure property relationships in aqueous food systems: Non-equilibrium behavior of carbohydrate–water systems. In H.Levine, & L. Slade (Eds.), Water relationships in food. New York:Plenum Press.
Slade, L., & Levine, L. (1991b). Beyond water activity: Recentadvances based on an alternative approach to the assessment offood quality and safety. Critical Reviews in Food Science andNutrition, 30, 115.
Steiner, A. M., & Ruckenbauer, P. (1995). Germination of 110-year-old cereal and weed seeds, the Vienna sample of 1877.Verification of effective ultra-dry storage at ambient temperature.Seed Science Research, 5, 195–199.
Taylor, J. R. (1995). Glass-state molecular mobility. Food IndustrySouth Africa, 48, 29.
Torreggiani, D., Forni, E., Guercilena, I., Maestrelli, A., Bertolo, G.,Archer, G. P., et al. (1999). Modification of glasstransition temperature through carbohydrates additions:Effect upon colour and anthocyanin pigment stability in frozenstrawberry juices. Food Research International, 32, 441–446.
Van den Berg, C. (1991). Food–water relations: Progress andintegration, comments and thoughts. In H. Levine, & L. Slade(Eds.), Water relations in foods (p. 21). New York: Plenum Press.
Verdonck, E., Schaap, K., & Thomas, L. C. (1999). A discussion ofthe principles and applications of modulated temperature DSC(MTDSC). International Journal of Pharmaceutics, 192, 3–20.
Wang, N., & Brennan, J. G. (1995). Changes in structure, densityand porosity of potato during dehydration. Journal of FoodEngineering, 24, 61–76.
Watanabe, H., Tang, C. Q., Suzuki, T., & Mihori, T. (1996). Fracturestress of fish meat and the glass transition. Journal of FoodEngineering, 29, 317–327.
White, G. W., & Cakebread, S. H. (1966). The glassy state in certainsugar-containing food products. Journal of Food Technology, 1,73–82.
Yang, W., Jia, C. C., & Howell, T. A. (2003). Relationhip of moisturecontent gradients and glass transition temperatures to head riceyield during cross-flow drying. Biosystems Engineering, 86(2),199–206.
Yang, W., Jia, C. C., Siebenmorgen, T. J., Pan, Z., & Cnossen, A. G.(2003). Relationship of kernel moisture content gradients andglass transition temperatures to head rice yield. BiosystemsEngineering, 85(4), 467–476.
Related Documents