State Capacity and the Quality of Policies: Revisiting the Relationship between Openness and the Size of Government María Franco Chuaire Carlos Scartascini Mariano Tommasi Department of Research and Chief Economist IDB-WP-532 IDB WORKING PAPER SERIES No. Inter-American Development Bank August 2014

Welcome message from author
This document is posted to help you gain knowledge. Please leave a comment to let me know what you think about it! Share it to your friends and learn new things together.
Transcript

State Capacity and the Quality of Policies: Revisiting the Relationship between Openness and the Size of Government
María Franco Chuaire Carlos Scartascini Mariano Tommasi
Department of Research and Chief Economist
IDB-WP-532IDB WORKING PAPER SERIES No.
Inter-American Development Bank
August 2014
State Capacity and the Quality of Policies:
Revisiting the Relationship between Openness and the Size of Government
María Franco Chuaire * Carlos Scartascini* Mariano Tommasi**
* Inter-American Development Bank ** Universidad de San Andrés
2014
Inter-American Development Bank

http://www.iadb.org The opinions expressed in this publication are those of the authors and do not necessarily reflect the views of the Inter-American Development Bank, its Board of Directors, or the countries they represent.
The unauthorized commercial use of Bank documents is prohibited and may be punishable under the
Bank's policies and/or applicable laws.
Copyright © Inter-American Development Bank. This working paper may be reproduced for any non-commercial purpose. It may also be reproduced in any academic journal indexed by the American Economic Association's EconLit, with previous consent by the Inter-American Development Bank (IDB), provided that the IDB is credited and that the author(s) receive no income from the publication.
Cataloging-in-Publication data provided by the Inter-American Development Bank Felipe Herrera Library Franco Chuaire, María. State capacity and the quality of policies: revisiting the relationship between openness and the size of government / María Franco Chuaire, Carlos Scartascini, Mariano Tommasi. p. cm. — (IDB Working Paper Series ; 532) Includes bibliographic references. 1. Public administration—Commercial policy. 2. International trade—Government policy. I. Scartascini, Carlos G., 1971-. II. Tommasi, Mariano, 1964-. III. Inter-American Development Bank. Department of Research and Chief Economist. IV. Title. V. Series. IDB-WP-532
2014

1
Abstract*
The literature has identified that countries with higher levels of openness tend to
present a larger government sector as a way to reduce the risks to the economy
that openness entails. This paper argues that there are a number of policies that
can mitigate trade-induced risks, many of which do not have the necessary
implication of increasing public spending. Yet, many such policies require
governmental capabilities not available to any country. For that reason, the
relationship between openness and the size of government might be mediated by
the quality of its public sector. While countries with weak government capabilities
will tend to rely on spending expansions to deal with trade-induced volatility,
countries with stronger governmental capabilities might address such challenges
by more efficient and less costly means. The empirical analysis in this paper
shows that the effect of openness on government consumption is mediated by the
quality of government institutions.
JEL classifications: D73, F19, H11, O16, O19, P16
Keywords: Government capabilities, Quality of policies, Openness, Government
size
* We have benefited from comments by Luciana Cingolani, Mark Hallerberg, Peter Kingstone, Johannes Lindvall,
Andrés Mejía Acosta, David Stasavage, John Stephens, Jeffrey Timmons, Jim Vreeland, and seminar participants at
King’s College International Development Institute, the workshop “Policy Reforms in Europe and Latin America” at
Lund University, and Universidad de San Andrés. We are grateful to Dani Rodrik and James Rockey for sharing
data with us. The opinions expressed in this publication are those of the authors and do not necessarily reflect the
views of the Inter-American Development Bank, its Board of Directors, or the countries they represent.

2
1. Introduction
The issue of government capabilities or, more broadly, of state capacity is a complex one, and it
has given rise to important analytical, measurement, and evaluation efforts, as well as lively
methodological debates. The concept of “state capacity” is very salient in studies of economic
development, and its presence or absence has been associated with development successes and
failures. Countries with low state capabilities have difficulties in implementing complex
economic policies. This situation in effect reduces the set of policies from which countries can
choose and makes them more vulnerable to both internal and external shocks. Countries with
strong state capabilities might be able to draw from a broader menu of policies, and pick and
successfully implement those policies that best suit the nature of their challenges.
One of the challenges countries face are external, trade-induced, shocks. Countries that
are more open, or that are more vulnerable to terms of trade shocks due to the structure of their
economy, have to find ways to reduce the incidence and impact of those shocks. One way for
countries to respond is by a variety of government programs and policies that may affect public
sector size. This is the intuition behind the so-called compensation hypothesis, which has been
part of the academic debate for more than two decades. According to this hypothesis, the
government’s attempt to compensate for the risks of increased exposure to international trade
results in a positive correlation between trade openness and the size of the public sector. The
empirical pattern relating trade openness with larger governments was first unveiled by Cameron
(1978) for 18 OECD countries, expanded by a very rich political science literature (including
Katzenstein, 1985, and others), and popularized by Rodrik (1998). The logic of the compensation
hypothesis is that government spending can provide insurance against external risk, i.e., a higher
level of openness brings increased exposure to external risk and, therefore, expanding the role of
the government in the economy helps reduce the level of exposure. The mechanisms suggested
by Rodrik and other authors include welfare programs, public employment, and the overall
macroeconomic stabilization role of public spending.
Those insights have spurred a rich and varied literature, not without debates, as many
authors have questioned aspects of the theoretical reasoning, as well as the empirical generality
of the results; Section 2 provides a glimpse to those discussions. By and large, however, the
compensation hypothesis has been quite accepted within the literature in international political
economy, and the potential positive correlation between openness and government spending has

3
become a staple consideration in exercises exploring the determinants of the size of government.
Because of its saliency in the political economy and comparative politics literature we focus on
the compensation hypothesis to highlight the importance of considering the relevance of state
capabilities for the selection and implementation of public policies.
In this paper we build upon an ample political science and economics literature that
shows the relevance of state capabilities for the selection and implementation of public policies
to argue that there are a variety of different policy responses to the additional economic volatility
induced by trade openness, not all of which imply increasing public spending.1 While almost any
government can reduce volatility by increasing its size through hiring more people, countries
with stronger governmental capabilities might address such challenges by more efficient and less
costly means by introducing more suitable macro, fiscal, micro, and social policies.2
Using the quality of the bureaucracy as a proxy for government capabilities, we show that
the marginal effect of openness on the size of government is only positive and significant for low
levels of government quality. As bureaucratic quality increases, and hence the set of policy
options at the disposal of authorities increases, the effect of openness on government size
decreases and even dissipates. Therefore, our results indicate that the effect of openness on
government consumption is mediated by the quality of government institutions.
This finding constitutes another step in building a stronger case on the relevance of state
capacities for economic development, and an agenda attempting to build bridges between the
study of institutions and policymaking in contexts of high and of low government capabilities. 3
These results open up new avenues of research for the comparative politics literature.4
1 The fact that countries may react differently to economic integration is not new. See for example Bates, Brock and
Tiefenthaler (1991) and Garrett (1998a, 1998b, 2001). 2 Some of these policies include stronger budget institutions that favor countercyclical adjustments, better financial
management systems, more flexible exchange rates, deeper credit markets, industrial and labor-market policies that
favor a more rapid adjustment in the use of factors, and more efficient welfare policies, among others. 3 It complements a related literature on the study of institutions and policymaking in contexts of different degrees of
institutionalization. See Scartascini and Tommasi (2012) for a model along those lines, and Caruso, Scartascini and
Tommasi (2013) for an empirical study arguing that standard results on the effects of political constitutions on fiscal
outcomes (à la Persson and Tabellini, 2003) apply only for countries with high levels of institutionalization of their
political institutions. 4 Our results complement a long tradition of articles dealing with policymaking in the context of differing abilities.
For example, Bates, Brock and Tiefenthaler (1991) identify the ability to offer transfers to compensate for risk as a
determinant of openness. We argue here that for a given level of openness, different levels of government
capabilities allow access to different insurance mechanisms. These results should feed back into a broader literature
that will incorporate them.
4
The paper proceeds as follows. The next section briefly discusses the literature that
relates openness and size of the government. It highlights the original discussion brought forward
by Rodrik (1998), as well as the extensions, clarifications, and criticisms it has received. Section
3 discusses the relationship between government capabilities (or state capacity) and the vector of
risk-reducing policies that each type of country can access. The concept, measures, and related
literature on state capacity are presented in Section 4. Section 5 presents the empirical analysis
and discusses the results, and Section 6 concludes.
2. More Open Economies and Bigger Governments
Following Cameron (1978) and Katzenstein’s (1985) work, the compensation hypothesis has
arisen as an important benchmark for the analysis of the effects of trade openness on domestic
policy. Cameron was the first to observe that trade openness was one of the most important
determinants of government size in OECD countries. Katzenstein argued that small European
states such as Sweden, Austria, and the Netherlands complemented their international
liberalization with strategic domestic compensation aimed at countering its harmful effects (i.e.,
instabilities in investment and employment). Policies of compensation included support for
employment, special tax legislation favoring enterprises that were affected by fluctuations in the
business cycle, wage control, and public expenditures (Balcells, 2006).
The empirical pattern relating trade openness with larger governments first unveiled by
Cameron (1978) for 18 OECD countries was extended to a broader international sample by
Rodrik (1998). In Rodrik’s analysis, the positive association was not limited to the cross section;
on average, international trade and public sectors had tended to grow together.
Alesina and Wacziarg (1998) confirm the correlation using government transfers as the
dependent variable but argue that country size is a mediating factor: the fact that smaller
countries have larger shares of government consumption on GDP and tend to be more open to
trade, may explain why more open economies have larger governments. However, Ram (2009)
revisits this idea using a panel data setting, and concludes that “the estimates are consistent with
the possibility of a direct link between openness and government size along the lines suggested
by Rodrik (1998).”5
5 Epifani and Gancia (2009) also find that the correlation between government size and openness is robust to the
inclusion of country size.

5
Adserà and Boix (2002) propose a model where the level of openness and government
consumption are simultaneously chosen by politicians according to the political regime in place.
They estimate a pooled cross-sectional time-series model where they include a measure of
democratic institutions both individually and interacted with openness. Although their results
confirm the compensation hypothesis, they find democracy to be an important intermediary: as
openness to international trade increases, the size of the public sector increases in democratic
regimes.
Some authors have reversed the causal arrow, claiming that the political sustainability of
globalization in open societies requires a thick, compensating welfare state or, at least,
government-sponsored efforts to redistribute (Garrett, 1998a; Adserà and Boix, 2002; Hays,
Ehrlich, and Peinhardt, 2005; Scheve and Slaughter, 2007; Martin and Steiner, 2013). This
“reverse compensation hypothesis” argues that that once a country has a large welfare state, trade
liberalization becomes more likely. Noorruddin and Rudra (2014), for example, show that less
developed countries use public employment to protect citizens from the economic insecurities
coming from the exposure to global markets. However, the type of public employment used,
focused on civil services and administration, tends to favor the politically prominent groups that
are, at the same time, those that show the most support for openness.
The discussion on the relationship between trade openness and the size of the public
sector is embedded in a broader discussion about the effects of “globalization,” including
financial openness and integration (Garrett 1998b, 2001). The core issue is whether governments
respond to the challenges of globalization with policy choices that are oriented more towards
cutting costs (efficiency hypothesis) or protecting people’s welfare (compensation hypothesis)
(Avelino, Brown and Hunter, 2001). In the context of that discussion there are related efforts
looking at the effects of financial openness, often thought to limit the scope of government, as
postulated by the “efficiency hypothesis.”6
Various studies have delved deeper into the microfoundations of the demand and supply
of “compensation,” looking at a more disaggregated level of policies (including varieties of
welfare states) and different politics. For instance, studies such as Rehm (2009), Baker (2008),
6 Some of the works that have incorporated the impact of financial openness into the analysis include, Garrett
(2001), Avelino, Brown and Hunter (2005), Kittel and Winner (2005), Garrett and Nickerson (2005), Liberati
(2007), Kimakova (2009), and Erauskin (2011). Similarly, Gemmell, Kneller and Sanz (2008) have tried to explore
the effects of globalization by focusing on FDI, as opposed to trade openness.
6
and Walter (2010) study individual level demand for redistribution in the context of open
economies. Burgoon (2001) looks the level of specific government programs and argues that
each one can be a more or less significant source of compensation and hence is subject to
different politics. Mares (2004 and 2005) argues that the individual demand for different types of
social policy depends on relative risk exposure across sectors, as well as on deeper political
economy considerations.
Despite all these rich and nuanced considerations, at the macro level, the correlation
between trade openness and government size has become fairly established, to the point that
important studies exploring the determinants of the size of government commonly include
openness as a control. Such works include Milesi-Ferreti, Perotti and Rostagno (2002), Persson
and Tabellini (2003), Mueller (2003), Blume, Müller and Voigt (2009), and Rockey (2012),
among many others.
3. Openness, State Capacity, and the Size of Government
3.1 The Compensation Hypothesis
As argued in the previous section, in spite of vibrant controversies and fine-grained discussion at
the level of micro political economy, the big picture of the compensation hypothesis connecting
openness to government size still stands. For concreteness, we focus here on the compensation
hypothesis as stated by Rodrik (1998) in order to anchor our argument on alternative policies to
deal with trade-induced economic insecurity and on the conditional effect of state capacity on the
ability to implement such policies.
Having identified a robust correlation between openness to trade and the size of the
public sector, Rodrik postulates that the main reason for that connection is “compensation” for
higher risk exposure. In his view, more open economies have a greater exposure to risk from the
turbulence of world markets, and government spending serves an insulation function. 7 He
considers the government sector as the “safe” sector of the economy, especially compared to
tradables; hence, the government can mitigate the shocks from international markets by taking
command of a larger share of the economy’s resources.
7 He observes not only that there is a positive and robust partial correlation between openness and the scope of
government, but also that the relationship between openness and government size is strongest when terms of trade
risk is higher.

7
Rodrik postulates a simple framework with three sectors: private tradables, private
nontradables, and the government. Assuming that a representative household owns streams of
income from all sectors, a higher share of (permanent) government consumption can provide
some ex ante insurance to external risk. Rodrik asks when (i.e., under what conditions) “will it
be optimal for the government to reduce risk in this fashion?” (p. 1011). Reducing risk by
enlarging the government is optimal in the stylized set-up presented by Rodrik; a key assumption
there is that the decision on how many resources to allocate to the public and to the private
sectors is made before the realization of the terms of trade shocks. Given standard assumptions
on production and utility functions and the fact that the government is the “safe asset,” in such a
set-up it is optimal to allocate more resources to the government, the higher the (trade-induced)
risk in the private sector. In this way, the model generates the correlation between openness and
spending—or more generally, the correlation between external risk (openness times terms of
trade volatility) and spending.
The set of policy instruments available in Rodrik’s framework is a rather restrictive one.
In the real world, there is a large set of potential macro, micro, and social policies that might
mitigate or alleviate the effects of external shocks, and many of them do not have obvious
budgetary implications. In terms of Rodrik’s model, some of those policy instruments might be
equivalent to allowing part of the adjustment to take place after the realization of the shock to
terms of trade; others are equivalent to finding cheaper ways to insure ex ante. Some operate at
the stage of softening the macroeconomic implication of those shocks, others at the level of
permitting more efficient and less costly microeconomic adjustment, and yet others at providing
more efficient and less costly social protection. Many of the potential policies might be relatively
demanding in terms of government capabilities, and hence not equally available to all polities.
We list below some of those possible policies and their connection to having a more capable
public sector, in particular a high-quality bureaucracy.
3.2 The Vector of Policies
A number of different macroeconomic policies have been discussed and tried as ways to cope
with various sources of macroeconomic volatility. One set of policies particularly relevant with
regards to external shocks are exchange rate policies. It is often argued that flexible exchange
rates might provide better insulation to trade shocks than fixed exchange rates. For instance,

8
Broda and Tille (2003) find, in a sample of 75 developing countries, that countries with a flexible
exchange rate tend to experience much milder contractions in output than their counterparts with
fixed exchange rate regimes. Since exchange rate choices do not map very easily into the size of
the public sector, they constitute one example of non-budgetary insulation. Also, it is possible
that instrumenting a flexible exchange rate regime in the real world requires some form of
administration that might be institutionally more demanding than a fixed regime.8 This relates to
the tendency of countries with weak institutions to choose fixed exchange rate regimes as way of
pumping up their scarce credibility (Canavan and Tommasi, 1997; Herrendorf, 1999; Keefer and
Stasavage, 2003; Bearce and Hallerberg, 2011).9
Different types of fiscal policies might also help mitigate the exposure to the risks
associated with international economic integration. For instance, well-designed fiscal rules may
alleviate the effects of terms of trade volatility by contributing to reduce procyclical fiscal
policies and related “Dutch Disease” problems (UNCTAD, 2011). But the ability to properly
implement adequate fiscal policies is not so readily available. Various studies have documented
differences in the quality of fiscal policy across countries (Gavin and Perotti, 1997; López,
Thomas and Wang, 2010; Céspedes and Velasco, 2013). Furthermore, several studies have
established that the ability to implement proper fiscal policies (and in particular, policies that
facilitate coping with shocks) is dependent upon institutional capabilities. Calderón, Duncan and
Schmidt-Hebbel (2012) find that fiscal and monetary policies tend to be significantly procyclical
in countries with weaker policymaking capabilities. Filc and Scartascini (2012) find that
countries with better implementation capabilities are able to design better fiscal frameworks.
Céspedes and Velasco (2013) find that improvements in institutional quality have led
commodity-rich countries to be more able to respond adequately to commodity price shocks.
Notice that the type of fiscal policy required is one that adjusts better to shocks, i.e., a form of ex
post “insurance” such as countercyclical funds, as opposed to blindly increasing spending as a
form of ex ante insurance.
In addition to the fiscal policy framework, the depth of financial markets can significantly
influence the way in which economies react to terms of trade volatility. In particular, higher
8 Another macroeconomic example in which government capabilities permit better adjustment to terms of trade
shocks is provided by Gelos and Ustyugova (2012), who show that countries with more independent central banks
and higher governance scores seem to have contained the impact of commodity price shocks better. 9 See Carmignani, Colombo and Tirelli (2008) for a dissenting view.

9
financial development can help mitigate the effect of terms of trade volatility on consumption
volatility (Andrews and Rees, 2009), and broader access to financing allows firms to better
manage macroeconomic volatility (Cavallo et al., 2010). In this context, higher government
capacities play an important role as they can provide deeper financial markets: Becerra, Cavallo
and Scartascini (2012) show that financial development is higher in countries with enhanced
government capabilities as, among other channels, they tend to abuse less the financial system in
order to finance government operations.
Looking at a slightly more disaggregated level, it is clear that the effects of terms of trade
shocks operate differently through different sectors of the economy. Focusing at that level, it is
clear that there are a number of horizontal and sectorial policies that have an impact on the
performance of various economic sectors, both on average, as well as in terms of how well they
respond to various shocks.10 Such industrial, financial, labor-market policies are also likely to
demand important government and bureaucratic capabilities in order to be implemented properly.
For instance, Cornick (2013) provides a detailed analysis of the government capabilities
necessary in order to implement various productive development policies. Scartascini and
Tommasi (2010) show that higher government capabilities are positively correlated with policies
that are associated with long term gains in productivity, such as less distortive tax systems and
government subsidies, a larger formal sector, higher quality infrastructure, labor market
flexibility, and ease of firm entry. The last two are described by Loayza and Raddatz (2007) as
structural characteristics that can be policy driven and can dampen the impact of negative terms
of trade shocks on aggregate output and magnify the positive ones.
Also, as argued by Mansfield and Reinhardt (2008), governments of open countries also
try to insulate their economies from the exposure to global markets volatility through
membership in international trade organizations, particularly the World Trade Organization
(WTO) and preferential trading arrangements (PTAs). Using annual data on exports for all pairs
of countries from 1951 through 2001, the authors find that PTAs and the WTO regime
significantly reduce export volatility. Once again, effective participation in such arrangements is
not likely to induce large amounts of public spending, while playing such international games
10
This relates to the notion of “transformative capacity” (Weiss, 1998) that we discuss in the next section.

10
tends to be quite demanding in terms of having a capable bureaucracy (Lecomte, 2002; Bouzas
2004, Pasadilla, 2005).11
Most of the policies mentioned so far tend to operate between the external shock and the
macro and micro economic consequences of the shock. After all of that is said and done, there
will still be social consequences of the remaining effects of external shocks. And there, again,
there are various policies to deal with that. Most of them will indeed have budgetary
implications, but one might speculate that more effective governments will obtain a better “bang
for the buck,” being able to mitigate the social costs of economic volatility more effectively and
more efficiently (i.e., at a lower cost). In terms of a model with aggregate and idiosyncratic
shocks, a more capable government will be better able to target its social policies at those times
and to those individuals that need it the most. Programs that might have such characteristics
include training programs (which also facilitate sectorial adjustment), unemployment insurance,
targeted social programs, as well as a number of health and education policies (which also might
matter for general productivity and for better microeconomic adjustment). Niles (2001) studies
the incentives and capabilities of governments to implement targeted social spending during
economic adjustment. Cingolani et al. (2013) report how bureaucratic autonomy and state
capacity allow governments to advance more rapidly in achieving development policy goals in
social sector areas. Scartascini, Stein and Tommasi (2008) report that health and education
spending are more effective in countries with better policymaking capabilities; some of their
results could be interpreted as indicating that policymaking capabilities might be more important
than money for improving education outcomes at high levels of governmental capacity.12
The examples above illustrate the fact that various policies which might allow to handle
different effects of economic shocks could be quite demanding in terms of the capabilities of
governments to implement them. Countries with low state capabilities might not be able to
deliver in some of these more demanding policies (i.e., they would not have the fiscal space ex-
post, the ability to pursue them, or be less efficient at doing so), and hence might be forced to
deal with increased volatility by blunt methods such as enlarging the state ex ante. On the other
11
According to Lecomte (2002) and Pasadilla (2005), best practices have revealed three critical elements needed to
achieve an efficient trade policy, namely government leadership, inclusion of all actors, and institutional capacity.
Institutional capacity includes, among others, the capacity to prepare technical backgrounds, research, and analysis,
and the capacity to carry out negotiations. 12
Brambor and Lindvall (2014) present evidence that countries with higher capabilities are able to pursue more
efficient fiscal and social protection policies.
11
hand, countries with high capabilities will be able to deal effectively with a wider menu, and
since some good policies not necessarily require much public spending, they might be able to
cope with the extra volatility induced by trade without necessarily increasing public spending.
What specific policies each country chooses to reduce ex ante volatility and what policies
each country pursues to reduce the social impact of external shocks will depend on the specific
characteristics of its economic and social environment and of its policymaking. Some countries
may choose to deepen financial markets and credit availability for a more efficient and automatic
adjustment of private agents, while others may prefer to concentrate their efforts on ensuring the
countercyclicality of fiscal adjustments in order to jumpstart the economy during bad times. In
every case though, those with higher government capabilities will have access to a superior
vector of policies than those with low capabilities; and the budget implications of those policies
will vary. For those reasons, in what follows we use a measure of governmental capabilities (the
quality of the bureaucracy) as a conditioning variable in the empirical exercises relating
openness and terms of trade volatility to the size of government.
4. State Capacity
The various policies that we discussed in the previous section are quite demanding in terms of
technical and political capabilities. A country with strong state capabilities might be able to draw
from the full menu and pick and successfully implement those policies that best suit the nature of
the shocks the country faces as well as its economic and social fabric. Countries with lesser
capabilities might have to deal with the risks induced by volatility in more blunt manners. For
that reason, we need to look into the governmental capabilities of each case.
The issue of government capabilities or, more broadly, of state capacity is a complex one,
and it has given rise to important analytical, measurement, and evaluation efforts, as well as
lively methodological debates.13 The concept of “state capacity” is very salient in studies of
economic development, and its presence or absence has been associated with development
successes and failures. It has many dimensions, such as coercive or military capacity, fiscal or
extractive capacity, administrative or implementation capacity, and legal capacity. 14 The
emphasis on each of its dimensions depends on the issue at hand.
13
See, for instance, the debate in the journal Governance surrounding an article by Francis Fukuyama (2013):
http://governancejournal.net/2013/03/04/fukuyama-asks-what-is-governance/. 14
See Cingolani (2013) for a very comprehensive recent survey of the concept and of its measurement.

12
The type of economic and social policy implementation capabilities we are referring to,
come closer to the notion of administrative or implementation capacity. This dimension, perhaps
the most widely referred to in the literature (Cingolani, 2013), is largely rooted in the Weberian
tradition regarding the modern state and the existence of a professional and insulated
bureaucracy. The bureaucratic/administrative dimension of state capacity has been emphasized
by classic authors such as Huntington (1968) and Skocpol (1979). Weaver and Rockman (1993)
conceive state capacities as policymaking capabilities, including the capacity to effectively
implement policies. In Knutsen (2012) state capacity is understood as the successful
implementation of public policies through and efficient rule-following bureaucracy.
The notion of capabilities we have in mind also relates to the idea of the “transformative”
capacities of states, conceived as “the ability of a state to adapt to external shocks and pressures
by generating ever-new means of governing the process of industrial change” (Weiss, 1998).
This aspect is also present in the work of Evans (1989) and (1995) who refers to embedded
autonomy, a combination of administrative insulation power and a certain level of state
embeddedness in the productive structure. According to Rueschmeyer and Evans (1995), the
effectiveness of state intervention in the economy depends upon a capable bureaucracy and good
coordination and coherence among state organizations.
The question of where does state capacity come from has also received substantial
attention. Cingolani (2013) provides a review of studies on the determinants of state capacity,
from the historical accounts of state formation processes and its impact on subsequent types of
administrative infrastructure, to the more recent emphasis on the incentives to invest in state
capacity. A common theme among these various arguments and strands is that capacity is a
multidimensional object that accumulates slowly over time, as a function of various
investments.15
Not surprisingly, the measures of state capacity found in the literature are quite varied,
some of them aiming at capturing state capacity in a broad generic way, others acknowledging
the existence of several aspects or dimensions, and trying to measure each of them. Among those
attempting to measure bureaucratic/administrative/implementation capacity, for the purpose of
this study where we need a large coverage in terms of countries and years, we rely on the
indicator of quality of the bureaucracy from the International Country Risk Guide (ICRG). The
15
See for instance Besley and Persson (2009) and Enriquez and Centeno (2012).
13
variable “bureaucratic quality” (burquality) reflects the institutional strength, quality, and
expertise of the bureaucratic structure.16 Countries that score high in this variable have the ability
to accumulate knowledge over time, to invest in the development of the workforce, and to pursue
long-term policies. Policy decisions accumulate over time and policymakers are able to learn
from previous mistakes.
ICRG’s “bureaucratic quality” has been used to measure state capacity in articles
particularly interested in administrative features of the state (Cingolani, Thomsson and de
Crombrugghe, 2013; Van de Walle, 2005; Hanson and Sigman 2013), and in studies such as this
one that attempt to capture how government capabilities affect the supply or demand of certain
types of policies (see for example Becerra, Cavallo and Scartascini, 2012). This indicator of
bureaucratic quality also correlates well with other dimensions of state capabilities that have
been shown to relate to higher quality of policymaking in smaller country samples (within Latin
America); see, for instance, Scartascini and Tommasi (2010), Scartascini, Stein, and Tommasi
(2013), and Franco Chuaire and Scartascini (2014).
5. Empirical Analysis
As stated earlier, for concreteness and easiness of the comparison, we take Rodrik’s empirical
framework as the baseline, and we add the possibility that the quality of the bureaucracy may
affect public policy. In particular, we evaluate the hypotheses of whether the connection between
openness and public spending is conditional on the level of government capabilities. While
governments with low bureaucratic capacities may have to deal with the effects of globalization
in rudimentary ways, governments with higher capabilities may be able to access a set of policies
that reduce the size of external shocks and ameliorate their consequences with a relatively low
effect on public expenditures. We do not argue in this paper about the level of government
expenditures, which depend upon a myriad of factors, but about the conditionality of the
relationship between external risk and size of the government.17
16
“High points are given to countries where the bureaucracy has the strength and expertise to govern without drastic
changes in policy or interruptions in government services. In these low-risk countries, the bureaucracy tends to be
somewhat autonomous from political pressure and to have an established mechanism for recruitment and training.
Countries that lack the cushioning effect of a strong bureaucracy receive low points because a change in government
tends to be traumatic in terms of policy formulation and day-to-day administrative functions.” (ICRG, 2009) 17
In other words, we are not implying that Paraguay would have a larger public sector than Sweden, but that both
countries would react differently to the potential negative consequences coming from unfavorable external
conditions. In the margin, a country like Sweden would be able to implement policies to reduce the possibility of

14
5.1 Specification
The basic model we test is presented in equation (1), which includes an additional term, enclosed
in brackets, to Rodrik’s (1998) baseline regression:
( ) ( ) (1)
where denotes general government final consumption in real terms as a share of GDP for
country j expressed in international prices and averaged over the period 2000-2004.18 The second
main variable of interest is openj which measures the degree of openness of economy j using the
ratio of imports plus exports to GDP, averaged over the preceding decade (1990-1999). The main
data source for these variables is the World Development Indicators from the World Bank.
Bureaucratic Quality (burquality), which comes from the International Country Risk Guide
(ICRG), takes values between 0 (low) and 4 (high) and is averaged over the preceding decade
(1990-1999). represents a set of control variables that includes the log of per capita GDP and
the log of the dependency ratio in the population and urbanization rate from the World Bank
data, and dummy variables for socialist countries, OECD members, and geographical regions.19
The set of variables is later expanded in the robustness section, as we move away from Rodrik’s
original specifications.
Since we are interested in the conditional effect, we will usually concentrate the analysis
on the marginal effect of openness on government size:
( )
(2)
While openness proxies exposure to economic volatility, estimating the effect of having
a higher exposure to external risk is more complex than looking only at openness. Equation (3)
takes this into account by adding terms of trade volatility (TOTvolatility) as a proxy for external
risk as done by Rodrik. Once more, the term in brackets reflects an addition made in this paper.
having to face an external shock and reduce the social impact of the shock if it realizes more efficiently than a
country with the state capacities of Paraguay. 18
General government final consumption expenditure includes all government expenditures for purchases of goods
and services (including compensation of employees). It also includes most expenditures on national defense and
security, but excludes government military expenditures that are part of government capital formation (WDI, 2014). 19
All the control variables except for the dummy variables are also averaged over the 1990-1999 period. See all
summary statistics in Table A1 of Appendix A.
15
( ) ( )
( )
(3)
is defined as the standard deviation of the log-differences in terms of trade for
the period 1980-1999 and all the other variables have the same meaning as in the baseline
regression. The interaction term between openness and terms of trade volatility aims to capture
that external risk depends not only on how open each country is but also on how exposed it is
because of that level of openness and the characteristics of its economy vis-à-vis the rest of the
world.20
In addition to the cross-sectional analysis, we also work with a panel for the period 1980-
2004. Following the literature, we divide this period into five sub-periods by collapsing the data
into five-year averages, which allows us to remove business cycle variations. 21 The panel
regressions are run using both fixed effects and random effects, and including and excluding
period dummies and additional controls. The core results are presented in the paper and the rest
in the appendix. The complete model specification is given by:
( ) ( ) ( ) (4)
( ) ( ) ( ) (5)
( ) ( )
( ) ( ) (
)
The dependent variable is again the share of government consumption in GDP for
country j averaged over the five-year period t ( ). The regressors include a lagged measure of
openness to international trade ( ) and bureaucratic quality ( ), and the
same controls as in the cross-country analysis. includes the regressors at the beginning of
20
Note that openness is not in logarithms in this version of the benchmark, to allow for the inclusion of terms of
trade volatility in levels both individually and in interacted with openness (Rodrik, 1998). 21
See for example Rodrik (1998), Andrews and Rees (2009), and Becerra, Cavallo and Scartascini (2012).

16
each period such as the log of real per capita GDP, log urbanization rate, and log dependency
ratio, and dummy variables for OECD members and socialist countries. and denote
country-specific and time-specific effects, respectively. We run these exercises using both fixed
and random effects and perform the respective Hausman tests to choose the appropriate model
(the fixed effects model figures are included in the text and the random effects models in
Appendix B).
5.2 Regression Results
Table 1 presents the first set of results. The dependent variable is the average of the log of
government consumption for the period 2000-2005.22 23
The independent variables use the
averages over the previous decade.24 In column 1 we replicate Rodrik’s baseline cross-country
regression for openness and we include the new terms in column 2. As it can be observed in that
column, the coefficients are statistically significant and they go in the direction that we expected.
Absent any bureaucratic capacities, openness has a large, positive and significant effect on
government consumption—similar in size to Rodrik’s findings. A 10-percentage point larger
share of total trade in GDP is associated with a 5 percent larger share of government
consumption in GDP.
22
Denoted as t-1 in the tables. 23 Using long-term averages reduces the concerns from picking up short-term fluctuations. While we have
run the regressions in a recent sample, which was chosen according to data availability, we have also
performed the same exercises in several other periods—as shown later in the paper—and in Rodrik’s
sample period (replicating the original dataset to the best of our ability), finding the same qualitative
results (even though Rodrik’s specification results tend to be stronger in the original sample period than
in more recent periods). These results are also presented in Appendix B. Consequently, our results do not
depend on the period chosen for the analysis. 24
In all the exercises reported in the paper, we use the largest possible sample of countries. In Appendix B, we
include the results for a smaller sample, which includes those countries that are thought to belong to Rodrik’s
sample according to the data sources used in his empirical analysis. Unfortunately, the final dataset used by the
author is not available and given the amount of time that has passed since the paper was first published, some of the
sources have been updated using new methodologies. Acquiring the actual data used to create the original dataset
thus proved to be difficult. However, our results are qualitatively similar, i.e., the direction and statistical
significance of the coefficients are close to those estimated and reported by Rodrik.

17
Table 1. The Effects of Openness and External Risk on Government Size,
Accounting for Government Capabilities: Cross-Section
However, countries differ in their ability to pursue policies and how to respond to higher
external risk, which is picked up in a negative (and significant) coefficient for the interaction
term between openness and bureaucratic quality. That is, openness has a positive effect, but this
effect tends to be attenuated by higher levels of bureaucratic capacities.
The marginal effect of openness on government consumption at different levels of
bureaucratic capacity is represented in Figure 1; the marginal effect of openness on government
size is high for low levels of bureaucratic quality (mimicking Rodrik’s compensation hypotheses
results) but it decreases as these capacities increase to the point of becoming insignificant. As
can be observed in the summary statistics, this effect takes place around the mean of the
distribution. In other words, openness has a positive effect on government consumption for those
(1) (2) (3) (4)
Openness (t-1) 0.0004 0.005*** -0.001 0.005
(0.001) (0.002) (0.001) (0.004)
Bureaucratic Quality (t-1) 0.174*** 0.374***
(0.058) (0.131)
Openness (t-1) x Bureaucratic Quality (t-1) -0.002*** -0.002
(0.001) (0.001)
ToT Volatil ity (t-1) -1.840* 1.011
(1.095) (2.331)
Openness (t-1) x ToT Volatil ity (t-1) 0.009 0.000
(0.013) (0.034)
Bureaucratic Quality (t-1) x ToT Volatil ity (t-1) -1.456
(1.245)
Openness (t-1) x Bureaucratic Quality (t-1) x ToT Volatil ity (t-1) -0.005
(0.017)
Observations 127 127 67 67
Adjusted R-squared 0.300 0.350 0.097 0.185
Log Government Consumption (% of GDP) 2000-05VARIABLES
Note: Other controls not shown in the table: log GDP per capita (t-1), log dependency ratio (t-1), log urbanization rate (t-1),
and dummy variables for OECD, Sub-Saharan Africa, Latin America, East Asia, and Socialist countries. t-1 corresponds to
the period 1990-99, except for ToT Volatil ity where the period 1980-99 is considered. A constant term was included in all
regressions.
Standard errors in parentheses. *** p<0.01, ** p<0.05, * p<0.1
18
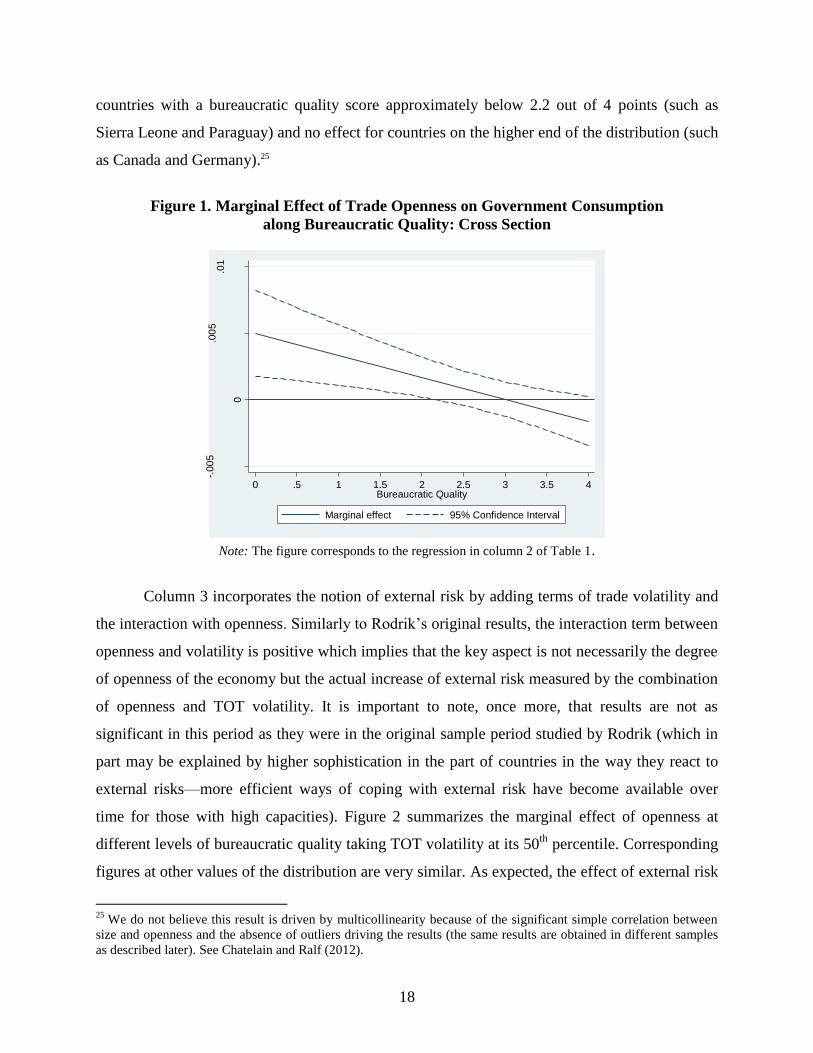
countries with a bureaucratic quality score approximately below 2.2 out of 4 points (such as
Sierra Leone and Paraguay) and no effect for countries on the higher end of the distribution (such
as Canada and Germany).25
Figure 1. Marginal Effect of Trade Openness on Government Consumption
along Bureaucratic Quality: Cross Section
Note: The figure corresponds to the regression in column 2 of Table 1.
Column 3 incorporates the notion of external risk by adding terms of trade volatility and
the interaction with openness. Similarly to Rodrik’s original results, the interaction term between
openness and volatility is positive which implies that the key aspect is not necessarily the degree
of openness of the economy but the actual increase of external risk measured by the combination
of openness and TOT volatility. It is important to note, once more, that results are not as
significant in this period as they were in the original sample period studied by Rodrik (which in
part may be explained by higher sophistication in the part of countries in the way they react to
external risks—more efficient ways of coping with external risk have become available over
time for those with high capacities). Figure 2 summarizes the marginal effect of openness at
different levels of bureaucratic quality taking TOT volatility at its 50th
percentile. Corresponding
figures at other values of the distribution are very similar. As expected, the effect of external risk
25
We do not believe this result is driven by multicollinearity because of the significant simple correlation between
size and openness and the absence of outliers driving the results (the same results are obtained in different samples
as described later). See Chatelain and Ralf (2012).
-.00
5
0
.00
5.0
1
d(lo
gcg
ov0
00
5)/
d(o
pen
90
99
)
0 .5 1 1.5 2 2.5 3 3.5 4Bureaucratic Quality
Marginal effect 95% Confidence Interval
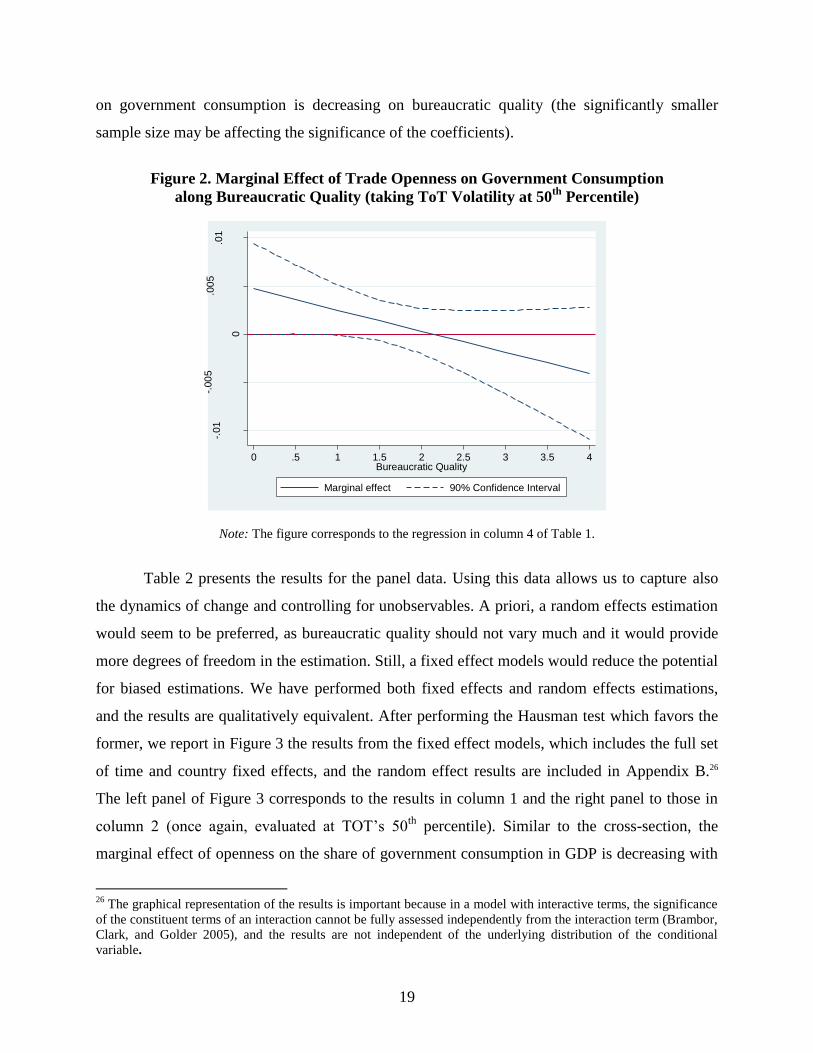
19
on government consumption is decreasing on bureaucratic quality (the significantly smaller
sample size may be affecting the significance of the coefficients).
Figure 2. Marginal Effect of Trade Openness on Government Consumption
along Bureaucratic Quality (taking ToT Volatility at 50th
Percentile)
Note: The figure corresponds to the regression in column 4 of Table 1.
Table 2 presents the results for the panel data. Using this data allows us to capture also
the dynamics of change and controlling for unobservables. A priori, a random effects estimation
would seem to be preferred, as bureaucratic quality should not vary much and it would provide
more degrees of freedom in the estimation. Still, a fixed effect models would reduce the potential
for biased estimations. We have performed both fixed effects and random effects estimations,
and the results are qualitatively equivalent. After performing the Hausman test which favors the
former, we report in Figure 3 the results from the fixed effect models, which includes the full set
of time and country fixed effects, and the random effect results are included in Appendix B.26
The left panel of Figure 3 corresponds to the results in column 1 and the right panel to those in
column 2 (once again, evaluated at TOT’s 50th
percentile). Similar to the cross-section, the
marginal effect of openness on the share of government consumption in GDP is decreasing with
26
The graphical representation of the results is important because in a model with interactive terms, the significance
of the constituent terms of an interaction cannot be fully assessed independently from the interaction term (Brambor,
Clark, and Golder 2005), and the results are not independent of the underlying distribution of the conditional
variable.
-.01
-.00
5
0
.00
5.0
1
d(lo
gcg
ov0
00
5)/
d(o
pen
90
99
)
0 .5 1 1.5 2 2.5 3 3.5 4Bureaucratic Quality
Marginal effect 90% Confidence Interval

20
bureaucratic quality and positive and significant for countries with weak bureaucracies. Hence,
past exposure to external risk is a statistically significant determinant of government size
conditional on state capacity, and this result is not purely cross-sectional; it holds within
countries even when year and country fixed effects are included as well.
Table 2. The Effects of Openness and External Risk on Government Size,
Accounting for Government Capabilities: Panel Data
(1) (2) (3) (4)
Openness (t-1) 0.004** 0.005** 0.006*** 0.007***
(0.002) (0.002) (0.001) (0.002)
ToT Volatil ity (t-1) 0.093 0.262
(0.644) (0.613)
Openness (t-1) x ToT Volatil ity (t-1) -0.011 -0.013
(0.011) (0.011)
Bureaucratic Quality (t-1) 0.075 0.086 0.140*** 0.163***
(0.046) (0.061) (0.035) (0.048)
Openness (t-1) x Bureaucratic Quality (t-1) -0.001 -0.001 -0.002*** -0.002***
(0.001) (0.001) (0.000) (0.001)
Bureaucratic Quality (t-1) x ToT Volatil ity (t-1) -0.193 -0.376
(0.376) (0.348)
Openness (t-1) x Bureaucratic Quality (t-1) x ToT
Volatil ity (t-1)0.005 0.007
(0.006) (0.006)
Hausman Test (Prob>chi2) 0.008^ 0.000^
Observations 246 246 246 246
Number of countries 67 67 67 67
VARIABLESLog Government Consumption (% of GDP)
Note: Regressions in columns 1 and 2 correspond to a Fixed Effects (within) model with time (period) dummies. Regressions in columns 3
and 4 correspond to a Random Effects model with time (period) dummies. Data are period averages for 1980-84, 1985-89,1990-94, 1995-
99, 2000-04 (except for the additional controls which belong to the beginning of each period).
Additional controls: log GDP per capita, log urbanization rate, and log dependency ratio all at the beginning of each period, and OECD and
socialism dummies. A constant term was included in all regressions.
Standard errors in parentheses. *** p<0.01, ** p<0.05, * p<0.1
^Hausman test: Ho (difference in coefficients not systematic), rejected in both cases. Therefore, the test favors the fixed effects model when
both, a single interaction term and a three-way interaction term, are included.

21
Figure 3. Marginal Effect of Trade Openness on Government Consumption
along Bureaucratic Quality: Panel Data
a. Column 1 of Table 2. b. Column 2 of Table 2 (TOT Volatility 50
th p.)
Are these effects stable over time? In order to check this we run a series of cross-sections
evaluating the dependent variable in the five-year periods 90-94, 95-99, and 00-04. As can be
observed in Table 3 and Figure 4, while we obtain the same qualitative results, the intercept and
slope of the conditional relationship change over time, particularly between the first two sub-
periods. In the 1995-99 period, the intercept (the coefficient of openness) is smaller and the slope
is shallower. This evidence may be consistent with a pattern in which there is learning and policy
diffusion, which allows more countries to pursue more efficient policies. This evidence may
serve as a first indication of why the statistical and economic significance of Rodrik’s results has
fallen over time.
-.00
5
0
.00
5.0
1
d(lo
gcg
ov)/
d(o
pe
n)
0 .5 1 1.5 2 2.5 3 3.5 4Bureaucratic Quality
Marginal effect 95% Confidence Interval
-.00
5
0
.00
5.0
1
d(lo
gcg
ov)
/d(o
pe
n)
0 .5 1 1.5 2 2.5 3 3.5 4Bureaucratic Quality
Marginal effect 95% Confidence Interval

22
Table 3. The Effects of Openness on Government Size over Time
Figure 4. Marginal Effect of Trade Openness on Government Consumption
along Bureaucratic Quality over Time
a. Column 2 of Table 3 (1985-89 − 1990-94) b. Column 4 of Table 3 (1990-94 − 1995-99)
5.3 Robustness Checks
So far we have evaluated our hypothesis in the context of Rodrik’s framework in order to
facilitate comparisons. However, as surveyed in Section 2, Rodrik’s results have been widely
revisited and concerns have been raised about the omission of relevant variables that may be
affecting the discussed relationship between openness and government size such as population
size and democratic institutions. Moreover, the broad literature on the size of the government has
1990-94 1990-94 1995-99 1995-99 2000-04 2000-04
Openness (t-1) 0.001 0.008*** 0.000 0.004*** 0.000 0.004*
(0.001) (0.002) (0.001) (0.001) (0.001) (0.002)
Bureaucratic Quality (t-1) 0.261*** 0.176*** 0.160**
(0.052) (0.057) (0.078)
Openness (t-1) x Bureaucratic Quality (t-1) -0.003*** -0.002*** -0.001*
(0.001) (0.001) (0.001)
Observations 103 103 103 103 103 103
Adjusted R-squared 0.342 0.493 0.345 0.421 0.318 0.353
Standard errors in parentheses. *** p<0.01, ** p<0.05, * p<0.1
Log Government Consumption (% of GDP) for the period:
Data are period averages for 1990-94, 1995-99, 2000-04, for the dependent variable (in t), and 1985-89, 1990-94, 1995-
99, for the independent variables in (t-1); except for the controls which belong to the beginning of each period.
Additional controls: log GDP per capita, log urbanization rate, and log dependency ratio all at the beginning of each
period, and dummy variables for OECD, Sub-Saharan Africa, Latin America, East Asia, and Socialist countries.
VARIABLES
23
established effects of constitutional rules on the size of government: presidential systems have
been found to lead to smaller governments while proportional representation systems (compared
to majoritarian systems) lead to larger governments.27 As a first robustness check we test our
hypothesis in the context of an expanded set of controls to avoid omitted variable biases.
Furthermore, the inclusion of our variable of interest, namely bureaucratic quality, may
raise a potential concern regarding causation and biases due to endogeneity. Could causality be
running from government size to quality of the bureaucracy? Even though it is not immediately
clear why this would be generating the previous set of results, we use an instrumental variables
approach in order to reduce this concern.
5.3.1 Expanded Controls
Table 4 presents the same exercises as in Table 1 using a set of expanded controls that includes
population size (log population), the freedom house score (GASTIL) on political rights and civil
liberties, average effective tariffs (tariff rate) given by the percentage of total import duties as a
share of the total value of imports, a dummy variable equal to 1 when the form of government is
presidential (pres) and 0 otherwise, and a dummy variable that is equal to 1 when the electoral
rule for the lower or only house is majoritarian (maj).28 As can be observed in the table, including
additional controls does not change the direction of the results. Again, the marginal effect of
openness (or exposure to external risk) on government consumption seems to be lower for
countries with higher bureaucratic capacities. Figure 5 presents this information graphically
showing that the positive effect of openness seems to be relevant only for low levels of capacities
(when the quality of bureaucracy is approximately below 2 out of 4 points). Similar results are
found when we look at the three-way interaction term even though these results are less precise
because of sample issues (including additional controls reduces the sample size substantially).
27
See, in particular, Persson, Roland and Tabellini (1997 and 2000) and Persson and Tabellini (2003). 28
We also run the same exercises including a dummy variable for countries with a federal structure. However, this
variable presents several problems such as the reduction of our sample size. After including it, the marginal effect of
openness on government size remains decreasing with bureaucratic quality and positive for low scores of the latter.
However, the results are not as significant as before.
24
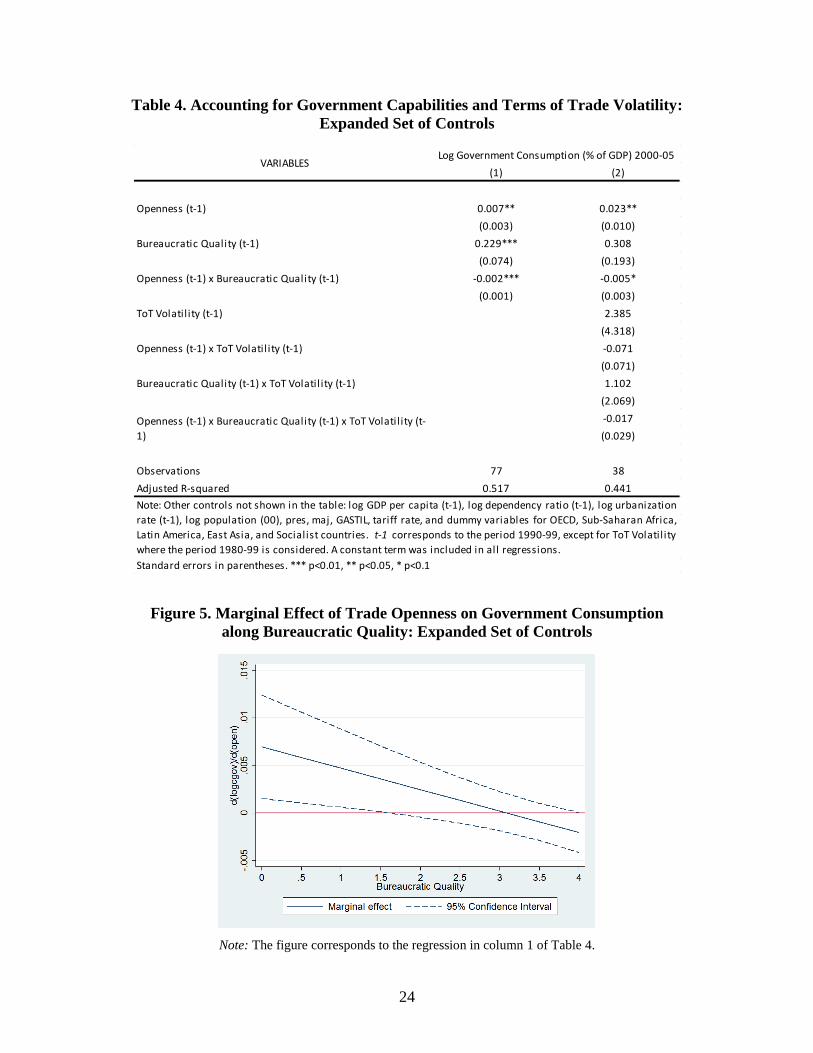
Table 4. Accounting for Government Capabilities and Terms of Trade Volatility:
Expanded Set of Controls
Figure 5. Marginal Effect of Trade Openness on Government Consumption
along Bureaucratic Quality: Expanded Set of Controls
Note: The figure corresponds to the regression in column 1 of Table 4.
(1) (2)
Openness (t-1) 0.007** 0.023**
(0.003) (0.010)
Bureaucratic Quality (t-1) 0.229*** 0.308
(0.074) (0.193)
Openness (t-1) x Bureaucratic Quality (t-1) -0.002*** -0.005*
(0.001) (0.003)
ToT Volatil ity (t-1) 2.385
(4.318)
Openness (t-1) x ToT Volatil ity (t-1) -0.071
(0.071)
Bureaucratic Quality (t-1) x ToT Volatil ity (t-1) 1.102
(2.069)
-0.017
(0.029)
Observations 77 38
Adjusted R-squared 0.517 0.441
VARIABLESLog Government Consumption (% of GDP) 2000-05
Openness (t-1) x Bureaucratic Quality (t-1) x ToT Volatil ity (t-
1)
Note: Other controls not shown in the table: log GDP per capita (t-1), log dependency ratio (t-1), log urbanization
rate (t-1), log population (00), pres, maj, GASTIL, tariff rate, and dummy variables for OECD, Sub-Saharan Africa,
Latin America, East Asia, and Socialist countries. t-1 corresponds to the period 1990-99, except for ToT Volatil ity
where the period 1980-99 is considered. A constant term was included in all regressions.
Standard errors in parentheses. *** p<0.01, ** p<0.05, * p<0.1

25
5.3.2 Instrumenting for Bureaucratic Quality
To address potential reverse causality problems between bureaucratic quality and size of the
government, we use an instrumental variables approach. Finding good instruments for
bureaucratic quality is not an easy task as the process of institutionalization of the bureaucracy
has not been an issue that has received much attention; most of the literature has concentrated
instead on the consequences of having professional and independent bureaucracies, and on the
legal framework that would seem to favor it. Given that bureaucratic capacity is not a feature that
can be built overnight but it depends on a series of investments done by the polity overtime on a
third-party that would help to enforce commitments and long-standing rules, it seems natural to
use variables that proxy for the stability of the political system and democratic heritage.29 Among
those, the variables that have been used by other authors in regressions that have size of
government as a dependent variable seem to be the safer bet for complying with the exclusion
restriction.
A first set of potential instrument variables includes age of democracy (age) and its
square, and a dummy variable for former colonies (ex-colony); see Persson and Tabellini (2003)
and Rockey (2012). The idea behind these instruments is that they allow isolating institutional
decisions that may be more conducive to investing in the bureaucracy from those that may
influence investments and consumption at the same time (e.g., preferences). Colonized countries
were likely to inherit institutions similar to those of their colonial rulers; therefore, these
institutional choices are not endogenous to national preferences that may drive expenditures at
the same time Rockey (2012: 315). Constitutional reforms are often adopted during political
regime transitions, and the contents tend to depend on the timing of constitutional adoption (i.e.,
fads), so there is little reason to expect a systematic effect on fiscal performance (Persson and
Tabellini 2003: 130).30 Including age^2 as well as age provides a parsimonious way to capture
any non-linearities in the history of constitutional fashion (Rockey, 2012: p. 314). Rockey (2012)
has improved upon the proxy for age of democracy by constructing two additional measures: the
date of first democratic elections (me) and the date of first democratic constitutions (mc). These
variables help to differentiate better formal democracies from working democracies. The
different measures of democratic history have an additional potential (and probably more
29
See for instance Besley and Persson (2009) and Enriquez and Centeno (2012). 30
Palanza, Scartascini and Tommasi (2014) find a positive correlation between age of democracy and the
institutionalization of Congress, which provides additional support for using these variables in this fashion.

26
relevant) channel of influence over bureaucratic quality, which is that they would allow the
polity to invest on the development of institutions over time that continuous political regime
change would weaken—which would not necessarily correlate to government size. A measure of
political stability could be another proxy for this ability to invest in the institutionalization of the
bureaucracy that should not be related to the size of the government.31 Additionally, we use, as
many before us have done, the measure of European settler mortality during colonization by
Acemoglu, Johnson and Robinson (2001), as a source of exogenous variation in state capacity.
The authors argue that colonization strategies, which relied on different types of institutions,
were influenced by the feasibility of settlements. In places where disease was more likely,
European powers set up more extractive states that favored a weaker system of checks and
balances and protection for private property.
Another potential instrument comes from Cruz and Keefer (2013). According to the
authors, when politicians are bound together by the existence of programmatic parties, they are
more likely to develop organizational arrangements that limit free-riding and promote collective
action, such as those reforms that promote a well-functioning public administration. Therefore,
because public sector reforms are more likely to succeed in countries with programmatic
political parties (Cruz and Keefer, 2013), the characteristics of the party system—which should
not be significantly correlated with public spending—can be a good instrument for the quality of
the bureaucracy. To create the relevant variable we follow Cruz and Keefer (2013).32
Finally, we also use several variables from the Comparative Constitutions Project, CCP
(Elkins, Ginsburg and Melton, 2008) that can explain bureaucratic quality while meeting the
exclusion restriction. First, we use the variable civil to measure whether the constitution of a
given country includes provisions for the meritocratic recruitment of civil servants. We would
expect these provisions to be positively correlated to bureaucratic quality and to affect
government consumption only through its effect on the instrumented variable. Second, countries
in which politicians invest in the development of the bureaucracy tend to be countries in which
there are similar investments made in other third party enforcement mechanisms. Consequently,
those countries that vest legislatures with oversight powers and insure the judiciary from
31
See Besley and Persson (2009). 32
We create a variable that measures the share of parties (from the largest three government parties and the largest
opposition party) that is identified as having right, left, or center orientation (rlc_avg) using data from the Database
of Political Institutions, DPI (Beck et al., 2001).

27
manipulation from the executive tend also to invest in stronger bureaucracies. We use the
variable intexec to measure whether the legislature has the power to interpellate members of
the executive or if the executive must report to the legislature at regular intervals,33 and the
variable jundind reports whether the constitution contains an explicit declaration regarding
the independence of the central judicial organs (Elkins, Ginsburg and Melton, 2008).
Finding a strong instrument for the quality of the bureaucracy has proven to be difficult.
Although the second stage results are similar for all the instruments considered in this analysis,
those that perform better in the first stage are Rockey’s me, which records the number of months
since the inception of democracy as measured by the date of first democratic elections, and civil
from the CCP, which measures the existence of meritocratic conditions for the recruitment of
civil workers.34 For the former, we use both me and me squared. We also follow Rockey (2012)
and use Fuller’s modified limited-information maximum likelihood estimator, which performs
better than 2SLS in the presence of weak instruments and has good finite sample properties.
Table 5 presents the second stage results of the instrumental variables approach, and Figure 6
plots the marginal effect of interest for different levels of bureaucratic quality. 35 Again, the
marginal effect of openness on government size turns out to be positive and significant for low
levels of quality of policymaking but decreasing as the latter increases. The results do not change
across specifications.
33
In the CCP (Elkin, Ginsburg and Melton, 2008) Intexec is equal to 1 if the legislature can call the executive to
report as it sees fit; 2 if the executive must report to legislature at regular intervals; 3 if both; and 4 if neither applies.
We have built a variable that ranges from 0 to 2, where 2 indicates that both conditions apply, 1 that only one
applies, and 0 that neither is stipulated in the constitution. 34
Note that our sample size decreases significantly when civil is used as the instrumental variable. 35
See Table A2 in Appendix A for the first-stage results. In Appendix B, we also present the first and second stage
results when the other instruments are used.

28
Table 5. Instrumental Variables (Second Stage): Fuller Estimator
Figure 6. Marginal Effect of Trade Openness on Government Consumption
along Bureaucratic Quality: Instrumental Variables
a. Column 5 of Table 5: me & me^2 b. Column 6 of Table 5: civil
6. Concluding Remarks
A well-known hypothesis in international political economy argues that government spending
acts as a cushion against external risk volatility for countries with high exposures to international
trade. We argue that the ability of different countries to properly deal with various risks and
uncertainties introduced by the volatility of international markets is conditioned by their
governmental capabilities. Some countries might develop more effective ways to cope with
(1) (2) (3) (4) (5) (6)
Openness (t-1) 0.007* 0.009*** 0.008*** 0.007* 0.011** 0.019***
(0.004) (0.003) (0.003) (0.004) (0.005) (0.004)
Bureaucratic Quality (t-1) 0.128 0.255** 0.119 0.091 0.179 0.314***
(0.110) (0.102) (0.111) (0.112) (0.110) (0.073)
Openness (t-1) x Bureaucratic Quality (t-1) -0.002*** -0.003*** -0.002*** -0.002* -0.003*** -0.005***
(0.001) (0.001) (0.001) (0.001) (0.001) (0.001)
Expanded Controls No No No Yes Yes Yes
Excluded Instruments me, me*opennessme, me*openness,
me^2, me^2*opennesscivil , civil*openness me, me*openness
me, me*openness,
me^2, me^2*opennesscivil , civil*openness
Observations 86 86 52 77 77 34
Adjusted R-squared 0.472 0.510 0.304 0.476 0.450 0.753
Robust s tandard errors in parentheses . *** p<0.01, ** p<0.05, * p<0.1
Log Government Consumption (% of GDP) 2000-05
Ful ler(4) estimator.
Note: Other controls not shown in the table: log GDP per capita (t-1), log dependency ratio (t-1), log urbanization rate (t-1) and dummy variables for OECD, Sub-Saharan Africa , Latin America,
East As ia , and Socia l i s t countries . Expanded set of controls : log population (00), GASTIL, pres , maj, and tari ff rate. t-1 corresponds to the period 1990-99. A constant term was included in a l l
regress ions .
VARIABLES
-.00
5
0
.00
5.0
1.0
15
.02
d(g
ovexp
)/d
(op
en)
0 1 2 3 4Bureaucratic Quality
Note: 95% Confidence Interval
-.01
0
.01
.02
.03
d(g
ovexp
)/d
(op
en)
0 1 2 3 4Bureaucratic Quality
Note: 95% Confidence Interval

29
economic volatility, ways that do not necessarily require important increases in public spending.
While some countries have very few policy alternatives at their disposal, others can make use of
better fiscal, financial, and monetary policies to reduce exposure to shocks, and better labor,
financial, industrial, and social policies to reduce the impact of the shock. Of course, this does
not imply that these countries would have a smaller government overall, but that their larger size
would not be a consequence of exposure to external risk but to a myriad of other factors.
In this paper we revisit the results connecting openness to international trade to the size
of public spending, and find that there is a positive connection only for countries with weak
government capabilities. In general, we find that the relevance of the compensation hypothesis
for explaining the size of the government is conditional on the government capabilities of a
country. The marginal increase of government size because of higher exposure to external risk
takes place only in those countries with low bureaucratic capabilities and it tends to disappear for
those countries that have a stronger bureaucracy. This result holds in the cross-section, panel,
and instrumental variables regressions, and across different samples. The result is also robust to
different specifications.
This finding constitutes another step in an agenda attempting to build bridges between the
study of institutions and policymaking in contexts of both high and low institutionalization, as
well as contexts of high and low government capabilities. The results suggest various areas in
which further research seems warranted. It would be desirable to develop a broader class of
theoretical models that incorporate the relevance of government (and bureaucratic capabilities)
for the policy choice set in the context of external risk.
On the empirical side, the exercise we have performed in this paper is only one out of
many. As government capabilities affect the vector of policies countries are able to choose from,
its relevance goes beyond the specific confines of the relationship between openness and size.
Additionally, the measures of capabilities we have used in this paper were those that we could
construct from readily available data, but there is ample room to improve upon our definitions
and to develop richer, broader, and more accurate measures. Those measures may also help to
run models that help to understand how capabilities relate to specific policy choices within the
vector of policies discussed here—that is, not only that some countries choose superior vectors
of policies but also to identify the composition within those vectors.
30
We also believe that deeper studies of experiences at the country level should be
developed. The study of specific dynamics of specific policies in specific countries seems to be a
prerequisite for understanding the mechanisms through which government capabilities affect the
design and implementation of public policies, and hence social welfare.
The findings in the paper offer additional insights into the relevance of increasing
government capabilities. Such governmental capabilities do not evolve overnight, and they
cannot be constructed by fiat by writing an institutional reform law. They are the outcome of
actions of key political players over time, in the context of country-specific political equilibria.
Still, there are plenty of investments that can be pursued that may lead to better-functioning
bureaucracies and more efficient policies.
31
References
Acemoglu, D., S. Johnson, and J. Robinson. 2001. “The Colonial Origins of Comparative
Development: An Empirical Investigation.” American Economic Review 91(5): 1369-
1401.
Adserà, A., and C. Boix. 2002. “Trade, Democracy, and the Size of the Public Sector: The
Political Underpinnings of Openness.” International Organization 56: 229-262.
Alesina, A., and R. Wacziarg. 1998. “Openness, Country Size and Government.” Journal of
Public Economics 69: 305-321.
Andrews, D., and D. Rees. 2009. “Macroeconomic Volatility and Terms of Trade Shocks.”
Working Paper 2009-05. Sydney, Australia: Reserve Bank of Australia.
Avelino, G., D.S. Brown and W. Hunter. 2001. “Globalization, Democracy, and Social Spending
in Latin America, 1980-1997.” Mimeographed document. Available at:
http://www.colorado.edu/ibs/pec/gadconf/papers/avelino_brown_hunter.pdf
----. 2005. “The Effects of Capital Mobility, Trade Openness, and Democracy on Social
Spending in Latin America, 1980-1999.” American Journal of Political Science 49: 625-
641.
Baker, A. 2008. “Public Opinion and the Compensation Hypothesis.” Boulder, United States:
University of Colorado at Boulder, Department of Political Science. Available at:
https://ncgg.princeton.edu/IPES/2008/papers/F13_paper3.pdf
Balcells, L. 2006. “Trade Openness and Preferences for Redistribution: A Cross-National
Assessment of the Compensation Hypothesis.” Business and Politics 8: 1-50.
Bates, R.H., P. Brock and J. Tiefenthaler. 1991. “Risk and Trade Regimes: Another
Exploration.” International Organization 45(1): 1-18.
Bearce, D., and M. Hallerberg. 2011. “Democracy and de Facto Exchange Rate Regimes.”
Economics & Politics 23(2): 172-194.
Becerra, O., E. Cavallo and C. Scartascini. 2012. “The Politics of Financial Development: The
Role of Interest Groups and Government Capabilities.” Journal of Banking & Finance
36: 626-643
Beck, T. et al. 2001. “New Tools in Comparative Political Economy: The Database of Political
Institutions.” World Bank Economic Review 15(1): 165-176.
32
Besley, T., and T. Persson. 2009. “The Origins of State Capacity: Property Rights, Taxation, and
Politics.” American Economic Review 99(4):1218-1244.
Blume, L., J. Müller and S. Voigt. 2009. “The Economic Effects of Direct Democracy: A Frst
Global Assessment.” Public Choice 140(3-4): 431–461.
Bouzas, R. 2004. “Mercosur’s Experiences of Preparing Trade Negotiations with the
EU.” ECDPM Discussion Paper 50. Maastricht, The Netherlands: European Centre for
Development Policy Management. Available at: http://ecdpm.org/wp-content/uploads/2013/11/DP-
50-MERCOSUR-Experiences-Preparing-Trade-Negotiations-With-EU-2004.pdf
Brambor, T., W. Clark and M. Golder. 2005. “Understanding Interaction Models: Improving
Empirical Analyses.” Political Analysis 14(1): 63-82.
Brambor, T., and J. Lindvall. 2014. “Fiscal Capacity, Domestic Compensation, and Trade Policy:
A Long Term View.” Lund, Sweden: Lund University. Mimeographed document.
Broda, C., and C. Tille. 2003. “Coping with Terms-of-Trade Shocks in Developing Countries.”
Current Issues in Economics and Finance 9(11). New York, United States: Federal
Reserve Bank of New York. http://www.newyorkfed.org/research/current_issues/ci9-11.pdf
Burgoon, B. 2001. “Globalization and Welfare Compensation: Disentangling the Ties that Bind.”
International Organization 55(3): 509-551
Calderón, C., R. Duncan, and K. Schmidt-Hebbel. 2012. “Do Good Institutions Promote
Counter-Cyclical Macroeconomic Policies?” Working Paper 118. Dallas, United States:
Federal Reserve Bank of Dallas, Globalization and Monetary Policy Institute.
Cameron, D.R. 1978. The expansion of the public economy. American Political Science Review
72: 1243-1261.
Canavan, C., and M. Tommasi. 1997. “On the Credibility of Alternative Exchange-Rate
Regimes.” Journal of Development Economics 54 (1):101–22.
Carmignani, F., E. Colombo and P. Tirelli, P. 2008. “Exploring Different Views of Exchange
Rate Regime Choice.” Journal of International Money and Finance, 27(7): 1177-1197.
Caruso, G., C. Scartascini and M. Tommasi. 2013. “Are We All Playing the Same Game? The
Economic Effects of Constitutions Depend on the Degree of Institutionalization.”
Working Paper IDB-WP-237. Washington, DC, United States: Inter-American
Development Bank.

33
Cavallo, E. et al. 2010. “The Role of Relative Price Volatility in the Efficiency of Investment
Allocation.” Working Paper IDB-WP-208. Washington, DC, United States: Inter-
American Development Bank.
Céspedes, F., and A. Velasco. 2013. “Was This Time Different? Fiscal Policy in Commodity
Republics.” NBER Working Paper 19748. Cambridge, United States: National Bureau of
Economic Research.
Chatelain, J-B., and K. Ralf. 2012. “Spurious Regressions and Near-Multicollinearity, with an
Application to Aid, Policies and Growth.” MPRA Paper 42533. Available online at
http://mpra.ub.uni-muenchen.de/42533/
Cingolani, L. 2013. “The State of State Capacity: A Review of Concepts, Evidence, and
Measures.” UNU-MERIT Working Paper 2013-053. Maastricht, The Netherlands: United
Nations University-Maastricht Economic and Social Research Institute on Innovation and
Technology.
Cingolani, L., K. Thomsson and D. de Crombrugghe. 2013. “Minding Weber More than Ever?
The Impacts of State Capacity and Bureaucratic Autonomy on Development Goals.”
UNU-MERIT Working Paper 2013-052. Maastricht, The Netherlands: United Nations
University-Maastricht Economic and Social Research Institute on Innovation and
Technology.
Cornick, J. 2013. “Public Sector Capabilities and Organization for Successful PDPs.”
Washington, DC, United States: Inter-American Development Bank. Mimeographed
document.
Cruz, C., and P. Keefer. 2013. “The Organization of Political Parties and the Politics of
Bureaucratic Reform.” Policy Research Working Paper 6686. Washington, DC, United
States: World Bank.
Elkins, Z., T. Ginsburg and J. Melton. 2014. “Characteristics of National Constitutions, Version
2.0.” Comparative Constitutions Project. Last modified: April 18, 2014. Available at:
http://www.comparativeconstitutionsproject.org.
Enriquez, E., and M. Centeno. 2012. “State Capacity: Utilization, Durability, and the Role of
Wealth vs. History.” International and Multidisciplinary Journal of Social Sciences 1(2):
130-162
34
Epifani, P., and G. Gancia. 2009. “Openness, Government Size and the Terms of Trade.” Review
of Economic Studies 76, 629-668.
Erauskin, I. 2011. “Financial Openness, Volatility, and the Size of Productive Government.”
SERIEs 2(2): 233-253.
Evans, P.B. 1989. “Predatory, Developmental, and Other Apparatuses: A Comparative Political
Economy Perspective on the Third World State.” Sociological Forum 4(4): 561-587.
Evans, P.B. 1995. Embedded Autonomy. Princeton, United States: Princeton University Press.
Filc, G., and C. Scartascini. 2012. “Budgeting for Results in Latin America: Conditions for its
Deployment and Development.” Policy Brief IDB-PB-160. Washington, DC, United
States: Inter-American Development Bank.
Franco Chuaire, M., and C. Scartascini. 2014. “The Politics of Policies: Revisiting the Quality of
Public Policies and Government Capabilities in Latin America and the Caribbean.”
Policy Brief IDB-PB-220. Washington, DC, United States: Inter-American Development
Bank.
Fukuyama, F. 2013. “What is Governance?” Governance 26(3): 347-368.
Garrett, G., 1998a. “Shrinking States? Globalization and Policy Autonomy in the OECD.”
Oxford Development Studies 26(1): 71-97.
Garrett, G., 1998b. “Global Markets and National Politics: Collision Course or Virtuous Circle?”
International Organization 52(4) 787–824
Garrett, G. 2001. “Globalization and Government Spending around the World.” Studies in
Comparative International Development 3: 3-29.
Garrett, G. and D. Nickerson., 2005. “Globalisation, Democratization and Government Spending
in Middle-Income Countries.” In: M. Glatzer and D. Rueschemeyer, editors.
Globalization and the Future of the Welfare State. Pittsburgh, United States: University
of Pittsburgh Press.
Gavin, M. and R. Perotti. 1997. “Fiscal Policy in Latin America.” In: B.S. Bernanke and J.
Rotemberg, editors. NBER Macroeconomics Annual 12. Cambridge, United States: MIT
Press.
Gelos, G., and Y. Ustyugova. 2012. “Inflation Responses to Commodity Price Shocks: How and
Why Do Countries Differ?” IMF Working Paper 12/225. Washington, DC, United States:
International Monetary Fund.

35
Gemmell, N., R. Kneller and I. Sanz. 2008. “Foreign Investment, International Trade and the
Size and Structure of Public Expenditures.” European Journal of Political Economy 24:
151-171.
Hanson, J., and R. Sigman. 2013. “Leviathan’s Latent Dimensions: Measuring State Capacity for
Comparative Political Research.” Paper presented at the World Bank Political Economy
Brown Bag Lunch Series, March 21, 2013, Syracuse University, Maxwell School of
Government.
Hays, S., D. Ehrlich and C. Peinhard. 2005. “Government Spending and Public Support for
Trade in the OECD: An Empirical Test of the Embedded Liberalism Thesis.”
International Organization 59: 473-494.
Herrendorf, B. 1999. “Transparency, Reputation, and Credibility under Floating and
Pegged Exchange Rates.” Journal of International Economics 49(1): 31–50.
Huntington, S. 1968. Political Order in Changing Societies. New Haven, United States: Yale
University Press.
ICRG. 2009. “International Country Risk Guide (ICRG) Researchers’ Dataset and Codebook.”
[computer file]. 2009 ed. East Syracuse, NY: The PRS Group, Inc.
Katzenstein, P.J. 1985. Small States in World Markets: Industrial Policy in Europe. Ithaca,
United States: Cornell University Press.
Keefer, P., and D. Stasavage. 2013. “The Limits of Delegation: Veto Players, Central Bank
Independence, and the Credibility of Monetary Policy.”American Political Science
Review 97(3): 407-23.
Kimakova, A. 2009. “Government Size and Openness Revisited: The Case of Financial
Globalization.” Kyklos 62: 394-406.
Kittel, B., and H. Winner. 2005. “How Reliable is Pooled Analysis in Political Economy? The
Globalization-Welfare State Nexus Revisited. European Journal of Political Research
44: 269-293.
Knutsen, C.H. 2013. “Democracy, State Capacity, and Economic Growth.” World Development
43: 1-18.
Lecomte, H.B.S. 2002. “Building Capacity to Trade: What are the Priorities?” Paper presented at
the International CTA Seminar 2002: “Meeting the Challenge of Effective ACP
36
Participation in Agricultural Trade Negotiations: The Role of ICM,” Brussels, Belgium,
November 27-29.
Liberati, P. 2007. “Trade Openness, Capital Openness and Government Size.” Journal of Public
Policy 27: 215-247.
Loayza, N., and C. Raddatz. 2007. “The Structural Determinants of External Vulnerability.”
World Bank Economic Review 21(3): 359-387.
López, R.E., V. Thomas and Y. Wang. 2010. “The Effect of Fiscal Policies on the Quality of
Growth.” Evaluation Brief 9. Washington, DC, United States: World Bank Independent
Evaluation Group. Available at: http://ieg.worldbank.org/Data/reports/eb9_web.pdf
Mansfield, E., and E. Reinhardt. 2008. “International Institutions and the Volatility of
International Trade.” International Organization 62(4): 621-652.
Mares, I. 2004. “Economic Insecurity and Social Policy Expansion: Evidence from Interwar
Europe.” International Organization 58(4): 745-774.
----. 2005. “Social Protection Around the World. External Insecurity, State Capacity, and
Domestic Political Cleavages.” Comparative Political Studies 38(6): 623-651.
Martin, C., and N. Steiner 2013. “Public Spending and Trade Liberalization: The Compensation
Hypothesis Revisited.” Paper prepared for presentation at the 71st Midwest Political
Science Association (MPSA) Annual Conference, Chicago, United States, April 11-14.
Milesi-Ferreti, G.M., R. Perotti and M. Rostagno. 2002. “Electoral Systems and Public
Spending.” Quarterly Journal of Economics 127: 609-57.
Mueller, D. 2003. Public Choice III. Cambridge, United Kingdom: Cambridge University Press.
Niles, K. 2001. “Economic Adjustment and Targeted Social Spending.” Paper prepared for the
World Development Report 2001 meetings, August 16-17, Castle Donington, United
Kingdom.
Noorruddin, I., and N. Rudra. 2014. “Are Developing Countries Really Defying the Embedded
Liberalism Compact?” Forthcoming in World Politics 66(4).
Palanza, V., C. Scartascini and M. Tommasi. 2014. “Congressional Institutionalization: A
Cross-National Comparison.” Washington, DC, United States: Inter-American
Development Bank. Mimeographed document.
37
Pasadilla, G. 2005. “Strengthening Trade Research Capacity for Policymaking and
Negotiations.” ARNeT Policy Brief 2. Bangkok, Thailand: United Nations Economic
and Social Commission for Asia and the Pacific. Available at:
http://artnet.unescap.org/pub/polbrief2.pdf
Persson, T., G. Roland and G. Tabellini. 1997. “Separation of Powers and Political
Accountability.” Quarterly Journal of Economics 112(4): 1163-1202.
Persson, T., G. Roland, and G. Tabellini. 2000. “Comparative Politics and Public Finance.”
Journal of Political Economy 108: 1121-1141.
Persson, T., and G. Tabellini. 2003. The Economic Effects of Constitutions. Cambridge, United
States: MIT Press.
Ram, R. 2009. “Openness, Country Size, and Government Size: Additional Evidence from a
Large Cross-Country Panel. Journal of Public Economics 93: 213-218.
Rehm, P. 2009. “Risks and Redistribution: An Individual-Level Analysis.” Comparative
Political Studies 42(7): 855-881.
Rockey, J. 2012. “Reconsidering the Fiscal Effects of Constitutions.” European Journal of
Political Economy 28: 313–323.
Rodrik, D. 1998. “Why Do More Open Economies Have Bigger Governments?” Journal of
Political Economy 106: 997-1032.
Rueschemeyer, D., and P. Evans. 1985. “The State and Economic Transformation: Toward an
Analysis of the Conditions Underlying Effective Intervention.” In: P.B. Evans, D.
Rueschemayer and T. Skocpol, editors. Bringing the State Back In. Cambridge, United
Kindgom: Cambridge University Press.
Scartascini, C., E. Stein and M. Tommasi. 2008. “Political Institutions, State Capabilities and
Public Policy: International Evidence.” Research Department Working Paper 661.
Washington, DC, United States: Inter-American Development Bank.
----. 2013. “Political Institutions, Intertemporal Cooperation, and the Quality of Policies.”
Journal of Applied Economics 16(1): 1-32.
Scartascini, C., and M. Tommasi. 2010. “The Political Economy of Productivity.” In: C. Pagés,
editor. The Age of Productivity. Development in the Americas Report. Washington, DC,
United States: Inter-American Development Bank/Palgrave.

38
----. 2012. “The Making of Policy: Institutionalized or Not?” American Journal of Political
Science 56(4): 787-801.
Scheve, K. and M. Slaughter. 2007. “A New Deal for Globalization.” Foreign Affairs 86(4): 34-
47.
Skocpol, T. 1979. States and Social Revolutions: A Comparative Analysis of France, Russia, and
China. Cambridge, United Kingdom: Cambridge University Press.
UNCTAD. 2011. “Policy actions to mitigate the impact of highly volatile prices and incomes on
commodity-dependent countries, and to facilitate value addition and greater participation
in commodity value chains by commodity-producing countries.” Note by the United
Nations Conference on Trade and Development (UNCTAD) secretariat, Geneva,
Switzerland, February 2. Available at: http://unctad.org/en/docs/cimem2d14_en.pdf
Van de Walle, S. 2005. “Measuring Bureaucratic Quality in Governance Indicators.” Paper
prepared for the 8th Public Management Research Conference, Los Angeles, United
States, September 29-October 1.
Walter, S. 2010. “Globalization and the Welfare State: Testing the Microfoundations of the
Compensation Hypothesis.” International Studies Quarterly 54(2): 403-26.
Weaver, R.K., and B.A. Rockman. 1993. Do Institutions Matter? Government Capabilities in the
United States and Abroad. Washington, DC, United States: Brookings Institution Press.
Weiss, L. 1998. The Myth of the Powerless State. Ithaca, United States: Cornell University Press.
World Development Indicators (WDI). 2014. Washington, DC: World Bank.
doi:10.1596/978-1-4648-0163-1. License: Creative Commons Attribution CC BY 3.0
IGO.

39
APPENDIX A.
Table A1. Summary Statistics
Variable Units Source Obs. MeanStd.
deviationMin Max
Cross section analysis
Government consumption (1985-89) % of GDP WDI 115 16.610 6.624 4.282 34.930
Government consumption (1990-92) % of GDP WDI 118 16.284 7.503 3.144 56.840
Government consumption (2000-05) % of GDP WDI 127 15.363 5.119 5.082 28.523
Openness (1975-84) % of GDP WDI 116 65.777 34.849 13.888 156.739
Openness (1980-89) % of GDP WDI 119 64.669 33.453 13.967 163.867
Openness (1990-99) % of GDP WDI 127 76.350 46.770 17.218 329.366
Terms of Trade (ToT) Volatil ity (1980-99)
Standard deviation of the log-
differences in terms of trade
for the period 1980-99
WDI and own estimates 67 0.118 0.060 0.018 0.262
Bureaucratic Quality Index (1990-99) 0-4 ICRG 127 2.217 1.096 0 4
Instrumental variables
Age of democracy (age) Persson and Tabellini (2003) 64 2.181 2.433 0 10
European settler mortality (log) (Settler mort.) log total Acemoglu et al. (2001) 62 4.594 1.213 2.146 7.986
Ex-colony Dummy variable Persson and Tabellini (2003) 77 0.766 0.426 0 1
First democratic constitution (mc ) * Rockey (2012) 86 1.049 1.054 0.163 4.819
First democratic elections (me ) * Rockey (2012) 86 1.064 1.049 0.054 4.499
Historical political stability (Pol. Stab) 0-1 Besley and Persson (2009) 122 0.310 0.248 0 1
Judicial independence (judind ) (1990) Dummy variable CCP (2008) 53 0.755 0.434 0 1
Legislative oversight power (intexec ) (1990) 0-2* CCP (2008) 51 0.961 0.720 0 2
Meritocratic recruitment of civil servants (civil ) (1990) Dummy variable CCP (2008) 52 0.173 0.382 0 1
Programmatic parties (rlc_avg ) (1990) Share of parties* Cruz and Keefer (2013) and DPI (2001) 124 0.373 0.335 0 1
Control variables
Real GDP per capita, PPP (log) (1975-84) log total WDI 116 8.309 1.280 5.959 11.589
Real GDP per capita, PPP (log) (1980-89) log total WDI 119 8.296 1.287 5.911 11.398
Real GDP per capita, PPP (log) (1990-99) log total WDI 127 8.602 1.267 5.660 10.796
Dependency ratio (log) (1975-84) % of working-age population WDI 126 4.366 0.235 3.775 4.724
Dependency ratio (log) (1980-89) % of working-age population WDI 126 4.336 0.255 3.830 4.750
Dependency ratio (log) (1990-99) % of working-age population WDI 127 4.181 0.267 3.670 4.757
Urbanization Rate (log) (1975-84) % of total WDI 126 3.563 0.695 1.423 4.556
Urbanization Rate (log) (1980-89) % of total WDI 126 3.639 0.657 1.617 4.575
Urbanization Rate (log) (1990-99) % of total WDI 127 3.919 0.522 2.252 4.605
pres Dummy variable Persson and Tabellini (2003) 126 0.563 0.498 0 1
maj Dummy variable Persson and Tabellini (2003) 123 0.635 0.464 0 1
GASTIL 1-7 Freedom House 77 2.437 1.214 1.000 4.889
Population (log) (2000) log total WDI 127 9.293 1.585 5.639 14.050
federal Dummy variable Persson and Tabellini (2003) 75 0.173 0.381 0 1
Tariff rate % of total imports WDI 127 2.709 4.763 0 27.211
OECD members Dummy variable 127 0.189 0.393 0 1
Sub-Saharan Africa Dummy variable 127 0.220 0.416 0 1
Latin America Dummy variable 127 0.189 0.393 0 1
East Asia Dummy variable 127 0.087 0.282 0 1
Socialist Dummy variable 127 0.024 0.152 0 1
Panel Data Analysis
(5-year averages 1980-2004)
Government consumption % of GDP WDI 246 12.996 5.067 4.080 40.655
Openness % of GDP WDI 246 69.207 54.131 13.423 378.825
Bureaucratic Quality 0-4 ICRG 246 1.788 0.967 0 4
Terms of Trade (ToT) Volatil ity
Standard deviation of the log-
differences in terms of trade
for each period
WDI 245 0.098 0.084 0.000 0.493
Beginning of the period
Real GDP per capita, PPP (log) log total WDI 246 7.997 1.077 5.562 10.586
Dependency ratio (log) % of working-age population WDI 246 3.726 0.551 2.140 4.605
Urbanization Rate (log) % of total WDI 246 4.331 0.239 3.614 4.717

40
Table A2. First Stage Results: Instrumental Variables me and civil
Bur. Quality Open * Bur Bur. Quality Open * Bur Bur. Quality Open * Bur Bur. Quality Open * Bur Bur. Quality Open * Bur Bur. Quality Open * Bur
(1) (2) (3) (4) (5) (6) (7) (8) (9) (10) (11) (12)
me 0.313*** -31.439*** 1.133** -110.276* 0.260** -20.391** 0.772 -108.211*
(0.110) (10.771) (0.514) (64.821) (0.104) (10.114) (0.501) (54.428)
me x Openness (t-1) -0.001 0.637*** -0.005 2.013** -0.001 0.367*** -0.004 1.483**
(0.001) (0.146) (0.005) (0.789) (0.001) (0.106) (0.005) (0.644)
me^2 -0.221* 20.092 -0.136 22.054*
(0.118) (15.914) (0.116) (13.073)
me^2 x Openness (t-1) 0.001 -0.335* 0.001 -0.268*
(0.001) (0.188) (0.001) (0.150)
civil -1.156*** 30.643 -1.255* 22.641
(0.278) (57.178) (0.650) (52.988)
civil x Openness (t-1) 0.014*** -0.935 0.014 -1.145
(0.005) (0.962) (0.010) (0.879)
Expanded Controls No No No No No No Yes Yes Yes Yes Yes Yes
Excluded Instruments me, me*openness me, me*openness
me, me*openness,
me^2,
me^2*openness
me, me*openness,
me^2,
me^2*openness
civil,
civil*openness
civil,
civil*openness
me,
me*openness
me,
me*openness
me, me*openness,
me^2,
me^2*openness
me, me*openness,
me^2,
me^2*openness
civil,
civil*openness
civil,
civil*openness
Observations 86 86 86 86 52 52 77 77 77 77 34 34
Adjusted R-squared 0.746 0.895 0.754 0.907 0.882 0.905 0.764 0.922 0.761 0.925 0.900 0.978
F 5.030 9.920 3.440 8.840 9.910 1.460 3.170 6.130 1.800 5.040 4.680 7.340
Prob>F 0.009 0.000 0.012 0.000 0.000 0.245 0.049 0.004 0.141 0.002 0.023 0.005
A-P F test of weak excluded instruments
F 9.960 19.770 4.590 11.740 19.710 2.580 5.720 11.340 2.120 5.920 4.630 6.680
Prob>F 0.002 0.000 0.005 0.000 0.000 0.116 0.020 0.001 0.107 0.001 0.045 0.019
Robust standard errors in parentheses. *** p<0.01, ** p<0.05, * p<0.1
FIRST-STAGE VARIABLES
Note: Other controls not shown in the table: log GDP per capita (t-1), log dependency ratio (t-1), log urbanization rate (t-1) and dummy variables for OECD, Sub-Saharan Africa, Latin America, East Asia, and Socialist countries. Expanded set of controls: log
population (00), GASTIL, pres, maj, and tariff rate. t-1 corresponds to the period 1990-99. A constant term was included in all regressions.

41
APPENDIX B
This appendix complements the evidence presented in the paper. It includes the following
material:
1. Replicating Rodrik’s results
2. Running Regressions in the “small” sample
3. Panel data analysis – Random effects regressions
4. Instrumental variables – Expanded set of instruments
1. Replicating Rodrik’s Results
Table B1. Rodrik’s Results and Replication
Rodrik (1998)
(1)
Replication
(2)
Rodrik (1998)
(3)
Replication
(4)
Log Openness (t-1) 0.205*** 0.370*** 0.223*** 0.276***
(0.057) (0.053) (0.064) (0.062)
log GDP per capita 0.105* 0.109* -0.030 0.201***
(0.063) (0.057) (0.084) (0.065)
log dependency ratio 0.630*** 0.804*** 0.642*** 0.579***
(0.193) (0.199) (0.241) (0.208)
log urbanization rate -0.136* -0.048 -0.203** -0.093
(0.075) (0.070) (0.093) (0.085)
OECD -0.014 0.358*** -0.007 0.133
(0.122) (0.116) (0.144) (0.124)
Sub-Saharan Africa -0.239** -0.030 -0.107 -0.010
(0.101) (0.095) (0.118) (0.107)
Latin America -0.218** -0.203** -0.171 -0.368***
(0.094) (0.089) (0.113) (0.096)
East Asia -0.338** -0.118 -0.206 -0.181
(0.130) (0.103) (0.140) (0.118)
Socialist 0.092 0.346* 0.169 0.339
(0.100) (0.196) (0.130) (0.267)
Constant 3.786*** -2.193* 3.289*** -2.193*
(0.383) (1.135) (0.536) (1.135)
Observations 125 133 103 133
Adjusted R-squared 0.458 0.348 0.430 0.348
VARIABLES
Log Government
Consumption (% of GDP)
1985-89
Log Government
Consumption (% of GDP)
1990-92
Note: t-1 corresponds to the period 1975-84 in columns (1) and (2) and to the period
1980-89 in columns (3) and (4).
Standard errors in parentheses. *** p<0.01, ** p<0.05, * p<0.1

42
2. Running Regressions in the “Small” Sample
As discussed in the main text, we run the empirical analysis in two different samples, a “large”
sample that includes those countries for which data was available in the updated sources and a
“small” sample that includes only those countries that are thought to belong to Rodrik’s sample
according to the data sources used in his work. While in the text we have concentrated on the
results based on the first set of countries, here we present the results using the small sample.
In Column 2 of Table B2 we have included the interaction term between bureaucratic
quality and openness to Rodrik’s baseline regression presented in column 1. Figure B1 plots the
marginal effects of interest which, similar to the results with the “large” sample, turns out to be
positive and significant for countries with low state capacities but dissipates as these increase.
Furthermore, once the three-way interaction term between openness, bureaucratic quality, and
TOT volatility is included (Column 4), the effect remains. Figure B2 summarizes the marginal
effect of openness for different values of bureaucratic quality when TOT volatility is set at its
50th
percentile. Table B3 and Figure B3 show that our results remain in a panel setting even after
including a full set of time and country fixed effects.
Table B2. Accounting for Government Capabilities and Terms of Trade Volatility:
Cross-Section, Small Sample
(1) (2) (3) (4)
Openness (t-1) 0.002** 0.004** 0.004 0.0001
(0.001) (0.002) (0.003) (0.006)
Bureaucratic Quality (t-1) 0.099 0.008
(0.073) (0.204)
Openness (t-1) x Bureaucratic Quality (t-1) -0.001 0.004
(0.001) (0.003)
ToT Volatil ity (t-1) 0.391 -1.514
(1.551) (2.658)
Openness (t-1) x ToT Volatil ity (t-1) -0.028 0.051
(0.023) (0.045)
Bureaucratic Quality (t-1) x ToT Volatil ity (t-1) 1.924
(1.805)
-0.068**
(0.031)
Observations 101 101 63 63
Adjusted R-squared 0.357 0.357 0.122 0.261
VARIABLESLog Government Consumption (% of GDP) 2000-05
Openness (t-1) x Bureaucratic Quality (t-1) x ToT Volatil ity (t-1)
Note: Other controls not shown in the table: log GDP per capita (t-1), log dependency ratio (t-1), log urbanization rate (t-1),
and dummy variables for OECD, Sub-Saharan Africa, Latin America, East Asia, and Socialist countries. t-1 corresponds to
the period 1990-99, except for ToT Volatil ity where the period 1980-99 is considered. A constant term was included in all
regressions.
Standard errors in parentheses. *** p<0.01, ** p<0.05, * p<0.1

43
Figure B1. Marginal Effect of Trade Openness on Government Consumption
along Bureaucratic Quality: Cross-Section, Small Sample
Note: The figure corresponds to the regression in column 2 of Table B1.
Figure B2. Marginal Effect of Trade Openness on Government Consumption
along Bureaucratic Quality: ToT Volatility at 50th
Percentile, Small Sample
Note: The figure corresponds to the regression in column 4 of Table B1.
-.00
5
0
.00
5.0
1
d(lo
gcg
ov0
00
5)/
d(o
pen
90
99
)
0 .5 1 1.5 2 2.5 3 3.5 4Bureaucratic Quality
Marginal effect 95% Confidence Interval
-.01
5-.
01
-.00
5
0
.00
5.0
1
d(lo
gcg
ov0
00
5)/
d(o
pen
90
99
)
0 .5 1 1.5 2 2.5 3 3.5 4Bureaucratic Quality
Marginal effect 90% Confidence Interval
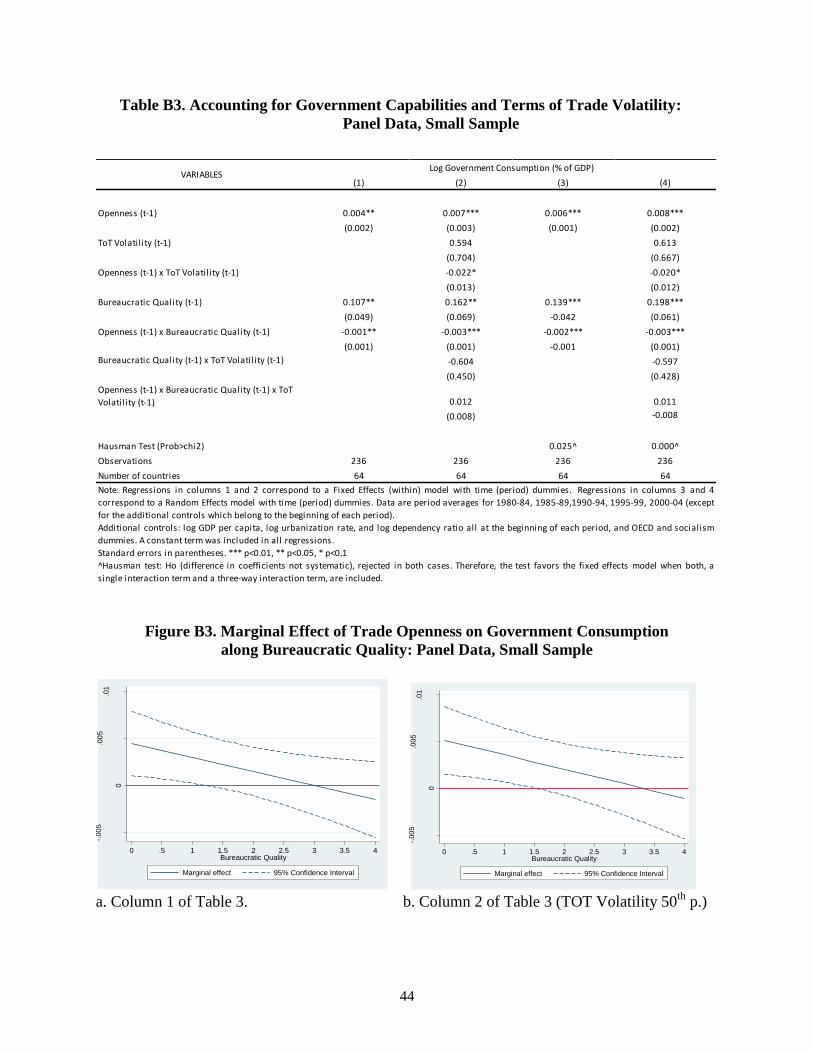
44
Table B3. Accounting for Government Capabilities and Terms of Trade Volatility:
Panel Data, Small Sample
Figure B3. Marginal Effect of Trade Openness on Government Consumption
along Bureaucratic Quality: Panel Data, Small Sample
a. Column 1 of Table 3. b. Column 2 of Table 3 (TOT Volatility 50
th p.)
(1) (2) (3) (4)
Openness (t-1) 0.004** 0.007*** 0.006*** 0.008***
(0.002) (0.003) (0.001) (0.002)
ToT Volatil ity (t-1) 0.594 0.613
(0.704) (0.667)
Openness (t-1) x ToT Volatil ity (t-1) -0.022* -0.020*
(0.013) (0.012)
Bureaucratic Quality (t-1) 0.107** 0.162** 0.139*** 0.198***
(0.049) (0.069) -0.042 (0.061)
Openness (t-1) x Bureaucratic Quality (t-1) -0.001** -0.003*** -0.002*** -0.003***
(0.001) (0.001) -0.001 (0.001)
Bureaucratic Quality (t-1) x ToT Volatil ity (t-1) -0.604 -0.597
(0.450) (0.428)
Openness (t-1) x Bureaucratic Quality (t-1) x ToT
Volatil ity (t-1) 0.012 0.011
(0.008) -0.008
Hausman Test (Prob>chi2) 0.025^ 0.000^
Observations 236 236 236 236
Number of countries 64 64 64 64
Note: Regressions in columns 1 and 2 correspond to a Fixed Effects (within) model with time (period) dummies. Regressions in columns 3 and 4
correspond to a Random Effects model with time (period) dummies. Data are period averages for 1980-84, 1985-89,1990-94, 1995-99, 2000-04 (except
for the additional controls which belong to the beginning of each period).
Additional controls: log GDP per capita, log urbanization rate, and log dependency ratio all at the beginning of each period, and OECD and socialism
dummies. A constant term was included in all regressions.
Standard errors in parentheses. *** p<0.01, ** p<0.05, * p<0.1
^Hausman test: Ho (difference in coefficients not systematic), rejected in both cases. Therefore, the test favors the fixed effects model when both, a
single interaction term and a three-way interaction term, are included.
Log Government Consumption (% of GDP)VARIABLES
-.00
5
0
.00
5.0
1
d(lo
gcg
ov)/
d(o
pe
n)
0 .5 1 1.5 2 2.5 3 3.5 4Bureaucratic Quality
Marginal effect 95% Confidence Interval
-.00
5
0
.00
5.0
1
d(lo
gcg
ov)/
d(o
pe
n)
0 .5 1 1.5 2 2.5 3 3.5 4Bureaucratic Quality
Marginal effect 95% Confidence Interval

45
3. Panel Data Analysis: Random Effects Regressions
The panel regressions were run using both fixed effects and random effects. As mentioned in the
paper's core results, the Hausman test favors the fixed effects model. However, we present the
random effects model in Table 2 of the paper (columns 3 and 4) and the respective figures in this
appendix. Figure B4 shows that past exposure to external risk is a statistically significant
determinant of government consumption when the quality of the bureaucracy is low. As in the
fixed effects model, this effect dissipates as the state capacities increase.
Figure B4. Marginal Effect of Trade Openness on Government Consumption along
Bureaucratic Quality: Panel Data, Random Effects, Large Sample
a. Column 3 of Table 2 in the main article b. Column 4 of Table 2 in the main article (TOT
Volatility 50th
p.)
-.00
2
0
.00
2.0
04
.00
6.0
08
d(lo
gcg
ov)/
d(o
pe
n)
0 .5 1 1.5 2 2.5 3 3.5 4Bureaucratic Quality
Marginal effect 95% Confidence Interval
-.00
5
0
.00
5.0
1
d(lo
gcg
ov)/
d(o
pe
n)
0 .5 1 1.5 2 2.5 3 3.5 4Bureaucratic Quality
Marginal effect 95% Confidence Interval
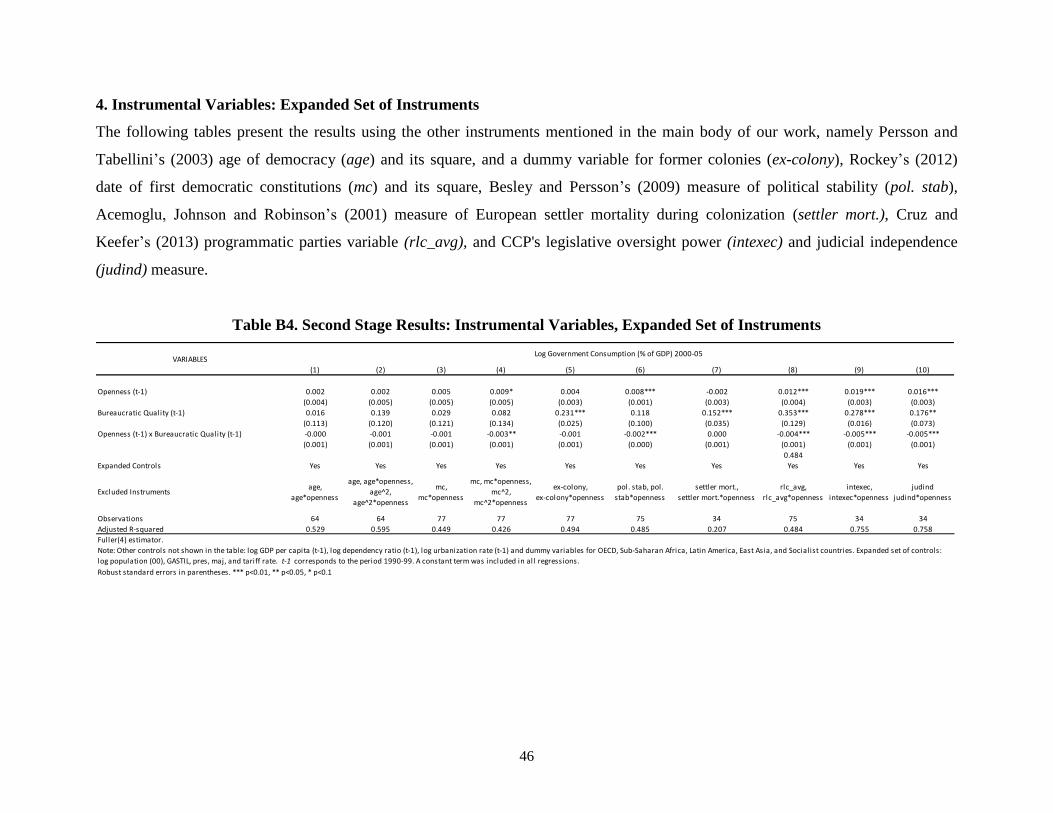
46
4. Instrumental Variables: Expanded Set of Instruments
The following tables present the results using the other instruments mentioned in the main body of our work, namely Persson and
Tabellini’s (2003) age of democracy (age) and its square, and a dummy variable for former colonies (ex-colony), Rockey’s (2012)
date of first democratic constitutions (mc) and its square, Besley and Persson’s (2009) measure of political stability (pol. stab),
Acemoglu, Johnson and Robinson’s (2001) measure of European settler mortality during colonization (settler mort.), Cruz and
Keefer’s (2013) programmatic parties variable (rlc_avg), and CCP's legislative oversight power (intexec) and judicial independence
(judind) measure.
Table B4. Second Stage Results: Instrumental Variables, Expanded Set of Instruments
(1) (2) (3) (4) (5) (6) (7) (8) (9) (10)
Openness (t-1) 0.002 0.002 0.005 0.009* 0.004 0.008*** -0.002 0.012*** 0.019*** 0.016***
(0.004) (0.005) (0.005) (0.005) (0.003) (0.001) (0.003) (0.004) (0.003) (0.003)
Bureaucratic Quality (t-1) 0.016 0.139 0.029 0.082 0.231*** 0.118 0.152*** 0.353*** 0.278*** 0.176**
(0.113) (0.120) (0.121) (0.134) (0.025) (0.100) (0.035) (0.129) (0.016) (0.073)
Openness (t-1) x Bureaucratic Quality (t-1) -0.000 -0.001 -0.001 -0.003** -0.001 -0.002*** 0.000 -0.004*** -0.005*** -0.005***
(0.001) (0.001) (0.001) (0.001) (0.001) (0.000) (0.001) (0.001) (0.001) (0.001)
0.484
Expanded Controls Yes Yes Yes Yes Yes Yes Yes Yes Yes Yes
Excluded Instrumentsage,
age*openness
age, age*openness,
age^2,
age^2*openness
mc,
mc*openness
mc, mc*openness,
mc^2,
mc^2*openness
ex-colony,
ex-colony*openness
pol. stab, pol.
stab*openness
settler mort.,
settler mort.*openness
rlc_avg,
rlc_avg*openness
intexec,
intexec*openness
judind
judind*openness
Observations 64 64 77 77 77 75 34 75 34 34
Adjusted R-squared 0.529 0.595 0.449 0.426 0.494 0.485 0.207 0.484 0.755 0.758
VARIABLES
Robust standard errors in parentheses. *** p<0.01, ** p<0.05, * p<0.1
Fuller(4) estimator.
Note: Other controls not shown in the table: log GDP per capita (t-1), log dependency ratio (t-1), log urbanization rate (t-1) and dummy variables for OECD, Sub-Saharan Africa, Latin America, East Asia, and Socialist countries. Expanded set of controls:
log population (00), GASTIL, pres, maj, and tariff rate. t-1 corresponds to the period 1990-99. A constant term was included in all regressions.
Log Government Consumption (% of GDP) 2000-05

47
Table B5. First Stage Results: Instrumental Variables, Expanded Set of Instruments
Bur. Quality Open * Bur Bur. Quality Open * Bur Bur. Quality Open * Bur Bur. Quality Open * Bur Bur. Quality Open * Bur
(1) (2) (3) (4) (5) (6) (7) (8) (9) (10)
age 0.065 -8.231* 0.420** 3.977
(0.049) (4.179) (0.189) (15.845)
age x Openness (t-1) -0.000 0.153** -0.001 0.191
(0.001) (0.059) (0.002) (0.248)
age^2 -0.041* -1.323
(0.021) (1.777)
age^2 x Openness (t-1) 0.000 -0.007
(0.000) (0.030)
mc 0.129 -9.263 0.538 -29.729
(0.083) (9.540) (0.366) (36.695)
mc x Openness (t-1) -0.001 0.304** -0.002 1.133*
(0.001) (0.128) (0.005) (0.678)
mc^2 -0.090 5.223
(0.075) (8.245)
mc^2 x Openness (t-1) 0.000 -0.200
(0.001) (0.158)
Ex-colony 0.604* 100.063***
(0.337) (33.891)
Ex-colony x Openness (t-1) -0.008* -1.271**
(0.005) (0.492)
Expanded Controls Yes Yes Yes Yes Yes Yes Yes Yes Yes Yes
Excluded Instruments age, age*openness age, age*opennessage, age*openness,
age^2, age^2*openness
age, age*openness,
age^2, age^2*opennessmc, mc*openness mc, mc*openness
mc, mc*openness,
mc^2,
mc^2*openness
mc, mc*openness,
mc^2,
mc^2*openness
ex-colony,
ex-colony*openness
ex-colony,
ex-colony*openness
Observations 64 64 64 64 77 77 77 77 77 77
Adjusted R-squared 0.771 0.945 0.798 0.946 0.755 0.920 0.755 0.922 0.757 0.918
F 1.700 3.410 3.080 3.170 1.350 4.130 1.540 3.090 1.630 4.380
Prob>F 0.194 0.041 0.025 0.022 0.266 0.021 0.202 0.022 0.204 0.017
A-P F test of weak excluded instruments
F 3.320 6.820 3.330 3.270 2.700 7.620 1.800 3.360 0.030 0.080
Prob>F 0.075 0.012 0.027 0.029 0.105 0.008 0.157 0.025 0.859 0.772
FIRST-STAGE VARIABLES
Note: Other controls not shown in the table: log GDP per capita (t-1), log dependency ratio (t-1), log urbanization rate (t-1) and dummy variables for OECD, Sub-Saharan Africa, Latin America, East Asia, and Socialist countries. Expanded set of controls: log population
(00), GASTIL, pres, maj, and tariff rate. t-1 corresponds to the period 1990-99. A constant term was included in all regressions.
Robust standard errors in parentheses. *** p<0.01, ** p<0.05, * p<0.1

48
Table B5., continued
Bur. Quality Open * Bur Bur. Quality Open * Bur Bur. Quality Open * Bur Bur. Quality Open * Bur Bur. Quality Open * Bur
(11) (12) (13) (14) (15) (16) (17) (18) (19) (20)
Pol. Stab -0.726 -50.622
(0.769) (72.132)
Pol. Stab x Openness (t-1) 0.002 0.161
(0.011) (1.057)
Settler mort. 0.069 -20.347
(0.174) (20.609)
Settler mort. x Openness (t-1) -0.006 -1.673
(0.181) (12.752)
rlc_avg 0.973** 34.244
(0.478) (62.621)
rlc_avg x Openness (t-1) -0.006 0.221
(0.005) (0.779)
intexec -0.237 -37.118
(0.333) (27.500)
intexec x Openness (t-1) 0.001 0.177
(0.004) (0.308)
judind -0.534 10.408
(0.445) (42.453)
judind x Openness (t-1) 0.006 -0.541
(0.004) (0.673)
Expanded Controls Yes Yes Yes Yes Yes Yes Yes Yes Yes Yes
Excluded Instrumentspol. stab,
pol.stab*openness
pol. stab,
pol.stab*openness
settler mort.,
settler mort.*openness
settler mort.,
settler mort.*openness
rlc_avg,
rlc_avg*openness
rlc_avg1,
rlc_avg*openness
intexec,
intexec*openness
intexec,
intexec*openness
judind,
judind*openness
judind,
judind*openness
Observations 75 75 34 34 75 75 34 34 34 34
Adjusted R-squared 0.765 0.916 0.807 0.954 0.770 0.915 0.867 0.973 0.853 0.973
F 1.380 0.940 0.090 0.520 3.060 3.010 0.970 1.470 0.990 1.180
Prob>F 0.259 0.395 0.913 0.600 0.054 0.057 0.398 0.257 0.391 0.330
A-P F test of weak excluded instruments
F 0.000 0.000 0.000 0.080 2.340 0.870 0.020 0.080 1.220 1.890
Prob>F 0.984 0.989 0.946 0.780 0.132 0.355 0.891 0.784 0.283 0.186
FIRST-STAGE VARIABLES
Note: Other controls not shown in the table: log GDP per capita (t-1), log dependency ratio (t-1), log urbanization rate (t-1) and dummy variables for OECD, Sub-Saharan Africa, Latin America, East Asia, and Socialist countries. Expanded set of controls: log population
(00), GASTIL, pres, maj, and tariff rate. t-1 corresponds to the period 1990-99. A constant term was included in all regressions.
Robust standard errors in parentheses. *** p<0.01, ** p<0.05, * p<0.1
Related Documents


![Openness Agreements: Part Two The Reality of Openness · Presented by © Adoptive Families Association of BC [2016] Openness Agreements: Part Two The Reality of Openness](https://static.cupdf.com/doc/110x72/5e81797d22c1fb32191241b3/openness-agreements-part-two-the-reality-of-openness-presented-by-adoptive-families.jpg)