SPENCER COUNTY SCHOOLS State Assessment 2013-2014 School Year

State Assessment 2013-2014 School Year. Grade Range AchieveGapGrowthCollege Career Grad. Rate Total Elem.30 40N/A 100 Mid.28 16N/A100 High20 100.
Dec 15, 2015
Welcome message from author
This document is posted to help you gain knowledge. Please leave a comment to let me know what you think about it! Share it to your friends and learn new things together.
Transcript
SPENCER COUNTY SCHOOLSState Assessment
2013-2014School Year
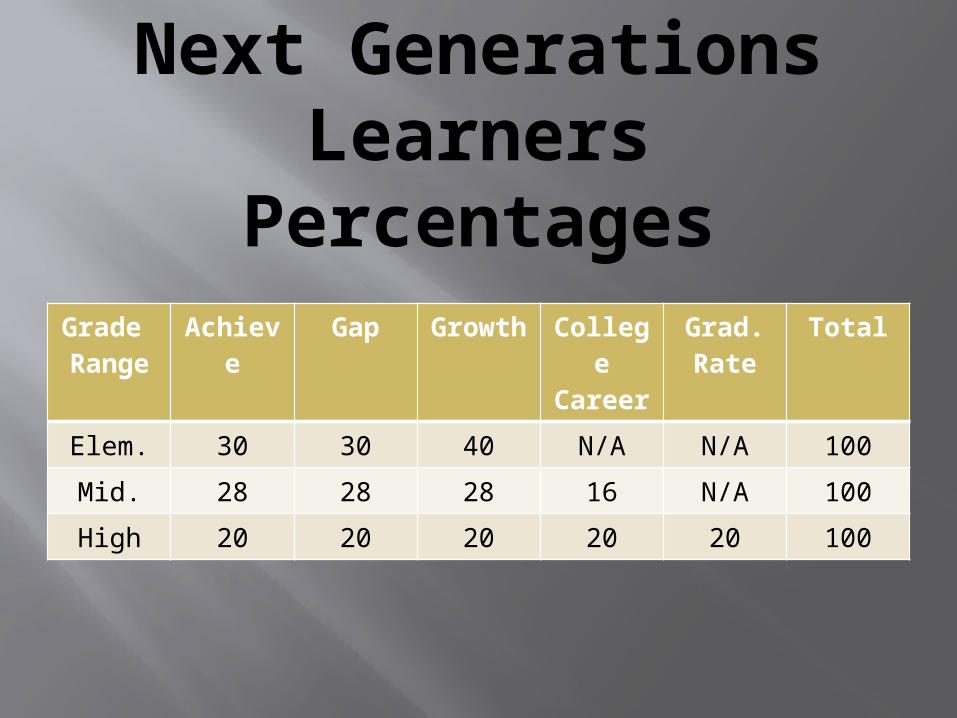
Next Generations Learners
PercentagesGrade Range
Achieve
Gap Growth
College
Career
Grad.Rate
Total
Elem. 30 30 40 N/A N/A 100
Mid. 28 28 28 16 N/A 100
High 20 20 20 20 20 100
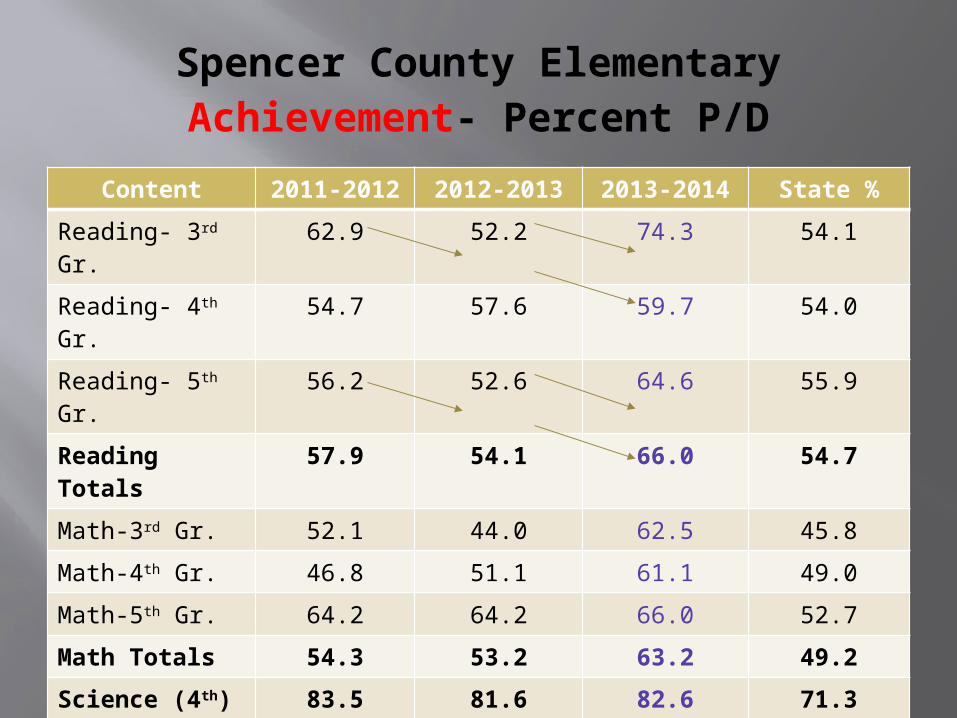
Spencer County ElementaryAchievement- Percent P/D
Content 2011-2012
2012-2013 2013-2014 State %
Reading- 3rd Gr. 62.9 52.2 74.3 54.1
Reading- 4th Gr. 54.7 57.6 59.7 54.0
Reading- 5th Gr. 56.2 52.6 64.6 55.9
Reading Totals
57.9 54.1 66.0 54.7
Math-3rd Gr. 52.1 44.0 62.5 45.8
Math-4th Gr. 46.8 51.1 61.1 49.0
Math-5th Gr. 64.2 64.2 66.0 52.7
Math Totals 54.3 53.2 63.2 49.2
Science (4th) 83.5 81.6 82.6 71.3
Lang. Mech. (4th)
54.0 61.7 53.5 51.8
Social St. (5th)
73.0 62.8 66.0 58.2
Writing (5th) 40.1 38.7 46.5 38.7
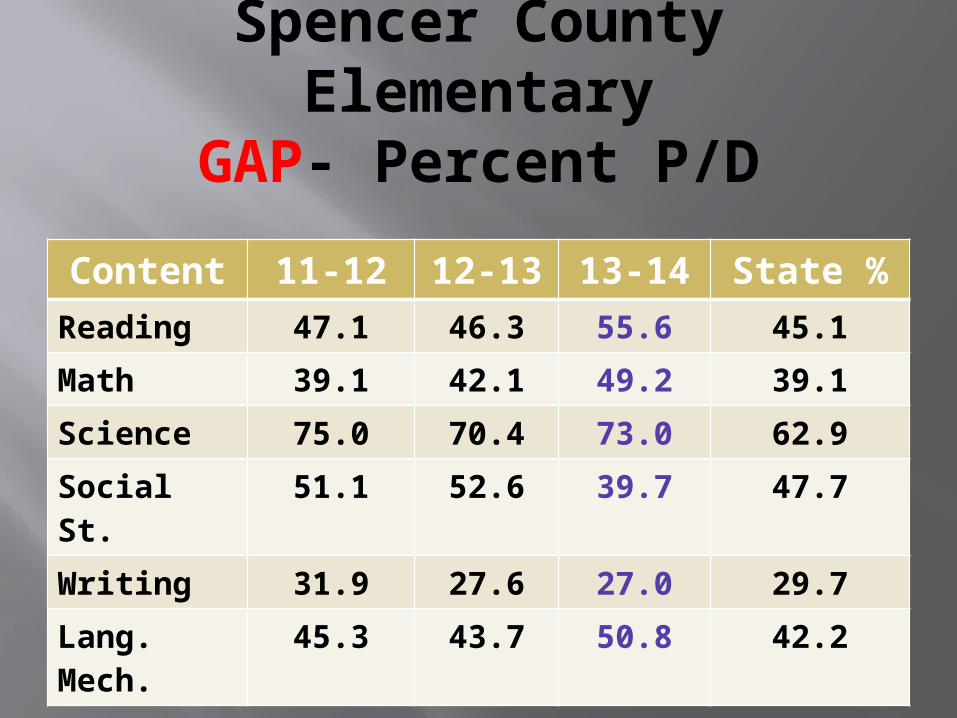
Spencer County Elementary
GAP- Percent P/D
Content 11-12 12-13 13-14 State %Reading 47.1 46.3 55.6 45.1
Math 39.1 42.1 49.2 39.1
Science 75.0 70.4 73.0 62.9
Social St. 51.1 52.6 39.7 47.7
Writing 31.9 27.6 27.0 29.7
Lang. Mech.
45.3 43.7 50.8 42.2

Spencer County ElementaryPercent Making Adequate Growth
Content 11-12 12-13 13-14 State %Reading 68.1 56.4 62.7 59.6
Math 82.7 68.4 76.0 59.9Combine
d75.5 62.4 69.4 59.8
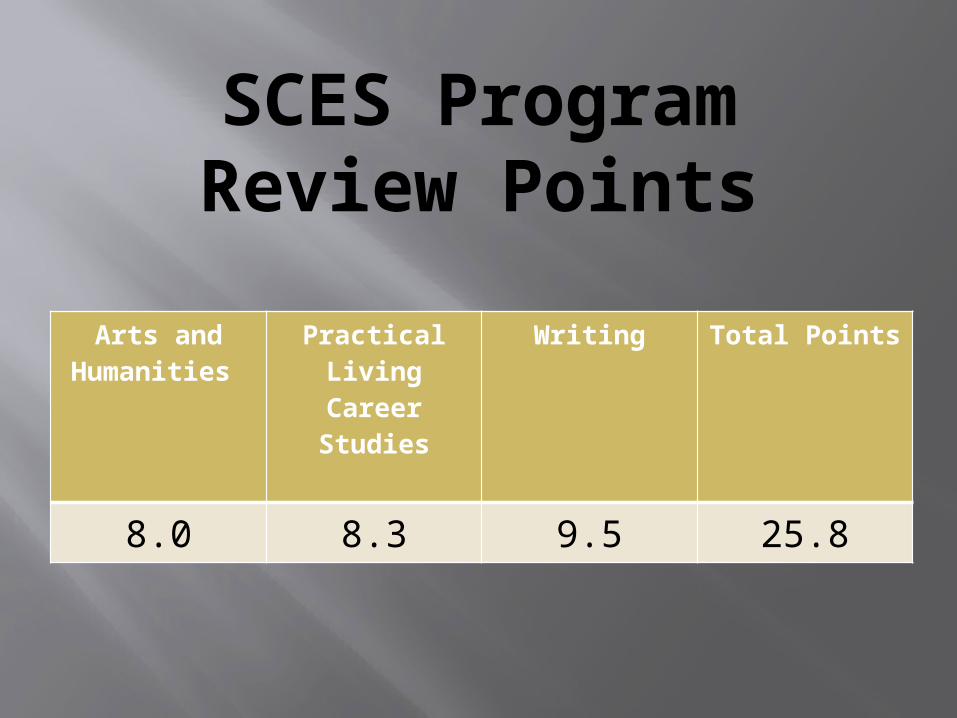
SCES ProgramReview Points
Arts and Humanities
Practical Living Career Studies
Writing Total Points
8.0 8.3 9.5 25.8

Spencer County ElementarySummary
Achievement Gap Growth
Points Weighted
Score
Points Weighted
Score
Points Weighted Score
11-12 82.5 24.8 49.3 14.8 75.5 30.2
12-13 76.7 23.0 48.4 14.5 62.4 25.0
13-14 84.5 25.4 49.7 14.9 69.4 27.8
Year Overall Score
Percentile
Rank
Classification
12-13 71.1 76 Proficient
13-14 75.4 91 Distinguished
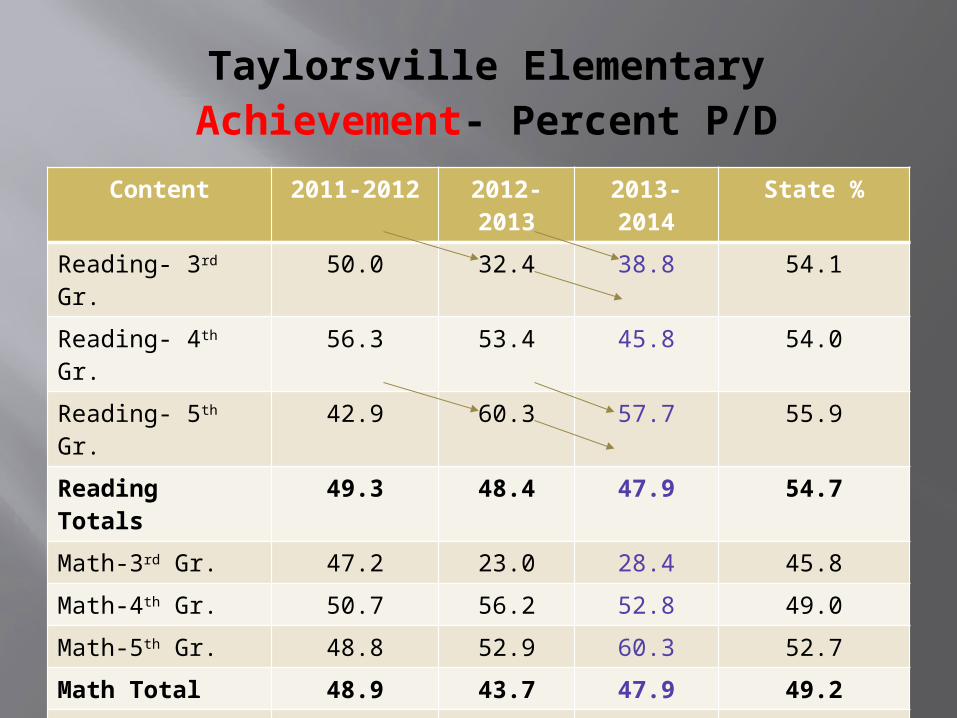
Taylorsville ElementaryAchievement- Percent P/D
Content 2011-2012 2012-2013
2013-2014
State %
Reading- 3rd Gr. 50.0 32.4 38.8 54.1
Reading- 4th Gr. 56.3 53.4 45.8 54.0
Reading- 5th Gr. 42.9 60.3 57.7 55.9
Reading Totals
49.3 48.4 47.9 54.7
Math-3rd Gr. 47.2 23.0 28.4 45.8
Math-4th Gr. 50.7 56.2 52.8 49.0
Math-5th Gr. 48.8 52.9 60.3 52.7
Math Total 48.9 43.7 47.9 49.2
Science (4th) 87.3 76.7 79.2 71.3
Lang. Mech. (4th)
57.7 58.9 48.6 51.8
Social St. (5th) 53.6 54.4 55.1 58.2
Writing (5th) 47.6 55.9 35.9 38.7
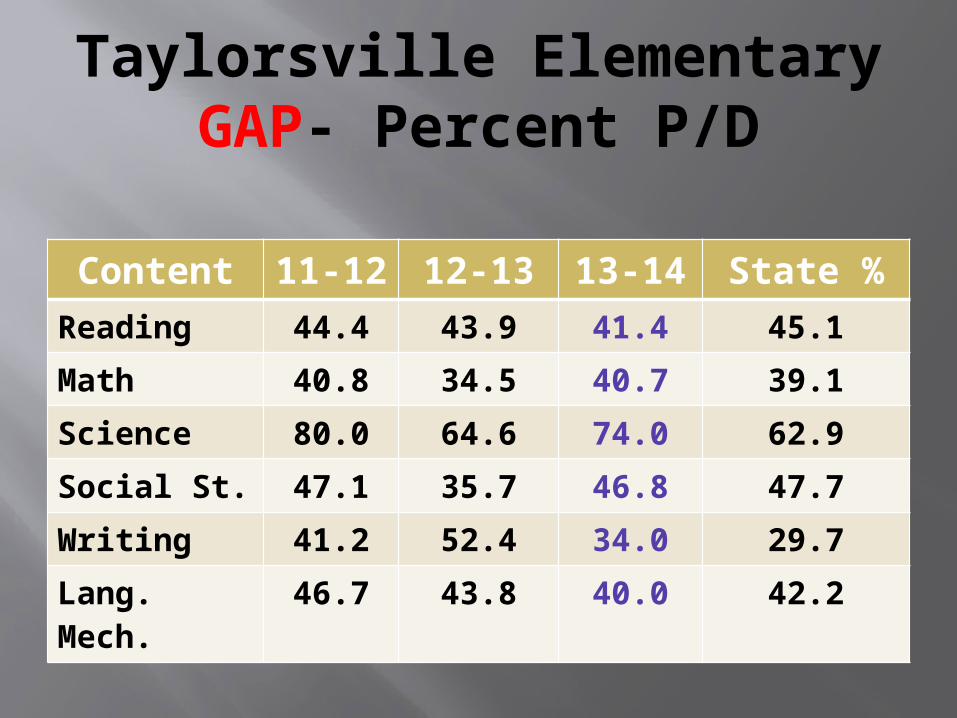
Taylorsville ElementaryGAP- Percent P/D
Content 11-12
12-13 13-14 State %
Reading 44.4 43.9 41.4 45.1
Math 40.8 34.5 40.7 39.1
Science 80.0 64.6 74.0 62.9
Social St. 47.1 35.7 46.8 47.7
Writing 41.2 52.4 34.0 29.7
Lang. Mech.
46.7 43.8 40.0 42.2
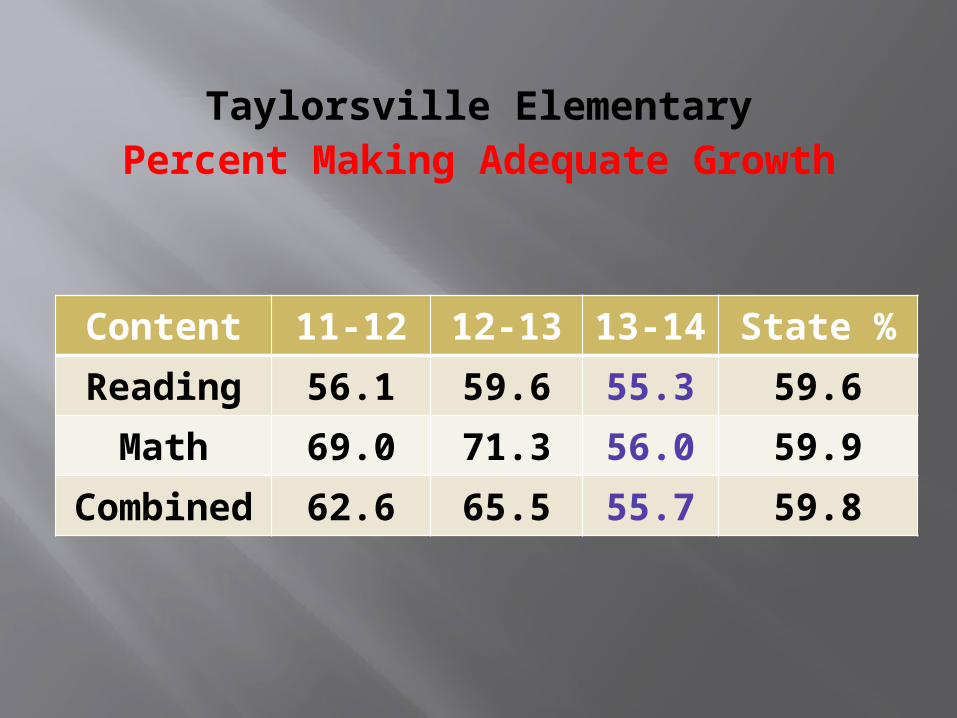
Taylorsville ElementaryPercent Making Adequate Growth
Content 11-12 12-13 13-14
State %
Reading 56.1 59.6 55.3 59.6Math 69.0 71.3 56.0 59.9
Combined
62.6 65.5 55.7 59.8
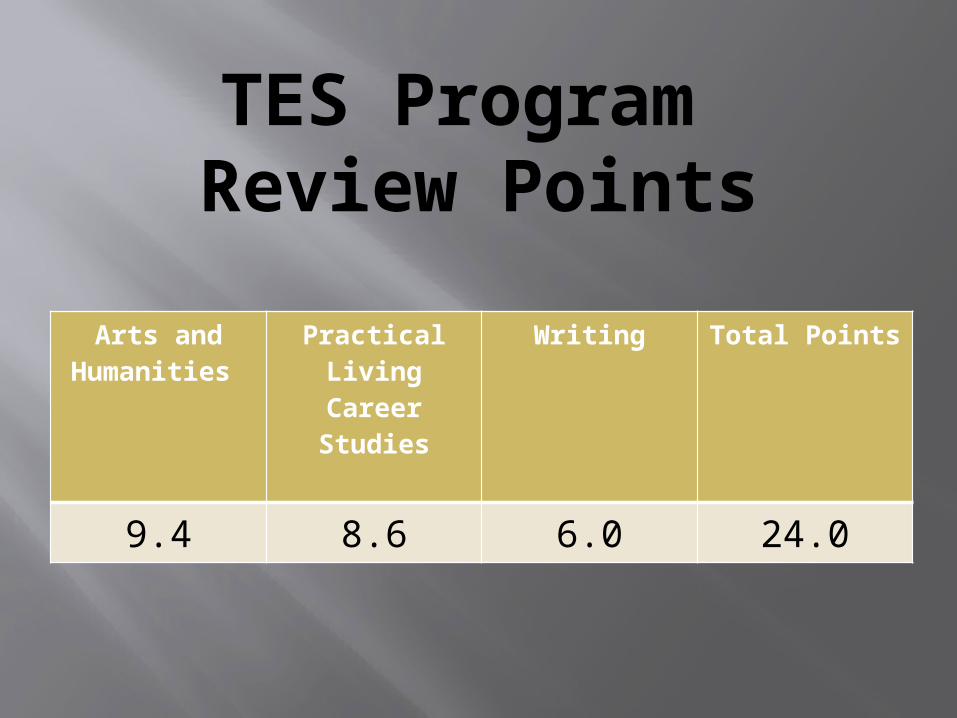
TES Program Review Points
Arts and Humanities
Practical Living Career Studies
Writing Total Points
9.4 8.6 6.0 24.0

Taylorsville ElementarySummary
Achievement
Gap Growth
Points Weighted
Score
Points Weighted
Score
Points Weighted Score
11-12 76.1 22.8 51.0 15.3 62.6 25.0
12-13 75.9 22.8 45.9 13.8 65.5 26.2
13-14 72.1 21.6 47.6 14.3 55.7 22.3Year Overall Score
Percentile
Rank
Class.
12-13 71.4 77 Proficient
13-14 67.8 62 Needs Improvement

Spencer County Middle SchoolAchievement- Percent P/D
Content 2011-2012
2012-2013
2013-2014
State %
Reading- 6th Gr. 46.9 44.3 60.2 52.8
Reading- 7th Gr. 51.1 55.2 66.7 54.4
Reading- 8th Gr. 52.6 46.5 49.3 52.2
Reading Totals 50.2 48.6 58.8 53.2
Math-6rd Gr. 48.8 46.5 61.1 47.3
Math-7th Gr. 32.6 34.4 50.4 42.1
Math-8th Gr. 39.9 39.0 40.0 45.2
Math Total 40.3 40.1 50.3 44.8
Science (7th) 61.5 56.6 74.8 64.2
Lang. Mech. (6th )
36.2 45.2 40.3 40.3
Social St. (8th ) 59.2 56.6 64.0 59.4
Writing-6th 37.1 48.3 54.0 52.3
Writing-8th 34.3 26.8 22.7 35.2
Writing Total 35.7 37.6 37.8 43.7

Spencer County Middle School
GAP- Percent P/D
Content 11-12 12-13 13-14 State %
Reading 40.6 35.9 48.4 42.2
Math 31.4 26.6 37.9 33.0
Science 53.8 45.7 68.3 53.5
Social St. 50.9 45.1 51.6 47.5
Writing 24.8 27.8 31.2 34.0
Lang. Mech.
27.4 28.6 25.6 29.8
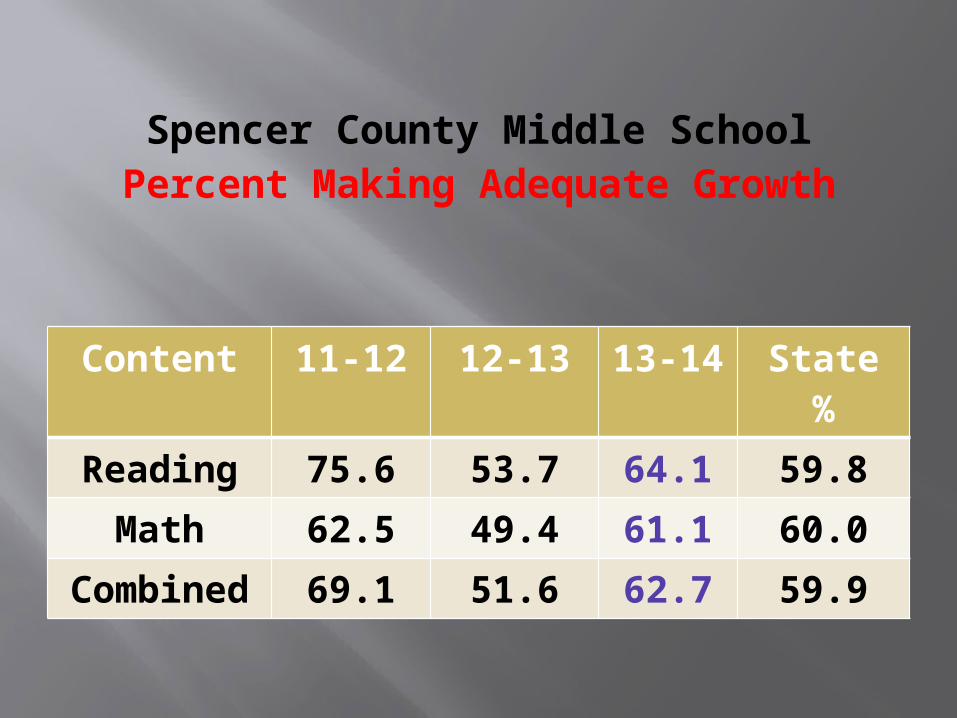
Spencer County Middle SchoolPercent Making Adequate Growth
Content 11-12 12-13 13-14 State %
Reading 75.6 53.7 64.1 59.8Math 62.5 49.4 61.1 60.0
Combined
69.1 51.6 62.7 59.9
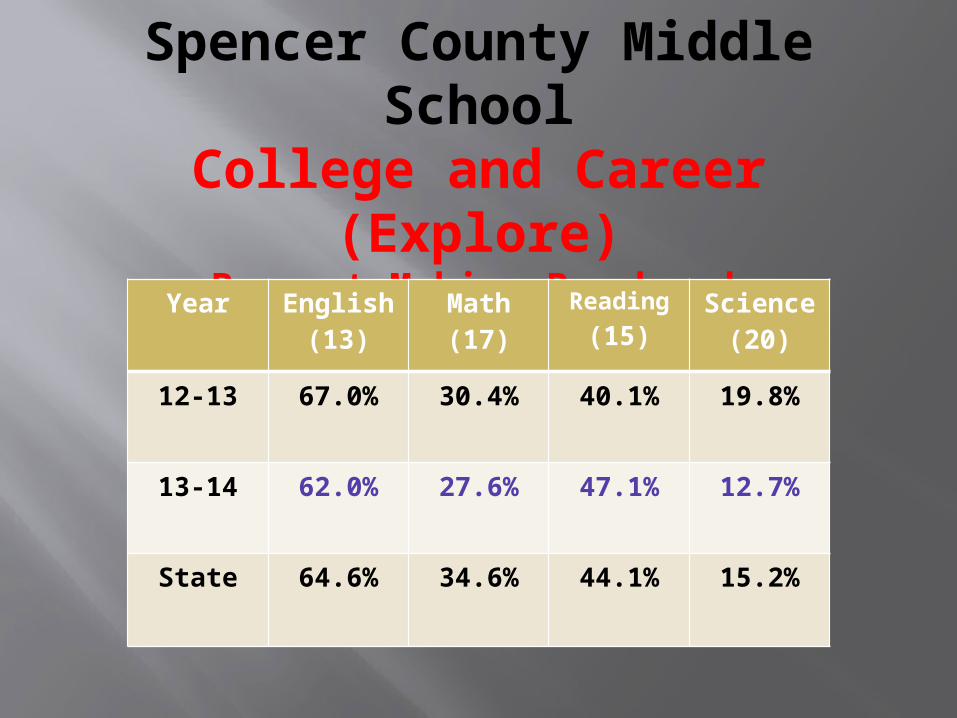
Spencer County Middle School
College and Career (Explore)
Percent Making BenchmarkYear English(13)
Math(17)
Reading(15)
Science(20)
12-13 67.0% 30.4% 40.1% 19.8%
13-14 62.0% 27.6% 47.1% 12.7%
State 64.6% 34.6% 44.1% 15.2%

SCMS Program Review Points
Arts and Humanities
Practical Living Career Studies
Writing Total Points
9.0 8.8 9.5 27.3

Spencer County Middle School Summary
Achieve-ment
Gap Growth CollegeAnd
CareerPoints Weighted
ScorePoints Weighted
ScorePoints Weighted
ScorePoints Weighted
Score
11-12
67.4 18.9 40.5 11.3 69.1 19.3 42.3 6.8
12-13
66.8 18.7 36.1 10.1 51.6 14.4 46.3 7.4
13-14
75.9 21.3 47.3 13.2 62.7 17.6 45.6 7.3Year Overall
ScorePercentil
e Rank
Classification
12-13 61.9 48 Needs Improvement
13-14 68.7 78 Proficient
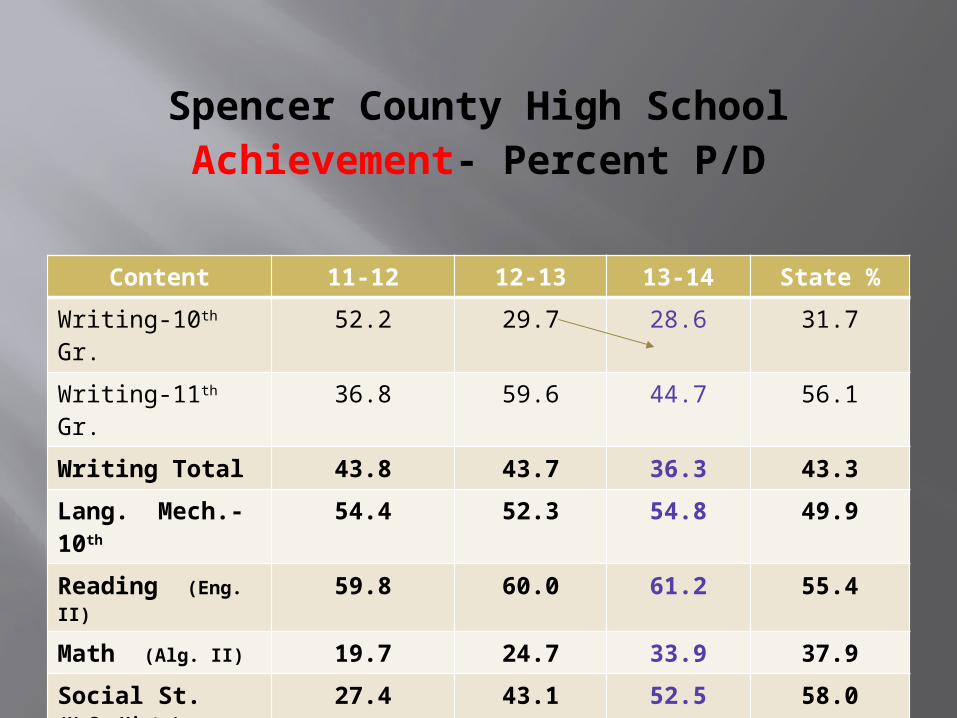
Spencer County High SchoolAchievement- Percent P/D
Content 11-12 12-13 13-14 State %
Writing-10th Gr. 52.2 29.7 28.6 31.7
Writing-11th Gr. 36.8 59.6 44.7 56.1
Writing Total 43.8 43.7 36.3 43.3
Lang. Mech.-10th
54.4 52.3 54.8 49.9
Reading (Eng. II)
59.8 60.0 61.2 55.4
Math (Alg. II) 19.7 24.7 33.9 37.9
Social St. (U.S. Hist.)
27.4 43.1 52.5 58.0
Science (Bio) NA 26.1 39.7 39.8
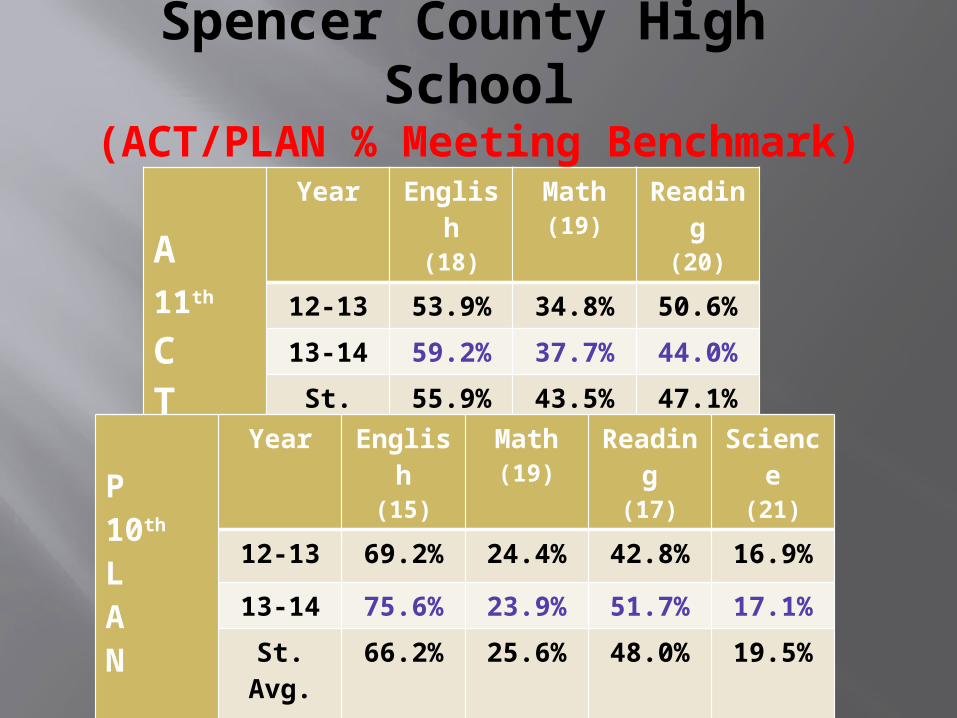
Spencer County High School
(ACT/PLAN % Meeting Benchmark)
A 11th CT
Year English
(18)
Math(19)
Reading
(20)
12-13 53.9% 34.8% 50.6%
13-14 59.2% 37.7% 44.0%
St. Avg.
55.9% 43.5% 47.1%
P 10th
LAN
Year English
(15)
Math(19)
Reading
(17)
Science
(21)
12-13 69.2% 24.4% 42.8% 16.9%
13-14 75.6% 23.9% 51.7% 17.1%
St. Avg.
66.2% 25.6% 48.0% 19.5%
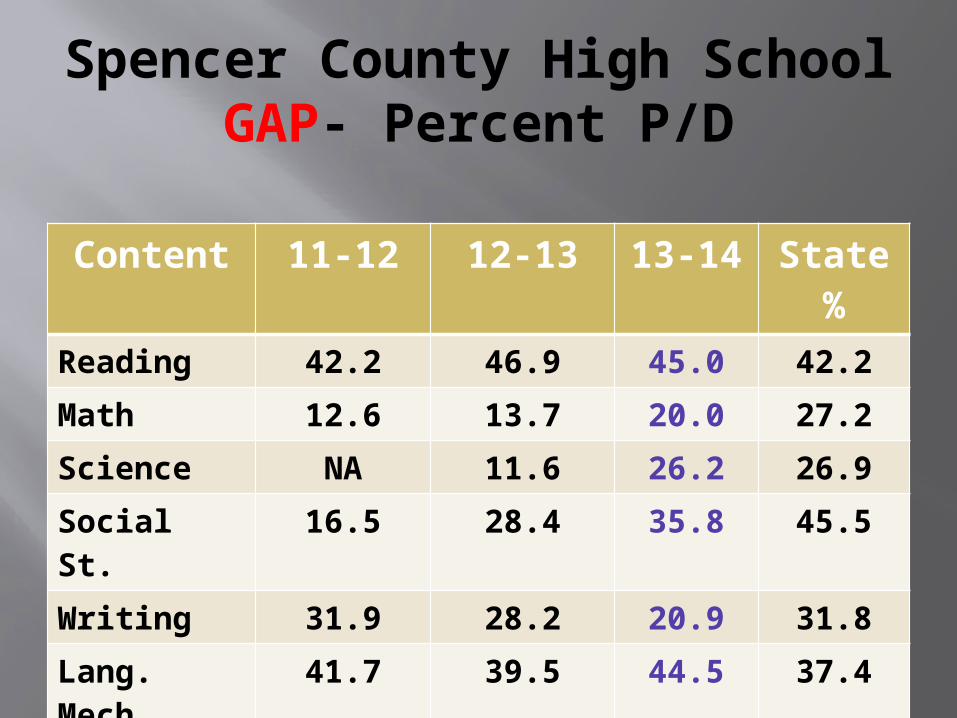
Spencer County High School
GAP- Percent P/D
Content 11-12 12-13 13-14 State %
Reading 42.2 46.9 45.0 42.2
Math 12.6 13.7 20.0 27.2
Science NA 11.6 26.2 26.9
Social St. 16.5 28.4 35.8 45.5
Writing 31.9 28.2 20.9 31.8
Lang. Mech.
41.7 39.5 44.5 37.4
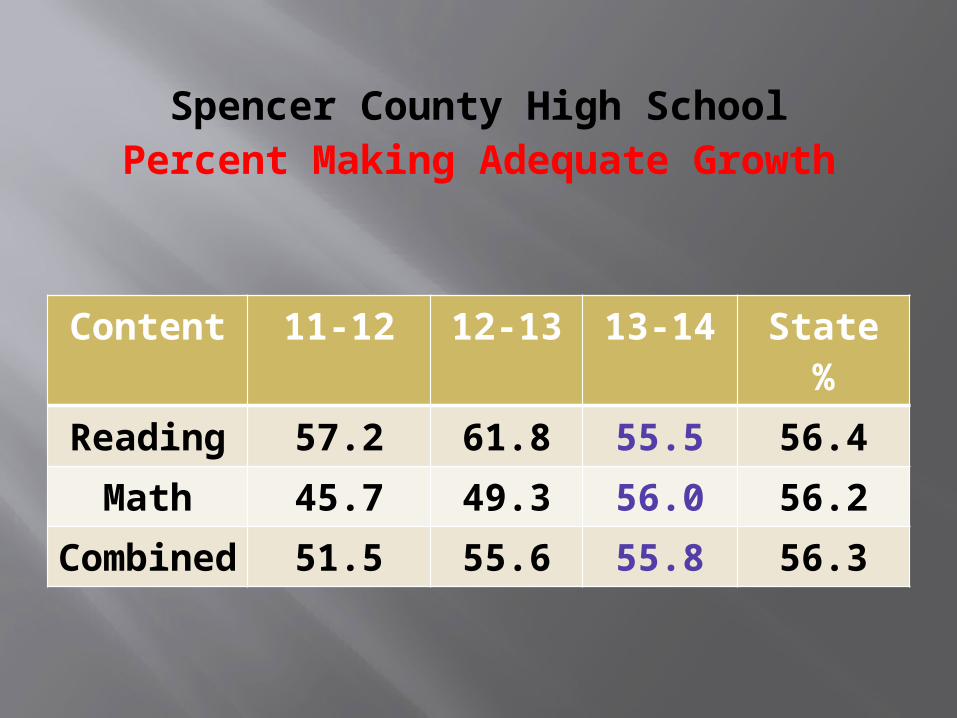
Spencer County High SchoolPercent Making Adequate Growth
Content 11-12 12-13 13-14 State %
Reading 57.2 61.8 55.5 56.4Math 45.7 49.3 56.0 56.2
Combined
51.5 55.6 55.8 56.3

SCHS Program Review Points
Arts and Humanities
Practical Living Career Studies
Writing Total Points
7.4 8.5 9.4 25.3
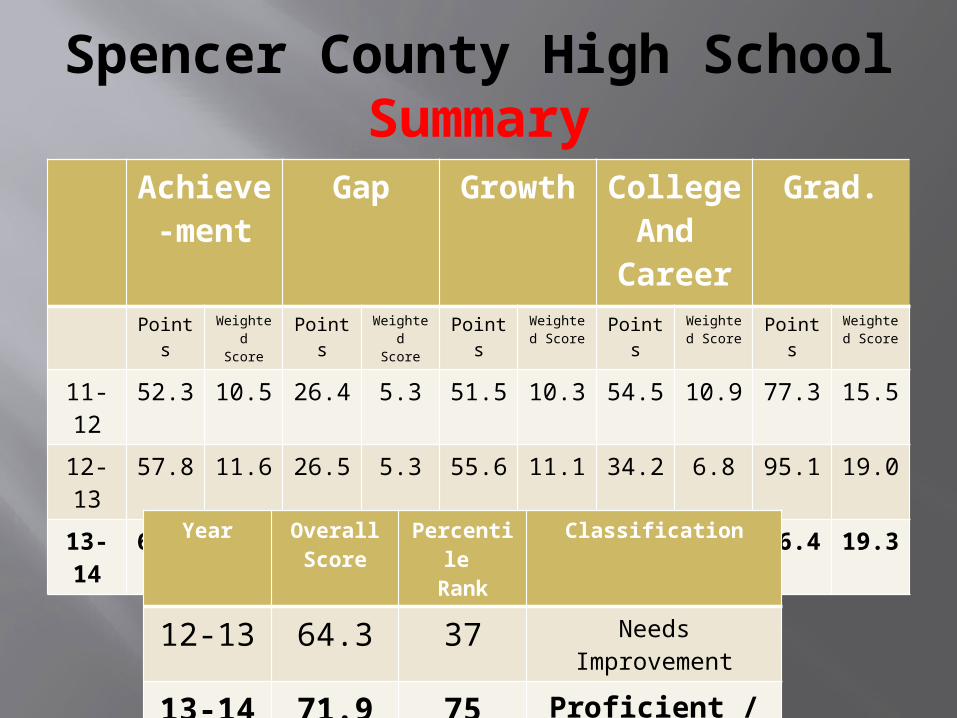
Spencer County High School Summary
Achieve-ment
Gap Growth CollegeAnd
Career
Grad.
Points Weighted
Score
Points Weighted
Score
Points Weighted Score
Points Weighted Score
Points Weighted Score
11-12
52.3 10.5 26.4 5.3 51.5 10.3 54.5 10.9 77.3 15.5
12-13
57.8 11.6 26.5 5.3 55.6 11.1 34.2 6.8 95.1 19.0
13-14
61.3 12.3 30.5 6.1 55.8 11.2 73.1 14.6 96.4 19.3Year Overall
ScorePercentil
e Rank
Classification
12-13 64.3 37 Needs Improvement
13-14 71.9 75 Proficient / Focus
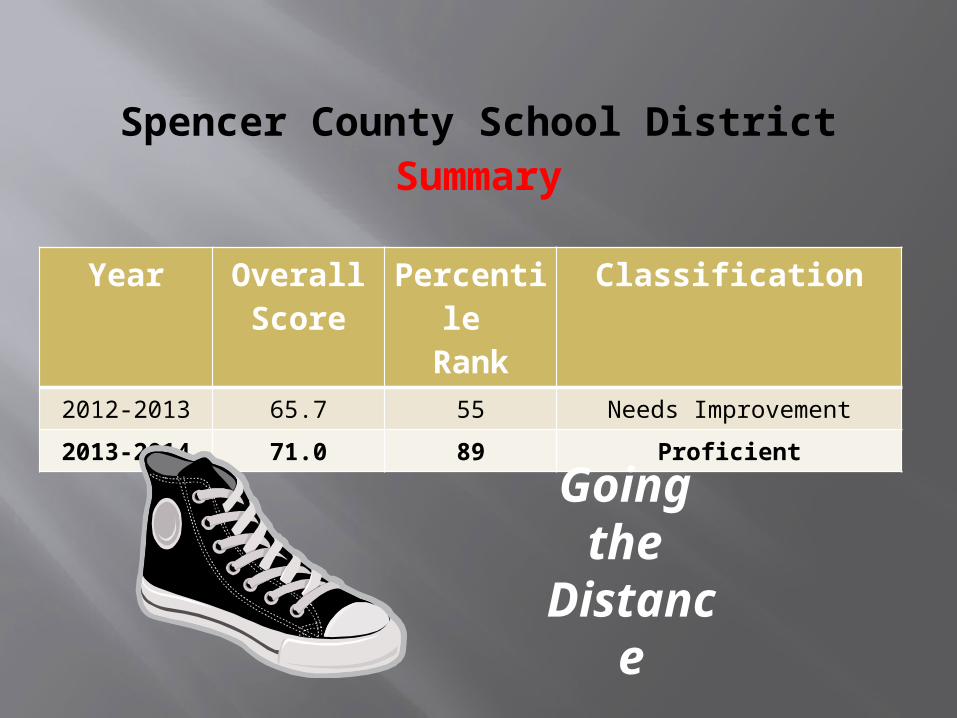
Spencer County School DistrictSummary
Year Overall Score
Percentile
Rank
Classification
2012-2013 65.7 55 Needs Improvement
2013-2014 71.0 89 Proficient
Going the
Distance
Related Documents