CONCEPT OF STATE AND GOVERNMENT

Welcome message from author
This document is posted to help you gain knowledge. Please leave a comment to let me know what you think about it! Share it to your friends and learn new things together.
Transcript

CONCEPT OF STATE AND GOVERNMENT

According to James Garner, the STATE is a community of persons more or less numerous occupying a definite portion of territory completely free of external control and possessing
an organized government to which a great body of inhabitants render
habitual obedience.

STATE VS. NATION

FOUR ESSENTIAL ELEMENTS OF STATE:1. People
2. Territory
3. Sovereignty
4. Government

People refer to the inhabitants of the state. There is no strict
requirement on their number, but they must be of sufficient number to
be self-sufficing.

Territory is a fixed portion on the surface of the earth inhabited by
the people of the state.

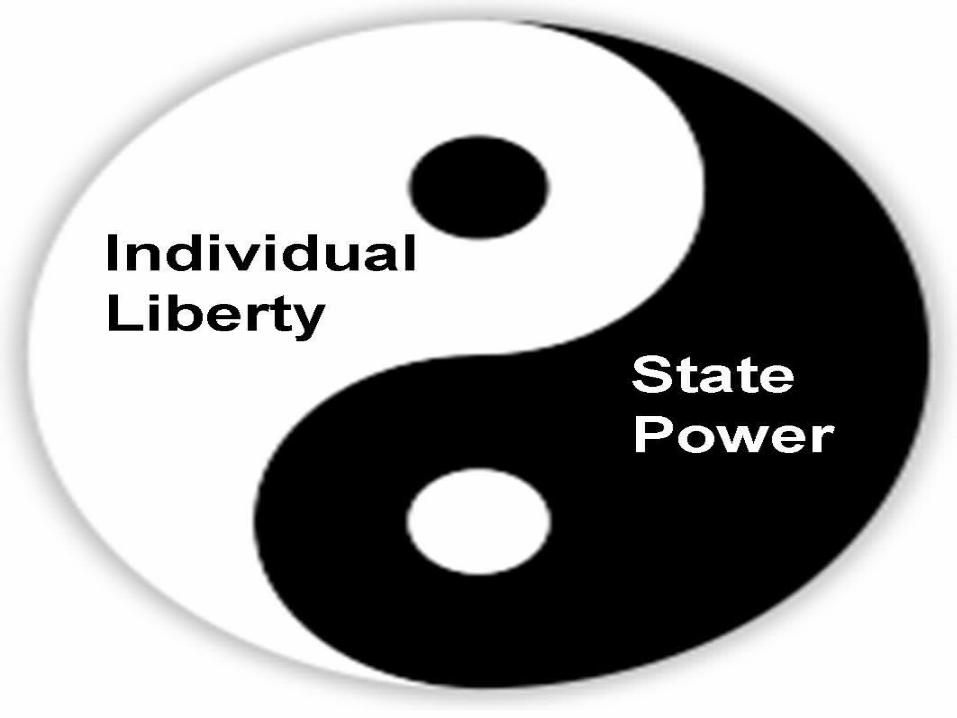
Sovereignty is the supreme and uncontrollable power inherent in a State.
1. Legal- is the authority which has the power to issue final commands;
2. 2. Political – is the power behind the legal sovereign, or the sum total of the influences that operate it.
2 KINDS OF SOVEREIGNTY

Government is the instrument that provides mechanisms in determining, formulating, and implementing the policies of the state. It is the essential instrument or machinery of the state
that carries out its will, purposes and objectives.

TWO FUNCTIONS OF GOVERNMENT
1. CONSTITUENT – Compulsory function
2. MINISTRANT- Discretionary function
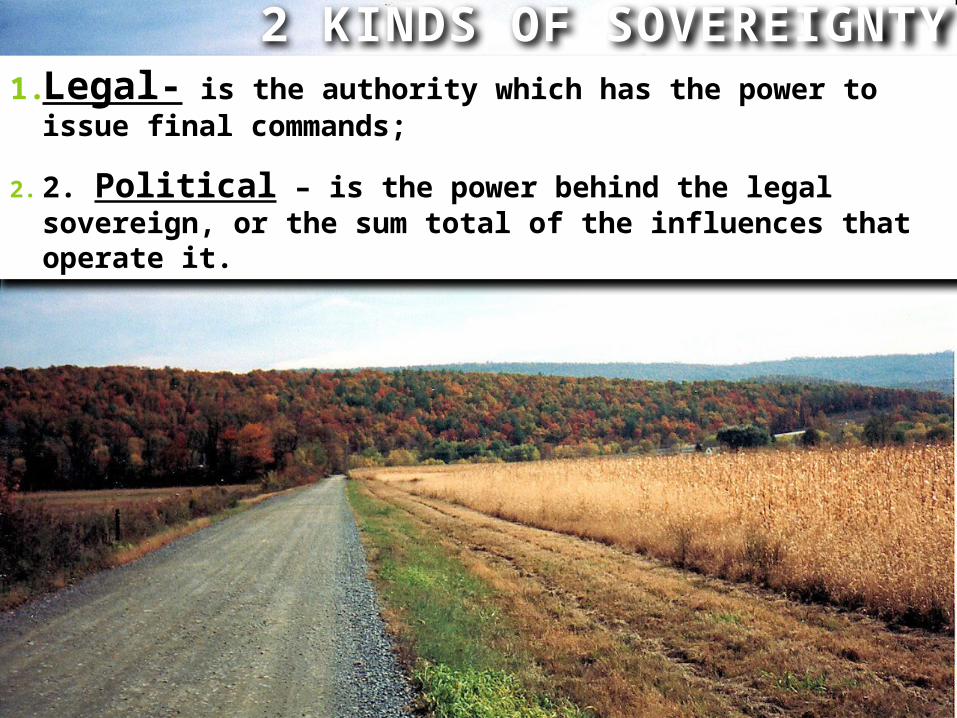
Refers to the group of persons in whose hands the reins of the government are held for the time being.
ADMINISTRATION

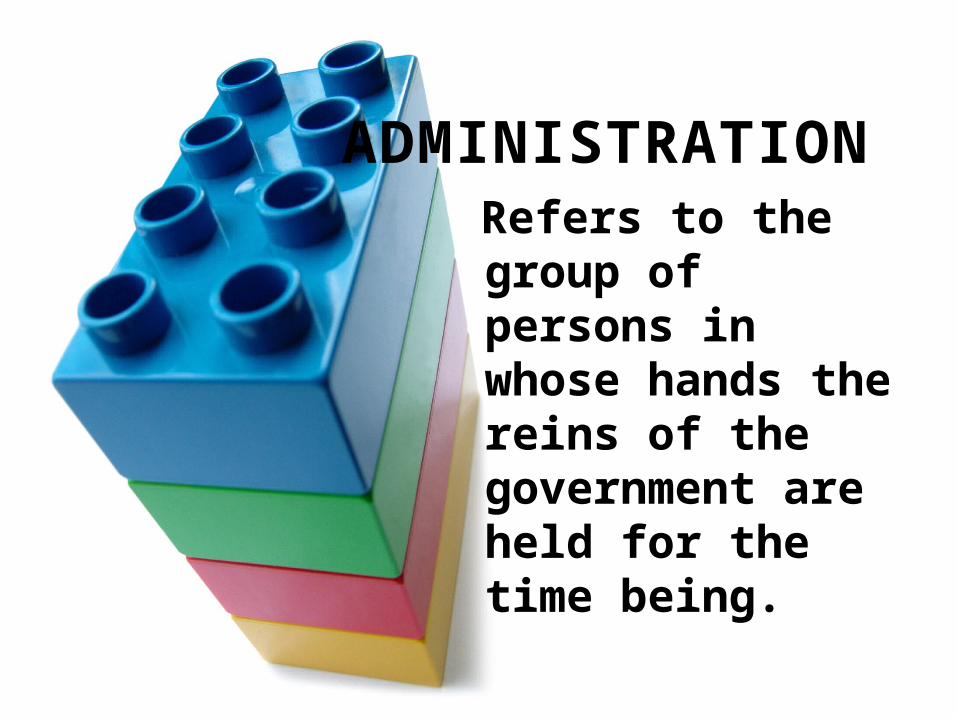
FORMS OF GOVERNMENT
A. According to the number of People who rule
1. MONARCHY
2. OLIGARCHY
3. DEMOCRACY

FORMS OF GOVERNMENT
B. According to the relationship between the National & Local
1. FEDERAL
2. UNITARY


FORMS OF GOVERNMENT
C. According to the status of those who hold the rein of Government1. CIVIL
2. MILITARY

FORMS OF GOVERNMENT
D. According to the Relationship between the Executive & Legislature
1. PARLIAMENTARY
2. PRESIDENTIAL


FORMS OF GOVERNMENTE. OTHER FORMS
1. DESPOTIC
2. TOTALITARIAN
3. REPUBLICAN
4. CONSTITUTIONAL
5. DE JURE
6. DE FACTO
7. REVOLUTIONARY

EXECUTE, IMPLEMENT, ENFORCE
LAW-MAKING, FORMULATION OF
POLICIES INTERPRET LAWS, JUSTICE
PRESIDENT, GOVERNOR, MAYOR, PUNONG
BARANGAY, SK CHAIRMAN
MEMBERS OF THE HOUSE OF
REPRESENTATIVES, SENATORS, BOARD
MEMBERS, COUNCILORS
JUSTICES, JUDGES


1.SEPARATION OF POWERS2. SYSTEM OF CHECK AND BALANCE
3.BLENDING OF POWERS
PRINCIPLES GOVERNING THE OPERATIONS OF GOVERNMENTAL POWERS
(3 BRANCHES)

POLICE POWER is the power of promoting the general welfare by restraining and regulating the use of liberty and property. Basis is the latin maxim salus populi est suprema lex (the general welfare is the supreme law)

EMINENT DOMAIN
enables the State to acquire
private property upon
payment of just compensation
for some intended public
use.

TAXATION it means the State is able to demand
from the members of society their
proportionate share or contribution in the maintenance of the
government.

INHERENT IN THE STATE


SIMILARITIES OF THE 3 FUNDAMENTAL POWERS
NOT ONLY NECESSARY BUT INDISPENSABLE
METHODS TO INTERFERE PRIVATE RIGHTS
PRESUPPOSES AN EQUIVALENT COMPENSATION
EXERCISED BY LEGISLATURE

National Government
ProvinceHighly Urbanized,
Chartered, Independent City
Component City
Municipality
Barangay Barangay
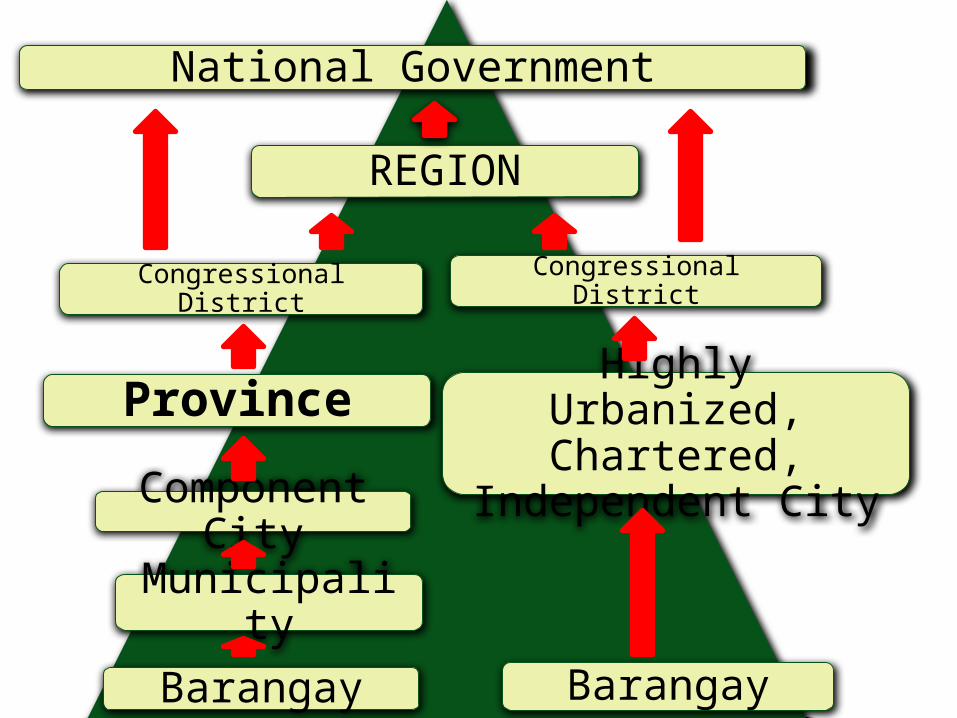
National Government
REGION
Province Highly Urbanized, Chartered, Independent
CityComponent City
Municipality
Barangay Barangay
Congressional District Congressional District

1 President of the Republic of the Philippines
229 Congressional/Legislative Districts
17 Regions
81 Provinces
33 Highly Urbanized Cities
5 Independent Component Cities
84 Component Cities
1,494 Municipalities42,000 Barangays

IMPACT OF LOCAL DECENTRALIZATION ON THE ECONOMIC GROWTH OF NORTHERN
MINDANAO

The Philippines (2007; in Million Pesos)
China (2004 ; 100M Yuan)
Central* Local** Central Local
Revenue 1,096,875 234,760 14,503 11,893
% to Total 82.37% 17.63% 54.90% 45.10%
Expenditure 1,029,377 194,736 7,894 20,592
% to Total 84.09% 15.91% 27.70% 72.30%
Net of IRA of P146,591.95 million**Inclusive of IRA of P146,591.95 millionSources: Philippine Commission on Audit 2007 Financial Reports; National Bureau of Statistics of China
Comparative Philippine and China Central and Local Government Share in Revenue and Expenditure

Central LocalTotal Revenue 82.37% 17.63%Tax Revenue* 93.08% 6.92%
General Income Permits and Licenses 77.03% 22.97% Service Income 94.24% 5.76% Business Income 68.65% 31.35% Other Income 94.65% 5.35%Gain on Forex 100.00% 0.00%
Philippine Central and Local Government Revenue Breakdown (in percent)
*Central-Net of IRASource: Philippine Commission on Audit 2007 Financial Reports
Sources: Country Report-United Nations Economic and Social Commission for Asia and the Pacific; Philippine Local Government Code
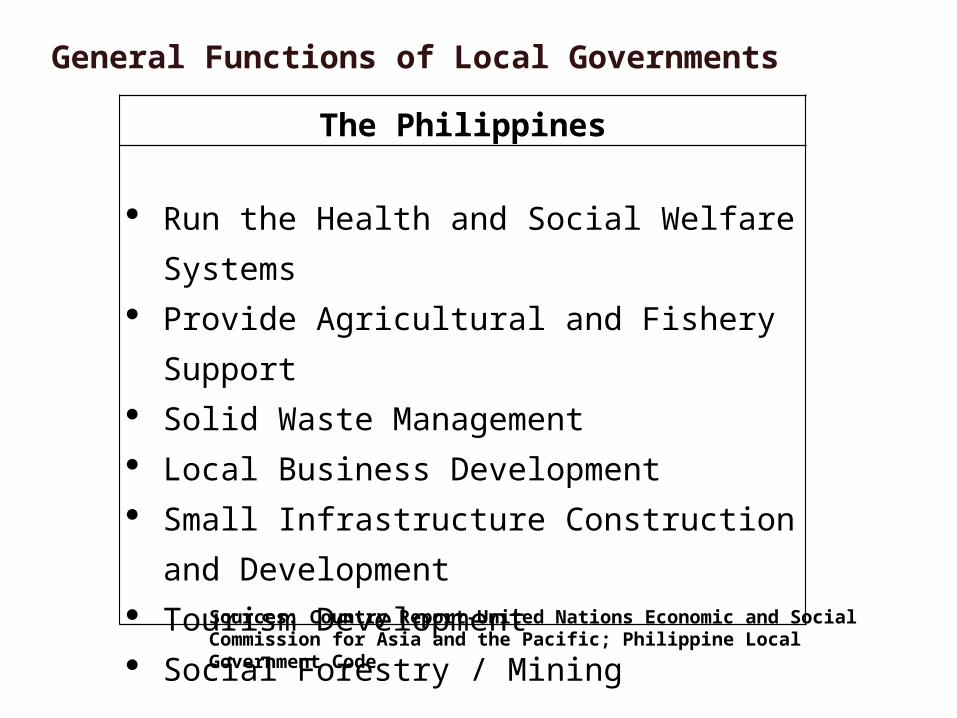
General Functions of Local Governments
The Philippines
Run the Health and Social Welfare Systems Provide Agricultural and Fishery Support Solid Waste Management Local Business Development Small Infrastructure Construction and
Development Tourism Development Social Forestry / Mining

Local Government Revenue SourcesThe Philippines
Local Taxes such as:Business TaxReal Property TaxTransfer TaxFranchise TaxPrinting and Publication TaxAmusement TaxCommunity TaxShare in National TaxesInternal revenue Allotment (IRA) representing 40% of internal revenue collections based on the third preceding year (Regional distribution is as follows: Provinces 23%; Cities 23%; Municipalities 34%; and Barangays 20%Non-Tax RevenueShare in national wealth exploitation in their areaShare in the earnings of government agencies or government-owned or controlled corporations engaged in the utilization and development of national wealth in their area based on the following: 1% of the gross sales or receipts of the preceding calendar year or 40% of mining taxes, royalties, forestry or fishery charges and such other taxes, fees or charges including related surcharges, interests, or fines, whichever is higher
Sources: Country Reports China and the Philippines-United Nations Economic and Social Commission for Asia and the Pacific

United States : Sources of State Revenue
Source Percentage (US Average)
General Sales Tax 23.5%
Selective Sales Tax 10.9%Property Taxes 30.1%License and Other Fees
8.2%
Corporate Income Taxes
4.7%
Individual Income Taxes
22.6%Source: Tax Foundation Report : stateline.org

LGU Income Generation• Region X - Northern Mindanao Php Millions
• Total Province Cities Towns
• 9,236 2,462 3,691 3,082 2006
• 11,072 2,913 4,570 3,588 2007
• 20% Growth Mostly due to IRA• IRA Dependency in 2006 = 82.6%• IRA Dependency in 2007 = 90.9%

Local Government Total* Central Central P000 Income Government Government Expenditure Expenditure % to LG Total Income Grand Total 234,642,572.58 762,534,007.59 324.98%National Capital Region 46,778,401.48 560,070,716.35 1197.28%Region 1 11,410,059.53 14,371,248.27 125.95%
CAR 6,223,710.33 7,499,513.73 120.50%
Region 2 9,160,569.36 10,132,758.94 110.61%Region 3 20,888,920.59 21,590,013.29 103.36%Region 4 35,866,590.31 27,646,932.60 77.08%Region 5 10,993,973.34 15,101,341.54 137.36%Region 6 16,679,840.96 18,419,954.59 110.43%Region 7 15,555,455.12 14,027,680.75 90.18%
Region 8 8,687,321.73 98,317,599.17 1131.74%
Region 9 7,781,531.08 9,821,773.23 126.22%
Region 10 11,300,406.23
11,512,490.21 101.88%
Region 11 10,170,596.06 10,980,183.03 107.96%
Region 12 8,285,249.49 8,623,777.18 104.09%
Region 13 7,545,245.07 7,146,537.05 94.72%ARMM 7,354,701.68 8,753,883.18 119.02%
Philippine LGU Total Income vs Central Govt. Expenditure per Region
*Inclusive of IRASource: Figures are from the Philippine Commission on Audit 2007 Financial Reports

If A Federal State…
• And with a Tax Effort of Efficiency of just 15%..
• Total Region 10 Government Revenues would amount to P58 Billion…
• 200% higher than what it is today

SUPERIORITY VERSUS SUBSIDIARITY
PINATULO
• Trickle- down
• Command and control
• Greed is good
• Sectoral income
PINATUBO
• Upward growth
• Consensus and coordination
• For the common good
• Community net worth

GROSS NORTHERN MINDANAO DOMESTIC PRODUCT
• Current Prices, in Millions of Pesos• 2000 2003 2006 2010• • 124,524 197,101 277,269 389,624

Top Manufacturing Outfits in Northern Mindanao
• Asia Brewery, • CATIMCO, • Coca-Cola, • Del Monte Phils., • LKKS Manufacturing, • Nestle Phils., • Phil Agro, • PICMW, Pilipinas • Kao, • RI Chemicals, • Mindanao Silicon, • STEAG State Power Inc• Elegant Chemical Alloy

AVERAGE FAMILY INCOME IN NORTHERN MINDANAO
• IN YEAR 2000 CONSTANT PRICES
• 2006 2009
• 102,000 98,000
• Poverty rate of Population in 2006: 43%

PHILIPPINES• INCOME BRACKET 2001 (%) 2010 (%)• Class AB 2 2
• Class C 18 12• Class D 56 64• Class E 24 23
• Despite the best years of GDP growth!

VIETNAM• INCOME BRACKET 1999 (%) 2010 (%)
• Class AB 7 21
• Class CD 31 55
• Class EF 62 24

“WHAT DOES GDP HAVE TO DO WITH ME?”
Results of PINATULO OR SUPERIORITY PRINCIPLE

GDP INDICATORS
COMPUTING PROGRESS FROM CORPORATE ACCOUNTS

WANTED!
A change of crew& a direction.

Change.
From superiority to subsidiarity.From pinatulo to pinatubo.
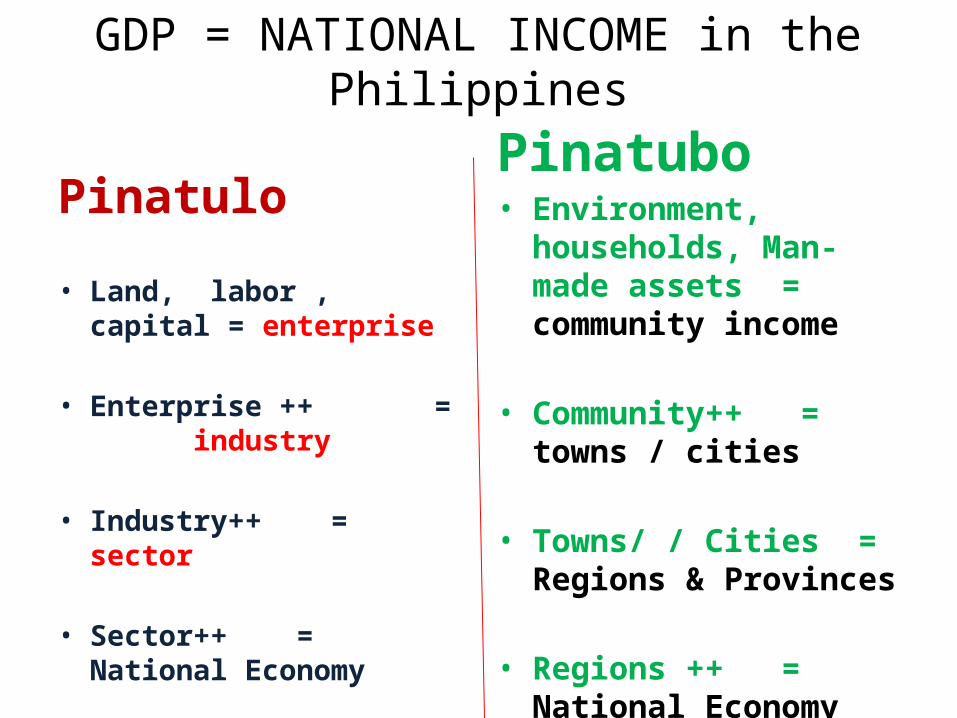
GDP = NATIONAL INCOME in the Philippines
Pinatulo
• Land, labor , capital = enterprise
• Enterprise ++ = industry
• Industry++ = sector
• Sector++ = National Economy
Pinatubo• Environment, households,
Man-made assets = community income
• Community++ = towns / cities
• Towns/ / Cities = Regions & Provinces
• Regions ++ = National Economy

Filipino dignity.
Restoring


Subsidiarity starts with the Individual
A STATE EXISTS SO THAT A NATION’S CHILDREN MAY GROW UP WITH DIGNITY

Trickle Down System
• Or PINATULO has been around with us since the colonial period…
• Independence merely Filipinized it but it is still Trickle Down or the Superiority Model…
• Only substantial change is the shift towards Pinatubo or Subsidiarity
• It is the SYSTEM that is incompetent, not the Filipino
Related Documents